UNITED STATES
SECURITIES AND EXCHANGE COMMISSION
Washington, D.C. 20549
FORMN-CSR
CERTIFIED SHAREHOLDER REPORT OF REGISTERED
MANAGEMENT INVESTMENT COMPANIES
Investment Company Act file number:811-06520
AMG Funds I
(Exact name of registrant as specified in charter)
600 Steamboat Road, Suite 300, Greenwich, Connecticut 06830
(Address of principal executive offices) (Zip code)
AMG Funds LLC
600 Steamboat Road, Suite 300, Greenwich, Connecticut 06830
(Name and address of agent for service)
Registrant’s telephone number, including area code: (203)299-3500
Date of fiscal year end: OCTOBER 31
Date of reporting period: NOVEMBER 1, 2018 – OCTOBER 31, 2019
(Annual Shareholder Report)
| Item 1. | Reports to Shareholders |
| | |
 | | ANNUALREPORT |
| | | | | | | | |
| | | | | AMG Funds October 31, 2019 
AMG GW&K Core Bond ESG Fund (formerly AMG GW&K Core Bond Fund) |
| | | | | |
| | | | | Class N: MBGVX | | Class I: MBDFX | | Class Z: MBDLX |
| | | | | AMG GW&K Trilogy Emerging Wealth Equity Fund (formerly AMG Trilogy Emerging Wealth Equity Fund) |
| | | | | |
| | | | | Class N: TYWVX | | Class I: TYWSX | | Class Z: TYWIX |
| | | |
| | | | | AMG GW&K Trilogy Emerging Markets Equity Fund (formerly AMG Trilogy Emerging Markets Equity Fund) |
| | | | | |
| | | | | Class N: TLEVX | | Class I: TLESX | | Class Z: TLEIX |
| | | | | |
| | | | | | | | | |
Beginning on January 1, 2021, as permitted by regulations adopted by the Securities and Exchange Commission, paper copies of the Funds’ shareholder reports like this one will no longer be sent by mail, unless you specifically request paper copies of the reports from the Funds or from your financial intermediary, such as a broker-dealer or bank. Instead, the reports will be made available on the Funds’ website (https://www.amgfunds.com/resources/order_literature.html), and you will be notified by mail each time a report is posted and provided with a website link to access the report.
If you already elected to receive shareholder reports electronically, you will not be affected by this change and you need not take any action. You may elect to receive shareholder reports and other communications from the Funds electronically at any time by contacting your financial intermediary or, if you invest directly with the Funds, by logging into your account at www.amgfunds.com.
You may elect to receive all future reports in paper free of charge. If you invest through a financial intermediary, you can contact your financial intermediary to request that you continue to receive paper copies of your shareholder reports. If you invest directly with the Funds, you can call 1.800.548.4539 to inform the Funds that you wish to continue receiving paper copies of your shareholder reports. Your election to receive reports in paper will apply to all funds in the AMG Funds Family of Funds held in your account if you invest through your financial intermediary or all funds in the AMG Funds Family of Funds held with the fund complex if you invest directly with the Funds.
| | | | |
| amgfunds.com | | | | 103119 AR069 |
| | |
| | | AMG Funds Annual Report — October 31, 2019 |
| | | | | | |
| | | |
| | | | | | | |
| | | TABLE OF CONTENTS | | PAGE | |
| | | | |
| | | LETTER TO SHAREHOLDERS | | | 2 | |
| | | |
| | | ABOUT YOUR FUND’S EXPENSES | | | 3 | |
| | | |
| | | PORTFOLIO MANAGER’S COMMENTS, FUND SNAPSHOTS AND SCHEDULES OF PORTFOLIO INVESTMENTS | | | | |
| | | |
| | | AMG GW&K Core Bond ESG Fund | | | 4 | |
| | | |
| | | AMG GW&K Trilogy Emerging Wealth Equity Fund | | | 12 | |
| | | |
| | | AMG GW&K Trilogy Emerging Markets Equity Fund | | | 21 | |
| | | |
| | | FINANCIAL STATEMENTS | | | | |
| | | |
| | | Statement of Assets and Liabilities | | | 28 | |
| | | |
| | | Balance sheets, net asset value (NAV) per share computations and cumulative distributable earnings (loss) | | | | |
| | | |
| | | Statement of Operations | | | 30 | |
| | | |
| | | Detail of sources of income, expenses, and realized and unrealized gains (losses) during the fiscal year | | | | |
| | | |
| | | Statements of Changes in Net Assets | | | 31 | |
| | | |
| | | Detail of changes in assets for the past two fiscal years | | | | |
| | | |
| | | Financial Highlights | | | 32 | |
| | | |
| | | Historical net asset values per share, distributions, total returns, income and expense ratios, turnover ratios and net assets | | | | |
| | | |
| | | Notes to Financial Statements | | | 41 | |
| | | |
| | | Accounting and distribution policies, details of agreements and transactions with Fund management and affiliates, and descriptions of certain investment risks | | | | |
| | | |
| | | REPORT OF INDEPENDENT REGISTERED PUBLIC ACCOUNTING FIRM | | | 48 | |
| | | |
| | | OTHER INFORMATION | | | 49 | |
| | | |
| | | TRUSTEES AND OFFICERS | | | 50 | |
| | | |
| | | ANNUAL RENEWAL OF INVESTMENT MANAGEMENT AND SUBADVISORY AGREEMENTS | | | 52 | |
| | | | | | | |
|
| Nothing contained herein is to be considered an offer, sale or solicitation of an offer to buy shares of any series of the AMG Funds family of mutual funds. Such offering is made only by prospectus, which includes details as to offering price and other material information. | |
| | |
| | Letter to Shareholders |
Dear Shareholder:
The U.S. bull market celebrated its 10-year anniversary during the fiscal year ended October 31, 2019, as stocks proved resilient in the face of global economic weakness, rising geopolitical tensions, and the ongoing trade war. Global stock markets swooned late in 2018 as hawkish U.S. Federal Reserve (Fed) policy and an escalation of the U.S./China trade war triggered a painful selloff. However, a dovish pivot from global central banks rescued investors and fueled a strong rebound early in 2019. Investors clung to hopes of a positive outcome from U.S./China trade negotiations, even as doubts about the durability of the economic cycle lingered, and the S&P 500® Index returned 14.33% for the fiscal year. International equities were also resistant to pressures facing the global economy and generated an 11.27% return as measured by the MSCI All Country World ex USA Index.
In total, ten out of eleven sectors of the S&P 500® Index were strongly positive during the prior twelve months. Investors sought the relative safety of defensive sectors, with utilities and real estate leading the index with returns of 26.73% and 23.71%, respectively. However, the higher growth information technology sector also generated a robust 22.60% return. Energy was the lone negative sector with a return of (11.40)% during the fiscal year. Growth stocks outperformed Value stocks for the full fiscal year with returns of 17.10% and 11.21% for the Russell 1000® Growth and Russell 1000® Value Indexes, respectively. The cycle of U.S. outperformance over international equities continued, but international developed and emerging markets still produced solidly positive returns, with the MSCI EAFE and MSCI Emerging Markets Index returning 11.04% and 11.86%, respectively, in the twelve months ending October 31, 2019.
Interest rates fell dramatically over the fiscal year and led to strong returns for bond investors as the Fed shifted to a more dovish policy stance early in 2019 and eventually cut short-term rates later in the year. The 10-year Treasury yield fell from a high of 3.24% last November to a yield of 1.69% as of October 31, 2019. The plunge in long-term interest rates caused the yield curve to briefly invert with 2-year yields rising higher than the 10-year yields. The Bloomberg Barclays U.S. Aggregate Bond Index, a broad measure of U.S. bond market performance, ended the fiscal year with an 11.51% return. High yield bonds lagged the broader bond market and returned 8.38% as measured by the return of the Bloomberg Barclays U.S. Corporate High Yield Bond Index. Municipal bonds also performed strongly with a 9.42% return for the Bloomberg Barclays Municipal Bond Index.
AMG Funds appreciates the privilege of providing investment tools to you and your clients. Our foremost goal is to provide investment solutions that help our shareholders successfully reach their long-term investment goals. AMG Funds
provides access to a distinctive array of actively managed return-oriented investment strategies. We thank you for your continued confidence and investment in AMG Funds. You can rest assured that under all market conditions our team is focused on delivering excellent investment management services for your benefit.
Respectfully,

Keitha Kinne
President
AMG Funds
| | | | | | | | | | | | | | |
| Average Annual Total Returns | | Periods ended
October 31, 2019* | |
| | | | |
| Stocks: | | | | 1 Year | | | 3 Years | | | 5 Years | |
| | | | |
Large Caps | | (S&P 500® Index) | | | 14.33 | % | | | 14.91% | | | | 10.78% | |
| | | | |
Small Caps | | (Russell 2000® Index) | | | 4.90 | % | | | 10.96% | | | | 7.37% | |
| | | | |
International | | (MSCI All Country World Index ex USA) | | | 11.27 | % | | | 8.07% | | | | 3.82% | |
| Bonds: | | | | | | | | | | | |
| | | | |
Investment Grade | | (Bloomberg Barclays U.S. Aggregate Bond Index) | | | 11.51 | % | | | 3.29% | | | | 3.24% | |
| | | | |
High Yield | | (Bloomberg Barclays U.S. Corporate High Yield Bond Index) | | | 8.38 | % | | | 6.03% | | | | 5.18% | |
| | | | |
Tax-exempt | | (Bloomberg Barclays Municipal Bond Index) | | | 9.42 | % | | | 3.62% | | | | 3.55% | |
| | | | |
Treasury Bills | | (ICE BofAML U.S. 6-Month Treasury Bill Index) | | | 2.71 | % | | | 1.74% | | | | 1.21% | |
*Source: FactSet. Past performance is no guarantee of future results.
2
|
About Your Fund’s Expenses |
| | | | | | | | |
As a shareholder of a Fund, you may incur two types of costs: (1) transaction costs, which may include sales charges (loads) on purchase payments; redemption fees; and exchange fees; and (2) ongoing costs, including management fees; distribution (12b-1) fees; and other Fund expenses. This example is intended to help you understand your ongoing costs (in dollars) of investing in the Fund and to compare these costs with the ongoing costs of investing in other mutual funds. The example is based on $1,000 invested at the beginning of the period and held for the entire period as indicated below. ACTUAL EXPENSES The first line of the following table provides information about the actual account values and | | | | actual expenses. You may use the information in this line, together with the amount you invested, to estimate the expenses that you paid over the period. Simply divide your account value by $1,000 (for example, an $8,600 account value divided by $1,000 = 8.6), then multiply the result by the number in the first line under the heading entitled “Expenses Paid During Period” to estimate the expenses you paid on your account during this period. HYPOTHETICAL EXAMPLE FOR COMPARISON PURPOSES The second line of the following table provides information about hypothetical account values and hypothetical expenses based on the Fund’s actual expense ratio and an assumed annual rate of return of 5% before expenses, which is not the Fund’s | | | | actual return. The hypothetical account values and expenses may not be used to estimate the actual ending account balance or expenses you paid for the period. You may use this information to compare the ongoing costs of investing in the Fund and other funds by comparing this 5% hypothetical example with the 5% hypothetical examples that appear in the shareholder reports of other funds. Please note that the expenses shown in the table are meant to highlight your ongoing costs only and do not reflect any transactional costs, such as sales charges (loads), redemption fees, or exchange fees. Therefore, the second line of the table is useful in comparing ongoing costs only, and will not help you determine the relative total costs of owning different funds. |
| | | | | | | | |
| | | | | | | | |
| | | | |
Six Months Ended October 31, 2019 | | Expense
Ratio for
the Period | | Beginning
Account
Value
05/01/19 | | Ending
Account
Value
10/31/19 | | Expenses
Paid
During
the Period* |
AMG GW&K Core Bond ESG Fund |
|
Based on Actual Fund Return |
| | | | |
Class N | | 0.88% | | $1,000 | | $1,058 | | $4.56 |
| | | | |
Class I | | 0.55% | | $1,000 | | $1,060 | | $2.86 |
| | | | |
Class Z | | 0.48% | | $1,000 | | $1,060 | | $2.49 |
|
Based on Hypothetical 5% Annual Return |
| | | | |
Class N | | 0.88% | | $1,000 | | $1,021 | | $4.48 |
| | | | |
Class I | | 0.55% | | $1,000 | | $1,022 | | $2.80 |
| | | | |
Class Z | | 0.48% | | $1,000 | | $1,023 | | $2.45 |
AMG GW&K Trilogy Emerging Wealth Equity Fund |
|
Based on Actual Fund Return |
| | | | |
Class N | | 1.35% | | $1,000 | | $959 | | $6.67 |
| | | | |
Class I | | 1.06% | | $1,000 | | $961 | | $5.24 |
| | | | |
Class Z | | 0.96% | | $1,000 | | $962 | | $4.75 |
|
Based on Hypothetical 5% Annual Return |
| | | | |
Class N | | 1.35% | | $1,000 | | $1,018 | | $6.87 |
| | | | |
Class I | | 1.06% | | $1,000 | | $1,020 | | $5.40 |
| | | | |
Class Z | | 0.96% | | $1,000 | | $1,020 | | $4.89 |
| | | | | | | | |
| | | | |
Six Months Ended October 31, 2019 | | Expense
Ratio for
the Period | | Beginning
Account
Value
05/01/19 | | Ending
Account
Value
10/31/19 | | Expenses
Paid
During
the Period* |
AMG GW&K Trilogy Emerging Markets Equity Fund |
|
Based on Actual Fund Return |
| | | | |
Class N | | 1.48% | | $1,000 | | $966 | | $7.34 |
| | | | |
Class I | | 1.13% | | $1,000 | | $968 | | $5.61 |
| | | | |
Class Z | | 0.92% | | $1,000 | | $969 | | $4.56 |
|
Based on Hypothetical 5% Annual Return |
| | | | |
Class N | | 1.48% | | $1,000 | | $1,018 | | $7.53 |
| | | | |
Class I | | 1.13% | | $1,000 | | $1,020 | | $5.75 |
| | | | |
Class Z | | 0.92% | | $1,000 | | $1,021 | | $4.69 |
| * | Expenses are equal to the Fund’s annualized expense ratio multiplied by the average account value over the period, multiplied by the number of days in the most recent fiscal half-year (184), then divided by 365. |
3
|
AMG GW&K Core Bond ESG Fund Portfolio Manager’s Comments(unaudited) |
| | | | | | | | |
For the 12 months ending October 31, 2019, the AMG GW&K Core Bond ESG Fund (Class I shares) (the “Fund”) returned 11.70%, compared to the return of 11.51% for the Bloomberg Barclays U.S. Aggregate Bond Index (the “Index”). On May 1, 2019, the AMG GW&K Core Bond Fund changed its name to the AMG GW&K Core Bond ESG Fund. While the Fund’s overall investment process remains the same, the Fund transitioned to an environmental, social, and governance (“ESG”) mandate. GW&K believes that responsible corporate behavior with respect to ESG factors can lead to positive and sustainable long-term financial performance and aligns with our pursuit of quality investments. GW&K has been incorporating ESG factors into our equity and fixed income analysis process for several years and as a signatory of the United Nations Principles for Responsible Investment (PRI), we are committed to incorporating the assessment of ESG issues into our fundamental research process. We believe ESG investing adds value to our investment process by improving our assessment of risk and enhancing our ability to identify high quality credits; aids our up-in-quality bias by improving identification of credits with less long-term volatility; limits our exposure to credit rating downgrades and negative events that are difficult to quantify; and deepens our fundamental credit analysis, leading to better outcomes by providing a more nuanced and complete picture. ESG considerations have long informed our process. We focus on business and credit fundamentals, relative valuation, and technical considerations. We believe ESG factors are important considerations in analyzing a company’s business and financial policy, as they highlight non-financial risks that can significantly affect a company’s financial health over the long term. Just as with credit risks, investors require additional compensation for ESG risks, leading to potential inefficiencies in valuation. MARKET OVERVIEW Investor sentiment deteriorated significantly at the end of 2018 as markets grew increasingly concerned about global growth, tightening U.S. Federal Reserve (“Fed”) policy and escalating trade tensions with China. These concerns took precedence over domestic economic data that, on balance, remained solid. The dominant narrative of synchronized global growth suddenly shifted to a serious debate around whether the post-crisis economic recovery was coming to an end—or worse. As expected, the Fed | | | | raised rates and tilted in a dovish direction, but not nearly enough for investors, who wanted a pause. Instead the Fed merely signaled a modestly slower pace of tightening along with continued balance sheet reduction. Volatility surged as a result, and risk assets sold off in a swift and decisive rebuke of Fed policy. Fixed income markets started 2019 on a strong note, helped by the unusual combination of a sharp rally in rates and a significant tightening in spreads. The Fed’s reduced growth outlook and dovish posture were the major drivers of the yield curve’s downward shift, reflecting softening U.S. economic data and renewed growth concerns out of Europe and China. Risk assets proved to be largely immune to these worries, benefiting instead from a fierce snapback in sentiment following a brutal fourth quarter. Corporates were also helped by a better-than-expected earnings season and a favorable technical backdrop. The rising tension between these competing risk-on/risk-off narratives underscores the high degree of investor uncertainty as the cycle continues to age, and volatility is likely to remain elevated until a clearer picture of the economy emerges. Having benefited from a second straight quarter of lower rates and tighter spreads, fixed income markets posted their strongest first-half returns in almost 25 years. Escalating trade rhetoric, decelerating industrial activity, and rising geopolitical tensions stoked concerns about a worldwide recession and drove a global flight to safety. In response, central banks around the world made clear their willingness to move forward with caution—if not provide outright stimulus as conditions warrant. In the U.S., this shift resulted in a massive collapse of the yield curve, driven by the perception that the Federal Open Market Committee (“FOMC”) had capitulated by removing the word “patient” from its post-meeting statement. This move had the perverse effect of both validating the risk aversion that drove the rally in rates and emboldening investors in risky assets, who promptly sent equities back to record highs. Fixed income markets endured a volatile third quarter amid the tumult of the trade war, mounting evidence of a global slowdown, and an increase in political tensions in the U.S. and abroad. Trade negotiations between the U.S. and China were the primary cause of uncertainty, as rhetoric escalated dramatically before calming in the closing days on hopes that tensions might be easing. This turmoil coincided with further signs of deterioration out of Europe, where both Germany and the U.K. posted | | | | negative Gross Domestic Product (“GDP”) readings. Against this already challenging backdrop, several other narratives weighed on investor sentiment: Saudi Arabia sustained an attack on its crude infrastructure, the overnight funding market required emergency intervention from the Fed, and talk of an impeachment inquiry began to gain traction. Interest rates finished October mixed following a sharp Fed-driven rally over the final two days of the month. The decision to cut the federal funds rate by another quarter point was not a surprise, nor was the messaging of a high bar set for further easing. Even so, Treasury yields fell, with a slight flattening bias, after Fed Chairman Jerome Powell stated in his post-meeting press conference that any increase in inflation would need to be “significant” and “persistent” before the Fed “would even consider” raising rates from here. The move reversed much of the October selloff that had preceded the meeting. All month long, rates had been rising and the curve re-steepening as investors took comfort from global monetary stimulus and receding concerns over trade and Brexit. The yield on the 10-year Treasury reached as high as 1.86% before rallying to close October 31, 2019, at 1.70%, up only 3 basis points on the month. The yield on the Long Bond finished up 7 basis points, while the two- and five-year fell 10 and 3 basis points, respectively. FUND REVIEW The Fund’s overweight to investment grade corporates, which outperformed the Index, was a significant contributor to performance. For the one-year period ending October 2019, interest rates decreased, and the corporate sector outperformed due to its longer duration and 8 basis points of spread tightening. Positive security selection within investment grade corporates was a key contributor to performance during the 12-month period, even as security selection overall contributed marginally. Corporate selection in the electric, insurance, and basic industry sectors were notable positives, while selection in consumer non-cyclicals and communications detracted. Treasuries were modest underperformers versus the Index, so our underweight was helpful. We were generally equal weight mortgage-backed securities, and our allocation decision had minimal impact, but our MBS selection underperformed in the rate rally given our preference for shorter duration seasoned mortgage pools. We overweighted taxable municipal bonds, a sector that benefited due to the decrease in rates, although security selection within the space was a small drag. The Fund’s overall yield curve positioning |
4
|
AMG GW&K Core Bond ESG Fund Portfolio Manager’s Comments(continued) |
| | | | | | | | |
added to performance. The 5- to 10-year segment of the curve experienced the largest declines in rates, which is where the Fund had its largest exposure. Conversely, rates on the very short and long ends saw drops of a lesser degree and the Fund had underweights in those areas. OUTLOOK Investor sentiment improved notably as bright spots emerged on U.S.-Chinese trade and Brexit, reducing the perceived threat to global growth. A relatively healthy read on the labor market, the strength of Q3 GDP growth, and solid corporate earnings helped to confirm that the manufacturing recession was not | | | | spilling over into the broader economy. The Fed made it clear that while they stand ready to add accommodation if needed, such an outcome is likely unnecessary. In light of all of these factors, we believe the U.S. expansion will continue. A healthy consumer and labor market coupled with an improving outlook for global growth support our preference for high-quality spread product. We believe that corporate bonds with above average and/or improving ESG profiles offer an attractive alternative to the Treasury market in an environment where the Fed has made it clear they are focused on extending the credit cycle. We see value in the lower-rated segment of the investment grade space, | | | | where we believe the risk of ratings downgrades has received undue attention, especially in light of an accommodative Fed. The securitized sector remains a good hedge against the possibility of rising rates, offering a relatively attractive spread following the recent flurry of refinancing activity. The views expressed represent the opinions of GW&K Investment Management, LLC as of October 31, 2019, and are not intended as a forecast or guarantee of future results, and are subject to change without notice. |
5
|
AMG GW&K Core Bond ESG Fund Portfolio Manager’s Comments(continued) |
CUMULATIVE TOTAL RETURN PERFORMANCE
AMG GW&K Core Bond ESG Fund’s (formerly AMG GW&K Core Bond Fund) cumulative total return is based on the daily change in net asset value (NAV), and assumes that all dividends and distributions were reinvested. This graph compares a hypothetical $10,000 investment made in the AMG GW&K Core Bond ESG Fund’s Class I shares on October 31, 2009 to a $10,000 investment made in the Bloomberg Barclays U.S. Aggregate Bond Index® for the same time period. The graph and table do not reflect the deduction of taxes that a shareholder would pay on a Fund distribution or redemption of shares. The listed returns for the Fund are net of expenses and the returns for the index exclude expenses. Total returns would have been lower had certain expenses not been reduced.
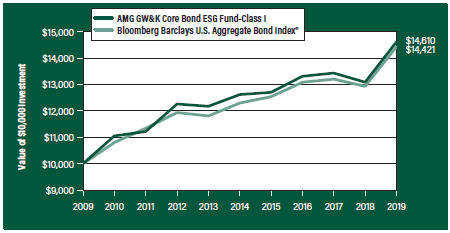
The table below shows the average annual total returns for the AMG GW&K Core Bond ESG Fund and the Bloomberg Barclays U.S. Aggregate Bond Index® for the same time periods ended October 31, 2019.
| | | | | | | | | | | | | | | | | | | | |
Average Annual Total Returns1 | | One
Year | | | Five
Years | | | Ten
Years | | | Since
Inception | | | Inception
Date | |
AMG GW&K Core Bond ESG Fund2, 3, 4, 5, 6, 7, 8 | |
| | | | | |
Class N | | | 11.20% | | | | — | | | | — | | | | 2.70 | % | | | 05/08/15 | |
| | | | | |
Class I | | | 11.70% | | | | 2.99% | | | | 3.87% | | | | 5.85 | % | | | 04/30/93 | |
| | | | | |
Class Z | | | 11.71% | | | | — | | | | — | | | | 3.12 | % | | | 05/08/15 | |
| | | | | |
Bloomberg Barclays U.S. Aggregate Bond Index®9 | | | 11.51% | | | | 3.24% | | | | 3.73% | | | | 5.31 | % | | | 04/30/93 | † |
The performance data shown represents past performance. Past performance is not a guarantee of future results. Current performance may be lower or higher than the performance data quoted. The investment return and principal value of an investment will fluctuate so that an investor’s shares, when redeemed, may be worth more or less than their original cost.
Investors should carefully consider the Fund’s investment objectives, risks, charges and expenses before investing. For performance information through the most recent month end, current net asset values per share for the Fund and other information, please call 800.548.4539 or visit our website at amgfunds.com for a free prospectus. Read it carefully before investing or sending money.
Distributed by AMG Distributors, Inc., member FINRA/SIPC.
| † | Date reflects inception date of the Fund, not the index. |
| 1 | Total return equals income yield plus share price change and assumes reinvestment of all dividends and capital gain distributions. Returns are net of fees and may reflect offsets of Fund expenses as described in the prospectus. No adjustment has been made for taxes payable by shareholders on their reinvested dividends and |
| | |
| | | capital gain distributions. Returns for periods greater than one year are annualized. The listed returns on the Fund are net of expenses and based on the published NAV as of October 31, 2019. All returns are in U.S. dollars ($). 2 From time to time, the Fund’s advisor has waived its fees and/or absorbed Fund expenses, which has resulted in higher returns. 3 To the extent that the Fund invests in asset-backed or mortgage-backed securities, its exposure to prepayment and extension risks may be greater than investments in other fixed income securities. 4 Active and frequent trading of a fund may result in higher transaction costs and increased tax liability. 5 The Fund is subject to the risks associated with investments in debt securities, such as default risk and fluctuations in the perception of the debtor’s ability to pay its creditors. Changing interest rates may adversely affect the value of an investment. An increase in interest rates typically causes the value of bonds and other fixed income securities to fall. 6 The Fund may invest in derivatives such as options and futures; the complexity and rapidly changing structure of derivatives markets may increase the possibility of market losses. 7 Many bonds have call provisions which allow the debtors to pay them back before maturity. This is especially true with mortgage securities, which can be paid back anytime. Typically debtors prepay their debt when it is to their advantage (when interest rates drop making a new loan at current rates more attractive), and thus likely to the disadvantage of bondholders, who may have to reinvest prepayment proceeds in securities with lower yields. Prepayment risk will vary depending on the provisions of the security and current interest rates relative to the interest rate of the debt. |
| | | 8 Applying the Fund’s ESG investment criteria may result in the selection or exclusion of securities of certain issuers for reasons other than performance, and the Fund may underperform funds that do not utilize an ESG investment strategy. The application of this strategy may affect the Fund’s exposure to certain companies, sectors, regions, countries or types of investments, which could negatively impact the Fund’s performance depending on whether such investments are in or out of favor. Applying ESG crieria to investment decisions is qualitative and subjective by nature, and there is no guarantee that the criteria utilized by the Subadvisr or any judgment exercised by the Subadviser will reflect the beliefs or values of any particular investor. 9 The Bloomberg Barclays U.S. Aggregate Bond Index® is an index of the U.S. investment-grade fixed-rate bond market, including both government and corporate bonds. Unlike the Fund, the |
6
|
AMG GW&K Core Bond ESG Fund Portfolio Manager’s Comments(continued) |
| | | | | | | | |
Bloomberg Barclays U.S. Aggregate Bond Index® is unmanaged, is not available for investment, and does not incur expenses. Bloomberg Index Services Limited. BLOOMBERG® is a trademark and service mark of Bloomberg Finance L.P. and its affiliates (collectively “Bloomberg”). BARCLAYS® is a trademark and service mark of | | | | Barclays Bank Plc (collectively with its affiliates, “Barclays”), used under license. Bloomberg or Bloomberg’s licensors, including Barclays, own all proprietary rights in the Bloomberg Barclays Indices. Neither Bloomberg nor Barclays approves or endorses this material, or guarantees the accuracy or completeness of any information herein, or makes any warranty, express or implied, as to the results to | | | | be obtained therefrom and, to the maximum extent allowed by law, neither shall have any liability or responsibility for injury or damages arising in connection therewith. Not FDIC insured, nor bank guaranteed. May lose value. |
7
|
AMG GW&K Core Bond ESG Fund Fund Snapshots(unaudited) October 31, 2019 |
PORTFOLIO BREAKDOWN
| | |
| Category | | % of Net Assets |
| | |
U.S. Government and Agency Obligations | | 46.5 |
| | |
Corporate Bonds and Notes | | 43.7 |
| | |
Municipal Bonds | | 7.6 |
| | |
Short-Term Investments | | 1.6 |
| | |
Other Assets Less Liabilities | | 0.6 |
| |
| Rating | | % of Market Value1 |
| | |
U.S. Government and Agency Obligations | | 47.5 |
| | |
Aa | | 17.5 |
| | |
A | | 19.0 |
| | |
Baa | | 16.0 |
| 1 | Includes market value of long-term fixed-income securities only. |
TOP TEN HOLDINGS
| | |
| Security Name | | % of
Net Assets |
United States Treasury Notes, 2.000%, 11/30/22 | | 4.1 |
| | |
United States Treasury Bonds, 4.500%, 02/15/36 | | 4.0 |
| | |
FNMA, 4.500%, 06/01/41 | | 2.7 |
| | |
FNMA, 4.000%, 12/01/33 | | 2.6 |
| | |
FNMA, 4.500%, 04/01/39 | | 2.6 |
| | |
FNMA, 4.500%, 04/01/39 | | 2.6 |
| | |
FHLMC, 2.500%, 10/01/34 | | 2.5 |
| | |
FNMA, 3.500%, 03/01/48 | | 2.3 |
| | |
United States Treasury Notes, 6.250%, 08/15/23 | | 2.1 |
| | |
Verizon Communications, Inc., 3.875%, 02/08/29 | | 2.1 |
| | | |
| | |
Top Ten as a Group | | 27.6 |
| | |
Credit quality ratings shown above reflect the highest rating assigned by either Standard & Poor’s (“S&P”) or Moody’s Investors Service, Inc. (“Moody’s”). These rating agencies are independent, nationally recognized statistical rating organizations and are widely used. Investment grade ratings are credit ratings of BBB/Baa or higher. Below investment grade ratings are credit ratings of BB/Ba or lower. Investments designated N/R are not rated by either rating agency. Unrated investments do not necessarily indicate low credit quality. Credit quality ratings are subject to change.
Because a fund’s strategy may result in multiple investments in particular sectors of the economy, its performance may depend on the performance of those sectors and may fluctuate more widely than investments diversified across more sectors. For additional information on these and other risk considerations, please see the Fund’s prospectus.
Any sectors, industries, or securities discussed should not be perceived as investment recommendations. Mention of a specific security should not be considered a recommendation to buy or solicitation to sell that security. Specific securities mentioned in this report may have been sold from the Fund’s portfolio of investments by the time you receive this report.
8
|
AMG GW&K Core Bond ESG Fund Schedule of Portfolio Investments October 31, 2019 |
| | | | | | | | |
| | | Principal
Amount | | | Value | |
| | |
Corporate Bonds and Notes - 43.7% | | | | | | | | |
| | |
Financials - 19.2% | | | | | | | | |
| | |
Aircastle, Ltd. | | | | | | | | |
4.125%, 05/01/24 | | | $3,073,000 | | | | $3,216,002 | |
| | |
Ally Financial, Inc. | | | | | | | | |
8.000%, 11/01/31 | | | 1,535,000 | | | | 2,143,244 | |
| | |
American Tower Corp. | | | | | | | | |
3.375%, 10/15/26 | | | 1,628,000 | | | | 1,694,632 | |
| | |
Bank of America Corp., MTN | | | | | | | | |
3.875%, 08/01/25 | | | 3,534,000 | | | | 3,814,087 | |
| | |
The Bank of New York Mellon Corp., MTN | | | | | | | | |
2.450%, 08/17/26 | | | 1,049,000 | | | | 1,060,752 | |
| | |
Berkshire Hathaway, Inc. | | | | | | | | |
3.125%, 03/15/26 | | | 3,151,000 | | | | 3,353,565 | |
| | |
Boston Properties, LP | | | | | | | | |
3.400%, 06/21/29 | | | 2,045,000 | | | | 2,158,868 | |
| | |
Citigroup, Inc. | | | | | | | | |
(3 month LIBOR + 1.023%) | | | | | | | | |
4.044%, 06/01/241 | | | 3,485,000 | | | | 3,691,928 | |
| | |
CME Group, Inc. | | | | | | | | |
3.750%, 06/15/28 | | | 930,000 | | | | 1,044,330 | |
| | |
Crown Castle International Corp. | | | | | | | | |
4.000%, 03/01/27 | | | 2,021,000 | | | | 2,188,758 | |
| | |
The Goldman Sachs Group, Inc. | | | | | | | | |
3.500%, 11/16/26 | | | 3,141,000 | | | | 3,275,030 | |
| | |
Host Hotels & Resorts, LP | | | | | | | | |
Series C | | | | | | | | |
4.750%, 03/01/23 | | | 2,429,000 | | | | 2,591,609 | |
| | |
JPMorgan Chase & Co. | | | | | | | | |
2.950%, 10/01/26 | | | 2,163,000 | | | | 2,234,332 | |
| | |
Morgan Stanley, GMTN | | | | | | | | |
(3 month LIBOR + 1.628%) | | | | | | | | |
4.431%, 01/23/301 | | | 1,919,000 | | | | 2,156,854 | |
| | |
National Rural Utilities Cooperative | | | | | | | | |
Finance Corp., MTN | | | | | | | | |
3.250%, 11/01/25 | | | 2,072,000 | | | | 2,185,082 | |
| | |
Simon Property Group LP | | | | | | | | |
3.300%, 01/15/26 | | | 2,057,000 | | | | 2,181,628 | |
| | |
Visa, Inc., MTN | | | | | | | | |
3.150%, 12/14/25 | | | 2,574,000 | | | | 2,753,727 | |
| | |
Total Financials | | | | | | | 41,744,428 | |
| | |
Industrials - 23.5% | | | | | | | | |
| | |
Advocate Health & Hospitals Corp. | | | | | | | | |
4.272%, 08/15/48 | | | 2,006,000 | | | | 2,392,373 | |
| | |
AT&T, Inc. | | | | | | | | |
4.250%, 03/01/27 | | | 3,955,000 | | | | 4,347,273 | |
| | |
Automatic Data Processing, Inc. | | | | | | | | |
3.375%, 09/15/25 | | | 3,067,000 | | | | 3,299,268 | |
| | | | | | | | |
| | | Principal
Amount | | | Value | |
| | |
Charter Communications Operating LLC/Charter Communications Operating Capital | | | | | | | | |
4.908%, 07/23/25 | | | $2,472,000 | | | | $2,725,640 | |
| | |
Cheniere Corpus Christi Holdings LLC | | | | | | | | |
5.875%, 03/31/25 | | | 2,889,000 | | | | 3,210,661 | |
| | |
CommonSpirit Health | | | | | | | | |
3.347%, 10/01/29 | | | 2,609,000 | | | | 2,634,527 | |
| | |
CVS Health Corp. | | | | | | | | |
5.125%, 07/20/45 | | | 1,899,000 | | | | 2,192,324 | |
| | |
Exelon Corp. | | | | | | | | |
3.400%, 04/15/26 | | | 2,016,000 | | | | 2,122,396 | |
| | |
Fidelity National Information Services, Inc. | | | | | | | | |
5.000%, 10/15/25 | | | 1,901,000 | | | | 2,173,985 | |
| | |
The George Washington University | | | | | | | | |
Series 2018 | | | | | | | | |
4.126%, 09/15/48 | | | 3,023,000 | | | | 3,611,447 | |
| | |
Georgia-Pacific LLC | | | | | | | | |
8.000%, 01/15/24 | | | 1,628,000 | | | | 1,997,610 | |
| | |
Kaiser Foundation Hospitals | | | | | | | | |
3.150%, 05/01/27 | | | 2,111,000 | | | | 2,235,768 | |
| | |
Kinder Morgan, Inc. | | | | | | | | |
4.300%, 03/01/28 | | | 1,967,000 | | | | 2,135,352 | |
| | |
McDonald’s Corp., MTN | | | | | | | | |
3.700%, 01/30/26 | | | 2,553,000 | | | | 2,758,619 | |
| | |
Parker-Hannifin Corp. | | | | | | | | |
3.250%, 06/14/29 | | | 2,089,000 | | | | 2,196,102 | |
| | |
RELX Capital, Inc. | | | | | | | | |
4.000%, 03/18/29 | | | 2,014,000 | | | | 2,216,215 | |
| | |
Rockwell Automation, Inc. | | | | | | | | |
3.500%, 03/01/29 | | | 2,027,000 | | | | 2,213,631 | |
| | |
Verizon Communications, Inc. | | | | | | | | |
3.875%, 02/08/29 | | | 4,042,000 | | | | 4,473,887 | |
| | |
Waste Management, Inc. | | | | | | | | |
3.450%, 06/15/29 | | | 2,007,000 | | | | 2,175,156 | |
| | |
Total Industrials | | | | | | | 51,112,234 | |
| | |
Utilities - 1.0% | | | | | | | | |
| | |
Northern States Power Co. | | | | | | | | |
2.900%, 03/01/50 | | | 2,197,000 | | | | 2,143,482 | |
| | |
Total Corporate Bonds and Notes | | | | | | | | |
(Cost $89,898,025) | | | | | | | 95,000,144 | |
| | |
Municipal Bonds - 7.6% | | | | | | | | |
| | |
California State General Obligation, | | | | | | | | |
School Improvements | | | | | | | | |
7.550%, 04/01/39 | | | 2,650,000 | | | | 4,351,751 | |
| | |
JobsOhio Beverage System, Series B | | | | | | | | |
4.532%, 01/01/35 | | | 1,890,000 | | | | 2,262,576 | |
| | |
Los Angeles Unified School District, | | | | | | | | |
School Improvements | | | | | | | | |
5.750%, 07/01/34 | | | 2,905,000 | | | | 3,787,452 | |
The accompanying notes are an integral part of these financial statements.
9
|
AMG GW&K Core Bond ESG Fund Schedule of Portfolio Investments(continued) |
| | | | | | | | |
| | | Principal
Amount | | | Value | |
| | |
Metropolitan Transportation Authority | | | | | | | | |
6.687%, 11/15/40 | | | $1,875,000 | | | | $2,672,081 | |
| | |
University of California, University & College Improvements, Series BD | | | | | | | | |
3.349%, 07/01/29 | | | 3,215,000 | | | | 3,482,777 | |
| | |
Total Municipal Bonds | | | | | | | | |
(Cost $15,390,277) | | | | | | | 16,556,637 | |
| | |
| U.S. Government and Agency Obligations - 46.5% | | | | | | | | |
| | |
Fannie Mae - 27.2% | | | | | | | | |
| | |
FNMA | | | | | | | | |
3.000%, 09/01/46 to 11/01/46 | | | 4,984,012 | | | | 5,117,746 | |
3.500%, 03/01/30 to 03/01/48 | | | 11,702,567 | | | | 12,287,342 | |
4.000%, 12/01/33 to 11/01/48 | | | 16,007,970 | | | | 17,125,098 | |
4.500%, 04/01/39 to 06/01/41 | | | 18,508,594 | | | | 20,069,532 | |
5.000%, 08/01/40 | | | 4,038,968 | | | | 4,458,669 | |
| | |
Total Fannie Mae | | | | | | | 59,058,387 | |
| | |
Freddie Mac - 8.0% | | | | | | | | |
| | |
FHLMC | | | | | | | | |
2.500%, 10/01/34 | | | 5,303,091 | | | | 5,385,847 | |
| | |
FHLMC Gold Pool | | | | | | | | |
3.000%, 06/01/43 | | | 341,400 | | | | 353,734 | |
3.500%, 07/01/32 to 05/01/44 | | | 2,694,696 | | | | 2,833,689 | |
4.000%, 05/01/26 | | | 162,675 | | | | 169,673 | |
5.000%, 07/01/44 | | | 2,878,927 | | | | 3,182,505 | |
| | |
FHLMC Multifamily Structured Pass | | | | | | | | |
Through Certificates | | | | | | | | |
Series K071, Class A2 | | | | | | | | |
3.286%, 11/25/27 | | | 2,012,000 | | | | 2,177,365 | |
Series K062, Class A2 | | | | | | | | |
3.413%, 12/25/26 | | | 513,000 | | | | 559,348 | |
Series K063, Class A2 | | | | | | | | |
3.430%, 01/25/271 | | | 2,544,000 | | | | 2,767,785 | |
| | |
Total Freddie Mac | | | | | | | 17,429,946 | |
| | | | | | | | |
| | | Principal
Amount | | | Value | |
| |
U.S. Treasury Obligations - 11.3% | | | | | |
| | |
United States Treasury Bonds | | | | | | | | |
3.500%, 02/15/39 | | | $1,750,000 | | | | $2,173,042 | |
4.500%, 02/15/36 | | | 6,312,000 | | | | 8,648,919 | |
| | |
United States Treasury Notes | | | | | | | | |
2.000%, 11/30/22 | | | 8,892,000 | | | | 9,019,649 | |
6.250%, 08/15/23 | | | 3,947,000 | | | | 4,631,712 | |
Total U.S. Treasury Obligations | | | | | | | 24,473,322 | |
| | |
Total U.S. Government and Agency Obligations | | | | | | | | |
(Cost $98,781,344) | | | | | | | 100,961,655 | |
| | |
| | | Shares | | | | | |
| | |
Short-Term Investments - 1.6% | | | | | | | | |
| |
Other Investment Companies - 1.6% | | | | | |
| | |
Dreyfus Government Cash Management Fund, | | | | | | | | |
Institutional Shares, 1.73%2 | | | 1,153,067 | | | | 1,153,067 | |
| | |
Dreyfus Institutional Preferred Government Money Market Fund, Institutional Shares, 1.77%2 | | | 1,153,068 | | | | 1,153,068 | |
| | |
JPMorgan U.S. Government Money Market Fund, IM Shares, 1.75%2 | | | 1,188,010 | | | | 1,188,010 | |
| | |
Total Short-Term Investments
(Cost $3,494,145) | | | | | | | 3,494,145 | |
| | |
Total Investments - 99.4%
(Cost $207,563,791) | | | | | | | 216,012,581 | |
| |
Other Assets, less Liabilities - 0.6% | | | | 1,251,978 | |
| | |
Net Assets - 100.0% | | | | | | | $217,264,559 | |
| 1 | Variable rate security. The rate shown is based on the latest available information as of October 31, 2019. Certain variable rate securities are not based on a published reference rate and spread but are determined by the issuer or agent and are based on current market conditions. These securities do not indicate a reference rate and spread in their description above. |
| 2 | Yield shown represents the October 31, 2019, seven day average yield, which refers to the sum of the previous seven days’ dividends paid, expressed as an annual percentage. |
| GMTN | Global Medium-Term Notes |
| LIBOR | London Interbank Offered Rate |
The accompanying notes are an integral part of these financial statements.
10
|
AMG GW&K Core Bond ESG Fund Schedule of Portfolio Investments(continued) |
The following table summarizes the inputs used to value the Fund’s investments by the fair value hierarchy levels as of October 31, 2019:
| | | | | | | | | | | | | | | | | | | | |
| | | Level 1 | | Level 2 | | Level 3 | | Total |
Investments in Securities | | | | | | | | | | | | | | | | | | | | |
Corporate Bonds and Notes† | | | | — | | | | | $95,000,144 | | | | | — | | | | | $95,000,144 | |
Municipal Bonds | | | | — | | | | | 16,556,637 | | | | | — | | | | | 16,556,637 | |
U.S. Government and Agency Obligations† | | | | — | | | | | 100,961,655 | | | | | — | | | | | 100,961,655 | |
Short-Term Investments | | | | | | | | | | | | | | | | | | | | |
Other Investment Companies | | | $ | 3,494,145 | | | | | — | | | | | — | | | | | 3,494,145 | |
| | | | | | | | | | | | | | | | | | | | |
Total Investments in Securities | | | $ | 3,494,145 | | | | $ | 212,518,436 | | | | | — | | | | $ | 216,012,581 | |
| | | | | | | | | | | | | | | | | | | | |
| † | All corporate bonds and notes and U.S. government and agency obligations held in the Fund are Level 2 securities. For a detailed breakout of corporate bonds and notes and U.S. government and agency obligations by major industry or agency classification, please refer to the Fund’s Schedule of Portfolio Investments. |
For the fiscal year ended October 31, 2019, there were no transfers in or out of Level 3.
The accompanying notes are an integral part of these financial statements.
11
|
AMG GW&K Trilogy Emerging Wealth Equity Fund Portfolio Manager’s Comments(unaudited) |
| | | | | | | | |
MARKET OVERVIEW Global equity markets experienced sharp declines in the final quarter of 2018, with the MSCI All Country World Index posting the worst annual performance since the global financial crisis of 2008. Notably, after leading global markets down in the previous two quarters, the MSCI Emerging Markets Index displayed relative strength during December. In response to firm U.S. economic data, the U.S. Federal Reserve (the “Fed”) delivered its fourth rate hike in December, the ninth hike of the tightening cycle, while giving only modestly dovish guidance about its future intentions. Moving into 2019, emerging market equities participated in the strong global rally and posted a first quarter gain which was the largest advance since the first quarter of 2017, erasing the sharp decline of the previous quarter. The same factors that boosted global developed markets were also at play in emerging markets, such as dovish signals from key central banks (the Fed and the European Central Bank), optimism on U.S.-China trade negotiations, and early signs of stabilization in China’s economy. Overall, emerging market currencies held their ground against the U.S. dollar, while oil and industrial commodity prices firmed as concerns about the global economy began to ease. Although the MSCI Emerging Markets Index rose in the first quarter, it remained significantly below its peak level reached in January 2018 and lagged the first quarter gain of the MSCI All Country World Index. Following the strong rally in the first quarter, emerging market equities ended the second quarter of 2019 with relatively flat performance due to tepid economic reports and an escalation of trade tensions. The flat performance for the second quarter masked considerable volatility within the quarter as markets responded negatively to a breakdown in U.S.-China trade negotiations. Evidence mounted that the trade war was resulting in a significant slowdown in global manufacturing activity as supply chains were disrupted while businesses put capital spending plans on hold. However, emerging market equities were able to recover in June as investors correctly discounted that the U.S. and China would agree at the end of the month to postpone further tariff hikes and resume negotiations. Emerging market equities continued to lag developed markets, with developed market equities posting their strongest first-half gain since 1998. The wide performance spread between emerging and developed markets in 2019 reflects the differential impact of weaker global manufacturing | | | | activity and ongoing tension surrounding U.S.-China trade negotiations. The confrontational tone between the two countries has hit emerging market assets particularly hard. Emerging market equities posted a decline for the third quarter of 2019, but ended off the period’s worst levels. There were signs of an easing of U.S.-China tensions in September, with China resuming some purchases of U.S. agricultural goods in advance of formal trade talks. In addition, investors have been focusing on the tempering effect of central bank policy actions to offset the global slowdown. A total of 16 central banks cut rates in the third quarter, led by two cuts by the Fed. That said, China has so far refrained from aggressive monetary easing. Its future policy stance remains an important wild card since China accounts for about one-third of global growth. During the two prior global downturns of 2008 and 2016, inflections in global growth required strong stimulus by China. Finishing off the fiscal year, emerging market equities did well in October but continued to lag developed markets for the calendar-year-to-date period. Several factors contributed to the improved environment for emerging market equities. First, market participants took comfort from the continued broad-based monetary easing by central banks. Second, a de-escalation of trade issues between the U.S. and China helped market sentiment. On October 11, the U.S. and China reached a tentative “Phase One” agreement on key trade issues. The U.S. agreed to hold off on tariff hikes scheduled for October 15 and December 15. In exchange, China offered key concessions on agricultural purchases and financial sector opening. But no deal has been signed, so there remains the risk of last-minute histrionics. Finally, odds of a no-deal Brexit also declined. Brexit now looks likely to proceed on January 31 next year. FUND REVIEW For the one-year period ending October 31, 2019, the AMG GW&K Trilogy Emerging Wealth Equity Fund (the “Fund”) (Class Z shares) returned 21.34%, outperforming the MSCI Emerging Markets Index (the “Index”), which returned 11.86%. Looking at performance on a sector basis, stock selection in the financial, consumer staples, and health care sectors represented the largest contributors to relative performance. Although stock selection detracted from performance in the consumer discretionary sector, the Fund’s large overweight allocation more than offset it, resulting in a positive impact on performance. Finally, holdings in the materials sector added to relative performance for the year. These positives were partially offset by holdings in the | | | | communication services and information technology sectors, as well as an underweight allocation in information technology. Geographically, stock selection in Asia, particularly China, was by far the largest contributor to relative performance for the fiscal year. Stock selection and an underweight allocation in South Korea also helped performance versus the Index while an underweight allocation in Taiwan detracted from performance within the region. Within the Latin America and EMEA regions, stock selection and underweight allocations versus the Index helped on a relative basis. Finally, within developed markets, positive performance from U.S. holdings more than offset the negative returns in Germany and Denmark. OUTLOOK AND PORTFOLIO POSITION Looking forward, we see continued low inflation levels in most emerging market countries as supportive for further monetary easing and economic growth, albeit at more modest levels. As the third quarter earnings season progresses, business trends in the Fund’s consumer-focused companies remain healthy. We believe earnings growth for the Fund will be between 8% and 10% for 2019, followed by low-double-digit growth in 2020 and 2021, providing further support to already compelling valuations. Volatility will likely continue as investors balance political risks, trade discussions, and accommodative central bank policies globally. This continued volatility will create further opportunities to invest in best-in-class companies serving the emerging consumer. Ongoing discussions between the U.S. and China will most likely result in a trade agreement that will be executed in several phases over an extended period of time. In the meantime, the shift toward consumption in emerging markets remains undeterred. Not only do we continue to see high consumer confidence and strong consumption in China, despite the headline news, we also note that premium segments are growing at approximately twice the pace of overall Chinese consumption. In India, after broad monetary and fiscal stimulus, the government has now moved to support important labor-intensive industries including the auto industry, where a cash-for-clunkers program is under consideration. We continue to believe the combination of strong earnings growth and compelling valuations could present investors with a strong snap-back in emerging markets, and we would like to remind investors of the benefit of an emerging wealth allocation, as we believe the emerging consumer will be the most compelling growth story for the next couple of decades. |
12
|
AMG GW&K Trilogy Emerging Wealth Equity Fund Portfolio Manager’s Comments(continued) |
| | | | | | | | |
Investors with a long-term investment horizon, as well as patience and focus on the underlying fundamentals of companies rather than the latest news, could reap sustainable excess returns in emerging markets as the world faces a scarcity of growth opportunities. We believe the underlying trends in emerging markets are very powerful for the companies within the Fund. Patience is required and we believe investors will be rewarded. With respect to the Fund’s structure, trading and market activity during the fiscal year resulted in increased exposures to the consumer discretionary, | | | | health care, information technology, materials, and industrial sectors while exposures to the consumer staples, communication services, and financial sectors decreased. At the close of the period, the Fund had overweight positions in the consumer discretionary and health care sectors and underweight positions in the energy, information technology, materials, communication services, industrial, real estate, utilities, and consumer staples sectors relative to the benchmark. Geographically, | | | | the portfolio finished the fiscal year with exposures of 68% in EM Asia, 22% in developed markets, 5% in EM EMEA, and 5% in EM Latin America. The views expressed represent the opinions of GW&K Investment Management, LLC as of October 31, 2019, and are not intended as a forecast or guarantee of future results, and are subject to change without notice. |
13
|
AMG GW&K Trilogy Emerging Wealth Equity Fund Portfolio Manager’s Comments(continued) |
CUMULATIVE TOTAL RETURN PERFORMANCE
AMG GW&K Trilogy Emerging Wealth Equity Fund’s (formerly AMG Trilogy Emerging Wealth Equity Fund) cumulative total return is based on the daily change in net asset value (NAV), and assumes that all dividends and distributions were reinvested. This graph compares a hypothetical $10,000 investment made in the AMG GW&K Trilogy Emerging Wealth Equity Fund’s Class Z shares on March 19, 2015 (inception date), to a $10,000 investment made in the MSCI Emerging Markets Index for the same time period. The graph and table do not reflect the deduction of taxes that a shareholder would pay on a Fund distribution or redemption of shares. The listed returns for the Fund are net of expenses and the returns for the index exclude expenses. Total returns would have been lower had certain expenses not been reduced.
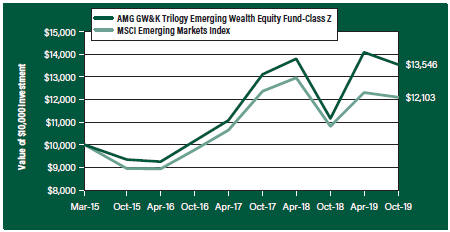
The table below shows the average annual total returns for the AMG GW&K Trilogy Emerging Wealth Equity Fund and the MSCI Emerging Markets Index for the same time periods ended October 31, 2019.
| | | | | | | | | | | | |
| Average Annual Total Returns1 | | One
Year | | | Since
Inception | | | Inception
Date | |
AMG GW&K Trilogy Emerging Wealth Equity Fund2, 3, 4, 5, 6, 7, 8 | | | | | | | | | | | | |
| | | |
Class N | | | 20.82 | % | | | 6.41 | % | | | 03/19/15 | |
| | | |
Class I | | | 21.15 | % | | | 6.69 | % | | | 03/19/15 | |
| | | |
Class Z | | | 21.34 | % | | | 6.79 | % | | | 03/19/15 | |
| | | |
MSCI Emerging Markets Index9 | | | 11.86 | % | | | 4.22 | % | | | 03/19/15 | † |
The performance data shown represents past performance. Past performance is not a guarantee of future results. Current performance may be lower or higher than the performance data quoted. The investment return and principal value of an investment will fluctuate so that an investor’s shares, when redeemed, may be worth more or less than their original cost.
Investors should carefully consider the Fund’s investment objectives, risks, charges and expenses before investing. For performance information through the most recent month end, current net asset values per share for the Fund and other information, please call 800.548.4539 or visit our website at amgfunds.com for a free prospectus. Read it carefully before investing or sending money.
Distributed by AMG Distributors, Inc., member FINRA/SIPC.
| † | Date reflects inception date of the Fund, not the index. |
| 1 | Total return equals income yield plus share price change and assumes reinvestment of all dividends and capital gain distributions. Returns are net of fees and may reflect offsets of Fund expenses as described in the prospectus. No adjustment has been made for taxes payable by shareholders on their reinvested dividends and |
| | |
| | | capital gain distributions. Returns for periods greater than one year are annualized. The listed returns on the Fund are net of expenses and based on the published NAV as of October 31, 2019. All returns are in U.S. dollars ($). 2 Investments in international securities are subject to certain risks of overseas investing including currency fluctuations and changes in political and economic conditions, which could result in significant market fluctuations. These risks are magnified in emerging markets. 3 The Fund is subject to the risks associated with investments in emerging markets, such as erratic earnings patterns, economic and political instability, changing exchange controls, limitations on repatriation of foreign capital and changes in local governmental attitudes toward private investment, possibly leading to nationalization or confiscation of investor assets. 4 The Fund is subject to currency risk resulting from fluctuations in exchange rates that may affect the total loss or gain on a non-U.S. Dollar investment when converted back to U.S. Dollars. 5 The Fund may invest in derivatives such as options and futures; the complexity and rapidly changing structure of derivatives markets may increase the possibility of market losses. 6 The Fund is subject to risks associated with investments in mid-capitalization companies such as greater price volatility, lower trading volume, and less liquidity than the stocks of larger, more established companies. 7 The Fund is subject to risks associated with investments in small-capitalization companies, such as erratic earnings patterns, competitive conditions, limited earnings history and a reliance on one or a limited number of products. 8 Companies that are in similar businesses may be similarly affected by particular economic or market events; to the extent the Fund has substantial holdings within a particular sector, the risks associated with that sector increase. |
| | | 9 The MSCI Emerging Markets Index is a free float-adjusted market capitalization index that is designed to measure equity market performance of emerging markets. Please go to msci.com for most current list of countries represented by the index. Unlike the Fund, the MSCI Emerging Markets Index is unmanaged, is not available for investment and does not incur expenses. All MSCI data is provided “as is.” The products described herein are not sponsored or endorsed and have not been reviewed or passed on by MSCI. In no event shall MSCI, its affiliates or any MSCI data provider have any liability of any kind in connection with the MSCI data or the products described herein. |
14
|
AMG GW&K Trilogy Emerging Wealth Equity Fund Portfolio Manager’s Comments(continued) |
| | | | | | | | |
Copying or redistributing the MSCI data is strictly prohibited. | | | | Not FIDC insured, not bank guaranteed. May lose value. | | | | |
15
|
AMG GW&K Trilogy Emerging Wealth Equity Fund Fund Snapshots(unaudited) October 31, 2019 |
PORTFOLIO BREAKDOWN
| | |
| Sector | | % of Net Assets |
| | |
Consumer Discretionary | | 36.7 |
| | |
Financials | | 24.8 |
| | |
Information Technology | | 10.5 |
| | |
Communication Services | | 7.4 |
| | |
Health Care | | 6.3 |
| | |
Consumer Staples | | 5.3 |
| | |
Materials | | 3.4 |
| | |
Industrials | | 2.5 |
| | |
Short-Term Investments | | 5.6 |
| | |
Other Assets Less Liabilities | | (2.5) |
TOP TEN HOLDINGS
| | |
| Security Name | | % of
Net Assets |
Alibaba Group Holding, Ltd., Sponsored ADR (China) | | 6.0 |
| | |
Infineon Technologies AG (Germany) | | 5.8 |
| | |
Sands China, Ltd. (Macau) | | 4.9 |
| | |
Ping An Insurance Group Co. of China, Ltd., Class H (China) | | 4.7 |
| | |
HDFC Bank, Ltd., ADR (India) | | 4.3 |
| | |
Sberbank of Russia PJSC, Sponsored ADR (Russia) | | 4.0 |
| | |
AIA Group, Ltd. (Hong Kong) | | 4.0 |
| | |
QUALCOMM, Inc. | | 3.9 |
| | |
Tencent Holdings, Ltd. (China) | | 3.3 |
| | |
Trip.com Group, Ltd., ADR (China) | | 3.3 |
| | | |
| | |
Top Ten as a Group | | 44.2 |
| | |
Because a fund’s strategy may result in multiple investments in particular sectors of the economy, its performance may depend on the performance of those sectors and may fluctuate more widely than investments diversified across more sectors. For additional information on these and other risk considerations, please see the Fund’s prospectus.
Any sectors, industries, or securities discussed should not be perceived as investment recommendations. Mention of a specific security should not be considered a recommendation to buy or solicitation to sell that security. Specific securities mentioned in this report may have been sold from the Fund’s portfolio of investments by the time you receive this report.
16
|
AMG GW&K Trilogy Emerging Wealth Equity Fund Schedule of Portfolio Investments October 31, 2019 |
| | | | | | | | |
| | | Shares | | | Value | |
| | |
Common Stocks - 96.9% | | | | | | | | |
| | |
Communication Services - 7.4% | | | | | | | | |
| | |
iQIYI, Inc., ADR (China)*,1 | | | 63,833 | | | | $1,112,609 | |
| | |
MultiChoice Group (South Africa)* | | | 37,798 | | | | 314,798 | |
| | |
Tencent Holdings, Ltd. (China) | | | 92,140 | | | | 3,737,467 | |
| | |
Tencent Music Entertainment Group, ADR (China)*,1 | | | 103,895 | | | | 1,437,907 | |
| | |
The Walt Disney Co. (United States) | | | 2,206 | | | | 286,604 | |
| | |
Zee Entertainment Enterprises, Ltd. (India) | | | 395,018 | | | | 1,451,339 | |
| | |
Total Communication Services | | | | | | | 8,340,724 | |
| | |
Consumer Discretionary - 36.7% | | | | | | | | |
| | |
Alibaba Group Holding, Ltd., Sponsored ADR (China)* | | | 38,781 | | | | 6,851,439 | |
| | |
Booking Holdings, Inc. (United States)* | | | 565 | | | | 1,157,555 | |
| | |
Eicher Motors, Ltd. (India) | | | 8,475 | | | | 2,686,988 | |
| | |
Hermes International (France) | | | 570 | | | | 410,601 | |
| | |
Huazhu Group Ltd., ADR (China)1 | | | 38,881 | | | | 1,472,035 | |
| | |
Jubilant Foodworks Ltd. (India) | | | 84,050 | | | | 1,894,594 | |
| | |
LVMH Moet Hennessy Louis Vuitton SE (France) | | | 3,660 | | | | 1,563,025 | |
| | |
MakeMyTrip, Ltd. (India)*,1 | | | 75,009 | | | | 1,726,707 | |
| | |
Maruti Suzuki India, Ltd. (India) | | | 30,688 | | | | 3,269,770 | |
| | |
Moncler SpA (Italy) | | | 37,312 | | | | 1,439,823 | |
| | |
Naspers, Ltd., N Shares (South Africa) | | | 5,353 | | | | 757,496 | |
| | |
New Oriental Education & Technology Group, Inc., Sponsored ADR (China)* | | | 7,148 | | | | 872,485 | |
| | |
NIKE, Inc., Class B (United States) | | | 6,301 | | | | 564,254 | |
| | |
Prosus, N.V. (Netherlands)* | | | 19,753 | | | | 1,362,147 | |
| | |
Sands China, Ltd. (Macau) | | | 1,131,000 | | | | 5,570,876 | |
| | |
Starbucks Corp. (United States) | | | 3,401 | | | | 287,589 | |
| | |
TAL Education Group, ADR (China)* | | | 28,850 | | | | 1,235,068 | |
| | |
Tiffany & Co. (United States)1 | | | 2,941 | | | | 366,184 | |
| | |
Titan Co., Ltd. (India) | | | 46,200 | | | | 866,771 | |
| | |
Trip.com Group, Ltd., ADR (China)* | | | 112,385 | | | | 3,707,581 | |
| | |
Yum China Holdings, Inc. (China) | | | 84,484 | | | | 3,590,570 | |
| | |
Total Consumer Discretionary | | | | | | | 41,653,558 | |
| | |
Consumer Staples - 5.3% | | | | | | | | |
| | |
The Estee Lauder Cos., Inc., Class A (United States) | | | 1,790 | | | | 333,423 | |
| | |
Kimberly-Clark de Mexico, SAB de CV, Class A (Mexico) | | | 135,260 | | | | 271,765 | |
| | |
Kweichow Moutai Co., Ltd., Class A (China) | | | 3,293 | | | | 551,469 | |
| | |
LG Household & Health Care, Ltd. (South Korea) | | | 2,490 | | | | 2,694,424 | |
| | |
Unilever NV (United Kingdom) | | | 3,439 | | | | 203,268 | |
| | |
Wal-Mart de Mexico, SAB de CV (Mexico) | | | 418,220 | | | | 1,253,366 | |
| | | | | | | | |
| | | Shares | | | Value | |
| | |
Wuliangye Yibin Co., Ltd., Class A (China) | | | 35,603 | | | | $666,411 | |
| | |
Total Consumer Staples | | | | | | | 5,974,126 | |
| | |
Financials - 24.8% | | | | | | | | |
| | |
AIA Group, Ltd. (Hong Kong) | | | 451,700 | | | | 4,498,130 | |
| | |
Bank Mandiri Persero Tbk PT (Indonesia) | | | 2,090,920 | | | | 1,045,187 | |
| | |
China Merchants Bank Co., Ltd., Class H (China) | | | 399,050 | | | | 1,903,162 | |
| | |
Credicorp, Ltd. (Peru) | | | 3,679 | | | | 787,453 | |
| | |
Grupo Financiero Banorte, S.A.B de CV (Mexico) | | | 374,370 | | | | 2,046,954 | |
| | |
HDFC Bank, Ltd., ADR (India) | | | 79,796 | | | | 4,874,738 | |
| | |
Kotak Mahindra (India) | | | 143,181 | | | | 3,175,711 | |
| | |
Ping An Insurance Group Co. of China, Ltd., Class H (China) | | | 459,000 | | | | 5,297,682 | |
| | |
Sberbank of Russia PJSC, Sponsored ADR (Russia) | | | 309,191 | | | | 4,553,243 | |
| | |
Total Financials | | | | | | | 28,182,260 | |
| | |
Health Care - 6.3% | | | | | | | | |
| | |
China Resources Sanjiu Medical & Pharmaceutical Co., Ltd., Class A (China) | | | 702,091 | | | | 2,937,827 | |
| | |
CSPC Pharmaceutical Group, Ltd. (China) | | | 238,000 | | | | 609,547 | |
| | |
Jiangsu Hengrui Medicine Co., Ltd., Class A (China) | | | 55,380 | | | | 714,469 | |
| | |
Novo Nordisk A/S, Class B (Denmark) | | | 13,509 | | | | 742,842 | |
| | |
Ping An Healthcare and Technology Co., Ltd. (China)*,1,2 | | | 314,300 | | | | 2,149,563 | |
| | |
Total Health Care | | | | | | | 7,154,248 | |
| | |
Industrials - 2.5% | | | | | | | | |
| | |
Copa Holdings, S.A., Class A (Panama) | | | 5,311 | | | | 540,341 | |
| | |
FANUC Corp. (Japan) | | | 9,230 | | | | 1,820,611 | |
| | |
Havells India, Ltd. (India) | | | 43,501 | | | | 423,841 | |
| | |
Total Industrials | | | | | | | 2,784,793 | |
| | |
Information Technology - 10.5% | | | | | | | | |
| | |
Infineon Technologies AG (Germany) | | | 339,205 | | | | 6,569,984 | |
| | |
Mastercard, Inc., Class A (United States) | | | 1,956 | | | | 541,440 | |
| | |
Pagseguro Digital, Ltd., Class A
(Brazil)*,1 | | | 10,240 | | | | 379,699 | |
| | |
QUALCOMM, Inc. (United States) | | | 55,266 | | | | 4,445,597 | |
| | |
Total Information Technology | | | | | | | 11,936,720 | |
| | |
Materials - 3.4% | | | | | | | | |
| | |
Asian Paints, Ltd. (India) | | | 62,004 | | | | 1,580,519 | |
| | |
Chr Hansen Holding A/S (Denmark) | | | 17,964 | | | | 1,379,200 | |
| | |
Novozymes A/S (Denmark) | | | 18,320 | | | | 863,597 | |
| | |
Total Materials | | | | | | | 3,823,316 | |
| | |
Total Common Stocks
| | | | | | | | |
(Cost $99,165,664) | | | | | | | 109,849,745 | |
The accompanying notes are an integral part of these financial statements.
17
|
AMG GW&K Trilogy Emerging Wealth Equity Fund Schedule of Portfolio Investments(continued) |
| | | | | | | | |
| | | Principal
Amount | | | Value | |
| | |
Short-Term Investments - 5.6% | | | | | | | | |
| |
Joint Repurchase Agreements - 2.8%3 | | | | | |
| | |
Cantor Fitzgerald Securities, Inc., dated 10/31/19,due 11/01/19, 1.750% total to be received $1,000,049 (collateralized by various U.S. Government Agency Obligations and U.S. Treasuries, 0.000% - 9.000%, 11/25/19 - 10/20/68, totaling $1,020,041) | | | $1,000,000 | | | | $1,000,000 | |
| | |
Citigroup Global Markets, Inc., dated 10/31/19, due 11/01/19, 1.740% total to be received $1,000,048 (collateralized by various U.S. Government Agency Obligations and U.S. Treasuries, 2.500% - 8.000%, 12/01/20 - 01/01/59, totaling $1,020,000) | | | 1,000,000 | | | | 1,000,000 | |
| | |
Credit Suisse AG, dated 10/31/19, due 11/01/19, 1.730% total to be received $211,727 (collateralized by various U.S. Treasuries, 0.125% - 3.125%, 11/15/22 - 05/15/47, totaling $215,951) | | | 211,717 | | | | 211,717 | |
| | |
Guggenheim Securities LLC, dated 10/31/19, due 11/01/19, 1.760% total to be received $1,000,049 (collateralized by various U.S. Government Agency Obligations and U.S. Treasuries, 1.625% - 5.000%, 01/01/27 - 06/20/69, totaling $1,020,000) | | | 1,000,000 | | | | 1,000,000 | |
| | |
Total Joint Repurchase Agreements | | | | | | | 3,211,717 | |
| | | | | | | | |
| | | Shares | | | Value | |
| |
Other Investment Companies - 2.8% | | | | | |
| | |
Dreyfus Government Cash Management Fund, Institutional Shares, 1.73%4 | | | 1,035,029 | | | | $1,035,029 | |
| | |
Dreyfus Institutional Preferred Government Money Market Fund, Institutional Shares, 1.77%4 | | | 1,035,029 | | | | 1,035,029 | |
| | |
JPMorgan U.S. Government Money Market Fund, IM Shares, 1.75%4 | | | 1,066,393 | | | | 1,066,393 | |
| | |
Total Other Investment Companies | | | | | | | 3,136,451 | |
| | |
Total Short-Term Investments | | | | | | | | |
(Cost $6,348,168) | | | | | | | 6,348,168 | |
| | |
Total Investments - 102.5% | | | | | | | | |
(Cost $105,513,832) | | | | | | | 116,197,913 | |
| |
Other Assets, less Liabilities - (2.5)% | | | | (2,793,817 | ) |
| | |
Net Assets - 100.0% | | | | | | | $113,404,096 | |
| * | Non-income producing security. |
| 1 | Some of these securities, amounting to $7,641,830 or 6.7% of net assets, were out on loan to various borrowers and are collateralized by cash and various U.S. Treasury Obligations. See Note 4 of Notes to Financial Statements. |
| 2 | Security exempt from registration under Rule 144A of the Securities Act of 1933. This security may be resold in transactions exempt from registration, normally to qualified buyers. At October 31, 2019, the value of these securities amounted to $2,149,563 or 1.9% of net assets. |
| 3 | Cash collateral received for securities lending activity was invested in these joint repurchase agreements. |
| 4 | Yield shown represents the October 31, 2019, seven day average yield, which refers to the sum of the previous seven days’ dividends paid, expressed as an annual percentage. |
| ADR | American Depositary Receipt |
The accompanying notes are an integral part of these financial statements.
18
|
AMG GW&K Trilogy Emerging Wealth Equity Fund Schedule of Portfolio Investments(continued) |
The following table summarizes the inputs used to value the Fund’s investments by the fair value hierarchy levels as of October 31, 2019:
| | | | | | | | | | | | | | | | | | | | |
| | | Level 1 | | Level 21 | | Level 3 | | Total |
Investments in Securities | | | | | | | | | | | | | | | | | | | | |
Common Stocks | | | | | | | | | | | | | | | | | | | | |
Consumer Discretionary | | | $ | 23,193,614 | | | | $ | 18,459,944 | | | | | — | | | | | $41,653,558 | |
Financials | | | | 7,709,145 | | | | | 20,473,115 | | | | | — | | | | | 28,182,260 | |
Information Technology | | | | 5,366,736 | | | | | 6,569,984 | | | | | — | | | | | 11,936,720 | |
Communication Services | | | | 4,288,459 | | | | | 4,052,265 | | | | | — | | | | | 8,340,724 | |
Health Care | | | | — | | | | | 7,154,248 | | | | | — | | | | | 7,154,248 | |
Consumer Staples | | | | 1,858,554 | | | | | 4,115,572 | | | | | — | | | | | 5,974,126 | |
Materials | | | | — | | | | | 3,823,316 | | | | | — | | | | | 3,823,316 | |
Industrials | | | | 540,341 | | | | | 2,244,452 | | | | | — | | | | | 2,784,793 | |
Short-Term Investments | | | | | | | | | | | | | | | | | | | | |
Joint Repurchase Agreements | | | | — | | | | | 3,211,717 | | | | | — | | | | | 3,211,717 | |
Other Investment Companies | | | | 3,136,451 | | | | | — | | | | | — | | | | | 3,136,451 | |
| | | | | | | | | | | | | | | | | | | | |
Total Investments in Securities | | | $ | 46,093,300 | | | | $ | 70,104,613 | | | | | — | | | | $ | 116,197,913 | |
| | | | | | | | | | | | | | | | | | | | |
| 1 | An external pricing service is used to reflect any impact on security value due to market movements between the time the Fund valued such foreign securities and the earlier closing of foreign markets. |
The following table below is a reconciliation of investments in which significant unobservable inputs (Level 3) were used in determining fair value at October 31, 2019:
| | | | | |
| | | Common
Stock |
Balance as of October 31, 2018 | | | | $244,523 | |
Accrued discounts (premiums) | | | | — | |
Realized gain (loss) | | | | — | |
Change in unrealized appreciation/depreciation | | | | — | |
Purchases | | | | — | |
Sales | | | | — | |
Transfers in to Level 3 | | | | — | |
Transfers out of Level 3 | | | | (244,523 | ) |
Balance as of October 31, 2019 | | | | — | |
| | | | | |
Net change in unrealized appreciation/depreciation on investments still held at October 31, 2019 | | | | — | |
The accompanying notes are an integral part of these financial statements.
19
|
AMG GW&K Trilogy Emerging Wealth Equity Fund Schedule of Portfolio Investments(continued) |
The country allocation in the Schedule of Portfolio Investments at October 31, 2019 is as follows:
| | | | |
| Country | | % of Long-Term
Investments |
Brazil | | | 0.3 | |
China | | | 35.4 | |
Denmark | | | 2.7 | |
France | | | 1.8 | |
Germany | | | 6.0 | |
Hong Kong | | | 4.1 | |
India | | | 20.0 | |
Indonesia | | | 0.9 | |
Italy | | | 1.3 | |
Japan | | | 1.7 | |
Macau | | | 5.1 | |
Mexico | | | 3.2 | |
Netherlands | | | 1.2 | |
Panama | | | 0.5 | |
Peru | | | 0.7 | |
Russia | | | 4.1 | |
South Africa | | | 1.0 | |
South Korea | | | 2.5 | |
United Kingdom | | | 0.2 | |
United States | | | 7.3 | |
| | | | | |
| |
| | | 100.0 | |
| | | | |
The accompanying notes are an integral part of these financial statements.
20
|
AMG GW&K Trilogy Emerging Markets Equity Fund Portfolio Manager’s Comments(unaudited) |
| | | | | | | | |
MARKET OVERVIEW Global equity markets experienced sharp declines in the final quarter of 2018, with the MSCI All Country World Index posting the worst annual performance since the global financial crisis of 2008. Notably, after leading global markets down in the previous two quarters, the MSCI Emerging Markets Index displayed relative strength in December. In response to firm U.S. economic data, the U.S. Federal Reserve (the “Fed”) delivered its fourth rate hike in December, the ninth hike of the tightening cycle, while giving only modestly dovish guidance about its future intentions. Moving into 2019, emerging market equities participated in the strong global rally and posted a first-quarter gain which was the largest advance since the first quarter of 2017, erasing the sharp decline of the previous quarter. The same factors that boosted global developed markets were also at play in emerging markets, such as dovish signals from key central banks (the Fed and the European Central Bank), optimism on U.S.-China trade negotiations, and early signs of stabilization in China’s economy. Overall, emerging market currencies held their ground against the U.S. dollar, while oil and industrial commodity prices firmed as concerns about the global economy began to ease. Although the MSCI Emerging Markets Index rose in the first quarter, it remained significantly below its peak level reached in January 2018 and lagged the first-quarter gain of the MSCI All Country World Index. Following the strong rally in the first quarter, emerging market equities ended the second quarter of 2019 with relatively flat performance due to tepid economic reports and an escalation of trade tensions. The flat performance for the second quarter masked considerable volatility within the quarter as markets responded negatively to a breakdown in U.S.-China trade negotiations. Evidence mounted that the trade war was resulting in a significant slowdown in global manufacturing activity as supply chains were disrupted while businesses put capital spending plans on hold. However, emerging market equities were able to recover in June as investors correctly discounted that the U.S. and China would agree at the end of the month to postpone further tariff hikes and resume negotiations. Emerging market equities continued to lag developed markets, with developed market equities posting their strongest first-half gain since 1998. The wide performance spread between emerging and developed markets in 2019 reflects the differential impact of weaker global manufacturing activity and ongoing tension surrounding U.S.-China | | | | trade negotiations. The confrontational tone between the two countries has hit emerging market assets particularly hard. Emerging market equities posted a decline for the third quarter of 2019, but ended off the period’s worst levels. There were signs of an easing of U.S.-China tensions in September, with China resuming some purchases of U.S. agricultural goods in advance of formal trade talks. In addition, investors have been focusing on the tempering effect of central bank policy actions to offset the global slowdown. A total of 16 central banks cut rates in the third quarter, led by two cuts by the Fed. That said, China has so far refrained from aggressive monetary easing. Its future policy stance remains an important wild card since China accounts for about one-third of global growth. During the two prior global downturns of 2008 and 2016, inflections in global growth required strong stimulus by China. Finishing off the fiscal year, emerging market equities did well in October but continued to lag developed markets for the calendar-year-to-date period. Several factors contributed to the improved environment for emerging market equities. First, market participants took comfort from the continued broad-based monetary easing by central banks. Second, a de-escalation of trade issues between the U.S. and China helped market sentiment. On October 11, the U.S. and China reached a tentative “Phase One” agreement on key trade issues. The U.S. agreed to hold off on tariff hikes scheduled for October 15 and December 15. In exchange, China offered key concessions on agricultural purchases and financial sector opening. But no deal has been signed, so there remains the risk of last-minute histrionics. Finally, odds of a no-deal Brexit also declined. Brexit now looks likely to proceed on January 31 next year. FUND REVIEW For the one-year period ending October 31, 2019, the AMG GW&K Trilogy Emerging Markets Equity Fund (the “Fund”) (Class Z shares) returned 14.39%, outperforming the MSCI Emerging Markets Index (the “Index”), which returned 11.86%. Looking at performance on a sector basis, stock selection in the consumer staples and financial sectors were the largest contributors to relative performance. Holdings in the industrial and information technology sectors, as well as an overweight allocation to the consumer discretionary sector, also contributed positively to relative performance. These positives were partially offset by the underperformance of holdings in the communication services sector and the underweight allocation to the real estate sector. Geographically, stock selection | | | | in Asia, particularly China, was the largest contributor to relative performance. Holdings in South Korea and Indonesia also added value, while stock selection in India and Thailand detracted from relative performance. The EMEA region also contributed positively to fiscal year performance, with our holdings in South Africa adding the most. Finally, within Latin America, the Fund’s holdings in Panama and Colombia added value relative to the benchmark while our exposure to Peru weighed on performance. OUTLOOK AND PORTFOLIO POSITIONING We believe emerging markets’ underperformance since early 2018 reflects a massive spike in global uncertainty, with the escalation of the U.S.-China trade war acting as the key driver. We expect political expediency in both the U.S. and China to support a gradual de-escalation of the trade war ahead of next November’s U.S. presidential election. That could become a catalyst for emerging market outperformance in coming quarters. Relative valuations should also work in favor of emerging vs developed markets. At the end of October, emerging markets traded at a Shiller PE ratio of 12.7 times compared to 30.3 for the S&P 500® Index and 17.8 for the MSCI EAFE Index. By inverting those Shiller PE ratios, long-term earnings yields can be derived as follows: 7.9% for emerging markets versus 3.3% for the S&P 500® and 5.6% for MSCI EAFE. Those yields can be viewed as rough-and-ready predictors of future expected real returns. They suggest that emerging markets are currently priced to deliver superior long-term returns. With respect to the Fund’s structure, trading and market activity during the fiscal year resulted in increased exposures to the communication services, consumer staples, information technology, industrials, health care, and real estate sectors while exposures to the materials, financial, energy, and consumer discretionary sectors decreased. At the close of the period, the Fund had overweight positions in the consumer discretionary, financial, consumer staples, communication services, and health care sectors and underweight positions in the materials, energy, utilities, and real estate sectors relative to the benchmark. Geographically, the portfolio finished the fiscal year with exposures of 70% in Asia, 16% in Latin America, and 14% in the EMEA region. The views expressed represent the opinions of GW&K Investment Management, LLC as of October 31, 2019, and are not intended as a forecast or guarantee of future results, and are subject to change without notice. |
21
|
AMG GW&K Trilogy Emerging Markets Equity Fund Portfolio Manager’s Comments(continued) |
CUMULATIVE TOTAL RETURN PERFORMANCE
AMG GW&K Trilogy Emerging Markets Equity Fund’s (formerly AMG Trilogy Emerging Markets Equity Fund) cumulative total return is based on the daily change in net asset value (NAV), and assumes that all dividends and distributions were reinvested. This graph compares a hypothetical $10,000 investment made in the AMG GW&K Trilogy Emerging Markets Equity Fund’s Class Z shares on March 01, 2011 (inception date), to a $10,000 investment made in the MSCI Emerging Markets Index for the same time period. The graph and table do not reflect the deduction of taxes that a shareholder would pay on a Fund distribution or redemption of shares. The listed returns for the Fund are net of expenses and the returns for the index exclude expenses. Total returns would have been lower had certain expenses not been reduced.
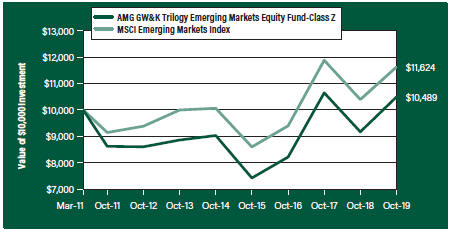
The table below shows the average annual total returns for the AMG GW&K Trilogy Emerging Markets Equity Fund and the MSCI Emerging Markets Index for the same time periods ended October 31, 2019.
| | | | | | | | | | | | | | | | |
| Average Annual Total Returns1 | | One
Year | | | Five
Years | | | Since
Inception | | | Inception
Date | |
AMG GW&K Trilogy Emerging Markets Equity Fund2, 3, 4, 5, 6, 7, 8, 9, 10 | | | | | |
| | | | |
Class N | | | 13.94 | % | | | 2.57 | % | | | 1.05 | % | | | 03/01/12 | |
| | | | |
Class I | | | 14.34 | % | | | 2.93 | % | | | 0.45 | % | | | 03/01/11 | |
| | | | |
Class Z | | | 14.39 | % | | | 3.04 | % | | | 0.55 | % | | | 03/01/11 | |
| | | | |
MSCI Emerging Markets Index11 | | | 11.86 | % | | | 2.93 | % | | | 1.75 | % | | | 03/01/11 | † |
The performance data shown represents past performance. Past performance is not a guarantee of future results. Current performance may be lower or higher than the performance data quoted. The investment return and principal value of an investment will fluctuate so that an investor’s shares, when redeemed, may be worth more or less than their original cost.
Investors should carefully consider the Fund’s investment objectives, risks, charges and expenses before investing. For performance information through the most recent month end, current net asset values per share for the Fund and other information, please call 800.548.4539 or visit our website at amgfunds.com for a free prospectus. Read it carefully before investing or sending money.
Distributed by AMG Distributors, Inc., member FINRA/SIPC.
| † | Date reflects inception date of the Fund, not the index. |
| 1 | Total return equals income yield plus share price change and assumes reinvestment of all dividends and capital gain distributions. Returns are net of fees and may reflect offsets of Fund expenses as described in the prospectus. No adjustment has been made for taxes payable by shareholders on their reinvested dividends and |
| | |
| | | capital gain distributions. Returns for periods greater than one year are annualized. The listed returns on the Fund are net of expenses and based on the published NAV as of October 31, 2019. All returns are in U.S. dollars ($). 2 The Fund is subject to currency risk resulting from fluctuations in exchange rates that may affect the total loss or gain on a non-U.S. Dollar investment when converted back to U.S. Dollars. 3 The Fund may invest in derivatives such as options and futures; the complexity and rapidly changing structure of derivatives markets may increase the possibility of market losses. 4 The Fund is subject to the risks associated with investments in emerging markets, such as erratic earnings patterns, economic and political instability, changing exchange controls, limitations on repatriation of foreign capital and changes in local governmental attitudes toward private investment, possibly leading to nationalization or confiscation of investor assets. 5 The Fund invests in growth stocks, which may be more sensitive to market movements because their prices tend to reflect future investor expectations rather than just current profits. Growth stocks may underperform value stocks during given periods. 6 Investments in international securities are subject to certain risks of overseas investing including currency fluctuations and changes in political and economic conditions, which could result in significant market fluctuations. These risks are magnified in emerging markets. 7 Investing in initial public offerings (IPOs) is risky and the prices of stocks purchased in IPOs tend to fluctuate more widely than stocks of companies that have been publicly traded for a longer period of time. Stocks purchased in IPOs generally do not have a trading history, and information about the companies may be available for very limited periods. |
| | |
| | | 8 The Fund is subject to risks associated with investments in mid-capitalization companies such as greater price volatility, lower trading volume, and less liquidity than the stocks of larger, more established companies. 9 Companies that are in similar businesses may be similarly affected by particular economic or market events; to the extent the Fund has substantial holdings within a particular sector, the risks associated with that sector increase. 10 The Fund is subject to risks associated with investments in small-capitalization companies, such as erratic earnings patterns, competitive conditions, limited earnings history and a reliance on one or a limited number of products. |
22
|
AMG GW&K Trilogy Emerging Markets Equity Fund Portfolio Manager’s Comments(continued) |
| | | | | | | | |
11 The MSCI Emerging Markets Index is a free float-adjusted market capitalization index that is designed to measure equity market performance of emerging markets. Please go to msci.com for most current list of countries represented by the index. Unlike the Fund, the MSCI Emerging Markets Index is unmanaged, is not available for investment and does not incur expenses. | | | | All MSCI data is provided “as is.” The products described herein are not sponsored or endorsed and have not been reviewed or passed on by MSCI. In no event shall MSCI, its affiliates or any MSCI data provider have any liability of any kind in connection with the MSCI data or the products described herein. Copying or redistributing the MSCI data is strictly prohibited. | | | | Not FDIC insured, nor bank guaranteed. May lose value. |
23
|
AMG GW&K Trilogy Emerging Markets Equity Fund Fund Snapshots(unaudited) October 31, 2019 |
PORTFOLIO BREAKDOWN
| | |
| Sector | | % of Net Assets |
| | |
Financials | | 27.2 |
| | |
Consumer Discretionary | | 19.4 |
| | |
Information Technology | | 15.8 |
| | |
Communication Services | | 12.3 |
| | |
Consumer Staples | | 8.7 |
| | |
Industrials | | 5.4 |
| | |
Health Care | | 4.0 |
| | |
Energy | | 2.9 |
| | |
Materials | | 1.4 |
| | |
Real Estate | | 0.6 |
| | |
Short-Term Investments | | 2.7 |
| | |
Other Assets Less Liabilities | | (0.4) |
TOP TEN HOLDINGS
| | |
| Security Name | | % of
Net Assets |
Taiwan Semiconductor Manufacturing Co., Ltd. (Taiwan) | | 5.7 |
| | |
Samsung Electronics Co., Ltd. (South Korea) | | 5.2 |
| | |
Alibaba Group Holding, Ltd., Sponsored ADR (China) | | 5.2 |
| | |
Tencent Holdings, Ltd. (China) | | 4.3 |
| | |
Sberbank of Russia PJSC, Sponsored ADR (Russia) | | 3.5 |
| | |
Ping An Insurance Group Co. of China, Ltd., Class H (China) | | 3.0 |
| | |
Itau Unibanco Holding, S.A., Sponsored ADR (Brazil) | | 2.1 |
| | |
Banco Bradesco, S.A., ADR (Brazil) | | 2.0 |
| | |
Housing Development Finance Corp., Ltd. (India) | | 1.9 |
| | |
Shanghai International Airport Co., Ltd., Class A (China) | | 1.8 |
| | | |
| | |
Top Ten as a Group | | 34.7 |
| | |
Because a fund’s strategy may result in multiple investments in particular sectors of the economy, its performance may depend on the performance of those sectors and may fluctuate more widely than investments diversified across more sectors. For additional information on these and other risk considerations, please see the Fund’s prospectus.
Any sectors, industries, or securities discussed should not be perceived as investment recommendations. Mention of a specific security should not be considered a recommendation to buy or solicitation to sell that security. Specific securities mentioned in this report may have been sold from the Fund’s portfolio of investments by the time you receive this report.
24
|
AMG GW&K Trilogy Emerging Markets Equity Fund Schedule of Portfolio Investments October 31, 2019 |
| | | | | | | | |
| | | Shares | | | Value | |
| | |
Common Stocks - 97.7% | | | | | | | | |
| |
Communication Services - 12.3% | | | | | |
| | |
58.com, Inc., ADR (China)* | | | 7,773 | | | | $410,492 | |
| | |
Autohome, Inc., ADR (China)* | | | 2,627 | | | | 222,139 | |
| | |
Baidu, Inc., Sponsored ADR (China)* | | | 3,770 | | | | 383,975 | |
| | |
iQIYI, Inc., ADR (China)*,1 | | | 23,288 | | | | 405,910 | |
| | |
MultiChoice Group (South Africa)* | | | 68,107 | | | | 567,224 | |
| | |
NetEase, Inc., ADR (China) | | | 1,756 | | | | 501,970 | |
| | |
Telekomunikasi Indonesia Persero Tbk PT (Indonesia) | | | 1,564,347 | | | | 456,509 | |
| | |
Tencent Holdings, Ltd. (China) | | | 59,300 | | | | 2,405,381 | |
| | |
Tencent Music Entertainment Group, ADR (China)*,1 | | | 53,180 | | | | 736,011 | |
| | |
Zee Entertainment Enterprises, Ltd. (India) | | | 231,207 | | | | 849,480 | |
| | |
Total Communication Services | | | | | | | 6,939,091 | |
| | |
Consumer Discretionary - 19.4% | | | | | | | | |
| | |
Alibaba Group Holding, Ltd., Sponsored ADR (China)* | | | 16,491 | | | | 2,913,465 | |
| | |
Feng TAY Enterprise Co., Ltd. (Taiwan) | | | 118,560 | | | | 800,913 | |
| | |
Hanon Systems (South Korea) | | | 43,799 | | | | 435,907 | |
| | |
MakeMyTrip, Ltd. (India)* | | | 15,043 | | | | 346,290 | |
| | |
Maruti Suzuki India, Ltd. (India) | | | 3,744 | | | | 398,919 | |
| | |
Midea Group Co., Ltd., Class A (China) | | | 67,385 | | | | 531,022 | |
| | |
Naspers, Ltd., N Shares (South Africa) | | | 4,859 | | | | 687,590 | |
| | |
New Oriental Education & Technology Group, Inc., Sponsored ADR (China)* | | | 5,789 | | | | 706,605 | |
| | |
Prosus, N.V. (Netherlands)* | | | 11,159 | | | | 769,513 | |
| | |
Sands China, Ltd. (Macau) | | | 171,647 | | | | 845,468 | |
| | |
Shanghai Jinjiang International Hotels Co., Ltd. (China) | | | 55,700 | | | | 176,751 | |
| | |
Shenzhou International Group Holdings, Ltd. (China) | | | 59,600 | | | | 823,592 | |
| | |
Trip.com Group, Ltd., ADR (China)* | | | 26,126 | | | | 861,897 | |
| | |
Yum China Holdings, Inc. (China) | | | 14,566 | | | | 619,055 | |
| | |
Total Consumer Discretionary | | | | | | | 10,916,987 | |
| | |
Consumer Staples - 8.7% | | | | | | | | |
| | |
Bid Corp., Ltd. (South Africa) | | | 24,646 | | | | 574,972 | |
| | |
BIM Birlesik Magazalar AS (Turkey) | | | 51,580 | | | | 426,913 | |
| | |
CP ALL PCL (Thailand) | | | 65,100 | | | | 168,267 | |
| | |
Dino Polska S.A. (Poland)*,2 | | | 6,523 | | | | 254,201 | |
| | |
Fomento Economico Mexicano, S.A.B de CV (Mexico) | | | 55,434 | | | | 492,743 | |
| | |
Inner Mongolia Yili Industrial Group Co., Ltd., Class A (China) | | | 67,800 | | | | 279,214 | |
| | |
Kweichow Moutai Co., Ltd., Class A (China) | | | 3,400 | | | | 569,388 | |
| | | | | | | | |
| | | Shares | | | Value | |
| | |
LG Household & Health Care, Ltd. (South Korea) | | | 241 | | | | $260,786 | |
| | |
Uni-President Enterprises Corp. (Taiwan) | | | 127,000 | | | | 313,739 | |
| | |
Wal-Mart de Mexico, SAB de CV (Mexico) | | | 219,800 | | | | 658,720 | |
| | |
Wuliangye Yibin Co., Ltd., Class A (China) | | | 49,000 | | | | 917,173 | |
| | |
Total Consumer Staples | | | | | | | 4,916,116 | |
| | |
Energy - 2.9% | | | | | | | | |
| | |
Novatek PJSC, Sponsored GDR (Russia) | | | 3,451 | | | | 740,356 | |
| | |
Reliance Industries, Ltd. (India) | | | 43,500 | | | | 896,592 | |
| | |
Total Energy | | | | | | | 1,636,948 | |
| | |
Financials - 27.2% | | | | | | | | |
| | |
AIA Group, Ltd. (Hong Kong) | | | 95,800 | | | | 953,998 | |
| | |
Banco Bradesco, S.A., ADR (Brazil) | | | 128,859 | | | | 1,128,805 | |
| | |
Banco de Chile, ADR (Chile)1 | | | 13,256 | | | | 340,414 | |
| | |
Bancolombia, S.A., Sponsored ADR (Colombia) | | | 13,078 | | | | 678,487 | |
| | |
Bank Mandiri Persero Tbk PT (Indonesia) | | | 1,232,100 | | | | 615,889 | |
| | |
Bank Rakyat Indonesia Persero Tbk PT (Indonesia) | | | 2,457,635 | | | | 736,394 | |
| | |
BDO Unibank, Inc. (Philippines) | | | 191,655 | | | | 584,645 | |
| | |
Credicorp, Ltd. (Peru) | | | 3,993 | | | | 854,662 | |
| | |
FirstRand, Ltd. (South Africa) | | | 155,364 | | | | 671,636 | |
| | |
Grupo Financiero Banorte, S.A.B de CV (Mexico) | | | 162,400 | | | | 887,959 | |
| | |
HDFC Bank, Ltd. (India) | | | 58,300 | | | | 1,010,123 | |
| | |
Housing Development Finance Corp., Ltd. (India) | | | 35,733 | | | | 1,072,421 | |
| | |
Itau Unibanco Holding, S.A., Sponsored ADR (Brazil) | | | 134,076 | | | | 1,210,706 | |
| | |
Noah Holdings, Ltd., ADR (China)*,1 | | | 6,737 | | | | 204,064 | |
| | |
OTP Bank Plc (Hungary) | | | 17,009 | | | | 784,403 | |
| | |
Ping An Insurance Group Co. of China, Ltd., Class H (China) | | | 145,000 | | | | 1,673,560 | |
| | |
Sberbank of Russia PJSC, Sponsored ADR (Russia) | | | 132,210 | | | | 1,946,966 | |
| | |
Total Financials | | | | | | | 15,355,132 | |
| | |
Health Care - 4.0% | | | | | | | | |
| | |
China Resources Sanjiu Medical & Pharmaceutical Co., Ltd., Class A (China) | | | 151,700 | | | | 634,773 | |
| | |
Fleury, S.A. (Brazil) | | | 100,918 | | | | 637,138 | |
| | |
Lepu Medical Technology Beijing Co., Ltd., Class A (China) | | | 75,000 | | | | 321,488 | |
| | |
Microport Scientific Corp. (China) | | | 177,080 | | | | 181,845 | |
| | |
Odontoprev, S.A. (Brazil) | | | 134,906 | | | | 501,546 | |
| | |
Total Health Care | | | | | | | 2,276,790 | |
| | |
Industrials - 5.4% | | | | | | | | |
| | |
Adani Ports & Special Economic Zone, Ltd. (India) | | | 113,180 | | | | 630,687 | |
| | |
The Bidvest Group, Ltd. (South Africa) | | | 25,158 | | | | 343,428 | |
| | |
Copa Holdings, S.A., Class A (Panama) | | | 5,468 | | | | 556,314 | |
The accompanying notes are an integral part of these financial statements.
25
|
AMG GW&K Trilogy Emerging Markets Equity Fund Schedule of Portfolio Investments(continued) |
| | | | | | | | |
| | | Shares | | | Value | |
| | |
Industrials - 5.4%(continued) | | | | | | | | |
| | |
Grupo Aeroportuario del Pacifico, S.A.B de CV, Class B (Mexico) | | | 42,706 | | | | $447,629 | |
| | |
Shanghai International Airport Co., Ltd., Class A (China) | | | 96,069 | | | | 1,040,457 | |
| | |
Total Industrials | | | | | | | 3,018,515 | |
| |
Information Technology - 15.8% | | | | | |
| | |
Delta Electronics, Inc. (Taiwan) | | | 119,720 | | | | 525,629 | |
| | |
Infosys, Ltd., Sponsored ADR (India) | | | 32,837 | | | | 314,907 | |
| | |
Pagseguro Digital, Ltd., Class A (Brazil)*,1 | | | 8,714 | | | | 323,115 | |
| | |
Samsung Electronics Co., Ltd. (South Korea) | | | 68,367 | | | | 2,954,812 | |
| | |
SK Hynix, Inc. (South Korea) | | | 14,792 | | | | 1,040,114 | |
| | |
Sunny Optical Technology Group Co., Ltd. (China) | | | 33,200 | | | | 533,653 | |
| | |
Taiwan Semiconductor Manufacturing Co., Ltd. (Taiwan) | | | 326,632 | | | | 3,200,929 | |
| | |
Total Information Technology | | | | | | | 8,893,159 | |
| | |
Materials - 1.4% | | | | | | | | |
| | |
Grasim Industries, Ltd. (India) | | | 24,413 | | | | 264,492 | |
| | |
LG Chem, Ltd. (South Korea) | | | 1,963 | | | | 517,928 | |
| | |
Total Materials | | | | | | | 782,420 | |
| | |
Real Estate - 0.6% | | | | | | | | |
| | |
Emaar Malls PJSC (United Arab Emirates) | | | 631,234 | | | | 334,701 | |
| | |
Total Common Stocks | | | | | | | | |
(Cost $46,346,976) | | | | | | | 55,069,859 | |
| | | | | | | | |
| | | Principal Amount | | | Value | |
| | |
Short-Term Investments - 2.7% | | | | | | | | |
| |
Joint Repurchase Agreements - 1.2%3 | | | | | |
| | |
Citigroup Global Markets, Inc., dated 10/31/19, due 11/01/19, 1.720% total to be received $661,910 (collateralized by various U.S. Treasuries, 0.125% - 4.250%, 03/31/20 - 02/15/49, totaling $675,116) | | | $661,878 | | | | $661,878 | |
| | |
| | | Shares | | | | |
| |
Other Investment Companies - 1.5% | | | | | |
| | |
Dreyfus Government Cash Management Fund, Institutional Shares, 1.73%4 | | | 280,391 | | | | 280,391 | |
| | |
Dreyfus Institutional Preferred Government Money Market Fund, Institutional Shares, 1.77%4 | | | 280,391 | | | | 280,391 | |
| | |
JPMorgan U.S. Government Money Market Fund, IM Shares, 1.75%4 | | | 288,888 | | | | 288,888 | |
| | |
Total Other Investment Companies | | | | | | | 849,670 | |
| | |
Total Short-Term Investments | | | | | | | | |
(Cost $1,511,548) | | | | | | | 1,511,548 | |
| | |
Total Investments - 100.4% | | | | | | | | |
(Cost $47,858,524) | | | | | | | 56,581,407 | |
| |
Other Assets, less Liabilities - (0.4)% | | | | (234,087 | ) |
| | |
Net Assets - 100.0% | | | | | | | $56,347,320 | |
| * | Non-income producing security. |
| 1 | Some of these securities, amounting to $1,682,508 or 3.0% of net assets, were out on loan to various borrowers and are collateralized by cash and various U.S. Treasury Obligations. See Note 4 of Notes to Financial Statements. |
| 2 | Security exempt from registration under Rule 144A of the Securities Act of 1933. This security may be resold in transactions exempt from registration, normally to qualified buyers. At October 31, 2019, the value of these securities amounted to $254,201 or 0.5% of net assets. |
| 3 | Cash collateral received for securities lending activity was invested in these joint repurchase agreements. |
| 4 | Yield shown represents the October 31, 2019, seven day average yield, which refers to the sum of the previous seven days’ dividends paid, expressed as an annual percentage. |
| ADR | American Depositary Receipt |
| GDR | Global Depositary Receipt |
The accompanying notes are an integral part of these financial statements.
26
|
AMG GW&K Trilogy Emerging Markets Equity Fund Schedule of Portfolio Investments(continued) |
The following table summarizes the inputs used to value the Fund’s investments by the fair value hierarchy levels as of October 31, 2019:
| | | | | | | | | | | | | | | | | | | | |
| | | Level 1 | | Level 21 | | Level 3 | | Total |
Investments in Securities | | | | | | | | | | | | | | | | | | | | |
Common Stocks | | | | | | | | | | | | | | | | | | | | |
Financials | | | | $5,305,097 | | | | $ | 10,050,035 | | | | | — | | | | $ | 15,355,132 | |
Consumer Discretionary | | | | 6,216,825 | | | | | 4,700,162 | | | | | — | | | | | 10,916,987 | |
Information Technology | | | | 638,022 | | | | | 8,255,137 | | | | | — | | | | | 8,893,159 | |
Communication Services | | | | 3,509,977 | | | | | 3,429,114 | | | | | — | | | | | 6,939,091 | |
Consumer Staples | | | | 1,578,376 | | | | | 3,337,740 | | | | | — | | | | | 4,916,116 | |
Industrials | | | | 1,003,943 | | | | | 2,014,572 | | | | | — | | | | | 3,018,515 | |
Health Care | | | | 1,138,684 | | | | | 1,138,106 | | | | | — | | | | | 2,276,790 | |
Energy | | | | — | | | | | 1,636,948 | | | | | — | | | | | 1,636,948 | |
Materials | | | | — | | | | | 782,420 | | | | | — | | | | | 782,420 | |
Real Estate | | | | — | | | | | 334,701 | | | | | — | | | | | 334,701 | |
Short-Term Investments | | | | | | | | | | | | | | | | | | | | |
Joint Repurchase Agreements | | | | — | | | | | 661,878 | | | | | — | | | | | 661,878 | |
Other Investment Companies | | | | 849,670 | | | | | — | | | | | — | | | | | 849,670 | |
| | | | | | | | | | | | | | | | | | | | |
Total Investments in Securities | | | $ | 20,240,594 | | | | $ | 36,340,813 | | | | | — | | | | $ | 56,581,407 | |
| | | | | | | | | | | | | | | | | | | | |
| 1 | An external pricing service is used to reflect any impact on security value due to market movements between the time the Fund valued such foreign securities and the earlier closing of foreign markets. |
For the fiscal year ended October 31, 2019, there were no transfers in or out of Level 3.
The country allocation in the Schedule of Portfolio Investments at October 31, 2019 is as follows:
| | | | |
| Country | | % of Long-Term
Investments |
Brazil | | | 6.9 | |
Chile | | | 0.6 | |
China | | | 32.8 | |
Colombia | | | 1.2 | |
Hong Kong | | | 1.7 | |
Hungary | | | 1.4 | |
India | | | 10.5 | |
Indonesia | | | 3.3 | |
Macau | | | 1.5 | |
Mexico | | | 4.5 | |
Netherlands | | | 1.4 | |
Panama | | | 1.0 | |
| | | | |
| Country | | % of Long-Term
Investments |
Peru | | | 1.5 | |
Philippines | | | 1.1 | |
Poland | | | 0.5 | |
Russia | | | 4.9 | |
South Africa | | | 5.2 | |
South Korea | | | 9.5 | |
Taiwan | | | 8.8 | |
Thailand | | | 0.3 | |
Turkey | | | 0.8 | |
United Arab Emirates | | | 0.6 | |
| | | | |
| | | 100.0 | |
| | | | |
The accompanying notes are an integral part of these financial statements.
27
|
Statement of Assets and Liabilities October 31, 2019 |
| | | | | | | | | | | | | | | |
| | | AMG GW&K Core
Bond
ESG Fund | | AMG GW&K Trilogy
Emerging Wealth
Equity Fund | | AMG GW&K Trilogy
Emerging Markets
Equity Fund |
Assets: | | | | | | | | | | | | | | | |
Investments at value1(including securities on loan valued at $0, $7,641,830, and $1,682,508, respectively) | | | | $216,012,581 | | | | | $116,197,913 | | | | | $56,581,407 | |
Foreign currency2 | | | | — | | | | | 285,629 | | | | | 68,965 | |
Receivable for investments sold | | | | — | | | | | — | | | | | 514,736 | |
Dividend, interest and other receivables | | | | 1,557,609 | | | | | 64,879 | | | | | 42,037 | |
Receivable for Fund shares sold | | | | 10,815 | | | | | 380,955 | | | | | 775 | |
Prepaid expenses and other assets | | | | 20,269 | | | | | 10,820 | | | | | 10,244 | |
Total assets | | | | 217,601,274 | | | | | 116,940,196 | | | | | 57,218,164 | |
Liabilities: | | | | | | | | | | | | | | | |
Payable upon return of securities loaned | | | | — | | | | | 3,211,717 | | | | | 661,878 | |
Payable for investments purchased | | | | 61,191 | | | | | — | | | | | 87,511 | |
Payable for Fund shares repurchased | | | | 110,274 | | | | | 67,946 | | | | | 2,495 | |
Payable for foreign capital gains tax | | | | — | | | | | 127,643 | | | | | 9,065 | |
Accrued expenses: | | | | | | | | | | | | | | | |
Investment advisory and management fees | | | | 55,569 | | | | | 50,796 | | | | | 25,874 | |
Administrative fees | | | | 27,688 | | | | | 13,853 | | | | | 7,057 | |
Distribution fees | | | | 263 | | | | | 415 | | | | | 108 | |
Shareholder service fees | | | | 7,358 | | | | | 388 | | | | | — | |
Other | | | | 74,372 | | | | | 63,342 | | | | | 76,856 | |
Total liabilities | | | | 336,715 | | | | | 3,536,100 | | | | | 870,844 | |
| | | | | | | | | | | | | | | |
Net Assets | | | | $217,264,559 | | | | | $113,404,096 | | | | | $56,347,320 | |
1Investments at cost | | | | $207,563,791 | | | | | $105,513,832 | | | | | $47,858,524 | |
2Foreign currency at cost | | | | — | | | | | $285,740 | | | | | $69,774 | |
The accompanying notes are an integral part of these financial statements.
28
|
Statement of Assets and Liabilities(continued) |
| | | | | | | | | | | | | | | |
| | | AMG GW&K Core
Bond
ESG Fund | | AMG GW&K Trilogy
Emerging Wealth
Equity Fund | | AMG GW&K Trilogy
Emerging Markets
Equity Fund |
| | | |
Net Assets Represent: | | | | | | | | | | | | | | | |
Paid-in capital | | | | $213,029,898 | | | | | $99,594,638 | | | | | $45,688,599 | |
Total distributable earnings | | | | 4,234,661 | | | | | 13,809,458 | | | | | 10,658,721 | |
Net Assets | | | | $217,264,559 | | | | | $113,404,096 | | | | | $56,347,320 | |
| | | |
Class N: | | | | | | | | | | | | | | | |
Net Assets | | | | $1,255,297 | | | | | $2,006,910 | | | | | $520,090 | |
Shares outstanding | | | | 119,158 | | | | | 168,158 | | | | | 54,622 | |
| | | |
Net asset value, offering and redemption price per share | | | | $10.53 | | | | | $11.93 | | | | | $9.52 | |
Class I: | | | | | | | | | | | | | | | |
Net Assets | | | | $212,801,331 | | | | | $6,327,987 | | | | | $24,099,957 | |
Shares outstanding | | | | 20,195,221 | | | | | 526,084 | | | | | 2,542,423 | |
| | | |
Net asset value, offering and redemption price per share | | | | $10.54 | | | | | $12.03 | | | | | $9.48 | |
Class Z: | | | | | | | | | | | | | | | |
Net Assets | | | | $3,207,931 | | | | | $105,069,199 | | | | | $31,727,273 | |
Shares outstanding | | | | 304,618 | | | | | 8,763,076 | | | | | 3,363,902 | |
| | | |
Net asset value, offering and redemption price per share | | | | $10.53 | | | | | $11.99 | | | | | $9.43 | |
The accompanying notes are an integral part of these financial statements.
29
|
Statement of Operations For the fiscal year ended October 31, 2019 |
| | | | | | | | | | | | | | | | | | | | | | | | | |
| | | AMG GW&K Core
Bond
ESG Fund | | AMG GW&K Trilogy
Emerging Wealth
Equity Fund | | AMG GW&K Trilogy
Emerging Markets
Equity Fund | | | | |
Investment Income: | | | | | | | | | | | | | | | | | | | | | | | | | |
Dividend income | | | | $66,340 | | | | | $2,070,029 | | | | | $4,755,424 | | | | | | | | | | | |
Interest income | | | | 6,738,479 | | | | | 138 | | | | | — | | | | | | | | | | | |
Securities lending income | | | | — | | | | | 48,604 | | | | | 33,472 | | | | | | | | | | | |
Foreign withholding tax | | | | — | | | | | (109,306 | ) | | | | (423,398 | ) | | | | | | | | | | |
Total investment income | | | | 6,804,819 | | | | | 2,009,465 | | | | | 4,365,498 | | | | | | | | | | | |
Expenses: | | | | | | | | | | | | | | | | | | | | | | | | | |
Investment advisory and management fees | | | | 685,681 | | | | | 479,631 | | | | | 850,725 | | | | | | | | | | | |
Administrative fees | | | | 342,841 | | | | | 130,809 | | | | | 232,016 | | | | | | | | | | | |
Distribution fees - Class N | | | | 1,822 | | | | | 5,086 | | | | | 1,077 | | | | | | | | | | | |
Shareholder servicing fees - Class N | | | | 1,093 | | | | | 3,051 | | | | | 647 | | | | | | | | | | | |
Shareholder servicing fees - Class I | | | | 166,517 | | | | | 3,934 | | | | | 13,666 | | | | | | | | | | | |
Professional fees | | | | 57,639 | | | | | 62,825 | | | | | 80,440 | | | | | | | | | | | |
Registration fees | | | | 52,054 | | | | | 54,842 | | | | | 51,138 | | | | | | | | | | | |
Custodian fees | | | | 36,965 | | | | | 80,549 | | | | | 133,349 | | | | | | | | | | | |
Reports to shareholders | | | | 23,335 | | | | | 10,309 | | | | | 16,655 | | | | | | | | | | | |
Transfer agent fees | | | | 22,876 | | | | | 3,240 | | | | | 5,430 | | | | | | | | | | | |
Trustee fees and expenses | | | | 22,223 | | | | | 7,419 | | | | | 15,317 | | | | | | | | | | | |
Miscellaneous | | | | 14,708 | | | | | 5,146 | | | | | 10,857 | | | | | | | | | | | |
Repayment of prior reimbursements | | | | — | | | | | 14,028 | | | | | — | | | | | | | | | | | |
Total expenses before offsets | | | | 1,427,754 | | | | | 860,869 | | | | | 1,411,317 | | | | | | | | | | | |
Expense reimbursements | | | | (156,648 | ) | | | | — | | | | | — | | | | | | | | | | | |
Net expenses | | | | 1,271,106 | | | | | 860,869 | | | | | 1,411,317 | | | | | | | | | | | |
| | | | | | | | | | | | | | | | | | | | | | | | | |
Net investment income | | | | 5,533,713 | | | | | 1,148,596 | | | | | 2,954,181 | | | | | | | | | | | |
Net Realized and Unrealized Gain: | | | | | | | | | | | | | | | | | | | | | | | | | |
Net realized gain (loss) on investments | | | | (417,409 | ) | | | | 2,349,007 | | | | | 12,901,906 | | | | | | | | | | | |
Net realized loss on foreign currency transactions | | | | — | | | | | (95,065 | ) | | | | (355,093 | ) | | | | | | | | | | |
Net change in unrealized appreciation/depreciation on investments | | | | 20,112,764 | | | | | 11,997,673 | | | | | 4,419,624 | | | | | | | | | | | |
| | | | | |
Net change in unrealized appreciation/depreciation on foreign currency translations | | | | — | | | | | (119,761 | ) | | | | (5,637 | ) | | | | | | | | | | |
Net realized and unrealized gain | | | | 19,695,355 | | | | | 14,131,854 | | | | | 16,960,800 | | | | | | | | | | | |
| | | | | | | | | | | | | | | | | | | | | | | | | |
Net increase in net assets resulting from operations | | | | $25,229,068 | | | | | $15,280,450 | | | | | $19,914,981 | | | | | | | | | | | |
The accompanying notes are an integral part of these financial statements.
30
|
Statements of Changes in Net Assets For the fiscal years ended October 31, |
| | | | | | | | | | | | | | | | | | | | | | | | | | | | | | |
| | | AMG GW&K Core
Bond ESG Fund | | AMG GW&K Trilogy
Emerging Wealth
Equity Fund | | AMG GW&K Trilogy
Emerging Markets
Equity Fund |
| | | | | | |
| | | 2019 | | 2018 | | 2019 | | 2018 | | 2019 | | 2018 |
| | | | | | |
Increase (Decrease) in Net Assets Resulting From Operations: | | | | | | | | | | | | | | | | | | | | | | | | | | | | | | |
Net investment income | | | | $5,533,713 | | | | | $6,582,045 | | | | | $1,148,596 | | | | | $599,084 | | | | | $2,954,181 | | | | | $2,324,220 | |
Net realized gain (loss) on investments | | | | (417,409 | ) | | | | (1,658,735 | ) | | | | 2,253,942 | | | | | 2,832,808 | | | | | 12,546,813 | | | | | 5,101,177 | |
Net change in unrealized appreciation/depreciation on investments | | | | 20,112,764 | | | | | (12,727,480 | ) | | | | 11,877,912 | | | | | (15,165,726 | ) | | | | 4,413,987 | | | | | (30,255,989 | ) |
| | | | | | |
Net increase (decrease) in net assets resulting from operations | | | | 25,229,068 | | | | | (7,804,170 | ) | | | | 15,280,450 | | | | | (11,733,834 | ) | | | | 19,914,981 | | | | | (22,830,592 | ) |
Distributions to Shareholders: | | | | | | | | | | | | | | | | | | | | | | | | | | | | | | |
Class N | | | | (15,730 | ) | | | | (6,701 | ) | | | | (91,676 | ) | | | | (1,210 | ) | | | | (12,186 | ) | | | | (2,438 | ) |
Class I | | | | (5,461,302 | ) | | | | (6,491,282 | ) | | | | (88,034 | ) | | | | (76,934 | ) | | | | (702,208 | ) | | | | (26,234 | ) |
Class Z | | | | (85,424 | ) | | | | (121,411 | ) | | | | (3,150,911 | ) | | | | (3,581,095 | ) | | | | (5,489,154 | ) | | | | (1,711,909 | ) |
Total distributions to shareholders | | | | (5,562,456 | ) | | | | (6,619,394 | ) | | | | (3,330,621 | ) | | | | (3,659,239 | ) | | | | (6,203,548 | ) | | | | (1,740,581 | ) |
Capital Share Transactions:1 | | | | | | | | | | | | | | | | | | | | | | | | | | | | | | |
| | | | | | |
Net increase (decrease) from capital share transactions | | | | (72,704,031 | ) | | | | (46,865,335 | ) | | | | 36,532,694 | | | | | 19,158,573 | | | | | (102,551,166 | ) | | | | 36,373,294 | |
| | | | | | | | | | | | | | | | | | | | | | | | | | | | | | |
| | | | | | |
Total increase (decrease) in net assets | | | | (53,037,419 | ) | | | | (61,288,899 | ) | | | | 48,482,523 | | | | | 3,765,500 | | | | | (88,839,733 | ) | | | | 11,802,121 | |
Net Assets: | | | | | | | | | | | | | | | | | | | | | | | | | | | | | | |
Beginning of year | | | | 270,301,978 | | | | | 331,590,877 | | | | | 64,921,573 | | | | | 61,156,073 | | | | | 145,187,053 | | | | | 133,384,932 | |
End of year | | | | $217,264,559 | | | | | $270,301,978 | | | | | $113,404,096 | | | | | $64,921,573 | | | | | $56,347,320 | | | | | $145,187,053 | |
| 1 | See Note 1(g) of the Notes to Financial Statements. |
The accompanying notes are an integral part of these financial statements.
31
|
AMG GW&K Core Bond ESG Fund Financial Highlights For a share outstanding throughout each fiscal period |
| | | | | | | | | | | | | | | | | | | | | | | | | |
| | | For the fiscal year ended October 31, | | For the fiscal period ended October 31, |
| | | | | |
| Class N | | 2019 | | 2018 | | 2017 | | 20161 | | 20152 |
Net Asset Value, Beginning of Period | | | | $9.67 | | | | | $10.14 | | | | | $10.26 | | | | | $10.23 | | | | | $10.39 | |
Income (loss) from Investment Operations: | | | | | | | | | | | | | | | | | | | | | | | | | |
Net investment income3,4 | | | | 0.21 | | | | | 0.18 | | | | | 0.18 | | | | | 0.16 | | | | | 0.08 | |
| | | | | |
Net realized and unrealized gain (loss) on investments | | | | 0.86 | | | | | (0.46 | ) | | | | (0.12 | ) | | | | 0.28 | | | | | (0.16 | ) |
| | | | | |
Total income (loss) from investment operations | | | | 1.07 | | | | | (0.28 | ) | | | | 0.06 | | | | | 0.44 | | | | | (0.08 | ) |
Less Distributions to Shareholders from: | | | | | | | | | | | | | | | | | | | | | | | | | |
Net investment income | | | | (0.21 | ) | | | | (0.19 | ) | | | | (0.18 | ) | | | | (0.17 | ) | | | | (0.08 | ) |
Net realized gain on investments | | | | — | | | | | — | | | | | — | | | | | (0.24 | ) | | | | — | |
Total distributions to shareholders | | | | (0.21 | ) | | | | (0.19 | ) | | | | (0.18 | ) | | | | (0.41 | ) | | | | (0.08 | ) |
Net Asset Value, End of Period | | | | $10.53 | | | | | $9.67 | | | | | $10.14 | | | | | $10.26 | | | | | $10.23 | |
Total Return4,5 | | | | 11.20 | % | | | | (2.79 | )% | | | | 0.57 | % | | | | 4.44 | % | | | | (0.76 | )%6 |
Ratio of net expenses to average net assets | | | | 0.88 | % | | | | 0.88 | % | | | | 0.88 | % | | | | 0.88 | % | | | | 0.88 | %7 |
| | | | | |
Ratio of gross expenses to average net assets8 | | | | 0.95 | % | | | | 0.93 | % | | | | 0.93 | % | | | | 0.97 | % | | | | 0.99 | %7 |
| | | | | |
Ratio of net investment income to average net assets4 | | | | 2.10 | % | | | | 1.88 | % | | | | 1.75 | % | | | | 1.51 | % | | | | 1.67 | %7 |
Portfolio turnover | | | | 48 | % | | | | 17 | % | | | | 18 | % | | | | 48 | % | | | | 175 | % |
Net assets end of period (000’s) omitted | | | | $1,255 | | | | | $502 | | | | | $146 | | | | | $293 | | | | | $124 | |
| | | | | | | | | | | | | | | | | | | | | | | | | | |
32
|
AMG GW&K Core Bond ESG Fund Financial Highlights For a share outstanding throughout each fiscal year |
| | | | | | | | | | | | | | | | | | | | | | | | | |
| | | For the fiscal year ended October 31, |
| | | | | |
| Class I | | 2019 | | 2018 | | 2017 | | 20161 | | 2015 |
Net Asset Value, Beginning of Year | | | | $9.67 | | | | | $10.15 | | | | | $10.27 | | | | | $10.24 | | | | | $10.87 | |
Income (loss) from Investment Operations: | | | | | | | | | | | | | | | | | | | | | | | | | |
Net investment income3,4 | | | | 0.24 | | | | | 0.22 | | | | | 0.21 | | | | | 0.21 | | | | | 0.18 | |
| | | | | |
Net realized and unrealized gain (loss) on investments | | | | 0.88 | | | | | (0.48 | ) | | | | (0.12 | ) | | | | 0.26 | | | | | (0.11 | ) |
Total income (loss) from investment operations | | | | 1.12 | | | | | (0.26 | ) | | | | 0.09 | | | | | 0.47 | | | | | 0.07 | |
Less Distributions to Shareholders from: | | | | | | | | | | | | | | | | | | | | | | | | | |
Net investment income | | | | (0.25 | ) | | | | (0.22 | ) | | | | (0.21 | ) | | | | (0.20 | ) | | | | (0.35 | ) |
Net realized gain on investments | | | | — | | | | | — | | | | | — | | | | | (0.24 | ) | | | | (0.35 | ) |
Total distributions to shareholders | | | | (0.25 | ) | | | | (0.22 | ) | | | | (0.21 | ) | | | | (0.44 | ) | | | | (0.70 | ) |
Net Asset Value, End of Year | | | | $10.54 | | | | | $9.67 | | | | | $10.15 | | | | | $10.27 | | | | | $10.24 | |
Total Return4,5 | | | | 11.70 | % | | | | (2.59 | )% | | | | 0.91 | % | | | | 4.79 | % | | | | 0.68 | % |
Ratio of net expenses to average net assets | | | | 0.55 | % | | | | 0.56 | % | | | | 0.55 | % | | | | 0.55 | % | | | | 0.56 | % |
Ratio of gross expenses to average net assets8 | | | | 0.62 | % | | | | 0.61 | % | | | | 0.60 | % | | | | 0.65 | % | | | | 0.67 | % |
| | | | | |
Ratio of net investment income to average net assets4 | | | | 2.42 | % | | | | 2.20 | % | | | | 2.08 | % | | | | 2.01 | % | | | | 1.70 | % |
Portfolio turnover | | | | 48 | % | | | | 17 | % | | | | 18 | % | | | | 48 | % | | | | 175 | % |
Net assets end of year (000’s) omitted | | | | $212,801 | | | | | $264,795 | | | | | $325,855 | | | | | $414,400 | | | | | $572,110 | |
| | | | | | | | | | | | | | | | | | | | | | | | | | |
33
|
AMG GW&K Core Bond ESG Fund Financial Highlights For a share outstanding throughout each fiscal period |
| | | | | | | | | | | | | | | | | | | | | | | | | |
| | | For the fiscal year ended October 31, | | For the fiscal period ended October 31, |
| | | | | |
| Class Z | | 2019 | | 2018 | | 2017 | | 20161 | | 20152 |
Net Asset Value, Beginning of Period | | | | $9.67 | | | | | $10.14 | | | | | $10.26 | | | | | $10.23 | | | | | $10.39 | |
Income (loss) from Investment Operations: | | | | | | | | | | | | | | | | | | | | | | | | | |
Net investment income3,4 | | | | 0.25 | | | | | 0.23 | | | | | 0.22 | | | | | 0.19 | | | | | 0.10 | |
| | | | | |
Net realized and unrealized gain (loss) on investments | | | | 0.87 | | | | | (0.47 | ) | | | | (0.12 | ) | | | | 0.29 | | | | | (0.16 | ) |
| | | | | |
Total income (loss) from investment operations | | | | 1.12 | | | | | (0.24 | ) | | | | 0.10 | | | | | 0.48 | | | | | (0.06 | ) |
Less Distributions to Shareholders from: | | | | | | | | | | | | | | | | | | | | | | | | | |
Net investment income | | | | (0.26 | ) | | | | (0.23 | ) | | | | (0.22 | ) | | | | (0.21 | ) | | | | (0.10 | ) |
Net realized gain on investments | | | | — | | | | | — | | | | | — | | | | | (0.24 | ) | | | | — | |
Total distributions to shareholders | | | | (0.26 | ) | | | | (0.23 | ) | | | | (0.22 | ) | | | | (0.45 | ) | | | | (0.10 | ) |
Net Asset Value, End of Period | | | | $10.53 | | | | | $9.67 | | | | | $10.14 | | | | | $10.26 | | | | | $10.23 | |
Total Return4,5 | | | | 11.71 | % | | | | (2.42 | )% | | | | 0.98 | % | | | | 4.85 | % | | | | (0.58 | )%6 |
Ratio of net expenses to average net assets | | | | 0.48 | % | | | | 0.48 | % | | | | 0.48 | % | | | | 0.48 | % | | | | 0.48 | %7 |
| | | | | |
Ratio of gross expenses to average net assets8 | | | | 0.55 | % | | | | 0.53 | % | | | | 0.53 | % | | | | 0.58 | % | | | | 0.59 | %7 |
| | | | | |
Ratio of net investment income to average net assets4 | | | | 2.50 | % | | | | 2.28 | % | | | | 2.15 | % | | | | 1.88 | % | | | | 2.05 | %7 |
Portfolio turnover | | | | 48 | % | | | | 17 | % | | | | 18 | % | | | | 48 | % | | | | 175 | % |
Net assets end of period (000’s) omitted | | | | $3,208 | | | | | $5,005 | | | | | $5,590 | | | | | $5,668 | | | | | $4,891 | |
| | | | | | | | | | | | | | | | | | | | | | | | | | |
| 1 | Effective October 1, 2016, the Investor Class, Service Class and Institutional Class were renamed Class N, Class I and Class Z, respectively. |
| 2 | Commencement of operations was on May 8, 2015. |
| 3 | Per share numbers have been calculated using average shares. |
| 4 | Total returns and net investment income would have been lower had certain expenses not been offset. |
| 5 | The total return is calculated using the published Net Asset Value as of fiscal year end. |
| 8 | Excludes the impact of expense reimbursement or fee waivers and expense reductions such as brokerage credits, but includes expense repayments and non-reimbursable expenses, if any, such as interest, taxes, and extraordinary expenses. (See Note 1(c) and 2 in the Notes to Financial Statements.) |
34
|
AMG GW&K Trilogy Emerging Wealth Equity Fund Financial Highlights For a share outstanding throughout each fiscal period |
| | | | | | | | | | | | | | | | | | | | | | | | | |
| | | For the fiscal year ended October 31, | | For the fiscal period ended October 31, |
| | | | | |
| Class N | | 2019 | | 2018 | | 2017 | | 20161 | | 20152 |
Net Asset Value, Beginning of Period | | | | $10.38 | | | | | $12.94 | | | | | $10.13 | | | | | $9.34 | | | | | $10.00 | |
Income (loss) from Investment Operations: | | | | | | | | | | | | | | | | | | | | | | | | | |
Net investment income3,4 | | | | 0.10 | | | | | 0.06 | | | | | 0.05 | | | | | 0.05 | | | | | 0.04 | |
| | | | | |
Net realized and unrealized gain (loss) on investments | | | | 1.95 | | | | | (1.88 | ) | | | | 2.80 | | | | | 0.74 | | | | | (0.70 | ) |
| | | | | |
Total income (loss) from investment operations | | | | 2.05 | | | | | (1.82 | ) | | | | 2.85 | | | | | 0.79 | | | | | (0.66 | ) |
Less Distributions to Shareholders from: | | | | | | | | | | | | | | | | | | | | | | | | | |
Net investment income | | | | (0.06 | ) | | | | (0.05 | ) | | | | (0.04 | ) | | | | — | | | | | — | |
Net realized gain on investments | | | | (0.44 | ) | | | | (0.69 | ) | | | | — | | | | | — | | | | | — | |
Total distributions to shareholders | | | | (0.50 | ) | | | | (0.74 | ) | | | | (0.04 | ) | | | | — | | | | | — | |
Net Asset Value, End of Period | | | | $11.93 | | | | | $10.38 | | | | | $12.94 | | | | | $10.13 | | | | | $9.34 | |
Total Return4,5 | | | | 20.82 | % | | | | (15.16 | )% | | | | 28.31 | % | | | | 8.46 | % | | | | (6.60 | )%6 |
Ratio of net expenses to average net assets | | | | 1.37 | %7 | | | | 1.45 | %7,8 | | | | 1.45 | %7,8 | | | | 1.44 | % | | | | 1.33 | %9 |
| | | | | |
Ratio of gross expenses to average net assets10 | | | | 1.37 | %7 | | | | 1.45 | %7 | | | | 1.45 | %7 | | | | 1.53 | % | | | | 1.65 | %9 |
| | | | | |
Ratio of net investment income to average net assets4 | | | | 0.93 | % | | | | 0.49 | % | | | | 0.45 | % | | | | 0.51 | % | | | | 0.65 | %9 |
Portfolio turnover | | | | 40 | % | | | | 37 | % | | | | 68 | % | | | | 58 | % | | | | 45 | %6 |
Net assets end of period (000’s) omitted | | | | $2,007 | | | | | $1,940 | | | | | $10 | | | | | $10 | | | | | $9 | |
| | | | | | | | | | | | | | | | | | | | | | | | | | |
35
|
AMG GW&K Trilogy Emerging Wealth Equity Fund Financial Highlights For a share outstanding throughout each fiscal period |
| | | | | | | | | | | | | | | | | | | | | | | | | |
| | | For the fiscal year ended October 31, | | For the fiscal period ended October 31, |
| | | | | |
| Class I | | 2019 | | 2018 | | 2017 | | 20161 | | 20152 |
Net Asset Value, Beginning of Period | | | | $10.44 | | | | | $12.96 | | | | | $10.14 | | | | | $9.34 | | | | | $10.00 | |
Income (loss) from Investment Operations: | | | | | | | | | | | | | | | | | | | | | | | | | |
Net investment income3,4 | | | | 0.14 | | | | | 0.09 | | | | | 0.08 | | | | | 0.07 | | | | | 0.04 | |
| | | | | |
Net realized and unrealized gain (loss) on investments | | | | 1.96 | | | | | (1.88 | ) | | | | 2.81 | | | | | 0.75 | | | | | (0.70 | ) |
| | | | | |
Total income (loss) from investment operations | | | | 2.10 | | | | | (1.79 | ) | | | | 2.89 | | | | | 0.82 | | | | | (0.66 | ) |
Less Distributions to Shareholders from: | | | | | | | | | | | | | | | | | | | | | | | | | |
Net investment income | | | | (0.07 | ) | | | | (0.04 | ) | | | | (0.07 | ) | | | | (0.02 | ) | | | | — | |
Net realized gain on investments | | | | (0.44 | ) | | | | (0.69 | ) | | | | — | | | | | — | | | | | — | |
Total distributions to shareholders | | | | (0.51 | ) | | | | (0.73 | ) | | | | (0.07 | ) | | | | (0.02 | ) | | | | — | |
Net Asset Value, End of Period | | | | $12.03 | | | | | $10.44 | | | | | $12.96 | | | | | $10.14 | | | | | $9.34 | |
Total Return4,5 | | | | 21.15 | % | | | | (14.89 | )% | | | | 28.73 | % | | | | 8.77 | % | | | | (6.60 | )%6 |
Ratio of net expenses to average net assets | | | | 1.08 | %7 | | | | 1.19 | %7,8 | | | | 1.12 | %7,8 | | | | 1.16 | % | | | | 1.16 | %9 |
| | | | | |
Ratio of gross expenses to average net assets10 | | | | 1.08 | %7 | | | | 1.19 | %7 | | | | 1.16 | %7 | | | | 1.24 | % | | | | 1.45 | %9 |
| | | | | |
Ratio of net investment income to average net assets4 | | | | 1.22 | % | | | | 0.75 | % | | | | 0.78 | % | | | | 0.79 | % | | | | 0.61 | %9 |
Portfolio turnover | | | | 40 | % | | | | 37 | % | | | | 68 | % | | | | 58 | % | | | | 45 | %6 |
Net assets end of period (000’s) omitted | | | | $6,328 | | | | | $2,539 | | | | | $1,646 | | | | | $16,639 | | | | | $22,432 | |
| | | | | | | | | | | | | | | | | | | | | | | | | | |
36
|
AMG GW&K Trilogy Emerging Wealth Equity Fund Financial Highlights For a share outstanding throughout each fiscal period |
| | | | | | | | | | | | | | | | | | | | | | | | | |
| | | For the fiscal year ended October 31, | | For the fiscal period ended October 31, |
| | | | | |
| Class Z | | 2019 | | 2018 | | 2017 | | 20161 | | 20152 |
Net Asset Value, Beginning of Period | | | | $10.41 | | | | | $12.97 | | | | | $10.15 | | | | | $9.35 | | | | | $10.00 | |
| | | | | |
Income (loss) from Investment Operations: | | | | | | | | | | | | | | | | | | | | | | | | | |
Net investment income3,4 | | | | 0.15 | | | | | 0.11 | | | | | 0.10 | | | | | 0.09 | | | | | 0.04 | |
| | | | | |
Net realized and unrealized gain (loss) on investments | | | | 1.96 | | | | | (1.89 | ) | | | | 2.80 | | | | | 0.74 | | | | | (0.69 | ) |
| | | | | |
Total income (loss) from investment operations | | | | 2.11 | | | | | (1.78 | ) | | | | 2.90 | | | | | 0.83 | | | | | (0.65 | ) |
Less Distributions to Shareholders from: | | | | | | | | | | | | | | | | | | | | | | | | | |
Net investment income | | | | (0.09 | ) | | | | (0.09 | ) | | | | (0.08 | ) | | | | (0.03 | ) | | | | — | |
Net realized gain on investments | | | | (0.44 | ) | | | | (0.69 | ) | | | | — | | | | | — | | | | | — | |
Total distributions to shareholders | | | | (0.53 | ) | | | | (0.78 | ) | | | | (0.08 | ) | | | | (0.03 | ) | | | | — | |
Net Asset Value, End of Period | | | | $11.99 | | | | | $10.41 | | | | | $12.97 | | | | | $10.15 | | | | | $9.35 | |
Total Return4,5 | | | | 21.34 | % | | | | (14.87 | )% | | | | 28.86 | % | | | | 8.86 | % | | | | (6.50 | )%6 |
| | | | | |
Ratio of net expenses to average net assets | | | | 0.97 | %7 | | | | 1.05 | %7,8 | | | | 1.05 | %7,8 | | | | 1.05 | % | | | | 1.05 | %9 |
| | | | | |
Ratio of gross expenses to average net assets10 | | | | 0.97 | %7 | | | | 1.05 | %7 | | | | 1.05 | %7 | | | | 1.15 | % | | | | 1.50 | %9 |
| | | | | |
Ratio of net investment income to average net assets4 | | | | 1.33 | % | | | | 0.89 | % | | | | 0.85 | % | | | | 0.94 | % | | | | 0.64 | %9 |
Portfolio turnover | | | | 40 | % | | | | 37 | % | | | | 68 | % | | | | 58 | % | | | | 45 | %6 |
Net assets end of period (000’s) omitted | | | | $105,069 | | | | | $60,443 | | | | | $59,500 | | | | | $30,777 | | | | | $7,782 | |
| | | | | | | | | | | | | | | | | | | | | | | | | | |
| 1 | Effective October 1, 2016, the Investor Class, Service Class and Institutional Class were renamed Class N, Class I and Class Z, respectively. |
| 2 | Commencement of operations was on March 20, 2015. |
| 3 | Per share numbers have been calculated using average shares. |
| 4 | Total returns and net investment income would have been lower had certain expenses not been offset. |
| 5 | The total return is calculated using the published Net Asset Value as of fiscal year end. |
| 7 | Such ratio includes recapture of waived/reimbursed fees from prior periods amounting to 0.02%, 0.07% and 0.04% for the fiscal years ended October 31, 2019, 2018 and 2017, respectively. |
| 8 | Includes reduction from broker recapture amounting to less than 0.01%. |
| 10 | Excludes the impact of expense reimbursement or fee waivers and expense reductions such as brokerage credits, but includes expense repayments and non-reimbursable expenses, if any, such as interest, taxes, and extraordinary expenses. (See Note 1(c) and 2 in the Notes to Financial Statements.) |
37
|
AMG GW&K Trilogy Emerging Markets Equity Fund Financial Highlights For a share outstanding throughout each fiscal year |
| | | | | | | | | | | | | | | | | | | | | | | | | |
| | | For the fiscal year ended October 31, |
| | | | | |
| Class N | | 2019 | | 2018 | | 2017 | | 20161 | | 2015 |
Net Asset Value, Beginning of Year | | | | $8.61 | | | | | $10.11 | | | | | $7.91 | | | | | $7.23 | | | | | $8.83 | |
Income (loss) from Investment Operations: | | | | | | | | | | | | | | | | | | | | | | | | | |
Net investment income2,3 | | | | 0.14 | | | | | 0.11 | | | | | 0.09 | | | | | 0.06 | | | | | 0.06 | |
Net realized and unrealized gain (loss) on investments | | | | 1.04 | | | | | (1.54 | ) | | | | 2.18 | | | | | 0.66 | | | | | (1.66 | ) |
Total income (loss) from investment operations | | | | 1.18 | | | | | (1.43 | ) | | | | 2.27 | | | | | 0.72 | | | | | (1.60 | ) |
Less Distributions to Shareholders from: | | | | | | | | | | | | | | | | | | | | | | | | | |
Net investment income | | | | (0.17 | ) | | | | (0.07 | ) | | | | (0.07 | ) | | | | (0.04 | ) | | | | — | |
Net realized gain on investments | | | | (0.10 | ) | | | | — | | | | | — | | | | | — | | | | | — | |
Total distributions to shareholders | | | | (0.27 | ) | | | | (0.07 | ) | | | | (0.07 | ) | | | | (0.04 | ) | | | | — | |
Net Asset Value, End of Year | | | | $9.52 | | | | | $8.61 | | | | | $10.11 | | | | | $7.91 | | | | | $7.23 | |
Total Return3 | | | | 13.94 | %4 | | | | (14.24 | )%4 | | | | 28.97 | %4 | | | | 10.01 | % | | | | (18.12 | )% |
Ratio of net expenses to average net assets | | | | 1.30 | % | | | | 1.27 | % | | | | 1.31 | % | | | | 1.44 | % | | | | 1.45 | % |
Ratio of gross expenses to average net assets5 | | | | 1.30 | % | | | | 1.27 | % | | | | 1.31 | % | | | | 1.44 | % | | | | 1.45 | % |
Ratio of net investment income to average net assets3 | | | | 1.52 | % | | | | 1.12 | % | | | | 1.08 | % | | | | 0.81 | % | | | | 0.76 | % |
Portfolio turnover | | | | 123 | % | | | | 24 | % | | | | 29 | % | | | | 33 | % | | | | 45 | % |
Net assets end of year (000’s) omitted | | | | $520 | | | | | $289 | | | | | $350 | | | | | $497 | | | | | $57 | |
| | | | | | | | | | | | | | | | | | | | | | | | | | |
38
|
AMG GW&K Trilogy Emerging Markets Equity Fund Financial Highlights For a share outstanding throughout each fiscal year |
| | | | | | | | | | | | | | | | | | | | | | | | | |
| | | For the fiscal year ended October 31, |
| | | | | |
| Class I | | 2019 | | 2018 | | 2017 | | 20161 | | 2015 |
Net Asset Value, Beginning of Year | | | | $8.60 | | | | | $10.11 | | | | | $7.90 | | | | | $7.19 | | | | | $8.88 | |
Income (loss) from Investment Operations: | | | | | | | | | | | | | | | | | | | | | | | | | |
Net investment income2,3 | | | | 0.17 | | | | | 0.13 | | | | | 0.12 | | | | | 0.08 | | | | | 0.05 | |
Net realized and unrealized gain (loss) on investments | | | | 1.04 | | | | | (1.53 | ) | | | | 2.18 | | | | | 0.67 | | | | | (1.62 | ) |
Total income (loss) from investment operations | | | | 1.21 | | | | | (1.40 | ) | | | | 2.30 | | | | | 0.75 | | | | | (1.57 | ) |
Less Distributions to Shareholders from: | | | | | | | | | | | | | | | | | | | | | | | | | |
Net investment income | | | | (0.23 | ) | | | | (0.11 | ) | | | | (0.09 | ) | | | | (0.04 | ) | | | | (0.12 | ) |
Net realized gain on investments | | | | (0.10 | ) | | | | — | | | | | — | | | | | — | | | | | — | |
Total distributions to shareholders | | | | (0.33 | ) | | | | (0.11 | ) | | | | (0.09 | ) | | | | (0.04 | ) | | | | (0.12 | ) |
Net Asset Value, End of Year | | | | $9.48 | | | | | $8.60 | | | | | $10.11 | | | | | $7.90 | | | | | $7.19 | |
Total Return3 | | | | 14.34 | %4 | | | | (13.94 | )%4 | | | | 29.34 | %4 | | | | 10.48 | %4 | | | | (17.82 | )%4 |
Ratio of net expenses to average net assets | | | | 0.97 | % | | | | 0.99 | % | | | | 1.03 | % | | | | 1.07 | % | | | | 1.00 | % |
Ratio of gross expenses to average net assets5 | | | | 0.97 | % | | | | 0.99 | % | | | | 1.03 | % | | | | 1.07 | % | | | | 1.00 | % |
Ratio of net investment income to average net assets3 | | | | 1.85 | % | | | | 1.40 | % | | | | 1.36 | % | | | | 1.14 | % | | | | 0.65 | % |
Portfolio turnover | | | | 123 | % | | | | 24 | % | | | | 29 | % | | | | 33 | % | | | | 45 | % |
Net assets end of year (000’s) omitted | | | | $24,100 | | | | | $11,210 | | | | | $2,207 | | | | | $1,271 | | | | | $1,203 | |
| | | | | | | | | | | | | | | | | | | | | | | | | | |
39
|
AMG GW&K Trilogy Emerging Markets Equity Fund Financial Highlights For a share outstanding throughout each fiscal year |
��
| | | | | | | | | | | | | | | | | | | | | | | | | |
| | | For the fiscal year ended October 31, |
| | | | | |
| Class Z | | 2019 | | 2018 | | 2017 | | 20161 | | 2015 |
Net Asset Value, Beginning of Year | | | | $8.56 | | | | | $10.06 | | | | | $7.86 | | | | | $7.20 | | | | | $8.89 | |
Income (loss) from Investment Operations: | | | | | | | | | | | | | | | | | | | | | | | | | |
Net investment income2,3 | | | | 0.18 | | | | | 0.15 | | | | | 0.13 | | | | | 0.09 | | | | | 0.09 | |
| | | | | |
Net realized and unrealized gain (loss) on investments | | | | 1.02 | | | | | (1.53 | ) | | | | 2.16 | | | | | 0.65 | | | | | (1.65 | ) |
Total income (loss) from investment operations | | | | 1.20 | | | | | (1.38 | ) | | | | 2.29 | | | | | 0.74 | | | | | (1.56 | ) |
Less Distributions to Shareholders from: | | | | | | | | | | | | | | | | | | | | | | | | | |
Net investment income | | | | (0.23 | ) | | | | (0.12 | ) | | | | (0.09 | ) | | | | (0.08 | ) | | | | (0.13 | ) |
Net realized gain on investments | | | | (0.10 | ) | | | | — | | | | | — | | | | | — | | | | | — | |
Total distributions to shareholders | | | | (0.33 | ) | | | | (0.12 | ) | | | | (0.09 | ) | | | | (0.08 | ) | | | | (0.13 | ) |
Net Asset Value, End of Year | | | | $9.43 | | | | | $8.56 | | | | | $10.06 | | | | | $7.86 | | | | | $7.20 | |
Total Return3 | | | | 14.39 | %4 | | | | (13.88 | )%4 | | | | 29.62 | %4 | | | | 10.52 | % | | | | (17.69 | )% |
Ratio of net expenses to average net assets | | | | 0.90 | % | | | | 0.87 | % | | | | 0.88 | % | | | | 0.94 | % | | | | 0.95 | % |
Ratio of gross expenses to average net assets5 | | | | 0.90 | % | | | | 0.87 | % | | | | 0.88 | % | | | | 0.94 | % | | | | 0.95 | % |
| | | | | |
Ratio of net investment income to average net assets3 | | | | 1.92 | % | | | | 1.52 | % | | | | 1.51 | % | | | | 1.25 | % | | | | 1.18 | % |
Portfolio turnover | | | | 123 | % | | | | 24 | % | | | | 29 | % | | | | 33 | % | | | | 45 | % |
Net assets end of year (000’s) omitted | | | | $31,727 | | | | | $133,688 | | | | | $130,828 | | | | | $102,086 | | | | | $95,434 | |
| | | | | | | | | | | | | | | | | | | | | | | | | | |
| 1 | Effective October 1, 2016, the Investor Class, Service Class and Institutional Class were renamed Class N, Class I and Class Z, respectively. |
| 2 | Per share numbers have been calculated using average shares. |
| 3 | Total returns and net investment income would have been lower had certain expenses not been offset. |
| 4 | The total return is calculated using the published Net Asset Value as of fiscal year end. |
| 5 | Excludes the impact of expense reimbursement or fee waivers and expense reductions such as brokerage credits, but includes expense repayments and non-reimbursable expenses, if any, such as interest, taxes, and extraordinary expenses. (See Note 1(c) and 2 in the Notes to Financial Statements.) |
40
|
Notes to Financial Statements October 31, 2019 |
1. ORGANIZATION AND SUMMARY OF SIGNIFICANT ACCOUNTING POLICIES
AMG Funds and AMG Funds I (the “Trusts”) are open-end management investment companies, organized as Massachusetts business trusts, and registered under the Investment Company Act of 1940, as amended (the “1940 Act”). Currently, the Trusts consist of a number of different funds, each having distinct investment management objectives, strategies, risks, and policies. Included in this report are AMG Funds I: AMG GW&K Core Bond ESG Fund (“Core Bond ESG”) (formerly AMG GW&K Core Bond Fund) and AMG Funds: AMG GW&K Trilogy Emerging Wealth Equity Fund (“Emerging Wealth Equity”) (formerly AMG Trilogy Emerging Wealth Equity Fund) and AMG GW&K Trilogy Emerging Markets Equity Fund (“Emerging Markets Equity”) (formerly AMG Trilogy Emerging Markets Equity Fund), each a “Fund” and collectively, the “Funds”.
Each Fund offers different classes of shares. Each Fund offers Class N, Class I and Class Z shares. Each class represents an interest in the same assets of the respective Fund. Although all share classes generally have identical voting rights, each share class votes separately when required by law. Different share classes may have different net asset values per share to the extent the share classes pay different distribution amounts and/or the expenses of such share classes differ. Each share class has its own expense structure. Please refer to a current prospectus for additional information on each share class.
Effective May 1, 2019, Core Bond ESG changed its principle investment strategy to give special consideration to environmental, social and governance (“ESG”) criteria.
The Funds’ financial statements are prepared in accordance with accounting principles generally accepted in the United States of America (“U.S. GAAP”), including accounting and reporting guidance pursuant to Accounting Standards Codification Topic 946 applicable to investment companies. U.S. GAAP requires management to make estimates and assumptions that affect the reported amounts of assets and liabilities and disclosure of contingent assets and liabilities at the date of the financial statements and the reported amounts of income and expenses during the reporting period. Actual results could differ from those estimates and such differences could be material. The following is a summary of significant accounting policies followed by the Funds in the preparation of their financial statements:
a. VALUATION OF INVESTMENTS
Equity securities traded on a national securities exchange or reported on the NASDAQ national market system (“NMS”) are valued at the last quoted sales price on the primary exchange or, if applicable, the NASDAQ official closing price or the official closing price of the relevant exchange or, lacking any sales, at the last quoted bid price or the mean between the last quoted bid and ask prices (the “exchange mean price”). Equity securities traded in the over-the-counter market (other than NMS securities) are valued at the exchange mean price. Foreign equity securities (securities principally traded in markets other than U.S. markets) are valued at the official closing price on the primary exchange or, for markets that either do not offer an official closing price or where the official closing price may not be representative of the overall market, the last quoted sale price.
Fixed income securities purchased with a remaining maturity exceeding 60 days are valued at the evaluated mean price provided by an authorized pricing service or, if an evaluated price is not available, by reference to other securities which are
considered comparable in credit rating, interest rate, due date and other features (generally referred to as “matrix pricing”) or other similar pricing methodologies.
Fixed income securities purchased with a remaining maturity of 60 days or less are valued at amortized cost, provided that the amortized cost value is approximately the same as the fair value of the security valued without the use of amortized cost. Investments in other open-end registered investment companies are valued at their end of day net asset value per share.
The Funds’ portfolio investments are generally valued based on independent market quotations or prices or, if none, “evaluative” or other market based valuations provided by third party pricing services approved by the Board of Trustees of the Trusts (the “Board”). Under certain circumstances, the value of certain Fund portfolio investments may be based on an evaluation of fair value, pursuant to procedures established by and under the general supervision of the Board. The Valuation Committee, which is comprised of the Independent Trustees of the Board, and the Pricing Committee, which is comprised of representatives from AMG Funds LLC (the “Investment Manager”) are the committees appointed by the Board to make fair value determinations. Each Fund may use the fair value of a portfolio investment to calculate its net asset value (“NAV”) in the event that the market quotation, price or market based valuation for the portfolio investment is not readily available or otherwise not determinable pursuant to the Board’s valuation procedures, if the Investment Manager or the Pricing Committee believes the quotation, price or market based valuation to be unreliable, or in certain other circumstances. When determining the fair value of an investment, the Pricing Committee and, if required under the Trusts’ securities valuation procedures, the Valuation Committee, seeks to determine the price that the Fund might reasonably expect to receive from current sale of that portfolio investment in an arms-length transaction. Fair value determinations shall be based upon consideration of all available facts and information, including, but not limited to (i) attributes specific to the investment; (ii) fundamental and analytical data relating to the investment; and (iii) the value of other comparable securities or relevant financial instruments, including derivative securities, traded on other markets or among dealers.
The values assigned to fair value portfolio investments are based on available information and do not necessarily represent amounts that might ultimately be realized in the future, since such amounts depend on future developments inherent in long-term investments. Because of the inherent uncertainty of valuation, those estimated values may differ significantly from the values that would have been used had a ready market for the investments existed, and the differences could be material. The Board will be presented with a quarterly report showing as of the most recent quarter end, all outstanding securities fair valued by the Funds, including a comparison with the prior quarter end and the percentage of the Funds that the security represents at each quarter end.
With respect to foreign equity securities and certain foreign fixed income securities, the Board has adopted a policy that securities held in the Funds that can be fair valued by the applicable fair value pricing service are fair valued on each business day provided that each individual price exceeds a pre-established confidence level.
U.S. GAAP defines fair value as the price that a fund would receive to sell an asset or pay to transfer a liability in an orderly transaction between market participants at the measurement date. U.S. GAAP also establishes a framework for measuring fair value, and a three level hierarchy for fair value measurements based upon the transparency of inputs to the valuation of an asset or liability. Inputs may be observable or unobservable and refer broadly to the assumptions that market participants would use in pricing the asset or liability. Observable inputs reflect
41
|
Notes to Financial Statements(continued) |
the assumptions market participants would use in pricing the asset or liability based on market data obtained from sources independent of the Funds. Unobservable inputs reflect the Funds’ own assumptions about the assumptions that market participants would use in pricing the asset or liability developed based on the best information available in the circumstances. Each investment is assigned a level based upon the observability of the inputs which are significant to the overall valuation.
The three-tier hierarchy of inputs is summarized below:
Level 1 – inputs are quoted prices in active markets for identical investments (e.g., equity securities, open-end investment companies)
Level 2 – other observable inputs (including, but not limited to: quoted prices for similar assets or liabilities in markets that are active, quoted prices for identical or similar assets or liabilities in markets that are not active, inputs other than quoted prices that are observable for the assets or liabilities (such as interest rates, yield curves, volatilities, prepayment speeds, loss severities, credit risks and default rates) or other market corroborated inputs) (e.g., debt securities, government securities, foreign currency exchange contracts, swaps, foreign securities utilizing international fair value pricing, fair valued securities with observable inputs)
Level 3 – inputs are significant unobservable inputs (including the Fund’s own assumptions used to determine the fair value of investments) (e.g., fair valued securities with unobservable inputs)
Changes in inputs or methodologies used for valuing investments may result in a transfer in or out of levels within the fair value hierarchy. The inputs or methodologies used for valuing investments may not necessarily be an indication of the risk associated with investing in those investments.
b. SECURITY TRANSACTIONS
Security transactions are accounted for as of trade date. Realized gains and losses on securities sold are determined on the basis of identified cost.
c. INVESTMENT INCOME AND EXPENSES
Dividend income is recorded on the ex-dividend date. Dividends from foreign securities are recorded on the ex-dividend date, and if after the fact, as soon as the Funds become aware of the ex-dividend date, except for Korean securities where dividends are recorded on confirmation date. Interest income, which includes amortization of premium and accretion of discount on debt securities, is accrued as earned. Dividend and interest income on foreign securities is recorded gross of any withholding tax. Non-cash dividends included in dividend income, if any, are reported at the fair market value of the securities received. Upon notification from issuers, distributions received from a real estate investment trust (“REIT”) may be redesignated as a reduction of cost of investments and/or realized gain. Other income and expenses are recorded on an accrual basis. Expenses that cannot be directly attributed to a Fund are apportioned among the funds in the Trusts and other trusts or funds within the AMG Funds family of mutual funds (collectively the “AMG Funds Family”) based upon their relative average net assets or number of shareholders. Investment income, realized and unrealized capital gains and losses, the common expenses of each Fund, and certain fund level expense reductions, if any, are allocated on a pro-rata basis to each class based on the relative net assets of each class to the total net assets of each Fund.
d. DIVIDENDS AND DISTRIBUTIONS
Fund distributions resulting from either net investment income or realized net capital gains, if any, will normally be declared and paid at least annually in December. Distributions to shareholders are recorded on the ex-dividend date. Distributions are determined in accordance with federal income tax regulations, which may differ from net investment income and net realized capital gains for financial statement purposes (U.S. GAAP). Differences may be permanent or temporary. Permanent differences are reclassified among capital accounts in the financial statements to reflect their tax character. Permanent book and tax basis differences, if any, relating to shareholder distributions will result in reclassifications to paid-in capital. Temporary differences arise when certain items of income, expense and gain or loss are recognized in different periods for financial statement and tax purposes; these differences will reverse at some time in the future. Temporary differences are primarily due to wash sale loss deferrals, and capital loss carryforwards.
The tax character of distributions paid during the fiscal years ended October 31, 2019 and October 31, 2018 were as follows:
| | | | | | | | | | | | | | | | | | | | | | | | |
| | | Core Bond ESG | | | Emerging Wealth Equity | | | Emerging Markets Equity | |
| | | | | | |
| Distributions paid from: | | 2019 | | | 2018 | | | 2019 | | | 2018 | | | 2019 | | | 2018 | |
| | | | | | |
Ordinary income | | | $5,562,456 | | | | $6,619,394 | | | | $542,178 | | | | $407,540 | | | | $4,230,480 | | | | $1,740,581 | |
| | | | | | |
Short-term capital gains | | | — | | | | — | | | | — | | | | — | | | | 1,973,068 | | | | — | |
| | | | | | |
Long-term capital gains | | | — | | | | — | | | | 2,788,443 | | | | 3,251,699 | | | | — | | | | — | |
| | | | | | | | | | | | | | | | | | | | | | | | |
| | | | | | |
| | | $5,562,456 | | | | $6,619,394 | | | | $3,330,621 | | | | $3,659,239 | | | | $6,203,548 | | | | $1,740,581 | |
| | | | | | | | | | | | | | | | | | | | | | | | |
As of October 31, 2019, the components of distributable earnings (excluding unrealized appreciation/depreciation) on a tax basis consisted of:
| | | | | | | | | | | | |
| | | Core Bond ESG | | | Emerging Wealth Equity | | | Emerging Markets Equity | |
Capital loss carryforward | | | $4,267,813 | | | | — | | | | — | |
Undistributed ordinary income | | | 65,859 | | | | $1,049,240 | | | | $423,370 | |
Undistributed short-term capital gains | | | — | | | | — | | | | 2,240,531 | |
Undistributed long-term capital gains | | | — | | | | 2,572,538 | | | | — | |
42
|
Notes to Financial Statements(continued) |
At October 31, 2019, the cost of investments and the aggregate gross unrealized appreciation and depreciation for federal income tax purposes were as follows:
| | | | | | | | | | | | | | | | |
| Fund | | Cost | | | Appreciation | | | Depreciation | | | Net | |
Core Bond ESG | | | $207,575,966 | | | | $8,566,925 | | | | $(130,310 | ) | | | $8,436,615 | |
Emerging Wealth Equity | | | 105,882,106 | | | | 14,183,824 | | | | (3,996,144 | ) | | | 10,187,680 | |
Emerging Markets Equity | | | 48,576,978 | | | | 10,771,614 | | | | (2,776,794 | ) | | | 7,994,820 | |
e. FEDERAL TAXES
Each Fund currently qualifies as an investment company and intends to comply with the requirements under Subchapter M of the Internal Revenue Code of 1986, as amended, and to distribute substantially all of its taxable income and gains to its shareholders and to meet certain diversification and income requirements with respect to investment companies. Therefore, no provision for federal income or excise tax is included in the accompanying financial statements.
Additionally, based on each Fund’s understanding of the tax rules and rates related to income, gains and transactions for the foreign jurisdictions in which it invests, each Fund will provide for foreign taxes, and where appropriate, deferred foreign taxes.
Management has analyzed the Funds’ tax positions taken on federal income tax returns as of October 31, 2019, and for all open tax years (generally, the three prior taxable years), and has concluded that no provision for federal income tax is required in the Funds’ financial statements. Additionally, Management is not aware of any tax position for which it is reasonably possible that the total amounts of unrecognized tax benefits will change materially in the next twelve months.
f. CAPITAL LOSS CARRYOVERS AND DEFERRALS
As of October 31, 2019, the following Funds had capital loss carryovers for federal income tax purposes as shown in the following chart. These amounts may be used to offset future realized capital gains indefinitely, and retain their character as short-term and/or long-term.
| | | | | | | | | | | | |
| | | Capital Loss
Carryover Amounts | | | | |
| | | |
| Fund | | Short-Term | | | Long-Term | | | Total | |
Core Bond ESG | | | $1,927,306 | | | | $2,340,507 | | | | $4,267,813 | |
As of October 31, 2019, Emerging Wealth Equity and Emerging Markets Equity had no capital loss carryovers for federal income tax purposes. Should the Funds incur net capital losses for the fiscal year ended October 31, 2020, such amounts may be used to offset future realized capital gains indefinitely, and retain their character as either short-term and/or long-term.
For the fiscal year ended October 31, 2019, the following Funds utilized capital loss carryovers in the amount of:
| | | | | | | | |
| | | Capital Loss
Carryover Utilized | |
| | |
| Fund | | Short-Term | | | Long-Term | |
Core Bond ESG | | | $324,115 | | | | — | |
Emerging Markets Equity | | | $1,780,479 | | | | $6,788,169 | |
g. CAPITAL STOCK
The Trusts’ Declaration of Trust authorizes for each Fund the issuance of an unlimited number of shares of beneficial interest, without par value. Each Fund records sales and repurchases of its capital stock on the trade date. Prior to March 1, 2019, Emerging Wealth Equity and Emerging Markets Equity deducted a 2.00% redemption fee from the proceeds of any redemption of shares (including a redemption by exchange) if the redemption occurred within 60 days of the purchase of those shares. For the fiscal year ended October 31, 2019, Emerging Wealth Equity and Emerging Markets Equity had redemption fees amounting to $25 and $194, respectively. For the fiscal year ended October 31, 2018, Emerging Wealth Equity and Emerging Markets Equity had redemption fees amounting to $7,166 and $677, respectively. These amounts are netted against the cost of shares repurchased in the Statements of Changes in Net Assets.
For the fiscal years ended October 31, 2019 and October 31, 2018, the capital stock transactions by class for the Funds were as follows:
| | | | | | | | | | | | | | | | | | | | | | | | | | | | | | | | |
| | | Core Bond ESG | | Emerging Wealth Equity |
| | | October 31, 2019 | | October 31, 2018 | | October 31, 2019 | | October 31, 2018 |
| | | | | | | | |
| | | Shares | | Amount | | Shares | | Amount | | Shares | | Amount | | Shares | | Amount |
| | | | | | | | |
Class N: | | | | | | | | | | | | | | | | | | | | | | | | | | | | | | | | |
| | | | | | | | |
Proceeds from sale of shares | | | 87,070 | | | | $910,282 | | | | 52,526 | | | | $517,842 | | | | 69,471 | | | | $769,916 | | | | 277,256 | | | | $3,345,888 | |
| | | | | | | | |
Reinvestment of distributions | | | 1,518 | | | | 15,524 | | | | 663 | | | | 6,518 | | | | 9,251 | | | | 90,748 | | | | 94 | | | | 1,211 | |
| | | | | | | | |
Cost of shares repurchased | | | (21,364 | ) | | | (222,853 | ) | | | (15,654 | ) | | | (152,624 | ) | | | (97,339 | ) | | | (1,084,456 | ) | | | (91,372 | ) | | | (1,070,986 | ) |
| | | | | | | | | | | | | | | | | | | | | | | | | | | | | | | | |
Net increase (decrease) | | | 67,224 | | | | $702,953 | | | | 37,535 | | | | $371,736 | | | | (18,617 | ) | | | $(223,792 | ) | | | 185,978 | | | | $2,276,113 | |
| | | | | | | | | | | | | | | | | | | | | | | | | | | | | | | | |
43
|
Notes to Financial Statements(continued) |
| | | | | | | | | | | | | | | | | | | | | | | | | | | | | | | | |
| | | Core Bond ESG | | Emerging Wealth Equity |
| | | | |
| | | October 31, 2019 | | October 31, 2018 | | October 31, 2019 | | October 31, 2018 |
| | | | | | | | |
| | | Shares | | Amount | | Shares | | Amount | | Shares | | Amount | | Shares | | Amount |
| | | | | | | | |
Class I: | | | | | | | | | | | | | | | | | | | | | | | | | | | | | | | | |
| | | | | | | | |
Proceeds from sale of shares | | | 875,494 | | | | $8,860,974 | | | | 1,533,467 | | | | $15,179,962 | | | | 471,195 | | | | $5,535,916 | | | | 317,594 | | | | $3,954,434 | |
| | | | | | | | |
Reinvestment of distributions | | | 515,172 | | | | 5,217,134 | | | | 628,431 | | | | 6,215,123 | | | | 8,893 | | | | 87,775 | | | | 5,975 | | | | 76,842 | |
| | | | | | | | |
Cost of shares repurchased | | | (8,572,748 | ) | | | (85,400,513 | ) | | | (6,897,752 | ) | | | (68,301,545 | ) | | | (197,196 | ) | | | (2,166,432 | ) | | | (207,383 | ) | | | (2,500,586 | ) |
| | | | | | | | | | | | | | | | | | | | | | | | | | | | | | | | |
Net increase (decrease) | | | (7,182,082 | ) | | | $(71,322,405) | | | | (4,735,854 | ) | | | $(46,906,460 | ) | | | 282,892 | | | | $3,457,259 | | | | 116,186 | | | | $1,530,690 | |
| | | | | | | | | | | | | | | | | | | | | | | | | | | | | | | | |
| | | | | | | | |
Class Z: | | | | | | | | | | | | | | | | | | | | | | | | | | | | | | | | |
| | | | | | | | |
Proceeds from sale of shares | | | 27,467 | | | | $272,702 | | | | 15,702 | | | | $155,741 | | | | 3,990,467 | | | | $44,631,920 | | | | 1,738,318 | | | | $21,909,809 | |
| | | | | | | | |
Reinvestment of distributions | | | 7,734 | | | | 78,419 | | | | 6,940 | | | | 68,566 | | | | 32,301 | | | | 317,526 | | | | 31,476 | | | | 403,515 | |
| | | | | | | | |
Cost of shares repurchased | | | (248,245 | ) | | | (2,435,700 | ) | | | (56,169 | ) | | | (554,918 | ) | | | (1,063,505 | ) | | | (11,650,219 | ) | | | (554,875 | ) | | | (6,961,554 | ) |
| | | | | | | | | | | | | | | | | | | | | | | | | | | | | | | | |
Net increase (decrease) | | | (213,044 | ) | | | $(2,084,579) | | | | (33,527 | ) | | | $(330,611 | ) | | | 2,959,263 | | | | $33,299,227 | | | | 1,214,919 | | | | $15,351,770 | |
| | | | | | | | | | | | | | | | | | | | | | | | | | | | | | | | |
| | |
| | | Emerging Markets Equity | | |
| | | | |
| | | October 31, 2019 | | October 31, 2018 | | | | |
| | | | | | | | |
| | | Shares | | Amount | | Shares | | Amount | | | | | | | | |
| | | | | | | | |
Class N: | | | | | | | | | | | | | | | | | | | | | | | | | | | | | | | | |
| | | | | | | | |
Proceeds from sale of shares | | | 26,442 | | | | $249,645 | | | | 32,216 | | | | $327,034 | | | | | | | | | | | | | | | | | |
| | | | | | | | |
Reinvestment of distributions | | | 1,362 | | | | 12,186 | | | | 238 | | | | 2,438 | | | | | | | | | | | | | | | | | |
| | | | | | | | |
Cost of shares repurchased | | | (6,762 | ) | | | (64,732 | ) | | | (33,515 | ) | | | (330,892 | ) | | | | | | | | | | | | | | | | |
| | | | | | | | | | | | | | | | | | | | | | | | | | | | | | | | |
Net increase (decrease) | | | 21,042 | | | | $197,099 | | | | (1,061 | ) | | | $(1,420 | ) | | | | | | | | | | | | | | | | |
| | | | | | | | | | | | | | | | | | | | | | | | | | | | | | | | |
| | | | | | | | |
Class I: | | | | | | | | | | | | | | | | | | | | | | | | | | | | | | | | |
| | | | | | | | |
Proceeds from sale of shares | | | 1,450,638 | | | | $13,047,613 | | | | 1,194,244 | | | | $11,277,804 | | | | | | | | | | | | | | | | | |
| | | | | | | | |
Reinvestment of distributions | | | 32,500 | | | | 286,519 | | | | 2,564 | | | | 26,179 | | | | | | | | | | | | | | | | | |
| | | | | | | | |
Cost of shares repurchased | | | (243,911 | ) | | | (2,243,793 | ) | | | (111,974 | ) | | | (1,158,853 | ) | | | | | | | | | | | | | | | | |
| | | | | | | | | | | | | | | | | | | | | | | | | | | | | | | | |
Net increase | | | 1,239,227 | | | | $11,090,339 | | | | 1,084,834 | | | | $10,145,130 | | | | | | | | | | | | | | | | | |
| | | | | | | | | | | | | | | | | | | | | | | | | | | | | | | | |
| | | | | | | | |
Class Z: | | | | | | | | | | | | | | | | | | | | | | | | | | | | | | | | |
| | | | | | | | |
Proceeds from sale of shares | | | 1,633,015 | | | | $15,883,163 | | | | 3,024,811 | | | | $30,641,999 | | | | | | | | | | | | | | | | | |
| | | | | | | | |
Reinvestment of distributions | | | 577,222 | | | | 5,074,236 | | | | 154,904 | | | | 1,572,271 | | | | | | | | | | | | | | | | | |
| | | | | | | | |
Cost of shares repurchased | | | (14,461,736 | ) | | | (134,796,003 | ) | | | (568,860 | ) | | | (5,984,686 | ) | | | | | | | | | | | | | | | | |
| | | | | | | | | | | | | | | | | | | | | | | | | | | | | | | | |
Net increase (decrease) | | | (12,251,499 | ) | | | $(113,838,604) | | | | 2,610,855 | | | | $26,229,584 | | | | | | | | | | | | | | | | | |
| | | | | | | | | | | | | | | | | | | | | | | | | | | | | | | | |
h. REPURCHASE AGREEMENTS AND JOINT REPURCHASE AGREEMENTS
The Funds may enter into third-party repurchase agreements for temporary cash management purposes and third-party or bilateral joint repurchase agreements for reinvestment of cash collateral on securities lending transactions under the securities lending program offered by The Bank of New York Mellon (“BNYM”) (the “Program”) (collectively, “Repurchase Agreements”). The value of the underlying collateral, including accrued interest, must equal or exceed the value of the Repurchase Agreements during the term of the agreement. For joint repurchase agreements, the Funds participate on a pro rata basis with other clients of BNYM in its share of the underlying collateral under such joint repurchase agreements and in its share of proceeds from any repurchase or other disposition of the
underlying collateral. The underlying collateral for all Repurchase Agreements is held in safekeeping by the Funds’ custodian or at the Federal Reserve Bank. If the seller defaults and the value of the collateral declines, or if bankruptcy proceedings commence with respect to the seller of the security, realization of the collateral by the Funds may be delayed or limited. Pursuant to the Program, the Funds are indemnified for such losses by BNYM on joint repurchase agreements.
At October 31, 2019, the market value of Repurchase Agreements outstanding for Emerging Wealth Equity and Emerging Markets Equity were $3,211,717 and $661,878, respectively.
44
|
Notes to Financial Statements(continued) |
i. FOREIGN CURRENCY TRANSLATION
The books and records of the Funds are maintained in U.S. dollars. The value of investments, assets and liabilities denominated in currencies other than U.S. dollars are translated into U.S. dollars based upon current foreign exchange rates. Purchases and sales of foreign investments, income and expenses are converted into U.S. dollars based on currency exchange rates prevailing on the respective dates of such transactions. Net realized and unrealized gain (loss) on foreign currency transactions represent: (1) foreign exchange gains and losses from the sale and holdings of foreign currencies; (2) gains and losses between trade date and settlement date on investment securities transactions and foreign currency exchange contracts; and (3) gains and losses from the difference between amounts of interest and dividends recorded and the amounts actually received.
The Funds do not isolate the net realized and unrealized gain or loss resulting from changes in exchange rates from the fluctuations in market prices of securities held. Such fluctuations are included with the net realized and unrealized gain or loss on investments.
2. AGREEMENTS AND TRANSACTIONS WITH AFFILIATES
For each of the Funds, the Trusts have entered into an investment advisory agreement under which the Investment Manager, a subsidiary and the U.S. retail distribution arm of Affiliated Managers Group, Inc. (“AMG”), serves as investment manager to the Funds and is responsible for the Funds’ overall administration and operations. The Investment Manager selects one or more subadvisers for the Funds (subject to Board approval) and monitors each subadviser’s investment performance, security holdings and investment strategies. Each Fund’s investment portfolio is managed by GW&K Investment Management, LLC, (“GW&K”), who serves pursuant to a subadvisory agreement with the Investment Manager. AMG indirectly owns a majority interest in GW&K.
Investment management fees are paid directly by the Funds to the Investment Manager based on average daily net assets. For the fiscal year ended October 31, 2019, the Funds’ investment management fees were paid at the following annual rate of each Fund’s respective average daily net assets:
| | | | |
Core Bond ESG | | | 0.30 | % |
Emerging Wealth Equity | | | 0.55 | % |
Emerging Markets Equity | | | 0.55 | % |
The Investment Manager has contractually agreed, through at least March 1, 2020, to waive management fees and/or pay or reimburse fund expenses in order to limit total annual Fund operating expenses after fee waiver and expense reimbursements (exclusive of taxes, interest (including interest incurred in connection with bank and custody overdrafts, and in connection with securities sold short), shareholder servicing fees, distribution and service (12b-1) fees, brokerage commissions and other transaction costs, dividends payable with respect to securities sold short, acquired fund fees and expenses and extraordinary expenses) of Core Bond ESG, Emerging Wealth Equity and Emerging Markets Equity to 0.48%, 1.05% and 1.05%, respectively, of each Fund’s average daily net assets (this annual rate or such other annual rate that may be in effect from time to time, the “Expense Cap”), subject to later reimbursement by the Funds in certain circumstances.
The contractual expense limitation may only be terminated in the event the Investment Manager or a successor ceases to be the investment manager of the Fund or a successor fund, by mutual agreement between the Investment Manager and the Board, or in the event of the Fund’s liquidation unless the Fund is reorganized or is a party to a merger in which the surviving entity is successor to the accounting and performance information of the Fund.
In general, for a period of up to 36 months, the Investment Manager may recover from each Fund fees waived and expenses paid pursuant to this contractual agreement, provided that such repayment would not cause a Fund’s total annual operating expenses after fee waiver and expense reimbursements (exclusive of the items noted in the parenthetical above) to exceed the contractual expense limitation amount.
At October 31, 2019, the Funds’ expiration of reimbursements subject to recoupment is as follows:
| | | | |
Expiration Period | | Core Bond ESG | |
Less than 1 year | | | $197,822 | |
1-2 years | | | 146,013 | |
2-3 years | | | 156,648 | |
| | | | |
Total | | | $500,483 | |
| | | | |
The Trusts, on behalf of the Funds, have entered into an amended and restated Administration Agreement under which the Investment Manager serves as the Funds’ administrator (the “Administrator”) and is responsible for all non-portfolio management aspects of managing the Funds’ operations, including administration and shareholder services to each Fund. Each Fund pays a fee to the Administrator at the rate of 0.15% per annum of the Fund’s average daily net assets for this service.
The Funds are distributed by AMG Distributors, Inc. (the “Distributor”), a wholly-owned subsidiary of the Investment Manager. The Distributor serves as the distributor and underwriter for each Fund and is a registered broker-dealer and member of the Financial Industry Regulatory Authority, Inc. (“FINRA”). Shares of each Fund will be continuously offered and will be sold directly to prospective purchasers and through brokers, dealers or other financial intermediaries who have executed selling agreements with the Distributor. Generally the Distributor bears all or a portion of the expenses of providing services pursuant to the distribution agreement, including the payment of the expenses relating to the distribution of prospectuses for sales purposes and any advertising or sales literature.
The Trusts have adopted a distribution and service plan (the “Plan”) with respect to the Class N shares, in accordance with the requirements of Rule 12b-1 under the 1940 Act and the requirements of the applicable rules of FINRA regarding asset-based sales charges. Pursuant to the Plan, each Fund may make payments to the Distributor for its expenditures in financing any activity primarily intended to result in the sale of each Fund’s Class N shares and for maintenance and personal service provided to existing shareholders of that class. The Plan authorized payments to the Distributor up to 0.25% annually of each Fund’s average daily net assets attributable to the Class N shares.
For Class N shares and Class I shares of each Fund, the Board has approved reimbursement payments to the Investment Manager for shareholder servicing expenses (“shareholder servicing fees”) incurred. Shareholder servicing fees
45
|
Notes to Financial Statements(continued) |
include payments to financial intermediaries, such as broker-dealers (including fund supermarket platforms), banks, and trust companies who provide shareholder recordkeeping, account servicing and other services. The Class N and Class I shares may reimburse the Investment Manager for the actual amount incurred up to a maximum annual rate of each Class’s average daily net assets as shown in the table below.
The impact on the annualized expense ratios for the fiscal year ended October 31, 2019, were as follows:
| | | | | | | | |
| Fund | | Maximum Annual
Amount
Approved | | | Actual
Amount
Incurred | |
Core Bond ESG | | | | | | | | |
Class N | | | 0.15% | | | | 0.15% | |
Class I | | | 0.10% | | | | 0.07% | |
Emerging Wealth Equity | | | | | | | | |
Class N | | | 0.15% | | | | 0.15% | |
Class I | | | 0.15% | | | | 0.11% | |
Emerging Markets Equity | | | | | | | | |
Class N | | | 0.15% | | | | 0.15% | |
Class I | | | 0.15% | | | | 0.07% | |
The Board provides supervision of the affairs of the Trusts and other trusts within the AMG Funds family. The Trustees of the Trusts who are not affiliated with the Investment Manager receive an annual retainer and per meeting fees for regular, special and telephonic meetings, and they are reimbursed for out-of-pocket expenses incurred while carrying out their duties as Board members. The Chairman of the Board and the Audit Committee Chair receive additional annual retainers. Certain Trustees and Officers of the Funds are Officers and/or Directors of the Investment Manager, AMG and/or the Distributor.
The Securities and Exchange Commission (the “SEC”) granted an exemptive order that permits the Funds to lend and borrow money for certain temporary purposes directly to and from other eligible funds in the AMG Funds family. Participation in this interfund lending program is voluntary for both the borrowing and lending funds, and an interfund loan is only made if it benefits each participating fund. The Administrator manages the program according to procedures approved by the Board, and the Board monitors the operation of the program. An interfund loan must comply with certain conditions set out in the exemptive order, which are designed to assure fairness and protect all participating funds. For the fiscal year ended October 31, 2019, Core Bond ESG borrowed a maximum of $14,458,953 for six days paying interest of $4,585, Emerging Wealth Equity borrowed a maximum of $1,121,372 for four days paying interest of $422, and Emerging Markets Equity borrowed a maximum of $14,130,442 for four days paying interest of $4,642. The interest expense amount is included in the Statement of Operations as miscellaneous expense. Emerging Wealth Equity lent a maximum of $350,968 for five days earning interest of $138. The interest income amount is included in the Statement of Operations as interest income. At October 31, 2019, the Funds had no interfund loans outstanding.
3. PURCHASES AND SALES OF SECURITIES
Purchases and sales of securities (excluding short-term securities and U.S. Government Obligations) for the fiscal year ended October 31, 2019, were as follows:
| | | | | | | | | | |
| | | Long Term Securities |
| | |
| Fund | | Purchases | | Sales |
Core Bond ESG | | | | $67,557,014 | | | | | $104,981,230 | |
Emerging Wealth Equity | | | | 66,599,115 | | | | | 33,922,040 | |
Emerging Markets Equity | | | | 183,992,619 | | | | | 286,240,561 | |
Core Bond ESG purchases and sales of U.S. Government obligations during the fiscal year ended October 31, 2019 were $39,422,961 and $73,314,405, respectively.
4. PORTFOLIO SECURITIES LOANED
The Funds participate in the Program providing for the lending of securities to qualified borrowers. Securities lending income includes earnings of such temporary cash investments, plus or minus any rebate to a borrower. These earnings (after any rebate) are then divided between BNYM, as a fee for its services under the Program, and the Funds, according to agreed-upon rates. Collateral on all securities loaned is accepted in cash or U.S. Government and Agency Obligations. Collateral is maintained at a minimum level of 102% (105% in the case of certain foreign securities) of the market value, plus interest, if applicable, of investments on loan. It is the Funds’ policy to obtain additional collateral from or return excess collateral to the borrower by the end of the next business day, following the valuation date of the securities loaned. Therefore, the value of the collateral held may be temporarily less than the value of the securities on loan. Lending securities entails a risk of loss to the Funds if and to the extent that the market value of the securities loaned were to increase and the borrower did not increase the collateral accordingly, and the borrower fails to return the securities. Under the terms of the Program, the Funds are indemnified for such losses by BNYM. Cash collateral is held in separate omnibus accounts managed by BNYM, who is authorized to exclusively enter into joint repurchase agreements for that cash collateral. Securities collateral is held in separate omnibus accounts managed by BNYM that cannot be sold or pledged. BNYM bears the risk of any deficiency in the amount of the cash collateral available for return to the borrower due to any loss on the collateral invested.
The value of securities loaned on positions held, and cash and securities collateral received at October 31, 2019, were as follows:
| | | | | | | | | | | | | | | | | | | | |
| Fund | | Securities
Loaned | | Cash
Collateral
Received | | Securities
Collateral
Received | | Total
Collateral
Received |
Emerging Wealth Equity | | | | $7,641,830 | | | | | $3,211,717 | | | | | $4,670,410 | | | | | $7,882,127 | |
Emerging Markets Equity | | | | 1,682,508 | | | | | 661,878 | | | | | 1,079,800 | | | | | 1,741,678 | |
46
|
Notes to Financial Statements(continued) |
The following table summarizes the securities received as collateral for securities lending at October 31, 2019:
| | | | | | | | | |
| Fund | | Collateral Type | | Coupon Range | | Maturity
Date Range |
Emerging Wealth Equity | | U.S. Treasury Obligations | | 0.000%-8.750% | | | | 12/31/19-02/15/49 | |
Emerging Markets Equity | | U.S. Treasury Obligations | | 0.010%-3.625% | | | | 04/15/20-05/15/47 | |
5. FOREIGN SECURITIES
Certain Funds invest in securities of foreign entities and in instruments denominated in foreign currencies which involve risks not typically associated with investments in domestic securities. Non-domestic securities carry special risks, such as exposure to currency fluctuations, less developed or less efficient trading markets, political instability, a lack of company information, differing auditing and legal standards, and, potentially, less liquidity. A Fund’s investments in emerging market countries are exposed to additional risks. A Fund’s
performance will be influenced by political, social and economic factors affecting companies in emerging market countries. Emerging market countries generally have economic structures that are less diverse and mature, and political systems that are less stable, than those of developed countries. Realized gains in certain countries may be subject to foreign taxes at the Fund level and the Fund would pay such foreign taxes at the appropriate rate for each jurisdiction.
6. COMMITMENTS AND CONTINGENCIES
Under the Trusts’ organizational documents, its trustees and officers are indemnified against certain liabilities arising out of the performance of their duties to the Trusts. In addition, in the normal course of business, the Funds may enter into contracts and agreements that contain a variety of representations and warranties, which provide general indemnifications. The maximum exposure to the Funds under these arrangements is unknown, as this would involve future claims that may be made against a Fund that have not yet occurred. However, based on experience, the Funds had no prior claims or losses and expect the risks of loss to be remote.
7. MASTER NETTING AGREEMENTS
The Funds may enter into master netting agreements with their counterparties for the securities lending program and Repurchase Agreements, which provide the right, in the event of default (including bankruptcy or insolvency) for the non-defaulting party to liquidate the collateral and calculate net exposure to the defaulting party or request additional collateral. For financial reporting purposes, the Funds do not offset financial assets and financial liabilities that are subject to master netting agreements in the Statement of Assets and Liabilities. For securities lending transactions, see Note 4.
The following table is a summary of the Funds’ open Repurchase Agreements that are subject to a master netting agreement as of October 31, 2019:
| | | | | | | | | | | | | | | | | | | | |
| | | | | Gross Amount Not Offset in the | | | | |
| | | | | Statement of Assets and Liabilities | | | | |
| Fund | | Gross Amounts of
Assets Presented in
the Statement of
Assets and Liabilities | | Offset
Amount | | Net Asset Balance | | Collateral Received | | Net Amount |
Emerging Wealth Equity | | | | | | | | | | | | | | | | | | | | |
Cantor Fitzgerald Securities, Inc. | | | $1,000,000 | | | | — | | | | $1,000,000 | | | | $1,000,000 | | | | — | |
Citigroup Global Markets, Inc. | | | 1,000,000 | | | | — | | | | 1,000,000 | | | | 1,000,000 | | | | — | |
Credit Suisse AG | | | 211,717 | | | | — | | | | 211,717 | | | | 211,717 | | | | — | |
Guggenheim Securities LLC | | | 1,000,000 | | | | — | | | | 1,000,000 | | | | 1,000,000 | | | | — | |
| | | | | | | | | | | | | | | | | | | | |
| | | | | |
Total | | | $3,211,717 | | | | — | | | | $3,211,717 | | | | $3,211,717 | | | | — | |
| | | | | | | | | | | | | | | | | | | | |
Emerging Markets Equity | | | | | | | | | | | | | | | | | | | | |
Citigroup Global Markets, Inc. | | | $661,878 | | | | — | | | | $661,878 | | | | $661,878 | | | | — | |
8. SUBSEQUENT EVENTS
The Funds have determined that no material events or transactions occurred through the issuance date of the Funds’ financial statements which require an additional disclosure in or adjustment of the Funds’ financial statements.
47
|
Report of Independent Registered Public Accounting Firm |
TO THE BOARD OF TRUSTEES OF AMG FUNDS AND AMG FUNDS I AND SHAREHOLDERS OF AMG GW&K CORE BOND ESG FUND (FORMERLY AMG GW&K CORE BOND FUND), AMG GW&K TRILOGY EMERGING WEALTH EQUITY FUND (FORMERLY AMG TRILOGY EMERGING WEALTH EQUITY FUND) AND AMG GW&K TRILOGY EMERGING MARKETS EQUITY FUND (FORMERLY AMG TRILOGY EMERGING MARKETS EQUITY FUND).
Opinions on the Financial Statements
We have audited the accompanying statements of assets and liabilities, including the schedules of portfolio investments, of AMG GW&K Core Bond ESG Fund (formerly AMG GW&K Core Bond Fund) (one of the funds constituting AMG Funds I), AMG GW&K Trilogy Emerging Wealth Equity Fund (formerly AMG Trilogy Emerging Wealth Equity Fund) and AMG GW&K Trilogy Emerging Markets Equity Fund (formerly AMG Trilogy Emerging Markets Equity Fund) (two of the funds constituting AMG Funds) (hereafter collectively referred to as the “Funds”) as of October 31, 2019, the related statements of operations for the year ended October 31, 2019, the statements of changes in net assets for each of the two years in the period ended October 31, 2019, including the related notes, and the financial highlights for each of the periods indicated therein (collectively referred to as the “financial statements”). In our opinion, the financial statements present fairly, in all material respects, the financial position of each of the Funds as of October 31, 2019, the results of each of their operations for the year then ended, the changes in each of their net assets for each of the two years in the period ended October 31, 2019 and each of the financial highlights for each of the periods indicated therein in conformity with accounting principles generally accepted in the United States of America.
Basis for Opinions
These financial statements are the responsibility of the Funds’ management. Our responsibility is to express an opinion on the Funds’ financial statements based on our audits. We are a public accounting firm registered with the Public Company Accounting Oversight Board (United States) (“PCAOB”) and are required to be independent with respect to the Funds in accordance with the U.S. federal securities laws and the applicable rules and regulations of the Securities and Exchange Commission and the PCAOB.
We conducted our audits of these financial statements in accordance with the standards of the PCAOB. Those standards require that we plan and perform the audit to obtain reasonable assurance about whether the financial statements are free of material misstatement, whether due to error or fraud.
Our audits included performing procedures to assess the risks of material misstatement of the financial statements, whether due to error or fraud, and performing procedures that respond to those risks. Such procedures included examining, on a test basis, evidence regarding the amounts and disclosures in the financial statements. Our audits also included evaluating the accounting principles used and significant estimates made by management, as well as evaluating the overall presentation of the financial statements. Our procedures included confirmation of securities owned as of October 31, 2019 by correspondence with the custodian, transfer agent and brokers; when replies were not received from brokers, we performed other auditing procedures. We believe that our audits provide a reasonable basis for our opinions.
PricewaterhouseCoopers LLP
Boston, Massachusetts
December 20, 2019
We have served as the auditor of one or more investment companies in the AMG Funds Family since 1993.
48
TAX INFORMATION
The AMG GW&K Core Bond ESG Fund, AMG GW&K Trilogy Emerging Wealth Equity Fund and AMG GW&K Trilogy Emerging Markets Equity Fund each hereby designate the maximum amount allowable of their net taxable income as qualified dividends as provided in the Jobs and Growth Tax Relief Reconciliation Act of 2003. The 2018/2019 Form 1099-DIV you receive for each Fund will show the tax status of all distributions paid to you during the year.
In accordance with federal tax law, the following Funds elect to provide foreign taxes paid and the income sourced from foreign countries. Accordingly, each Fund hereby makes the following designations regarding its taxable period ended October 31, 2019:
AMG GW&K Trilogy Emerging Wealth Equity Fund
 The total amount of taxes paid and income sourced from foreign countries was $104,318 and $1,828,848, respectively.
AMG GW&K Trilogy Emerging Markets Equity Fund
The total amount of taxes paid and income sourced from foreign countries was $382,889 and $4,673,974, respectively.
Pursuant to section 852 of the Internal Revenue Code, AMG GW&K Core Bond ESG Fund, AMG GW&K Trilogy Emerging Wealth Equity Fund and AMG GW&K Trilogy Emerging Markets Equity Fund, each hereby designates as a capital gain distribution with respect to the taxable period ended October 31, 2019, $0, $2,788,443 and $0, respectively, or, if subsequently determined to be different, the net capital gains of such period.
PROXY VOTE
At a special meeting of shareholders on April 16, 2019, the shareholders of AMG GW&K Trilogy Emerging Wealth Equity Fund and AMG GW&K Trilogy Emerging Markets Equity Fund voted on the following proposal:
| | | | | | | | | | | | | | | |
| | | | | Number of Eligible Voters | | |
| Proposal 1 | | For | | Against | | Abstain |
| | | |
Approval of a new subadvisory agreement between the Investment Manager and GW&K Investment, LLC (“GW&K”) with repects to: | | | | | | | | | | | | | | | |
AMG GW&K Trilogy Emerging Wealth Equity | | | | 6,648,211 | | | | | — | | | | | 4,582 | |
AMG GW&K Trilogy Emerging Markets Equity | | | | 16,824,505 | | | | | 1,135 | | | | | — | |
49
|
AMG Funds Trustees and Officers |
| | | | | | | | |
The Trustees and Officers of the Trust, their business addresses, principal occupations for the past five years and ages are listed below. The Trustees provide broad supervision over the affairs of the Trust and the Funds. The Trustees are experienced executives who meet periodically throughout the year to oversee the Funds’ activities, review contractual arrangements with companies that provide services to the Funds, and | | | | review the Funds’ performance. Unless otherwise noted, the address of each Trustee or Officer is the address of the Trust: 600 Steamboat Road, Suite 300, Greenwich, Connecticut 06830. There is no stated term of office for Trustees. Trustees serve until their resignation, retirement or removal in | | | | accordance with the Trust’s organizational documents and policies adopted by the Board from time to time. The Chairman of the Trustees, President, Treasurer and Secretary of the Trust are elected by the Trustees annually. Other officers hold office at the pleasure of the Trustees. |
Independent Trustees
The following Trustees are not “interested persons” of the Trust within the meaning of the 1940 Act:
| | |
Number of Funds Overseen in Fund Complex | | Name, Age, Principal Occupation(s) During Past 5 Years and Other Directorships Held by
Trustee |
| | |
• Trustee since 2012 • Oversees 49 Funds in Fund Complex | | Bruce B. Bingham, 71 Partner, Hamilton Partners (real estate development firm) (1987-Present); Director of The Yacktman Funds (2000-2012). |
| | |
• Trustee since 1999 - AMG Funds • Trustee since 2000 - AMG Funds I • Oversees 49 Funds in Fund Complex | | Edward J. Kaier, 74 Attorney at Law and Partner, Teeters Harvey Marrone & Kaier LLP (2007-Present); Attorney at Law and Partner, Hepburn Willcox Hamilton & Putnam, LLP (1977-2007); Trustee of Third Avenue Trust (2002-2019); Trustee of Third Avenue Variable Trust (2002-2019). |
| | |
• Trustee since 2013 • Oversees 52 Funds in Fund Complex | | Kurt A. Keilhacker, 56 Managing Partner, TechFund Capital (1997-Present); Managing Partner, TechFund Europe (2000-Present); Board Member, 6wind SA, (2002-Present); Managing Partner, Elementum Ventures (2013-Present); Director, MetricStory, Inc. (2017-Present); Trustee, Wheaton College (2018-Present); Trustee, Gordon College (2001-2016). |
| | |
• Trustee since 2000 • Oversees 49 Funds in Fund Complex | | Steven J. Paggioli, 69 Independent Consultant (2002-Present); Trustee, Professionally Managed Portfolios (28 portfolios); Advisory Board Member, Sustainable Growth Advisors, LP; Independent Director, Muzinich BDC, Inc. (business development company) (2019-Present); Independent Director, Chase Investment Counsel (2008–2019); Executive Vice President, Secretary and Director, Investment Company Administration, LLC (1990-2001). |
| | |
• Trustee since 2013 • Oversees 49 Funds in Fund Complex | | Richard F. Powers III, 73 Adjunct Professor, U.S. Naval War College (2016-Present); Adjunct Professor, Boston College (2010-2013); President and CEO of Van Kampen Investments Inc. (1998-2003). |
| | |
• Independent Chairman • Trustee since 2000 • Oversees 52 Funds in Fund Complex | | Eric Rakowski, 61 Professor of Law, University of California at Berkeley School of Law - Boalt Hall (1990-Present); Director of Harding, Loevner Funds, Inc. (9 portfolios); Trustee of Third Avenue Trust (2002-2019); Trustee of Third Avenue Variable Trust (2002-2019). |
| | |
• Trustee since 2013 • Oversees 52 Funds in Fund Complex | | Victoria L. Sassine, 54 Adjunct Professor, Babson College (2007–Present); Director, Board of Directors, PRG Group (2017-Present); CEO, Founder, Scale Smarter Partners, LLC (2018-Present); Chairperson, Board of Directors, Business Management Associates (2018-Present). |
| | |
• Trustee since 2004 - AMG Funds • Trustee since 2000 - AMG Funds II • Oversees 49 Funds in Fund Complex | | Thomas R. Schneeweis, 72 Professor Emeritus, University of Massachusetts (2013-Present); President, TRS Associates (1982-Present); Board Member, Chartered Alternative Investment Association (“CAIA”) (2002-Present); Director, Institute for Global Asset and Risk Management (Education) (2010-Present); Co-Owner, Quantitative Investment Technologies (2014-Present); Director of Research, Yes Wealth Management (2018-Present); Partner, S Capital Wealth Advisors (2015-2018); Partner, S Capital Management, LLC (2007-2015); President, Alternative Investment Analytics, LLC, (formerly Schneeweis Partners, LLC) (2001-2013). |
50
|
AMG Funds Trustees and Officers(continued) |
Interested Trustees
Each Trustee in the following table is an “interested person” of the Trust within the meaning of the 1940 Act. Ms. Carsman is an interested person of the Trust within the meaning of the 1940 Act by virtue of her position with, and interest in securities of, AMG.
| | |
Number of Funds Overseen in Fund Complex | | Name, Age, Principal Occupation(s) During Past 5 Years and Other Directorships Held by
Trustee |
| | |
• Trustee since 2011 • Oversees 52 Funds in Fund Complex | | Christine C. Carsman, 67 Senior Policy Advisor, Affiliated Managers Group, Inc. (2019-Present); Director of Harding, Loevner Funds, Inc. (9 portfolios); Executive Vice President, Deputy General Counsel and Chief Regulatory Counsel, Affiliated Managers Group, Inc. (2017-2018); Director (2010-2018) and Chair of the Board of Directors (2015-2018), AMG Funds plc; Senior Vice President and Deputy General Counsel, Affiliated Managers Group, Inc. (2011-2016); Senior Vice President and Chief Regulatory Counsel, Affiliated Managers Group, Inc. (2007-2011); Vice President and Chief Regulatory Counsel, Affiliated Managers Group, Inc. (2004-2007); Secretary and Chief Legal Officer, AMG Funds, AMG Funds I, AMG Funds II and AMG Funds III (2004-2011); Senior Counsel, Vice President and Director of Operational Risk Management and Compliance, Wellington Management Company, LLP (1995-2004). |
| | |
| Officers | | |
Position(s) Held with Fund and Length of Time Served | | Name, Age, Principal Occupation(s) During Past 5 Years |
| | |
• President since 2018 • Principal Executive Officer since 2018 • Chief Executive Officer since 2018 • Chief Operating Officer since 2007 | | Keitha L. Kinne, 61 Chief Operating Officer, AMG Funds LLC (2007-Present); Chief Investment Officer, AMG Funds LLC (2008-Present); President and Principal, AMG Distributors, Inc. (2018-Present); Chief Operating Officer, AMG Distributors, Inc. (2007-Present); President, Chief Executive Officer and Principal Executive Officer, AMG Funds, AMG Funds I, AMG Funds II, AMG Funds III and AMG Funds IV (2018-Present); Chief Operating Officer, AMG Funds, AMG Funds I, AMG Funds II, and AMG Funds III (2007-Present); Chief Operating Officer, AMG Funds IV (2016-Present); Chief Operating Officer and Chief Investment Officer, Aston Asset Management, LLC (2016); President and Principal Executive Officer, AMG Funds, AMG Funds I, AMG Funds II and AMG Funds III (2012-2014); Managing Partner, AMG Funds LLC (2007-2014); President and Principal, AMG Distributors, Inc. (2012-2014); Managing Director, Legg Mason & Co., LLC (2006-2007); Managing Director, Citigroup Asset Management (2004-2006). |
| | |
• Secretary since 2015 • Chief Legal Officer since 2015 | | Mark J. Duggan, 54 Senior Vice President and Senior Counsel, AMG Funds LLC (2015-Present); Secretary and Chief Legal Officer, AMG Funds, AMG Funds I, AMG Funds II, AMG Funds III and AMG Funds IV (2015-Present); Attorney, K&L Gates, LLP (2009-2015). |
| | |
• Chief Financial Officer since 2017 • Treasurer since 2017 • Principal Financial Officer since 2017 • Principal Accounting Officer since 2017 | | Thomas G. Disbrow, 53 Vice President, Mutual Fund Treasurer & CFO, AMG Funds, AMG Funds LLC (2017-Present); Chief Financial Officer, Principal Financial Officer, Treasurer and Principal Accounting Officer, AMG Funds, AMG Funds I, AMG Funds II, AMG Funds III and AMG Funds IV (2017-Present); Managing Director - Global Head of Traditional Funds Product Control, UBS Asset Management (Americas), Inc. (2015-2017); Managing Director - Head of North American Funds Treasury, UBS Asset Management (Americas), Inc. (2011-2015). |
| | |
• Deputy Treasurer since 2017 | | John A. Starace, 49 Director, Mutual Fund Accounting, AMG Funds LLC (2017-Present); Vice President, Deputy Treasurer of Mutual Funds Services, AMG Funds LLC (2014-2017); Deputy Treasurer, AMG Funds, AMG Funds I, AMG Funds II, AMG Funds III and AMG Funds IV (2017-Present); Vice President, Citi Hedge Fund Services (2010-2014); Audit Senior Manager (2005-2010) and Audit Manager (2001-2005), Deloitte & Touche LLP. |
| | |
• Chief Compliance Officer since 2019 | | Patrick J. Spellman, 45 Vice President, Chief Compliance Officer, AMG Funds LLC (2017-Present); Chief Compliance Officer and Sarbanes-Oxley Code of Ethics Compliance Officer, AMG Funds, AMG Funds I, AMG Funds II, AMG Funds III and AMG Funds IV (2019-Present); Chief Compliance Officer, AMG Distributors, Inc., (2010-Present) Senior Vice President, Chief Compliance Officer, AMG Funds LLC (2011-2017); Anti-Money Laundering Compliance Officer, AMG Funds, AMG Funds I, AMG Funds II, and AMG Funds III (2014-2019); Anti-Money Laundering Officer, AMG Funds IV, (2016-2019); Compliance Manager, Legal and Compliance, Affiliated Managers Group, Inc. (2005-2011). |
| | |
• Assistant Secretary since 2016 | | Maureen A. Meredith, 34 Vice President, Counsel, AMG Funds LLC (2019-Present); Director, Counsel, AMG Funds LLC (2017-2018); Vice President, Counsel, AMG Funds LLC (2015-2017); Assistant Secretary, AMG Funds, AMG Funds I, AMG Funds II, AMG Funds III and AMG Funds IV (2016-Present); Associate, Ropes & Gray LLP (2011-2015); Law Fellow, Massachusetts Appleseed Center for Law and Justice (2010-2011). |
| | |
• Anti-Money Laundering Compliance Officer since 2019 | | Hector D. Roman, 41 Manager, Legal and Compliance, AMG Funds LLC (2017-Present); Director of Compliance, Morgan Stanley Investment Management (2015-2017); Senior Advisory, PricewaterhouseCoopers LLP (2014-2015); Risk Manager, Barclays Investment Bank (2008-2014); Anti-Money Laundering Compliance Officer, AMG Funds, AMG Funds I, AMG Funds II, AMG Funds III and AMG Funds IV (2019-Present). |
51
|
Annual Renewal of Investment Management and Subadvisory Agreements |
| | | | | | | | |
AMG GW&K Trilogy Emerging Markets Equity Fund (formerly AMG Trilogy Emerging Markets Equity Fund), AMG GW&K Trilogy Emerging Wealth Equity Fund (formerly AMG Trilogy Emerging Wealth Equity Fund), and AMG GW&K Core Bond ESG Fund (formerly AMG GW&K Core Bond Fund): Approval of Investment Management Agreements and Subadvisory Agreement on June 27, 2019 At an in-person meeting held on June 27, 2019, the Board of Trustees (the “Board” or the “Trustees”) of each of AMG Funds and AMG Funds I (each, a “Trust” and collectively, the “Trusts”), and separately a majority of the Trustees who are not “interested persons” of the Trusts (the “Independent Trustees”), approved (i) the Investment Management Agreement, as amended pursuant to letter agreements at any time prior to the date of the meeting, with AMG Funds LLC (the “Investment Manager”) and AMG Funds for each of AMG GW&K Trilogy Emerging Markets Equity Fund (formerly AMG Trilogy Emerging Markets Equity Fund) and AMG GW&K Trilogy Emerging Wealth Equity Fund (formerly AMG Trilogy Emerging Wealth Equity Fund), and separately each of Amendment No. 1 thereto dated July 1, 2015, and Amendment No. 2 thereto dated October 1, 2016; and the Investment Management Agreement, as amended pursuant to letter agreements at any time prior to the date of the meeting, with the Investment Manager and AMG Funds I for AMG GW&K Core Bond ESG Fund (formerly AMG GW&K Core Bond Fund), and separately each of Amendment No. 1 thereto dated July 1, 2015, and Amendment No. 2 thereto dated October 1, 2016 (collectively, the “Investment Management Agreements”) and (ii) the Subadvisory Agreement, as amended at any time prior to the date of the meeting, with the Subadviser for AMG GW&K Core Bond ESG Fund (the “Subadvisory Agreement”).1 The Independent Trustees were separately represented by independent legal counsel in connection with their consideration of the approval of these agreements. In considering the Investment Management Agreements and the Subadvisory Agreement, the Trustees reviewed a variety of materials relating to AMG GW&K Trilogy Emerging Markets Equity Fund, AMG GW&K Trilogy Emerging Wealth Equity Fund, and AMG GW&K Core Bond ESG Fund (each, a “Fund,” and collectively, the “Funds”), the Investment Manager and the Subadviser, including comparative performance, fee and expense information for an appropriate peer group of similar mutual funds for each Fund (each, a “Peer Group”), performance information for the relevant benchmark index for each Fund (each, a “Fund Benchmark”) and | | | | other information provided to them on a periodic basis throughout the year, as well as information provided in connection with their meeting held on June 27, 2019, regarding the nature, extent and quality of services provided by the Investment Manager and the Subadviser under their respective agreements and other relevant matters. Prior to voting, the Independent Trustees: (a) reviewed the foregoing information with their independent legal counsel; (b) received materials from their independent legal counsel discussing the legal standards applicable to their consideration of the Investment Management Agreements and the Subadvisory Agreement; and (c) met with their independent legal counsel in private sessions at which no representatives of management were present. NATURE, EXTENT AND QUALITY OF SERVICES In considering the nature, extent and quality of the services provided by the Investment Manager, the Trustees reviewed information relating to the Investment Manager’s operations and personnel. Among other things, the Investment Manager provided financial information, information about its supervisory and professional staff and descriptions of its organizational and management structure. The Trustees also took into account information provided periodically throughout the previous year by the Investment Manager in Board meetings relating to the performance of its duties with respect to the Funds and the Trustees’ knowledge of the Investment Manager’s management and the quality of the performance of the Investment Manager’s duties under the Investment Management Agreements and Administration Agreement. In the course of their deliberations regarding the Investment Manager, the Trustees evaluated, among other things: (a) the extent and quality of the Investment Manager’s oversight of the operation and management of the Funds; (b) the quality of the Investment Manager’s oversight of the performance by the Subadviser of its portfolio management duties; (c) the Investment Manager’s ability to supervise the Funds’ other service providers; and (d) the Investment Manager’s compliance program. The Trustees also took into account that, in performing its functions under the Investment Management Agreements and supervising the Subadviser, the Investment Manager: performs periodic detailed analyses and reviews of the performance by the Subadviser of its obligations to each Fund, including without limitation, analysis and review of portfolio and other compliance matters and review of the Subadviser’s investment performance with respect to each Fund; | | | | prepares and presents periodic reports to the Board regarding the investment performance of the Subadviser and other information regarding the Subadviser, at such times and in such forms as the Board may reasonably request; reviews and considers any changes in the personnel of the Subadviser responsible for performing the Subadviser’s obligations and makes appropriate reports to the Board; reviews and considers any changes in the ownership or senior management of the Subadviser and makes appropriate reports to the Board; performs periodic in-person or telephonic diligence meetings, including with respect to compliance matters, with representatives of the Subadviser; assists the Board and management of the Trust in developing and reviewing information with respect to the initial approval of the Subadvisory Agreement and annual consideration of the Subadvisory Agreement thereafter; prepares recommendations with respect to the continued retention of the Subadviser or the replacement of the Subadviser, including at the request of the Board; identifies potential successors to, or replacements of, the Subadviser or potential additional subadvisers, including performing appropriate due diligence, and developing and presenting to the Board a recommendation as to any such successor, replacement, or additional subadviser, including at the request of the Board; designates and compensates from its own resources such personnel as the Investment Manager may consider necessary or appropriate to the performance of its services; and performs such other review and reporting functions as the Board shall reasonably request consistent with the Investment Management Agreements and applicable law. The Trustees noted the affiliation of the Subadviser with the Investment Manager, noting any potential conflicts of interest. The Trustees also took into account the financial condition of the Investment Manager with respect to its ability to provide the services required under the Investment Management Agreements and the Investment Manager’s undertaking to maintain a contractual expense limitation for each Fund. The Trustees also considered the Investment Manager’s risk management processes. For AMG GW&K Core Bond ESG Fund, the Trustees also reviewed information relating to the Subadviser’s operations and personnel and the investment philosophy, strategies and techniques (its “Investment Strategy”) used in managing the Fund. Among other things, the Trustees reviewed information on portfolio management and other professional staff, information regarding the Subadviser’s organizational and management |
52
|
Annual Renewal of Investment Management and Subadvisory Agreements(continued) |
| | | | | | | | |
structure and the Subadviser’s brokerage policies and practices. The Trustees considered specific information provided regarding the experience of the individuals at the Subadviser with portfolio management responsibility for the Fund, including the information set forth in the Fund’s prospectus and statement of additional information. In the course of their deliberations, the Trustees evaluated, among other things: (a) the services rendered by the Subadviser in the past; (b) the qualifications and experience of the Subadviser’s personnel; and (c) the Subadviser’s compliance program. The Trustees also took into account the financial condition of the Subadviser with respect to its ability to provide the services required under the Subadvisory Agreement. The Trustees also considered the Subadviser’s risk management processes. PERFORMANCE The Board considered each Fund’s net performance during relevant time periods as compared to the Fund’s Peer Group and Fund Benchmark and considered the gross performance of the Fund as compared to the Subadviser’s relevant performance composite that utilizes the same investment strategy and approach and noted that the Board reviews on a quarterly basis detailed information about both the Fund’s performance results and portfolio composition, as well as the Subadviser’s Investment Strategy. The Board noted the Investment Manager’s expertise and resources in monitoring the performance, investment style and risk-adjusted performance of the Subadviser. The Board was mindful of the Investment Manager’s attention to monitoring the Subadviser’s performance with respect to the Funds and its discussions with management regarding the factors that contributed to the performance of the Funds. With respect to AMG GW&K Trilogy Emerging Markets Equity Fund, among other information relating to the Fund’s performance, the Trustees noted that the Fund’s performance for Class Z shares (which share class has the largest amount of assets of all the share classes of the Fund) for the 1-year, 3-year and 5-year periods ended March 31, 2019 and for the period from the Class Z shares’ inception on March 1, 2011 through March 31, 2019 was above, above, above and below, respectively, the median performance for the Peer Group and above, above, above and below, respectively, the performance of the Fund Benchmark, the MSCI Emerging Markets Index. The Trustees took into account management’s discussion of the Fund’s performance, including the Fund’s more recent improved performance. The Trustees noted that Class Z shares of the Fund ranked in the | | | | top quintile relative to its Peer Group for the 1-year and 3-year periods, and in the top quartile relative to its Peer Group for the 5-year period. The Trustees concluded that the Fund’s overall performance has been satisfactory. With respect to AMG GW&K Trilogy Emerging Wealth Equity Fund, among other information relating to the Fund’s performance, the Trustees noted that the Fund’s performance for Class Z shares (which share class has the largest amount of assets of all the share classes of the Fund) for the 1-year and 3-year periods ended March 31, 2019 and for the period from the Fund’s inception on March 19, 2015 through March 31, 2019 was above the median performance for the Peer Group and above the performance of the Fund Benchmark, the MSCI Emerging Markets Index. The Trustees took into account management’s discussion of the Fund’s performance, noting that Class Z shares of the Fund ranked in the top decile relative to its Peer Group for the 3-year period and the period from inception through March 31, 2019 and in the top quintile relative to its Peer Group for the 1-year period. The Trustees concluded that the Fund’s overall performance has been satisfactory. With respect to AMG GW&K Core Bond ESG Fund, among other information relating to the Fund’s performance, the Trustees noted that the Fund’s performance for Class I shares (which share class has the earliest inception date and the largest amount of assets of all the share classes of the Fund) for the 1-year, 3-year, 5-year and 10-year periods ended March 31, 2019 was above, below, below and above, respectively, the median performance for the Peer Group and below, below, below and above, respectively, the performance of the Fund Benchmark, the Bloomberg Barclays U.S. Aggregate Bond Index®. The Trustees took into account management’s discussion of the Fund’s performance, including the reasons for the Fund’s underperformance relative to the Fund Benchmark. The Trustees specifically noted the change in the Fund’s Subadviser in February 2015 and that the performance record prior to that time reflects that of the prior Subadviser. The Trustees concluded that the Fund’s overall performance has been satisfactory in light of the Fund’s investment objective, strategies and policies. ADVISORY AND SUBADVISORY FEES AND PROFITABILITY In considering the reasonableness of the advisory fee payable to the Investment Manager, the Trustees reviewed information provided by the Investment Manager setting forth all revenues and other benefits, both direct and indirect (including any | | | | so-called “fallout benefits” such as reputational value derived from the Investment Manager serving as Investment Manager to a Fund), received by the Investment Manager and its affiliates attributable to managing each Fund and all the mutual funds in the AMG Funds Family of Funds; the cost of providing such services; the significant risks undertaken as Investment Manager and sponsor of the Funds, including investment, operational, enterprise, entrepreneurial, litigation, regulatory and compliance risks; and the resulting profitability to the Investment Manager and its affiliates from these relationships. The Trustees also considered the amount of the advisory fee retained by the Investment Manager after payment of the subadvisory fee with respect to each Fund. The Trustees also noted payments made or to be made from the Subadviser to the Investment Manager, and other payments made or to be made from the Investment Manager to the Subadviser. The Trustees also considered management’s discussion of the current asset levels of the Funds, and the impact on profitability of both the current asset levels and any future growth of assets of the Funds. In considering the cost of services to be provided by the Investment Manager under each Investment Management Agreement and the profitability to the Investment Manager of its relationship with each Fund, the Trustees noted the undertaking by the Investment Manager to maintain a contractual expense limitation for the Funds. The Board also took into account management’s discussion of the advisory fee structure, and the services the Investment Manager provides in performing its functions under the Investment Management Agreements and supervising the Subadviser. Based on the foregoing, the Trustees concluded that the profitability to the Investment Manager is reasonable and that the Investment Manager is not realizing material benefits from economies of scale that would warrant adjustments to the advisory fee at this time. Also with respect to economies of scale, the Trustees noted that as each Fund’s assets increase over time, the Fund may realize other economies of scale to the extent the increase in assets is proportionally greater than the increase in certain other expenses. For AMG GW&K Core Bond ESG Fund, in considering the reasonableness of the subadvisory fees payable by the Investment Manager to the Subadviser, the Trustees reviewed information regarding the cost to the Subadviser of providing subadvisory services to the Fund and the resulting profitability from the relationships. The Trustees noted that, because the Subadviser is an affiliate of the Investment Manager, a portion of the Subadviser’s revenues or profits might be shared directly or indirectly with the |
53
|
Annual Renewal of Investment Management and Subadvisory Agreements(continued) |
| | | | | | | | |
Investment Manager. The Trustees also noted that the subadvisory fees are paid by the Investment Manager out of its advisory fee. The Board also took into account management’s discussion of the subadvisory fee structure, and the services the Subadviser provides in performing its functions under the Subadvisory Agreement. Based on the foregoing, the Trustees concluded that the profitability to the Subadviser is reasonable and that the Subadviser is not realizing material benefits from economies of scale that would warrant adjustments to the subadvisory fees at this time. Also with respect to economies of scale, the Trustees noted that as the Fund’s assets increase over time, the Fund may realize other economies of scale to the extent the increase in assets is proportionally greater than the increase in certain other expenses. With respect to AMG GW&K Trilogy Emerging Markets Equity Fund, the Trustees noted that the Fund’s management fees (which include both the advisory and administration fees) and total expenses (weighted average, all classes combined) (net of applicable expense waivers/reimbursements) as of March 31, 2019 were both lower than the average for the Fund’s Peer Group. The Trustees took into account the fact that the Investment Manager has contractually agreed, through March 1, 2020, to limit the Fund’s net annual operating expenses (subject to certain excluded expenses) to 1.05%. The Trustees concluded that, in light of the nature, extent and quality of the services provided by the Investment Manager, the foregoing expense limitation and the considerations noted above with respect to the Investment Manager, the Fund’s advisory fees are reasonable. With respect to AMG GW&K Trilogy Emerging Wealth Equity Fund, the Trustees noted that the Fund’s management fees (which include both the advisory | | | | and administration fees) and total expenses (weighted average, all classes combined) (net of applicable expense waivers/reimbursements) as of March 31, 2019 were both lower than the average for the Fund’s Peer Group. The Trustees took into account the fact that the Investment Manager has contractually agreed, through March 1, 2020, to limit the Fund’s net annual operating expenses (subject to certain excluded expenses) to 1.05%. The Trustees concluded that, in light of the nature, extent and quality of the services provided by the Investment Manager, the foregoing expense limitation and the considerations noted above with respect to the Investment Manager, the Fund’s advisory fees are reasonable. With respect to AMG GW&K Core Bond ESG Fund, the Trustees noted that the Fund’s management fees (which include both the advisory and administration fees) and total expenses (weighted average, all classes combined) (net of applicable expense waivers/reimbursements) as of March 31, 2019 were both lower than the average for the Fund’s Peer Group. The Trustees took into account the fact that the Investment Manager has contractually agreed, through March 1, 2020, to limit the Fund’s net annual operating expenses (subject to certain excluded expenses) to 0.48%. The Trustees concluded that, in light of the nature, extent and quality of the services provided by the Investment Manager and the Subadviser (which is an affiliate of the Investment Manager), the foregoing expense limitation and the considerations noted above with respect to the Investment Manager and the Subadviser, the Fund’s advisory and subadvisory fees are reasonable. * * * * | | | | After consideration of the foregoing, the Trustees also reached the following conclusions (in addition to the conclusions discussed above) regarding the Investment Management Agreements and the Subadvisory Agreement: (a) the Investment Manager and the Subadviser have demonstrated that they possess the capability and resources to perform the duties required of them under each Investment Management Agreement and the Subadvisory Agreement and (b) the Investment Manager and Subadviser maintain appropriate compliance programs. Based on all of the above-mentioned factors and their related conclusions, with no single factor or conclusion being determinative and with each Trustee not necessarily attributing the same weight to each factor, the Trustees concluded that approval of each Investment Management Agreement and the Subadvisory Agreement would be in the best interests of the applicable Fund and its shareholders. Accordingly, on June 27, 2019, the Trustees, and separately a majority of the Independent Trustees, voted to approve the Investment Management Agreement for each Fund and the Subadvisory Agreement for AMG GW&K Core Bond ESG Fund. 1 At an in-person meeting held on December 6, 2018, the Board of Trustees of AMG Funds, and separately a majority of the Independent Trustees, approved the Subadvisory Agreements with respect to AMG GW&K Trilogy Emerging Markets Equity Fund and AMG GW&K Trilogy Emerging Wealth Equity Fund, which were subsequently approved by each applicable Fund’s shareholders at a special meeting held on April 16, 2019, for an initial two-year period. |
54
THIS PAGE INTENTIONALLY LEFT BLANK
THIS PAGE INTENTIONALLY LEFT BLANK
| | |
| | |
| | | | |
INVESTMENT MANAGER AND ADMINISTRATOR AMG Funds LLC 600 Steamboat Road, Suite 300 Greenwich, CT 06830 800.548.4539 DISTRIBUTOR AMG Distributors, Inc. 600 Steamboat Road, Suite 300 Greenwich, CT 06830 800.548.4539 SUBADVISER GW&K Investment Management, LLC 222 Berkeley St. Boston, MA 02116 | | CUSTODIAN The Bank of New York Mellon 111 Sanders Creek Parkway East Syracuse, NY 13057 LEGAL COUNSEL Ropes & Gray LLP Prudential Tower, 800 Boylston Street Boston, MA 02199-3600 TRANSFER AGENT BNY Mellon Investment Servicing (US) Inc. Attn: AMG Funds P.O. Box 9769 Providence, RI 02940 800.548.4539 | | This report is prepared for the Funds’ shareholders. It is authorized for distribution to prospective investors only when preceded or accompanied by an effective prospectus. To receive a free copy of the prospectus or Statement of Additional Information, which includes additional information about Fund Trustees, please contact us by calling 800.548.4539. Distributed by AMG Distributors, Inc., member FINRA/SIPC. Current net asset values per share for each Fund are available on the Funds’ website at amgfunds.com. A description of the policies and procedures each Fund uses to vote its proxies is available: (i) without charge, upon request, by calling 800.548.4539, or (ii) on the Securities and Exchange Commission’s (SEC) website at sec.gov. For information regarding each Fund’s proxy voting record for the 12-month period ended June 30, call 800.548.4539 or visit the SEC website at sec.gov. The Funds file their complete schedule of portfolio holdings with the SEC for the first and third quarters of each fiscal year as an exhibit to their reports on Form N-PORT, which has replaced Form N-Q. The Funds’ portfolio holdings on Form N-PORT are available on the SEC’s website at sec.gov. To review a complete list of the Funds’ portfolio holdings, or to view the most recent semiannual report or annual report, please visit amgfunds.com. |
| | | | | | | | |
AFFILIATE SUBADVISED FUNDS BALANCED FUNDS AMG Chicago Equity Partners Balanced Chicago Equity Partners, LLC AMG FQ Global Risk-Balanced First Quadrant, L.P. EQUITY FUNDS AMG FQ Tax-Managed U.S. Equity AMG FQ Long-Short Equity First Quadrant, L.P. AMG Frontier Small Cap Growth Frontier Capital Management Co., LLC AMG GW&K Small Cap Core AMG GW&K Small/Mid Cap AMG GW&K Trilogy Emerging Markets Equity AMG GW&K Trilogy Emerging Wealth Equity GW&K Investment Management, LLC AMG Renaissance Large Cap Growth The Renaissance Group LLC AMG River Road Dividend All Cap Value AMG River Road Dividend All Cap Value II AMG River Road Focused Absolute Value AMG River Road Long-Short AMG River Road Small-Mid Cap Value AMG River Road Small Cap Value River Road Asset Management, LLC AMG SouthernSun Small Cap AMG SouthernSun U.S. Equity SouthernSun Asset Management, LLC | | | | AMG TimesSquare Emerging Markets Small Cap AMG TimesSquare Global Small Cap AMG TimesSquare International Small Cap AMG TimesSquare Mid Cap Growth AMG TimesSquare Small Cap Growth TimesSquare Capital Management, LLC AMG Yacktman AMG Yacktman Focused AMG Yacktman Focused Fund - Security Selection Only AMG Yacktman Special Opportunities Yacktman Asset Management LP FIXED INCOME FUNDS AMG GW&K Core Bond ESG AMG GW&K Enhanced Core Bond ESG AMG GW&K Municipal Bond AMG GW&K Municipal Enhanced Yield GW&K Investment Management, LLC OPEN-ARCHITECTURE FUNDS EQUITY FUNDS AMG Managers Brandywine AMG Managers Brandywine Advisors Mid Cap Growth AMG Managers Brandywine Blue Friess Associates, LLC AMG Managers Cadence Emerging Companies AMG Managers Cadence Mid Cap Cadence Capital Management LLC AMG Managers CenterSquare Real Estate CenterSquare Investment Management LLC | | | | AMG Managers Emerging Opportunities WEDGE Capital Management L.L.P. Next Century Growth Investors LLC RBC Global Asset Management (U.S.) Inc. AMG Managers Fairpointe ESG Equity AMG Managers Fairpointe Mid Cap Fairpointe Capital LLC AMG Managers LMCG Small Cap Growth LMCG Investments, LLC AMG Managers Montag & Caldwell Growth Montag & Caldwell, LLC AMG Managers Pictet International Pictet Asset Management Limited AMG Managers Silvercrest Small Cap Silvercrest Asset Management Group LLC AMG Managers Skyline Special Equities Skyline Asset Management, L.P. AMG Managers Special Equity Ranger Investment Management, L.P. Lord, Abbett & Co. LLC Smith Asset Management Group, L.P. Federated MDTA LLC FIXED INCOME FUNDS AMG Managers Doubleline Core Plus Bond DoubleLine Capital LP AMG Managers Global Income Opportunity AMG Managers Loomis Sayles Bond Loomis, Sayles & Company, L.P. |
| | | | |
amgfunds.com | | 103119 | | AR069 |
| | |
 | | ANNUALREPORT |
| | | | | | | | |
| | | | | AMG Funds October 31, 2019 
AMG FQ Tax-Managed U.S. Equity Fund |
| | | | | | | | | |
| | | | | |
| | | | | Class N: MFQAX | | Class I: MFQTX | | |
| | | |
| | | | | AMG FQ Long-Short Equity Fund |
| | | | | | | | | |
| | | | | |
| | | | | Class N: FQUAX | | Class I: MEQFX | | |
| | | |
| | | | | AMG FQ Global Risk-Balanced Fund |
| | | | | | | | | |
| | | | | |
| | | | | Class N: MMAVX | | Class I: MMASX | | Class Z:MMAFX |
| | | | | |
| | | | | | | | | |
Beginning on January 1, 2021, as permitted by regulations adopted by the Securities and Exchange Commission, paper copies of the Funds’ shareholder reports like this one will no longer be sent by mail, unless you specifically request paper copies of the reports from the Funds or from your financial intermediary, such as a broker-dealer or bank. Instead, the reports will be made available on the Funds’ website (https://www.amgfunds.com/resources/order_literature.html), and you will be notified by mail each time a report is posted and provided with a website link to access the report.
If you already elected to receive shareholder reports electronically, you will not be affected by this change and you need not take any action. You may elect to receive shareholder reports and other communications from the Funds electronically at any time by contacting your financial intermediary or, if you invest directly with the Funds, by logging into your account at www.amgfunds.com.
You may elect to receive all future reports in paper free of charge. If you invest through a financial intermediary, you can contact your financial intermediary to request that you continue to receive paper copies of your shareholder reports. If you invest directly with the Funds, you can call 1.800.548.4539 to inform the Funds that you wish to continue receiving paper copies of your shareholder reports. Your election to receive reports in paper will apply to all funds in the AMG Funds Family of Funds held in your account if you invest through your financial intermediary or all funds in the AMG Funds Family of Funds held with the fund complex if you invest directly with the Funds.
| | | | |
| amgfunds.com | | | | 103119 AR014 |
| | |
| | | AMG Funds Annual Report — October 31, 2019 |
| | | | | | |
| | | |
| | | | | | | |
| | | TABLE OF CONTENTS | | PAGE | |
| | | | |
| | | LETTER TO SHAREHOLDERS | | | 2 | |
| | | |
| | | ABOUT YOUR FUND’S EXPENSES | | | 3 | |
| | | |
| | | PORTFOLIO MANAGER’S COMMENTS, FUND SNAPSHOTS AND SCHEDULES OF PORTFOLIO INVESTMENTS | | | | |
| | | |
| | | AMG FQ Tax-Managed U.S. Equity Fund | | | 4 | |
| | | |
| | | AMG FQ Long-Short Equity Fund | | | 10 | |
| | | |
| | | AMG FQ Global Risk-Balanced Fund | | | 26 | |
| | | |
| | | FINANCIAL STATEMENTS | | | | |
| | | |
| | | Statement of Assets and Liabilities | | | 33 | |
| | | |
| | | Balance sheets, net asset value (NAV) per share computations and cumulative distributable earnings (loss) | | | | |
| | | |
| | | Statement of Operations | | | 35 | |
| | | |
| | | Detail of sources of income, expenses, and realized and unrealized gains (losses) during the fiscal year | | | | |
| | | |
| | | Statements of Changes in Net Assets | | | 36 | |
| | | |
| | | Detail of changes in assets for the past two fiscal years | | | | |
| | | |
| | | Financial Highlights | | | 37 | |
| | | |
| | | Historical net asset values per share, distributions, total returns, income and expense ratios, turnover ratios and net assets | | | | |
| | | |
| | | Notes to Financial Statements | | | 44 | |
| | | |
| | | Accounting and distribution policies, details of agreements and transactions with Fund management and affiliates, and descriptions of certain investment risks | | | | |
| | | |
| | | REPORT OF INDEPENDENT REGISTERED PUBLIC ACCOUNTING FIRM | | | 54 | |
| | | |
| | | OTHER INFORMATION | | | 55 | |
| | | |
| | | TRUSTEES AND OFFICERS | | | 56 | |
| | | |
| | | ANNUAL RENEWAL OF INVESTMENT MANAGEMENT AND SUBADVISORY AGREEMENTS | | | 58 | |
| | | | | | | |
|
| Nothing contained herein is to be considered an offer, sale or solicitation of an offer to buy shares of any series of the AMG Funds family of mutual funds. Such offering is made only by prospectus, which includes details as to offering price and other material information. | |
| | |
| | Letter to Shareholders |
Dear Shareholder:
The U.S. bull market celebrated its 10-year anniversary during the fiscal year ended October 31, 2019, as stocks proved resilient in the face of global economic weakness, rising geopolitical tensions, and the ongoing trade war. Global stock markets swooned late in 2018 as hawkish U.S. Federal Reserve (Fed) policy and an escalation of the U.S./China trade war triggered a painful selloff. However, a dovish pivot from global central banks rescued investors and fueled a strong rebound early in 2019. Investors clung to hopes of a positive outcome from U.S./China trade negotiations, even as doubts about the durability of the economic cycle lingered, and the S&P 500® Index returned 14.33% for the fiscal year. International equities were also resistant to pressures facing the global economy and generated an 11.27% return as measured by the MSCI All Country World ex USA Index.
In total, ten out of eleven sectors of the S&P 500® Index were strongly positive during the prior twelve months. Investors sought the relative safety of defensive sectors, with utilities and real estate leading the index with returns of 26.73% and 23.71%, respectively. However, the higher growth information technology sector also generated a robust 22.60% return. Energy was the lone negative sector with a return of (11.40)% during the fiscal year. Growth stocks outperformed Value stocks for the full fiscal year with returns of 17.10% and 11.21% for the Russell 1000® Growth and Russell 1000® Value Indexes, respectively. The cycle of U.S. outperformance over international equities continued, but international developed and emerging markets still produced solidly positive returns, with the MSCI EAFE and MSCI Emerging Markets Index returning 11.04% and 11.86%, respectively, in the twelve months ending October 31, 2019.
Interest rates fell dramatically over the fiscal year and led to strong returns for bond investors as the Fed shifted to a more dovish policy stance early in 2019 and eventually cut short-term rates later in the year. The 10-year Treasury yield fell from a high of 3.24% last November to a yield of 1.69% as of October 31, 2019. The plunge in long-term interest rates caused the yield curve to briefly invert with 2-year yields rising higher than the 10-year yields. The Bloomberg Barclays U.S. Aggregate Bond Index, a broad measure of U.S. bond market performance, ended the fiscal year with an 11.51% return. High yield bonds lagged the broader bond market and returned 8.38% as measured by the return of the Bloomberg Barclays U.S. Corporate High Yield Bond Index. Municipal bonds also performed strongly with a 9.42% return for the Bloomberg Barclays Municipal Bond Index.
AMG Funds appreciates the privilege of providing investment tools to you and your clients. Our foremost goal is to provide investment solutions that help our shareholders successfully reach their long-term investment goals. AMG Funds
provides access to a distinctive array of actively managed return-oriented investment strategies. We thank you for your continued confidence and investment in AMG Funds. You can rest assured that under all market conditions our team is focused on delivering excellent investment management services for your benefit.
Respectfully,

Keitha Kinne
President
AMG Funds
| | | | | | | | | | | | | | |
| Average Annual Total Returns | | Periods ended
October 31, 2019* | |
| | | | |
| Stocks: | | | | 1 Year | | | 3 Years | | | 5 Years | |
| | | | |
Large Caps | | (S&P 500® Index) | | | 14.33 | % | | | 14.91% | | | | 10.78% | |
| | | | |
Small Caps | | (Russell 2000® Index) | | | 4.90 | % | | | 10.96% | | | | 7.37% | |
| | | | |
International | | (MSCI All Country World Index ex USA) | | | 11.27 | % | | | 8.07% | | | | 3.82% | |
| Bonds: | | | | | | | | | | | |
| | | | |
Investment Grade | | (Bloomberg Barclays U.S. Aggregate Bond Index) | | | 11.51 | % | | | 3.29% | | | | 3.24% | |
| | | | |
High Yield | | (Bloomberg Barclays U.S. Corporate High Yield Bond Index) | | | 8.38 | % | | | 6.03% | | | | 5.18% | |
| | | | |
Tax-exempt | | (Bloomberg Barclays Municipal Bond Index) | | | 9.42 | % | | | 3.62% | | | | 3.55% | |
| | | | |
Treasury Bills | | (ICE BofAML U.S. 6-Month Treasury Bill Index) | | | 2.71 | % | | | 1.74% | | | | 1.21% | |
*Source: FactSet. Past performance is no guarantee of future results.
2
|
About Your Fund’s Expenses |
| | | | | | | | |
As a shareholder of a Fund, you may incur two types of costs: (1) transaction costs, which may include sales charges (loads) on purchase payments; redemption fees; and exchange fees; and (2) ongoing costs, including management fees; distribution (12b-1) fees; and other Fund expenses. This example is intended to help you understand your ongoing costs (in dollars) of investing in the Fund and to compare these costs with the ongoing costs of investing in other mutual funds. The example is based on $1,000 invested at the beginning of the period and held for the entire period as indicated below. ACTUAL EXPENSES The first line of the following table provides information about the actual account values and | | | | actual expenses. You may use the information in this line, together with the amount you invested, to estimate the expenses that you paid over the period. Simply divide your account value by $1,000 (for example, an $8,600 account value divided by $1,000 = 8.6), then multiply the result by the number in the first line under the heading entitled “Expenses Paid During Period” to estimate the expenses you paid on your account during this period. HYPOTHETICAL EXAMPLE FOR COMPARISON PURPOSES The second line of the following table provides information about hypothetical account values and hypothetical expenses based on the Fund’s actual expense ratio and an assumed annual rate of return of 5% before expenses, which is not the Fund’s | | | | actual return. The hypothetical account values and expenses may not be used to estimate the actual ending account balance or expenses you paid for the period. You may use this information to compare the ongoing costs of investing in the Fund and other funds by comparing this 5% hypothetical example with the 5% hypothetical examples that appear in the shareholder reports of other funds. Please note that the expenses shown in the table are meant to highlight your ongoing costs only and do not reflect any transactional costs, such as sales charges (loads), redemption fees, or exchange fees. Therefore, the second line of the table is useful in comparing ongoing costs only, and will not help you determine the relative total costs of owning different funds. |
| | | | | | | | |
| | | | | | | | | | | | | | | | | | | | |
Six Months Ended October 31, 2019 | | Expense
Ratio for
the Period | | Beginning
Account
Value
05/01/19 | | Ending
Account
Value
10/31/19 | | Expenses
Paid During
the Period* |
AMG FQ Tax-Managed U.S. Equity Fund | |
|
Based on Actual Fund Return | |
| | | | |
Class N | | | | 1.14 | % | | | | $1,000 | | | | | $1,046 | | | | | $5.88 | |
| | | | |
Class I | | | | 0.89 | % | | | | $1,000 | | | | | $1,047 | | | | | $4.59 | |
|
Based on Hypothetical 5% Annual Return | |
| | | | |
Class N | | | | 1.14 | % | | | | $1,000 | | | | | $1,019 | | | | | $5.80 | |
| | | | |
Class I | | | | 0.89 | % | | | | $1,000 | | | | | $1,021 | | | | | $4.53 | |
| | | | | | | | | | | | | | | | | | | | |
AMG FQ Long-Short Equity Fund | |
|
Based on Actual Fund Return | |
| | | | |
Class N | | | | 1.04 | % | | | | $1,000 | | | | | $1,028 | | | | | $5.32 | |
| | | | |
Class I | | | | 0.76 | % | | | | $1,000 | | | | | $1,029 | | | | | $3.89 | |
|
Based on Hypothetical 5% Annual Return | |
| | | | |
Class N | | | | 1.04 | % | | | | $1,000 | | | | | $1,020 | | | | | $5.30 | |
| | | | |
Class I | | | | 0.76 | % | | | | $1,000 | | | | | $1,021 | | | | | $3.87 | |
| | | | | | | | | | | | | | | | | | | | |
Six Months Ended October 31, 2019 | | Expense
Ratio for
the Period | | Beginning
Account
Value
05/01/19 | | Ending
Account
Value
10/31/19 | | Expenses
Paid During
the Period* |
AMG FQ Global Risk-Balanced Fund | |
|
Based on Actual Fund Return | |
| | | | |
Class N | | | | 1.29 | % | | | | $1,000 | | | | | $1,062 | | | | | $6.71 | |
| | | | |
Class I | | | | 1.04 | % | | | | $1,000 | | | | | $1,063 | | | | | $5.41 | |
| | | | |
Class Z | | | | 0.89 | % | | | | $1,000 | | | | | $1,064 | | | | | $4.63 | |
|
Based on Hypothetical 5% Annual Return | |
| | | | |
Class N | | | | 1.29 | % | | | | $1,000 | | | | | $1,019 | | | | | $6.56 | |
| | | | |
Class I | | | | 1.04 | % | | | | $1,000 | | | | | $1,020 | | | | | $5.30 | |
| | | | |
Class Z | | | | 0.89 | % | | | | $1,000 | | | | | $1,021 | | | | | $4.53 | |
| | * | Expenses are equal to the Fund’s annualized expense ratio multiplied by the average account value over the period, multiplied by the number of days in the most recent fiscal half-year (184), then divided by 365. |
3
|
AMG FQ Tax-Managed U.S. Equity Fund Portfolio Manager’s Comments(unaudited) |
| | | | | | | | |
For the fiscal year ended October 31, 2019, the AMG FQ Tax-Managed U.S. Equity Fund (the “Fund”) Class I shares returned 10.40%, compared to 13.49% for its benchmark, the Russell 3000® Index. MARKET OVERVIEW At the start of the period we identified a mostly resilient market environment. In recent months, however, we observed increasing fragility as the global economy slowed down and demand for safe-haven assets picked up. Despite ongoing uncertainty surrounding trade, the domestic economy held up well, and risk appetite appeared healthy outside of episodic risk shocks. As a result, for most of the period investor behavior aligned with that of recent years: Growth and momentum outperformed, while value struggled. As fragility accumulated, however, we started to observe rotations out of growth and momentum and into value. PERFORMANCE REVIEW The primary reason the strategy lagged the benchmark over the reporting period was our greater exposure toward small-cap. This exposure is part of | | | | the strategy’s structural design, in an effort to achieve broader market exposure. Over this reporting period, however, small-cap lagged, weighed down by concern about the rate environment. (Smaller companies are more sensitive to borrowing costs.) Small-cap showed signs of a turnaround late in the fiscal year, given the U.S. Federal Reserve’s interest rate cuts and signs of a healthy domestic economy. Exposure to momentum also contributed to underperformance, albeit to a lesser degree. We initially held significant overweight positioning in momentum stocks. This contributed to the gap between benchmark and portfolio performance in early 2019, as January featured a strong value rally. Although momentum staged a strong comeback, we had moderated our exposure as the market environment started to show signs of fragility, limiting our ability to close the gap. We made back a portion of losses through our positive exposure to profitability and growth. Active industry positioning also delivered gains. In particular, we benefited from overweight positioning in financials, which advanced as interest rates rose and demand for safe havens (including bonds) | | | | increased. We were further helped by underweight positioning in energy, which lagged amidst concern about overproduction and a crude supply glut. OUTLOOK As the fiscal year closes, we continue to observe indications of both resilience and fragility in the market environment. Although we still hold positive exposure to growth and momentum, we have reallocated some of our overall risk to value in recent months, in response to the building fragility. We continue to prioritize select expressions of value (just as earnings valuations), however, as we still observe a bearish opportunity for traditional forms of value. This commentary reflects the viewpoints of the portfolio manager, First Quadrant, L.P., as of October 31, 2019 and is not intended as a forecast or guarantee of future results, and is subject to change without notice. |
| | | | | | | | |
4
|
AMG FQ Tax-Managed U.S. Equity Fund Portfolio Manager’s Comments(continued) |
CUMULATIVE TOTAL RETURN PERFORMANCE
AMG FQ Tax-Managed U.S. Equity Fund’s cumulative total return is based on the daily change in net asset value (NAV), and assumes that all dividends and distributions were reinvested. This graph compares a hypothetical $10,000 investment made in the AMG FQ Tax-Managed U.S. Equity Fund’s Class I shares on October 31, 2009, to a $10,000 investment made in the Russell 3000® Index for the same time period. The graph does not reflect the deduction of taxes that a shareholder would pay on a Fund distribution or redemption of shares. The listed returns for the Fund are net of expenses and the returns for the index exclude expenses. Total returns would have been lower had certain expenses not been reduced.
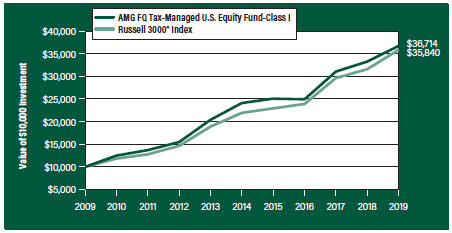
The table below shows the average annual total returns for the AMG FQ Tax-Managed U.S. Equity Fund and the Russell 3000® Index for the same time periods ended October 31, 2019.
| | | | | | | | | | | | | | | | | | | | |
| Average Annual Total Returns1 | | One Year | | | | | | Five
Years | | | | | | Ten Years | |
AMG FQ Tax-Managed U.S. Equity Fund2, 3, 4, 5, 6 | | | | | | | | | | | | | | | | | | | | |
| | | | | |
Class N | | | 10.15% | | | | | | | | 8.52 | % | | | | | | | 13.60% | |
| | | | | |
Class I | | | 10.40% | | | | | | | | 8.78 | % | | | | | | | 13.89% | |
| | | | | |
Russell 3000® Index7 | | | 13.49% | | | | | | | | 10.31 | % | | | | | | | 13.62% | |
| | | | | |
Return After Taxes on Distributions8 | | | | | | | | | | | | | | | | | | | | |
| | | | | |
Class N | | | 9.73% | | | | | | | | 8.35 | % | | | | | | | 13.50% | |
| | | | | |
Class I | | | 9.89% | | | | | | | | 8.55 | % | | | | | | | 13.73% | |
| | | | | |
Returns After Taxes on Distributions & Sale of Fund Shares8 | �� | | | | | | | | | | | | | | | | | | | |
| | | | | |
Class N | | | 6.22% | | | | | | | | 6.69 | % | | | | | | | 11.46% | |
| | | | | |
Class I | | | 6.40% | | | | | | | | 6.89 | % | | | | | | | 11.70% | |
The performance data shown represents past performance. Past performance is not a guarantee of future results. Current performance may be lower or higher than the performance data quoted. The investment return and principal value of an investment will fluctuate so that an investor’s shares, when redeemed, may be worth more or less than their original cost.
Investors should carefully consider the Fund’s investment objectives, risks, charges and expenses before investing. For performance information through the most recent month end, current net asset values per share for the Fund and other information, please call 800.548.4539 or visit our website at amgfunds.com for a free prospectus. Read it carefully before investing or sending money.
| | |
| | | Distributed by AMG Distributors, Inc., member FINRA/SIPC. |
| | |
| | | 1 Total return equals income yield plus share price change and assumes reinvestment of all dividends and capital gain distributions. Returns are net of fees and may reflect offsets of Fund expenses as described in the prospectus. No adjustment has been made for taxes payable by shareholders on their reinvested dividends and capital gain distributions. Returns for periods greater than one year are annualized. The listed returns on the Fund are net of expenses and based on the published NAV as of October 31, 2019. All returns are in U.S. dollars ($). 2 From time to time, the Fund’s advisor has waived its fees and/or absorbed Fund expenses, which has resulted in higher returns. 3 The Fund invests in large-capitalization companies that may underperform other stock funds (such as funds that focus on small-and-medium-capitalization companies) when stocks of large-capitalization companies are out of favor. 4 Although the Fund is managed to minimize taxable distributions, it may not be able to avoid taxable distributions. 5 The Fund may invest in derivatives such as options and futures; the complexity and rapidly changing structure of derivatives markets may increase the possibility of market losses. 6 In managing the Fund, the Fund’s Subadviser may rely heavily on one or more quantitative models (“Model”) and information and data supplied by third parties (“Data”). When a Model or Data used in managing the Fund contains an error, or is incorrect or incomplete, any investment decision made in reliance on the Model or Data may not produce the desired results and the Fund may realize losses. In addition, any hedging based on a faulty Model or Data may prove to be unsuccessful. 7 The Russell 3000® Index is composed of the 3,000 largest U.S. companies as measured by market capitalization, and represents about 98% of the U.S. stock market. Unlike the Fund, the Russell 3000® Index is unmanaged, is not available for investment and does not incur expenses. |
| | |
| | | 8 After-tax returns are calculated using the historical highest individual federal marginal income tax rates and do not reflect the impact of state and local taxes. Actual after-tax returns depend on an investor’s tax situation and may differ from those shown, and after-tax returns are not relevant to investors who hold their Fund shares through tax-deferred arrangements, such as 401(k) plans or individual retirement accounts. The Russell 3000® Index is a trademark of the London Stock Exchange Group companies. Not FDIC insured, nor bank guaranteed. May lose value. |
5
|
AMG FQ Tax-Managed U.S. Equity Fund Fund Snapshots(unaudited) October 31, 2019 |
PORTFOLIO BREAKDOWN
| | |
| Sector | | % of
Net Assets |
| | |
Information Technology | | 23.4 |
| | |
Health Care | | 14.0 |
| | |
Financials | | 13.9 |
| | |
Consumer Discretionary | | 10.8 |
| | |
Industrials | | 9.5 |
| | |
Communication Services | | 8.3 |
| | |
Consumer Staples | | 6.5 |
| | |
Real Estate | | 3.7 |
| | |
Energy | | 3.7 |
| | |
Utilities | | 2.6 |
| | |
Materials | | 2.4 |
| | |
Short-Term Investments | | 1.6 |
| | |
Other Assets Less Liabilities | | (0.4) |
TOP TEN HOLDINGS
| | |
| Security Name | | % of
Net Assets |
| | |
Microsoft Corp. | | 4.5 |
| | |
Apple, Inc. | | 4.1 |
| | |
Visa, Inc., Class A | | 4.0 |
| | |
Mastercard, Inc., Class A | | 3.7 |
| | |
Berkshire Hathaway, Inc., Class B | | 3.1 |
| | |
UnitedHealth Group, Inc. | | 3.0 |
| | |
Brown & Brown, Inc. | | 2.7 |
| | |
Crocs, Inc. | | 2.7 |
| | |
Amazon.com, Inc. | | 2.5 |
| | |
Arch Capital Group, Ltd. (Bermuda) | | 2.1 |
| | | |
| | |
Top Ten as a Group | | 32.4 |
| | |
Because a fund’s strategy may result in multiple investments in particular sectors of the economy, its performance may depend on the performance of those sectors and may fluctuate more widely than investments diversified across more sectors. For additional information on these and other risk considerations, please see the Fund’s prospectus.
Any sectors, industries, or securities discussed should not be perceived as investment recommendations. Mention of a specific security should not be considered a recommendation to buy or solicitation to sell that security. Specific securities mentioned in this report may have been sold from the Fund’s portfolio of investments by the time you receive this report.
6
|
AMG FQ Tax-Managed U.S. Equity Fund Schedule of Portfolio Investments October 31, 2019 |
| | | | | | | | |
| | | Shares | | | Value | |
| | |
Common Stocks - 98.8% | | | | | | | | |
| | |
Communication Services - 8.3% | | | | | | | | |
| | |
Activision Blizzard, Inc. | | | 1,347 | | | | $75,473 | |
| | |
Alphabet, Inc., Class A* | | | 731 | | | | 920,183 | |
| | |
Alphabet, Inc., Class C* | | | 748 | | | | 942,562 | |
| | |
AT&T, Inc. | | | 10,870 | | | | 418,386 | |
| | |
Comcast Corp., Class A | | | 3,542 | | | | 158,753 | |
| | |
Electronic Arts, Inc.* | | | 236 | | | | 22,750 | |
| | |
Facebook, Inc., Class A* | | | 5,716 | | | | 1,095,471 | |
| | |
Liberty Media Corp-Liberty SiriusXM, Class A* | | | 18,774 | | | | 843,140 | |
| | |
Netflix, Inc.* | | | 1,013 | | | | 291,146 | |
| | |
TechTarget, Inc.* | | | 4,156 | | | | 101,406 | |
| | |
Twitter, Inc.* | | | 994 | | | | 29,790 | |
| | |
Verizon Communications, Inc. | | | 2,924 | | | | 176,814 | |
| | |
The Walt Disney Co. | | | 869 | | | | 112,901 | |
| | |
Yelp, Inc.*,1 | | | 16,466 | | | | 568,242 | |
| | |
Zynga, Inc., Class A* | | | 8,227 | | | | 50,761 | |
| | |
Total Communication Services | | | | | | | 5,807,778 | |
| | |
Consumer Discretionary - 10.8% | | | | | | | | |
| | |
Aaron’s, Inc. | | | 411 | | | | 30,796 | |
| | |
Amazon.com, Inc.* | | | 997 | | | | 1,771,330 | |
| | |
Best Buy Co., Inc. | | | 2,515 | | | | 180,652 | |
| | |
Crocs, Inc.*,1 | | | 54,248 | | | | 1,898,138 | |
| | |
eBay, Inc. | | | 14,217 | | | | 501,149 | |
| | |
Gentex Corp. | | | 33,635 | | | | 943,462 | |
| | |
Graham Holdings Co., Class B | | | 608 | | | | 382,833 | |
| | |
The Home Depot, Inc. | | | 1,128 | | | | 264,606 | |
| | |
K12, Inc.* | | | 7,056 | | | | 139,638 | |
| | |
Lowe’s Cos., Inc. | | | 6,998 | | | | 781,047 | |
| | |
Ross Stores, Inc. | | | 2,546 | | | | 279,220 | |
| | |
Standard Motor Products, Inc. | | | 3,900 | | | | 204,204 | |
| | |
Stoneridge, Inc.* | | | 6,312 | | | | 194,915 | |
| | |
Total Consumer Discretionary | | | | | | | 7,571,990 | |
| | |
Consumer Staples - 6.5% | | | | | | | | |
| | |
Central Garden & Pet Co., Class A* | | | 11,889 | | | | 336,221 | |
| | |
The Coca-Cola Co. | | | 1,370 | | | | 74,569 | |
| | |
Medifast, Inc.1 | | | 7,275 | | | | 807,088 | |
| | |
National Beverage Corp.1 | | | 5,799 | | | | 254,924 | |
| | |
PepsiCo, Inc. | | | 176 | | | | 24,142 | |
| | |
Performance Food Group Co.* | | | 14,772 | | | | 629,435 | |
| | |
The Procter & Gamble Co. | | | 2,182 | | | | 271,681 | |
| | |
Tyson Foods, Inc., Class A | | | 14,833 | | | | 1,228,024 | |
| | | | | | | | |
| | | Shares | | | Value | |
| | |
US Foods Holding Corp.* | | | 23,221 | | | | $921,177 | |
| | |
Total Consumer Staples | | | | | | | 4,547,261 | |
| | |
Energy - 3.7% | | | | | | | | |
| | |
Chevron Corp. | | | 1,701 | | | | 197,554 | |
| | |
Exxon Mobil Corp. | | | 4,844 | | | | 327,309 | |
| | |
HollyFrontier Corp. | | | 1,354 | | | | 74,389 | |
| | |
Marathon Petroleum Corp. | | | 9,400 | | | | 601,130 | |
| | |
Phillips 66 | | | 4,600 | | | | 537,372 | |
| | |
Valero Energy Corp. | | | 5,800 | | | | 562,484 | |
| | |
W&T Offshore, Inc.* | | | 67,152 | | | | 270,623 | |
| | |
Total Energy | | | | | | | 2,570,861 | |
| | |
Financials - 13.9% | | | | | | | | |
| | |
Arch Capital Group, Ltd. (Bermuda)* | | | 34,786 | | | | 1,452,663 | |
| | |
Bank of America Corp. | | | 10,000 | | | | 312,700 | |
| | |
Berkshire Hathaway, Inc., Class B* | | | 10,154 | | | | 2,158,537 | |
| | |
Brown & Brown, Inc. | | | 50,513 | | | | 1,903,330 | |
| | |
Canadian Imperial Bank of Commerce (Canada)1 | | | 1,790 | | | | 152,616 | |
| | |
Citigroup, Inc. | | | 4,100 | | | | 294,626 | |
| | |
Discover Financial Services | | | 6,597 | | | | 529,475 | |
| | |
Enterprise Financial Services Corp. | | | 2,000 | | | | 87,600 | |
| | |
Erie Indemnity Co., Class A1 | | | 2,000 | | | | 368,540 | |
| | |
Essent Group, Ltd. | | | 7,148 | | | | 372,339 | |
| | |
Everest Re Group, Ltd. (Bermuda) | | | 2,200 | | | | 565,598 | |
| | |
First Defiance Financial Corp. | | | 2,962 | | | | 91,585 | |
| | |
First Interstate BancSystem, Inc., Class A | | | 4,099 | | | | 171,994 | |
| | |
Houlihan Lokey, Inc. | | | 763 | | | | 36,059 | |
| | |
JPMorgan Chase & Co. | | | 6,852 | | | | 855,952 | |
| | |
SEI Investments Co. | | | 1,319 | | | | 79,035 | |
| | |
SunTrust Banks, Inc. | | | 3,197 | | | | 218,483 | |
| | |
Wells Fargo & Co. | | | 1,990 | | | | 102,744 | |
| | |
Total Financials | | | | | | | 9,753,876 | |
| | |
Health Care - 14.0% | | | | | | | | |
| | |
Agilent Technologies, Inc. | | | 1,239 | | | | 93,854 | |
| | |
Amgen, Inc. | | | 6,211 | | | | 1,324,496 | |
| | |
Anika Therapeutics, Inc.* | | | 9,000 | | | | 633,510 | |
| | |
Atrion Corp. | | | 251 | | | | 211,701 | |
| | |
Biogen, Inc.* | | | 3,415 | | | | 1,020,095 | |
| | |
Cardiovascular Systems, Inc.* | | | 6,232 | | | | 277,449 | |
| | |
Centene Corp.* | | | 20,094 | | | | 1,066,589 | |
| | |
Charles River Laboratories International, Inc.* | | | 5,811 | | | | 755,314 | |
| | |
Haemonetics Corp.* | | | 570 | | | | 68,816 | |
| | |
Horizon Therapeutics PLC* | | | 4,155 | | | | 120,121 | |
| | |
IDEXX Laboratories, Inc.* | | | 353 | | | | 100,609 | |
The accompanying notes are an integral part of these financial statements.
7
|
AMG FQ Tax-Managed U.S. Equity Fund Schedule of Portfolio Investments(continued) |
| | | | | | | | |
| | | Shares | | | Value | |
| | |
Health Care - 14.0%(continued) | | | | | | | | |
| | |
Johnson & Johnson | | | 4,713 | | | | $622,304 | |
| | |
McKesson Corp. | | | 1,199 | | | | 159,467 | |
| | |
Merck & Co., Inc. | | | 932 | | | | 80,767 | |
| | |
NextGen Healthcare, Inc.* | | | 1,526 | | | | 25,797 | |
| | |
OraSure Technologies, Inc.* | | | 9,021 | | | | 77,039 | |
| | |
Pfizer, Inc. | | | 5,762 | | | | 221,088 | |
| | |
The Providence Service Corp.* | | | 3,524 | | | | 225,078 | |
| | |
Simulations Plus, Inc. | | | 1,181 | | | | 41,819 | |
| | |
UnitedHealth Group, Inc. | | | 8,147 | | | | 2,058,747 | |
| | |
Voyager Therapeutics, Inc.* | | | 1,237 | | | | 19,037 | |
| | |
WellCare Health Plans, Inc.* | | | 2,003 | | | | 594,090 | |
| | |
Total Health Care | | | | | | | 9,797,787 | |
| | |
Industrials - 9.5% | | | | | | | | |
| | |
Alaska Air Group, Inc. | | | 17,345 | | | | 1,204,263 | |
| | |
Allison Transmission Holdings, Inc. | | | 22,521 | | | | 982,141 | |
| | |
Atkore International Group, Inc.* | | | 1,047 | | | | 36,331 | |
| | |
The Boeing Co. | | | 231 | | | | 78,519 | |
| | |
Brady Corp., Class A | | | 478 | | | | 26,931 | |
| | |
BWX Technologies, Inc.1 | | | 20,825 | | | | 1,209,932 | |
| | |
Delta Air Lines, Inc. | | | 2,728 | | | | 150,258 | |
| | |
HEICO Corp., Class A | | | 387 | | | | 36,869 | |
| | |
Herman Miller, Inc. | | | 11,489 | | | | 534,238 | |
| | |
Huntington Ingalls Industries, Inc. | | | 5,713 | | | | 1,289,196 | |
| | |
ICF International, Inc. | | | 1,569 | | | | 134,448 | |
| | |
Kimball International, Inc., Class B | | | 1,313 | | | | 26,733 | |
| | |
Rush Enterprises, Inc., Class B | | | 2,678 | | | | 114,940 | |
| | |
Southwest Airlines Co. | | | 4,500 | | | | 252,585 | |
| | |
UniFirst Corp. | | | 3,000 | | | | 602,520 | |
| | |
Total Industrials | | | | | | | 6,679,904 | |
| | |
Information Technology - 23.4% | | | | | | | | |
| | |
Appfolio, Inc., Class A*,1 | | | 2,427 | | | | 235,977 | |
| | |
Apple, Inc. | | | 11,616 | | | | 2,889,596 | |
| | |
CACI International, Inc., Class A* | | | 2,375 | | | | 531,406 | |
| | |
CDW Corp. | | | 8,410 | | | | 1,075,723 | |
| | |
Ciena Corp.* | | | 4,571 | | | | 169,676 | |
| | |
Cisco Systems, Inc. | | | 2,865 | | | | 136,116 | |
| | |
Diodes, Inc.*,1 | | | 1,266 | | | | 59,059 | |
| | |
FormFactor, Inc.* | | | 6,751 | | | | 147,374 | |
| | |
Intel Corp. | | | 3,246 | | | | 183,496 | |
| | |
Lumentum Holdings, Inc.* | | | 2,363 | | | | 148,066 | |
| | |
Mastercard, Inc., Class A | | | 9,392 | | | | 2,599,799 | |
| | |
Micron Technology, Inc.* | | | 518 | | | | 24,631 | |
| | | | | | | | |
| | | Shares | | | Value | |
| | |
Microsoft Corp. | | | 21,934 | | | | $3,144,678 | |
| | |
Onto Innovation, Inc.* | | | 9,327 | | | | 300,329 | |
| | |
Oracle Corp. | | | 583 | | | | 31,768 | |
| | |
PC Connection, Inc. | | | 1,741 | | | | 85,030 | |
| | |
Progress Software Corp. | | | 26,045 | | | | 1,038,675 | |
| | |
QAD, Inc., Class A | | | 9,851 | | | | 457,874 | |
| | |
salesforce.com, Inc.* | | | 1,742 | | | | 272,606 | |
| | |
ServiceNow, Inc.* | | | 326 | | | | 80,607 | |
| | |
Visa, Inc., Class A | | | 15,446 | | | | 2,762,672 | |
| | |
Total Information Technology | | | | | | | 16,375,158 | |
| | |
Materials - 2.4% | | | | | | | | |
| | |
AdvanSix, Inc.* | | | 4,109 | | | | 93,521 | |
| | |
Graphic Packaging Holding Co. | | | 25,299 | | | | 396,182 | |
| | |
LyondellBasell Industries NV, Class A | | | 7,700 | | | | 690,690 | |
| | |
NewMarket Corp. | | | 156 | | | | 75,737 | |
| | |
Stepan Co. | | | 4,307 | | | | 420,880 | |
| | |
Total Materials | | | | | | | 1,677,010 | |
| | |
Real Estate - 3.7% | | | | | | | | |
| | |
American Homes 4 Rent, Class A, REIT | | | 11,900 | | | | 314,993 | |
| | |
American Tower Corp., REIT | | | 481 | | | | 104,896 | |
| | |
Apartment Investment & Management Co., Class A, REIT | | | 8,650 | | | | 474,712 | |
| | |
Douglas Emmett, Inc., REIT | | | 2,450 | | | | 106,134 | |
| | |
Equity Commonwealth, REIT | | | 1,867 | | | | 60,080 | |
| | |
PS Business Parks, Inc., REIT | | | 4,658 | | | | 841,002 | |
| | |
Sunstone Hotel Investors, Inc., REIT | | | 50,749 | | | | 685,619 | |
| | |
Total Real Estate | | | | | | | 2,587,436 | |
| | |
Utilities - 2.6% | | | | | | | | |
| | |
American Water Works Co., Inc. | | | 4,551 | | | | 561,002 | |
| | |
Evergy, Inc. | | | 304 | | | | 19,429 | |
| | |
Hawaiian Electric Industries, Inc.1 | | | 10,503 | | | | 474,210 | |
| | |
IDACORP, Inc. | | | 168 | | | | 18,080 | |
| | |
OGE Energy Corp. | | | 16,509 | | | | 710,878 | |
| | |
Total Utilities | | | | | | | 1,783,599 | |
| | |
Total Common Stocks
(Cost $36,655,724) | | | | | | | 69,152,660 | |
| | |
| | | Principal
Amount | | | | |
| | |
Short-Term Investments - 1.6% | | | | | | | | |
| |
Joint Repurchase Agreements - 0.4%2 | | | | | |
| | |
Credit Suisse AG, dated 10/31/19, due 11/01/19, 1.730% total to be received $258,657 (collateralized by various U.S. Treasuries, 0.125% - 3.125%, 11/15/22 - 05/15/47, totaling $263,818) | | | $258,645 | | | | 258,645 | |
The accompanying notes are an integral part of these financial statements.
8
|
AMG FQ Tax-Managed U.S. Equity Fund Schedule of Portfolio Investments(continued) |
| | | | | | | | |
| | | Shares | | | Value | |
| |
Other Investment Companies - 1.2% | | | | | |
| | |
Dreyfus Government Cash Management Fund, Institutional Shares, 1.73%3 | | | 281,737 | | | | $281,737 | |
| | |
Dreyfus Institutional Preferred Government Money Market Fund, Institutional Shares, 1.77%3 | | | 281,737 | | | | 281,737 | |
| | |
JPMorgan U.S. Government Money Market Fund, IM Shares, 1.75%3 | | | 290,274 | | | | 290,274 | |
| | |
Total Other Investment Companies | | | | | | | 853,748 | |
| | |
Total Short-Term Investments | | | | | | | | |
(Cost $1,112,393) | | | | | | | 1,112,393 | |
| | | | | | | | |
| | | | | | Value | |
| | |
Total Investments - 100.4% | | | | | | | | |
(Cost $37,768,117) | | | | | | | $70,265,053 | |
| | |
Other Assets, less Liabilities - (0.4)% | | | | | | | (309,410 | ) |
| | |
Net Assets - 100.0% | | | | | | | $69,955,643 | |
| * | Non-income producing security. |
| 1 | Some of these securities, amounting to $4,054,457 or 5.8% of net assets, were out on loan to various borrowers and are collateralized by cash and various U.S. Treasury Obligations. See Note 4 of Notes to Financial Statements. |
| 2 | Cash collateral received for securities lending activity was invested in these joint repurchase agreements. |
| 3 | Yield shown represents the October 31, 2019, seven day average yield, which refers to the sum of the previous seven days’ dividends paid, expressed as an annual percentage. |
REIT Real Estate Investment Trust
The following table summarizes the inputs used to value the Fund’s investments by the fair value hierarchy levels as of October 31, 2019:
| | | | | | | | | | | | | | | | |
| | | Level 1 | | | Level 2 | | | Level 3 | | | Total | |
Investments in Securities | | | | | | | | | | | | | | | | |
| | | | |
Common Stocks† | | $ | 69,152,660 | | | | — | | | | — | | | $ | 69,152,660 | |
| | | | |
Short-Term Investments | | | | | | | | | | | | | | | | |
| | | | |
Joint Repurchase Agreements | | | — | | | $ | 258,645 | | | | — | | | | 258,645 | |
| | | | |
Other Investment Companies | | | 853,748 | | | | — | | | | — | | | | 853,748 | |
| | | | | | | | | | | | | | | | |
Total Investments in Securities | | $ | 70,006,408 | | | $ | 258,645 | | | | — | | | $ | 70,265,053 | |
| | | | | | | | | | | | | | | | |
| † | All common stocks held in the Fund are Level 1 securities. For a detailed breakout of common stocks by major industry classification, please refer to the Fund’s Schedule of Portfolio Investments. |
For the fiscal year ended October 31, 2019, there were no transfers in or out of Level 3.
The accompanying notes are an integral part of these financial statements.
9
|
AMG FQ Long-Short Equity Fund Portfolio Manager’s Comments(unaudited) |
| | | | | | | | |
OVERVIEW For the fiscal year ended October 31, 2019, the AMG FQ Long-Short Equity Fund (the “Fund”) Class I shares returned 7.43%, trailing the 13.49% return for its primary benchmark, the Russell 3000® Index, and the 8.10% return of its secondary benchmark, an equally weighted average of the Russell 3000® Index and the ICE BofAML 0-3 Month U.S. Treasury Bill. MARKET REVIEW At the start of the period we identified a mostly resilient market environment. In recent months, however, we observed increasing fragility as the global economy slowed down and demand for safe-haven assets picked up. Despite ongoing uncertainty surrounding trade, the domestic economy held up well, and risk appetite appeared healthy outside of episodic risk shocks. As a result, for most of the period investor behavior aligned with that of recent years: Growth and momentum outperformed, while value struggled. As fragility accumulated, however, we started to observe rotations out of growth and momentum and into value. FUND PERFORMANCE BETA MANAGEMENT Active beta management added value during the period. For most of the fiscal year we kept beta exposure near its long-term target. For two periods, however, we held significant overweight positions, inferring that capital preservation needs had created | | | | an oversold market. In both episodes, the market recovered, and we were rewarded for our additional beta exposure. The first instance was early in the reporting period, when markets experienced frequent selloffs as investors assessed the energy industry, political risks, and global growth. Performance attributed to the heightened exposure to equity markets delivered gains in November, reversed in December, and turned positive again in January. The second period was May/June 2019. Renewed trade tensions prompted selling behavior, and we increased our beta exposure mid-May. Although we were a couple of weeks early, markets rebounded as expected and the trade turned profitable in June. Active beta management is achieved through the use of futures contracts on the S&P 500® Index, as we feel their use is a more efficient implementation methodology. Additionally, swaps on baskets of securities are utilized to gain exposure to individual securities within the Fund’s short portfolio as well as a portion of the long portfolio. While derivatives usage made a notable contribution to the Fund’s overall return, their contribution relative to the use of cash securities was negligible. STOCK SELECTION Throughout the period, we saw limited opportunity for value as a whole but ample opportunity for a trade on specific measures of value. As a result, we held positive exposure to cash flow- and earnings-based value but negative exposure to asset-based value (like book/price). Although we | | | | were correct in assessing which types of value investors would prefer, this positioning left us with modest positive exposure to value generally. This bias worked against performance relative to benchmark, since value sold off for most of the period before finally starting to make a comeback in September 2019. On the other hand, we had strong success through our positive exposure to select growth characteristics, particularly sustained profitability. We also benefited from positive exposure to price and earnings momentum. Momentum delivered significant returns from early 2019 through September, when it crashed amidst the value rally, giving back a portion of earlier gains. OUTLOOK AND POSITIONING As the fiscal year closes, we continue to observe indications of both resilience and fragility in the market environment. Although we still hold positive exposure to growth and momentum, we have reallocated some of our overall risk to select value characteristics in recent months, in response to the building fragility. We continue to prioritize the value spread, however, as we still observe bearish opportunity for traditional forms of value. This commentary reflects the viewpoints of the portfolio manager, First Quadrant, L.P., as of October 31, 2019 and is not intended as a forecast or guarantee of future results, and is subject to change without notice. |
10
|
AMG FQ Long-Short Equity Fund Portfolio Manager’s Comments(continued) |
CUMULATIVE TOTAL RETURN PERFORMANCE
AMG FQ Long-Short Equity Fund’s cumulative total return is based on the daily change in net asset value (NAV), and assumes that all dividends and distributions were reinvested. This graph compares a hypothetical $10,000 investment made in the AMG FQ Long-Short Equity Fund’s Class I shares on October 31, 2009, to a $10,000 investment made in the Russell 3000® Index for the same time period. The graph and table do not reflect the deduction of taxes that a shareholder would pay on a Fund distribution or redemption of shares. The listed returns for the Fund are net of expenses and the returns for the index exclude expenses. Total returns would have been lower had certain expenses not been reduced.
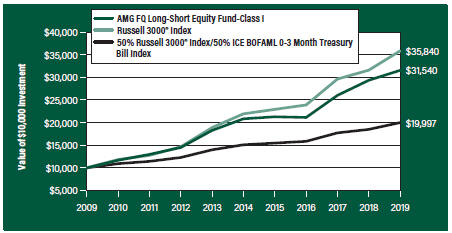
The table below shows the average annual total returns for the AMG FQ Long-Short Equity Fund and the Russell 3000® Index for the same time periods ended October 31, 2019.
| | | | | | | | | | | | | | | | | | | | |
| Average Annual Total Returns1 | | One Year | | | | | | Five
Years | | | | | | Ten Years | |
AMG FQ Long-Short Equity Fund2, 3, 4, 5, 6, 7, 8, 9, 10, 11 | | | | | | | | | | | | | | | | | | | | |
| | | | | |
Class N | | | 7.15% | | | | | | | | 8.33 | % | | | | | | | 11.87% | |
| | | | | |
Class I | | | 7.43% | | | | | | | | 8.64 | % | | | | | | | 12.17% | |
| | | | | |
Russell 3000® Index12 | | | 13.49% | | | | | | | | 10.31 | % | | | | | | | 13.62% | |
| | | | | |
50% Russell 3000® Index/50% ICE BofAML 0-3 Month U.S. Treasury Bill Index13 | | | 8.10% | | | | | | | | 5.78 | % | | | | | | | 7.18% | |
The performance data shown represents past performance. Past performance is not a guarantee of future results. Current performance may be lower or higher than the performance data quoted. The investment return and principal value of an investment will fluctuate so that an investor’s shares, when redeemed, may be worth more or less than their original cost.
Investors should carefully consider the Fund’s investment objectives, risks, charges and expenses before investing. For performance information through the most recent month end, current net asset values per share for the Fund and other information, please call 800.548.4539 or visit our website at amgfunds.com for a free prospectus. Read it carefully before investing or sending money.
Distributed by AMG Distributors, Inc., member FINRA/SIPC.
| 1 | Total return equals income yield plus share price change and assumes reinvestment of all dividends and capital gain distributions. Returns are net of fees and may reflect offsets of Fund expenses as described in the prospectus. No adjustment has been made for taxes payable by shareholders on their reinvested dividends and capital gain distributions. Returns for periods greater than one year are annualized. The listed returns on the Fund are net of expenses and based on the published NAV as of October 31, 2019. All returns are in U.S. dollars ($). |
| | |
| | | 2 From time to time, the Fund’s advisor has waived its fees and/or absorbed Fund expenses, which has resulted in higher returns. 3 The Fund invests in large-capitalization companies that may underperform other stock funds (such as funds that focus on small- and medium-capitalization companies) when stocks of large-capitalization companies are out of favor. 4 The Fund may suffer significant losses on assets that it sells short. Unlike the possible loss on a security that is purchased, there is no limit on the amount of loss on an appreciating security that is sold short. 5 In managing the Fund, the Fund’s subadviser may rely heavily on one or more quantitative models (“Model”) and information and data supplied by third parties (“Data”). When a Model or Data used in managing the Fund contains an error, or is incorrect or incomplete, any investment decision made in reliance on the Model or Data may not produce the desired results and the Fund may realize losses. In addition, any hedging based on a faulty Model or Data may prove to be unsuccessful. 6 The use of leverage in a Fund’s strategy, such as future, swaps and forward commitment transactions, can magnify relatively small market movements into relatively larger losses for the Fund. 7 The Fund is subject to risks associated with investments in small-capitalization companies, such as erratic earnings patterns, competitive conditions, limited earnings history and a reliance on one or a limited number of products. 8 The Fund is subject to risks associated with investments in mid-capitalization companies such as greater price volatility, lower trading volume, and less liquidity than the stocks of larger, more established companies. 9 Active and frequent trading of a fund may result in higher transaction costs and increased tax liability. 10 The Fund is subject to special risk considerations similar to those associated with the direct ownership of real estate. Real estate valuations may be subject to factors such as changing general and local economic, financial, competitive, and environmental conditions. |
| | |
| | | 11 The Fund may invest in derivatives such as options, futures and swaps; the complexity and rapidly changing structure of derivatives markets may increase the possibility of market losses. 12 The Russell 3000® Index is composed of the 3,000 largest U.S. companies as measured by market capitalization, and represents about 98% of the U.S. stock market. Unlike the Fund, the Russell 3000® Index is unmanaged, is not available for investment, and does not incur expenses. |
| | | |
11
|
AMG FQ Long-Short Equity Fund Portfolio Manager’s Comments(continued) |
| | | | | | | | |
13 ICE BofAML 0-3 Month U.S. Treasury Bill Index is comprised of a single issue purchased at the beginning of the month and held for a full month. At the end of the month that issue is sold and rolled into a newly selected issue. The issue selected at each month-end rebalancing is the outstanding | | | | Treasury Bill that matures closest to, but not beyond, three months from the rebalancing date. Unlike the Fund, the ICE BofAML 0-3 Month U.S. Treasury Bill Index is unmanaged, is not available for investment and does not incur expenses. | | | | The Russell 3000® Index is a trademark of the London Stock Exchange Group companies. Not FDIC insured, nor bank guaranteed. May lose value. |
12
|
AMG FQ Long-Short Equity Fund Fund Snapshots(unaudited) October 31, 2019 |
PORTFOLIO BREAKDOWN
| | | | | | | | | | | | | | | | | | | | | | | | | |
| Sector | | Long
Exposure1, 2 | | | | Short
Exposure1, 2 | | | | Net
Exposure1, 2 |
| | | | | | |
Financials | | | | 21.1 | % | | | | | | | | | (23.2 | )% | | | | | | | | | (2.1 | ) |
| | | | | | |
Real Estate | | | | 18.8 | | | | | | | | | | (21.1 | ) | | | | | | | | | (2.3 | ) |
| | | | | | |
Industrials | | | | 18.1 | | | | | | | | | | (18.8 | ) | | | | | | | | | (0.7 | ) |
| | | | | | |
Information Technology | | | | 11.8 | | | | | | | | | | (6.6 | ) | | | | | | | | | 5.2 | |
| | | | | | |
Consumer Discretionary | | | | 11.8 | | | | | | | | | | (6.7 | ) | | | | | | | | | 5.1 | |
| | | | | | |
Utilities | | | | 8.5 | | | | | | | | | | (3.5 | ) | | | | | | | | | 5.0 | |
| | | | | | |
Consumer Staples | | | | 5.3 | | | | | | | | | | (2.9 | ) | | | | | | | | | 2.4 | |
| | | | | | |
Materials | | | | 5.0 | | | | | | | | | | (3.7 | ) | | | | | | | | | 1.3 | |
| | | | | | |
Health Care | | | | 4.4 | | | | | | | | | | (5.1 | ) | | | | | | | | | (0.7 | ) |
| | | | | | |
Energy | | | | 3.1 | | | | | | | | | | (3.7 | ) | | | | | | | | | 0.6 | |
| | | | | | |
Communication Services | | | | 2.5 | | | | | | | | | | (3.9 | ) | | | | | | | | | (1.4 | ) |
| | | | | | |
Short Term Investments | | | | 26.9 | | | | | | | | | | — | | | | | | | | | | 26.9 | |
| | | | | | |
Other Assets3 | | | | | | | | | | | | | | — | | | | | | | | | | 60.7 | |
| 1 | As a percentage of net assets. |
| 2 | Includes notional market value of constituents in Equity Basket Swaps. |
| 3 | Includes collateral for swaps. |
TOP TEN HOLDINGS
| | |
| Security Name | | % of
Net Assets |
| | |
LKQ Corp. | | 2.1 |
| | |
Essent Group, Ltd. | | 2.1 |
| | |
UDR, Inc.1 | | 2.0 |
| | |
First American Financial Corp. | | 2.0 |
| | |
SEI Investments Co.1 | | 2.0 |
| | |
Gentex Corp.1 | | 2.0 |
| | |
American Financial Group, Inc. | | 2.0 |
| | |
OGE Energy Corp. | | 2.0 |
| | |
IDACORP, Inc. | | 2.0 |
| | |
MGIC Investment Corp. | | 2.0 |
| | | |
| | |
Top Ten as a Group | | 20.2 |
| | |
| | 1 | Underlying security in Equity Swap Basket. % of Net Assets calculated using notional market value. |
Because a fund’s strategy may result in multiple investments in particular sectors of the economy, its performance may depend on the performance of those sectors and may fluctuate more widely than investments diversified across more sectors. For additional information on these and other risk considerations, please see the Fund’s prospectus.
Any sectors, industries, or securities discussed should not be perceived as investment recommendations. Mention of a specific security should not be considered a recommendation to buy or solicitation to sell that security. Specific securities mentioned in this report may have been sold from the Fund’s portfolio of investments by the time you receive this report.
13
|
AMG FQ Long-Short Equity Fund Schedule of Portfolio Investments October 31, 2019 |
| | | | | | | | |
| | | Shares | | | Value | |
| | |
Common Stocks - 65.8% | | | | | | | | |
| | |
Communication Services - 2.3% | | | | | | | | |
| | |
Activision Blizzard, Inc.1 | | | 9,737 | | | | $545,564 | |
| | |
Cogent Communications Holdings, Inc.1 | | | 12,008 | | | | 704,149 | |
| | |
DHI Group, Inc.* | | | 36,371 | | | | 131,663 | |
| | |
Electronic Arts, Inc.* | | | 8,326 | | | | 802,626 | |
| | |
Glu Mobile, Inc.* | | | 7,714 | | | | 45,744 | |
| | |
TechTarget, Inc.* | | | 1,114 | | | | 27,182 | |
| | |
Total Communication Services | | | | | | | 2,256,928 | |
| | |
Consumer Discretionary - 6.5% | | | | | | | | |
| | |
Choice Hotels International, Inc. | | | 697 | | | | 61,671 | |
| | |
eBay, Inc.1 | | | 46,744 | | | | 1,647,726 | |
| | |
Hanesbrands, Inc.2 | | | 8,485 | | | | 129,057 | |
| | |
Hibbett Sports, Inc.* | | | 338 | | | | 8,065 | |
| | |
Lennar Corp., Class B | | | 172 | | | | 8,087 | |
| | |
LKQ Corp.* | | | 61,668 | | | | 2,096,095 | |
| | |
Malibu Boats, Inc., Class A* | | | 14,953 | | | | 487,767 | |
| | |
Marriott International, Inc., Class A | | | 2,212 | | | | 279,929 | |
| | |
Meritage Homes Corp.* | | | 4,976 | | | | 358,720 | |
| | |
NIKE, Inc., Class B | | | 6,749 | | | | 604,373 | |
| | |
Tapestry, Inc. | | | 697 | | | | 18,024 | |
| | |
Taylor Morrison Home Corp., Class A* | | | 26,726 | | | | 669,486 | |
| | |
Total Consumer Discretionary | | | | | | | 6,369,000 | |
| | |
Consumer Staples - 4.6% | | | | | | | | |
| | |
Central Garden & Pet Co.* | | | 322 | | | | 9,667 | |
| | |
Colgate-Palmolive Co. | | | 144 | | | | 9,878 | |
| | |
Keurig Dr Pepper, Inc.2 | | | 35,120 | | | | 988,979 | |
| | |
Lifevantage Corp.* | | | 676 | | | | 9,167 | |
| | |
Performance Food Group Co.*,1 | | | 22,849 | | | | 973,596 | |
| | |
The Simply Good Foods Co.* | | | 13,393 | | | | 328,664 | |
| | |
United Natural Foods, Inc.* | | | 30,102 | | | | 225,765 | |
| | |
US Foods Holding Corp.*,1 | | | 48,467 | | | | 1,922,686 | |
| | |
Total Consumer Staples | | | | | | | 4,468,402 | |
| | |
Energy - 2.9% | | | | | | | | |
| | |
Apergy Corp.* | | | 6,923 | | | | 174,252 | |
| | |
ConocoPhillips1 | | | 12,542 | | | | 692,318 | |
| | |
Devon Energy Corp. | | | 17,470 | | | | 354,291 | |
| | |
FTS International, Inc.* | | | 5,734 | | | | 8,716 | |
| | |
HollyFrontier Corp. | | | 21,201 | | | | 1,164,783 | |
| | |
Kosmos Energy, Ltd. | | | 1,562 | | | | 9,684 | |
| | |
Laredo Petroleum, Inc.* | | | 46,638 | | | | 110,066 | |
| | |
Parsley Energy, Inc., Class A | | | 2,496 | | | | 39,462 | |
| | | | | | | | |
| | | Shares | | | Value | |
| | |
TETRA Technologies, Inc.* | | | 147,571 | | | | $250,871 | |
| | |
Total Energy | | | | | | | 2,804,443 | |
| | |
Financials - 13.4% | | | | | | | | |
| | |
Ally Financial, Inc. | | | 10,119 | | | | 309,945 | |
| | |
American Financial Group, Inc.1 | | | 18,858 | | | | 1,961,986 | |
| | |
AXA Equitable Holdings, Inc. | | | 7,268 | | | | 156,989 | |
| | |
Curo Group Holdings Corp.* | | | 1,146 | | | | 16,033 | |
| | |
Enova International, Inc.* | | | 14,813 | | | | 347,957 | |
| | |
Essent Group, Ltd.1 | | | 39,040 | | | | 2,033,594 | |
| | |
Evercore, Inc., Class A | | | 219 | | | | 16,127 | |
| | |
Farmers National Banc Corp. | | | 2,035 | | | | 30,362 | |
| | |
First American Financial Corp.1 | | | 32,132 | | | | 1,985,115 | |
| | |
First Hawaiian, Inc. | | | 8,416 | | | | 230,009 | |
| | |
MGIC Investment Corp.1 | | | 141,959 | | | | 1,946,258 | |
| | |
National General Holdings Corp. | | | 53,417 | | | | 1,138,850 | |
| | |
NMI Holdings, Inc., Class A* | | | 14,978 | | | | 438,107 | |
| | |
Principal Financial Group, Inc. | | | 6,890 | | | | 367,788 | |
| | |
Pzena Investment Management, Inc., Class A | | | 16,837 | | | | 139,747 | |
| | |
Umpqua Holdings Corp.1 | | | 121,257 | | | | 1,918,286 | |
| | |
Total Financials | | | | | | | 13,037,153 | |
| | |
Health Care - 2.8% | | | | | | | | |
| | |
Biogen, Inc.*,1 | | | 5,352 | | | | 1,598,696 | |
| | |
HealthEquity, Inc.* | | | 2,269 | | | | 128,856 | |
| | |
Humana, Inc. | | | 33 | | | | 9,709 | |
| | |
Ionis Pharmaceuticals, Inc.*,2 | | | 2,664 | | | | 148,438 | |
| | |
Masimo Corp.* | | | 87 | | | | 12,684 | |
| | |
Medpace Holdings, Inc.*,2 | | | 11 | | | | 810 | |
| | |
Novocure, Ltd. (Jersey)* | | | 1,267 | | | | 90,768 | |
| | |
Puma Biotechnology, Inc.* | | | 1,412 | | | | 9,602 | |
| | |
Vertex Pharmaceuticals, Inc.* | | | 2,952 | | | | 577,057 | |
| | |
Voyager Therapeutics, Inc.* | | | 11,178 | | | | 172,029 | |
| | |
Total Health Care | | | | | | | 2,748,649 | |
| | |
Industrials - 8.6% | | | | | | | | |
| | |
Allison Transmission Holdings, Inc.1 | | | 43,017 | | | | 1,875,971 | |
| | |
Atkore International Group, Inc.*,1 | | | 25,335 | | | | 879,124 | |
| | |
Builders FirstSource, Inc.* | | | 26,222 | | | | 592,879 | |
| | |
Carlisle Cos., Inc. | | | 10,537 | | | | 1,604,469 | |
| | |
HD Supply Holdings, Inc.* | | | 23,838 | | | | 942,555 | |
| | |
HNI Corp. | | | 12,220 | | | | 464,360 | |
| | |
JetBlue Airways Corp.*,1 | | | 84,116 | | | | 1,623,439 | |
| | |
KAR Auction Services, Inc.2 | | | 2,121 | | | | 52,728 | |
| | |
Knoll, Inc. | | | 8,715 | | | | 233,039 | |
The accompanying notes are an integral part of these financial statements.
14
|
AMG FQ Long-Short Equity Fund Schedule of Portfolio Investments(continued) |
| | | | | | | | |
| | | Shares | | | Value | |
| | |
Industrials - 8.6%(continued) | | | | | | | | |
| | |
Resideo Technologies, Inc.* | | | 14,084 | | | | $134,221 | |
| | |
Total Industrials | | | | | | | 8,402,785 | |
| | |
Information Technology - 6.7% | | | | | | | | |
| | |
Aspen Technology, Inc.*,1 | | | 14,131 | | | | 1,626,619 | |
| | |
Benchmark Electronics, Inc. | | | 2,873 | | | | 97,395 | |
| | |
CommVault Systems, Inc.* | | | 5,280 | | | | 262,258 | |
| | |
Enphase Energy, Inc.* | | | 387 | | | | 7,519 | |
| | |
Intuit, Inc.1 | | | 5,354 | | | | 1,378,655 | |
| | |
Micron Technology, Inc.* | | | 26,321 | | | | 1,251,563 | |
| | |
National Instruments Corp. | | | 2,302 | | | | 95,280 | |
| | |
NortonLifeLock, Inc. | | | 31,770 | | | | 726,898 | |
| | |
SMART Global Holdings, Inc.* | | | 2,611 | | | | 77,547 | |
| | |
SPS Commerce, Inc.* | | | 187 | | | | 9,868 | |
| | |
VeriSign, Inc.* | | | 5,353 | | | | 1,017,177 | |
| | |
Total Information Technology | | | | | | | 6,550,779 | |
| | |
Materials - 2.9% | | | | | | | | |
| | |
Kraton Corp.* | | | 2,001 | | | | 44,862 | |
| | |
PolyOne Corp.1 | | | 6,893 | | | | 220,921 | |
| | |
Silgan Holdings, Inc.1 | | | 62,820 | | | | 1,932,971 | |
| | |
Steel Dynamics, Inc. | | | 19,697 | | | | 598,001 | |
| | |
Total Materials | | | | | | | 2,796,755 | |
| | |
Real Estate - 8.3% | | | | | | | | |
| | |
Brixmor Property Group, Inc., REIT | | | 3,040 | | | | 66,941 | |
| | |
Douglas Emmett, Inc., REIT1 | | | 43,052 | | | | 1,865,013 | |
| | |
First Industrial Realty Trust, Inc.,
REIT1 | | | 44,264 | | | | 1,863,957 | |
| | |
Monmouth Real Estate Investment Corp., REIT | | | 26,902 | | | | 405,682 | |
| | |
RE/MAX Holdings, Inc., Class A | | | 13,613 | | | | 455,355 | |
| | |
The RMR Group, Inc., Class A1 | | | 32,001 | | | | 1,548,848 | |
| | |
Sunstone Hotel Investors, Inc.,
REIT1 | | | 141,971 | | | | 1,918,028 | |
| | |
Total Real Estate | | | | | | | 8,123,824 | |
| | |
Utilities - 6.8% | | | | | | | | |
| | |
AES Corp. | | | 44,159 | | | | 752,911 | |
| | | | | | | | |
| | | Shares | | | Value | |
| | |
Atlantic Power Corp.*,1 | | | 511,154 | | | | $1,190,989 | |
| | |
Hawaiian Electric Industries, Inc. | | | 13,169 | | | | 594,580 | |
| | |
IDACORP, Inc.1 | | | 18,093 | | | | 1,947,169 | |
| | |
OGE Energy Corp.1 | | | 45,481 | | | | 1,958,412 | |
| | |
Portland General Electric Co. | | | 3,730 | | | | 212,162 | |
| | |
Total Utilities | | | | | | | 6,656,223 | |
| | |
Total Common Stocks | | | | | | | | |
(Cost $61,552,001) | | | | | | | 64,214,941 | |
| | |
| | | Principal
Amount | | | | |
| | |
Short-Term Investments - 26.9% | | | | | | | | |
| |
Joint Repurchase Agreements - 0.3%3 | | | | | |
| | |
Credit Suisse AG, dated 10/31/19, due 11/01/19, 1.730% total to be received $291,259 (collateralized by various U.S. Treasuries, 0.125% - 3.125%, 11/15/22 - 05/15/47, totaling $297,070) | | | $291,245 | | | | 291,245 | |
| | |
| | | Shares | | | | |
| |
Other Investment Companies - 26.6% | | | | | |
| | |
Morgan Stanley Institutional Liquidity Funds Prime Portfolio, Institutional Shares, 1.90%4 | | | 5,972,845 | | | | 5,977,623 | |
| | |
Dreyfus Government Cash Management Fund, Institutional Shares, 1.73%4 | | | 6,611,266 | | | | 6,611,266 | |
| | |
Dreyfus Institutional Preferred Government Money Market Fund, Institutional Shares, 1.77%4 | | | 6,611,265 | | | | 6,611,265 | |
| | |
JPMorgan U.S. Government Money Market Fund, IM Shares, 1.75%4 | | | 6,811,607 | | | | 6,811,607 | |
| | |
Total Other Investment Companies | | | | | | | 26,011,761 | |
| | |
Total Short-Term Investments | | | | | | | | |
(Cost $26,301,952) | | | | | | | 26,303,006 | |
| | |
Total Investments - 92.7% | | | | | | | | |
(Cost $87,853,953) | | | | | | | 90,517,947 | |
| | |
Derivatives - 0.9%5 | | | | | | | 912,660 | |
| | |
Other Assets, less Liabilities - 6.4% | | | | | | | 6,193,228 | |
| | |
Net Assets - 100.0% | | | | | | | $97,623,835 | |
| * | Non-income producing security. |
| 1 | Security position is either entirely or partially held in a segregated account as collateral for swaps and futures contracts. As of October 31, 2019, value of securities held in the segregated account was $25,891,172. |
| 2 | Some of these securities, amounting to $788,425 or 0.8% of net assets, were out on loan to various borrowers and are collateralized by cash and various U.S. Treasury Obligations. See Note 4 of Notes to Financial Statements. |
| 3 | Cash collateral received for securities lending activity was invested in these joint repurchase agreements. |
| 4 | Yield shown represents the October 31, 2019, seven day average yield, which refers to the sum of the previous seven days’ dividends paid, expressed as an annual percentage. |
| 5 | Includes Futures Contracts and Over-the-counter total return basket swaps. Please refer to the Futures Contracts and Over-the-counter total return basket swap tables for details. |
REIT Real Estate Investment Trust
The accompanying notes are an integral part of these financial statements.
15
|
AMG FQ Long-Short Equity Fund Schedule of Portfolio Investments(continued) |
Open Futures Contracts
| | | | | | | | | | | | | | | | | | |
| Description | | Currency | | Number of
Contracts | | Position | | Expiration
Date | | | Current
Notional
Amount | | | Value and
Unrealized
Gain/(Loss) | |
S&P 500 E-Mini FUT Index | | USD | | 323 | | Long | | | 12/20/19 | | | $ | 49,028,170 | | | | $809,046 | |
Over-the-counter total return basket swap
| | | | | | | | | | | | | | |
| Counterparty | | Description | | Notional | | | Termination
Date | | | Value | |
Morgan Stanley & Co. | | The Fund receives or pays the total return on a portfolio of long positions and receives or pays the 1-Month LIBOR (+/- a spread). | | | $43,878,805 | | | | 8/7/2020 | | | | $(185,307) | |
Components of over-the-counter total return basket swap
| | | | | | | | | | | | | | | | |
| Reference Entity | | Shares | | | Notional
Value | | | Net Unrealized
Appreciation/
(Depreciation) | | | % of Notional
Market Value | |
Aaron’s, Inc. | | | 952 | | | | $72,933 | | | | $(1,599 | ) | | | 0.2 | |
Alexander & Baldwin, Inc. | | | 40,859 | | | | 1,002,680 | | | | (42,085 | ) | | | 2.2 | |
Altice USA, Inc., Class A | | | 4,670 | | | | 142,331 | | | | 2,206 | | | | 0.3 | |
Altisource Portfolio Solutions, S.A. (Luxembourg) | | | 969 | | | | 17,064 | | | | 184 | | | | 0.0 | # |
American Public Education, Inc. | | | 7,209 | | | | 156,980 | | | | (400 | ) | | | 0.4 | |
Apartment Investment & Management Co., Class A | | | 19,355 | | | | 1,051,946 | | | | 10,256 | | | | 2.4 | |
Apple Hospitality REIT, Inc. | | | 77,023 | | | | 1,263,947 | | | | 5,392 | | | | 2.9 | |
Avangrid, Inc. | | | 27,363 | | | | 1,348,728 | | | | 20,790 | | | | 3.1 | |
Barrett Business Services, Inc. | | | 221 | | | | 19,729 | | | | (340 | ) | | | 0.0 | # |
Cadence Design Systems, Inc. | | | 12,065 | | | | 807,631 | | | | (19,183 | ) | | | 1.8 | |
Carbonite, Inc. | | | 8,122 | | | | 142,135 | | | | (2,680 | ) | | | 0.3 | |
Cavco Industries, Inc. | | | 322 | | | | 62,800 | | | | (1,088 | ) | | | 0.1 | |
Central Garden & Pet Co., Class A | | | 15,740 | | | | 447,016 | | | | (1,889 | ) | | | 1.0 | |
Ciena Corp. | | | 13,200 | | | | 485,496 | | | | 4,488 | | | | 1.1 | |
Commercial Vehicle Group, Inc. | | | 11,102 | | | | 83,820 | | | | (2,887 | ) | | | 0.2 | |
Continental Building Products, Inc. | | | 62,552 | | | | 1,875,084 | | | | (4,153 | ) | | | 4.3 | |
Curtiss-Wright Corp. | | | 6,931 | | | | 903,878 | | | | 33,540 | | | | 2.1 | |
Cutera, Inc. | | | 17,577 | | | | 544,887 | | | | 8,788 | | | | 1.3 | |
Deckers Outdoor Corp. | | | 599 | | | | 90,551 | | | | 1,036 | | | | 0.2 | |
Denbury Resources, Inc. | | | 15,131 | | | | 15,585 | | | | (483 | ) | | | 0.0 | # |
Discover Financial Services | | | 4,928 | | | | 399,907 | | | | (4,386 | ) | | | 0.9 | |
Discovery, Inc., Class C | | | 1,226 | | | | 30,681 | | | | 264 | | | | 0.1 | |
Eagle Pharmaceuticals, Inc. | | | 613 | | | | 38,870 | | | | (435 | ) | | | 0.1 | |
EastGroup Properties, Inc. | | | 6,321 | | | | 848,910 | | | | (2,212 | ) | | | 1.9 | |
Employers Holdings, Inc. | | | 28,408 | | | | 1,207,340 | | | | (4,545 | ) | | | 2.8 | |
EOG Resources, Inc. | | | 2,497 | | | | 173,841 | | | | (774 | ) | | | 0.4 | |
F5 Networks, Inc. | | | 6,604 | | | | 949,457 | | | | 2,047 | | | | 2.2 | |
Financial Institutions, Inc. | | | 2,167 | | | | 68,651 | | | | (542 | ) | | | 0.2 | |
The accompanying notes are an integral part of these financial statements.
16
|
AMG FQ Long-Short Equity Fund Schedule of Portfolio Investments(continued) |
Components of over-the-counter total return basket swap (continued)
| | | | | | | | | | | | | | | | |
| Reference Entity | | Shares | | | Notional Value | | | Net Unrealized Appreciation/ (Depreciation) | | | % of Notional Market Value | |
First Defiance Financial Corp. | | | 4,319 | | | | $132,161 | | | | $1,382 | | | | 0.3 | |
Flagstar Bancorp, Inc. | | | 15,357 | | | | 556,384 | | | | 1,689 | | | | 1.3 | |
Fortinet, Inc. | | | 288 | | | | 23,795 | | | | (305 | ) | | | 0.1 | |
Four Corners Property Trust, Inc. | | | 14,914 | | | | 426,272 | | | | 1,014 | | | | 1.0 | |
frontdoor, Inc. | | | 1,487 | | | | 71,049 | | | | 669 | | | | 0.2 | |
Gentex Corp. | | | 70,028 | | | | 1,981,092 | | | | (16,807 | ) | | | 4.5 | |
Graco, Inc. | | | 15,567 | | | | 713,747 | | | | (10,119 | ) | | | 1.6 | |
HEICO Corp., Class A | | | 2,895 | | | | 271,551 | | | | 4,256 | | | | 0.6 | |
Herman Miller, Inc. | | | 1,500 | | | | 70,879 | | | | (1,129 | ) | | | 0.2 | |
HMS Holdings Corp. | | | 577 | | | | 19,168 | | | | (306 | ) | | | 0.0 | # |
Hologic, Inc. | | | 7,459 | | | | 358,935 | | | | 1,409 | | | | 0.8 | |
Host Hotels & Resorts, Inc., REIT | | | 117,360 | | | | 1,942,965 | | | | (19,435 | ) | | | 4.4 | |
HP, Inc. | | | 44,835 | | | | 789,993 | | | | (11,209 | ) | | | 1.8 | |
Hubbell, Inc. | | | 4,202 | | | | 598,464 | | | | (3,041 | ) | | | 1.4 | |
Ironwood Pharmaceuticals, Inc. | | | 9,237 | | | | 87,105 | | | | 5,635 | | | | 0.2 | |
Keysight Technologies, Inc. | | | 1,034 | | | | 106,376 | | | | (2,035 | ) | | | 0.2 | |
Kimball International, Inc., Class B | | | 31,998 | | | | 659,479 | | | | (8,000 | ) | | | 1.5 | |
Korn Ferry | | | 389 | | | | 14,412 | | | | (140 | ) | | | 0.0 | # |
LSC Communications, Inc. | | | 40,670 | | | | 42,703 | | | | (3,050 | ) | | | 0.1 | |
Marcus & Millichap, Inc. | | | 9,090 | | | | 324,967 | | | | (273 | ) | | | 0.7 | |
Masco Corp. | | | 16,990 | | | | 785,278 | | | | 510 | | | | 1.8 | |
MasterCraft Boat Holdings, Inc. | | | 37,327 | | | | 640,905 | | | | (53,004 | ) | | | 1.3 | |
MAXIMUS, Inc. | | | 12,971 | | | | 1,000,064 | | | | (4,670 | ) | | | 2.3 | |
Mesa Air Group, Inc. | | | 42,943 | | | | 333,667 | | | | (6,441 | ) | | | 0.8 | |
Michaels Cos., Inc.[The] | | | 5,985 | | | | 54,344 | | | | (2,095 | ) | | | 0.1 | |
Minerals Technologies, Inc. | | | 3,303 | | | | 171,327 | | | | (7,993 | ) | | | 0.4 | |
Molina Healthcare, Inc. | | | 1,176 | | | | 145,683 | | | | (7,338 | ) | | | 0.3 | |
Morningstar, Inc. | | | 2 | | | | 312 | | | | 11 | | | | 0.0 | # |
NeoPhotonics Corp. | | | 7,927 | | | | 48,355 | | | | 3,805 | | | | 0.1 | |
NewMarket Corp. | | | 4,015 | | | | 1,937,388 | | | | 11,854 | | | | 4.5 | |
NextGen Healthcare, Inc. | | | 19,934 | | | | 335,888 | | | | 1,096 | | | | 0.8 | |
NexTier Oilfield Solutions, Inc. | | | 15,555 | | | | 70,615 | | | | (3,417 | ) | | | 0.2 | |
NVR, Inc. | | | 378 | | | | 1,369,150 | | | | 5,481 | | | | 3.1 | |
ON Semiconductor Corp. | | | 7,786 | | | | 163,350 | | | | (4,516 | ) | | | 0.4 | |
Patrick Industries, Inc. | | | 1,995 | | | | 98,271 | | | | 301 | | | | 0.2 | |
Penn National Gaming, Inc. | | | 8,690 | | | | 189,876 | | | | (4,649 | ) | | | 0.4 | |
Progress Software Corp. | | | 9,202 | | | | 370,933 | | | | (3,957 | ) | | | 0.8 | |
PS Business Parks, Inc. | | | 7,892 | | | | 1,429,951 | | | | (5,051 | ) | | | 3.3 | |
The accompanying notes are an integral part of these financial statements.
17
|
AMG FQ Long-Short Equity Fund Schedule of Portfolio Investments(continued) |
Components of over-the-counter total return basket swap (continued)
| | | | | | | | | | | | | | | | |
| Reference Entity | | Shares | | | Notional Value | | | Net Unrealized Appreciation/ (Depreciation) | | | % of Notional Market Value | |
Qorvo, Inc. | | | 1,841 | | | | $147,004 | | | | $1,859 | | | | 0.3 | |
Radian Group, Inc. | | | 49,725 | | | | 1,224,727 | | | | 23,371 | | | | 2.9 | |
Reinsurance Group of America, Inc. | | | 5,654 | | | | 922,054 | | | | (3,449 | ) | | | 2.1 | |
Robert Half International, Inc. | | | 7,780 | | | | 452,174 | | | | (6,613 | ) | | | 1.0 | |
Ross Stores, Inc. | | | 1,011 | | | | 111,533 | | | | (657 | ) | | | 0.3 | |
SEI Investments Co. | | | 32,906 | | | | 2,006,279 | | | | (34,551 | ) | | | 4.5 | |
ServiceMaster Global Holdings, Inc. | | | 8,531 | | | | 351,764 | | | | (7,282 | ) | | | 0.8 | |
Sonos, Inc. | | | 2,980 | | | | 39,247 | | | | (268 | ) | | | 0.1 | |
Spark Energy, Inc., Class A | | | 28,548 | | | | 276,539 | | | | (3,334 | ) | | | 0.6 | |
Sprouts Farmers Market, Inc. | | | 13,718 | | | | 257,212 | | | | 9,054 | | | | 0.6 | |
Synchrony Financial | | | 12,679 | | | | 451,580 | | | | (3,124 | ) | | | 1.0 | |
Travelzoo | | | 2,276 | | | | 23,511 | | | | (478 | ) | | | 0.1 | |
TrueBlue, Inc. | | | 27,099 | | | | 631,949 | | | | (11,382 | ) | | | 1.4 | |
UDR, Inc., REIT | | | 39,637 | | | | 1,976,527 | | | | 15,232 | | | | 4.6 | |
United Rentals, Inc. | | | 1,712 | | | | 232,729 | | | | (4,057 | ) | | | 0.5 | |
Veracyte, Inc. | | | 2,150 | | | | 48,762 | | | | 537 | | | | 0.1 | |
Walker & Dunlop, Inc. | | | 4,885 | | | | 306,925 | | | | 782 | | | | 0.7 | |
WESCO International, Inc. | | | 29,533 | | | | 1,499,390 | | | | (18,310 | ) | | | 3.4 | |
Western Alliance Bancorp | | | 3,136 | | | | 157,333 | | | | (2,634 | ) | | | 0.4 | |
| | | | |
WSFS Financial Corp. | | | 3,998 | | | | 171,834 | | | | (3,238 | ) | | | 0.4 | |
| | | | | | | | | | | | | | | | |
Total long equity positions | | | | | | | — | | | | (189,100 | ) | | | 100.0 | |
| | | | |
Financing | | | | | | | — | | | | 3,793 | | | | — | |
| | | | | | | | | | | | | | | | |
| | | | |
| | | Total | | | | $43,878,805 | | | | $(185,307 | ) | | | 100.0 | |
| | | | | | | | | | | | | | | | |
Over-the-counter total return basket swap
| | | | | | | | | | | | | | |
| Counterparty | | Description | | Notional | | | Termination
Date | | | Value | |
Morgan Stanley & Co. | | The Fund receives or pays the total return on a portfolio of short positions and receives or pays the 1-Month LIBOR (+/- a spread). | | $ | (97,189,412 | ) | | | 8/7/2020 | | | $ | 288,921 | |
Components of over-the-counter total return basket swap
| | | | | | | | | | | | | | | | |
| Reference Entity | | Shares | | | Notional Value | | | Net Unrealized Appreciation/ (Depreciation) | | | % of Notional Market Value | |
2U, Inc. | | | (12,142 | ) | | | $(219,078 | ) | | | $1,433 | | | | 0.2 | |
AbbVie, Inc. | | | (14,216 | ) | | | (1,132,447 | ) | | | 1,564 | | | | 1.2 | |
Aerie Pharmaceuticals, Inc. | | | (704 | ) | | | (15,481 | ) | | | (141 | ) | | | 0.0 | # |
Agios Pharmaceuticals, Inc. | | | (13,448 | ) | | | (424,626 | ) | | | 20,110 | | | | 0.4 | |
AGNC Investment Corp., REIT | | | (101,137 | ) | | | (1,664,594 | ) | | | (59,792 | ) | | | 1.8 | |
Albemarle Corp. | | | (27,060 | ) | | | (1,691,450 | ) | | | 47,826 | | | | 1.7 | |
The accompanying notes are an integral part of these financial statements.
18
|
AMG FQ Long-Short Equity Fund Schedule of Portfolio Investments(continued) |
Components of over-the-counter total return basket swap (continued)
| | | | | | | | | | | | | | | | |
| Reference Entity | | Shares | | | Notional Value | | | Net Unrealized Appreciation/ (Depreciation) | | | % of Notional Market Value | |
Alexandria Real Estate Equities, Inc. | | | (10,950 | ) | | | $(1,741,707 | ) | | | $3,394 | | | | 1.8 | |
Alteryx, Inc., Class A | | | (818 | ) | | | (79,305 | ) | | | 4,458 | | | | 0.1 | |
Ambac Financial Group, Inc. | | | (58,034 | ) | | | (1,186,865 | ) | | | (2,832 | ) | | | 1.2 | |
Ameresco, Inc., Class A | | | (7,542 | ) | | | (115,770 | ) | | | 4,601 | | | | 0.1 | |
American Electric Power Co., Inc. | | | (104 | ) | | | (9,781 | ) | | | (36 | ) | | | 0.0 | # |
American International Group, Inc. | | | (32,737 | ) | | | (1,718,837 | ) | | | (14,915 | ) | | | 1.8 | |
American States Water Co. | | | (2,992 | ) | | | (281,856 | ) | | | (2,773 | ) | | | 0.3 | |
Annaly Capital Management, Inc. | | | (196,851 | ) | | | (1,755,911 | ) | | | (11,811 | ) | | | 1.8 | |
Apollo Medical Holdings, Inc. | | | (2,586 | ) | | | (38,932 | ) | | | 220 | | | | 0.0 | # |
Appian Corp. | | | (2,943 | ) | | | (133,141 | ) | | | 1,766 | | | | 0.1 | |
Applied Optoelectronics, Inc. | | | (31,628 | ) | | | (296,038 | ) | | | 0 | | | | 0.3 | |
Archer-Daniels-Midland Co. | | | (41,089 | ) | | | (1,670,798 | ) | | | (56,584 | ) | | | 1.8 | |
Argan, Inc. | | | (24,282 | ) | | | (926,421 | ) | | | 7,348 | | | | 1.0 | |
Arlington Asset Investment Corp., Class A | | | (302,344 | ) | | | (1,753,595 | ) | | | 6,047 | | | | 1.8 | |
ARMOUR Residential REIT, Inc. | | | (53,770 | ) | | | (890,969 | ) | | | (8,603 | ) | | | 0.9 | |
Banc of California, Inc. | | | (80,979 | ) | | | (1,106,983 | ) | | | (8,098 | ) | | | 1.2 | |
BB&T Corp. | | | (24,738 | ) | | | (1,329,445 | ) | | | 17,094 | | | | 1.4 | |
Bluebird Bio, Inc. | | | (4,191 | ) | | | (352,025 | ) | | | 12,554 | | | | 0.4 | |
Blueprint Medicines Corp. | | | (205 | ) | | | (13,840 | ) | | | (273 | ) | | | 0.0 | # |
Bluerock Residential Growth REIT, Inc. | | | (14,349 | ) | | | (173,623 | ) | | | 1,148 | | | | 0.2 | |
The Boeing Co. | | | (4,887 | ) | | | (1,690,941 | ) | | | 29,801 | | | | 1.7 | |
BOK Financial Corp. | | | (2,227 | ) | | | (176,156 | ) | | | 4,343 | | | | 0.2 | |
Briggs & Stratton Corp. | | | (77,348 | ) | | | (579,182 | ) | | | 9,127 | | | | 0.6 | |
Cannae Holdings, Inc. | | | (4,759 | ) | | | (136,298 | ) | | | (2,665 | ) | | | 0.1 | |
Cantel Medical Corp. | | | (3,844 | ) | | | (278,459 | ) | | | (1,730 | ) | | | 0.3 | |
Carvana Co. | | | (13,815 | ) | | | (1,140,507 | ) | | | 20,387 | | | | 1.2 | |
Century Aluminum Co. | | | (15,606 | ) | | | (95,713 | ) | | | 4,730 | | | | 0.1 | |
CenturyLink, Inc. | | | (7,606 | ) | | | (98,041 | ) | | | (380 | ) | | | 0.1 | |
Charah Solutions, Inc. | | | (30,307 | ) | | | (60,311 | ) | | | 2,425 | | | | 0.1 | |
Cherry Hill Mortgage Investment Corp. | | | (15,808 | ) | | | (213,250 | ) | | | (474 | ) | | | 0.2 | |
Chipotle Mexican Grill, Inc. | | | (425 | ) | | | (329,596 | ) | | | (1,122 | ) | | | 0.3 | |
Cimarex Energy Co. | | | (7,486 | ) | | | (317,032 | ) | | | 973 | | | | 0.3 | |
Cincinnati Bell, Inc. | | | (2,456 | ) | | | (12,526 | ) | | | (25 | ) | | | 0.0 | # |
Clearwater Paper Corp. | | | (19,842 | ) | | | (367,871 | ) | | | 0 | | | | 0.4 | |
CME Group, Inc. | | | (1,408 | ) | | | (288,598 | ) | | | (1,098 | ) | | | 0.3 | |
Coeur Mining, Inc. | | | (14,976 | ) | | | (78,474 | ) | | | (4,193 | ) | | | 0.1 | |
Cohu, Inc. | | | (5,914 | ) | | | (97,404 | ) | | | (887 | ) | | | 0.1 | |
Colfax Corp. | | | (39,742 | ) | | | (1,261,312 | ) | | | (74,020 | ) | | | 1.4 | |
The accompanying notes are an integral part of these financial statements.
19
|
AMG FQ Long-Short Equity Fund Schedule of Portfolio Investments(continued) |
Components of over-the-counter total return basket swap (continued)
| | | | | | | | | | | | | | | | |
| Reference Entity | | Shares | | | Notional Value | | | Net Unrealized Appreciation/ (Depreciation) | | | % of Notional Market Value | |
Colony Credit Real Estate, Inc. | | | (2,019 | ) | | | $(29,074 | ) | | | $141 | | | | 0.0 | # |
CommScope Holding Co., Inc. | | | (85,299 | ) | | | (970,549 | ) | | | 15,200 | | | | 1.0 | |
Concho Resources, Inc. | | | (15,452 | ) | | | (1,065,411 | ) | | | 22,092 | | | | 1.1 | |
Concrete Pumping Holdings, Inc. | | | (3,538 | ) | | | (11,995 | ) | | | (176 | ) | | | 0.0 | # |
Constellation Brands, Inc., Class A | | | (56 | ) | | | (10,732 | ) | | | 73 | | | | 0.0 | # |
Coupa Software, Inc. | | | (4,663 | ) | | | (656,784 | ) | | | 15,668 | | | | 0.7 | |
Crown Castle International Corp. | | | (8,820 | ) | | | (1,229,813 | ) | | | 5,685 | | | | 1.3 | |
CVS Health Corp. | | | (21,958 | ) | | | (1,472,284 | ) | | | 14,492 | | | | 1.5 | |
CyrusOne, Inc. | | | (1,007 | ) | | | (75,102 | ) | | | 3,323 | | | | 0.1 | |
DASAN Zhone Solutions, Inc. | | | (1,924 | ) | | | (14,468 | ) | | | (29 | ) | | | 0.0 | # |
Daseke, Inc. | | | (27,896 | ) | | | (85,791 | ) | | | 10,751 | | | | 0.1 | |
Dean Foods Co. | | | (30,946 | ) | | | (32,051 | ) | | | 1,724 | | | | 0.0 | # |
Deere & Co. | | | (9,750 | ) | | | (1,694,745 | ) | | | (3,120 | ) | | | 1.8 | |
Diamond Offshore Drilling, Inc. | | | (70,969 | ) | | | (404,523 | ) | | | 29,097 | | | | 0.4 | |
Diamondback Energy, Inc. | | | (4,171 | ) | | | (355,059 | ) | | | (2,646 | ) | | | 0.4 | |
Dick’s Sporting Goods, Inc. | | | (14,687 | ) | | | (580,908 | ) | | | 9,143 | | | | 0.6 | |
Digimarc Corp. | | | (2,654 | ) | | | (112,078 | ) | | | 17,596 | | | | 0.1 | |
Digital Realty Trust, Inc. | | | (13,314 | ) | | | (1,722,965 | ) | | | 31,554 | | | | 1.7 | |
DocuSign, Inc. | | | (1,717 | ) | | | (114,644 | ) | | | 996 | | | | 0.1 | |
Dominion Energy, Inc. | | | (21,379 | ) | | | (1,749,016 | ) | | | (15,820 | ) | | | 1.8 | |
Domo, Inc., Class B | | | (15,901 | ) | | | (258,232 | ) | | | 2,544 | | | | 0.3 | |
Drive Shack, Inc. | | | (11,968 | ) | | | (49,308 | ) | | | 1,556 | | | | 0.1 | |
Edison International | | | (19,163 | ) | | | (1,191,172 | ) | | | (14,181 | ) | | | 1.2 | |
Energizer Holdings, Inc. | | | (7,127 | ) | | | (309,350 | ) | | | 6,523 | | | | 0.3 | |
Entergy Corp. | | | (319 | ) | | | (38,778 | ) | | | 25 | | | | 0.0 | # |
Equinix, Inc. | | | (1,755 | ) | | | (1,001,629 | ) | | | 6,930 | | | | 1.0 | |
Exact Sciences Corp. | | | (315 | ) | | | (26,463 | ) | | | (942 | ) | | | 0.0 | # |
Farmland Partners, Inc. | | | (98,295 | ) | | | (656,611 | ) | | | (1,966 | ) | | | 0.7 | |
Fastenal Co. | | | (1,683 | ) | | | (61,030 | ) | | | 543 | | | | 0.1 | |
FireEye, Inc. | | | (780 | ) | | | (12,004 | ) | | | (351 | ) | | | 0.0 | # |
Floor & Decor Holdings, Inc., Class A | | | (1,245 | ) | | | (58,378 | ) | | | 1,320 | | | | 0.1 | |
Flotek Industries, Inc. | | | (32,677 | ) | | | (63,720 | ) | | | 1,307 | | | | 0.1 | |
Fluor Corp. | | | (17,769 | ) | | | (344,711 | ) | | | 58,453 | | | | 0.3 | |
Freeport-McMoRan, Inc. | | | (18,036 | ) | | | (182,705 | ) | | | 5,591 | | | | 0.2 | |
Front Yard Residential Corp. | | | (64,321 | ) | | | (790,177 | ) | | | (5,474 | ) | | | 0.8 | |
Gaia, Inc. | | | (157,224 | ) | | | (1,108,429 | ) | | | 18,867 | | | | 1.1 | |
GAIN Capital Holdings, Inc. | | | (205,784 | ) | | | (854,415 | ) | | | (13,993 | ) | | | 0.9 | |
General Dynamics Corp. | | | (964 | ) | | | (171,823 | ) | | | 1,388 | | | | 0.2 | |
The accompanying notes are an integral part of these financial statements.
20
|
AMG FQ Long-Short Equity Fund Schedule of Portfolio Investments(continued) |
Components of over-the-counter total return basket swap (continued)
| | | | | | | | | | | | | | | | |
| Reference Entity | | Shares | | | Notional Value | | | Net Unrealized Appreciation/ (Depreciation) | | | % of Notional Market Value | |
General Electric Co. | | | (146,661 | ) | | | $(1,468,810 | ) | | | $5,133 | | | | 1.5 | |
Gold Resource Corp. | | | (78,777 | ) | | | (331,651 | ) | | | (13,392 | ) | | | 0.4 | |
The Goldman Sachs Group, Inc. | | | (8,081 | ) | | | (1,743,961 | ) | | | 19,637 | | | | 1.8 | |
Green Plains, Inc. | | | (28,556 | ) | | | (352,381 | ) | | | 286 | | | | 0.4 | |
The Greenbrier Cos., Inc. | | | (13,415 | ) | | | (400,035 | ) | | | 7,110 | | | | 0.4 | |
GrubHub, Inc. | | | (1,301 | ) | | | (44,234 | ) | | | (78 | ) | | | 0.0 | # |
GTY Technology Holdings, Inc. | | | (18,894 | ) | | | (100,584 | ) | | | 2,146 | | | | 0.1 | |
Hecla Mining Co. | | | (14,724 | ) | | | (32,547 | ) | | | (1,318 | ) | | | 0.0 | # |
Howard Bancorp, Inc. | | | (7,529 | ) | | | (127,446 | ) | | | 1,110 | | | | 0.1 | |
The Howard Hughes Corp. | | | (1,546 | ) | | | (172,070 | ) | | | (804 | ) | | | 0.2 | |
Hyster-Yale Materials Handling, Inc. | | | (3,338 | ) | | | (172,441 | ) | | | 3,138 | | | | 0.2 | |
Immersion Corp. | | | (29,279 | ) | | | (238,038 | ) | | | (2,635 | ) | | | 0.2 | |
Infinera Corp. | | | (10,600 | ) | | | (57,073 | ) | | | (2,182 | ) | | | 0.1 | |
Inovio Pharmaceuticals, Inc. | | | (70,552 | ) | | | (154,509 | ) | | | 4,233 | | | | 0.2 | |
Interactive Brokers Group, Inc., Class A | | | (19,029 | ) | | | (919,099 | ) | | | 13,889 | | | | 0.9 | |
Iron Mountain, Inc. | | | (51,350 | ) | | | (1,719,198 | ) | | | 34,918 | | | | 1.7 | |
JBG SMITH Properties | | | (3,078 | ) | | | (124,351 | ) | | | 431 | | | | 0.1 | |
Kala Pharmaceuticals, Inc. | | | (10,501 | ) | | | (39,799 | ) | | | 1,680 | | | | 0.0 | # |
Kindred Biosciences, Inc. | | | (13,190 | ) | | | (108,026 | ) | | | 264 | | | | 0.1 | |
Kirby Corp. | | | (10,771 | ) | | | (868,035 | ) | | | 15,403 | | | | 0.9 | |
KLA Corp. | | | (138 | ) | | | (23,685 | ) | | | 358 | | | | 0.0 | # |
Knight-Swift Transportation Holdings, Inc. | | | (14,216 | ) | | | (528,409 | ) | | | 10,093 | | | | 0.5 | |
The Kraft Heinz Co. | | | (25,007 | ) | | | (712,699 | ) | | | (95,777 | ) | | | 0.8 | |
KVH Industries, Inc. | | | (3,644 | ) | | | (36,732 | ) | | | (510 | ) | | | 0.0 | # |
Leaf Group, Ltd. | | | (42,851 | ) | | | (129,689 | ) | | | 2,421 | | | | 0.1 | |
LendingClub Corp. | | | (29,038 | ) | | | (377,784 | ) | | | 10,744 | | | | 0.4 | |
LendingTree, Inc. | | | (1,175 | ) | | | (370,854 | ) | | | (51,970 | ) | | | 0.4 | |
Lindsay Corp. | | | (17,577 | ) | | | (1,691,610 | ) | | | 32,166 | | | | 1.7 | |
LivePerson, Inc. | | | (5,835 | ) | | | (240,986 | ) | | | 1,459 | | | | 0.2 | |
The Lovesac Co. | | | (5,898 | ) | | | (104,277 | ) | | | 7,962 | | | | 0.1 | |
Lyft, Inc., Class A | | | (9,972 | ) | | | (435,508 | ) | | | 22,268 | | | | 0.4 | |
Marathon Petroleum Corp. | | | (4,447 | ) | | | (294,582 | ) | | | 10,196 | | | | 0.3 | |
Mattel, Inc. | | | (44,660 | ) | | | (536,590 | ) | | | 3,349 | | | | 0.6 | |
MBIA, Inc. | | | (181,262 | ) | | | (1,704,280 | ) | | | 20,356 | | | | 1.7 | |
Middlesex Water Co. | | | (1,270 | ) | | | (84,061 | ) | | | (1,346 | ) | | | 0.1 | |
Moderna, Inc. | | | (3,502 | ) | | | (60,024 | ) | | | 1,366 | | | | 0.1 | |
MongoDB, Inc. | | | (836 | ) | | | (110,912 | ) | | | 4,096 | | | | 0.1 | |
Motorcar Parts of America, Inc. | | | (57,375 | ) | | | (1,095,289 | ) | | | 1,721 | | | | 1.1 | |
The accompanying notes are an integral part of these financial statements.
21
|
AMG FQ Long-Short Equity Fund Schedule of Portfolio Investments(continued) |
Components of over-the-counter total return basket swap (continued)
| | | | | | | | | | | | | | | | |
| Reference Entity | | Shares | | | Notional Value | | | Net Unrealized Appreciation/ (Depreciation) | | | % of Notional Market Value | |
Motorola Solutions, Inc. | | | (85 | ) | | | $(14,010 | ) | | | $(127 | ) | | | 0.0 | # |
Murphy Oil Corp. | | | (2,791 | ) | | | (54,452 | ) | | | (3,126 | ) | | | 0.1 | |
Nektar Therapeutics | | | (7,098 | ) | | | (124,570 | ) | | | 3,017 | | | | 0.1 | |
New Residential Investment Corp. | | | (112,985 | ) | | | (1,776,124 | ) | | | (13,558 | ) | | | 1.8 | |
Newmont Goldcorp Corp. | | | (3,946 | ) | | | (154,052 | ) | | | (2,723 | ) | | | 0.2 | |
Northwest Pipe Co. | | | (7,639 | ) | | | (226,925 | ) | | | (6,065 | ) | | | 0.2 | |
Novagold Resources, Inc. (Canada) | | | (55,790 | ) | | | (390,636 | ) | | | (15,515 | ) | | | 0.4 | |
Ocwen Financial Corp. | | | (9,532 | ) | | | (16,681 | ) | | | 572 | | | | 0.0 | # |
Omega Healthcare Investors, Inc. | | | (38,792 | ) | | | (1,699,865 | ) | | | (8,534 | ) | | | 1.8 | |
Papa John’s International, Inc. | | | (5,396 | ) | | | (318,297 | ) | | | 2,361 | | | | 0.3 | |
PAR Technology Corp. | | | (705 | ) | | | (17,660 | ) | | | (7 | ) | | | 0.0 | # |
PDL Community Bancorp | | | (13,787 | ) | | | (193,018 | ) | | | (414 | ) | | | 0.2 | |
Pfizer, Inc. | | | (255 | ) | | | (9,821 | ) | | | 37 | | | | 0.0 | # |
Pluralsight, Inc., Class A | | | (3,264 | ) | | | (59,780 | ) | | | 767 | | | | 0.1 | |
Pure Cycle Corp. | | | (878 | ) | | | (9,865 | ) | | | 49 | | | | 0.0 | # |
Quanta Services, Inc. | | | (5,023 | ) | | | (210,167 | ) | | | (1,050 | ) | | | 0.2 | |
Realty Income Corp. | | | (21,095 | ) | | | (1,721,291 | ) | | | (4,069 | ) | | | 1.8 | |
Redfin Corp. | | | (22,844 | ) | | | (410,080 | ) | | | 12,822 | | | | 0.4 | |
Roku, Inc. | | | (1,010 | ) | | | (150,924 | ) | | | 2,252 | | | | 0.2 | |
Ryder System, Inc. | | | (1,415 | ) | | | (68,543 | ) | | | (269 | ) | | | 0.1 | |
Sage Therapeutics, Inc. | | | (2,814 | ) | | | (391,044 | ) | | | 9,325 | | | | 0.4 | |
Sarepta Therapeutics, Inc. | | | (3,646 | ) | | | (308,802 | ) | | | 5,965 | | | | 0.3 | |
SEACOR Marine Holdings, Inc. | | | (5,727 | ) | | | (77,429 | ) | | | 2,921 | | | | 0.1 | |
Seritage Growth Properties | | | (3,213 | ) | | | (141,260 | ) | | | 1,527 | | | | 0.1 | |
SharpSpring, Inc. | | | (15,613 | ) | | | (160,189 | ) | | | 1,093 | | | | 0.2 | |
Six Flags Entertainment Corp. | | | (2,210 | ) | | | (94,524 | ) | | | 1,284 | | | | 0.1 | |
SL Green Realty Corp. | | | (2,646 | ) | | | (220,929 | ) | | | (277 | ) | | | 0.2 | |
Solid Biosciences, Inc. | | | (836 | ) | | | (9,467 | ) | | | 229 | | | | 0.0 | # |
Stericycle, Inc. | | | (15,704 | ) | | | (840,007 | ) | | | (64,543 | ) | | | 0.9 | |
Stratus Properties, Inc. | | | (8,835 | ) | | | (245,613 | ) | | | 1,944 | | | | 0.3 | |
SunPower Corp. | | | (19,921 | ) | | | (167,336 | ) | | | (7,172 | ) | | | 0.2 | |
Sunrun, Inc. | | | (3,846 | ) | | | (60,811 | ) | | | 1,044 | | | | 0.1 | |
Targa Resources Corp. | | | (17,676 | ) | | | (715,369 | ) | | | 28,126 | | | | 0.7 | |
Tesla, Inc. | | | (1,531 | ) | | | (482,280 | ) | | | 138 | | | | 0.5 | |
Thor Industries, Inc. | | | (8,639 | ) | | | (565,131 | ) | | | 18,627 | | | | 0.6 | |
Tile Shop Holdings, Inc. | | | (51,459 | ) | | | (90,789 | ) | | | 4,338 | | | | 0.1 | |
Titan International, Inc. | | | (79,785 | ) | | | (219,409 | ) | | | 6,383 | | | | 0.2 | |
TPI Composites, Inc. | | | (15,104 | ) | | | (309,360 | ) | | | (725 | ) | | | 0.3 | |
The accompanying notes are an integral part of these financial statements.
22
|
AMG FQ Long-Short Equity Fund Schedule of Portfolio Investments(continued) |
Components of over-the-counter total return basket swap (continued)
| | | | | | | | | | | | | | | | |
| Reference Entity | | Shares | | | Notional Value | | | Net Unrealized Appreciation/ (Depreciation) | | | % of Notional Market Value | |
TransDigm Group, Inc. | | | (3,242 | ) | | | $(1,719,921 | ) | | | $13,721 | | | | 1.8 | |
Tucows, Inc., Class A | | | (691 | ) | | | (39,567 | ) | | | 1,188 | | | | 0.0 | # |
Twilio, Inc., Class A | | | (3,731 | ) | | | (402,104 | ) | | | 41,838 | | | | 0.4 | |
Twin Disc, Inc. | | | (1,446 | ) | | | (15,805 | ) | | | 246 | | | | 0.0 | # |
Ubiquiti, Inc. | | | (3,225 | ) | | | (415,573 | ) | | | 7,321 | | | | 0.4 | |
Unit Corp. | | | (34,030 | ) | | | (75,489 | ) | | | 6,068 | | | | 0.1 | |
United Insurance Holdings Corp. | | | (1,042 | ) | | | (12,806 | ) | | | 31 | | | | 0.0 | # |
United Parcel Service, Inc., Class B | | | (1,165 | ) | | | (135,208 | ) | | | 1,035 | | | | 0.1 | |
United States Steel Corp. | | | (17,345 | ) | | | (208,313 | ) | | | 8,672 | | | | 0.2 | |
Ventas, Inc. | | | (26,684 | ) | | | (1,719,026 | ) | | | (18,102 | ) | | | 1.8 | |
Verra Mobility Corp. | | | (678 | ) | | | (9,740 | ) | | | 11 | | | | 0.0 | # |
ViaSat, Inc. | | | (20,491 | ) | | | (1,436,009 | ) | | | 25,409 | | | | 1.5 | |
ViewRay, Inc. | | | (42,499 | ) | | | (106,672 | ) | | | (3,825 | ) | | | 0.1 | |
Virtu Financial, Inc., Class A | | | (49,118 | ) | | | (822,726 | ) | | | (10,315 | ) | | | 0.9 | |
Vivint Solar, Inc. | | | (44,070 | ) | | | (307,168 | ) | | | (1,763 | ) | | | 0.3 | |
Wabtec Corp. | | | (24,370 | ) | | | (1,668,031 | ) | | | (22,515 | ) | | | 1.7 | |
The Walt Disney Co. | | | (13,173 | ) | | | (1,708,952 | ) | | | (2,484 | ) | | | 1.8 | |
Wayfair, Inc., Class A | | | (3,016 | ) | | | (304,857 | ) | | | 56,852 | | | | 0.3 | |
Welltower, Inc. | | | (19,070 | ) | | | (1,712,869 | ) | | | (16,589 | ) | | | 1.8 | |
WEX, Inc. | | | (322 | ) | | | (65,646 | ) | | | 4,730 | | | | 0.1 | |
Weyerhaeuser Co. | | | (56,300 | ) | | | (1,676,524 | ) | | | 32,001 | | | | 1.7 | |
White Mountains Insurance Group, Ltd. (Bermuda) | | | (642 | ) | | | (680,758 | ) | | | (6,824 | ) | | | 0.7 | |
Willdan Group, Inc. | | | (935 | ) | | | (36,540 | ) | | | 8,210 | | | | 0.0 | # |
WisdomTree Investments, Inc. | | | (135,595 | ) | | | (701,392 | ) | | | 8,502 | | | | 0.7 | |
WP Carey, Inc. | | | (18,453 | ) | | | (1,700,998 | ) | | | 2,214 | | | | 1.8 | |
Wyndham Hotels & Resorts, Inc. | | | (11,953 | ) | | | (640,800 | )�� | | | (4,303 | ) | | | 0.7 | |
Zillow Group, Inc., Class A | | | (11,988 | ) | | | (397,491 | ) | | | 9,200 | | | | 0.4 | |
| | | | |
Zillow Group, Inc., Class C | | | (15,598 | ) | | | (517,542 | ) | | | 9,515 | | | | 0.5 | |
| | | | | | | | | | | | | | | | |
Total short equity positions | | | | | | | — | | | | 367,393 | | | | 100.0 | |
| | | | |
Financing | | | | | | | — | | | | (78,472 | ) | | | — | |
| | | | | | | | | | | | | | | | |
| | | | |
| | | Total | | | | $(97,189,412 | ) | | | $288,921 | | | | 100.0 | |
| | | | | | | | | | | | | | | | |
#Less than 0.05% or (0.05%).
The accompanying notes are an integral part of these financial statements.
23
|
AMG FQ Long-Short Equity Fund Schedule of Portfolio Investments(continued) |
The following table summarizes the inputs used to value the Fund’s investments by the fair value hierarchy levels as of October 31, 2019:
| | | | | | | | | | | | | | | | | | | | |
| | | Level 1 | | Level 2 | | Level 3 | | Total |
Investments in Securities | | | | | | | | | | | | | | | | | | | | |
Common Stocks† | | | | $64,214,941 | | | | | — | | | | | — | | | | | $64,214,941 | |
Short-Term Investments | | | | | | | | | | | | | | | | | | | | |
Joint Repurchase Agreements | | | | — | | | | | $291,245 | | | | | — | | | | | 291,245 | |
Other Investment Companies | | | | 26,011,761 | | | | | — | | | | | — | | | | | 26,011,761 | |
| | | | | | | | | | | | | | | | | | | | |
Total Investments in Securities | | | | $90,226,702 | | | | | $291,245 | | | | | — | | | | | $90,517,947 | |
| | | | | | | | | | | | | | | | | | | | |
Financial Derivative Instruments - Assets | | | | | | | | | | | | | | | | | | | | |
Equity Futures Contracts | | | | $809,046 | | | | | — | | | | | — | | | | | $809,046 | |
Equity Swap Contracts | | | | — | | | | | $288,921 | | | | | — | | | | | 288,921 | |
Financial Derivative Instruments - Liabilities | | | | | | | | | | | | | | | | | | | | |
Equity Swap Contracts | | | | — | | | | | (185,307 | ) | | | | — | | | | | (185,307 | ) |
| | | | | | | | | | | | | | | | | | | | |
Total Financial Derivative Instruments | | | | $809,046 | | | | | $103,614 | | | | | — | | | | | $912,660 | |
| | | | | | | | | | | | | | | | | | | | |
| † | All common stocks held in the Fund are Level 1 securities. For a detailed breakout of common stocks by major industry classification, please refer to the Fund’s Schedule of Portfolio Investments. |
For the fiscal year ended October 31, 2019, there were no transfers in or out of Level 3.
The accompanying notes are an integral part of these financial statements.
24
|
AMG FQ Long-Short Equity Fund Schedule of Portfolio Investments(continued) |
The following schedule shows the value of derivative instruments at October 31, 2019:
| | | | | | | | | | | | |
| | | Asset Derivatives | | | Liability Derivatives | |
| | | | |
Derivatives not accounted
for as hedging instruments | | Statement of Assets and
Liabilities Location | | Fair Value | | | Statement of Assets and
Liabilities Location | | Fair Value | |
| | | | |
Equity contracts | | Swap at value | | | $288,921 | | | Swap at value | | | $185,307 | |
| | | | |
| | Cash deposited with broker for futures contracts1 | | | 2,082,541 | | | | | | — | |
| | | | | | | | | | | | |
| | | | |
| | Totals | | | $2,371,462 | | | | | | $185,307 | |
| | | | | | | | | | | | |
| | |
| | | Realized Gain/(Loss) | | | Change in Unrealized Appreciation/Depreciation | |
| | | | |
Derivatives not accounted
for as hedging instruments | | Statement of Operations
Location | | Realized
Gain/(Loss) | | | Statement of Operations
Location | | Change in
Unrealized
Appreciation/
Depreciation | |
| | | | |
Equity contracts | | Net realized gain on futures contracts | | | $2,788,996 | | | Net change in unrealized appreciation/ depreciation on futures contracts | | | $1,284,680 | |
| | Net realized loss on swaps | | | (9,285,157 | ) | | Net change in unrealized appreciation/depreciation on swaps | | | 61,429 | |
| | | | | | | | | | | | |
| | Totals | | | $(6,496,161 | ) | | | | | $1,346,109 | |
| | | | | | | | | | | | |
1Amount represents cash with futures broker and unrealized appreciation/depreciation on open futures contracts. See Note 9 for additional information.
The accompanying notes are an integral part of these financial statements.
25
|
AMG FQ Global Risk-Balanced Fund Portfolio Manager’s Comments(unaudited) |
| | | | | | | | |
OVERVIEW For the fiscal year ended October 31, 2019, the AMG FQ Global Risk-Balanced Fund (the “Fund”) Class Z shares returned 16.43%, while the benchmark 60% MSCI World Index/40% FTSE World Government Bond Index - Hedged returned 11.63%. MARKET OVERVIEW Throughout the period, the trade war between the U.S. and China and Brexit negotiations dominated the news. Despite occasional indications of a breakthrough, both “known unknowns” remained unresolved. These political developments contributed to the ongoing slowdown in the global economy, though we have so far avoided a full-blown recession. For most of the period, we identified a transitioning market environment, with evidence of both resilience and fragility (MRI=0.5)1. Global business conditions pointed toward fragility, particularly the global manufacturing recession. Despite the “known unknowns” and slowing economy, markets were mostly optimistic. Except in credit markets, risk appetite was generally healthy, resulting in subdued volatility. Late in the reporting period, we observed signs of eroding optimism. Institutional flows began to signal “risk-off” sentiment, while bond volatility increased. In response to the building fragility, the MRI shifted to 0.75 in August, and we ended the period identifying a mostly fragile environment. As a general rule, derivatives are an important instrument used to implement the Fund’s investment strategy. Specifically, equity and bond futures are used to gain economic exposure, and equity options | | | | for risk management. Overall, the liquidity and low transaction cost of this instrument offers the investment team the ability to be more nimble and to implement our investment strategy at a lower cost. PERFORMANCE REVIEW Given our view on the market environment, the portfolio was positioned for hedged growth. We maintained significant exposure to risk assets as well as diversifiers. Our risk-balanced approach benefited results, as both stocks and bonds delivered strong positive returns, but with strong negative correlation. Global equities advanced over the reporting period, led by developed markets. Risk appetite in emerging markets was far weaker, likely due to the sensitivity of emerging economies to global trade. Small cap struggled early in the period and finished flat. Since smaller companies are more sensitive to borrowing conditions, the prospect of rising rates alongside a slowing economy was worrying. However, small cap started to show signs of life toward the period’s end, benefiting from the healthy domestic economy and the U.S. Federal Reserve’s dovish turn. Bond managers appeared less optimistic about the health of the global economy. As a result, global bond markets also advanced. Inflation-linked bonds contributed positively, but lagged nominal debt. Commodity exposures also helped results. Energy struggled, as the combination of strong production and uncertain demand fueled concern about the supply glut. However, like bonds, gold advanced, benefiting from demand for safe havens. | | | | The only noteworthy detractor over the period was the Fund’s options hedge. Given the healthy appetite for equity risk, this component incurred losses for much of the period. However, it helped smooth overall returns, as the options hedge performed well when equity markets sold off in December 2018 and May 2019. OUTLOOK Heading into November, we continue to identify significant fragility in the market environment (MRI=0.75), though many of our indicators appear to be transitioning toward more positive sentiment. But there is a difference between “relief” and “optimism.” Only a reduction in the current levels of tariffs and a resolution of Brexit will result in true optimism. We believe that now investors should be wary of confusing the relief rally with a true reason for positive sentiment. 1 The FQ Market Risk Indicator (“MRI”) is designed to indicate the current phase of the market cycle and the level of macro uncertainty, from resilience (MRI=0.00) to high fragility (MRI=1.00) in increments of 0.25 for a total of five levels. This commentary reflects the viewpoints of the portfolio manager, First Quadrant, L.P., as of October 31, 2019 and is not intended as a forecast or guarantee of future results, and is subject to change without notice. |
26
|
AMG FQ Global Risk-Balanced Fund Portfolio Manager’s Comments(continued) |
CUMULATIVE TOTAL RETURN PERFORMANCE
AMG FQ Global Risk-Balanced Fund’s cumulative total return is based on the daily change in net asset value (NAV), and assumes that all dividends and distributions were reinvested. This graph compares a hypothetical $10,000 investment made in the AMG FQ Global Risk Balanced Fund’s Class Z shares on October 31, 2009, to a $10,000 investment made in the 60% MSCI World Index & 40% FTSE World Government Bond Index-Hedged (“Composite Hedged Index”) and the 60% MSCI World Index & 40% FTSE World Government Bond Index-UnHedged (“Composite UnHedged Index”) and S&P 500® Index for the same time period. The graph and table do not reflect the deduction of taxes that a shareholder would pay on a Fund distribution or redemption of shares. The listed returns for the Fund are net of expenses and the returns for the index exclude expenses. Total returns would have been lower had certain expenses not been reduced.
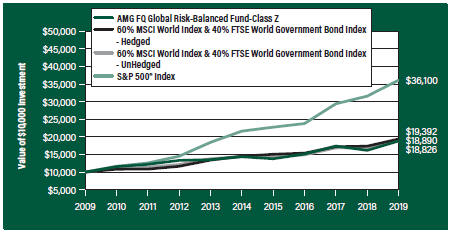
The table below shows the average annual total returns for the AMG FQ Global Risk-Balanced Fund and the AMG FQ Global Risk-Balanced Fund Composite Hedged and UnHedged Indexes and S&P 500® Index for the same time periods ended October 31, 2019.
| | | | | | | | | | | | | | | | | | | | |
Average Annual Total Returns1 | | One
Year | | | Five
Years | | | Ten
Years | | | Since
Inception | | | Inception
Date | |
AMG FQ Global Risk-Balanced Fund2, 3, 4, 5, 6, 7, 8, 9, 10, 11, 12, 13, 14, 15 | | | | | |
| | | | | |
Class N | | | 15.98 | % | | | 5.12 | % | | | — | | | | 5.88 | % | | | 01/01/10 | |
| | | | | |
Class I | | | 16.23 | % | | | 5.47 | % | | | — | | | | 6.25 | % | | | 01/01/10 | |
| | | | | |
Class Z | | | 16.43 | % | | | 5.57 | % | | | 6.53 | % | | | 6.10 | % | | | 11/18/88 | |
| | | | | |
Composite Hedged Index16 | | | 11.63 | % | | | 5.97 | % | | | 6.85 | % | | | 5.86 | % | | | 11/30/88 | 18 |
| | | | | |
Composite UnHedged Index16 | | | 11.84 | % | | | 5.52 | % | | | 6.57 | % | | | 6.60 | % | | | 11/30/88 | 18 |
| | | | | |
S&P 500® Index17 | | | 14.33 | % | | | 10.78 | % | | | 13.70 | % | | | 10.55 | % | | | 11/18/88 | † |
The performance data shown represents past performance. Past performance is not a guarantee of future results. Current performance may be lower or higher than the performance data quoted. The investment return and principal value of an investment will fluctuate so that an investor’s shares, when redeemed, may be worth more or less than their original cost.
Investors should carefully consider the Fund’s investment objectives, risks, charges and expenses before investing. For performance information through the most recent month end, current net asset values per share for the Fund and other information, please call 800.548.4539 or visit our website at amgfunds.com for a free prospectus. Read it carefully before investing or sending money.
Distributed by AMG Distributors, Inc., member FINRA/SIPC.
| | |
| | | † Date reflects the inception date of the Fund, not the index. 1 Total return equals income yield plus share price change and assumes reinvestment of all dividends and capital gain distributions. Returns are net of fees and may reflect offsets of Fund expenses as described in the prospectus. No adjustment has been made for taxes payable by shareholders on their reinvested dividends and capital gain distributions. Returns for periods greater than one year are annualized. The listed returns on the Fund are net of expenses and based on the published NAV as of October 31, 2019. All returns are in U.S. dollars ($). 2 From time to time, the Fund’s advisor has waived its fees and/or absorbed Fund expenses, which has resulted in higher returns. 3 Investments in international securities are subject to certain risks of overseas investing including currency fluctuations and changes in political and economic conditions, which could result in significant market fluctuations. These risks are magnified in emerging markets. 4 The Fund is subject to currency risk resulting from fluctuations in exchange rates that may affect the total loss or gain on a non-U.S. Dollar investment when converted back to U.S. Dollars. 5 The use of leverage in a Fund’s strategy, such as futures and forward commitment transactions, can magnify relatively small market movements into relatively larger losses for the Fund. 6 Investments in commodities are subject to greater volatility than investments in traditional securities, such as stocks and bonds. Commodities are subject to risks, including but not limited to climate conditions, livestock disease, war, terrorism, political conflicts, interest rates, currency fluctuations, embargoes, tariffs and other regulatory developments. |
| | |
| | | 7 Because exchange-traded funds (ETFs) incur their own costs, investing in them could result in a higher cost to the investor. Additionally, the Fund will be indirectly exposed to all the risks of securities held by the ETFs. 8 Obligations of certain government agencies are not backed by the full faith and credit of the U.S. government. If one of these agencies defaulted on a loan, there is no guarantee that the U.S. government would provide financial support. Additionally, debt securities of the U.S. government may be affected by changing interest rates and subject to prepayment risk. 9 The Fund is subject to risks associated with investments in small-capitalization companies, such as erratic earnings patterns, competitive |
27
|
AMG FQ Global Risk-Balanced Fund Portfolio Manager’s Comments(continued) |
| | | | | | | | |
conditions, limited earnings history, and a reliance on one or a limited number of products. 10 The Fund is subject to risks associated with investments in mid-capitalization companies such as greater price volatility, lower trading volume, and less liquidity than the stocks of larger, more established companies. 11 The Fund is subject to the risks associated with investments in emerging markets, such as erratic earnings patterns, economic and political instability, changing exchange controls, limitations on repatriation of foreign capital and changes in local governmental attitudes toward private investment, possibly leading to nationalization or confiscation of investor assets. 12 High-yield bonds (also known as “junk bonds”) may be subject to greater levels of interest rate, credit, and liquidity risk than investments in higher rated securities. These securities are considered predominantly speculative with respect to the issuer’s continuing ability to make principal and interest payments. The issuers of the Fund’s holdings may be involved in bankruptcy proceedings, reorganizations, or financial restructurings, and are not as strong financially as higher-rated issuers. 13 The Fund is subject to the risks associated with investments in debt securities, such as default risk and fluctuations in the perception of the debtor’s ability to pay its creditors. Changing interest rates may adversely affect the value of an investment. An increase in interest rates typically causes the value of bonds and other fixed-income securities to fall. 14 The Fund may invest in derivatives such as options and futures; the complexity and rapidly changing structure of derivatives markets may increase the possibility of market losses. 15 The Fund is subject to special risk considerations similar to those associated with the direct ownership of real estate. Real estate valuations may be subject to factors such as changing general and local economic, financial, competitive, and environmental conditions. | | | | 16 The benchmark is comprised of 60% MSCI World Index and 40% FTSE World Government Bond Index. The MSCI World Index is a free float-adjusted market capitalization weighted index that is designed to measure the equity market performance of developed markets. The MSCI World Index consists of 23 developed market country indices. Please go to msci.com for most current list of countries represented by the index. The FTSE World Government Bond Index (FTSE) measures the performance of fixed-rate, local currency, investment grade sovereign bonds. The FTSE is a widely used benchmark that currently comprises sovereign debt from over 20 countries, denominated in a variety of currencies, and has more than 25 years of history available. Prior to July 31, 2018, the FTSE World Government Bond Index was known as the Citigroup World Government Bond Index. The Composite Index is calculated on both a hedged and unhedged basis, with respect to currency exchange rates. Unlike the Fund, the Composite Index is unmanaged, is not available for investment and does not incur fees. All MSCI data is provided ’as is.’ The products described herein are not sponsored or endorsed and have not been reviewed or passed on by MSCI. In no event shall MSCI, its affiliates, or any MSCI data provider have any liability of any kind in connection with the MSCI data or the products described herein. Copying or redistributing the MSCI data is strictly prohibited. 17 The S&P 500® Index is a capitalization-weighted index of 500 stocks. The S&P 500® Index is designed to measure performance of the broad domestic economy through changes in the aggregate market value of 500 stocks representing all major industries. Unlike the Fund, the S&P 500® Index is unmanaged, is not available for investment and does not incur expenses. 18 The date reflects the closest available index date to the Fund’s inception date. The S&P 500® Index is proprietary data of Standard & Poor’s, a division of McGraw-Hill Companies, Inc. Not FDIC insured, nor bank guaranteed. May lose value. | | | | |
28
|
AMG FQ Global Risk-Balanced Fund Schedule of Portfolio Investments October 31, 2019 |
| | | | | | | | |
| | | Shares | | | Value | |
| |
Exchange Traded Funds - 47.0% | | | | | |
| | |
iShares Global Infrastructure ETF | | | 14,959 | | | | $705,616 | |
| | |
iShares iBoxx $ High Yield Corporate Bond ETF1,2 | | | 78,951 | | | | 6,853,736 | |
| | |
iShares TIPS Bond ETF1 | | | 91,844 | | | | 10,659,415 | |
| | |
Materials Select Sector SPDR Fund2 | | | 11,924 | | | | 693,858 | |
| | |
SPDR Citi International Government Inflation-Protected Bond ETF1 | | | 47,121 | | | | 2,608,147 | |
| | |
VanEck Vectors Gold Miners ETF | | | 25,321 | | | | 712,786 | |
| | |
VanEck Vectors Natural Resource ETF | | | 18,873 | | | | 671,879 | |
| | |
Vanguard Global ex-U.S. Real Estate ETF | | | 3,725 | | | | 226,852 | |
| | |
Vanguard REIT ETF1,2 | | | 22,211 | | | | 2,094,497 | |
| | |
Total Exchange Traded Funds | | | | | | | | |
(Cost $23,974,890) | | | | | | | 25,226,786 | |
| | |
| | | Notes | | | | |
| |
Exchange Traded Notes - 10.2% | | | | | |
| | |
Deutsche Bank AG, PowerShares DB Gold Double Long, 02/15/38* | | | 36,381 | | | | 1,111,701 | |
| | |
iPath Bloomberg Commodity Index Total Return ETN, 06/12/36*,2 | | | 93,199 | | | | 2,074,610 | |
| | |
Swedish Export Credit Corp., ELEMENTS Linked to the Rogers International Commodity Index Total Return, 10/24/22*,2 | | | 414,958 | | | | 2,151,557 | |
| | |
VelocityShares 3x Long Crude Oil ETN, 02/09/32*,2 | | | 12,950 | | | | 131,184 | |
| | |
Total Exchange Traded Notes | | | | | | | | |
(Cost $5,434,355) | | | | | | | 5,469,052 | |
| | |
Purchased Options - 0.2% | | | | | | | | |
(See Open Purchased Options schedule) | | | | | | | | |
(Cost $385,681) | | | | | | | 89,346 | |
| | |
| | | Principal
Amount | | | | |
| |
U.S. Government Obligations - 14.8% | | | | | |
| | |
United States Treasury Bill, 0.479%, 12/05/193,4 | | | $4,000,000 | | | | 3,992,558 | |
| | | | | | | | |
| | | Principal
Amount | | | Value | |
| | |
United States Treasury Bill, 0.977%, 01/30/204 | | | $4,000,000 | | | | $3,984,800 | |
| |
Total U.S. Government Obligations | | | | | |
(Cost $7,974,208) | | | | | | | 7,977,358 | |
| | |
Short-Term Investments - 30.0% | | | | | | | | |
| |
Joint Repurchase Agreements - 2.1%5 | | | | | |
| | |
Credit Suisse AG, dated 10/31/19, due 11/01/19, 1.730% total to be received $161,091 (collateralized by various U.S. Treasuries, 0.125% - 3.125%, 11/15/22 - 05/15/47, totaling $164,305) | | | 161,083 | | | | 161,083 | |
| | |
Guggenheim Securities LLC, dated 10/31/19, due 11/01/19, 1.760% total to be received $1,000,049 (collateralized by various U.S. Government Agency Obligations and U.S. Treasuries, 1.625% - 5.000%, 01/01/27 - 06/20/69, totaling $1,020,000) | | | 1,000,000 | | | | 1,000,000 | |
| | |
Total Joint Repurchase Agreements | | | | | | | 1,161,083 | |
| | |
| | | Shares | | | | |
| |
Other Investment Companies - 27.9% | | | | | |
| | |
Dreyfus Government Cash Management Fund, Institutional Shares, 1.73%6 | | | 4,938,629 | | | | 4,938,629 | |
| | |
Dreyfus Institutional Preferred Government Money Market Fund, Institutional Shares, 1.77%6 | | | 4,938,629 | | | | 4,938,629 | |
| | |
JPMorgan U.S. Government Money Market Fund, IM Shares, 1.75%6 | | | 5,088,284 | | | | 5,088,284 | |
| | |
Total Other Investment Companies | | | | | | | 14,965,542 | |
| | |
Total Short-Term Investments | | | | | | | | |
(Cost $16,126,625) | | | | | | | 16,126,625 | |
| | |
Total Investments - 102.2% | | | | | | | | |
(Cost $53,895,759) | | | | | | | 54,889,167 | |
| | |
Derivatives - (0.7)%7 | | | | | | | (350,510 | ) |
| |
Other Assets, less Liabilities - (1.5)% | | | | (854,509 | ) |
| | |
Net Assets - 100.0% | | | | | | | $53,684,148 | |
| * | Non-income producing security. |
| 1 | Some or all of these securities were held as collateral for written options as of October 31, 2019, amounting to $7,123,901 or 13.3% of net assets. |
| 2 | Some of these securities, amounting to $5,532,252 or 10.3% of net assets, were out on loan to various borrowers and are collateralized by cash and various U.S. Treasury Obligations. See Note 4 of Notes to Financial Statements. |
| 3 | Some or all of this security is held as collateral for futures contracts. The market value of collateral at October 31, 2019, amounted to $2,994,418, or 5.6% of net assets. |
| 4 | Represents yield to maturity at October 31, 2019. |
| 5 | Cash collateral received for securities lending activity was invested in these joint repurchase agreements. |
| 6 | Yield shown represents the October 31, 2019, seven day average yield, which refers to the sum of the previous seven days’ dividends paid, expressed as an annual percentage. |
| 7 | Includes Written Options and Futures Contracts. Please refer to the Open Written Options and Open Futures Contracts tables for the details. |
| REIT | Real Estate Investment Trust |
| SPDR | Standard & Poor’s Depositary Receipt |
| TIPS | Treasury Inflation-Protected Securities |
The accompanying notes are an integral part of these financial statements.
29
|
AMG FQ Global Risk-Balanced Fund Schedule of Portfolio Investments(continued) |
Open Purchased Options
| | | | | | | | | | | | | | | | | | | | | | | | |
| Description | | Strike Price | | | Expiration Date | | | Number of
Contracts | | | Notional
Amount | | | Cost | | | Value | |
EURO STOXX 50 (Put) | | | 3,050 | | | | 11/15/19 | | | | 31 | | | | $945,500 | | | | $17,524 | | | | $138 | |
EURO STOXX 50 (Put) | | | 3,300 | | | | 12/20/19 | | | | 38 | | | | 1,254,000 | | | | 14,984 | | | | 4,492 | |
EURO STOXX 50 (Put) | | | 3,300 | | | | 01/17/20 | | | | 49 | | | | 1,617,000 | | | | 23,020 | | | | 11,422 | |
EURO STOXX 50 (Put) | | | 3,325 | | | | 12/20/19 | | | | 11 | | | | 365,750 | | | | 4,163 | | | | 1,497 | |
EURO STOXX 50 (Put) | | | 3,375 | | | | 11/15/19 | | | | 19 | | | | 641,250 | | | | 5,801 | | | | 509 | |
S&P 500 Index (Put) | | | 2,680 | | | | 11/15/19 | | | | 33 | | | | 8,844,000 | | | | 155,247 | | | | 2,178 | |
S&P 500 Index (Put) | | | 2,760 | | | | 01/17/20 | | | | 20 | | | | 5,520,000 | | | | 77,122 | | | | 37,700 | |
S&P 500 Index (Put) | | | 2,785 | | | | 12/20/19 | | | | 15 | | | | 4,177,500 | | | | 54,621 | | | | 16,725 | |
S&P 500 Index (Put) | | | 2,790 | | | | 12/20/19 | | | | 11 | | | | 3,069,000 | | | | 33,199 | | | | 14,685 | |
| | | | | | | | | | | | | | | | | | | | | | | | |
| | | | | | | | | | | | | | | Total | | | | $385,681 | | | | $89,346 | |
| | | | | | | | | | | | | | | | | | | | | | | | |
Open Written Options
| | | | | | | | | | | | | | | | | | | | | | | | |
| Description | | Strike Price | | | Expiration Date | | | Number of
Contracts | | | Notional
Amount | | | Premium | | | Value | |
EURO STOXX 50 (Call) | | | 3,550 | | | | 11/15/19 | | | | 31 | | | | $1,100,500 | | | | $7,468 | | | | $(27,106 | ) |
EURO STOXX 50 (Call) | | | 3,750 | | | | 12/20/19 | | | | 11 | | | | 412,500 | | | | 1,209 | | | | (1,485 | ) |
EURO STOXX 50 (Call) | | | 3,775 | | | | 01/17/20 | | | | 49 | | | | 1,849,750 | | | | 7,126 | | | | (9,618 | ) |
EURO STOXX 50 (Call) | | | 3,800 | | | | 12/20/19 | | | | 38 | | | | 1,444,000 | | | | 4,197 | | | | (2,204 | ) |
EURO STOXX 50 (Put) | | | 2,900 | | | | 11/15/19 | | | | 31 | | | | 899,000 | | | | 10,394 | | | | (69 | ) |
EURO STOXX 50 (Put) | | | 3,200 | | | | 01/17/20 | | | | 49 | | | | 1,568,000 | | | | 15,608 | | | | (7,214 | ) |
EURO STOXX 50 (Put) | | | 3,225 | | | | 12/20/19 | | | | 38 | | | | 1,225,500 | | | | 10,834 | | | | (2,924 | ) |
EURO STOXX 50 (Put) | | | 3,250 | | | | 12/20/19 | | | | 11 | | | | 357,500 | | | | 2,932 | | | | (969 | ) |
EURO STOXX 50 (Put) | | | 3,300 | | | | 11/15/19 | | | | 19 | | | | 627,000 | | | | 3,886 | | | | (318 | ) |
S&P 500 Index (Call) | | | 3,095 | | | | 11/15/19 | | | | 33 | | | | 10,213,500 | | | | 41,873 | | | | (11,220 | ) |
S&P 500 Index (Call) | | | 3,145 | | | | 12/20/19 | | | | 11 | | | | 3,459,500 | | | | 6,731 | | | | (10,120 | ) |
S&P 500 Index (Call) | | | 3,180 | | | | 01/17/20 | | | | 20 | | | | 6,360,000 | | | | 17,598 | | | | (24,500 | ) |
S&P 500 Index (Call) | | | 3,215 | | | | 12/20/19 | | | | 15 | | | | 4,822,500 | | | | 13,083 | | | | (3,105 | ) |
S&P 500 Index (Put) | | | 2,600 | | | | 11/15/19 | | | | 33 | | | | 8,580,000 | | | | 112,546 | | | | (1,320 | ) |
S&P 500 Index (Put) | | | 2,690 | | | | 01/17/20 | | | | 20 | | | | 5,380,000 | | | | 56,798 | | | | (27,200 | ) |
S&P 500 Index (Put) | | | 2,715 | | | | 12/20/19 | | | | 15 | | | | 4,072,500 | | | | 40,790 | | | | (11,400 | ) |
S&P 500 Index (Put) | | | 2,730 | | | | 12/20/19 | | | | 11 | | | | 3,003,000 | | | | 23,979 | | | | (9,570 | ) |
| | | | | | | | | | | | | | | | | | | | | | | | |
| | | | | | | | | | | | | | | Total | | | | $377,052 | | | | $(150,342 | ) |
| | | | | | | | | | | | | | | | | | | | | | | | |
Open Futures Contracts
| | | | | | | | | | | | | | | | | | |
| Description | | Currency | | Number of
Contracts | | Position | | Expiration
Date | | | Current
Notional
Amount | | | Value and Unrealized Gain/(Loss) | |
ASX SPI 200 Index | | AUD | | 16 | | Long | | | 12/19/19 | | | | $1,830,640 | | | | $(6,942 | ) |
Australia 10-Year Bond | | AUD | | 84 | | Long | | | 12/16/19 | | | | 8,443,138 | | | | (10,434 | ) |
Canadian 10-Year Bond | | CAD | | 77 | | Long | | | 12/18/19 | | | | 8,303,910 | | | | (144,318 | ) |
EURO STOXX 50 | | EUR | | 117 | | Long | | | 12/20/19 | | | | 4,709,386 | | | | 132,915 | |
FTSE 100 Index | | GBP | | 13 | | Long | | | 12/20/19 | | | | 1,220,197 | | | | (6,268 | ) |
Hang Seng Index | | HKD | | 5 | | Long | | | 11/28/19 | | | | 860,904 | | | | 9,292 | |
The accompanying notes are an integral part of these financial statements.
30
|
AMG FQ Global Risk-Balanced Fund Schedule of Portfolio Investments(continued) |
| | | | | | | | | | | | | | | | | | |
| Description | | Currency | | Number of
Contracts | | Position | | Expiration
Date | | | Current
Notional
Amount | | | Value and Unrealized Gain/(Loss) | |
MSCI Emerging Markets Index | | USD | | 80 | | Long | | | 12/20/19 | | | | $4,165,600 | | | | $43,415 | |
Russell 2000® Mini Index | | USD | | 61 | | Long | | | 12/20/19 | | | | 4,768,370 | | | | (51,270 | ) |
S&P 500 E-Mini FUT Index | | USD | | 10 | | Long | | | 12/20/19 | | | | 1,517,900 | | | | 16,017 | |
S&P/TSX 60 Index | | CAD | | 10 | | Long | | | 12/19/19 | | | | 1,495,559 | | | | (20,241 | ) |
TOPIX Index | | JPY | | 8 | | Long | | | 12/12/19 | | | | 1,236,040 | | | | 109,566 | |
U.K. 10-Year Gilt | | GBP | | 69 | | Long | | | 12/27/19 | | | | 11,873,159 | | | | (81,012 | ) |
U.S. Treasury 10-Year Note (CBT) | | USD | | 166 | | Long | | | 12/19/19 | | | | 21,629,282 | | | | (190,888 | ) |
| | | | | | | | | | | | | | | | | | |
| | | | | | | | | | | | | Total | | | | $(200,168 | ) |
| | | | | | | | | | | | | | | | | | |
CURRENCY ABBREVIATIONS:
The following table summarizes the inputs used to value the Fund’s investments by the fair value hierarchy levels as of October 31, 2019:
| | | | | | | | | | | | | | | | |
| | | Level 1 | | Level 2 | | Level 3 | | Total |
Investments in Securities | | | | | | | | | | | | | | | | |
Exchange Traded Funds† | | | $25,226,786 | | | | — | | | | — | | | | $25,226,786 | |
Exchange Traded Notes† | | | 5,469,052 | | | | — | | | | — | | | | 5,469,052 | |
Purchased Options | | | | | | | | | | | | | | | | |
Equity Contracts | | | 89,346 | | | | — | | | | — | | | | 89,346 | |
U.S. Government Obligations | | | — | | | | $7,977,358 | | | | — | | | | 7,977,358 | |
Short-Term Investments | | | | | | | | | | | | | | | | |
Joint Repurchase Agreements | | | — | | | | 1,161,083 | | | | — | | | | 1,161,083 | |
| | | | |
Other Investment Companies | | | 14,965,542 | | | | — | | | | — | | | | 14,965,542 | |
| | | | | | | | | | | | | | | | |
| | | | |
Total Investments in Securities | | | $45,750,726 | | | | $9,138,441 | | | | — | | | | $54,889,167 | |
| | | | | | | | | | | | | | | | |
Financial Derivative Instruments - Assets | | | | | | | | | | | | | | | | |
Equity Futures Contracts | | | $311,205 | | | | — | | | | — | | | | $311,205 | |
Financial Derivative Instruments - Liabilities | | | | | | | | | | | | | | | | |
Equity Written Options and Futures Contracts | | | (235,063 | ) | | | — | | | | — | | | | (235,063 | ) |
| | | | |
Interest Rate Futures Contracts | | | (426,652 | ) | | | — | | | | — | | | | (426,652 | ) |
| | | | | | | | | | | | | | | | |
| | | | |
Total Financial Derivative Instruments | | | $(350,510 | ) | | | — | | | | — | | | | $(350,510 | ) |
| | | | | | | | | | | | | | | | |
| † | All exchange traded funds and exchange traded notes held in the Fund are level 1 securities. For a detailed listing of these securities, please refer to the Fund’s Schedule of Portfolio Investments. |
For the fiscal year ended October 31, 2019, there were no transfers in or out of Level 3.
The accompanying notes are an integral part of these financial statements.
31
|
AMG FQ Global Risk-Balanced Fund Schedule of Portfolio Investments(continued) |
The following schedule shows the value of derivative instruments at October 31, 2019:
| | | | | | | | | | | | |
| | | Asset Derivatives | | | Liability Derivatives | |
| | | | |
Derivatives not accounted
for as hedging instruments | | Statement of Assets and
Liabilities Location | | Fair Value | | | Statement of Assets and
Liabilities Location | | Fair Value | |
| | | | |
Equity contracts | | Options purchased1 | | | $89,346 | | | Options written | | | $150,342 | |
| | | | |
Equity contracts | | Receivable for variation margin2 | | | 14,596 | | | Payable for variation margin2 | | | 95,644 | |
| | | | |
Interest rate contracts | | Receivable for variation margin2 | | | 232,141 | | | | | | — | |
| | | | | | | | | | | | |
| | | | |
| | Totals | | | $336,083 | | | | | | $245,986 | |
| | | | | | | | | | | | |
For the year ended October 31, 2019 the effect of derivative instruments on the Statement of Operations for the Fund and the amount of realized gain/loss and unrealized appreciation/depreciation on derivatives recognized in income was as follows:
| | | | | | | | | | | | |
| | | Realized Gain/(Loss) | | | Change in Unrealized Appreciation/Depreciation | |
| | | | |
Derivatives not accounted
for as hedging instruments | | Statement of Operations
Location | | Realized Gain/(Loss) | | | Statement of Operations
Location | | Change in
Unrealized
Appreciation/
Depreciation | |
| | | | |
Equity contracts | | Net realized loss on options purchased1 | | | $(153,053 | ) | | Net change in unrealized appreciation/ depreciation on options purchased1 | | | $(541,109 | ) |
| | | | |
Equity contracts | | Net realized loss on futures contracts | | | (397,794 | ) | | Net change in unrealized appreciation/depreciation on future contracts | | | 2,413,783 | |
| | | | |
Interest rate contracts | | Net realized gain on futures contracts | | | 3,693,504 | | | Net change in unrealized appreciation/ depreciation on futures contracts | | | (280,587 | ) |
| | | | |
Equity contracts | | Net realized loss on options written | | | (119,937 | ) | | Net change in unrealized appreciation/ depreciation options written | | | 363,759 | |
| | | | | | | | | | | | |
| | Totals | | | $3,022,720 | | | | | | $1,955,846 | |
| | | | | | | | | | | | |
1 Options purchased are included in Investments at value on the Statement of Assets and Liabilities. Net realized gain/(loss) on options purchased and net change in unrealized appreciation/depreciation on options purchased are included in the net realized gain/(loss) on investments and net change in unrealized appreciation/depreciation of investments, respectively, on the Statement of Operations.
2 Only current day’s variation margin is reported within the Statement of Assets and Liabilities. The variation margin is included in the open futures cumulative appreciation/depreciation of $(200,168).
The accompanying notes are an integral part of these financial statements.
32
|
Statement of Assets and Liabilities October 31, 2019 |
| | | | | | | | | | | | | | | |
| | | AMG FQ
Tax-Managed
U.S.
Equity Fund | | AMG
FQ Long-Short
Equity Fund | | AMG
FQ Global
Risk-Balanced Fund |
Assets: | | | | | | | | | | | | | | | |
| | | |
Investments at value1(including securities on loan valued at $4,054,457, $788,425, and $5,532,252, respectively) | | | | $70,265,053 | | | | | $90,517,947 | | | | | $54,889,167 | |
| | | |
Cash deposit with brokers for futures contracts (see Note 9) | | | | — | | | | | 2,082,541 | | | | | — | |
Receivable for investments sold | | | | — | | | | | 7,163,842 | | | | | — | |
Segregated cash | | | | — | | | | | 5,120,000 | | | | | — | |
Dividend, interest and other receivables | | | | 25,585 | | | | | 58,544 | | | | | 24,546 | |
Receivable for Fund shares sold | | | | — | | | | | 208,827 | | | | | 50 | |
Receivable from affiliate | | | | 2,585 | | | | | 5,356 | | | | | 250 | |
Swaps at value | | | | — | | | | | 288,921 | | | | | — | |
Receivable for variation margin | | | | — | | | | | — | | | | | 246,737 | |
Prepaid expenses and other assets | | | | 14,181 | | | | | 15,017 | | | | | 11,951 | |
Total assets | | | | 70,307,404 | | | | | 105,460,995 | | | | | 55,172,701 | |
Liabilities: | | | | | | | | | | | | | | | |
Payable upon return of securities loaned | | | | 258,645 | | | | | 291,245 | | | | | 1,161,083 | |
Payable for investments purchased | | | | — | | | | | 7,197,666 | | | | | — | |
Payable for Fund shares repurchased | | | | — | | | | | 48,697 | | | | | 500 | |
Written options2 | | | | — | | | | | — | | | | | 150,342 | |
Payable for variation margin | | | | — | | | | | — | | | | | 95,644 | |
Swaps at value | | | | — | | | | | 185,307 | | | | | — | |
Accrued expenses: | | | | | | | | | | | | | | | |
Investment advisory and management fees | | | | 40,456 | | | | | 28,130 | | | | | 27,176 | |
Administrative fees | | | | 8,669 | | | | | 12,056 | | | | | 6,794 | |
Distribution fees | | | | 1,684 | | | | | 2,999 | | | | | 482 | |
Shareholder service fees | | | | — | | | | | 8,982 | | | | | 565 | |
Other | | | | 42,307 | | | | | 62,078 | | | | | 45,967 | |
Total liabilities | | | | 351,761 | | | | | 7,837,160 | | | | | 1,488,553 | |
| | | | | | | | | | | | | | | |
Net Assets | | | | $69,955,643 | | | | | $97,623,835 | | | | | $53,684,148 | |
1Investments at cost | | | | $37,768,117 | | | | | $87,853,953 | | | | | $53,895,759 | |
2Premiums received | | | | — | | | | | — | | | | | $377,052 | |
The accompanying notes are an integral part of these financial statements.
33
|
Statement of Assets and Liabilities(continued) |
| | | | | | | | | | | | | | | |
| | | AMG FQ
Tax-Managed
U.S.
Equity Fund | | AMG
FQ Long-Short
Equity Fund | | AMG
FQ Global
Risk-Balanced Fund |
| | | |
Net Assets Represent: | | | | | | | | | | | | | | | |
Paid-in capital | | | | $37,131,382 | | | | | $90,866,443 | | | | | $51,386,587 | |
Total distributable earnings | | | | 32,824,261 | | | | | 6,757,392 | | | | | 2,297,561 | |
Net Assets | | | | $69,955,643 | | | | | $97,623,835 | | | | | $53,684,148 | |
| | | |
Class N: | | | | | | | | | | | | | | | |
Net Assets | | | | $8,188,348 | | | | | $14,300,697 | | | | | $2,339,726 | |
Shares outstanding | | | | 238,530 | | | | | 881,823 | | | | | 141,490 | |
| | | |
Net asset value, offering and redemption price per share | | | | $34.33 | | | | | $16.22 | | | | | $16.54 | |
Class I: | | | | | | | | | | | | | | | |
Net Assets | | | | $61,767,295 | | | | | $83,323,138 | | | | | $2,181,694 | |
Shares outstanding | | | | 1,800,234 | | | | | 5,127,118 | | | | | 131,243 | |
| | | |
Net asset value, offering and redemption price per share | | | | $34.31 | | | | | $16.25 | | | | | $16.62 | |
Class Z: | | | | | | | | | | | | | | | |
Net Assets | | | | — | | | | | — | | | | | $49,162,728 | |
Shares outstanding | | | | — | | | | | — | | | | | 2,957,212 | |
| | | |
Net asset value, offering and redemption price per share | | | | — | | | | | — | | | | | $16.62 | |
The accompanying notes are an integral part of these financial statements.
34
|
Statements of Operations For the fiscal year ended October 31, 2019 |
| | | | | | | | | | | | | | | |
| | | AMG FQ
Tax-Managed
U.S.
Equity Fund | | AMG
FQ Long-Short
Equity Fund | | AMG
FQ Global
Risk-Balanced Fund |
Investment Income: | | | | | | | | | | | | | | | |
Dividend income | | | | $964,428 | 1 | | | | $1,560,351 | 1 | | | | $1,185,114 | |
Interest income | | | | — | | | | | 199,425 | | | | | 175,891 | |
Securities lending income | | | | 5,462 | | | | | 3,313 | | | | | 53,658 | |
Foreign withholding tax | | | | (1,149 | ) | | | | (643 | ) | | | | — | |
Total investment income | | | | 968,741 | | | | | 1,762,446 | | | | | 1,414,663 | |
Expenses: | | | | | | | | | | | | | | | |
Investment advisory and management fees | | | | 479,726 | | | | | 305,901 | | | | | 318,350 | |
Administrative fees | | | | 102,798 | | | | | 131,100 | | | | | 79,588 | |
Distribution fees - Class N | | | | 20,562 | | | | | 49,815 | | | | | 4,815 | |
Shareholder servicing fees - Class N | | | | — | | | | | 19,926 | | | | | 2,889 | |
Shareholder servicing fees - Class I | | | | — | | | | | 38,932 | | | | | 2,697 | |
Registration fees | | | | 34,607 | | | | | 46,110 | | | | | 47,086 | |
Professional fees | | | | 31,129 | | | | | 51,330 | | | | | 36,456 | |
Custodian fees | | | | 23,726 | | | | | 39,962 | | | | | 22,970 | |
Reports to shareholders | | | | 14,044 | | | | | 24,909 | | | | | 9,410 | |
Transfer agent fees | | | | 12,089 | | | | | 19,370 | | | | | 11,236 | |
Trustee fees and expenses | | | | 6,328 | | | | | 7,375 | | | | | 4,976 | |
Interest and dividend expense (see Note 14) | | | | — | | | | | 201,083 | | | | | — | |
Miscellaneous | | | | 3,730 | | | | | 9,039 | | | | | 3,974 | |
Repayment of prior reimbursements | | | | — | | | | | 7,151 | | | | | — | |
Total expenses before offsets | | | | 728,739 | | | | | 952,003 | | | | | 544,447 | |
Expense reimbursements | | | | (98,178 | ) | | | | (34,444 | ) | | | | (61,763 | ) |
Expense reductions | | | | (3,939 | ) | | | | (1,387 | ) | | | | — | |
Net expenses | | | | 626,622 | | | | | 916,172 | | | | | 482,684 | |
| | | | | | | | | | | | | | | |
Net investment income | | | | 342,119 | | | | | 846,274 | | | | | 931,979 | |
Net Realized and Unrealized Gain: | | | | | | | | | | | | | | | |
Net realized gain (loss) on investments | | | | 110,218 | | | | | (1,108,265 | ) | | | | (111,357 | ) |
Net realized gain on short sales | | | | — | | | | | 9,930,336 | | | | | — | |
Net realized gain on futures contracts | | | | — | | | | | 2,788,996 | | | | | 3,295,710 | |
Net realized loss on written options | | | | — | | | | | — | | | | | (119,937 | ) |
Net realized loss on swaps | | | | — | | | | | (9,285,157 | ) | | | | — | |
Net realized loss on foreign currency transactions | | | | — | | | | | — | | | | | (7,582 | ) |
Net change in unrealized appreciation/depreciation on investments | | | | 5,907,820 | | | | | 5,405,099 | | | | | 1,580,480 | |
Net change in unrealized appreciation/depreciation on short sales | | | | — | | | | | (4,443,692 | ) | | | | — | |
Net change in unrealized appreciation/depreciation on futures contracts | | | | — | | | | | 1,284,680 | | | | | 2,133,196 | |
Net change in unrealized appreciation/depreciation on written options | | | | — | | | | | — | | | | | 363,759 | |
Net change in unrealized appreciation/depreciation on swaps | | | | — | | | | | 61,429 | | | | | — | |
| | | |
Net change in unrealized appreciation/depreciation on foreign currency translations | | | | — | | | | | — | | | | | 796 | |
Net realized and unrealized gain | | | | 6,018,038 | | | | | 4,633,426 | | | | | 7,135,065 | |
| | | | | | | | | | | | | | | |
Net increase in net assets resulting from operations | | | | $6,360,157 | | | | | $5,479,700 | | | | | $8,067,044 | |
| 1 | Includes non-recurring dividends of $59,643 and $252,259 for AMG FQ Tax-Managed U.S. Equity and AMG FQ Long-Short Equity Fund, respectively. |
The accompanying notes are an integral part of these financial statements.
35
|
Statements of Changes in Net Assets For the fiscal years ended October 31, |
| | | | | | | | | | | | | | | | | | | | | | | | | | | | | | |
| | | AMG FQ
Tax-Managed
U.S. Equity Fund | | AMG
FQ Long-Short
Equity Fund | | AMG
FQ Global
Risk-Balanced Fund |
| | | 2019 | | 2018 | | 2019 | | 2018 | | 2019 | | 2018 |
| | | | | | |
Increase (Decrease) in Net Assets Resulting From Operations: | | | | | | | | | | | | | | | | | | | | | | | | | | | | | | |
Net investment income (loss) | | | | $342,119 | | | | | $227,977 | | | | | $846,274 | | | | | $(82,287 | ) | | | | $931,979 | | | | | $1,233,469 | |
Net realized gain (loss) on investments | | | | 110,218 | | | | | 914,936 | | | | | 2,325,910 | | | | | 4,767,354 | | | | | 3,056,834 | | | | | (581,029 | ) |
| | | | | | |
Net change in unrealized appreciation/depreciation on investments | | | | 5,907,820 | | | | | 3,849,141 | | | | | 2,307,516 | | | | | (252,193 | ) | | | | 4,078,231 | | | | | (4,791,983 | ) |
| | | | | | |
Net increase (decrease) in net assets resulting from operations | | | | 6,360,157 | | | | | 4,992,054 | | | | | 5,479,700 | | | | | 4,432,874 | | | | | 8,067,044 | | | | | (4,139,543 | ) |
Distributions to Shareholders: | | | | | | | | | | | | | | | | | | | | | | | | | | | | | | |
Class N | | | | (128,969 | ) | | | | (12,973 | ) | | | | (1,339,503 | ) | | | | (735,101 | ) | | | | (37,124 | ) | | | | (5,692 | ) |
Class I | | | | (1,073,001 | ) | | | | (296,023 | ) | | | | (2,076,653 | ) | | | | (8,503,620 | ) | | | | (33,497 | ) | | | | (4,577 | ) |
Class Z | | | | — | | | | | — | | | | | — | | | | | — | | | | | (1,184,019 | ) | | | | (397,638 | ) |
Total distributions to shareholders | | | | (1,201,970 | ) | | | | (308,996 | ) | | | | (3,416,156 | ) | | | | (9,238,721 | ) | | | | (1,254,640 | ) | | | | (407,907 | ) |
Capital Share Transactions:1 | | | | | | | | | | | | | | | | | | | | | | | | | | | | | | |
Net increase (decrease) from capital share transactions | | | | (8,264,352 | ) | | | | (4,173,164 | ) | | | | 15,433,917 | | | | | 44,435,042 | | | | | (6,539,924 | ) | | | | (5,373,466 | ) |
| | | | | | | | | | | | | | | | | | | | | | | | | | | | | | | |
Total increase (decrease) in net assets | | | | (3,106,165 | ) | | | | 509,894 | | | | | 17,497,461 | | | | | 39,629,195 | | | | | 272,480 | | | | | (9,920,916 | ) |
Net Assets: | | | | | | | | | | | | | | | | | | | | | | | | | | | | | | |
Beginning of year | | | | 73,061,808 | | | | | 72,551,914 | | | | | 80,126,374 | | | | | 40,497,179 | | | | | 53,411,668 | | | | | 63,332,584 | |
End of year | | | | $69,955,643 | | | | | $73,061,808 | | | | | $97,623,835 | | | | | $80,126,374 | | | | | $53,684,148 | | | | | $53,411,668 | |
| 1 | See Note 1(g) of the Notes to Financial Statements. |
The accompanying notes are an integral part of these financial statements.
36
|
AMG FQ Tax-Managed U.S. Equity Fund Financial Highlights For a share outstanding throughout each fiscal year |
| | | | | | | | | | | | | | | | | | | | | | | | | |
| | | For the fiscal year ended October 31, |
| | | | | |
| Class N | | 2019 | | 2018 | | 2017 | | 20161 | | 2015 |
Net Asset Value, Beginning of Year | | | | $31.68 | | | | | $29.69 | | | | | $24.11 | | | | | $24.42 | | | | | $23.58 | |
Income (loss) from Investment Operations: | | | | | | | | | | | | | | | | | | | | | | | | | |
Net investment income2,3 | | | | 0.09 | 4 | | | | 0.03 | | | | | 0.03 | 5 | | | | 0.22 | 6 | | | | 0.08 | 7 |
Net realized and unrealized gain (loss) on investments | | | | 3.02 | | | | | 2.00 | | | | | 5.79 | | | | | (0.43 | ) | | | | 0.81 | |
Total income (loss) from investment operations | | | | 3.11 | | | | | 2.03 | | | | | 5.82 | | | | | (0.21 | ) | | | | 0.89 | |
Less Distributions to Shareholders from: | | | | | | | | | | | | | | | | | | | | | | | | | |
Net investment income | | | | (0.05 | ) | | | | — | | | | | (0.24 | ) | | | | (0.10 | ) | | | | (0.05 | ) |
Net realized gain on investments | | | | (0.41 | ) | | | | (0.04 | ) | | | | — | | | | | — | | | | | — | |
Total distributions to shareholders | | | | (0.46 | ) | | | | (0.04 | ) | | | | (0.24 | ) | | | | (0.10 | ) | | | | (0.05 | ) |
Net Asset Value, End of Year | | | | $34.33 | | | | | $31.68 | | | | | $29.69 | | | | | $24.11 | | | | | $24.42 | |
Total Return3,8 | | | | 10.15 | % | | | | 6.84 | % | | | | 24.27 | % | | | | (0.86 | )% | | | | 3.79 | % |
Ratio of net expenses to average net assets | | | | 1.13 | %9 | | | | 1.14 | %9 | | | | 1.14 | % | | | | 1.14 | % | | | | 1.20 | % |
Ratio of gross expenses to average net assets10 | | | | 1.28 | % | | | | 1.26 | % | | | | 1.27 | % | | | | 1.26 | % | | | | 1.27 | % |
Ratio of net investment income to average net assets3 | | | | 0.28 | % | | | | 0.09 | % | | | | 0.13 | % | | | | 0.93 | % | | | | 0.34 | % |
Portfolio turnover | | | | 34 | % | | | | 31 | % | | | | 75 | % | | | | 102 | % | | | | 62 | % |
Net assets end of year (000’s) omitted | | | | $8,188 | | | | | $9,622 | | | | | $12,131 | | | | | $22,885 | | | | | $24,825 | |
| | | | | | | | | | | | | | | | | | | | | | | | | | |
37
|
AMG FQ Tax-Managed U.S. Equity Fund Financial Highlights For a share outstanding throughout each fiscal year |
| | | | | | | | | | | | | | | | | | | | | | | | | |
| | | For the fiscal year ended October 31, |
| | | | | |
| Class I | | 2019 | | 2018 | | 2017 | | 20161 | | 2015 |
Net Asset Value, Beginning of Year | | | | $31.69 | | | | | $29.72 | | | | | $24.14 | | | | | $24.42 | | | | | $23.56 | |
Income (loss) from Investment Operations: | | | | | | | | | | | | | | | | | | | | | | | | | |
Net investment income2,3 | | | | 0.17 | 4 | | | | 0.11 | | | | | 0.10 | 5 | | | | 0.28 | 6 | | | | 0.17 | 7 |
Net realized and unrealized gain (loss) on investments | | | | 3.00 | | | | | 2.00 | | | | | 5.79 | | | | | (0.43 | ) | | | | 0.78 | |
Total income (loss) from investment operations | | | | 3.17 | | | | | 2.11 | | | | | 5.89 | | | | | (0.15 | ) | | | | 0.95 | |
Less Distributions to Shareholders from: | | | | | | | | | | | | | | | | | | | | | | | | | |
Net investment income | | | | (0.14 | ) | | | | (0.10 | ) | | | | (0.31 | ) | | | | (0.13 | ) | | | | (0.09 | ) |
Net realized gain on investments | | | | (0.41 | ) | | | | (0.04 | ) | | | | — | | | | | — | | | | | — | |
Total distributions to shareholders | | | | (0.55 | ) | | | | (0.14 | ) | | | | (0.31 | ) | | | | (0.13 | ) | | | | (0.09 | ) |
Net Asset Value, End of Year | | | | $34.31 | | | | | $31.69 | | | | | $29.72 | | | | | $24.14 | | | | | $24.42 | |
Total Return3,8 | | | | 10.40 | % | | | | 7.13 | % | | | | 24.57 | % | | | | (0.59 | )% | | | | 4.03 | % |
Ratio of net expenses to average net assets | | | | 0.88 | %9 | | | | 0.89 | %9 | | | | 0.89 | % | | | | 0.89 | % | | | | 0.96 | % |
Ratio of gross expenses to average net assets10 | | | | 1.03 | % | | | | 1.01 | % | | | | 1.02 | % | | | | 1.01 | % | | | | 1.03 | % |
Ratio of net investment income to average net assets3 | | | | 0.53 | % | | | | 0.34 | % | | | | 0.38 | % | | | | 1.19 | % | | | | 0.68 | % |
Portfolio turnover | | | | 34 | % | | | | 31 | % | | | | 75 | % | | | | 102 | % | | | | 62 | % |
Net assets end of year (000’s) omitted | | | | $61,767 | | | | | $63,440 | | | | | $60,421 | | | | | $53,494 | | | | | $56,493 | |
| | | | | | | | | | | | | | | | | | | | | | | | | | |
| 1 | Effective October 1, 2016, the Investor Class and Institutional Class were renamed Class N and Class I, respectively. |
| 2 | Per share numbers have been calculated using average shares. |
| 3 | Total returns and net investment income would have been lower had certain expenses not been offset. |
| 4 | Includes non-recurring dividends. Without these dividends, net investment income per share would have been $0.06 and $0.14 for Class N and Class I, respectively. |
| 5 | Includes non-recurring dividends. Without these dividends, net investment income per share would have been $0.01 and $0.08 for Class N and Class I, respectively. |
| 6 | Includes non-recurring dividends. Without these dividends, net investment income per share would have been $0.11 and $0.17 for Class N and Class I, respectively. |
| 7 | Includes non-recurring dividends. Without these dividends, net investment income per share would have been $0.00 and $0.09 for Class N and Class I, respectively. |
| 8 | The total return is calculated using the published Net Asset Value as of fiscal year end. |
| 9 | Includes reduction from broker recapture amounting to 0.01% and less than 0.01% for the fiscal years ended October 31, 2019 and October 31, 2018, respectively. |
| 10 | Excludes the impact of expense reimbursement or fee waivers and expense reductions such as brokerage credits, but includes expense repayments and non-reimbursable expenses, if any, such as interest, taxes, and extraordinary expenses. (See Note 1(c) and 2 in the Notes to Financial Statements.) |
38
|
AMG FQ Long-Short Equity Fund Financial Highlights For a share outstanding throughout each fiscal year |
| | | | | | | | | | | | | | | | | | | | | | | | | |
| | | For the fiscal year ended October 31, |
| | | | | |
| Class N | | 2019 | | 2018 | | 2017 | | 20161 | | 2015 |
Net Asset Value, Beginning of Year | | | | $15.68 | | | | | $17.97 | | | | | $15.48 | | | | | $17.38 | | | | | $17.20 | |
Income (loss) from Investment Operations: | | | | | | | | | | | | | | | | | | | | | | | | | |
Net investment income (loss)2,3 | | | | 0.12 | 4 | | | | (0.07 | ) | | | | 0.10 | 5 | | | | 0.14 | | | | | 0.16 | 6 |
Net realized and unrealized gain (loss) on investments | | | | 0.95 | | | | | 1.94 | | | | | 3.30 | | | | | (0.31 | ) | | | | 0.17 | |
Total income (loss) from investment operations | | | | 1.07 | | | | | 1.87 | | | | | 3.40 | | | | | (0.17 | ) | | | | 0.33 | |
Less Distributions to Shareholders from: | | | | | | | | | | | | | | | | | | | | | | | | | |
Net investment income | | | | (0.02 | ) | | | | — | | | | | (0.16 | ) | | | | (0.15 | ) | | | | (0.15 | ) |
Net realized gain on investments | | | | (0.51 | ) | | | | (4.16 | ) | | | | (0.75 | ) | | | | (1.58 | ) | | | | — | |
Total distributions to shareholders | | | | (0.53 | ) | | | | (4.16 | ) | | | | (0.91 | ) | | | | (1.73 | ) | | | | (0.15 | ) |
Net Asset Value, End of Year | | | | $16.22 | | | | | $15.68 | | | | | $17.97 | | | | | $15.48 | | | | | $17.38 | |
Total Return3,7 | | | | 7.15 | % | | | | 12.54 | % | | | | 22.62 | % | | | | (0.98 | )% | | | | 1.90 | % |
Ratio of net expenses to average net assets | | | | 1.28 | %8,9 | | | | 2.24 | %8,9,10 | | | | 1.09 | %9 | | | | 1.05 | % | | | | 1.04 | % |
Ratio of gross expenses to average net assets11 | | | | 1.30 | % | | | | 2.36 | %10 | | | | 1.14 | % | | | | 1.08 | % | | | | 1.05 | % |
| | | | | |
Ratio of net investment income (loss) to average net assets3 | | | | 0.74 | % | | | | (0.43 | )% | | | | 0.60 | % | | | | 0.88 | % | | | | 0.93 | % |
Portfolio turnover | | | | 330 | % | | | | 240 | % | | | | 159 | % | | | | 178 | % | | | | 139 | % |
Net assets end of year (000’s) omitted | | | | $14,301 | | | | | $24,536 | | | | | $3,495 | | | | | $24,752 | | | | | $30,043 | |
| | | | | | | | | | | | | | | | | | | | | | | | | | |
39
|
AMG FQ Long-Short Equity Fund Financial Highlights For a share outstanding throughout each fiscal year |
| | | | | | | | | | | | | | | | | | | | | | | | | |
| | | For the fiscal year ended October 31, |
| | | | | |
| Class I | | 2019 | | 2018 | | 2017 | | 20161 | | 2015 |
Net Asset Value, Beginning of Year | | | | $15.71 | | | | | $17.97 | | | | | $15.47 | | | | | $17.37 | | | | | $17.22 | |
Income (loss) from Investment Operations: | | | | | | | | | | | | | | | | | | | | | | | | | |
Net investment income (loss)2,3 | | | | 0.16 | 4 | | | | (0.02 | ) | | | | 0.15 | 5 | | | | 0.18 | | | | | 0.21 | 6 |
Net realized and unrealized gain (loss) on investments | | | | 0.95 | | | | | 1.92 | | | | | 3.33 | | | | | (0.31 | ) | | | | 0.16 | |
Total income (loss) from investment operations | | | | 1.11 | | | | | 1.90 | | | | | 3.48 | | | | | (0.13 | ) | | | | 0.37 | |
Less Distributions to Shareholders from: | | | | | | | | | | | | | | | | | | | | | | | | | |
Net investment income | | | | (0.06 | ) | | | | — | | | | | (0.23 | ) | | | | (0.19 | ) | | | | (0.22 | ) |
Net realized gain on investments | | | | (0.51 | ) | | | | (4.16 | ) | | | | (0.75 | ) | | | | (1.58 | ) | | | | — | |
Total distributions to shareholders | | | | (0.57 | ) | | | | (4.16 | ) | | | | (0.98 | ) | | | | (1.77 | ) | | | | (0.22 | ) |
Net Asset Value, End of Year | | | | $16.25 | | | | | $15.71 | | | | | $17.97 | | | | | $15.47 | | | | | $17.37 | |
Total Return3,7 | | | | 7.43 | % | | | | 12.82 | % | | | | 23.11 | % | | | | (0.73 | )% | | | | 2.16 | % |
Ratio of net expenses to average net assets | | | | 0.99 | %8,9 | | | | 1.92 | %8,9,10 | | | | 0.78 | %9 | | | | 0.79 | % | | | | 0.79 | % |
Ratio of gross expenses to average net assets11 | | | | 1.01 | % | | | | 2.04 | %10 | | | | 0.87 | % | | | | 0.82 | % | | | | 0.79 | % |
| | | | | |
Ratio of net investment income (loss) to average net assets3 | | | | 1.03 | % | | | | (0.11 | )% | | | | 0.90 | % | | | | 1.14 | % | | | | 1.22 | % |
Portfolio turnover | | | | 330 | % | | | | 240 | % | | | | 159 | % | | | | 178 | % | | | | 139 | % |
Net assets end of year (000’s) omitted | | | | $83,323 | | | | | $55,590 | | | | | $37,002 | | | | | $33,715 | | | | | $37,313 | |
| | | | | | | | | | | | | | | | | | | | | | | | | | |
| 1 | Effective October 1, 2016, the Investor Class and Institutional Class were renamed Class N and Class I, respectively. |
| 2 | Per share numbers have been calculated using average shares. |
| 3 | Total returns and net investment income (loss) would have been lower had certain expenses not been offset. |
| 4 | Includes non-recurring dividends. Without these dividends, net investment income per share would have been $0.07 and $0.12 for Class N and Class I, respectively. |
| 5 | Includes non-recurring dividends. Without these dividends, net investment income per share would have been $0.07 and $0.12 for Class N and Class I, respectively. |
| 6 | Includes non-recurring dividends. Without these dividends, net investment income per share would have been $0.11 and $0.16 for Class N and Class I, respectively. |
| 7 | The total return is calculated using the published Net Asset Value as of fiscal year end. |
| 8 | Includes reduction from broker recapture amounting to less than 0.01% and 0.01% for the fiscal years ended October 31, 2019 and October 31, 2018, respectively. |
| 9 | Expense ratio includes dividend and interest expense related to securities sold short. Excluding such dividend and interest expense, the ratio of expenses to average net assets would be 1.04% and 0.75%, 1.04% and 0.72% and 1.04% and 0.73% for Class N and Class I, respectively, for the fiscal years ended October 31, 2019, October 31, 2018 and October 31, 2017, respectively. |
| 10 | Ratios of net expenses and of gross expenses to average net assets were revised from 2.83% and 2.95% for Class N, respectively, and 2.51% and 2.63% for Class I, respectively, to reflect net presentation of income received and fees paid on short sales. |
| 11 | Excludes the impact of expense reimbursement or fee waivers and expense reductions such as brokerage credits, but includes expense repayments and non-reimbursable expenses, if any, such as interest, taxes, and extraordinary expenses. (See Note 1(c) and 2 in the Notes to Financial Statements.) |
40
|
AMG FQ Global Risk-Balanced Fund Financial Highlights For a share outstanding throughout each fiscal year |
| | | | | | | | | | | | | | | | | | | | | | | | | |
| | | For the fiscal year ended October 31, |
| | | | | |
| Class N | | 2019 | | 2018 | | 2017 | | 20161 | | 2015 |
Net Asset Value, Beginning of Year | | | | $14.56 | | | | | $15.77 | | | | | $13.89 | | | | | $12.93 | | | | | $13.84 | |
Income (loss) from Investment Operations: | | | | | | | | | | | | | | | | | | | | | | | | | |
Net investment income (loss)2,3 | | | | 0.21 | | | | | 0.26 | | | | | 0.11 | | | | | (0.02 | ) | | | | 0.05 | |
Net realized and unrealized gain (loss) on investments | | | | 2.06 | | | | | (1.43 | ) | | | | 1.91 | | | | | 1.16 | | | | | (0.64 | ) |
Total income (loss) from investment operations | | | | 2.27 | | | | | (1.17 | ) | | | | 2.02 | | | | | 1.14 | | | | | (0.59 | ) |
Less Distributions to Shareholders from: | | | | | | | | | | | | | | | | | | | | | | | | | |
Net investment income | | | | (0.29 | ) | | | | (0.04 | ) | | | | (0.14 | ) | | | | (0.18 | ) | | | | (0.32 | ) |
Net Asset Value, End of Year | | | | $16.54 | | | | | $14.56 | | | | | $15.77 | | | | | $13.89 | | | | | $12.93 | |
Total Return3,4 | | | | 15.98 | % | | | | (7.43 | )% | | | | 14.69 | % | | | | 8.97 | % | | | | (4.31 | )% |
Ratio of net expenses to average net assets | | | | 1.29 | % | | | | 1.29 | % | | | | 1.33 | % | | | | 1.39 | % | | | | 1.38 | % |
Ratio of gross expenses to average net assets5 | | | | 1.41 | % | | | | 1.37 | % | | | | 1.39 | % | | | | 1.55 | % | | | | 1.51 | % |
Ratio of net investment income (loss) to average net assets3 | | | | 1.38 | % | | | | 1.67 | % | | | | 0.76 | % | | | | (0.15 | )% | | | | 0.36 | % |
Portfolio turnover | | | | 15 | % | | | | 27 | % | | | | 26 | % | | | | 71 | % | | | | 55 | % |
Net assets end of year (000’s) omitted | | | | $2,340 | | | | | $1,870 | | | | | $2,200 | | | | | $3,725 | | | | | $2,083 | |
| | | | | | | | | | | | | | | | | | | | | | | | | | |
41
|
AMG FQ Global Risk-Balanced Fund Financial Highlights For a share outstanding throughout each fiscal year |
| | | | | | | | | | | | | | | | | | | | |
| | | For the fiscal year ended October 31, | |
| | | | | |
| Class I | | 2019 | | | 2018 | | | 2017 | | | 20161 | | | 2015 | |
Net Asset Value, Beginning of Year | | $ | 14.64 | | | $ | 15.83 | | | $ | 13.97 | | | $ | 13.02 | | | $ | 13.98 | |
Income (loss) from Investment Operations: | | | | | | | | | | | | | | | | | | | | |
Net investment income (loss)2,3 | | | 0.25 | | | | 0.30 | | | | 0.16 | | | | (0.01 | ) | | | 0.11 | |
Net realized and unrealized gain (loss) on investments | | | 2.06 | | | | (1.44 | ) | | | 1.92 | | | | 1.21 | | | | (0.65 | ) |
Total income (loss) from investment operations | | | 2.31 | | | | (1.14 | ) | | | 2.08 | | | | 1.20 | | | | (0.54 | ) |
Less Distributions to Shareholders from: | | | | | | | | | | | | | | | | | | | | |
Net investment income | | | (0.33 | ) | | | (0.05 | ) | | | (0.22 | ) | | | (0.25 | ) | | | (0.42 | ) |
Net Asset Value, End of Year | | $ | 16.62 | | | $ | 14.64 | | | $ | 15.83 | | | $ | 13.97 | | | $ | 13.02 | |
Total Return3,4 | | | 16.23 | % | | | (7.20 | )% | | | 15.14 | % | | | 9.43 | % | | | (3.98 | )% |
Ratio of net expenses to average net assets | | | 1.04 | % | | | 1.04 | % | | | 0.99 | % | | | 0.99 | % | | | 0.98 | % |
Ratio of gross expenses to average net assets5 | | | 1.16 | % | | | 1.12 | % | | | 1.05 | % | | | 1.15 | % | | | 1.11 | % |
Ratio of net investment income to average net assets3 | | | 1.63 | % | | | 1.92 | % | | | 1.09 | % | | | 0.25 | % | | | 0.83 | % |
Portfolio turnover | | | 15 | % | | | 27 | % | | | 26 | % | | | 71 | % | | | 55 | % |
Net assets end of year (000’s) omitted | | $ | 2,182 | | | $ | 1,484 | | | $ | 1,420 | | | $ | 7,215 | | | $ | 1,652 | |
| | | | | | | | | | | | | | | | | | | | | |
42
|
AMG FQ Global Risk-Balanced Fund Financial Highlights For a share outstanding throughout each fiscal year |
| | | | | | | | | | | | | | | | | | | | |
| | | For the fiscal year ended October 31, | |
| | | | | |
| Class Z | | 2019 | | | 2018 | | | 2017 | | | 20161 | | | 2015 | |
Net Asset Value, Beginning of Year | | | $14.64 | | | | $15.87 | | | | $14.00 | | | | $13.05 | | | | $14.02 | |
Income (loss) from Investment Operations: | | | | | | | | | | | | | | | | | | | | |
Net investment income2,3 | | | 0.28 | | | | 0.32 | | | | 0.18 | | | | 0.05 | | | | 0.12 | |
Net realized and unrealized gain (loss) on investments | | | 2.05 | | | | (1.44 | ) | | | 1.92 | | | | 1.16 | | | | (0.66 | ) |
Total income (loss) from investment operations | | | 2.33 | | | | (1.12 | ) | | | 2.10 | | | | 1.21 | | | | (0.54 | ) |
Less Distributions to Shareholders from: | | | | | | | | | | | | | | | | | | | | |
Net investment income | | | (0.35 | ) | | | (0.11 | ) | | | (0.23 | ) | | | (0.26 | ) | | | (0.43 | ) |
Net Asset Value, End of Year | | | $16.62 | | | | $14.64 | | | | $15.87 | | | | $14.00 | | | | $13.05 | |
Total Return3,4 | | | 16.43 | % | | | (7.13 | )% | | | 15.23 | % | | | 9.55 | % | | | (3.92 | )% |
Ratio of net expenses to average net assets | | | 0.89 | % | | | 0.89 | % | | | 0.89 | % | | | 0.89 | % | | | 0.88 | % |
Ratio of gross expenses to average net assets5 | | | 1.01 | % | | | 0.97 | % | | | 0.95 | % | | | 1.05 | % | | | 1.01 | % |
Ratio of net investment income to average net assets3 | | | 1.78 | % | | | 2.07 | % | | | 1.19 | % | | | 0.36 | % | | | 0.88 | % |
Portfolio turnover | | | 15 | % | | | 27 | % | | | 26 | % | | | 71 | % | | | 55 | % |
Net assets end of year (000’s) omitted | | | $49,163 | | | | $50,058 | | | | $59,712 | | | | $58,670 | | | | $63,485 | |
| | | | | | | | | | | | | | | | | | | | | |
| 1 | Effective October 1, 2016, the Investor Class, Service Class and Institutional Class were renamed Class N, Class I and Class Z, respectively. |
| 2 | Per share numbers have been calculated using average shares. |
| 3 | Total returns and net investment income (loss) would have been lower had certain expenses not been offset. |
| 4 | The total return is calculated using the published Net Asset Value as of fiscal year end. |
| 5 | Excludes the impact of expense reimbursement or fee waivers and expense reductions such as brokerage credits, but includes expense repayments and non-reimbursable expenses, if any, such as interest, taxes, and extraordinary expenses. (See Note 1(c) and 2 in the Notes to Financial Statements.) |
43
|
Notes to Financial Statements October 31, 2019 |
1. ORGANIZATION AND SUMMARY OF SIGNIFICANT ACCOUNTING POLICIES
AMG Funds I (the “Trust”) is an open-end management investment company, organized as a Massachusetts business trust, and registered under the Investment Company Act of 1940, as amended (the “1940 Act”). Currently, the Trust consists of a number of different funds, each having distinct investment management objectives, strategies, risks, and policies. Included in this report are AMG FQ Tax-Managed U.S. Equity Fund (“Tax-Managed”), AMG FQ Long-Short Equity Fund (“Long-Short Equity”) and AMG FQ Global Risk-Balanced Fund (“Global Risk-Balanced”), each a “Fund” and collectively, the “Funds”.
Each Fund offers different classes of shares. Tax-Managed and Long-Short Equity offer Class N and Class I shares. Global Risk-Balanced offers Class N, Class I and Class Z shares. Each class represents an interest in the same assets of the respective Fund. Although all share classes generally have identical voting rights, each share class votes separately when required by law. Different share classes may have different net asset values per share to the extent the share classes pay different distribution amounts and/or the expenses of such share classes differ. Each share class has its own expense structure. Please refer to a current prospectus for additional information on each share class.
The Funds’ financial statements are prepared in accordance with accounting principles generally accepted in the United States of America (“U.S. GAAP”), including accounting and reporting guidance pursuant to Accounting Standards Codification Topic 946 applicable to investment companies. U.S. GAAP requires management to make estimates and assumptions that affect the reported amounts of assets and liabilities and disclosure of contingent assets and liabilities at the date of the financial statements and the reported amounts of income and expenses during the reporting period. Actual results could differ from those estimates and such differences could be material. The following is a summary of significant accounting policies followed by the Funds in the preparation of their financial statements:
a. VALUATION OF INVESTMENTS
Equity securities, including securities sold short and option contracts, traded on a national securities exchange or reported on the NASDAQ national market system (“NMS”) are valued at the last quoted sales price on the primary exchange or, if applicable, the NASDAQ official closing price or the official closing price of the relevant exchange or, lacking any sales, at the last quoted bid price or the mean between the last quoted bid and ask prices (the “exchange mean price”). Equity securities and securities sold short traded in the over-the-counter market (other than NMS securities) are valued at the exchange mean price. Foreign equity securities (securities principally traded in markets other than U.S. markets) are valued at the official closing price on the primary exchange or, for markets that either do not offer an official closing price or where the official closing price may not be representative of the overall market, the last quoted sale price.
Fixed income securities purchased with a remaining maturity exceeding 60 days are valued at the evaluated mean price provided by an authorized pricing service or, if an evaluated price is not available, by reference to other securities which are considered comparable in credit rating, interest rate, due date and other features (generally referred to as “matrix pricing”) or other similar pricing methodologies.
Fixed income securities purchased with a remaining maturity of 60 days or less are valued at amortized cost, provided that the amortized cost value is approximately the same as the fair value of the security valued without the use of
amortized cost. Investments in other open-end registered investment companies are valued at their end of day net asset value per share.
Futures contracts for which market quotations are readily available are valued at the settlement price as of the close of the futures exchange.
Total Return Equity Basket Swaps (“Equity Basket Swap”) may be valued using a price obtained from the counterparty of the Equity Basket Swap as long as the value obtained from the counterparty is reasonable to the total value of the underlying securities constituting the Equity Basket Swap if such underlying securities were priced in accordance with the Funds’ equity security valuation policies as discussed above.
The Funds’ portfolio investments are generally valued based on independent market quotations or prices or, if none, “evaluative” or other market based valuations provided by third party pricing services approved by the Board of Trustees of the Trust (the “Board”). Under certain circumstances, the value of certain Fund portfolio investments (including derivatives) may be based on an evaluation of fair value, pursuant to procedures established by and under the general supervision of the Board. The Valuation Committee, which is comprised of the Independent Trustees of the Board, and the Pricing Committee, which is comprised of representatives from AMG Funds LLC (the “Investment Manager”) are the committees appointed by the Board to make fair value determinations. Each Fund may use the fair value of a portfolio investment to calculate its net asset value (“NAV”) in the event that the market quotation, price or market based valuation for the portfolio investment is not readily available or otherwise not determinable pursuant to the Board’s valuation procedures, if the Investment Manager or the Pricing Committee believes the quotation, price or market based valuation to be unreliable, or in certain other circumstances. When determining the fair value of an investment, the Pricing Committee and, if required under the Trust’s securities valuation procedures, the Valuation Committee, seeks to determine the price that the Fund might reasonably expect to receive from current sale of that portfolio investment in an arms-length transaction. Fair value determinations shall be based upon consideration of all available facts and information, including, but not limited to (i) attributes specific to the investment; (ii) fundamental and analytical data relating to the investment; and (iii) the value of other comparable securities or relevant financial instruments, including derivative securities, traded on other markets or among dealers.
The values assigned to fair value portfolio investments are based on available information and do not necessarily represent amounts that might ultimately be realized in the future, since such amounts depend on future developments inherent in long-term investments. Because of the inherent uncertainty of valuation, those estimated values may differ significantly from the values that would have been used had a ready market for the investments existed, and the differences could be material. The Board will be presented with a quarterly report showing as of the most recent quarter end, all outstanding securities fair valued by the Funds, including a comparison with the prior quarter end and the percentage of the Funds that the security represents at each quarter end.
With respect to foreign equity securities and certain foreign fixed income securities, the Board has adopted a policy that securities held in the Funds that can be fair valued by the applicable fair value pricing service are fair valued on each business day provided that each individual price exceeds a pre-established confidence level.
U.S. GAAP defines fair value as the price that a fund would receive to sell an asset or pay to transfer a liability in an orderly transaction between market participants at the measurement date. U.S. GAAP also establishes a framework for measuring
44
|
Notes to Financial Statements(continued) |
fair value, and a three level hierarchy for fair value measurements based upon the transparency of inputs to the valuation of an asset or liability. Inputs may be observable or unobservable and refer broadly to the assumptions that market participants would use in pricing the asset or liability. Observable inputs reflect the assumptions market participants would use in pricing the asset or liability based on market data obtained from sources independent of the Funds. Unobservable inputs reflect the Funds’ own assumptions about the assumptions that market participants would use in pricing the asset or liability developed based on the best information available in the circumstances. Each investment is assigned a level based upon the observability of the inputs which are significant to the overall valuation.
The three-tier hierarchy of inputs is summarized below:
Level 1 – inputs are quoted prices in active markets for identical investments (e.g., equity securities, open-end investment companies, futures contracts, options contracts)
Level 2 – other observable inputs (including, but not limited to: quoted prices for similar assets or liabilities in markets that are active, quoted prices for identical or similar assets or liabilities in markets that are not active, inputs other than quoted prices that are observable for the assets or liabilities (such as interest rates, yield curves, volatilities, prepayment speeds, loss severities, credit risks and default rates) or other market corroborated inputs) (e.g., debt securities, government securities, foreign currency exchange contracts, swaps, foreign securities utilizing international fair value pricing, fair valued securities with observable inputs)
Level 3 – inputs are significant unobservable inputs (including the Fund’s own assumptions used to determine the fair value of investments) (e.g., fair valued securities with unobservable inputs)
Changes in inputs or methodologies used for valuing investments may result in a transfer in or out of levels within the fair value hierarchy. The inputs or methodologies used for valuing investments may not necessarily be an indication of the risk associated with investing in those investments.
b. SECURITY TRANSACTIONS
Security transactions are accounted for as of trade date. Realized gains and losses on securities sold are determined on the basis of identified cost.
c. INVESTMENT INCOME AND EXPENSES
Dividend income is recorded on the ex-dividend date. Dividends from foreign securities are recorded on the ex-dividend date, and if after the fact, as soon as the Funds become aware of the ex-dividend date. Dividends declared on short positions are recorded on ex-date as dividend expense. Interest income, which includes amortization of premium and accretion of discount on debt securities, is accrued as earned. Dividend and interest income on foreign securities is recorded gross of any withholding tax. Non-cash dividends included in dividend income, if any, are reported at the fair market value of the securities received. Upon notification from issuers, distributions received from a real estate investment trust (“REIT”) may be redesignated as a reduction of cost of investments and/or realized gain. Other income and expenses are recorded on an accrual basis. Expenses that cannot be directly attributed to a Fund are apportioned among the funds in the Trust and other trusts or funds within the AMG Funds family of mutual funds (collectively the “AMG Funds Family”) based upon their relative average net assets or number of shareholders. Investment income, realized and unrealized capital gains and losses, the common expenses of each Fund, and certain fund level expense reductions, if any, are allocated on a pro-rata basis to each class based on the relative net assets of each class to the total net assets of each Fund.
Tax Managed and Long-Short Equity had certain portfolio trades directed to various brokers under a brokerage recapture program. Credits received from the brokerage recapture program are earned and paid on a monthly basis, and are recorded as expense offsets, which serve to reduce the Funds’ overall expense ratio. For the fiscal year ended October 31, 2019, the impact on the expenses and expense ratios were as follows: Tax Managed - $3,939 or 0.01%, and Long-Short Equity - $1,387 or less than 0.00%.
d. DIVIDENDS AND DISTRIBUTIONS
Fund distributions resulting from either net investment income or realized net capital gains, if any, will normally be declared and paid at least annually in December. Distributions to shareholders are recorded on the ex-dividend date. Distributions are determined in accordance with federal income tax regulations, which may differ from net investment income and net realized capital gains for financial statement purposes (U.S. GAAP). Differences may be permanent or temporary. Permanent differences are reclassified among capital accounts in the financial statements to reflect their tax character. Permanent book and tax basis differences, if any, relating to shareholder distributions will result in reclassifications to paid-in capital. Temporary differences arise when certain items of income, expense and gain or loss are recognized in different periods for financial statement and tax purposes; these differences will reverse at some time in the future. There were no permanent differences during the year. Temporary differences are due to wash sales, mark-to-market of open swap, futures and option contracts, and capital loss carryforwards.
The tax character of distributions paid during the fiscal years ended October 31, 2019 and October 31, 2018 were as follows:
| | | | | | | | | | | | | | | | | | | | | | | | |
| | | Tax-Managed | | | Long-Short Equity | | | Global Risk-Balanced | |
| | | | | | |
Distributions paid from: | | 2019 | | | 2018 | | | 2019 | | | 2018 | | | 2019 | | | 2018 | |
| | | | | | |
Ordinary income | | | $272,993 | | | | $213,203 | | | | — | | | | — | | | | $1,254,640 | | | | $407,907 | |
| | | | | | |
Short-term capital gains | | | — | | | | — | | | | $841,450 | | | | $6,654,191 | | | | — | | | | — | |
| | | | | | |
Long-term capital gains | | | 928,977 | | | | 95,793 | | | | 2,574,706 | | | | 2,584,530 | | | | — | | | | — | |
| | | | | | | | | | | | | | | | | | | | | | | | |
| | | | | | |
| | | $1,201,970 | | | | $308,996 | | | | $3,416,156 | | | | $9,238,721 | | | | $1,254,640 | | | | $407,907 | |
| | | | | | | | | | | | | | | | | | | | | | | | |
45
|
Notes to Financial Statements(continued) |
As of October 31, 2019, the components of distributable earnings (excluding unrealized appreciation/depreciation) on a tax basis consisted of:
| | | | | | | | | | | | |
| | | Tax-Managed | | | Long-Short Equity | | | Global Risk-Balanced | |
| | | |
Capital loss carryforward | | | — | | | | — | | | | $78,042 | |
| | | |
Undistributed ordinary income | | | $237,805 | | | | — | | | | 1,862,826 | |
| | | |
Undistributed short-term capital gains | | | — | | | | $1,899,419 | | | | — | |
| | | |
Undistributed long-term capital gains | | | 89,866 | | | | 2,370,685 | | | | — | |
At October 31, 2019, the cost of investments and the aggregate gross unrealized appreciation and depreciation for federal income tax purposes were as follows:
| | | | | | | | | | | | | | | | |
| Fund | | Cost | | | Appreciation | | | Depreciation | | | Net | |
| | | | |
Tax-Managed | | | $37,768,463 | | | | $32,789,190 | | | | $(292,600 | ) | | | $32,496,590 | |
| | | | |
Long-Short Equity | | | 88,030,660 | | | | 4,969,039 | | | | (2,556,321 | ) | | | 2,412,718 | |
| | | | |
Global Risk-Balanced | | | 54,313,313 | | | | 1,974,845 | | | | (1,462,068 | ) | | | 512,777 | |
e. FEDERAL TAXES
Each Fund currently qualifies as an investment company and intends to comply with the requirements under Subchapter M of the Internal Revenue Code of 1986, as amended, and to distribute substantially all of its taxable income and gains to its shareholders and to meet certain diversification and income requirements with respect to investment companies. Therefore, no provision for federal income or excise tax is included in the accompanying financial statements.
Additionally, based on each Fund’s understanding of the tax rules and rates related to income, gains and transactions for the foreign jurisdictions in which it invests, each Fund will provide for foreign taxes, and where appropriate, deferred foreign taxes.
Management has analyzed the Funds’ tax positions taken on federal income tax returns as of October 31, 2019, and for all open tax years (generally, the three prior taxable years), and has concluded that no provision for federal income tax is required in the Funds’ financial statements. Additionally, Management is not aware of any tax position for which it is reasonably possible that the total amounts of unrecognized tax benefits will change materially in the next twelve months.
f. CAPITAL LOSS CARRYOVERS AND DEFERRALS
As of October 31, 2019, the following Fund had capital loss carryovers for federal income tax purposes as shown in the following chart. These amounts may be used
to offset future realized capital gains indefinitely, and retain their character as short-term and/or long-term.
| | | | | | | | | | | | |
| | | Capital Loss | |
| | | Carryover Amounts | |
| | | |
| Fund | | Short-Term | | | Long-Term | | | Total |
| | | |
Global Risk-Balanced | | | — | | | | $78,042 | | | | $78,042 | |
As of October 31, 2019, Tax Managed and Long-Short Equity had no capital loss carryovers for federal income tax purposes. Should the Funds incur net capital losses for the fiscal year ended October 31, 2020, such amounts may be used to offset future realized capital gains indefinitely, and retain their character as either short-term and/or long-term.
| | | | | | | | | | | | | | | |
| | | Capital Loss |
| | | Carryover Utilized |
| | | |
| Fund | | Short-Term | | | | Long-Term |
| | | |
Global Risk-Balanced | | | | $532,808 | | | | | | | | | | $2,742,822 | |
46
|
Notes to Financial Statements(continued) |
g. CAPITAL STOCK
The Trust’s Declaration of Trust authorizes for each Fund the issuance of an unlimited number of shares of beneficial interest, without par value. Each Fund records sales and repurchases of its capital stock on the trade date.
For the fiscal years ended October 31, 2019 and October 31, 2018, the capital stock transactions by class for the Funds were as follows:
| | | | | | | | | | | | | | | | | | | | | | | | | | | | | | | | |
| | | Tax-Managed | | Long-Short Equity |
| | | October 31, 2019 | | October 31, 2018 | | October 31, 2019 | | October 31, 2018 |
| | | Shares | | Amount | | Shares | | Amount | | Shares | | Amount | | Shares | | Amount |
| | | | | | | | |
Class N: | | | | | | | | | | | | | | | | | | | | | | | | | | | | | | | | |
| | | | | | | | |
Proceeds from sale of shares | | | 18,717 | | | | $599,541 | | | | 89,309 | | | | $3,039,894 | | | | 1,989,840 | | | | $31,414,305 | | | | 1,538,753 | | | | $24,699,406 | |
| | | | | | | | |
Reinvestment of distributions | | | 4,186 | | | | 118,708 | | | | 357 | | | | 10,842 | | | | 88,302 | | | | 1,309,108 | | | | 48,518 | | | | 693,802 | |
| | | | | | | | |
Cost of shares repurchased | | | (88,040 | ) | | | (2,673,664 | ) | | | (194,591 | ) | | | (6,147,980 | ) | | | (2,761,497 | ) | | | (42,260,498 | ) | | | (216,542 | ) | | | (3,358,947 | ) |
| | | | | | | | | | | | | | | | | | | | | | | | | | | | | | | | |
| | | | | | | | |
Net increase (decrease) | | | (65,137 | ) | | | $(1,955,415 | ) | | | (104,925 | ) | | | $(3,097,244 | ) | | | (683,355 | ) | | | $(9,537,085 | ) | | | 1,370,729 | | | | $22,034,261 | |
| | | | | | | | | | | | | | | | | | | | | | | | | | | | | | | | |
| | | | | | | | |
Class I: | | | | | | | | | | | | | | | | | | | | | | | | | | | | | | | | |
| | | | | | | | |
Proceeds from sale of shares | | | 66,958 | | | | $2,097,380 | | | | 200,346 | | | | $6,232,503 | | | | 2,854,424 | | | | $44,768,398 | | | | 1,573,628 | | | | $24,596,154 | |
| | | | | | | | |
Reinvestment of distributions | | | 36,540 | | | | 1,033,349 | | | | 9,365 | | | | 284,333 | | | | 137,041 | | | | 2,048,386 | | | | 581,487 | | | | 8,315,255 | |
| | | | | | | | |
Cost of shares repurchased | | | (305,225 | ) | | | (9,439,666 | ) | | | (240,844 | ) | | | (7,592,756 | ) | | | (1,403,852 | ) | | | (21,845,782 | ) | | | (675,126 | ) | | | (10,510,628 | ) |
| | | | | | | | | | | | | | | | | | | | | | | | | | | | | | | | |
| | | | | | | | |
Net increase (decrease) | | | (201,727 | ) | | | $(6,308,937 | ) | | | (31,133 | ) | | | $(1,075,920 | ) | | | 1,587,613 | | | | $24,971,002 | | | | 1,479,989 | | | | $22,400,781 | |
| | | | | | | | | | | | | | | | | | | | | | | | | | | | | | | | |
| | | | | | | | | | | | | | | | |
| | | Global Risk-Balanced |
| | | October 31, 2019 | | October 31, 2018 |
| | | Shares | | Amount | | Shares | | Amount |
| | | | |
Class N: | | | | | | | | | | | | | | | | |
| | | | |
Proceeds from sale of shares | | | 49,315 | | | | $808,428 | | | | 7,244 | | | | $114,701 | |
| | | | |
Reinvestment of distributions | | | 2,679 | | | | 37,124 | | | | 357 | | | | 5,692 | |
| | | | |
Cost of shares repurchased | | | (38,960 | ) | | | (619,410 | ) | | | (18,612 | ) | | | (285,005 | ) |
| | | | | | | | | | | | | | | | |
| | | | |
Net increase (decrease) | | | 13,034 | | | | $226,142 | | | | (11,011 | ) | | | $(164,612 | ) |
| | | | | | | | | | | | | | | | |
| | | | |
Class I: | | | | | | | | | | | | | | | | |
| | | | |
Proceeds from sale of shares | | | 63,262 | | | | $997,739 | | | | 53,628 | | | | $842,928 | |
| | | | |
Reinvestment of distributions | | | 2,408 | | | | 33,497 | | | | 286 | | | | 4,577 | |
| | | | |
Cost of shares repurchased | | | (35,813 | ) | | | (567,632 | ) | | | (42,242 | ) | | | (659,758 | ) |
| | | | | | | | | | | | | | | | |
| | | | |
Net increase | | | 29,857 | | | | $463,604 | | | | 11,672 | | | | $187,747 | |
| | | | | | | | | | | | | | | | |
| | | | |
Class Z: | | | | | | | | | | | | | | | | |
| | | | |
Proceeds from sale of shares | | | 25,286 | | | | $381,973 | | | | 44,736 | | | | $702,172 | |
| | | | |
Reinvestment of distributions | | | 83,556 | | | | 1,160,590 | | | | 24,413 | | | | 389,879 | |
| | | | |
Cost of shares repurchased | | | (570,377 | ) | | | (8,772,233 | ) | | | (413,829 | ) | | | (6,488,652 | ) |
| | | | | | | | | | | | | | | | |
| | | | |
Net decrease | | | (461,535 | ) | | | $(7,229,670 | ) | | | (344,680 | ) | | | $(5,396,601 | ) |
| | | | | | | | | | | | | | | | |
h. REPURCHASE AGREEMENTS AND JOINT REPURCHASE AGREEMENTS
The Funds may enter into third-party repurchase agreements for temporary cash management purposes and third-party or bilateral joint repurchase agreements for reinvestment of cash collateral on securities lending transactions under the securities lending program offered by The Bank of New York Mellon (“BNYM”) (the
“Program”) (collectively, “Repurchase Agreements”). The value of the underlying collateral, including accrued interest, must equal or exceed the value of the Repurchase Agreements during the term of the agreement. For joint repurchase agreements, the Funds participate on a pro rata basis with other clients of BNYM in its share of the underlying collateral under such joint repurchase agreements
47
|
Notes to Financial Statements(continued) |
and in its share of proceeds from any repurchase or other disposition of the underlying collateral. The underlying collateral for all Repurchase Agreements is held in safekeeping by the Funds’ custodian or at the Federal Reserve Bank. If the seller defaults and the value of the collateral declines, or if bankruptcy proceedings commence with respect to the seller of the security, realization of the collateral by the Funds may be delayed or limited. Pursuant to the Program, the Funds are indemnified for such losses by BNYM on joint repurchase agreements.
At October 31, 2019, the market value of Repurchase Agreements outstanding for Tax-Managed, Long-Short Equity and Global Risk-Balanced were $258,645, $291,245 and $1,161,083, respectively.
i. FOREIGN CURRENCY TRANSLATION
The books and records of the Funds are maintained in U.S. dollars. The value of investments, assets and liabilities denominated in currencies other than U.S. dollars are translated into U.S. dollars based upon current foreign exchange rates. Purchases and sales of foreign investments, income and expenses are converted into U.S. dollars based on currency exchange rates prevailing on the respective dates of such transactions. Net realized and unrealized gain (loss) on foreign currency transactions represent: (1) foreign exchange gains and losses from the sale and holdings of foreign currencies; (2) gains and losses between trade date and settlement date on investment securities transactions and foreign currency exchange contracts; and (3) gains and losses from the difference between amounts of interest and dividends recorded and the amounts actually received.
The Funds do not isolate the net realized and unrealized gain or loss resulting from changes in exchange rates from the fluctuations in market prices of securities held. Such fluctuations are included with the net realized and unrealized gain or loss on investments.
2. AGREEMENTS AND TRANSACTIONS WITH AFFILIATES
For each of the Funds, the Trust has entered into an investment advisory agreement under which the Investment Manager, a subsidiary and the U.S. retail distribution arm of Affiliated Managers Group, Inc. (“AMG”), serves as investment manager to the Funds and is responsible for the Funds’ overall administration and operations. The Investment Manager selects one or more subadvisers for the Funds (subject to Board approval) and monitors each subadviser’s investment performance, security holdings and investment strategies. Each Fund’s investment portfolio is managed by First Quadrant, L.P. (“First Quadrant”), who serves pursuant to a subadvisory agreement with the Investment Manager. AMG indirectly owns a majority interest in First Quadrant.
Investment management fees are paid directly by the Funds to the Investment Manager based on average daily net assets. For the fiscal year ended October 31, 2019, the Funds’ investment management fees were paid at the following annual rate of each Fund’s respective average daily net assets:
| | | | |
| |
Tax-Managed | | | 0.70% | |
| |
Long-Short Equity | | | 0.35% | |
| |
Global Risk-Balanced | | | 0.60% | |
The Investment Manager has contractually agreed, through at least March 1, 2020, to waive management fees and/or pay or reimburse fund expenses in order to limit total annual Fund operating expenses after fee waiver and expense
reimbursements (exclusive of taxes, interest (including interest incurred in connection with bank and custody overdrafts, and in connection with securities sold short), shareholder servicing fees, distribution and service (12b-1) fees, brokerage commissions and other transaction costs, dividends payable with respect to securities sold short, acquired fund fees and expenses and extraordinary expenses) of Tax-Managed, Long-Short Equity and Global Risk-Balanced to 0.89%, 0.69% and 0.89%, respectively, of each Fund’s average daily net assets (this annual rate or such other annual rate that may be in effect from time to time, the “Expense Cap”), subject to later reimbursement by the Funds in certain circumstances.
The contractual expense limitation may only be terminated in the event the Investment Manager or a successor ceases to be the investment manager of the Fund or a successor fund, by mutual agreement between the Investment Manager and the Board, or in the event of the Fund’s liquidation unless the Fund is reorganized or is a party to a merger in which the surviving entity is successor to the accounting and performance information of the Fund.
In general, for a period of up to 36 months, the Investment Manager may recover from each Fund fees waived and expenses paid pursuant to this contractual agreement, provided that such repayment would not cause a Fund’s total annual operating expenses after fee waiver and expense reimbursements (exclusive of the items noted in the parenthetical above) to exceed the contractual expense limitation amount.
At October 31, 2019, the Funds’ expiration of reimbursements subject to recoupment is as follows:
| | | | | | | | | | | | |
Expiration Period | | | Tax-Managed | | | | Long-Short Equity | | | | Global Risk-Balanced | |
| | | |
Less than 1 year | | | $94,797 | | | | $31,029 | | | | $39,272 | |
| | | |
1-2 years | | | 92,665 | | | | 58,523 | | | | 49,633 | |
| | | |
2-3 years | | | 98,178 | | | | 34,444 | | | | 61,763 | |
| | | | | | | | | | | | |
| | | |
Total | | | $285,640 | | | | $123,996 | | | | $150,668 | |
| | | | | | | | | | | | |
The Trust, on behalf of the Funds, has entered into an amended and restated Administration Agreement under which the Investment Manager serves as the Funds’ administrator (the “Administrator”) and is responsible for all non-portfolio management aspects of managing the Funds’ operations, including administration and shareholder services to each Fund. Each Fund pays a fee to the Administrator at the rate of 0.15% per annum of the Fund’s average daily net assets for this service.
The Funds are distributed by AMG Distributors, Inc. (the “Distributor”), a wholly-owned subsidiary of the Investment Manager. The Distributor serves as the distributor and underwriter for each Fund and is a registered broker-dealer and member of the Financial Industry Regulatory Authority, Inc. (“FINRA”). Shares of each Fund will be continuously offered and will be sold directly to prospective purchasers and through brokers, dealers or other financial intermediaries who have executed selling agreements with the Distributor. Generally the Distributor bears all or a portion of the expenses of providing services pursuant to the distribution agreement, including the payment of the expenses relating to the distribution of prospectuses for sales purposes and any advertising or sales literature.
The Trust has adopted a distribution and service plan (the “Plan”) with respect to the Class N shares, in accordance with the requirements of Rule 12b-1 under the
48
|
Notes to Financial Statements(continued) |
1940 Act and the requirements of the applicable rules of FINRA regarding asset-based sales charges. Pursuant to the Plan, each Fund may make payments to the Distributor for its expenditures in financing any activity primarily intended to result in the sale of each Fund’s Class N shares and for maintenance and personal service provided to existing shareholders of that class. The Plan authorized payments to the Distributor up to 0.25% annually of each Fund’s average daily net assets attributable to the Class N shares.
For Class N and Class I shares of Long-Short Equity and Global Risk-Balanced, the Board has approved reimbursement payments to the Investment Manager for shareholder servicing expenses (“shareholder servicing fees”) incurred. Shareholder servicing fees include payments to financial intermediaries, such as broker-dealers (including fund supermarket platforms), banks, and trust companies who provide shareholder recordkeeping, account servicing and other services. The Class N and Class I shares may reimburse the Investment Manager for the actual amount incurred up to a maximum annual rate of each Class’s average daily net assets as shown in the table below.
The impact on the annualized expense ratio for the year ended October 31,2019, was as follows:
| | | | | | | | |
| | | Maximum Annual
Amount | | | Actual
Amount | |
| Fund | | Approved | | | Incurred | |
| | |
Long-Short Equity | | | | | | | | |
| | |
Class N | | | 0.10 | % | | | 0.10% | |
| | |
Class I | | | 0.10 | % | | | 0.06% | |
| | |
Global Risk-Balanced | | | | | | | | |
| | |
Class N | | | 0.15 | % | | | 0.15% | |
| | |
Class I | | | 0.15 | % | | | 0.15% | |
The Board provides supervision of the affairs of the Trust and other trusts within the AMG Funds family. The Trustees of the Trust who are not affiliated with the Investment Manager receive an annual retainer and per meeting fees for regular, special and telephonic meetings, and they are reimbursed for out-of-pocket expenses incurred while carrying out their duties as Board members. The Chairman of the Board and the Audit Committee Chair receive additional annual retainers. Certain Trustees and Officers of the Funds are Officers and/or Directors of the Investment Manager, AMG and/or the Distributor.
The Securities and Exchange Commission (the “SEC”) granted an exemptive order that permits the Funds to lend and borrow money for certain temporary purposes directly to and from other eligible funds in the AMG Funds family. Participation in this interfund lending program is voluntary for both the borrowing and lending funds, and an interfund loan is only made if it benefits each participating fund. The Administrator manages the program according to procedures approved by the Board, and the Board monitors the operation of the program. An interfund loan must comply with certain conditions set out in the exemptive order, which are designed to assure fairness and protect all participating funds. For the fiscal year ended October 31, 2019, Long-Short Equity lent a maximum of $4,128,079 for ten days earning interest of $3,148 and Global Risk-Balanced lent a maximum of $2,388,276 for nine days earning interest of $1,528. The interest income amount is included in the Statement of Operations as interest income. Long-Short Equity borrowed a maximum of $17,078,904 for seven days paying interest of $4,718. The
interest expense amount is included on the Statement of Operations as miscellaneous expense. At October 31, 2019, the Funds had no interfund loans outstanding.
3. PURCHASES AND SALES OF SECURITIES
Purchases and sales of securities (excluding short-term securities and U.S. Government Obligations) for the fiscal year ended October 31, 2019, were as follows:
| | | | | | | | |
| | | Long Term Securities | |
| | |
| Fund | | Purchases | | | Sales | |
| | |
Tax-Managed | | | $23,142,205 | | | | $32,373,183 | |
| | |
Long-Short Equity | | | 287,941,104 | | | | 232,586,164 | |
| | |
Global Risk-Balanced | | | 4,921,989 | | | | 11,259,552 | |
The Funds had no purchases or sales of U.S. Government Obligations during the fiscal year ended October 31, 2019.
4. PORTFOLIO SECURITIES LOANED
The Funds participate in the Program providing for the lending of securities to qualified borrowers. Securities lending income includes earnings of such temporary cash investments, plus or minus any rebate to a borrower. These earnings (after any rebate) are then divided between BNYM, as a fee for its services under the Program, and the Funds, according to agreed-upon rates. Collateral on all securities loaned is accepted in cash or U.S. Government and Agency Obligations. Collateral is maintained at a minimum level of 102% (105% in the case of certain foreign securities) of the market value, plus interest, if applicable, of investments on loan. It is the Funds’ policy to obtain additional collateral from or return excess collateral to the borrower by the end of the next business day, following the valuation date of the securities loaned. Therefore, the value of the collateral held may be temporarily less than the value of the securities on loan. Lending securities entails a risk of loss to the Funds if and to the extent that the market value of the securities loaned were to increase and the borrower did not increase the collateral accordingly, and the borrower fails to return the securities. Under the terms of the Program, the Funds are indemnified for such losses by BNYM. Cash collateral is held in separate omnibus accounts managed by BNYM, who is authorized to exclusively enter into joint repurchase agreements for that cash collateral. Securities collateral is held in separate omnibus accounts managed by BNYM that cannot be sold or pledged. BNYM bears the risk of any deficiency in the amount of the cash collateral available for return to the borrower due to any loss on the collateral invested.
The value of securities loaned on positions held, and cash and securities collateral received at October 31, 2019, were as follows:
| | | | | | | | | | | | | | | | |
| | | | | | Cash | | | Securities | | | Total | |
| | | Securities | | | Collateral | | | Collateral | | | Collateral | |
| Fund | | Loaned | | | Received | | | Received | | | Received | |
| | | | |
Tax-Managed | | | $4,054,457 | | | | $258,645 | | | | $3,975,467 | | | | $4,234,112 | |
| | | | |
Long-Short Equity | | | 788,425 | | | | 291,245 | | | | 522,575 | | | | 813,820 | |
| | | | |
Global Risk-Balanced | | | 5,532,252 | | | | 1,161,083 | | | | 4,517,848 | | | | 5,678,931 | |
49
|
Notes to Financial Statements(continued) |
The following table summarizes the securities received as collateral for securities lending at October 31, 2019:
| | | | | | | | |
| | | Collateral | | Coupon | | Maturity | |
| Fund | | Type | | Range | | Date Range | |
| | | |
Tax-Managed | | U.S. Treasury Obligations | | 0.000%-8.750% | | | 11/15/19-02/15/49 | |
| | | | | | | | |
| | | |
Long-Short Equity | | U.S. Treasury Obligations | | 0.000%-8.750% | | | 11/15/19-11/15/48 | |
| | | | | | | | |
| | | |
Global Risk-Balanced | | U.S. Treasury Obligations | | 0.000%-5.250% | | | 03/12/20-11/15/48 | |
| | | | | | | | |
5. FOREIGN SECURITIES
Global Risk-Balanced invests in securities of foreign entities and in instruments denominated in foreign currencies which involve risks not typically associated with investments in domestic securities. Non-domestic securities carry special risks, such as exposure to currency fluctuations, less developed or less efficient trading markets, political instability, a lack of company information, differing auditing and legal standards, and, potentially, less liquidity. Realized gains in certain countries may be subject to foreign taxes at the Fund level and the Fund would pay such foreign taxes at the appropriate rate for each jurisdiction.
6. COMMITMENTS AND CONTINGENCIES
Under the Trust’s organizational documents, its trustees and officers are indemnified against certain liabilities arising out of the performance of their duties to the Trust. In addition, in the normal course of business, the Funds may enter into contracts and agreements that contain a variety of representations and warranties, which provide general indemnifications. The maximum exposure to the Funds under these arrangements is unknown, as this would involve future claims that may be made against a Fund that have not yet occurred. However, based on experience, the Funds had no prior claims or losses and expect the risks of loss to be remote.
7. FORWARD COMMITMENTS
Certain transactions, such as futures and forward transactions may have a similar effect on a Fund’s net asset value as if a Fund had created a degree of leverage in its portfolio. However, if a Fund enters into such a transaction, a Fund will establish a segregated account with its custodian in which it will maintain cash, U.S. government securities or other liquid securities equal in value to its obligations in respect to such transaction. Securities and other assets held in the segregated account may not be sold while the transaction is outstanding, unless other suitable assets are substituted.
8. DERIVATIVE INSTRUMENTS
The following disclosures contain information on how and why certain Funds use derivative instruments, the credit risk and how derivative instruments affect the Funds’ financial position, and results of operations. The location and fair value amounts of these instruments on the Statement of Assets and Liabilities, and the realized gains and losses and changes in unrealized gains and losses on the Statement of Operations, each categorized by type of derivative contract, are included in a table at the end of the applicable Funds’ Schedule of Portfolio Investments. For the fiscal year ended October 31, 2019, the average quarterly balances of derivative financial instruments outstanding were as follows:
| | | | | | | | |
| | | Long-Short Equity | | | Global Risk-Balanced | |
|
Financial Futures Contracts | |
| | |
Average number of contracts purchased | | | 459 | | | | 707 | |
| | |
Average notional value of contracts purchased | | | $60,464,508 | | | | $64,877,662 | |
| | |
Options | | | | | | | | |
| | | | | | | | |
| | |
Average value of option contracts purchased | | | — | | | | $237,980 | |
| | |
Average value of option contracts written | | | — | | | | 347,793 | |
| | |
Swap Agreements | | | | | | | | |
| | | | | | | | |
| | |
Long Position: | | | | | | | | |
| | |
Average notional value | | | $10,025,509 | | | | — | |
| | |
Short Position: | | | | | | | | |
| | |
Average notional value | | | 57,206,744 | | | | — | |
9. FUTURES CONTRACTS
Long-Short Equity entered into equity index futures contracts with the objective of maintaining exposure to equity stock markets while maintaining liquidity. Global Risk-Balanced entered into futures contracts, including futures contracts on fixed-income securities, interest rate futures contracts, foreign currency futures contracts and futures contracts on security indices (including broad-based security indices). Long-Short Equity and Global Risk-Balanced purchased and sold futures contracts to achieve a desired level of investment, whether to accommodate portfolio turnover or cash flows from capital shares transactions. There are certain risks associated with futures contracts. Prices may not move as expected or the Funds may not be able to close out the contract when it desires to do so, resulting in losses.
On entering into a futures contract, either cash or securities in an amount equal to a certain percentage of the contract value (initial margin) must be deposited with the futures broker. Subsequent variation margin payments are made or received by the Funds depending on the fluctuations in the value of the futures contracts and the value of cash or securities on deposit with the futures broker. The Funds must have total value at the futures broker consisting of either net unrealized gains, cash or securities collateral to meet the initial margin requirement, and any value over the initial margin requirement may be transferred to the Funds. Long-Short Equity paid or received variation margin periodically, while Global Risk-Balanced paid or received variation margin on a daily basis. As of October 31, 2019, Long-Short Equity had an initial margin requirement of $2,238,390, which Long-Short Equity covered with a combination of cash at the futures broker, unrealized gains on futures contracts and securities deposited in a segregated account, while Global Risk-Balanced had an initial margin requirement of $1,809,241, which Global Risk-Balanced covered with securities deposited with the futures broker.
Variation margin on future contracts is recorded as unrealized appreciation or depreciation until the futures contract is closed or expired. The Funds recognize a realized gain or loss when the contract is closed or expires equal to the difference between the value of the contract at the time it was opened and the value at the time it was closed. Fluctuations in the value of the contracts are recorded in the
50
|
Notes to Financial Statements(continued) |
Statement of Assets and Liabilities as an asset (liability) and in the Statement of Operations as unrealized appreciation (depreciation) until the contracts are closed, when they are recorded as realized gains (losses) on futures contracts.
10. OPTIONS
Long-Short Equity and Global Risk-Balanced may purchase and write call options and put options on a variety of underlying securities and instruments, including, but not limited to, specific securities, securities indices, futures contracts and foreign currencies. A call option gives the purchaser the right to buy, and obligates the writer to sell, the underlying security or instrument at the agreed-upon price during the option period. A put option gives the purchaser the right to sell, and obligates the writer to buy, the underlying security or instrument at the agreed-upon price during the option period. Options purchased are recorded as an asset, while options written (sold) are recorded as liabilities. When the Funds write options they bear the risk of an unfavorable change in the market value of the instrument underlying the written option. When an option expires, the premium (original option value) is realized as a gain if the option was written or as a loss if the option was purchased. When the exercise of an option results in a cash settlement, the difference between the premium and the settlement proceeds is recognized as realized gain or loss. When securities are acquired or delivered upon exercise of an option, the acquisition cost or sale proceeds are adjusted by the amount of the premium. When an option is closed, the difference between the premium and the cost to close the position is realized as a gain or loss.
11. SWAPS
Long Short Equity may enter into Equity Basket Swaps to obtain exposure to a portfolio of long and short securities. Under the terms of the agreement, the equity return basket swap is designed to function as a fund of direct investments in long and short equity positions. The Fund will receive all of the economic benefits and risks equivalent to direct investments in these positions such as: capital appreciation or depreciation, corporate actions, and dividends and interest received and paid, all of which are reflected in the swap value. The swap value also includes interest charges and credits (“financing”) related to the notional values of the long and short positions and cash balances within the swap. This financing is based on defined market rates or a specified benchmark rate, plus or minus a specified spread. Underlying positions constituting the Equity Basket Swap are reset periodically. On reset date, any unrealized gains (losses) on positions and accrued financing costs become available for cash settlement between Long Short Equity and the swap counterparty. Cash settlement in and out of the swap may occur at a reset date, close-out date or at maturity.
A change in the market value of a Equity Basket Swap, unpaid dividend income and/or expense and financing are recognized as net change in unrealized appreciation or depreciation on swaps in the Statements of Operations. Payments received or paid, on resets, close-outs or maturities, are recorded in the statement of operations as realized gains or losses of swaps.
Swaps and Equity Basket Swaps are two-party contracts that may be subject to contractual restrictions on transferability and termination, and because they may have terms of greater than seven days, swap agreements may be considered to be illiquid. If a swap is not liquid, it may not be possible to initiate a transaction or liquidate a position at an advantageous time or price, which may result in significant losses. Moreover, the Fund bears the risk of loss of the amount expected to be received under a swap agreement in the event of the default or
bankruptcy of a swap agreement counterparty. The Fund will enter into swap agreements only with counterparties that meet certain standards of creditworthiness. When a counterparty’s obligations are not fully secured by collateral, then the Fund is essentially an unsecured creditor of the counterparty. If the counterparty defaults, the Fund will have contractual remedies, but there is no assurance that a counterparty will be able to meet its obligations pursuant to such contracts or that, in the event of default, the Fund will succeed in enforcing contractual remedies. Counterparty risk still exists even if a counterparty’s obligations are secured by collateral because the Fund’s interest in collateral may not be perfected or additional collateral may not be promptly posted as required. Counterparty risk also may be more pronounced if a counterparty’s obligations exceed the amount of collateral held by the Fund, if any, the Fund is unable to exercise its interest in collateral upon default by the counterparty, or the termination value of the instrument varies significantly from the marked-to-market value of the instrument.
12. EXCHANGE TRADED NOTES
Global Risk-Balanced invests in Exchange Traded Notes (“ETNs”). ETNs are senior, unsecured, unsubordinated debt securities issued by a financial institution, listed on an exchange and traded in the secondary market. There are no periodic interest payments, and principal is not protected. The Fund could lose some or all of the amount invested. The price in the secondary market is determined by supply and demand, the current performance of the index, and the credit rating of the ETN issuer. At maturity, the issuer pays the Fund a return linked to the performance of the market index, such as a commodity index, to which the ETN is linked, minus the issuer’s fee. ETNs are subject to the risk of a breakdown in the futures markets that they use. As a means to obtain commodity exposure, the Fund invests in ETNs linked to commodity indices. The Fund may be exposed to a wide variety of commodity sectors, including, without limitation, agriculture, livestock, base/industrial metals, oil, energy and precious metals. Commodity prices, and the value of stocks of companies exposed to commodities, can be extremely volatile and are affected by a wide range of factors.
13. MARKET, CREDIT AND COUNTERPARTY RISKS
In the normal course of business, Global Risk-Balanced invests in securities and enters into transactions where risks exist due to market fluctuations and is exposed to credit risk with parties with whom it trades (issuers or counterparties). Market prices of investments held by the Fund may fall rapidly or unpredictably and will rise and fall due to changing economic, political, or market conditions or in response to events that affect particular industries or companies. The Fund may be exposed to credit or counterparty risk, or the risk that an institution or other entity with which the Fund has unsettled or open transactions will default or not perform under the contract. The Fund minimizes credit risk and counterparty risk by undertaking transactions with a large number of customers and counterparties on recognized and reputable exchanges. The Fund could lose money if the issuer or guarantor of a fixed income security, or the counterparty to a financial derivatives contract, repurchase agreement or a loan of portfolio securities, is unable or unwilling to make timely principal and/or interest payments, or to otherwise honor its obligations.
The Funds are subject to various Master Agreements, which govern the terms of certain transactions with select counterparties. These Master Agreements reduce the counterparty risk associated with relevant transactions by specifying credit protection mechanisms and providing standardization that improves legal certainty. Master Agreements can also help limit counterparty risk by specifying
51
|
Notes to Financial Statements(continued) |
collateral posting arrangements at pre-arranged exposure levels. Under the Master Agreements, collateral is routinely transferred if the total net exposure to certain transactions (net of existing collateral already in place) governed under the relevant master agreement with a counterparty in a given account exceeds a specified threshold, which typically ranges from zero to $250,000 depending on the counterparty and the type of Master Agreement.
International Swaps and Derivatives Association, Inc. Master Agreements (“ISDA Master Agreements”) govern OTC financial derivative transactions entered into by the Funds and the respective counterparty. The ISDA Master Agreements maintain provisions for general obligations, representations, agreements, collateral and events of default or termination. Certain ISDA Master Agreements allow counterparties to OTC derivatives to terminate derivative contracts prior to maturity in the event the Funds’ net assets decline by a stated percentage or the Funds fail to meet the terms of the ISDA Master Agreement, which requires accelerated settlement of all outstanding transactions under the applicable ISDA Master Agreement. Any election to terminate early could be material to the financial statements.
| 14. | SECURITIES SOLD SHORT AND DUE TO/FROM BROKERS |
Long-Short Equity utilizes short sales as part of its overall portfolio management strategy. A short sale involves the sale of a security that is borrowed from a broker or other financial institution. A gain, limited to the price at which the Fund sold the security short, or a loss, unlimited in size, will be recognized upon closing a short sale. Short sales expose the Fund to the risk that it will be required to acquire, convert or exchange securities to replace the borrowed securities at a time when the securities sold short have appreciated in value, thus resulting in a loss to the
Fund. The Fund must segregate liquid assets, or otherwise cover its position in a permissible manner. The Investment Manager determines the liquidity of assets, in accordance with procedures established by the Board. Cash segregated as collateral for short sales is shown in the Statement of Assets and Liabilities as segregated cash. Security positions segregated as collateral for short sales are included in investments at value in the Statement of Assets and Liabilities. Due to/from brokers represents cash balances on deposit with, or cash balances owed to the Prime Broker. When the Fund has cash balances on deposit with the Prime Broker, the Fund is subject to credit risk should the Prime Broker be unable to meet their obligations to the Fund; and when the Fund has cash balances owed to the Prime Broker, the amount is payable upon demand and the Fund must segregate liquid assets. The Fund has entered into a Special Custody and Pledge Agreement with the Prime Broker for securities sold short, which provides the right, in the event of default (including bankruptcy or insolvency) for the non-defaulting party to liquidate the collateral and calculate net exposure to the defaulting party or request additional collateral. For financial reporting purposes, the Fund does not offset financial assets and financial liabilities that are subject to a Special Custody and Pledge Agreement in the Statement of Assets and Liabilities. In accordance with the terms of its prime brokerage agreement, the Fund may receive rebate income or be charged a fee on the market value on the collateral of loaned securities. The income received or fee paid is calculated based upon a variable rate minus a spread. The Fund will recognize interest income if the variable rate is greater than the spread or interest expense if the variable rate is less than the spread. For the fiscal year ended October 31, 2019, the Fund had interest income and dividend expense in the amount of $118,260 and $201,083, respectively. As of October 31, 2019, the Fund did not hold any securities sold short.
| 15. | MASTER NETTING AGREEMENTS |
The Funds may enter into master netting agreements with their counterparties for the securities lending and short-sale programs, Repurchase Agreements and derivative instruments, which provide the right, in the event of default (including bankruptcy or insolvency) for the non-defaulting party to liquidate the collateral and calculate net exposure to the defaulting party or request additional collateral. For financial reporting purposes, the Funds do not offset financial assets and financial liabilities that are subject to master netting agreements in the Statement of Assets and Liabilities. For securities lending and short sale transactions, see Note 4 and Note 13.
The following table is a summary of the Funds’ open Repurchase Agreements and derivatives that are subject to a master netting agreement as of October 31, 2019:
| | | | | | | | | | | | | | | | | | | | |
| | | | | | Gross Amount Not Offset in the
Statement of Assets and Liabilities | | | | | | | |
| |
| Gross Amounts of
Assets Presented in
the Statement of |
| | | Offset | | |
| Net
Asset |
| | | Collateral | | | | Net | |
Fund | | | Assets and Liabilities | | | | Amount | | | | Balance | | | | Received | | | | Amount | |
| | | | | |
Tax-Managed | | | | | | | | | | | | | | | | | | | | |
| | | | | | | | | | | | | | | | | | | | |
| | | | | |
Credit Suisse AG | | | $258,645 | | | | — | | | | $258,645 | | | | $258,645 | | | | — | |
| | | | | | | | | | | | | | | | | | | | |
| | | | | |
Long-Short Equity | | | | | | | | | | | | | | | | | | | | |
| | | | | | | | | | | | | | | | | | | | |
| | | | | |
Credit Suisse AG | | | $291,245 | | | | — | | | | $291,245 | | | | $291,245 | | | | — | |
| | | | | |
Morgan Stanley & Co. | | | 288,921 | | | | $(185,307) | | | | 103,614 | | | | 103,614 | | | | — | |
| | | | | | | | | | | | | | | | | | | | |
| | | | | |
Total | | | $580,166 | | | | $(185,307) | | | | $394,859 | | | | $394,859 | | | | — | |
| | | | | | | | | | | | | | | | | | | | |
52
|
Notes to Financial Statements(continued) |
| | | | | | | | | | | | | | | | | | | | |
| | | | | | Gross Amount Not Offset in the
Statement of Assets and Liabilities | | | | | | | |
| |
| Gross Amounts of
Assets Presented in
the Statement of |
| | | Offset | | | | Net Asset | | | | Collateral | | | | Net | |
Fund | | | Assets and Liabilities | | | | Amount | | | | Balance | | | | Received | | | | Amount | |
| | | | | |
Global Risk-Balanced | | | | | | | | | | | | | | | | | | | | |
| | | | | |
Credit Suisse AG | | | $161,083 | | | | — | | | | $161,083 | | | | $161,083 | | | | — | |
| | | | | |
Guggenheim Securities LLC | | | 1,000,000 | | | | — | | | | 1,000,000 | | | | 1,000,000 | | | | — | |
| | | | | |
| | | | | | | | | | | | | | | | | | | | |
| | | | | |
Total | | | $1,161,083 | | | | — | | | | $1,161,083 | | | | $1,161,083 | | | | — | |
| | | | | | | | | | | | | | | | | | | | |
| | | | |
| | | | | | Gross Amount Not Offset in the
Statement of Assets and Liabilities | | | | | | | |
| |
| Gross Amounts of
Liabilities Presented in
the Statement of |
| | | Offset | | |
| Net
Liability |
| | | Collateral | | | | Net | |
Fund | | | Assets and Liabilities | | | | Amount | | | | Balance | | | | Received | | | | Amount | |
| | | | | |
Long-Short Equity | | | | | | | | | | | | | | | | | | | | |
| | | | | |
Morgan Stanley & Co. | | | $(185,307) | | | | $185,307 | | | | — | | | | — | | | | — | |
The Funds have determined that no material events or transactions occurred through the issuance date of the Funds’ financial statements which require an additional disclosure in or adjustment of the Funds’ financial statements.
53
|
Report of Independent Registered Public Accounting Firm |
| | |
| TO THE BOARD OF TRUSTEES OF AMG FUNDS I AND SHAREHOLDERS OF THE AMG FQ TAX-MANAGED U.S. EQUITY FUND, AMG FQ LONG-SHORT EQUITY FUND AND AMG FQ GLOBAL RISK-BALANCED FUND. | | |
| |
Opinions on the Financial Statements | | |
| |
| We have audited the accompanying statements of assets and liabilities, including the schedules of portfolio investments, of AMG FQ Tax-Managed U.S. Equity Fund, AMG FQ Long-Short Equity Fund, and AMG FQ Global Risk-Balanced Fund (three of the Funds constituting AMG Funds I, hereafter collectively referred to as the “Funds”) as of October 31, 2019, the related statements of operations for the year ended October 31, 2019, the statements of changes in net assets for each of the two years in the period ended October 31, 2019, including the related notes, and the financial highlights for each of the five years in the period ended October 31, 2019 (collectively referred to as the “financial statements”). In our opinion, the financial statements present fairly, in all material respects, the financial position of each of the Funds as of October 31, 2019, the results of each of their operations for the year then ended, the changes in each of their net assets for each of the two years in the period ended October 31, 2019 and each of the financial highlights for each of the five years in the period ended October 31, 2019 in conformity with accounting principles generally accepted in the United States of America. | | |
| |
| Basis for Opinions | | |
| |
| These financial statements are the responsibility of the Funds’ management. Our responsibility is to express an opinion on the Funds’ financial statements based on our audits. We are a public accounting firm registered with the Public Company Accounting Oversight Board (United States) (“PCAOB”) and are required to be independent with respect to the Funds in accordance with the U.S. federal securities laws and the applicable rules and regulations of the Securities and Exchange Commission and the PCAOB. | | |
| |
| We conducted our audits of these financial statements in accordance with the standards of the PCAOB. Those standards require that we plan and perform the audit to obtain reasonable assurance about whether the financial statements are free of material misstatement, whether due to error or fraud. | | |
| |
| Our audits included performing procedures to assess the risks of material misstatement of the financial statements, whether due to error or fraud, and performing procedures that respond to those risks. Such procedures included examining, on a test basis, evidence regarding the amounts and disclosures in the financial statements. Our audits also included evaluating the accounting principles used and significant estimates made by management, as well as evaluating the overall presentation of the financial statements. Our procedures included confirmation of securities owned as of October 31, 2019 by correspondence with the custodian, transfer agent, and brokers; when replies were not received from brokers, we performed other auditing procedures. We believe that our audits provide a reasonable basis for our opinions. | | |
| |
| PricewaterhouseCoopers LLP | | |
Boston, Massachusetts | | |
December 27, 2019 | | |
| |
| We have served as the auditor of one or more investment companies in the AMG Funds Family since 1993. | | |
54
TAX INFORMATION
The AMG FQ Tax-Managed U.S. Equity Fund, AMG FQ Long-Short Equity Fund and AMG FQ Global Risk-Balanced Fund each hereby designates the maximum amount allowable of its net taxable income as qualified dividends as provided in the Jobs and Growth Tax Relief Reconciliation Act of 2003. The 2018/2019 Form 1099-DIV you receive for each Fund will show the tax status of all distributions paid to you during the year.
Pursuant to section 852 of the Internal Revenue Code, AMG FQ Tax-Managed U.S. Equity Fund, AMG FQ Long-Short Equity Fund and AMG FQ Global Risk-Balanced Fund each hereby designates $928,977, $2,574,706, and $0 respectively, as a capital gain distribution with respect to the taxable year ended October 31, 2019, or if subsequently determined to be different, the net capital gains of such fiscal year.
55
|
AMG Funds Trustees and Officers |
| | | | |
| The Trustees and Officers of the Trust, their business addresses, principal occupations for the past five years and ages are listed below. The Trustees provide broad supervision over the affairs of the Trust and the Funds. The Trustees are experienced executives who meet periodically throughout the year to oversee the Funds’ activities, review contractual arrangements with companies that provide services to the Funds, and | | review the Funds’ performance. Unless otherwise noted, the address of each Trustee or Officer is the address of the Trust: 600 Steamboat Road, Suite 300, Greenwich, Connecticut 06830. There is no stated term of office for Trustees. Trustees serve until their resignation, retirement or removal in | | accordance with the Trust’s organizational documents and policies adopted by the Board from time to time. The Chairman of the Trustees, President, Treasurer and Secretary of the Trust are elected by the Trustees annually. Other officers hold office at the pleasure of the Trustees. |
Independent Trustees
The following Trustees are not “interested persons” of the Trust within the meaning of the 1940 Act:
| | |
Number of Funds Overseen in
Fund Complex | | Name, Age, Principal Occupation(s) During Past 5 Years and Other Directorships Held by Trustee |
| | |
• Trustee since 2012 • Oversees 49 Funds in Fund Complex | | Bruce B. Bingham, 71 Partner, Hamilton Partners (real estate development firm) (1987-Present); Director of The Yacktman Funds (2000-2012). |
| | |
• Trustee since 2000 • Oversees 49 Funds in Fund Complex | | Edward J. Kaier, 74 Attorney at Law and Partner, Teeters Harvey Marrone & Kaier LLP (2007-Present); Attorney at Law and Partner, Hepburn Willcox Hamilton & Putnam, LLP (1977-2007); Trustee of Third Avenue Trust (2002-2019); Trustee of Third Avenue Variable Trust (2002-2019). |
| | |
• Trustee since 2013 • Oversees 52 Funds in Fund Complex | | Kurt A. Keilhacker, 56 Managing Partner, TechFund Capital (1997-Present); Managing Partner, TechFund Europe (2000-Present); Board Member, 6wind SA, (2002-Present); Managing Partner, Elementum Ventures (2013-Present); Director, MetricStory, Inc. (2017-Present); Trustee, Wheaton College (2018-Present); Trustee, Gordon College (2001-2016). |
| | |
• Trustee since 2000 • Oversees 49 Funds in Fund Complex | | Steven J. Paggioli, 69 Independent Consultant (2002-Present); Trustee, Professionally Managed Portfolios (28 portfolios); Advisory Board Member, Sustainable Growth Advisors, LP; Independent Director, Muzinich BDC, Inc. (business development company) (2019-Present); Independent Director, Chase Investment Counsel (2008–2019); Executive Vice President, Secretary and Director, Investment Company Administration, LLC (1990-2001). |
| | |
• Trustee since 2013 • Oversees 49 Funds in Fund Complex | | Richard F. Powers III, 73 Adjunct Professor, U.S. Naval War College (2016-Present); Adjunct Professor, Boston College (2010-2013); President and CEO of Van Kampen Investments Inc. (1998-2003). |
| | |
• Independent Chairman • Trustee since 2000 • Oversees 52 Funds in Fund Complex | | Eric Rakowski, 61 Professor of Law, University of California at Berkeley School of Law - Boalt Hall (1990-Present); Director of Harding, Loevner Funds, Inc. (9 portfolios); Trustee of Third Avenue Trust (2002-2019); Trustee of Third Avenue Variable Trust (2002-2019). |
| | |
• Trustee since 2013 • Oversees 52 Funds in Fund Complex | | Victoria L. Sassine, 54 Adjunct Professor, Babson College (2007–Present); Director, Board of Directors, PRG Group (2017-Present); CEO, Founder, Scale Smarter Partners, LLC (2018-Present); Chairperson, Board of Directors, Business Management Associates (2018-Present). |
| | |
• Trustee since 2000 • Oversees 49 Funds in Fund Complex | | Thomas R. Schneeweis, 72 Professor Emeritus, University of Massachusetts (2013-Present); President, TRS Associates (1982-Present); Board Member, Chartered Alternative Investment Association (“CAIA”) (2002-Present); Director, Institute for Global Asset and Risk Management (Education) (2010-Present); Co-Owner, Quantitative Investment Technologies (2014-Present); Director of Research, Yes Wealth Management (2018-Present); Partner, S Capital Wealth Advisors (2015-2018); Partner, S Capital Management, LLC (2007-2015); President, Alternative Investment Analytics, LLC, (formerly Schneeweis Partners, LLC) (2001-2013). |
56
|
AMG Funds Trustees and Officers(continued) |
Interested Trustees
Each Trustee in the following table is an “interested person” of the Trust within the meaning of the 1940 Act. Ms. Carsman is an interested person of the Trust within the meaning of the 1940 Act by virtue of her position with, and interest in securities of, AMG.
| | |
Number of Funds Overseen in
Fund Complex | | Name, Age, Principal Occupation(s) During Past 5 Years and Other Directorships Held by Trustee |
| | |
• Trustee since 2011 • Oversees 52 Funds in Fund Complex | | Christine C. Carsman, 67 Senior Policy Advisor, Affiliated Managers Group, Inc. (2019-Present); Director of Harding, Loevner Funds, Inc. (9 portfolios); Executive Vice President, Deputy General Counsel and Chief Regulatory Counsel, Affiliated Managers Group, Inc. (2017-2018); Director (2010-2018) and Chair of the Board of Directors (2015-2018), AMG Funds plc; Senior Vice President and Deputy General Counsel, Affiliated Managers Group, Inc. (2011-2016); Senior Vice President and Chief Regulatory Counsel, Affiliated Managers Group, Inc. (2007-2011); Vice President and Chief Regulatory Counsel, Affiliated Managers Group, Inc. (2004-2007); Secretary and Chief Legal Officer, AMG Funds, AMG Funds I, AMG Funds II and AMG Funds III (2004-2011); Senior Counsel, Vice President and Director of Operational Risk Management and Compliance, Wellington Management Company, LLP (1995-2004). |
| |
| Officers |
Position(s) Held with Fund and
Length of Time Served | | Name, Age, Principal Occupation(s) During Past 5 Years |
| | |
• President since 2018 • Principal Executive Officer since 2018 • Chief Executive Officer since 2018 • Chief Operating Officer since 2007 | | Keitha L. Kinne, 61 Chief Operating Officer, AMG Funds LLC (2007-Present); Chief Investment Officer, AMG Funds LLC (2008-Present); President and Principal, AMG Distributors, Inc. (2018-Present); Chief Operating Officer, AMG Distributors, Inc. (2007-Present); President, Chief Executive Officer and Principal Executive Officer, AMG Funds, AMG Funds I, AMG Funds II, AMG Funds III and AMG Funds IV (2018-Present); Chief Operating Officer, AMG Funds, AMG Funds I, AMG Funds II, and AMG Funds III (2007-Present); Chief Operating Officer, AMG Funds IV (2016-Present); Chief Operating Officer and Chief Investment Officer, Aston Asset Management, LLC (2016); President and Principal Executive Officer, AMG Funds, AMG Funds I, AMG Funds II and AMG Funds III (2012-2014); Managing Partner, AMG Funds LLC (2007-2014); President and Principal, AMG Distributors, Inc. (2012-2014); Managing Director, Legg Mason & Co., LLC (2006-2007); Managing Director, Citigroup Asset Management (2004-2006). |
| | |
• Secretary since 2015 • Chief Legal Officer since 2015 | | Mark J. Duggan, 54 Senior Vice President and Senior Counsel, AMG Funds LLC (2015-Present); Secretary and Chief Legal Officer, AMG Funds, AMG Funds I, AMG Funds II, AMG Funds III and AMG Funds IV (2015-Present); Attorney, K&L Gates, LLP (2009-2015). |
| | |
• Chief Financial Officer since 2017 • Treasurer since 2017 • Principal Financial Officer since 2017 • Principal Accounting Officer since 2017 | | Thomas G. Disbrow, 53 Vice President, Mutual Fund Treasurer & CFO, AMG Funds, AMG Funds LLC (2017-Present); Chief Financial Officer, Principal Financial Officer, Treasurer and Principal Accounting Officer, AMG Funds, AMG Funds I, AMG Funds II, AMG Funds III and AMG Funds IV (2017-Present); Managing Director - Global Head of Traditional Funds Product Control, UBS Asset Management (Americas), Inc. (2015-2017); Managing Director - Head of North American Funds Treasury, UBS Asset Management (Americas), Inc. (2011-2015). |
| | |
• Deputy Treasurer since 2017 | | John A. Starace, 49 Director, Mutual Fund Accounting, AMG Funds LLC (2017-Present); Vice President, Deputy Treasurer of Mutual Funds Services, AMG Funds LLC (2014-2017); Deputy Treasurer, AMG Funds, AMG Funds I, AMG Funds II, AMG Funds III and AMG Funds IV (2017-Present); Vice President, Citi Hedge Fund Services (2010-2014); Audit Senior Manager (2005-2010) and Audit Manager (2001-2005), Deloitte & Touche LLP. |
| | |
• Chief Compliance Officer since 2019 | | Patrick J. Spellman, 45 Vice President, Chief Compliance Officer, AMG Funds LLC (2017-Present); Chief Compliance Officer and Sarbanes-Oxley Code of Ethics Compliance Officer, AMG Funds, AMG Funds I, AMG Funds II, AMG Funds III and AMG Funds IV (2019-Present); Chief Compliance Officer, AMG Distributors, Inc., (2010-Present) Senior Vice President, Chief Compliance Officer, AMG Funds LLC (2011-2017); Anti-Money Laundering Compliance Officer, AMG Funds, AMG Funds I, AMG Funds II, and AMG Funds III (2014-2019); Anti-Money Laundering Officer, AMG Funds IV, (2016-2019); Compliance Manager, Legal and Compliance, Affiliated Managers Group, Inc. (2005-2011). |
| | |
• Assistant Secretary since 2016 | | Maureen A. Meredith, 34 Vice President, Counsel, AMG Funds LLC (2019-Present); Director, Counsel, AMG Funds LLC (2017-2018); Vice President, Counsel, AMG Funds LLC (2015-2017); Assistant Secretary, AMG Funds, AMG Funds I, AMG Funds II, AMG Funds III and AMG Funds IV (2016-Present); Associate, Ropes & Gray LLP (2011-2015); Law Fellow, Massachusetts Appleseed Center for Law and Justice (2010-2011). |
| | |
• Anti-Money Laundering Compliance Officer since 2019 | | Hector D. Roman, 41 Manager, Legal and Compliance, AMG Funds LLC (2017-Present); Director of Compliance, Morgan Stanley Investment Management (2015-2017); Senior Advisory, PricewaterhouseCoopers LLP (2014-2015); Risk Manager, Barclays Investment Bank (2008-2014); Anti-Money Laundering Compliance Officer, AMG Funds, AMG Funds I, AMG Funds II, AMG Funds III and AMG Funds IV (2019-Present). |
57
|
Annual Renewal of Investment Management and Subadvisory Agreements |
| | | | | | | | |
At an in-person meeting held on June 27, 2019, the Board of Trustees (the “Board” or the “Trustees”), and separately a majority of the Trustees who are not “interested persons” of AMG Funds I (the “Trust”) (the “Independent Trustees”), approved (i) the Investment Management Agreement, as amended pursuant to letter agreements at any time prior to the date of the meeting, with AMG Funds LLC (the “Investment Manager”) for each of AMG FQ Long-Short Equity Fund, AMG FQ Tax-Managed U.S. Equity Fund and AMG FQ Global Risk-Balanced Fund (each, a “Fund,” and collectively, the “Funds”) and separately each of Amendment No. 1 thereto dated July 1, 2015, and Amendment No. 2 thereto dated October 1, 2016 (collectively, the “Investment Management Agreements”) and (ii) the Subadvisory Agreement, as amended at any time prior to the date of the meeting, with the Subadviser for each Fund (collectively, the “Subadvisory Agreements”). The Independent Trustees were separately represented by independent legal counsel in connection with their consideration of the approval of these agreements. In considering the Investment Management Agreements and the Subadvisory Agreements, the Trustees reviewed a variety of materials relating to each Fund, the Investment Manager and the Subadviser, including comparative performance, fee and expense information for an appropriate peer group of similar mutual funds for each Fund (each, a “Peer Group”), performance information for the relevant benchmark index for each Fund (each, a “Fund Benchmark”) and other information provided to them on a periodic basis throughout the year, as well as information provided in connection with their meeting held on June 27, 2019, regarding the nature, extent and quality of services provided by the Investment Manager and the Subadviser under their respective agreements and other relevant matters. Prior to voting, the Independent Trustees: (a) reviewed the foregoing information with their independent legal counsel; (b) received materials from their independent legal counsel discussing the legal standards applicable to their consideration of the Investment Management Agreements and the Subadvisory Agreements; and (c) met with their independent legal counsel in private sessions at which no representatives of management were present. NATURE, EXTENT AND QUALITY OF SERVICES In considering the nature, extent and quality of the services provided by the Investment Manager, the Trustees reviewed information relating to the Investment Manager’s operations and personnel. Among other things, the Investment Manager provided financial information, information about its | | | | supervisory and professional staff and descriptions of its organizational and management structure. The Trustees also took into account information provided periodically throughout the previous year by the Investment Manager in Board meetings relating to the performance of its duties with respect to the Funds and the Trustees’ knowledge of the Investment Manager’s management and the quality of the performance of the Investment Manager’s duties under the Investment Management Agreements and Administration Agreement. In the course of their deliberations regarding the Investment Manager, the Trustees evaluated, among other things: (a) the extent and quality of the Investment Manager’s oversight of the operation and management of the Funds; (b) the quality of the Investment Manager’s oversight of the performance by the Subadviser of its portfolio management duties; (c) the Investment Manager’s ability to supervise the Funds’ other service providers; and (d) the Investment Manager’s compliance program. The Trustees also took into account that, in performing its functions under the Investment Management Agreements and supervising the Subadviser, the Investment Manager: performs periodic detailed analyses and reviews of the performance by the Subadviser of its obligations to each Fund, including without limitation, analysis and review of portfolio and other compliance matters and review of the Subadviser’s investment performance with respect to a Fund; prepares and presents periodic reports to the Board regarding the investment performance of the Subadviser and other information regarding the Subadviser, at such times and in such forms as the Board may reasonably request; reviews and considers any changes in the personnel of the Subadviser responsible for performing the Subadviser’s obligations and makes appropriate reports to the Board; reviews and considers any changes in the ownership or senior management of the Subadviser and makes appropriate reports to the Board; performs periodic in-person or telephonic diligence meetings, including with respect to compliance matters, with representatives of the Subadviser; assists the Board and management of the Trust in developing and reviewing information with respect to the initial approval of each Subadvisory Agreement and annual consideration of each Subadvisory Agreement thereafter; prepares recommendations with respect to the continued retention of the Subadviser or the replacement of the Subadviser, including at the request of the Board; identifies potential successors to, or replacements of, the Subadviser or potential additional subadvisers, including performing appropriate due diligence, and developing and presenting to the Board a | | | | recommendation as to any such successor, replacement, or additional subadviser, including at the request of the Board; designates and compensates from its own resources such personnel as the Investment Manager may consider necessary or appropriate to the performance of its services; and performs such other review and reporting functions as the Board shall reasonably request consistent with the Investment Management Agreements and applicable law. The Trustees noted the affiliation of the Subadviser with the Investment Manager, noting any potential conflicts of interest. The Trustees also took into account the financial condition of the Investment Manager with respect to its ability to provide the services required under the Investment Management Agreements and the Investment Manager’s undertaking to maintain contractual expense limitations for the Funds. The Trustees also considered the Investment Manager’s risk management processes. The Trustees also reviewed information relating to the Subadviser’s operations and personnel and the investment philosophy, strategies and techniques (its “Investment Strategy”) used in managing each Fund. Among other things, the Trustees reviewed information on portfolio management and other professional staff, information regarding the Subadviser’s organizational and management structure and the Subadviser’s brokerage policies and practices. The Trustees considered specific information provided regarding the experience of the individuals at the Subadviser with portfolio management responsibility for the Funds, including the information set forth in each Fund’s prospectus and statement of additional information. In the course of their deliberations, the Trustees evaluated, among other things: (a) the services rendered by the Subadviser in the past; (b) the qualifications and experience of the Subadviser’s personnel; and (c) the Subadviser’s compliance program. The Trustees also took into account the financial condition of the Subadviser with respect to its ability to provide the services required under each Subadvisory Agreement. The Trustees also considered the Subadviser’s risk management processes. PERFORMANCE The Board considered each Fund’s net performance during relevant time periods as compared to the Fund’s Peer Group and Fund Benchmark and considered the gross performance of the Fund as compared to the Subadviser’s relevant performance composite that utilizes the same investment strategy and approach and noted that the Board reviews on a quarterly basis detailed information about each Fund’s performance results and portfolio |
58
|
Annual Renewal of Investment Management and Subadvisory Agreements(continued) |
| | | | | | | | |
composition, as well as the Subadviser’s Investment Strategy. The Board noted the Investment Manager’s expertise and resources in monitoring the performance, investment style and risk-adjusted performance of the Subadviser. The Board was mindful of the Investment Manager’s attention to monitoring the Subadviser’s performance with respect to the Funds and its discussions with management regarding the factors that contributed to the performance of the Funds. With respect to AMG FQ Long-Short Equity Fund, among other information related to the Fund’s performance, the Trustees noted that the Fund’s performance for Class I shares (which share class has the earliest inception date and the largest amount of assets of all the share classes of the Fund) for the 1-year, 3-year, 5-year and 10-year periods ended March 31, 2019 was above the median performance of the Peer Group and below the performance of the Fund Benchmark, the Russell 3000® Index. The Trustees took into account management’s discussion of the Fund’s performance, including the fact that, prior to August 31, 2017, the Fund focused on a U.S. equity strategy and generally did not take short equity positions although it did utilize an option overlay strategy that included the ability to both buy and sell short options. The Trustees also took into account the fact that Class I shares of the Fund ranked in the top decile relative to its Peer Group for the 1-year and 3-year periods. Given the Fund’s relatively short performance history using its current investment strategy, the Trustees did not attribute much weight to the Fund’s longer-term performance. The Trustees concluded that the Fund’s overall performance has been satisfactory in light of the Fund’s investment objective, strategies and policies. With respect to AMG FQ Tax-Managed U.S. Equity Fund, among other information related to the Fund’s performance, the Trustees noted that the Fund’s performance for Class I shares (which share class has the earliest inception date and the largest amount of assets of all the share classes of the Fund) for the 1-year, 3-year, 5-year and 10-year periods ended March 31, 2019 was below, below, below and above, respectively, the median performance of the Peer Group and below the performance of the Fund Benchmark, the Russell 3000® Index. The Trustees took into account management’s discussion of the Fund’s performance, including the reasons for the Fund’s underperformance and any actions being taken to | | | | address such underperformance. The Trustees concluded that the Fund’s performance is being addressed. With respect to AMG FQ Global Risk-Balanced Fund, among other information related to the Fund’s performance, the Trustees noted that the Fund’s performance for Class Z shares (which share class has the earliest inception date and the largest amount of assets of all the share classes of the Fund) for the 1-year, 3-year, 5-year and 10-year periods ended March 31, 2019 was above the median performance of the Peer Group and above the performance of the Fund Benchmark, a Composite Index (60% MSCI World Index and 40% FTSE World Government Bond Index (Hedged)). The Trustees took into account management’s discussion of the Fund’s performance, including the fact that Class Z shares of the Fund ranked in the top decile relative to its Peer Group for the 10-year period, in the top quintile relative to its Peer Group for the 3-year and 5-year periods and in the top quartile relative to its Peer Group for the 1-year period. The Trustees concluded that the Fund’s overall performance has been satisfactory. ADVISORY AND SUBADVISORY FEES AND PROFITABILITY In considering the reasonableness of the advisory fee payable to the Investment Manager, the Trustees reviewed information provided by the Investment Manager setting forth all revenues and other benefits, both direct and indirect (including any so-called “fallout benefits” such as reputational value derived from the Investment Manager serving as Investment Manager to a Fund), received by the Investment Manager and its affiliates attributable to managing each Fund and all the mutual funds in the AMG Funds Family of Funds; the cost of providing such services; the significant risks undertaken as Investment Manager and sponsor of the Funds, including investment, operational, enterprise, entrepreneurial, litigation, regulatory and compliance risks; and the resulting profitability to the Investment Manager and its affiliates from these relationships. The Trustees also considered the amount of the advisory fee retained by the Investment Manager after payment of the subadvisory fee with respect to the Fund. The Trustees also noted payments made or to be made from the Subadviser to the Investment Manager, and other payments made or to be made from the Investment Manager to the Subadviser. The Trustees also considered management’s discussion | | | | of the current asset levels of the Funds, and the impact on profitability of both the current asset levels and any future growth of assets of the Funds. In considering the cost of services to be provided by the Investment Manager under each Investment Management Agreement and the profitability to the Investment Manager of its relationship with the Funds, the Trustees noted the undertaking by the Investment Manager to maintain contractual expense limitations for the Funds. The Board also took into account management’s discussion of the advisory fee structure and the services the Investment Manager provides in performing its functions under each Investment Management Agreement and supervising the Subadviser. Based on the foregoing, the Trustees concluded that the profitability to the Investment Manager is reasonable and that the Investment Manager is not realizing material benefits from economies of scale that would warrant adjustments to the advisory fee at this time. Also with respect to economies of scale, the Trustees noted that as a Fund’s assets increase over time, the Fund may realize other economies of scale to the extent the increase in assets is proportionally greater than the increase in certain other expenses. In considering the reasonableness of the subadvisory fees payable by the Investment Manager to the Subadviser, the Trustees reviewed information regarding the cost of providing subadvisory services to each of the Funds and the resulting profitability to the Subadviser from these relationships. The Trustees noted that, because the Subadviser is an affiliate of the Investment Manager, a portion of the Subadviser’s revenues or profits might be shared directly or indirectly with the Investment Manager. The Trustees also noted that the subadvisory fees are paid by the Investment Manager out of its advisory fee. The Board also took into account management’s discussion of the subadvisory fee structure, and the services the Subadviser provides in performing its functions under each Subadvisory Agreement. Based on the foregoing, the Trustees concluded that the profitability to the Subadviser is reasonable and that the Subadviser is not realizing material benefits from economies of scale that would warrant adjustments to the subadvisory fees at this time. Also with respect to economies of scale, the Trustees noted that as a Fund’s assets increase over time, the Fund may realize other economies of scale to the extent the increase in assets is proportionally greater than the increase in certain other expenses. |
59
|
Annual Renewal of Investment Management and Subadvisory Agreements(continued) |
| | | | | | | | |
With respect to AMG FQ Long-Short Equity Fund, the Trustees noted that the Fund’s management fees (which include both the advisory and administration fees) and total expenses (weighted average, all classes combined) (net of applicable expense waivers/reimbursements) as of March 31, 2019 were lower and higher, respectively, than the average for the Fund’s Peer Group. The Trustees took into account the fact that the Investment Manager has contractually agreed, through March 1, 2020, to limit the Fund’s net annual operating expenses (subject to certain excluded expenses) to 0.69%. The Trustees also took into account management’s discussion of the Fund’s expenses and the current size of the Fund. The Trustees concluded that, in light of the nature, extent and quality of the services provided by the Investment Manager and the Subadviser (which is an affiliate of the Investment Manager), the foregoing expense limitation and the considerations noted above with respect to the Investment Manager and the Subadviser, the Fund’s advisory and subadvisory fees are reasonable. With respect to AMG FQ Tax-Managed U.S. Equity Fund, the Trustees noted that the Fund’s management fees (which include both the advisory and administration fees) and total expenses (weighted average, all classes combined) (net of applicable expense waivers/reimbursements) as of March 31, 2019 were both higher than the average for the Fund’s Peer Group. The Trustees took into account the fact that the Investment Manager has | | | | contractually agreed, through March 1, 2020, to limit the Fund’s net annual operating expenses (subject to certain excluded expenses) to 0.89%. The Board also took into account management’s discussion of the Fund’s expenses and competitiveness with comparably sized funds. The Trustees concluded that, in light of the nature, extent and quality of the services provided by the Investment Manager and the Subadviser (which is an affiliate of the Investment Manager), the foregoing expense limitation and the considerations noted above with respect to the Investment Manager and the Subadviser, the Fund’s advisory and subadvisory fees are reasonable. With respect to AMG FQ Global Risk-Balanced Fund, the Trustees noted that the Fund’s management fees (which include both the advisory and administration fees) and total expenses (weighted average, all classes combined) (net of applicable expense waivers/reimbursements) as of March 31, 2019 were both lower than the average for the Fund’s Peer Group. The Trustees took into account the fact that the Investment Manager has contractually agreed, through March 1, 2020, to limit the Fund’s net annual operating expenses (subject to certain excluded expenses) to 0.89%. The Trustees concluded that, in light of the nature, extent and quality of the services provided by the Investment Manager and the Subadviser (which is an affiliate of the Investment Manager), the foregoing expense limitation and the considerations noted above with respect to the | | | | Investment Manager and the Subadviser, the Fund’s advisory and subadvisory fees are reasonable. * * * * After consideration of the foregoing, the Trustees also reached the following conclusions (in addition to the conclusions discussed above) regarding the Investment Management and Subadvisory Agreements: (a) the Investment Manager and the Subadviser have demonstrated that they possess the capability and resources to perform the duties required of them under each Investment Management Agreement and each Subadvisory Agreement and (b) the Investment Manager and Subadviser maintain appropriate compliance programs. Based on all of the above-mentioned factors and their related conclusions, with no single factor or conclusion being determinative and with each Trustee not necessarily attributing the same weight to each factor, the Trustees concluded that approval of each Investment Management Agreement and each Subadvisory Agreement would be in the best interests of the applicable Fund and its shareholders. Accordingly, on June 27, 2019, the Trustees, and separately a majority of the Independent Trustees, voted to approve the Investment Management and the Subadvisory Agreements for each Fund. |
60
| | |
| | |
| | | | |
INVESTMENT MANAGER AND ADMINISTRATOR AMG Funds LLC 600 Steamboat Road, Suite 300 Greenwich, CT 06830 800.548.4539 DISTRIBUTOR AMG Distributors, Inc. 600 Steamboat Road, Suite 300 Greenwich, CT 06830 800.548.4539 SUBADVISER First Quadrant, L.P. 800 E. Colorado Boulevard, Suite 900 Pasadena, CA 91101 | | CUSTODIAN The Bank of New York Mellon 111 Sanders Creek Parkway East Syracuse, NY 13057 LEGAL COUNSEL Ropes & Gray LLP Prudential Tower, 800 Boylston Street Boston, MA 02199-3600 TRANSFER AGENT BNY Mellon Investment Servicing (US) Inc. Attn: AMG Funds P.O. Box 9769 Providence, RI 02940 800.548.4539 | | This report is prepared for the Funds’ shareholders. It is authorized for distribution to prospective investors only when preceded or accompanied by an effective prospectus. To receive a free copy of the prospectus or Statement of Additional Information, which includes additional information about Fund Trustees, please contact us by calling 800.548.4539. Distributed by AMG Distributors, Inc., member FINRA/SIPC. Current net asset values per share for each Fund are available on the Funds’ website at amgfunds.com. A description of the policies and procedures each Fund uses to vote its proxies is available: (i) without charge, upon request, by calling 800.548.4539, or (ii) on the Securities and Exchange Commission’s (SEC) website at sec.gov. For information regarding each Fund’s proxy voting record for the 12-month period ended June 30, call 800.548.4539 or visit the SEC website at sec.gov. The Funds file their complete schedule of portfolio holdings with the SEC for the first and third quarters of each fiscal year as an exhibit to their reports on Form N-PORT, which has replaced Form N-Q. The Funds’ portfolio holdings on Form N-PORT are available on the SEC’s website at sec.gov. To review a complete list of the Funds’ portfolio holdings, or to view the most recent semiannual report or annual report, please visit amgfunds.com. |
| | | | |
| | |
| | |
| | | | | | | | | | | | |
| | | AFFILIATE SUBADVISED FUNDS BALANCED FUNDS AMG Chicago Equity Partners Balanced Chicago Equity Partners, LLC AMG FQ Global Risk-Balanced First Quadrant, L.P. EQUITY FUNDS AMG FQ Tax-Managed U.S. Equity AMG FQ Long-Short Equity First Quadrant, L.P. AMG Frontier Small Cap Growth Frontier Capital Management Co., LLC AMG GW&K Small Cap Core AMG GW&K Small/Mid Cap AMG GW&K Trilogy Emerging Markets Equity AMG GW&K Trilogy Emerging Wealth Equity GW&K Investment Management, LLC AMG Renaissance Large Cap Growth The Renaissance Group LLC AMG River Road Dividend All Cap Value AMG River Road Dividend All Cap Value II AMG River Road Focused Absolute Value AMG River Road Long-Short AMG River Road Small-Mid Cap Value AMG River Road Small Cap Value River Road Asset Management, LLC AMG SouthernSun Small Cap AMG SouthernSun U.S. Equity SouthernSun Asset Management, LLC | | | | AMG TimesSquare Emerging Markets Small Cap AMG TimesSquare Global Small Cap AMG TimesSquare International Small Cap AMG TimesSquare Mid Cap Growth AMG TimesSquare Small Cap Growth TimesSquare Capital Management, LLC AMG Yacktman AMG Yacktman Focused AMG Yacktman Focused Fund - Security Selection Only AMG Yacktman Special Opportunities Yacktman Asset Management LP FIXED INCOME FUNDS AMG GW&K Core Bond ESG AMG GW&K Enhanced Core Bond ESG AMG GW&K Municipal Bond AMG GW&K Municipal Enhanced Yield GW&K Investment Management, LLC OPEN-ARCHITECTURE FUNDS EQUITY FUNDS AMG Managers Brandywine AMG Managers Brandywine Advisors Mid Cap Growth AMG Managers Brandywine Blue Friess Associates, LLC AMG Managers Cadence Emerging Companies AMG Managers Cadence Mid Cap Cadence Capital Management LLC AMG Managers CenterSquare Real Estate CenterSquare Investment Management LLC | | | | AMG Managers Emerging Opportunities WEDGE Capital Management L.L.P. Next Century Growth Investors LLC RBC Global Asset Management (U.S.) Inc. AMG Managers Fairpointe ESG Equity AMG Managers Fairpointe Mid Cap Fairpointe Capital LLC AMG Managers LMCG Small Cap Growth LMCG Investments, LLC AMG Managers Montag & Caldwell Growth Montag & Caldwell, LLC AMG Managers Pictet International Pictet Asset Management Limited AMG Managers Silvercrest Small Cap Silvercrest Asset Management Group LLC AMG Managers Skyline Special Equities Skyline Asset Management, L.P. AMG Managers Special Equity Ranger Investment Management, L.P. Lord, Abbett & Co. LLC Smith Asset Management Group, L.P. Federated MDTA LLC FIXED INCOME FUNDS AMG Managers Doubleline Core Plus Bond DoubleLine Capital LP AMG Managers Global Income Opportunity AMG Managers Loomis Sayles Bond Loomis, Sayles & Company, L.P. | | |
| | | | |
| amgfunds.com | | | 103119 | | AR014 |
| | |
| | | ANNUALREPORT |
| | | | | | | | |
| | | | | AMG Funds |
| | | |
| | | | | October 31, 2019 |
| | | |
| | | | | AMG Frontier Small Cap Growth Fund |
| | | | | |
| | | | | Class N: MSSVX | | Class I: MSSCX | | Class Z:MSSYX |
| | | |
| | | | | AMG Managers Emerging Opportunities Fund |
| | | | | |
| | | | | Class N:MMCFX | | Class I:MIMFX | | |
| | | | | |
| | | | | | | | | |
Beginning on January 1, 2021, as permitted by regulations adopted by the Securities and Exchange Commission, paper copies of the Funds’ shareholder reports like this one will no longer be sent by mail, unless you specifically request paper copies of the reports from the Funds or from your financial intermediary, such as a broker-dealer or bank. Instead, the reports will be made available on the Funds’ website (https://www.amgfunds.com/resources/order_literature.html), and you will be notified by mail each time a report is posted and provided with a website link to access the report.
If you already elected to receive shareholder reports electronically, you will not be affected by this change and you need not take any action. You may elect to receive shareholder reports and other communications from the Funds electronically at any time by contacting your financial intermediary or, if you invest directly with the Funds, by logging into your account at www.amgfunds.com.
You may elect to receive all future reports in paper free of charge. If you invest through a financial intermediary, you can contact your financial intermediary to request that you continue to receive paper copies of your shareholder reports. If you invest directly with the Funds, you can call 1.800.548.4539 to inform the Funds that you wish to continue receiving paper copies of your shareholder reports. Your election to receive reports in paper will apply to all funds in the AMG Funds Family of Funds held in your account if you invest through your financial intermediary or all funds in the AMG Funds Family of Funds held with the fund complex if you invest directly with the Funds.
| | | | |
| amgfunds.com | | | | 103119 AR022 |
| | |
| | | AMG Funds Annual Report — October 31, 2019 |
| | | | |
| | | |
| | | | | |
| | | TABLE OF CONTENTS | | PAGE |
| | | |
| | | LETTER TO SHAREHOLDERS | | 2 |
| | | |
| | | ABOUT YOUR FUND’S EXPENSES | | 3 |
| | | |
| | | PORTFOLIO MANAGER’S COMMENTS, FUND SNAPSHOTS AND SCHEDULES OF PORTFOLIO INVESTMENTS | | |
| | | |
| | | AMG Frontier Small Cap Growth Fund | | 4 |
| | | |
| | | AMG Managers Emerging Opportunities Fund | | 10 |
| | | |
| | | FINANCIAL STATEMENTS | | |
| | | |
| | | Statement of Assets and Liabilities | | 20 |
| | | |
| | | Balance sheets, net asset value (NAV) per share computations and cumulative distributable earnings (loss) | | |
| | | |
| | | Statement of Operations | | 22 |
| | | |
| | | Detail of sources of income, expenses, and realized and unrealized gains (losses) during the fiscal year | | |
| | | |
| | | Statements of Changes in Net Assets | | 23 |
| | | |
| | | Detail of changes in assets for the past two fiscal years | | |
| | | |
| | | Financial Highlights | | 24 |
| | | |
| | | Historical net asset values per share, distributions, total returns, income and expense ratios, turnover ratios and net assets | | |
| | | |
| | | Notes to Financial Statements | | 29 |
| | | |
| | | Accounting and distribution policies, details of agreements and transactions with Fund management and affiliates, and descriptions of certain investment risks | | |
| | | |
| | | REPORT OF INDEPENDENT REGISTERED PUBLIC ACCOUNTING FIRM | | 35 |
| | | |
| | | OTHER INFORMATION | | 36 |
| | | |
| | | TRUSTEES AND OFFICERS | | 37 |
| | | |
| | | ANNUAL RENEWAL OF INVESTMENT MANAGEMENT AND SUBADVISORY AGREEMENTS | | 39 |
Nothing contained herein is to be considered an offer, sale or solicitation of an offer to buy shares of any series of the AMG Funds family of mutual funds. Such offering is made only by prospectus, which includes details as to offering price and other material information.
| | |
| | Letter to Shareholders |
Dear Shareholder:
The U.S. bull market celebrated its 10-year anniversary during the fiscal year ended October 31, 2019, as stocks proved resilient in the face of global economic weakness, rising geopolitical tensions, and the ongoing trade war. Global stock markets swooned late in 2018 as hawkish U.S. Federal Reserve (Fed) policy and an escalation of the U.S./China trade war triggered a painful selloff. However, a dovish pivot from global central banks rescued investors and fueled a strong rebound early in 2019. Investors clung to hopes of a positive outcome from U.S./China trade negotiations, even as doubts about the durability of the economic cycle lingered, and the S&P 500® Index returned 14.33% for the fiscal year. International equities were also resistant to pressures facing the global economy and generated an 11.27% return as measured by the MSCI All Country World ex USA Index.
In total, ten out of eleven sectors of the S&P 500® Index were strongly positive during the prior twelve months. Investors sought the relative safety of defensive sectors, with utilities and real estate leading the index with returns of 26.73% and 23.71%, respectively. However, the higher growth information technology sector also generated a robust 22.60% return. Energy was the lone negative sector with a return of (11.40)% during the fiscal year. Growth stocks outperformed Value stocks for the full fiscal year with returns of 17.10% and 11.21% for the Russell 1000® Growth and Russell 1000® Value Indexes, respectively. The cycle of U.S. outperformance over international equities continued, but international developed and emerging markets still produced solidly positive returns, with the MSCI EAFE and MSCI Emerging Markets Index returning 11.04% and 11.86%, respectively, in the twelve months ending October 31, 2019.
Interest rates fell dramatically over the fiscal year and led to strong returns for bond investors as the Fed shifted to a more dovish policy stance early in 2019 and eventually cut short-term rates later in the year. The 10-year Treasury yield fell from a high of 3.24% last November to a yield of 1.69% as of October 31, 2019. The plunge in long-term interest rates caused the yield curve to briefly invert with 2-year yields rising higher than the 10-year yields. The Bloomberg Barclays U.S. Aggregate Bond Index, a broad measure of U.S. bond market performance, ended the fiscal year with an 11.51% return. High yield bonds lagged the broader bond market and returned 8.38% as measured by the return of the Bloomberg Barclays U.S. Corporate High Yield Bond Index. Municipal bonds also performed strongly with a 9.42% return for the Bloomberg Barclays Municipal Bond Index.
AMG Funds appreciates the privilege of providing investment tools to you and your clients. Our foremost goal is to provide investment solutions that help our shareholders successfully reach their long-term investment goals. AMG Funds
provides access to a distinctive array of actively managed return-oriented investment strategies. We thank you for your continued confidence and investment in AMG Funds. You can rest assured that under all market conditions our team is focused on delivering excellent investment management services for your benefit.
Respectfully,
Keitha Kinne
President
AMG Funds
| | | | | | | | | | | | | | |
| | | Periods ended | |
| Average Annual Total Returns | | October 31, 2019* | |
| | | | |
| Stocks: | | | | 1 Year | | | 3 Years | | | 5 Years | |
| | | | |
Large Caps | | (S&P 500® Index) | | | 14.33 | % | | | 14.91% | | | | 10.78% | |
| | | | |
Small Caps | | (Russell 2000® Index) | | | 4.90 | % | | | 10.96% | | | | 7.37% | |
| | | | |
| | (MSCI All Country World | | | | | | | | | | | | |
International | | Index ex USA) | | | 11.27 | % | | | 8.07% | | | | 3.82% | |
| Bonds: | | | | | | | | | | | |
| | | | |
Investment Grade | | (Bloomberg Barclays U.S. Aggregate Bond Index) | | | 11.51 | % | | | 3.29% | | | | 3.24% | |
| | | | |
High Yield | | (Bloomberg Barclays U.S. Corporate High Yield Bond Index) | | | 8.38 | % | | | 6.03% | | | | 5.18% | |
| | | | |
Tax-exempt | | (Bloomberg Barclays Municipal Bond Index) | | | 9.42 | % | | | 3.62% | | | | 3.55% | |
| | | | |
Treasury Bills | | (ICE BofAML U.S. 6-Month Treasury Bill Index) | | | 2.71 | % | | | 1.74% | | | | 1.21% | |
*Source: FactSet. Past performance is no guarantee of future results.
2
|
About Your Fund’s Expenses |
| | | | | | | | |
As a shareholder of a Fund, you may incur two types of costs: (1) transaction costs, which may include sales charges (loads) on purchase payments; redemption fees; and exchange fees; and (2) ongoing costs, including management fees; distribution (12b-1) fees; and other Fund expenses. This example is intended to help you understand your ongoing costs (in dollars) of investing in the Fund and to compare these costs with the ongoing costs of investing in other mutual funds. The example is based on $1,000 invested at the beginning of the period and held for the entire period as indicated below. ACTUAL EXPENSES The first line of the following table provides information about the actual account values and | | | | actual expenses. You may use the information in this line, together with the amount you invested, to estimate the expenses that you paid over the period. Simply divide your account value by $1,000 (for example, an $8,600 account value divided by $1,000 = 8.6), then multiply the result by the number in the first line under the heading entitled “Expenses Paid During Period” to estimate the expenses you paid on your account during this period. HYPOTHETICAL EXAMPLE FOR COMPARISON PURPOSES The second line of the following table provides information about hypothetical account values and hypothetical expenses based on the Fund’s actual expense ratio and an assumed annual rate of return of 5% before expenses, which is not the Fund’s | | | | actual return. The hypothetical account values and expenses may not be used to estimate the actual ending account balance or expenses you paid for the period. You may use this information to compare the ongoing costs of investing in the Fund and other funds by comparing this 5% hypothetical example with the 5% hypothetical examples that appear in the shareholder reports of other funds. Please note that the expenses shown in the table are meant to highlight your ongoing costs only and do not reflect any transactional costs, such as sales charges (loads), redemption fees, or exchange fees. Therefore, the second line of the table is useful in comparing ongoing costs only, and will not help you determine the relative total costs of owning different funds. |
| | | | | | | | |
| | | | | | | | |
| | | | |
Six Months Ended October 31, 2019 | | Expense
Ratio for
the Period | | Beginning
Account
Value
05/01/19 | | Ending
Account
Value
10/31/19 | | Expenses
Paid
During
the Period* |
AMG Frontier Small Cap Growth Fund |
|
Based on Actual Fund Return |
| | | | |
Class N | | 1.30% | | $1,000 | | $1,005 | | $6.57 |
| | | | |
Class I | | 0.97% | | $1,000 | | $1,005 | | $4.90 |
| | | | |
Class Z | | 0.90% | | $1,000 | | $1,006 | | $4.55 |
|
Based on Hypothetical 5% Annual Return |
| | | | |
Class N | | 1.30% | | $1,000 | | $1,019 | | $6.61 |
| | | | |
Class I | | 0.97% | | $1,000 | | $1,020 | | $4.94 |
| | | | |
Class Z | | 0.90% | | $1,000 | | $1,021 | | $4.58 |
AMG Managers Emerging Opportunities Fund |
|
Based on Actual Fund Return |
| | | | |
Class N | | 1.19% | | $1,000 | | $1,008 | | $6.02 |
| | | | |
Class I | | 0.94% | | $1,000 | | $1,009 | | $4.76 |
|
Based on Hypothetical 5% Annual Return |
| | | | |
Class N | | 1.19% | | $1,000 | | $1,019 | | $6.06 |
| | | | |
Class I | | 0.94% | | $1,000 | | $1,020 | | $4.79 |
| | * | Expenses are equal to the Fund’s annualized expense ratio multiplied by the average account value over the period, multiplied by the number of days in the most recent fiscal half-year (184), then divided by 365. |
3
|
AMG Frontier Small Cap Growth Fund Portfolio Manager’s Comments(unaudited) |
| | | | | | | | |
THE YEAR IN REVIEW Albeit with significant trade and U.S. Federal Reserve the (“Fed”) related volatility, the past year has been positive for domestic equities. For the year ending October 31, 2019, small caps lagged large caps as the Russell 2000® Index rose 4.9%, trailing the 14.2% advance of the Russell 1000® Index. Growth continued to lead within the small cap segment as the Russell 2000® Growth Index gained 6.4%. The AMG Frontier Small Cap Growth Fund the (“Fund”) (Class I shares) returned 12.08% over this time, significantly exceeding the return for its primary benchmark, the Russell 2000® Growth Index the (“Index”). All of our outperformance was driven by positive stock selection as sector selection had a modest overall impact. Technology, our largest overweight sector, was also our leading contributor as our 33% return substantially outpaced the 14% gain of the Index. Our strongest technology investment was Ultra Clean Holdings Inc., a semiconductor capital equipment company, appreciating 103%. We initiated our position in Ultra Clean toward the end of 2018 with the thesis that their core business was nearing its cyclical trough and that business conditions should bottom and begin to improve. As 2019 progressed this thesis began to play out. End market demand is now expected to pick up significantly from multiple customer types, starting with logic & foundry customers and accelerating with the addition of memory customers throughout 2020. Ultra Clean’s position in the supply chain leads to exaggerated revenue declines when times are bad and exaggerated revenue increases when times are good, and thus its stock is now reflecting the upcoming period of strength. Additionally, Ultra Clean’s profit margins held despite the weak market conditions due to cost saving initiatives, and are set up to potentially improve over the coming 12–18 months. The second top technology contributor was Teradyne Inc., a manufacturer of robotics and semiconductor capital equipment. The stock rose 60% after reporting solid earnings results and raising estimates. The semiconductor testing business is performing better than expected, and while the industrial automation division was slightly weaker than expected, management reiterated its long-term growth targets of 30–40% due to the strong demand in the pipeline. Another top ten contributor was Model N Inc., up 94%. Model N provides revenue management software to pharma and high-tech companies. Initiatives from a new management team are accelerating growth and the company is beginning to see a material increase in subscription billings. At the same time, investors are recognizing that there is a big opportunity to penetrate their current base of customers with | | | | incremental products. The company also continues to migrate customers from on-premise solutions to the cloud, a tailwind for growth. Health care, an equal weighted sector but comprising one-quarter of the Fund, was our second strongest contributor rising 27% versus the 1% loss for the index. Top overall contributor Tesaro Inc. returned 156% for the fiscal year. The stock rose in late 2018 after GlaxoSmithKline agreed to acquire the company at a substantial premium. Our initial purchase in the first quarter 2018 was based on the company’s best-in-class PARP (Poly (ADP-ribose) polymerase) inhibitor drug for fighting cancer. We determined that a company with such a quality asset would be a likely acquisition target, and that ultimately proved to be the case. We established a position at over $70 per share only to see the price retreat to a low of $23 in November. We believed our thesis remained valid and significantly increased our position size near the lows following market confusion regarding pipeline data that we viewed as favorable. Ultimately, the stock proved to be the largest contributor to the portfolio return for the fiscal year. Novocure Ltd., a medical device developer with an approved product to treat glioblastoma, rose 116%. Excitement continues to build around the company’s pipeline, including the potential for approval in a second indication, mesothelioma. This approval would help to solidify confidence in the company’s innovative cancer treatment involving tumor treatment fields, which is currently approved for a deadly form of brain cancer. Lastly, Insulet Corporation, a developer of insulin infusion systems, has experienced a dramatic turnaround since new management took over in late 2014. The stock rose 65% this fiscal year as the company continued to post strong financial results and signed a new contract with the largest health insurance company in the U.S., United Healthcare. This agreement will likely be instrumental in allowing Insulet to potentially achieve significant market share in the untapped Medicare market. Financial services, an overweight sector, was our third largest relative contributing sector where our 14% return outpaced the 10% gain of the benchmark. Our strongest contributor in the sector was LPL Financial Holding Inc., up 33%, an independent broker dealer that provides financial planning and brokerage services to consumers. The company continues to benefit from the secular trend of advisors moving away from wirehouses toward independent models. Investment over the last few years in technology and compliance has led to an acceleration of organic growth and asset gathering in 2019. New offerings for advisors are helping with recruiting and also improving the economics of assets under administration while driving increased returns on capital. Additionally, sensitivity of earnings to interest rates has been greatly reduced | | | | with management fixing a portion of its cash deposits, thus allowing investors to focus more on organic growth. The financial sector also benefited from our exposure to REITs, as SITE Centers Corp., Brixmore Property Group, and Spirit Realty Capital appreciated 29%, 25%, and 30%, respectively. As concerns over economic growth and the trade war with China materialized over the last 12 months, REITs have been strong performers as investors have increasingly searched for stable and defensive companies. Furthermore, the drop in the 10-year treasury rate made REITs more attractive given their elevated yields. While equal weight consumer discretionary, the sector was our largest detractor as our 4% loss trailed the 7% gain of the index. Online post-secondary curriculum provider 2U Inc. was our largest decliner during the fiscal year, falling 80%. Starting the year with a high multiple of sales and perceived as a software as a service business model, the company guided organic growth below expectations and we reduced the position. However, our belief that this was an isolated incident proved to be incorrect as the problems were wider and more pronounced than we thought and the company reduced guidance again. We sold our remaining position. Home furnishing retailer At Home Group, Inc. tumbled 61% after slashing earnings guidance due to margin pressures and negative comparable store sales. Extremely wet weather had an outsized impact on the sale of spring and summer related products and also slowed store traffic which hurt overall sales and left the company with bloated inventory levels. While we reduced the position, we believe that company remains one of the few retailors with significant future store expansion possibilities. At this time, we do not believe a recession is imminent and maintain positions in cyclical stocks with idiosyncratic earning drivers. However, we do believe that the industrial sector remains depressed due to concerns over the trade war and weak global growth. If the trade war escalates further a recession is certainly possible, but on the other hand if a resolution is reached we would expect a rebound for cyclical companies as industrial supply chains would move back to a normal operating mode, including restoring depleted inventory levels throughout the channel. We are confident that our stock selection and balanced portfolio approach will continue to generate excess returns over the intermediate and long term. The views expressed represent the opinions of Frontier Capital Management Co. LLC as of October 31, 2019, and are not intended as a forecast or guarantee of future results, and are subject to change without notice. |
4
|
AMG Frontier Small Cap Growth Fund Portfolio Manager’s Comments(continued) |
CUMULATIVE TOTAL RETURN PERFORMANCE
AMG Frontier Small Cap Growth Fund’s cumulative total return is based on the daily change in net asset value (NAV), and assumes that all dividends and distributions were reinvested. This graph compares a hypothetical $10,000 investment made in the AMG Frontier Small Cap Growth Fund’s Class I shares on October 31, 2009, to a $10,000 investment made in the Russell 2000® Growth Index for the same time period. The graph and table do not reflect the deduction of taxes that a shareholder would pay on a Fund distribution or redemption of shares. The listed returns for the Fund are net of expenses and the returns for the index exclude expenses. Total returns would have been lower had certain expenses not been reduced.
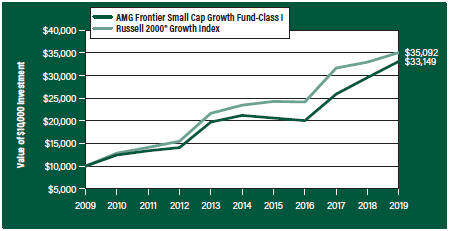
The table below shows the average annual total returns for the AMG Frontier Small Cap Growth Fund and the Russell 2000® Growth Index for the same time periods ended October 31, 2019.
| | | | | | | | | | | | | | | | | | | | |
| | | One | | | Five | | | Ten | | | Since | | | Inception | |
| Average Annual Total Returns1 | | Year | | | Years | | | Years | | | Inception | | | Date | |
AMG Frontier Small Cap Growth Fund2, 3, 4, 5, 6 | | | | | |
| | | | | |
Class N | | | 11.83 | % | | | 9.05 | % | | | — | | | | 11.69% | | | | 01/01/10 | |
| | | | | |
Class I | | | 12.08 | % | | | 9.34 | % | | | 12.73 | % | | | 8.08% | | | | 09/24/97 | |
| | | | | |
Class Z | | | 12.15 | % | | | 9.52 | % | | | — | | | | 12.19% | | | | 01/01/10 | |
| | | | | |
Russell 2000® Growth Index7 | | | 6.40 | % | | | 8.38 | % | | | 13.38 | % | | | 6.06% | | | | 09/24/97† | |
The performance data shown represents past performance. Past performance is not a guarantee of future results. Current performance may be lower or higher than the performance dataquoted. The investment return and principal value of an investment will fluctuate so that an investor’s shares, when redeemed, may be worth more or less than their original cost.
Investors should carefully consider the Fund’s investment objectives, risks, charges and expenses before investing. For performance information through the most recent month end, current net asset values per share for the Fund and other information, please call 800.548.4539 or visit our website at amgfunds.com for a free prospectus. Read it carefully before investing or sending money.
Distributed by AMG Distributors, Inc., member FINRA/SIPC.
| † | Date reflects inception date of the Fund, not the index. |
| 1 | Total return equals income yield plus share price change and assumes reinvestment of all dividends and capital gain distributions. Returns are net of fees and may reflect offsets of Fund expenses as described in the prospectus. No adjustment has been made for taxes payable by shareholders on their reinvested dividends and capital gain distributions. Returns for periods greater than one year are annualized. The listed returns on the Fund are net of expenses and based on the published NAV as of October 31, 2019. All returns are in U.S. dollars ($). |
| | |
| | | 2 From time to time, the Fund’s advisor has waived its fees and/or absorbed Fund expenses, which has resulted in higher returns. |
| | |
| | | 3 The Fund is subject to risks associated with investments in small-capitalization companies, such as erratic earnings patterns, competitive conditions, limited earnings history and a reliance on one or a limited number of products. |
| | |
| | | 4 The Fund invests in growth stocks, which may be more sensitive to market movements because their prices tend to reflect future investor expectations rather than just current profits. Growth stocks may underperform value stocks during given periods. |
| | |
| | | 5 Active and frequent trading of a fund may result in higher transaction costs and increased tax liability. |
| | |
| | | 6 Companies that are in similar businesses may be similarly affected by particular economic or market events; to the extent the Fund has substantial holdings within a particular sector, the risks associated with that sector increase. |
| | |
| | | 7 The Russell 2000® Growth Index measures the performance of the Russell 2000® companies with higher price-to-book ratios and higher forecasted growth values. Unlike the Fund, the Russell 2000® Growth Index is unmanaged, is not available for investment and does not incur expenses. |
| | |
| | | The Russell 2000® Growth Index is a trademark of the London Stock Exchange Group companies. |
| | |
| | | Not FDIC insured, nor bank guaranteed. May lose value. |
5
|
AMG Frontier Small Cap Growth Fund Fund Snapshots(unaudited) October 31, 2019 |
PORTFOLIO BREAKDOWN
| | |
| Sector | | % of
Net Assets |
| | |
Information Technology | | 31.5 |
| | |
Health Care | | 19.0 |
| | |
Consumer Discretionary | | 13.7 |
| | |
Industrials | | 13.3 |
| | |
Materials | | 6.2 |
| | |
Financials | | 6.0 |
| | |
Real Estate | | 5.8 |
| | |
Energy | | 2.4 |
| | |
Communication Services | | 0.4 |
| | |
Short-Term Investments | | 5.4 |
| | |
Other Assets Less Liabilities | | (3.7) |
TOP TEN HOLDINGS
| | |
| Security Name | | % of
Net Assets |
| | |
Ultra Clean Holdings, Inc. | | 3.8 |
| | |
Allegheny Technologies, Inc. | | 3.0 |
| | |
Dana, Inc. | | 3.0 |
| | |
Eldorado Resorts, Inc. | | 2.5 |
| | |
Natera, Inc. | | 2.5 |
| | |
Texas Capital Bancshares, Inc. | | 2.5 |
| | |
KBR, Inc. | | 2.1 |
| | |
JetBlue Airways Corp. | | 2.1 |
| | |
Quanta Services, Inc. | | 2.1 |
| | |
Benefitfocus, Inc. | | 2.1 |
| | |
| | |
Top Ten as a Group | | 25.7 |
| | |
Because a fund’s strategy may result in multiple investments in particular sectors of the economy, its performance may depend on the performance of those sectors and may fluctuate more widely than investments diversified across more sectors. For additional information on these and other risk considerations, please see the Fund’s prospectus.
Any sectors, industries, or securities discussed should not be perceived as investment recommendations. Mention of a specific security should not be considered a recommendation to buy or solicitation to sell that security. Specific securities mentioned in this report may have been sold from the Fund’s portfolio of investments by the time you receive this report.
6
|
AMG Frontier Small Cap Growth Fund Schedule of Portfolio Investments October 31, 2019 |
| | | | | | | | |
| | | Shares | | | Value | |
| | |
Common Stocks - 98.3% | | | | | | | | |
| |
Communication Services - 0.4% | | | | | |
| | |
Cardlytics, Inc.*,1 | | | 1,574 | | | | $65,966 | |
| |
Consumer Discretionary - 13.7% | | | | | |
| | |
At Home Group, Inc.*,1 | | | 13,947 | | | | 118,828 | |
| | |
Boot Barn Holdings, Inc.*,1 | | | 5,651 | | | | 198,067 | |
| | |
Capri Holdings, Ltd. (United
Kingdom)* | | | 8,538 | | | | 265,276 | |
| | |
Carvana Co.*,1 | | | 133 | | | | 10,784 | |
| | |
Century Communities, Inc.*,1 | | | 11,405 | | | | 344,089 | |
| | |
Cooper-Standard Holdings, Inc.* | | | 1,524 | | | | 48,555 | |
| | |
Dana, Inc. | | | 34,044 | | | | 552,534 | |
| | |
Eldorado Resorts, Inc.*,1 | | | 10,250 | | | | 458,892 | |
| | |
Etsy, Inc.* | | | 173 | | | | 7,697 | |
| | |
Floor & Decor Holdings, Inc.,
Class A*,1 | | | 5,895 | | | | 270,168 | |
| | |
LGI Homes, Inc.* | | | 708 | | | | 55,564 | |
| | |
Stoneridge, Inc.* | | | 6,049 | | | | 186,793 | |
| | |
Total Consumer Discretionary | | | | | | | 2,517,247 | |
| | |
Energy - 2.4% | | | | | | | | |
| | |
GasLog, Ltd. (Monaco) | | | 6,770 | | | | 92,817 | |
| | |
International Seaways, Inc.* | | | 9,518 | | | | 239,283 | |
| | |
PDC Energy, Inc.* | | | 3,374 | | | | 67,311 | |
| | |
Valaris PLC (United Kingdom)1 | | | 11,739 | | | | 48,247 | |
| | |
Total Energy | | | | | | | 447,658 | |
| | |
Financials - 6.0% | | | | | | | | |
| | |
Argo Group International Holdings, Ltd. (Bermuda) | | | 2,610 | | | | 161,481 | |
| | |
James River Group Holdings, Ltd. (Bermuda) | | | 4,736 | | | | 169,596 | |
| | |
LPL Financial Holdings, Inc. | | | 2,059 | | | | 166,449 | |
| | |
Texas Capital Bancshares, Inc.* | | | 8,414 | | | | 454,861 | |
| | |
Webster Financial Corp. | | | 3,318 | | | | 146,324 | |
| | |
Total Financials | | | | | | | 1,098,711 | |
| | |
Health Care - 19.0% | | | | | | | | |
| | |
ABIOMED, Inc.* | | | 675 | | | | 140,117 | |
| | |
Aerie Pharmaceuticals, Inc.*,1 | | | 9,316 | | | | 206,722 | |
| | |
Alnylam Pharmaceuticals, Inc.*,1 | | | 503 | | | | 43,630 | |
| | |
Amarin Corp. PLC, ADR (Ireland)*,1 | | | 8,478 | | | | 139,209 | |
| | |
Biohaven Pharmaceutical Holding Co., Ltd.* | | | 1,369 | | | | 62,864 | |
| | |
BioMarin Pharmaceutical, Inc.* | | | 829 | | | | 60,691 | |
| | |
Bluebird Bio, Inc.*,1 | | | 111 | | | | 8,991 | |
| | |
DexCom, Inc.* | | | 896 | | | | 138,199 | |
| | |
Exact Sciences Corp.*,1 | | | 2,556 | | | | 222,372 | |
| | |
Global Blood Therapeutics, Inc.*,1 | | | 2,225 | | | | 106,689 | |
| | |
Guardant Health, Inc.*,1 | | | 104 | | | | 7,228 | |
| | | | | | | | |
| | | Shares | | | Value | |
| | |
Immunomedics, Inc.*,1 | | | 15,542 | | | | $248,672 | |
| | |
Inspire Medical Systems, Inc.* | | | 194 | | | | 11,830 | |
| | |
Insulet Corp.*,1 | | | 62 | | | | 9,010 | |
| | |
Karyopharm Therapeutics, Inc.*,1 | | | 26,306 | | | | 307,780 | |
| | |
Madrigal Pharmaceuticals, Inc.*,1 | | | 424 | | | | 39,190 | |
| | |
Masimo Corp.* | | | 63 | | | | 9,185 | |
| | |
Merit Medical Systems, Inc.* | | | 6,286 | | | | 129,837 | |
| | |
Myriad Genetics, Inc.* | | | 5,892 | | | | 198,384 | |
| | |
NanoString Technologies, Inc.* | | | 8,825 | | | | 199,445 | |
| | |
Natera, Inc.* | | | 11,864 | | | | 457,001 | |
| | |
Nektar Therapeutics*,1 | | | 4,967 | | | | 85,060 | |
| | |
Novocure, Ltd. (Jersey)* | | | 1,645 | | | | 117,848 | |
| | |
Pacira BioSciences, Inc.* | | | 9,250 | | | | 374,532 | |
| | |
PTC Therapeutics, Inc.*,1 | | | 235 | | | | 9,609 | |
| | |
Sage Therapeutics, Inc.*,1 | | | 57 | | | | 7,732 | |
| | |
Seattle Genetics, Inc.* | | | 720 | | | | 77,328 | |
| | |
TherapeuticsMD, Inc.* | | | 30,957 | | | | 82,346 | |
| | |
Total Health Care | | | | | | | 3,501,501 | |
| | |
Industrials - 13.3% | | | | | | | | |
| | |
AECOM* | | | 5,004 | | | | 200,210 | |
| | |
American Woodmark Corp.* | | | 1,896 | | | | 188,007 | |
| | |
Azul, S.A., ADR (Brazil)* | | | 6,146 | | | | 239,571 | |
| | |
GMS, Inc.* | | | 3,346 | | | | 100,246 | |
| | |
The Greenbrier Cos., Inc. | | | 1,052 | | | | 30,813 | |
| | |
JetBlue Airways Corp.* | | | 19,857 | | | | 383,240 | |
| | |
Knight-Swift Transportation Holdings, Inc.1 | | | 8,762 | | | | 319,463 | |
| | |
MasTec, Inc.*,1 | | | 1,033 | | | | 65,017 | |
| | |
Meritor, Inc.* | | | 4,681 | | | | 103,122 | |
| | |
Mesa Air Group, Inc.* | | | 7,529 | | | | 57,371 | |
| | |
Quanta Services, Inc. | | | 9,106 | | | | 382,907 | |
| | |
Tutor Perini Corp.*,1 | | | 12,895 | | | | 199,486 | |
| | |
Watsco, Inc. | | | 1,049 | | | | 184,939 | |
| | |
Total Industrials | | | | | | | 2,454,392 | |
| |
Information Technology - 31.5% | | | | | |
| | |
Alteryx, Inc., Class A*,1 | | | 410 | | | | 37,515 | |
| | |
Anaplan, Inc.*,1 | | | 99 | | | | 4,673 | |
| | |
Appian Corp.*,1 | | | 1,051 | | | | 46,917 | |
| | |
Benefitfocus, Inc.* | | | 16,772 | | | | 381,311 | |
| | |
Coherent, Inc.*,1 | | | 1,647 | | | | 245,271 | |
| | |
Coupa Software, Inc.*,1 | | | 335 | | | | 46,059 | |
| | |
Cypress Semiconductor Corp. | | | 2,672 | | | | 62,177 | |
| | |
DocuSign, Inc.* | | | 55 | | | | 3,641 | |
| | |
Euronet Worldwide, Inc.* | | | 258 | | | | 36,138 | |
The accompanying notes are an integral part of these financial statements.
7
|
AMG Frontier Small Cap Growth Fund Schedule of Portfolio Investments(continued) |
| | | | | | | | |
| | | Shares | | | Value | |
| |
Information Technology - 31.5% | | | | | |
(continued) | | | | | | | | |
| | |
Five9, Inc.*,1 | | | 3,357 | | | | $186,347 | |
| | |
Guidewire Software, Inc.*,1 | | | 1,422 | | | | 160,316 | |
| | |
HubSpot, Inc.* | | | 59 | | | | 9,151 | |
| | |
KBR, Inc. | | | 13,639 | | | | 384,074 | |
| | |
MACOM Technology Solutions Holdings, Inc.* | | | 4,382 | | | | 99,647 | |
| | |
Medallia, Inc.*,1 | | | 7,884 | | | | 229,267 | |
| | |
Mellanox Technologies, Ltd. (Israel)* | | | 2,229 | | | | 251,208 | |
| | |
Mitek Systems, Inc.* | | | 2,271 | | | | 21,892 | |
| | |
MKS Instruments, Inc. | | | 2,912 | | | | 315,137 | |
| | |
Model N, Inc.* | | | 6,802 | | | | 202,632 | |
| | |
MongoDB, Inc.* | | | 62 | | | | 7,922 | |
| | |
Monolithic Power Systems, Inc. | | | 319 | | | | 47,825 | |
| | |
Nutanix, Inc., Class A* | | | 7,900 | | | | 230,838 | |
| | |
Okta, Inc.*,1 | | | 265 | | | | 28,904 | |
| | |
Paylocity Holding Corp.* | | | 380 | | | | 38,988 | |
| | |
Perficient, Inc.* | | | 7,792 | | | | 305,446 | |
| | |
RealPage, Inc.*,1 | | | 3,306 | | | | 200,178 | |
| | |
Science Applications International Corp. | | | 3,639 | | | | 300,654 | |
| | |
SolarEdge Technologies, Inc.
(Israel)*,1 | | | 439 | | | | 37,297 | |
| | |
SYNNEX Corp. | | | 2,957 | | | | 348,157 | |
| | |
Teradyne, Inc. | | | 3,320 | | | | 203,250 | |
| | |
The Trade Desk, Inc., Class A*,1 | | | 37 | | | | 7,430 | |
| | |
Ultra Clean Holdings, Inc.*,1 | | | 33,260 | | | | 710,766 | |
| | |
Virtusa Corp.* | | | 4,076 | | | | 151,953 | |
| | |
WEX, Inc.* | | | 777 | | | | 146,993 | |
| | |
Wix.com, Ltd. (Israel)* | | | 81 | | | | 9,888 | |
| | |
Zendesk, Inc.* | | | 128 | | | | 9,043 | |
| | |
Zscaler, Inc.* | | | 357 | | | | 15,701 | |
| | |
Zuora, Inc., Class A*,1 | | | 18,694 | | | | 266,390 | |
| | |
Total Information Technology | | | | | | | 5,790,996 | |
| | |
Materials - 6.2% | | | | | | | | |
| | |
Allegheny Technologies, Inc.*,1 | | | 26,642 | | | | 559,748 | |
| | |
Carpenter Technology Corp. | | | 6,181 | | | | 302,993 | |
| | | | | | | | |
| | | Shares | | | Value | |
| | |
Huntsman Corp. | | | 9,961 | | | | $220,437 | |
| | |
Livent Corp.* | | | 8,337 | | | | 57,192 | |
| | |
Total Materials | | | | | | | 1,140,370 | |
| | |
Real Estate - 5.8% | | | | | | | | |
| | |
Brixmor Property Group, Inc., REIT | | | 12,252 | | | | 269,789 | |
| | |
Corporate Office Properties Trust, REIT | | | 9,001 | | | | 266,790 | |
| | |
SITE Centers Corp., REIT | | | 16,134 | | | | 250,561 | |
| | |
Spirit Realty Capital, Inc., REIT | | | 3,854 | | | | 192,083 | |
| | |
STAG Industrial, Inc., REIT1 | | | 2,560 | | | | 79,463 | |
| | |
Total Real Estate | | | | | | | 1,058,686 | |
| | |
Total Common Stocks
(Cost $16,284,826) | | | | | | | 18,075,527 | |
| | |
| | | Principal
Amount | | | | |
| |
Short-Term Investments - 5.4% | | | | | |
| |
Joint Repurchase Agreements - 4.2%2 | | | | | |
| | |
Citigroup Global Markets, Inc., dated 10/31/19, due 11/01/19, 1.720% total to be received $785,417 (collateralized by various U.S. Treasuries, 0.125% - 4.250%, 03/31/20 - 02/15/49, totaling $801,087) | | | $785,379 | | | | 785,379 | |
| | |
| | | Shares | | | | |
| |
Other Investment Companies - 1.2% | | | | | |
| | |
Dreyfus Government Cash Management Fund, Institutional Shares, 1.73%3 | | | 72,669 | | | | 72,669 | |
| | |
Dreyfus Institutional Preferred Government Money Market Fund, Institutional Shares, 1.77%3 | | | 72,669 | | | | 72,669 | |
| | |
JPMorgan U.S. Government Money Market Fund, IM Shares, 1.75%3 | | | 74,871 | | | | 74,871 | |
| |
Total Other Investment Companies | | | | 220,209 | |
| | |
Total Short-Term Investments
(Cost $1,005,588) | | | | | | | 1,005,588 | |
| | |
Total Investments - 103.7%
(Cost $17,290,414) | | | | | | | 19,081,115 | |
| |
Other Assets, less Liabilities - (3.7)% | | | | (688,373 | ) |
| | |
Net Assets - 100.0% | | | | | | | $18,392,742 | |
| * | Non-income producing security. |
| 1 | Some of these securities, amounting to $4,400,170 or 23.9% of net assets, were out on loan to various borrowers and are collateralized by cash and various U.S. Treasury Obligations. See Note 4 of Notes to Financial Statements. |
| 2 | Cash collateral received for securities lending activity was invested in these joint repurchase agreements. |
| 3 | Yield shown represents the October 31, 2019, seven day average yield, which refers to the sum of the previous seven days’ dividends paid, expressed as an annual percentage. |
ADR American Depositary Receipt
REIT Real Estate Investment Trust
The accompanying notes are an integral part of these financial statements.
8
|
AMG Frontier Small Cap Growth Fund Schedule of Portfolio Investments(continued) |
The following table summarizes the inputs used to value the Fund’s investments by the fair value hierarchy levels as of October 31, 2019:
| | | | | | | | | | | | | | | | |
| | | Level 1 | | | Level 2 | | | Level 3 | | | Total | |
Investments in Securities | | | | | | | | | | | | | | | | |
| | | | |
Common Stocks† | | $ | 18,075,527 | | | | — | | | | — | | | $ | 18,075,527 | |
| | | | |
Short-Term Investments | | | | | | | | | | | | | | | | |
| | | | |
Joint Repurchase Agreements | | | — | | | $ | 785,379 | | | | — | | | | 785,379 | |
| | | | |
Other Investment Companies | | | 220,209 | | | | — | | | | — | | | | 220,209 | |
| | | | | | | | | | | | | | | | |
Total Investments in Securities | | $ | 18,295,736 | | | $ | 785,379 | | | | — | | | $ | 19,081,115 | |
| | | | | | | | | | | | | | | | |
| † | All common stocks held in the Fund are Level 1 securities. For a detailed breakout of common stocks by major industry classification, please refer to the Fund’s Schedule of Portfolio Investments. |
For the fiscal year ended October 31, 2019, there were no transfers in or out of Level 3.
The accompanying notes are an integral part of these financial statements.
9
|
AMG Managers Emerging Opportunities Fund Portfolio Manager’s Comments(unaudited) |
| | | | | | | | |
OVERVIEW For the fiscal year ended October 31, 2019, the AMG Managers Emerging Opportunities Fund (the “Fund”) Class N shares returned 7.46%, outpacing both the -3.27% return for the Russell Microcap® Index (the “Microcap Index”) and the 4.90% return for the Russell 2000® Index (“2000” Index”). During the fiscal year, Lord Abbett & Co. LLC was eliminated as a subadvisor to the Fund, with proceeds being allocated among the Fund’s remaining three subadvisors. Next Century Growth Investors, LLC MARKET AND PERFORMANCE REVIEW The year ended October 31, 2019, started with a downdraft in November and December 2018 and then spent the ensuing ten months trying to dig out of that hole. In the end, the Russell Microcap® Growth Index (the “Microcap Growth Index”) finished down 6.82% for the full 12-month period. Over that period, the Next Century Growth sleeve of the Fund performed better than that, returning a positive 11.96%. Performance during the past year was driven mainly by stocks in the financial services, healthcare, and technology sectors. Our sleeve also benefited from being completely out of the energy sector, which plummeted 50% during the period. During the year, we continued to increase the sleeve’s position in the financial sector and finished with a double weighting relative to the benchmark. Financials provided the biggest source of alpha during the past year. We continue to favor segments of the financial services sector that are not interest rate sensitive (for example there are no banks in our sleeve) and, even if the economy were to slow further, should have little exposure to deterioration in credit performance. In health care, the sleeve’s performance was driven by several successful investments across diagnostics, services. and medical devices. In general, returns in the healthcare sector were tougher this year than last. Business fundamentals in the group were less consistent than the prior year and valuations which expanded during most of 2018 have, on balance, contracted during 2019. For example, health care was the worst performing sector in the third quarter, and we think politics was the main issue. As Elizabeth Warren (touting “Medicare for All”) has risen in the polls, fears of | | | | significant economic upheaval in the healthcare industry have also risen. The decline in healthcare multiples has especially impacted high growth, high valuation stocks and anything involved with medical insurance. As valuations improve, we have been doing a little buying, mindful that election jitters may persist for another year. Our sleeve ended the year about neutral weighted, but with far less biotech and more medical device and diagnostic concentration. Despite the outperformance this past year, overall valuations in this part of the portfolio are more favorable than a year ago. Strong relative performance in the technology sector was driven by our software holdings. As multiples in the software sector expanded and businesses delivered strong fundamental results, we were in a position, for the second straight year, to be booking sizable profits for the sleeve. During the year, we sold completely out of three large software holdings due to market cap and had another holding acquired at a nice premium. While we like the fundamentals in the software area, we view the valuations as stretched and are waiting for a pullback to reinstate our overweight position. Partially offsetting the sizable contributions from financials, health care, and technology was poor performance in the consumer sector. We attempted to adopt a more defensive posture with the sleeve’s consumer holdings and were significantly underweight consumer discretionary and overweight consumer staples. Unfortunately, our stock selection was off target and we underperformed in both areas. In general, we are having some difficulty in the current environment finding microcap companies that are capable of delivering consistent growth. Our sleeve is currently substantially underweight consumer discretionary and still overweight consumer staples, an area we hope will hold up better if the economy slows. OUTLOOK Despite the overall stock market hitting all-time highs, over the past four (4) months the Microcap Growth Index is down almost 8%. The Russell Microcap® Value Index (the “Microcap Value Index”) has performed much better over that period and for the past 12 months. When the future becomes cloudier, high valuation stocks tend to perform relatively poorly, and in our sleeve, multiples in the fastest growing companies have begun to decline. Concerned about such a valuation contraction, we have been reducing exposure to high valuation stocks for several months. | | | | Looking forward, we feel the U.S. economy, while slowing from last year, remains in growth mode. That should be a good enough environment for the very capable, fast-growing companies in the sleeve. We remain bullish on active investment management right now. Institutions are increasingly turning their equity assets over to index funds, ETFs and computer driven “quant funds” which have little understanding of the businesses underlying the stocks they buy and sell. Many large investment pools have moved 100% of their U.S. equity assets to passive strategies. We think this will lead to a very good period for active management because our information and analysis will be even more valuable in a world with fewer assets in the hands of professional investors. We are glad that was the case over the past 12 months and look forward to continuing to invest in great companies that we believe can return much better results than the average index holding. RBC Global Asset Management (U.S.) Inc. MARKET OVERVIEW U.S. equity markets fell sharply in the final quarter of 2018, with a crescendo of near panic selling at year end. Both the Dow Jones Industrial Average and the S&P 500® Index recorded their worst December the returns since 1931, in the midst of the Great Depression. The selloff began with fears that U.S. Federal Reserve the (“Fed”) monetary policy tightening might be too severe, significantly slowing U.S. economic growth and increasing the risk of recession. These concerns were abetted by rising trade tensions and tariff uncertainty, ongoing domestic political dysfunction, and slowing global growth data. Following a steep selloff in December, equity markets rebounded sharply in the first quarter of 2019. The groundwork for the rally was the public communication in January of a more accommodative monetary policy by the Fed. Equity markets continued their positive performance through June, although at a far slower pace than the first quarter’s sharp rebound. Gains were fueled by better-than-expected corporate earnings and a report of robust first quarter GDP growth of 3.1%. Weakening global economic data and rising trade tensions caused the market to give up in April’s gains and more. Growing anticipation of a third quarter Fed rate cut, combined with continued |
10
|
AMG Managers Emerging Opportunities Fund Portfolio Manager’s Comments (continued) |
| | | | | | | | |
strength in domestic labor markets and consumer spending, brought about a June rebound that put markets in positive territory. Equity markets offered mixed results in the third quarter following a first half of 2019 that was one of the strongest in two decades in terms of investment performance. Rising trade tensions, geopolitical uncertainties, and slowing economic growth data dampened the positive impact of more accommodative Fed policy in the period. Micro cap stocks, as represented by the Microcap Index, had weak returns for the year with 6 out of the 11 economic sectors posting negative returns. The energy (-35.5%), communication services (-24.5%), and materials (-16.2%) sectors were the worst performing sectors in the Microcap Index. The best performing sectors included real estate (24.8%) and utilities (24.7%). The sleeve is underweight to the energy and real estate sectors and overweight to the communication services, materials, and utilities sectors. PERFORMANCE REVIEW Our sleeve of the Fund outperformed the Microcap Index, the Fund’s benchmark, during the one-year time period, producing a 7.2% return compared to the -3.27% return for the Microcap Index. Favorable stock selection and sector allocation decisions contributed to returns for the period. Offsetting this somewhat was negative stock selection results within the energy and consumer discretionary sectors. The top three contributing stocks during the period were Novanta, Inc., Compass Diversified Holdings, and Community Healthcare Trust, Inc. while the top detractors were Grand Canyon Education, Inc., Callon Petroleum Company, and Greenbrier Companies, Inc. OUTLOOK The ongoing trade conflict between the U.S. and China has exacerbated normal concerns of investors about the sustainability of the current domestic economic expansion, given its record length in time (if not cumulative GDP growth). Uncertainty has inhibited business capital investment decisions, which have, in turn, slowed industrial activity and overall economic growth. The Fed shifted from dovish rhetoric to action in the third quarter, lowering interest rates twice and expanding its balance sheet. Expectations are that the Fed will remain accommodative in the coming quarters, taking action as needed to offset tighter financial conditions, a global growth slowdown, and | | | | uncertain trade tension. This policy shift has provided support both to the real economy and to stock market valuations. In the midst of a multiyear period in which growth stocks have provided superior investment performance, value stocks outperformed their growth counterparts in all capitalization segments in the third quarter. Combined with a market preference for profitable companies over loss-making companies (a relatively rare occurrence over the past several years), this shift toward value certainly benefited. The market preference for early stage, high potential growth companies with little or no profits and stratospheric valuations appears to have significantly diminished with the poor performance of several recent initial public stock offerings (or potential offerings) of businesses with this profile. For example, the dramatic decline in the private equity valuation of WeWork, the subsequent withdrawal of its plans to go public, and the large paper losses incurred by later-stage private equity investors have all market participants reassessing the importance of businesses and business models that are actually able to make a profit. Since our investment philosophy rests on the time-tested belief that valuations in the long run reflect the earnings and cash flows that a business is able to generate, this rediscovery by the market of the importance of profits is most welcome and will be beneficial to valuations of holdings in your portfolio. The RBC strategy focuses on neglected small and microcap companies with attractive long-term fundamentals, near-term profitability improvement potential, and low relative valuations. The strategy emphasizes market leaders with proven products or services, sustainable competitive advantages, solid balance sheets, and attractive cash flows. While sector weightings are a result of bottom-up research and stock selection, the sleeve remains positioned for economic recovery with overweights to the economically sensitive industrials, consumer discretionary, and materials sectors. We believe relative downside protection is provided by the superior return on equity and balance sheet profile of the sleeve compared to the Microcap Index and the market leadership positions of most companies held in the sleeve. WEDGE Capital Management LLP | | | | MARKET OVERVIEW China trading fears, Brexit uncertainty, Saudi oil facility attacks, and the potential impeachment of a U.S. president dominated the headlines during the year. Despite all these concerns, we have now entered the longest and slowest U.S. expansion in history. Absolute yields on U.S. bonds continue to be depressed but remain positive—a sharp distinction from other countries that currently have over $14 trillion in negative yielding bonds. Denmark became the first country to announce a mortgage rate of -0.5%. Effectively, homebuyers in Denmark are being paid to take out a 10-year mortgage. Without question, we are in an unprecedented time. With the Fed’s recent simulative posture, the yield curve has now transitioned from inverted to more normal. It is clear that global growth has slowed over the past year; however, it is possible that a bottoming is occurring. The uncertainty around trade, especially with China, is weighing heavily on the markets and is often causing daily swings. Beyond trade, geopolitical risks continue including situations in Iran, Saudi Arabia, Turkey, and Hong Kong and could disrupt markets in the near term. The Fed is accommodating, though continued low inflation and favorable historic employment data suggest their moves will likely be measured from here. Representing 17% of global gross domestic product (GDP), the U.S. typically leads global recession, not the opposite. In this cycle, the U.S. economy has shown amazing resiliency in the face of a global economic slowdown. In our opinion, recession probability has risen but remains muted in the short-term. In the near-term, political issues at home, including a possible presidential impeachment and a presidential election a year hence, could cause short-term volatility in markets. PERFORMANCE AND ATTRIBUTION ANALYSIS During the 12-month period ending October 31, 2019, the WEDGE sleeve of the Fund returned 0.27% compared to the Microcap Value Index return of -0.91%. During the year, technology (25.5%), utilities (14.0%) and finance (8.2%), specifically REITs (23.2%) and insurance (28%) were the best performing sectors in the Microcap Value Index. Energy (-47.1%), telecom (-41.8%), and basic materials (-26.6%) were the worst performing segments. Stock selection during the year was positive as selections in the health sector, basic materials, and consumer services added value while selections in technology and finance detracted. |
11
|
AMG Managers Emerging Opportunities Fund Portfolio Manager’s Comments(continued) |
| | | | | | | | |
POSITIONING AND OUTLOOK We largely maintain a sector-neutral position to our internal benchmark with limited exceptions. We want the majority of our added value to be in stock selection not sector rotation. We believe the sleeve is well diversified with portfolio risk in line with the benchmark. Turnover within the Wedge sleeve | | | | continues to be between 50% and 75%. We will remain focused on searching for high-quality companies, with earnings growth potential, that may be temporarily out of favor. This commentary reflects the viewpoints of the portfolio managers: Lord, Abbett & Co. LLC, Next Century Growth Investors, LLC, RBC Global Asset | | | | Management (U.S.) Inc. and WEDGE Capital Management L.L.P. as of October 31, 2019, and is not intended as a forecast or guarantee of future results. Each commentary references how the subadvisor manages its respective sleeve of the AMG Managers Emerging Opportunities Fund. |
12
|
AMG Managers Emerging Opportunities Fund Portfolio Manager’s Comments(continued) |
CUMULATIVE TOTAL RETURN PERFORMANCE
AMG Managers Emerging Opportunities Fund’s cumulative total return is based on the daily change in net asset value (NAV), and assumes that all dividends and distributions were reinvested. This graph compares a hypothetical $10,000 investment made in the AMG Managers Emerging Opportunities Fund’s Class N shares on October 31, 2009, to a $10,000 investment made in the Russell Microcap® Index and the Russell 2000® Index for the same time period. The graph and table do not reflect the deduction of taxes that a shareholder would pay on a Fund distribution or redemption of shares. The listed returns for the Fund are net of expenses and the returns for the index exclude expenses. Total returns would have been lower had certain expenses not been reduced.
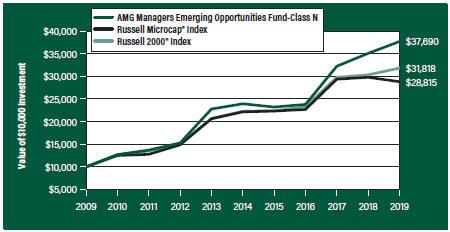
The table below shows the average annual total returns for the AMG Managers Emerging Opportunities Fund, the Russell Microcap® Index and the Russell 2000® Index for the same time periods ended October 31, 2019.
| | | | | | | | | | | | | | | | | | | | |
| Average Annual Total Returns1 | | One
Year | | | Five
Years | | | Ten
Years | | | Since
Inception | | | Inception
Date | |
AMG Managers Emerging Opportunities Fund2, 3, 4, 5, 6, 7 | |
| | | | | |
Class N | | | 7.46 | % | | | 9.50 | % | | | 14.19 | % | | | 12.72 | % | | | 06/30/94 | |
| | | | | |
Class I | | | 7.72 | % | | | 9.77 | % | | | — | | | | 15.74 | % | | | 10/01/11 | |
| | | | | |
Russell Microcap® Index8 | | | (3.27 | %) | | | 5.40 | % | | | 11.16 | % | | | 6.24 | % | | | 06/01/05 | |
| | | | | |
Russell 2000® Index9 | | | 4.90 | % | | | 7.37 | % | | | 12.27 | % | | | 9.13 | % | | | 06/30/94 | † |
The performance data shown represents past performance. Past performance is not a guarantee of future results. Current performance may be lower or higher than the performance data quoted. The investment return and principal value of an investment will fluctuate so that an investor’s shares, when redeemed, may be worth more or less than their original cost.
Investors should carefully consider the Fund’s investment objectives, risks, charges and expenses before investing. For performance information through the most recent month end, current net asset values per share for the Fund and other information, please call 800.548.4539 or visit our website at amgfunds.com for a free prospectus. Read it carefully before investing or sending money.
Distributed by AMG Distributors, Inc., member FINRA/SIPC.
| † | Date reflects the inception date of the Fund, not the index. |
| 1 | Total return equals income yield plus share price change and assumes reinvestment of all dividends and capital gain distributions. Returns are net of fees and may reflect offsets of Fund expenses as described in the prospectus. No adjustment has been made for taxes payable by shareholders on their reinvested dividends and |
| | |
| | | capital gain distributions. Returns for periods greater than one year are annualized. The listed returns on the Fund are net of expenses and based on the published NAV as of October 31, 2019. All returns are in U.S. dollars ($). 2 From time to time, the Fund’s advisor has waived its fees and/or absorbed Fund expenses, which has resulted in higher returns. 3 The Fund is subject to the special risks associated with investments in micro-cap companies, such as relatively short earnings history, competitive conditions, less publicly available corporate information, and reliance on a limited number of products. 4 Investing in initial public offerings (IPOs) is risky and the prices of stocks purchased in IPOs tend to fluctuate more widely than stocks of companies that have been publicly traded for a longer period of time. Stocks purchased in IPOs generally do not have a trading history, and information about the companies may be available for very limited periods. 5 Companies that are in similar businesses may be similarly affected by particular economic or market events; to the extent the Fund has substantial holdings within a particular sector, the risks associated with that sector increase. 6 The Fund invests in growth stocks, which may be more sensitive to market movements because their prices tend to reflect future investor expectations rather than just current profits. Growth stocks may underperform value stocks during given periods. 7 The Fund invests in value stocks, which may perform differently from the market as a whole and may be undervalued by the market for a long period of time. |
| | |
| | | 8 The Russell Microcap® Index tracks the microcap segment of the U.S. equity market. It makes up less than 3% of the U.S. equity market and is represented by the smallest 1,000 securities in the small-cap Russell 2000® Index plus the next 1,000 securities. Unlike the Fund, the Russell Microcap® Index is unmanaged, is not available for investment, and does not incur expenses. 9 The Russell 2000® Index is composed of the 2,000 smallest stocks in the Russell 3000® Index and is widely regarded in the industry as the premier measure of small-cap stock performance. Unlike the Fund, the Russell 2000® Index is unmanaged, is not available for investment, and does not incur expenses. The Russell Indices are trademarks of the London Stock Exchange Group companies. Not FDIC insured, nor bank guaranteed. May lose value. |
13
|
AMG Managers Emerging Opportunities Fund Fund Snapshots(unaudited) October 31, 2019 |
PORTFOLIO BREAKDOWN
| | |
| Sector | | % of
Net Assets |
| | |
Financials | | 22.3 |
| | |
Industrials | | 17.8 |
| | |
Health Care | | 15.8 |
| | |
Information Technology | | 12.2 |
| | |
Consumer Discretionary | | 9.9 |
| | |
Energy | | 3.6 |
| | |
Materials | | 3.4 |
| | |
Consumer Staples | | 3.2 |
| | |
Real Estate | | 3.2 |
| | |
Communication Services | | 2.8 |
| | |
Utilities | | 0.8 |
| | |
Exchange Traded Funds | | 0.2 |
| | |
Short-Term Investments | | 6.7 |
| | |
Other Assets Less Liabilities | | (1.9) |
TOP TEN HOLDINGS
| | |
| Security Name | | % of
Net Assets |
| | |
Model N, Inc. | | 1.8 |
| | |
Compass Diversified Holdings, MLP | | 1.8 |
| | |
Patrick Industries, Inc. | | 1.8 |
| | |
Ducommun, Inc. | | 1.7 |
| | |
Columbus McKinnon Corp. | | 1.7 |
| | |
Alphatec Holdings, Inc. | | 1.3 |
| | |
ACCO Brands Corp. | | 1.2 |
| | |
Palomar Holdings, Inc. | | 1.2 |
| | |
Goosehead Insurance, Inc., Class A | | 1.1 |
| | |
Novanta, Inc. | | 1.1 |
| | | |
| | |
Top Ten as a Group | | 14.7 |
| | |
Because a fund’s strategy may result in multiple investments in particular sectors of the economy, its performance may depend on the performance of those sectors and may fluctuate more widely than investments diversified across more sectors. For additional information on these and other risk considerations, please see the Fund’s prospectus.
Any sectors, industries, or securities discussed should not be perceived as investment recommendations. Mention of a specific security should not be considered a recommendation to buy or solicitation to sell that security. Specific securities mentioned in this report may have been sold from the Fund’s portfolio of investments by the time you receive this report.
14
|
AMG Managers Emerging Opportunities Fund Schedule of Portfolio Investments October 31, 2019 |
| | | | | | | | |
| | | Shares | | | Value | |
| | |
Common Stocks - 95.0% | | | | | | | | |
| | |
Communication Services - 2.8% | | | | | | | | |
| | |
Bandwidth, Inc., Class A* | | | 3,291 | | | | $184,790 | |
| | |
Entravision Communications Corp., Class A | | | 109,486 | | | | 310,940 | |
| | |
Glu Mobile, Inc.*,1 | | | 88,570 | | | | 525,220 | |
| | |
Gray Television, Inc.*,1 | | | 98,650 | | | | 1,618,846 | |
| | |
QuinStreet, Inc.* | | | 16,742 | | | | 214,800 | |
| | |
Salem Media Group, Inc. | | | 32,361 | | | | 48,865 | |
| | |
TechTarget, Inc.* | | | 72,619 | | | | 1,771,904 | |
| | |
Total Communication Services | | | | | | | 4,675,365 | |
| | |
Consumer Discretionary - 9.9% | | | | | | | | |
| | |
Vera Bradley Inc.* | | | 32,853 | | | | 353,498 | |
| | |
Aspen Group, Inc.* | | | 102,380 | | | | 639,875 | |
| | |
Barnes & Noble Education, Inc.* | | | 30,527 | | | | 125,466 | |
| | |
Century Casinos, Inc.* | | | 42,175 | | | | 311,673 | |
| | |
The Container Store Group, Inc.* | | | 25,134 | | | | 106,065 | |
| | |
Culp, Inc. | | | 19,620 | | | | 303,521 | |
| | |
Delta Apparel, Inc.* | | | 61,641 | | | | 1,537,943 | |
| | |
Destination XL Group, Inc.* | | | 176,806 | | | | 256,369 | |
| | |
Everi Holdings, Inc.*,1 | | | 70,084 | | | | 705,045 | |
| | |
Grand Canyon Education, Inc.* | | | 18,390 | | | | 1,691,144 | |
| | |
Hamilton Beach Brands Holding Co., Class A | | | 42,495 | | | | 792,532 | |
| | |
Haverty Furniture Cos., Inc. | | | 24,525 | | | | 444,884 | |
| | |
Johnson Outdoors, Inc., Class A | | | 4,881 | | | | 285,783 | |
| | |
Lakeland Industries, Inc.* | | | 22,410 | | | | 247,631 | |
| | |
Malibu Boats, Inc., Class A* | | | 44,723 | | | | 1,458,864 | |
| | |
Marine Products Corp. | | | 21,989 | | | | 295,092 | |
| | |
MasterCraft Boat Holdings, Inc.* | | | 11,590 | | | | 182,543 | |
| | |
Monarch Casino & Resort, Inc.* | | | 12,630 | | | | 545,490 | |
| | |
Points International, Ltd. (Canada)* | | | 45,102 | | | | 491,612 | |
| | |
Rocky Brands, Inc. | | | 12,907 | | | | 358,944 | |
| | |
Ruth’s Hospitality Group, Inc. | | | 40,369 | | | | 830,794 | |
| | |
Shiloh Industries, Inc.* | | | 8,043 | | | | 29,116 | |
| | |
Shoe Carnival, Inc. | | | 10,228 | | | | 339,467 | |
| | |
Stoneridge, Inc.* | | | 40,320 | | | | 1,245,082 | |
| | |
Tilly’s, Inc., Class A | | | 22,290 | | | | 228,695 | |
| | |
Universal Electronics, Inc.* | | | 35,170 | | | | 1,833,060 | |
| | |
ZAGG, Inc.*,1 | | | 151,398 | | | | 1,115,803 | |
| | |
Total Consumer Discretionary | | | | | | | 16,755,991 | |
| | |
Consumer Staples - 3.2% | | | | | | | | |
| | |
Calavo Growers, Inc.1 | | | 9,021 | | | | 782,391 | |
| | |
John B Sanfilippo & Son, Inc. | | | 10,200 | | | | 1,082,424 | |
| | |
Lifevantage Corp.* | | | 52,176 | | | | 707,507 | |
| | | | | | | | |
| | | Shares | | | Value | |
| | |
Limoneira Co.1 | | | 59,889 | | | | $1,133,100 | |
| | |
Natural Grocers by Vitamin Cottage, Inc.* | | | 62,651 | | | | 549,449 | |
| | |
RiceBran Technologies* | | | 126,311 | | | | 366,302 | |
| | |
SunOpta, Inc. (Canada)* | | | 152,555 | | | | 291,380 | |
| | |
Turning Point Brands, Inc.1 | | | 13,202 | | | | 275,526 | |
| | |
Veru, Inc.* | | | 92,053 | | | | 180,424 | |
| | |
Total Consumer Staples | | | | | | | 5,368,503 | |
| | |
Energy - 3.6% | | | | | | | | |
| | |
Aspen Aerogels, Inc.* | | | 153,662 | | | | 895,849 | |
| | |
Callon Petroleum Co.*,1 | | | 77,350 | | | | 293,930 | |
| | |
Dawson Geophysical Co.* | | | 127,115 | | | | 305,076 | |
| | |
DMC Global, Inc.1 | | | 12,791 | | | | 572,269 | |
| | |
Era Group, Inc.* | | | 76,442 | | | | 739,194 | |
| | |
Evolution Petroleum Corp. | | | 77,686 | | | | 436,595 | |
| | |
Exterran Corp.* | | | 25,794 | | | | 326,810 | |
| | |
Matrix Service Co.* | | | 16,775 | | | | 314,699 | |
| | |
North American Construction Group, Ltd. (Canada) | | | 59,291 | | | | 684,811 | |
| | |
Par Pacific Holdings Inc.* | | | 24,150 | | | | 546,998 | |
| | |
Precision Drilling Corp. (Canada)* | | | 616,595 | | | | 647,425 | |
| | |
Profire Energy, Inc.* | | | 129,426 | | | | 227,790 | |
| | |
Ring Energy, Inc.* | | | 31,536 | | | | 52,350 | |
| | |
TransGlobe Energy Corp. (Canada) | | | 61,233 | | | | 71,030 | |
| | |
Total Energy | | | | | | | 6,114,826 | |
| | |
Financials - 22.3% | | | | | | | | |
| | |
AMERISAFE, Inc. | | | 25,710 | | | | 1,633,356 | |
| | |
Arrow Financial Corp. | | | 16,203 | | | | 569,049 | |
| | |
Ashford, Inc.* | | | 399 | | | | 9,540 | |
| | |
The Bancorp, Inc.* | | | 65,794 | | | | 717,155 | |
| | |
Bridgewater Bancshares, Inc.* | | | 42,290 | | | | 532,431 | |
| | |
Capital City Bank Group, Inc. | | | 7,816 | | | | 222,365 | |
| | |
Carolina Financial Corp. | | | 8,700 | | | | 330,165 | |
| | |
Civista Bancshares, Inc. | | | 15,943 | | | | 358,399 | |
| | |
CNB Financial Corp. | | | 11,220 | | | | 350,849 | |
| | |
Compass Diversified Holdings, MLP | | | 145,462 | | | | 3,003,790 | |
| | |
Cowen, Inc., Class A*,1 | | | 38,767 | | | | 580,342 | |
| | |
eHealth, Inc.*,1 | | | 13,271 | | | | 916,230 | |
| | |
Elevate Credit, Inc.* | | | 37,979 | | | | 155,334 | |
| | |
Ellington Financial, Inc. | | | 37,690 | | | | 694,250 | |
| | |
EZCORP, Inc.*,1 | | | 40,407 | | | | 212,541 | |
| | |
Farmers National Banc Corp. | | | 12,109 | | | | 180,666 | |
| | |
FedNat Holding Co. | | | 22,412 | | | | 321,612 | |
| | |
Fidus Investment Corp. | | | 44,773 | | | | 660,402 | |
The accompanying notes are an integral part of these financial statements.
15
|
AMG Managers Emerging Opportunities Fund Schedule of Portfolio Investments(continued) |
| | | | | | | | |
| | | Shares | | | Value | |
| | |
Financials - 22.3%(continued) | | | | | | | | |
| | |
Financial Institutions, Inc. | | | 25,294 | | | | $794,990 | |
| | |
First Bancorp | | | 29,180 | | | | 1,101,545 | |
| | |
First Business Financial Services, Inc. | | | 7,605 | | | | 184,954 | |
| | |
First Community Bancshares, Inc. | | | 19,806 | | | | 630,425 | |
| | |
First Defiance Financial Corp. | | | 36,264 | | | | 1,121,283 | |
| | |
First Financial Corp. | | | 16,234 | | | | 712,186 | |
| | |
First Savings Financial Group, Inc. | | | 2,756 | | | | 170,707 | |
| | |
German American Bancorp, Inc. | | | 34,835 | | | | 1,151,297 | |
| | |
Goosehead Insurance, Inc., Class A1 | | | 37,607 | | | | 1,924,726 | |
| | |
Hallmark Financial Services, Inc.* | | | 72,067 | | | | 1,284,234 | |
| | |
Heritage Financial Corp. | | | 27,937 | | | | 769,106 | |
| | |
Heritage Insurance Holdings, Inc. | | | 38,889 | | | | 518,002 | |
| | |
Independent Bank Corp. | | | 23,576 | | | | 530,696 | |
| | |
Kinsale Capital Group, Inc. | | | 16,351 | | | | 1,728,628 | |
| | |
Macatawa Bank Corp. | | | 20,889 | | | | 218,395 | |
| | |
Marlin Business Services Corp. | | | 15,852 | | | | 376,326 | |
| | |
Mercantile Bank Corp. | | | 52,130 | | | | 1,835,497 | |
| | |
Metropolitan Bank Holding Corp.* | | | 7,980 | | | | 342,661 | |
| | |
MidWestOne Financial Group, Inc. | | | 16,130 | | | | 525,757 | |
| | |
Northeast Bank | | | 18,820 | | | | 402,936 | |
| | |
Northrim BanCorp, Inc. | | | 36,518 | | | | 1,422,376 | |
| | |
OFS Capital Corp. | | | 31,195 | | | | 371,532 | |
| | |
Old Second Bancorp, Inc. | | | 49,426 | | | | 596,572 | |
| | |
Pacific Premier Bancorp, Inc. | | | 19,077 | | | | 643,944 | |
| | |
Palomar Holdings, Inc.* | | | 43,703 | | | | 1,973,190 | |
| | |
Preferred Bank1 | | | 26,850 | | | | 1,431,374 | |
| | |
Regional Management Corp.* | | | 31,011 | | | | 897,148 | |
| | |
Riverview Bancorp, Inc. | | | 21,243 | | | | 152,737 | |
| | |
Southern Missouri Bancorp, Inc. | | | 10,953 | | | | 398,799 | |
| | |
Territorial Bancorp, Inc. | | | 6,163 | | | | 182,178 | |
| | |
United Community Financial Corp. | | | 79,646 | | | | 907,168 | |
| | |
Unity Bancorp, Inc. | | | 9,043 | | | | 197,499 | |
| | |
Waterstone Financial, Inc. | | | 38,866 | | | | 724,074 | |
| | |
Total Financials | | | | | | | 37,671,418 | |
| | |
Health Care - 15.8% | | | | | | | | |
| | |
Alphatec Holdings, Inc.* | | | 321,533 | | | | 2,212,147 | |
| | |
BioSpecifics Technologies Corp.* | | | 13,779 | | | | 667,317 | |
| | |
CareDx, Inc.*,1 | | | 44,447 | | | | 1,164,956 | |
| | |
Champions Oncology, Inc.* | | | 17,649 | | | | 92,304 | |
| | |
Computer Programs & Systems, Inc. | | | 18,351 | | | | 423,358 | |
| | |
CRH Medical Corp. (Canada)* | | | 51,839 | | | | 156,295 | |
| | |
Cross Country Healthcare, Inc.* | | | 63,221 | | | | 683,419 | |
| | | | | | | | |
| | | Shares | | | Value | |
| | |
CryoLife, Inc.* | | | 22,236 | | | | $499,198 | |
| | |
CryoPort, Inc.*,1 | | | 25,509 | | | | 357,891 | |
| | |
Cutera, Inc.* | | | 16,662 | | | | 524,853 | |
| | |
Exagen, Inc.*,1 | | | 33,865 | | | | 510,007 | |
| | |
Harrow Health, Inc.*,1 | | | 76,111 | | | | 380,555 | |
| | |
Harvard Bioscience, Inc.* | | | 174,052 | | | | 487,346 | |
| | |
InfuSystem Holdings, Inc.* | | | 48,573 | | | | 336,611 | |
| | |
Inspire Medical Systems, Inc.* | | | 17,031 | | | | 1,038,550 | |
| | |
The Joint Corp.* | | | 96,029 | | | | 1,831,273 | |
| | |
Lantheus Holdings, Inc.* | | | 13,812 | | | | 287,980 | |
| | |
LeMaitre Vascular, Inc.1 | | | 12,064 | | | | 417,414 | |
| | |
Opiant Pharmaceuticals, Inc.* | | | 12,067 | | | | 184,142 | |
| | |
OrthoPediatrics Corp.*,1 | | | 42,569 | | | | 1,646,569 | |
| | |
Osmotica Pharmaceuticals PLC
(Ireland)*,1 | | | 53,673 | | | | 237,771 | |
| | |
Pro-Dex, Inc.* | | | 10,347 | | | | 138,133 | |
| | |
Quanterix Corp.* | | | 21,626 | | | | 450,902 | |
| | |
Recro Pharma, Inc.* | | | 70,069 | | | | 1,104,988 | |
| | |
SeaSpine Holdings Corp.* | | | 36,826 | | | | 509,672 | |
| | |
Semler Scientific, Inc.* | | | 8,339 | | | | 391,933 | |
| | |
SI-BONE, Inc.*,1 | | | 94,124 | | | | 1,567,165 | |
| | |
Silk Road Medical, Inc.*,1 | | | 20,597 | | | | 682,173 | |
| | |
Simulations Plus, Inc. | | | 23,303 | | | | 825,159 | |
| | |
Surmodics, Inc.* | | | 17,040 | | | | 809,570 | |
| | |
Tactile Systems Technology, Inc.*,1 | | | 32,676 | | | | 1,484,144 | |
| | |
TransMedics Group, Inc.*,1 | | | 16,310 | | | | 292,601 | |
| | |
US Physical Therapy, Inc. | | | 2,600 | | | | 367,822 | |
| | |
Utah Medical Products, Inc. | | | 7,918 | | | | 811,358 | |
| | |
Veracyte, Inc.* | | | 18,689 | | | | 428,539 | |
| | |
Vericel Corp.*,1 | | | 99,259 | | | | 1,575,240 | |
| | |
Zynex, Inc.1 | | | 119,799 | | | | 1,106,943 | |
| | |
Total Health Care | | | | | | | 26,686,298 | |
| | |
Industrials - 17.8% | | | | | | | | |
| | |
ACCO Brands Corp. | | | 221,773 | | | | 2,029,223 | |
| | |
Air Transport Services Group, Inc.* | | | 5,700 | | | | 119,187 | |
| | |
Allied Motion Technologies, Inc. | | | 14,842 | | | | 561,918 | |
| | |
Armstrong Flooring, Inc.* | | | 69,006 | | | | 423,697 | |
| | |
Barrett Business Services, Inc. | | | 11,040 | | | | 968,539 | |
| | |
Blue Bird Corp.* | | | 16,580 | | | | 323,973 | |
| | |
Casella Waste Systems, Inc., Class A* | | | 15,747 | | | | 686,412 | |
| | |
CBIZ, Inc.* | | | 26,450 | | | | 723,936 | |
| | |
Columbus McKinnon Corp. | | | 75,950 | | | | 2,849,644 | |
| | |
Covenant Transportation Group, Inc., Class A* | | | 20,669 | | | | 317,683 | |
| | |
CPI Aerostructures, Inc.* | | | 22,278 | | | | 173,546 | |
The accompanying notes are an integral part of these financial statements.
16
|
AMG Managers Emerging Opportunities Fund Schedule of Portfolio Investments(continued) |
| | | | | | | | |
| | | Shares | | | Value | |
| | |
Industrials - 17.8%(continued) | | | | | | | | |
| | |
CRA International, Inc. | | | 16,377 | | | | $806,567 | |
| | |
Ducommun, Inc.* | | | 59,316 | | | | 2,940,887 | |
| | |
Ennis, Inc. | | | 49,861 | | | | 976,777 | |
| | |
Graham Corp. | | | 32,151 | | | | 728,542 | |
| | |
The Greenbrier Cos., Inc. | | | 31,033 | | | | 908,957 | |
| | |
Heidrick & Struggles International, Inc. | | | 17,859 | | | | 508,267 | |
| | |
Heritage-Crystal Clean, Inc.* | | | 20,647 | | | | 547,971 | |
| | |
Insteel Industries, Inc. | | | 17,480 | | | | 333,344 | |
| | |
Kornit Digital, Ltd. (Israel)* | | | 44,167 | | | | 1,501,236 | |
| | |
LB Foster Co., Class A* | | | 6,801 | | | | 123,778 | |
| | |
LiqTech International, Inc.
(Denmark)*,1 | | | 64,242 | | | | 465,112 | |
| | |
Manitex International, Inc.* | | | 21,367 | | | | 118,801 | |
| | |
Marten Transport, Ltd. | | | 19,663 | | | | 425,901 | |
| | |
Mistras Group, Inc.* | | | 22,163 | | | | 343,526 | |
| | |
NN, Inc. | | | 26,840 | | | | 193,785 | |
| | |
Northwest Pipe Co.* | | | 6,501 | | | | 198,280 | |
| | |
NV5 Global, Inc.*,1 | | | 17,520 | | | | 1,268,974 | |
| | |
Patrick Industries, Inc.*,1 | | | 59,697 | | | | 2,949,629 | |
| | |
PGT Innovations, Inc.* | | | 16,490 | | | | 291,213 | |
| | |
Radiant Logistics, Inc.* | | | 111,421 | | | | 600,559 | |
| | |
Spartan Motors, Inc. | | | 47,488 | | | | 829,615 | |
| | |
Sterling Construction Co., Inc.* | | | 32,794 | | | | 532,739 | |
| | |
Titan Machinery, Inc.* | | | 33,106 | | | | 549,560 | |
| | |
Transcat, Inc.* | | | 15,967 | | | | 500,406 | |
| | |
Universal Logistics Holdings, Inc. | | | 23,968 | | | | 451,917 | |
| | |
Vectrus, Inc.* | | | 19,554 | | | | 893,813 | |
| | |
Willdan Group, Inc.*,1 | | | 32,291 | | | | 978,417 | |
| | |
Total Industrials | | | | | | | 30,146,331 | |
| | |
Information Technology - 12.2% | | | | | | | | |
| | |
Airgain, Inc.* | | | 35,319 | | | | 401,577 | |
| | |
American Software, Inc., Class A | | | 30,407 | | | | 492,897 | |
| | |
AstroNova, Inc. | | | 20,762 | | | | 329,285 | |
| | |
AXT, Inc.* | | | 61,840 | | | | 192,941 | |
| | |
Bel Fuse, Inc., Class B | | | 29,075 | | | | 427,693 | |
| | |
Comtech Telecommunications Corp. | | | 17,177 | | | | 600,336 | |
| | |
CyberOptics Corp.* | | | 8,565 | | | | 157,425 | |
| | |
DSP Group, Inc.* | | | 27,210 | | | | 405,701 | |
| | |
The Hackett Group, Inc. | | | 43,595 | | | | 737,191 | |
| | |
Information Services Group, Inc.* | | | 68,564 | | | | 148,098 | |
| | |
International Money Express, Inc.* | | | 119,412 | | | | 1,829,392 | |
| | |
Mitek Systems, Inc.* | | | 104,150 | | | | 1,004,006 | |
| | |
Model N, Inc.* | | | 101,160 | | | | 3,013,556 | |
| | | | | | | | |
| | | Shares | | | Value | |
| | |
Napco Security Technologies, Inc.*,1 | | | 35,486 | | | | $1,077,355 | |
| | |
Novanta, Inc.* | | | 21,490 | | | | 1,913,685 | |
| | |
Paysign, Inc.*,1 | | | 82,541 | | | | 889,792 | |
| | |
PC Connection, Inc. | | | 30,088 | | | | 1,469,498 | |
| | |
PC-Tel, Inc. | | | 28,765 | | | | 205,670 | |
| | |
Sapiens International Corp. NV (Israel) | | | 58,251 | | | | 1,230,844 | |
| | |
TESSCO Technologies, Inc. | | | 17,931 | | | | 238,303 | |
| | |
TransAct Technologies, Inc. | | | 9,780 | | | | 120,881 | |
| | |
Tufin Software Technologies, Ltd. (Israel)*,1 | | | 12,553 | | | | 214,280 | |
| | |
Tyler Technologies, Inc.* | | | 3,370 | | | | 904,912 | |
| | |
Unisys Corp.* | | | 40,268 | | | | 413,150 | |
| | |
Vishay Precision Group, Inc.* | | | 49,730 | | | | 1,693,307 | |
| | |
Zix Corp.* | | | 67,963 | | | | 449,235 | |
| | |
Total Information Technology | | | | | | | 20,561,010 | |
| | |
Materials - 3.4% | | | | | | | | |
| | |
FutureFuel Corp. | | | 39,620 | | | | 488,515 | |
| | |
Haynes International, Inc. | | | 5,208 | | | | 179,468 | |
| | |
Koppers Holdings, Inc.* | | | 30,915 | | | | 992,371 | |
| | |
Myers Industries, Inc. | | | 55,007 | | | | 931,269 | |
| | |
OMNOVA Solutions, Inc.* | | | 80,057 | | | | 809,376 | |
| | |
UFP Technologies, Inc.* | | | 21,451 | | | | 892,576 | |
| | |
Universal Stainless & Alloy Products, Inc.*,1 | | | 112,110 | | | | 1,504,516 | |
| | |
Total Materials | | | | | | | 5,798,091 | |
| | |
Real Estate - 3.2% | | | | | | | | |
| | |
Braemar Hotels & Resorts, Inc., REIT | | | 85,018 | | | | 784,716 | |
| | |
Cedar Realty Trust, Inc., REIT | | | 126,253 | | | | 421,685 | |
| | |
Clipper Realty, Inc., REIT | | | 30,140 | | | | 290,550 | |
| | |
Community Healthcare Trust, Inc., REIT | | | 32,060 | | | | 1,552,345 | |
| | |
Consolidated-Tomoka Land Co. | | | 11,348 | | | | 725,931 | |
| | |
Plymouth Industrial REIT, Inc. | | | 20,953 | | | | 395,173 | |
| | |
Sotherly Hotels, Inc., REIT | | | 25,865 | | | | 166,571 | |
| | |
UMH Properties, Inc., REIT | | | 68,390 | | | | 1,021,063 | |
| | |
Total Real Estate | | | | | | | 5,358,034 | |
| | |
Utilities - 0.8% | | | | | | | | |
| | |
Atlantic Power Corp.* | | | 69,833 | | | | 162,711 | |
| | |
Unitil Corp. | | | 19,420 | | | | 1,209,283 | |
| | |
Total Utilities | | | | | | | 1,371,994 | |
| | |
Total Common Stocks
(Cost $122,990,318) | | | | | | | 160,507,861 | |
| |
Exchange Traded Funds - 0.2% | | | | | |
| | |
SPDR S&P Regional Banking ETF1
(Cost $344,175) | | | 6,550 | | | | 353,045 | |
The accompanying notes are an integral part of these financial statements.
17
|
AMG Managers Emerging Opportunities Fund Schedule of Portfolio Investments(continued) |
| | | | | | | | |
| | | Principal
Amount | | | Value | |
| |
Short-Term Investments - 6.7% | | | | | |
| | |
Joint Repurchase Agreements - 2.3%2 | | | | | | | | |
| | |
Cantor Fitzgerald Securities, Inc., dated 10/31/19, due 11/01/19, 1.750% total to be received $1,000,049 (collateralized by various U.S. Government Agency Obligations and U.S. Treasuries, 0.000% - 9.000%, 11/25/19 - 10/20/68, totaling $1,020,041) | | | $1,000,000 | | | | $1,000,000 | |
| | |
Citigroup Global Markets, Inc., dated 10/31/19, due 11/01/19, 1.740% total to be received $1,000,048 (collateralized by various U.S. Government Agency Obligations and U.S. Treasuries, 2.500% - 8.000%, 12/01/20 - 01/01/59, totaling $1,020,000) | | | 1,000,000 | | | | 1,000,000 | |
| | |
Industrial and Commercial Bank of China Financial Services LLC, dated 10/31/19, due 11/01/19, 1.750% total to be received $939,892 (collateralized by various U.S. Government Agency Obligations and U.S. Treasuries, 0.000% - 9.500%, 12/24/19 - 10/01/49, totaling $958,643) | | | 939,846 | | | | 939,846 | |
| | |
MUFG Securities America, Inc., dated 10/31/19, due 11/01/19, 1.730% total to be received $1,000,048 (collateralized by various U.S. Government Agency Obligations, 3.203% - 4.447%, 12/01/25 - 10/01/49, totaling $1,020,000) | | | 1,000,000 | | | | 1,000,000 | |
| | |
Total Joint Repurchase Agreements | | | | | | | 3,939,846 | |
| | | | | | | | |
| | | Shares | | | Value | |
| | |
Other Investment Companies - 4.4% | | | | | | | | |
| | |
Dreyfus Government Cash Management Fund, Institutional Shares, 1.73%3 | | | 6,936,299 | | | | $6,936,299 | |
| | |
Dreyfus Institutional Preferred Government Money Market Fund, Institutional Shares, 1.77%3 | | | 202,193 | | | | 202,193 | |
| | |
JPMorgan U.S. Government Money Market Fund, IM Shares, 1.75%3 | | | 208,320 | | | | 208,320 | |
| | |
Total Other Investment Companies | | | | | | | 7,346,812 | |
| | |
Total Short-Term Investments
(Cost $11,286,658) | | | | | | | 11,286,658 | |
| | |
Total Investments - 101.9%
(Cost $134,621,151) | | | | | | | 172,147,564 | |
| |
Other Assets, less Liabilities - (1.9)% | | | | (3,204,401 | ) |
| | |
Net Assets - 100.0% | | | | | | | $168,943,163 | |
| * | Non-income producing security. |
| 1 | Some of these securities, amounting to $21,076,086 or 12.5% of net assets, were out on loan to various borrowers and are collateralized by cash and various U.S. Treasury Obligations. See Note 4 of Notes to Financial Statements. |
| 2 | Cash collateral received for securities lending activity was invested in these joint repurchase agreements. |
| 3 | Yield shown represents the October 31, 2019, seven day average yield, which refers to the sum of the previous seven days’ dividends paid, expressed as an annual percentage. |
| | |
| ETF | | Exchange Traded Fund |
| |
| MLP | | Master Limited Partnership |
| |
| REIT | | Real Estate Investment Trust |
| |
| S&P | | Standard & Poor’s |
| |
| SPDR | | Standard & Poor’s Depositary Receipt |
The accompanying notes are an integral part of these financial statements.
18
|
AMG Managers Emerging Opportunities Fund Schedule of Portfolio Investments(continued) |
The following table summarizes the inputs used to value the Fund’s investments by the fair value hierarchy levels as of October 31, 2019:
| | | | | | | | | | | | | | | | |
| | | Level 1 | | | Level 2 | | | Level 3 | | | Total | |
Investments in Securities | | | | | | | | | | | | | | | | |
| | | | |
Common Stocks† | | $ | 160,507,861 | | | | — | | | | — | | | $ | 160,507,861 | |
| | | | |
Exchange Traded Funds | | | 353,045 | | | | — | | | | — | | | | 353,045 | |
| | | | |
Short-Term Investments | | | | | | | | | | | | | | | | |
| | | | |
Joint Repurchase Agreements | | | — | | | $ | 3,939,846 | | | | — | | | | 3,939,846 | |
| | | | |
Other Investment Companies | | | 7,346,812 | | | | — | | | | — | | | | 7,346,812 | |
| | | | | | | | | | | | | | | | |
| | | | |
Total Investments in Securities | | $ | 168,207,718 | | | $ | 3,939,846 | | | | — | | | $ | 172,147,564 | |
| | | | | | | | | | | | | | | | |
| † | All common stocks held in the Fund are Level 1 securities. For a detailed breakout of common stocks by major industry classification, please refer to the Fund’s Schedule of Portfolio Investments. |
For the fiscal year ended October 31, 2019, there were no transfers in or out of Level 3.
The accompanying notes are an integral part of these financial statements.
19
| | |
| | Statement of Assets and Liabilities October 31, 2019 |
| | | | | | | | |
| | | AMG Frontier
Small Cap
Growth Fund | | AMG Managers
Emerging
Opportunities Fund |
| | |
| Assets: | | | | |
| | |
Investments at value1(including securities on loan valued at $4,400,170, and $21,076,086, respectively) | | | $19,081,115 | | | | $172,147,564 | |
| | |
Receivable for investments sold | | | 394,216 | | | | 1,416,435 | |
| | |
Dividend, interest and other receivables | | | 2,407 | | | | 72,310 | |
| | |
Receivable for Fund shares sold | | | 200 | | | | 1,252 | |
| | |
Receivable from affiliate | | | 3,189 | | �� | | 6,948 | |
| | |
Prepaid expenses and other assets | | | 12,394 | | | | 17,190 | |
| | |
Total assets | | | 19,493,521 | | | | 173,661,699 | |
| | |
Liabilities: | | | | | | | | |
| | |
Payable upon return of securities loaned | | | 785,379 | | | | 3,939,846 | |
| | |
Payable for investments purchased | | | 263,551 | | | | 538,566 | |
| | |
Payable for Fund shares repurchased | | | 15 | | | | 31,299 | |
| | |
Accrued expenses: | | | | | | | | |
| | |
Investment advisory and management fees | | | 10,708 | | | | 103,005 | |
| | |
Administrative fees | | | 2,294 | | | | 20,879 | |
| | |
Distribution fees | | | 66 | | | | — | |
| | |
Shareholder service fees | | | 633 | | | | 28,574 | |
| | |
Other | | | 38,133 | | | | 56,367 | |
| | |
Total liabilities | | | 1,100,779 | | | | 4,718,536 | |
| | | | | | | | |
| | |
Net Assets | | | $18,392,742 | | | | $168,943,163 | |
| | |
1Investments at cost | | | $17,290,414 | | | | $134,621,151 | |
The accompanying notes are an integral part of these financial statements.
20
|
Statement of Assets and Liabilities(continued) |
| | | | | | | | |
| | |
| | | AMG Frontier
Small Cap
Growth Fund | | AMG Managers
Emerging
Opportunities Fund |
| | |
Net Assets
Represent: | | | | |
| | |
Paid-in capital | | | $15,959,157 | | | | $119,258,468 | |
| | |
Total distributable earnings | | | 2,433,585 | | | | 49,684,695 | |
| | |
Net Assets | | | $18,392,742 | | | | $168,943,163 | |
| | |
| Class N: | | | | |
| | |
Net Assets | | | $323,554 | | | | $138,695,283 | |
| | |
Shares outstanding | | | 40,312 | | | | 3,347,040 | |
| | |
Net asset value, offering and redemption price per share | | | $8.03 | | | | $41.44 | |
| | |
| Class I: | | | | |
| | |
Net Assets | | | $10,873,317 | | | | $30,247,880 | |
| | |
Shares outstanding | | | 1,290,493 | | | | 714,834 | |
| | |
Net asset value, offering and redemption price per share | | | $8.43 | | | | $42.31 | |
| | |
| Class Z: | | | | |
| | |
Net Assets | | | $7,195,871 | | | | — | |
| | |
Shares outstanding | | | 822,049 | | | | — | |
| | |
Net asset value, offering and redemption price per share | | | $8.75 | | | | — | |
The accompanying notes are an integral part of these financial statements.
21
| | |
| | Statement of Operations For the fiscal year ended October 31, 2019 |
| | | | | | | | |
| | | AMG Frontier
Small Cap
Growth Fund | | AMG Managers
Emerging
Opportunities Fund |
| | |
| Investment Income: | | | | |
| | |
Dividend income | | | $86,851 | | | | $1,576,951 | |
| | |
Securities lending income | | | 10,444 | | | | 164,377 | |
| | |
Foreign withholding tax | | | — | | | | (8,875) | |
| | |
Total investment income | | | 97,295 | | | | 1,732,453 | |
| | |
Expenses: | | | | | | | | |
| | |
Investment advisory and management fees | | | 132,364 | | | | 1,410,246 | |
| | |
Administrative fees | | | 28,364 | | | | 256,591 | |
| | |
Distribution fees - Class N | | | 1,643 | | | | — | |
| | |
Shareholder servicing fees - Class N | | | 986 | | | | 354,147 | |
| | |
Shareholder servicing fees - Class I | | | 7,217 | | | | — | |
| | |
Registration fees | | | 47,662 | | | | 39,890 | |
| | |
Custodian fees | | | 42,045 | | | | 49,988 | |
| | |
Professional fees | | | 27,362 | | | | 37,363 | |
| | |
Transfer agent fees | | | 6,531 | | | | 30,852 | |
| | |
Reports to shareholders | | | 3,278 | | | | 25,086 | |
| | |
Trustee fees and expenses | | | 1,753 | | | | 15,757 | |
| | |
Miscellaneous | | | 2,887 | | | | 6,788 | |
| | |
Total expenses before offsets | | | 302,092 | | | | 2,226,708 | |
| | |
Expense reimbursements | | | (121,636) | | | | (131,263) | |
| | |
Expense reductions | | | — | | | | (38,332) | |
| | |
Net expenses | | | 180,456 | | | | 2,057,113 | |
| | | | | | | | |
| | |
Net investment loss | | | (83,161) | | | | (324,660) | |
| | |
Net Realized and Unrealized Gain: | | | | | | | | |
| | |
Net realized gain on investments | | | 1,661,550 | | | | 14,221,292 | |
| | |
Net change in unrealized appreciation/depreciation on investments | | | 407,788 | | | | (1,986,484) | |
| | |
Net realized and unrealized gain | | | 2,069,338 | | | | 12,234,808 | |
| | | | | | | | |
| | |
Net increase in net assets resulting from operations | | | $1,986,177 | | | | $11,910,148 | |
The accompanying notes are an integral part of these financial statements.
22
| | |
| | Statements of Changes in Net Assets For the fiscal years ended October 31, |
| | | | | | | | | | | | | | | | |
| | | AMG Frontier
Small Cap Growth Fund | | | AMG Managers Emerging
Opportunities Fund | |
| | | | |
| | | 2019 | | | 2018 | | | 2019 | | | 2018 | |
| | | | |
Increase in Net Assets Resulting From Operations: | | | | | | | | | | | | | | | | |
| | | | |
Net investment loss | | | $(83,161 | ) | | | $(88,607 | ) | | | $(324,660 | ) | | | $(1,095,831 | ) |
| | | | |
Net realized gain on investments | | | 1,661,550 | | | | 5,566,378 | | | | 14,221,292 | | | | 32,625,998 | |
| | | | |
Net change in unrealized appreciation/depreciation on investments | | | 407,788 | | | | (2,987,833 | ) | | | (1,986,484 | ) | | | (16,727,914 | ) |
| | | | |
Net increase in net assets resulting from operations | | | 1,986,177 | | | | 2,489,938 | | | | 11,910,148 | | | | 14,802,253 | |
| | | | |
Distributions to Shareholders: | | | | | | | | | | | | | | | | |
| | | | |
Class N | | | (137,752 | ) | | | (74,443 | ) | | | (26,608,055 | ) | | | (16,730,534 | ) |
| | | | |
Class I | | | (3,607,157 | ) | | | (2,421,844 | ) | | | (4,974,384 | ) | | | (2,696,048 | ) |
| | | | |
Class Z | | | (2,240,613 | ) | | | (1,606,835 | ) | | | — | | | | — | |
| | | | |
Total distributions to shareholders | | | (5,985,522 | ) | | | (4,103,122 | ) | | | (31,582,439 | ) | | | (19,426,582 | ) |
| | | | |
Capital Share Transactions:1 | | | | | | | | | | | | | | | | |
| | | | |
Net increase from capital share transactions | | | 3,871,839 | | | | 1,559,658 | | | | 11,711,122 | | | | 8,639,116 | |
| | | | |
| | | | | | | | | | | | | | | | |
| | | | |
Total increase (decrease) in net assets | | | (127,506 | ) | | | (53,526 | ) | | | (7,961,169 | ) | | | 4,014,787 | |
| | | | |
Net Assets: | | | | | | | | | | | | | | | | |
| | | | |
Beginning of year | | | 18,520,248 | | | | 18,573,774 | | | | 176,904,332 | | | | 172,889,545 | |
| | | | |
End of year | | | $18,392,742 | | | | $18,520,248 | | | | $168,943,163 | | | | $176,904,332 | |
1 See Note 1(g) of the Notes to Financial Statements.
The accompanying notes are an integral part of these financial statements.
23
| | | | |
| | | | AMG Frontier Small Cap Growth Fund Financial Highlights For a share outstanding throughout each fiscal year |
| | | | | | | | | | | | | | | | | | | | | | | | | |
| | | For the fiscal year ended October 31, |
| | | | | |
| Class N | | 2019 | | 2018 | | 2017 | | 20161 | | 2015 |
| | | | | |
Net Asset Value, Beginning of Year | | | | $11.69 | | | | | $13.20 | | | | | $10.29 | | | | | $13.57 | | | | | $25.12 | |
| | | | | |
Income (loss) from Investment Operations: | | | | | | | | | | | | | | | | | | | | | | | | | |
| | | | | |
Net investment loss2,3 | | | | (0.06 | ) | | | | (0.09 | ) | | | | (0.11 | ) | | | | (0.06 | )4 | | | | (0.12 | ) |
| | | | | |
Net realized and unrealized gain (loss) on investments | | | | 0.45 | | | | | 1.58 | | | | | 3.07 | | | | | (0.22 | ) | | | | 0.19 | |
| | | | | |
Total income (loss) from investment operations | | | | 0.39 | | | | | 1.49 | | | | | 2.96 | | | | | (0.28 | ) | | | | 0.07 | |
| | | | | |
Less Distributions to Shareholders from: | | | | | | | | | | | | | | | | | | | | | | | | | |
| | | | | |
Net realized gain on investments | | | | (4.05 | ) | | | | (3.00 | ) | | | | (0.05 | ) | | | | (3.00 | ) | | | | (11.62 | ) |
| | | | | |
Net Asset Value, End of Year | | | | $8.03 | | | | | $11.69 | | | | | $13.20 | | | | | $10.29 | | | | | $13.57 | |
| | | | | |
Total Return3 | | | | 11.83 | %5 | | | | 13.81 | %5 | | | | 28.82 | %5 | | | | (3.01 | )%5 | | | | (3.06 | )% |
| | | | | |
Ratio of net expenses to average net assets | | | | 1.30 | % | | | | 1.30 | % | | | | 1.43 | % | | | | 1.55 | % | | | | 1.55 | % |
| | | | | |
Ratio of gross expenses to average net assets6 | | | | 1.94 | % | | | | 1.81 | % | | | | 2.01 | % | | | | 1.95 | % | | | | 1.81 | % |
| | | | | |
Ratio of net investment loss to average net assets3 | | | | (0.79 | )% | | | | (0.76 | )% | | | | (0.93 | )% | | | | (0.58 | )% | | | | (0.76 | )% |
| | | | | |
Portfolio turnover | | | | 226 | % | | | | 233 | % | | | | 99 | % | | | | 70 | % | | | | 99 | % |
| | | | | |
Net assets end of year (000’s) omitted | | | | $324 | | | | | $553 | | | | | $210 | | | | | $147 | | | | | $179 | |
| | | | | | | | | | | | | | | | | | | | | | | | | | |
24
| | | | |
| | | | AMG Frontier Small Cap Growth Fund Financial Highlights For a share outstanding throughout each fiscal year |
| | | | | | | | | | | | | | | | | | | | | | | | | |
| | | For the fiscal year ended October 31, |
| | | | | |
| Class I | | 2019 | | 2018 | | 2017 | | 20161 | | 2015 |
| | | | | |
Net Asset Value, Beginning of Year | | | | $12.02 | | | | | $13.46 | | | | | $10.46 | | | | | $13.76 | | | | | $25.40 | |
| | | | | |
Income (loss) from Investment Operations: | | | | | | | | | | | | | | | | | | | | | | | | | |
| | | | | |
Net investment loss2,3 | | | | (0.04 | ) | | | | (0.06 | ) | | | | (0.08 | ) | | | | (0.03 | )4 | | | | (0.08 | ) |
| | | | | |
Net realized and unrealized gain (loss) on investments | | | | 0.50 | | | | | 1.62 | | | | | 3.13 | | | | | (0.23 | ) | | | | 0.20 | |
| | | | | |
Total income (loss) from investment operations | | | | 0.46 | | | | | 1.56 | | | | | 3.05 | | | | | (0.26 | ) | | | | 0.12 | |
| | | | | |
Less Distributions to Shareholders from: | | | | | | | | | | | | | | | | | | | | | | | | | |
| | | | | |
Net realized gain on investments | | | | (4.05 | ) | | | | (3.00 | ) | | | | (0.05 | ) | | | | (3.04 | ) | | | | (11.76 | ) |
| | | | | |
Net Asset Value, End of Year | | | | $8.43 | | | | | $12.02 | | | | | $13.46 | | | | | $10.46 | | | | | $13.76 | |
| | | | | |
Total Return3 | | | | 12.08 | %5 | | | | 14.12 | %5 | | | | 29.22 | %5 | | | | (2.77 | )%5 | | | | (2.78 | )% |
| | | | | |
Ratio of net expenses to average net assets | | | | 0.96 | % | | | | 1.01 | % | | | | 1.15 | % | | | | 1.29 | % | | | | 1.28 | % |
| | | | | |
Ratio of gross expenses to average net assets6 | | | | 1.60 | % | | | | 1.52 | % | | | | 1.73 | % | | | | 1.69 | % | | | | 1.55 | % |
| | | | | |
Ratio of net investment loss to average net assets3 | | | | (0.45 | )% | | | | (0.46 | )% | | | | (0.65 | )% | | | | (0.32 | )% | | | | (0.51 | )% |
| | | | | |
Portfolio turnover | | | | 226 | % | | | | 233 | % | | | | 99 | % | | | | 70 | % | | | | 99 | % |
| | | | | |
Net assets end of year (000’s) omitted | | | | $10,873 | | | | | $11,549 | | | | | $11,009 | | | | | $9,570 | | | | | $12,671 | |
| | | | | | | |
25
| | | | |
| | | | AMG Frontier Small Cap Growth Fund Financial Highlights For a share outstanding throughout each fiscal year |
| | | | | | | | | | | | | | | | | | | | | | | | | |
| | | For the fiscal year ended October 31, |
| | | | | |
| Class Z | | 2019 | | 2018 | | 2017 | | 20161 | | 2015 |
| | | | | |
Net Asset Value, Beginning of Year | | | | $12.31 | | | | | $13.70 | | | | | $10.63 | | | | | $13.95 | | | | | $25.69 | |
| | | | | |
Income (loss) from Investment Operations: | | | | | | | | | | | | | | | | | | | | | | | | | |
| | | | | |
Net investment loss2,3 | | | | (0.03 | ) | | | | (0.05 | ) | | | | (0.06 | ) | | | | (0.01 | )4 | | | | (0.05 | ) |
| | | | | |
Net realized and unrealized gain (loss) on investments | | | | 0.52 | | | | | 1.66 | | | | | 3.18 | | | | | (0.22 | ) | | | | 0.21 | |
| | | | | |
Total income (loss) from investment operations | | | | 0.49 | | | | | 1.61 | | | | | 3.12 | | | | | (0.23 | ) | | | | 0.16 | |
| | | | | |
Less Distributions to Shareholders from: | | | | | | | | | | | | | | | | | | | | | | | | | |
| | | | | |
Net realized gain on investments | | | | (4.05 | ) | | | | (3.00 | ) | | | | (0.05 | ) | | | | (3.09 | ) | | | | (11.90 | ) |
| | | | | |
Net Asset Value, End of Year | | | | $8.75 | | | | | $12.31 | | | | | $13.70 | | | | | $10.63 | | | | | $13.95 | |
| | | | | |
Total Return3 | | | | 12.15 | %5 | | | | 14.26 | %5 | | | | 29.42 | %5 | | | | (2.53 | )%5 | | | | (2.55 | )% |
| | | | | |
Ratio of net expenses to average net assets | | | | 0.90 | % | | | | 0.90 | % | | | | 1.00 | % | | | | 1.05 | % | | | | 1.05 | % |
| | | | | |
Ratio of gross expenses to average net assets6 | | | | 1.54 | % | | | | 1.41 | % | | | | 1.58 | % | | | | 1.44 | % | | | | 1.32 | % |
| | | | | |
Ratio of net investment loss to average net assets3 | | | | (0.39 | )% | | | | (0.36 | )% | | | | (0.50 | )% | | | | (0.10 | )% | | | | (0.28 | )% |
| | | | | |
Portfolio turnover | | | | 226 | % | | | | 233 | % | | | | 99 | % | | | | 70 | % | | | | 99 | % |
| | | | | |
Net assets end of year (000’s) omitted | | | | $7,196 | | | | | $6,418 | | | | | $7,354 | | | | | $9,114 | | | | | $16,366 | |
| | | | | | | | | | | | | | | | | | | | | | | | | | |
| 1 | Effective October 1, 2016, the Investor Class, Service Class and Institutional Class were renamed Class N, Class I and Class Z, respectively. |
| 2 | Per share numbers have been calculated using average shares. |
| 3 | Total returns and net investment income (loss) would have been lower had certain expenses not been offset. |
| 4 | Includes non-recurring dividends. Without these dividends, net investment income per share would have been $(0.09), $(0.06), and $(0.04) for Class N, Class I, and Class Z shares, respectively. |
| 5 | The total return is calculated using the published Net Asset Value as of fiscal year end. |
| 6 | Excludes the impact of expense reimbursement or fee waivers and expense reductions such as brokerage credits, but includes expense repayments and non-reimbursable expenses, if any, such as interest, taxes, and extraordinary expenses. (See Note 1(c) and 2 in the Notes to Financial Statements.) |
26
| | | | |
| | | | AMG Managers Emerging Opportunities Fund Financial Highlights For a share outstanding throughout each fiscal year |
| | | | | | | | | | | | | | | | | | | | | | | | | |
| | | For the fiscal year ended October 31, |
| | | | | |
| Class N | | 2019 | | 2018 | | 20171 | | 20162 | | 2015 |
| | | | | |
Net Asset Value, Beginning of Year | | | | $48.48 | | | | | $50.06 | | | | | $37.09 | | | | | $40.76 | | | | | $47.11 | |
| | | | | |
Income (loss) from Investment Operations: | | | | | | | | | | | | | | | | | | | | | | | | | |
| | | | | |
Net investment loss3,4 | | | | (0.09 | ) | | | | (0.32 | ) | | | | (0.27 | )5 | | | | (0.17 | )6 | | | | (0.24 | )7 |
| | | | | |
Net realized and unrealized gain (loss) on investments | | | | 1.70 | | | | | 4.45 | | | | | 13.38 | | | | | 1.02 | | | | | (0.79 | ) |
| | | | | |
Total income (loss) from investment operations | | | | 1.61 | | | | | 4.13 | | | | | 13.11 | | | | | 0.85 | | | | | (1.03 | ) |
| | | | | |
Less Distributions to Shareholders from: | | | | | | | | | | | | | | | | | | | | | | | | | |
| | | | | |
Net investment income | | | | — | | | | | — | | | | | — | | | | | — | | | | | — | |
| | | | | |
Net realized gain on investments | | | | (8.65 | ) | | | | (5.71 | ) | | | | (0.14 | ) | | | | (4.52 | ) | | | | (5.32 | ) |
| | | | | |
Total distributions to shareholders | | | | (8.65 | ) | | | | (5.71 | ) | | | | (0.14 | ) | | | | (4.52 | ) | | | | (5.32 | ) |
| | | | | |
Net Asset Value, End of Year | | | | $41.44 | | | | | $48.48 | | | | | $50.06 | | | | | $37.09 | | | | | $40.76 | |
| | | | | |
Total Return4,8 | | | | 7.46 | % | | | | 8.82 | % | | | | 35.43 | % | | | | 2.50 | % | | | | (3.01 | )% |
| | | | | |
Ratio of net expenses to average net assets9 | | | | 1.24 | % | | | | 1.41 | % | | | | 1.42 | % | | | | 1.41 | % | | | | 1.42 | % |
| | | | | |
Ratio of gross expenses to average net assets10 | | | | 1.34 | % | | | | 1.50 | % | | | | 1.51 | % | | | | 1.62 | % | | | | 1.61 | % |
| | | | | |
Ratio of net investment loss to average net assets4 | | | | (0.23 | )% | | | | (0.63 | )% | | | | (0.62 | )% | | | | (0.47 | )% | | | | (0.55 | )% |
| | | | | |
Portfolio turnover | | | | 79 | % | | | | 55 | % | | | | 58 | % | | | | 72 | % | | | | 89 | % |
| | | | | |
Net assets end of year (000’s) omitted | | | | $138,695 | | | | | $148,419 | | | | | $148,915 | | | | | $124,045 | | | | | $145,980 | |
| | | | | | | | | | | | | | | | | | | | | | | | | | |
27
| | | | |
| | | | AMG Managers Emerging Opportunities Fund Financial Highlights For a share outstanding throughout each fiscal year |
| | | | | | | | | | | | | | | | | | | | | | | | | |
| | | For the fiscal year ended October 31, |
| | | | | |
| Class I | | 2019 | | 2018 | | 2017 | | 20162 | | 2015 |
| | | | | |
Net Asset Value, Beginning of Year | | | | $49.19 | | | | | $50.60 | | | | | $37.40 | | | | | $41.05 | | | | | $47.32 | |
| | | | | |
Income (loss) from Investment Operations: | | | | | | | | | | | | | | | | | | | | | | | | | |
| | | | | |
Net investment income (loss)3,4 | | | | 0.01 | | | | | (0.20 | ) | | | | (0.16 | )5 | | | | (0.08 | )6 | | | | (0.13 | )7 |
| | | | | |
Net realized and unrealized gain (loss) on investments | | | | 1.76 | | | | | 4.50 | | | | | 13.51 | | | | | 1.02 | | | | | (0.80 | ) |
| | | | | |
Total income (loss) from investment operations | | | | 1.77 | | | | | 4.30 | | | | | 13.35 | | | | | 0.94 | | | | | (0.93 | ) |
| | | | | |
Less Distributions to Shareholders from: | | | | | | | | | | | | | | | | | | | | | | | | | |
| | | | | |
Net investment income | | | | — | | | | | — | | | | | — | | | | | (0.04 | ) | | | | — | |
| | | | | |
Net realized gain on investments | | | | (8.65 | ) | | | | (5.71 | ) | | | | (0.15 | ) | | | | (4.55 | ) | | | | (5.34 | ) |
| | | | | |
Total distributions to shareholders | | | | (8.65 | ) | | | | (5.71 | ) | | | | (0.15 | ) | | | | (4.59 | ) | | | | (5.34 | ) |
| | | | | |
Net Asset Value, End of Year | | | | $42.31 | | | | | $49.19 | | | | | $50.60 | | | | | $37.40 | | | | | $41.05 | |
| | | | | |
Total Return4,8 | | | | 7.72 | % | | | | 9.09 | % | | | | 35.80 | % | | | | 2.73 | % | | | | (2.76 | )% |
| | | | | |
Ratio of net expenses to average net assets9 | | | | 0.99 | % | | | | 1.16 | % | | | | 1.17 | % | | | | 1.16 | % | | | | 1.17 | % |
| | | | | |
Ratio of gross expenses to average net assets10 | | | | 1.09 | % | | | | 1.25 | % | | | | 1.26 | % | | | | 1.37 | % | | | | 1.36 | % |
| | | | | |
Ratio of net investment income (loss) to average net assets4 | | | | 0.02 | % | | | | (0.38 | )% | | | | (0.37 | )% | | | | (0.22 | )% | | | | (0.30 | )% |
| | | | | |
Portfolio turnover | | | | 79 | % | | | | 55 | % | | | | 58 | % | | | | 72 | % | | | | 89 | % |
| | | | | |
Net assets end of year (000’s) omitted | | | | $30,248 | | | | | $28,485 | | | | | $23,974 | | | | | $25,127 | | | | | $31,111 | |
| | | | | | | | | | | | | | | | | | | | | | | | | | |
| 1 | Effective February 27, 2017, Class S was renamed Class N. |
| 2 | Effective October 1, 2016, the Service Class and Institutional Class were renamed Class S and Class I, respectively. |
| 3 | Per share numbers have been calculated using average shares. |
| 4 | Total returns and net investment income (loss) would have been lower had certain expenses not been offset. |
| 5 | Includes non-recurring dividends. Without these dividends, net investment loss per share would have been $(0.34) and $(0.23) for Class N, and Class I, respectively. |
| 6 | Includes non-recurring dividends. Without these dividends, net investment loss per share would have been $(0.24) and $(0.15) for Class N and Class I shares, respectively. |
| 7 | Includes non-recurring dividends. Without these dividends, net investment loss per share would have been $(0.30) and $(0.19) for Class N and Class I shares, respectively. |
| 8 | The total return is calculated using the published Net Asset Value as of fiscal year end. |
| 9 | Includes reduction from broker recapture amounting to 0.02%, 0.02%, 0.01% and 0.02% for the fiscal years ended 2019, 2018, 2017 and 2016, respectively. |
| 10 | Excludes the impact of expense reimbursement or fee waivers and expense reductions such as brokerage credits, but includes expense repayments and non-reimbursable expenses, if any, such as interest, taxes, and extraordinary expenses. (See Note 1(c) and 2 in the Notes to Financial Statements.) |
28
|
Notes to Financial Statements October 31, 2019 |
1. ORGANIZATION AND SUMMARY OF SIGNIFICANT ACCOUNTING POLICIES
AMG Funds I (the “Trust”) is an open-end management investment company, organized as a Massachusetts business trust, and registered under the Investment Company Act of 1940, as amended (the “1940 Act”). Currently, the Trust consists of a number of different funds, each having distinct investment management objectives, strategies, risks, and policies. Included in this report are the AMG Frontier Small Cap Growth Fund (“Small Cap”) and AMG Managers Emerging Opportunities Fund (“Emerging Opportunities”), each a “Fund” and collectively, the “Funds”.
Each Fund offers different classes of shares. Both Funds offer Class N and Class I shares, and Small Cap offers Class Z shares. Each class represents an interest in the same assets of the respective Fund. Although all share classes generally have identical voting rights, each share class votes separately when required by law. Different share classes may have different net asset values per share to the extent the share classes pay different distribution amounts and/or the expenses of such share classes differ. Each share class has its own expense structure. Please refer to a current prospectus for additional information on each share class.
The Funds’ financial statements are prepared in accordance with accounting principles generally accepted in the United States of America (“U.S. GAAP”), including accounting and reporting guidance pursuant to Accounting Standards Codification Topic 946 applicable to investment companies. U.S. GAAP requires management to make estimates and assumptions that affect the reported amounts of assets and liabilities and disclosure of contingent assets and liabilities at the date of the financial statements and the reported amounts of income and expenses during the reporting period. Actual results could differ from those estimates and such differences could be material. The following is a summary of significant accounting policies followed by the Funds in the preparation of their financial statements:
a. VALUATION OF INVESTMENTS
Equity securities traded on a national securities exchange or reported on the NASDAQ national market system (“NMS”) are valued at the last quoted sales price on the primary exchange or, if applicable, the NASDAQ official closing price or the official closing price of the relevant exchange or, lacking any sales, at the last quoted bid price or the mean between the last quoted bid and ask prices (the “exchange mean price”). Equity securities traded in the over-the-counter market (other than NMS securities) are valued at the exchange mean price. Foreign equity securities (securities principally traded in markets other than U.S. markets) are valued at the official closing price on the primary exchange or, for markets that either do not offer an official closing price or where the official closing price may not be representative of the overall market, the last quoted sale price.
Fixed income securities purchased with a remaining maturity of 60 days or less are valued at amortized cost, provided that the amortized cost value is approximately the same as the fair value of the security valued without the use of amortized cost. Investments in other open-end registered investment companies are valued at their end of day net asset value per share.
The Funds’ portfolio investments are generally valued based on independent market quotations or prices or, if none, “evaluative” or other market based valuations provided by third party pricing services approved by the Board of Trustees of the Trust (the “Board”). Under certain circumstances, the value of certain Fund portfolio investments may be based on an evaluation of fair value,
pursuant to procedures established by and under the general supervision of the Board. The Valuation Committee, which is comprised of the Independent Trustees of the Board, and the Pricing Committee, which is comprised of representatives from AMG Funds LLC (the “Investment Manager”) are the committees appointed by the Board to make fair value determinations. Each Fund may use the fair value of a portfolio investment to calculate its net asset value (“NAV”) in the event that the market quotation, price or market based valuation for the portfolio investment is not readily available or otherwise not determinable pursuant to the Board’s valuation procedures, if the Investment Manager or the Pricing Committee believes the quotation, price or market based valuation to be unreliable, or in certain other circumstances. When determining the fair value of an investment, the Pricing Committee and, if required under the Trust’s securities valuation procedures, the Valuation Committee, seeks to determine the price that the Fund might reasonably expect to receive from current sale of that portfolio investment in an arms-length transaction. Fair value determinations shall be based upon consideration of all available facts and information, including, but not limited to (i) attributes specific to the investment; (ii) fundamental and analytical data relating to the investment; and (iii) the value of other comparable securities or relevant financial instruments, including derivative securities, traded on other markets or among dealers.
The values assigned to fair value portfolio investments are based on available information and do not necessarily represent amounts that might ultimately be realized in the future, since such amounts depend on future developments inherent in long-term investments. Because of the inherent uncertainty of valuation, those estimated values may differ significantly from the values that would have been used had a ready market for the investments existed, and the differences could be material. The Board will be presented with a quarterly report showing as of the most recent quarter end, all outstanding securities fair valued by the Funds, including a comparison with the prior quarter end and the percentage of the Funds that the security represents at each quarter end.
With respect to foreign equity securities and certain foreign fixed income securities, the Board has adopted a policy that securities held in the Funds that can be fair valued by the applicable fair value pricing service are fair valued on each business day provided that each individual price exceeds a pre-established confidence level.
U.S. GAAP defines fair value as the price that a fund would receive to sell an asset or pay to transfer a liability in an orderly transaction between market participants at the measurement date. U.S. GAAP also establishes a framework for measuring fair value, and a three level hierarchy for fair value measurements based upon the transparency of inputs to the valuation of an asset or liability. Inputs may be observable or unobservable and refer broadly to the assumptions that market participants would use in pricing the asset or liability. Observable inputs reflect the assumptions market participants would use in pricing the asset or liability based on market data obtained from sources independent of the Funds. Unobservable inputs reflect the Funds’ own assumptions about the assumptions that market participants would use in pricing the asset or liability developed based on the best information available in the circumstances. Each investment is assigned a level based upon the observability of the inputs which are significant to the overall valuation.
The three-tier hierarchy of inputs is summarized below:
Level 1 – inputs are quoted prices in active markets for identical investments (e.g., equity securities, open-end investment companies)
Level 2 – other observable inputs (including, but not limited to: quoted prices for similar assets or liabilities in markets that are active, quoted prices for identical or
29
|
Notes to Financial Statements(continued) |
similar assets or liabilities in markets that are not active, inputs other than quoted prices that are observable for the assets or liabilities (such as interest rates, yield curves, volatilities, prepayment speeds, loss severities, credit risks and default rates) or other market corroborated inputs) (e.g., debt securities, government securities, foreign currency exchange contracts, swaps, foreign securities utilizing international fair value pricing, fair valued securities with observable inputs)
Level 3 – inputs are significant unobservable inputs (including the Fund’s own assumptions used to determine the fair value of investments) (e.g., fair valued securities with unobservable inputs)
Changes in inputs or methodologies used for valuing investments may result in a transfer in or out of levels within the fair value hierarchy. The inputs or methodologies used for valuing investments may not necessarily be an indication of the risk associated with investing in those investments.
b. SECURITY TRANSACTIONS
Security transactions are accounted for as of trade date. Realized gains and losses on securities sold are determined on the basis of identified cost.
c. INVESTMENT INCOME AND EXPENSES
Dividend income is recorded on the ex-dividend date. Dividends from foreign securities are recorded on the ex-dividend date, and if after the fact, as soon as the Funds become aware of the ex-dividend date. Interest income, which includes amortization of premium and accretion of discount on debt securities, is accrued as earned. Dividend and interest income on foreign securities is recorded gross of any withholding tax. Non-cash dividends included in dividend income, if any, are reported at the fair market value of the securities received. Upon notification from issuers, distributions received from a real estate investment trust (“REIT”) may be redesignated as a reduction of cost of investments and/or realized gain. Other income and expenses are recorded on an accrual basis. Expenses that cannot be directly attributed to a Fund are apportioned among the funds in the Trust and other trusts or funds within the AMG Funds family of mutual funds (collectively the “AMG Funds Family”) based upon their relative average net assets or number of shareholders. Investment income, realized and unrealized capital gains and losses, the common expenses of each Fund, and certain fund level expense reductions, if any, are allocated on a pro-rata basis to each class based on the relative net assets of each class to the total net assets of each Fund.
Emerging Opportunities had certain portfolio trades directed to various brokers under a brokerage recapture program. Credits received from the brokerage recapture program are earned and paid on a monthly basis, and are recorded as expense offsets, which serve to reduce the Fund’s overall expense ratio. For the fiscal year ended October 31, 2019, the impact on the expenses and expense ratios, if any, were as follows: Emerging Opportunities - $38,332 or 0.02%.
d. DIVIDENDS AND DISTRIBUTIONS
Fund distributions resulting from either net investment income or realized net capital gains, if any, will normally be declared and paid at least annually in December. Distributions to shareholders are recorded on the ex-dividend date. Distributions are determined in accordance with federal income tax regulations, which may differ from net investment income and net realized capital gains for financial statement purposes (U.S. GAAP). Differences may be permanent or temporary. Permanent differences are reclassified among capital accounts in the financial statements to reflect their tax character. Permanent book and tax basis differences, if any, relating to shareholder distributions will result in reclassifications to paid-in capital. Temporary differences arise when certain items of income, expense and gain or loss are recognized in different periods for financial statement and tax purposes; these differences will reverse at some time in the future. Permanent differences are primarily due to current year write off of net operating loss and distributions received from investments in certain partnerships. Temporary differences are primarily due to distributions received from investments in certain partnerships, wash sales deferrals, and the deferral of qualified late year losses.
The tax character of distributions paid during the fiscal years ended October 31, 2019 and October 31, 2018 were as follows:
| | | | | | | | | | | | | | | | |
| | | Small Cap | | | Emerging Opportunities | |
| | | | |
Distributions paid from: | | | 2019 | | | | 2018 | | | | 2019 | | | | 2018 | |
| | | | |
Ordinary income | | | — | | | | — | | | | — | | | | — | |
| | | | |
Short-term capital gains | | | $2,889,333 | | | | $970,521 | | | | $5,241,238 | | | | $4,187,086 | |
| | | | |
Long-term capital gains | | | 3,096,189 | | | | 3,132,601 | | | | 26,341,201 | | | | 15,239,496 | |
| | | | |
| | | | | | | | | | | | | | | | |
| | | | |
| | | $5,985,522 | | | | $4,103,122 | | | | $31,582,439 | | | | $19,426,582 | |
| | | | | | | | | | | | | | | | |
As of October 31, 2019, the components of distributable earnings (excluding unrealized appreciation/depreciation) on a tax basis consisted of:
| | | | | | | | |
| | | Small Cap | | | Emerging Opportunities | |
Undistributed long-term capital gains | | | $1,549,696 | | | | $14,720,688 | |
| | |
Late-year loss deferral | | | 80,228 | | | | 283,083 | |
30
|
Notes to Financial Statements(continued) |
At October 31, 2019, the cost of investments and the aggregate gross unrealized appreciation and depreciation for federal income tax purposes were as follows:
| | | | | | | | | | | | | | | | |
| Fund | | Cost | | | Appreciation | | | Depreciation | | | Net | |
| | | | |
Small Cap | | | $18,116,998 | | | | $2,487,941 | | | | $(1,523,824 | ) | | | $964,117 | |
| | | | |
Emerging Opportunities | | | 136,900,474 | | | | 44,350,697 | | | | (9,103,607 | ) | | | 35,247,090 | |
e. FEDERAL TAXES
Each Fund currently qualifies as an investment company and intends to comply with the requirements under Subchapter M of the Internal Revenue Code of 1986, as amended, and to distribute substantially all of its taxable income and gains to its shareholders and to meet certain diversification and income requirements with respect to investment companies. Therefore, no provision for federal income or excise tax is included in the accompanying financial statements.
Additionally, based on each Fund’s understanding of the tax rules and rates related to income, gains and transactions for the foreign jurisdictions in which it invests, each Fund will provide for foreign taxes, and where appropriate, deferred foreign taxes.
Management has analyzed the Funds’ tax positions taken on federal income tax returns as of October 31, 2019, and for all open tax years (generally, the three prior taxable years), and has concluded that no provision for federal income tax is required in the Funds’ financial statements. Additionally, Management is not aware of any tax position for which it is reasonably possible that the total amounts of unrecognized tax benefits will change materially in the next twelve months.
f. CAPITAL LOSS CARRYOVERS AND DEFERRALS
As of October 31, 2019, the Funds had no capital loss carryovers for federal income tax purposes. Should the Funds incur net capital losses for the fiscal year ended October 31, 2020, such amounts may be used to offset future realized capital gains indefinitely, and retain their character as short-term and/or long-term.
g. CAPITAL STOCK
The Trust’s Declaration of Trust authorizes for each Fund the issuance of an unlimited number of shares of beneficial interest, without par value. Each Fund records sales and repurchases of its capital stock on the trade date.
For the fiscal years ended October 31, 2019 and October 31, 2018, the capital stock transactions by class for the Funds were as follows:
| | | | | | | | | | | | | | | | | | | | | | | | | | | | | | | | |
| | | Small Cap | | | Emerging Opportunities | |
| | | October 31, 2019 | | | October 31, 2018 | | | October 31, 2019 | | | October 31, 2018 | |
| | | Shares | | | Amount | | | Shares | | | Amount | | | Shares | | | Amount | | | Shares | | | Amount | |
| | | | | | | | |
Class N: | | | | | | | | | | | | | | | | | | | | | | | | | | | | | | | | |
| | | | | | | | |
Proceeds from sale of shares | | | 173,601 | | | | $1,420,613 | | | | 81,198 | | | | $1,027,555 | | | | 127,532 | | | | $5,229,560 | | | | 144,622 | | | | $7,315,263 | |
| | | | | | | | |
Reinvestment of distributions | | | 21,357 | | | | 137,752 | | | | 7,083 | | | | 74,443 | | | | 782,287 | | | | 26,323,951 | | | | 358,001 | | | | 16,528,925 | |
| | | | | | | | |
Cost of shares repurchased | | | (201,967) | | | | (1,626,392) | | | | (56,888) | | | | (708,083) | | | | (624,087) | | | | (24,430,038) | | | | (415,804) | | | | (20,639,398) | |
| | | | | | | | | | | | | | | | | | | | | | | | | | | | | | | | |
| | | | | | | | |
Net increase (decrease) | | | (7,009) | | | | $(68,027) | | | | 31,393 | | | | $393,915 | | | | 285,732 | | | | $7,123,473 | | | | 86,819 | | | | $3,204,790 | |
| | | | | | | | | | | | | | | | | | | | | | | | | | | | | | | | |
| | | | | | | | |
Class I: | | | | | | | | | | | | | | | | | | | | | | | | | | | | | | | | |
| | | | | | | | |
Proceeds from sale of shares | | | 136,557 | | | | $1,114,912 | | | | 381,012 | | | | $4,840,005 | | | | 180,337 | | | | $7,377,241 | | | | 144,567 | | | | $7,713,952 | |
| | | | | | | | |
Reinvestment of distributions | | | 531,454 | | | | 3,587,315 | | | | 222,143 | | | | 2,394,702 | | | | 139,442 | | | | 4,781,458 | | | | 55,932 | | | | 2,614,790 | |
| | | | | | | | |
Cost of shares repurchased | | | (338,119) | | | | (2,973,626) | | | | (460,240) | | | | (5,775,001) | | | | (183,973) | | | | (7,571,050) | | | | (95,234) | | | | (4,894,416) | |
| | | | | | | | | | | | | | | | | | | | | | | | | | | | | | | | |
| | | | | | | | |
Net increase | | | 329,892 | | | | $1,728,601 | | | | 142,915 | | | | $1,459,706 | | | | 135,806 | | | | $4,587,649 | | | | 105,265 | | | | $5,434,326 | |
| | | | | | | | | | | | | | | | | | | | | | | | | | | | | | | | |
| | | | | | | | |
Class Z: | | | | | | | | | | | | | | | | | | | | | | | | | | | | | | | | |
| | | | | | | | |
Proceeds from sale of shares | | | 86,958 | | | | $890,000 | | | | 14,195 | | | | $169,188 | | | | — | | | | — | | | | — | | | | — | |
| | | | | | | | |
Reinvestment of distributions | | | 319,631 | | | | 2,240,613 | | | | 145,679 | | | | 1,606,835 | | | | — | | | | — | | | | — | | | | — | |
| | | | | | | | |
Cost of shares repurchased | | | (105,930) | | | | (919,348) | | | | (175,189) | | | | (2,069,986) | | | | — | | | | — | | | | — | | | | — | |
| | | | | | | | | | | | | | | | | | | | | | | | | | | | | | | | |
| | | | | | | | |
Net increase (decrease) | | | 300,659 | | | | $2,211,265 | | | | (15,315) | | | | $(293,963) | | | | — | | | | — | | | | — | | | | — | |
| | | | | | | | | | | | | | | | | | | | | | | | | | | | | | | | |
At October 31, 2019, certain shareholders of record individually or collectively held greater than 10% of the net assets of the Funds as follows: Small Cap - one owns 19%. Transactions by this shareholder may have a material impact on the Fund.
31
|
Notes to Financial Statements(continued) |
h. REPURCHASE AGREEMENTS AND JOINT REPURCHASE AGREEMENTS
The Funds may enter into third-party repurchase agreements for temporary cash management purposes and third-party or bilateral joint repurchase agreements for reinvestment of cash collateral on securities lending transactions under the securities lending program offered by The Bank of New York Mellon (“BNYM”) (the “Program”) (collectively, “Repurchase Agreements”). The value of the underlying collateral, including accrued interest, must equal or exceed the value of the Repurchase Agreements during the term of the agreement. For joint repurchase agreements, the Funds participate on a pro rata basis with other clients of BNYM in its share of the underlying collateral under such joint repurchase agreements and in its share of proceeds from any repurchase or other disposition of the underlying collateral. The underlying collateral for all Repurchase Agreements is held in safekeeping by the Funds’ custodian or at the Federal Reserve Bank. If the seller defaults and the value of the collateral declines, or if bankruptcy proceedings commence with respect to the seller of the security, realization of the collateral by the Funds may be delayed or limited. Pursuant to the Program, the Funds are indemnified for such losses by BNYM on joint repurchase agreements.
At October 31, 2019, the market value of Repurchase Agreements outstanding for Small Cap and Emerging Opportunities were $785,379 and $3,939,846, respectively.
2. AGREEMENTS AND TRANSACTIONS WITH AFFILIATES
For each of the Funds, the Trust has entered into an investment advisory agreement under which the Investment Manager, a subsidiary and the U.S. retail distribution arm of Affiliated Managers Group, Inc. (“AMG”), serves as investment manager to the Funds and is responsible for the Funds’ overall administration and operations. The Investment Manager selects one or more subadvisers for the Funds (subject to Board approval) and monitors each subadviser’s investment performance, security holdings and investment strategies. Each Fund’s investment portfolio is managed by one or more portfolio managers who serve pursuant to a subadvisory agreement with the Investment Manager. Small Cap is managed by Frontier Capital Management Co., LLC (“Frontier”). AMG indirectly owns a majority interest in Frontier. Emerging Opportunities is managed by Next Century Growth Investors, LLC, RBC Global Asset Management (U.S.) Inc., and WEDGE Capital Management LLP. Effective March 19, 2019, Lord, Abbett & Co. LLC no longer manages a portion of the Emerging Opportunities portfolio of investments.
Investment management fees are paid directly by the Funds to the Investment Manager based on average daily net assets. For the fiscal year ended October 31, 2019, the Funds’ investment management fees were paid at the following annual rate of each Fund’s respective average daily net assets:
| | | | |
| |
Small Cap | | | 0.70% | |
| |
Emerging Opportunities | | | 0.74% | 1 |
| 1 | Prior to March 1, 2019, the annual rate for the investment management fees for Emerging Opportunities was 1.00% of the Fund’s average daily net assets. |
The Investment Manager has contractually agreed, through at least March 1, 2020, to waive management fees and/or pay or reimburse fund expenses in order to limit total annual Fund operating expenses after fee waiver and expense reimbursements (exclusive of taxes, interest (including interest incurred in connection with bank and custody overdrafts, and in connection with securities sold short), shareholder servicing fees, distribution and service (12b-1) fees, brokerage commissions and other transaction costs, dividends payable with
respect to securities sold short, acquired fund fees and expenses and extraordinary expenses) of Small Cap and Emerging Opportunities to 0.90% and 0.94%, respectively, of each Fund’s average daily net assets (this annual rate or such other annual rate that may be in effect from time to time, the “Expense Cap”), subject to later reimbursement by the Funds in certain circumstances. Prior to March 1, 2019, the Emerging Opportunities contractual expense limitation was 1.18%.
The contractual expense limitation may only be terminated in the event the Investment Manager or a successor ceases to be the investment manager of the Fund or a successor fund, by mutual agreement between the Investment Manager and the Board, or in the event of the Fund’s liquidation unless the Fund is reorganized or is a party to a merger in which the surviving entity is successor to the accounting and performance information of the Fund.
In general, for a period of up to 36 months, the Investment Manager may recover from each Fund fees waived and expenses paid pursuant to this contractual agreement, provided that such repayment would not cause a Fund’s total annual operating expenses after fee waiver and expense reimbursements (exclusive of the items noted in the parenthetical above) to exceed the contractual expense limitation amount.
At October 31, 2019, the Funds’ expiration of reimbursements subject to recoupment is as follows:
| | | | | | | | |
Expiration Period | | Small Cap | | | Emerging Opportunities | |
| | |
Less than 1 year | | | $106,586 | | | | $132,090 | |
| | |
1-2 years | | | 105,483 | | | | 130,107 | |
| | |
2-3 years | | | 121,636 | | | | 131,263 | |
| | | | | | | | |
| | |
Total | | | $333,705 | | | | $393,460 | |
| | | | | | | | |
The Trust, on behalf of the Funds, has entered into an amended and restated Administration Agreement under which the Investment Manager serves as the Funds’ administrator (the “Administrator”) and is responsible for all non-portfolio management aspects of managing the Funds’ operations, including administration and shareholder services to each Fund. Each Fund pays a fee to the Administrator at the rate of 0.15% per annum of the Fund’s average daily net assets for this service.
The Funds are distributed by AMG Distributors, Inc. (the “Distributor”), a wholly-owned subsidiary of the Investment Manager. The Distributor serves as the distributor and underwriter for each Fund and is a registered broker-dealer and member of the Financial Industry Regulatory Authority, Inc. (“FINRA”). Shares of each Fund will be continuously offered and will be sold directly to prospective purchasers and through brokers, dealers or other financial intermediaries who have executed selling agreements with the Distributor. Generally the Distributor bears all or a portion of the expenses of providing services pursuant to the distribution agreement, including the payment of the expenses relating to the distribution of prospectuses for sales purposes and any advertising or sales literature.
Small Cap has adopted a distribution and service plan (the “Plan”) with respect to the Class N shares, in accordance with the requirements of Rule 12b-1 under the 1940 Act and the requirements of the applicable rules of FINRA regarding asset-based sales charges. Pursuant to the Plan, Small Cap may make payments to the Distributor for its expenditures in financing any activity primarily intended to
32
|
Notes to Financial Statements(continued) |
result in the sale of the Fund’s Class N shares and for maintenance and personal service provided to existing shareholders of that class. The Plan authorized payments to the Distributor up to 0.25% annually of the Fund’s average daily net assets attributable to the Class N shares.
For Class N of Small Cap and Emerging Opportunities, and for Class I of Small Cap, the Board has approved reimbursement payments to the Investment Manager for shareholder servicing expenses (“shareholder servicing fees”) incurred. Shareholder servicing fees include payments to financial intermediaries, such as broker-dealers (including fund supermarket platforms), banks, and trust companies who provide shareholder recordkeeping, account servicing and other services. The Class N shares of Small Cap and Emerging Opportunities and Class I shares of Small Cap may reimburse the Investment Manager for the actual amount incurred up to a maximum annual rate of each Class’s average daily net assets as shown in the table below.
The impact on the annualized expense ratios for the fiscal year ended October 31, 2019, were as follows:
| | | | | | | | |
Fund | | Maximum Annual
Amount
Approved | | | Actual
Amount
Incurred | |
| | |
Small Cap | | | | | | | | |
| | |
Class N | | | 0.15% | | | | 0.15% | |
| | |
Class I | | | 0.15% | | | | 0.06% | |
| | |
Emerging Opportunities | | | | | | | | |
| | |
Class N | | | 0.25% | | | | 0.25% | |
The Board provides supervision of the affairs of the Trust and other trusts within the AMG Funds family. The Trustees of the Trust who are not affiliated with the Investment Manager receive an annual retainer and per meeting fees for regular, special and telephonic meetings, and they are reimbursed for out-of-pocket expenses incurred while carrying out their duties as Board members. The Chairman of the Board and the Audit Committee Chair receive additional annual retainers. Certain Trustees and Officers of the Funds are Officers and/or Directors of the Investment Manager, AMG and/or the Distributor.
The Securities and Exchange Commission (the “SEC”) granted an exemptive order that permits the Funds to lend and borrow money for certain temporary purposes directly to and from other eligible funds in the AMG Funds family. Participation in this interfund lending program is voluntary for both the borrowing and lending funds, and an interfund loan is only made if it benefits each participating fund. The Administrator manages the program according to procedures approved by the Board, and the Board monitors the operation of the program. An interfund loan must comply with certain conditions set out in the exemptive order, which are designed to assure fairness and protect all participating funds. For the fiscal year ended October 31, 2019, Small Cap borrowed a maximum of $350,968 for five days paying interest of $138. The interest expense amount is included in the Statement of Operations as miscellaneous expense. Emerging Opportunities neither borrowed from nor lent to other funds in the AMG Funds family. At October 31, 2019, the Funds had no interfund loans outstanding.
For the fiscal year ended October 31, 2019, Emerging Opportunities executed security transactions with other funds affiliated with Lord, Abbett & Co. LLC. Each of the transactions were executed at the closing price of the security transacted and with no commissions under Rule 17a-7 procedures approved by the Board. The
amounts purchased and sold during the fiscal year ended October 31, 2019, are reflected in the following chart:
| | | | | | |
| | | Number of
Transactions | | Total
Quantity | | Cost/Proceeds |
| | | |
Purchases | | 2 | | 17,208 | | $351,687 |
| | | |
Sales* | | 2 | | 17,532 | | 1,047,929 |
| * | Realized gain was $637,391. |
3. PURCHASES AND SALES OF SECURITIES
Purchases and sales of securities (excluding short-term securities and U.S. Government Obligations) for the fiscal year ended October 31, 2019, were as follows:
| | | | | | | | |
| | | Long Term Securities | |
| | |
| Fund | | Purchases | | | Sales | |
| | |
Small Cap | | | $41,784,908 | | | | $43,514,603 | |
| | |
Emerging Opportunities | | | 129,710,464 | | | | 149,473,918 | |
The Funds had no purchases or sales of U.S. Government Obligations during the fiscal year ended October 31, 2019.
4. PORTFOLIO SECURITIES LOANED
The Funds participate in the Program providing for the lending of securities to qualified borrowers. Securities lending income includes earnings of such temporary cash investments, plus or minus any rebate to a borrower. These earnings (after any rebate) are then divided between BNYM, as a fee for its services under the Program, and the Funds, according to agreed-upon rates. Collateral on all securities loaned is accepted in cash or U.S. Government and Agency Obligations. Collateral is maintained at a minimum level of 102% (105% in the case of certain foreign securities) of the market value, plus interest, if applicable, of investments on loan. It is the Funds’ policy to obtain additional collateral from or return excess collateral to the borrower by the end of the next business day, following the valuation date of the securities loaned. Therefore, the value of the collateral held may be temporarily less than the value of the securities on loan. Lending securities entails a risk of loss to the Funds if and to the extent that the market value of the securities loaned were to increase and the borrower did not increase the collateral accordingly, and the borrower fails to return the securities. Under the terms of the Program, the Funds are indemnified for such losses by BNYM. Cash collateral is held in separate omnibus accounts managed by BNYM, who is authorized to exclusively enter into joint repurchase agreements for that cash collateral. Securities collateral is held in separate omnibus accounts managed by BNYM that cannot be sold or pledged. BNYM bears the risk of any deficiency in the amount of the cash collateral available for return to the borrower due to any loss on the collateral invested.
33
|
Notes to Financial Statements(continued) |
The value of securities loaned on positions held, and cash and securities collateral received at October 31, 2019, were as follows:
| | | | | | | | | | | | | | | | |
Fund | | Securities
Loaned | | | Cash
Collateral
Received | | | Securities
Collateral
Received | | | Total
Collateral
Received | |
| | | | |
Small Cap | | | $4,400,170 | | | | $785,379 | | | | $3,613,953 | | | | $4,399,332 | |
| | | | |
Emerging Opportunities | | | 21,076,086 | | | | 3,939,846 | | | | 18,059,376 | | | | 21,999,222 | |
The following table summarizes the securities received as collateral for securities lending at October 31, 2019:
| | | | | | | | |
Fund | | Collateral
Type | | Coupon
Range | | Maturity Date Range | |
| | | |
Small Cap | | U.S. Treasury
Obligations | | 0.000%-8.750% | | | 11/14/19-02/15/49 | |
| | | |
Emerging Opportunities | | U.S. Treasury
Obligations | | 0.000%-8.750% | | | 11/15/19-02/15/49 | |
5. COMMITMENTS AND CONTINGENCIES
Under the Trust’s organizational documents, its trustees and officers are indemnified against certain liabilities arising out of the performance of their duties to the Trust. In addition, in the normal course of business, the Funds may enter into contracts and agreements that contain a variety of representations and warranties, which provide general indemnifications. The maximum exposure to the Funds under these arrangements is unknown, as this would involve future claims that may be made against a Fund that have not yet occurred. However, based on experience, the Funds had no prior claims or losses and expect the risks of loss to be remote.
6. MASTER NETTING AGREEMENTS
The Funds may enter into master netting agreements with their counterparties for the securities lending program and Repurchase Agreements, which provide the right, in the event of default (including bankruptcy or insolvency) for the non-defaulting party to liquidate the collateral and calculate net exposure to the defaulting party or request additional collateral. For financial reporting purposes, the Funds do not offset financial assets and financial liabilities that are subject to master netting agreements in the Statement of Assets and Liabilities. For securities lending transactions, see Note 4.
The following table is a summary of the Funds’ open Repurchase Agreements that are subject to a master netting agreement as of October 31, 2019:
| | | | | | | | | | | | | | | | | | | | |
| | | | | | Gross Amount Not Offset in the
Statement of Assets and Liabilities | | | | | | | |
| Fund | | Gross Amounts of
Assets Presented in
the Statement of
Assets and Liabilities | | | Offset
Amount | | | Net Asset Balance | | | Collateral
Received | | | Net
Amount | |
| | | | | | | | | | | | | | | | | | | | |
| | | | | |
Small Cap | | | | | | | | | | | | | | | | | | | | |
| | | | | |
Citigroup Global Markets, Inc. | | | $785,379 | | | | — | | | | $785,379 | | | | $785,379 | | | | — | |
| | | | | |
Emerging Opportunities | | | | | | | | | | | | | | | | | | | | |
| | | | | |
Cantor Fitzgerald Securities, Inc. | | | $1,000,000 | | | | — | | | | $1,000,000 | | | | $1,000,000 | | | | — | |
| | | | | |
Citigroup Global Markets, Inc. | | | 1,000,000 | | | | — | | | | 1,000,000 | | | | 1,000,000 | | | | — | |
| | | | | |
Industrial and Commercial Bank of China Financial Services LLC | | | 939,846 | | | | — | | | | 939,846 | | | | 939,846 | | | | — | |
| | | | | |
MUFG Securities America, Inc. | | | 1,000,000 | | | | — | | | | 1,000,000 | | | | 1,000,000 | | | | — | |
| | | | | |
| | | | | | | | | | | | | | | | | | | | |
| | | | | |
Total | | | $3,939,846 | | | | — | | | | $3,939,846 | | | | $3,939,846 | | | | — | |
| | | | | | | | | | | | | | | | | | | | |
7. SUBSEQUENT EVENTS
The Funds have determined that no material events or transactions occurred through the issuance date of the Funds’ financial statements which require an additional disclosure in or adjustment of the Funds’ financial statements.
34
|
Report of Independent Registered Public Accounting Firm |
| | |
| TO THE BOARD OF TRUSTEES OF AMG FUNDS I AND SHAREHOLDERS OF AMG FRONTIER SMALL CAP GROWTH FUND AND AMG MANAGERS EMERGING OPPORTUNITIES FUND: | | |
| |
| Opinions on the Financial Statements | | |
| |
| We have audited the accompanying statements of assets and liabilities, including the schedules of portfolio investments, of AMG Frontier Small Cap Growth Fund and AMG Managers Emerging Opportunities Fund (two of the funds constituting AMG Funds I, hereafter collectively referred to as the “Funds”) as of October 31, 2019, the related statements of operations for the year ended October 31, 2019, the statements of changes in net assets for each of the two years in the period ended October 31, 2019, including the related notes, and the financial highlights for each of the five years in the period ended October 31, 2019 (collectively referred to as the “financial statements”). In our opinion, the financial statements present fairly, in all material respects, the financial position of each of the Funds as of October 31, 2019, the results of each of their operations for the year then ended, the changes in each of their net assets for each of the two years in the period ended October 31, 2019 and each of the financial highlights for each of the five years in the period ended October 31, 2019 in conformity with accounting principles generally accepted in the United States of America. | | |
| |
| Basis for Opinions | | |
| |
| These financial statements are the responsibility of the Funds’ management. Our responsibility is to express an opinion on the Funds’ financial statements based on our audits. We are a public accounting firm registered with the Public Company Accounting Oversight Board (United States) (“PCAOB”) and are required to be independent with respect to the Funds in accordance with the U.S. federal securities laws and the applicable rules and regulations of the Securities and Exchange Commission and the PCAOB. | | |
| |
| We conducted our audits of these financial statements in accordance with the standards of the PCAOB. Those standards require that we plan and perform the audit to obtain reasonable assurance about whether the financial statements are free of material misstatement, whether due to error or fraud. | | |
| |
| Our audits included performing procedures to assess the risks of material misstatement of the financial statements, whether due to error or fraud, and performing procedures that respond to those risks. Such procedures included examining, on a test basis, evidence regarding the amounts and disclosures in the financial statements. Our audits also included evaluating the accounting principles used and significant estimates made by management, as well as evaluating the overall presentation of the financial statements. Our procedures included confirmation of securities owned as of October 31, 2019 by correspondence with the custodian, transfer agent and brokers; when replies were not received from brokers, we performed other auditing procedures. We believe that our audits provide a reasonable basis for our opinions. | | |
| |
| PricewaterhouseCoopers LLP | | |
| Boston, Massachusetts | | |
| December 20, 2019 | | |
| |
| We have served as the auditor of one or more investment companies in the AMG Funds Family since 1993. | | |
35
TAX INFORMATION
The AMG Frontier Small Cap Growth Fund and AMG Managers Emerging Opportunities Fund each hereby designates the maximum amount allowable of its net taxable income as qualified dividends as provided in the Jobs and Growth Tax Relief Reconciliation Act of 2003. The 2018/2019 Form 1099-DIV you receive for each Fund will show the tax status of all distributions paid to you during the year.
Pursuant to section 852 of the Internal Revenue Code, AMG Frontier Small Cap Growth Fund and AMG Managers Emerging Opportunities Fund each hereby designates as a capital gain distribution with respect to the taxable period ended October 31, 2019, $3,096,189 and $26,341,201, respectively, or if subsequently determined to be different, the net capital gains of such period.
36
| | |
| | AMG Funds Trustees and Officers |
| | | | | | | | |
| The Trustees and Officers of the Trust, their business addresses, principal occupations for the past five years and ages are listed below. The Trustees provide broad supervision over the affairs of the Trust and the Funds. The Trustees are experienced executives who meet periodically throughout the year to oversee the Funds’ activities, review contractual arrangements with companies that provide services to the Funds, and | | | | review the Funds’ performance. Unless otherwise noted, the address of each Trustee or Officer is the address of the Trust: 600 Steamboat Road, Suite 300, Greenwich, Connecticut 06830. There is no stated term of office for Trustees. Trustees serve until their resignation, retirement or removal in | | | | accordance with the Trust’s organizational documents and policies adopted by the Board from time to time. The Chairman of the Trustees, President, Treasurer and Secretary of the Trust are elected by the Trustees annually. Other officers hold office at the pleasure of the Trustees. |
Independent Trustees
The following Trustees are not “interested persons” of the Trust within the meaning of the 1940 Act:
| | |
Number of Funds Overseen in Fund Complex | | Name, Age, Principal Occupation(s) During Past 5 Years and Other Directorships Held by Trustee |
| | |
| • Trustee since 2012 | | Bruce B. Bingham, 71 |
• Oversees 49 Funds in Fund Complex | | Partner, Hamilton Partners (real estate development firm) (1987-Present); Director of The Yacktman Funds (2000-2012). |
| | |
| • Trustee since 2000 | | Edward J. Kaier, 74 |
• Oversees 49 Funds in Fund Complex | | Attorney at Law and Partner, Teeters Harvey Marrone & Kaier LLP (2007-Present); Attorney at Law and Partner, Hepburn Willcox Hamilton & Putnam, LLP (1977-2007); Trustee of Third Avenue Trust (2002-2019); Trustee of Third Avenue Variable Trust (2002-2019). |
| | |
| • Trustee since 2013 | | Kurt A. Keilhacker, 56 |
| • Oversees 52 Funds in Fund Complex | | Managing Partner, TechFund Capital (1997-Present); Managing Partner, TechFund Europe (2000-Present); Board Member, 6wind SA, (2002-Present); Managing Partner, Elementum Ventures (2013-Present); Director, MetricStory, Inc. (2017-Present); Trustee, Wheaton College (2018-Present); Trustee, Gordon College (2001-2016). |
| | |
| • Trustee since 2000 | | Steven J. Paggioli, 69 |
| • Oversees 49 Funds in Fund Complex | | Independent Consultant (2002-Present); Trustee, Professionally Managed Portfolios (28 portfolios); Advisory Board Member, Sustainable Growth Advisors, LP; Independent Director, Muzinich BDC, Inc. (business development company) (2019-Present); Independent Director, Chase Investment Counsel (2008–2019); Executive Vice President, Secretary and Director, Investment Company Administration, LLC (1990-2001). |
| | |
| • Trustee since 2013 | | Richard F. Powers III, 73 |
| • Oversees 49 Funds in Fund Complex | | Adjunct Professor, U.S. Naval War College (2016-Present); Adjunct Professor, Boston College (2010-2013); President and CEO of Van Kampen Investments Inc. (1998-2003). |
| | |
| • Independent Chairman | | Eric Rakowski, 61 |
• Trustee since 2000 • Oversees 52 Funds in Fund Complex | | Professor of Law, University of California at Berkeley School of Law - Boalt Hall (1990-Present); Director of Harding, Loevner Funds, Inc. (9 portfolios); Trustee of Third Avenue Trust (2002-2019); Trustee of Third Avenue Variable Trust (2002-2019). |
| | |
| • Trustee since 2013 | | Victoria L. Sassine, 54 |
| • Oversees 52 Funds in Fund Complex | | Adjunct Professor, Babson College (2007–Present); Director, Board of Directors, PRG Group (2017-Present); CEO, Founder, Scale Smarter Partners, LLC (2018-Present); Chairperson, Board of Directors, Business Management Associates (2018-Present). |
| | |
| • Trustee since 2000 | | Thomas R. Schneeweis, 72 |
| • Oversees 49 Funds in Fund Complex | | Professor Emeritus, University of Massachusetts (2013-Present); President, TRS Associates (1982-Present); Board Member, Chartered Alternative Investment Association (“CAIA”) (2002-Present); Director, Institute for Global Asset and Risk Management (Education) (2010-Present); Co-Owner, Quantitative Investment Technologies (2014-Present); Director of Research, Yes Wealth Management (2018-Present); Partner, S Capital Wealth Advisors (2015-2018); Partner, S Capital Management, LLC (2007-2015); President, Alternative Investment Analytics, LLC, (formerly Schneeweis Partners, LLC) (2001-2013). |
37
| | |
| | AMG Funds Trustees and Officers(continued) |
Interested Trustees
Each Trustee in the following table is an “interested person” of the Trust within the meaning of the 1940 Act. Ms. Carsman is an interested person of the Trust within the meaning of the 1940 Act by virtue of her position with, and interest in securities of, AMG.
| | |
Number of Funds Overseen in Fund Complex | | Name, Age, Principal Occupation(s) During Past 5 Years and Other Directorships Held by Trustee |
| |
| • Trustee since 2011 | | Christine C. Carsman, 67 |
• Oversees 52 Funds in Fund Complex | | Senior Policy Advisor, Affiliated Managers Group, Inc. (2019-Present); Director of Harding, Loevner Funds, Inc. (9 portfolios); Executive Vice President, Deputy General Counsel and Chief Regulatory Counsel, Affiliated Managers Group, Inc. (2017-2018); Director (2010-2018) and Chair of the Board of Directors (2015-2018), AMG Funds plc; Senior Vice President and Deputy General Counsel, Affiliated Managers Group, Inc. (2011-2016); Senior Vice President and Chief Regulatory Counsel, Affiliated Managers Group, Inc. (2007-2011); Vice President and Chief Regulatory Counsel, Affiliated Managers Group, Inc. (2004-2007); Secretary and Chief Legal Officer, AMG Funds, AMG Funds I, AMG Funds II and AMG Funds III (2004-2011); Senior Counsel, Vice President and Director of Operational Risk Management and Compliance, Wellington Management Company, LLP (1995-2004). |
|
Officers |
| |
Position(s) Held with Fund and Length of Time Served | | Name, Age, Principal Occupation(s) During Past 5 Years |
| |
| • President since 2018 | | Keitha L. Kinne, 61 |
• Principal Executive Officer since 2018 • Chief Executive Officer since 2018 • Chief Operating Officer since 2007 | | Chief Operating Officer, AMG Funds LLC (2007-Present); Chief Investment Officer, AMG Funds LLC (2008-Present); President and Principal, AMG Distributors, Inc. (2018-Present); Chief Operating Officer, AMG Distributors, Inc. (2007-Present); President, Chief Executive Officer and Principal Executive Officer, AMG Funds, AMG Funds I, AMG Funds II, AMG Funds III and AMG Funds IV (2018-Present); Chief Operating Officer, AMG Funds, AMG Funds I, AMG Funds II, and AMG Funds III (2007-Present); Chief Operating Officer, AMG Funds IV (2016-Present); Chief Operating Officer and Chief Investment Officer, Aston Asset Management, LLC (2016); President and Principal Executive Officer, AMG Funds, AMG Funds I, AMG Funds II and AMG Funds III (2012-2014); Managing Partner, AMG Funds LLC (2007-2014); President and Principal, AMG Distributors, Inc. (2012-2014); Managing Director, Legg Mason & Co., LLC (2006-2007); Managing Director, Citigroup Asset Management (2004-2006). |
| |
| • Secretary since 2015 | | Mark J. Duggan, 54 |
| • Chief Legal Officer since 2015 | | Senior Vice President and Senior Counsel, AMG Funds LLC (2015-Present); Secretary and Chief Legal Officer, AMG Funds, AMG Funds I, AMG Funds II, AMG Funds III and AMG Funds IV (2015-Present); Attorney, K&L Gates, LLP (2009-2015). |
| |
| • Chief Financial Officer since | | Thomas G. Disbrow, 53 |
2017 • Treasurer since 2017 • Principal Financial Officer since 2017 • Principal Accounting Officer since 2017 | | Vice President, Mutual Fund Treasurer & CFO, AMG Funds, AMG Funds LLC (2017-Present); Chief Financial Officer, Principal Financial Officer, Treasurer and Principal Accounting Officer, AMG Funds, AMG Funds I, AMG Funds II, AMG Funds III and AMG Funds IV (2017-Present); Managing Director - Global Head of Traditional Funds Product Control, UBS Asset Management (Americas), Inc. (2015-2017); Managing Director - Head of North American Funds Treasury, UBS Asset Management (Americas), Inc. (2011-2015). |
| |
| • Deputy Treasurer since 2017 | | John A. Starace, 49 |
| | | Director, Mutual Fund Accounting, AMG Funds LLC (2017-Present); Vice President, Deputy Treasurer of Mutual Funds Services, AMG Funds LLC (2014-2017); Deputy Treasurer, AMG Funds, AMG Funds I, AMG Funds II, AMG Funds III and AMG Funds IV (2017-Present); Vice President, Citi Hedge Fund Services (2010-2014); Audit Senior Manager (2005-2010) and Audit Manager (2001-2005), Deloitte & Touche LLP. |
| |
| • Chief Compliance Officer since | | Patrick J. Spellman, 45 |
| 2019 | | Vice President, Chief Compliance Officer, AMG Funds LLC (2017-Present); Chief Compliance Officer and Sarbanes-Oxley Code of Ethics Compliance Officer, AMG Funds, AMG Funds I, AMG Funds II, AMG Funds III and AMG Funds IV (2019-Present); Chief Compliance Officer, AMG Distributors, Inc., (2010-Present) Senior Vice President, Chief Compliance Officer, AMG Funds LLC (2011-2017); Anti-Money Laundering Compliance Officer, AMG Funds, AMG Funds I, AMG Funds II, and AMG Funds III (2014-2019); Anti-Money Laundering Officer, AMG Funds IV, (2016-2019); Compliance Manager, Legal and Compliance, Affiliated Managers Group, Inc. (2005-2011). |
| |
| • Assistant Secretary since 2016 | | Maureen A. Meredith, 34 |
| | | Vice President, Counsel, AMG Funds LLC (2019-Present); Director, Counsel, AMG Funds LLC (2017-2018); Vice President, Counsel, AMG Funds LLC (2015-2017); Assistant Secretary, AMG Funds, AMG Funds I, AMG Funds II, AMG Funds III and AMG Funds IV (2016-Present); Associate, Ropes & Gray LLP (2011-2015); Law Fellow, Massachusetts Appleseed Center for Law and Justice (2010-2011). |
| |
| • Anti-Money Laundering | | Hector D. Roman, 41 |
| Compliance Officer since 2019 | | Manager, Legal and Compliance, AMG Funds LLC (2017-Present); Director of Compliance, Morgan Stanley Investment Management (2015-2017); Senior Advisory, PricewaterhouseCoopers LLP (2014-2015); Risk Manager, Barclays Investment Bank (2008-2014); Anti-Money Laundering Compliance Officer, AMG Funds, AMG Funds I, AMG Funds II, AMG Funds III and AMG Funds IV (2019-Present). |
38
|
Annual Renewal of Investment Management and Subadvisory Agreements |
| | | | | | | | |
AMG Managers Emerging Opportunities Fund and AMG Frontier Small Cap Growth Fund: Approval of Investment Management Agreement and Subadvisory Agreements on June 27, 2019 At an in-person meeting held on June 27, 2019, the Board of Trustees (the “Board” or the “Trustees”), and separately a majority of the Trustees who are not “interested persons” of AMG Funds I (the “Trust”) (the “Independent Trustees”), approved (i) the Investment Management Agreement, as amended pursuant to letter agreements at any time prior to the date of the meeting, with AMG Funds LLC (the “Investment Manager”) for each of AMG Managers Emerging Opportunities Fund and AMG Frontier Small Cap Growth Fund (each, a “Fund,” and collectively, the “Funds”) and separately each of Amendment No. 1 thereto dated July 1, 2015, and Amendment No. 2 thereto dated October 1, 2016 (collectively, the “Investment Management Agreement”) and (ii) the Subadvisory Agreement, as amended at any time prior to the date of the meeting, with the applicable Subadviser for each Fund (collectively, the “Subadvisory Agreements”). The Independent Trustees were separately represented by independent legal counsel in connection with their consideration of the approval of these agreements. In considering the Investment Management Agreement and the Subadvisory Agreements, the Trustees reviewed a variety of materials relating to each Fund, the Investment Manager and each Subadviser, including comparative performance, fee and expense information for an appropriate peer group of similar mutual funds for each Fund (each, a “Peer Group”), performance information for the relevant benchmark index for each Fund (each, a “Fund Benchmark”) and, with respect to each applicable Subadviser, comparative performance information for an appropriate peer group of managed accounts, and other information provided to them on a periodic basis throughout the year, as well as information provided in connection with their meeting held on June 27, 2019, regarding the nature, extent and quality of services provided by the Investment Manager and the Subadvisers under their respective agreements and other relevant matters. Prior to voting, the Independent Trustees: (a) reviewed the foregoing information with their independent legal counsel; (b) received materials from their independent legal counsel discussing the legal standards applicable to their consideration of the Investment Management Agreement and Subadvisory Agreements; and (c) met with their independent legal counsel in private sessions at which no representatives of management were present. | | | | NATURE, EXTENT AND QUALITY OF SERVICES In considering the nature, extent and quality of the services provided by the Investment Manager, the Trustees reviewed information relating to the Investment Manager’s operations and personnel. Among other things, the Investment Manager provided financial information, information about its supervisory and professional staff and descriptions of its organizational and management structure. The Trustees also took into account information provided periodically throughout the previous year by the Investment Manager in Board meetings relating to the performance of its duties with respect to the Funds and the Trustees’ knowledge of the Investment Manager’s management and the quality of the performance of the Investment Manager’s duties under the Investment Management Agreement and Administration Agreement. In the course of their deliberations regarding the Investment Manager, the Trustees evaluated, among other things: (a) the extent and quality of the Investment Manager’s oversight of the operation and management of the Funds; (b) the quality of the search, selection and monitoring services performed by the Investment Manager in overseeing the portfolio management responsibilities of the Subadvisers; (c) the Investment Manager’s ability to supervise the Funds’ other service providers; and (d) the Investment Manager’s compliance program. The Trustees also took into account that, in performing its functions under the Investment Management Agreement and supervising each Subadviser, the Investment Manager: performs periodic detailed analyses and reviews of the performance by each Subadviser of its obligations to a Fund, including without limitation, analysis and review of portfolio and other compliance matters and review of each Subadviser’s investment performance with respect to a Fund; prepares and presents periodic reports to the Board regarding the investment performance of each Subadviser and other information regarding each Subadviser, at such times and in such forms as the Board may reasonably request; reviews and considers any changes in the personnel of each Subadviser responsible for performing the Subadviser’s obligations and makes appropriate reports to the Board; reviews and considers any changes in the ownership or senior management of each Subadviser and makes appropriate reports to the Board; performs periodic in-person or telephonic diligence meetings, including with respect to compliance matters, with representatives of each Subadviser; assists the Board and management of the Trust in developing and reviewing information with respect to the initial approval of each Subadvisory Agreement and annual consideration of | | | | each Subadvisory Agreement thereafter; prepares recommendations with respect to the continued retention of any Subadviser or the replacement of any Subadviser, including at the request of the Board; identifies potential successors to, or replacements of, any Subadviser or potential additional subadvisers, including performing appropriate due diligence, and developing and presenting to the Board a recommendation as to any such successor, replacement, or additional subadviser, including at the request of the Board; designates and compensates from its own resources such personnel as the Investment Manager may consider necessary or appropriate to the performance of its services; and performs such other review and reporting functions as the Board shall reasonably request consistent with the Investment Management Agreement and applicable law. With respect to AMG Frontier Small Cap Growth Fund, the Trustees noted the affiliation of the Subadviser with the Investment Manager, noting any potential conflicts of interest. The Trustees also took into account the financial condition of the Investment Manager with respect to its ability to provide the services required under the Investment Management Agreement and the Investment Manager’s undertaking to maintain contractual expense limitations for the Funds. The Trustees also considered the Investment Manager’s risk management processes. The Trustees also reviewed information relating to each Subadviser’s operations and personnel and the investment philosophy, strategies and techniques (for each Subadviser, its “Investment Strategy”) used in managing a Fund or the portion of a Fund for which the Subadviser has portfolio management responsibility. Among other things, the Trustees reviewed information on portfolio management and other professional staff, information regarding each Subadviser’s organizational and management structure and each Subadviser’s brokerage policies and practices. The Trustees considered specific information provided regarding the experience of the individual(s) at each Subadviser with portfolio management responsibility for a Fund or the portion of a Fund managed by the Subadviser, including the information set forth in the Fund’s prospectus and statement of additional information. With respect to AMG Managers Emerging Opportunities Fund, which is managed by multiple Subadvisers, the Trustees also noted the manner in which each Subadviser’s Investment Strategy complements those utilized by the Fund’s other Subadvisers. In the course of their deliberations, the Trustees evaluated, among other things: (a) the services rendered by each Subadviser in the past; (b) the qualifications and experience of |
39
|
Annual Renewal of Investment Management and Subadvisory Agreements(continued) |
| | | | | | | | |
the Subadviser’s personnel; and (c) the Subadviser’s compliance program. The Trustees also took into account the financial condition of each Subadviser with respect to its ability to provide the services required under its Subadvisory Agreement. The Trustees also considered each Subadviser’s risk management processes. PERFORMANCE The Board considered each Fund’s net performance during relevant time periods as compared to each Fund’s Peer Group and Fund Benchmark and considered each applicable Subadviser’s performance as compared to an appropriate peer group of managed accounts and also considered the gross performance of the Fund or the portion of the Fund managed by each Subadviser as compared to the Subadviser’s relevant performance composite that utilizes the same investment strategy and approach and noted that the Board reviews on a quarterly basis detailed information about both the Fund’s performance results and portfolio composition, as well as the Subadviser’s Investment Strategy, including, with respect to AMG Managers Emerging Opportunities Fund, the portion of the Fund managed by each Subadviser. The Board noted the Investment Manager’s expertise and resources in monitoring the performance, investment style and risk-adjusted performance of each Subadviser. The Board also noted each Subadviser’s performance record with respect to AMG Managers Emerging Opportunities Fund. The Board was mindful of the Investment Manager’s attention to monitoring each Subadviser’s performance with respect to the Funds and its discussions with management regarding the factors that contributed to the performance of the Funds. ADVISORY FEES AND PROFITABILITY In considering the reasonableness of the advisory fee charged by the Investment Manager for managing each Fund, the Trustees noted that the Investment Manager, and not the Fund, is responsible for paying the fees charged by the Fund’s Subadviser(s) and, therefore, that the fees paid to the Investment Manager cover the cost of providing portfolio management services as well as the cost of providing search, selection and monitoring services in operating a “manager-of-managers” complex of mutual funds. The Trustees also considered the amount of the advisory fee retained by the Investment Manager after payment of the subadvisory fee(s) with respect to each Fund. The Trustees also noted payments made or to be made from Frontier Capital Management Company, LLC (“Frontier”) to the | | | | Investment Manager, and other payments made or to be made from the Investment Manager to Frontier. The Trustees concluded that, in light of the high quality supervisory services provided by the Investment Manager and the fact that the subadvisory fees are paid out of the advisory fee, the advisory fee payable by each Fund to the Investment Manager can reasonably be expected to exceed the median advisory fee for the Peer Group, which consists of many funds that do not operate with a manager-of-managers structure. In this regard, the Trustees also noted that the Investment Manager has undertaken to maintain contractual expense limitations for the Funds. In addition, in considering the reasonableness of the advisory fee payable to the Investment Manager, the Trustees also reviewed information provided by the Investment Manager setting forth all revenues and other benefits, both direct and indirect (including any so-called “fallout benefits” such as reputational value derived from the Investment Manager serving as Investment Manager to a Fund), received by the Investment Manager and its affiliates attributable to managing each Fund and all the mutual funds in the AMG Funds Family of Funds; the cost of providing such services; the significant risks undertaken as Investment Manager and sponsor of the Funds, including investment, operational, enterprise, entrepreneurial, litigation, regulatory and compliance risks; and the resulting profitability to the Investment Manager and its affiliates from these relationships. The Trustees also noted the current asset levels of each Fund and the willingness of the Investment Manager to waive fees and pay expenses for all of the Funds from time to time as a means of limiting total expenses. The Trustees also considered management’s discussion of the current asset levels of the Funds, and the impact on profitability of both the current asset levels and any future growth of assets of the Funds. The Board took into account management’s discussion of the advisory fee structure, and the services the Investment Manager provides in performing its functions under the Investment Management Agreement and supervising each Subadviser. In this regard, the Trustees noted that, unlike a mutual fund that is managed by a single investment adviser, the Funds operate in a manager-of-managers structure. Based on the foregoing, the Trustees concluded that the profitability to the Investment Manager is reasonable and that the Investment Manager is not realizing material benefits from economies of scale that would warrant adjustments to the advisory fees for any Fund at this time. With respect to economies of scale, the Trustees also noted that as a Fund’s assets | | | | increase over time, the Fund may realize other economies of scale to the extent that the increase in assets is proportionally greater than the increase in certain other expenses. SUBADVISORY FEES AND PROFITABILITY In considering the reasonableness of the subadvisory fee payable by the Investment Manager to each Subadviser of AMG Managers Emerging Opportunities Fund, the Trustees relied on the ability of the Investment Manager to negotiate the terms of the Subadvisory Agreement at arm’s length as part of the manager-of-managers structure, noting that each Subadviser of AMG Managers Emerging Opportunities Fund is not affiliated with the Investment Manager. In addition, the Trustees considered other potential benefits of the subadvisory relationship to a Subadviser, including, among others, the indirect benefits that the Subadviser may receive from the Subadviser’s relationship with AMG Managers Emerging Opportunities Fund, including any so-called “fallout benefits” to the Subadviser, such as reputational value derived from the Subadviser serving as Subadviser to the Fund. In addition, the Trustees noted that the subadvisory fees are paid by the Investment Manager out of its advisory fee. As a consequence of all of the foregoing, the cost of services to be provided by each unaffiliated Subadviser and the profitability to the Subadviser of its relationship with AMG Managers Emerging Opportunities Fund were not material factors in the Trustees’ deliberations. For similar reasons, the Trustees did not consider potential economies of scale in the management of the portion of AMG Managers Emerging Opportunities Fund managed by each unaffiliated Subadviser to be a material factor in their deliberations at this time. In considering the reasonableness of the subadvisory fees payable by the Investment Manager to Frontier, the Trustees noted that Frontier is an affiliate of the Investment Manager, and the Trustees reviewed information regarding the cost to Frontier of providing subadvisory services to AMG Frontier Small Cap Growth Fund and the resulting profitability from such relationship. The Trustees noted that, because Frontier is an affiliate of the Investment Manager, a portion of Frontier’s revenues or profits might be shared directly or indirectly with the Investment Manager. The Trustees also noted that the subadvisory fees are paid by the Investment Manager out of its advisory fee. The Board also took into account management’s discussion of the subadvisory fee structure, and the services Frontier provides in performing its functions under the |
40
|
Annual Renewal of Investment Management and Subadvisory Agreements (continued) |
| | | | | | | | |
Subadvisory Agreement. Based on the foregoing, the Trustees concluded that the profitability to Frontier is reasonable and that Frontier is not realizing material benefits from economies of scale that would warrant adjustments to the subadvisory fees at this time. Also with respect to economies of scale, the Trustees noted that as the Fund’s assets increase over time, the Fund may realize other economies of scale to the extent the increase in assets is proportionally greater than the increase in certain other expenses. In addition to the foregoing, the Trustees considered the specific factors and related conclusions set forth below with respect to each Fund, the Investment Manager and each Subadviser. AMG Managers Emerging Opportunities Fund FUND PERFORMANCE Among other information relating to the Fund’s performance, the Trustees noted that the Fund’s performance for Class N shares (which share class has the earliest inception date and the largest amount of assets of all the share classes of the Fund) for the 1-year, 3-year, 5-year and 10-year periods ended March 31, 2019 was above the median performance of the Peer Group and above, above, below and above, respectively, the performance of the Fund Benchmark, the Russell Microcap® Index. The Trustees took into account management’s discussion of the Fund’s performance, noting that Class N shares of the Fund ranked in the top decile relative to its Peer Group for the 1-year, 3-year and 10- year periods and in the top quintile relative to its Peer Group for the 5-year period. The Trustees concluded that the Fund’s overall performance has been satisfactory. ADVISORY AND SUBADVISORY FEES The Trustees noted that the Fund’s management fees (which include both the advisory and administration fees) and total expenses (weighted average, all classes combined) (net of applicable expense waivers/reimbursements) as of March 31, 2019 were | | | | lower and higher, respectively, than the average for the Peer Group. The Trustees took into account the fact that, effective March 1, 2019, the Investment Manager has contractually agreed, through March 1, 2020, to lower the Fund’s contractual expense limitation from 1.18% to 0.94% of the Fund’s net annual operating expenses (subject to certain excluded expenses). The Trustees also noted that, effective March 1, 2019, the Fund’s management fee rate was reduced. The Trustees concluded that, in light of the nature, extent and quality of the services provided by the Investment Manager and the Subadvisers, the foregoing expense limitation and the considerations noted above with respect to the Investment Manager and the Subadvisers, the Fund’s advisory and subadvisory fees are reasonable. AMG Frontier Small Cap Growth Fund FUND PERFORMANCE Among other information relating to the Fund’s performance, the Trustees noted that the Fund’s performance for Class I shares (which share class has the earliest inception date and the largest amount of assets of all the share classes of the Fund) for the 1-year, 3-year, 5-year and 10-year periods ended March 31, 2019 was above, above, above and below, respectively, the median performance of the Peer Group and above, above, above and below, respectively, the performance of the Fund Benchmark, the Russell 2000® Growth Index. The Trustees took into account management’s discussion of the Fund’s performance, including the Fund’s more recent improved performance. The Trustees also noted that Class I shares of the Fund ranked in the top quintile relative to its Peer Group for the 1-year and 3-year periods. The Trustees concluded that the Fund’s overall performance has been satisfactory. ADVISORY AND SUBADVISORY FEES The Trustees noted that the Fund’s management fees (which include both the advisory and administration fees) and total expenses (weighted average, all | | | | classes combined) (net of applicable expense waivers/reimbursements) as of March 31, 2019 were both lower than the average for the Peer Group. The Trustees took into account the fact that the Investment Manager has contractually agreed, through March 1, 2020, to limit the Fund’s net annual operating expenses (subject to certain excluded expenses) to 0.90%. The Trustees concluded that, in light of the nature, extent and quality of the services provided by the Investment Manager and the Subadviser (which is an affiliate of the Investment Manager), the foregoing expense limitation and the considerations noted above with respect to the Investment Manager and the Subadviser, the Fund’s advisory and subadvisory fees are reasonable. * * * * After consideration of the foregoing, the Trustees also reached the following conclusions (in addition to the conclusions discussed above) regarding each Investment Management Agreement and each Subadvisory Agreement: (a) the Investment Manager and each Subadviser have demonstrated that they possess the capability and resources to perform the duties required of them under each Investment Management Agreement and the applicable Subadvisory Agreements and (b) the Investment Manager and each Subadviser maintain appropriate compliance programs. Based on all of the above-mentioned factors and their related conclusions, with no single factor or conclusion being determinative and with each Trustee not necessarily attributing the same weight to each factor, the Trustees concluded that approval of each Investment Management Agreement and each Subadvisory Agreement would be in the best interests of the applicable Fund and its shareholders. Accordingly, on June 27, 2019, the Trustees, and separately a majority of the Independent Trustees, voted to approve the Investment Management and the Subadvisory Agreements for each Fund. |
41
THIS PAGE INTENTIONALLY LEFT BLANK
THIS PAGE INTENTIONALLY LEFT BLANK
THIS PAGE INTENTIONALLY LEFT BLANK
| | |
| | | |
| | | | |
INVESTMENT MANAGER AND ADMINISTRATOR AMG Funds LLC 600 Steamboat Road, Suite 300 Greenwich, CT 06830 800.548.4539 DISTRIBUTOR AMG Distributors, Inc. 600 Steamboat Road, Suite 300 Greenwich, CT 06830 800.548.4539 | | CUSTODIAN The Bank of New York Mellon 111 Sanders Creek Parkway East Syracuse, NY 13057 LEGAL COUNSEL Ropes & Gray LLP Prudential Tower, 800 Boylston Street Boston, MA 02199-3600 TRANSFER AGENT BNY Mellon Investment Servicing (US) Inc. Attn: AMG Funds P.O. Box 9769 Providence, RI 02940 800.548.4539 | | This report is prepared for the Funds’ shareholders. It is authorized for distribution to prospective investors only when preceded or accompanied by an effective prospectus. To receive a free copy of the prospectus or Statement of Additional Information, which includes additional information about Fund Trustees, please contact us by calling 800.548.4539. Distributed by AMG Distributors, Inc., member FINRA/SIPC. Current net asset values per share for each Fund are available on the Funds’ website at amgfunds.com. A description of the policies and procedures each Fund uses to vote its proxies is available: (i) without charge, upon request, by calling 800.548.4539, or (ii) on the Securities and Exchange Commission’s (SEC) website at sec.gov. For information regarding each Fund’s proxy voting record for the 12-month period ended June 30, call 800.548.4539 or visit the SEC website at sec.gov. The Funds file their complete schedule of portfolio holdings with the SEC for the first and third quarters of each fiscal year as an exhibit to their reports on Form N-PORT, which has replaced Form N-Q. The Funds’ portfolio holdings on Form N-PORT are available on the SEC’s website at sec.gov. To review a complete list of the Funds’ portfolio holdings, or to view the most recent semiannual report or annual report, please visit amgfunds.com. |
| | |
| | | |
| | | | | | | | |
AFFILIATE SUBADVISED FUNDS BALANCED FUNDS AMG Chicago Equity Partners Balanced Chicago Equity Partners, LLC AMG FQ Global Risk-Balanced First Quadrant, L.P. EQUITY FUNDS AMG FQ Tax-Managed U.S. Equity AMG FQ Long-Short Equity First Quadrant, L.P. AMG Frontier Small Cap Growth Frontier Capital Management Co., LLC AMG GW&K Small Cap Core AMG GW&K Small/Mid Cap AMG GW&K Trilogy Emerging Markets Equity AMG GW&K Trilogy Emerging Wealth Equity GW&K Investment Management, LLC AMG Renaissance Large Cap Growth The Renaissance Group LLC AMG River Road Dividend All Cap Value AMG River Road Dividend All Cap Value II AMG River Road Focused Absolute Value AMG River Road Long-Short AMG River Road Small-Mid Cap Value AMG River Road Small Cap Value River Road Asset Management, LLC AMG SouthernSun Small Cap AMG SouthernSun U.S. Equity SouthernSun Asset Management, LLC | | | | AMG TimesSquare Emerging Markets Small Cap AMG TimesSquare Global Small Cap AMG TimesSquare International Small Cap AMG TimesSquare Mid Cap Growth AMG TimesSquare Small Cap Growth TimesSquare Capital Management, LLC AMG Yacktman AMG Yacktman Focused AMG Yacktman Focused Fund - Security Selection Only AMG Yacktman Special Opportunities Yacktman Asset Management LP FIXED INCOME FUNDS AMG GW&K Core Bond ESG AMG GW&K Enhanced Core Bond ESG AMG GW&K Municipal Bond AMG GW&K Municipal Enhanced Yield GW&K Investment Management, LLC OPEN-ARCHITECTURE FUNDS EQUITY FUNDS AMG Managers Brandywine AMG Managers Brandywine Advisors Mid Cap Growth AMG Managers Brandywine Blue Friess Associates, LLC AMG Managers Cadence Emerging Companies AMG Managers Cadence Mid Cap Cadence Capital Management LLC AMG Managers CenterSquare Real Estate CenterSquare Investment Management LLC | | | | AMG Managers Emerging Opportunities WEDGE Capital Management L.L.P. Next Century Growth Investors LLC RBC Global Asset Management (U.S.) Inc. AMG Managers Fairpointe ESG Equity AMG Managers Fairpointe Mid Cap Fairpointe Capital LLC AMG Managers LMCG Small Cap Growth LMCG Investments, LLC AMG Managers Montag & Caldwell Growth Montag & Caldwell, LLC AMG Managers Pictet International Pictet Asset Management Limited AMG Managers Silvercrest Small Cap Silvercrest Asset Management Group LLC AMG Managers Skyline Special Equities Skyline Asset Management, L.P. AMG Managers Special Equity Ranger Investment Management, L.P. Lord, Abbett & Co. LLC Smith Asset Management Group, L.P. Federated MDTA LLC FIXED INCOME FUNDS AMG Managers Doubleline Core Plus Bond DoubleLine Capital LP AMG Managers Global Income Opportunity AMG Managers Loomis Sayles Bond Loomis, Sayles & Company, L.P. |
| | |
| amgfunds.com | | 103119 AR022 |
Registrant has adopted a Code of Ethics. See attached Exhibit (a)(1).
| Item 3. | AUDIT COMMITTEE FINANCIAL EXPERT |
Registrant’s Board of Trustees has determined that independent Trustee Mr. Steven J. Paggioli qualifies as an Audit Committee Financial Expert. Mr. Paggioli is “independent” as such term is defined in FormN-CSR.
| Item 4. | PRINCIPAL ACCOUNTANT FEES AND SERVICES |
The aggregate fees billed by the Funds’ independent registered public accounting firm, PricewaterhouseCoopers LLP (“PwC”), to the Funds for the Funds’ two most recent fiscal years for professional services rendered for audits of annual financial statements, or services that are normally provided in connection with statutory and regulatory filings or engagements (“Audit Fees”) were as follows:
| | | | | | | | |
| | | Fiscal
2019 | | | Fiscal
2018 | |
AMG FQTax-Managed U.S. Equity Fund | | $ | 22,186 | | | $ | 20,714 | |
AMG FQ Long-Short Equity Fund | | $ | 33,510 | | | $ | 32,976 | |
AMG FQ Global Risk-Balanced Fund | | $ | 26,240 | | | $ | 27,819 | |
AMG Frontier Small Cap Growth Fund | | $ | 21,369 | | | $ | 19,796 | |
AMG Managers Emerging Opportunities Fund | | $ | 21,775 | | | $ | 20,356 | |
AMG GW&K Core Bond ESG Fund | | $ | 39,548 | | | $ | 39,034 | |
There were no fees billed by PwC to the Funds in its two recent fiscal years for services rendered for assurance and related services that are reasonably related to the performance of the audit or review of the Fund’s financial statements, but are not reported as Audit Fees (“Audit-Related Fees”).
For the Funds’ two most recent fiscal years, there were no Audit-Related Fees billed by PwC for engagements related directly to the operations and financial reporting of one or more Funds by a Fund Service Provider. A Fund Service Provider is (a) any investment adviser to the Fund (not including any Subadvisor whose role is primarily portfolio management and is subcontracted with or overseen by another investment adviser) or (b) any entity that provides ongoing services to the Fund and is controlling, controlled by or under common control with a Fund investment adviser described in (a).
The aggregate fees billed by PwC to the Funds for the two most recent fiscal years for professional services rendered for tax compliance, tax advice, and tax planning (“Tax Fees”) were as follows:
| | | | | | | | |
| | | Fiscal
2019 | | | Fiscal
2018 | |
AMG FQTax-Managed U.S. Equity Fund | | $ | 4,850 | | | $ | 7,774 | |
AMG FQ Long-Short Equity Fund | | $ | 7,000 | | | $ | 12,142 | |
AMG FQ Global Risk-Balanced Fund | | $ | 7,000 | | | $ | 10,782 | |
AMG Frontier Small Cap Growth Fund | | $ | 4,850 | | | $ | 7,774 | |
AMG Managers Emerging Opportunities Fund | | $ | 4,850 | | | $ | 8,939 | |
AMG GW&K Core Bond ESG Fund | | $ | 4,850 | | | $ | 9,893 | |
For the Funds’ two most recent fiscal years, Tax Fees billed by PwC for engagements by Fund Service Providers that related directly to the operations and financial reporting of the Funds were $0 for fiscal 2019 and $0 for fiscal 2018, respectively.
The services for which Tax Fees were charged comprise all services performed by professional staff in PwC’s tax division except those services related to the audit. Typically, this category would include fees for tax compliance, tax planning, and tax advice. Tax compliance, tax advice, and tax planning services include preparation of original and amended tax returns, claims for refund and tax payment-planning services, assistance with tax audits and appeals, tax advice related to mergers and acquisitions and requests for rulings or technical advice from taxing authorities.
There were no other fees billed by PwC to the Funds for all othernon-audit services (“Other Fees”) during the Funds’ two most recent fiscal years. During the same period, there were no Other Fees billed by PwC for engagements by Fund Service Providers that related directly to the operations and financial reporting of the Funds.
(e)(1) According to policies adopted by the Audit Committee, services provided by PwC to the Funds must bepre-approved by the Audit Committee. On an annual basis, the Audit Committee reviews andpre-approves various types of services that PwC may perform for the Funds without specific approval of each engagement, subject to specified budget limitations. As contemplated by the Sarbanes-Oxley Act of 2002 and related SEC rules, the Audit Committee alsopre-approvesnon-audit services provided by PwC to any Fund Service Provider for any engagement that relates directly to the operations and financial reporting of the Funds. Any engagement that is not alreadypre-approved or that will exceed apre-approved budget must be submitted to the Audit Committee forpre-approval. The Chairman of the Audit Committee is authorized on behalf of the Board of Trustees and the Audit Committee to approve the engagement of PwC to performnon-audit services subject to certain conditions, including notification to the
Audit Committee of suchpre-approval not later than the next meeting of the Audit Committee following the date of suchpre-approval.
(e)(2) None.
(f) Not applicable.
(g) The aggregate fees billed by PwC in 2019 and 2018 fornon-audit services rendered to the Funds and Fund Service Providers were $82,900 and $106,804, respectively. For the fiscal year ended October 31, 2019, this amount reflects the amounts disclosed above in Item 4(b),(c),(d), plus $49,500 in fees billed to the Fund Service Providers fornon-audit services that did not relate directly to the operations and financial reporting of the Funds. For the fiscal year ended October 31, 2018, this amount reflects the amounts disclosed above in Item 4(b),(c),(d), plus $49,500 in fees billed to the Fund Service Providers fornon-audit services that did not relate directly to the operations and financial reporting of the Funds.
(h) The Trust’s Audit Committee has considered whether the provision ofnon-audit services by registrant’s independent registered public accounting firm to the registrant’s investment adviser, and any entity controlling, controlled by, or under common control with the investment adviser that provided ongoing services to the registrant that were notpre-approved by the Committee (because such services did not relate directly to the operations and financial reporting of the registrant) was compatible with maintaining the independence of the independent registered public accounting firm.
| Item 5. | AUDIT COMMITTEE OF LISTED REGISTRANTS |
Not applicable.
| Item 6. | SCHEDULE OF INVESTMENTS |
The schedule of investments in securities of unaffiliated issuers as of the close of the reporting period is included as part of the report to shareholders filed under Item 1 of this form.
| Item 7. | DISCLOSURE OF PROXY VOTING POLICIES AND PROCEDURES FORCLOSED-END MANAGEMENT INVESTMENT COMPANIES |
Not applicable.
| Item 8. | PORTFOLIO MANAGERS OFCLOSED-END MANAGEMENT INVESTMENT COMPANIES |
Not applicable.
| Item 9. | PURCHASES OF EQUITY SECURITIES BYCLOSED-END MANAGEMENT INVESTMENT COMPANIES AND AFFILIATED PURCHASERS |
Not applicable.
| Item 10. | SUBMISSION OF MATTERS TO A VOTE OF SECURITY HOLDERS |
Not applicable.
| Item 11. | CONTROLS AND PROCEDURES |
(a) The Registrant’s principal executive and principal financial officers have concluded, based on their evaluation of the registrant’s disclosure controls and procedures as of a date within 90 days of the filing of this report, that the Registrant’s disclosure controls and procedures are reasonably designed to ensure that information required to be disclosed by the Registrant on FormN-CSR is recorded, processed, summarized and reported within the required time periods and that information required to be disclosed by the registrant in the reports that it files or submits on FormN-CSR is accumulated and communicated to the Registrant’s management, including its principal executive and principal financial officers, as appropriate to allow timely decisions regarding required disclosure.
(b) There were no changes in the Registrant’s internal control over financial reporting during the period covered by this report that have materially affected, or are reasonably likely to materially affect, the internal control over financial reporting.
| Item 12. | DISCLOSURE OF SECURITIES LENDING ACTIVITIES FORCLOSED-END MANAGEMENT INVESTMENT COMPANIES |
Not applicable.
| (a)(1) | Any Code of Ethics or amendments hereto. Filed herewith. |
| (a)(2) | Certifications pursuant to Rule 30a-2(a) under the Investment Company Act of 1940—Filed herewith. |
| (b) | Certifications pursuant to Rule 30a-2(b) under the Investment Company Act of 1940—Filed herewith. |
SIGNATURES
Pursuant to the requirements of the Securities Exchange Act of 1934 and the Investment Company Act of 1940, the registrant has duly caused this report to be signed on its behalf by the undersigned, thereunto duly authorized.
| | |
| AMG Funds I |
| |
| By: | | /s/ Keitha L. Kinne |
| | Keitha L. Kinne, Principal Executive Officer |
| |
| Date: | | January 3, 2020 |
Pursuant to the requirements of the Securities Exchange Act of 1934 and the Investment Company Act of 1940, this report has been signed below by the following persons on behalf of the registrant and in the capacities and on the dates indicated.
| | |
| By: | | /s/ Keitha L. Kinne |
| | Keitha L. Kinne, Principal Executive Officer |
| |
| Date: | | January 3, 2020 |
| |
| By: | | /s/ Thomas Disbrow |
| | Thomas Disbrow, Principal Financial Officer |
| |
| Date: | | January 3, 2020 |