UNITED STATES
SECURITIES AND EXCHANGE COMMISSION
Washington, D.C. 20549
FORM N-CSR
CERTIFIED SHAREHOLDER REPORT OF REGISTERED
MANAGEMENT INVESTMENT COMPANIES
Investment Company Act file number: 811-06520
AMG Funds I
(Exact name of registrant as specified in charter)
600 Steamboat Road, Suite 300, Greenwich, Connecticut 06830
(Address of principal executive offices) (Zip code)
AMG Funds LLC
600 Steamboat Road, Suite 300, Greenwich, Connecticut 06830
(Name and address of agent for service)
Registrant’s telephone number, including area code: (203) 299-3500
Date of fiscal year end: OCTOBER 31
Date of reporting period: NOVEMBER 1, 2017 – OCTOBER 31, 2018
(Annual Shareholder Report)
| Item 1. | Reports to Shareholders |

AMG Funds
October 31, 2018

AMG FQ Tax-Managed U.S. Equity Fund
Class N: MFQAX | Class I: MFQTX
AMG FQ Long-Short Equity Fund
Class N: FQUAX | Class I: MEQFX
AMG FQ Global Risk-Balanced Fund
Class N: MMAVX | Class I: MMASX | Class Z: MMAFX
| | | | | | | | |
amgfunds.com | | | 103118 | | | | AR014 | |
AMG Funds
Annual Report — October 31, 2018
| | | | |
TABLE OF CONTENTS | | PAGE | |
LETTER TO SHAREHOLDERS | | | 2 | |
| |
ABOUT YOUR FUND’S EXPENSES | | | 3 | |
| |
PORTFOLIO MANAGER’S COMMENTS, FUND SNAPSHOTS AND SCHEDULES OF PORTFOLIO INVESTMENTS | | | | |
| |
AMG FQ Tax-Managed U.S. Equity Fund | | | 4 | |
| |
AMG FQ Long-Short Equity Fund | | | 11 | |
| |
AMG FQ Global Risk-Balanced Fund | | | 24 | |
| |
FINANCIAL STATEMENTS | | | | |
| |
Statement of Assets and Liabilities | | | 33 | |
Balance sheets, net asset value (NAV) per share computations and cumulative undistributed amounts | | | | |
| |
Statement of Operations | | | 35 | |
Detail of sources of income, expenses, and realized and unrealized gains (losses) during the fiscal year | | | | |
| |
Statements of Changes in Net Assets | | | 36 | |
Detail of changes in assets for the past two fiscal years | | | | |
| |
Financial Highlights | | | 37 | |
Historical net asset values per share, distributions, total returns, income and expense ratios, turnover ratios and net assets | | | | |
| |
Notes to Financial Statements | | | 44 | |
Accounting and distribution policies, details of agreements and transactions with Fund management and affiliates, and descriptions of certain investment risks | | | | |
| |
REPORT OF INDEPENDENT REGISTERED PUBLIC ACCOUNTING FIRM | | | 54 | |
| |
OTHER INFORMATION | | | 55 | |
| |
TRUSTEES AND OFFICERS | | | 56 | |
| |
ANNUAL RENEWAL OF INVESTMENT MANAGEMENT AND SUBADVISORY AGREEMENTS | | | 59 | |
Nothing contained herein is to be considered an offer, sale or solicitation of an offer to buy shares of any series of the AMG Funds family of mutual funds. Such offering is made only by prospectus, which includes details as to offering price and other material information.
| | |
| | Letter to Shareholders |
Dear Shareholder:
The fiscal year ended October 31, 2018, was a period of mixed results for global financial markets. The global economic expansion supported strong investor sentiment early in the year before giving way to higher volatility amid a backdrop of tightening monetary policy and uncertainty around global trade policy. U.S. equities were resilient despite the volatility as the S&P 500® Index, a broad gauge of U.S. equity performance, returned 7.35% over the full fiscal year. The U.S. bull market continued into its 10th year having gained 390% since the market bottom on March 9, 2009.
Economic conditions outside the U.S. have been mixed. At the European Central Bank’s (ECB) most recent monetary policy meeting, the governing council confirmed that the European economy showed signs of continued, though slightly slower, growth and inflation progressing toward its target level. After nine months of strength, global economic growth began to show signs of deceleration in the third quarter of 2018. Although the Purchasing Managers Index, a leading economic indicator, remained slightly above the all-important level of 50 for the five largest global economies, only the United States increased from one year prior. Global interest rate policies remain accommodative, but the ECB has continued on its path to conclude its bond buying program at the end of 2018 and the Bank of England increased its target rate.
Nine of eleven economic sectors of the S&P 500® Index were positive during the 12-month reporting period, but there was significant dispersion in performance across sectors. Information technology, consumer discretionary, and healthcare all ended the period with positive double-digit returns of 16.70%, 15.69%, and 11.32%, respectively. Financials, industrials, and materials significantly lagged the broader benchmark with returns of 0.66%, (1.09)%, and (9.53)%, respectively. Overall, corporate earnings in the third quarter were better than expected with 78% of the companies in the S&P 500® Index beating the consensus earnings per share estimate.1 Growth stocks continued to outperform value with returns of 10.71% and 3.03% for the Russell 1000® Growth and Russell 1000® Value Indexes, respectively. International equities and emerging markets demonstrated significantly weaker returns, with the MSCI All Country World Index ex-USA and MSCI Emerging Markets Index returning (8.24)% and (12.52)%, respectively, in the 12 months ending October 31, 2018. Two rounds of new U.S. tariffs for Chinese imports and signs of a slowing economy acted as a drag on the largest economy within the MSCI Emerging Markets Index. Concurrently, the U.S. Dollar strengthened against most major global currencies, particularly in emerging markets, where those with large current account deficits faced significant pressure adding to the drag on performance for emerging markets.
Tightening U.S. Federal Reserve policy and higher interest rates eroded the performance of bonds. The Bloomberg Barclays U.S. Aggregate Bond Index, a broad measure of U.S. bond market performance, turned negative with (2.05)% return for the 12 months ending October 31, 2018. The yield on the 10-year U.S. Treasury note crossed above 3% at the end of September despite market speculation that the December rate hike may not materialize. During the past year, the short end of the yield curve has risen faster than the longer end, resulting in the 2–10 year Treasury spread falling (0.5)%. Bond investors willing to accept more credit risk were rewarded with higher returns as high yield bonds performed strongly and credit spreads tightened over most of the fiscal year. The Bloomberg Barclays U.S. Corporate High Yield Bond Index ended the period with a 0.97% return.
| 1 | Source: FactSet, Based on the 74% of S&P 500® companies which had reported third quarter earnings as of November 2, 2018. |
AMG Funds appreciates the privilege of providing investment tools to you and your clients. Our foremost goal is to provide investment solutions that help our shareholders successfully reach their long-term investment goals. AMG Funds provides access to a distinctive array of actively managed return-oriented investment strategies. We thank you for your continued confidence and investment in AMG Funds. You can rest assured that under all market conditions our team is focused on delivering excellent investment management services for your benefit.
Respectfully,

Keitha Kinne
President
AMG Funds
| | | | | | | | | | | | | | |
Average Annual Total Returns | | Periods ended
October 31, 2018* | |
Stocks: | | | | 1 Year | | | 3 Years | | | 5 Years | |
Large Caps | | (S&P 500® Index) | | | 7.35 | % | | | 11.52 | % | | | 11.34 | % |
Small Caps | | (Russell 2000® Index) | | | 1.85 | % | | | 10.68 | % | | | 8.01 | % |
International | | (MSCI All Country World Index ex USA) | | | (8.24 | )% | | | 4.37 | % | | | 1.63 | % |
| | | | |
Bonds: | | | | | | | | | | | | | | |
Investment Grade | | (Bloomberg Barclays U.S. Aggregate Bond Index) | | | (2.05 | )% | | | 1.04 | % | | | 1.83 | % |
High Yield | | (Bloomberg Barclays U.S. Corporate High Yield Bond Index) | | | 0.97 | % | | | 6.60 | % | | | 4.68 | % |
Tax-exempt | | (Bloomberg Barclays Municipal Bond Index) | | | (0.51 | )% | | | 1.90 | % | | | 3.25 | % |
Treasury Bills | | (BofA Merrill Lynch 6-Month U.S. Treasury Bill) | | | 1.68 | % | | | 1.05 | % | | | 0.70 | % |
| * | Source: FactSet. Past performance is no guarantee of future results. |
2
About Your Fund’s Expenses
As a shareholder of a Fund, you may incur two types of costs: (1) transaction costs, which may include sales charges (loads) on purchase payments; redemption fees; and exchange fees; and (2) ongoing costs, including management fees; distribution (12b-1) fees; and other Fund expenses. This example is intended to help you understand your ongoing costs (in dollars) of investing in the Fund and to compare these costs with the ongoing costs of investing in other mutual funds. The example is based on $1,000 invested at the beginning of the period and held for the entire period as indicated below.
ACTUAL EXPENSES
The first line of the following table provides information about the actual account values and
actual expenses. You may use the information in this line, together with the amount you invested, to estimate the expenses that you paid over the period. Simply divide your account value by $1,000 (for example, an $8,600 account value divided by $1,000 = 8.6), then multiply the result by the number in the first line under the heading entitled “Expenses Paid During Period” to estimate the expenses you paid on your account during this period.
HYPOTHETICAL EXAMPLE FOR COMPARISON PURPOSES
The second line of the following table provides information about hypothetical account values and hypothetical expenses based on the Fund’s actual expense ratio and an assumed annual rate of return of 5% before expenses, which is not the Fund’s
actual return. The hypothetical account values and expenses may not be used to estimate the actual ending account balance or expenses you paid for the period. You may use this information to compare the ongoing costs of investing in the Fund and other funds by comparing this 5% hypothetical example with the 5% hypothetical examples that appear in the shareholder reports of other funds.
Please note that the expenses shown in the table are meant to highlight your ongoing costs only and do not reflect any transactional costs, such as sales charges (loads), redemption fees, or exchange fees. Therefore, the second line of the table is useful in comparing ongoing costs only, and will not help you determine the relative total costs of owning different funds.
| | | | | | | | | | | | | | | | |
Six Months Ended
October 31, 2018 | | Expense
Ratio for
the Period | | | Beginning
Account
Value
05/01/18 | | | Ending
Account
Value
10/31/18 | | | Expenses
Paid
During
the Period* | |
AMG FQ Tax-Managed U.S. Equity Fund | | | | | |
Based on Actual Fund Return | | | | | | | | | |
Class N | | | 1.14 | % | | $ | 1,000 | | | $ | 1,031 | | | $ | 5.84 | |
Class I | | | 0.89 | % | | $ | 1,000 | | | $ | 1,033 | | | $ | 4.56 | |
Based on Hypothetical 5% Annual Return | | | | | |
Class N | | | 1.14 | % | | $ | 1,000 | | | $ | 1,019 | | | $ | 5.80 | |
Class I | | | 0.89 | % | | $ | 1,000 | | | $ | 1,021 | | | $ | 4.53 | |
AMG FQ Long-Short Equity Fund** | | | | | |
Based on Actual Fund Return | | | | | |
Class N | | | 1.04 | % | | $ | 1,000 | | | $ | 1,048 | | | $ | 5.37 | |
Class I | | | 0.73 | % | | $ | 1,000 | | | $ | 1,049 | | | $ | 3.77 | |
Based on Hypothetical 5% Annual Return | | | | | |
Class N | | | 1.04 | % | | $ | 1,000 | | | $ | 1,020 | | | $ | 5.30 | |
Class I | | | 0.73 | % | | $ | 1,000 | | | $ | 1,022 | | | $ | 3.72 | |
| | | | | | | | | | | | | | | | |
Six Months Ended
October 31, 2018 | | Expense
Ratio
for the
Period | | | Beginning
Account
Value
05/01/18 | | | Ending
Account
Value
10/31/18 | | | Expenses
Paid
During
the Period* | |
AMG FQ Global Risk-Balanced Fund | | | | | |
Based on Actual Fund Return | | | | | |
Class N | | | 1.29 | % | | $ | 1,000 | | | $ | 941 | | | $ | 6.31 | |
Class I | | | 1.04 | % | | $ | 1,000 | | | $ | 942 | | | $ | 5.09 | |
Class Z | | | 0.89 | % | | $ | 1,000 | | | $ | 942 | | | $ | 4.36 | |
Based on Hypothetical 5% Annual Return | | | | | |
Class N | | | 1.29 | % | | $ | 1,000 | | | $ | 1,019 | | | $ | 6.56 | |
Class I | | | 1.04 | % | | $ | 1,000 | | | $ | 1,020 | | | $ | 5.30 | |
Class Z | | | 0.89 | % | | $ | 1,000 | | | $ | 1,021 | | | $ | 4.53 | |
| * | Expenses are equal to the Fund’s annualized expense ratio multiplied by the average account value over the period, multiplied by the number of days in the most recent fiscal half-year (184), then divided by 365. |
| ** | Excludes interest expense and dividends on short positions. If included, your annualized expense ratios would be 2.94% and 2.63% for Class N and Class I, respectively, and your actual and hypothetical expenses paid during the period would be $15.17 and $13.58, and $14.90 and $ 13.34 for Class N and Class I, respectively. |
3
AMG FQ Tax-Managed U.S. Equity Fund
Portfolio Manager’s Comments (unaudited)
For the fiscal year ended October 31, 2018, the AMG FQ Tax-Managed U.S. Equity Fund (the “Fund”) Class I returned 7.13%, compared to 6.60% for its benchmark, the Russell 3000® Index.
MARKET OVERVIEW
The U.S. equity market advanced throughout much of the reporting period. A comprehensive overhaul to the U.S. tax code in December 2017 created a tailwind for the domestic economy. The fiscal stimulus provided strong support for consumer and corporate spending, and contributed to a general trend of strong earnings reports. Moreover, strong domestic macro data (low unemployment, a pickup in wage growth) provided a favorable economic backdrop for foreign equity investors—particularly in contrast with other markets, which started to show signs of slowing growth.
Nevertheless, the U.S. equity market did experience a few significant downturns in February 2018, March 2018, and October 2018. During these episodes, investors worried about the prospects of a rising interest rate environment (though we believe current rate levels continue to be supportive) as well as threats to domestic and global growth.
PERFORMANCE REVIEW
In the first half of 2018, risky and low-quality stocks were generally rewarded, with investors spurred by a strengthening domestic economy and positive corporate earnings. This trend started to reverse in the third quarter of 2018, as threats to global growth started to surface (the ongoing trade war, Brexit uncertainty, emerging-market weakness). In the period’s final month, increased concern about the
Federal Reserve’s commitment to consistent rate hikes, in conjunction with a cooling domestic housing market and a dimming outlook for global growth, sparked a U.S. equity market selloff. As risk appetite deteriorated, value stocks, which had been underperforming growth stocks, received a lift from defensive trading.
An attribution of performance using risk model common factors showed that the Fund’s outperformance was largely due to a positive contribution from industry positions. The stock-specific component was also positive. The Fund’s exposure to common risk factors, however, detracted.
The Fund profited from an overweight to stocks with positive price momentum, which performed well over the fiscal year, as investors became increasingly confident in the health of the domestic economy. On the other hand, it lost ground from its overweight of small market-capitalization stocks. For much of the reporting period, “small-cap” stocks outperformed, as these companies were more insulated from concerns about global demand (stemming from the trade war). However, this trend reversed in the final months of the reporting period, and small-cap stocks experienced significant losses. Since these companies tend to maintain higher levels of debt, investors were particularly worried about how they would perform as interest rates increased.
On the other hand, the Fund benefited from its industry positioning. The strongest gains came through overweight positions in the retail food and drugs and other insurance industries during the last
several months of the period. Low unemployment and a pickup in wages, alongside the one-time tax cuts, lifted domestic consumption and supported the retail sector. Meanwhile, the Fund’s most significant industry losses came from an underweight position in medical supplies and an overweight position in forest products. Medical supplies companies benefited from an expanding healthcare industry, supported by an aging population. U.S. tariffs on Canadian lumber have increased supply costs for forest products, serving as a drag on profitability.
OUTLOOK
The signal from our quantitative model continues to have higher-than-average exposure to growth stocks, due to trends in prices and earnings, improved fundamental quality, and reduced price volatility. The signal has increased the Fund’s exposure to large-cap defensive stocks, as positive economic information has become increasingly priced into the equity market. There has been a notable increase in exposure to household products, driven by improved fundamentals, price momentum, and growth prospective. The Fund’s exposure to tobacco has declined, driven by deterioration in fundamentals, valuation, and price momentum, as well as an increase in earnings and price volatility.
This commentary reflects the viewpoints of the portfolio manager, First Quadrant, L.P., as of October 31, 2018 and is not intended as a forecast or guarantee of future results, and is subject to change without notice.
4
AMG FQ Tax-Managed U.S. Equity Fund
Portfolio Manager’s Comments (continued)
CUMULATIVE TOTAL RETURN PERFORMANCE
AMG FQ Tax-Managed U.S. Equity Fund’s cumulative total return is based on the daily change in net asset value (NAV), and assumes that all dividends and distributions were reinvested. This graph compares a hypothetical $10,000 investment made in the AMG FQ Tax-Managed U.S. Equity Fund’s Class I shares on October 31, 2008 to a $10,000 investment made in the Russell 3000® Index for the same time period. The graph and table do not reflect the deduction of taxes that a shareholder would pay on a Fund distribution or redemption of shares. The listed returns for the Fund are net of expenses and the returns for the index exclude expenses. Total returns would have been lower had certain expenses not been reduced.
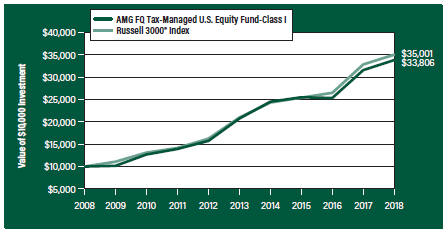
The table below shows the average annual total returns for the AMG FQ Tax-Managed U.S. Equity Fund and the Russell 3000® Index for the same time periods ended October 31, 2018.
| | | | | | | | | | | | |
| Average Annual Total Returns1 | | One Year | | | Five Years | | | Ten Years | |
AMG FQ Tax-Managed U.S. Equity Fund2, 3, 4, 5 | | | | | | | | | | | | |
Class N | | | 6.84 | % | | | 10.00 | % | | | 12.68 | % |
Class I | | | 7.13 | % | | | 10.27 | % | | | 12.96 | % |
Russell 3000® Index6 | | | 6.60 | % | | | 10.81 | % | | | 13.35 | % |
Return After Taxes on Distributions7 | | | | | | | | | | | | |
Class N | | | 6.81 | % | | | 9.91 | % | | | 12.60 | % |
Class I | | | 7.01 | % | | | 10.12 | % | | | 12.81 | % |
Returns After Taxes on Distributions & Sale of Fund Shares7 | | | | | | | | | | | | |
Class N | | | 4.07 | % | | | 7.93 | % | | | 10.63 | % |
Class I | | | 4.30 | % | | | 8.14 | % | | | 10.86 | % |
The performance data shown represents past performance. Past performance is not a guarantee of future results. Current performance may be lower or higher than the performance data quoted. The investment return and principal value of an investment will fluctuate so that an investor’s shares, when redeemed, may be worth more or less than their original cost.
Investors should carefully consider the Fund’s investment objectives, risks, charges and expenses before investing. For performance information through the most recent month end, current net asset values per share for the Fund and other information, please call 800.835.3879 or visit our website at amgfunds.com for a free prospectus. Read it carefully before investing or sending money.
Distributed by AMG Distributors, Inc., member FINRA/SIPC.
| 1 | Total return equals income yield plus share price change and assumes reinvestment of all dividends and capital gain distributions. Returns are net of fees and may reflect offsets of Fund expenses as described in the prospectus. No adjustment has been made for taxes payable by shareholders on their reinvested dividends and capital gain distributions. Returns for periods greater than one year are annualized. The listed returns on the Fund are net of expenses and based on the published NAV as of October 31, 2018. All returns are in U.S. dollars ($). |
| 2 | From time to time, the Fund’s advisor has waived its fees and/or absorbed Fund expenses, which has resulted in higher returns. |
| 3 | The Fund invests in large-capitalization companies that may underperform other stock funds (such as funds that focus on small- and medium-capitalization companies) when stocks of large-capitalization companies are out of favor. |
| 4 | Although the Fund is managed to minimize taxable distributions, it may not be able to avoid taxable distributions. |
| 5 | The Fund may invest in derivatives such as options and futures; the complexity and rapidly changing structure of derivatives markets may increase the possibility of market losses. |
| 6 | The Russell 3000® Index is composed of the 3,000 largest U.S. companies as measured by market capitalization, and represents about 98% of the U.S. stock market. Unlike the Fund, the Russell 3000® Index is unmanaged, is not available for investment and does not incur expenses. |
| 7 | After-tax returns are calculated using the historical highest individual federal marginal income tax rates and do not reflect the impact of state and local taxes. Actual after-tax returns depend on an investor’s tax situation and may differ from those shown, and after-tax returns are not relevant to investors who hold their Fund shares through tax-deferred arrangements, such as 401(k) plans or individual retirement accounts. |
The Russell 3000® Index is a trademark of the London Stock Exchange Group companies.
Not FDIC insured, nor bank guaranteed. May lose value.
5
AMG FQ Tax-Managed U.S. Equity Fund
Fund Snapshots (unaudited)
October 31, 2018
PORTFOLIO BREAKDOWN
| | | | |
Sector | | % of
Net Assets | |
Information Technology | | | 23.1 | |
Health Care | | | 14.9 | |
Financials | | | 14.3 | |
Consumer Discretionary | | | 12.9 | |
Industrials | | | 9.4 | |
Consumer Staples | | | 7.0 | |
Energy | | | 5.2 | |
Communication Services | | | 4.5 | |
Real Estate | | | 3.4 | |
Materials | | | 2.8 | |
Utilities | | | 1.6 | |
Short-Term Investments1 | | | 1.7 | |
Other Assets Less Liabilities2 | | | (0.8 | ) |
| 1 | Includes reinvestment of cash collateral into joint repurchase agreements on security lending transactions. |
| 2 | Includes repayment of cash collateral on security lending transactions. |
TOP TEN HOLDINGS
| | | | |
Security Name | | % of
Net Assets | |
Microsoft Corp. | | | 4.0 | |
Apple, Inc. | | | 3.9 | |
Visa, Inc., Class A | | | 3.2 | |
UnitedHealth Group, Inc. | | | 2.9 | |
Berkshire Hathaway, Inc., Class B | | | 2.9 | |
Mastercard, Inc., Class A | | | 2.9 | |
Amazon.com, Inc. | | | 2.4 | |
Medifast, Inc. | | | 2.1 | |
Crocs, Inc. | | | 2.1 | |
Brown & Brown, Inc. | | | 2.0 | |
| | | | |
Top Ten as a Group | | | 28.4 | |
| | | | |
Because a fund’s strategy may result in multiple investments in particular sectors of the economy, its performance may depend on the performance of those sectors and may fluctuate more widely than investments diversified across more sectors. For additional information on these and other risk considerations, please see the Fund’s prospectus.
Any sectors, industries, or securities discussed should not be perceived as investment recommendations. Mention of a specific security should not be considered a recommendation to buy or solicitation to sell that security. Specific securities mentioned in this report may have been sold from the Fund’s portfolio of investments by the time you receive this report.
6
AMG FQ Tax-Managed U.S. Equity Fund
Fund Snapshots (unaudited)
October 31, 2018
| | | | | | | | |
| | | Shares | | | Value | |
Common Stocks—99.1% | | | | | | | | |
Communication Services—4.5% | | | | | | | | |
Alphabet, Inc., Class A* | | | 801 | | | $ | 873,555 | |
Alphabet, Inc., Class C* | | | 814 | | | | 876,491 | |
AT&T, Inc. | | | 10,870 | | | | 333,492 | |
Boingo Wireless, Inc.* | | | 12,095 | | | | 378,936 | |
Netflix, Inc.* | | | 1,041 | | | | 314,153 | |
Verizon Communications, Inc. | | | 2,873 | | | | 164,019 | |
Vonage Holdings Corp.* | | | 25,982 | | | | 344,521 | |
Total Communication Services | | | | | | | 3,285,167 | |
Consumer Discretionary—12.9% | | | | | | | | |
Amazon.com, Inc.* | | | 1,086 | | | | 1,735,439 | |
Asbury Automotive Group, Inc.*,1 | | | 5,377 | | | | 350,043 | |
Best Buy Co., Inc. | | | 2,515 | | | | 176,452 | |
Cambium Learning Group, Inc.* | | | 15,810 | | | | 227,348 | |
Comcast Corp., Class A | | | 3,542 | | | | 135,092 | |
Crocs, Inc.*,1 | | | 75,023 | | | | 1,540,972 | |
Extended Stay America, Inc., (Units) | | | 13,285 | | | | 216,280 | |
Gentex Corp. | | | 22,692 | | | | 477,667 | |
Graham Holdings Co., Class B | | | 662 | | | | 384,655 | |
Grand Canyon Education, Inc.* | | | 4,094 | | | | 510,522 | |
The Home Depot, Inc. | | | 2,030 | | | | 357,036 | |
International Speedway Corp., Class A | | | 5,124 | | | | 192,201 | |
Johnson Outdoors, Inc., Class A | | | 3,467 | | | | 261,100 | |
Liberty Media Corp-Liberty SiriusXM* | | | 19,050 | | | | 785,622 | |
Lowe’s Cos., Inc. | | | 6,998 | | | | 666,349 | |
MCBC Holdings, Inc.* | | | 13,820 | | | | 410,178 | |
Penn National Gaming, Inc.* | | | 10,642 | | | | 258,388 | |
Ross Stores, Inc. | | | 3,534 | | | | 349,866 | |
Standard Motor Products, Inc. | | | 3,900 | | | | 211,029 | |
Stoneridge, Inc.* | | | 6,312 | | | | 160,388 | |
The Walt Disney Co. | | | 376 | | | | 43,176 | |
Total Consumer Discretionary | | | | | | | 9,449,803 | |
Consumer Staples—7.0% | | | | | | | | |
Central Garden & Pet Co.*,1 | | | 8,781 | | | | 285,207 | |
Central Garden & Pet Co., Class A* | | | 11,889 | | | | 352,509 | |
The Coca-Cola Co. | | | 1,355 | | | | 64,878 | |
Medifast, Inc. | | | 7,456 | | | | 1,578,286 | |
National Beverage Corp.*,1 | | | 6,098 | | | | 563,760 | |
The Procter & Gamble Co. | | | 1,627 | | | | 144,282 | |
Tyson Foods, Inc., Class A | | | 16,596 | | | | 994,432 | |
US Foods Holding Corp.* | | | 23,659 | | | | 690,133 | |
| | | | | | | | |
| | | Shares | | | Value | |
USANA Health Sciences, Inc.* | | | 4,059 | | | $ | 474,984 | |
Total Consumer Staples | | | | | | | 5,148,471 | |
Energy—5.2% | | | | | | | | |
Abraxas Petroleum Corp.* | | | 62,095 | | | | 114,255 | |
Chevron Corp. | | | 1,910 | | | | 213,252 | |
Exxon Mobil Corp. | | | 14,541 | | | | 1,158,627 | |
Marathon Petroleum Corp. | | | 9,400 | | | | 662,230 | |
Matrix Service Co.* | | | 1,221 | | | | 24,823 | |
Phillips 66 | | | 4,600 | | | | 472,972 | |
Renewable Energy Group, Inc.* | | | 4,518 | | | | 140,419 | |
Valero Energy Corp. | | | 5,800 | | | | 528,322 | |
W&T Offshore, Inc.*,1 | | | 67,152 | | | | 452,604 | |
Total Energy | | | | | | | 3,767,504 | |
Financials—14.3% | | | | | | | | |
Arch Capital Group, Ltd. (Bermuda)* | | | 35,100 | | | | 995,787 | |
Bank of America Corp. | | | 12,444 | | | | 342,210 | |
The Bank of NT Butterfield & Son, Ltd. (Bermuda) | | | 9,244 | | | | 372,441 | |
Berkshire Hathaway, Inc., Class B* | | | 10,287 | | | | 2,111,715 | |
Brown & Brown, Inc. | | | 50,972 | | | | 1,436,391 | |
Canadian Imperial Bank of Commerce (Canada) | | | 1,823 | | | | 157,361 | |
Citigroup, Inc. | | | 4,100 | | | | 268,386 | |
Discover Financial Services | | | 6,597 | | | | 459,613 | |
Employers Holdings, Inc. | | | 11,883 | | | | 546,143 | |
Enterprise Financial Services Corp. | | | 2,000 | | | | 86,900 | |
Erie Indemnity Co., Class A | | | 2,000 | | | | 259,380 | |
Everest Re Group, Ltd. (Bermuda) | | | 2,200 | | | | 479,292 | |
First Defiance Financial Corp. | | | 2,962 | | | | 80,626 | |
First Financial Corp. | | | 525 | | | | 24,076 | |
First Interstate BancSystem, Inc., Class A | | | 4,099 | | | | 169,945 | |
Houlihan Lokey, Inc. | | | 763 | | | | 31,420 | |
Investment Technology Group, Inc. | | | 22,783 | | | | 626,077 | |
JPMorgan Chase & Co. | | | 6,852 | | | | 747,005 | |
MGIC Investment Corp.* | | | 32,783 | | | | 400,280 | |
The Progressive Corp. | | | 5,338 | | | | 372,059 | |
Pzena Investment Management, Inc., Class A | | | 4,972 | | | | 50,018 | |
SunTrust Banks, Inc. | | | 3,197 | | | | 200,324 | |
Wells Fargo & Co. | | | 4,181 | | | | 222,555 | |
Total Financials | | | | | | | 10,440,004 | |
Health Care—14.9% | | | | | | | | |
Agilent Technologies, Inc. | | | 1,239 | | | | 80,275 | |
Amgen, Inc. | | | 6,296 | | | | 1,213,806 | |
AngioDynamics, Inc.* | | | 5,317 | | | | 108,626 | |
Anika Therapeutics, Inc.*,1 | | | 9,000 | | | | 321,840 | |
The accompanying notes are an integral part of these financial statements.
7
AMG FQ Tax-Managed U.S. Equity Fund
Schedule of Portfolio Investments (continued)
| | | | | | | | |
| | | Shares | | | Value | |
Health Care—14.9% (continued) | | | | | | | | |
Atrion Corp. | | | 251 | | | $ | 171,227 | |
Biogen, Inc.* | | | 1,735 | | | | 527,908 | |
Cantel Medical Corp. | | | 2,899 | | | | 229,456 | |
Cardiovascular Systems, Inc.* | | | 3,960 | | | | 111,078 | |
Catalent, Inc.* | | | 7,139 | | | | 287,987 | |
Centene Corp.* | | | 10,956 | | | | 1,427,786 | |
Charles River Laboratories International, Inc.* | | | 5,950 | | | | 724,829 | |
Genomic Health, Inc.* | | | 7,518 | | | | 539,116 | |
Haemonetics Corp.* | | | 2,051 | | | | 214,268 | |
HealthStream, Inc. | | | 5,434 | | | | 142,968 | |
IDEXX Laboratories, Inc.* | | | 353 | | | | 74,878 | |
Johnson & Johnson | | | 4,713 | | | | 659,773 | |
Ligand Pharmaceuticals, Inc.*,1 | | | 844 | | | | 139,100 | |
McKesson Corp. | | | 1,199 | | | | 149,587 | |
Medidata Solutions, Inc.* | | | 1,451 | | | | 102,005 | |
Medpace Holdings, Inc.* | | | 1,170 | | | | 60,957 | |
Merck & Co., Inc. | | | 684 | | | | 50,349 | |
OraSure Technologies, Inc.* | | | 9,021 | | | | 125,392 | |
Pfizer, Inc. | | | 5,778 | | | | 248,801 | |
The Providence Service Corp.* | | | 4,454 | | | | 294,365 | |
Simulations Plus, Inc. | | | 1,181 | | | | 23,868 | |
UnitedHealth Group, Inc. | | | 8,196 | | | | 2,142,025 | |
Vanda Pharmaceuticals, Inc.* | | | 7,412 | | | | 140,606 | |
WellCare Health Plans, Inc.* | | | 2,003 | | | | 552,808 | |
Total Health Care | | | | | | | 10,865,684 | |
Industrials—9.4% | | | | | | | | |
Alaska Air Group, Inc. | | | 17,680 | | | | 1,085,906 | |
Allison Transmission Holdings, Inc. | | | 22,735 | | | | 1,002,159 | |
Atkore International Group, Inc.* | | | 3,481 | | | | 67,044 | |
The Boeing Co. | | | 335 | | | | 118,878 | |
Brady Corp., Class A | | | 478 | | | | 19,259 | |
BWX Technologies, Inc. | | | 23,997 | | | | 1,402,865 | |
Continental Building Products, Inc.* | | | 23,030 | | | | 640,464 | |
Delta Air Lines, Inc. | | | 2,728 | | | | 149,303 | |
HEICO Corp., Class A | | | 387 | | | | 25,797 | |
Huntington Ingalls Industries, Inc. | | | 5,799 | | | | 1,266,966 | |
ICF International, Inc. | | | 1,569 | | | | 115,541 | |
Rush Enterprises, Inc., Class B | | | 5,151 | | | | 185,745 | |
Southwest Airlines Co. | | | 4,500 | | | | 220,950 | |
TPI Composites, Inc.*,1 | | | 1,903 | | | | 48,070 | |
TrueBlue, Inc.* | | | 3,374 | | | | 78,715 | |
| | | | | | | | |
| | | Shares | | | Value | |
UniFirst Corp. | | | 3,000 | | | $ | 447,900 | |
Total Industrials | | | | | | | 6,875,562 | |
Information Technology—23.1% | | | | | |
Appfolio, Inc., Class A* | | | 2,427 | | | | 138,582 | |
Apple, Inc. | | | 13,046 | | | | 2,855,248 | |
Aspen Technology, Inc.* | | | 3,817 | | | | 324,025 | |
CACI International, Inc., Class A* | | | 4,423 | | | | 789,329 | |
Care.com, Inc.* | | | 3,364 | | | | 59,206 | |
CDW Corp. | | | 8,540 | | | | 768,685 | |
Ciena Corp.*,1 | | | 4,568 | | | | 142,796 | |
Cisco Systems, Inc. | | | 2,779 | | | | 127,139 | |
Diodes, Inc.* | | | 1,286 | | | | 38,824 | |
Facebook, Inc., Class A* | | | 6,229 | | | | 945,500 | |
Intel Corp. | | | 3,793 | | | | 177,816 | |
KLA-Tencor Corp. | | | 2,029 | | | | 185,735 | |
Mastercard, Inc., Class A | | | 10,621 | | | | 2,099,453 | |
MAXIMUS, Inc. | | | 3,055 | | | | 198,483 | |
Micron Technology, Inc.* | | | 13,006 | | | | 490,586 | |
Microsoft Corp. | | | 27,500 | | | | 2,937,275 | |
NVIDIA Corp. | | | 211 | | | | 44,485 | |
Oracle Corp. | | | 583 | | | | 28,474 | |
PC Connection, Inc. | | | 1,741 | | | | 57,697 | |
Progress Software Corp. | | | 26,502 | | | | 851,774 | |
QAD, Inc., Class A | | | 9,851 | | | | 417,978 | |
Rudolph Technologies, Inc.* | | | 13,064 | | | | 271,601 | |
salesforce.com, Inc.* | | | 1,696 | | | | 232,759 | |
ServiceNow, Inc.* | | | 326 | | | | 59,019 | |
TechTarget, Inc.*,1 | | | 4,156 | | | | 84,450 | |
Twitter, Inc. * | | | 994 | | | | 34,541 | |
Virtusa Corp.* | | | 1,224 | | | | 60,698 | |
Visa, Inc., Class A | | | 16,768 | | | | 2,311,469 | |
XO Group, Inc.* | | | 2,200 | | | | 76,142 | |
Zynga, Inc., Class A* | | | 25,605 | | | | 93,202 | |
Total Information Technology | | | | | | | 16,902,971 | |
Materials—2.8% | | | | | | | | |
AdvanSix, Inc.* | | | 4,109 | | | | 113,984 | |
Boise Cascade Co.1 | | | 2,922 | | | | 89,968 | |
Cabot Corp. | | | 2,197 | | | | 106,950 | |
Graphic Packaging Holding Co.1 | | | 25,299 | | | | 278,542 | |
Louisiana-Pacific Corp. | | | 25,891 | | | | 563,647 | |
LyondellBasell Industries NV, Class A | | | 7,700 | | | | 687,379 | |
Verso Corp., Class A* | | | 6,451 | | | | 181,338 | |
Total Materials | | | | | | | 2,021,808 | |
The accompanying notes are an integral part of these financial statements.
8
AMG FQ Tax-Managed U.S. Equity Fund
Schedule of Portfolio Investments (continued)
| | | | | | | | |
| | | Shares | | | Value | |
Real Estate—3.4% | | | | | | | | |
American Homes 4 Rent, Class A, REIT | | | 11,900 | | | $ | 250,733 | |
American Tower Corp., REIT | | | 481 | | | | 74,945 | |
Equity Commonwealth, REIT | | | 1,867 | | | | 55,599 | |
Marcus & Millichap, Inc.* | | | 21,691 | | | | 753,111 | |
Park Hotels & Resorts, Inc., REIT | | | 20,815 | | | | 605,092 | |
The RMR Group, Inc., Class A | | | 9,585 | | | | 727,310 | |
Total Real Estate | | | | | | | 2,466,790 | |
Utilities—1.6% | | | | | | | | |
American Water Works Co., Inc. | | | 4,551 | | | | 402,900 | |
Hawaiian Electric Industries, Inc. | | | 10,503 | | | | 391,762 | |
NorthWestern Corp. | | | 328 | | | | 19,273 | |
Portland General Electric Co. | | | 1,009 | | | | 45,486 | |
UGI Corp. | | | 367 | | | | 19,473 | |
Vectren Corp. | | | 4,069 | | | | 291,056 | |
Total Utilities | | | | | | | 1,169,950 | |
Total Common Stocks
(Cost $45,804,598) | | | | | | | 72,393,714 | |
| |
| Principal
Amount |
| | | | |
Short-Term Investments—1.7% | | | | | |
Joint Repurchase Agreements—0.7%2 | | | | | |
Credit Suisse AG, dated 10/31/18, due 11/01/18, 2.190% total to be received $505,815 (collateralized by various U.S. Treasuries, 0.000% - 9.000%, 11/15/18 - 09/09/49, totaling $515,900) | | $ | 505,784 | | | | 505,784 | |
| * | Non-income producing security. |
| 1 | Some or all of these securities, amounting to $2,371,923 or 3.2% of net assets, were out on loan to various brokers and are collateralized by cash and various U.S. Treasury Obligations. See Note 4 of Notes to Financial Statements. |
| 2 | Cash collateral received from brokers for securities lending was invested in these joint repurchase agreements. |
| | | | | | | | |
| | | Shares | | | Value | |
Other Investment Companies—1.0% | | | | | | | | |
Dreyfus Government Cash Management Fund, Institutional Class Shares, 2.05%3 | | | 251,050 | | | $ | 251,050 | |
Dreyfus Institutional Preferred Government Money Market Fund, Institutional Class Shares, 2.12%3 | | | 251,050 | | | | 251,050 | |
JPMorgan U.S. Government Money Market Fund, IM Shares, 2.09%3 | | | 258,658 | | | | 258,658 | |
Total Other Investment Companies | | | | | | | 760,758 | |
Total Short-Term Investments
(Cost $1,266,542) | | | | | | | 1,266,542 | |
Total Investments—100.8% | | | | | | | | |
(Cost $47,071,140) | | | | | | | 73,660,256 | |
Other Assets, less Liabilities—(0.8)% | | | | (598,448 | ) |
Net Assets—100.0% | | | | | | $ | 73,061,808 | |
| 3 | Yield shown represents the October 31, 2018, seven day average yield, which refers to the sum of the previous seven days’ dividends paid, expressed as an annual percentage. |
REIT Real Estate Investment Trust.
The accompanying notes are an integral part of these financial statements.
9
AMG FQ Tax-Managed U.S. Equity Fund
Schedule of Portfolio Investments (continued)
The following table summarizes the inputs used to value the Fund’s investments by the fair value hierarchy levels as of October 31, 2018:
| | | | | | | | | | | | | | | | |
| | | Level 1 | | | Level 2 | | | Level 3 | | | Total | |
Investments in Securities | | | | | | | | | | | | | | | | |
Common Stocks† | | $ | 72,393,714 | | | | — | | | | — | | | $ | 72,393,714 | |
Short-Term Investments | | | | | | | | | | | | | | | | |
Joint Repurchase Agreements | | | — | | | $ | 505,784 | | | | — | | | | 505,784 | |
Other Investment Companies | | | 760,758 | | | | — | | | | — | | | | 760,758 | |
| | | | | | | | | | | | | | | | |
Total Investments in Securities | | $ | 73,154,472 | | | $ | 505,784 | | | | — | | | $ | 73,660,256 | |
| | | | | | | | | | | | | | | | |
| † | All common stocks held in the Fund are Level 1 securities. For a detailed breakout of common stocks by major industry classification, please refer to the Fund’s Schedule of Portfolio Investments. |
As of October 31, 2018, the Fund had no transfers between levels from the beginning of the reporting period.
The accompanying notes are an integral part of these financial statements.
10
AMG FQ Long-Short Equity Fund
Portfolio Manager’s Comments (unaudited)
OVERVIEW
For the fiscal year ended October 31, 2018, the AMG FQ Long-Short Equity Fund (the “Fund”) Class I returned 12.82%, significantly outperforming both the 6.60% for its primary benchmark, the Russell 3000® Index, and the 4.34% return of its secondary benchmark, an equally weighted average of the Russell 3000 Index and the ICE BofAML 0-3 Month U.S. Treasury Bill.
MARKET REVIEW
The U.S. equity market advanced throughout much of the reporting period. A comprehensive overhaul to the U.S. tax code in December 2017 created a tailwind for the domestic economy. The fiscal stimulus provided strong support for consumer and corporate spending and contributed to a general trend of strong earnings reports. Moreover, strong domestic macro data (low unemployment, a pickup in wage growth) provided a favorable economic backdrop for equity investors—particularly in contrast with other markets, which started to show signs of slowing growth.
Nevertheless, the U.S. equity market did experience a few significant downturns: February 2018, March 2018, and October 2018. During these episodes, investors worried about the prospects of a rising interest rate environment (though current rate levels continue to be supportive), as well as threats to domestic and global growth. Notably, the Fund outperformed the benchmark index in all three months, largely due to success in the dynamic, top-down part of its process.
FUND PERFORMANCE
The stock selection component of the Fund detracted modestly early in the period. The Fund’s net-long exposure to companies with recent positive performance (prompted by the Fund’s proprietary Market Sentiment signal) detracted modestly, since cash equity investors favored quality over momentum. This investor preference was perhaps due to considerable uncertainty surrounding domestic fiscal and monetary policy (coming through the debate around tax legislation, and speculation about how the U.S. Federal Reserve (the “Fed”) would set policy under new Chairman Powell).
However, this part of the process began to experience a turnaround in January 2018. The Fund’s net long exposure to the savings and loan industry benefited from heightened attention to the Fed’s plans to raise rates. Additionally, investors’ high tolerance for risk, spurred by several weeks of strong
equity performance, led to dampened preference for stability. The Fund maintained net short exposure to stocks that were undervalued relative to their dividend yield. This conviction paid off in January, as dividend yield as a risk factor underperformed.
This same net short exposure to dividend yield, however, was the primary driver behind negative performance for stock selection in April. Though some encouraging earnings reports offered motivation for risk-bearing behavior, investors also weighted rising tensions in the Middle East, as well as considerable uncertainty about global trading relationships. As a result, they still expressed some preference for fundamentals related to stability.
Over the summer, the Fund generally saw success in its stock selection. The Market Sentiment signal contributed to net long exposure to companies that were inexpensive relative to positive momentum. This positioning resulted in modest underperformance in June, as investors worried about the escalating trade war, but profited in August and September. Strong corporate earnings reinforced investor appetite for U.S. equity risk, particularly amid indications of a strong domestic economy. Furthermore, as described earlier in the discussion of dividend yield, the Fund’s stock selection maintained less of a tilt toward value than usual. As another expression of this view, it held net short exposure to stocks that were undervalued relative to their book/price metrics. Book/price significantly underperformed most other risk factors for much of 2018, so this exposure translated to gains for the Fund.
DYNAMIC TOP-DOWN VIEWS
The beta overlay experienced a few distinct episodes of performance. After a fairly quiet start to the period, the dynamic, top-down view on investor appetite for risk began to play more of a role. In January, the U.S. equity market had been experiencing a strong rally, fueled in part by a weakening U.S. dollar and speculation about the positive impact of fiscal stimulus. A top-down view, however, inferred that the equity price levels had overshot their appropriate levels (relative to fundamentals), and the Fund began to short the market. The short beta tilt initially detracted: The U.S. market continued to advance throughout January, with investor exuberance reinforced by comments from the Trump administration that appeared to favor an inexpensive currency.
As investor tolerance for risk began to decline again, however, the market stumbled and the relative underweight to equities profited. The market downturn culminated in a liquidity crisis in early February, at which point the beta management process neutralized its view. The liquidity crisis sparked broad concern that the correction could turn into a bear market, and prices continued to trend downward as risk appetite deteriorated further. Interestingly, the dynamic process now perceived an overshoot in the opposite direction, and increased the Fund’s exposure to equity beta mid-March. And as predicted, the U.S. equity market started to recover in April, with investor tolerance for risk supported by strong corporate earnings, optimism about trade relationships, recovering energy prices, and several indicators of a healthy U.S. economy.
Finally, toward the end of the period, U.S. equities came under pressure again. The Fed’s increasingly firm commitment to monetary tightening, in conjunction with mounting concern about the outlook for global growth, led to risk-off behavior. As a result, U.S. equities plunged alongside other risk assets for several weeks. The Fund saw opportunity in a long beta tilt, perceiving the market to be oversold. The positioning generated small gains when the market rebounded in the final days of the reporting period, but the overall outcome of the positioning remains to be seen.
OVERALL TRENDS
With respect to common risk factors, the Fund steadily increased its net short exposure to stocks that were undervalued relative to their book/price metrics. This risk factor performed extremely poorly over the reporting period, resulting in gains for the Fund. The Fund saw less success in its net short exposure to stocks that were undervalued relative to their dividend yield. As risk appetite deteriorated in October, investors began to pay more attention to stability, resulting in outperformance for companies that offered advantageous dividend payouts.
With respect to industries, the Fund strongly benefited from net long exposure to computer software, which received a lift from strong consumer demand for services such as cloud data storage. Additionally, for much of the period, equity investors displayed a preference for growth stocks. On the other hand, it was negatively impacted by its net long exposure to forest products. U.S. tariffs on Canadian lumber increased supply costs for this industry, serving as a drag on profitability.
11
AMG FQ Long-Short Equity Fund
Portfolio Manager’s Comments (continued)
OUTLOOK AND POSITIONING
The Fund’s quantitative signal continues to have higher-than-average exposure to growth stocks, driven by both price and earnings movements, improved fundamental quality, and reduced price volatility in growth stocks. The Fund increased its exposure to large-cap defensive stocks, as we believe positive economic information has become increasingly priced into the equity market. There has been a notable increase in exposure to household products driven by improved fundamentals, price
momentum, and prospects for growth. Exposure to tobacco has been reduced, driven by deterioration in fundamentals, valuation, and price momentum, accompanied by an increase in earnings and price volatility.
As a general rule, derivatives are an important instrument used to implement the Fund’s strategy. Specifically, equity index futures are used to gain economic exposure. The Fund also utilized total return swaps to gain exposure to the equity market, although the exposure was very small. Overall, the
liquidity and low transaction cost of this instrument offers the investment team the ability to be more nimble and to implement our investment strategy at a lower cost.
This commentary reflects the viewpoints of the portfolio manager, First Quadrant, L.P., as of October 31, 2018 and is not intended as a forecast or guarantee of future results, and is subject to change without notice.
12
AMG FQ Long-Short Equity Fund
Portfolio Manager’s Comments (continued)
CUMULATIVE TOTAL RETURN PERFORMANCE
AMG FQ Long-Short Equity Fund’s cumulative total return is based on the daily change in net asset value (NAV), and assumes that all dividends and distributions were reinvested. This graph compares a hypothetical $10,000 investment made in the AMG FQ Long-Short Equity Fund’s Class I shares on October 31, 2008 to a $10,000 investment made in the Russell 3000® Index for the same time period. The graph and table do not reflect the deduction of taxes that a shareholder would pay on a Fund distribution or redemption of shares. The listed returns for the Fund are net of expenses and the returns for the index exclude expenses. Total returns would have been lower had certain expenses not been reduced.
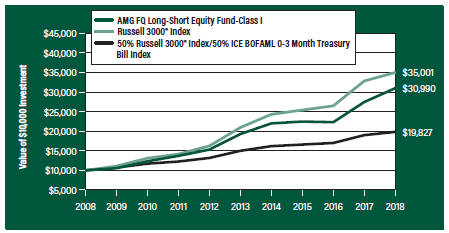
The table below shows the average annual total returns for the AMG FQ Long-Short Equity Fund and the Russell 3000® Index for the same time periods ended October 31, 2018.
| | | | | | | | | | | | |
| Average Annual Total Returns1 | | One Year | | | Five
Years | | | Ten Years | |
AMG FQ Long-Short Equity Fund2, 3, 4, 5, 6, 7, 8, 9, 10, 11 | | | | | | | | | | | | |
Class N | | | 12.54 | % | | | 9.64 | % | | | 11.66 | % |
Class I | | | 12.82 | % | | | 9.94 | % | | | 11.97 | % |
Russell 3000® Index12 | | | 6.60 | % | | | 10.81 | % | | | 13.35 | % |
50% Russell 3000® Index/50% ICE BofAML 0-3 Month U.S. Treasury Bill Index13 | | | 4.34 | % | | | 5.75 | % | | | 7.09 | % |
The performance data shown represents past performance. Past performance is not a guarantee of future results. Current performance may be lower or higher than the performance data quoted. The investment return and principal value of an investment will fluctuate so that an investor’s shares, when redeemed, may be worth more or less than their original cost.
Investors should carefully consider the Fund’s investment objectives, risks, charges and expenses before investing. For performance information through the most recent month end, current net asset values per share for the Fund and other information, please call 800.835.3879 or visit our website at amgfunds.com for a free prospectus. Read it carefully before investing or sending money.
Distributed by AMG Distributors, Inc., member FINRA/SIPC.
| 1 | Total return equals income yield plus share price change and assumes reinvestment of all dividends and capital gain distributions. Returns are net of fees and may reflect offsets of Fund expenses as described in the prospectus. No adjustment has been made for taxes payable by shareholders on their reinvested dividends and capital gain distributions. Returns for periods greater than one year are annualized. The listed returns on the Fund are net of expenses and based on the published NAV as of October 31, 2018. All returns are in U.S. dollars ($). |
| 2 | From time to time, the Fund’s advisor has waived its fees and/or absorbed Fund expenses, which has resulted in higher returns. |
| 3 | The Fund invests in large-capitalization companies that may underperform other stock funds (such as funds that focus on small- and medium-capitalization companies) when stocks of large-capitalization companies are out of favor. |
| 4 | The Fund may suffer significant losses on assets that it sells short. Unlike the possible loss on a security that is purchased, there is no limit on the amount of loss on an appreciating security that is sold short. |
| 5 | In managing the Fund, the Fund’s subadviser may rely heavily on one or more quantitative models (“Model”) and information and data supplied by third parties (“Data”). When a Model or Data used in managing the Fund contains an error, or is incorrect or incomplete, any investment decision made in reliance on the Model or Data may not produce the desired results and the Fund may realize losses. In addition, any hedging based on a faulty Model or Data may prove to be unsuccessful. |
| 6 | The use of leverage in a Fund’s strategy, such as futures, swaps and forward commitment transactions, can magnify relatively small market movements into relatively larger losses for the Fund. |
| 7 | The Fund is subject to risks associated with investments in small-capitalization companies, such as erratic earnings patterns, competitive conditions, limited earnings history and a reliance on one or a limited number of products. |
| 8 | The Fund is subject to risks associated with investments in mid-capitalization companies such as greater price volatility, lower trading volume, and less liquidity than the stocks of larger, more established companies. Growth stocks may under preform value stocks during given periods. |
| 9 | Active and frequent trading of a fund may result in higher transaction costs and increased tax liability. |
| 10 | The Fund is subject to special risk considerations similar to those associated with the direct ownership of real estate. Real estate valuations may be subject to factors such as changing general and local economic, financial, competitive, and environmental conditions. |
| 11 | The Fund may invest in derivatives such as options, futures and swaps; the complexity and rapidly changing structure of derivatives markets may increase the possibility of market losses. |
| 12 | The Russell 3000® Index is composed of the 3,000 largest U.S. companies as measured by market capitalization, and represents about 98% of the U.S. stock market. Unlike the Fund, the Russell 3000® |
13
[AMG FQ Long-Short Equity Fund]
[Portfolio Manager’s Comments] (continued)
| | Index is unmanaged, is not available for investment, and does not incur expenses. |
| 13 | ICE BofAML 0-3 Month U.S. Treasury Bill Index is comprised of a single issue purchased at the beginning of the month and held for a full month. At the end of the month that issue is sold and rolled into a newly selected issue. The issue selected at |
| | each month-end rebalancing is the outstanding Treasury Bill that matures closest to, but not beyond, three months from the rebalancing date. Unlike the Fund, the index is unmanaged, is not available for investment and does not incur expenses. |
| | The Russell 3000® Index is a trademark of the London Stock Exchange Group companies. |
Not FDIC insured, nor bank guaranteed. May lose value.
14
AMG FQ Long-Short Equity Fund
Fund Snapshots (unaudited)
October 31, 2018
| | | | | | | | | | | | |
Sector | | Long
Exposure1 | | | Short
Exposure1 | | | Net
Exposure1 | |
Financials | | | 8.5 | | | | (9.7 | ) | | | (1.2 | ) |
Real Estate | | | 8.0 | | | | (7.4 | ) | | | 0.6 | |
Information Technology | | | 7.7 | | | | (6.2 | ) | | | 1.5 | |
Consumer Discretionary | | | 7.0 | | | | (6.3 | ) | | | 0.7 | |
Industrials | | | 6.2 | | | | (7.0 | ) | | | (0.8 | ) |
Health Care | | | 3.5 | | | | (2.2 | ) | | | 1.3 | |
Utilities | | | 2.2 | | | | (1.9 | ) | | | 0.3 | |
Materials | | | 2.1 | | | | (2.7 | ) | | | (0.6 | ) |
Energy | | | 1.7 | | | | (1.4 | ) | | | 0.3 | |
Consumer Staples | | | 1.2 | | | | (1.7 | ) | | | (0.5 | ) |
Communication Services | | | 0.4 | | | | (0.5 | ) | | | (0.1 | ) |
Short Term Investments2 | | | 11.2 | | | | — | | | | 11.2 | |
Other Assets3,4 | | | 87.3 | | | | — | | | | 87.3 | |
| 1 | As a perecentage of net assets. |
| 2 | Includes reinvestment of cash collateral into joint repurchase agreements on security lending transactions. |
| 3 | Includes repayment of cash collateral on security lending transactions. |
| 4 | Incudes collateral for short sale and swaps. |
TOP TEN HOLDINGS
| | | | |
Security Name | | %of
Net Assets | |
PS Business Parks, Inc. | | | 1.1 | |
The Progressive Corp. | | | 1.0 | |
Ciena Corp. | | | 1.0 | |
UGI Corp. | | | 1.0 | |
Progress Software Corp. | | | 1.0 | |
Houlihan Lokey, Inc. | | | 1.0 | |
Rayonier, Inc. | | | 0.9 | |
MGIC Investment Corp. | | | 0.9 | |
Bluerock Residential Growth REIT, Inc.1 | | | 0.9 | |
Helen of Troy, Ltd. | | | 0.9 | |
| | | | |
Top Ten as a Group | | | 9.7 | |
| | | | |
| 1 | Represents security sold short. |
Because a fund’s strategy may result in multiple investments in particular sectors of the economy, its performance may depend on the performance of those sectors and may fluctuate more widely than investments diversified across more sectors. For additional information on these and other risk considerations, please see the Fund’s prospectus.
Any sectors, industries, or securities discussed should not be perceived as investment recommendations. Mention of a specific security should not be considered a recommendation to buy or solicitation to sell that security. Specific securities mentioned in this report may have been sold from the Fund’s portfolio of investments by the time you receive this report.
15
AMG FQ Long-Short Equity Fund
Schedule of Portfolio Investments
October 31, 2018
| | | | | | | | |
| | | Shares | | | Value | |
Long Positions - 59.7% | | | | | | | | |
Common Stocks - 48.5% | | | | | | | | |
Communication Services - 0.4% | | | | | |
Vonage Holdings Corp.*,1 | | | 27,720 | | | $ | 367,567 | |
Consumer Discretionary - 7.0% | | | | | |
Aaron’s, Inc. | | | 1,675 | | | | 78,943 | |
Asbury Automotive Group, Inc.*,2 | | | 4,027 | | | | 262,158 | |
Career Education Corp.*,1 | | | 2,234 | | | | 32,125 | |
Comcast Corp., Class A | | | 1,146 | | | | 43,708 | |
Core-Mark Holding Co., Inc. | | | 770 | | | | 29,576 | |
Deckers Outdoor Corp.*,1 | | | 2,819 | | | | 358,492 | |
Entravision Communications Corp., Class A | | | 37,383 | | | | 184,672 | |
Gentex Corp.1 | | | 29,321 | | | | 617,207 | |
Helen of Troy, Ltd.*,1 | | | 6,019 | | | | 747,078 | |
International Speedway Corp., Class A1 | | | 3,885 | | | | 145,726 | |
J. Jill, Inc.*,2 | | | 10,913 | | | | 55,111 | |
K12, Inc.* | | | 5,396 | | | | 115,528 | |
Liberty Expedia Holdings, Inc., Class A* | | | 5,225 | | | | 226,870 | |
Lowe’s Cos., Inc. | | | 2,527 | | | | 240,621 | |
MCBC Holdings, Inc.* | | | 8,031 | | | | 238,360 | |
MSG Networks, Inc., Class A*,2 | | | 9,296 | | | | 237,513 | |
NIKE, Inc., Class B1 | | | 6,431 | | | | 482,582 | |
Red Rock Resorts,Inc.,ClassA2 | | | 6,623 | | | | 153,256 | |
Ross Stores, Inc.1 | | | 5,823 | | | | 576,477 | |
Signet Jewelers, Ltd. | | | 670 | | | | 37,554 | |
Speedway Motorsports, Inc. | | | 13,970 | | | | 216,954 | |
Taylor Morrison Home Corp., Class A* | | | 12,374 | | | | 204,666 | |
Tilly’s, Inc., Class A | | | 361 | | | | 6,404 | |
The TJX Cos., Inc. | | | 1,539 | | | | 169,105 | |
Tower International, Inc. | | | 3,628 | | | | 107,715 | |
The Walt Disney Co. | | | 71 | | | | 8,153 | |
Total Consumer Discretionary | | | | | | | 5,576,554 | |
Consumer Staples - 1.2% | | | | | | | | |
Performance Food Group Co.*,1 | | | 13,337 | | | | 391,041 | |
The Kroger Co. | | | 709 | | | | 21,100 | |
United Natural Foods, Inc.*,1,2 | | | 8,649 | | | | 187,943 | |
US Foods Holding Corp.* | | | 5,853 | | | | 170,732 | |
USANA Health Sciences, Inc.*,1 | | | 1,555 | | | | 181,966 | |
Total Consumer Staples | | | | | | | 952,782 | |
Energy - 1.7% | | | | | | | | |
Adams Resources & Energy, Inc.1 | | | 770 | | | | 31,224 | |
CONSOL Energy, Inc.* | | | 287 | | | | 11,434 | |
Denbury Resources, Inc.*,2 | | | 2,240 | | | | 7,728 | |
| | | | | | | | |
| | | Shares | | | Value | |
Evolution Petroleum Corp.1 | | | 15,731 | | | $ | 162,029 | |
Helix Energy Solutions Group, Inc.*,2 | | | 10,229 | | | | 87,151 | |
Laredo Petroleum, Inc.*,2 | | | 19,939 | | | | 104,480 | |
Matrix Service Co.* | | | 6,992 | | | | 142,147 | |
NACCO Industries, Inc., Class A | | | 516 | | | | 17,823 | |
Peabody Energy Corp. | | | 8,599 | | | | 304,835 | |
Renewable Energy Group, Inc.*,1 | | | 13,214 | | | | 410,691 | |
W&T Offshore, Inc.*,2 | | | 11,743 | | | | 79,148 | |
Total Energy | | | | | | | 1,358,690 | |
Financials - 8.5% | | | | | | | | |
American Equity Investment Life Holding Co.1 | | | 12,561 | | | | 392,154 | |
Arthur J Gallagher & Co.1 | | | 8,367 | | | | 619,242 | |
Artisan Partners Asset Management, Inc., Class A | | | 930 | | | | 25,491 | |
The Bank of NT Butterfield & Son, Ltd. (Bermuda)1 | | | 15,350 | | | | 618,452 | |
Banner Corp.1 | | | 6,901 | | | | 399,016 | |
Cathay General Bancorp | | | 2,420 | | | | 91,161 | |
Cherry Hill Mortgage Investment Corp., REIT | | | 5,618 | | | | 100,618 | |
Discover Financial Services | | | 1,642 | | | | 114,398 | |
Employers Holdings, Inc.1 | | | 8,984 | | | | 412,905 | |
Enova International, Inc.* | | | 5,167 | | | | 122,200 | |
Essent Group, Ltd.* | | | 8,096 | | | | 319,144 | |
Evercore, Inc., Class A | | | 1,940 | | | | 158,479 | |
Federated Investors, Inc., Class B | | | 11,339 | | | | 279,733 | |
Fidelity National Financial, Inc. | | | 122 | | | | 4,081 | |
Financial Institutions, Inc. | | | 728 | | | | 20,784 | |
First American Financial Corp. | | | 212 | | | | 9,398 | |
Green Dot Corp., Class A* | | | 1,628 | | | | 123,305 | |
Houlihan Lokey, Inc.1 | | | 18,600 | | | | 765,948 | |
International Bancshares Corp. | | | 3,541 | | | | 137,037 | |
Kemper Corp. | | | 573 | | | | 43,084 | |
MGIC Investment Corp.*,1 | | | 61,824 | | | | 754,871 | |
National General Holdings Corp. | | | 571 | | | | 15,908 | |
The Progressive Corp.1 | | | 11,647 | | | | 811,796 | |
Pzena Investment Management, Inc., Class A | | | 20,291 | | | | 204,127 | |
SEI Investments Co. | | | 1,942 | | | | 103,800 | |
Silvercrest Asset Management Group, Inc., Class A2 | | | 3,722 | | | | 53,522 | |
Universal Insurance Holdings, Inc. | | | 2,831 | | | | 118,845 | |
Total Financials | | | | | | | 6,819,499 | |
Health Care - 3.5% | | | | | | | | |
Acorda Therapeutics, Inc.*,2 | | | 3,527 | | | | 67,401 | |
Amedisys, Inc.*,1 | | | 4,788 | | | | 526,680 | |
Biogen, Inc.* | | | 198 | | | | 60,245 | |
The accompanying notes are an integral part of these financial statements.
16
AMG FQ Long-Short Equity Fund
Schedule of Portfolio Investments (continued)
| | | | | | | | |
| | | Shares | | | Value | |
Health Care - 3.5% (continued) | | | | | | | | |
Cardiovascular Systems, Inc.* | | | 3,822 | | | $ | 107,207 | |
Evolent Health, Inc., Class A*,2 | | | 370 | | | | 8,214 | |
Genomic Health, Inc.*,1 | | | 4,735 | | | | 339,547 | |
Haemonetics Corp.* | | | 491 | | | | 51,295 | |
Halozyme Therapeutics, Inc.* | | | 6,494 | | | | 100,852 | |
HealthEquity, Inc.* | | | 3,644 | | | | 334,519 | |
Horizon Pharma PLC* | | | 1,280 | | | | 23,309 | |
Ligand Pharmaceuticals, Inc.*,2 | | | 2,292 | | | | 377,745 | |
Loxo Oncology, Inc.*,2 | | | 311 | | | | 47,477 | |
Mallinckrodt PLC* | | | 6,003 | | | | 150,435 | |
Medpace Holdings, Inc.* | | | 3,752 | | | | 195,479 | |
UnitedHealth Group, Inc. | | | 629 | | | | 164,389 | |
Vanda Pharmaceuticals, Inc.* | | | 5,591 | | | | 106,061 | |
Vertex Pharmaceuticals, Inc.*,1 | | | 791 | | | | 134,043 | |
Zoetis, Inc. | | | 504 | | | | 45,436 | |
Total Health Care | | | | | | | 2,840,334 | |
Industrials - 6.2% | | | | | | | | |
Albany International Corp., Class A | | | 58 | | | | 4,059 | |
Allison Transmission Holdings, Inc.1 | | | 16,419 | | | | 723,750 | |
ArcBest Corp.2 | | | 3,090 | | | | 114,701 | |
Armstrong World Industries, Inc.* | | | 737 | | | | 45,510 | |
Atkore International Group, Inc.* | | | 13,713 | | | | 264,112 | |
Avis Budget Group, Inc.*,1 | | | 9,492 | | | | 266,915 | |
Brady Corp., Class A1 | | | 2,122 | | | | 85,495 | |
Comfort Systems USA, Inc. | | | 534 | | | | 28,558 | |
Continental Building Products, Inc.*,1 | | | 25,478 | | | | 708,543 | |
EMCOR Group, Inc.1 | | | 8,190 | | | | 581,326 | |
FTI Consulting, Inc.* | | | 2,077 | | | | 143,541 | |
Generac Holdings, Inc.* | | | 3,231 | | | | 163,909 | |
HD Supply Holdings, Inc.*,1 | | | 4,150 | | | | 155,916 | |
Interface, Inc. | | | 4,226 | | | | 68,842 | |
JetBlue Airways Corp.* | | | 15,663 | | | | 262,042 | |
Kimball International, Inc., Class B | | | 1,199 | | | | 19,736 | |
Masonite International Corp.* | | | 1,678 | | | | 92,944 | |
Moog, Inc., Class A | | | 2,142 | | | | 153,260 | |
Pentair PLC (United Kingdom) | | | 108 | | | | 4,336 | |
PGT Innovations, Inc.* | | | 3,390 | | | | 68,681 | |
Southwest Airlines Co. | | | 3,928 | | | | 192,865 | |
The Toro Co.1 | | | 7,487 | | | | 421,743 | |
TriNet Group, Inc.* | | | 205 | | | | 9,633 | |
TrueBlue, Inc.*,1 | | | 13,352 | | | | 311,502 | |
United Continental Holdings, Inc.* | | | 588 | | | | 50,280 | |
| | | | | | | | |
| | | Shares | | | Value | |
YRC Worldwide, Inc.*,1,2 | | | 4,288 | | | $ | 35,419 | |
Total Industrials | | | | | | | 4,977,618 | |
Information Technology - 7.7% | | | | | | | | |
Amkor Technology, Inc.* | | | 5,898 | | | | 42,171 | |
Aspen Technology, Inc.*,1 | | | 4,125 | | | | 350,171 | |
Blucora, Inc.* | | | 2,925 | | | | 84,591 | |
CDW Corp. 1 | | | 4,779 | | | | 430,158 | |
Ciena Corp.*,1,2 | | | 25,699 | | | | 803,351 | |
Endurance International Group Holdings, Inc.* | | | 28,769 | | | | 283,950 | |
Entegris, Inc. | | | 10,579 | | | | 280,767 | |
ePlus, Inc.* | | | 2,048 | | | | 173,834 | |
EVERTEC, Inc. (Puerto Rico)1 | | | 25,480 | | | | 664,518 | |
Intuit, Inc. | | | 204 | | | | 43,044 | |
Lumentum Holdings, Inc.*,2 | | | 1,281 | | | | 70,007 | |
MAXIMUS, Inc.1 | | | 7,230 | | | | 469,733 | |
Micron Technology, Inc.*,1 | | | 18,963 | | | | 715,284 | |
Nanometrics, Inc.* | | | 3,702 | | | | 118,686 | |
Presidio, Inc. | | | 529 | | | | 7,089 | |
Progress Software Corp.1 | | | 24,306 | | | | 781,195 | |
Sabre Corp.1 | | | 17,252 | | | | 425,262 | |
SailPoint Technologies Holding, Inc.* | | | 664 | | | | 17,290 | |
Semtech Corp.* | | | 2,896 | | | | 130,146 | |
SMART Global Holdings, Inc.*,2 | | | 665 | | | | 18,627 | |
Stamps.com, Inc.*,2 | | | 732 | | | | 147,988 | |
TTM Technologies, Inc.*,2 | | | 2,623 | | | | 30,689 | |
Yelp, Inc.* | | | 1,728 | | | | 73,993 | |
Total Information Technology | | | | | | | 6,162,544 | |
Materials - 2.1% | | | | | | | | |
Freeport-McMoRan, Inc. | | | 1,347 | | | | 15,693 | |
FutureFuel Corp. | | | 7,530 | | | | 123,492 | |
Louisiana-Pacific Corp.1 | | | 27,910 | | | | 607,601 | |
LyondellBasell Industries NV, Class A | | | 2,546 | | | | 227,281 | |
Reliance Steel & Aluminum Co.1 | | | 2,605 | | | | 205,587 | |
Trinseo, S.A.1 | | | 6,118 | | | | 329,638 | |
Verso Corp., Class A* | | | 5,923 | | | | 166,495 | |
Total Materials | | | | | | | 1,675,787 | |
Real Estate - 8.0% | | | | | | | | |
Chesapeake Lodging Trust, REIT | | | 7,097 | | | | 208,581 | |
Equity LifeStyle Properties, Inc., REIT | | | 2,810 | | | | 266,079 | |
First Industrial Realty Trust, Inc., REIT 1 | | | 23,214 | | | | 712,670 | |
Marcus & Millichap, Inc.*,1 | | | 17,234 | | | | 598,364 | |
Park Hotels & Resorts, Inc., REIT 1 | | | 15,211 | | | | 442,184 | |
Pebblebrook Hotel Trust, REIT 2 | | | 5,218 | | | | 175,899 | |
The accompanying notes are an integral part of these financial statements.
17
AMG FQ Long-Short Equity Fund
Schedule of Portfolio Investments (continued)
| | | | | | | | |
| | | Shares | | | Value | |
Real Estate - 8.0% (continued) | | | | | | | | |
PS Business Parks, Inc.,
REIT 1 | | | 6,472 | | | $ | 845,243 | |
Rayonier, Inc., REIT 1 | | | 25,283 | | | | 763,546 | |
The RMR Group, Inc., Class A1 | | | 6,844 | | | | 519,323 | |
Ryman Hospitality Properties, Inc., REIT 1 | | | 7,646 | | | | 593,253 | |
Sunstone Hotel Investors, Inc., REIT 1 | | | 41,561 | | | | 601,388 | |
Terreno Realty Corp., REIT | | | 6,559 | | | | 245,503 | |
Xenia Hotels & Resorts, Inc., REIT 1 | | | 21,283 | | | | 437,366 | |
Total Real Estate | | | | | | | 6,409,399 | |
Utilities - 2.2% | | | | | | | | |
NorthWestern Corp.1 | | | 6,798 | | | | 399,450 | |
Portland General Electric Co.1 | | | 12,960 | | | | 584,237 | |
UGI Corp.1 | | | 14,733 | | | | 781,733 | |
Total Utilities | | | | | | | 1,765,420 | |
Total Common Stocks | | | | | | | | |
(Cost $41,647,299) | | | | | | | 38,906,194 | |
| | |
| | | Principal
Amount | | | | |
Short-Term Investments - 11.2% | | | | | |
Joint Repurchase Agreements - 0.2%3 | | | | | |
Citibank N.A., dated 10/31/18, due 11/01/18, 2.200% total to be received $160,214 (collateralized by various U.S. Treasuries, 0.000% - 8.750%, 03/07/19 - 09/09/49, totaling $163,408) | | $ | 160,204 | | | | 160,204 | |
| | |
| | | Shares | | | | |
Other Investment Companies - 11.0% | |
Dreyfus Government Cash Management Fund, Institutional Class Shares, 2.05%4 | | | 2,913,927 | | | | 2,913,927 | |
Dreyfus Institutional Preferred Government Money Market Fund, Institutional Class Shares,
2.12%4 | | | 2,913,927 | | | | 2,913,927 | |
JPMorgan U.S. Government Money Market Fund, IM Shares, 2.09%4 | | | 3,002,228 | | | | 3,002,228 | |
Total Other Investment Companies | | | | | | | 8,830,082 | |
Total Short-Term Investments | | | | | | | | |
(Cost $8,990,286) | | | | | | | 8,990,286 | |
Total Investments - 59.7% | | | | | | | | |
(Cost $50,637,585) | | | | | | | 47,896,480 | |
Short Sales - (47.0%)5 | | | | | | | | |
Common Stocks - (47.0%) | | | | | |
Communication Services - (0.5%) | | | | | |
ORBCOMM, Inc. * | | | (40,281 | ) | | | (383,878 | ) |
Consumer Discretionary - (6.3%) | | | | | |
Caesars Entertainment Corp. * | | | (45,760 | ) | | | (393,078 | ) |
Carvana Co. * | | | (4,158 | ) | | | (161,123 | ) |
| | | | | | | | |
| | | Shares | | | Value | |
Century Casinos, Inc. * | | | (6,789 | ) | | $ | (42,363 | ) |
Cooper Tire & Rubber Co. | | | (10,379 | ) | | | (320,607 | ) |
Dine Brands Global, Inc. | | | (2,482 | ) | | | (201,141 | ) |
Entercom Communications Corp., Class A | | | (80,878 | ) | | | (524,898 | ) |
Gaia, Inc. * | | | (45,722 | ) | | | (667,999 | ) |
Hamilton Beach Brands Holding Co., Class A | | | (9,062 | ) | | | (210,420 | ) |
Liquidity Services, Inc. * | | | (802 | ) | | | (4,764 | ) |
Mattel, Inc. * | | | (44,803 | ) | | | (608,425 | ) |
Meredith Corp. | | | (11,374 | ) | | | (586,444 | ) |
Motorcar Parts of America, Inc. * | | | (17,952 | ) | | | (380,223 | ) |
The New Home Co, Inc. * | | | (53,205 | ) | | | (379,352 | ) |
Noodles & Co. * | | | (10,294 | ) | | | (97,073 | ) |
Shake Shack, Inc., Class A * | | | (1,516 | ) | | | (80,181 | ) |
Superior Industries International, Inc. | | | (10,980 | ) | | | (107,933 | ) |
Tempur Sealy International, Inc. * | | | (2,437 | ) | | | (112,614 | ) |
Tesla, Inc. * | | | (476 | ) | | | (160,564 | ) |
Wayfair, Inc., Class A * | | | (284 | ) | | | (31,322 | ) |
Total Consumer Discretionary | | | | | | | (5,070,524 | ) |
Consumer Staples - (1.7%) | | | | | | | | |
Bunge, Ltd. | | | (6,609 | ) | | | (408,436 | ) |
Campbell Soup Co. | | | (2,815 | ) | | | (105,309 | ) |
Coty, Inc., Class A | | | (57,234 | ) | | | (603,819 | ) |
Farmer Brothers Co. * | | | (9,944 | ) | | | (239,750 | ) |
Total Consumer Staples | | | | | | | (1,357,314 | ) |
Energy - (1.4%) | | | | | | | | |
Alta Mesa Resources, Inc., Class A * | | | (8,216 | ) | | | (25,880 | ) |
Diamond Offshore Drilling, Inc. * | | | (2,323 | ) | | | (32,940 | ) |
Green Plains, Inc. | | | (4,787 | ) | | | (81,571 | ) |
International Seaways, Inc. * | | | (32,471 | ) | | | (698,451 | ) |
Nabors Industries, Ltd. | | | (22,856 | ) | | | (113,594 | ) |
SEACOR Marine Holdings, Inc. * | | | (1,919 | ) | | | (35,079 | ) |
SemGroup Corp., Class A | | | (2,765 | ) | | | (51,125 | ) |
Targa Resources Corp. | | | (1,747 | ) | | | (90,268 | ) |
Total Energy | | | | | | | (1,128,908 | ) |
Financials - (9.7%) | | | | | | | | |
AGNC Investment Corp., REIT | | | (12,528 | ) | | | (223,500 | ) |
American International Group, Inc. | | | (13,102 | ) | | | (540,982 | ) |
Arlington Asset Investment Corp., Class A | | | (18,721 | ) | | | (157,444 | ) |
ARMOUR Residential REIT, Inc. | | | (10,518 | ) | | | (229,082 | ) |
Associated Capital Group, Inc., Class A | | | (13,613 | ) | | | (527,640 | ) |
Banc of California, Inc. | | | (23,132 | ) | | | (368,955 | ) |
Brighthouse Financial, Inc. * | | | (8,214 | ) | | | (325,521 | ) |
Byline Bancorp, Inc. * | | | (1,739 | ) | | | (38,258 | ) |
The accompanying notes are an integral part of these financial statements.
18
AMG FQ Long-Short Equity Fund
Schedule of Portfolio Investments (continued)
| | | | | | | | |
| | | Shares | | | Value | |
Financials - (9.7%) (continued) | | | | | | | | |
Cowen, Inc. * | | | (5,605 | ) | | $ | (82,954 | ) |
eHealth, Inc. * | | | (7,243 | ) | | | (248,869 | ) |
First Bank/Hamilton NJ | | | (4,457 | ) | | | (52,949 | ) |
GAIN Capital Holdings, Inc. | | | (13,552 | ) | | | (103,537 | ) |
Greenhill & Co., Inc. | | | (844 | ) | | | (18,610 | ) |
Greenlight Capital Re, Ltd., Class A (Cayman Islands)* | | | (58,831 | ) | | | (681,851 | ) |
Hallmark Financial Services, Inc. * | | | (8,317 | ) | | | (92,651 | ) |
Hannon Armstrong Sustainable Infrastructure Capital, Inc., REIT | | | (22,282 | ) | | | (462,351 | ) |
HCI Group, Inc. | | | (6,835 | ) | | | (298,484 | ) |
Heritage Insurance Holdings, Inc. | | | (15,099 | ) | | | (210,782 | ) |
Howard Bancorp, Inc. * | | | (28,637 | ) | | | (455,615 | ) |
LendingClub Corp. * | | | (75,531 | ) | | | (243,965 | ) |
MBIA, Inc. * | | | (69,643 | ) | | | (689,466 | ) |
New York Community Bancorp, Inc. | | | (13,135 | ) | | | (125,833 | ) |
Ocwen Financial Corp. * | | | (26,933 | ) | | | (94,266 | ) |
PDL Community Bancorp * | | | (6,109 | ) | | | (83,754 | ) |
Republic First Bancorp, Inc. * | | | (13,685 | ) | | | (92,374 | ) |
Safeguard Scientifics, Inc. * | | | (77,991 | ) | | | (666,823 | ) |
Virtus Investment Partners, Inc. | | | (552 | ) | | | (54,836 | ) |
Westamerica Bancorporation | | | (1,574 | ) | | | (91,623 | ) |
WisdomTree Investments, Inc. | | | (60,776 | ) | | | (472,230 | ) |
Total Financials | | | | | | | (7,735,205 | ) |
Health Care - (2.2%) | | | | | | | | |
AAC Holdings, Inc. * | | | (7,677 | ) | | | (42,300 | ) |
Aclaris Therapeutics, Inc. * | | | (13,219 | ) | | | (157,174 | ) |
Adamas Pharmaceuticals, Inc. * | | | (11,231 | ) | | | (185,873 | ) |
Aerie Pharmaceuticals, Inc. * | | | (526 | ) | | | (27,973 | ) |
Agenus, Inc. * | | | (24,794 | ) | | | (39,422 | ) |
Bluebird Bio, Inc. * | | | (646 | ) | | | (74,096 | ) |
Community Health Systems, Inc. * | | | (44,524 | ) | | | (140,696 | ) |
The Cooper Cos, Inc. | | | (739 | ) | | | (190,891 | ) |
Dermira, Inc. * | | | (7,314 | ) | | | (91,791 | ) |
Evelo Biosciences, Inc. * | | | (6,489 | ) | | | (59,115 | ) |
Flexion Therapeutics, Inc. * | �� | | (5,575 | ) | | | (75,485 | ) |
Henry Schein, Inc. * | | | (2,304 | ) | | | (191,232 | ) |
Insmed, Inc. * | | | (483 | ) | | | (7,052 | ) |
Insulet Corp. * | | | (1,506 | ) | | | (132,844 | ) |
La Jolla Pharmaceutical Co. * | | | (3,273 | ) | | | (53,350 | ) |
The Medicines Co. * | | | (158 | ) | | | (3,675 | ) |
Melinta Therapeutics, Inc. * | | | (23,792 | ) | | | (62,573 | ) |
| | | | | | | | |
| | | Shares | | | Value | |
Molecular Templates, Inc. * | | | (3,484 | ) | | $ | (14,912 | ) |
Nuvectra Corp. * | | | (849 | ) | | | (16,988 | ) |
Paratek Pharmaceuticals, Inc. * | | | (4,369 | ) | | | (32,549 | ) |
Portola Pharmaceuticals, Inc. * | | | (1,075 | ) | | | (21,167 | ) |
Quorum Health Corp. * | | | (14,051 | ) | | | (55,923 | ) |
Radius Health, Inc. * | | | (4,966 | ) | | | (78,612 | ) |
TG Therapeutics, Inc. * | | | (4,119 | ) | | | (18,741 | ) |
Total Health Care | | | | | | | (1,774,434 | ) |
Industrials - (7.0%) | | | | | | | | |
Babcock & Wilcox Enterprises, Inc. * | | | (115,805 | ) | | | (113,211 | ) |
CECO Environmental Corp. * | | | (5,170 | ) | | | (38,465 | ) |
Charah Solutions, Inc. * | | | (17,722 | ) | | | (133,092 | ) |
CIRCOR International, Inc. | | | (15,168 | ) | | | (493,112 | ) |
Deere & Co. | | | (3,680 | ) | | | (498,419 | ) |
FreightCar America, Inc. * | | | (7,182 | ) | | | (102,703 | ) |
General Electric Co. | | | (57,644 | ) | | | (582,204 | ) |
Great Lakes Dredge & Dock Corp. * | | | (10,851 | ) | | | (63,044 | ) |
HC2 Holdings, Inc. * | | | (44,289 | ) | | | (230,303 | ) |
Johnson Controls International PLC | | | (6,425 | ) | | | (205,407 | ) |
The KeyW Holding Corp * | | | (22,069 | ) | | | (172,800 | ) |
Kirby Corp. * | | | (2,361 | ) | | | (169,850 | ) |
LSC Communications, Inc. | | | (27,261 | ) | | | (257,071 | ) |
Macquarie Infrastructure Corp. | | | (15,512 | ) | | | (573,168 | ) |
Multi-Color Corp. | | | (530 | ) | | | (28,175 | ) |
NN, Inc. | | | (41,395 | ) | | | (480,182 | ) |
Northwest Pipe Co. * | | | (29,134 | ) | | | (518,876 | ) |
RR Donnelley & Sons Co. | | | (32,571 | ) | | | (191,192 | ) |
Sun Hydraulics Corp. | | | (5,312 | ) | | | (246,477 | ) |
Sunrun, Inc. * | | | (1,453 | ) | | | (17,814 | ) |
Textainer Group Holdings, Ltd. * | | | (11,057 | ) | | | (129,699 | ) |
Valmont Industries, Inc. | | | (3,180 | ) | | | (395,306 | ) |
Total Industrials | | | | | | | (5,640,570 | ) |
Information Technology - (6.2%) | | | | | |
2U, Inc. * | | | (1,080 | ) | | | (67,943 | ) |
Adesto Technologies Corp. * | | | (30,344 | ) | | | (121,073 | ) |
Calix, Inc. * | | | (12,779 | ) | | | (93,287 | ) |
Cray, Inc. * | | | (4,048 | ) | | | (91,849 | ) |
Cree, Inc. * | | | (1,163 | ) | | | (45,148 | ) |
Digimarc Corp. * | | | (7,462 | ) | | | (187,520 | ) |
Exela Technologies, Inc. * | | | (37,821 | ) | | | (230,708 | ) |
Fitbit, Inc., Class A * | | | (15,547 | ) | | | (73,537 | ) |
Gartner, Inc. * | | | (2,332 | ) | | | (344,017 | ) |
Instructure, Inc. * | | | (615 | ) | | | (22,964 | ) |
The accompanying notes are an integral part of these financial statements.
19
AMG FQ Long-Short Equity Fund
Schedule of Portfolio Investments (continued)
| | | | | | | | |
| | | Shares | | | Value | |
Information Technology - (6.2%) (continued) | | | | | | | | |
Internap Corp. * | | | (12,592 | ) | | $ | (107,913 | ) |
Iteris, Inc. * | | | (22,828 | ) | | | (98,617 | ) |
Kopin Corp. * | | | (281,482 | ) | | | (627,705 | ) |
Leaf Group, Ltd. * | | | (10,000 | ) | | | (87,500 | ) |
Maxwell Technologies, Inc. * | | | (197,945 | ) | | | (581,958 | ) |
Microchip Technology, Inc. | | | (1,258 | ) | | | (82,751 | ) |
NeoPhotonics Corp. * | | | (8,868 | ) | | | (70,944 | ) |
Nutanix, Inc., Class A * | | | (137 | ) | | | (5,687 | ) |
Park Electrochemical Corp. | | | (21,017 | ) | | | (371,160 | ) |
PROS Holdings, Inc. * | | | (2,782 | ) | | | (91,583 | ) |
Switch, Inc., Class A | | | (5,643 | ) | | | (50,053 | ) |
Telenav, Inc. * | | | (19,014 | ) | | | (81,000 | ) |
USA Technologies, Inc. * | | | (12,837 | ) | | | (74,455 | ) |
ViaSat, Inc. * | | | (11,144 | ) | | | (710,542 | ) |
Xerox Corp. | | | (21,999 | ) | | | (613,112 | ) |
Total Information Technology | | | | | | | (4,933,026 | ) |
Materials - (2.7%) | | | | | | | | |
AK Steel Holding Corp. * | | | (5,866 | ) | | | (21,704 | ) |
Albemarle Corp. | | | (5,886 | ) | | | (584,009 | ) |
Crown Holdings, Inc. * | | | (14,757 | ) | | | (624,074 | ) |
Flotek Industries, Inc. * | | | (60,342 | ) | | | (109,219 | ) |
FMC Corp. | | | (2,669 | ) | | | (208,395 | ) |
Innophos Holdings, Inc. | | | (2,333 | ) | | | (68,357 | ) |
LSB Industries, Inc. * | | | (20,392 | ) | | | (154,979 | ) |
Tahoe Resources, Inc. * | | | (94,953 | ) | | | (225,039 | ) |
US Concrete, Inc. * | | | (5,184 | ) | | | (169,206 | ) |
Total Materials | | | | | | | (2,164,982 | ) |
Real Estate - (7.4%) | | | | | | | | |
American Realty Investors, Inc. * | | | (1,114 | ) | | | (16,899 | ) |
| * | Non-income producing security. |
| 1 | Security position is either entirely or partially held in a segregated account as collateral for securities sold short, swaps and futures contracts. As of October 31, 2018, value of securities held in the segregated account was $24,157,407. |
| 2 | Some or all of these securities, amounting to $2,085,671 or 2.6% of net assets, were out on loan to various brokers and are collateralized by cash and various U.S. Treasury Obligations. See Note 4 of Notes to Financial Statements. |
| 3 | Cash collateral received from brokers for securities lending was invested in these joint repurchase agreements. |
| | | | | | | | |
| | | Shares | | | Value | |
Bluerock Residential Growth REIT, Inc. | | | (79,042 | ) | | $ | (748,528 | ) |
CBL & Associates Properties, Inc., REIT | | | (184,084 | ) | | | (607,477 | ) |
Colony Capital, Inc., REIT | | | (31,309 | ) | | | (183,784 | ) |
Front Yard Residential Corp., REIT (Virgin Islands, U.S.) | | | (69,573 | ) | | | (644,942 | ) |
Gladstone Land Corp., REIT | | | (4,362 | ) | | | (54,569 | ) |
Government Properties Income Trust, REIT | | | (49,057 | ) | | | (433,173 | ) |
The Howard Hughes Corp * | | | (1,336 | ) | | | (148,991 | ) |
The Macerich Co., REIT | | | (13,646 | ) | | | (704,406 | ) |
Maui Land & Pineapple Co., Inc. * | | | (5,240 | ) | | | (59,055 | ) |
New Senior Investment Group, Inc., REIT | | | (106,472 | ) | | | (609,020 | ) |
Omega Healthcare Investors, Inc., REIT | | | (16,278 | ) | | | (542,871 | ) |
Preferred Apartment Communities, Inc., Class A, REIT | | | (24,856 | ) | | | (418,824 | ) |
SITE Centers Corp., REIT | | | (53,943 | ) | | | (670,511 | ) |
Stratus Properties, Inc. * | | | (1,861 | ) | | | (53,690 | ) |
Uniti Group, Inc., REIT * | | | (3,562 | ) | | | (68,177 | ) |
Total Real Estate | | | | | | | (5,964,917 | ) |
Utilities - (1.9%) | | | | | | | | |
AquaVenture Holdings, Ltd. * | | | (7,310 | ) | | | (122,442 | ) |
FirstEnergy Corp. | | | (1,936 | ) | | | (72,174 | ) |
Northwest Natural Holding Co. | | | (58 | ) | | | (3,758 | ) |
Pattern Energy Group, Inc., Class A | | | (29,036 | ) | | | (520,325 | ) |
Sempra Energy | | | (6,048 | ) | | | (666,006 | ) |
TerraForm Power, Inc., Class A | | | (13,404 | ) | | | (151,063 | ) |
Total Utilities | | | | | | | (1,535,768 | ) |
Total Common Stocks (Proceeds $(42,133,218)) | | | | | | | (37,689,526 | ) |
Total Short Sales - (47.0%)
(Proceeds $(42,133,218)) | | | | | | | (37,689,526 | ) |
Other Assets, less Liabilities - 87.3% | | | | 69,919,420 | |
Net Assets - 100.0% | | | | | | $ | 80,126,374 | |
| | | | |
4 Yield shown represents the October 31, 2018, seven day average yield, which refers to the sum of the previous seven days’ dividends paid, expressed as an annual percentage. 5 The Fund is contractually responsible to the lender for any dividends payable on securities while those securities are outstanding in short position. These dividends and interest amounts are recorded as interest and dividend expense on the Statement of Operations. REIT Real Estate Investment Trust |
| | | | | | | | | | | | | | | | | | | | | | | | |
| Open Futures Contracts | | | | | | | | | | | | | | | | | | | | | | | | |
| Description | | Currency | | | Number of
Contracts | | | Position | | | Expiration
Date | | | Current
Notional
Amount | | | Value and
Unrealized
Gain/(Loss) | |
S&P 500 E-Mini FUT Index | | | USD | | | | 952 | | | | Long | | | | 12/21/18 | | | $ | 129,048,360 | | | $ | (475,634 | ) |
The accompanying notes are an integral part of these financial statements.
20
AMG FQ Long-Short Equity Fund
Schedule of Portfolio Investments (continued)
Over-the-counter total return basket swap
| | | | | | | | | | | | |
| Counterparty | | Description | | Notional | | | Termination Date | | Value | |
Morgan Stanley & Co. | | The Fund pays the total return on a portfolio of short positions and receives the 1-Month LIBOR (+/- a spread). | | | (361,540 | ) | | 9/7/20 | | $ | 42,185 | |
| | | | | | | | | | | | |
| | | | | | | | | | $ | 42,185 | |
| | | | | | | | | | | | |
Components of over-the-counter total return basket swap
| | | | | | | | | | | | | | | | |
| Reference Entity | | Shares | | | Notional Value | | | Net Unrealized
Appreciation/
Depreciation | | | %of
Swap Value | |
Ameresco, Inc. | | | (1,356) | | | $ | (18,821) | | | $ | (3,376) | | | | (8.0) | |
The Andersons, Inc. | | | (577) | | | | (21,609) | | | | 837 | | | | 2.0 | |
B. Riley Financial, Inc. | | | (1,324) | | | | (29,724) | | | | 4,237 | | | | 10.1 | |
Digital Realty Trust, Inc. | | | (34) | | | | (3,726) | | | | 216 | | | | 0.5 | |
Drive Shack, Inc. | | | (4,547) | | | | (24,327) | | | | 45 | | | | 0.1 | |
The EW Scripps Co. | | | (1,001) | | | | (16,416) | | | | (420) | | | | (1.0) | |
FireEye, Inc. | | | (3,470) | | | | (58,851) | | | | (5,309) | | | | (12.6) | |
GTT Communications, Inc. | | | (190) | | | | (8,601) | | | | 1,780 | | | | 4.2 | |
Martin Marietta Materials, Inc. | | | (60) | | | | (11,121) | | | | 844 | | | | 2.0 | |
Neos Therapeutics, Inc. | | | (12,174) | | | | (56,853) | | | | 18,748 | | | | 44.5 | |
PHI, Inc. | | | (3,303) | | | | (31,808) | | | | 6,077 | | | | 14.4 | |
Sienna Biopharmaceuticals, Inc. | | | (384) | | | | (5,622) | | | | 2,077 | | | | 4.9 | |
TimkenSteel Corp. | | | (4,313) | | | | (64,350) | | | | 14,190 | | | | 33.6 | |
Triumph Group, Inc. | | | (428) | | | | (9,711) | | | | 1,900 | | | | 4.5 | |
| | | | | | | | | | | | | | | | |
Total short equity positions | | | | | | | | | | | 41,846 | | | | 99.2 | |
Financing | | | | | | | | | | | 339 | | | | 0.8 | |
| | | | | | | | | | | | | | | | |
| | | Total | | | | | | | $ | 42,185 | | | | 100.0 | |
| | | | | | | | | | | | | | | | |
The accompanying notes are an integral part of these financial statements.
21
AMG FQ Long-Short Equity Fund
Schedule of Portfolio Investments (continued)
The following table summarizes the inputs used to value the Fund’s investments by the fair value hierarchy levels as of October 31, 2018:
| | | | | | | | | | | | | | | | |
| | | Level 1 | | | Level 2 | | | Level 3 | | | Value | |
Investments in Securities | | | | | | | | | | | | | | | | |
Assets | | | | | | | | | | | | | | | | |
Common Stocks† | | $ | 38,906,194 | | | | — | | | | — | | | $ | 38,906,194 | |
Short-Term Investments | | | | | | | | | | | | | | | | |
Joint Repurchase Agreements | | | — | | | $ | 160,204 | | | | — | | | | 160,204 | |
Other Investment Companies | | | 8,830,082 | | | | — | | | | — | | | | 8,830,082 | |
| | | | | | | | | | | | | | | | |
Total Assets | | | 47,736,276 | | | | 160,204 | | | | — | | | | 47,896,480 | |
| | | | | | | | | | | | | | | | |
Liabilities | | | | | | | | | | | | | | | | |
Common Stocks† | | | (37,689,526) | | | | — | | | | — | | | | (37,689,526) | |
| | | | | | | | | | | | | | | | |
Net Investments in Securities | | $ | 10,046,750 | | | $ | 160,204 | | | | — | | | $ | 10,206,954 | |
| | | | | | | | | | | | | | | | |
Financial Derivative Instruments - Assets | | | | | | | | | | | | | | | | |
Equity Swap Contracts | | | — | | | $ | 42,185 | | | | — | | | $ | 42,185 | |
Financial Derivative Instruments - Liabilities | | | | | | | | | | | | | | | | |
Equity Futures Contracts | | $ | (475,634) | | | | — | | | | — | | | | (475,634) | |
| | | | | | | | | | | | | | | | |
Total Financial Derivative Instruments | | $ | (475,634) | | | $ | 42,185 | | | | — | | | $ | (433,449) | |
| | | | | | | | | | | | | | | | |
| † | All common stocks held in the Fund are Level 1 securities. For a detailed breakout of common stocks by major industry classification, please refer to the Fund’s Schedule of Portfolio Investments. |
As of October 31, 2018, the Fund had no transfers between levels from the beginning of the reporting period.
The accompanying notes are an integral part of these financial statements.
22
AMG FQ Long-Short Equity Fund
Schedule of Portfolio Investments (continued)
The following schedule shows the value of derivative instruments at October 31, 2018:
| | | | | | | | | | | | | | |
| | | Asset Derivatives | | | | | Liability Derivatives | | | | |
Derivatives not accounted
for as hedging instruments | | Statement of Assets and
Liabilities Location | | Fair Value | | | Statement of Assets and Liabilities Location | | | Fair Value | |
Equity contracts | | Swap at value | | $ | 42,185 | | | | Cash deposited with broker for futures contracts | 1 | | $ | 8,943,034 | |
| | | | | | | | | | | | | | |
| | Totals | | $ | 42,185 | | | | | | | $ | 8,943,034 | |
| | | | | | | | | | | | | | |
For the year ended October 31, 2018, the effect of derivative instruments on the Statement of Operations for the Fund and the amount of realized gain/loss and unrealized appreciation/depreciation on derivatives recognized in income was as follows:
| | | | | | | | | | | | | | | | |
| | | Realized Gain/Loss | | | | | | Change in Unrealized Appreciation/Depreciation | |
Derivatives not
accounted for as
hedging
instruments | | Statement of Operations Location | | | Realized
Gain/Loss | | | Statement of Operations
Location | | | Change in
Unrealized
Appreciation/
Depreciation | |
| | | | | | | | | | | Net change in unrealized appreciation/ | | | | | |
Equity contracts | | | Net realized gain on futures contracts | | | $ | 5,486,628 | | | | depreciation on futures contracts | | | $ | (1,725,061 | ) |
| | | Net realized loss on swaps | | | | (11,975 | ) | | | Net change in unrealized appreciation/depreciation on swaps | | | | 42,185 | |
| | | | | | | | | | | | | | | | |
| | | Totals | | | $ | 5,474,653 | | | | | | | $ | (1,682,876 | ) |
| | | | | | | | | | | | | | | | |
| 1 | Amount represents cash with futures broker and unrealized appreciation/depreciation on open futures contracts. See Note 9 for additional information. |
The accompanying notes are an integral part of these financial statements.
23
AMG FQ Global Risk-Balanced Fund
Portfolio Manager’s Comments (unaudited)
OVERVIEW
For the fiscal year ended October 31, 2018, the AMG FQ Global Risk-Balanced Fund (the “Fund”) Class Z returned (7.13)%, while the benchmark 60% MSCI World Index/40% Citigroup World Government Bond Index–Hedged returned 0.93%.
MARKETOVERVIEW
The Fund delivered negative performance for the fiscal year ending October 2018. This period was a disappointing one for many global investors, as most major asset classes struggled. Concerns about global growth worked against equity and commodity markets, while concerns about monetary tightening worked against bond markets. The Fund was delivering positive returns for the year-end period ending in September, but concerns about trade, global growth, and a rising-rate environment in the U.S. prompted several weeks of risk-off trading during October, resulting in a broad-based selloff of risk assets.
For the period, the First Quadrant Market Risk Indicator (MRI) identified a market environment that would absorb risk shocks efficiently. And indeed, for much of the reporting period, investor appetite for risk (across most asset classes) tended to rebound following risk-off events. In May, the MRI began to detect a potential shift in the ambient environment, observing that investors demanded a higher yield to assume credit risk (in response to deteriorating credit conditions, as well as concerns about global economic growth and rising rates). Later, in the reporting period’s final month, the MRI identified diminishing investor appetite for equity risk as well. Since these two shifts in conjunction represented a potential build-up in fundamental risks, the MRI reduced its tilt toward hedged growth and increased its defensive holdings.
As a general rule, derivatives are an important instrument used to implement the Fund’s investment strategy. Specifically, equity and bond futures are used to gain economic exposure, and equity options for risk management. Overall, the liquidity and low transaction cost of these instruments offers the investment team the ability to be more nimble and to implement our investment strategy at a lower cost.
PERFORMANCE REVIEW
Developed-market equities advanced for much of the period, but significant losses during October pushed performance in the asset class into negative territory. Though the Fund is diversified across developed markets, its overall performance in the asset class
was still heavily influenced by the U.S. market. The U.S. Federal Reserve (the “Fed”) continued to shift away from monetary stimulus, but fiscal stimulus provided a tailwind for the domestic economy. A comprehensive overhaul to the U.S. tax code benefited corporates both directly and indirectly, lessening costs and supporting consumer spending. Furthermore, the U.S. economy appeared healthy, with robust employment and a pickup in wage growth. In the period’s final month, however, the U.S. market sold off, with investors concerned about a rising-rate environment, a cooling housing market, and the November midterm elections. The U.S. selloff quickly reverberated throughout global equity markets and brought U.S. performance closer in line with that of other developed markets.
Non-U.S. developed-market equities, meanwhile, encountered more turbulence over the broader period. The European economy continued to weather significant political risks, as populist sentiment continued to threaten the long-term future of the European Union. And of course, the United Kingdom and Brussels continued to negotiate terms for the upcoming “Brexit.”
The ongoing trade wars also worked against emerging-market equities, which tend to rely heavily on commodity production. The tit-for-tat tariffs imposed by the U.S. and China continue to pose a significant threat to global demand, and emerging markets have been caught in the crossfire. Though Chinese exports have not yet declined precipitously, economic data (particularly gross domestic product (GDP) growth) has fueled concern about the overall health of the Chinese economy.
The Fund’s exposures to small-capitalization stocks and real estate investment trusts (REITs), meanwhile, contributed flat performance. “Small cap” equities had performed well throughout most of the reporting period but relinquished gains during the period’s final months. Small-cap companies tend to be predominantly influenced by domestic consumption, and had therefore been fairly insulated from trade-related concerns. However, as the Fed continued to raise short-term interest rates and U.S. treasury yields rose, small-cap stocks began to underperform their large-cap counterparts. Because smaller companies tend to maintain higher levels of debt, investor demand for their stocks is particularly sensitive to increases in borrowing costs. REITs experienced a similar reversal of fortune in the period’s final months. The prospects of a rising-rate
environment brought concern for property investment, as did a cooling housing market and the increased costs of construction materials.
In fixed income, nominal sovereign debt delivered neutral performance for the period. As several central banks shifted to the tightening phase of their monetary policy cycle, expectations of further rate hikes reduced demand for current debt issuances. On the other hand, episodic flight-to-liquidity behavior provided some positive support for the asset class when investor risk appetite deteriorated. Inflation-linked bond holdings fared better, providing the Fund’s strongest performance over the reporting period. Although these assets also faced headwinds from expectations of rate hikes, they benefited from expectations that U.S. price pressures would continue to build, as investors sought protection from mounting inflationary pressures. Finally, credit posted losses, largely due to defensive trading during the February and October selloffs of risk assets. Even in the period’s more risk-on environments, however, investor appetite for risk in the credit sector was relatively contained.
The Fund’s commodity exposure also detracted. Exposure to the asset class generated gains early in the period, when the outlook for global growth was more favorable. Positive momentum for the asset class was stalled in February, however, when deterioration in investor risk appetite resulted in broad losses across commodity sectors, particularly energy-related industries. And in the latter part of the period, the U.S. Dollar’s rebound and escalating trade tensions further pressured commodity prices, and the Fund’s commodity performance fell into negative territory.
OUTLOOK
At this time, the MRI continues to identify a resilient market environment, albeit one that is more susceptible to an accumulation of fundamental risks (relative to the start of the reporting period). As a result, though the Fund remains titled toward hedged growth, it has increased its risk allocation to defensive assets.
The underlying philosophy of the MRI is that markets become fragile when many risks become high simultaneously. Currently, only credit risk is high, while the other indicators (including equity volatility) remain below their critical levels. If this is the beginning of the end of the bull market, we believe the actual decline is still some months out, and the October selloff would be a preliminary tremor. In the near term, markets are likely to recover, although if
24
AMG FQ Global Risk-Balanced Fund
Portfolio Manager’s Comments (continued)
other fundamental risks continue to increase beyond their current levels, a catalyst of some kind could set off a risk cascade. On the other hand, it is also possible that the markets could rally, some of the political uncertainty could be resolved, and the
global economy begins to strengthen again. If so, the MRI will likely revert to a fully resilient reading, and the crisis will have been averted.
This commentary reflects the viewpoints of the portfolio manager, First Quadrant, L.P., as of October 31, 2018 and is not intended as a forecast or guarantee of future results, and is subject to change without notice
25
AMG FQ Global Risk-Balanced Fund
Portfolio Manager’s Comments (continued)
CUMULATIVE TOTAL RETURN PERFORMANCE
AMG FQ Global Risk-Balanced Fund’s cumulative total return is based on the daily change in net asset value (NAV), and assumes that all dividends and distributions were reinvested. This graph compares a hypothetical $10,000 investment made in the AMG FQ Global Risk Balanced Fund’s Class Z shares on October 31, 2008 to a $10,000 investment made in the 60% MSCI World Index & 40% FTSE World Government Bond Index-Hedged (“Composite Hedged Index”) and the 60% MSCI World Index & 40% FTSE World Government Bond Index-UnHedged (“Composite UnHedged Index”) and S&P 500® Index for the same time period. The graph and table do not reflect the deduction of taxes that a shareholder would pay on a Fund distribution or redemption of shares. The listed returns for the Fund are net of expenses and the returns for the index exclude expenses. Total returns would have been lower had certain expenses not been reduced.
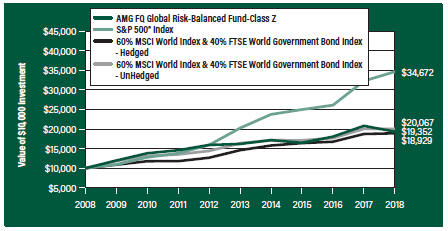
The table below shows the average annual total returns for the AMG FQ Global Risk-Balanced Fund and the AMG FQ Global Risk-Balanced Fund Composite Hedged and UnHedged Indexes and S&P 500® Index for the same time periods ended October 31, 2018.
| | | | | | | | | | | | | | | | | | | | |
| | | One | | | Five | | | Ten | | | Since | | | Inception | |
| Average Annual Total Returns1 | | Year | | | Years | | | Years | | | Inception | | | Date | |
AMG FQ Global Risk-Balanced Fund2, 3, 4, 5, 6, 7, 8, 9, 10, 11, 12, 13, 14 | | | | | |
Class N | | | (7.43 | %) | | | 3.12 | % | | | — | | | | 4.79 | % | | | 01/01/10 | |
Class I | | | (7.20 | %) | | | 3.51 | % | | | — | | | | 5.18 | % | | | 01/01/10 | |
Class Z | | | (7.13 | %) | | | 3.60 | % | | | 6.82 | % | | | 5.78 | % | | | 11/18/88 | |
Composite Hedged Index15 | | | 0.93 | % | | | 5.31 | % | | | 6.59 | % | | | 5.68 | % | | | 11/30/88 | 17 |
Composite UnHedged Index15 | | | 0.00 | % | | | 4.14 | % | | | 7.21 | % | | | 6.43 | % | | | 11/30/88 | 17 |
S&P 500 Index16 | | | 7.35 | % | | | 11.34 | % | | | 13.24 | % | | | 10.42 | % | | | 11/18/88 | † |
The performance data shown represents past performance. Past performance is not a guarantee of future results. Current performance may be lower or higher than the performance data quoted. The investment return and principal value of an investment will fluctuate so that an investor’s shares, when redeemed, may be worth more or less than their original cost.
Investors should carefully consider the Fund’s investment objectives, risks, charges and expenses before investing. For performance information through the most recent month end, current net asset values per share for the Fund and other information, please call 800.835.3879 or visit our website at amgfunds.com for a free prospectus. Read it carefully before investing or sending money.
Distributed by AMG Distributors, Inc., member FINRA/SIPC.
| † | Date reflects the inception date of the Fund, not the index. |
| 1 | Total return equals income yield plus share price change and assumes reinvestment of all dividends and capital gain distributions. Returns are net of fees and may reflect offsets of Fund expenses as described in the prospectus. No adjustment has been made for taxes payable by shareholders on their reinvested dividends and capital gain distributions. Returns for periods greater than one year are annualized. The listed returns on the Fund are net of expenses and based on the published NAV as of October 31, 2018. All returns are in U.S. dollars ($). |
| 2 | From time to time, the Fund’s advisor has waived its fees and/or absorbed Fund expenses, which has resulted in higher returns. |
| 3 | Investments in international securities are subject to certain risks of overseas investing including currency fluctuations and changes in political and economic conditions, which could result in significant market fluctuations. These risks are magnified in emerging markets. |
| 4 | The Fund is subject to currency risk resulting from fluctuations in exchange rates that may affect the total loss or gain on a non-U.S. Dollar investment when converted back to U.S. Dollars. |
| 5 | The use of leverage in a Fund’s strategy, such as futures and forward commitment transactions, can magnify relatively small market movements into relatively larger losses for the Fund. |
| 6 | The Fund is subject to special risk considerations similar to those associated with the direct ownership of real estate. Real estate valuations may be subject to factors such as changing general and local economic, financial, competitive and environmental conditions. |
| 7 | Because exchange-traded funds (ETFs) incur their own costs, investing in them could result in a higher cost to the investor. Additionally, the Fund will be indirectly exposed to all the risks of securities held by the ETFs. |
| 8 | Obligations of certain government agencies are not backed by the full faith and credit of the U.S. Government. If one of these agencies defaulted on a loan, there is no guarantee that the U.S. Government would provide financial support. Additionally, debt securities of the U.S. Government may be affected by changing interest rates and subject to prepayment risk. |
| 9 | The Fund is subject to risks associated with investments in small-capitalization companies, such as erratic earnings patterns, competitive conditions, limited earnings history, and a reliance on one or a limited number of products. |
| 10 | The Fund is subject to risks associated with |
26
AMG FQ Global Risk-Balanced Fund
Portfolio Manager’s Comments (continued)
| | investments in mid-capitalization companies such as greater price volatility, lower trading volume, and less liquidity than the stocks of larger, more established companies. Growth stocks may underperform value stocks during given periods |
| 11 | The Fund is subject to the risks associated with investments in emerging markets, such as erratic earnings patterns, economic and political instability, changing exchange controls, limitations on repatriation of foreign capital and changes in local governmental attitudes toward private investment, possibly leading to nationalization or confiscation of investor assets. |
| 12 | High-yield bonds (also known as “junk bonds”) may be subject to greater levels of interest rate, credit, and liquidity risk than investments in higher rated securities. These securities are considered predominantly speculative with respect to the issuer’s continuing ability to make principal and interest payments. The issuers of the Fund’s holdings may be involved in bankruptcy proceedings, reorganizations, or financial restructurings, and are not as strong financially as higher-rated issuers. |
| 13 | The Fund is subject to the risks associated with investments in debt securities, such as default risk and fluctuations in the perception of the debtor’s ability to pay its creditors. Changing interest rates may adversely affect the value of an investment. An increase in interest rates typically causes the value of bonds and other fixed-income securities to fall. |
| 14 | The Fund may invest in derivatives such as options and futures; the complexity and rapidly changing structure of derivatives markets may increase the possibility of market losses. |
| 15 | The benchmark is comprised of 60% MSCI World Index and 40% FTSE World Government Bond Index. The MSCI World Index is a free float-adjusted market capitalization weighted index that is designed to measure the equity market performance of developed markets. The MSCI World Index consists of 23 developed market country indices. Please go to msci.com for most current list of countries represented by the index. The FTSE World Government Bond Index (FTSE) measures the performance of fixed-rate, local currency, investment grade sovereign bonds. The FTSE is a widely used benchmark that currently comprises sovereign debt from over 20 countries, denominated in |
| | a variety of currencies, and has more than 25 years of history available. Prior to July 31, 2018, the FTSE World Government Bond Index was know as the Citigroup World Governmenr Bond Index. Unlike the Fund, the Composite Index is unmanaged, is not available for investment and does not incur fees. All MSCI data is provided ’as is.’ The products described herein are not sponsored or endorsed and have not been reviewed or passed on by MSCI. In no event shall MSCI, its affiliates, or any MSCI data provider have any liability of any kind in connection with the MSCI data or the products described herein. Copying or redistributing the MSCI data is strictly prohibited. |
| 16 | The S&P 500® Index is capitalization-weighted index of 500 stocks. The S&P 500® Index is designed to measure performance of the broad domestic economy through changes in the aggregate market value of 500 stocks representing all major industries. Unlike the Fund, the index are unmanaged, is not available for investment and do not incur expenses. |
| 17 | The date reflects the closest available index date to the Fund’s inception date. |
The S&P 500® Index is proprietary data of Standard & Poor’s, a division of McGraw-Hill Companies, Inc.
Not FDIC insured, nor bank guaranteed. May lose value.
27
AMG FQ Global Risk-Balanced Fund
Schedule of Portfolio Investments
October 31, 2018
| | | | | | | | |
| | | Shares | | | Value | |
Exchange Traded Funds—55.6% | | | | | |
iShares Global Infrastructure ETF1 | | | 22,933 | | | | $930,164 | |
iShares iBoxx $ High Yield Corporate Bond ETF1,2,3 | | | 153,397 | | | | 12,939,037 | |
iShares TIPS Bond ETF1,2 | | | 74,676 | | | | 8,127,736 | |
Materials Select Sector SPDR Fund1 | | | 18,307 | | | | 963,131 | |
SPDR Citi International Government Inflation-Protected Bond ETF2 | | | 30,756 | | | | 1,606,386 | |
VanEck Vectors Gold Miners ETF | | | 49,295 | | | | 933,154 | |
VanEck Vectors Natural Resource ETF | | | 27,046 | | | | 945,528 | |
Vanguard Global ex-U.S. Real Estate ETF1 | | | 6,114 | | | | 323,614 | |
Vanguard REIT ETF1,2 | | | 37,566 | | | | 2,942,169 | |
Total Exchange Traded Funds (Cost $30,396,511) | | | | | | | 29,710,919 | |
| | | Notes | | | | |
Exchange Traded Notes—9.8% | | | | | | | | |
Deutsche Bank AG, PowerShares DB Gold Double Long, 02/15/38* | | | 49,764 | | | | 1,050,020 | |
iPath Bloomberg Commodity Index Total Return ETN, 06/12/36* | | | 85,188 | | | | 1,972,954 | |
Swedish Export Credit Corp., ELEMENTS Linked to the Rogers International Commodity Index Total Return, 10/24/22* | | | 389,246 | | | | 2,105,821 | |
VelocityShares 3x Long Crude Oil ETN, 02/09/32* | | | 4,004 | | | | 122,002 | |
Total Exchange Traded Notes (Cost $5,397,005) | | | | | | | 5,250,797 | |
Purchased Options—1.5% | | | | | | | | |
(See Open Purchased Options schedule) (Cost $555,044) | | | | | | | 799,818 | |
| | | Principal
Amount | | | | |
U.S. Government Obligations—13.0% | | | | | |
United States Treasury Bill, 1.995%, 11/08/184 | | $ | 1,000,000 | | | | 999,612 | |
United States Treasury Bill, 2.026%, 12/06/184,5 | | | 2,950,000 | | | | 2,944,191 | |
United States Treasury Bill, 2.345%, 03/28/194 | | | 3,000,000 | | | | 2,971,228 | |
Total U.S. Government Obligations
(Cost $6,915,077) | | | | 6,915,031 | |
Short-Term Investments—42.4% | | | | | | | | |
Joint Repurchase Agreements—21.3%6 | | | | | |
BNP Paribas SA, dated 10/31/18, due 11/01/18, 2.200% total to be received $882,822 (collateralized by various U.S. Treasuries, 0.000% - 8.125%, 08/15/19 - 05/15/47, totaling $900,423) | | | 882,768 | | | | 882,768 | |
| | | | | | | | |
| | | Principal
Amount | | | Value | |
MUFG Securities America, Inc. dated 10/31/18, due 11/01/18, 2.210% total to be received $2,705,113 (collateralized by various U.S. Government Agency Obligations, 3.000% - 4.500%, 01/01/30 - 05/20/48, totaling $2,759,046) | | $ | 2,704,947 | | | $ | 2,704,947 | |
Nomura Securities International, Inc., dated 10/31/18, due 11/01/18, 2.210% total to be received $2,705,113 (collateralized by various U.S. Government Agency Obligations and U.S. Treasuries, 0.000% - 9.500%, 11/08/18 - 09/20/68, totaling $2,759,046) | | | 2,704,947 | | | | 2,704,947 | |
RBC Dominion Securities, Inc. dated 10/31/18, due 11/01/18, 2.220% total to be received $2,705,114 (collateralized by various U.S. Government Agency Obligations and U.S. Treasuries, 0.000% - 7.000%, 11/29/18 - 09/09/49, totaling $2,759,046) | | | 2,704,947 | | | | 2,704,947 | |
State of Wisconsin Investment Board, dated 10/31/18, due 11/01/18, 2.410% total to be received $2,391,072 (collateralized by various U.S. Treasuries, 0.125% - 3.875%, 04/15/20 - 02/15/48, totaling $2,439,060) | | | 2,390,912 | | | | 2,390,912 | |
Total Joint Repurchase Agreements | | | | 11,388,521 | |
| | | Shares | | | | |
Other Investment Companies—21.1% | |
Dreyfus Government Cash Management Fund, Institutional Class Shares, 2.05%7 | | | 3,713,650 | | | | 3,713,650 | |
Dreyfus Institutional Preferred Government Money Market Fund, Institutional Class Shares, 2.12%7 | | | 3,713,650 | | | | 3,713,650 | |
JPMorgan U.S. Government Money Market Fund, IM Shares, 2.09%7 | | | 3,826,184 | | | | 3,826,184 | |
Total Other Investment Companies | | | | 11,253,484 | |
Total Short-Term Investments
(Cost $22,642,005) | | | | 22,642,005 | |
Total Investments—122.3%
(Cost $65,905,642) | | | | 65,318,570 | |
Other Assets, less Liabilities—(22.3)% | | | | (11,906,902 | ) |
Net Assets - 100.0% | | | | | | $ | 53,411,668 | |
The accompanying notes are an integral part of these financial statements.
28
AMG FQ Global Risk-Balanced Fund
Schedule of Portfolio Investments (continued)
| * | Non-income producing security. |
| 1 | Some or all of these securities, amounting to $13,849,078 or 25.9% of net assets, were out on loan to various brokers and are collateralized by cash and various U.S. Treasury Obligations. See Note 4 of Notes to Financial Statements. |
| 2 | Some or all of these securities were held as collateral for written options as of October 31, 2018, amounting to $11,796,228 or 22.1% of net assets. |
| 3 | A copy of the security’s annual report to shareholders may be obtained without charge on the SEC’s website (http://www.sec.gov). |
| 4 | Represents yield to maturity at October 31, 2018. |
| 5 | Some or all of this security is held as collateral for futures contracts. The market value of collateral at October 31, 2018, amounted to $2,894,289, or 5.4% of net assets. |
| 6 | Cash collateral received from brokers for securities lending was invested in these joint repurchase agreements. |
| 7 | Yield shown represents the October 31, 2018, seven day average yield, which refers to the sum of the previous seven days’ dividends paid, expressed as an annual percentage. |
| REIT | Real Estate Investment Trust |
| SPDR | Standard & Poor’s Depositary Receipt |
| TIPS | Treasury Inflation-Protected Securities |
Open Purchased Options
| | | | | | | | | | | | | | | | | | | | | | | | |
| Description | | Strike Price | | | Expiration Date | | | Number of
Contracts | | | Notional
Amount | | | Cost | | | Value | |
EURO STOXX 50 (Put) | | | 2,975 | | | | 01/18/19 | | | | 96 | | | $ | 2,856,000 | | | $ | 46,511 | | | $ | 42,297 | |
EURO STOXX 50 (Put) | | | 3,000 | | | | 12/21/18 | | | | 9 | | | | 270,000 | | | | 3,543 | | | | 3,058 | |
EURO STOXX 50 (Put) | | | 3,150 | | | | 11/16/18 | | | | 58 | | | | 1,827,000 | | | | 25,684 | | | | 19,511 | |
EURO STOXX 50 (Put) | | | 3,175 | | | | 12/21/18 | | | | 90 | | | | 2,857,500 | | | | 30,565 | | | | 75,638 | |
S&P 500 Index (Put) | | | 2,415 | | | | 02/15/19 | | | | 26 | | | | 6,279,000 | | | | 119,655 | | | | 83,330 | |
S&P 500 Index (Put) | | | 2,575 | | | | 01/18/19 | | | | 49 | | | | 12,617,500 | | | | 188,753 | | | | 207,515 | |
S&P 500 Index (Put) | | | 2,605 | | | | 01/18/19 | | | | 7 | | | | 1,823,500 | | | | 25,228 | | | | 37,275 | |
S&P 500 Index (Put) | | | 2,695 | | | | 12/21/18 | | | | 46 | | | | 12,397,000 | | | | 106,817 | | | | 298,586 | |
S&P 500 Index (Put) | | | 2,735 | | | | 12/21/18 | | | | 4 | | | | 1,094,000 | | | | 8,288 | | | | 32,608 | |
| | | | | | | | | | | | | | | | | | | | | | | | |
| | | | | | | | | | | | | | | Total | | | $ | 555,044 | | | $ | 799,818 | |
| | | | | | | | | | | | | | | | | | | | | | | | |
Open Written Options
| | | | | | | | | | | | | | | | | | | | | | | | |
| Description | | Strike Price | | | Expiration Date | | | Number of
Contracts | | | Notional
Amount | | | Premium | | | Value | |
EURO STOXX 50 (Call) | | | 3,400 | | | | 12/21/18 | | | | 9 | | | $ | 306,000 | | | $ | 1,387 | | | $ | (1,030 | ) |
EURO STOXX 50 (Call) | | | 3,425 | | | | 01/18/19 | | | | 96 | | | | 3,288,000 | | | | 17,784 | | | | (14,788 | ) |
EURO STOXX 50 (Put) | | | 2,850 | | | | 01/18/19 | | | | 96 | | | | 2,736,000 | | | | 28,500 | | | | (25,552 | ) |
EURO STOXX 50 (Put) | | | 2,900 | | | | 12/21/18 | | | | 9 | | | | 261,000 | | | | 2,185 | | | | (1,865 | ) |
EURO STOXX 50 (Put) | | | 3,050 | | | | 11/16/18 | | | | 58 | | | | 1,769,000 | | | | 16,722 | | | | (7,949 | ) |
EURO STOXX 50 (Put) | | | 3,075 | | | | 12/21/18 | | | | 90 | | | | 2,767,500 | | | | 19,133 | | | | (44,955 | ) |
S&P 500 Index (Call) | | | 2,925 | | | | 02/15/19 | | | | 26 | | | | 7,605,000 | | | | 37,645 | | | | (49,530 | ) |
S&P 500 Index (Call) | | | 2,960 | | | | 12/21/18 | | | | 3 | | | | 888,000 | | | | 2,461 | | | | (774 | ) |
S&P 500 Index (Call) | | | 2,980 | | | | 01/18/19 | | | | 49 | | | | 14,602,000 | | | | 43,997 | | | | (38,220 | ) |
S&P 500 Index (Call) | | | 2,995 | | | | 01/18/19 | | | | 7 | | | | 2,096,500 | | | | 7,265 | | | | (3,325 | ) |
S&P 500 Index (Call) | | | 3,150 | | | | 12/21/18 | | | | 4 | | | | 1,260,000 | | | | 1,392 | | | | (140 | ) |
S&P 500 Index (Put) | | | 2,300 | | | | 02/15/19 | | | | 26 | | | | 5,980,000 | | | | 80,545 | | | | (50,960 | ) |
S&P 500 Index (Put) | | | 2,505 | | | | 01/18/19 | | | | 49 | | | | 12,274,500 | | | | 144,447 | | | | (165,375 | ) |
S&P 500 Index (Put) | | | 2,530 | | | | 01/18/19 | | | | 7 | | | | 1,771,000 | | | | 18,549 | | | | (25,900 | ) |
S&P 500 Index (Put) | | | 2,560 | | | | 12/21/18 | | | | 3 | | | | 768,000 | | | | 6,361 | | | | (8,250 | ) |
S&P 500 Index (Put) | | | 2,630 | | | | 12/21/18 | | | | 43 | | | | 11,309,000 | | | | 75,589 | | | | (185,330 | ) |
S&P 500 Index (Put) | | | 2,670 | | | | 12/21/18 | | | | 4 | | | | 1,068,000 | | | | 6,192 | | | | (23,260 | ) |
| | | | | | | | | | | | | | | | | | | | | | | | |
| | | | | | | | | | | | | | | Total | | | $ | 510,154 | | | $ | (647,203 | ) |
| | | | | | | | | | | | | | | | | | | | | | | | |
The accompanying notes are an integral part of these financial statements.
29
AMG FQ Global Risk-Balanced Fund
Schedule of Portfolio Investments (continued)
Open Futures Contracts
| | | | | | | | | | | | | | | | | | | | | | | | |
| Description | | Currency | | | Number of
Contracts | | | Position | | | Expiration
Date | | | Current
Notional
Amount | | | Value and
Unrealized
Gain/(Loss) | |
ASX SPI 200 Index | | | AUD | | | | 27 | | | | Long | | | | 12/20/18 | | | $ | 2,771,452 | | | $ | (186,027 | ) |
Australia 10-Year Bond | | | AUD | | | | 57 | | | | Long | | | | 12/17/18 | | | | 5,223,685 | | | | (14,809 | ) |
Canadian 10-Year Bond | | | CAD | | | | 52 | | | | Long | | | | 12/18/18 | | | | 5,219,948 | | | | (61,863 | ) |
EURO BUXL 30-Year Bond | | | EUR | | | | 21 | | | | Long | | | | 12/06/18 | | | | 4,207,659 | | | | 4,549 | |
EURO STOXX 50 | | | EUR | | | | 192 | | | | Long | | | | 12/21/18 | | | | 6,945,916 | | | | (315,563 | ) |
FTSE 100 Index | | | GBP | | | | 20 | | | | Long | | | | 12/21/18 | | | | 1,817,857 | | | | (36,964 | ) |
Hang Seng Index | | | HKD | | | | 8 | | | | Long | | | | 11/29/18 | | | | 1,270,653 | | | | 10,858 | |
MSCI Emerging Markets Index | | | USD | | | | 116 | | | | Long | | | | 12/21/18 | | | | 5,548,860 | | | | (419,035 | ) |
Russell 2000® Mini Index | | | USD | | | | 87 | | | | Long | | | | 12/21/18 | | | | 6,576,765 | | | | (911,932 | ) |
S&P 500 E-Mini FUT Index | | | USD | | | | 17 | | | | Long | | | | 12/21/18 | | | | 2,304,435 | | | | (155,040 | ) |
S&P/TSX 60 Index | | | CAD | | | | 17 | | | | Long | | | | 12/20/18 | | | | 2,309,453 | | | | (134,309 | ) |
TOPIX Index | | | JPY | | | | 13 | | | | Long | | | | 12/13/18 | | | | 1,890,637 | | | | (39,287 | ) |
U.K. 10-Year Gilt | | | GBP | | | | 44 | | | | Long | | | | 12/27/18 | | | | 6,884,438 | | | | 3,863 | |
U.S. Treasury 10-Year Note (CBT) | | | USD | | | | 54 | | | | Long | | | | 12/19/18 | | | | 6,395,625 | | | | (77,805 | ) |
| | | | | | | | | | | | | | | | | | | | | | | | |
| | | | | | | | | | | | | | | | | | | Total | | | $ | (2,333,364 | ) |
| | | | | | | | | | | | | | | | | | | | | | | | |
CURRENCY ABBREVIATIONS:
The accompanying notes are an integral part of these financial statements.
30
AMG FQ Global Risk-Balanced Fund
Schedule of Portfolio Investments (continued)
The following table summarizes the inputs used to value the Fund’s investments by the fair value hierarchy levels as of October 31, 2018:
| | | | | | | | | | | | | | | | |
| | | Level 1 | | | Level 2 | | | Level 3 | | | Total | |
Investments in Securities | | | | | | | | | | | | | | | | |
Exchange Traded Funds† | | $ | 29,710,918 | | | | — | | | | — | | | $ | 29,710,918 | |
Exchange Traded Notes† | | | 5,250,797 | | | | — | | | | — | | | | 5,250,797 | |
Purchased Options | | | | | | | | | | | | | | | | |
Equity Contracts | | | 799,818 | | | | — | | | | — | | | | 799,818 | |
U.S. Government Obligations | | | — | | | $ | 6,915,031 | | | | — | | | | 6,915,031 | |
Short-Term Investments | | | | | | | | | | | | | | | | |
Joint Repurchase Agreements | | | — | | | | 11,388,521 | | | | — | | | | 11,388,521 | |
Other Investment Companies | | | 11,253,485 | | | | — | | | | — | | | | 11,253,485 | |
| | | | | | | | | | | | | | | | |
Total Investments in Securities | | $ | 47,015,018 | | | $ | 18,303,552 | | | | — | | | $ | 65,318,570 | |
| | | | | | | | | | | | | | | | |
Financial Derivative Instruments—Assets | | | | | | | | | | | | | | | | |
Interest Rate Futures Contracts | | $ | 8,412 | | | | — | | | | — | | | $ | 8,412 | |
Equity Written Options and Futures Contracts | | | 10,858 | | | | — | | | | — | | | | 10,858 | |
Financial Derivative Instruments—Liabilities | | | | | | | | | | | | | | | | |
Equity Written Options and Futures Contracts | | | (2,845,360 | ) | | | — | | | | — | | | | (2,845,360 | ) |
Interest Rate Futures Contracts | | | (154,477 | ) | | | — | | | | — | | | | (154,477 | ) |
| | | | | | | | | | | | | | | | |
Total Financial Derivative Instruments | | $ | (2,980,567 | ) | | | — | | | | — | | | $ | (2,980,567 | ) |
| | | | | | | | | | | | | | | | |
| † | All exchange traded funds and exchange traded notes held in the Fund are level 1 securities. For a detailed listing of these securities, please refer to the Fund’s Schedule of Portfolio Investments. |
As of October 31, 2018, the Fund had no transfers between levels from the beginning of the reporting period.
The accompanying notes are an integral part of these financial statements.
31
AMG FQ Global Risk-Balanced Fund
Schedule of Portfolio Investments (continued)
The following schedule shows the value of derivative instruments at October 31, 2018:
| | | | | | | | | | | | |
| | | Asset Derivatives | | | Liability Derivatives | |
Derivatives not accounted
for as hedging instruments | | Statement of Assets and
Liabilities Location | | Fair Value | | | Statement of Assets and
Liabilities Location | | Fair Value | |
Equity contracts | | Options purchased1 | | $ | 799,818 | | | Options written | | $ | 647,203 | |
Equity contracts | | Receivable for variation margin2 | | | 303,843 | | | Payable for variation margin2 | | | 435 | |
Interest rate contracts | | Receivable for variation margin2 | | | 1,427 | | | Payable for variation margin2 | | | 86,656 | |
| | | | | | | | | | | | |
| | Totals | | $ | 1,105,088 | | | | | $ | 734,294 | |
| | | | | | | | | | | | |
For the year ended October 31, 2018, the effect of derivative instruments on the Statement of Operations for the Fund and the amount of realized gain/loss and unrealized appreciation/depreciation on derivatives recognized in income was as follows:
| | | | | | | | | | | | |
| | | Realized Gain/Loss | | | Change in Unrealized Appreciation/Depreciation | |
Derivatives not accounted
for as hedging instruments | | Statement of Operations
Location | | Realized
Gain/Loss | | | Statement of Operations
Location | | Change in
Unrealized
Appreciation/
Depreciation | |
Equity contracts | | Net realized loss on options purchased1 | | $ | (1,802,582 | ) | | Net change in unrealized appreciation/ depreciation on options purchased1 | | $ | 649,895 | |
Equity contracts | | Net realized gain on futures contracts | | | 2,095,587 | | | Net change in unrealized appreciation/ depreciation on future contracts | | | (4,192,460 | ) |
Interest rate contracts | | Net realized loss on futures contracts | | | (125,559 | ) | | Net change in unrealized appreciation/ depreciation on futures contracts | | | 66,634 | |
Equity contracts | | Net realized gain on options written | | | 181,423 | | | Net change in unrealized appreciation/ depreciation on options written | | | (189,664 | ) |
| | | | | | | | | | | | |
| | Totals | | $ | 348,869 | | | | | $ | (3,665,595 | ) |
| | | | | | | | | | | | |
| 1 | Options purchased are included in Investments at value on the Statement of Assets and Liabilities. Net realized gain/loss on options purchased and net change in unrealized appreciation/depreciation on options purchased are included in the net realized gain/loss on investments and net change in unrealized appreciation/depreciation of investments, respectively, on the Statement of Operations. |
| 2 | Only current day’s variation margin is reported within the Statement of Assets and Liabilities. The variation margin is included in the open futures cumulative appreciation/depreciation of $(2,333,364). |
The accompanying notes are an integral part of these financial statements.
32
Statement of Assets and Liabilities
October 31, 2018
| | | | | | | | | | | | |
| | | AMG FQ
Tax-Managed
U.S.
Equity Fund | | | AMG
FQ Long-Short
Equity Fund | | | AMG
FQ Global
Risk-Balanced Fund | |
Assets: | | | | | | | | | | | | |
Investments at Value1 (including securities on loan valued at $2,371,923, $2,085,671, and $13,849,078, respectively) | | $ | 73,154,472 | | | $ | 47,736,276 | | | $ | 53,930,049 | |
Repurchase Agreements at value2 | | | 505,784 | | | | 160,204 | | | | 11,388,521 | |
Due from broker | | | — | | | | 34,683,201 | | | | 60,931 | |
Cash deposit with brokers for futures contracts (see Note 9) | | | — | | | | 8,943,034 | | | | — | |
Segregated cash | | | — | | | | 25,750,000 | | | | — | |
Dividend, interest and other receivables | | | 28,223 | | | | 90,938 | | | | 33,890 | |
Receivable for Fund shares sold | | | 846 | | | | 1,088,309 | | | | 1,011 | |
Receivable from affiliate | | | 5,368 | | | | 683 | | | | 1,894 | |
Swaps at value | | | — | | | | 42,185 | | | | — | |
Receivable for variation margin | | | — | | | | — | | | | 305,270 | |
Prepaid expenses and other assets | | | 13,280 | | | | 18,312 | | | | 11,583 | |
Total assets | | | 73,707,973 | | | | 118,513,142 | | | | 65,733,149 | |
Liabilities: | | | | | | | | | | | | |
Payable upon return of securities loaned | | | 505,784 | | | | 160,204 | | | | 11,388,521 | |
Payable for investments purchased | | | — | | | | — | | | | 110,570 | |
Payable for Fund shares repurchased | | | 40,137 | | | | 388,152 | | | | 3,938 | |
Written options3 | | | — | | | | — | | | | 647,203 | |
Interest and dividends payable | | | — | | | | 46,782 | | | | — | |
Payable for variation margin | | | — | | | | — | | | | 87,091 | |
Accrued expenses: | | | | | | | | | | | | |
Investment advisory and management fees | | | 44,900 | | | | 23,493 | | | | 28,067 | |
Administrative fees | | | 9,622 | | | | 10,068 | | | | 7,017 | |
Distribution fees | | | 2,107 | | | | 5,318 | | | | 419 | |
Shareholder service fees | | | — | | | | 6,453 | | | | 452 | |
Professional fees | | | 29,138 | | | | 41,895 | | | | 35,533 | |
Trustee fees and expenses | | | — | | | | 47 | | | | — | |
Other | | | 14,477 | | | | 14,830 | | | | 12,670 | |
Securities sold short, at value4 | | | — | | | | 37,689,526 | | | | — | |
Total liabilities | | | 646,165 | | | | 38,386,768 | | | | 12,321,481 | |
Net Assets | | $ | 73,061,808 | | | $ | 80,126,374 | | | $ | 53,411,668 | |
1 Investments at cost | | $ | 46,565,356 | | | $ | 50,477,381 | | | $ | 54,517,121 | |
2 Repurchase agreements at cost | | $ | 505,784 | | | $ | 160,204 | | | $ | 11,388,521 | |
3 Premiums received | | | — | | | | — | | | $ | 510,154 | |
4 Proceeds | | | — | | | $ | 42,133,218 | | | | — | |
The accompanying notes are an integral part of these financial statements.
33
Statement of Assets and Liabilities (continued)
| | | | | | | | | | | | |
| | | AMG FQ
Tax-Managed
U.S.
Equity Fund | | | AMG
FQ Long-Short
Equity Fund | | | AMG
FQ Global
Risk-Balanced Fund | |
Net Assets Represent: | | | | | | | | | | | | |
Paid-in capital | | $ | 45,395,734 | | | $ | 75,432,526 | | | $ | 57,926,511 | |
Total distributable earnings (loss) | | | 27,666,074 | | | | 4,693,848 | | | | (4,514,843 | ) |
Net Assets | | $ | 73,061,808 | | | $ | 80,126,374 | | | $ | 53,411,668 | |
Class N: | | | | | | | | | | | | |
Net Assets | | $ | 9,621,651 | | | $ | 24,536,075 | | | $ | 1,869,930 | |
Shares outstanding | | | 303,667 | | | | 1,565,178 | | | | 128,456 | |
Net asset value, offering and redemption price per share | | $ | 31.68 | | | $ | 15.68 | | | $ | 14.56 | |
Class I: | | | | | | | | | | | | |
Net Assets | | $ | 63,440,157 | | | $ | 55,590,299 | | | $ | 1,484,003 | |
Shares outstanding | | | 2,001,961 | | | | 3,539,505 | | | | 101,386 | |
Net asset value, offering and redemption price per share | | $ | 31.69 | | | $ | 15.71 | | | $ | 14.64 | |
Class Z: | | | | | | | | | | | | |
Net Assets | | | — | | | | — | | | $ | 50,057,735 | |
Shares outstanding | | | — | | | | — | | | | 3,418,747 | |
Net asset value, offering and redemption price per share | | | — | | | | — | | | $ | 14.64 | |
The accompanying notes are an integral part of these financial statements.
34
Statement of Operations
For the fiscal year ended October 31, 2018
| | | | | | | | | | | | |
| | | AMG FQ
Tax-Managed
U.S.
Equity Fund | | | AMG
FQ Long-Short
Equity Fund | | | AMG
FQ Global
Risk-Balanced Fund | |
Investment Income: | | | | | | | | | | | | |
Dividend income | | $ | 911,981 | | | $ | 606,328 | | | $ | 1,522,095 | |
Interest income | | | — | | | | 346,445 | | | | 109,812 | |
Securities lending income | | | 4,005 | | | | 291,863 | | | | 146,772 | |
Foreign withholding tax | | | (1,133 | ) | | | (105 | ) | | | — | |
Total investment income | | | 914,853 | | | | 1,244,531 | | | | 1,778,679 | |
Expenses: | | | | | | | | | | | | |
Investment advisory and management fees | | | 521,881 | | | | 181,288 | | | | 360,226 | |
Administrative fees | | | 111,832 | | | | 77,695 | | | | 90,057 | |
Distribution fees—Class N | | | 24,989 | | | | 19,699 | | | | 5,358 | |
Shareholder servicing fees—Class N | | | — | | | | 7,880 | | | | 3,215 | |
Shareholder servicing fees—Class I | | | — | | | | 13,661 | | | | 2,302 | |
Registration fees | | | 37,453 | | | | 35,957 | | | | 45,588 | |
Professional fees | | | 31,640 | | | | 58,313 | | | | 40,499 | |
Reports to shareholders | | | 17,746 | | | | 14,354 | | | | 14,384 | |
Custodian fees | | | 14,175 | | | | 28,029 | | | | 13,818 | |
Transfer agent fees | | | 13,206 | | | | 14,005 | | | | 11,741 | |
Trustee fees and expenses | | | 5,066 | | | | 3,317 | | | | 4,218 | |
Interest and dividend expense (see note 14) | | | — | | | | 932,473 | | | | — | |
Miscellaneous | | | 3,287 | | | | 2,964 | | | | 3,437 | |
Total expenses before offsets | | | 781,275 | | | | 1,389,635 | | | | 594,843 | |
Expense reimbursements | | | (92,665 | ) | | | (58,523 | ) | | | (49,633 | ) |
Expense reductions | | | (1,734 | ) | | | (4,294 | ) | | | — | |
Net expenses | | | 686,876 | | | | 1,326,818 | | | | 545,210 | |
Net investment income (loss) | | | 227,977 | | | | (82,287 | ) | | | 1,233,469 | |
Net Realized and Unrealized Gain (Loss): | | | | | | | | | | | | |
Net realized gain (loss) on investments | | | 914,936 | | | | 2,636,975 | | | | (2,744,085 | ) |
Net realized loss on short sales | | | — | | | | (3,344,274 | ) | | | — | |
Net realized gain on futures contracts | | | — | | | | 5,486,628 | | | | 1,970,028 | |
Net realized gain on written options | | | — | | | | — | | | | 181,423 | |
Net realized loss on swaps | | | — | | | | (11,975 | ) | | | — | |
Net realized gain on foreign currency transactions | | | — | | | | — | | | | 11,605 | |
Net change in unrealized appreciation/depreciation on investments | | | 3,849,141 | | | | (3,987,476 | ) | | | (475,577 | ) |
Net change in unrealized appreciation/depreciation on short sales | | | — | | | | 5,418,159 | | | | — | |
Net change in unrealized appreciation/depreciation on futures contracts | | | — | | | | (1,725,061 | ) | | | (4,125,826 | ) |
Net change in unrealized appreciation/depreciation on written options | | | — | | | | — | | | | (189,664 | ) |
Net change in unrealized appreciaiton/depreciation on swaps | | | — | | | | 42,185 | | | | — | |
Net change in unrealized appreciation/depreciation on foreign currency translations | | | — | | | | — | | | | (916 | ) |
Net realized and unrealized gain (loss) | | | 4,764,077 | | | | 4,515,161 | | | | (5,373,012 | ) |
Net increase (decrease) in net assets resulting from operations | | $ | 4,992,054 | | | $ | 4,432,874 | | | $ | (4,139,543 | ) |
The accompanying notes are an integral part of these financial statements.
35
Statements of Changes in Net Assets
For the fiscal years ended October 31,
| | | | | | | | | | | | | | | | | | | | | | | | |
| | | AMG FQ
Tax-Managed
U.S. Equity Fund | | | AMG
FQ Long-Short
Equity Fund | | | AMG
FQ Global
Risk-Balanced Fund | |
| | | 2018 | | | 2017 | | | 2018 | | | 2017 | | | 2018 | | | 2017 | |
Increase (Decrease) in Net Assets Resulting From Operations: | | | | | | | | | | | | | | | | | | | | | | | | |
Net investment income (loss) | | $ | 227,977 | | | $ | 239,960 | | | $ | (82,287 | ) | | $ | 425,923 | | | $ | 1,233,469 | | | $ | 777,401 | |
Net realized gain (loss) on investments | | | 914,936 | | | | 10,300,977 | | | | 4,767,354 | | | | 10,393,276 | | | | (581,029 | ) | | | 5,317,015 | |
Net change in unrealized appreciation/depreciation on investments | | | 3,849,141 | | | | 6,175,558 | | | | (252,193 | ) | | | 724,385 | | | | (4,791,983 | ) | | | 3,182,485 | |
Net increase (decrease) in net assets resulting from operations | | | 4,992,054 | | | | 16,716,495 | | | | 4,432,874 | | | | 11,543,584 | | | | (4,139,543 | ) | | | 9,276,901 | |
Distributions to Shareholders:1 | | | | | | | | | | | | | | | | | | | | | | | | |
Class N | | | (12,973 | ) | | | (222,884 | ) | | | (735,101 | ) | | | (1,390,250 | ) | | | (5,692 | ) | | | (20,489 | ) |
Class I | | | (296,023 | ) | | | (675,125 | ) | | | (8,503,620 | ) | | | (2,096,635 | ) | | | (4,577 | ) | | | (115,642 | ) |
Class Z | | | — | | | | — | | | | — | | | | — | | | | (397,638 | ) | | | (927,631 | ) |
Total distributions to shareholders | | | (308,996 | ) | | | (898,009 | ) | | | (9,238,721 | ) | | | (3,486,885 | ) | | | (407,907 | ) | | | (1,063,762 | ) |
Capital Share Transactions:2 | | | | | | | | | | | | | | | | | | | | | | | | |
Net increase (decrease) from capital share transactions | | | (4,173,164 | ) | | | (19,645,798 | ) | | | 44,435,042 | | | | (26,025,738 | ) | | | (5,373,466 | ) | | | (14,490,282 | ) |
Total increase (decrease) in net assets | | | 509,894 | | | | (3,827,312 | ) | | | 39,629,195 | | | | (17,969,039 | ) | | | (9,920,916 | ) | | | (6,277,143 | ) |
Net Assets: | | | | | | | | | | | | | | | | | | | | | | | | |
Beginning of year | | | 72,551,914 | | | | 76,379,226 | | | | 40,497,179 | | | | 58,466,218 | | | | 63,332,584 | | | | 69,609,727 | |
End of year3 | | $ | 73,061,808 | | | $ | 72,551,914 | | | $ | 80,126,374 | | | $ | 40,497,179 | | | $ | 53,411,668 | | | $ | 63,332,584 | |
| 1 | See Note 1(d) of the Notes to Financial Statements. |
| 2 | See Note 1(g) of the Notes to Financial Statements. |
| 3 | Net assets—End of year includes undistributed (distributions in excess of) net investment income of $156,758, $(82,287) and $149,765 for AMG FQ Tax-Managed U.S. Equity Fund, AMG FQ Long-Short Equity Fund and AMG FQ Global Risk-Balanced Fund, respectively, in 2017. During 2018, the requirement to disclose undistributed net investment income in 2018 was eliminated. |
The accompanying notes are an integral part of these financial statements.
36
AMG FQ Tax-Managed U.S. Equity Fund
Financial Highlights
For a share outstanding throughout each fiscal year
| | | | | | | | | | | | | | | | | | | | |
| | | For the fiscal years ended October 31, | |
| Class N | | 2018 | | | 2017 | | | 20161 | | | 2015 | | | 2014 | |
Net Asset Value, Beginning of Year | | $ | 29.69 | | | $ | 24.11 | | | $ | 24.42 | | | $ | 23.58 | | | $ | 20.02 | |
Income (loss) from Investment Operations: | | | | | | | | | | | | | | | | | | | | |
Net investment income2,3 | | | 0.03 | | | | 0.03 | 4 | | | 0.22 | 5 | | | 0.08 | 6 | | | 0.03 | |
Net realized and unrealized gain (loss) on investments | | | 2.00 | | | | 5.79 | | | | (0.43 | ) | | | 0.81 | | | | 3.55 | |
Total income (loss) from investment operations | | | 2.03 | | | | 5.82 | | | | (0.21 | ) | | | 0.89 | | | | 3.58 | |
Less Distributions to Shareholders from: | | | | | | | | | | | | | | | | | | | | |
Net investment income | | | — | | | | (0.24 | ) | | | (0.10 | ) | | | (0.05 | ) | | | (0.02 | ) |
Net realized gain on investments | | | (0.04 | ) | | | — | | | | — | | | | — | | | | — | |
Total distributions to shareholders | | | (0.04 | ) | | | (0.24 | ) | | | (0.10 | ) | | | (0.05 | ) | | | (0.02 | ) |
Net Asset Value, End of Year | | $ | 31.68 | | | $ | 29.69 | | | $ | 24.11 | | | $ | 24.42 | | | $ | 23.58 | |
Total Return3 | | | 6.84 | %7 | | | 24.27 | %7 | | | (0.86 | )%7 | | | 3.79 | %7 | | | 17.91 | %7 |
Ratio of net expenses to average net assets | | | 1.14 | %8 | | | 1.14 | % | | | 1.14 | % | | | 1.20 | % | | | 1.24 | % |
Ratio of gross expenses to average net assets9 | | | 1.26 | % | | | 1.27 | % | | | 1.26 | % | | | 1.27 | % | | | 1.29 | % |
Ratio of net investment income to average net assets3 | | | 0.09 | % | | | 0.13 | % | | | 0.93 | % | | | 0.34 | % | | | 0.13 | % |
Portfolio turnover | | | 31 | % | | | 75 | % | | | 102 | % | | | 62 | % | | | 45 | % |
Net assets end of year (000’s) omitted | | $ | 9,622 | | | $ | 12,131 | | | $ | 22,885 | | | $ | 24,825 | | | $ | 12,541 | |
| | | | | | | | | | | | | | | | | | | | |
37
AMG FQ Tax-Managed U.S. Equity Fund
Financial Highlights
For a share outstanding throughout each fiscal year
| | | | | | | | | | | | | | | | | | | | |
| | | For the fiscal years ended October 31, | |
| Class I | | 2018 | | | 2017 | | | 20161 | | | 2015 | | | 2014 | |
Net Asset Value, Beginning of Year | | $ | 29.72 | | | $ | 24.14 | | | $ | 24.42 | | | $ | 23.56 | | | $ | 19.99 | |
Income (loss) from Investment Operations: | | | | | | | | | | | | | | | | | | | | |
Net investment income2,3 | | | 0.11 | | | | 0.10 | 4 | | | 0.28 | 5 | | | 0.17 | 6 | | | 0.09 | |
Net realized and unrealized gain (loss) on investments | | | 2.00 | | | | 5.79 | | | | (0.43 | ) | | | 0.78 | | | | 3.54 | |
Total income (loss) from investment operations | | | 2.11 | | | | 5.89 | | | | (0.15 | ) | | | 0.95 | | | | 3.63 | |
Less Distributions to Shareholders from: | | | | | | | | | | | | | | | | | | | | |
Net investment income | | | (0.10 | ) | | | (0.31 | ) | | | (0.13 | ) | | | (0.09 | ) | | | (0.06 | ) |
Net realized gain on investments | | | (0.04 | ) | | | — | | | | — | | | | — | | | | — | |
Total distributions to shareholders | | | (0.14 | ) | | | (0.31 | ) | | | (0.13 | ) | | | (0.09 | ) | | | (0.06 | ) |
Net Asset Value, End of Year | | $ | 31.69 | | | $ | 29.72 | | | $ | 24.14 | | | $ | 24.42 | | | $ | 23.56 | |
Total Return3 | | | 7.13 | %7 | | | 24.57 | %7 | | | (0.59 | )%7 | | | 4.03 | %7 | | | 18.22 | % |
Ratio of net expenses to average net assets | | | 0.89 | %8 | | | 0.89 | % | | | 0.89 | % | | | 0.96 | % | | | 0.99 | % |
Ratio of gross expenses to average net assets9 | | | 1.01 | % | | | 1.02 | % | | | 1.01 | % | | | 1.03 | % | | | 1.04 | % |
Ratio of net investment income to average net assets3 | | | 0.34 | % | | | 0.38 | % | | | 1.19 | % | | | 0.68 | % | | | 0.40 | % |
Portfolio turnover | | | 31 | % | | | 75 | % | | | 102 | % | | | 62 | % | | | 45 | % |
Net assets end of year (000’s) omitted | | $ | 63,440 | | | $ | 60,421 | | | $ | 53,494 | | | $ | 56,493 | | | $ | 50,686 | |
| | | | | | | | | | | | | | | | | | | | |
| 1 | Effective October 1, 2016, the Investor Class and Institutional Class were renamed Class N and Class I, respectively. |
| 2 | Per share numbers have been calculated using average shares. |
| 3 | Total returns and net investment income would have been lower had certain expenses not been offset. |
| 4 | Includes non-recurring dividends. Without these dividends, net investment income per share would have been $0.01 and $0.08 for Class N and Class I, respectively. |
| 5 | Includes non-recurring dividends. Without these dividends, net investment income per share would have been $0.11 and $0.17 for Class N and Class I shares, respectively. |
| 6 | Includes non-recurring dividends. Without these dividends, net investment income per share would have been $0.00 and $0.09 for Class N and Class I, respectively |
| 7 | The total return is calculated using the published Net Asset Value as of fiscal year end. |
| 8 | Includes reduction from broker recapture amounting to less than 0.01%. |
| 9 | Excludes the impact of expense reimbursement or fee waivers and expense reductions such as brokerage credits, but includes expense repayments and non-reimbursable expenses, if any, such as interest, taxes, and extraordinary expenses. (See Note 1(c) and 2 in the Notes to Financial Statements.) |
38
AMG FQ Long-Short Equity Fund
Financial Highlights
For a share outstanding throughout each fiscal year
| | | | | | | | | | | | | | | | | | | | |
| | | For the fiscal years ended October 31, | |
| Class N | | 2018 | | | 2017 | | | 20161 | | | 2015 | | | 2014 | |
Net Asset Value, Beginning of Year | | $ | 17.97 | | | $ | 15.48 | | | $ | 17.38 | | | $ | 17.20 | | | $ | 15.23 | |
Income (loss) from Investment Operations: | | | | | | | | | | | | | | | | | | | | |
Net investment income (loss)2,3 | | | (0.07 | ) | | | 0.10 | 4 | | | 0.14 | | | | 0.16 | 5 | | | 0.14 | |
Net realized and unrealized gain (loss) on investments | | | 1.94 | | | | 3.30 | | | | (0.31 | ) | | | 0.17 | | | | 1.95 | |
Total income (loss) from investment operations | | | 1.87 | | | | 3.40 | | | | (0.17 | ) | | | 0.33 | | | | 2.09 | |
Less Distributions to Shareholders from: | | | | | | | | | | | | | | | | | | | | |
Net investment income | | | — | | | | (0.16 | ) | | | (0.15 | ) | | | (0.15 | ) | | | (0.12 | ) |
Net realized gain on investments | | | (4.16 | ) | | | (0.75 | ) | | | (1.58 | ) | | | — | | | | — | |
Total distributions to shareholders | | | (4.16 | ) | | | (0.91 | ) | | | (1.73 | ) | | | (0.15 | ) | | | (0.12 | ) |
Net Asset Value, End of Year | | $ | 15.68 | | | $ | 17.97 | | | $ | 15.48 | | | $ | 17.38 | | | $ | 17.20 | |
Total Return3,6 | | | 12.54 | % | | | 22.62 | % | | | (0.98 | )% | | | 1.90 | % | | | 13.76 | % |
Ratio of net expenses to average net assets | | | 2.83 | %7,8 | | | 1.09 | %8 | | | 1.05 | % | | | 1.04 | % | | | 1.04 | % |
Ratio of gross expenses to average net assets9 | | | 2.95 | % | | | 1.14 | % | | | 1.08 | % | | | 1.05 | % | | | 1.05 | % |
Ratio of net investment income (loss) to average net assets3 | | | (0.43 | )% | | | 0.60 | % | | | 0.88 | % | | | 0.93 | % | | | 0.88 | % |
Portfolio turnover | | | 240 | % | | | 159 | % | | | 178 | % | | | 139 | % | | | 87 | % |
Net assets end of year (000’s) omitted | | $ | 24,536 | | | $ | 3,495 | | | $ | 24,752 | | | $ | 30,043 | | | $ | 25,931 | |
| | | | | | | | | | | | | | | | | | | | |
39
AMG FQ Long-Short Equity Fund
Financial Highlights
For a share outstanding throughout each fiscal year
| | | | | | | | | | | | | | | | | | | | |
| | | For the fiscal years ended October 31, | |
| Class I | | 2018 | | | 2017 | | | 20161 | | | 2015 | | | 2014 | |
Net Asset Value, Beginning of Year | | $ | 17.97 | | | $ | 15.47 | | | $ | 17.37 | | | $ | 17.22 | | | $ | 15.27 | |
Income (loss) from Investment Operations: | | | | | | | | | | | | | | | | | | | | |
Net investment income (loss)2,3 | | | (0.02 | ) | | | 0.15 | 4 | | | 0.18 | | | | 0.21 | 5 | | | 0.18 | |
Net realized and unrealized gain (loss) on investments | | | 1.92 | | | | 3.33 | | | | (0.31 | ) | | | 0.16 | | | | 1.96 | |
Total income (loss) from investment operations | | | 1.90 | | | | 3.48 | | | | (0.13 | ) | | | 0.37 | | | | 2.14 | |
Less Distributions to Shareholders from: | | | | | | | | | | | | | | | | | | | | |
Net investment income | | | — | | | | (0.23 | ) | | | (0.19 | ) | | | (0.22 | ) | | | (0.19 | ) |
Net realized gain on investments | | | (4.16 | ) | | | (0.75 | ) | | | (1.58 | ) | | | — | | | | — | |
Total distributions to shareholders | | | (4.16 | ) | | | (0.98 | ) | | | (1.77 | ) | | | (0.22 | ) | | | (0.19 | ) |
Net Asset Value, End of Year | | $ | 15.71 | | | $ | 17.97 | | | $ | 15.47 | | | $ | 17.37 | | | $ | 17.22 | |
Total Return3,6 | | | 12.82 | % | | | 23.11 | % | | | (0.73 | )% | | | 2.16 | % | | | 14.05 | % |
Ratio of net expenses to average net assets | | | 2.51 | %7,8 | | | 0.78 | %8 | | | 0.79 | % | | | 0.79 | % | | | 0.79 | % |
Ratio of gross expenses to average net assets9 | | | 2.63 | % | | | 0.87 | % | | | 0.82 | % | | | 0.79 | % | | | 0.80 | % |
Ratio of net investment income (loss) to average net assets3 | | | (0.11 | )% | | | 0.90 | % | | | 1.14 | % | | | 1.22 | % | | | 1.13 | % |
Portfolio turnover | | | 240 | % | | | 159 | % | | | 178 | % | | | 139 | % | | | 87 | % |
Net assets end of year (000’s) omitted | | $ | 55,590 | | | $ | 37,002 | | | $ | 33,715 | | | $ | 37,313 | | | $ | 41,636 | |
| | | | | | | | | | | | | | | | | | | | |
| 1 | Effective October 1, 2016, the Investor Class and Institutional Class were renamed Class N and Class I, respectively. |
| 2 | Per share numbers have been calculated using average shares. |
| 3 | Total returns and net investment income (loss) would have been lower had certain expenses not been offset. |
| 4 | Includes non-recurring dividends. Without these dividends, net investment income per share would have been $0.07 and $0.12 for Class N and Class I, respectively. |
| 5 | Includes non-recurring dividends. Without these dividends, net investment income per share would have been $0.11 and $0.16 for Class N and Class I, respectively |
| 6 | The total return is calculated using the published Net Asset Value as of fiscal year end. |
| 7 | Includes reduction from broker recapture amounting to 0.01%. |
| 8 | Expense ratio includes dividend and interest expense related to securities sold short. Excluding such dividend and interest expense, the ratio of expenses to average net assets would be 1.04% and 0.72% and 1.04% and 0.73% for Class N and Class I, respectively, for the fiscal years ended October 31, 2018 and October 31, 2017, respectively. |
| 9 | Excludes the impact of expense reimbursement or fee waivers and expense reductions such as brokerage credits, but includes expense repayments and non-reimbursable expenses, if any, such as interest, taxes, and extraordinary expenses. (See Note 1(c) and 2 in the Notes to Financial Statements.) |
40
AMG FQ Global Risk-Balanced Fund
Financial Highlights
For a share outstanding throughout each fiscal year
| | | | | | | | | | | | | | | | | | | | |
| | | For the fiscal years ended October 31, | |
| Class N | | 2018 | | | 2017 | | | 20161 | | | 2015 | | | 2014 | |
Net Asset Value, Beginning of Year | | $ | 15.77 | | | $ | 13.89 | | | $ | 12.93 | | | $ | 13.84 | | | $ | 13.14 | |
Income (loss) from Investment Operations: | | | | | | | | | | | | | | | | | | | | |
Net investment income (loss)2,3 | | | 0.26 | | | | 0.11 | | | | (0.02 | ) | | | 0.05 | | | | 0.17 | |
Net realized and unrealized gain (loss) on investments | | | (1.43 | ) | | | 1.91 | | | | 1.16 | | | | (0.64 | ) | | | 0.53 | |
Total income (loss) from investment operations | | | (1.17 | ) | | | 2.02 | | | | 1.14 | | | | (0.59 | ) | | | 0.70 | |
Less Distributions to Shareholders from: | | | | | | | | | | | | | | | | | | | | |
Net investment income | | | (0.04 | ) | | | (0.14 | ) | | | (0.18 | ) | | | (0.32 | ) | | | — | |
Total distributions to shareholders | | | (0.04 | ) | | | (0.14 | ) | | | (0.18 | ) | | | (0.32 | ) | | | — | |
Net Asset Value, End of Year | | $ | 14.56 | | | $ | 15.77 | | | $ | 13.89 | | | $ | 12.93 | | | $ | 13.84 | |
Total Return3,4 | | | (7.43 | )% | | | 14.69 | % | | | 8.97 | % | | | (4.31 | )% | | | 5.33 | % |
Ratio of net expenses to average net assets | | | 1.29 | % | | | 1.33 | % | | | 1.39 | % | | | 1.38 | % | | | 1.38 | % |
Ratio of gross expenses to average net assets5 | | | 1.37 | % | | | 1.39 | % | | | 1.55 | % | | | 1.51 | % | | | 1.52 | % |
Ratio of net investment income (loss) to average net assets3 | | | 1.67 | % | | | 0.76 | % | | | (0.15 | )% | | | 0.36 | % | | | 1.30 | % |
Portfolio turnover | | | 27 | % | | | 26 | % | | | 71 | % | | | 55 | % | | | 5 | % |
Net assets end of year (000’s) omitted | | $ | 1,870 | | | $ | 2,200 | | | $ | 3,725 | | | $ | 2,083 | | | $ | 2,228 | |
| | | | | | | | | | | | | | | | | | | | |
41
AMG FQ Global Risk-Balanced Fund
Financial Highlights
For a share outstanding throughout each fiscal year
| | | | | | | | | | | | | | | | | | | | |
| | | For the fiscal years ended October 31, | |
| Class I | | 2018 | | | 2017 | | | 20161 | | | 2015 | | | 2014 | |
Net Asset Value, Beginning of Year | | $ | 15.83 | | | $ | 13.97 | | | $ | 13.02 | | | $ | 13.98 | | | $ | 13.21 | |
Income (loss) from Investment Operations: | | | | | | | | | | | | | | | | | | | | |
Net investment income (loss)2,3 | | | 0.30 | | | | 0.16 | | | | (0.01 | ) | | | 0.11 | | | | 0.23 | |
Net realized and unrealized gain (loss) on investments | | | (1.44 | ) | | | 1.92 | | | | 1.21 | | | | (0.65 | ) | | | 0.54 | |
Total income (loss) from investment operations | | | (1.14 | ) | | | 2.08 | | | | 1.20 | | | | (0.54 | ) | | | 0.77 | |
Less Distributions to Shareholders from: | | | | | | | | | | | | | | | | | | | | |
Net investment income | | | (0.05 | ) | | | (0.22 | ) | | | (0.25 | ) | | | (0.42 | ) | | | — | |
Total distributions to shareholders | | | (0.05 | ) | | | (0.22 | ) | | | (0.25 | ) | | | (0.42 | ) | | | — | |
Net Asset Value, End of Year | | $ | 14.64 | | | $ | 15.83 | | | $ | 13.97 | | | $ | 13.02 | | | $ | 13.98 | |
Total Return3,4 | | | (7.20 | )% | | | 15.14 | % | | | 9.43 | % | | | (3.98 | )% | | | 5.83 | % |
Ratio of net expenses to average net assets | | | 1.04 | % | | | 0.99 | % | | | 0.99 | % | | | 0.98 | % | | | 0.96 | % |
Ratio of gross expenses to average net assets5 | | | 1.12 | % | | | 1.05 | % | | | 1.15 | % | | | 1.11 | % | | | 1.10 | % |
Ratio of net investment income to average net assets3 | | | 1.92 | % | | | 1.09 | % | | | 0.25 | % | | | 0.83 | % | | | 1.72 | % |
Portfolio turnover | | | 27 | % | | | 26 | % | | | 71 | % | | | 55 | % | | | 5 | % |
Net assets end of year (000’s) omitted | | $ | 1,484 | | | $ | 1,420 | | | $ | 7,215 | | | $ | 1,652 | | | $ | 2,537 | |
| | | | | | | | | | | | | | | | | | | | |
42
AMG FQ Global Risk-Balanced Fund
Financial Highlights
For a share outstanding throughout each fiscal year
| | | | | | | | | | | | | | | | | | | | |
| | | For the fiscal years ended October 31, | |
| Class Z | | 2018 | | | 2017 | | | 20161 | | | 2015 | | | 2014 | |
Net Asset Value, Beginning of Year | | $ | 15.87 | | | $ | 14.00 | | | $ | 13.05 | | | $ | 14.02 | | | $ | 13.23 | |
Income (loss) from Investment Operations: | | | | | | | | | | | | | | | | | | | | |
Net investment income2,3 | | | 0.32 | | | | 0.18 | | | | 0.05 | | | | 0.12 | | | | 0.24 | |
Net realized and unrealized gain (loss) on investments | | | (1.44 | ) | | | 1.92 | | | | 1.16 | | | | (0.66 | ) | | | 0.55 | |
Total income (loss) from investment operations | | | (1.12 | ) | | | 2.10 | | | | 1.21 | | | | (0.54 | ) | | | 0.79 | |
Less Distributions to Shareholders from: | | | | | | | | | | | | | | | | | | | | |
Net investment income | | | (0.11 | ) | | | (0.23 | ) | | | (0.26 | ) | | | (0.43 | ) | | | — | |
Total distributions to shareholders | | | (0.11 | ) | | | (0.23 | ) | | | (0.26 | ) | | | (0.43 | ) | | | — | |
Net Asset Value, End of Year | | $ | 14.64 | | | $ | 15.87 | | | $ | 14.00 | | | $ | 13.05 | | | $ | 14.02 | |
Total Return3,4 | | | (7.13 | )% | | | 15.23 | % | | | 9.55 | % | | | (3.92 | )% | | | 5.97 | % |
Ratio of net expenses to average net assets | | | 0.89 | % | | | 0.89 | % | | | 0.89 | % | | | 0.88 | % | | | 0.88 | % |
Ratio of gross expenses to average net assets5 | | | 0.97 | % | | | 0.95 | % | | | 1.05 | % | | | 1.01 | % | | | 1.02 | % |
Ratio of net investment income to average net assets3 | | | 2.07 | % | | | 1.19 | % | | | 0.36 | % | | | 0.88 | % | | | 1.76 | % |
Portfolio turnover | | | 27 | % | | | 26 | % | | | 71 | % | | | 55 | % | | | 5 | % |
Net assets end of year (000’s) omitted | | $ | 50,058 | | | $ | 59,712 | | | $ | 58,670 | | | $ | 63,485 | | | $ | 73,437 | |
| | | | | | | | | | | | | | | | | | | | |
| 1 | Effective October 1, 2016, the Investor Class, Service Class and Institutional Class were renamed Class N, Class I and Class Z, respectively. |
| 2 | Per share numbers have been calculated using average shares. |
| 3 | Total returns and net investment income (loss) would have been lower had certain expenses not been offset. |
| 4 | The total return is calculated using the published Net Asset Value as of fiscal year end. |
| 5 | Excludes the impact of expense reimbursement or fee waivers and expense reductions such as brokerage credits, but includes expense repayments and non-reimbursable expenses, if any, such as interest, taxes, and extraordinary expenses. (See Note 1(c) and 2 in the Notes to Financial Statements.) |
43
Notes to Financial Statements
October 31, 2018
1. SUMMARY OF SIGNIFICANT ACCOUNTING POLICIES
AMG Funds I (the “Trust”) is an open-end management investment company, organized as a Massachusetts business trust, and registered under the Investment Company Act of 1940, as amended (the “1940 Act”). Currently, the Trust consists of a number of different funds, each having distinct investment management objectives, strategies, risks, and policies. Included in this report are AMG FQ Tax-Managed U.S. Equity Fund (“Tax-Managed”), AMG FQ Long-Short Equity Fund (“Long-Short Equity”) and AMG FQ Global Risk-Balanced Fund (“Global Risk-Balanced”), each a “Fund” and collectively, the “Funds.”
Each Fund offers different classes of shares. Tax-Managed and Long-Short Equity offer Class N and Class I shares. Global Risk-Balanced offers Class N, Class I and Class Z shares. Each class represents an interest in the same assets of the respective Fund. Although all share classes generally have identical voting rights, each share class votes separately when required by law. Different share classes may have different net asset values per share to the extent the share classes pay different distribution amounts and/or the expenses of such share classes differ. Each share class has its own expense structure. Please refer to a current prospectus for additional information on each share class.
The Funds’ financial statements are prepared in accordance with accounting principles generally accepted in the United States of America (“U.S. GAAP”), including accounting and reporting guidance pursuant to Accounting Standards Codification Topic 946 applicable to investment companies. U.S. GAAP requires management to make estimates and assumptions that affect the reported amounts of assets and liabilities and disclosure of contingent assets and liabilities at the date of the financial statements and the reported amounts of income and expenses during the reporting period. Actual results could differ from those estimates and such differences could be material. The following is a summary of significant accounting policies followed by the Funds in the preparation of their financial statements:
a. VALUATION OF INVESTMENTS
Equity securities, including securities sold short and option contracts, traded on a national securities exchange or reported on the NASDAQ national market system (“NMS”) are valued at the last quoted sales price on the primary exchange or, if applicable, the NASDAQ official closing price or the official closing price of the relevant exchange or, lacking any sales, at the last quoted bid price or the mean between the last quoted bid and ask prices (the “exchange mean price”). Equity securities and securities sold short traded in the over-the-counter market (other than NMS securities) are valued at the exchange mean price. Foreign equity securities (securities principally traded in markets other than U.S. markets) are valued at the official closing price on the primary exchange or, for markets that either do not offer an official closing price or where the official closing price may not be representative of the overall market, the last quoted sale price.
Fixed income securities purchased with a remaining maturity exceeding 60 days are valued at the evaluated bid price or the mean price provided by an authorized pricing service or, if an evaluated price is not available, by reference to other securities which are considered comparable in credit rating, interest rate, due date and other features (generally referred to as “matrix pricing”) or other similar pricing methodologies.
Fixed income securities purchased with a remaining maturity of 60 days or less are valued at amortized cost, provided that the amortized cost value is approximately the same as the fair value of the security valued without the use of
amortized cost. Investments in other open-end regulated investment companies are valued at their end of day net asset value per share.
Futures contracts for which market quotations are readily available are valued at the settlement price as of the close of the futures exchange.
Total Return Equity Basket Swaps (“Equity Basket Swap”) may be valued using a price obtained from the counterparty of the Equity Basket Swap as long as the value obtained from the counterparty is reasonable to the total value of the underlying securities constituting the Equity Basket Swap if such underlying securities were priced in accordance with the Funds’ equity security valuation as discussed above.
The Funds’ portfolio investments are generally valued based on independent market quotations or prices or, if none, “evaluative” or other market based valuations provided by third party pricing services approved by the Board of Trustees of the Trust (the “Board”). Under certain circumstances, the value of certain Fund portfolio investments (including derivatives) may be based on an evaluation of fair value, pursuant to procedures established by and under the general supervision of the Board. The Valuation Committee, which is comprised of the Independent Trustees of the Board, and the Pricing Committee, which is comprised of representatives from AMG Funds LLC (the “Investment Manager”) are the committees appointed by the Board to make fair value determinations. Each Fund may use the fair value of a portfolio investment to calculate its net asset value (“NAV”) in the event that the market quotation, price or market based valuation for the portfolio investment is not readily available or otherwise not determinable pursuant to the Board’s valuation procedures, if the Investment Manager or the Pricing Committee believes the quotation, price or market based valuation to be unreliable, or in certain other circumstances. When determining the fair value of an investment, the Pricing Committee and, if required under the Trust’s securities valuation procedures, the Valuation Committee, seeks to determine the price that the Fund might reasonably expect to receive from current sale of that portfolio investment in an arms-length transaction. Fair value determinations shall be based upon consideration of all available facts and information, including, but not limited to (i) attributes specific to the investment; (ii) fundamental and analytical data relating to the investment; and (iii) the value of other comparable securities or relevant financial instruments, including derivative securities, traded on other markets or among dealers.
The values assigned to fair value portfolio investments are based on available information and do not necessarily represent amounts that might ultimately be realized in the future, since such amounts depend on future developments inherent in long-term investments. Because of the inherent uncertainty of valuation, those estimated values may differ significantly from the values that would have been used had a ready market for the investments existed, and the differences could be material. The Board will be presented with a quarterly report showing as of the most recent quarter end, all outstanding securities fair valued by the Fund, including a comparison with the prior quarter end and the percentage of the Fund that the security represents at each quarter end.
With respect to foreign equity securities and certain foreign fixed income securities, the Board has adopted a policy that securities held in a Fund that can be fair valued by the applicable fair value pricing service are fair valued on each business day provided that each individual price exceeds a pre-established confidence level.
U.S. GAAP defines fair value as the price that a fund would receive to sell an asset or pay to transfer a liability in an orderly transaction between market participants at the measurement date. U.S. GAAP also establishes a framework for measuring
44
Notes to Financial Statements (continued)
fair value, and a three level hierarchy for fair value measurements based upon the transparency of inputs to the valuation of an asset or liability. Inputs may be observable or unobservable and refer broadly to the assumptions that market participants would use in pricing the asset or liability. Observable inputs reflect the assumptions market participants would use in pricing the asset or liability based on market data obtained from sources independent of the Funds. Unobservable inputs reflect the Funds’ own assumptions about the assumptions that market participants would use in pricing the asset or liability developed based on the best information available in the circumstances. Each investment is assigned a level based upon the observability of the inputs which are significant to the overall valuation.
The three-tier hierarchy of inputs is summarized below:
Level 1 – inputs are quoted prices in active markets for identical investments (e.g., equity securities, open-end investment companies, futures contracts, options contracts)
Level 2 – other observable inputs (including, but not limited to: quoted prices for similar assets or liabilities in markets that are active, quoted prices for identical or similar assets or liabilities in markets that are not active, inputs other than quoted prices that are observable for the assets or liabilities (such as interest rates, yield curves, volatilities, prepayment speeds, loss severities, credit risks and default rates) or other market corroborated inputs) (e.g., debt securities, government securities, foreign currency exchange contracts, swaps, foreign securities utilizing international fair value pricing, fair valued securities with observable inputs)
Level 3 – inputs are significant unobservable inputs (including the Fund’s own assumptions used to determine the fair value of investments) (e.g., fair valued securities with unobservable inputs)
Changes in inputs or methodologies used for valuing investments may result in a transfer in or out of levels within the fair value hierarchy. The inputs or methodologies used for valuing investments may not necessarily be an indication of the risk associated with investing in those investments. Transfers between different levels of the fair value disclosure hierarchy are deemed to have occurred as of the beginning of the reporting period.
b. SECURITY TRANSACTIONS
Security transactions are accounted for as of trade date. Realized gains and losses on securities sold are determined on the basis of identified cost.
c. INVESTMENT INCOME AND EXPENSES
Dividend income is recorded on the ex-dividend date. Dividends from foreign securities are recorded on the ex-dividend date, and if after the fact, as soon as the Funds become aware of the ex-dividend date. Dividends declared on short positions are recorded on ex-date as dividend expense. Interest income, which includes amortization of premium and accretion of discount on debt securities, is accrued as earned. Dividend and interest income on foreign securities is recorded gross of any withholding tax. Non-cash dividends included in dividend income, if any, are reported at the fair market value of the securities received. Upon notification from issuers, distributions received from a real estate investment trust (“REIT”) may be redesignated as a reduction of cost of investments and/or realized gain. Other income and expenses are recorded on an accrual basis. Expenses that cannot be directly attributed to a Fund are apportioned among the funds in the Trust and other trusts within the AMG Funds family of mutual funds (collectively the “AMG Funds Family”) based upon their relative average net assets or number
of shareholders. Investment income, realized and unrealized capital gains and losses, the common expenses of each Fund, and certain fund level expense reductions, if any, are allocated on a pro-rata basis to each class based on the relative net assets of each class to the total net assets of each Fund.
Tax Managed and Long-Short Equity had certain portfolio trades directed to various brokers under a brokerage recapture program. Credits received from the brokerage recapture program are earned and paid on a monthly basis, and are recorded as expense offsets, which serve to reduce the Funds’ overall expense ratio. For the fiscal year ended October 31, 2018, the impact on the expense ratios, if any, were as follows: Tax Managed—$1,734 or less than 0.01%, and Long-Short Equity—$4,294 or less than 0.01%.
d. DIVIDENDS AND DISTRIBUTIONS
Fund distributions resulting from either net investment income or realized net capital gains, if any, will normally be declared and paid at least annually in December. Distributions to shareholders are recorded on the ex-dividend date. Distributions are determined in accordance with federal income tax regulations, which may differ from net investment income and net realized capital gains for financial statement purposes (U.S. GAAP). Differences may be permanent or temporary. Permanent differences are reclassified among capital accounts in the financial statements to reflect their tax character. Permanent book and tax basis differences, if any, relating to shareholder distributions will result in reclassifications to paid-in capital. Temporary differences arise when certain items of income, expense and gain or loss are recognized in different periods for financial statement and tax purposes; these differences will reverse at some time in the future. Permanent differences are primarily due to foreign currency transactions, reclass of swaps gain to ordinary income, net operating losses used to offset short-term capital gains, and capitalized dividends on short sales. Temporary differences are primarily due to wash sales, and mark-to-market of open swap, futures and option contracts.
The distributions disclosed on the Statements of Changes in Net Assets for the fiscal year ended October 31, 2017 were from the following sources:
| | | | | | | | |
| Fund | | Net Investment
Income | | | Realized Gain on
Investments | |
Tax-Managed | | | | | | | | |
Class N | | $ | 222,884 | | | | — | |
Class I | | | 675,125 | | | | — | |
| | | | | | | | |
Total | | | 898,009 | | | | — | |
| | | | | | | | |
Long-Short Equity | | | | | | | | |
Class N | | | 223,372 | | | $ | 1,166,878 | |
Class I | | | 483,055 | | | | 1,613,580 | |
| | | | | | | | |
Total | | | 706,427 | | | | 2,780,458 | |
| | | | | | | | |
Global Risk-Balanced | | | | | | | | |
Class N | | | 20,489 | | | | — | |
Class I | | | 115,642 | | | | — | |
Class Z | | | 927,631 | | | | — | |
| | | | | | | | |
Total | | | 1,063,762 | | | | — | |
| | | | | | | | |
45
Notes to Financial Statements (continued)
The tax character of distributions paid during the fiscal years ended October 31, 2018 and October 31, 2017 were as follows:
| | | | | | | | | | | | | | | | | | | | | | | | |
| | | Tax-Managed | | | Long-Short Equity | | | Global Risk-Balanced | |
| Distributions paid from: | | 2018 | | | 2017 | | | 2018 | | | 2017 | | | 2018 | | | 2017 | |
Ordinary income | | $ | 213,203 | | | $ | 898,009 | | | | — | | | $ | 463,754 | | | $ | 407,907 | | | $ | 1,063,762 | |
Short-term capital gains | | | — | | | | — | | | $ | 6,654,191 | | | | 764,459 | | | | — | | | | — | |
Long-term capital gains | | | 95,793 | | | | — | | | | 2,584,530 | | | | 2,258,672 | | | | — | | | | — | |
| | | | | | | | | | | | | | | | | | | | | | | | |
| | | $308,996 | | | $898,009 | | | $9,238,721 | | | $3,486,885 | | | $407,907 | | | $1,063,762 | |
| | | | | | | | | | | | | | | | | | | | | | | | |
As of October 31, 2018, the components of distributable earnings (excluding unrealized appreciation/depreciation) on a tax basis consisted of:
| | | | | | | | | | | | |
| | | Tax-Managed | | | Long-Short Equity | | | Global Risk-Balanced | |
Capital loss carryforward | | | — | | | | — | | | $ | (3,359,564 | ) |
Undistributed ordinary income | | $ | 171,532 | | | | — | | | | 916,632 | |
Undistributed short-term capital gains | | | — | | | $ | 509,261 | | | | — | |
Undistributed long-term capital gains | | | 914,963 | | | | 2,569,482 | | | | — | |
Late-year loss deferral | | | — | | | | — | | | | — | |
At October 31, 2018, the cost of investments and the aggregate gross unrealized appreciation and depreciation for federal income tax purposes were as follows:
| | | | | | | | | | | | | | | | |
| Fund | | Cost | | | Appreciation | | | Depreciation | | | Net | |
Tax-Managed | | $ | 47,080,677 | | | $ | 27,651,184 | | | $ | (1,071,605 | ) | | $ | 26,579,579 | |
Long-Short Equity | | | 8,592,188 | | | | 6,780,822 | | | | (5,165,717 | ) | | | 1,615,105 | |
Global Risk-Balanced | | | 66,964,163 | | | | 546,152 | | | | (2,618,063 | ) | | | (2,071,911 | ) |
e. FEDERAL TAXES
Each Fund currently qualifies as an investment company and intends to comply with the requirements under Subchapter M of the Internal Revenue Code of 1986, as amended, and to distribute substantially all of its taxable income and gains to its shareholders and to meet certain diversification and income requirements with respect to investment companies. Therefore, no provision for federal income or excise tax is included in the accompanying financial statements.
Additionally, based on each Fund’s understanding of the tax rules and rates related to income, gains and transactions for the foreign jurisdictions in which it invests, each Fund will provide for foreign taxes, and where appropriate, deferred foreign taxes.
Management has analyzed the Funds’ tax positions taken on federal income tax returns as of October 31, 2018, and for all open tax years (generally, the three prior taxable years), and has concluded that no provision for federal income tax is required in the Funds’ financial statements. Additionally, Management is not aware of any tax position for which it is reasonably possible that the total amounts of unrecognized tax benefits will change materially in the next twelve months.
Net capital losses incurred may be carried forward for an unlimited time period and retain their tax character as either short-term or long-term capital losses.
f. CAPITAL LOSS CARRYOVERS AND DEFERRALS
As of October 31, 2018, the following Funds had accumulated net realized capital loss carryovers from securities transactions for federal income tax purposes as
shown in the following chart. These amounts may be used to offset future realized capital gains, if any, for an unlimited time period.
| | | | | | | | | | | | |
| | | Capital Loss
Carryover Amounts | |
| Fund | | Short-Term | | | Long-Term | | | Total | |
Global Risk-Balanced | | $ | 532,808 | | | $ | 2,826,756 | | | $ | 3,359,564 | |
As of October 31, 2018, Tax Managed and Long-Short Equity had no accumulated net realized capital loss carryovers from securities transactions for federal income tax purposes. Should the Fund incur net capital losses for the fiscal year ended October 31, 2019, such amounts may be used to offset future realized capital gains, for an unlimited time period.
g. CAPITAL STOCK
The Trust’s Declaration of Trust authorizes for each Fund the issuance of an unlimited number of shares of beneficial interest, without par value. Each Fund records sales and repurchases of its capital stock on the trade date.
46
Notes to Financial Statements (continued)
For the fiscal years ended October 31, 2018 and October 31, 2017, the capital stock transactions by class for the Funds were as follows:
| | | | | | | | | | | | | | | | | | | | | | | | | | | | | | | | |
| | | Tax-Managed | | | Long-Short Equity | |
| | | October 31, 2018 | | | October 31, 2017 | | | October 31, 2018 | | | October 31, 2017 | |
| | | Shares | | | Amount | | | Shares | | | Amount | | | Shares | | | Amount | | | Shares | | | Amount | |
Class N: | | | | | | | | | | | | | | | | | | | | | | | | | | | | | | | | |
Proceeds from sale of shares | | | 89,309 | | | $ | 3,039,894 | | | | 134,121 | | | $ | 3,486,138 | | | | 1,538,753 | | | $ | 24,699,406 | | | | 57,050 | | | $ | 953,326 | |
Reinvestment of distributions | | | 357 | | | | 10,842 | | | | 6,515 | | | | 169,637 | | | | 48,518 | | | | 693,802 | | | | 84,893 | | | | 1,381,070 | |
Cost of shares repurchased | | | (194,591 | ) | | | (6,147,980 | ) | | | (681,281 | ) | | | (18,444,807 | ) | | | (216,542 | ) | | | (3,358,947 | ) | | | (1,546,753 | ) | | | (26,281,313 | ) |
| | | | | | | | | | | | | | | | | | | | | | | | | | | | | | | | |
Net increase (decrease) | | | (104,925 | ) | | $ | (3,097,244 | ) | | | (540,645 | ) | | $ | (14,789,032 | ) | | | 1,370,729 | | | $ | 22,034,261 | | | | (1,404,810 | ) | | $ | (23,946,917 | ) |
| | | | | | | | | | | | | | | | | | | | | | | | | | | | | | | | |
Class I: | | | | | | | | | | | | | | | | | | | | | | | | | | | | | | | | |
Proceeds from sale of shares | | | 200,346 | | | $ | 6,232,503 | | | | 405,824 | | | $ | 11,201,539 | | | | 1,573,628 | | | $ | 24,596,154 | | | | 83,845 | | | $ | 1,448,437 | |
Reinvestment of distributions | | | 9,365 | | | | 284,333 | | | | 25,709 | | | | 668,681 | | | | 581,487 | | | | 8,315,255 | | | | 125,527 | | | | 2,047,449 | |
Cost of shares repurchased | | | (240,844 | ) | | | (7,592,756 | ) | | | (614,676 | ) | | | (16,726,986 | ) | | | (675,126 | ) | | | (10,510,628 | ) | | | (329,885 | ) | | | (5,574,707 | ) |
| | | | | | | | | | | | | | | | | | | | | | | | | | | | | | | | |
Net increase (decrease) | | | (31,133 | ) | | $ | (1,075,920 | ) | | | (183,143 | ) | | $ | (4,856,766 | ) | | | 1,479,989 | | | $ | 22,400,781 | | | | (120,513 | ) | | $ | (2,078,821 | ) |
| | | | | | | | | | | | | | | | | | | | | | | | | | | | | | | | |
| | | | | | | | | | | | | | | | |
| | | Global Risk-Balanced | |
| | | October 31, 2018 | | | October 31, 2017 | |
| | | Shares | | | Amount | | | Shares | | | Amount | |
Class N: | | | | | | | | | | | | | | | | |
Proceeds from sale of shares | | | 7,244 | | | $ | 114,701 | | | | 36,312 | | | $ | 515,087 | |
Reinvestment of distributions | | | 357 | | | | 5,692 | | | | 1,495 | | | | 20,489 | |
Cost of shares repurchased | | | (18,612 | ) | | | (285,005 | ) | | | (166,590 | ) | | | (2,325,265 | ) |
| | | | | | | | | | | | | | | | |
Net decrease | | | (11,011 | ) | | $ | (164,612 | ) | | | (128,783 | ) | | $ | (1,789,689 | ) |
| | | | | | | | | | | | | | | | |
Class I: | | | | | | | | | | | | | | | | |
Proceeds from sale of shares | | | 53,628 | | | $ | 842,928 | | | | 147,896 | | | $ | 2,154,357 | |
Reinvestment of distributions | | | 286 | | | | 4,577 | | | | 8,435 | | | | 115,642 | |
Cost of shares repurchased | | | (42,242 | ) | | | (659,758 | ) | | | (583,215 | ) | | | (8,690,474 | ) |
| | | | | | | | | | | | | | | | |
Net increase (decrease) | | | 11,672 | | | $ | 187,747 | | | | (426,884 | ) | | $ | (6,420,475 | ) |
| | | | | | | | | | | | | | | | |
Class Z: | | | | | | | | | | | | | | | | |
Proceeds from sale of shares | | | 44,736 | | | $ | 702,172 | | | | 81,379 | | | $ | 1,189,764 | |
Reinvestment of distributions | | | 24,413 | | | | 389,879 | | | | 66,271 | | | | 911,253 | |
Cost of shares repurchased | | | (413,829 | ) | | | (6,488,652 | ) | | | (575,434 | ) | | | (8,381,135 | ) |
| | | | | | | | | | | | | | | | |
Net decrease | | | (344,680 | ) | | $ | (5,396,601 | ) | | | (427,784 | ) | | $ | (6,280,118 | ) |
| | | | | | | | | | | | | | | | |
h. REPURCHASE AGREEMENTS AND JOINT REPURCHASE AGREEMENTS
The Funds may enter into third-party repurchase agreements for temporary cash management purposes and third-party or bilateral joint repurchase agreements for reinvestment of cash collateral on securities lending transactions under the securities lending program offered by The Bank of New York Mellon (“BNYM”) (the “Program”) (collectively, “Repurchase Agreements”). The value of the underlying collateral, including accrued interest, must equal or exceed the value of the Repurchase Agreements during the term of the agreement. For joint repurchase agreements, the Funds participate on a pro rata basis with other clients of BNYM
in its share of the underlying collateral under such joint repurchase agreements and in its share of proceeds from any repurchase or other disposition of the underlying collateral. The underlying collateral for all Repurchase Agreements is held in safekeeping by the Funds’ custodian or at the Federal Reserve Bank. If the seller defaults and the value of the collateral declines, or if bankruptcy proceedings commence with respect to the seller of the security, realization of the collateral by the Funds may be delayed or limited. Pursuant to the Program, the Funds are indemnified for such losses by BNYM on joint repurchase agreements.
47
Notes to Financial Statements (continued)
At October 31, 2018, the market value of Repurchase Agreements outstanding for Tax-Managed, Long-Short Equity and Global Risk-Balanced were $505,784, $160,204 and $11,388,521, respectively.
i. FOREIGN CURRENCY TRANSLATION
The books and records of the Funds are maintained in U.S. dollars. The value of investments, assets and liabilities denominated in currencies other than U.S. dollars are translated into U.S. dollars based upon current foreign exchange rates. Purchases and sales of foreign investments, income and expenses are converted into U.S. dollars based on currency exchange rates prevailing on the respective dates of such transactions. Net realized and unrealized gain (loss) on foreign currency transactions represent: (1) foreign exchange gains and losses from the sale and holdings of foreign currencies; (2) gains and losses between trade date and settlement date on investment securities transactions and foreign currency exchange contracts; and (3) gains and losses from the difference between amounts of interest and dividends recorded and the amounts actually received.
The Funds do not isolate the net realized and unrealized gain or loss resulting from changes in exchange rates from the fluctuations in market prices of securities held. Such fluctuations are included with the net realized and unrealized gain or loss on investments.
2. AGREEMENTS AND TRANSACTIONS WITH AFFILIATES
For each of the Funds, the Trust has entered into an investment advisory agreement under which the Investment Manager, a subsidiary and the U.S. retail distribution arm of Affiliated Managers Group, Inc. (“AMG”), serves as investment manager to the Funds and is responsible for the Funds’ overall administration and operations. The Investment Manager selects one or more subadvisers for the Funds (subject to Board approval) and monitors each subadviser’s investment performance, security holdings and investment strategies. Each Fund’s investment portfolio is managed by First Quadrant, L.P. (“First Quadrant”), who serves pursuant to a subadvisory agreement with the Investment Manager. AMG indirectly owns a majority interest in First Quadrant.
Investment management fees are paid directly by the Funds to the Investment Manager based on average daily net assets. For the fiscal year ended October 31, 2018, the Funds’ investment management fees were paid at the following annual rate of each Fund’s respective average daily net assets:
| | | | |
Tax-Managed | | | 0.70 | % |
Long-Short Equity | | | 0.35 | % |
Global Risk-Balanced | | | 0.60 | % |
The Investment Manager has contractually agreed, through at least March 1, 2019, to waive management fees and/or reimburse fund expenses in order to limit total annual Fund operating expenses after fee waiver and expense reimbursements (exclusive of taxes, interest (including interest incurred in connection with bank and custody overdrafts), shareholder servicing fees, distribution and service (12b-1) fees, brokerage commissions and other transaction costs, dividends, payable with respect to securities sold short (Long-Short Equity only), acquired fund fees and expenses and extraordinary expenses) of Tax-Managed, Long-Short Equity and Global Risk-Balanced to 0.89%, 0.69% and 0.89%, respectively, of each Fund’s average daily net assets subject to later reimbursement by the Funds in
certain circumstances. Prior to February 27, 2017, the expense cap was 0.79% of average daily net assets for Long-Short Equity.
The contractual expense limitation may only be terminated in the event the Investment Manager or a successor ceases to be the investment manager of the Fund or a successor fund, by mutual agreement between the Investment Manager and the Board, or in the event of the Fund’s liquidation unless the Fund is reorganized or is a party to a merger in which the surviving entity is successor to the accounting and performance information of the Fund.
In general, for a period of up to 36 months, the Investment Manager may recover from each Fund fees waived and expenses paid pursuant to this contractual agreement, provided that such repayment would not cause the Fund’s total annual operating expenses after fee waiver and expense reimbursements (exclusive of the items noted in the parenthetical above) to exceed the contractual expense limitation amount.
At October 31, 2018, the Funds’ expiration of recoupment is as follows:
| | | | | | | | | | | | |
Expiration
Period | | Tax-Managed | | | Long-Short Equity | | | Global Risk-Balanced | |
Less than 1 year | | $ | 100,980 | | | $ | 22,232 | | | $ | 98,848 | |
Within 2 years | | | 94,797 | | | | 38,180 | | | | 39,272 | |
Within 3 years | | | 92,665 | | | | 58,523 | | | | 49,633 | |
| | | | | | | | | | | | |
Total Amount Subject to Recoupment | | $ | 288,442 | | | $ | 118,935 | | | $ | 187,753 | |
| | | | | | | | | | | | |
The Trust, on behalf of the Funds, has entered into an amended and restated Administration Agreement under which the Investment Manager serves as the Funds’ administrator (the “Administrator”) and is responsible for all non-portfolio management aspects of managing the Fund’s operations, including administration and shareholder services to each Fund. Each Fund pays a fee to the Administrator at the rate of 0.15% per annum of the Fund’s average daily net assets for this service.
The Funds are distributed by AMG Distributors, Inc. (the “Distributor”), a wholly-owned subsidiary of the Investment Manager. The Distributor serves as the distributor and underwriter for each Fund and is a registered broker-dealer and member of the Financial Industry Regulatory Authority, Inc. (“FINRA”). Shares of each Fund will be continuously offered and will be sold directly to prospective purchasers and through brokers, dealers or other financial intermediaries who have executed selling agreements with the Distributor. Generally the Distributor bears all or a portion of the expenses of providing services pursuant to the distribution agreement, including the payment of the expenses relating to the distribution of prospectuses for sales purposes and any advertising or sales literature.
The Trust has adopted a distribution and service plan (the “Plan”) with respect to the Class N shares, in accordance with the requirements of Rule 12b-1 under the 1940 Act and the requirements of the applicable rules of FINRA regarding asset-based sales charges. Pursuant to the Plan, each Fund may make payments to the Distributor for its expenditures in financing any activity primarily intended to result in the sale of each such class of the Fund’s shares and for maintenance and personal service provided to existing shareholders of that class. The Plan authorizes payments to the Distributor up to 0.25% annually of each Fund’s average daily net assets attributable to the Class N shares.
48
Notes to Financial Statements (continued)
For Class N and Class I shares of Long-Short Equity and Global Risk-Balanced, the Board has approved reimbursement payments to the Investment Manager for shareholder servicing expenses (“shareholder servicing fees”) incurred. Shareholder servicing fees include payments to financial intermediaries, such as broker-dealers (including fund supermarket platforms), banks, and trust companies who provide shareholder recordkeeping, account servicing and other services. The Class N and Class I shares may reimburse the Investment Manager for the actual amount incurred up to a maximum annual rate of each Class’s average daily net assets as shown in the table below.
The impact on the annualized expense ratio for the fiscal year ended October 31, 2018, were as follows:
| | | | | | | | |
| Fund | | Maximum Annual
Amount
Approved | | | Actual
Amount
Incurred | |
Long-Short Equity | | | | | | | | |
Class N | | | 0.10 | % | | | 0.10 | % |
Class I | | | 0.10 | % | | | 0.03 | % |
Global Risk-Balanced | | | | | | | | |
Class N* | | | 0.15 | % | | | 0.15 | % |
Class I | | | 0.15 | % | | | 0.15 | % |
| * | Effective February 27, 2017, the maximum annual rate was decreased to 0.15% from 0.25%. |
The Board provides supervision of the affairs of the Trust and other trusts within the AMG Funds family. The Trustees of the Trust who are not affiliated with the Investment Manager receive an annual retainer and per meeting fees for regular, special and telephonic meetings, and they are reimbursed for out-of-pocket expenses incurred while carrying out their duties as Board members. The Chairman of the Board and the Audit Committee Chair receive additional annual retainers. Certain Trustees and Officers of the Funds are Officers and/or Directors of the Investment Manager, AMG and/or the Distributor.
The Securities and Exchange Commission (the “SEC”) granted an exemptive order that permits the Funds to lend and borrow money for certain temporary purposes directly to and from other eligible funds in the AMG Funds family. Participation in this interfund lending program is voluntary for both the borrowing and lending funds, and an interfund loan is only made if it benefits each participating fund. The Administrator manages the program according to procedures approved by the Board, and the Board monitors the operation of the program. An interfund loan must comply with certain conditions set out in the exemptive order, which are designed to assure fairness and protect all participating funds. For the fiscal year ended October 31, 2018, Long-Short Equity lent a maximum of $1,295,244 for three days earning interest of $193, Global Risk-Balanced lent a maximum of $111,807 for four days earning interest of $28. The interest income amount is included in the Statement of Operations as interest income. At October 31, 2018, the Funds had no interfund loans outstanding.
3. PURCHASES AND SALES OF SECURITIES
Purchases and sales of securities (excluding short-term securities and U.S. Government Obligations) for the fiscal year ended October 31, 2018, were as follows:
| | | | | | | | |
| | | Long Term Securities | |
| Fund | | Purchases | | | Sales | |
Tax-Managed | | $ | 23,165,388 | | | $ | 26,699,257 | |
Long-Short Equity | | | 126,207,971 | | | | 126,098,838 | |
Global Risk-Balanced | | | 11,320,529 | | | | 17,423,263 | |
The Funds had no purchases or sales of U.S. Government Obligations during the fiscal year ended October 31, 2018.
4. PORTFOLIO SECURITIES LOANED
The Funds participate in the Program providing for the lending of securities to qualified brokers. Securities lending income includes earnings of such temporary cash investments, plus or minus any rebate to a borrower. These earnings (after any rebate) are then divided between BNYM, as a fee for its services under the Program, and the Funds, according to agreed-upon rates. Collateral on all securities loaned is accepted in cash and non-cash and, effective October 1, 2018, may also be accepted in U.S. Government and Agency Obligations. Collateral is maintained at a minimum level of 102% (105% in the case of certain foreign securities) of the market value, plus interest, if applicable, of investments on loan. It is the Funds’ policy to obtain additional collateral from or return excess collateral to the borrower by the end of the next business day, following the valuation date of the securities loaned. Therefore, the value of the collateral held may be temporarily less than the value of the securities on loan. Lending securities entails a risk of loss to the Funds if and to the extent that the market value of the securities loaned were to increase and the borrower did not increase the collateral accordingly, and the borrower fails to return the securities. Under the terms of the Program, the Funds are indemnified for such losses by BNYM. Cash collateral is held in separate omnibus accounts managed by BNYM, who is authorized to exclusively enter into joint repurchase agreements for that cash collateral. Non-cash collateral is held in separate omnibus accounts managed by BNYM that cannot be sold or pledged. BNYM bears the risk of any deficiency in the amount of the cash collateral available for return to the borrower due to any loss on the collateral invested.
The value of securities loaned on positions held and cash and non-cash collateral received at October 31, 2018, were as follows:
| | | | | | | | | | | | | | | | |
| Fund | | Securities
Loaned | | | Cash
Collateral
Received | | | Non-Cash
Collateral
Received | | | Total
Collateral
Received | |
Tax-Managed | | $ | 2,371,923 | | | $ | 505,784 | | | $ | 1,935,627 | | | $ | 2,441,411 | |
Long-Short Equity | | | 2,085,671 | | | | 160,204 | | | | 1,986,994 | | | | 2,147,198 | |
Global Risk-Balanced | | | 13,849,078 | | | | 11,388,521 | | | | 2,803,298 | | | | 14,191,819 | |
5. FOREIGN SECURITIES
Global Risk-Balanced invests in securities of foreign entities and in instruments denominated in foreign currencies which involve risks not typically associated with investments in domestic securities. Non-domestic securities carry special risks, such as exposure to currency fluctuations, less developed or less efficient trading markets, political instability, a lack of company information, differing auditing and legal standards, and, potentially, less liquidity. Realized gains in certain countries may be subject to foreign taxes at the Fund level and the Fund would pay such foreign taxes at the appropriate rate for each jurisdiction.
49
Notes to Financial Statements (continued)
6. COMMITMENTS AND CONTINGENCIES
Under the Trust’s organizational documents, its trustees and officers are indemnified against certain liabilities arising out of the performance of their duties to the Trust. In addition, in the normal course of business, the Funds may enter into contracts and agreements that contain a variety of representations and warranties, which provide general indemnifications. The maximum exposure to the Funds under these arrangements is unknown, as this would involve future claims that may be made against a Fund that have not yet occurred. However, based on experience, the Funds had no prior claims or losses and expect the risks of loss to be remote.
7. FORWARD COMMITMENTS
Certain transactions, such as futures and forward transactions may have a similar effect on a Fund’s net asset value as if a Fund had created a degree of leverage in its portfolio. However, if a Fund enters into such a transaction, a Fund will establish a segregated account with its custodian in which it will maintain cash, U.S. government securities or other liquid securities equal in value to its obligations in respect to such transaction. Securities and other assets held in the segregated account may not be sold while the transaction is outstanding, unless other suitable assets are substituted.
8. DERIVATIVE INSTRUMENTS
The following disclosures contain information on how and why certain Funds use derivative instruments, the credit risk and how derivative instruments affect the Funds’ financial position, and results of operations. The location and fair value amounts of these instruments on the Statement of Assets and Liabilities, and the realized gains and losses and changes in unrealized gains and losses on the Statement of Operations, each categorized by type of derivative contract, are included in a table at the end of the applicable Fund’s Schedule of Portfolio Investments. For the fiscal year ended October 31, 2018, the average quarterly balances of derivative financial instruments outstanding were as follows:
| | | | | | | | |
| | | Long-Short Equity | | | Global Risk-Balanced | |
Financial Futures Contracts | | | | | | | | |
Average number of contracts purchased | | | 400 | | | | 737 | |
Average notional value of contracts | | $ | 54,102,435 | | | $ | 62,029,809 | |
Options | | | | | | | | |
Average value of option contracts purchased | | | — | | | $ | 349,784 | |
Average value of option contracts written | | | — | | | $ | 403,267 | |
Swap Agreements | | | | | | | | |
Average notional value* | | $ | 340,671 | | | | — | |
| * | Average based on last three months of fiscal year ended October 31, 2018. |
9. FUTURES CONTRACTS
Long-Short Equity entered into equity index futures contracts with the objective of maintaining exposure to equity stock markets while maintaining liquidity. Global
Risk-Balanced entered into futures contracts, including futures contracts on fixed-income securities, interest rate futures contracts, foreign currency futures contracts and futures contracts on security indices (including broad-based security indices). Long-Short Equity and Global Risk-Balanced purchased and sold futures contracts to achieve a desired level of investment, whether to accommodate portfolio turnover or cash flows from capital shares transactions. There are certain risks associated with futures contracts. Prices may not move as expected or the Fund may not be able to close out the contract when it desires to do so, resulting in losses.
On entering into a futures contract, either cash or securities in an amount equal to a certain percentage of the contract value (initial margin) must be deposited with the futures broker. Subsequent variation margin payments are made or received by the Funds depending on the fluctuations in the value of the futures contracts and the value of cash or securities on deposit with the futures broker. The Funds must have total value at the futures broker consisting of either net unrealized gains, cash or securities collateral to meet the initial margin requirement, and any value over the initial margin requirement may be transferred to the Funds.
Variation margin on future contracts is recorded as unrealized appreciation or depreciation until the futures contract is closed or expired. The Funds recognize a realized gain or loss when the contract is closed or expires equal to the difference between the value of the contract at the time it was opened and the value at the time it was closed. Fluctuations in the value of the contracts are recorded in the Statement of Assets and Liabilities as an asset (liability) and in the Statement of Operations as unrealized appreciation (depreciation) until the contracts are closed, when they are recorded as realized gains (losses) on futures contracts.
As of October 31, 2018, Long-Short Equity had an amount of $8,943,034 with the futures broker, which consisted of $6,283,200 cash deposited to cover initial margin requirements, unrealized depreciation of $475,634 on open futures contracts and additional cash of $3,135,468.
As of October 31, 2018, Global Risk-Balanced had unrealized depreciation of $2,333,364 on open futures contracts, which Global Risk-Balanced made payments to the futures broker of $2,551,543. Additionally, the Fund has $2,894,289 of security collateral held with the futures broker to cover initial margin.
10. OPTIONS
A written option contract is a contract in which the writer of the option grants the buyer of the option the right to purchase from (call option) or sell to (put option) the writer a designated instrument at a specified price within a specified period of time. Options purchased are recorded as an asset, while options written (sold) are recorded as liabilities. Long-Short Equity and Global Risk-Balanced, as writer of written options, bears the risk of an unfavorable change in the market value of the instrument underlying the written option. When an option expires, the premium (original option value) is realized as a gain if the option was written or as a loss if the option was purchased. When the exercise of an option results in a cash settlement, the difference between the premium and the settlement proceeds is recognized as realized gain or loss. When securities are acquired or delivered upon exercise of an option, the acquisition cost or sale proceeds are adjusted by the amount of the premium. When an option is closed, the difference between the premium and the cost to close the position is realized as a gain or loss.
50
Notes to Financial Statements (continued)
11. SWAPS
Long Short Equity may enter into Equity Basket Swaps to obtain exposure to a portfolio of long and short securities. Under the terms of the agreement, the equity return basket swap is designed to function as a fund of direct investments in long and short equity positions. The Fund will receive all of the economic benefits and risks equivalent to direct investments in these positions such as: capital appreciation or depreciation, corporate actions, and dividends and interest received and paid, all of which are reflected in the swap value. The swap value also includes interest charges and credits (“financing fees”) related to the notional values of the long and short positions and cash balances within the swap. These financing fees are based on defined market rates or a specified benchmark rate, plus or minus a specified spread. Underlying positions constituting the Equity Basket Swap are reset periodically. On reset date, any unrealized gains (losses) on positions and accrued financing costs become available for cash settlement between Long Short Equity and the swap counterparty. Cash settlement in and out of the swap may occur at a reset date, close-out date or at maturity.
A change in the market value of a Equity Basket Swap unpaid dividend income and/or expense and financing fees are recognized as net change in unrealized appreciation or depreciation on swaps in the Statements of Operations. Payments received or paid, on resets, close-outs or maturities, are recorded in the statement of operations as realized gains or losses of swaps.
Swaps and Equity Basket Swaps, are two-party contracts that may be subject to contractual restrictions on transferability and termination and because they may have terms of greater than seven days, swap agreements may be considered to be illiquid. If a swap is not liquid, it may not be possible to initiate a transaction or liquidate a position at an advantageous time or price, which may result in significant losses. Moreover, the Fund bears the risk of loss of the amount expected to be received under a swap agreement in the event of the default or bankruptcy of a swap agreement counterparty. the Fund will enter into swap agreements only with counterparties that meet certain standards of creditworthiness. When a counterparty’s obligations are not fully secured by collateral, then the Fund is essentially an unsecured creditor of the counterparty. If the counterparty defaults, the Fund will have contractual remedies, but there is no assurance that a counterparty will be able to meet its obligations pursuant to such contracts or that, in the event of default, the Fund will succeed in enforcing contractual remedies. Counterparty risk still exists even if a counterparty’s obligations are secured by collateral because the Fund’s interest in collateral may not be perfected or additional collateral may not be promptly posted as required. Counterparty risk also may be more pronounced if a counterparty’s obligations exceed the amount of collateral held by the Fund, if any, the Fund is unable to exercise its interest in collateral upon default by the counterparty, or the termination value of the instrument varies significantly from the marked-to-market value of the instrument.
12. EXCHANGE TRADED NOTES
Global Risk-Balanced invests in Exchange Traded Notes (“ETNs”). ETNs are senior, unsecured, unsubordinated debt securities issued by a financial institution, listed on an exchange and traded in the secondary market. There are no periodic interest payments, and principal is not protected. The Fund could lose some or all of the amount invested. The price in the secondary market is determined by supply and demand, the current performance of the index, and the credit rating of the ETN issuer. At maturity, the issuer pays the Fund a return linked to the performance of the market index, such as a commodity index, to which the ETN is linked, minus the issuer’s fee. ETNs are subject to the risk of a breakdown in the
futures markets that they use. As a means to obtain commodity exposure, the Fund invests in ETNs linked to commodity indices. The Fund may be exposed to a wide variety of commodity sectors, including, without limitation, agriculture, livestock, base/industrial metals, oil, energy and precious metals. Commodity prices, and the value of stocks of companies exposed to commodities, can be extremely volatile and are affected by a wide range of factors.
13. MARKET, CREDIT AND COUNTERPARTY RISKS
In the normal course of business, Global Risk-Balanced invests in securities and enters into transactions where risks exist due to market fluctuations and is exposed to credit risk with parties with whom it trades (issuers or counterparties). Market prices of investments held by the Fund may fall rapidly or unpredictably and will rise and fall due to changing economic, political, or market conditions or in response to events that affect particular industries or companies. The Fund may be exposed to credit or counterparty risk, or the risk that an institution or other entity with which the Fund has unsettled or open transactions will default or not perform under the contract. The Fund minimizes credit risk and counterparty risk by undertaking transactions with a large number of customers and counterparties on recognized and reputable exchanges. The Fund could lose money if the issuer or guarantor of a fixed income security, or the counterparty to a financial derivatives contract, repurchase agreement or a loan of portfolio securities, is unable or unwilling to make timely principal and/or interest payments, or to otherwise honor its obligations.
The Funds are subject to various Master Agreements, which govern the terms of certain transactions with select counterparties. These Master Agreements reduce the counterparty risk associated with relevant transactions by specifying credit protection mechanisms and providing standardization that improves legal certainty. Master Agreements can also help limit counterparty risk by specifying collateral posting arrangements at pre-arranged exposure levels. Under the Master Agreements, collateral is routinely transferred if the total net exposure to certain transactions (net of existing collateral already in place) governed under the relevant master agreement with a counterparty in a given account exceeds a specified threshold, which typically ranges from zero to $250,000 depending on the counterparty and the type of Master Agreement.
International Swaps and Derivatives Association, Inc. Master Agreements (“ISDA Master Agreements”) govern OTC financial derivative transactions entered into by the Funds and the respective counterparty. The ISDA Master Agreements maintain provisions for general obligations, representations, agreements, collateral and events of default or termination. Certain ISDA Master Agreements allow counterparties to OTC derivatives to terminate derivative contracts prior to maturity in the event the Funds’ net assets decline by a stated percentage or the Funds fail to meet the terms of the ISDA Master Agreement, which requires accelerated settlement of all outstanding transactions under the applicable ISDA Master Agreement. Any election to terminate early could be material to the financial statements.
14. SECURITIES SOLD SHORT AND DUE TO/FROM BROKERS
Long-Short Equity utilizes short sales as part of its overall portfolio management strategy. A short sale involves the sale of a security that is borrowed from a broker or other financial institution. A gain, limited to the price at which the Fund sold the security short, or a loss, unlimited in size, will be recognized upon closing a short sale. Short sales expose the Fund to the risk that it will be required to acquire, convert or exchange securities to replace the borrowed securities at a time when
51
Notes to Financial Statements (continued)
the securities sold short have appreciated in value, thus resulting in a loss to the Fund. The Fund must segregate liquid assets, or otherwise cover its position in a permissible manner. The Investment Manager determines the liquidity of assets, in accordance with procedures established by the Board. Cash segregated as collateral for short sales is shown in the Statement of Assets and Liabilities as segregated cash. Security positions segregated as collateral for short sales are included in unaffiliated investments at value in the Statement of Assets and Liabilities. Due to/from brokers represents cash balances on deposit with, or cash balances owed to the Prime Broker. When the Fund has cash balances on deposit with the Prime Broker, the Fund is subject to credit risk should the Prime Broker be unable to meet their obligations to the Fund; and when the Fund has cash balances owed to the Prime Broker, the amount is payable upon demand and the Fund must segregate liquid assets. The Fund has entered into a Special Custody and Pledge Agreement with the Prime Broker for securities sold short, which provides the right, in the event of default (including bankruptcy or insolvency) for the non-defaulting party to liquidate the collateral and calculate net exposure to the defaulting party or request additional collateral. For financial reporting purposes, the Fund does not offset financial assets and financial liabilities that are subject to a Special Custody and Pledge Agreement in the Statement of Assets
and Liabilities. As of October 31, 2018, the value of securities sold short was $37,689,526, and the Fund had $34,604,851 of cash deposited with the Prime Broker and securities segregated as collateral worth $7,973,291. For the fiscal year ended October 31, 2018, the Fund had interest and dividend expense in the amounts of $305,593 and $626,880, respectively. These amounts are included in the Statement of Operations as interest and dividend expense.
15. MASTER NETTING AGREEMENTS
The Funds may enter into master netting agreements with their counterparties for the securities lending and short-sale programs, Repurchase Agreements and derivative instruments, which provide the right, in the event of default (including bankruptcy or insolvency) for the non-defaulting party to liquidate the collateral and calculate net exposure to the defaulting party or request additional collateral. For financial reporting purposes, the Funds do not offset financial assets and financial liabilities that are subject to master netting agreements in the Statement of Assets and Liabilities. For securities lending and short sale transactions, see Note 4 and Note 13.
The following table is a summary of the Funds’ open Repurchase Agreements and derivatives that are subject to a master netting agreement as of October 31, 2018:
| | | | | | | | | | | | | | | | |
| | | | | | Gross Amount Not Offset in the
Statement of Assets and Liabilities | | | | |
| Fund | | Net Amounts of Assets
Presented in the Statement
of Assets and Liabilities | | | Financial
Instruments
Collateral | | | Cash Collateral
Received | | | Net Amount | |
Tax-Managed | | | | | | | | | | | | | | | | |
Credit Suisse AG | | $ | 505,784 | | | $ | 505,784 | | | | — | | | | — | |
Long-Short Equity | | | | | | | | | | | | | | | | |
Citibank N.A. | | $ | 160,204 | | | $ | 160,204 | | | | — | | | | — | |
Morgan Stanley & Co. | | | 42,185 | | | | 42,185 | | | | — | | | | — | |
| | | | | | | | | | | | | | | | |
Total | | $ | 202,389 | | | $ | 202,389 | | | | — | | | | — | |
| | | | | | | | | | | | | | | | |
Global Risk-Balanced | | | | | | | | | | | | | | | | |
BNP Paribas SA | | $ | 882,768 | | | $ | 882,768 | | | | — | | | | — | |
MUFG Securities America, Inc. | | | 2,704,947 | | | | 2,704,947 | | | | — | | | | — | |
Nomura Securities International, Inc. | | | 2,704,947 | | | | 2,704,947 | | | | — | | | | — | |
RBC Dominion Securities, Inc. | | | 2,704,947 | | | | 2,704,947 | | | | — | | | | — | |
State of Wisconsin Investment Board | | | 2,390,912 | | | | 2,390,912 | | | | — | | | | — | |
| | | | | | | | | | | | | | | | |
Total | | $ | 11,388,521 | | | $ | 11,388,521 | | | | — | | | | — | |
| | | | | | | | | | | | | | | | |
16. REGULATORY UPDATES
In August 2018, the FASB issued Accounting Standards Update No. 2018-13, Fair Value Measurement (Topic 820), Disclosure Framework—Changes to the Disclosure Requirements for Fair Value Measurement (“ASU 2018-13”) which is effective for periods starting after December 15, 2019. The primary focus of the update is to improve the effectiveness of ASC 820’s disclosure in the notes to financial statements. Management is currently evaluating the impact, if any, of applying ASU 2018-13.
Effective November 15, 2018, the SEC amended existing rules intended to modernize reporting and disclosure of information. These amendments relate to Regulation S-X which sets forth the form and content of financial statements. The amendment requires collapsing the components of distributable earnings on the Statement of Assets and Liabilities and collapsing the distributions paid to shareholders on the Statements of Changes in Net Assets. Management has adopted these amendments and there was no significant impact on the financial statements and accompanying notes.
52
Notes to Financial Statements (continued)
17. SUBSEQUENT EVENTS
The Funds have determined that no material events or transactions occurred through the issuance date of the Funds’ financial statements, which require an additional disclosure in or adjustment of the Funds’ financial statements.
53
Report of Independent Registered Public Accounting Firm
TO THE BOARD OF TRUSTEES OF AMG FUNDS I AND SHAREHOLDERS OF THE AMG FQ TAX-MANAGED U.S. EQUITY FUND, AMG FQ LONG-SHORT EQUITY FUND AND AMG FQ GLOBAL RISK BALANCED FUND:
Opinions on the Financial Statements
We have audited the accompanying statements of assets and liabilities, including the schedules of portfolio investments, of AMG FQ Tax-Managed U.S. Equity Fund, AMG FQ Long-Short Equity Fund, and AMG FQ Global Risk-Balanced Fund (three of the Funds constituting AMG Funds I, hereafter collectively referred to as the “Funds”) as of October 31, 2018, the related statements of operations for the year ended October 31, 2018, the statements of changes in net assets for each of the two years in the period ended October 31, 2018, including the related notes, and the financial highlights for each of the five years in the period ended October 31, 2018 (collectively referred to as the “financial statements”). In our opinion, the financial statements present fairly, in all material respects, the financial position of each of the Funds as of October 31, 2018, the results of each of their operations for the year then ended, the changes in each of their net assets for each of the two years in the period ended October 31, 2018 and each of the financial highlights for each of the five years in the period ended October 31, 2018 in conformity with accounting principles generally accepted in the United States of America.
Basis for Opinions
These financial statements are the responsibility of the Funds’ management. Our responsibility is to express an opinion on the Funds’ financial statements based on our audits. We are a public accounting firm registered with the Public Company Accounting Oversight Board (United States) (“PCAOB”) and are required to be independent with respect to the Funds in accordance with the U.S. federal securities laws and the applicable rules and regulations of the Securities and Exchange Commission and the PCAOB.
We conducted our audits of these financial statements in accordance with the standards of the PCAOB. Those standards require that we plan and perform the audit to obtain reasonable assurance about whether the financial statements are free of material misstatement, whether due to error or fraud.
Our audits included performing procedures to assess the risks of material misstatement of the financial statements, whether due to error or fraud, and performing procedures that respond to those risks. Such procedures included examining, on a test basis, evidence regarding the amounts and disclosures in the financial statements. Our audits also included evaluating the accounting principles used and significant estimates made by management, as well as evaluating the overall presentation of the financial statements. Our procedures included confirmation of securities owned as of October 31, 2018 by correspondence with the custodian, transfer agent, and brokers; when replies were not received from brokers, we performed other auditing procedures. We believe that our audits provide a reasonable basis for our opinions.
PricewaterhouseCoopers LLP
Boston, Massachusetts
December 26, 2018
54
Other Information
TAX INFORMATION
The AMG FQ Tax-Managed U.S. Equity, AMG FQ Long-Short Equity and AMG FQ Global Risk-Balanced Funds each hereby designates the maximum amount allowable of its net taxable income as qualified dividends as provided in the Jobs and Growth Tax Relief Reconciliation Act of 2003. The 2017/2018 Form 1099-DIV you receive for each Fund will show the tax status of all distributions paid to you during the year.
Pursuant to section 852 of the Internal Revenue Code, AMG FQ Tax-Managed U.S. Equity, AMG FQ Long-Short Equity and AMG FQ Global Risk-Balanced Funds each hereby designates $95,793, $2,584,962, and $0 respectively, as a capital gain distribution with respect to the taxable year ended October 31, 2018, or if subsequently determined to be different, the net capital gains of such fiscal year.
55
AMG Funds
Trustees and Officers
The Trustees and Officers of the Trust, their business addresses, principal occupations for the past five years and ages are listed below. The Trustees provide broad supervision over the affairs of the Trust and the Funds. The Trustees are experienced executives who meet periodically throughout the year to oversee the Funds’ activities, review contractual arrangements with companies that provide services to the Funds, and
review the Funds’ performance. Unless otherwise noted, the address of each Trustee or Officer is the address of the Trust: 600 Steamboat Road, Suite 300, Greenwich, Connecticut 06830.
There is no stated term of office for Trustees. Trustees serve until their resignation, retirement or removal in
accordance with the Trust’s organizational documents and policies adopted by the Board from time to time. The Chairman of the Trustees, President, Treasurer and Secretary of the Trust are elected by the Trustees annually. Other officers hold office at the pleasure of the Trustees.
Independent Trustees
The following Trustees are not “interested persons” of the Trust within the meaning of the 1940 Act:
| | |
Number of Funds Overseen in
Fund Complex | | Name, Age, Principal Occupation(s) During Past 5 Years and Other Directorships Held by Trustee |
• Trustee since 2012 • Oversees 59 Funds in Fund Complex | | Bruce B. Bingham, 70 Partner, Hamilton Partners (real estate development firm) (1987-Present); Director of The Yacktman Funds (2000-2012). |
| |
• Trustee since 2000 • Oversees 59 Funds in Fund Complex | | Edward J. Kaier, 73 Attorney at Law and Partner, Teeters Harvey Marrone & Kaier LLP (2007-Present); Attorney at Law and Partner, Hepburn Willcox Hamilton & Putnam, LLP (1977-2007); Trustee of Third Avenue Trust (5 portfolios); Trustee of Third Avenue Variable Trust (1 portfolio). |
| |
• Trustee since 2013 • Oversees 61 Funds in Fund Complex | | Kurt A. Keilhacker, 55 Managing Partner, TechFund Capital (1997-Present); Managing Partner, TechFund Europe (2000-Present); Board Member, 6wind SA, (2002-Present); Managing Partner, Elementum Ventures (2013-Present); Director, MetricStory, Inc. (2017-Present); Trustee, Gordon College (2001-2016). |
| |
• Trustee since 2000 • Oversees 59 Funds in Fund Complex | | Steven J. Paggioli, 68 Independent Consultant (2002-Present); Trustee, Professionally Managed Portfolios (32 portfolios); Advisory Board Member, Sustainable Growth Advisors, LP; Independent Director, Chase Investment Counsel (2008–Present); Executive Vice President, Secretary and Director, Investment Company Administration, LLC (1990-2001). |
| |
• Trustee since 2013 • Oversees 59 Funds in Fund Complex | | Richard F. Powers III, 72 Adjunct Professor, U.S. Naval War College (2016-Present); Adjunct Professor, Boston College (2010-2013); President and CEO of Van Kampen Investments Inc. (1998-2003). |
| |
• Independent Chairman • Trustee since 2000 • Oversees 61 Funds in Fund Complex | | Eric Rakowski, 60 Professor of Law, University of California at Berkeley School of Law—Boalt Hall (1990-Present); Director of Harding, Loevner Funds, Inc. (9 portfolios); Trustee of Third Avenue Trust (5 portfolios); Trustee of Third Avenue Variable Trust (1 portfolio). |
| |
• Trustee since 2013 • Oversees 61 Funds in Fund Complex | | Victoria L. Sassine, 53 Adjunct Professor, Babson College (2007 – Present). |
| |
• Trustee since 2000 • Oversees 59 Funds in Fund Complex | | Thomas R. Schneeweis, 71 Professor Emeritus, University of Massachusetts (2013-Present); Partner, S Capital Wealth Advisors (2015-Present); President, TRS Associates (1982-Present); Board Member, Chartered Alternative Investment Association (“CAIA”) (2002-Present); Director, CAIA Foundation (Education) (2010-Present); Director, Institute for Global Asset and Risk Management (Education) (2010-Present); Partner, S Capital Management, LLC (2007-2015); Director, CISDM at the University of Massachusetts, (1996-2013); President, Alternative Investment Analytics, LLC, (formerly Schneeweis Partners, LLC) (2001-2013); Professor of Finance, University of Massachusetts (1977-2013). |
56
AMG Funds
Trustees and Officers (continued)
Interested Trustees
Each Trustee in the following table is an “interested person” of the Trust within the meaning of the 1940 Act. Ms. Carsman is an interested person of the Trust within the meaning of the 1940 Act by virtue of her position with, and interest in securities of, AMG.
| | |
Number of Funds Overseen in
Fund Complex | | Name, Age, Principal Occupation(s) During Past 5 Years and Other Directorships Held by Trustee |
• Trustee since 2011 • Oversees 61 Funds in Fund Complex | | Christine C. Carsman, 66 Executive Vice President, Deputy General Counsel and Chief Regulatory Counsel, Affiliated Managers Group, Inc. (2017-Present); Director (2010-Present) and Chair of the Board of Directors (2015-Present), AMG Funds plc; Director of Harding, Loevner Funds, Inc. (9 portfolios); Senior Vice President and Deputy General Counsel, Affiliated Managers Group, Inc. (2011-2016); Senior Vice President and Chief Regulatory Counsel, Affiliated Managers Group, Inc. (2007-2011); Vice President and Chief Regulatory Counsel, Affiliated Managers Group, Inc. (2004-2007); Secretary and Chief Legal Officer, AMG Funds, AMG Funds I, AMG Funds II and AMG Funds III (2004-2011); Senior Counsel, Vice President and Director of Operational Risk Management and Compliance, Wellington Management Company, LLP (1995-2004). |
| | |
Officers |
Position(s) Held with Fund
and Length of Time Served | | Name, Age, Principal Occupation(s) During Past 5 Years |
| |
• President since 2018 • Principal Executive Officer since 2018 • Chief Executive Officer since 2018 • Chief Operating Officer since 2007 | | Keitha L. Kinne, 60 Chief Operating Officer, AMG Funds LLC (2007-Present); Chief Investment Officer, AMG Funds LLC (2008-Present); President and Principal, AMG Distributors, Inc. (2018-Present); Chief Operating Officer, AMG Distributors, Inc. (2007-Present); President, Chief Executive Officer and Principal Executive Officer, AMG Funds, AMG Funds I, AMG Funds II, AMG Funds III and AMG Funds IV (2018-Present); Chief Operating Officer, AMG Funds, AMG Funds I, AMG Funds II, and AMG Funds III (2007-Present); Chief Operating Officer, AMG Funds IV (2016-Present); Chief Operating Officer and Chief Investment Officer, Aston Asset Management, LLC (2016); President and Principal Executive Officer, AMG Funds, AMG Funds I, AMG Funds II and AMG Funds III (2012-2014); Managing Partner, AMG Funds LLC (2007-2014); President and Principal, AMG Distributors, Inc. (2012-2014); Managing Director, Legg Mason & Co., LLC (2006-2007); Managing Director, Citigroup Asset Management (2004-2006). |
| |
• Secretary since 2015 • Chief Legal Officer since 2015 | | Mark J. Duggan, 53 Senior Vice President and Senior Counsel, AMG Funds LLC (2015-Present); Secretary and Chief Legal Officer, AMG Funds, AMG Funds I, AMG Funds II, AMG Funds III and AMG Funds IV (2015-Present); Attorney, K&L Gates, LLP (2009-2015). |
| |
• Chief Financial Officer since 2017 • Treasurer since 2017 • Principal Financial Officer since 2017 • Principal Accounting Officer since 2017 | | Thomas G. Disbrow, 52 Vice President, Mutual Fund Treasurer & CFO, AMG Funds, AMG Funds LLC (2017-Present); Chief Financial Officer, Principal Financial Officer, Treasurer and Principal Accounting Officer, AMG Funds, AMG Funds I, AMG Funds II, AMG Funds III and AMG Funds IV (2017-Present); Managing Director—Global Head of Traditional Funds Product Control, UBS Asset Management (Americas), Inc. (2015-2017); Managing Director—Head of North American Funds Treasury, UBS Asset Management (Americas), Inc. (2011-2015). |
| |
• Deputy Treasurer since 2017 | | John A. Starace, 48 Director, Mutual Fund Accounting, AMG Funds LLC (2017-Present); Vice President, Deputy Treasurer of Mutual Funds Services, AMG Funds LLC (2014-2017); Deputy Treasurer, AMG Funds, AMG Funds I, AMG Funds II, AMG Funds III and AMG Funds IV (2017-Present); Vice President, Citi Hedge Fund Services (2010-2014); Audit Senior Manager (2005-2010) and Audit Manager (2001-2005), Deloitte & Touche LLP. |
| |
• Controller since 2017 | | Christopher R. Townsend, 51 Vice President, Business Finance, AMG Funds LLC (2017-Present); Head of Business Finance, AMG Funds LLC (2015-2017); Chief Financial Officer and Financial and Operations Principal, AMG Distributors, Inc. (2016-Present); Controller, AMG Funds, AMG Funds I, AMG Funds II, AMG Funds III and AMG Funds IV (2017-Present); Treasurer, Chief Financial Officer, Principal Financial Officer, Principal Accounting Officer, AMG Funds, AMG Funds I, AMG Funds II, AMG Funds III and AMG Funds IV (2017); Chief Financial Officer, Aston Asset Management LLC (2016); Head of Finance and Accounting, Allianz Asset Management (2006-2015). |
| |
• Chief Compliance Officer since 2016 | | Gerald F. Dillenburg, 51 Vice President, Chief Compliance Officer AMG Funds, AMG Funds LLC (2017-Present); Chief Compliance Officer AMG Funds, AMG Funds LLC (2016-2017); Chief Compliance Officer and Sarbanes-Oxley Code of Ethics Compliance Officer, AMG Funds, AMG Funds I, AMG Funds II and AMG Funds III (2016-Present); ChiefCompliance Officer, AMG Funds IV (1996-Present); Sarbanes-Oxley Code of Ethics Compliance Officer, AMG Funds IV (2016-Present); Chief Compliance Officer, AstonAsset Management, LLC (2006-2016); Chief Operating Officer, Aston Funds (2003-2016); Secretary, Aston Funds (1996-2015); Chief Financial Officer, Aston Funds (1997-2010); Chief Financial Officer, Aston Asset Management, LLC (2006-2010); Treasurer, Aston Funds (1996-2010). |
57
AMG Funds
Trustees and Officers (continued)
| | |
Position(s) Held with Fund
and Length of Time Served | | Name, Age, Principal Occupation(s) During Past 5 Years |
| |
• Anti-Money Laundering Compliance Officer since 2014 | | Patrick J. Spellman, 44 Vice President, Chief Compliance Officer, AMG Funds LLC (2017-Present); Senior Vice President, Chief Compliance Officer, AMG Funds LLC (2011-2017); Chief Compliance Officer, AMG Distributors, Inc., (2010-Present); Anti-Money Laundering Compliance Officer, AMG Funds, AMG Funds I, AMG Funds II, and AMG Funds III (2014-Present); Anti-Money Laundering Officer, AMG Funds IV, (2016-Present); Compliance Manager, Legal and Compliance, Affiliated Managers Group, Inc. (2005-2011). |
| |
• Assistant Secretary since 2016 | | Maureen A. Meredith, 33 Director, Counsel, AMG Funds LLC (2017-Present); Vice President, Counsel, AMG Funds LLC (2015-2017); Assistant Secretary, AMG Funds, AMG Funds I, AMG Funds II, AMG Funds III and AMG Funds IV (2016-Present); Associate, Ropes & Gray LLP (2011-2015); Law Fellow, Massachusetts Appleseed Center for Law and Justice (2010-2011). |
58
Annual Renewal of Investment Management and Subadvisory Agreements
At an in-person meeting held on June 27-28, 2018, the Board of Trustees (the “Board” or the “Trustees”), and separately a majority of the Trustees who are not “interested persons” of the AMG Funds I (the “Trust”) (the “Independent Trustees”), approved (i) the Investment Management Agreement, as amended pursuant to letter agreements at any time prior to the date of the meeting, with AMG Funds LLC (the “Investment Manager”) for each of AMG FQ Long-Short Equity Fund, AMG FQ Tax-Managed U.S. Equity Fund and AMG FQ Global Risk-Balanced Fund (each, a “Fund,” and collectively, the “Funds”) and separately each of Amendment No. 1 thereto dated July 1, 2015, and Amendment No. 2 thereto dated October 1, 2016 (collectively, the “Investment Management Agreements”) and (ii) the Subadvisory Agreement, as amended at any time prior to the date of the meeting, with the Subadviser for each Fund (collectively, the “Subadvisory Agreements”). The Independent Trustees were separately represented by independent legal counsel in connection with their consideration of the approval of these agreements. In considering the Investment Management Agreements and the Subadvisory Agreements, the Trustees reviewed a variety of materials relating to each Fund, the Investment Manager and the Subadviser, including comparative performance, fee and expense information for an appropriate peer group of similar mutual funds for each Fund (each, a “Peer Group”), performance information for the relevant benchmark index for each Fund (each, a “Fund Benchmark”) and other information provided to them on a periodic basis throughout the year, as well as information provided in connection with the meetings of June 27-28, 2018, regarding the nature, extent and quality of services provided by the Investment Manager and the Subadviser under their respective agreements and other relevant matters. Prior to voting, the Independent Trustees: (a) reviewed the foregoing information with their independent legal counsel; (b) received materials from their independent legal counsel discussing the legal standards applicable to their consideration of the Investment Management and Subadvisory Agreements; and (c) met with their independent legal counsel in private sessions at which no representatives of management were present.
NATURE, EXTENT AND QUALITY OF SERVICES
In considering the nature, extent and quality of the services provided by the Investment Manager, the Trustees reviewed information relating to the Investment Manager’s operations and personnel. Among other things, the Investment Manager
provided financial information, biographical information on its supervisory and professional staff and descriptions of its organizational and management structure. The Trustees also took into account information provided periodically throughout the previous year by the Investment Manager in Board meetings relating to the performance of its duties with respect to the Funds and the Trustees’ knowledge of the Investment Manager’s management and the quality of the performance of the Investment Manager’s duties under the Investment Management Agreements and Administration Agreement. In the course of their deliberations regarding the Investment Manager, the Trustees evaluated, among other things: (a) the extent and quality of the Investment Manager’s oversight of the operation and management of the Funds; (b) the quality of the Investment Manager’s oversight of the performance by the Subadviser of its portfolio management duties; (c) the Investment Manager’s ability to supervise the Funds’ other service providers; and (d) the Investment Manager’s compliance program. The Trustees also took into account that, in performing its functions under the Investment Management Agreements and supervising the Subadviser, the Investment Manager: performs periodic detailed analyses and reviews of the performance by the Subadviser of its obligations to each Fund, including without limitation, analysis and review of portfolio and other compliance matters and review of the Subadviser’s investment performance with respect to a Fund; prepares and presents periodic reports to the Board regarding the investment performance of the Subadviser and other information regarding the Subadviser, at such times and in such forms as the Board may reasonably request; reviews and considers any changes in the personnel of the Subadviser responsible for performing the Subadviser’s obligations and makes appropriate reports to the Board; reviews and considers any changes in the ownership or senior management of the Subadviser and makes appropriate reports to the Board; performs periodic in-person or telephonic diligence meetings, including with respect to compliance matters, with representatives of the Subadviser; assists the Board and management of the Trust in developing and reviewing information with respect to the initial approval of each Subadvisory Agreement and annual consideration of each Subadvisory Agreement thereafter; prepares recommendations with respect to the continued retention of the Subadviser or the replacement of the Subadviser, including at the request of the Board; identifies potential successors to or replacements of
the Subadviser or potential additional subadvisers, performs appropriate due diligence, and develops and presents to the Board a recommendation as to any such successor, replacement, or additional subadviser, including at the request of the Board; designates and compensates from its own resources such personnel as the Investment Manager may consider necessary or appropriate to the performance of its services; and performs such other review and reporting functions as the Board shall reasonably request consistent with the Investment Management Agreements and applicable law. The Trustees noted the affiliation of the Subadviser with the Investment Manager, noting any potential conflicts of interest. The Trustees also took into account the financial condition of the Investment Manager with respect to its ability to provide the services required under the Investment Management Agreements and the Investment Manager’s undertaking to maintain contractual expense limitations for the Funds. The Trustees also considered the Investment Manager’s risk management processes.
The Trustees also reviewed information relating to the Subadviser’s financial condition, operations and personnel and the investment philosophy, strategies and techniques (its “Investment Strategy”) used in managing each Fund. Among other things, the Trustees reviewed biographical information on portfolio management and other professional staff, information regarding the Subadviser’s organizational and management structure and the Subadviser’s brokerage policies and practices. The Trustees considered specific information provided regarding the experience of the individuals at the Subadviser with portfolio management responsibility for the Funds, including the information set forth in each Fund’s prospectus and statement of additional information. In the course of their deliberations, the Trustees evaluated, among other things: (a) the services rendered by the Subadviser in the past; (b) the qualifications and experience of the Subadviser’s personnel; and (c) the Subadviser’s compliance program. The Trustees also took into account the financial condition of the Subadviser with respect to its ability to provide the services required under each Subadvisory Agreement. The Trustees also considered the Subadviser’s risk management processes.
59
Annual Renewal of Investment Management and Subadvisory Agreements (continued)
PERFORMANCE
As noted above, the Board considered each Fund’s net performance during relevant time periods as compared to the Fund’s Peer Group and Fund Benchmark and considered the gross performance of the Fund as compared to the Subadviser’s relevant performance composite that utilizes the same investment strategy and approach and noted that the Board reviews on a quarterly basis detailed information about each Fund’s performance results and portfolio composition, as well as the Subadviser’s Investment Strategy. The Board noted the Investment Manager’s expertise and resources in monitoring the performance, investment style and risk-adjusted performance of the Subadviser. The Board was mindful of the Investment Manager’s attention to monitoring the Subadviser’s performance with respect to the Funds and its discussions with management regarding the factors that contributed to the performance of the Funds.
With respect to AMG FQ Long-Short Equity Fund, among other information related to the Fund’s performance, the Trustees noted that the Fund’s performance for Class I shares (which share class has the earliest inception date and the largest amount of assets of all the share classes of the Fund) for the 1-year, 3-year, 5-year and 10-year periods ended March 31, 2018 was above the median performance of the Peer Group and above, below, below and below, respectively, the performance of the Fund Benchmark, the Russell 3000 Index. The Trustees took into account management’s discussion of the Fund’s performance, including the fact that, prior to August 31, 2017, the Fund focused on a U.S. equity strategy and generally did not take short equity positions although it did utilize an option overlay strategy that included the ability to both buy and sell short options. Given the Fund’s relatively short performance history using its current investment strategy, the Trustees did not attribute much weight to the Fund’s prior performance. The Trustees concluded that the Fund’s overall performance has been satisfactory in light of the Fund’s investment objective, strategies and policies.
With respect to AMG FQ Tax-Managed U.S. Equity Fund, among other information related to the Fund’s performance, the Trustees noted that the Fund’s performance for Class I shares (which share class has the earliest inception date and the largest amount of assets of all the share classes of the Fund) for the 1-year, 3-year, 5-year and 10-year periods ended March 31, 2018 was below, below,
above and above, respectively, the median performance of the Peer Group and below the performance of the Fund Benchmark, the Russell 3000 Index. The Trustees took into account management’s discussion of the Fund’s performance, including the reasons for the Fund’s underperformance. The Trustees concluded that the Fund’s overall performance has been satisfactory in light of the Fund’s investment objective, strategies and policies.
With respect to AMG FQ Global Risk-Balanced Fund, among other information related to the Fund’s performance, the Trustees noted that the Fund’s performance for Class Z shares (which share class has the earliest inception date and the largest amount of assets of all the share classes of the Fund) for the 1-year, 3-year, 5-year and 10-year periods ended March 31, 2018 was below, above, below and below, respectively, the median performance of the Peer Group and below, above, below and below, respectively, the performance of the Fund Benchmark, a Composite Index (60% MSCI World Index and 40% Citigroup World Government Bond Index (Hedged)). The Trustees took into account management’s discussion of the Fund’s performance, including the reasons for the Fund’s recent underperformance. The Trustees concluded that the Fund’s overall performance has been satisfactory in light of the Fund’s investment objective, strategies and policies.
ADVISORY AND SUBADVISORY FEES AND PROFITABILITY
In considering the reasonableness of the advisory fee payable to the Investment Manager, the Trustees reviewed information provided by the Investment Manager setting forth all revenues and other benefits, both direct and indirect (including any so-called “fallout benefits” such as reputational value derived from the Investment Manager serving as Investment Manager to a Fund), received by the Investment Manager and its affiliates attributable to managing each Fund and all the mutual funds in the AMG Funds Family of Funds, the cost of providing such services, the significant risks undertaken as Investment Manager and sponsor of the Funds, including investment, operational, enterprise, entrepreneurial, litigation, regulatory and compliance risks, and the resulting profitability to the Investment Manager and its affiliates from these relationships. The Trustees also considered the amount of the advisory fee retained by the Investment Manager after payment of the subadvisory fee with respect to
the Fund. The Trustees also noted any payments that were made from the Subadviser to the Investment Manager, and any other payments made or to be made from the Investment Manager to the Subadviser. The Trustees also considered management’s discussion of the current asset levels of the Funds, and the impact on profitability of both the current asset levels and any future growth of assets of the Funds.
In considering the cost of services to be provided by the Investment Manager under each Investment Management Agreement and the profitability to the Investment Manager of its relationship with the Funds, the Trustees noted the undertaking by the Investment Manager to maintain contractual expense limitations for the Funds. The Board also took into account management’s discussion of the advisory fee structure and, as noted above, the services the Investment Manager provides in performing its functions under each Investment Management Agreement and supervising the Subadviser. Based on the foregoing, the Trustees concluded that the profitability to the Investment Manager is reasonable and that the Investment Manager is not realizing material benefits from economies of scale that would warrant adjustments to the advisory fee at this time. Also with respect to economies of scale, the Trustees noted that as a Fund’s assets increase over time, the Fund may realize other economies of scale to the extent the increase in assets is proportionally greater than the increase in certain other expenses.
In considering the reasonableness of the subadvisory fees payable by the Investment Manager to the Subadviser, the Trustees reviewed information regarding the cost of providing subadvisory services to each of the Funds and the resulting profitability to the Subadviser from these relationships. The Trustees noted that, because the Subadviser is an affiliate of the Investment Manager, a portion of the Subadviser’s revenues or profits might be shared directly or indirectly with the Investment Manager. The Trustees also noted that the subadvisory fees are paid by the Investment Manager out of its advisory fee. The Board also took into account management’s discussion of the subadvisory fee structure, and the services the Subadviser provides in performing its functions under each Subadvisory Agreement. Based on the foregoing, the Trustees concluded that the profitability to the Subadviser is reasonable and that the Subadviser is not realizing material benefits from economies of scale that would warrant adjustments
60
Annual Renewal of Investment Management and Subadvisory Agreements (continued)
to the subadvisory fees at this time. Also with respect to economies of scale, the Trustees noted that as a Fund’s assets increase over time, the Fund may realize other economies of scale to the extent the increase in assets is proportionally greater than the increase in certain other expenses.
With respect to AMG FQ Long-Short Equity Fund, the Trustees noted that the Fund’s management fees (which include both the advisory and administration fees) and total expenses (weighted average, all classes combined) (net of applicable expense waivers/reimbursements) as of March 31, 2018 were both lower than the average for the Fund’s Peer Group. The Trustees took into account the fact that the Investment Manager has contractually agreed, through March 1, 2019, to limit the Fund’s net annual operating expenses (subject to certain excluded expenses) to 0.69%. The Trustees concluded that, in light of the nature, extent and quality of the services provided by the Investment Manager and the Subadviser (which is an affiliate of the Investment Manager), the foregoing expense limitation and the considerations noted above with respect to the Investment Manager and the Subadviser, the Fund’s advisory and subadvisory fees are reasonable.
With respect to AMG FQ Tax-Managed U.S. Equity Fund, the Trustees noted that the Fund’s management fees (which include both the advisory and administration fees) and total expenses (weighted average, all classes combined) (net of applicable expense waivers/reimbursements) as of March 31, 2018 were both higher than the average for
the Fund’s Peer Group. The Trustees took into account the fact that the Investment Manager has contractually agreed, through March 1, 2019, to limit the Fund’s net annual operating expenses (subject to certain excluded expenses) to 0.89%. The Board also took into account management’s discussion of the Fund’s expenses and competitiveness with comparably sized funds. The Trustees concluded that, in light of the nature, extent and quality of the services provided by the Investment Manager and the Subadviser (which is an affiliate of the Investment Manager), the foregoing expense limitation and the considerations noted above with respect to the Investment Manager and the Subadviser, the Fund’s advisory and subadvisory fees are reasonable.
With respect to AMG FQ Global Risk-Balanced Fund, the Trustees noted that the Fund’s management fees (which include both the advisory and administration fees) and total expenses (weighted average, all classes combined) (net of applicable expense waivers/reimbursements) as of March 31, 2018 were both lower than the average for the Fund’s Peer Group. The Trustees took into account the fact that the Investment Manager has contractually agreed, through March 1, 2019, to limit the Fund’s net annual operating expenses (subject to certain excluded expenses) to 0.89%. The Trustees concluded that, in light of the nature, extent and quality of the services provided by the Investment Manager and the Subadviser (which is an affiliate of the Investment Manager), the foregoing expense limitation and the considerations noted above with respect to the
Investment Manager and the Subadviser, the Fund’s advisory and subadvisory fees are reasonable.
* * * *
After consideration of the foregoing, the Trustees also reached the following conclusions (in addition to the conclusions discussed above) regarding the Investment Management and Subadvisory Agreements: (a) the Investment Manager has demonstrated that it possesses the resources and capability to perform its duties under the Investment Management Agreements; (b) the Subadviser has the resources to perform its duties under the Subadvisory Agreements and is qualified to manage each Fund’s assets in accordance with its investment objectives and policies; and (c) the Investment Manager and Subadviser maintain appropriate compliance programs
Based on all of the above-mentioned factors and their related conclusions, with no single factor or conclusion being determinative and with each Trustee not necessarily attributing the same weight to each factor, the Trustees concluded that approval of each Investment Management Agreement and each Subadvisory Agreement would be in the best interests of the applicable Fund and its shareholders. Accordingly, on June 27-28, 2018, the Trustees, and separately a majority of the Independent Trustees, voted to approve the Investment Management and the Subadvisory Agreements for each Fund.
61
THIS PAGE INTENTIONALLY LEFT BLANK
THIS PAGE INTENTIONALLY LEFT BLANK
THIS PAGE INTENTIONALLY LEFT BLANK
INVESTMENT MANAGER AND ADMINISTRATOR
AMG Funds LLC
600 Steamboat Road, Suite 300 Greenwich, CT 06830
800.835.3879
DISTRIBUTOR
AMG Distributors, Inc.
600 Steamboat Road, Suite 300 Greenwich, CT 06830
800.835.3879
SUBADVISER
First Quadrant, L.P.
800 E. Colorado Boulevard, Suite 900 Pasadena, CA 91101
CUSTODIAN
The Bank of New York Mellon
111 Sanders Creek Parkway
East Syracuse, NY 13057
LEGAL COUNSEL
Ropes & Gray LLP
Prudential Tower, 800 Boylston Street Boston, MA 02199-3600
TRANSFER AGENT
BNY Mellon Investment Servicing (US) Inc.
Attn: AMG Funds
P.O. Box 9769
Providence, RI 02940
800.548.4539
This report is prepared for the Funds’ shareholders. It is authorized for distribution to prospective investors only when preceded or accompanied by an effective prospectus. To receive a free copy of the prospectus or Statement of Additional Information, which includes additional information about Fund Trustees, please contact us by calling 800.835.3879. Distributed by AMG Distributors, Inc., member FINRA/SIPC.
Current net asset values per share for each Fund are available on the Funds’ website at amgfunds.com.
A description of the policies and procedures each Fund uses to vote its proxies is available: (i) without charge, upon request, by calling 800.835.3879, or (ii) on the Securities and Exchange Commission’s (SEC) website at sec.gov. For information regarding each Fund’s proxy voting record for the 12-month period ended June 30, call 800.835.3879 or visit the SEC website at sec.gov.
Each Fund files its complete schedule of portfolio holdings with the SEC for the first and third quarters of each fiscal year on Form N-Q. The Fund’s Forms N-Q are available on the SEC’s website at sec.gov. To review a complete list of the Funds’ portfolio holdings, or to view the most recent quarterly holdings report, semiannual report, or annual report, please visit amgfunds.com.
AFFILIATE SUBADVISED FUNDS
BALANCED FUNDS
AMG Chicago Equity Partners Balanced
Chicago Equity Partners, LLC
AMG FQ Global Risk-Balanced
First Quadrant, L.P.
EQUITY FUNDS
AMG FQ Tax-Managed U.S. Equity
AMG FQ Long-Short Equity
First Quadrant, L.P.
AMG Frontier Small Cap Growth
Frontier Capital Management Co., LLC
AMG GW&K Small Cap Core
AMG GW&K Small/Mid Cap
AMG GW&K U.S. Small Cap Growth
GW&K Investment Management, LLC
AMG Renaissance International Equity
AMG Renaissance Large Cap Growth
The Renaissance Group LLC
|
AMG River Road Dividend All Cap Value |
AMG River Road Dividend All Cap Value II |
AMG River Road Focused Absolute Value |
AMG River Road Long-Short
AMG River Road Small-Mid Cap Value
AMG River Road Small Cap Value
River Road Asset Management, LLC
AMG SouthernSun Small Cap
AMG SouthernSun Global Opportunities
AMG SouthernSun U.S. Equity
SouthernSun Asset Management, LLC
AMG Systematic Mid Cap Value
Systematic Financial Management L.P.
|
AMG TimesSquare Emerging Markets Small Cap |
AMG TimesSquare Global Small Cap AMG TimesSquare International Small Cap |
AMG TimesSquare Mid Cap Growth AMG TimesSquare Small Cap Growth
TimesSquare Capital Management, LLC
AMG Trilogy Emerging Markets Equity AMG Trilogy Emerging Wealth Equity
Trilogy Global Advisors, L.P.
AMG Yacktman
AMG Yacktman Focused
AMG Yacktman Focused Fund—Security Selection Only
AMG Yacktman Special Opportunities
Yacktman Asset Management LP
FIXED INCOME FUNDS
AMG GW&K Core Bond
AMG GW&K Enhanced Core Bond
AMG GW&K Municipal Bond
AMG GW&K Municipal Enhanced Yield
GW&K Investment Management, LLC
OPEN-ARCHITECTURE FUNDS
ALTERNATIVE FUNDS
AMG Managers Lake Partners LASSO Alternative
Lake Partners, Inc.
EQUITY FUNDS
AMG Managers Brandywine
|
AMG Managers Brandywine Advisors Mid Cap Growth |
AMG Managers Brandywine Blue
Friess Associates, LLC
|
AMG Managers Cadence Emerging Companies |
AMG Managers Cadence Mid Cap
Cadence Capital Management LLC
AMG Managers CenterSquare Real Estate
|
CenterSquare Investment Management LLC |
AMG Managers Emerging Opportunities
Lord, Abbett & Co. LLC
WEDGE Capital Management L.L.P.
Next Century Growth Investors LLC
RBC Global Asset Management (U.S.) Inc.
|
AMG Managers Essex Small/Micro Cap Growth |
Essex Investment Management Company, LLC |
AMG Managers Fairpointe ESG Equity AMG Managers Fairpointe Mid Cap
Fairpointe Capital LLC
|
AMG Managers Guardian Capital Global Dividend |
Guardian Capital LP
|
AMG Managers LMCG Small Cap Growth |
LMCG Investments, LLC
|
AMG Managers Montag & Caldwell Growth |
Montag & Caldwell, LLC
AMG Managers Pictet International
Pictet Asset Management Limited
AMG Managers Silvercrest Small Cap
|
Silvercrest Asset Management Group LLC |
AMG Managers Skyline Special Equities
Skyline Asset Management, L.P.
AMG Managers Special Equity
Ranger Investment Management, L.P. Lord, Abbett & Co. LLC
Smith Asset Management Group, L.P. Federated MDTA LLC
|
AMG Managers Value Partners Asia Dividend |
Value Partners Hong Kong Limited
FIXED INCOME FUNDS
|
AMG Managers Amundi Intermediate Government |
AMG Managers Amundi Short Duration Government |
Amundi Pioneer Institutional Asset Management, Inc. |
|
AMG Managers Doubleline Core Plus Bond |
DoubleLine Capital LP
|
AMG Managers Global Income Opportunity |
AMG Managers Loomis Sayles Bond
Loomis, Sayles & Company, L.P.
| | | | |
amgfunds.com | | | | | 103118 AR014 |
| | |
| | | ANNUAL REPORT |
AMG Funds
October 31, 2018
AMG Frontier Small Cap Growth Fund
Class N: MSSVX | Class I: MSSCX | Class Z: MSSYX
AMG Managers Emerging Opportunities Fund
Class N: MMCFX | Class I: MIMFX
AMG GW&K Core Bond Fund
Class N: MBGVX | Class I: MBDFX | Class Z: MBDLX
| | |
| amgfunds.com | | | 103118 AR022 |
AMG Funds
Annual Report — October 31, 2018
| | | | |
TABLE OF CONTENTS | | PAGE | |
LETTER TO SHAREHOLDERS | | | 2 | |
| |
ABOUT YOUR FUND’S EXPENSES | | | 3 | |
| |
PORTFOLIO MANAGER’S COMMENTS, FUND SNAPSHOTS AND SCHEDULES OF PORTFOLIO INVESTMENTS | | | | |
| |
AMG Frontier Small Cap Growth Fund | | | 4 | |
| |
AMG Managers Emerging Opportunities Fund | | | 11 | |
| |
AMG GW&K Core Bond Fund | | | 21 | |
| |
FINANCIAL STATEMENTS | | | | |
| |
Statement of Assets and Liabilities | | | 28 | |
Balance sheets, net asset value (NAV) per share computations and cumulative undistributed amounts | | | | |
| |
Statement of Operations | | | 30 | |
Detail of sources of income, expenses, and realized and unrealized gains (losses) during the fiscal year | | | | |
| |
Statements of Changes in Net Assets | | | 31 | |
Detail of changes in assets for the past two fiscal years | | | | |
| |
Financial Highlights | | | 32 | |
Historical net asset values per share, distributions, total returns, income and expense ratios, turnover ratios and net assets | | | | |
| |
Notes to Financial Statements | | | 40 | |
Accounting and distribution policies, details of agreements and transactions with Fund management and affiliates, and descriptions of certain investment risks | | | | |
| |
REPORT OF INDEPENDENT REGISTERED PUBLIC ACCOUNTING FIRM | | | 48 | |
| |
OTHER INFORMATION | | | 49 | |
| |
TRUSTEES AND OFFICERS | | | 50 | |
| |
ANNUAL RENEWAL OF INVESTMENT MANAGEMENT AND SUBADVISORY AGREEMENTS | | | 53 | |
Nothing contained herein is to be considered an offer, sale or solicitation of an offer to buy shares of any series of the AMG Funds family of mutual funds. Such offering is made only by prospectus, which includes details as to offering price and other material information.
| | |
| | | Letter to Shareholders |
Dear Shareholder:
The fiscal year ended October 31, 2018, was a period of mixed results for global financial markets. The global economic expansion supported strong investor sentiment early in the year before giving way to higher volatility amid a backdrop of tightening monetary policy and uncertainty around global trade policy. U.S. equities were resilient despite the volatility as the S&P 500® Index, a broad gauge of U.S. equity performance, returned 7.35% over the full fiscal year. The U.S. bull market continued into its 10th year having gained 390% since the market bottom on March 9, 2009.
Economic conditions outside the U.S. have been mixed. At the European Central Bank’s (ECB) most recent monetary policy meeting, the governing council confirmed that the European economy showed signs of continued, though slightly slower, growth and inflation progressing toward its target level. After nine months of strength, global economic growth began to show signs of deceleration in the third quarter of 2018. Although the Purchasing Managers Index, a leading economic indicator, remained slightly above the all-important level of 50 for the five largest global economies, only the United States increased from one year prior. Global interest rate policies remain accommodative, but the ECB has continued on its path to conclude its bond buying program at the end of 2018 and the Bank of England increased its target rate.
Nine of eleven economic sectors of the S&P 500® Index were positive during the 12-month reporting period, but there was significant dispersion in performance across sectors. Information technology, consumer discretionary, and healthcare all ended the period with positive double-digit returns of 16.70%, 15.69%, and 11.32%, respectively. Financials, industrials, and materials significantly lagged the broader benchmark with returns of 0.66%, (1.09)%, and (9.53)%, respectively. Overall, corporate earnings in the third quarter were better than expected with 78% of the companies in the S&P 500® Index beating the consensus earnings per share estimate.1 Growth stocks continued to outperform value with returns of 10.71% and 3.03% for the Russell 1000® Growth and Russell 1000® Value Indexes, respectively. International equities and emerging markets demonstrated significantly weaker returns, with the MSCI All Country World Index ex-USA and MSCI Emerging Markets Index returning (8.24)% and (12.52)%, respectively, in the 12 months ending October 31, 2018. Two rounds of new U.S. tariffs for Chinese imports and signs of a slowing economy acted as a drag on the largest economy within the MSCI Emerging Markets Index. Concurrently, the U.S. Dollar strengthened against most major global currencies, particularly in emerging markets, where those with large current account deficits faced significant pressure adding to the drag on performance for emerging markets.
Tightening U.S. Federal Reserve policy and higher interest rates eroded the performance of bonds. The Bloomberg Barclays U.S. Aggregate Bond Index, a broad measure of U.S. bond market performance, turned negative with (2.05)% return for the 12 months ending October 31, 2018. The yield on the 10-year U.S. Treasury note crossed above 3% at the end of September despite market speculation that the December rate hike may not materialize. During the past year, the short end of the yield curve has risen faster than the longer end, resulting in the 2–10 year Treasury spread falling (0.5)%. Bond investors willing to accept more credit risk were rewarded with higher returns as high yield bonds performed strongly and credit spreads tightened over most of the fiscal year. The Bloomberg Barclays U.S. Corporate High Yield Bond Index ended the period with a 0.97% return.
| 1 | Source: FactSet, Based on the 74% of S&P 500® companies which had reported third quarter earnings as of November 2, 2018. |
AMG Funds appreciates the privilege of providing investment tools to you and your clients. Our foremost goal is to provide investment solutions that help our shareholders successfully reach their long-term investment goals. AMG Funds provides access to a distinctive array of actively managed return-oriented investment strategies. We thank you for your continued confidence and investment in AMG Funds. You can rest assured that under all market conditions our team is focused on delivering excellent investment management services for your benefit.
Respectfully,
Keitha Kinne
President
AMG Funds
| | | | | | | | | | | | | | |
Average Annual Total Returns | | Periods ended
October 31, 2018* | |
Stocks: | | | | 1 Year | | | 3 Years | | | 5 Years | |
Large Caps | | (S&P 500® Index) | | | 7.35 | % | | | 11.52 | % | | | 11.34 | % |
Small Caps | | (Russell 2000® Index) | | | 1.85 | % | | | 10.68 | % | | | 8.01 | % |
International | | (MSCI All Country World Index ex USA) | | | (8.24 | )% | | | 4.37 | % | | | 1.63 | % |
Bonds: | | | | | | | | | | | |
Investment Grade | | (Bloomberg Barclays U.S. Aggregate Bond Index) | | | (2.05 | )% | | | 1.04 | % | | | 1.83 | % |
High Yield | | (Bloomberg Barclays U.S. Corporate High Yield Bond Index) | | | 0.97 | % | | | 6.60 | % | | | 4.68 | % |
Tax-exempt | | (Bloomberg Barclays Municipal Bond Index) | | | (0.51 | )% | | | 1.90 | % | | | 3.25 | % |
Treasury Bills | | (BofA Merrill Lynch 6-Month U.S. Treasury Bill) | | | 1.68 | % | | | 1.05 | % | | | 0.70 | % |
| * | Source: FactSet. Past performance is no guarantee of future results. |
2
About Your Fund’s Expenses
As a shareholder of a Fund, you may incur two types of costs: (1) transaction costs, which may include sales charges (loads) on purchase payments; redemption fees; and exchange fees; and (2) ongoing costs, including management fees; distribution (12b-1) fees; and other Fund expenses. This example is intended to help you understand your ongoing costs (in dollars) of investing in the Fund and to compare these costs with the ongoing costs of investing in other mutual funds. The example is based on $1,000 invested at the beginning of the period and held for the entire period as indicated below.
ACTUAL EXPENSES
The first line of the following table provides information about the actual account values and
actual expenses. You may use the information in this line, together with the amount you invested, to estimate the expenses that you paid over the period. Simply divide your account value by $1,000 (for example, an $8,600 account value divided by $1,000 = 8.6), then multiply the result by the number in the first line under the heading entitled “Expenses Paid During Period” to estimate the expenses you paid on your account during this period.
HYPOTHETICAL EXAMPLE FOR COMPARISON PURPOSES
The second line of the following table provides information about hypothetical account values and hypothetical expenses based on the Fund’s actual expense ratio and an assumed annual rate of return of 5% before expenses, which is not the Fund’s
actual return. The hypothetical account values and expenses may not be used to estimate the actual ending account balance or expenses you paid for the period. You may use this information to compare the ongoing costs of investing in the Fund and other funds by comparing this 5% hypothetical example with the 5% hypothetical examples that appear in the shareholder reports of other funds.
Please note that the expenses shown in the table are meant to highlight your ongoing costs only and do not reflect any transactional costs, such as sales charges (loads), redemption fees, or exchange fees. Therefore, the second line of the table is useful in comparing ongoing costs only, and will not help you determine the relative total costs of owning different funds.
| | | | | | | | | | | | | | | | |
Six Months Ended October 31, 2018 | | Expense
Ratio
for the
Period | | | Beginning
Account
Value
05/01/18 | | | Ending
Account
Value
10/31/18 | | | Expenses
Paid
During
the Period* | |
AMG Frontier Small Cap Growth Fund | |
Based on Actual Fund Return | | | | | | | | | |
Class N | | | 1.30 | % | | $ | 1,000 | | | $ | 1,035 | | | $ | 6.67 | |
Class I | | | 0.97 | % | | $ | 1,000 | | | $ | 1,037 | | | $ | 4.98 | |
Class Z | | | 0.90 | % | | $ | 1,000 | | | $ | 1,038 | | | $ | 4.62 | |
Based on Hypothetical 5% Annual Return | |
Class N | | | 1.30 | % | | $ | 1,000 | | | $ | 1,019 | | | $ | 6.61 | |
Class I | | | 0.97 | % | | $ | 1,000 | | | $ | 1,020 | | | $ | 4.94 | |
Class Z | | | 0.90 | % | | $ | 1,000 | | | $ | 1,021 | | | $ | 4.58 | |
AMG Managers Emerging Opportunities Fund | | | | | |
Based on Actual Fund Return | | | | | | | | | |
Class N | | | 1.43 | % | | $ | 1,000 | | | $ | 1,023 | | | $ | 7.29 | |
Class I | | | 1.18 | % | | $ | 1,000 | | | $ | 1,024 | | | $ | 6.02 | |
Based on Hypothetical 5% Annual Return | |
Class N | | | 1.43 | % | | $ | 1,000 | | | $ | 1,018 | | | $ | 7.27 | |
Class I | | | 1.18 | % | | $ | 1,000 | | | $ | 1,019 | | | $ | 6.01 | |
| | | | | | | | | | | | | | | | |
Six Months Ended
October 31, 2018 | | Expense
Ratio
for the
Period | | | Beginning
Account
Value
05/01/18 | | | Ending
Account
Value
10/31/18 | | | Expenses
Paid
During
the Period* | |
AMG GW&K Core Bond Fund | | | | | | | | | |
Based on Actual Fund Return | | | | | | | | | |
Class N | | | 0.88 | % | | $ | 1,000 | | | $ | 996 | | | $ | 4.43 | |
Class I | | | 0.57 | % | | $ | 1,000 | | | $ | 997 | | | $ | 2.87 | |
Class Z | | | 0.48 | % | | $ | 1,000 | | | $ | 998 | | | $ | 2.42 | |
Based on Hypothetical 5% Annual Return | |
Class N | | | 0.88 | % | | $ | 1,000 | | | $ | 1,021 | | | $ | 4.48 | |
Class I | | | 0.57 | % | | $ | 1,000 | | | $ | 1,022 | | | $ | 2.91 | |
Class Z | | | 0.48 | % | | $ | 1,000 | | | $ | 1,023 | | | $ | 2.45 | |
| * | Expenses are equal to the Fund’s annualized expense ratio multiplied by the average account value over the period, multiplied by the number of days in the most recent fiscal half-year (184), then divided by 365. |
3
AMG Frontier Small Cap Growth Fund
Portfolio Manager’s Comments (unaudited)
THE SUBADVISOR
Frontier Capital Management Co. LLC (“Frontier”) manages client assets in small-, small/mid-, mid-and large-cap U.S. equity strategies. The AMG Frontier Small Cap Growth Fund follows a small- cap growth discipline as Frontier implements its “GARP” investment approach to select attractive small-cap stocks.
Frontier believes:
| | • | | Fundamental research is the cornerstone to adding value |
| | • | | Stock prices ultimately are linked to sales and earnings growth |
| | • | | Growth must be purchased at a reasonable price (“GARP”) |
| | • | | Research is a continuous process |
Frontier utilizes and draws support from its entire team of 18 investment professionals to identify opportunities and conduct fundamental research. Through fundamental bottom-up research, Frontier seeks long-term capital appreciation by investing in small-capitalization companies that it believes have above-average earnings growth potential and are available at reasonable valuations.
Frontier looks for companies it believes can generate long-term, sustainable earnings, managed by qualified professionals capable of executing a well-conceived strategic plan. Frontier seeks businesses that can generate superior rates of return on capital in excess of their cost of capital over a business cycle, due to above-average secular growth prospects or a competitive advantage.
THE YEAR IN REVIEW
For the fiscal year ended October 31, 2018, the AMG Frontier Small Cap Growth Fund (Class I) (“the Fund”) returned 14.12%, compared with the Russell 2000® Growth Index, which returned 4.13%.
After a strong fiscal year ending October 31, 2017, stocks posted modest returns for the subsequent 12 months ending October 31, 2018. Small caps lagged large caps as the Russell 2000® rose 1.9% trailing the 7.0% advance of the Russell 1000® Index. Growth continued to lead within the small cap segment as the Russell 2000® Growth gained 4.1%. The Fund outperformed its benchmark over this period with all of the outperformance driven by positive stock selection, as sector selection had a negligible impact overall.
Technology, an overweight sector, was our largest contributor as our 30% return substantially outpaced the 7% gain of the index. This was primarily the result of our stock selection within the software as a service (SAAS) industry, which comprised 16% of our portfolio compared to 11% for the index. As a group, our SAAS investments were up 46%, notably outpacing the 20% return of the index. Our strongest holding overall was MuleSoft, a leader in next generation application integration software, appreciating 89%. The company agreed to be acquired by Salesforce.com at a 36% premium. A growing number of Salesforce customers had used MuleSoft to integrate Salesforce cloud with other applications and thus Salesforce believed a joint effort was the fastest way to address a potential large market for both companies. The second top contributor was benefits management software company Benefitfocus, up 30%. In January, the founder and CEO retired and promoted the chief operating officer. New leadership has made noteworthy strategic changes designed to increase the addressable market and to advance market adoption of its software platform. These modifications included partnering with insurance brokers to reach a broader set of enterprise customers and working with insurance companies to earn commissions on supplemental insurance bought through the Benefitfocus platform. The changes were favorably received by sell-side analysts and investors and advanced the stock. We expect that the sales force additions over the past two years will result in accelerated revenue growth in 2019. The final top ten contributor in the SAAS space, MongoDB, which sells a new type of database software, appreciated 82% following strong financial results. The company’s software as a service offering is designed to address the limitation of legacy relational databases and enables new features essential for cloud-based applications. We believe that the addressable market is very large and only in its infancy, and MongoDB is one of the early leaders with a strong intellectual property position.
Healthcare, an equal weighted sector comprising one-quarter of the portfolio, was our second strongest contributor, rising 26% versus the 12% increase for the index. Four medical device related companies led to the outperformance. Insulet, a developer of insulin infusion systems, has experienced a dramatic turnaround since new
management took over in late 2014. The stock rose 50% this fiscal year as the company continued to post strong financial results and signed a new contract with the largest health insurance company in the U.S., United Healthcare. This agreement will likely be instrumental in helping Insulet achieve significant market share in the untapped Medicare market. While we have owned DexCom, a developer of continuous glucose monitoring systems for diabetes patients, for many years, we sizably reduced the position in 2015 on valuation and further in 2017 based on our own competitive concerns from both Medtronic and Abbott. The stock fell 50% in 2017. As we became convinced that DexCom maintained its technological superiority in glucose monitoring, we added to our position in early 2018 and were rewarded as the stock rose 195%. Novocure, a medical device developer with an approved product to treat glioblastoma, rose 53% on a series of strong financial reports as well as promising Phase 2 trial data for a second indication, mesothelioma, which if approved could increase the company’s addressable market by 50%. ABIOMED Inc., the leading manufacturer of lifesaving implanted heart pumps, was also a top contributor, increasing 130%. The company continues to post industry leading sales growth metrics and has only just begun to penetrate the total addressable market.
Consumer discretionary, where we were modestly overweight, was another positive contributing sector as our 19% return compared favorably to the 11% return in the index. Our best consumer stock, country and western apparel retailer Boot Barn Holdings, appreciated 200%. Same-store sales gathered momentum and grew over 10% as weakness in the oil patch geographies recovered and merchandising initiatives took hold. We have reduced the holding into strength but continue to maintain a position as we believe the company is the dominant retailer in its niche with the opportunity to at least double its current base of 230 stores. Planet Fitness appreciated 84% and is a franchisor of low membership fee fitness centers that is an industry disruptor, having already amassed ten million members in the $24 billion fitness club industry. The company has exhibited strong growth by offering $10 per month memberships, which is attractive to the value-oriented consumer. The success of the business model relies on the fact that the gym can accommodate a very high number of members
4
AMG Frontier Small Cap Growth Fund
Portfolio Manager’s Comments (continued)
because the usage per member is low, but still justified by the price point. Same-club growth remains robust and we believe the company can eventually grow from its current 1,600 franchised locations to approximately 4,000 nationally, driving earnings growth in excess of 20% per annum for the foreseeable future.
Interest rate sensitive companies in our portfolio were adversely impacted by the Federal Reserve tightening monetary policy. Despite continuing to report strong earnings growth, home builders, auto and truck part companies and other housing-related companies have declined markedly over the past year. As a result, we considerably reduced our exposure to these areas. A good example of this multiple compression is Dana Incorporated, a manufacturer of axles for commercial and light trucks. Earnings per share have grown from $1.94 in 2016 and $2.52 in 2017 to an expected $2.92 this year. Despite this trend the stock declined 48% during the
fiscal year and currently trades near $15, or just over five times this year’s expected earnings versus an S&P 500® Index multiple of roughly 17 times. We remain cautious on interest rate sensitive sectors but continue to monitor the companies closely so we are prepared to invest in stocks that fall far below intrinsic values.
Despite the positive economic news, the period ended with a litany of potential concerns, ranging from increasing interest rates to China tariff negotiations, to mid-term elections all causing significant volatility in the financial markets. Meanwhile Frontier’s team continues to focus on company research to uncover investment opportunities that offer favorable risk/reward returns. Two notable areas where we have spent years building a strong research foundation include technology and health care. During 2018, we leveraged our advantage by opportunistically identifying and understanding many complex
companies. Within technology, software has been the dominant driver as this industry has made up more than half our sector weighting. Within healthcare, our gains have been broad based among several industries with biotechnology up 15%, medical and dental up 55%, and medical equipment up 81%. We believe that these industries have many years of strong secular growth ahead and the vast majority of innovation will continue to be developed by small U.S. based companies. Our extensive research foundation puts us in a very favorable position to capitalize on these megatrends for the next decade, and we look forward to delivering strong returns for shareholders in the coming years.
The views expressed represent the opinions of Frontier Capital Management Co. LLC as of October 31, 2018, and are not intended as a forecast or guarantee of future results, and are subject to change without notice.
5
AMG Frontier Small Cap Growth Fund
Portfolio Manager’s Comments (continued)
CUMULATIVE TOTAL RETURN PERFORMANCE
AMG Frontier Small Cap Growth Fund’s cumulative total return is based on the daily change in net asset value (NAV), and assumes that all dividends and distributions were reinvested. This graph compares a hypothetical $10,000 investment made in the AMG Frontier Small Cap Growth Fund’s Class I shares on October 31, 2008, to a $10,000 investment made in the Russell 2000® Growth Index for the same time period. The graph and table do not reflect the deduction of taxes that a shareholder would pay on a Fund distribution or redemption of shares. The listed returns for the Fund are net of expenses and the returns for the index exclude expenses. Total returns would have been lower had certain expenses not been reduced.
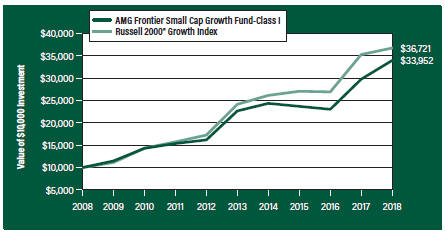
The table below shows the average annual total returns for the AMG Frontier Small Cap Growth Fund and the Russell 2000® Growth Index for the same time periods ended October 31, 2018.
| | | | | | | | | | | | | | | | | | | | |
| Average Annual Total Returns1 | | One
Year | | | Five
Years | | | Ten
Years | | | Since
Inception | | | Inception
Date | |
AMG Frontier Small Cap Growth Fund2, 3, 4 | | | | | | | | | |
Class N | | | 13.81 | % | | | 8.13 | % | | | — | | | | 11.68 | % | | | 01/01/10 | |
Class I | | | 14.12 | % | | | 8.43 | % | | | 13.00 | % | | | 7.89 | % | | | 09/24/97 | |
Class Z | | | 14.26 | % | | | 8.65 | % | | | — | | | | 12.20 | % | | | 01/01/10 | |
Russell 2000® Growth Index5 | | | 4.13 | % | | | 8.75 | % | | | 13.89 | % | | | 6.05 | % | | | 09/24/97 | † |
The performance data shown represents past performance. Past performance is not a guarantee of future results. Current performance may be lower or higher than the performance data quoted. The investment return and principal value of an investment will fluctuate so that an investor’s shares, when redeemed, may be worth more or less than their original cost.
Investors should carefully consider the Fund’s investment objectives, risks, charges and expenses before investing. For performance information through the most recent month end, current net asset values per share for the Fund and other information, please call 800.835.3879 or visit our website at amgfunds.com for a free prospectus. Read it carefully before investing or sending money.
Distributed by AMG Distributors, Inc., member FINRA/SIPC.
| † | Date reflects inception date of the Fund, not the index. |
| 1 | Total return equals income yield plus share price change and assumes reinvestment of all dividends and capital gain distributions. Returns are net of fees and may reflect offsets of Fund expenses as described in the prospectus. No adjustment has been made for taxes payable by shareholders on their reinvested dividends and capital gain distributions. Returns for periods greater than one year are annualized. The listed returns on the Fund are net of expenses and based on the published NAV as of October 31, 2018. All returns are in U.S. dollars ($). |
| 2 | From time to time, the Fund’s advisor has waived its fees and/or absorbed Fund expenses, which has resulted in higher returns. |
| 3 | The Fund is subject to risks associated with investments in small-capitalization companies, such as erratic earnings patterns, competitive conditions, limited earnings history and a reliance on one or a limited number of products. |
| 4 | The Fund invests in growth stocks, which may be more sensitive to market movements because their prices tend to reflect future investor expectations rather than just current profits. Growth stocks may underperform value stocks during given periods. |
| 5 | The Russell 2000® Growth Index measures the performance of the Russell 2000® companies with higher price-to-book ratios and higher forecasted growth values. Unlike the Fund, the Russell 2000® Growth Index is unmanaged, is not available for investment and does not incur expenses. |
The Russell 2000® Growth Index is a trademark of the London Stock Exchange Group companies.
Not FDIC insured, nor bank guaranteed. May lose value.
6
AMG Frontier Small Cap Growth Fund
Fund Snapshots (unaudited)
October 31, 2018
PORTFOLIO BREAKDOWN
| | | | |
Sector | | %of
Net Assets | |
Health Care | | | 26.8 | |
Information Technology | | | 23.3 | |
Industrials | | | 14.6 | |
Consumer Discretionary | | | 10.9 | |
Energy | | | 6.2 | |
Financials | | | 4.5 | |
Real Estate | | | 4.0 | |
Materials | | | 4.0 | |
Communication Services | | | 1.0 | |
Consumer Staples | | | 0.3 | |
Utilities | | | 0.3 | |
Short-Term Investments1 | | | 11.9 | |
Other Assets Less Liabilities2 | | | (7.8 | ) |
| 1 | Includes reinvestment of cash collateral into joint repurchase agreements on security lending transactions. |
| 2 | Includes repayment of cash collateral on securities lending transactions. |
TOP TEN HOLDINGS
| | | | |
Security Name | | %of
Net Assets | |
Insulet Corp. | | | 3.5 | |
Exact Sciences Corp. | | | 3.0 | |
Semtech Corp. | | | 2.9 | |
Aerie Pharmaceuticals, Inc. | | | 2.8 | |
Myriad Genetics, Inc. | | | 2.7 | |
Eldorado Resorts, Inc. | | | 2.5 | |
MasTec, Inc. | | | 2.3 | |
KBR, Inc. | | | 2.2 | |
Allegheny Technologies, Inc. | | | 2.2 | |
JetBlue Airways Corp. | | | 2.0 | |
| | | | |
Top Ten as a Group | | | 26.1 | |
| | | | |
Because a fund’s strategy may result in multiple investments in particular sectors of the economy, its performance may depend on the performance of those sectors and may fluctuate more widely than investments diversified across more sectors. For additional information on these and other risk considerations, please see the Fund’s prospectus.
Any sectors, industries, or securities discussed should not be perceived as investment recommendations. Mention of a specific security should not be considered a recommendation to buy or solicitation to sell that security. Specific securities mentioned in this report may have been sold from the Fund’s portfolio of investments by the time you receive this report.
7
AMG Frontier Small Cap Growth Fund
Schedule of Portfolio Investments
October 31, 2018
| | | | | | | | |
| | | Shares | | | Value | |
Common Stocks—95.9% | | | | | | | | |
Communication Services—1.0% | | | | | | | | |
Cardlytics, Inc.* | | | 8,485 | | | $ | 179,543 | |
Consumer Discretionary—10.9% | | | | | | | | |
Boot Barn Holdings, Inc.* | | | 4,263 | | | | 105,211 | |
Carvana Co.*,1 | | | 124 | | | | 4,805 | |
Century Communities, Inc.*,1 | | | 5,430 | | | | 115,225 | |
Core-Mark Holding Co., Inc. | | | 1,633 | | | | 62,723 | |
Dana, Inc. | | | 7,875 | | | | 122,614 | |
Eldorado Resorts, Inc.*,1 | | | 12,783 | | | | 466,579 | |
Etsy, Inc.* | | | 4,465 | | | | 189,852 | |
Floor & Decor Holdings, Inc., Class A*,1 | | | 5,035 | | | | 128,795 | |
LKQ Corp.* | | | 5,623 | | | | 153,339 | |
Nutrisystem, Inc.1 | | | 3,635 | | | | 129,261 | |
Planet Fitness, Inc., Class A* | | | 4,775 | | | | 234,405 | |
Tailored Brands, Inc. | | | 14,975 | | | | 314,625 | |
Total Consumer Discretionary | | | | | | | 2,027,434 | |
Consumer Staples—0.3% | | | | | | | | |
Casey’s General Stores, Inc. | | | 446 | | | | 56,245 | |
Energy—6.2% | | | | | | | | |
Centennial Resource Development, Inc., Class A*,1 | | | 6,434 | | | | 123,275 | |
Ensco PLC, Class A (United Kingdom)1 | | | 17,833 | | | | 127,328 | |
Euronav, N.V. (Belgium) | | | 3,503 | | | | 32,228 | |
GasLog, Ltd. (Monaco)1 | | | 8,473 | | | | 173,358 | |
International Seaways, Inc.* | | | 11,306 | | | | 243,192 | |
PDC Energy, Inc.* | | | 3,051 | | | | 129,515 | |
SM Energy Co.1 | | | 7,431 | | | | 180,870 | |
Transocean, Ltd.*,1 | | | 11,844 | | | | 130,402 | |
Total Energy | | | | | | | 1,140,168 | |
Financials—4.5% | | | | | | | | |
Argo Group International Holdings, Ltd. (Bermuda) | | | 2,583 | | | | 159,139 | |
Evercore, Inc., Class A | | | 423 | | | | 34,555 | |
James River Group Holdings, Ltd. (Bermuda) | | | 5,920 | | | | 227,920 | |
LPL Financial Holdings, Inc. | | | 4,539 | | | | 279,602 | |
Texas Capital Bancshares, Inc.* | | | 429 | | | | 27,984 | |
Webster Financial Corp. | | | 1,753 | | | | 103,146 | |
Total Financials | | | | | | | 832,346 | |
Health Care—26.8% | | | | | | | | |
Aerie Pharmaceuticals, Inc.*,1 | | | 9,803 | | | | 521,323 | |
Alnylam Pharmaceuticals, Inc.*,1 | | | 658 | | | | 52,923 | |
Amneal Pharmaceuticals, Inc.*,1 | | | 13,365 | | | | 246,584 | |
BioMarin Pharmaceutical, Inc.* | | | 1,321 | | | | 121,757 | |
| | | | | | | | |
| | | Shares | | | Value | |
Bluebird Bio, Inc.*,1 | | | 2,578 | | | $ | 295,697 | |
DexCom, Inc.* | | | 252 | | | | 33,458 | |
Diplomat Pharmacy, Inc.* | | | 13,872 | | | | 275,220 | |
Exact Sciences Corp.*,1 | | | 7,899 | | | | 561,224 | |
Incyte Corp.* | | | 3,298 | | | | 213,776 | |
Insulet Corp.*,1 | | | 7,313 | | | | 645,080 | |
Intrexon Corp.* | | | 5,207 | | | | 60,193 | |
Karyopharm Therapeutics, Inc.* | | | 3,429 | | | | 36,142 | |
Loxo Oncology, Inc.*,1 | | | 989 | | | | 150,981 | |
Madrigal Pharmaceuticals, Inc.*,1 | | | 384 | | | | 73,290 | |
Masimo Corp.* | | | 1,102 | | | | 127,391 | |
Medidata Solutions, Inc.* | | | 690 | | | | 48,507 | |
Medpace Holdings, Inc.* | | | 1,589 | | | | 82,787 | |
Merit Medical Systems, Inc.*,1 | | | 897 | | | | 51,237 | |
Myriad Genetics, Inc.*,1 | | | 11,230 | | | | 505,687 | |
Nektar Therapeutics* | | | 104 | | | | 4,023 | |
Neurocrine Biosciences, Inc.* | | | 183 | | | | 19,608 | |
Novocure, Ltd. (Jersey)* | | | 1,348 | | | | 44,673 | |
PTC Therapeutics, Inc.* | | | 4,777 | | | | 184,010 | |
Seattle Genetics, Inc.* | | | 3,026 | | | | 169,849 | |
TESARO, Inc.*,1 | | | 11,490 | | | | 331,831 | |
ViewRay, Inc.* | | | 12,849 | | | | 111,144 | |
Total Health Care | | | | | | | 4,968,395 | |
Industrials—14.6% | | | | | | | | |
American Woodmark Corp.*,1 | | | 1,104 | | | | 66,726 | |
Azul, S.A., ADR (Brazil)* | | | 4,209 | | | | 102,615 | |
Beacon Roofing Supply, Inc.* | | | 5,586 | | | | 155,905 | |
BMC Stock Holdings, Inc.* | | | 2,189 | | | | 36,644 | |
Granite Construction, Inc.1 | | | 2,711 | | | | 123,947 | |
JetBlue Airways Corp.* | | | 22,657 | | | | 379,051 | |
KAR Auction Services, Inc. | | | 5,553 | | | | 316,188 | |
KBR, Inc. | | | 20,515 | | | | 405,787 | |
Knight-Swift Transportation Holdings, Inc.1 | | | 2,101 | | | | 67,232 | |
MasTec, Inc.* | | | 9,940 | | | | 432,489 | |
Meritor, Inc.* | | | 4,764 | | | | 80,940 | |
TransUnion | | | 3,453 | | | | 227,035 | |
Tutor Perini Corp.*,1 | | | 9,610 | | | | 148,955 | |
Watsco, Inc. | | | 127 | | | | 18,819 | |
Wesco Aircraft Holdings, Inc.*,1 | | | 13,493 | | | | 137,359 | |
Total Industrials | | | | | | | 2,699,692 | |
Information Technology—23.3% | | | | | | | | |
2U, Inc.* | | | 3,513 | | | | 221,003 | |
Alteryx, Inc., Class A*,1 | | | 175 | | | | 9,273 | |
The accompanying notes are an integral part of these financial statements.
8
AMG Frontier Small Cap Growth Fund
Schedule of Portfolio Investments (continued)
| | | | | | | | |
| | | Shares | | | Value | |
Information Technology—23.3%
(continued) | | | | | | | | |
Anaplan, Inc.* | | | 3,928 | | | $ | 90,344 | |
Appian Corp.*,1 | | | 7,839 | | | | 201,541 | |
Benefitfocus, Inc.*,1 | | | 7,463 | | | | 265,160 | |
Blackline, Inc.*,1 | | | 1,453 | | | | 67,390 | |
Cloudera, Inc.*,1 | | | 10,068 | | | | 138,536 | |
Conduent, Inc.* | | | 4,555 | | | | 87,001 | |
Coupa Software, Inc.*,1 | | | 3,745 | | | | 242,788 | |
DocuSign, Inc.*,1 | | | 1,139 | | | | 47,770 | |
Ellie Mae, Inc.* | | | 966 | | | | 64,026 | |
Guidewire Software, Inc.* | | | 309 | | | | 27,492 | |
HubSpot, Inc.* | | | 669 | | | | 90,750 | |
Instructure, Inc.*,1 | | | 4,472 | | | | 166,984 | |
Mimecast, Ltd.* | | | 5,844 | | | | 203,722 | |
Model N, Inc.* | | | 7,757 | | | | 119,148 | |
New Relic, Inc.* | | | 820 | | | | 73,185 | |
Nutanix, Inc., Class A* | | | 6,021 | | | | 249,932 | |
Okta, Inc.* | | | 872 | | | | 50,890 | |
Pivotal Software, Inc., Class A* | | | 4,276 | | | | 87,230 | |
Pure Storage, Inc., Class A* | | | 11,686 | | | | 235,823 | |
RealPage, Inc.*,1 | | | 1,713 | | | | 90,789 | |
Semtech Corp.* | | | 11,796 | | | | 530,112 | |
ShotSpotter, Inc.*,1 | | | 351 | | | | 13,577 | |
Tableau Software, Inc., Class A* | | | 91 | | | | 9,708 | |
Ultra Clean Holdings, Inc.*,1 | | | 8,170 | | | | 85,948 | |
Universal Display Corp.1 | | | 1,332 | | | | 163,849 | |
WEX, Inc.* | | | 1,158 | | | | 203,762 | |
Zendesk, Inc.* | | | 2,539 | | | | 139,569 | |
Zscaler, Inc.*,1 | | | 1,051 | | | | 38,141 | |
Zuora, Inc., Class A* | | | 14,722 | | | | 300,623 | |
Total Information Technology | | | | | | | 4,316,066 | |
Materials—4.0% | | | | | | | | |
Allegheny Technologies, Inc.*,1 | | | 15,602 | | | | 403,936 | |
Carpenter Technology Corp. | | | 2,036 | | | | 88,790 | |
Ferroglobe PLC (United Kingdom) | | | 18,737 | | | | 114,108 | |
Forterra, Inc.* | | | 11,654 | | | | 52,560 | |
Kraton Corp.* | | | 2,993 | | | | 82,427 | |
Total Materials | | | | | | | 741,821 | |
Real Estate—4.0% | | | | | | | | |
Corporate Office Properties Trust, REIT | | | 8,686 | | | | 224,446 | |
| | | | | | | | |
| | | Shares | | | Value | |
Cushman & Wakefield PLC*,1 | | | 10,100 | | | $ | 164,226 | |
Healthcare Trust of America, Inc., Class A, REIT | | | 2,916 | | | | 76,574 | |
National Retail Properties, Inc., REIT | | | 3,623 | | | | 169,376 | |
Physicians Realty Trust, REIT | | | 2,833 | | | | 46,971 | |
STAG Industrial, Inc., REIT | | | 2,544 | | | | 67,314 | |
Total Real Estate | | | | | | | 748,907 | |
Utilities—0.3% | | | | | | | | |
Portland General Electric Co. | | | 1,094 | | | | 49,318 | |
Total Common Stocks
(Cost $16,377,022) | | | | | | | 17,759,935 | |
| | |
| | | Principal
Amount | | | | |
Short-Term Investments—11.9% | | | | | | | | |
Joint Repurchase Agreements—10.7%2 | | | | | | | | |
Mizuho Securities, LLC, dated 10/31/18, due 11/01/18, 2.220% total to be received $978,162 (collateralized by various U.S. Government Agency Obligations, 2.000%-7.500%, 03/01/31 - 02/15/48, totaling $997,664) | | $ | 978,102 | | | | 978,102 | |
RBC Dominion Securities, Inc., dated 10/31/18, due 11/01/18, 2.220% total to be received $1,000,062 (collateralized by various U.S. Government Agency Obligations and U.S. Treasuries, 0.000% - 7.000%, 11/29/18 - 09/09/49, totaling $1,020,000) | | | 1,000,000 | | | | 1,000,000 | |
Total Joint Repurchase Agreements | | | | | | | 1,978,102 | |
| | |
| | | Shares | | | | |
Other Investment Companies—1.2% | | | | | | | | |
Dreyfus Government Cash Management Fund, Institutional Class Shares, 2.05%3 | | | 76,345 | | | | 76,345 | |
Dreyfus Institutional Preferred Government Money Market Fund, Institutional Class Shares, 2.12%3 | | | 76,345 | | | | 76,345 | |
JPMorgan U.S. Government Money Market Fund, IM Shares, 2.09%3 | | | 78,659 | | | | 78,659 | |
Total Other Investment Companies | | | | | | | 231,349 | |
Total Short-Term Investments | | | | | | | | |
(Cost $2,209,451) | | | | | | | 2,209,451 | |
Total Investments—107.8% | | | | | | | | |
(Cost $18,586,473) | | | | | | | 19,969,386 | |
Other Assets, less Liabilities—(7.8)% | | | | | | | (1,449,138 | ) |
Net Assets—100.0% | | | | | | $ | 18,520,248 | |
The accompanying notes are an integral part of these financial statements.
9
AMG Frontier Small Cap Growth Fund
Schedule of Portfolio Investments (continued)
| * | Non-income producing security. |
| 1 | Some or all of these securities, amounting to $5,016,352 or 27.1% of net assets, were out on loan to various brokers and are collateralized by cash and various U.S. Treasury Obligations. See Note 4 of Notes to Financial Statements. |
| 2 | Cash collateral received from brokers for securities lending was invested in these joint repurchase agreements. |
| 3 | Yield shown represents the October 31, 2018, seven day average yield, which refers to the sum of the previous seven days’ dividends paid, expressed as an annual percentage. |
| ADR | American Depositary Receipt |
| REIT | Real Estate Investment Trust |
The following table summarizes the inputs used to value the Fund’s investments by the fair value hierarchy levels as of October 31, 2018:
| | | | | | | | | | | | | | | | |
| | | Level 1 | | | Level 2 | | | Level 3 | | | Total | |
Investments in Securities | | | | | | | | | | | | | | | | |
Common Stocks† | | $ | 17,759,935 | | | | — | | | | — | | | $ | 17,759,935 | |
Short-Term Investments | | | | | | | | | | | | | | | | |
Joint Repurchase Agreements | | | — | | | $ | 1,978,102 | | | | — | | | | 1,978,102 | |
Other Investment Companies | | | 231,349 | | | | — | | | | — | | | | 231,349 | |
| | | | | | | | | | | | | | | | |
Total Investments in Securities | | $ | 17,991,284 | | | $ | 1,978,102 | | | | — | | | $ | 19,969,386 | |
| † | All common stocks held in the Fund are Level 1 securities. For a detailed breakout of common stocks by major industry classification, please refer to the Fund’s Schedule of Portfolio Investments. |
As of October 31, 2018, the Fund had no transfers between levels from the beginning of the reporting period.
The accompanying notes are an integral part of these financial statements.
10
AMG Managers Emerging Opportunities Fund
Portfolio Manager’s Comments (unaudited)
For the fiscal year ended October 31, 2018, the AMG Managers Emerging Opportunities Fund (N Shares) returned 8.82%, outpacing both the 1.42% return for the Russell Microcap® Index and the 1.85% return for the Russell 2000® Index, respectively.
Lord, Abbett & Co. LLC
PERFORMANCE SUMMARY
For the fiscal year ended October 31, 2018 (the “performance period”), Lord, Abbett’s sleeve of the Fund (the “Sleeve”) returned 18.24% outperforming its benchmark, the Russell Microcap® Index which returned 1.42% over the same period.
MARKET REVIEW
Domestic equity returns were positive over the past year, with large cap stocks, as represented by the S&P 500® Index, rising 7.35% during the period, while small cap stocks, as represented by the Russell 2000® Index, were up 1.85%. During the period, there were several market-moving events. Notably, in December 2017, Congress passed the largest rewrite of the U.S. tax code in decades. The bill reduced the corporate tax rate from 35% to 21% and allowed for a one-time repatriation tax of 15.5%, rather than the standard repatriation tax rate of 35%. In June 2018, the White House announced its intent to impose additional tariffs on $200 billion worth of Chinese goods, on top of the $50 billion previously announced. The aggressive U.S. trade posture continued into September with trade tensions mounting between the U.S. and China. While the impact has yet to fully be realized, many corporations anticipate that the retaliatory tariffs will weigh on profits. Trade discussions between Mexico, Canada, and the U.S., however, took a more favorable turn as the negotiations resulted in a revised version of the North American Free Trade Agreement (NAFTA) called the U.S.-Mexico-Canada Agreement. In December 2017, the Federal Reserve (the “Fed”) raised its target for short-term interest rates by 0.25%, to a range of 1.25%–1.50%, and indicated that it was targeting three rate hikes in 2018. The Fed followed with rate hikes of 0.25% at each of its March, June, and September meetings, raising the target range to 2.00%–2.25%. Amid rising concerns surrounding escalating trade tensions, slowing growth, and increasing interest rates, the Nasdaq experienced the largest monthly drop since 2008 in October 2018. Despite the selloff, the U.S. economy continued to expand by more than 2% during each quarter of the trailing 12-month period, with domestic GDP growth ranging between 2.2% and 4.2% from
the third quarter of 2017 to the third quarter of 2018. The 4.2% GDP growth in the second quarter marked the strongest growth rate since the third quarter of 2014.
PERFORMANCE AND POSITIONING
Security selection and positioning within the information technology and health care sectors contributed to the Sleeve’s relative performance during the 12-month period. Within the information technology sector, shares of Everbridge, Inc., a developer of critical event and enterprise safety software solutions, contributed to relative performance during the period. Everbridge delivered successive quarters of strong earnings and revenue growth as it increased its product lineup and critical management deals, expanded internationally, and completed its acquisition of Unified Messaging System. Alteryx, Inc., which provides self-service data analytics software, also contributed to relative performance. Shares of Alteryx benefited from increased awareness of its data solutions with little competition, while it introduced several new product initiatives over the course of the period.
Within the health care sector, the Sleeve’s positioning in Madrigal Pharmaceuticals, Inc., a developer of therapeutic treatments for a multitude of diseases, contributed to relative performance. Shares of Madrigal Pharmaceuticals rose dramatically as the company’s Phase 2 data for its drug MGL 3196, which treats non-alcoholic steatohepatitis (NASH), showed a statistically significant benefit on NASH resolution and a reduction in markers of fibrosis. Investors’ confidence in a potentially successful Phase 3 trial improved significantly.
Positioning within the communication services sector detracted from the Sleeve’s performance relative to its benchmark. The Sleeve’s lack of exposure to the sector, specifically to Boingo Wireless, Inc., which reported strong second quarter 2018 earnings and revenue, and the company’s announcement of a lateral acquisition of Elauwit Networks detracted from performance.
Security selection within the consumer staples sector detracted from performance during the period. While the Sleeve’s overweight position within the sector contributed to performance as it was the best performing sector within the index, the Sleeve’s lack of exposure to several rapidly appreciating companies within the sector detracted from relative performance. The Sleeve’s position in MGP
Ingredients, Inc., a manufacturer of food, beverage, and specialty ingredients, also detracted from performance. Shares of MGP Ingredients declined after it reported revenue and earnings that failed to meet investors’ expectations, as its sales of premium beverage alcohol declined year-over-year.
Next Century Growth Investors, LLC
MARKET AND PERFORMANCE REVIEW
The year ended October 31, 2018, was another strong one for small cap growth stocks. The Next Century Growth sleeve of the Fund was up 43.01% compared to 1.42% for the Russell Microcap Index.
Performance during the past year was powered mainly by stocks in the healthcare, technology, communication services, and financial services sectors.
In healthcare, the medical device area has had strong growth and valuation expansion all year. In addition, recent buys in the diagnostics industry contributed to performance. While valuations are now elevated in parts of the sector, we are actively working to keep the portfolio at reasonable levels. During the year we trimmed several healthcare holdings due to valuation and eliminated three due to market cap. The portfolio ended the year somewhat underweight relative to the index, primarily due to our zero weighting in biotechnology.
The technology sector was driven by some of the larger software holdings which performed better than the average tech stock in the index. The portfolio remains overweight this sector but not significantly since we are finding high growth companies across the economy. Throughout the year we sold three big winners in the technology sector due to market cap.
During the year we beefed up your weighting in the financial sector to overweight. The portfolio’s mix of high growth, non-bank stocks performed much better than the financial stocks in the index. We continue to favor segments of the financial services sector that are less competitive and have less credit and margin risk.
The one area that did not perform well in this past year was industrials. We have had some difficulty finding microcap companies that are capable of delivering consistent growth, and industrial stocks have generally lagged on worries about weather disruptions, new tariffs, and a reduced chance for a federal infrastructure bill.
11
AMG Managers Emerging Opportunities Fund
Portfolio Manager’s Comments (continued)
The U.S. economy continues to perform well. However, we are picking up early signs of price cutting in some housing markets and rent growth slowing or beginning to roll over in a few cities. Some companies have begun to report softer demand in certain international markets, particularly China. Historically, increases in short-term interest rates will put a damper on economic growth, raising the potential that economic and earnings growth will peak in 2018. During the year we reduced exposure to a few cyclical areas. We exited the remaining positions in banks and homebuilders and reduced or eliminated selective industrials holdings.
Despite a few clouds on the horizon, the current economic environment should be good for small, fast growing American companies and good for our investment style. For most of the year, we have been trimming holdings where the valuations are stretched. We have now sold outright seven positions due to market cap, moves that lock in large gains and tend to reduce the portfolio’s valuation multiple. If we get a significant market correction, we will likely give up some short-term relative performance but will use the opportunity to increase positions in the highest quality, fastest growing companies at more attractive valuations.
We are bullish on active investment management right now. Institutions are increasingly turning their equity assets over to index funds, ETFs, and computer-driven “quant funds” which have little understanding of the businesses underlying the stocks they buy and sell. Many large investment pools have moved 100% of their U.S. equity assets to passive strategies. We think this will lead to a very good period for active management because our information and analysis will be even more valuable in a world with fewer assets in the hands of professional investors.
Overall, this was a very good year for the microcap portfolio.
RBC Global Asset Management (U.S.) Inc.
MARKET OVERVIEW
Equity markets advanced in the final quarter of 2017, spurred by the continuing improvement in a broad array of domestic economic data and the passage of the first major overhaul of the U.S. tax system in over 30 years. Overall domestic economic backdrop remained positive through June, supported by corporate tax cuts, deregulation, low unemployment, high confidence levels, and accelerating GDP growth. Equity markets continued to advance in the third quarter as quarterly domestic GDP growth
exceeded 4% for the first time since 2014 and the unemployment rate fell to a multi-decade low. Business and consumer confidence remained at high levels throughout the summer, although stocks gave back some of their gains in September on concerns about the impact of tightening Federal Reserve policy on future economic growth and the implications of ongoing trade and tariff disputes.
Thus far in 2018, it has been a volatile year for the small cap market. A rather slow start of the year was followed by a minor market correction in February and a surge in markets toward the end of the third and beginning of the fourth quarter, ending the year with another correction in the last weeks of October. The latest bull market since 2009 has seen three major corrections (-20% or worse) in 2010, 2011, and 2015/16. Although there are some big fundamental economic questions around trade and budget imbalances in particular, we believe that the current situation is different from each of these periods as the U.S. economy and markets are on a much sounder footing today than in any of these previous periods.
Microcap leadership through the first nine months of the year has been very narrow, with just two sectors, healthcare and information technology, providing almost two-thirds of the overall index returns. In addition, loss-making companies have provided dramatically stronger returns than profitable companies within the small and microcap universe in 2018. When there has been variation in market leadership this year, it has been between high growth, often unprofitable companies and defensive, less economically sensitive sectors, such as utilities, consumer staples, and real estate. The stocks of companies tied closely to the domestic economy have been largely out of favor all year. This is somewhat ironic because U.S. economic data in terms of GDP and industrial production growth, consumer and business confidence, and employment are at multiyear high levels.
Micro cap stocks, as represented by the Russell Microcap Index, had neutral returns for the year with 5 out of the 11 economic sectors posting positive returns. The consumer staples (+36.7%), communication services (+10.1%), and healthcare (+9.3%) sectors were the best performing sectors in the index. The worst performing sectors included consumer discretionary (-5.6) and materials (-9.6%). The RBC sleeve of the Fund has no holdings in the communication services sector, is slightly underweight to consumer staples, significantly
underweight health care, modestly overweight consumer discretionary, and significantly overweight industrials sector.
PERFORMANCE REVIEW
Our sleeve of the AMG Managers Emerging Opportunities Fund underperformed its Russell Microcap Index benchmark during the one-year time period, producing a -4.8% return compared to the +1.42% return for the index. Adverse stock selection (-309 bps) caused the underperformance, while allocation decisions (-300 bps) also weighed on returns. Favorable stock selection in the information technology, healthcare, and real estate sectors contributed to overall performance. Adverse stock selection in industrials and materials combined with an underweight allocation to energy detracted from overall performance.
OUTLOOK
This market environment has been especially challenging for our approach, which focuses on profitable companies, neglected by the market, selling at attractive valuations, with earnings growth prospects superior to the overall index. Many of these companies, because they are in more economically sensitive sectors, have sold off despite superior earnings growth and positive earnings surprises. The fear of an economic downturn in the United States due to rising interest rates, trade tensions, and slowing global growth has overwhelmed improving company fundamentals in terms of stock valuations in these sectors.
The current market correction, while painful, may be a catalyst for investors to re-examine company fundamentals and valuations. We believe that U.S. economic conditions are stronger and more sustainable than the equity market currently reflects. We are going to stay consistent with our disciplined investment approach, confident that it has the potential to produce superior returns over time as it has over the past 25 years. Rarely have the profitability, anticipated earnings growth, and valuation in the portfolio relative to the Russell Microcap Index been as attractive as they are currently. These characteristics should be favorable going forward.
The RBC sleeve of the Fund focuses on neglected small and microcap companies with attractive long-term fundamentals, near-term profitability improvement potential, and low relative valuations. The strategy emphasizes market leaders with proven products or services, sustainable competitive advantages, solid balance sheets, and attractive
12
AMG Managers Emerging Opportunities Fund
Portfolio Manager’s Comments (continued)
cash flows. While sector weightings are a result of bottom-up research and stock selection, the portfolio remains positioned for economic recovery with overweights to the economically sensitive industrials, consumer discretionary, and materials sectors. Downside protection is provided by the superior return on equity and balance sheet profile of the strategy compared to the index and the market leadership positions of most portfolio companies.
WEDGE Capital Management LLP
MARKET OVERVIEW
The Fed will continue to balance raising rates to counter growth and inflation with overreacting and forcing an inversion in the yield curve, often seen as a precursor to recession. Recent employment data suggest that job growth is still moving in the right direction, with the unemployment rate the lowest in 48 years and signs of modest wage growth. The labor force participation rate is steady, with those entering the workforce mostly offsetting retiring boomers. The consumer remains strong and confident, with debt service levels still low and retail sales showing signs of life. Business confidence is also up as companies are paying down debt and are set to invest, outpacing return to shareholders through dividends and share buybacks. The U.S.
completed trade deals with two of its three largest trading partners, Mexico and Canada. Now, all attention is on reaching an agreement with China. So far, fiscal stimulus and regulatory easing are expected to more than offset the impact of remaining trade wars.
With strong economic growth, continued healthy and growing corporate profits, and confidence among consumers and businesses, one would anticipate a favorable stock market environment. However, pressure from rising U.S. interest rates, slower global growth, emerging market challenges, political chaos at home, and a stock market that has just moved into the longest bull market in history, one could expect some volatility and re-pricing over the next one to two years. At WEDGE, we will continue to be patient and focus on high-quality, undervalued companies with unique growth opportunities—a repeatable process that we believe has benefited our patient investors through many market cycles over the last 34 years.
PERFORMANCE AND ATTRIBUTION ANALYSIS
During the 12-month period ending October 31, 2018, the WEDGE sleeve of the Fund returned 2.22% compared to the Russell Microcap Index return of 1.42%. During the year, consumer staples (+36.7%), communication services (+10.1%), healthcare
(+9.3%), and energy (+4.6%) were the best performing sectors in the index. Materials (-9.6%), consumer discretionary (-5.6%) and industrials (-5.3%) were the worst performing segments. Stock selection during the year was somewhat muted as selection in the finance sector and retail sector added value while selection in healthcare and materials detracted.
POSITIONING AND OUTLOOK
We largely maintain a sector neutral position to our internal benchmark with limited exceptions. We want the majority of our added value to be in stock selection, not sector rotation. The portfolio is well diversified with portfolio risk in line with the benchmark. Turnover continues to be between 50% and 75%. We will remain focused on searching for high-quality companies with earnings growth potential that may be temporarily out of favor.
This commentary reflects the viewpoints of the portfolio managers: Lord, Abbett & Co. LLC, Next Century Growth Investors, LLC, RBC Global Asset Management (U.S.) Inc. and WEDGE Capital Management L.L.P. as of October 31, 2018, and is not intended as a forecast or guarantee of future results. Each commentary references how the subadvisor manages its respective sleeve of the AMG Managers Emerging Opportunities Fund.
13
AMG Managers Emerging Opportunities Fund
Portfolio Manager’s Comments (continued)
CUMULATIVE TOTAL RETURN PERFORMANCE
AMG Managers Emerging Opportunities Fund’s cumulative total return is based on the daily change in net asset value (NAV), and assumes that all dividends and distributions were reinvested. This graph compares a hypothetical $10,000 investment made in the AMG Managers Emerging Opportunities Fund’s Class N shares on October 31, 2008, to a $10,000 investment made in the Russell Microcap® Index and the Russell 2000® Index for the same time period. The graph and table do not reflect the deduction of taxes that a shareholder would pay on a Fund distribution or redemption of shares. The listed returns for the Fund are net of expenses and the returns for the index exclude expenses. Total returns would have been lower had certain expenses not been reduced.
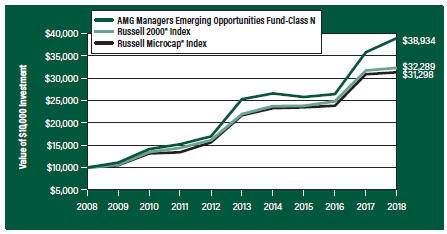
The table below shows the average annual total returns for the AMG Managers Emerging Opportunities Fund, the Russell Microcap® Index and the Russell 2000® Index for the same time periods ended October 31, 2018.
| | | | | | | | | | | | | | | | | | | | |
| | | One | | | Five | | | Ten | | | Since | | | Inception | |
| Average Annual Total Returns1 | | Year | | | Years | | | Years | | | Inception | | | Date | |
AMG Managers Emerging Opportunities Fund2, 3, 4, 5 | | | | | | | | | | | | | |
Class N | | | 8.82 | % | | | 9.02 | % | | | 14.56 | % | | | 12.94 | % | | | 06/30/94 | |
Class I | | | 9.09 | % | | | 9.28 | % | | | — | | | | 16.92 | % | | | 10/01/11 | |
Russell Microcap® Index6 | | | 1.42 | % | | | 7.62 | % | | | 12.09 | % | | | 6.98 | % | | | 06/01/05 | |
Russell 2000® Index7 | | | 1.85 | % | | | 8.01 | % | | | 12.44 | % | | | 9.31 | % | | | 06/30/94 | † |
The performance data shown represents past performance. Past performance is not a guarantee of future results. Current performance may be lower or higher than the performance data quoted. The investment return and principal value of an investment will fluctuate so that an investor’s shares, when redeemed, may be worth more or less than their original cost.
Investors should carefully consider the Fund’s investment objectives, risks, charges and expenses before investing. For performance information through the most recent month end, current net asset values per share for the Fund and other information, please call 800.835.3879 or visit our website at amgfunds.com for a free prospectus. Read it carefully before investing or sending money.
Distributed by AMG Distributors, Inc., member FINRA/SIPC.
| † | Date reflects the inception date of the Fund, not the index. |
| 1 | Total return equals income yield plus share price change and assumes reinvestment of all dividends and capital gain distributions. Returns are net of fees and may reflect offsets of Fund expenses as described in the prospectus. No adjustment has been made for taxes payable by shareholders on their reinvested dividends and |
| | capital gain distributions. Returns for periods greater than one year are annualized. The listed returns on the Fund are net of expenses and based on the published NAV as of October 31, 2018. All returns are in U.S. dollars ($). |
| 2 | From time to time, the Fund’s advisor has waived its fees and/or absorbed Fund expenses, which has resulted in higher returns. |
| 3 | The Fund is subject to the special risks associated with investments in micro-cap companies, such as relatively short earnings histories, competitive conditions, less publicly available corporate information, and reliance on a limited number of products. |
| 4 | Investing in initial public offerings (IPOs) is risky and the prices of stocks purchased in IPOs tend to fluctuate more widely than stocks of companies that have been publicly traded for a longer period of time. Stocks purchased in IPOs generally do not have a trading history, and information about the companies may be available for very limited periods. |
| 5 | Companies that are in similar businesses may be similarly affected by particular economic or market events; to the extent the Fund has substantial holdings within a particular sector, the risks associated with that sector increase. |
| 6 | The Russell Microcap® Index tracks the microcap segment of the U.S. equity market. It makes up less than 3% of the U.S. equity market and is represented by the smallest 1,000 securities in the small-cap Russell 2000® Index plus the next 1,000 securities. Unlike the Fund, the Russell Microcap® Index is unmanaged, is not available for investment, and does not incur expenses. |
| 7 | The Russell 2000® Index is composed of the 2,000 smallest stocks in the Russell 3000® Index and is widely regarded in the industry as the premier measure of small-cap stock performance. Unlike the Fund, the Russell 2000® Index is unmanaged, is not available for investment, and does not incur expenses. |
The Russell Indices are trademarks of the London Stock Exchange Group companies.
Not FDIC insured, nor bank guaranteed. May lose value.
14
AMG Managers Emerging Opportunities Fund
Fund Snapshots (unaudited)
October 31, 2018
PORTFOLIO BREAKDOWN
| | | | | | |
Sector | | %of
Net Assets | |
Health Care | | | 20.3 | |
Information Technology | | | 19.1 | |
Financials | | | 16.8 | |
Industrials | | | 15.7 | |
Consumer Discretionary | | | 10.7 | |
Consumer Staples | | | 3.5 | |
Materials | | | 3.5 | |
Energy | | | 2.4 | |
Real Estate | | | 2.1 | |
Communication Services | | | 0.9 | |
Utilities | | | 0.5 | |
Exchange Traded Funds | | | 0.0 | # |
Short-Term Investments1 | | | 13.6 | |
Other Assets Less Liabilities2 | | | (9.1 | ) |
| 1 | Includes reinvestment of cash collateral into joint repurchase agreements on security lending transactions. |
| 2 | Includes repayment of cash collateral on securities lending transactions. |
TOP TEN HOLDINGS
| | | | |
Security Name | | %of
Net Assets | |
Tactile Systems Technology, Inc. | | | 1.7 | |
Everbridge, Inc. | | | 1.5 | |
Malibu Boats, Inc., Class A | | | 1.5 | |
NV5 Global, Inc. | | | 1.4 | |
Columbus McKinnon Corp. | | | 1.4 | |
CareDx, Inc. | | | 1.4 | |
Universal Stainless & Alloy Products, Inc. | | | 1.3 | |
Compass Diversified Holdings, MLP | | | 1.2 | |
Grand Canyon Education, Inc. | | | 1.2 | |
Goosehead Insurance, Inc., Class A | | | 1.1 | |
| | | | |
Top Ten as a Group | | | 13.7 | |
| | | | |
Because a fund’s strategy may result in multiple investments in particular sectors of the economy, its performance may depend on the performance of those sectors and may fluctuate more widely than investments diversified across more sectors. For additional information on these and other risk considerations, please see the Fund’s prospectus.
Any sectors, industries, or securities discussed should not be perceived as investment recommendations. Mention of a specific security should not be considered a recommendation to buy or solicitation to sell that security. Specific securities mentioned in this report may have been sold from the Fund’s portfolio of investments by the time you receive this report.
15
AMG Managers Emerging Opportunities Fund
Schedule of Portfolio Investments
October 31, 2018
| | | | | | | | |
| | | Shares | | | Value | |
Common Stocks - 95.5% | | | | | | | | |
Communication Services - 0.9% | | | | | |
Boingo Wireless, Inc.* | | | 38,694 | | | $ | 1,212,283 | |
Cardlytics, Inc.*,1 | | | 17,998 | | | | 380,838 | |
Total Communication Services | | | | | | | 1,593,121 | |
Consumer Discretionary - 10.7% | | | | | |
Aspen Group, Inc.* | | | 23,412 | | | | 133,448 | |
At Home Group, Inc.* | | | 24,970 | | | | 682,680 | |
Barnes & Noble Education, Inc.* | | | 19,502 | | | | 111,356 | |
Century Casinos, Inc.* | | | 24,500 | | | | 152,880 | |
Citi Trends, Inc. | | | 15,000 | | | | 379,950 | |
The Container Store Group, Inc.* | | | 14,012 | | | | 82,811 | |
Culp, Inc. | | | 8,897 | | | | 205,966 | |
Delta Apparel, Inc.* | | | 46,928 | | | | 894,917 | |
Destination XL Group, Inc.* | | | 123,806 | | | | 378,846 | |
Gaia, Inc.* | | | 34,994 | | | | 511,262 | |
Grand Canyon Education, Inc.* | | | 16,460 | | | | 2,052,562 | |
Gray Television, Inc.*,1 | | | 71,910 | | | | 1,244,762 | |
Hamilton Beach Brands Holding Co., Class A1 | | | 18,793 | | | | 436,374 | |
Haverty Furniture Cos., Inc.1 | | | 15,290 | | | | 310,081 | |
Hibbett Sports, Inc.* | | | 10,881 | | | | 190,091 | |
J Alexander’s Holdings, Inc.* | | | 19,000 | | | | 200,450 | |
Johnson Outdoors, Inc., Class A | | | 2,611 | | | | 196,634 | |
Kirkland’s, Inc.*,1 | | | 16,700 | | | | 168,837 | |
Lakeland Industries, Inc.* | | | 26,770 | | | | 351,758 | |
LGI Homes, Inc.* | | | 9,756 | | | | 417,459 | |
Libbey, Inc. | | | 9,770 | | | | 73,666 | |
The Lovesac Co.* | | | 32,195 | | | | 612,993 | |
Malibu Boats, Inc., Class A* | | | 64,910 | | | | 2,609,382 | |
Marine Products Corp. | | | 11,466 | | | | 233,563 | |
MCBC Holdings, Inc.* | | | 6,193 | | | | 183,808 | |
Monarch Casino & Resort, Inc.* | | | 7,500 | | | | 290,775 | |
Nautilus, Inc.* | | | 7,120 | | | | 87,078 | |
Potbelly Corp.* | | | 26,529 | | | | 309,859 | |
Reading International, Inc., Class A* | | | 12,200 | | | | 177,144 | |
Red Robin Gourmet Burgers, Inc.* | | | 2,300 | | | | 69,460 | |
Rocky Brands, Inc. | | | 3,461 | | | | 99,400 | |
Ruth’s Hospitality Group, Inc. | | | 17,679 | | | | 477,863 | |
Salem Media Group, Inc. | | | 42,361 | | | | 124,965 | |
Shiloh Industries, Inc.* | | | 23,400 | | | | 212,706 | |
Shoe Carnival, Inc. | | | 9,892 | | | | 402,901 | |
Spartan Motors, Inc. | | | 22,227 | | | | 149,588 | |
Sportsman’s Warehouse Holdings, Inc.*,1 | | | 20,861 | | | | 104,931 | |
| | | | | | | | |
| | | Shares | | | Value | |
Superior Group of Cos., Inc. | | | 14,880 | | | $ | 258,763 | |
Tandy Leather Factory, Inc.* | | | 67,200 | | | | 483,840 | |
Tilly’s, Inc., Class A | | | 17,707 | | | | 314,122 | |
Tower International, Inc. | | | 14,700 | | | | 436,443 | |
Unifi, Inc.* | | | 10,596 | | | | 242,543 | |
Universal Electronics, Inc.*,1 | | | 23,720 | | | | 741,724 | |
ZAGG, Inc.* | | | 93,228 | | | | 1,128,991 | |
Total Consumer Discretionary | | | | | | | 18,929,632 | |
Consumer Staples - 3.5% | | | | | | | | |
Calavo Growers, Inc. | | | 2,732 | | | | 265,004 | |
The Chefs’ Warehouse, Inc.*,1 | | | 28,132 | | | | 946,079 | |
Craft Brew Alliance, Inc.* | | | 23,100 | | | | 423,654 | |
John B Sanfilippo & Son, Inc.1 | | | 14,710 | | | | 927,613 | |
Landec Corp.* | | | 26,030 | | | | 356,351 | |
Limoneira Co.1 | | | 47,272 | | | | 1,165,255 | |
MGP Ingredients, Inc.1 | | | 10,927 | | | | 777,674 | |
Natural Grocers by Vitamin Cottage, Inc.*,1 | | | 5,968 | | | | 108,140 | |
Primo Water Corp.*,1 | | | 55,234 | | | | 920,751 | |
Turning Point Brands, Inc.1 | | | 8,741 | | | | 359,255 | |
Total Consumer Staples | | | | | | | 6,249,776 | |
Energy - 2.4% | | | | | | | | |
Abraxas Petroleum Corp.* | | | 99,700 | | | | 183,448 | |
Callon Petroleum Co.*,1 | | | 80,920 | | | | 806,772 | |
Contango Oil & Gas Co.*,1 | | | 35,269 | | | | 178,108 | |
Dawson Geophysical Co.* | | | 57,854 | | | | 324,561 | |
Era Group, Inc.* | | | 38,968 | | | | 441,118 | |
Evolution Petroleum Corp. | | | 25,227 | | | | 259,838 | |
Matrix Service Co.* | | | 13,096 | | | | 266,242 | |
North American Construction Group, Ltd. (Canada) | | | 22,000 | | | | 234,740 | |
Profire Energy, Inc.* | | | 43,589 | | | | 99,383 | |
Ring Energy, Inc.*,1 | | | 88,446 | | | | 630,620 | |
Solaris Oilfield Infrastructure, Inc., Class A*,1 | | | 36,685 | | | | 484,242 | |
TransGlobe Energy Corp. (Canada) | | | 103,084 | | | | 238,124 | |
Total Energy | | | | | | | 4,147,196 | |
Financials - 16.8% | | | | | | | | |
American National Bankshares, Inc. | | | 5,700 | | | | 205,713 | |
AMERISAFE, Inc. | | | 22,110 | | | | 1,439,140 | |
Arrow Financial Corp. | | | 8,067 | | | | 283,474 | |
Atlas Financial Holdings, Inc.* | | | 32,103 | | | | 308,510 | |
BankFinancial Corp. | | | 12,200 | | | | 172,264 | |
BOK Financial Corp. | | | 7,624 | | | | 653,606 | |
Bridge Bancorp, Inc. | | | 9,855 | | | | 292,693 | |
The accompanying notes are an integral part of these financial statements.
16
AMG Managers Emerging Opportunities Fund
Schedule of Portfolio Investments (continued)
| | | | | | | | |
| | | Shares | | | Value | |
Financials - 16.8% (continued) | | | | | | | | |
Bryn Mawr Bank Corp. | | | 11,980 | | | $ | 478,481 | |
Byline Bancorp, Inc.* | | | 31,539 | | | | 693,858 | |
CenterState Bank Corp. | | | 19,794 | | | | 486,537 | |
Compass Diversified Holdings, MLP 1 | | | 138,950 | | | | 2,196,799 | |
Cowen, Inc.*,1 | | | 29,632 | | | | 438,554 | |
Ellington Financial LLC, MLP | | | 21,222 | | | | 326,394 | |
Entegra Financial Corp.* | | | 8,100 | | | | 183,789 | |
Farmers National Banc Corp. | | | 6,949 | | | | 91,032 | |
FedNat Holding Co. | | | 20,896 | | | | 449,891 | |
First Bancorp | | | 32,170 | | | | 1,186,751 | |
First Business Financial Services, Inc. | | | 4,162 | | | | 87,111 | |
First Community Bancshares, Inc. | | | 12,799 | | | | 441,949 | |
First Defiance Financial Corp. | | | 18,000 | | | | 489,960 | |
First Financial Corp. | | | 8,353 | | | | 383,069 | |
Flushing Financial Corp. | | | 16,398 | | | | 372,071 | |
FS Bancorp, Inc. | | | 3,731 | | | | 168,417 | |
German American Bancorp, Inc. | | | 28,685 | | | | 909,601 | |
Goosehead Insurance, Inc., Class A*,1 | | | 59,097 | | | | 2,025,845 | |
Hallmark Financial Services, Inc.* | | | 7,900 | | | | 88,006 | |
Hamilton Lane, Inc., Class A | | | 6,898 | | | | 264,745 | |
HCI Group, Inc. | | | 11,098 | | | | 484,650 | |
Heritage Commerce Corp. | | | 24,661 | | | | 357,831 | |
Heritage Financial Corp. | | | 35,297 | | | | 1,154,918 | |
Heritage Insurance Holdings, Inc.1 | | | 26,696 | | | | 372,676 | |
HomeTrust Bancshares, Inc.* | | | 16,100 | | | | 438,886 | |
Independent Bank Corp. | | | 21,800 | | | | 482,434 | |
International Money Express, Inc.* | | | 107,298 | | | | 1,297,233 | |
Kingstone Cos., Inc. | | | 52,608 | | | | 894,336 | |
Kinsale Capital Group, Inc. | | | 18,098 | | | | 1,080,632 | |
Macatawa Bank Corp. | | | 9,392 | | | | 101,903 | |
Marlin Business Services Corp. | | | 7,504 | | | | 199,456 | |
Mercantile Bank Corp. | | | 30,460 | | | | 967,410 | |
Northeast Bancorp | | | 19,100 | | | | 359,271 | |
Northrim BanCorp, Inc. | | | 29,511 | | | | 1,122,303 | |
OFS Capital Corp.1 | | | 18,185 | | | | 196,398 | |
Old Second Bancorp, Inc. | | | 28,353 | | | | 403,180 | |
Oppenheimer Holdings, Inc., Class A | | | 15,904 | | | | 489,207 | |
Orrstown Financial Services, Inc. | | | 4,000 | | | | 81,040 | |
Pacific Premier Bancorp, Inc.* | | | 30,637 | | | | 895,520 | |
People’s Utah Bancorp | | | 7,000 | | | | 234,570 | |
Preferred Bank | | | 20,900 | | | | 1,074,469 | |
RBB Bancorp.1 | | | 15,089 | | | | 325,621 | |
| | | | | | | | |
| | | Shares | | | Value | |
Regional Management Corp.* | | | 17,257 | | | $ | 498,037 | |
State Bank Financial Corp. | | | 5,650 | | | | 144,470 | |
Trupanion, Inc. *,1 | | | 28,733 | | | | 725,796 | |
United Community Financial Corp. | | | 32,300 | | | | 295,545 | |
Total Financials | | | | | | | 29,796,052 | |
Health Care - 20.3% | | | | | | | | |
Accelerate Diagnostics, Inc.*,1 | | | 16,871 | | | | 252,053 | |
Addus HomeCare Corp.* | | | 4,776 | | | | 312,828 | |
Arcus Biosciences, Inc.* | | | 21,767 | | | | 218,758 | |
Arena Pharmaceuticals, Inc.* | | | 7,678 | | | | 273,797 | |
Audentes Therapeutics, Inc.*,1 | | | 29,952 | | | | 844,646 | |
AxoGen, Inc.*,1 | | | 7,125 | | | | 265,691 | |
CareDx, Inc.*,1 | | | 91,603 | | | | 2,391,754 | |
CRH Medical Corp. (Canada)* | | | 27,492 | | | | 86,050 | |
CryoLife, Inc.* | | | 10,191 | | | | 315,717 | |
CryoPort, Inc.*,1 | | | 11,256 | | | | 124,942 | |
Deciphera Pharmaceuticals, Inc.* | | | 21,239 | | | | 428,815 | |
Denali Therapeutics, Inc.*,1 | | | 42,919 | | | | 621,038 | |
ElectroCore LLC* | | | 14,777 | | | | 148,213 | |
Glaukos Corp.* | | | 17,819 | | | | 1,032,433 | |
Harvard Bioscience, Inc.* | | | 49,320 | | | | 195,307 | |
Homology Medicines, Inc.* | | | 27,268 | | | | 513,184 | |
Inspire Medical Systems, Inc.*,1 | | | 25,333 | | | | 1,015,347 | |
Intellia Therapeutics, Inc.*,1 | | | 17,045 | | | | 289,424 | |
Invacare Corp. | | | 36,330 | | | | 469,384 | |
iRhythm Technologies, Inc.* | | | 18,105 | | | | 1,398,792 | |
The Joint Corp* | | | 41,842 | | | | 315,907 | |
KalVista Pharmaceuticals, Inc.*,1 | | | 19,614 | | | | 370,705 | |
LeMaitre Vascular, Inc. | | | 11,800 | | | | 315,060 | |
Mirati Therapeutics, Inc.*,1 | | | 17,772 | | | | 664,140 | |
MyoKardia, Inc.*,1 | | | 16,482 | | | | 872,557 | |
Myovant Sciences, Ltd. (United Kingdom)*,1 | | | 54,326 | | | | 1,142,476 | |
Neuronetics, Inc.*,1 | | | 50,947 | | | | 1,298,130 | |
Nightstar Therapeutics PLC, ADR (United Kingdom)* | | | 18,624 | | | | 188,102 | |
Nuvectra Corp.* | | | 20,235 | | | | 404,902 | |
Optinose, Inc.*,1 | | | 51,281 | | | | 542,553 | |
OrthoPediatrics Corp.* | | | 30,969 | | | | 1,075,553 | |
PetIQ, Inc.* | | | 42,419 | | | | 1,342,986 | |
Pieris Pharmaceuticals, Inc.* | | | 79,534 | | | | 327,680 | |
Protagonist Therapeutics, Inc.* | | | 54,618 | | | | 436,398 | |
RA Medical Systems, Inc.* | | | 27,355 | | | | 292,699 | |
Repligen Corp.* | | | 9,386 | | | | 508,909 | |
The accompanying notes are an integral part of these financial statements.
17
AMG Managers Emerging Opportunities Fund
Schedule of Portfolio Investments (continued)
| | | | | | | | |
| | | Shares | | | Value | |
Health Care - 20.3% (continued) | | | | | | | | |
Rocket Pharmaceuticals, Inc.*,1 | | | 29,749 | | | $ | 471,224 | |
RTI Surgical, Inc.* | | | 94,600 | | | | 433,268 | |
SeaSpine Holdings Corp.* | | | 22,161 | | | | 380,504 | |
SI-BONE, Inc.* | | | 17,969 | | | | 336,919 | |
Sientra, Inc.*,1 | | | 72,505 | | | | 1,492,878 | |
Simulations Plus, Inc. | | | 13,500 | | | | 272,835 | |
Spark Therapeutics, Inc.*,1 | | | 4,416 | | | | 198,676 | |
Surface Oncology, Inc.*,1 | | | 34,631 | | | | 270,468 | |
Surmodics, Inc.* | | | 12,030 | | | | 763,063 | |
Syros Pharmaceuticals, Inc.*,1 | | | 17,849 | | | | 117,446 | |
Tabula Rasa HealthCare, Inc.*,1 | | | 4,052 | | | | 299,362 | |
Tactile Systems Technology, Inc.*,1 | | | 46,665 | | | | 3,055,624 | |
Tandem Diabetes Care, Inc.*,1 | | | 39,302 | | | | 1,478,148 | |
uniQure, N.V. (Netherlands)*,1 | | | 10,090 | | | | 259,616 | |
US Physical Therapy, Inc. | | | 2,600 | | | | 279,552 | |
Utah Medical Products, Inc. | | | 4,373 | | | | 381,238 | |
Veracyte, Inc.* | | | 49,340 | | | | 732,699 | |
Vericel Corp.*,1 | | | 85,336 | | | | 951,496 | |
ViewRay, Inc.* | | | 89,643 | | | | 775,412 | |
Vocera Communications, Inc.* | | | 20,404 | | | | 708,223 | |
Xencor, Inc.*,1 | | | 12,994 | | | | 425,164 | |
Zymeworks, Inc. (Canada)*,1 | | | 46,301 | | | | 591,264 | |
Total Health Care | | | | | | | 35,972,009 | |
Industrials - 15.7% | | | | | | | | |
ACCO Brands Corp. | | | 122,953 | | | | 992,231 | |
Aerovironment, Inc.*,1 | | | 10,992 | | | | 988,950 | |
Air Transport Services Group, Inc.* | | | 35,871 | | | | 703,072 | |
Allied Motion Technologies, Inc. | | | 17,073 | | | | 745,407 | |
Armstrong Flooring, Inc.* | | | 19,694 | | | | 306,242 | |
AZZ, Inc. | | | 5,470 | | | | 242,595 | |
Barrett Business Services, Inc. | | | 4,230 | | | | 266,152 | |
Blue Bird Corp.*,1 | | | 12,340 | | | | 229,647 | |
Broadwind Energy, Inc.* | | | 59,310 | | | | 109,130 | |
Casella Waste Systems, Inc., Class A* | | | 21,067 | | | | 685,942 | |
CBIZ, Inc.* | | | 19,660 | | | | 436,059 | |
Columbus McKinnon Corp. | | | 67,700 | | | | 2,486,621 | |
Commercial Vehicle Group, Inc.* | | | 31,979 | | | | 213,940 | |
Covenant Transportation Group, Inc., Class A* | | | 8,500 | | | | 212,755 | |
CPI Aerostructures, Inc.* | | | 11,364 | | | | 77,275 | |
CRA International, Inc. | | | 8,850 | | | | 373,027 | |
DMC Global, Inc. | | | 41,860 | | | | 1,613,703 | |
Ducommun, Inc.* | | | 39,955 | | | | 1,484,728 | |
| | | | | | | | |
| | | Shares | | | Value | |
Echo Global Logistics, Inc.*,1 | | | 35,716 | | | $ | 918,258 | |
Ennis, Inc. | | | 28,666 | | | | 554,974 | |
Global Brass & Copper Holdings, Inc. | | | 13,566 | | | | 428,957 | |
Graham Corp. | | | 25,279 | | | | 622,116 | |
The Greenbrier Cos., Inc. | | | 23,727 | | | | 1,125,846 | |
Heidrick & Struggles International, Inc. | | | 11,001 | | | | 379,645 | |
Heritage-Crystal Clean, Inc.* | | | 9,899 | | | | 227,578 | |
Hudson Technologies, Inc.* | | | 43,810 | | | | 36,305 | |
Insteel Industries, Inc. | | | 20,780 | | | | 542,774 | |
Kornit Digital, Ltd. (Israel)*,1 | | | 22,281 | | | | 411,307 | |
Lydall, Inc.* | | | 14,562 | | | | 434,967 | |
Manitex International, Inc.* | | | 83,063 | | | | 709,358 | |
Marten Transport, Ltd. | | | 11,663 | | | | 224,629 | |
NN, Inc.1 | | | 45,810 | | | | 531,396 | |
NV5 Global, Inc.*,1 | | | 32,108 | | | | 2,506,672 | |
Orion Group Holdings, Inc.* | | | 52,313 | | | | 246,917 | |
Patrick Industries, Inc.*,1 | | | 44,787 | | | | 1,948,682 | |
PGT Innovations, Inc.* | | | 22,950 | | | | 464,967 | |
Radiant Logistics, Inc.*,1 | | | 40,650 | | | | 221,136 | |
Sterling Construction Co., Inc.* | | | 18,357 | | | | 208,536 | |
Titan Machinery, Inc.*,1 | | | 20,517 | | | | 292,367 | |
Transcat, Inc.* | | | 9,489 | | | | 196,517 | |
Universal Logistics Holdings, Inc. | | | 9,679 | | | | 262,978 | |
Upwork, Inc.* | | | 25,667 | | | | 492,806 | |
Vectrus, Inc.* | | | 17,830 | | | | 477,844 | |
Willdan Group, Inc.*,1 | | | 37,574 | | | | 1,134,735 | |
Total Industrials | | | | | | | 27,769,743 | |
Information Technology - 19.1% | | | | | | | | |
8x8, Inc.* | | | 32,182 | | | | 553,209 | |
Alteryx, Inc., Class A*,1 | | | 8,110 | | | | 429,749 | |
American Software, Inc., Class A | | | 21,828 | | | | 251,240 | |
Appfolio, Inc., Class A* | | | 6,709 | | | | 383,084 | |
Appian Corp.*,1 | | | 24,187 | | | | 621,848 | |
Apptio, Inc., Class A* | | | 22,159 | | | | 573,918 | |
Aquantia Corp.*,1 | | | 35,386 | | | | 338,290 | |
AXT, Inc.*,1 | | | 95,890 | | | | 631,915 | |
Bel Fuse, Inc., Class B | | | 12,700 | | | | 279,400 | |
Carbonite, Inc.*,1 | | | 17,769 | | | | 607,877 | |
Care.com, Inc.* | | | 49,871 | | | | 877,730 | |
CEVA, Inc.* | | | 6,044 | | | | 148,924 | |
Comtech Telecommunications Corp. | | | 35,956 | | | | 1,003,892 | |
Control4 Corp.*,1 | | | 25,253 | | | | 705,064 | |
Endava PLC, ADR (United Kingdom)* | | | 21,382 | | | | 497,345 | |
The accompanying notes are an integral part of these financial statements.
18
AMG Managers Emerging Opportunities Fund
Schedule of Portfolio Investments (continued)
| | | | | | | | |
| | | Shares | | | Value | |
Information Technology - 19.1% (continued) | | | | | |
Everbridge, Inc.*,1 | | | 52,309 | | | $ | 2,658,866 | |
Everi Holdings, Inc.* | | | 39,218 | | | | 282,370 | |
EverQuote, Inc., Class A*,1 | | | 36,691 | | | | 472,213 | |
Five9, Inc.* | | | 17,050 | | | | 671,088 | |
Glu Mobile, Inc.* | | | 105,780 | | | | 745,749 | |
The Hackett Group, Inc. | | | 25,400 | | | | 519,938 | |
Ichor Holdings, Ltd.*,1 | | | 9,020 | | | | 160,105 | |
Information Services Group, Inc.* | | | 48,600 | | | | 199,746 | |
inTEST Corp.* | | | 44,550 | | | | 327,443 | |
Mimecast, Ltd.* | | | 8,208 | | | | 286,131 | |
Mitek Systems, Inc.*,1 | | | 80,350 | | | | 736,809 | |
Model N, Inc.* | | | 43,118 | | | | 662,292 | |
Napco Security Technologies, Inc.* | | | 9,500 | | | | 133,665 | |
Novanta, Inc.* | | | 34,520 | | | | 2,009,409 | |
NVE Corp. | | | 4,173 | | | | 353,453 | |
OSI Systems, Inc.* | | | 8,067 | | | | 557,914 | |
Park Electrochemical Corp. | | | 21,790 | | | | 384,811 | |
PC Connection, Inc. | | | 24,500 | | | | 811,930 | |
PC-Tel, Inc. | | | 13,900 | | | | 61,438 | |
Points International, Ltd. (Canada)* | | | 20,764 | | | | 258,719 | |
PRGX Global, Inc.* | | | 25,805 | | | | 221,407 | |
PROS Holdings, Inc.* | | | 17,698 | | | | 582,618 | |
QAD, Inc., Class A | | | 4,305 | | | | 182,661 | |
Quantenna Communications, Inc.* | | | 39,704 | | | | 713,084 | |
QuinStreet, Inc.*,1 | | | 56,561 | | | | 899,320 | |
Rapid7, Inc.* | | | 11,161 | | | | 404,475 | |
Sapiens International Corp. NV (Israel) | | | 58,851 | | | | 669,136 | |
SendGrid, Inc.*,1 | | | 53,840 | | | | 1,955,469 | |
SVMK, Inc.* | | | 31,310 | | | | 335,330 | |
Talend, S.A., ADR * | | | 16,866 | | | | 1,044,849 | |
TechTarget, Inc.*,1 | | | 66,873 | | | | 1,358,859 | |
TESSCO Technologies, Inc. | | | 39,633 | | | | 478,965 | |
TransAct Technologies, Inc. | | | 8,514 | | | | 125,156 | |
Tyler Technologies, Inc.* | | | 5,740 | | | | 1,214,928 | |
Unisys Corp.*,1 | | | 11,071 | | | | 203,817 | |
Upland Software, Inc.* | | | 20,253 | | | | 638,780 | |
USA Technologies, Inc.*,1 | | | 101,805 | | | | 590,469 | |
Vishay Precision Group, Inc.* | | | 42,092 | | | | 1,365,885 | |
Zix Corp.* | | | 80,717 | | | | 544,033 | |
Total Information Technology | | | | | | | 33,726,815 | |
Materials - 3.5% | | | | | | | | |
AgroFresh Solutions, Inc.*,1 | | | 35,809 | | | | 204,469 | |
| | | | | | | | |
| | | Shares | | | Value | |
FutureFuel Corp. | | | 20,480 | | | $ | 335,872 | |
Koppers Holdings, Inc.* | | | 22,815 | | | | 610,301 | |
Myers Industries, Inc. | | | 20,084 | | | | 318,532 | |
OMNOVA Solutions, Inc.* | | | 181,903 | | | | 1,344,263 | |
Trecora Resources* | | | 22,923 | | | | 247,569 | |
UFP Technologies, Inc.* | | | 20,235 | | | | 698,512 | |
Universal Stainless & Alloy Products, Inc.* | | | 113,751 | | | | 2,234,070 | |
US Concrete, Inc.*,1 | | | 4,920 | | | | 160,589 | |
Total Materials | | | | | | | 6,154,177 | |
Real Estate - 2.1% | | | | | | | | |
Braemar Hotels & Resorts, Inc., REIT | | | 50,899 | | | | 541,565 | |
Community Healthcare Trust, Inc., REIT 1 | | | 36,840 | | | | 1,094,885 | |
Consolidated-Tomoka Land Co. | | | 7,343 | | | | 425,307 | |
Global Medical REIT, Inc., REIT | | | 35,710 | | | | 327,104 | |
NexPoint Residential Trust, Inc., REIT | | | 14,935 | | | | 532,283 | |
UMH Properties, Inc., REIT | | | 50,210 | | | | 719,509 | |
Total Real Estate | | | | | | | 3,640,653 | |
Utilities - 0.5% | | | | | | | | |
Middlesex Water Co. | | | 2,391 | | | | 107,595 | |
Unitil Corp. | | | 16,720 | | | | 794,367 | |
Total Utilities | | | | | | | 901,962 | |
Total Common Stocks
(Cost $129,387,313) | | | | | | | 168,881,136 | |
Exchange Traded Funds - 0.0%# | | | | | | | | |
SPDR S&P Regional Banking ETF (Cost $10,620) | | | 550 | | | | 29,694 | |
| | | Principal
Amount | | | | |
Short-Term Investments - 13.6% | | | | | |
Joint Repurchase Agreements - 9.1%2 | | | | | |
Barclays Capital, Inc., dated 10/31/18, due 11/01/18, 2.190% total to be received $1,252,856 (collateralized by various U.S. Treasuries, 0.000% - 3.625%, 11/15/18 - 08/15/48, totaling $1,277,836) | | $ | 1,252,780 | | | | 1,252,780 | |
MUFG Securities America, Inc., dated 10/31/18, due 11/01/18, 2.210% total to be received $3,839,091 (collateralized by various U.S. Government Agency Obligations, 3.000% - 4.500%, 01/01/30 - 05/20/48, totaling $3,915,632) | | | 3,838,855 | | | | 3,838,855 | |
Nomura Securities International, Inc., dated 10/31/18, due 11/01/18, 2.210% total to be received $3,839,091 (collateralized by various U.S. Government Agency Obligations and U.S. Treasuries, 0.000% - 9.500%, 11/08/18 - 09/20/68, totaling $3,915,632) | | | 3,838,855 | | | | 3,838,855 | |
The accompanying notes are an integral part of these financial statements.
19
AMG Managers Emerging Opportunities Fund
Schedule of Portfolio Investments (continued)
| | | | | | | | |
| | | Principal
Amount | | | Value | |
Joint Repurchase Agreements - 9.1%2 (continued) | | | | | |
RBC Dominion Securities, Inc., dated 10/31/18, due 11/01/18, 2.220% total to be received $3,839,092 (collateralized by various U.S. Government Agency Obligations and U.S. Treasuries, 0.000% - 7.000%, 11/29/18 - 09/09/49, totaling $3,915,632) | | $ | 3,838,855 | | | $ | 3,838,855 | |
State of Wisconsin Investment Board, dated 10/31/18, due 11/01/18, 2.410% total to be received $3,393,397 (collateralized by various U.S. Treasuries, 0.125% - 3.875%, 04/15/20 - 02/15/48, totaling $3,461,501) | | | 3,393,170 | | | | 3,393,170 | |
Total Joint Repurchase Agreements | | | | 16,162,515 | |
| * | Non-income producing security. |
| 1 | Some or all of these securities, amounting to $31,464,308 or 17.8% of net assets, were out on loan to various brokers and are collateralized by cash and various U.S. Treasury Obligations. See Note 4 of Notes to Financial Statements. |
| 2 | Cash collateral received from brokers for securities lending was invested in these joint repurchase agreements. |
| 3 | Yield shown represents the October 31, 2018, seven day average yield, which refers to the sum of the previous seven days’ dividends paid, expressed as an annual percentage. |
| | | | | | | | |
| | | Shares | | Value | |
Other Investment Companies - 4.5% | | | | |
Dreyfus Government Cash Management Fund, Institutional Class Shares, 2.05%3 | | 7,684,565 | | $ | 7,684,565 | |
Dreyfus Institutional Preferred Government Money Market Fund, Institutional Class Shares, 2.12%3 | | 90,935 | | | 90,935 | |
JPMorgan U.S. Government Money Market Fund, IM Shares, 2.09%3 | | 93,691 | | | 93,691 | |
Total Other Investment Companies | | | | | 7,869,191 | |
Total Short-Term Investments
(Cost $24,031,706) | | | | | 24,031,706 | |
Total Investments - 109.1%
(Cost $153,429,639) | | | | | 192,942,536 | |
Other Assets, less Liabilities - (9.1)% | | | (16,038,204 | ) |
Net Assets - 100.0% | | | | $ | 176,904,332 | |
| ADR | American Depositary Receipt |
| MLP | Master Limited Partnership |
| REIT | Real Estate Investment Trust |
| SPDR | Standard & Poor’s Depositary Receipt |
The following table summarizes the inputs used to value the Fund’s investments by the fair value hierarchy levels as of October 31, 2018:
| | | | | | | | | | | | | | | | |
| | | Level 1 | | | Level 2 | | | Level 3 | | | Total | |
Investments in Securities | | | | | | | | | | | | | | | | |
Common Stocks† | | $ | 168,881,136 | | | | — | | | | — | | | $ | 168,881,136 | |
Exchange Traded Funds | | | 29,694 | | | | — | | | | — | | | | 29,694 | |
Short-Term Investments | | | | | | | | | | | | | | | | |
Joint Repurchase Agreements | | | — | | | $ | 16,162,515 | | | | — | | | | 16,162,515 | |
Other Investment Companies | | | 7,869,191 | | | | — | | | | — | | | | 7,869,191 | |
| | | | | | | | | | | | | | | | |
Total Investments in Securities | | $ | 176,780,021 | | | $ | 16,162,515 | | | | — | | | $ | 192,942,536 | |
| | | | | | | | | | | | | | | | |
| † | All common stocks held in the Fund are Level 1 securities. For a detailed breakout of common stocks by major industry classification, please refer to the Fund’s Schedule of Portfolio Investments. |
As of October 31, 2018, the Fund had no transfers between levels from the beginning of the reporting period.
The accompanying notes are an integral part of these financial statements.
20
AMG GW&K Core Bond Fund
Portfolio Manager’s Comments (unaudited)
THE YEAR IN REVIEW
For the 12 months ending October 31, 2018, the AMG GW&K Core Bond Fund (Class I) (the “Fund”) returned (2.59)%, compared to the return of (2.05)% for the Bloomberg Barclays U.S. Aggregate Bond Index® (the “Index”).
Fixed income markets ended 2017 on a relatively calm note following months of policy uncertainty and headline-driven volatility. Debates surrounding U.S. Federal Reserve (Fed) policy, tax reform legislation, and the sustainability of record corporate profitability dominated trading at various points throughout the final months. However, each of these questions was eventually resolved and investors gradually shifted their focus to 2018. Ironically, the absence of obvious risks on the horizon had been cited as a risk in itself, as investors point to record low volatility and broad consensus as evidence of complacency. We continued to closely monitor policy and economic developments while we watched for early signs of wage inflation, an uptick in the default rate, or any indication that we were approaching the late stages of the business cycle.
At the start of 2018, fixed income markets endured turbulence as the narrative shifted abruptly from one of optimism surrounding synchronized global growth to one of risk-aversion. Rates began the quarter under pressure due to concerns that the global economy was doing too well—strong gross domestic product (GDP) growth out of Europe and Asia, better-than-expected corporate profits in the U.S., and high consumer confidence pushed inflation expectations to their highest level in years. Meanwhile, equities traded at record highs and credit spreads reached decade lows. But when wage growth unexpectedly showed signs of accelerating at its fastest pace since 2009, the story changed. Interest rates spiked, equities headed toward their first correction in two years, and volatility soared. Hawkish rhetoric from the
White House raised the potential for a global trade war, the prospect of increased regulation weighed heavily on the technology space, and worries about overly aggressive Fed policy stoked fears of a recession. The debate continued as to whether the tumult was simply a healthy consolidation or a more ominous sign of things to come.
Fixed income markets were less volatile in the second quarter, although interest rates continued to rise as a stronger economy outweighed geopolitical tensions. The 10-year U.S. Treasury note crossed 3% for the first time since the end of 2013 and hit a seven-year high before reversing course on
concerns over Italy’s political crisis. Yields at the shorter end of the curve moved even more, creating the flattest curve in over ten years, as the Fed, up until this point, had raised rates for the second time this year and seventh time since the start of its tightening path. Positive readings from the housing market, retail sales, and business investment pointed to an improving economy while the job market continued to chug along with unemployment at levels not seen in nearly 20 years. The strong labor market and lower income tax rates resulted in solid consumer spending and record corporate profits. However, the synchronized global growth story was called into question toward the end of the quarter by a negative GDP report in Japan, softness in Europe, and emerging trade disputes. Furthermore, central banks seemed keen on pulling back from overly accommodative monetary policy. Those potential disruptors did little to dent the economic environment in the U.S., but were a concern to investors as we entered the second half of the year.
Risk appetite returned to fixed income markets in the third quarter, sending interest rates higher and credit spreads tighter. Investors largely shrugged off persistent trade tensions, the specter of tighter monetary policy, and turmoil in emerging markets. Instead, market sentiment was lifted by a healthy outlook for corporate earnings, a surge in consumer and business confidence, and the renewed outlook for synchronized global growth. On top of that, the Fed remained transparent and predictable in its normalization of monetary policy, promising an orderly shift to a neutral interest rate environment.
Interest rates rose sharply during the opening days of October, with 10-year yields reaching a 7-year high in response to a record service sector reading, a 48-year low in the unemployment rate, and signs of healthy wage gains. Ironically, this sudden jump in yields, combined with lackluster data out of the retail and housing sectors, drove an uptick in volatility that led investors to seek refuge in the rates market. Ultimately, the yield on the 10-year rose .08% on the month. Corporate spreads widened amid growing concerns about the end of the cycle, peak earnings, and trade wars. Investment grade struggled amid higher rates and worries about the credit quality of BBB-rated credits, which now represent 50% of the investment grade market.
Positive security selection was a contributor to performance during the 12-month period. Investment grade corporate selection was especially good, notably in the consumer cyclicals and banking segments, while selection in communications detracted. The Fund’s overweight to investment
grade corporates, which underperformed the Bloomberg Barclays U.S. Aggregate Bond Index, was a negative from an allocation standpoint. For the one-year period ending October 2018, interest rates increased, and the corporate sector lagged due to its longer duration and 23 basis points of spread widening. Treasuries were modest outperformers versus the Index, so our underweight was a small drag on performance. We were generally equal weight mortgage-backed securities, so our allocation decision had minimal impact, but our selection in the sector outperformed given our preference for shorter duration seasoned mortgage pools. We overweighted taxable municipal bonds, a sector that was hurt due to the rise in rates, yet the Fund benefited from good security selection within the space. The Fund’s duration was marginally lower than the benchmark’s for the overall period, which added to performance. Yield curve positioning, however, hurt more so, as the Fund’s intermediate to longer-term bonds struggled, and being underweight the front end of the curve was a drag due to its outperformance.
There is a sense of uncertainty that remains across the economic landscape. Trade policy, despite recent successes in North America, has the potential to flare up given ongoing friction with China. The Fed’s balancing act of maintaining price stability while supporting a strong labor market promises to become increasingly fraught as this rate hike cycle approaches its end. Tail risks, such as emerging market contagion, volatility in crude prices, or the new political landscape could also cause market dislocations. For now, the economy still looks fundamentally robust, with accelerating wage growth, strong Institute for Supply Management (ISM) surveys, and the fastest GDP growth since 2014.
In light of these competing narratives, we believe a neutral position with respect to interest rates is prudent at the moment. The Fund’s duration is close to its benchmark, with a slight bias to the shorter side in advance of further rate hikes. We are also close to neutral in terms of curve positioning, although again with a slight bias in favor of intermediates over the short end.
We continue to see value in spread product, particularly corporate bonds. With default rates at such low levels and corporations enjoying cycle-high profitability, we believe they offer a compelling alternative to Treasuries. In our view, valuations are approaching full levels, however, and at current spreads, lower-quality tiers merit caution. Increased M&A risk in certain sectors, debt-funded
21
AMG GW&K Core Bond Fund
Portfolio Manager’s Comments (continued)
shareholder returns, and exposure to rising input costs stand out as potential sources of volatility that need to be carefully monitored. Consequently, we continue to opportunistically upgrade the Fund’s portfolio by shifting toward higher quality and less cyclical credits. We have maintained a similarly
defensive posture within the mortgage-backed securities sector. We continue to favor higher coupon, lower duration pools to protect against the potential for spread widening and rate moves that may occur with the runoff of the Fed’s balance sheet.
The views expressed represent the opinions of GW&K Investment Management, LLC as of October 31, 2018, and are not intended as a forecast or guarantee of future results, and are subject to change without notice.
22
AMG GW&K Core Bond Fund
Portfolio Manager’s Comments (continued)
CUMULATIVE TOTAL RETURN PERFORMANCE
AMG GW&K Core Bond Fund’s cumulative total return is based on the daily change in net asset value (NAV), and assumes that all dividends and distributions were reinvested. This graph compares a hypothetical $10,000 investment made in the AMG GW&K Core Bond Fund’s Class I shares on October 31, 2008, to a $10,000 investment made in the Bloomberg Barclays U.S. Aggregate Bond Index® for the same time period. The graph and table do not reflect the deduction of taxes that a shareholder would pay on a Fund distribution or redemption of shares. The listed returns for the Fund are net of expenses and the returns for the index exclude expenses. Total returns would have been lower had certain expenses not been reduced.
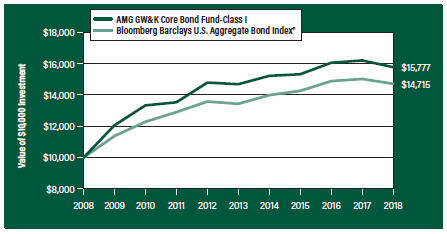
The table below shows the average annual total returns for the AMG GW&K Core Bond Fund and the Bloomberg Barclays U.S. Aggregate Bond Index® for the same time periods ended October 31, 2018.
| | | | | | | | | | | | | | | | | | | | |
| Average Annual Total Returns1 | | One
Year | | | Five
Years | | | Ten
Years | | | Since
Inception | | | Inception
Date | |
| AMG GW&K Core Bond Fund2, 3, 4, 5, 6, 7 | | | | | | | | | | | | | |
Class N | | | (2.79%) | | | | — | | | | — | | | | 0.38% | | | | 05/08/15 | |
Class I | | | (2.59%) | | | | 1.45% | | | | 4.67% | | | | 5.63% | | | | 04/30/93 | |
Class Z | | | (2.42%) | | | | — | | | | — | | | | 0.78% | | | | 05/08/15 | |
Bloomberg Barclays U.S. Aggregate Bond Index®8 | | | (2.05%) | | | | 1.83% | | | | 3.94% | | | | 5.07% | | | | 04/30/93 | † |
The performance data shown represents past performance. Past performance is not a guarantee of future results. Current performance may be lower or higher than the performance data quoted. The investment return and principal value of an investment will fluctuate so that an investor’s shares, when redeemed, may be worth more or less than their original cost.
Investors should carefully consider the Fund’s investment objectives, risks, charges and expenses before investing. For performance information through the most recent month end, current net asset values per share for the Fund and other information, please call 800.835.3879 or visit our website at amgfunds.com for a free prospectus. Read it carefully before investing or sending money.
Distributed by AMG Distributors, Inc., member FINRA/SIPC.
| † | Date reflects inception date of the Fund, not the index. |
| 1 | Total return equals income yield plus share price change and assumes reinvestment of all dividends and capital gain distributions. Returns are net of fees and may reflect offsets of Fund expenses as described in the prospectus. No adjustment has been made for taxes payable by shareholders on their reinvested dividends and capital gain distributions. Returns for periods greater than one year are annualized. The listed returns on the Fund are net of expenses and based on the published NAV as of October 31, 2018. All returns are in U.S. dollars ($). |
| 2 | From time to time, the Fund’s advisor has waived its fees and/or absorbed Fund expenses, which has resulted in higher returns. |
| 3 | To the extent that the Fund invests in asset-backed or mortgage-backed securities, its exposure to prepayment and extension risks may be greater than investments in other fixed income securities. |
| 4 | Active and frequent trading of a fund may result in higher transaction costs and increased tax liability. |
| 5 | The Fund is subject to the risks associated with investments in debt securities, such as default risk and fluctuations in the perception of the debtor’s ability to pay its creditors. Changing interest rates may adversely affect the value of an investment. An increase in interest rates typically causes the value of bonds and other fixed income securities to fall. |
| 6 | The Fund may invest in derivatives such as options and futures; the complexity and rapidly changing structure of derivatives markets may increase the possibility of market losses. |
| 7 | Many bonds have call provisions which allow the debtors to pay them back before maturity. This is especially true with mortgage securities, which can be paid back anytime. Typically debtors prepay their debt when it is to their advantage (when interest rates drop making a new loan at current rates more attractive), and thus likely to the disadvantage of bondholders, who may have to reinvest prepayment proceeds in securities with lower yields. Prepayment risk will vary depending on the provisions of the security and current interest rates relative to the interest rate of the debt. |
| 8 | The Bloomberg Barclays U.S. Aggregate Bond Index® is an index of the U.S. investment-grade fixed-rate bond market, including both government and corporate bonds. Unlike the Fund, the Bloomberg Barclays U.S. Aggregate Bond Index® is unmanaged, is not available for investment, and does not incur expenses. |
Source: Bloomberg Index Services Limited. BLOOMBERG® is a trademark and service mark of Bloomberg Finance L.P. and its affiliates (collectively “Bloomberg”). BARCLAYS® is a trademark and service mark of Barclays Bank Plc (collectively with its affiliates, “Barclays”), used under license. Bloomberg or Bloomberg’s licensors, including Barclays, own all proprietary rights in the Bloomberg Barclays Indices. Neither Bloomberg nor Barclays approves or endorses this material, or guarantees the accuracy or completeness of any information herein, or makes any warranty, express or implied, as to the results to
23
AMG GW&K Core Bond Fund
Portfolio Manager’s Comments (continued)
be obtained therefrom and, to the maximum extent allowed by law, neither shall have any liability or responsibility for injury or damages arising in connection therewith.
Not FDIC insured, nor bank guaranteed. May lose value.
24
AMG GW&K Core Bond Fund
Fund Snapshots (unaudited)
October 31, 2018
PORTFOLIO BREAKDOWN
| | | | |
Category | | %of
Net Assets | |
U.S. Government and Agency Obligations | | | 47.6 | |
Corporate Bonds and Notes | | | 43.7 | |
Municipal Bonds | | | 7.1 | |
Short-Term Investments | | | 0.8 | |
Other Assets Less Liabilities | | | 0.8 | |
| |
Rating | | % of Market Value1
| |
U.S. Government and Agency Obligations | | | 48.4 | |
Aaa | | | 1.3 | |
Aa | | | 14.1 | |
A | | | 19.9 | |
Baa | | | 16.3 | |
| 1 | Includes market value of fixed-income securities only. |
TOP TEN HOLDINGS
| | | | |
Security Name | | %of
Net Assets | |
United States Treasury Bonds, 6.250%, 08/15/23 | | | 5.7 | |
United States Treasury Notes, 2.000%, 11/30/22 | | | 5.3 | |
United States Treasury Bonds, 4.500%, 02/15/36 | | | 3.9 | |
Apple, Inc., 2.841%, 02/09/22 | | | 2.6 | |
Wells Fargo & Co., 3.268%, 02/11/22 | | | 2.6 | |
Fannie Mae Pool, 4.500%, 04/01/39 | | | 2.3 | |
Fannie Mae Pool, 4.500%, 06/01/41 | | | 2.3 | |
Fannie Mae Pool, 4.500%, 04/01/39 | | | 2.3 | |
Fannie Mae Pool, 5.000%, 02/01/34 | | | 2.3 | |
Fannie Mae Pool, 5.500%, 10/01/41 | | | 2.1 | |
| | | | |
Top Ten as a Group | | | 31.4 | |
| | | | |
Credit quality ratings shown above reflect the highest rating assigned by either Standard & Poor’s (“S&P”) or Moody’s Investors Service, Inc. (“Moody’s”). These rating agencies are independent, nationally recognized statistical rating organizations and are widely used. Investment grade ratings are credit ratings of BBB/Baa or higher. Below investment grade ratings are credit ratings of BB/Ba or lower. Investments designated N/R are not rated by either rating agency. Unrated investments do not necessarily indicate low credit quality. Credit quality ratings are subject to change.
Because a fund’s strategy may result in multiple investments in particular sectors of the economy, its performance may depend on the performance of those sectors and may fluctuate more widely than investments diversified across more sectors. For additional information on these and other risk considerations, please see the Fund’s prospectus.
Any sectors, industries, or securities discussed should not be perceived as investment recommendations. Mention of a specific security should not be considered a recommendation to buy or solicitation to sell that security. Specific securities mentioned in this report may have been sold from the Fund’s portfolio of investments by the time you receive this report.
25
AMG GW&K Core Bond Fund
Schedule of Portfolio Investments
October 31, 2018
| | | | | | | | |
| | | Principal
Amount | | | Value | |
Corporate Bonds and Notes—43.7% | | | | | | | | |
Financials—18.5% | | | | | | | | |
American Tower Corp. 3.375%, 10/15/26 | | $ | 2,268,000 | | | $ | 2,086,963 | |
Bank of America Corp., MTN 3.875%, 08/01/25 | | | 4,862,000 | | | | 4,787,882 | |
Berkshire Hathaway, Inc. 3.125%, 03/15/26 | | | 4,319,000 | | | | 4,115,640 | |
Citigroup, Inc. (3 month LIBOR + 1.023%) 4.044%, 06/01/241 | | | 4,664,000 | | | | 4,656,928 | |
Crown Castle International Corp. 5.250%, 01/15/23 | | | 4,548,000 | | | | 4,747,252 | |
Host Hotels & Resorts LP Series C 4.750%, 03/01/23 | | | 3,335,000 | | | | 3,391,168 | |
JPMorgan Chase & Co. 2.950%, 10/01/26 | | | 2,965,000 | | | | 2,719,776 | |
Morgan Stanley, GMTN 5.500%, 07/28/21 | | | 4,522,000 | | | | 4,739,548 | |
National Rural Utilities Cooperative Finance Corp., MTN 3.250%, 11/01/25 | | | 2,877,000 | | | | 2,784,609 | |
US Bancorp, MTN 2.950%, 07/15/22 | | | 5,612,000 | | | | 5,472,922 | |
Visa, Inc. 3.150%, 12/14/25 | | | 3,610,000 | | | | 3,476,611 | |
Wells Fargo & Co. (3 month LIBOR + 0.930%) 3.268%, 02/11/221 | | | 6,857,000 | | | | 6,915,001 | |
Total Financials | | | | | | | 49,894,300 | |
Industrials—25.2% | | | | | | | | |
AbbVie, Inc. 3.200%, 11/06/22 | | | 3,491,000 | | | | 3,413,318 | |
Advocate Health & Hospitals Corp.
4.272%, 08/15/48 | | | 2,760,000 | | | | 2,682,230 | |
Anheuser-Busch InBev Finance, Inc.
3.650%, 02/01/26 | | | 2,803,000 | | | | 2,668,770 | |
Apple, Inc. (3 month LIBOR + 0.500%) 2.841%, 02/09/221 | | | 6,827,000 | | | | 6,918,972 | |
AT&T, Inc. 3.200%, 03/01/22 | | | 5,600,000 | | | | 5,506,331 | |
Automatic Data Processing, Inc. 3.375%, 09/15/25 | | | 4,178,000 | | | | 4,141,731 | |
Burlington Northern Santa Fe LLC 6.150%, 05/01/37 | | | 2,741,000 | | | | 3,262,797 | |
CVS Health Corp. 5.125%, 07/20/45 | | | 2,655,000 | | | | 2,613,599 | |
| | | | | | | | |
| | | Principal
Amount | | | Value | |
Fidelity National Information Services, Inc. 5.000%, 10/15/25 | | $ | 2,580,000 | | | $ | 2,694,129 | |
General Motors Financial Co., Inc. 4.250%, 05/15/23 | | | 2,718,000 | | | | 2,690,093 | |
The George Washington University Series 2018 4.126%, 09/15/48 | | | 4,199,000 | | | | 4,063,797 | |
Georgia-Pacific LLC 8.000%, 01/15/24 | | | 2,198,000 | | | | 2,615,420 | |
International Paper Co. 3.000%, 02/15/27 | | | 5,289,000 | | | | 4,770,152 | |
Kaiser Foundation Hospitals 3.150%, 05/01/27 | | | 2,915,000 | | | | 2,759,108 | |
McDonald’s Corp., MTN 3.700%, 01/30/26 | | | 3,450,000 | | | | 3,371,266 | |
Microsoft Corp. 3.750%, 02/12/45 | | | 3,541,000 | | | | 3,294,975 | |
Oracle Corp. 3.800%, 11/15/37 | | | 2,816,000 | | | | 2,571,955 | |
Owens Corning 4.200%, 12/15/22 | | | 3,391,000 | | | | 3,384,134 | |
Walmart, Inc. 4.050%, 06/29/48 | | | 2,075,000 | | | | 1,978,402 | |
The Walt Disney Co., MTN 2.950%, 06/15/27 | | | 2,900,000 | | | | 2,728,583 | |
Total Industrials | | | | | | | 68,129,762 | |
Total Corporate Bonds and Notes | | | | | |
(Cost $122,987,429) | | | | | | | 118,024,062 | |
Municipal Bonds—7.1% | | | | | | | | |
Los Angeles Unified School District 5.750%, 07/01/34 | | | 3,895,000 | | | | 4,496,544 | |
State of California 7.550%, 04/01/39 | | | 3,695,000 | | | | 5,259,611 | |
New Jersey Transportation Trust Fund Authority 5.754%, 12/15/28 | | | 3,140,000 | | | | 3,433,778 | |
Metropolitan Transportation Authority 6.687%, 11/15/40 | | | 2,605,000 | | | | 3,347,868 | |
JobsOhio Beverage System 4.532%, 01/01/35 | | | 2,550,000 | | | | 2,669,289 | |
Total Municipal Bonds
(Cost $20,091,986) | | | | | | | 19,207,090 | |
U.S. Government and Agency Obligations —47.6% | | | | | | | | |
Fannie Mae—26.0% | | | | | | | | |
| | | | | | | | |
Fannie Mae Pool | | | | | | | | |
3.000%, 09/01/46 | | | 583,683 | | | | 553,942 | |
3.500%, 07/01/28 to 02/01/46 | | | 10,786,132 | | | | 10,690,704 | |
4.000%, 03/01/44 to 02/01/47 | | | 7,824,204 | | | | 7,883,509 | |
4.500%, 04/01/39 to 06/01/46 | | | 26,812,813 | | | | 27,757,311 | |
5.000%, 02/01/34 to 08/01/40 | | | 11,630,184 | | | | 12,306,916 | |
The accompanying notes are an integral part of these financial statements.
26
AMG GW&K Core Bond Fund
Schedule of Portfolio Investments (continued)
| | | | | | | | |
| | | Principal
Amount | | | Value | |
Fannie Mae—26.0% (continued) | | | | | | | | |
Fannie Mae Pool | | $ | 10,463,061 | | | $ | 11,221,856 | |
5.500%, 08/01/37 to 10/01/41 | | | | | | | | |
Total Fannie Mae | | | | | | | 70,414,238 | |
Freddie Mac—4.1% | | | | | | | | |
Freddie Mac Gold Pool | | | | | | | | |
3.000%, 06/01/43 | | | 384,609 | | | | 367,361 | |
3.500%, 11/01/25 to 05/01/44 | | | 4,547,395 | | | | 4,534,095 | |
4.000%, 05/01/26 | | | 214,737 | | | | 218,362 | |
5.000%, 01/01/40 to 07/01/44 | | | 5,621,400 | | | | 5,932,740 | |
Total Freddie Mac | | | | | | | 11,052,558 | |
U.S. Treasury Obligations—17.5% | | | | | | | | |
U.S. Treasury Notes | | | | | | | | |
1.750%, 03/31/22 | | | 2,848,000 | | | | 2,737,417 | |
United States Treasury Notes | | | | | | | | |
2.000%, 11/30/22 | | | 14,897,000 | | | | 14,343,891 | |
(U.S. Treasury 3 month Bill Money Market Yield + 0.000%), 2.334%, 01/31/201 | | | 4,195,000 | | | | 4,196,043 | |
United States Treasury Bonds | | | | | | | | |
4.500%, 02/15/36 | | | 9,060,000 | | | | 10,552,600 | |
6.250%, 08/15/23 | | | 13,486,000 | | | | 15,448,582 | |
Total U.S. Treasury Obligations | | | | | | | 47,278,533 | |
Total U.S. Government and Agency Obligations | | | | | | | | |
(Cost $134,561,040) | | | | | | | 128,745,329 | |
| 1 | Variable rate security. The rate shown is based on the latest available information as of October 31, 2018. |
| 2 | Yield shown represents the October 31, 2018, seven day average yield, which refers to the sum of the previous seven days’ dividends paid, expressed as an annual percentage. |
| | | | | | | | |
| | | Shares | | | Value | |
Short-Term Investments—0.8% | | | | | | | | |
Other Investment Companies—0.8% | | | | | | | | |
Dreyfus Government Cash Management Fund, | | | | | | | | |
Institutional Class Shares, 2.05%2 | | | 717,661 | | | $ | 717,661 | |
Dreyfus Institutional Preferred Government | | | | | | | | |
Money Market Fund, Institutional | | | | | | | | |
Class Shares, 2.12%2 | | | 717,662 | | | | 717,662 | |
JPMorgan U.S. Government Money Market Fund, | | | | | | | | |
IM Shares, 2.09%2 | | | 739,409 | | | | 739,409 | |
Total Short-Term Investments | | | | | | | | |
(Cost $2,174,732) | | | | | | | 2,174,732 | |
Total Investments—99.2% | | | | | | | | |
(Cost $279,815,187) | | | | | | | 268,151,213 | |
Other Assets, less Liabilities—0.8% | | | | | | | 2,150,765 | |
Net Assets—100.0% | | | | | | $ | 270,301,978 | |
| | |
| GMTN | | Global Medium-Term Notes |
| LIBOR | | London Interbank Offered Rate |
| LP | | Limited Partnership |
| MTN | | Medium-Term Note |
The following table summarizes the inputs used to value the Fund’s investments by the fair value hierarchy levels as of October 31, 2018:
| | | | | | | | | | | | | | | | |
| | | Level 1 | | | Level 2 | | | Level 3 | | | Total | |
Investments in Securities | | | | | | | | | | | | | | | | |
Corporate Bonds and Notes† | | | — | | | $ | 118,024,062 | | | | — | | | $ | 118,024,062 | |
Municipal Bonds | | | — | | | | 19,207,090 | | | | — | | | | 19,207,090 | |
U.S. Government and Agency Obligations† | | | — | | | | 128,745,329 | | | | — | | | | 128,745,329 | |
Short-Term Investments | | | | | | | | | | | | | | | | |
Other Investment Companies | | $ | 2,174,732 | | | | — | | | | — | | | | 2,174,732 | |
| | | | | | | | | | | | | | | | |
Total Investments in Securities | | $ | 2,174,732 | | | $ | 265,976,481 | | | | — | | | $ | 268,151,213 | |
| | | | | | | | | | | | | | | | |
| † | All corporate bonds and notes and U.S. government and agency obligations held in the Fund are Level 2 securities. For a detailed breakout of corporate bonds and notes and U.S. government and agency obligations by major industry or agency classification, please refer to the Fund’s Schedule of Portfolio Investments. |
As of October 31, 2018, the Fund had no transfers between levels from the beginning of the reporting period.
The accompanying notes are an integral part of these financial statements.
27
Statement of Assets and Liabilities
October 31, 2018
| | | | | | | | | | | | |
| | | AMG Frontier
Small Cap
Growth Fund | | | AMG Managers
Emerging
Opportunities Fund | | | AMG GW&K Core
Bond Fund | |
Assets: | | | | | | | | | | | | |
Investments at Value 1 (including securities on loan valued at $5,016,352, $31,464,308, and $0, respectively) | | $ | 17,991,284 | | | $ | 176,780,021 | | | $ | 268,151,213 | |
Repurchase Agreements at value2 | | | 1,978,102 | | | | 16,162,515 | | | | — | |
Receivable for investments sold | | | 848,669 | | | | 565,250 | | | | 429,601 | |
Dividend, interest and other receivables | | | 5,657 | | | | 54,358 | | | | 2,255,099 | |
Receivable for Fund shares sold | | | 200 | | | | 79,424 | | | | 2,231 | |
Receivable from affiliate | | | 5,083 | | | | 10,386 | | | | 9,286 | |
Prepaid expenses and other assets | | | 13,266 | | | | 17,763 | | | | 18,520 | |
Total assets | | | 20,842,261 | | | | 193,669,717 | | | | 270,865,950 | |
Liabilities: | | | | | | | | | | | | |
Payable upon return of securities loaned | | | 1,978,102 | | | | 16,162,515 | | | | — | |
Payable for investments purchased | | | 283,812 | | | | 291,829 | | | | — | |
Payable for Fund shares repurchased | | | 5,243 | | | | 38,978 | | | | 346,615 | |
Accrued expenses: | | | | | | | | | | | | |
Investment advisory and management fees | | | 11,999 | | | | 157,144 | | | | 69,613 | |
Administrative fees | | | 2,571 | | | | 23,572 | | | | 34,806 | |
Distribution fees | | | 125 | | | | — | | | | 123 | |
Shareholder service fees | | | 400 | | | | 32,964 | | | | 25,856 | |
Professional fees | | | 27,753 | | | | 30,931 | | | | 50,790 | |
Other | | | 12,008 | | | | 27,452 | | | | 36,169 | |
Total liabilities | | | 2,322,013 | | �� | | 16,765,385 | | | | 563,972 | |
Net Assets | | $ | 18,520,248 | | | $ | 176,904,332 | | | $ | 270,301,978 | |
1 Investments at cost | | $ | 16,608,371 | | | $ | 137,267,124 | | | $ | 279,815,187 | |
2 Repurchase agreements at cost | | $ | 1,978,102 | | | $ | 16,162,515 | | | | — | |
The accompanying notes are an integral part of these financial statements.
28
Statement of Assets and Liabilities (continued)
| | | | | | | | | | | | |
| | | AMG Frontier
Small Cap
Growth Fund | | | AMG Managers
Emerging
Opportunities Fund | | | AMG GW&K Core
Bond Fund | |
Net Assets Represent: | | | | | | | | | | | | |
Paid-in capital | | $ | 12,090,251 | | | $ | 107,548,207 | | | $ | 285,733,929 | |
Total distributable earnings (loss) | | | 6,429,997 | | | | 69,356,125 | | | | (15,431,951 | ) |
Net Assets | | $ | 18,520,248 | | | $ | 176,904,332 | | | $ | 270,301,978 | |
| | | |
Class N: | | | | | | | | | | | | |
Net Assets | | $ | 553,207 | | | $ | 148,419,241 | | | $ | 502,100 | |
Shares outstanding | | | 47,321 | | | | 3,061,308 | | | | 51,934 | |
Net asset value, offering and redemption price per share | | $ | 11.69 | | | $ | 48.48 | | | $ | 9.67 | |
Class I: | | | | | | | | | | | | |
Net Assets | | $ | 11,549,407 | | | $ | 28,485,091 | | | $ | 264,795,229 | |
Shares outstanding | | | 960,601 | | | | 579,028 | | | | 27,377,303 | |
Net asset value, offering and redemption price per share | | $ | 12.02 | | | $ | 49.19 | | | $ | 9.67 | |
Class Z: | | | | | | | | | | | | |
Net Assets | | $ | 6,417,634 | | | | — | | | $ | 5,004,649 | |
Shares outstanding | | | 521,390 | | | | — | | | | 517,662 | |
Net asset value, offering and redemption price per share | | $ | 12.31 | | | | — | | | $ | 9.67 | |
The accompanying notes are an integral part of these financial statements.
29
Statement of Operations
For the fiscal year ended October 31, 2018
| | | | | | | | | | | | |
| | | AMG Frontier
Small Cap
Growth Fund | | | AMG Managers
Emerging
Opportunities Fund | | | AMG GW&K Core
Bond Fund | |
Investment Income: | | | | | | | | | | | | |
Dividend income | | $ | 97,216 | | | $ | 1,150,912 | | | $ | 63,858 | |
Interest income | | | — | | | | — | | | | 8,181,799 | |
Securities lending income | | | 16,331 | | | | 284,176 | | | | — | |
Foreign withholding tax | | | (268 | ) | | | (4,015 | ) | | | — | |
Total investment income | | | 113,279 | | | | 1,431,073 | | | | 8,245,657 | |
Expenses: | | | | | | | | | | | | |
Investment advisory and management fees | | | 144,372 | | | | 1,836,672 | | | | 897,595 | |
Administrative fees | | | 30,937 | | | | 275,501 | | | | 448,798 | |
Distribution fees—Class N | | | 1,126 | | | | — | | | | 821 | |
Shareholder servicing fees—Class N | | | 676 | | | | 391,238 | | | | 492 | |
Shareholder servicing fees—Class I | | | 13,466 | | | | — | | | | 226,146 | |
Registration fees | | | 45,679 | | | | 34,302 | | | | 47,836 | |
Professional fees | | | 28,763 | | | | 36,361 | | | | 57,310 | |
Custodian fees | | | 27,813 | | | | 39,608 | | | | 28,278 | |
Transfer agent fees | | | 6,631 | | | | 31,783 | | | | 27,330 | |
Reports to shareholders | | | 3,459 | | | | 24,945 | | | | 43,750 | |
Trustee fees and expenses | | | 1,323 | | | | 12,180 | | | | 21,504 | |
Miscellaneous | | | 3,124 | | | | 6,029 | | | | 9,765 | |
Total expenses before offsets | | | 307,369 | | | | 2,688,619 | | | | 1,809,625 | |
Expense reimbursements | | | (105,483 | ) | | | (130,107 | ) | | | (146,013 | ) |
Expense reductions | | | — | | | | (31,608 | ) | | | — | |
Net expenses | | | 201,886 | | | | 2,526,904 | | | | 1,663,612 | |
Net investment income (loss) | | | (88,607 | ) | | | (1,095,831 | ) | | | 6,582,045 | |
Net Realized and Unrealized Gain (Loss): | | | | | | | | | | | | |
Net realized gain (loss) on investments | | | 5,566,378 | | | | 32,625,998 | | | | (1,658,735 | ) |
Net change in unrealized appreciation/depreciation on investments | | | (2,987,833 | ) | | | (16,727,914 | ) | | | (12,727,480 | ) |
Net realized and unrealized gain (loss) | | | 2,578,545 | | | | 15,898,084 | | | | (14,386,215 | ) |
Net increase (decrease) in net assets resulting from operations | | $ | 2,489,938 | | | $ | 14,802,253 | | | $ | (7,804,170 | ) |
The accompanying notes are an integral part of these financial statements.
30
Statements of Changes in Net Assets
For the fiscal years ended October 31,
| | | | | | | | | | | | | | | | | | | | | | | | |
| | | AMG Frontier Small Cap
Growth Fund | | | AMG Managers Emerging
Opportunities Fund | | | AMG GW&K Core
Bond Fund | |
| | | 2018 | | | 2017 | | | 2018 | | | 20171 | | | 2018 | | | 2017 | |
Increase (Decrease) in Net Assets Resulting From Operations: | | | | | | | | | | | | | | | | | | | | | | | | |
Net investment income (loss) | | $ | (88,607 | ) | | $ | (108,085 | ) | | $ | (1,095,831 | ) | | $ | (947,619 | ) | | $ | 6,582,045 | | | $ | 7,634,064 | |
Net realized gain (loss) on investments | | | 5,566,378 | | | | 4,355,813 | | | | 32,625,998 | | | | 21,684,274 | | | | (1,658,735 | ) | | | (917,994 | ) |
Net change in unrealized appreciation/depreciation on investments | | | (2,987,833 | ) | | | 627,199 | | | | (16,727,914 | ) | | | 28,112,689 | | | | (12,727,480 | ) | | | (4,801,128 | ) |
Net increase (decrease) in net assets resulting from operations | | | 2,489,938 | | | | 4,874,927 | | | | 14,802,253 | | | | 48,849,344 | | | | (7,804,170 | ) | | | 1,914,942 | |
Distributions to Shareholders:2 | | | | | | | | | | | | | | | | | | | | | | | | |
Class N | | | (74,443 | ) | | | (680 | ) | | | (16,730,534 | ) | | | (474,506 | ) | | | (6,701 | ) | | | (3,147 | ) |
Class I | | | (2,421,844 | ) | | | (43,105 | ) | | | (2,696,048 | ) | | | (95,766 | ) | | | (6,491,282 | ) | | | (7,469,075 | ) |
Class Z | | | (1,606,835 | ) | | | (40,815 | ) | | | — | | | | — | | | | (121,411 | ) | | | (121,102 | ) |
Total distributions to shareholders | | | (4,103,122 | ) | | | (84,600 | ) | | | (19,426,582 | ) | | | (570,272 | ) | | | (6,619,394 | ) | | | (7,593,324 | ) |
Capital Share Transactions:3 | | | | | | | | | | | | | | | | | | | | | | | | |
Net increase (decrease) from capital share transactions | | | 1,559,658 | | | | (5,047,285 | ) | | | 8,639,116 | | | | (24,561,311 | ) | | | (46,865,335 | ) | | | (83,092,352 | ) |
Total increase (decrease) in net assets | | | (53,526 | ) | | | (256,958 | ) | | | 4,014,787 | | | | 23,717,761 | | | | (61,288,899 | ) | | | (88,770,734 | ) |
Net Assets: | | | | | | | | | | | | | | | | | | | | | | | | |
Beginning of year | | | 18,573,774 | | | | 18,830,732 | | | | 172,889,545 | | | | 149,171,784 | | | | 331,590,877 | | | | 420,361,611 | |
End of year4 | | $ | 18,520,248 | | | $ | 18,573,774 | | | $ | 176,904,332 | | | $ | 172,889,545 | | | $ | 270,301,978 | | | $ | 331,590,877 | |
| 1 | Effective February 27, 2017, the Fund’s share classes were renamed as described in Note 1 of the Notes to the Financial Statements. |
| 2 | See Note 1(d) of the Notes to Financial Statements. |
| 3 | See Note 1(g) of the Notes to Financial Statements. |
| 4 | Net assets—End of year includes undistributed (distributions in excess of) net investment income of $0, $(162,605) and $131,951 for AMG Frontier Small Cap Growth Fund, AMG Managers Emerging Opportunities Fund and AMG GW&K Core Bond Fund, respectively, in 2017. During 2018, the requirement to disclose undistributed net investment income was eliminated. |
The accompanying notes are an integral part of these financial statements.
31
AMG Frontier Small Cap Growth Fund
Financial Highlights
For a share outstanding throughout each fiscal year
| | | | | | | | | | | | | | | | | | | | |
| | | For the fiscal years ended October 31, | |
| Class N | | 2018 | | | 2017 | | | 20161 | | | 2015 | | | 2014 | |
Net Asset Value, Beginning of Year | | $ | 13.20 | | | $ | 10.29 | | | $ | 13.57 | | | $ | 25.12 | | | $ | 26.26 | |
Income (loss) from Investment Operations: | | | | | | | | | | | | | | | | | | | | |
Net investment loss2,3 | | | (0.09 | ) | | | (0.11 | ) | | | (0.06 | )4 | | | (0.12 | ) | | | (0.21 | )5 |
Net realized and unrealized gain (loss) on investments | | | 1.58 | | | | 3.07 | | | | (0.22 | ) | | | 0.19 | | | | 2.05 | |
Total income (loss) from investment operations | | | 1.49 | | | | 2.96 | | | | (0.28 | ) | | | 0.07 | | | | 1.84 | |
Less Distributions to Shareholders from: | | | | | | | | | | | | | | | | | | | | |
Net realized gain on investments | | | (3.00 | ) | | | (0.05 | ) | | | (3.00 | ) | | | (11.62 | ) | | | (2.98 | ) |
Total distributions to shareholders | | | (3.00 | ) | | | (0.05 | ) | | | (3.00 | ) | | | (11.62 | ) | | | (2.98 | ) |
Net Asset Value, End of Year | | $ | 11.69 | | | $ | 13.20 | | | $ | 10.29 | | | $ | 13.57 | | | $ | 25.12 | |
Total Return3 | | | 13.81 | %6 | | | 28.82 | %6 | | | (3.01 | )%6 | | | (3.06 | )% | | | 7.24 | % |
Ratio of net expenses to average net assets | | | 1.30 | % | | | 1.43 | % | | | 1.55 | % | | | 1.55 | % | | | 1.55 | % |
Ratio of gross expenses to average net assets7 | | | 1.81 | % | | | 2.01 | % | | | 1.95 | % | | | 1.81 | % | | | 1.74 | % |
Ratio of net investment loss to average net assets3 | | | (0.76 | )% | | | (0.93 | )% | | | (0.58 | )% | | | (0.76 | )% | | | (0.86 | )% |
Portfolio turnover | | | 233 | % | | | 99 | % | | | 70 | % | | | 99 | % | | | 63 | % |
Net assets end of year (000’s) omitted | | $ | 553 | | | $ | 210 | | | $ | 147 | | | $ | 179 | | | $ | 365 | |
| | | | | | | | | | | | | | | | | | | | |
32
AMG Frontier Small Cap Growth Fund
Financial Highlights
For a share outstanding throughout each fiscal year
| | | | | | | | | | | | | | | | | | | | |
| | | For the fiscal years ended October 31, | |
| Class I | | 2018 | | | 2017 | | | 20161 | | | 2015 | | | 2014 | |
Net Asset Value, Beginning of Year | | $ | 13.46 | | | $ | 10.46 | | | $ | 13.76 | | | $ | 25.40 | | | $ | 26.48 | |
Income (loss) from Investment Operations: | | | | | | | | | | | | | | | | | | | | |
Net investment loss2,3 | | | (0.06 | ) | | | (0.08 | ) | | | (0.03 | )4 | | | (0.08 | ) | | | (0.15 | )5 |
Net realized and unrealized gain (loss) on investments | | | 1.62 | | | | 3.13 | | | | (0.23 | ) | | | 0.20 | | | | 2.08 | |
Total income (loss) from investment operations | | | 1.56 | | | | 3.05 | | | | (0.26 | ) | | | 0.12 | | | | 1.93 | |
Less Distributions to Shareholders from: | | | | | | | | | | | | | | | | | | | | |
Net realized gain on investments | | | (3.00 | ) | | | (0.05 | ) | | | (3.04 | ) | | | (11.76 | ) | | | (3.01 | ) |
Total distributions to shareholders | | | (3.00 | ) | | | (0.05 | ) | | | (3.04 | ) | | | (11.76 | ) | | | (3.01 | ) |
Net Asset Value, End of Year | | $ | 12.02 | | | $ | 13.46 | | | $ | 10.46 | | | $ | 13.76 | | | $ | 25.40 | |
Total Return3 | | | 14.12 | %6 | | | 29.22 | %6 | | | (2.77 | )%6 | | | (2.78 | )% | | | 7.54 | % |
Ratio of net expenses to average net assets | | | 1.01 | % | | | 1.15 | % | | | 1.29 | % | | | 1.28 | % | | | 1.28 | % |
Ratio of gross expenses to average net assets7 | | | 1.52 | % | | | 1.73 | % | | | 1.69 | % | | | 1.55 | % | | | 1.47 | % |
Ratio of net investment loss to average net assets3 | | | (0.46 | )% | | | (0.65 | )% | | | (0.32 | )% | | | (0.51 | )% | | | (0.59 | )% |
Portfolio turnover | | | 233 | % | | | 99 | % | | | 70 | % | | | 99 | % | | | 63 | % |
Net assets end of year (000’s) omitted | | $ | 11,549 | | | $ | 11,009 | | | $ | 9,570 | | | $ | 12,671 | | | $ | 14,842 | |
| | | | | | | | | | | | | | | | | | | | |
33
AMG Frontier Small Cap Growth Fund
Financial Highlights
For a share outstanding throughout each fiscal year
| | | | | | | | | | | | | | | | | | | | |
| | | For the fiscal years ended October 31, | |
| Class Z | | 2018 | | | 2017 | | | 20161 | | | 2015 | | | 2014 | |
Net Asset Value, Beginning of Year | | $ | 13.70 | | | $ | 10.63 | | | $ | 13.95 | | | $ | 25.69 | | | $ | 26.72 | |
Income (loss) from Investment Operations: | | | | | | | | | | | | | | | | | | | | |
Net investment loss2,3 | | | (0.05 | ) | | | (0.06 | ) | | | (0.01 | )4 | | | (0.05 | ) | | | (0.09 | )5 |
Net realized and unrealized gain (loss) on investments | | | 1.66 | | | | 3.18 | | | | (0.22 | ) | | | 0.21 | | | | 2.10 | |
Total income (loss) from investment operations | | | 1.61 | | | | 3.12 | | | | (0.23 | ) | | | 0.16 | | | | 2.01 | |
Less Distributions to Shareholders from: | | | | | | | | | | | | | | | | | | | | |
Net realized gain on investments | | | (3.00 | ) | | | (0.05 | ) | | | (3.09 | ) | | | (11.90 | ) | | | (3.04 | ) |
Total distributions to shareholders | | | (3.00 | ) | | | (0.05 | ) | | | (3.09 | ) | | | (11.90 | ) | | | (3.04 | ) |
Net Asset Value, End of Year | | $ | 12.31 | | | $ | 13.70 | | | $ | 10.63 | | | $ | 13.95 | | | $ | 25.69 | |
Total Return3 | | | 14.26 | %6 | | | 29.42 | %6 | | | (2.53 | )%6 | | | (2.55 | )% | | | 7.78 | % |
Ratio of net expenses to average net assets | | | 0.90 | % | | | 1.00 | % | | | 1.05 | % | | | 1.05 | % | | | 1.05 | % |
Ratio of gross expenses to average net assets7 | | | 1.41 | % | | | 1.58 | % | | | 1.44 | % | | | 1.32 | % | | | 1.24 | % |
Ratio of net investment loss to average net assets3 | | | (0.36 | )% | | | (0.50 | )% | | | (0.10 | )% | | | (0.28 | )% | | | (0.34 | )% |
Portfolio turnover | | | 233 | % | | | 99 | % | | | 70 | % | | | 99 | % | | | 63 | % |
Net assets end of year (000’s) omitted | | $ | 6,418 | | | $ | 7,354 | | | $ | 9,114 | | | $ | 16,366 | | | $ | 21,070 | |
| | | | | | | | | | | | | | | | | | | | |
| 1 | Effective October 1, 2016, the Investor Class, Service Class and Institutional Class were renamed Class N, Class I and Class Z, respectively. |
| 2 | Per share numbers have been calculated using average shares. |
| 3 | Total returns and net investment income (loss) would have been lower had certain expenses not been offset. |
| 4 | Includes non-recurring dividends. Without these dividends, net investment loss per share would have been $(0.09), $(0.06), and $(0.04) for Class N, Class I and Class Z shares, respectively. |
| 5 | Includes non-recurring dividends. Without these dividends, net investment loss per share would have been $(0.22), $(0.16), and $(0.10) for Class N, Class I and Class Z shares, respectively. |
| 6 | The total return is calculated using the published Net Asset Value as of fiscal year end. |
| 7 | Excludes the impact of expense reimbursement or fee waivers and expense reductions such as brokerage credits, but includes expense repayments and non-reimbursable expenses, if any, such as interest, taxes, and extraordinary expenses. (See Note 1(c) and 2 in the Notes to Financial Statements.) |
34
AMG Managers Emerging Opportunities Fund
Financial Highlights
For a share outstanding throughout each fiscal year
| | | | | | | | | | | | | | | | | | | | |
| | | For the fiscal years ended October 31, | |
| Class N | | 2018 | | | 20171 | | | 20162 | | | 2015 | | | 2014 | |
Net Asset Value, Beginning of Year | | $ | 50.06 | | | $ | 37.09 | | | $ | 40.76 | | | $ | 47.11 | | | $ | 51.19 | |
Income (loss) from Investment Operations: | | | | | | | | | | | | | | | | | | | | |
Net investment loss3,4 | | | (0.32 | ) | | | (0.27 | )5 | | | (0.17 | )6 | | | (0.24 | )7 | | | (0.29 | )8 |
Net realized and unrealized gain (loss) on investments | | | 4.45 | | | | 13.38 | | | | 1.02 | | | | (0.79 | ) | | | 3.01 | |
Total income (loss) from investment operations | | | 4.13 | | | | 13.11 | | | | 0.85 | | | | (1.03 | ) | | | 2.72 | |
Less Distributions to Shareholders from: | | | | | | | | | | | | | | | | | | | | |
Net investment income | | | — | | | | — | | | | — | | | | — | | | | — | |
Net realized gain on investments | | | (5.71 | ) | | | (0.14 | ) | | | (4.52 | ) | | | (5.32 | ) | | | (6.80 | ) |
Total distributions to shareholders | | | (5.71 | ) | | | (0.14 | ) | | | (4.52 | ) | | | (5.32 | ) | | | (6.80 | ) |
Net Asset Value, End of Year | | $ | 48.48 | | | $ | 50.06 | | | $ | 37.09 | | | $ | 40.76 | | | $ | 47.11 | |
Total Return4,9 | | | 8.82 | % | | | 35.43 | % | | | 2.50 | % | | | (3.01 | )% | | | 5.09 | % |
Ratio of net expenses to average net assets10 | | | 1.41 | % | | | 1.42 | % | | | 1.41 | % | | | 1.42 | % | | | 1.41 | %11 |
Ratio of gross expenses to average net assets12 | | | 1.50 | % | | | 1.51 | % | | | 1.62 | % | | | 1.61 | % | | | 1.61 | %11 |
Ratio of net investment loss to average net assets4 | | | (0.63 | )% | | | (0.62 | )% | | | (0.47 | )% | | | (0.55 | )% | | | (0.61 | )%11 |
Portfolio turnover | | | 55 | % | | | 58 | % | | | 72 | % | | | 89 | % | | | 98 | % |
Net assets end of year (000’s) omitted | | $ | 148,419 | | | $ | 148,915 | | | $ | 124,045 | | | $ | 145,980 | | | $ | 169,398 | |
| | | | | | | | | | | | | | | | | | | | |
35
AMG Managers Emerging Opportunities Fund
Financial Highlights
For a share outstanding throughout each fiscal year
| | | | | | | | | | | | | | | | | | | | |
| | | For the fiscal years ended October 31, | |
| Class I | | 2018 | | | 2017 | | | 20162 | | | 2015 | | | 2014 | |
Net Asset Value, Beginning of Year | | $ | 50.60 | | | $ | 37.40 | | | $ | 41.05 | | | $ | 47.32 | | | $ | 51.31 | |
Income (loss) from Investment Operations: | | | | | | | | | | | | | | | | | | | | |
Net investment loss3,4 | | | (0.20 | ) | | | (0.16 | )5 | | | (0.08 | )6 | | | (0.13 | )7 | | | (0.17 | )8 |
Net realized and unrealized gain (loss) on investments | | | 4.50 | | | | 13.51 | | | | 1.02 | | | | (0.80 | ) | | | 3.00 | |
Total income (loss) from investment operations | | | 4.30 | | | | 13.35 | | | | 0.94 | | | | (0.93 | ) | | | 2.83 | |
Less Distributions to Shareholders from: | | | | | | | | | | | | | | | | | | | | |
Net investment income | | | — | | | | — | | | | (0.04 | ) | | | — | | | | — | |
Net realized gain on investments | | | (5.71 | ) | | | (0.15 | ) | | | (4.55 | ) | | | (5.34 | ) | | | (6.82 | ) |
Total distributions to shareholders | | | (5.71 | ) | | | (0.15 | ) | | | (4.59 | ) | | | (5.34 | ) | | | (6.82 | ) |
Net Asset Value, End of Year | | $ | 49.19 | | | $ | 50.60 | | | $ | 37.40 | | | $ | 41.05 | | | $ | 47.32 | |
Total Return4,9 | | | 9.09 | % | | | 35.80 | % | | | 2.73 | % | | | (2.76 | )% | | | 5.33 | % |
Ratio of net expenses to average net assets10 | | | 1.16 | % | | | 1.17 | % | | | 1.16 | % | | | 1.17 | % | | | 1.16 | %11 |
Ratio of gross expenses to average net assets12 | | | 1.25 | % | | | 1.26 | % | | | 1.37 | % | | | 1.36 | % | | | 1.36 | %11 |
Ratio of net investment loss to average net assets4 | | | (0.38 | )% | | | (0.37 | )% | | | (0.22 | )% | | | (0.30 | )% | | | (0.36 | )%11 |
Portfolio turnover | | | 55 | % | | | 58 | % | | | 72 | % | | | 89 | % | | | 98 | % |
Net assets end of year (000’s) omitted | | $ | 28,485 | | | $ | 23,974 | | | $ | 25,127 | | | $ | 31,111 | | | $ | 35,282 | |
| | | | | | | | | | | | | | | | | | | | |
| 1 | Effective February 27, 2017, Class S was renamed Class N. |
| 2 | Effective October 1, 2016, the Service Class and Institutional Class were renamed Class S and Class I, respectively. |
| 3 | Per share numbers have been calculated using average shares. |
| 4 | Total returns and net investment income (loss) would have been lower had certain expenses not been offset. |
| 5 | Includes non-recurring dividends. Without these dividends, net investment loss per share would have been $(0.34) and $(0.23) for Class N and Class I shares, respectively. |
| 6 | Includes non-recurring dividends. Without these dividends, net investment loss per share would have been $(0.24) and $(0.15) for Class N and Class I shares, respectively. |
| 7 | Includes non-recurring dividends. Without these dividends, net investment loss per share would have been $(0.30) and $(0.19) for Class N and Class I shares, respectively. |
| 8 | Includes non-recurring dividends. Without these dividends, net investment loss per share would have been $(0.33) and $(0.21) for Class N and Class I shares, respectively. |
| 9 | The total return is calculated using the published Net Asset Value as of fiscal year end. |
| 10 | Includes reduction from broker recapture amounting to 0.02%, 0.01%, 0.02% and 0.03% for the fiscal years ended 2018, 2017, 2016 and 2014, respectively. |
| 11 | Includes tax expense of $23,725 or 0.01%. |
| 12 | Excludes the impact of expense reimbursement or fee waivers and expense reductions such as brokerage credits, but includes expense repayments and non-reimbursable expenses, if any, such as interest, taxes, and extraordinary expenses. (See Note 1(c) and 2 in the Notes to Financial Statements.) |
36
AMG GW&K Core Bond Fund
Financial Highlights
For a share outstanding throughout each fiscal period
| | | | | | | | | | | | | | | | |
| | | For the fiscal years ended October 31, | | | For the fiscal period ended October 31, | |
| Class N | | 2018 | | | 2017 | | | 20161 | | | 20152 | |
Net Asset Value, Beginning of Period | | $ | 10.14 | | | $ | 10.26 | | | $ | 10.23 | | | $ | 10.39 | |
Income (loss) from Investment Operations: | | | | | | | | | | | | | | | | |
Net investment income3,4 | | | 0.18 | | | | 0.18 | | | | 0.16 | | | | 0.08 | |
Net realized and unrealized gain (loss) on investments | | | (0.46 | ) | | | (0.12 | ) | | | 0.28 | | | | (0.16 | ) |
Total income (loss) from investment operations | | | (0.28 | ) | | | 0.06 | | | | 0.44 | | | | (0.08 | ) |
Less Distributions to Shareholders from: | | | | | | | | | | | | | | | | |
Net investment income | | | (0.19 | ) | | | (0.18 | ) | | | (0.17 | ) | | | (0.08 | ) |
Net realized gain on investments | | | — | | | | — | | | | (0.24 | ) | | | — | |
Total distributions to shareholders | �� | | (0.19 | ) | | | (0.18 | ) | | | (0.41 | ) | | | (0.08 | ) |
Net Asset Value, End of Period | | $ | 9.67 | | | $ | 10.14 | | | $ | 10.26 | | | $ | 10.23 | |
Total Return4,5 | | | (2.79 | )% | | | 0.57 | % | | | 4.44 | % | | | (0.76 | )%6 |
Ratio of net expenses to average net assets | | | 0.88 | % | | | 0.88 | % | | | 0.88 | % | | | 0.88 | %7 |
Ratio of gross expenses to average net assets8 | | | 0.93 | % | | | 0.93 | % | | | 0.97 | % | | | 0.99 | %7 |
Ratio of net investment income to average net assets4 | | | 1.88 | % | | | 1.75 | % | | | 1.51 | % | | | 1.67 | %7 |
Portfolio turnover | | | 17 | % | | | 18 | % | | | 48 | % | | | 175 | % |
Net assets end of period (000’s) omitted | | $ | 502 | | | $ | 146 | | | $ | 293 | | | $ | 124 | |
| | | | | | | | | | | | | | | | |
37
AMG GW&K Core Bond Fund
Financial Highlights
For a share outstanding throughout each fiscal year
| | | | | | | | | | | | | | | | | | | | |
| | | For the fiscal years ended October 31, | |
| Class I | | 2018 | | | 2017 | | | 20161 | | | 2015 | | | 2014 | |
Net Asset Value, Beginning of Year | | $ | 10.15 | | | $ | 10.27 | | | $ | 10.24 | | | $ | 10.87 | | | $ | 10.63 | |
Income (loss) from Investment Operations: | | | | | | | | | | | | | | | | | | | | |
Net investment income3,4 | | | 0.22 | | | | 0.21 | | | | 0.21 | | | | 0.18 | | | | 0.16 | |
Net realized and unrealized gain (loss) on investments | | | (0.48 | ) | | | (0.12 | ) | | | 0.26 | | | | (0.11 | ) | | | 0.22 | |
Total income (loss) from investment operations | | | (0.26 | ) | | | 0.09 | | | | 0.47 | | | | 0.07 | | | | 0.38 | |
Less Distributions to Shareholders from: | | | | | | | | | | | | | | | | | | | | |
Net investment income | | | (0.22 | ) | | | (0.21 | ) | | | (0.20 | ) | | | (0.35 | ) | | | (0.14 | ) |
Net realized gain on investments | | | — | | | | — | | | | (0.24 | ) | | | (0.35 | ) | | | — | |
Total distributions to shareholders | | | (0.22 | ) | | | (0.21 | ) | | | (0.44 | ) | | | (0.70 | ) | | | (0.14 | ) |
Net Asset Value, End of Year | | $ | 9.67 | | | $ | 10.15 | | | $ | 10.27 | | | $ | 10.24 | | | $ | 10.87 | |
Total Return4,5 | | | (2.59 | )% | | | 0.91 | % | | | 4.79 | % | | | 0.68 | % | | | 3.64 | % |
Ratio of net expenses to average net assets | | | 0.56 | % | | | 0.55 | % | | | 0.55 | % | | | 0.56 | % | | | 0.58 | % |
Ratio of gross expenses to average net assets8 | | | 0.61 | % | | | 0.60 | % | | | 0.65 | % | | | 0.67 | % | | | 0.67 | % |
Ratio of net investment income to average net assets4 | | | 2.20 | % | | | 2.08 | % | | | 2.01 | % | | | 1.70 | % | | | 1.46 | % |
Portfolio turnover | | | 17 | % | | | 18 | % | | | 48 | % | | | 175 | % | | | 177 | % |
Net assets end of year (000’s) omitted | | $ | 264,795 | | | $ | 325,855 | | | $ | 414,400 | | | $ | 572,110 | | | $ | 942,956 | |
| | | | | | | | | | | | | | | | | | | | |
38
AMG GW&K Core Bond Fund
Financial Highlights
For a share outstanding throughout each fiscal period
| | | | | | | | | | | | | | |
| | | For the fiscal years ended October 31, | | | For the fiscal period ended October 31, |
| Class Z | | 2018 | | | 2017 | | | 20161 | | | 20152 |
Net Asset Value, Beginning of Period | | $ | 10.14 | | | $ | 10.26 | | | $ | 10.23 | | | $10.39 |
Income (loss) from Investment Operations: | | | | | | | | | | | | | | |
Net investment income3,4 | | | 0.23 | | | | 0.22 | | | | 0.19 | | | 0.10 |
Net realized and unrealized gain (loss) on investments | | | (0.47 | ) | | | (0.12 | ) | | | 0.29 | | | (0.16) |
Total income (loss) from investment operations | | | (0.24 | ) | | | 0.10 | | | | 0.48 | | | (0.06) |
Less Distributions to Shareholders from: | | | | | | | | | | | | | | |
Net investment income | | | (0.23 | ) | | | (0.22 | ) | | | (0.21 | ) | | (0.10) |
Net realized gain on investments | | | — | | | | — | | | | (0.24 | ) | | — |
Total distributions to shareholders | | | (0.23 | ) | | | (0.22 | ) | | | (0.45 | ) | | (0.10) |
Net Asset Value, End of Period | | $ | 9.67 | | | $ | 10.14 | | | $ | 10.26 | | | $10.23 |
Total Return4,5 | | | (2.42 | )% | | | 0.98 | % | | | 4.85 | % | | (0.58)%6 |
Ratio of net expenses to average net assets | | | 0.48 | % | | | 0.48 | % | | | 0.48 | % | | 0.48%7 |
Ratio of gross expenses to average net assets8 | | | 0.53 | % | | | 0.53 | % | | | 0.58 | % | | 0.59%7 |
Ratio of net investment income to average net assets4 | | | 2.28 | % | | | 2.15 | % | | | 1.88 | % | | 2.05%7 |
Portfolio turnover | | | 17 | % | | | 18 | % | | | 48 | % | | 175% |
Net assets end of period (000’s) omitted | | $ | 5,005 | | | $ | 5,590 | | | $ | 5,668 | | | $4,891 |
| | | | | | | | | | | | | | |
| 1 | Effective October 1, 2016, the Investor Class, Service Class and Institutional Class were renamed Class N, Class I and Class Z, respectively. |
| 2 | Commencement of operations was on May 8, 2015. |
| 3 | Per share numbers have been calculated using average shares. |
| 4 | Total returns and net investment income would have been lower had certain expenses not been offset. |
| 5 | The total return is calculated using the published Net Asset Value as of fiscal year end. |
| 8 | Excludes the impact of expense reimbursement or fee waivers and expense reductions such as brokerage credits, but includes expense repayments and non-reimbursable expenses, if any, such as interest, taxes, and extraordinary expenses. (See Note 1(c) and 2 in the Notes to Financial Statements.) |
39
Notes to Financial Statements
October 31, 2018
1. SUMMARY OF SIGNIFICANT ACCOUNTING POLICIES
AMG Funds I (the “Trust”) is an open-end management investment company, organized as a Massachusetts business trust, and registered under the Investment Company Act of 1940, as amended (the “1940 Act”). Currently, the Trust consists of a number of different funds, each having distinct investment management objectives, strategies, risks, and policies. Included in this report are the AMG Frontier Small Cap Growth Fund (“Small Cap”), AMG Managers Emerging Opportunities Fund (“Emerging Opportunities”) and AMG GW&K Core Bond Fund (“Core Bond”), each a “Fund” and collectively, the “Funds.”
Each Fund offers different classes of shares. Both Small Cap and Core Bond offer Class N, Class I and Class Z shares. Emerging Opportunities previously offered Class S and Class I shares. Effective February 27, 2017, Emerging Opportunities’s Class S shares were renamed Class N. Each class represents an interest in the same assets of the respective Fund. Although all share classes generally have identical voting rights, each share class votes separately when required by law. Different share classes may have different net asset values per share to the extent the share classes pay different distribution amounts and/or the expenses of such share classes differ. Each share class has its own expense structure. Please refer to a current prospectus for additional information on each share class.
The Funds’ financial statements are prepared in accordance with accounting principles generally accepted in the United States of America (“U.S. GAAP”), including accounting and reporting guidance pursuant to Accounting Standards Codification Topic 946 applicable to investment companies. U.S. GAAP requires management to make estimates and assumptions that affect the reported amounts of assets and liabilities and disclosure of contingent assets and liabilities at the date of the financial statements and the reported amounts of income and expenses during the reporting period. Actual results could differ from those estimates and such differences could be material. The following is a summary of significant accounting policies followed by the Funds in the preparation of their financial statements:
a. VALUATION OF INVESTMENTS
Equity securities traded on a national securities exchange or reported on the NASDAQ national market system (“NMS”) are valued at the last quoted sales price on the primary exchange or, if applicable, the NASDAQ official closing price or the official closing price of the relevant exchange or, lacking any sales, at the last quoted bid price or the mean between the last quoted bid and ask prices (the “exchange mean price”). Equity securities traded in the over-the-counter market (other than NMS securities) are valued at the exchange mean price. Foreign equity securities (securities principally traded in markets other than U.S. markets) are valued at the official closing price on the primary exchange or, for markets that either do not offer an official closing price or where the official closing price may not be representative of the overall market, the last quoted sale price.
Fixed income securities purchased with a remaining maturity exceeding 60 days are valued at the evaluated bid price or the mean price provided by an authorized pricing service or, if an evaluated price is not available, by reference to other securities which are considered comparable in credit rating, interest rate, due date and other features (generally referred to as “matrix pricing”) or other similar pricing methodologies.
Fixed income securities purchased with a remaining maturity of 60 days or less are valued at amortized cost, provided that the amortized cost value is approximately the same as the fair value of the security valued without the use of
amortized cost. Investments in other open-end regulated investment companies are valued at their end of day net asset value per share.
The Funds’ portfolio investments are generally valued based on independent market quotations or prices or, if none, “evaluative” or other market based valuations provided by third party pricing services approved by the Board of Trustees of the Trust (the “Board”). Under certain circumstances, the value of certain Fund portfolio investments may be based on an evaluation of fair value, pursuant to procedures established by and under the general supervision of the Board. The Valuation Committee, which is comprised of the Independent Trustees of the Board, and the Pricing Committee, which is comprised of representatives from AMG Funds LLC (the “Investment Manager”) are the committees appointed by the Board to make fair value determinations. Each Fund may use the fair value of a portfolio investment to calculate its net asset value (“NAV”) in the event that the market quotation, price or market based valuation for the portfolio investment is not readily available or otherwise not determinable pursuant to the Board’s valuation procedures, if the Investment Manager or the Pricing Committee believes the quotation, price or market based valuation to be unreliable, or in certain other circumstances. When determining the fair value of an investment, the Pricing Committee and, if required under the Trust’s securities valuation procedures, the Valuation Committee, seeks to determine the price that the Fund might reasonably expect to receive from current sale of that portfolio investment in an arms-length transaction. Fair value determinations shall be based upon consideration of all available facts and information, including, but not limited to (i) attributes specific to the investment; (ii) fundamental and analytical data relating to the investment; and (iii) the value of other comparable securities or relevant financial instruments, including derivative securities, traded on other markets or among dealers.
The values assigned to fair value portfolio investments are based on available information and do not necessarily represent amounts that might ultimately be realized in the future, since such amounts depend on future developments inherent in long-term investments. Because of the inherent uncertainty of valuation, those estimated values may differ significantly from the values that would have been used had a ready market for the investments existed, and the differences could be material. The Board will be presented with a quarterly report showing as of the most recent quarter end, all outstanding securities fair valued by the Fund, including a comparison with the prior quarter end and the percentage of the Fund that the security represents at each quarter end.
With respect to foreign equity securities and certain foreign fixed income securities, the Board has adopted a policy that securities held in a Fund that can be fair valued by the applicable fair value pricing service are fair valued on each business day provided that each individual price exceeds a pre-established confidence level.
U.S. GAAP defines fair value as the price that a fund would receive to sell an asset or pay to transfer a liability in an orderly transaction between market participants at the measurement date. U.S. GAAP also establishes a framework for measuring fair value, and a three level hierarchy for fair value measurements based upon the transparency of inputs to the valuation of an asset or liability. Inputs may be observable or unobservable and refer broadly to the assumptions that market participants would use in pricing the asset or liability. Observable inputs reflect the assumptions market participants would use in pricing the asset or liability based on market data obtained from sources independent of the Funds. Unobservable inputs reflect the Funds’ own assumptions about the assumptions that market participants would use in pricing the asset or liability developed based on the best information available in the circumstances. Each investment is
40
Notes to Financial Statements (continued)
assigned a level based upon the observability of the inputs which are significant to the overall valuation.
The three-tier hierarchy of inputs is summarized below:
Level 1 – inputs are quoted prices in active markets for identical investments (e.g., equity securities, open-end investment companies)
Level 2 – other observable inputs (including, but not limited to: quoted prices for similar assets or liabilities in markets that are active, quoted prices for identical or similar assets or liabilities in markets that are not active, inputs other than quoted prices that are observable for the assets or liabilities (such as interest rates, yield curves, volatilities, prepayment speeds, loss severities, credit risks and default rates) or other market corroborated inputs) (e.g., debt securities, government securities, foreign currency exchange contracts, swaps, foreign securities utilizing international fair value pricing, fair valued securities with observable inputs)
Level 3 – inputs are significant unobservable inputs (including the Fund’s own assumptions used to determine the fair value of investments) (e.g., fair valued securities with unobservable inputs)
Changes in inputs or methodologies used for valuing investments may result in a transfer in or out of levels within the fair value hierarchy. The inputs or methodologies used for valuing investments may not necessarily be an indication of the risk associated with investing in those investments. Transfers between different levels of the fair value disclosure hierarchy are deemed to have occurred as of the beginning of the reporting period.
b. SECURITY TRANSACTIONS
Security transactions are accounted for as of trade date. Realized gains and losses on securities sold are determined on the basis of identified cost.
c. INVESTMENT INCOME AND EXPENSES
Dividend income is recorded on the ex-dividend date. Dividends from foreign securities are recorded on the ex-dividend date, and if after the fact, as soon as the Funds become aware of the ex-dividend date. Interest income, which includes amortization of premium and accretion of discount on debt securities, is accrued as earned. Dividend and interest income on foreign securities is recorded gross of any withholding tax. Non-cash dividends included in dividend income, if any, are reported at the fair market value of the securities received. Upon notification from issuers, distributions received from a real estate investment trust (“REIT”) may be redesignated as a reduction of cost of investments and/or realized gain. Other income and expenses are recorded on an accrual basis. Expenses that cannot be directly attributed to a Fund are apportioned among the funds in the Trust and other trusts within the AMG Funds family of mutual funds (collectively the “AMG Funds Family”) based upon their relative average net assets or number of shareholders. Investment income, realized and unrealized capital gains and losses, the common expenses of each Fund, and certain fund level expense reductions, if any, are allocated on a pro-rata basis to each class based on the relative net assets of each class to the total net assets of each Fund.
Emerging Opportunities had certain portfolio trades directed to various brokers under a brokerage recapture program. Credits received from the brokerage
recapture program are earned and paid on a monthly basis, and are recorded as expense offsets, which serve to reduce the Fund’s overall expense ratio. For the fiscal year ended October 31, 2018, the impact on the expense ratios, if any, were as follows: Emerging Opportunities - $31,608 or 0.02%.
d. DIVIDENDS AND DISTRIBUTIONS
Fund distributions resulting from either net investment income or realized net capital gains, if any, will normally be declared and paid at least annually in December with the exception of Core Bond, which normally declares and pays income dividends monthly. Distributions to shareholders are recorded on the ex-dividend date. Distributions are determined in accordance with federal income tax regulations, which may differ from net investment income and net realized capital gains for financial statement purposes (U.S. GAAP). Differences may be permanent or temporary. Permanent differences are reclassified among capital accounts in the financial statements to reflect their tax character. Permanent book and tax basis differences, if any, relating to shareholder distributions will result in reclassifications to paid-in capital. Temporary differences arise when certain items of income, expense and gain or loss are recognized in different periods for financial statement and tax purposes; these differences will reverse at some time in the future. Permanent differences are due to current year redesignations of net operating loss to offset short term capital gains and distributions received from investments in certain partnerships. Temporary differences are distributions received from investments in certain partnerships and wash sales deferrals.
The distributions disclosed on the Statements of Changes in Net Assets for the fiscal year ended October 31, 2017 were from the following sources:
| | | | | | | | |
| Fund | | Net
Investment
Income | | | Realized Gain on
Investments | |
Small Cap | | | | | | | | |
Class N | | | — | | | $ | 680 | |
Class I | | | — | | | | 43,105 | |
Class Z | | | — | | | | 40,815 | |
| | | | | | | | |
Total | | | — | | | $ | 84,600 | |
| | | | | | | | |
Emerging Opportunities | | | | | |
Class N | | | — | | | $ | 474,506 | |
Class I | | | — | | | | 95,766 | |
| | | | | | | | |
Total | | | — | | | $ | 570,272 | |
| | | | | | | | |
Core Bond | | | | | | | | |
Class N | | $ | 3,147 | | | | — | |
Class I | | | 7,469,075 | | | | — | |
Class Z | | | 121,102 | | | | — | |
| | | | | | | | |
Total | | $ | 7,593,324 | | | | — | |
| | | | | | | | |
41
Notes to Financial Statements (continued)
The tax character of distributions paid during the fiscal years ended October 31, 2018 and October 31, 2017 were as follows:
| | | | | | | | | | | | | | | | | | | | | | | | |
| | | Small Cap | | | Emerging Opportunities | | | Core Bond | |
| | | 2018 | | | 2017 | | | 2018 | | | 2017 | | | 2018 | | | 2017 | |
Distributions paid from: | | | | | | | | | | | | | | | | | | | | | | | | |
Ordinary income | | | — | | | | — | | | | — | | | | — | | | $ | 6,619,394 | | | $ | 7,593,324 | |
Short-term capital gains | | $ | 970,521 | | | | — | | | $ | 4,187,086 | | | | — | | | | — | | | | — | |
Long-term capital gains | | | 3,132,601 | | | $ | 84,600 | | | | 15,239,496 | | | $ | 570,272 | | | | — | | | | — | |
| | | | | | | | | | | | | | | | | | | | | | | | |
| | $ | 4,103,122 | | | $ | 84,600 | | | $ | 19,426,582 | | | $ | 570,272 | | | $ | 6,619,394 | | | $ | 7,593,324 | |
| | | | | | | | | | | | | | | | | | | | | | | | |
As of October 31, 2018, the components of distributable earnings (excluding unrealized appreciation/depreciation) on a tax basis consisted of:
| | | | | | | | | | | | |
| | | Small Cap | | | Emerging Opportunities | | | Core Bond | |
Capital loss carryforward | | | — | | | | — | | | $ | 3,846,407 | |
Undistributed ordinary income | | | — | | | | — | | | | 94,602 | |
Undistributed short-term capital gains | | $ | 2,889,325 | | | $ | 5,241,429 | | | | — | |
Undistributed long-term capital gains | | | 3,096,106 | | | | 26,340,939 | | | | — | |
Late-year loss deferral | | | — | | | | — | | | | — | |
At October 31, 2018, the cost of investments and the aggregate gross unrealized appreciation and depreciation for federal income tax purposes were as follows:
| | | | | | | | | | | | | | | | |
| Fund | | Cost | | | Appreciation | | | Depreciation | | | Net | |
Small Cap | | $ | 19,524,820 | | | $ | 2,309,607 | | | $ | (1,865,041 | )�� | | $ | 444,566 | |
Emerging Opportunities | | | 155,168,779 | | | | 48,540,674 | | | | (10,766,917 | ) | | | 37,773,757 | |
Core Bond | | | 279,831,359 | | | | 83,813 | | | | (11,763,959 | ) | | | (11,680,146 | ) |
e. FEDERAL TAXES
Each Fund currently qualifies as an investment company and intends to comply with the requirements under Subchapter M of the Internal Revenue Code of 1986, as amended, and to distribute substantially all of its taxable income and gains to its shareholders and to meet certain diversification and income requirements with respect to investment companies. Therefore, no provision for federal income or excise tax is included in the accompanying financial statements.
Additionally, based on each Fund’s understanding of the tax rules and rates related to income, gains and transactions for the foreign jurisdictions in which it invests, each Fund will provide for foreign taxes, and where appropriate, deferred foreign taxes.
Management has analyzed the Funds’ tax positions taken on federal income tax returns as of October 31, 2018, and for all open tax years (generally, the three prior taxable years), and has concluded that no provision for federal income tax is required in the Funds’ financial statements. Additionally, Management is not aware of any tax position for which it is reasonably possible that the total amounts of unrecognized tax benefits will change materially in the next twelve months.
Net capital losses incurred may be carried forward for an unlimited time period, and retain their tax character as either short-term or long-term capital losses.
f. CAPITAL LOSS CARRYOVERS AND DEFERRALS
As of October 31, 2018, the following Fund had accumulated net realized capital loss carryovers from securities transactions for federal income tax purposes as shown in the following chart. These amounts may be used to offset future realized capital gains, if any, for an unlimited time period.
| | | | | | | | | | | | |
| | | Capital Loss
Carryover Amounts | | | | |
| Fund | | Short-Term | | | Long-Term | | | Total | |
Core Bond | | $ | 2,251,421 | | | $ | 1,594,986 | | | $ | 3,846,407 | |
As of October 31, 2018, Small Cap and Emerging Opportunities had no accumulated net realized capital loss carryovers. Should the Funds incur net capital losses for the fiscal year ended October 31, 2019, such amounts may be used to offset future realized capital gains, for an unlimited time period.
g. CAPITAL STOCK
The Trust’s Declaration of Trust authorizes for each Fund the issuance of an unlimited number of shares of beneficial interest, without par value. Each Fund records sales and repurchases of its capital stock on the trade date.
42
Notes to Financial Statements (continued)
For the fiscal years ended October 31, 2018 and October 31, 2017, the capital stock transactions by class for the Funds were as follows:
| | | | | | | | | | | | | | | | | | | | | | | | | | | | | | | | |
| | | Small Cap | | | Emerging Opportunities | |
| | | October 31, 2018 | | | October 31, 2017 | | | October 31, 2018 | | | October 31, 2017 | |
| | | Shares | | | Amount | | | Shares | | | Amount | | | Shares | | | Amount | | | Shares | | | Amount | |
Class N: | | | | | | | | | | | | | | | | | | | | | | | | | | | | | | | | |
Proceeds from sale of shares | | | 81,198 | | | $ | 1,027,555 | | | | 1,726 | | | $ | 20,611 | | | | 144,622 | | | $ | 7,315,263 | | | | 124,645 | | | $ | 5,394,996 | |
Reinvestment of distributions | | | 7,083 | | | | 74,443 | | | | 60 | | | | 680 | | | | 358,001 | | | | 16,528,925 | | | | 11,112 | | | | 468,577 | |
Cost of shares repurchased | | | (56,888 | ) | | | (708,083 | ) | | | (172 | ) | | | (2,029 | ) | | | (415,804 | ) | | | (20,639,398 | ) | | | (505,849 | ) | | | (21,866,550 | ) |
| | | | | | | | | | | | | | | | | | | | | | | | | | | | | | | | |
Net increase (decrease) | | | 31,393 | | | $ | 393,915 | | | | 1,614 | | | $ | 19,262 | | | | 86,819 | | | $ | 3,204,790 | | | | (370,092 | ) | | $ | (16,002,977 | ) |
| | | | | | | | | | | | | | | | | | | | | | | | | | | | | | | | |
Class I: | | | | | | | | | | | | | | | | | | | | | | | | | | | | | | | | |
Proceeds from sale of shares | | | 381,012 | | | $ | 4,840,005 | | | | 44,220 | | | $ | 526,638 | | | | 144,567 | | | $ | 7,713,952 | | | | 97,412 | | | $ | 4,391,063 | |
Reinvestment of distributions | | | 222,143 | | | | 2,394,702 | | | | 3,731 | | | | 43,022 | | | | 55,932 | | | | 2,614,790 | | | | 2,202 | | | | 93,688 | |
Cost of shares repurchased | | | (460,240 | ) | | | (5,775,001 | ) | | | (145,343 | ) | | | (1,724,403 | ) | | | (95,234 | ) | | | (4,894,416 | ) | | | (297,784 | ) | | | (13,043,085 | ) |
| | | | | | | | | | | | | | | | | | | | | | | | | | | | | | | | |
Net increase (decrease) | | | 142,915 | | | $ | 1,459,706 | | | | (97,392 | ) | | $ | (1,154,743 | ) | | | 105,265 | | | $ | 5,434,326 | | | | (198,170 | ) | | $ | (8,558,334 | ) |
| | | | | | | | | | | | | | | | | | | | | | | | | | | | | | | | |
Class Z: | | | | | | | | | | | | | | | | | | | | | | | | | | | | | | | | |
Proceeds from sale of shares | | | 14,195 | | | $ | 169,188 | | | | 6,364 | | | $ | 76,190 | | | | — | | | | — | | | | — | | | | — | |
Reinvestment of distributions | | | 145,679 | | | | 1,606,835 | | | | 3,482 | | | | 40,815 | | | | — | | | | — | | | | — | | | | — | |
Cost of shares repurchased | | | (175,189 | ) | | | (2,069,986 | ) | | | (330,679 | ) | | | (4,028,809 | ) | | | — | | | | — | | | | — | | | | — | |
| | | | | | | | | | | | | | | | | | | | | | | | | | | | | | | | |
Net decrease | | | (15,315 | ) | | $ | (293,963 | ) | | | (320,833 | ) | | $ | (3,911,804 | ) | | | — | | | | — | | | | — | | | | — | |
| | | | | | | | | | | | | | | | | | | | | | | | | | | | | | | | |
43
Notes to Financial Statements (continued)
| | | | | | | | | | | | | | | | |
| | | Core Bond | |
| | | October 31, 2018 | | | October 31, 2017 | |
| | | Shares | | | Amount | | | Shares | | | Amount | |
Class N: | | | | | | | | | | | | | | | | |
Proceeds from sale of shares | | | 52,526 | | | $ | 517,842 | | | | 12,223 | | | $ | 123,539 | |
Reinvestment of distributions | | | 663 | | | | 6,518 | | | | 297 | | | | 2,978 | |
Cost of shares repurchased | | | (15,654 | ) | | | (152,624 | ) | | | (26,707 | ) | | | (267,495 | ) |
| | | | | | | | | | | | | | | | |
Net increase (decrease) | | | 37,535 | | | $ | 371,736 | | | | (14,187 | ) | | $ | (140,978 | ) |
| | | | | | | | | | | | | | | | |
Class I: | | | | | | | | | | | | | | | | |
Proceeds from sale of shares | | | 1,533,467 | | | $ | 15,179,962 | | | | 1,948,710 | | | $ | 19,639,391 | |
Reinvestment of distributions | | | 628,431 | | | | 6,215,123 | | | | 711,997 | | | | 7,154,704 | |
Cost of shares repurchased | | | (6,897,752 | ) | | | (68,301,545 | ) | | | (10,908,824 | ) | | | (109,731,047 | ) |
| | | | | | | | | | | | | | | | |
Net decrease | | | (4,735,854 | ) | | $ | (46,906,460 | ) | | | (8,248,117 | ) | | $ | (82,936,952 | ) |
| | | | | | | | | | | | | | | | |
Class Z: | | | | | | | | | | | | | | | | |
Proceeds from sale of shares | | | 15,702 | | | $ | 155,741 | | | | 54,299 | | | $ | 543,277 | |
Reinvestment of distributions | | | 6,940 | | | | 68,566 | | | | 7,059 | | | | 70,932 | |
Cost of shares repurchased | | | (56,169 | ) | | | (554,918 | ) | | | (62,513 | ) | | | (628,631 | ) |
| | | | | | | | | | | | | | | | |
Net decrease | | | (33,527 | ) | | $ | (330,611 | ) | | | (1,155 | ) | | $ | (14,422 | ) |
| | | | | | | | | | | | | | | | |
h. REPURCHASE AGREEMENTS AND JOINT REPURCHASE AGREEMENTS
The Funds may enter into third-party repurchase agreements for temporary cash management purposes and third-party or bilateral joint repurchase agreements for reinvestment of cash collateral on securities lending transactions under the securities lending program offered by The Bank of New York Mellon (“BNYM”) (the “Program”) (collectively, “Repurchase Agreements”). The value of the underlying collateral, including accrued interest, must equal or exceed the value of the Repurchase Agreements during the term of the agreement. For joint repurchase agreements, the Funds participate on a pro rata basis with other clients of BNYM in its share of the underlying collateral under such joint repurchase agreements and in its share of proceeds from any repurchase or other disposition of the underlying collateral. The underlying collateral for all Repurchase Agreements is held in safekeeping by the Funds’ custodian or at the Federal Reserve Bank. If the seller defaults and the value of the collateral declines, or if bankruptcy proceedings commence with respect to the seller of the security, realization of the collateral by the Funds may be delayed or limited. Pursuant to the Program, the Funds are indemnified for such losses by BNYM on joint repurchase agreements.
At October 31, 2018, the market value of Repurchase Agreements outstanding for Small Cap and Emerging Opportunities were $1,978,102 and $16,162,515, respectively.
2. AGREEMENTS AND TRANSACTIONS WITH AFFILIATES
For each of the Funds, the Trust has entered into an investment advisory agreement under which the Investment Manager, a subsidiary and the U.S. retail distribution arm of Affiliated Managers Group, Inc. (“AMG”), serves as investment manager to the Funds and is responsible for the Funds’ overall administration and operations. The Investment Manager selects one or more subadvisers for the Funds (subject to Board approval) and monitors each subadviser’s investment
performance, security holdings and investment strategies. Each Fund’s investment portfolio is managed by one or more portfolio managers who serve pursuant to a subadvisory agreement with the Investment Manager. Small Cap is managed by Frontier Capital Management Co., LLC (“Frontier”). Emerging Opportunities is managed by Lord, Abbett & Co. LLC, Next Century Growth Investors, LLC, RBC Global Asset Management (U.S.) Inc., and WEDGE Capital Management LLP. Core Bond is managed by GW&K Investment Management, LLC (“GW&K”). AMG indirectly owns a majority interest in Frontier and GW&K.
Investment management fees are paid directly by the Funds to the Investment Manager based on average daily net assets. For the fiscal year ended October 31, 2018, the Funds’ investment management fees were paid at the following annual rate of each Fund’s respective average daily net assets:
| | | | |
Small Cap | | | 0.70 | % |
Emerging Opportunities | | | 1.00 | % |
Core Bond | | | 0.30 | % |
Prior to July 1, 2017, the annual rate for the investment management fees for Small Cap was 0.85% of the Fund’s average daily net assets.
The Investment Manager has contractually agreed, through at least March 1, 2019 to waive management fees and/or reimburse fund expenses in order to limit total annual Fund operating expenses after fee waiver and expense reimbursements (exclusive of taxes, interest (including interest incurred in connection with bank and custody overdrafts), shareholder servicing fees, distribution and service (12b-1) fees, brokerage commissions and other transaction costs, acquired fund fees and expenses and extraordinary expenses) of Small Cap, Emerging Opportunities, and Core Bond to 0.90%, 1.18% and 0.48%, respectively, of each
44
Notes to Financial Statements (continued)
Fund’s average daily net assets subject to later reimbursement by the Funds in certain circumstances. Prior to July 1, 2017, the Small Cap contractual expense limitation was 1.05%.
The contractual expense limitation may only be terminated in the event the Investment Manager or a successor ceases to be the investment manager of the Fund or a successor fund, by mutual agreement between the Investment Manager and the Board, or in the event of the Fund’s liquidation unless the Fund is reorganized or is a party to a merger in which the surviving entity is successor to the accounting and performance information of the Fund.
In general, for a period of up to 36 months, the Investment Manager may recover from each Fund fees waived and expenses paid pursuant to this contractual agreement, provided that such repayment would not cause the Fund’s total annual operating expenses after fee waiver and expense reimbursements (exclusive of the items noted in the parenthetical above) to exceed the contractual expense limitation amount.
At October 31, 2018, the Funds’ expiration of recoupment is as follows:
| | | | | | | | | | | | |
| Expiration Period | | Small Cap | | | Emerging Opportunities | | | Core Bond | |
Less than 1 year | | $ | 86,272 | | | $ | 291,604 | | | $ | 442,748 | |
Within 2 years | | | 106,586 | | | | 132,090 | | | | 197,822 | |
Within 3 years | | | 105,483 | | | | 130,107 | | | | 146,013 | |
| | | | | | | | | | | | |
Total Amount Subject to Recoupment | | $ | 298,341 | | | $ | 553,801 | | | $ | 786,583 | |
| | | | | | | | | | | | |
The Trust, on behalf of the Funds, has entered into an amended and restated Administration Agreement under which the Investment Manager serves as the Funds’ administrator (the “Administrator”) and is responsible for all non-portfolio management aspects of managing the Fund’s operations, including administration and shareholder services to each Fund. Each Fund pays a fee to the Administrator at the rate of 0.15% per annum of the Fund’s average daily net assets for this service.
The Funds are distributed by AMG Distributors, Inc. (the “Distributor”), a wholly-owned subsidiary of the Investment Manager. The Distributor serves as the distributor and underwriter for each Fund and is a registered broker-dealer and member of the Financial Industry Regulatory Authority, Inc. (“FINRA”). Shares of each Fund will be continuously offered and will be sold directly to prospective purchasers and through brokers, dealers or other financial intermediaries who have executed selling agreements with the Distributor. Generally the Distributor bears all or a portion of the expenses of providing services pursuant to the distribution agreement, including the payment of the expenses relating to the distribution of prospectuses for sales purposes and any advertising or sales literature.
Small Cap and Core Bond each have adopted a distribution and service plan (the “Plan”) with respect to the Class N shares, in accordance with the requirements of Rule 12b-1 under the 1940 Act and the requirements of the applicable rules of FINRA regarding asset-based sales charges. Pursuant to the Plan, each Fund may make payments to the Distributor for its expenditures in financing any activity primarily intended to result in the sale of each Fund’s Class N shares and for maintenance and personal service provided to existing shareholders of that class. The Plan authorizes payments to the Distributor up to 0.25% annually of each Fund’s average daily net assets attributable to the Class N shares.
For Class N of Small Cap, Emerging Opportunities and Core Bond and for Class I of Small Cap and Core Bond, the Board has approved reimbursement payments to the Investment Manager for shareholder servicing expenses (“shareholder servicing fees”) incurred. Shareholder servicing fees include payments to financial intermediaries, such as broker-dealers (including fund supermarket platforms), banks, and trust companies who provide shareholder recordkeeping, account servicing and other services. Class N shares of Small Cap, Emerging Opportunities and Core Bond and Class I shares of Small Cap and Core Bond may reimburse the Investment Manager for the actual amount incurred up to a maximum annual rate of each Class’s average daily net assets as shown in the table below.
The impact on the annualized expense ratio for the fiscal year ended October 31, 2018, were as follows:
| | | | | | | | |
| Fund | | Maximum Annual
Amount
Approved | | | Actual
Amount
Incurred | |
Small Cap | | | | | | | | |
Class N | | | 0.15 | % | | | 0.15 | % |
Class I | | | 0.15 | % | | | 0.11 | % |
Emerging Opportunities | | | | | | | | |
Class N | | | 0.25 | % | | | 0.25 | % |
Core Bond | | | | | | | | |
Class N | | | 0.15 | % | | | 0.15 | % |
Class I | | | 0.10 | % | | | 0.08 | % |
The Board provides supervision of the affairs of the Trust and other trusts within the AMG Funds family. The Trustees of the Trust who are not affiliated with the Investment Manager receive an annual retainer and per meeting fees for regular, special and telephonic meetings, and they are reimbursed for out-of-pocket expenses incurred while carrying out their duties as Board members. The Chairman of the Board and the Audit Committee Chair receive additional annual retainers. Certain Trustees and Officers of the Funds are Officers and/or Directors of the Investment Manager, AMG and/or the Distributor.
The Securities and Exchange Commission (the “SEC”) granted an exemptive order that permits the Funds to lend and borrow money for certain temporary purposes directly to and from other eligible funds in the AMG Funds family. Participation in this interfund lending program is voluntary for both the borrowing and lending funds, and an interfund loan is only made if it benefits each participating fund. The Administrator manages the program according to procedures approved by the Board, and the Board monitors the operation of the program. An interfund loan must comply with certain conditions set out in the exemptive order, which are designed to assure fairness and protect all participating funds. For the fiscal year ended October 31, 2018, Small Cap borrowed a maximum of $1,414,397 for nine days paying interest of $693. The interest expense amount is included in the Statement of Operations as miscellaneous expense. For the fiscal year ended October 31, 2018, Emerging Opportunities and Core Bond neither borrowed from nor lent to other funds in the AMG Funds family. At October 31, 2018, the Funds had no interfund loans outstanding.
For the fiscal year ended October 31, 2018, Emerging Opportunities executed security transactions with other funds affiliated with Lord, Abbett & Co. LLC. Each of the transactions were executed at the closing price of the security transacted and with no commissions under Rule 17a-7 procedures approved by the Board. The
45
Notes to Financial Statements (continued)
amounts purchased and sold during the fiscal year ended October 31, 2018, are reflected in the following chart:
| | | | | | | | | | | | |
| | | Number of
Transactions | | | Total
Quantity | | | Cost/
Proceeds | |
Purchases | | | 4 | | | | 11,160 | | | $ | 312,814 | |
Sales* | | | 2 | | | | 12,623 | | | | 346,953 | |
| * | Realized gain was $186,351. |
3. PURCHASES AND SALES OF SECURITIES
Purchases and sales of securities (excluding short-term securities and U.S. Government Obligations) for the fiscal year ended October 31, 2018, were as follows:
| | | | | | | | |
| | | Long Term Securities | |
| Fund | | Purchases | | | Sales | |
Small Cap | | $ | 46,238,398 | | | $ | 48,979,007 | |
Emerging Opportunities | | | 96,934,842 | | | | 109,420,743 | |
Core Bond | | | 30,279,487 | | | | 52,372,851 | |
Core Bond purchases and sales of U.S. Government obligations during the fiscal year ended October 31, 2018 were $18,144,192 and $35,860,018, respectively.
4. PORTFOLIO SECURITIES LOANED
The Funds participate in the Program providing for the lending of securities to qualified brokers. Securities lending income includes earnings of such temporary cash investments, plus or minus any rebate to a borrower. These earnings (after any rebate) are then divided between BNYM, as a fee for its services under the Program, and the Funds, according to agreed-upon rates. Collateral on all securities loaned is accepted in cash and non-cash and, effective October 1, 2018, may also be accepted in U.S. Government and Agency Obligations. Collateral is maintained at a minimum level of 102% (105% in the case of certain foreign securities) of the market value, plus interest, if applicable, of investments on loan. It is the Funds’ policy to obtain additional collateral from or return excess collateral to the borrower by the end of the next business day, following the valuation date of the securities loaned. Therefore, the value of the collateral held may be temporarily less than the value of the securities on loan. Lending securities entails a risk of loss to the Funds if and to the extent that the market value of the securities loaned
were to increase and the borrower did not increase the collateral accordingly, and the borrower fails to return the securities. Under the terms of the Program, the Funds are indemnified for such losses by BNYM. Cash collateral is held in separate omnibus accounts managed by BNYM, who is authorized to exclusively enter into joint repurchase agreements for that cash collateral. Non-cash collateral is held in separate omnibus accounts managed by BNYM that cannot be sold or pledged. BNYM bears the risk of any deficiency in the amount of the cash collateral available for return to the borrower due to any loss on the collateral invested.
The value of securities loaned on positions held and cash and non-cash collateral received at October 31, 2018, were as follows:
| | | | | | | | | | | | | | | | |
| Fund | | Securities
Loaned | | | Cash
Collateral
Received | | | Non-Cash
Collateral
Received | | | Total
Collateral
Received | |
Small Cap | | $ | 5,016,352 | | | $ | 1,978,102 | | | $ | 3,031,432 | | | $ | 5,009,534 | |
Emerging Opportunities | | | 31,464,308 | | | | 16,162,515 | | | | 15,526,387 | | | | 31,688,902 | |
5. COMMITMENTS AND CONTINGENCIES
Under the Trust’s organizational documents, its trustees and officers are indemnified against certain liabilities arising out of the performance of their duties to the Trust. In addition, in the normal course of business, the Funds may enter into contracts and agreements that contain a variety of representations and warranties, which provide general indemnifications. The maximum exposure to the Funds under these arrangements is unknown, as this would involve future claims that may be made against a Fund that have not yet occurred. However, based on experience, the Funds had no prior claims or losses and expect the risks of loss to be remote.
6. MASTER NETTING AGREEMENTS
The Funds may enter into master netting agreements with their counterparties for the securities lending program and Repurchase Agreements, which provide the right, in the event of default (including bankruptcy or insolvency) for the non-defaulting party to liquidate the collateral and calculate net exposure to the defaulting party or request additional collateral. For financial reporting purposes, the Funds do not offset financial assets and financial liabilities that are subject to master netting agreements in the Statement of Assets and Liabilities. For securities lending transactions, see Note 4.
46
Notes to Financial Statements (continued)
The following table is a summary of the Funds’ open Repurchase Agreements that are subject to a master netting agreement as of October 31, 2018:
| | | | | | | | | | | | | | | | |
| | | | | | Gross Amount Not Offset in
the Statement of Assets and Liabilities | | | | |
| Fund | | Net Amounts of Assets
Presented in the Statement
of Assets and Liabilities | | | Financial
Instruments
Collateral | | | Cash Collateral
Received | | | Net
Amount | |
Small Cap | | | | | | | | | | | | | | | | |
Mizuho Securities, LLC | | $ | 978,102 | | | $ | 978,102 | | | | — | | | | — | |
RBC Dominion Securities, Inc. | | | 1,000,000 | | | | 1,000,000 | | | | — | | | | — | |
| | | | | | | | | | | | | | | | |
Totals | | $ | 1,978,102 | | | $ | 1,978,102 | | | | — | | | | — | |
| | | | | | | | | | | | | | | | |
Emerging Opportunities | | | | | | | | | | | | | | | | |
Barclays Capital, Inc. | | $ | 1,252,780 | | | $ | 1,252,780 | | | | — | | | | — | |
MUFG Securities America, Inc. | | | 3,838,855 | | | | 3,838,855 | | | | — | | | | — | |
Nomura Securities International, Inc. | | | 3,838,855 | | | | 3,838,855 | | | | — | | | | — | |
RBC Dominion Securities, Inc. | | | 3,838,855 | | | | 3,838,855 | | | | — | | | | — | |
State of Wisconsin Investment Board | | | 3,393,170 | | | | 3,393,170 | | | | — | | | | — | |
| | | | | | | | | | | | | | | | |
Totals | | $ | 16,162,515 | | | $ | 16,162,515 | | | | — | | | | — | |
| | | | | | | | | | | | | | | | |
7. REGULATORY UPDATES
In August 2018, the FASB issued Accounting Standards Update No. 2018-13, Fair Value Measurement (Topic 820), Disclosure Framework—Changes to the Disclosure Requirements for Fair Value Measurement (“ASU 2018-13”) which is effective for periods starting after December 15, 2019. The primary focus of the update is to improve the effectiveness of ASC 820’s disclosure in the notes to financial statements. Management is currently evaluating the impact, if any, of applying ASU 2018-13.
Effective November 15, 2018, the SEC amended existing rules intended to modernize reporting and disclosure of information. These amendments relate to Regulation S-X which sets forth the form and content of financial statements. The
amendment requires collapsing the components of distributable earnings on the Statement of Assets and Liabilities and collapsing the distributions paid to shareholders on the Statements of Changes in Net Assets. Management has adopted these amendments and there was no significant impact on the financial statements and accompanying notes.
8. SUBSEQUENT EVENTS
The Funds have determined that no material events or transactions occurred through the issuance date of the Funds’ financial statements, which require an additional disclosure in or adjustment of the Funds’ financial statements.
47
Report of Independent Registered Public Accounting Firm
TO THE BOARD OF TRUSTEES OF AMG FUNDS I AND SHAREHOLDERS OF AMG FRONTIER SMALL CAP GROWTH FUND, AMG MANAGERS EMERGING OPPORTUNITIES FUND AND AMG GW&K CORE BOND FUND:
Opinions on the Financial Statements
We have audited the accompanying statements of assets and liabilities, including the schedules of portfolio investments, of AMG Frontier Small Cap Growth Fund, AMG Managers Emerging Opportunities Fund, and AMG GW&K Core Bond Fund (three of the funds constituting AMG Funds I, hereafter collectively referred to as the “Funds”) as of October 31, 2018, the related statements of operations for the year ended October 31, 2018, the statements of changes in net assets for each of the two years in the period ended October 31, 2018, including the related notes, and the financial highlights for each of the periods indicated therein (collectively referred to as the “financial statements”). In our opinion, the financial statements present fairly, in all material respects, the financial position of each of the Funds as of October 31, 2018, the results of each of their operations for the year then ended, the changes in each of their net assets for each of the two years in the period ended October 31, 2018 and each of the financial highlights for each of the periods indicated therein in conformity with accounting principles generally accepted in the United States of America.
Basis for Opinions
These financial statements are the responsibility of the Funds’ management. Our responsibility is to express an opinion on the Funds’ financial statements based on our audits. We are a public accounting firm registered with the Public Company Accounting Oversight Board (United States) (“PCAOB”) and are required to be independent with respect to the Funds in accordance with the U.S. federal securities laws and the applicable rules and regulations of the Securities and Exchange Commission and the PCAOB.
We conducted our audits of these financial statements in accordance with the standards of the PCAOB. Those standards require that we plan and perform the audit to obtain reasonable assurance about whether the financial statements are free of material misstatement, whether due to error or fraud.
Our audits included performing procedures to assess the risks of material misstatement of the financial statements, whether due to error or fraud, and performing procedures that respond to those risks. Such procedures included examining, on a test basis, evidence regarding the amounts and disclosures in the financial statements. Our audits also included evaluating the accounting principles used and significant estimates made by management, as well as evaluating the overall presentation of the financial statements. Our procedures included confirmation of securities owned as of October 31, 2018 by correspondence with the custodian, transfer agent and brokers; when replies were not received from brokers, we performed other auditing procedures. We believe that our audits provide a reasonable basis for our opinions.
PricewaterhouseCoopers LLP
Boston, Massachusetts
December 26, 2018
We have served as the auditor of one or more investment companies in the AMG Funds Family since 1993.
48
Other Information
TAX INFORMATION
The AMG Frontier Small Cap Growth, AMG Managers Emerging Opportunities and AMG GW&K Core Bond Funds each hereby designates the maximum amount allowable of its net taxable income as qualified dividends as provided in the Jobs and Growth Tax Relief Reconciliation Act of 2003. The 2017/2018 Form 1099-DIV you receive for each Fund will show the tax status of all distributions paid to you during the year.
Pursuant to section 852 of the Internal Revenue Code, AMG Frontier Small Cap Growth, AMG Managers Emerging Opportunities and AMG GW&K Core Bond Funds each hereby designates $3,132,601, $15,239,496 and $0, respectively, as a capital gain distribution with respect to the taxable year ended October 31, 2018, or if subsequently determined to be different, the net capital gains of such fiscal year.
49
AMG Funds
Trustees and Officers
The Trustees and Officers of the Trust, their business addresses, principal occupations for the past five years and ages are listed below. The Trustees provide broad supervision over the affairs of the Trust and the Funds. The Trustees are experienced executives who meet periodically throughout the year to oversee the Funds’ activities, review contractual arrangements with companies that provide services to the Funds, and
review the Funds’ performance. Unless otherwise noted, the address of each Trustee or Officer is the address of the Trust: 600 Steamboat Road, Suite 300, Greenwich, Connecticut 06830.
There is no stated term of office for Trustees. Trustees serve until their resignation, retirement or removal in
accordance with the Trust’s organizational documents and policies adopted by the Board from time to time. The Chairman of the Trustees, President, Treasurer and Secretary of the Trust are elected by the Trustees annually. Other officers hold office at the pleasure of the Trustees.
Independent Trustees
The following Trustees are not “interested persons” of the Trust within the meaning of the 1940 Act:
| | |
Number of Funds Overseen in Fund Complex | | Name, Age, Principal Occupation(s) During Past 5 Years and Other Directorships Held by Trustee |
| |
• Trustee since 2012 | | Bruce B. Bingham, 70 |
• Oversees 59 Funds in Fund Complex | | Partner, Hamilton Partners (real estate development firm) (1987-Present); Director of The Yacktman Funds (2000-2012). |
| |
• Trustee since 2000 | | Edward J. Kaier, 73 |
• Oversees 59 Funds in Fund Complex | | Attorney at Law and Partner, Teeters Harvey Marrone & Kaier LLP (2007-Present); Attorney at Law and Partner, Hepburn Willcox Hamilton & Putnam, LLP (1977-2007); Trustee of Third Avenue Trust (5 portfolios); Trustee of Third Avenue Variable Trust (1 portfolio). |
| |
• Trustee since 2013 | | Kurt A. Keilhacker, 55 |
• Oversees 61 Funds in Fund Complex | | Managing Partner, TechFund Capital (1997-Present); Managing Partner, TechFund Europe (2000-Present); Board Member, 6wind SA, (2002-Present); Managing Partner, Elementum Ventures (2013-Present); Director, MetricStory, Inc. (2017-Present); Trustee, Gordon College (2001-2016). |
| |
• Trustee since 2000 | | Steven J. Paggioli, 68 |
• Oversees 59 Funds in Fund Complex | | Independent Consultant (2002-Present); Trustee, Professionally Managed Portfolios (32 portfolios); Advisory Board Member, Sustainable Growth Advisors, LP; Independent Director, Chase Investment Counsel (2008–Present); Executive Vice President, Secretary and Director, Investment Company Administration, LLC (1990-2001). |
| |
• Trustee since 2013 | | Richard F. Powers III, 72 |
• Oversees 59 Funds in Fund Complex | | Adjunct Professor, U.S. Naval War College (2016-Present); Adjunct Professor, Boston College (2010-2013); President and CEO of Van Kampen Investments Inc. (1998-2003). |
| |
• Independent Chairman | | Eric Rakowski, 60 |
• Trustee since 2000 • Oversees 61 Funds in Fund Complex | | Professor of Law, University of California at Berkeley School of Law—Boalt Hall (1990-Present); Director of Harding, Loevner Funds, Inc. (9 portfolios); Trustee of Third Avenue Trust (5 portfolios); Trustee of Third Avenue Variable Trust (1 portfolio). |
| |
• Trustee since 2013 | | Victoria L. Sassine, 53 |
• Oversees 61 Funds in Fund Complex | | Adjunct Professor, Babson College (2007 – Present). |
| |
• Trustee since 2000 | | Thomas R. Schneeweis, 71 |
• Oversees 59 Funds in Fund Complex | | Professor Emeritus, University of Massachusetts (2013-Present); Partner, S Capital Wealth Advisors (2015-Present); President, TRS Associates (1982-Present); Board Member, Chartered Alternative Investment Association (“CAIA”) (2002-Present); Director, CAIA Foundation (Education) (2010-Present); Director, Institute for Global Asset and Risk Management (Education) (2010-Present); Partner, S Capital Management, LLC (2007-2015); Director, CISDM at the University of Massachusetts, (1996-2013); President, Alternative Investment Analytics, LLC, (formerly Schneeweis Partners, LLC) (2001-2013); Professor of Finance, University of Massachusetts (1977-2013). |
50
AMG Funds
Trustees and Officers (continued)
Interested Trustees
Each Trustee in the following table is an “interested person” of the Trust within the meaning of the 1940 Act. Ms. Carsman is an interested person of the Trust within the meaning of the 1940 Act by virtue of her position with, and interest in securities of, AMG.
| | |
Number of Funds Overseen in Fund Complex | | Name, Age, Principal Occupation(s) During Past 5 Years and Other Directorships Held by Trustee |
| |
• Trustee since 2011 | | Christine C. Carsman, 66 |
• Oversees 61 Funds in Fund Complex | | Executive Vice President, Deputy General Counsel and Chief Regulatory Counsel, Affiliated Managers Group, Inc. (2017-Present); Director (2010-Present) and Chair of the Board of Directors (2015-Present), AMG Funds plc; Director of Harding, Loevner Funds, Inc. (9 portfolios); Senior Vice President and Deputy General Counsel, Affiliated Managers Group, Inc. (2011-2016); Senior Vice President and Chief Regulatory Counsel, Affiliated Managers Group, Inc. (2007-2011); Vice President and Chief Regulatory Counsel, Affiliated Managers Group, Inc. (2004-2007); Secretary and Chief Legal Officer, AMG Funds, AMG Funds I, AMG Funds II and AMG Funds III (2004-2011); Senior Counsel, Vice President and Director of Operational Risk Management and Compliance, Wellington Management Company, LLP (1995-2004). |
| |
| Officers | | |
| |
Position(s) Held with Fund and Length of Time Served | | Name, Age, Principal Occupation(s) During Past 5 Years |
| |
• President since 2018 | | Keitha L. Kinne, 60 |
• Principal Executive Officer since 2018 • Chief Executive Officer since 2018 • Chief Operating Officer since 2007 | | Chief Operating Officer, AMG Funds LLC (2007-Present); Chief Investment Officer, AMG Funds LLC (2008-Present); President and Principal, AMG Distributors, Inc. (2018-Present); Chief Operating Officer, AMG Distributors, Inc. (2007-Present); President, Chief Executive Officer and Principal Executive Officer, AMG Funds, AMG Funds I, AMG Funds II, AMG Funds III and AMG Funds IV (2018-Present); Chief Operating Officer, AMG Funds, AMG Funds I, AMG Funds II, and AMG Funds III (2007-Present); Chief Operating Officer, AMG Funds IV (2016-Present); Chief Operating Officer and Chief Investment Officer, Aston Asset Management, LLC (2016); President and Principal Executive Officer, AMG Funds, AMG Funds I, AMG Funds II and AMG Funds III (2012-2014); Managing Partner, AMG Funds LLC (2007-2014); President and Principal, AMG Distributors, Inc. (2012-2014); Managing Director, Legg Mason & Co., LLC (2006-2007); Managing Director, Citigroup Asset Management (2004-2006). |
| |
• Secretary since 2015 | | Mark J. Duggan, 53 |
• Chief Legal Officer since 2015 | | Senior Vice President and Senior Counsel, AMG Funds LLC (2015-Present); Secretary and Chief Legal Officer, AMG Funds, AMG Funds I, AMG Funds II, AMG Funds III and AMG Funds IV (2015-Present); Attorney, K&L Gates, LLP (2009-2015). |
| |
• Chief Financial Officer since 2017 • Treasurer since 2017 • Principal Financial Officer since 2017 • Principal Accounting Officer since 2017 | | Thomas G. Disbrow, 52 |
| | Vice President, Mutual Fund Treasurer & CFO, AMG Funds, AMG Funds LLC (2017-Present); Chief Financial Officer, Principal Financial Officer, Treasurer and Principal Accounting Officer, AMG Funds, AMG Funds I, AMG Funds II, AMG Funds III and AMG Funds IV (2017-Present); Managing Director—Global Head of Traditional Funds Product Control, UBS Asset Management (Americas), Inc. (2015-2017); Managing Director—Head of North American Funds Treasury, UBS Asset Management (Americas), Inc. (2011-2015). |
| |
• Deputy Treasurer since 2017 | | John A. Starace, 48 |
| | Director, Mutual Fund Accounting, AMG Funds LLC (2017-Present); Vice President, Deputy Treasurer of Mutual Funds Services, AMG Funds LLC (2014-2017); Deputy Treasurer, AMG Funds, AMG Funds I, AMG Funds II, AMG Funds III and AMG Funds IV (2017-Present); Vice President, Citi Hedge Fund Services (2010-2014); Audit Senior Manager (2005-2010) and Audit Manager (2001-2005), Deloitte & Touche LLP. |
| |
• Controller since 2017 | | Christopher R. Townsend, 51 |
| | Vice President, Business Finance, AMG Funds LLC (2017-Present); Head of Business Finance, AMG Funds LLC (2015-2017); Chief Financial Officer and Financial and Operations Principal, AMG Distributors, Inc. (2016-Present); Controller, AMG Funds, AMG Funds I, AMG Funds II, AMG Funds III and AMG Funds IV (2017-Present); Treasurer, Chief Financial Officer, Principal Financial Officer, Principal Accounting Officer, AMG Funds, AMG Funds I, AMG Funds II, AMG Funds III and AMG Funds IV (2017); Chief Financial Officer, Aston Asset Management LLC (2016); Head of Finance and Accounting, Allianz Asset Management (2006-2015). |
| |
• Chief Compliance Officer since 2016 | | Gerald F. Dillenburg, 51 |
| | Vice President, Chief Compliance Officer AMG Funds, AMG Funds LLC (2017-Present); Chief Compliance Officer AMG Funds, AMG Funds LLC (2016-2017); Chief Compliance Officer and Sarbanes-Oxley Code of Ethics Compliance Officer, AMG Funds, AMG Funds I, AMG Funds II and AMG Funds III (2016-Present); Chief Compliance Officer, AMG Funds IV (1996-Present); Sarbanes-Oxley Code of Ethics Compliance Officer, AMG Funds IV (2016-Present); Chief Compliance Officer, AstonAsset Management, LLC (2006-2016); Chief Operating Officer, Aston Funds (2003-2016); Secretary, Aston Funds (1996-2015); Chief Financial Officer, Aston Funds (1997-2010); Chief Financial Officer, Aston Asset Management, LLC (2006-2010); Treasurer, Aston Funds (1996-2010). |
51
AMG Funds
Trustees and Officers (continued)
| | |
Position(s) Held with Fund and Length of Time Served | | Name, Age, Principal Occupation(s) During Past 5 Years |
| |
• Anti-Money Laundering Compliance Officer since 2014 | | Patrick J. Spellman, 44 |
| | Vice President, Chief Compliance Officer, AMG Funds LLC (2017-Present); Senior Vice President, Chief Compliance Officer, AMG Funds LLC (2011-2017); Chief Compliance Officer, AMG Distributors, Inc., (2010-Present); Anti-Money Laundering Compliance Officer, AMG Funds, AMG Funds I, AMG Funds II, and AMG Funds III (2014-Present); Anti-Money Laundering Officer, AMG Funds IV, (2016-Present); Compliance Manager, Legal and Compliance, Affiliated Managers Group, Inc. (2005-2011). |
| |
• Assistant Secretary since 2016 | | Maureen A. Meredith, 33 |
| | Director, Counsel, AMG Funds LLC (2017-Present); Vice President, Counsel, AMG Funds LLC (2015-2017); Assistant Secretary, AMG Funds, AMG Funds I, AMG Funds II, AMG Funds III and AMG Funds IV (2016-Present); Associate, Ropes & Gray LLP (2011-2015); Law Fellow, Massachusetts Appleseed Center for Law and Justice (2010-2011). |
52
Annual Renewal of Investment Management and Subadvisory Agreements
At an in-person meeting held on June 27-28, 2018, the Board of Trustees (the “Board” or the “Trustees”), and separately a majority of the Trustees who are not “interested persons” of AMG Funds I (the “Trust”) (the “Independent Trustees”), approved (i) the Investment Management Agreement, as amended pursuant to letter agreements at any time prior to the date of the meeting, with AMG Funds LLC (the “Investment Manager”) for each of AMG Managers Emerging Opportunities Fund, AMG Frontier Small Cap Growth Fund and AMG GW&K Core Bond Fund (each, a “Fund,” and collectively, the “Funds”) and separately each of Amendment No. 1 thereto dated July 1, 2015, and Amendment No. 2 thereto dated October 1, 2016 (collectively, the “Investment Management Agreements”) and (ii) the Subadvisory Agreement, as amended at any time prior to the date of the meeting, with the applicable Subadviser for each Fund (collectively, the “Subadvisory Agreements”). The Independent Trustees were separately represented by independent legal counsel in connection with their consideration of the approval of these agreements. In considering the Investment Management Agreements and the Subadvisory Agreements, the Trustees reviewed a variety of materials relating to each Fund, the Investment Manager and each Subadviser, including comparative performance, fee and expense information for an appropriate peer group of similar mutual funds (each, a “Peer Group”), performance information for the relevant benchmark index for each Fund (each, a “Fund Benchmark”) and, with respect to each applicable Subadviser, comparative performance information for an appropriate peer group of managed accounts, and other information provided to them on a periodic basis throughout the year, as well as information provided in connection with the meetings of June 27-28, 2018, regarding the nature, extent and quality of services provided by the Investment Manager and the Subadvisers under their respective agreements and other relevant matters. Prior to voting, the Independent Trustees: (a) reviewed the foregoing information with their independent legal counsel; (b) received materials from their independent legal counsel discussing the legal standards applicable to their consideration of the Investment Management and Subadvisory Agreements; and (c) met with their independent legal counsel in private sessions at which no representatives of management were present.
NATURE, EXTENT AND QUALITY OF SERVICES
In considering the nature, extent and quality of the services provided by the Investment Manager, the Trustees reviewed information relating to the
Investment Manager’s operations and personnel. Among other things, the Investment Manager provided financial information, biographical information on its supervisory and professional staff and descriptions of its organizational and management structure. The Trustees also took into account information provided periodically throughout the previous year by the Investment Manager in Board meetings relating to the performance of its duties with respect to the Funds and the Trustees’ knowledge of the Investment Manager’s management and the quality of the performance of the Investment Manager’s duties under the Investment Management Agreement and Administration Agreement. In the course of their deliberations regarding the Investment Manager, the Trustees evaluated, among other things: (a) the extent and quality of the Investment Manager’s oversight of the operation and management of the Funds; (b) the quality of the search, selection and monitoring services performed by the Investment Manager in overseeing the portfolio management responsibilities of the Subadvisers; (c) the Investment Manager’s ability to supervise the Funds’ other service providers; and (d) the Investment Manager’s compliance program. The Trustees also took into account that, in performing its functions under the Investment Management Agreements and supervising each Subadviser, the Investment Manager: performs periodic detailed analyses and reviews of the performance by each Subadviser of its obligations to a Fund, including without limitation, analysis and review of portfolio and other compliance matters and review of each Subadviser’s investment performance with respect to a Fund; prepares and presents periodic reports to the Board regarding the investment performance of each Subadviser and other information regarding each Subadviser, at such times and in such forms as the Board may reasonably request; reviews and considers any changes in the personnel of each Subadviser responsible for performing the Subadviser’s obligations and makes appropriate reports to the Board; reviews and considers any changes in the ownership or senior management of each Subadviser and makes appropriate reports to the Board; performs periodic in-person or telephonic diligence meetings, including with respect to compliance matters, with representatives of each Subadviser; assists the Board and management of the Trust in developing and reviewing information with respect to the initial approval of each
Subadvisory Agreement and annual consideration of each Subadvisory Agreement thereafter; prepares recommendations with respect to the continued retention of any Subadviser or the replacement of any Subadviser, including at the request of the Board; identifies potential successors to or replacements of any subadviser or potential additional Subadvisers, performs appropriate due diligence, and develops and presents to the Board a recommendation as to any such successor, replacement, or additional subadviser, including at the request of the Board; designates and compensates from its own resources such personnel as the Investment Manager may consider necessary or appropriate to the performance of its services; and performs such other review and reporting functions as the Board shall reasonably request consistent with the Investment Management Agreements and applicable law. With respect to AMG Frontier Small Cap Growth Fund and AMG GW&K Core Bond Fund, the Trustees noted the affiliation of each Subadviser with the Investment Manager, noting any potential conflicts of interest. The Trustees also took into account the financial condition of the Investment Manager with respect to its ability to provide the services required under the Investment Management Agreements and the Investment Manager’s undertaking to maintain contractual expense limitations for the Funds. The Trustees also considered the Investment Manager’s risk management processes.
The Trustees also reviewed information relating to each Subadviser’s operations and personnel and the investment philosophy, strategies and techniques (for each Subadviser, its “Investment Strategy”) used in managing a Fund or the portion of a Fund for which the Subadviser has portfolio management responsibility. Among other things, the Trustees reviewed biographical information on portfolio management and other professional staff, information regarding each Subadviser’s organizational and management structure and each Subadviser’s brokerage policies and practices. The Trustees considered specific information provided regarding the experience of the individual(s) at each Subadviser with portfolio management responsibility for a Fund or the portion of a Fund managed by the Subadviser, including the information set forth in the Fund’s prospectus and statement of additional information. With respect to AMG Managers Emerging Opportunities Fund, which is managed by multiple Subadvisers, the Trustees also noted
53
Annual Renewal of Investment Management and Subadvisory Agreements (continued)
information provided by the Investment Manager regarding the manner in which each Subadviser’s Investment Strategy complements those utilized by the Fund’s other Subadvisers. In the course of their deliberations, the Trustees evaluated, among other things: (a) the services rendered by each Subadviser in the past; (b) the qualifications and experience of the Subadviser’s personnel; and (c) the Subadviser’s compliance program. The Trustees also took into account the financial condition of each Subadviser with respect to its ability to provide the services required under its Subadvisory Agreement. The Trustees also considered each Subadviser’s risk management processes.
PERFORMANCE
As noted above, the Board considered each Fund’s net performance during relevant time periods as compared to each Fund’s Peer Group and Fund Benchmark and considered each applicable Subadviser’s performance as compared to an appropriate peer group of managed accounts and also considered the gross performance of the Fund or the portion of the Fund managed by each Subadviser as compared to the Subadviser’s relevant performance composite that utilizes the same investment strategy and approach and noted that the Board reviews on a quarterly basis detailed information about both the Fund’s performance results and portfolio composition, as well as the Subadviser’s Investment Strategy, including, with respect to AMG Managers Emerging Opportunities Fund, the portion of the Fund managed by each Subadviser. The Board noted the Investment Manager’s expertise and resources in monitoring the performance, investment style and risk-adjusted performance of each Subadviser. The Board also noted each Subadviser’s performance record with respect to AMG Managers Emerging Opportunities Fund. The Board was mindful of the Investment Manager’s attention to monitoring each Subadviser’s performance with respect to the Funds and its discussions with management regarding the factors that contributed to the performance of the Funds.
ADVISORY FEES AND PROFITABILITY
In considering the reasonableness of the advisory fee charged by the Investment Manager for managing each Fund, the Trustees noted that the Investment Manager, and not the Fund, is responsible for paying the fees charged by the Fund’s Subadviser(s) and, therefore, that the fees paid to the Investment Manager cover the cost of providing portfolio management services as well as
the cost of providing search, selection and monitoring services in operating a “manager-of-managers” complex of mutual funds. The Trustees also considered the amount of the advisory fee retained by the Investment Manager after payment of the subadvisory fee(s) with respect to each Fund. The Trustees also noted any payments that were made from Frontier Capital Management Company, LLC (“Frontier”) and GW&K Investment Management, LLC (“GW&K”) to the Investment Manager, and any other payments made or to be made from the Investment Manager to Frontier and GW&K. The Trustees concluded that, in light of the high quality supervisory services provided by the Investment Manager and the fact that the subadvisory fees are paid out of the advisory fee, the advisory fee payable by each Fund to the Investment Manager can reasonably be expected to exceed the median advisory fee for the Peer Group, which consists of many funds that do not operate with a manager-of-managers structure. In this regard, the Trustees also noted that the Investment Manager has undertaken to maintain contractual expense limitations for the Funds.
In addition, in considering the reasonableness of the advisory fee payable to the Investment Manager, the Trustees also reviewed information provided by the Investment Manager setting forth all revenues and other benefits, both direct and indirect (including any so-called “fallout benefits” such as reputational value derived from the Investment Manager serving as Investment Manager to a Fund), received by the Investment Manager and its affiliates attributable to managing each Fund and all the mutual funds in the AMG Funds Family of Funds, the cost of providing such services, the significant risks undertaken as Investment Manager and sponsor of the Funds, including investment, operational, enterprise, entrepreneurial, litigation, regulatory and compliance risks, and the resulting profitability to the Investment Manager and its affiliates from these relationships. The Trustees also noted the current asset levels of each Fund and the willingness of the Investment Manager to waive fees and pay expenses for all of the Funds from time to time as a means of limiting total expenses. The Trustees also considered management’s discussion of the current asset levels of the Funds, and the impact on profitability of both the current asset levels and any future growth of assets of the Funds. The Board took into account management’s discussion of the advisory fee structure, and, as noted above, the services the Investment Manager provides in performing its
functions under the Investment Management Agreements and supervising each Subadviser. In this regard, the Trustees noted that, unlike a mutual fund that is managed by a single investment adviser, the Funds operate in a manager-of-managers structure. Based on the foregoing, the Trustees concluded that the profitability to the Investment Manager is reasonable and that the Investment Manager is not realizing material benefits from economies of scale that would warrant adjustments to the advisory fees for any Fund at this time. With respect to economies of scale, the Trustees also noted that as a Fund’s assets increase over time, the Fund may realize other economies of scale to the extent that the increase in assets is proportionally greater than the increase in certain other expenses.
SUBADVISORY FEES AND PROFITABILITY
In considering the reasonableness of the fee payable by the Investment Manager to each Subadviser of AMG Managers Emerging Opportunities Fund, the Trustees relied on the ability of the Investment Manager to negotiate the terms of the Subadvisory Agreement at arm’s length as part of the manager-of-managers structure, noting that each Subadviser of AMG Managers Emerging Opportunities Fund is not affiliated with the Investment Manager. In addition, the Trustees considered other potential benefits of the subadvisory relationship to a Subadviser, including, among others, the indirect benefits that the Subadviser may receive from the Subadviser’s relationship with AMG Managers Emerging Opportunities Fund, including any so-called “fallout benefits” to the Subadviser, such as reputational value derived from the Subadviser serving as Subadviser to the Fund. In addition, the Trustees noted that the subadvisory fees are paid by the Investment Manager out of its advisory fee. As a consequence of all of the foregoing, the cost of services to be provided by each unaffiliated Subadviser and the profitability to the Subadviser of its relationship with AMG Managers Emerging Opportunities Fund were not material factors in the Trustees’ deliberations. For similar reasons, the Trustees did not consider potential economies of scale in the management of the portion of AMG Managers Emerging Opportunities Fund managed by each unaffiliated Subadviser to be a material factor in their deliberations at this time.
In considering the reasonableness of the fees payable by the Investment Manager to each of Frontier and GW&K, the Trustees noted that each of
54
Annual Renewal of Investment Management and Subadvisory Agreements (continued)
Frontier and GW&K is an affiliate of the Investment Manager, and the Trustees reviewed information regarding the cost to Frontier and GW&K, respectively, of providing subadvisory services to a Fund and the resulting profitability from such relationship. The Trustees noted that, because each of Frontier and GW&K is an affiliate of the Investment Manager, a portion of Frontier’s or GW&K’s revenues or profits might be shared directly or indirectly with the Investment Manager. The Trustees also noted that the subadvisory fees are paid by the Investment Manager out of its advisory fee. The Board also took into account management’s discussion of the subadvisory fee structure, and the services each of Frontier and GW&K provides in performing its functions under the applicable Subadvisory Agreement. Based on the foregoing, the Trustees concluded that the profitability to each of Frontier and GW&K is reasonable and that neither Frontier nor GW&K is realizing material benefits from economies of scale that would warrant adjustments to the subadvisory fees at this time. Also with respect to economies of scale, the Trustees noted that as a Fund’s assets increase over time, the Fund may realize other economies of scale to the extent the increase in assets is proportionally greater than the increase in certain other expenses.
In addition to the foregoing, the Trustees considered the specific factors and related conclusions set forth below with respect to each Fund, the Investment Manager and each Subadviser.
AMG Managers Emerging Opportunities Fund
FUND PERFORMANCE
Among other information relating to the Fund’s performance, the Trustees noted that the Fund’s performance for Class N shares (which share class has the earliest inception date and the largest amount of assets of all the share classes of the Fund) for the 1-year, 3-year, 5-year and 10-year periods ended March 31, 2018 was above the median performance of the Peer Group and above the performance of the Fund Benchmark, the Russell Microcap Index. The Trustees took into account management’s discussion of the Fund’s performance, noting that Class N shares of the Fund ranked in the top decile relative to its Peer Group for the 1-year, 5-year and 10- year periods and in the top quintile relative to its Peer Group for the 3-year period. The Trustees concluded that the Fund’s overall performance has been satisfactory.
ADVISORY AND SUBADVISORY FEES
The Trustees noted that the Fund’s management fees (which include both the advisory and administration fees) and total expenses (weighted average, all classes combined) (net of applicable expense waivers/reimbursements) as of March 31, 2018 were both higher than the average for the Peer Group. The Trustees took into account the fact that the Investment Manager has contractually agreed, through March 1, 2019, to limit the Fund’s net annual operating expenses (subject to certain excluded expenses) to 1.18%. The Trustees took into account management’s discussion of the Fund’s expenses and competitiveness with comparably sized funds. The Trustees concluded that, in light of the nature, extent and quality of the services provided by the Investment Manager and the Subadvisers, the foregoing expense limitation and the considerations noted above with respect to the Investment Manager and the Subadvisers, the Fund’s advisory and subadvisory fees are reasonable.
AMG Frontier Small Cap Growth Fund
FUND PERFORMANCE
Among other information relating to the Fund’s performance, the Trustees noted that the Fund’s performance for Class I shares (which share class has the earliest inception date and the largest amount of assets of all the share classes of the Fund) for the 1-year, 3-year, 5-year and 10-year periods ended March 31, 2018 was above, below, below and below, respectively, the median performance of the Peer Group and above, below, below and below, respectively, the performance of the Fund Benchmark, the Russell 2000 Growth Index. The Trustees took into account management’s discussion of the Fund’s performance, including the reasons for the Fund’s underperformance. The Trustees also considered the Fund’s more recent improved performance, noting that Class I shares of the Fund ranked in the top quartile relative to its Peer Group for the 1-year period. The Trustees concluded that the Fund’s overall performance has been satisfactory in light of the Fund’s investment objective, strategies and policies.
ADVISORY AND SUBADVISORY FEES
The Trustees noted that the Fund’s management fees (which include both the advisory and administration fees) and total expenses (weighted average, all
classes combined) (net of applicable expense waivers/reimbursements) as of March 31, 2018 were both lower than the average for the Peer Group. The Trustees took into account the fact that the Investment Manager has contractually agreed, through March 1, 2019, to limit the Fund’s net annual operating expenses (subject to certain excluded expenses) to 0.90%. The Trustees noted that the Investment Manager reduced the Fund’s expense limitation in 2017. The Trustees concluded that, in light of the nature, extent and quality of the services provided by the Investment Manager and the Subadviser (which is an affiliate of the Investment Manager), the foregoing expense limitation and the considerations noted above with respect to the Investment Manager and the Subadviser, the Fund’s advisory and subadvisory fees are reasonable.
AMG GW&K Core Bond Fund
FUND PERFORMANCE
Among other information relating to the Fund’s performance, the Trustees noted that the Fund’s performance for Class I shares (which share class has the earliest inception date and the largest amount of assets of all the share classes of the Fund) for the 1-year, 3-year, 5-year and 10-year periods ended March 31, 2018 was below, below, below and above, respectively, the median performance of the Peer Group and at, below, below and above, respectively, the performance of the Fund Benchmark, the Bloomberg Barclays U.S. Aggregate Bond Index. The Trustees took into account management’s discussion of the Fund’s performance, including the reasons for the Fund’s underperformance. The Trustees noted that the Fund’s longer-term performance is partially attributable to the previous subadviser, which was replaced in 2015. The Trustees concluded that the Fund’s overall performance has been satisfactory in light of the Fund’s investment objective, strategies and policies.
ADVISORY AND SUBADVISORY FEES
The Trustees noted that the Fund’s management fees (which include both the advisory and administration fees) and total expenses (weighted average, all
55
Annual Renewal of Investment Management and Subadvisory Agreements (continued)
classes combined) (net of applicable expense waivers/reimbursements) as of March 31, 2018 were both lower than the average for the Peer Group. The Trustees took into account the fact that the Investment Manager has contractually agreed, through March 1, 2019, to limit the Fund’s net annual operating expenses (subject to certain excluded expenses) to 0.48%. The Trustees concluded that, in light of the nature, extent and quality of the services provided by the Investment Manager and the Subadviser (which is an affiliate of the Investment Manager), the foregoing expense limitation and the considerations noted above with respect to the Investment Manager and the Subadviser, the Fund’s advisory and subadvisory fees are reasonable.
* * * *
After consideration of the foregoing, the Trustees also reached the following conclusions (in addition to the conclusions discussed above) regarding each Investment Management Agreement and each Subadvisory Agreement: (a) the Investment Manager and each Subadviser have demonstrated that they possess the capability and resources to perform the duties required of them under each Investment Management Agreement and the applicable Subadvisory Agreements; (b) each Subadviser’s Investment Strategy is appropriate for pursuing the applicable Fund’s investment objectives; and (c) the Investment Manager and each Subadviser maintain appropriate compliance programs.
Based on all of the above-mentioned factors and their related conclusions, with no single factor or conclusion being determinative and with each Trustee not necessarily attributing the same weight to each factor, the Trustees concluded that approval of each Investment Management Agreement and each Subadvisory Agreement would be in the best interests of the applicable Fund and its shareholders. Accordingly, on June 27-28, 2018, the Trustees, and separately a majority of the Independent Trustees, voted to approve the Investment Management and the Subadvisory Agreements for each Fund.
56
INVESTMENT MANAGER AND ADMINISTRATOR
AMG Funds LLC
600 Steamboat Road, Suite 300
Greenwich, CT 06830
800.835.3879
DISTRIBUTOR
AMG Distributors, Inc.
600 Steamboat Road, Suite 300
Greenwich, CT 06830
800.835.3879
CUSTODIAN
The Bank of New York Mellon
111 Sanders Creek Parkway
East Syracuse, NY 13057
LEGAL COUNSEL
Ropes & Gray LLP
Prudential Tower, 800 Boylston Street
Boston, MA 02199-3600
TRANSFER AGENT
BNY Mellon Investment Servicing (US) Inc.
Attn: AMG Funds
P.O. Box 9769
Providence, RI 02940
800.548.4539
This report is prepared for the Funds’ shareholders. It is authorized for distribution to prospective investors only when preceded or accompanied by an effective prospectus. To receive a free copy of the prospectus or Statement of Additional Information, which includes additional information about Fund Trustees, please contact us by calling 800.835.3879. Distributed by AMG Distributors, Inc., member FINRA/SIPC.
Current net asset values per share for each Fund are available on the Funds’ website at amgfunds.com.
A description of the policies and procedures each Fund uses to vote its proxies is available: (i) without charge, upon request, by calling 800.835.3879, or (ii) on the Securities and Exchange Commission’s (SEC) website at sec.gov. For information regarding each Fund’s proxy voting record for the 12-month period ended June 30, call 800.835.3879 or visit the SEC website at sec.gov.
Each Fund files its complete schedule of portfolio holdings with the SEC for the first and third quarters of each fiscal year on Form N-Q. The Fund’s Forms N-Q are available on the SEC’s website at sec.gov. To review a complete list of the Funds’ portfolio holdings, or to view the most recent quarterly holdings report, semiannual report, or annual report, please visit amgfunds.com.
AFFILIATE SUBADVISED FUNDS
BALANCED FUNDS
AMG Chicago Equity Partners Balanced
Chicago Equity Partners, LLC
AMG FQ Global Risk-Balanced
First Quadrant, L.P.
EQUITY FUNDS
AMG FQ Tax-Managed U.S. Equity
AMG FQ Long-Short Equity
First Quadrant, L.P.
AMG Frontier Small Cap Growth
Frontier Capital Management Co., LLC
AMG GW&K Small Cap Core
AMG GW&K Small/Mid Cap
AMG GW&K U.S. Small Cap Growth
GW&K Investment Management, LLC
AMG Renaissance International Equity
AMG Renaissance Large Cap Growth
The Renaissance Group LLC
AMG River Road Dividend All Cap Value
AMG River Road Dividend All Cap Value II
AMG River Road Focused Absolute Value
AMG River Road Long-Short
AMG River Road Small-Mid Cap Value
AMG River Road Small Cap Value
River Road Asset Management, LLC
AMG SouthernSun Small Cap
AMG SouthernSun Global Opportunities
AMG SouthernSun U.S. Equity
SouthernSun Asset Management, LLC
AMG Systematic Mid Cap Value
Systematic Financial Management L.P.
AMG TimesSquare Emerging Markets Small Cap
AMG TimesSquare Global Small Cap
AMG TimesSquare International Small Cap
AMG TimesSquare Mid Cap Growth
AMG TimesSquare Small Cap Growth
TimesSquare Capital Management, LLC
AMG Trilogy Emerging Markets Equity
AMG Trilogy Emerging Wealth Equity
Trilogy Global Advisors, L.P.
AMG Yacktman
AMG Yacktman Focused
AMG Yacktman Focused Fund—Security Selection Only
AMG Yacktman Special Opportunities
Yacktman Asset Management LP
FIXED INCOME FUNDS
AMG GW&K Core Bond
AMG GW&K Enhanced Core Bond
AMG GW&K Municipal Bond
AMG GW&K Municipal Enhanced Yield
GW&K Investment Management, LLC
OPEN-ARCHITECTURE FUNDS
ALTERNATIVE FUNDS
AMG Managers Lake Partners LASSO Alternative
Lake Partners, Inc.
EQUITY FUNDS
AMG Managers Brandywine
AMG Managers Brandywine Advisors Mid Cap Growth
AMG Managers Brandywine Blue
Friess Associates, LLC
AMG Managers Cadence Emerging Companies
AMG Managers Cadence Mid Cap
Cadence Capital Management LLC
AMG Managers CenterSquare Real Estate
CenterSquare Investment Management LLC
AMG Managers Emerging Opportunities
Lord, Abbett & Co. LLC
WEDGE Capital Management L.L.P.
Next Century Growth Investors LLC
RBC Global Asset Management (U.S.) Inc.
AMG Managers Essex Small/Micro Cap Growth
Essex Investment Management Company, LLC
AMG Managers Fairpointe ESG Equity
AMG Managers Fairpointe Mid Cap
Fairpointe Capital LLC
AMG Managers Guardian Capital Global Dividend
Guardian Capital LP
AMG Managers LMCG Small Cap Growth
LMCG Investments, LLC
AMG Managers Montag & Caldwell Growth
Montag & Caldwell, LLC
AMG Managers Pictet International
Pictet Asset Management Limited
AMG Managers Silvercrest Small Cap
Silvercrest Asset Management Group LLC
AMG Managers Skyline Special Equities
Skyline Asset Management, L.P.
AMG Managers Special Equity
Ranger Investment Management, L.P.
Lord, Abbett & Co. LLC
Smith Asset Management Group, L.P.
Federated MDTA LLC
AMG Managers Value Partners Asia Dividend
Value Partners Hong Kong Limited
FIXED INCOME FUNDS
AMG Managers Amundi Intermediate Government
AMG Managers Amundi Short Duration Government
Amundi Pioneer Institutional Asset Management, Inc.
AMG Managers Doubleline Core Plus Bond
DoubleLine Capital LP
AMG Managers Global Income Opportunity
AMG Managers Loomis Sayles Bond
Loomis, Sayles & Company, L.P.
| | |
| amgfunds.com | | 103118 AR022 |
Item 2. CODE OF ETHICS
Registrant has adopted a Code of Ethics. See attached Exhibit (a)(1).
Item 3. AUDIT COMMITTEE FINANCIAL EXPERT
Registrant’s Board of Trustees has determined that independent Trustee Mr. Steven J. Paggioli qualifies as an Audit Committee Financial Expert. Mr. Paggioli is “independent” as such term is defined in Form N-CSR.
Item 4. PRINCIPAL ACCOUNTANT FEES AND SERVICES
(a) Audit Fees
The aggregate fees billed by the Funds’ independent registered public accounting firm, PricewaterhouseCoopers LLP (“PwC”), to the Funds for the Funds’ two most recent fiscal years for professional services rendered for audits of annual financial statements, or services that are normally provided in connection with statutory and regulatory filings or engagements (“Audit Fees”) were as follows:
| | | | | | | | |
| | | Fiscal
2018 | | | Fiscal
2017 | |
AMG FQ Tax-Managed U.S. Equity Fund | | $ | 20,714 | | | $ | 21,412 | |
AMG FQ Long-Short Equity Fund | | $ | 32,976 | | | $ | 30,609 | |
AMG FQ Global Risk-Balanced Fund | | $ | 27,819 | | | $ | 26,059 | |
AMG Frontier Small Cap Growth Fund | | $ | 19,796 | | | $ | 20,272 | |
AMG Managers Emerging Opportunities Fund | | $ | 20,356 | | | $ | 21,265 | |
AMG GW&K Core Bond Fund | | $ | 39,034 | | | $ | 41,190 | |
(b) Audit-Related Fees
There were no fees billed by PwC to the Funds in its two recent fiscal years for services rendered for assurance and related services that are reasonably related to the performance of the audit or review of the Fund’s financial statements, but are not reported as Audit Fees (“Audit-Related Fees”).
For the Funds’ two most recent fiscal years, there were no Audit-Related Fees billed by PwC for engagements related directly to the operations and financial reporting of one or more Funds by a Fund Service Provider. A Fund Service Provider is (a) any investment adviser to the Fund (not including any Subadvisor whose role is primarily portfolio management and is subcontracted with or overseen by another investment adviser) or (b) any entity that provides ongoing services to the Fund and is controlling, controlled by or under common control with a Fund investment adviser described in (a).
(c) Tax Fees
The aggregate fees billed by PwC to the Funds for the two most recent fiscal years for professional services rendered for tax compliance, tax advice, and tax planning (“Tax Fees”) were as follows:
| | | | | | | | |
| | | Fiscal
2018 | | | Fiscal
2017 | |
AMG FQ Tax-Managed U.S. Equity Fund | | $ | 7,774 | | | $ | 7,369 | |
AMG FQ Long-Short Equity Fund | | $ | 12,142 | | | $ | 11,463 | |
AMG FQ Global Risk-Balanced Fund | | $ | 10,782 | | | $ | 10,195 | |
AMG Frontier Small Cap Growth Fund | | $ | 7,774 | | | $ | 7,369 | |
AMG Managers Emerging Opportunities Fund | | $ | 8,939 | | | $ | 8,471 | |
AMG GW&K Core Bond Fund | | $ | 9,893 | | | $ | 9,362 | |
For the Funds’ two most recent fiscal years, Tax Fees billed by PwC for engagements by Fund Service Providers that related directly to the operations and financial reporting of the Funds were $0 for fiscal 2018 and $0 for fiscal 2017, respectively.
The services for which Tax Fees were charged comprise all services performed by professional staff in PwC’s tax division except those services related to the audit. Typically, this category would include fees for tax compliance, tax planning, and tax advice. Tax compliance, tax advice, and tax planning services include preparation of original and amended tax returns, claims for refund and tax payment-planning services, assistance with tax audits and appeals, tax advice related to mergers and acquisitions and requests for rulings or technical advice from taxing authorities.
(d) All Other Fees
There were no other fees billed by PwC to the Funds for all other non-audit services (“Other Fees”) during the Funds’ two most recent fiscal years. During the same period, there were no Other Fees billed by PwC for engagements by Fund Service Providers that related directly to the operations and financial reporting of the Funds.
(e)(1) According to policies adopted by the Audit Committee, services provided by PwC to the Funds must be pre-approved by the Audit Committee. On an annual basis, the Audit Committee reviews and pre-approves various types of services that PwC may perform for the Funds without specific approval of each engagement, subject to specified budget limitations. As contemplated by the Sarbanes-Oxley Act of 2002 and related SEC rules, the Audit Committee also pre-approves non-audit services provided by PwC to any Fund Service Provider for any engagement that relates directly to the operations and financial reporting of the Funds. Any engagement that is not already pre-approved or that will exceed a pre-approved budget must be submitted to the Audit Committee for pre-approval. The Chairman of the Audit Committee is authorized on behalf of the Board of Trustees and the Audit Committee to approve the engagement of PwC to perform non-audit services subject to certain conditions, including notification to the Audit Committee of such pre-approval not later than the next meeting of the Audit Committee following the date of such pre-approval.
(e)(2) None.
(f) Not applicable.
(g) The aggregate fees billed by PwC in 2018 and 2017 for non-audit services rendered to the Funds and Fund Service Providers were $106,804 and $144,504, respectively. For the fiscal year ended October 31, 2018, this amount reflects the amounts disclosed above in Item 4(b), (c), (d), plus $49,500 in fees billed to the Fund Service Providers for non-audit services that did not relate directly to the operations and financial reporting of the Funds. For the fiscal year ended October 31, 2017, this amount reflects the amounts disclosed above in Item 4(b),(c),(d), plus $80,850 in fees billed to the Fund Service Providers for non-audit services that did not relate directly to the operations and financial reporting of the Funds.
(h) The Trust’s Audit Committee has considered whether the provision of non-audit services by registrant’s independent registered public accounting firm to the registrant’s investment advisor, and any entity controlling, controlled, or under common control with the investment advisor that provided ongoing services to the registrant that were not pre-approved by the Committee (because such services did not relate directly to the operations and financial reporting of the registrant) was compatible with maintaining the independence of the independent registered public accounting firm.
Item 5. AUDIT COMMITTEE OF LISTED REGISTRANTS
Not applicable.
Item 6. SCHEDULE OF INVESTMENTS
The schedule of investments in unaffiliated issuers as of the close of the reporting period is included as part of the shareholder report contained in Item 1 hereof.
Item 7. DISCLOSURE OF PROXY VOTING POLICIES AND PROCEDURES FOR CLOSED-END MANAGEMENT INVESTMENT COMPANIES
Not applicable.
Item 8. PORTFOLIO MANAGERS OF CLOSED-END MANAGEMENT INVESTMENT COMPANIES
Not applicable.
Item 9. PURCHASES OF EQUITY SECURITIES BY CLOSED-END MANAGEMENT INVESTMENT COMPANIES AND AFFILIATED PURCHASERS
Not applicable.
Item 10. SUBMISSION OF MATTERS TO A VOTE OF SECURITY HOLDERS
Not applicable.
Item 11. CONTROLS AND PROCEDURES
(a) The Registrant’s principal executive and principal financial officers have concluded, based on their evaluation of the registrant’s disclosure controls and procedures as of a date within 90
days of the filing of this report, that the Registrant’s disclosure controls and procedures are reasonably designed to ensure that information required to be disclosed by the Registrant on Form N-CSR is recorded, processed, summarized and reported within the required time periods and that information required to be disclosed by the registrant in the reports that it files or submits on Form N-CSR is accumulated and communicated to the Registrant’s management, including its principal executive and principal financial officers, as appropriate to allow timely decisions regarding required disclosure.
(b) There were no changes in the Registrant’s internal control over financial reporting during the Registrant’s fourth fiscal quarter of the period covered by this report that have materially affected, or are reasonably likely to affect, the internal control over financial reporting.
Item 12. DISCLOSURE OF SECURITIES LENDING ACTIVITIES FOR CLOSED-END MANAGEMENT INVESTMENT COMPANIES
Not applicable.
| | |
| Item 13. EXHIBITS |
| |
| (a) (1) | | Any Code of Ethics or amendments hereto. Filed herewith. |
| |
| (a) (2) | | Certifications pursuant to Rule 30a-2(a) under the Investment Company Act of 1940 - Filed herewith. |
| |
| (a) (3) | | Not applicable. |
| |
| (b) | | Certificationspursuant to Rule 30a-2(b) under the Investment Company Act of 1940 - Filed herewith. |
SIGNATURES
Pursuant to the requirements of the Securities Exchange Act of 1934 and the Investment Company Act of 1940, the registrant has duly caused this report to be signed on its behalf by the undersigned, thereunto duly authorized.
| | |
| AMG Funds I |
| |
| By: | | /s/ Keitha L. Kinne |
| | Keitha L. Kinne, Principal Executive Officer |
Date: January 7, 2019
Pursuant to the requirements of the Securities Exchange Act of 1934 and the Investment Company Act of 1940, this report has been signed below by the following persons on behalf of the registrant and in the capacities and on the dates indicated.
| | |
| |
| By: | | /s/ Keitha L. Kinne |
| | Keitha L. Kinne, Principal Executive Officer |
Date: January 7, 2019
| | |
| |
| By: | | /s/ Thomas Disbrow |
| | Thomas Disbrow, Principal Financial Officer |
Date: January 7, 2019