UNITED STATES
SECURITIES AND EXCHANGE COMMISSION
Washington, D.C. 20549
FORM N-CSR
CERTIFIED SHAREHOLDER REPORT OF REGISTERED
MANAGEMENT INVESTMENT COMPANIES
Investment Company Act file number: 811-06520
AMG FUNDS I
(Exact name of registrant as specified in charter)
600 Steamboat Road, Suite 300, Greenwich, Connecticut 06830
(Address of principal executive offices) (Zip code)
AMG Funds LLC
600 Steamboat Road, Suite 300, Greenwich, Connecticut 06830
(Name and address of agent for service)
Registrant’s telephone number, including area code: (203) 299-3500
Date of fiscal year end: September 30
Date of reporting period: OCTOBER 1, 2017 – SEPTEMBER 30, 2018
(Annual Shareholder Report)
Item 1. Reports to Shareholders
| | |
 | | ANNUAL REPORT |
AMG Funds
September 30, 2018

AMG Managers Brandywine Fund
Class I: BRWIX
AMG Managers Brandywine Blue Fund
Class I: BLUEX
| | |
| amgfunds.com | | 093018 AR073 |
AMG Funds
Annual Report — September 30, 2018
| | | | |
TABLE OF CONTENTS | | PAGE | |
LETTER TO SHAREHOLDERS | | | 2 | |
| |
ABOUT YOUR FUND’S EXPENSES | | | 3 | |
| |
PORTFOLIO MANAGER’S COMMENTS, FUND SNAPSHOTS, ROSES AND THORNS AND SCHEDULES OF PORTFOLIO INVESTMENTS | | | 4 | |
| |
AMG Managers Brandywine Fund | | | 4 | |
| |
AMG Managers Brandywine Blue Fund | | | 11 | |
| |
FINANCIAL STATEMENTS | | | | |
| |
Statement of Assets and Liabilities | | | 18 | |
| |
Balance sheets, net asset value (NAV) per share computations and cumulative undistributed amounts | | | | |
| |
Statement of Operations | | | 19 | |
| |
Detail of sources of income, expenses, and realized and unrealized gains (losses) during the fiscal year | | | | |
| |
Statements of Changes in Net Assets | | | 20 | |
| |
Detail of changes in assets for the past two fiscal years | | | | |
| |
Financial Highlights | | | 21 | |
| |
Historical net asset values per share, distributions, total returns, income and expense ratios, turnover ratios and net assets | | | | |
| |
Notes to Financial Statements | | | 23 | |
| |
Accounting and distribution policies, details of agreements and transactions with Fund management and affiliates, and descriptions of certain investment risks | | | | |
| |
REPORT OF INDEPENDENT REGISTERED PUBLIC ACCOUNTING FIRM | | | 28 | |
| |
OTHER INFORMATION | | | 29 | |
| |
TRUSTEES AND OFFICERS | | | 30 | |
| |
ANNUAL RENEWAL OF INVESTMENT MANAGEMENT AND SUBADVISORY AGREEMENTS | | | 33 | |
Nothing contained herein is to be considered an offer, sale or solicitation of an offer to buy shares of any series of the AMG Funds family of mutual funds. Such offering is made only by prospectus, which includes details as to offering price and other material information.
| | |
| | | AMG Managers Brandywine Fund AMG Managers Brandywine Blue Fund |
DEAR FELLOW SHAREHOLDER:
Buoyed by “remarkably positive” economic conditions, stocks extended their gains in the three months through September. Enthusiasm among investors swelled as year-over-year earnings continued to grow at the fastest pace in years.
AMG Managers Brandywine Fund rose 11.80 percent in the September quarter. The Russell 3000® and Russell 3000® Growth Indexes gained 7.12 and 8.88 percent. AMG Managers Brandywine Blue Fund increased 10.82 percent in the quarter as the Russell 1000® and Russell 1000® Growth Indexes added 7.42 and 9.17 percent. The S&P 500® Index gained 7.71 percent in the September quarter.
According to CNBC, the current bull market became the longest on record since World War II on August 22. Depending on the benchmark and criteria used, a minority still argues otherwise, but there’s no debating that the September quarter represented the continuation of something special.
A 0.76 percent decline in this year’s first quarter is the only setback that prevented the S&P 500® Index from posting a perfect record of quarterly gains over the past two-and-a-half years. There were no exceptions for the Russell 3000® Growth and Russell 1000® Growth Indexes, which over that stretch went 10 for 10 in gaining ground from one quarter to the next.
The persistent upside bias is evident even when the period is more than doubled. The S&P 500® Index declined in two quarters out of the 23 quarters that passed since 2012. The Russell 3000® Growth and Russell 1000® Growth Indexes declined in one quarter in that period.
The economic conditions cultivating continued optimism among investors were cited by the Federal Reserve Bank on September 26 when its Open Market Committee raised the federal funds rate by 0.25 percent. The Committee forecasts 3.1 percent growth in gross domestic product (GDP) this year followed by 2.5 percent in 2019.
The Federal Reserve Chairman’s words at an economic conference held the week after the interest rate hike were more telling than any figures. “This historically rare pairing of steady, low inflation and very low unemployment is a testament to the fact we remain in extraordinary times,” he said. “I was asked at last week’s news conference whether these forecasts are too good to be true—a reasonable question.”
Good times, indeed.
Brandywine gained ground in seven out of the nine economic sectors represented in its portfolio during the three months through September. The Fund outperformed the sector within the Russell 3000® Growth Index in six out of those nine instances. Brandywine Blue generated positive absolute returns in all seven sectors in its portfolio and outperformed its benchmark, the Russell 1000® Growth Index, in five of them.
Technology holdings comprised the largest position in both Funds and contributed the most to absolute results and performance relative to benchmarks. Semiconductor and software holdings were top performers.
Advanced Micro Devices was the top contributor in both Funds. The semiconductor company grew June-quarter revenue 53 percent, helping it earn $0.14 per share
versus $0.02 the year before. Brandywine also held The Trade Desk. The company, which provides technology to manage digital advertising campaigns, grew revenue 54 percent in the June quarter. Earnings exceeded the consensus estimate by 38 percent.
Consumer discretionary holdings, representing the second largest position in both Funds, were the next most notable contributors to absolute performance. GrubHub, which operates a mobile food ordering platform, was a top contributor in both Funds. The company exceeded expectations with 92 percent June-quarter earnings growth and a 51 percent increase in revenue. Other standouts included Boot Barn Holdings for Brandywine and TJX Cos. for both Funds.
While consumer discretionary holdings were significant contributors to Brandywine’s relative performance (third largest influence), they were the biggest detractors from Brandywine Blue’s performance versus the Russell 1000® Growth Index. Weight Watchers was the primary reason Brandywine Blue’s contribution from consumer discretionary holdings fell short of the sector’s return. Investors were displeased with June-quarter subscriber growth.
Outside of technology, Brandywine Blue’s sector contributions were modest but broad. Brandywine, on the other hand, enjoyed a couple other concentrated areas of strength. Communication services holdings such as Match Group and health care holdings such as HMS Holdings provided an added boost.
Energy detracted from Brandywine’s September-quarter absolute and relative results. The portfolio’s exposure consisted of just one holding, which underperformed the sector. Delek US Holdings refines product pumped from the Permian Basin, where energy transport options were strained during a recent run up in oil prices. The demand gave Delek pricing leverage, but investors questioned the company’s ability to maintain it as customers announced plans to move production to other fields due to the Permian congestion.
For more information on companies that influenced September-quarter performance, please see Roses & Thorns on page 7 for Brandywine and page 14 for Brandywine Blue.
Technology, consumer discretionary and health care holdings represent the largest positions in the Brandywine Funds at the start of the December quarter. For more information on portfolio characteristics, please see page 6 for Brandywine and page 13 for Brandywine Blue.
Thank you for your confidence in the AMG Brandywine Funds. We’re committed to building on recent results on your behalf.

Scott Gates
Chief Investment Officer
Friess Associates, LLC
About Your Fund’s Expenses
As a shareholder of a Fund, you may incur two types of costs: (1) transaction costs, which may include sales charges (loads) on purchase payments; redemption fees; and exchange fees; and (2) ongoing costs, including management fees; distribution (12b-1) fees; and other Fund expenses. This example is intended to help you understand your ongoing costs (in dollars) of investing in the Fund and to compare these costs with the ongoing costs of investing in other mutual funds. The example is based on $1,000 invested at the beginning of the period and held for the entire period as indicated below.
ACTUAL EXPENSES
The first line of the following table provides information about the actual account values and
actual expenses. You may use the information in this line, together with the amount you invested, to estimate the expenses that you paid over the period. Simply divide your account value by $1,000 (for example, an $8,600 account value divided by $1,000 = 8.6), then multiply the result by the number in the first line under the heading entitled “Expenses Paid During Period” to estimate the expenses you paid on your account during this period.
HYPOTHETICAL EXAMPLE FOR COMPARISON PURPOSES
The second line of the following table provides information about hypothetical account values and hypothetical expenses based on the Fund’s actual expense ratio and an assumed annual rate of return of 5% before expenses, which is not the Fund’s
actual return. The hypothetical account values and expenses may not be used to estimate the actual ending account balance or expenses you paid for the period. You may use this information to compare the ongoing costs of investing in the Fund and other funds by comparing this 5% hypothetical example with the 5% hypothetical examples that appear in the shareholder reports of other funds.
Please note that the expenses shown in the table are meant to highlight your ongoing costs only and do not reflect any transactional costs, such as sales charges (loads), redemption fees, or exchange fees. Therefore, the second line of the table is useful in comparing ongoing costs only, and will not help you determine the relative total costs of owning different funds.
| | | | | | | | | | | | | | | | |
| Six Months Ended September 30, 2018 | | Expense
Ratio
for the
Period | | | Beginning
Account
Value
04/01/18 | | | Ending
Account
Value
09/30/18 | | | Expenses
Paid
During
the Period* | |
AMG Managers Brandywine Fund | | | | | | | | | | | | | | | | |
Based on Actual Fund Return | | | | | | | | | | | | | | | | |
Class I | | | 1.09 | % | | $ | 1,000 | | | $ | 1,173 | | | $ | 5.94 | |
| | | | | | | | | | | | | | | | |
Based on Hypothetical 5% Annual Return | | | | | | | | | | | | | | | | |
Class I | | | 1.09 | % | | $ | 1,000 | | | $ | 1,020 | | | $ | 5.52 | |
AMG Managers Brandywine Blue Fund | | | | | | | | | | | | | | | | |
Based on Actual Fund Return | | | | | | | | | | | | | | | | |
Class I | | | 1.14 | % | | $ | 1,000 | | | $ | 1,143 | | | $ | 6.12 | |
| | | | | | | | | | | | | | | | |
Based on Hypothetical 5% Annual Return | | | | | | | | | | | | | | | | |
Class I | | | 1.14 | % | | $ | 1,000 | | | $ | 1,019 | | | $ | 5.77 | |
| | | | | | | | | | | | | | | | |
| * | Expenses are equal to the Fund’s annualized expense ratio multiplied by the average account value over the period, multiplied by the number of days in the most recent fiscal half-year (183), then divided by 365. |
AMG Managers Brandywine Fund
Portfolio Manager’s Comments (unaudited)
Solid economic conditions and robust earnings growth combined to outshine all else in competing to influence market sentiment in the fiscal year. The stock market’s prolonged ascent continued in the 12 months through September 30, 2018, with some drama but, in the end, little lasting disruption.
AMG Managers Brandywine Fund employs an investment strategy that is based on the premise that earnings drive stock prices. While conceding that broader trends can influence stocks as a group for fleeting periods, this approach relies on investors to judge each company on its individual merits over the long haul.
We believe conditions in the fiscal year were good for the Fund’s earnings-driven investment strategy. Brandywine rose 25.92 percent during its fiscal year, posting positive absolute returns in each of the year’s four quarters.
The fiscal year got off to a good start in the final three months of 2017, when the prelude to and passage of the Tax Cuts and Jobs Act positively influenced investor spirits. The Federal Reserve Bank (the “Fed”) continued a running series of interest rate increases amid encouraging economic reports.
Committed as they were to end the year on a high note, investors still appeared to consider how both developments—tax cuts and interest rates—could rearrange fortunes in a bull market that might be due for some change. Technology stocks, which were high-profile leaders in recent years, still posted solid
gains in the quarter but lost momentum in December as investors showed appreciation for lesser-loved sectors.
Still, the final quarter of 2017 was broadly positive, and a celebratory mood emerged to start 2018. The S&P 500® Index enjoyed its best January in 21 years. Just over a week into February, the index was in correction territory for the first time in two years as trade tensions and inflation fears increased.
The quarter was a bit of a rollercoaster ride, with most indexes reclaiming the ground they lost in the correction by the end of March. Economically sensitive sectors, including technology and consumer discretionary, led the comeback.
Volatility, however, would persist. The first day of trading ended as the worst on record for a second-quarter start since the Great Depression, according to Bloomberg. A budding trade war with China was the spark. While concerns resurfaced occasionally during the three months through June, optimism triumphed as investors got the chance to assess first-quarter earnings reports, the first reports to show the profit-boosting impact of reduced corporate tax rates. Technology and consumer discretionary holdings fared well again.
Positive momentum carried, even accelerated, into the September quarter, the final three months of the fiscal year. While continuing to raise interest rates in modest increments, the Fed described the economy in glowing terms. Second-quarter earnings reports, like the first-quarter’s tally, revealed some of the fastest earnings growth in years.
The three months through September represented the strongest quarter in the fiscal year. Again, companies from technology and consumer discretionary sectors stood out.
Technology and consumer discretionary holdings comprised Brandywine’s largest portfolio positions during the fiscal year. Technology holdings contributed the most to performance, generating roughly half of the Fund’s return. The sector also contributed the most to the Fund’s relative performance advantage versus the Russell 3000® Growth Index. Consumer discretionary holdings were the second greatest contributors to the Fund’s return, while ranking fifth in terms of the sector’s relative performance contribution.
Six out of nine sectors represented in the Fund generated positive performance in the fiscal year. Health care holdings followed technology in terms of relative performance contribution. Holdings from the industrial and energy sectors detracted the most from absolute and relative results. Performance from industrial holdings, which represented the portfolio’s fourth largest position and underperformed the sector, tempered the relative performance advantage the Fund generated in other sectors.
This commentary reflects the viewpoints of Friess Associates, LLC as of September 30, 2018 and is not intended as a forecast or guarantee of future results.
AMG Managers Brandywine Fund
Portfolio Manager’s Comments (continued)
CUMULATIVE TOTAL RETURN PERFORMANCE
AMG Managers Brandywine Fund’s cumulative total return is based on the daily change in net asset value (NAV), and assumes that all dividends and distributions were reinvested. The graph compares a hypothetical $10,000 investment made in the AMG Managers Brandywine Fund’s Class I shares on September 30, 2008, to a $10,000 investment made in the Russell 3000® Growth Index, Russell 3000® Index and S&P 500® Index for the same time period. The graph and table do not reflect the deduction of taxes that a shareholder would pay on a Fund distribution or redemption of shares. The listed returns for the Fund are net of expenses and the returns for the index exclude expenses. Total returns would have been lower had certain expenses not been reduced.
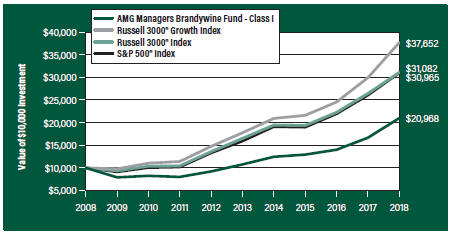
The table below shows the average annual total returns for the AMG Managers Brandywine Fund and the Russell 3000® Growth Index, Russell 3000® Index and S&P 500 Index for the same time periods ended September 30, 2018.
| | | | | | | | | | | | |
| Average Annual Total Returns1 | | One
Year | | | Five
Years | | | Ten
Years | |
AMG Managers Brandywine Fund2, 3, 4, 5, 6, 7 | | | | | | | | | | | | |
Class I | | | 25.92 | % | | | 14.27 | % | | | 7.69 | % |
| | | | | | | | | | | | |
Russell 3000® Growth Index8, 11 | | | 25.89 | % | | | 16.23 | % | | | 14.18 | % |
Russell 3000® Index9, 11 | | | 17.58 | % | | | 13.46 | % | | | 12.01 | % |
S&P 500® Index10, 11 | | | 17.91 | % | | | 13.95 | % | | | 11.97 | % |
| | | | | | | | | | | | |
The performance data shown represents past performance. Past performance is not a guarantee of future results. Current performance may be lower or higher than the performance data quoted. The investment return and principal value of an investment will fluctuate so that an investor’s shares, when redeemed, may be worth more or less than their original cost.
Investors should carefully consider the Fund’s investment objectives, risks, charges and expenses before investing. For performance information through the most recent month end, current net asset values per share for the Fund and other information, please call 800.835.3879 or visit our website at amgfunds.com for a free prospectus. Read it carefully before investing or sending money.
Distributed by AMG Distributors, Inc., member FINRA/SIPC.
| 1 | Total return equals income yield plus share price change and assumes reinvestment of all dividends and capital gain distributions. Returns are net of fees and may reflect offsets of Fund expenses as described in the prospectus. No adjustment has been made for taxes payable by shareholders on their reinvested dividends and capital gain distributions. Returns for periods greater than one year are annualized. The listed returns on the Fund are net of expenses and based on the published NAV as of September 30, 2018. All returns are in U.S. dollars ($). |
| 2 | The Fund returns for all periods prior to October 1, 2013, reflect performance of the predecessor fund, Brandywine Fund, Inc., and was managed by Friess Associates, LLC with the same investment objective and substantially similar investment policies. |
| 3 | Active and frequent trading of a fund may result in higher transaction costs and increase tax liability. |
| 4 | The Fund invests in growth stocks, which may be more sensitive to market movements because their prices tend to reflect future investor expectations rather than just current profits. Growth stocks may underperform value stocks during given periods. |
| 5 | Investments in international securities are subject to certain risks of overseas investing including currency fluctuations and changes in political and economic conditions, which could result in significant market fluctuations. These risks are magnified in emerging markets. |
| 6 | The Fund is subject to risks associated with investments in mid-capitalization companies such as greater price volatility, lower trading volume, and less liquidity than the stocks of larger, more established companies. Growth stocks may underperform value stocks during given periods. |
| 7 | The Fund is subject to risks associated with investments in small-capitalization companies, such as erratic earnings patterns, competitive conditions, limited earnings history and a reliance on one or a limited number of products. |
| 8 | The Russell 3000® Growth Index measures the performance of those Russell 3000® Index companies with higher price-to-book ratios and higher forecasted growth values. |
| 9 | The Russell 3000® Index is composed of the 3,000 largest U.S. companies as measured by market capitalization, and represents about 98% of the U.S. stock market. |
| 10 | The S&P 500® Index is a capitalization-weighted index of 500 stocks. The S&P 500® Index is designed to measure performance of the broad domestic economy through changes in the aggregate market value of 500 stocks representing all major industries. |
| 11 | Unlike the Fund, indices are unmanaged, are not available for investment and do not incur expenses. |
The Russell Indices are trademarks of the London Stock Exchange Group companies.
The S&P 500® Index is proprietary data of Standard & Poor’s, a division of McGraw-Hill Companies, Inc. All rights reserved.
Not FDIC insured, nor bank guaranteed. May lose value.
AMG Managers Brandywine Fund
Fund Snapshots (unaudited)
September 30, 2018
PORTFOLIO BREAKDOWN
| | | | | | | | |
Industry (Top Ten) | | AMG
Managers
Brandywine
Fund1 | | | Russell
3000®
Growth
Index | |
Application Software | | | 10.0 | % | | | 3.9 | % |
Internet & Direct Marketing Retail | | | 8.5 | % | | | 6.3 | % |
Semiconductors | | | 7.2 | % | | | 3.5 | % |
Data Processing & Outsourced Services | | | 6.3 | % | | | 5.9 | % |
Interactive Home Entertainment | | | 5.6 | % | | | 0.7 | % |
Life Sciences Tools & Services | | | 5.4 | % | | | 0.8 | % |
Systems Software | | | 5.1 | % | | | 6.3 | % |
Movies & Entertainment | | | 4.8 | % | | | 2.0 | % |
Interactive Media & Services | | | 4.4 | % | | | 7.6 | % |
Apparel Retail | | | 4.3 | % | | | 0.9 | % |
Other Common Stock | | | 36.6 | % | | | 62.1 | % |
Short-Term Investments2 | | | 5.9 | % | | | 0.0 | % |
Other Assets3 | | | (4.1 | )% | | | 0.0 | % |
| 1 | As a percentage of net assets. |
| 2 | Includes reinvestment of cash collateral into joint repurchase agreements on security lending transactions. |
| 3 | Includes repayment of cash collateral on securities lending transactions. |
TOP TEN HOLDINGS
| | | | | | | | |
Security Name | | % of
Net Assets | | | % Change from
Book Cost | |
Amazon.com, Inc. | | | 5.1 | | | | 213.3 | |
Microsoft Corp. | | | 3.9 | | | | 38.6 | |
Advanced Micro Devices, Inc. | | | 3.3 | | | | 140.3 | |
The Trade Desk, Inc., Class A | | | 2.7 | | | | 221.0 | |
Salesforce.com, Inc. | | | 2.5 | | | | 110.0 | |
Bio-Techne Corp. | | | 2.4 | | | | 77.2 | |
Alphabet, Inc., Class A | | | 2.4 | | | | 75.6 | |
NVIDIA Corp. | | | 2.1 | | | | 219.2 | |
Match Group, Inc. | | | 2.1 | | | | 51.2 | |
XPO Logistics, Inc. | | | 2.1 | | | | 13.5 | |
| | | | | | | | |
Top Ten as a Group | | | 28.6 | | | | | |
| | | | | | | | |
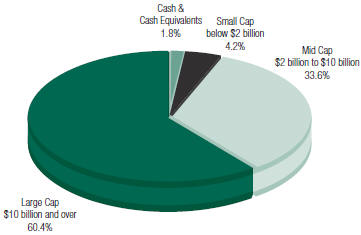
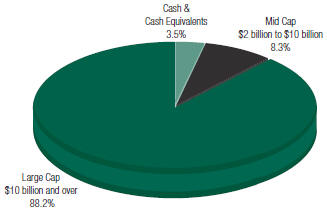
PORTFOLIO MARKET CAPITALIZATION
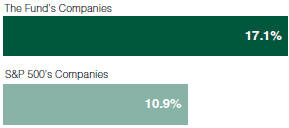
ESTIMATED EARNINGS GROWTH RATE OF THE FUND’S INVESTMENTS
Forecasted Increase in Earnings Per Share 2019 vs 2018
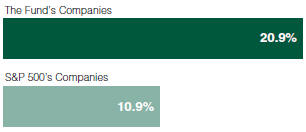
Source: Consensus estimates from FactSet Research Systems Inc.
This is not a forecast of the Fund’s future performance. Earnings growth for a Fund holding does not guarantee a corresponding increase in the market value of the holding or the Fund.
Because a fund’s strategy may result in multiple investments in particular sectors of the economy, its performance may depend on the performance of those sectors and may fluctuate more widely than investments diversified across more sectors. For additional information on these and other risk considerations, please see the Fund’s prospectus.
Any sectors, industries, or securities discussed should not be perceived as investment recommendations. Mention of a specific security should not be considered a recommendation to buy or solicitation to sell that security. Specific securities mentioned in this report may have been sold from the Fund’s portfolio of investments by the time you receive this report.
AMG Managers Brandywine Fund
Roses and Thorns (unaudited)
Quarter Ending September 30, 2018
| | | | | | | | | | |
$ Gain
(in millions) | | | % Gain | | | Biggest $ Winners | | Reason for Move |
| | | | | | | | |
| $ | 15.1 | | | | 106.1 | % | | Advanced Micro Devices Inc. (AMD) |
| | | | | | | | The semiconductor manufacturer reported June-quarter revenue of $1.8 billion, up 53 percent from the previous year on strong sales of its Ryzen processors. The company grew earnings to $0.14 per share from $0.02 per share in the year-ago period, exceeding the consensus estimate. |
| $ | 9.2 | | | | 60.9 | % | | The Trade Desk Inc. (TTD) |
| | | | | | | | The provider of a technology platform for ad buyers grew June-quarter revenue 54 percent from the year-ago period to a company record of $112 million. Increased spending among existing clients and new customer wins both contributed to performance. Earnings rose 15 percent, exceeding expectations. |
| $ | 6.9 | | | | 17.8 | % | | Amazon.com Inc. (AMZN) |
| | | | | | | | The provider of online shopping services reported June-quarter earnings of $5.07 per share versus $0.40 per share in the year-ago period, exceeding the consensus estimate. Amazon Web Services posted its third consecutive quarter of accelerating growth, increasing 49 percent. Advertising and operational efficiencies in the retail business were also key drivers. |
| $ | 6.3 | | | | 51.2 | % | | Match Group Inc. (MTCH) |
| | | | | | | | The online dating and test preparation services provider earned $0.41 per share in the June quarter, up from $0.16 the year before and ahead of the consensus estimate. Revenue for the company’s Tinder mobile app jumped 136 percent, driven by 81 percent subscriber growth and 33 percent growth in revenue per user. Total revenue climbed 36 percent. |
| $ | 5.9 | | | | 38.0 | % | | Bio-Techne Corp. (TECH) |
| | | | | | | | The company, which makes biotechnology reagents, instruments and clinical diagnostic controls, grew June-quarter earnings 23 percent, exceeding the consensus estimate. Revenue increased 15 percent through a combination of organic growth and contributions from acquisitions. The company’s advanced cell diagnostics platform increased sales 30 percent. |
| | | |
$Loss
(in millions) | | | % Loss | | | Biggest $ Losers | | Reason for Move |
| | | | | | | | |
| $ | 3.3 | | | | 13.1 | % | | Electronic Arts Inc. (EA) |
| | | | | | | | The video game maker reported June-quarter earnings of $0.15 per share, exceeding the consensus estimate. Shares declined when the company lowered revenue guidance by 6 percent due to a four-week delay in the launch of Battlefield V, reduced mobile expectations, and the impact of foreign exchange. |
| $ | 2.4 | | | | 19.1 | % | | MasTec Inc. (MTZ) |
| | | | | | | | The infrastructure construction company earned $1.04 per share in the June quarter, topping the consensus estimate by a penny. Revenue fell short of expectations due to a slower-than-anticipated start of its Mountain Valley Pipeline project. We sold MasTec to fund a new opportunity. |
| $ | 2.4 | | | | 14.2 | % | | Broadcom Inc. (AVGO) |
| | | | | | | | The semiconductor company beat expectations with 21 percent June-quarter earnings growth. Investor concerns over a proposed acquisition stoked volatility in the stock. We sold Broadcom to fund an opportunity with better visibility. |
| $ | 2.0 | | | | 15.4 | % | | Delek US Holdings, Inc. (DK) |
| | | | | | | | The energy refining and distribution company earned $1.03 per share in the June quarter, rebounding from a $0.09 per share loss in the year-ago period. Shares fell after statistics showed slowing drilling activity in the Permian basin, an area to which Delek is broadly exposed. |
| $ | 2.0 | | | | 18.5 | % | | Exact Sciences Corp. (EXAS) |
| | | | | | | | The diagnostics company, which focuses on the detection of colorectal cancer, declined after lower-than-expected shipment volume for its Cologuard test kits led to disappointing June-quarter revenue. |
All gains/losses are calculated on an average cost basis from June 30, 2018 through September 30, 2018.
This commentary reflects the viewpoints of Friess Associates, LLC as of September 30, 2018, and is not intended as a forecast or guarantee of future results.
AMG Managers Brandywine Fund
Schedule of Portfolio Investments
September 30, 2018
| | | | | | | | | | | | |
| Shares | | | | | Cost | | | Value | |
| | Common Stocks - 98.2% | | | | | | | | |
| | Communication Services | | | | | | | | |
| | | | Interactive Home Entertainment - 5.6% | | | | | |
| | 207,755 | | | Activision Blizzard, Inc. | | $ | 11,084,770 | | | $ | 17,283,138 | |
| | 130,448 | | | Electronic Arts, Inc.* | | | 16,019,999 | | | | 15,717,680 | |
| | 122,750 | | | Take-Two Interactive Software, Inc.* | | | 12,895,585 | | | | 16,938,272 | |
| | | | Interactive Media & Services - 4.4% | | | | | | | | |
| | 17,429 | | | Alphabet, Inc., Class A* | | | 11,980,700 | | | | 21,038,197 | |
| | 323,150 | | | Match Group, Inc.*,1 | | | 12,374,874 | | | | 18,713,617 | |
| | | | Movies & Entertainment - 4.8% | | | | | | | | |
| | 355,760 | | | Liberty Media Corp.-Liberty Formula One, Class C* | | | 12,659,711 | | | | 13,230,715 | |
| | 42,587 | | | Netflix, Inc.* | | | 4,776,967 | | | | 15,933,074 | |
| | 75,507 | | | Spotify Technology SA (Sweden)* | | | 11,833,402 | | | | 13,653,931 | |
| | | | | | | | | | | | |
| | Total Communication Services | | | 93,626,008 | | | | 132,508,624 | |
| | | | This sector is 41.5% above your Fund’s cost. | | | | | |
| | Consumer Discretionary | | | | | | | | |
| | | | Apparel Retail - 4.3% | | | | | | | | |
| | 287,901 | | | Boot Barn Holdings, Inc.* | | | 6,574,307 | | | | 8,179,268 | |
| | 285,886 | | | Foot Locker, Inc. | | | 13,756,223 | | | | 14,574,468 | |
| | 136,188 | | | The TJX Cos., Inc. | | | 11,933,268 | | | | 15,255,780 | |
| | | | Apparel, Accessories & Luxury Goods - 2.6% | | | | | |
| | 74,545 | | | PVH Corp. | | | 11,377,248 | | | | 10,764,298 | |
| | 134,152 | | | VF Corp. | | | 12,562,226 | | | | 12,536,504 | |
| | | | Footwear - 3.0% | | | | | | | | |
| | 105,275 | | | Deckers Outdoor Corp.* | | | 7,329,901 | | | | 12,483,510 | |
| | 370,564 | | | Wolverine World Wide, Inc. | | | 10,364,579 | | | | 14,470,524 | |
| | | | Homebuilding - 0.8% | | | | | | | | |
| | 29,431 | | | Cavco Industries, Inc.* | | | 5,114,547 | | | | 7,446,043 | |
| | | | Internet & Direct Marketing Retail - 8.5% | | | | | |
| | 22,755 | | | Amazon.com, Inc.* | | | 14,549,121 | | | | 45,578,265 | |
| | 6,984 | | | Booking Holdings, Inc.* | | | 13,379,082 | | | | 13,856,256 | |
| | 117,231 | | | GrubHub, Inc.* | | | 12,336,375 | | | | 16,250,561 | |
| | | | Leisure Facilities - 3.1% | | | | | | | | |
| | 187,383 | | | Six Flags Entertainment Corp.1 | | | 12,363,433 | | | | 13,083,081 | |
| | 54,527 | | | Vail Resorts, Inc. | | | 12,051,311 | | | | 14,963,299 | |
| | | | | | | | | | | | |
| | Total Consumer Discretionary | | | 143,691,621 | | | | 199,441,857 | |
| | | | This sector is 38.8% above your Fund’s cost. | | | | | |
| | Consumer Staples | | | | | | | | |
| | | | Hypermarkets & Super Centers - 0.3% | | | | | |
| | 101,223 | | | BJ’s Wholesale Club Holdings, Inc.* | | | 2,108,483 | | | | 2,710,752 | |
| | | | Packaged Foods & Meats - 0.5% | | | | | | | | |
| | 88,303 | | | B&G Foods, Inc.1 | | | 2,849,429 | | | | 2,423,917 | |
| | | | | | | | | | | | |
| Shares | | | | | Cost | | | Value | |
| | 17,060 | | | Calavo Growers, Inc.1 | | $ | 855,811 | | | $ | 1,647,996 | |
| | | | | | | | | | | | |
| | Total Consumer Staples | | | 5,813,723 | | | | 6,782,665 | |
| | | | This sector is 16.7% above your Fund’s cost. | | | | | |
| | Energy | | | | | | | | |
| | | | Oil & Gas Refining & Marketing - 1.2% | | | | | | | | |
| | 260,822 | | | Delek US Holdings, Inc. | | | 12,211,650 | | | | 11,066,678 | |
| | | | This sector is 9.4% below your Fund’s cost. | | | | | |
| | Financials | | | | | | | | |
| | | | Financial Exchanges & Data - 1.8% | | | | | | | | |
| | 93,140 | | | CME Group, Inc. | | | 8,750,461 | | | | 15,853,359 | |
| | | | This sector is 81.2% above your Fund’s cost. | | | | | |
| | Health Care | | | | | | | | |
| | | | Biotechnology - 1.6% | | | | | | | | |
| | 34,985 | | | Regeneron Pharmaceuticals, Inc.* | | | 12,343,923 | | | | 14,135,339 | |
| | | | Health Care Equipment - 3.2% | | | | | | | | |
| | 205,465 | | | Abbott Laboratories | | | 12,225,583 | | | | 15,072,913 | |
| | 308,031 | | | Tandem Diabetes Care, Inc.* | | | 13,422,144 | | | | 13,196,048 | |
| | | | Health Care Supplies - 2.0% | | | | | | | | |
| | 34,401 | | | Align Technology, Inc.* | | | 13,060,976 | | | | 13,458,359 | |
| | 14,601 | | | ICU Medical, Inc.* | | | 4,029,496 | | | | 4,128,433 | |
| | | | Health Care Technology - 0.7% | | | | | | | | |
| | 203,980 | | | HMS Holdings Corp.* | | | 3,565,939 | | | | 6,692,584 | |
| | | | Life Sciences Tools & Services - 5.4% | | | | | | | | |
| | 105,319 | | | Bio-Techne Corp. | | | 12,129,213 | | | | 21,496,661 | |
| | 342,340 | | | QIAGEN, N.V. (Netherlands)* | | | 12,404,999 | | | | 12,967,839 | |
| | 57,255 | | | Thermo Fisher Scientific, Inc. | | | 8,809,594 | | | | 13,974,801 | |
| | | | Managed Health Care - 1.8% | | | | | | | | |
| | 58,701 | | | Anthem, Inc. | | | 13,983,506 | | | | 16,087,009 | |
| | | | | | | | | | | | |
| | Total Health Care | | | 105,975,373 | | | | 131,209,986 | |
| | | | This sector is 23.8% above your Fund’s cost. | | | | | |
| | Industrials | | | | | | | | |
| | | | Aerospace & Defense - 1.6% | | | | | | | | |
| | 85,200 | | | Harris Corp. | | | 12,823,951 | | | | 14,416,692 | |
| | | | Air Freight & Logistics - 2.9% | | | | | | | | |
| | 168,285 | | | Hub Group Inc. , Class A* | | | 8,674,907 | | | | 7,673,796 | |
| | 160,748 | | | XPO Logistics, Inc.* | | | 16,165,972 | | | | 18,352,599 | |
| | | | Environmental & Facilities Services - 1.2% | | | | | |
| | 147,304 | | | Clean Harbors, Inc.* | | | 10,070,588 | | | | 10,544,020 | |
| | | | Trading Companies & Distributors - 0.8% | | | | | |
| | 184,361 | | | Rush Enterprises, Inc., Class A | | | 7,529,393 | | | | 7,247,231 | |
| | | | | | | | | | | | |
| | Total Industrials | | | 55,264,811 | | | | 58,234,338 | |
| | | | This sector is 5.4% above your Fund’s cost. | | | | | |
|
The accompanying notes are an integral part of these financial statements. 8 |
AMG Managers Brandywine Fund
Schedule of Portfolio Investments (continued)
| | | | | | | | | | | | |
Shares | | | | | Cost | | | Value | |
| | Information Technology | | | | | | | | |
| | | | Application Software - 10.0% | | | | | | | | |
| | 42,250 | | | Adobe Systems, Inc.* | | $ | 10,541,539 | | | $ | 11,405,388 | |
| | 568,184 | | | Avaya Holdings Corp.* | | | 12,181,223 | | | | 12,579,594 | |
| | 63,522 | | | Ceridian HCM Holding, Inc.*,1 | | | 1,813,269 | | | | 2,669,830 | |
| | 155,485 | | | RingCentral, Inc., Class A* | | | 12,918,163 | | | | 14,467,879 | |
| | 142,880 | | | Salesforce.com, Inc.* | | | 10,821,895 | | | | 22,722,206 | |
| | 77,788 | | | SVMK, Inc.* | | | 1,249,756 | | | | 1,246,942 | |
| | 160,662 | | | The Trade Desk, Inc., Class A* | | | 7,554,141 | | | | 24,245,502 | |
| | | | Communications Equipment - 3.3% | | | | | |
| | 539,892 | | | Ciena Corp.* | | | 13,791,216 | | | | 16,866,226 | |
| | 208,873 | | | Lumentum Holdings, Inc.* | | | 12,432,892 | | | | 12,521,936 | |
| | | | Data Processing & Outsourced Services - 6.3% | | | | | |
| | 176,960 | | | Black Knight, Inc.* | | | 4,502,085 | | | | 9,193,072 | |
| | 139,960 | | | Global Payments, Inc. | | | 10,039,962 | | | | 17,830,904 | |
| | 52,642 | | | Mastercard, Inc., Class A | | | 9,086,098 | | | | 11,718,636 | |
| | 119,890 | | | Visa, Inc., Class A | | | 8,635,439 | | | | 17,994,290 | |
| | | | Internet Services & Infrastructure - 1.1% | | | | | |
| | 1,888,010 | | | Limelight Networks, Inc.* | | | 8,335,267 | | | | 9,477,810 | |
| | | | IT Consulting & Other Services - 1.6% | | | | | |
| | 284,161 | | | Booz Allen Hamilton Holding Corp. | | | 12,560,155 | | | | 14,102,910 | |
| | | | Semiconductors - 7.2% | | | | | | | | |
| | 949,238 | | | Advanced Micro Devices, Inc.* | | | 12,200,465 | | | | 29,321,962 | |
| | 67,631 | | | NVIDIA Corp. | | | 5,953,664 | | | | 19,005,664 | |
| | 134,957 | | | Universal Display Corp.1 | | | 12,555,629 | | | | 15,911,430 | |
| | | | Systems Software - 5.1% | | | | | | | | |
| | 306,950 | | | Microsoft Corp. | | | 25,328,855 | | | | 35,105,871 | |
| | 52,206 | | | ServiceNow, Inc.* | | | 4,163,474 | | | | 10,213,060 | |
| | | | | | | | | | | | |
| | Total Information Technology | | | 196,665,187 | | | | 308,601,112 | |
| | | | This sector is 56.9% above your Fund’s cost. | | | | | |
| | Materials | | | | | | | | |
| | | | Specialty Chemicals - 1.5% | | | | | | | | |
| | 29,260 | | | The Sherwin-Williams Co. | | | 13,300,069 | | | | 13,319,445 | |
| | | | This sector is 0.1% above your Fund’s cost. | | | | | |
| | Total Common Stocks | | | 635,298,903 | | | | 877,018,064 | |
| | | |
Principal
Amount | | | | | | | | | |
| | Short-Term Investments - 5.9% | | | | | | | | |
| | Commercial Paper - 1.7% | | | | | | | | |
| | $14,840,000 | | | Western Union Co., 2.40%, 10/01/182 | | | 14,840,000 | | | | 14,840,000 | |
| | | | | | | | | | | | |
Principal
Amount | | | | | Cost | | | Value | |
| | Joint Repurchase Agreements - 4.2%3 | | | | | | | | |
| | $8,973,238 | | | Cantor Fitzgerald Securities, Inc., dated 09/28/18, due 10/01/18, 2.270% total to be received $8,974,935 (collateralized by various U.S. Government Agency Obligations and U.S. Treasuries, 0.000% - 9.000%, 10/25/18 - 08/20/68, totaling $9,152,703) | | $ | 8,973,238 | | | $ | 8,973,238 | |
| | 1,886,688 | | | Merrill Lynch, Pierce, Fenner & Smith, Inc., dated 09/28/18, due 10/01/18, 2.250% total to be received $1,887,042 (collateralized by various U.S. Treasuries, 0.000% - 1.625%, 05/23/19 - 09/09/49, totaling $1,924,422) | | | 1,886,688 | | | | 1,886,688 | |
| | 8,973,238 | | | Nomura Securities International, Inc., dated 09/28/18, due 10/01/18, 2.270% total to be received $8,974,935 (collateralized by various U.S. Government Agency Obligations and U.S. Treasuries, 0.000% - 9.500%, 10/01/18 - 08/20/68, totaling $9,152,703) | | | 8,973,238 | | | | 8,973,238 | |
| | 8,973,238 | | | RBC Dominion Securities, Inc., dated 09/28/18, due 10/01/18, 2.260% total to be received $8,974,928 (collateralized by various U.S. Government Agency Obligations and U.S. Treasuries, 0.000% - 7.000%, 10/04/18 - 09/09/49, totaling $9,152,703) | | | 8,973,238 | | | | 8,973,238 | |
| | 8,973,238 | | | State of Wisconsin Investment Board, dated 09/28/18, due 10/01/18, 2.510% total to be received $8,975,115 (collateralized by various U.S. Treasuries, 0.125% - 3.875%, 04/15/20 - 02/15/48, totaling $9,153,982) | | | 8,973,238 | | | | 8,973,238 | |
| | | | | | | | | | | | |
| | | | Total Joint Repurchase Agreements | | | 37,779,640 | | | | 37,779,640 | |
| | | | | | | | | | | | |
| | Total Short-Term Investments | | | 52,619,640 | | | | 52,619,640 | |
| | Total Investments - 104.1% | | $ | 687,918,543 | | | | 929,637,704 | |
| | Other Assets, less Liabilities - (4.1%) | | | | | | | (36,336,347 | ) |
| | Total Net Assets - 100.0% | | | | | | $ | 893,301,357 | |
| | | | | | | | | | | | |
| * | Non-income producing security. |
| 1 | Some or all of these securities, amounting to $36,568,135 or 4.1% of net assets, were out on loan to various brokers. |
| 2 | Percentage rate represents yield to maturity at September 30, 2018. |
| 3 | Collateral received from brokers for securities lending was invested in these joint repurchase agreements. |
|
The accompanying notes are an integral part of these financial statements. 9 |
AMG Managers Brandywine Fund
Schedule of Portfolio Investments (continued)
The following table summarizes the inputs used to value the Fund’s investments by the fair value hierarchy levels as of September 30, 2018:
| | | | | | | | | | | | | | | | |
| | | Level 1 | | | Level 2 | | | Level 3 | | | Total | |
Investments in Securities | | | | | | | | | | | | | | | | |
Common Stocks† | | $ | 877,018,064 | | | | — | | | | — | | | $ | 877,018,064 | |
Short-Term Investments | | | | | | | | | | | | | | | | |
Commercial Paper | | | — | | | $ | 14,840,000 | | | | — | | | | 14,840,000 | |
Joint Repurchase Agreements | | | — | | | | 37,779,640 | | | | — | | | | 37,779,640 | |
| | | | | | | | | | | | | | | | |
Total Investments in Securities | | $ | 877,018,064 | | | $ | 52,619,640 | | | | — | | | $ | 929,637,704 | |
| | | | | | | | | | | | | | | | |
| † | All common stocks held in the Fund are Level 1 securities. For a detailed breakout of common stocks by major industry classification, please refer to the Fund’s Schedule of Portfolio Investments. |
As of September 30, 2018, the Fund had no transfers between levels from the beginning of the reporting period.
The accompanying notes are an integral part of these financial statements.
AMG Managers Brandywine Blue Fund
Portfolio Manager’s Comments (unaudited)
The first correction in two years. The worst start to a second quarter since 1929. Trade war. Inflation fears. Considering some of the causes for concern that arose in the 12 months through September, it might be reasonable to think that the long-running bull market saw reason to rest during the fiscal year.
While that thought might be reasonable, it was proven definitively to be wrong. Despite potential distractions, investors primarily trained their focus on earnings in the fiscal year, and it appears they liked what they saw.
AMG Managers Brandywine Blue Fund employs a fundamentals-driven investment strategy emphasizing individual-company earnings performance as the primary influence on share prices. Earnings attracted considerable attention in the fiscal year, contributing to a good environment for Brandywine Blue’s approach. Brandywine Blue climbed 23.97 percent in the 12 months through September 30, 2018.
Jockeying at times as the market’s mood fluctuated, technology stocks ultimately broke away as clear-cut winners during the fiscal year. Technology holdings comprised Brandywine Blue’s largest position and delivered the highest return among sectors, making them the biggest contributors to the Fund’s absolute return. Technology holdings were the second biggest contributors to results relative to the Russell 1000® Growth Index.
Communication services holdings, which tend to operate businesses with technology and/or telecommunications components to them, also fared well during the fiscal year. Holdings from the sector represented the Fund’s second largest percentage of assets. The sector was the second biggest contributor to absolute return and the biggest contributor to relative results.
While health care and consumer discretionary holdings were notable contributors to the Fund’s fiscal-year gain, they negatively influenced relative performance. Industrial holdings were the most significant detractors from results versus the benchmark.
The summary seems simple in retrospect, but there were periods during the fiscal year when it appeared things might unfold differently. Positive momentum from the previous fiscal year carried into the first three months of fiscal 2018 as investors applauded the Tax Cuts and Jobs Act, legislation that included a reduction of the corporate tax rate from 35 percent to 21 percent as its centerpiece accomplishment.
Meanwhile, the Federal Reserve Bank (the “Fed”) continued with a series of interest rate increases meant to reverse earlier stimulus and, by the period’s end, control inflation that could emerge amid the economy’s ongoing progress. Inflation became a concern among investors in February, when Fed commentary followed by incremental evidence of budding wage pressure fueled uncertainty. The S&P 500® Index entered correction territory.
Recovery from there was swift, with most major indexes ending the first three months of 2018 near break-even. Trade tensions, stoked by the announcement of a long list of retaliatory tariffs planned by China, rattled investors as the June quarter, or the second quarter of the calendar year, began. The selloff represented the worst opening day to the second quarter since the onset of the Great Depression.
Those concerns also proved to be fleeting. Enthusiasm grew as companies reported their first-quarter earnings results. Earnings growth, boosted by the cut in the corporate tax rate, became the market’s defining theme in the June quarter and again in the September quarter as second-quarter results were revealed. The final three months of the fiscal year represented the fiscal year’s strongest quarter.
The net result was a broadly positive environment for stocks in the fiscal year. The Fund’s portfolio showed a solid connection with the market’s embrace of earnings results during the period. The Fund posted positive returns in eight of the nine economic sectors represented in it during the fiscal year.
This commentary reflects the viewpoints of Friess Associates, LLC as of September 30, 2018 and is not intended as a forecast or guarantee of future results.
AMG Managers Brandywine Blue Fund
Portfolio Manager’s Comments (continued)
CUMULATIVE TOTAL RETURN PERFORMANCE
AMG Managers Brandywine Blue Fund’s cumulative total return is based on the daily change in net asset value (NAV), and assumes that all dividends and distributions were reinvested. The graph compares a hypothetical $10,000 investment made in the AMG Managers Brandywine Blue Fund’s Class I shares on September 30, 2008, to a $10,000 investment made in the Russell 1000® Growth Index, Russell 1000® Index and S&P 500® Index for the same time period. The graph and table do not reflect the deduction of taxes that a shareholder would pay on a Fund distribution or redemption of shares. The listed returns for the Fund are net of expenses and the returns for the index exclude expenses.
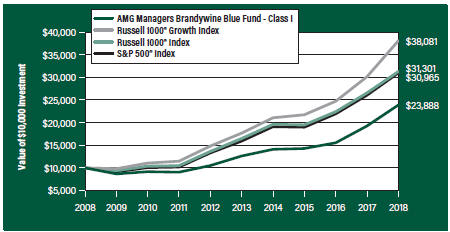
The table below shows the average annual total returns for the AMG Managers Brandywine Blue Fund and the Russell 1000® Growth Index, Russell 1000® Index and S&P 500 Index for the same time periods ended September 30, 2018.
| | | | | | | | | | | | |
| Average Annual Total Returns1 | | One Year | | | Five
Years | | | Ten Years | |
AMG Managers Brandywine Blue Fund2, 3, 4, 5, 6 | | | | | | | | | | | | |
Class I | | | 23.97 | % | | | 13.60 | % | | | 9.10 | % |
| | | | | | | | | | | | |
Russell 1000® Growth Index7, 10 | | | 26.30 | % | | | 16.58 | % | | | 14.31 | % |
Russell 1000® Index8, 10 | | | 17.76 | % | | | 13.67 | % | | | 12.09 | % |
S&P 500® Index9, 10 | | | 17.91 | % | | | 13.95 | % | | | 11.97 | % |
| | | | | | | | | | | | |
The performance data shown represents past performance. Past performance is not a guarantee of future results. Current performance may be lower or higher than the performance data quoted. The investment return and principal value of an investment will fluctuate so that an investor’s shares, when redeemed, may be worth more or less than their original cost.
Investors should carefully consider the Fund’s investment objectives, risks, charges and expenses before investing. For performance information through the most recent month end, current net asset values per share for the Fund and other information, please call 800.835.3879 or visit our website at amgfunds.com for a free prospectus. Read it carefully before investing or sending money.
Distributed by AMG Distributors, Inc., member FINRA/SIPC.
| 1 | Total return equals income yield plus share price change and assumes reinvestment of all dividends and capital gain distributions. Returns are net of fees and may reflect offsets of Fund expenses as described in the prospectus. No adjustment has been made for taxes payable by shareholders on their reinvested dividends and capital gain distributions. Returns for periods greater than one year are annualized. The listed returns on the Fund are net of expenses and based on the published NAV as of September 30, 2018. All returns are in U.S. dollars ($). |
| 2 | The Fund inception dates and returns for all periods prior to October 1, 2013, reflect performance of the predecessor fund, Brandywine Blue Fund, and was managed by Friess Associates, LLC with the same investment objective and substantially similar investment policies. |
| 3 | Active and frequent trading of a fund may result in higher transaction costs and increased tax liability. |
| 4 | A greater percentage of the Fund’s holdings may be focused in a smaller number of securities which may place the Fund at greater risk than a more diversified fund. |
| 5 | Investments in international securities are subject to certain risks of overseas investing including currency fluctuations and changes in political and economic conditions, which could result in significant market fluctuations. These risks are magnified in emerging markets. |
| 6 | The Fund is subject to risks associated with investments in mid-capitalization companies such as greater price volatility, lower trading volume, and less liquidity than the stocks of larger, more established companies. Growth stocks may underperform value stocks during given periods. |
| 7 | The Russell 1000® Growth Index is a market capitalization weighted index that measures the performance of those Russell 1000® companies with higher price-to-book ratio and higher forecasted growth values. |
| 8 | The Russell 1000® Index measures the performance of approximately 1,000 of the largest securities based on a combination of their market cap and current index membership. The Russell 1000® Index represents approximately 92% of the U.S. market. |
| 9 | The S&P 500® Index is a capitalization-weighted index of 500 stocks. The S&P 500® Index is designed to measure performance of the broad domestic economy through changes in the aggregate market value of 500 stocks representing all major industries. |
| 10 | Unlike the Fund, indices are unmanaged, are not available for investment and do not incur expenses. |
The Russell Indices are trademarks of the London Stock Exchange Group companies.
The S&P 500® Index is proprietary data of Standard & Poor’s, a division of McGraw-Hill Companies, Inc. All rights reserved.
Not FDIC insured, nor bank guaranteed. May lose value.
AMG Managers Brandywine Blue Fund
Fund Snapshots (unaudited)
September 30, 2018
PORTFOLIO BREAKDOWN
| | | | | | | | |
Industry (Top Ten) | | AMG
Managers
Brandywine
Blue Fund1 | | | Russell
1000®
Growth
Index | |
Internet & Direct Marketing Retail | | | 10.1 | % | | | 6.8 | % |
Data Processing & Outsourced Services | | | 10.0 | % | | | 6.3 | % |
Semiconductors | | | 9.1 | % | | | 3.6 | % |
Interactive Home Entertainment | | | 7.5 | % | | | 0.8 | % |
Systems Software | | | 7.4 | % | | | 6.7 | % |
Movies & Entertainment | | | 6.1 | % | | | 2.1 | % |
Application Software | | | 5.4 | % | | | 3.8 | % |
Biotechnology | | | 4.7 | % | | | 5.0 | % |
Life Sciences Tools & Services | | | 4.3 | % | | | 0.8 | % |
Apparel, Accessories & Luxury Goods | | | 4.1 | % | | | 0.5 | % |
Other Common Stock | | | 27.8 | % | | | 63.6 | % |
Short-Term Investments2 | | | 9.7 | % | | | 0.0 | % |
Other Assets3 | | | (6.2 | )% | | | 0.0 | % |
| 1 | As a percentage of net assets. |
| 2 | Includes reinvestment of cash collateral into joint repurchase agreements on security lending transactions. |
| 3 | Includes repayment of cash collateral on securities lending transactions. |
TOP TEN HOLDINGS
| | | | | | | | |
Security Name | | % of
Net Assets | | | % Change from
Book Cost | |
Microsoft Corp. | | | 5.9 | | | | 74.2 | |
Amazon.com, Inc. | | | 5.7 | | | | 149.8 | |
Advanced Micro Devices, Inc. | | | 4.4 | | | | 140.3 | |
Salesforce.com, Inc. | | | 3.3 | | | | 104.9 | |
XPO Logistics, Inc. | | | 3.2 | | | | 13.9 | |
Alphabet, Inc., Class A | | | 2.9 | | | | 75.4 | |
NVIDIA Corp. | | | 2.9 | | | | 224.4 | |
Regeneron Pharmaceuticals, Inc. | | | 2.7 | | | | 15.0 | |
Visa, Inc., Class A | | | 2.6 | | | | 108.6 | |
Worldpay, Inc., Class A | | | 2.6 | | | | 120.8 | |
| | | | | | | | |
Top Ten as a Group | | | 36.2 | | | | | |
| | | | | | | | |
PORTFOLIO MARKET CAPITALIZATION
ESTIMATED EARNINGS GROWTH RATE OF THE FUND’S INVESTMENTS
Forecasted Increase in Earnings Per Share 2019 vs 2018
Source: Consensus estimates from FactSet Research Systems Inc.
This is not a forecast of the Fund’s future performance. Earnings growth for a Fund holding does not guarantee a corresponding increase in the market value of the holding or the Fund.
Because a fund’s strategy may result in multiple investments in particular sectors of the economy, its performance may depend on the performance of those sectors and may fluctuate more widely than investments diversified across more sectors. For additional information on these and other risk considerations, please see the Fund’s prospectus.
Any sectors, industries, or securities discussed should not be perceived as investment recommendations. Mention of a specific security should not be considered a recommendation to buy or solicitation to sell that security. Specific securities mentioned in this report may have been sold from the Fund’s portfolio of investments by the time you receive this report.
AMG Managers Brandywine Blue Fund
Roses and Thorns (unaudited)
Quarter Ending September 30, 2018
| | | | | | | | | | |
$ Gain (in millions) | | | % Gain | | | Biggest $ Winners | | Reason for Move |
| | | | | | | | |
| $ | 4.4 | | | | 106.1 | % | | Advanced Micro Devices Inc. (AMD) |
| | | | | | | | The semiconductor manufacturer reported June-quarter revenue of $1.8 billion, up 53 percent from the previous year on strong sales of its Ryzen processors. The company grew earnings to $0.14 per share from $0.02 per share in the year-ago period, exceeding the consensus estimate. |
| $ | 1.7 | | | | 17.8 | % | | Amazon.com Inc. (AMZN) |
| | | | | | | | The provider of online shopping services reported June-quarter earnings of $5.07 per share versus $0.40 per share in the year-ago period, exceeding the consensus estimate. Amazon Web Services posted its third consecutive quarter of accelerating growth, increasing 49 percent. Advertising and operational efficiencies in the retail business were also key drivers. |
| $ | 1.6 | | | | 16.0 | % | | Microsoft Corp. (MSFT) |
| | | | | | | | The maker of software, consumer electronics and personal computers grew June-quarter earnings 15 percent, topping the consensus estimate. Revenue increased 17 percent to $30.1 billion. Cloud services, up 26 percent on a year-over-year basis, and gaming, up 39 percent, were standout contributors. |
| $ | 1.2 | | | | 32.1 | % | | Grubhub Inc. (GRUB) |
| | | | | | | | The operator of an online and mobile food-ordering platform grew June-quarter earnings 92 percent, exceeding the consensus estimate. Revenue rose 51 percent as the company’s diner base grew amid efforts to expand into smaller cities through distribution deals with restaurant chains. |
| $ | 1.0 | | | | 23.8 | % | | WorldPay Inc. (WP) |
| | | | | | | | The electronic payment processing solutions provider grew June-quarter earnings 25 percent, exceeding the consensus estimate. Against a strong retail backdrop with an expanding footprint via its acquisition of Vantiv, WorldPay shares attracted positive investor attention. |
| | | |
$ Loss (in millions) | | | % Loss | | | Biggest $ Losers | | Reason for Move |
| | | | | | | | |
| $ | 1.0 | | | | 27.4 | % | | Weight Watchers International Inc. (WTW) |
| | | | | | | | The weight management services company grew June-quarter earnings 53 percent, exceeding the consensus estimate. The company also raised its full-year earnings guidance. Insider stock sales and a lack of sequential growth in end-of-period subscribers dampened earlier investor enthusiasm. We sold Weight Watchers to fund a new opportunity. |
| $ | 0.8 | | | | 14.6 | % | | Electronic Arts Inc. (EA) |
| | | | | | | | The video game maker reported June-quarter earnings of $0.15 per share, exceeding the consensus estimate. Shares declined when the company lowered revenue guidance by 6 percent due to a four-week delay in the launch of Battlefield V, reduced mobile expectations and the impact of foreign exchange. |
| $ | 0.7 | | | | 14.2 | % | | Broadcom Inc. (AVGO) |
| | | | | | | | The semiconductor company beat expectations with 21 percent June-quarter earnings growth. Investor concerns over a proposed acquisition stoked volatility in the stock. We sold Broadcom to fund an opportunity with better visibility. |
| $ | 0.5 | | | | 11.4 | % | | Micron Technology Inc. (MU) |
| | | | | | | | The semiconductor manufacturer grew earnings 75 percent in the three months through August, topping expectations. Shares declined after the company tempered sales guidance for the quarter ahead. Micron also warned investors that profit margins would be affected by tariffs recently imposed on imports from China. We sold Micron to fund an opportunity with better visibility. |
| $ | 0.2 | | | | 3.7 | % | | PVH Corp. (PVH) |
| | | | | | | | The apparel maker, with brands such as Calvin Klein and Tommy Hilfiger, grew July-quarter earnings 29 percent, exceeding the consensus estimate. Shares declined when profit margin expansion proved to be less than investors expected. |
All gains/losses are calculated on an average cost basis from June 30, 2018 through September 30, 2018.
This commentary reflects the viewpoints of Friess Associates, LLC as of September 30, 2018, and is not intended as a forecast or guarantee of future results.
AMG Managers Brandywine Blue Fund
Schedule of Portfolio Investments
September 30, 2018
| | | | | | | | | | | | |
| Shares | | | | | Cost | | | Value | |
| | Common Stocks - 96.5% | | | | | | | | |
| | Communication Services | | | | | | | | |
| | | | Interactive Home Entertainment - 7.5% | | | | | |
| | 61,045 | | | Activision Blizzard, Inc. | | $ | 3,265,429 | | | $ | 5,078,333 | |
| | 39,703 | | | Electronic Arts, Inc.* | | | 4,271,620 | | | | 4,783,815 | |
| | 35,550 | | | Take-Two Interactive Software, Inc.* | | | 3,455,163 | | | | 4,905,544 | |
| | | | Interactive Media & Services - 2.9% | | | | | |
| | 4,807 | | | Alphabet, Inc., Class A* | | | 3,308,126 | | | | 5,802,434 | |
| | | | Movies & Entertainment - 6.1% | | | | | |
| | 115,500 | | | Liberty Media Corp.-Liberty Formula One, Class C* | | | 3,739,172 | | | | 4,295,445 | |
| | 10,443 | | | Netflix, Inc.* | | | 1,468,989 | | | | 3,907,040 | |
| | 20,721 | | | Spotify Technology SA (Sweden)* | | | 3,207,294 | | | | 3,746,978 | |
| | | | | | | | | | | | |
| | Total Communication Services | | | 22,715,793 | | | | 32,519,589 | |
| | | | This sector is 43.2% above your Fund’s cost. | | | | | |
| | Consumer Discretionary | | | | | | | | |
| | | | Apparel Retail - 2.3% | | | | | | | | |
| | 40,960 | | | The TJX Cos., Inc. | | | 3,562,569 | | | | 4,588,339 | |
| | | | Apparel, Accessories & Luxury Goods - 4.1% | | | | | |
| | 27,738 | | | PVH Corp. | | | 4,416,724 | | | | 4,005,367 | |
| | 44,089 | | | VF Corp. | | | 3,584,425 | | | | 4,120,117 | |
| | | | Automotive Retail - 1.9% | | | | | | | | |
| | 49,500 | | | CarMax, Inc.*,1 | | | 3,743,947 | | | | 3,696,165 | |
| | | | Internet & Direct Marketing Retail - 10.1% | | | | | |
| | 5,583 | | | Amazon.com, Inc.* | | | 4,476,567 | | | | 11,182,749 | |
| | 1,955 | | | Booking Holdings, Inc.* | | | 3,712,497 | | | | 3,878,720 | |
| | 34,541 | | | GrubHub, Inc.* | | | 3,604,617 | | | | 4,788,074 | |
| | | | Leisure Facilities - 2.2% | | | | | | | | |
| | 15,928 | | | Vail Resorts, Inc. | | | 3,479,722 | | | | 4,370,962 | |
| | | | | | | | | | | | |
| | Total Consumer Discretionary | | | 30,581,068 | | | | 40,630,493 | |
| | | | This sector is 32.9% above your Fund’s cost. | | | | | |
| | Financials | | | | | | | | |
| | | | Financial Exchanges & Data - 2.3% | | | | | |
| | 27,025 | | | CME Group, Inc. | | | 2,538,802 | | | | 4,599,925 | |
| | | | This sector is 81.2% above your Fund’s cost. | | | | | |
| | Health Care | | | | | | | | |
| | | | Biotechnology - 4.7% | | | | | | | | |
| | 51,369 | | | Exact Sciences Corp.*,1 | | | 3,729,676 | | | | 4,054,042 | |
| | 13,000 | | | Regeneron Pharmaceuticals, Inc.* | | | 4,568,381 | | | | 5,252,520 | |
| | | | Health Care Equipment - 2.3% | | | | | |
| | 62,300 | | | Abbott Laboratories | | | 3,825,105 | | | | 4,570,328 | |
| | | | Health Care Supplies - 2.0% | | | | | |
| | 10,170 | | | Align Technology, Inc.* | | | 3,820,386 | | | | 3,978,707 | |
| | | | | | | | | | | | |
| Shares | | | | | Cost | | | Value | |
| | | | Life Sciences Tools & Services - 4.3% | | | | | |
| | 99,765 | | | QIAGEN, N.V. (Netherlands)* | | $ | 3,616,660 | | | $ | 3,779,098 | |
| | 18,700 | | | Thermo Fisher Scientific, Inc. | | | 2,890,096 | | | | 4,564,296 | |
| | | | Managed Health Care - 2.4% | | | | | |
| | 17,000 | | | Anthem, Inc. | | | 4,056,157 | | | | 4,658,850 | |
| | | | Pharmaceuticals - 0.1% | | | | | | | | |
| | 5,000 | | | Elanco Animal Health, Inc.* | | | 120,000 | | | | 174,450 | |
| | | | | | | | | | | | |
| | Total Health Care | | | 26,626,461 | | | | 31,032,291 | |
| | | | This sector is 16.5% above your Fund’s cost. | | | | | |
| | Industrials | | | | | | | | |
| | | | Aerospace & Defense - 2.1% | | | | | | | | |
| | 24,800 | | | Harris Corp. | | | 3,742,455 | | | | 4,196,408 | |
| | | | Air Freight & Logistics - 3.2% | | | | | | | | |
| | 55,200 | | | XPO Logistics, Inc.* | | | 5,532,456 | | | | 6,302,184 | |
| | | | | | | | | | | | |
| | Total Industrials | | | 9,274,911 | | | | 10,498,592 | |
| | | | This sector is 13.2% above your Fund’s cost. | | | | | |
| | Information Technology | | | | | | | | |
| | | | Application Software - 5.4% | | | | | |
| | 14,985 | | | Adobe Systems, Inc.* | | | 3,722,862 | | | | 4,045,201 | |
| | 41,060 | | | Salesforce.com, Inc.* | | | 3,187,380 | | | | 6,529,772 | |
| | | | Data Processing & Outsourced Services - 10.0% | | | | | |
| | 37,520 | | | Global Payments, Inc. | | | 2,696,027 | | | | 4,780,048 | |
| | 20,700 | | | Mastercard, Inc., Class A | | | 3,608,354 | | | | 4,608,027 | |
| | 34,550 | | | Visa, Inc., Class A | | | 2,485,668 | | | | 5,185,609 | |
| | 51,000 | | | Worldpay, Inc., Class A* | | | 2,339,257 | | | | 5,164,770 | |
| | | | IT Consulting & Other Services - 2.1% | | | | | |
| | 82,379 | | | Booz Allen Hamilton Holding Corp. | | | 3,654,782 | | | | 4,088,470 | |
| | | | Semiconductors - 9.1% | | | | | | | | |
| | 277,977 | | | Advanced Micro Devices, Inc.*,1 | | | 3,572,900 | | | | 8,586,709 | |
| | 77,420 | | | Micron Technology, Inc.* | | | 3,275,947 | | | | 3,501,707 | |
| | 20,507 | | | NVIDIA Corp. | | | 1,776,598 | | | | 5,762,877 | |
| | | | Systems Software - 7.4% | | | | | | | | |
| | 100,800 | | | Microsoft Corp. | | | 6,616,654 | | | | 11,528,496 | |
| | 16,100 | | | ServiceNow, Inc.* | | | 1,388,838 | | | | 3,149,643 | |
| | | | | | | | | | | | |
| | Total Information Technology | | | 38,325,267 | | | | 66,931,329 | |
| | | | This sector is 74.6% above your Fund’s cost. | | | | | |
| | Materials | | | | | | | | |
| | | | Specialty Chemicals - 2.0% | | | | | | | | |
| | 8,550 | | | The Sherwin-Williams Co. | | | 3,886,588 | | | | 3,892,046 | |
| | | | This sector is 0.1% above your Fund’s cost. | | | | | |
| | Total Common Stocks | | | 133,948,890 | | | | 190,104,265 | |
|
The accompanying notes are an integral part of these financial statements. 15 |
AMG Managers Brandywine Blue Fund
Schedule of Portfolio Investments (continued)
| | | | | | | | | | | | |
Principal
Amount | | | | | Cost | | | Value | |
| | Short-Term Investments - 9.7% | | | | | | | | |
| | Commercial Paper - 3.8% | | | | | | | | |
| | $7,410,000 | | | Western Union Co., 2.40%, 10/01/182 | | $ | 7,410,000 | | | $ | 7,410,000 | |
| | Joint Repurchase Agreements - 5.8%3 | | | | | | | | |
| | 2,729,488 | | | Cantor Fitzgerald Securities, Inc., dated 09/28/18, due 10/01/18, 2.270% total to be received $2,730,004 (collateralized by various U.S. Government Agency Obligations and U.S. Treasuries, 0.000% - 9.000%, 10/25/18 - 08/20/68, totaling $2,784,078) | | | 2,729,488 | | | | 2,729,488 | |
| | 485,393 | | | Mizuho Securities USA, LLC, dated 09/28/18, due 10/01/18, 2.240% total to be received $485,484 (collateralized by various U.S. Treasuries, 0.500% - 3.000%, 03/31/20 - 09/09/49, totaling $495,101) | | | 485,393 | | | | 485,393 | |
| | 2,729,488 | | | Nomura Securities International, Inc., dated 09/28/18, due 10/01/18, 2.270% total to be received $2,730,004 (collateralized by various U.S. Government Agency Obligations and U.S. Treasuries, 0.000% - 9.500%, 10/01/18 - 08/20/68, totaling $2,784,078) | | | 2,729,488 | | | | 2,729,488 | |
| | 2,729,488 | | | RBC Dominion Securities, Inc., dated 09/28/18, due 10/01/18, 2.260% total to be received $2,730,002 (collateralized by various U.S. Government Agency Obligations and U.S. Treasuries, 0.000% - 7.000%, 10/04/18 - 09/09/49, totaling $2,784,078) | | | 2,729,488 | | | | 2,729,488 | |
| * | Non-income producing security. |
| 1 | Some or all of these securities, amounting to $10,992,953 or 5.6% of net assets, were out on loan to various brokers. |
| 2 | Percentage rate represents yield to maturity at September 30, 2018. |
| 3 | Collateral received from brokers for securities lending was invested in these joint repurchase agreements. |
| | | | | | | | | | | | |
Principal
Amount | | | | | Cost | | | Value | |
| | $2,818,488 | | | State of Wisconsin Investment Board, dated 09/28/18, due 10/01/18, 2.510% total to be received $2,819,078 (collateralized by various U.S. Treasuries, 0.125% - 3.875%, 04/15/20 - 02/15/48, totaling $2,875,260) | | $ | 2,818,488 | | | $ | 2,818,488 | |
| | | | | | | | | | | | |
| | | | Total Joint Repurchase Agreements | | | 11,492,345 | | | | 11,492,345 | |
| | | |
| Shares | | | | | | | | | |
| | Other Investment Companies - 0.1% | | | | | |
| | 40,049 | | | Dreyfus Government Cash Management Fund, Institutional Shares, 1.95%4 40,049 | | | | 40,049 | |
| | 40,049 | | | Dreyfus Institutional Preferred Government Money Market Fund, Institutional Shares, 1.97%4 | | | 40,049 | | | | 40,049 | |
| | 41,263 | | | JPMorgan U.S. Government Money Market Fund, IM Shares, 1.98%4 | | | 41,263 | | | | 41,263 | |
| | | | Total Other Investment Companies | | | 121,361 | | | | 121,361 | |
| | | | | | | | | | | | |
| | Total Short-Term Investments | | | 19,023,706 | | | | 19,023,706 | |
| | | | | | | | | | | | |
| | Total Investments - 106.2% | | $ | 152,972,596 | | | | 209,127,971 | |
| | Other Assets, less Liabilities - (6.2%) | | | | | | | (12,128,270 | ) |
| | Total Net Assets - 100.0% | | | | | | $ | 196,999,701 | |
| | | | | | | | | | | | |
| 4 | Yield shown represents the September 30, 2018, seven day average yield, which refers to the sum of the previous seven days’ dividends paid, expressed as an annual percentage. |
|
The accompanying notes are an integral part of these financial statements. 16 |
AMG Managers Brandywine Blue Fund
Schedule of Portfolio Investments (continued)
The following table summarizes the inputs used to value the Fund’s investments by the fair value hierarchy levels as of September 30, 2018:
| | | | | | | | | | | | | | | | |
| | | Level 1 | | | Level 2 | | | Level 3 | | | Total | |
Investments in Securities | | | | | | | | | | | | | | | | |
Common Stocks† | | $ | 190,104,265 | | | | — | | | | — | | | $ | 190,104,265 | |
Short-Term Investments | | | | | | | | | | | | | | | | |
Commercial Paper | | | — | | | $ | 7,410,000 | | | | — | | | | 7,410,000 | |
Joint Repurchase Agreements | | | — | | | | 11,492,345 | | | | — | | | | 11,492,345 | |
Other Investment Companies | | | 121,361 | | | | — | | | | — | | | | 121,361 | |
| | | | | | | | | | | | | | | | |
Total Investments in Securities | | $ | 190,225,626 | | | $ | 18,902,345 | | | | — | | | $ | 209,127,971 | |
| | | | | | | | | | | | | | | | |
| † | All common stocks held in the Fund are Level 1 securities. For a detailed breakout of common stocks by major industry classification, please refer to the Fund’s Schedule of Portfolio Investments. |
As of September 30, 2018, the Fund had no transfers between levels from the beginning of the reporting period.
The accompanying notes are an integral part of these financial statements.
Statement of Assets and Liabilities
September 30, 2018
| | | | | | | | |
| | | AMG
Managers
Brandywine Fund | | | AMG
Managers
Brandywine
Blue Fund | |
Assets: | | | | | | | | |
Investments at Value* (including securities on loan valued at $36,568,135, and $10,992,953, respectively) | | $ | 929,637,704 | | | $ | 209,127,971 | |
Cash | | | 135,816 | | | | — | |
Receivable for investments sold | | | 4,393,481 | | | | — | |
Dividend, interest and other receivables | | | 196,463 | | | | 4,855 | |
Receivable for Fund shares sold | | | 13,408 | | | | 8,072 | |
Receivable from affiliate | | | 2,919 | | | | — | |
Prepaid expenses and other assets | | | 11,010 | | | | 8,833 | |
Total assets | | | 934,390,801 | | | | 209,149,731 | |
Liabilities: | | | | | | | | |
Payable upon return of securities loaned | | | 37,779,640 | | | | 11,492,345 | |
Payable for investments purchased | | | 1,914,112 | | | | — | |
Payable for Fund shares repurchased | | | 455,693 | | | | 402,121 | |
Accrued expenses: | | | | | | | | |
Investment advisory and management fees | | | 642,207 | | | | 140,486 | |
Administrative fees | | | 109,467 | | | | 23,947 | |
Shareholder service fees | | | 27,178 | | | | 3,843 | |
Professional fees | | | 46,555 | | | | 34,114 | |
Trustee fees and expenses | | | 10,179 | | | | 2,238 | |
Other | | | 104,413 | | | | 50,936 | |
Total liabilities | | | 41,089,444 | | | | 12,150,030 | |
Net Assets | | $ | 893,301,357 | | | $ | 196,999,701 | |
* Investments at cost | | $ | 687,918,543 | | | $ | 152,972,596 | |
Net Assets Represent: | | | | | | | | |
Paid-in capital | | $ | 654,569,979 | | | $ | 141,916,550 | |
Accumulated net investment loss | | | (2,965,324 | ) | | | (708,354 | ) |
Accumulated net realized loss from investments | | | (22,459 | ) | | | (363,870 | ) |
Net unrealized appreciation on investments | | | 241,719,161 | | | | 56,155,375 | |
Net Assets | | $ | 893,301,357 | | | $ | 196,999,701 | |
Class I: | | | | | | | | |
Net Assets | | $ | 893,301,357 | | | $ | 196,999,701 | |
Shares outstanding | | | 15,948,569 | | | | 3,478,000 | |
Net asset value, offering and redemption price per share | | $ | 56.01 | | | $ | 56.64 | |
|
The accompanying notes are an integral part of these financial statements. 18 |
Statement of Operations
For the fiscal year ended September 30, 2018
| | | | | | | | |
| | | AMG
Managers
Brandywine Fund | | | AMG
Managers
Brandywine
Blue Fund | |
Investment Income: | | | | | | | | |
Dividend income | | $ | 4,811,535 | | | $ | 1,112,050 | |
Interest income | | | 401,436 | | | | 140,944 | |
Securities lending income | | | 226,731 | | | | 10,372 | |
Total investment income | | | 5,439,702 | | | | 1,263,366 | |
Expenses: | | | | | | | | |
Investment advisory and management fees | | | 7,185,594 | | | | 1,607,130 | |
Administrative fees | | | 1,224,817 | | | | 273,943 | |
Shareholder servicing fees - Class I | | | 175,891 | | | | 87,175 | |
Transfer agent fees | | | 99,323 | | | | 14,709 | |
Custodian fees | | | 64,433 | | | | 22,414 | |
Professional fees | | | 61,840 | | | | 37,704 | |
Reports to shareholders | | | 58,177 | | | | 32,065 | |
Trustee fees and expenses | | | 54,884 | | | | 12,304 | |
Registration fees | | | 27,001 | | | | 25,535 | |
Miscellaneous | | | 15,576 | | | | 3,805 | |
Total expenses before offsets | | | 8,967,536 | | | | 2,116,784 | |
Fee waivers | | | (32,662 | ) | | | — | |
Net expenses | | | 8,934,874 | | | | 2,116,784 | |
Net investment loss | | | (3,495,172 | ) | | | (853,418 | ) |
Net Realized and Unrealized Gain: | | | | | | | | |
Net realized gain on investments | | | 98,938,137 | | | | 19,700,383 | |
Net change in unrealized appreciation/depreciation on investments | | | 94,574,014 | | | | 20,560,676 | |
Net realized and unrealized gain | | | 193,512,151 | | | | 40,261,059 | |
Net increase in net assets resulting from operations | | $ | 190,016,979 | | | $ | 39,407,641 | |
|
The accompanying notes are an integral part of these financial statements. 19 |
Statements of Changes in Net Assets
For the fiscal years ended September 30,
| | | | | | | | | | | | | | | | |
| | | AMG
Managers
Brandywine Fund | | | AMG
Managers
Brandywine Blue Fund | |
| | | 2018 | | | 20171 | | | 2018 | | | 20171 | |
Increase in Net Assets Resulting From Operations: | | | | | | | | | | | | | | | | |
Net investment loss | | $ | (3,495,172 | ) | | $ | (3,167,941 | ) | | $ | (853,418 | ) | | $ | (469,725 | ) |
Net realized gain on investments | | | 98,938,137 | | | | 79,635,473 | | | | 19,700,383 | | | | 19,449,670 | |
Net change in unrealized appreciation/depreciation on investments | | | 94,574,014 | | | | 50,520,064 | | | | 20,560,676 | | | | 15,658,514 | |
Net increase in net assets resulting from operations | | | 190,016,979 | | | | 126,987,596 | | | | 39,407,641 | | | | 34,638,459 | |
Capital Share Transactions:2 | | | | | | | | | | | | | | | | |
Net decrease from capital share transactions | | | (68,189,568 | ) | | | (76,279,999 | ) | | | (14,861,716 | ) | | | (19,137,433 | ) |
Total increase in net assets | | | 121,827,411 | | | | 50,707,597 | | | | 24,545,925 | | | | 15,501,026 | |
Net Assets: | | | | | | | | | | | | | | | | |
Beginning of year | | | 771,473,946 | | | | 720,766,349 | | | | 172,453,776 | | | | 156,952,750 | |
End of year | | $ | 893,301,357 | | | $ | 771,473,946 | | | $ | 196,999,701 | | | $ | 172,453,776 | |
End of year accumulated net investment loss | | $ | (2,965,324 | ) | | $ | (2,622,386 | ) | | $ | (708,354 | ) | | $ | (451,815 | ) |
| | | | | | | | | | | | | | | | |
| 1 | Effective February 27, 2017, the Funds’ share classes were renamed as described in Note 1 of the Notes to the Financial Statements. |
| 2 | See Note 1(g) of the Notes to Financial Statements. |
|
The accompanying notes are an integral part of these financial statements. 20 |
AMG Managers Brandywine Fund
Financial Highlights
For a share outstanding throughout each fiscal year
| | | | | | | | | | | | | | | | | | | | |
| | | For the fiscal years ended September 30, | |
| Class I | | 2018 | | | 20171 | | | 2016 | | | 2015 | | | 20142 | |
Net Asset Value, Beginning of Year | | $ | 44.48 | | | $ | 37.42 | | | $ | 34.54 | | | $ | 33.25 | | | $ | 28.75 | |
Income (loss) from Investment Operations: | | | | | | | | | | | | | | | | | | | | |
Net investment income (loss)3,4 | | | (0.21 | ) | | | (0.17 | )5 | | | (0.08 | )6 | | | 0.04 | 7 | | | (0.12 | ) |
Net realized and unrealized gain on investments | | | 11.74 | | | | 7.23 | | | | 2.96 | | | | 1.25 | | | | 4.62 | |
Total income from investment operations | | | 11.53 | | | | 7.06 | | | | 2.88 | | | | 1.29 | | | | 4.50 | |
Net Asset Value, End of Year | | $ | 56.01 | | | $ | 44.48 | | | $ | 37.42 | | | $ | 34.54 | | | $ | 33.25 | |
Total Return4,8 | | | 25.92 | % | | | 18.87 | % | | | 8.34 | % | | | 3.88 | % | | | 15.65 | % |
Ratio of net expenses to average net assets | | | 1.10 | % | | | 1.11 | % | | | 1.11 | % | | | 1.10 | % | | | 1.10 | % |
Ratio of gross expenses to average net assets4,9 | | | 1.10 | % | | | 1.12 | % | | | 1.11 | % | | | 1.10 | % | | | 1.10 | % |
Ratio of net investment income (loss) to average net assets | | | (0.43 | )% | | | (0.43 | )% | | | (0.24 | )% | | | 0.10 | % | | | (0.37 | )% |
Portfolio turnover | | | 138 | % | | | 187 | % | | | 185 | % | | | 190 | % | | | 219 | % |
Net assets end of year (000’s) omitted | | $ | 893,301 | | | $ | 771,474 | | | $ | 720,766 | | | $ | 759,185 | | | $ | 799,045 | |
| | | | | | | | | | | | | | | | | | | | |
| 1 | Effective February 27, 2017, the Fund’s Class S shares were renamed to Class I shares. |
| 2 | At the start of business October 1, 2013, the Fund was reorganized into a fund of AMG Funds I. |
| 3 | Per share numbers have been calculated using average shares. |
| 4 | Total returns and net investment income (loss) would have been lower had certain expenses not been offset. |
| 5 | Includes non-recurring dividends. Without these dividends, net investment loss per share would have been $(0.22). |
| 6 | Includes non-recurring dividends. Without these dividends, net investment loss per share would have been $(0.10). |
| 7 | Includes non-recurring dividends. Without these dividends, net investment loss per share would have been $(0.07). |
| 8 | The total return is calculated using the published Net Asset Value as of fiscal year end. |
| 9 | Excludes the impact of expense reimbursement or fee waivers and expense reductions such as brokerage credits, but includes expense repayments and non-reimbursable expenses, if any, such as interest, taxes, and extraordinary expenses. (See Note 1(c) and 2 in the Notes to Financial Statements.) |
AMG Managers Brandywine Blue Fund
Financial Highlights
For a share outstanding throughout each fiscal year
| | | | | | | | | | | | | | | | | | | | |
| | | For the fiscal years ended September 30, | |
| Class I | | 2018 | | | 20171 | | | 2016 | | | 2015 | | | 20142 | |
Net Asset Value, Beginning of Year | | $ | 45.69 | | | $ | 36.87 | | | $ | 33.95 | | | $ | 33.51 | | | $ | 30.01 | |
Income (loss) from Investment Operations: | | | | | | | | | | | | | | | | | | | | |
Net investment income (loss)3 | | | (0.24 | ) | | | (0.12 | )4 | | | (0.02 | )5 | | | 0.10 | 6 | | | (0.03 | ) |
Net realized and unrealized gain on investments | | | 11.19 | | | | 8.94 | | | | 3.02 | | | | 0.34 | | | | 3.53 | |
Total income from investment operations | | | 10.95 | | | | 8.82 | | | | 3.00 | | | | 0.44 | | | | 3.50 | |
Less Distributions to Shareholders from: | | | | | | | | | | | | | | | | | | | | |
Net investment income | | | — | | | | — | | | | (0.08 | ) | | | — | | | | — | |
Net Asset Value, End of Year | | $ | 56.64 | | | $ | 45.69 | | | $ | 36.87 | | | $ | 33.95 | | | $ | 33.51 | |
Total Return7 | | | 23.97 | % | | | 23.92 | % | | | 8.86 | % | | | 1.31 | % | | | 11.66 | % |
Ratio of expenses to average net assets | | | 1.16 | % | | | 1.20 | % | | | 1.20 | % | | | 1.20 | % | | | 1.19 | % |
Ratio of net investment income (loss) to average net assets | | | (0.47 | )% | | | (0.29 | )% | | | (0.05 | )% | | | 0.29 | % | | | (0.11 | )% |
Portfolio turnover | | | 122 | % | | | 167 | % | | | 139 | % | | | 156 | % | | | 182 | % |
Net assets end of year (000’s) omitted | | $ | 197,000 | | | $ | 172,454 | | | $ | 156,953 | | | $ | 169,180 | | | $ | 215,941 | |
| | | | | | | | | | | | | | | | | | | | |
| 1 | Effective February 27, 2017, the Fund’s Class S shares were renamed to Class I shares. |
| 2 | At the start of business October 1, 2013, the Fund was reorganized into a fund of AMG Funds I. |
| 3 | Per share numbers have been calculated using average shares. |
| 4 | Includes non-recurring dividends. Without these dividends, net investment loss per share would have been $(0.18). |
| 5 | Includes non-recurring dividends. Without these dividends, net investment loss per share would have been $(0.04). |
| 6 | Includes non-recurring dividends. Without these dividends, net investment loss per share would have been $(0.08). |
| 7 | The total return is calculated using the published Net Asset Value as of fiscal year end. |
Notes to Financial Statements
September 30, 2018
1. SUMMARY OF SIGNIFICANT ACCOUNTING POLICIES
AMG Funds I (the “Trust”) is an open-end management investment company, organized as a Massachusetts business trust, and registered under the Investment Company Act of 1940, as amended (the “1940 Act”). Currently, the Trust consists of a number of different funds, each having distinct investment management objectives, strategies, risks, and policies. Included in this report are AMG Managers Brandywine Fund (“Brandywine”) and AMG Managers Brandywine Blue Fund (“Brandywine Blue”), each a “Fund” and collectively, the “Funds.”
A significant portion of the Brandywine Blue’s holdings may be focused in a relatively small number of securities, which may make the Fund more volatile and subject to greater risk than a more diversified fund.
Effective February 27, 2017, each Fund’s Class S shares were renamed to Class I shares. Please refer to a current prospectus for additional information.
The Funds’ financial statements are prepared in accordance with accounting principles generally accepted in the United States of America (“U.S. GAAP”), including accounting and reporting guidance pursuant to Accounting Standards Codification Topic 946 applicable to investment companies. U.S. GAAP requires management to make estimates and assumptions that affect the reported amounts of assets and liabilities and disclosure of contingent assets and liabilities at the date of the financial statements and the reported amounts of income and expenses during the reporting period. Actual results could differ from those estimates and such differences could be material. The following is a summary of significant accounting policies followed by the Funds in the preparation of their financial statements:
a. VALUATION OF INVESTMENTS
Equity securities traded on a national securities exchange or reported on the NASDAQ national market system (“NMS”) are valued at the last quoted sales price on the primary exchange or, if applicable, the NASDAQ official closing price or the official closing price of the relevant exchange or, lacking any sales, at the last quoted bid price or the mean between the last quoted bid and ask prices (the “exchange mean price”). Equity securities traded in the over-the-counter market (other than NMS securities) are valued at the exchange mean price. Foreign equity securities (securities principally traded in markets other than U.S. markets) are valued at the official closing price on the primary exchange or, for markets that either do not offer an official closing price or where the official closing price may not be representative of the overall market, the last quoted sale price.
Fixed income securities purchased with a remaining maturity of 60 days or less are valued at amortized cost, provided that the amortized cost value is approximately the same as the fair value of the security valued without the use of amortized cost. Investments in other open-end regulated investment companies are valued at their end of day net asset value per share.
The Funds’ portfolio investments are generally valued based on independent market quotations or prices or, if none, “evaluative” or other market based valuations provided by third party pricing services approved by the Board of Trustees of the Trust (the “Board”). Under certain circumstances, the value of certain Fund portfolio investments may be based on an evaluation of fair value, pursuant to procedures established by and under the general supervision of the Board. The Valuation Committee, which is comprised of the Independent Trustees of the Board, and the Pricing Committee, which is comprised of representatives from AMG Funds LLC (the “Investment Manager”) are the committees appointed by the Board to make fair value determinations. Each Fund may use the fair value of a
portfolio investment to calculate its net asset value (“NAV”) in the event that the market quotation, price or market based valuation for the portfolio investment is not readily available or otherwise not determinable pursuant to the Board’s valuation procedures, if the Investment Manager or the Pricing Committee believes the quotation, price or market based valuation to be unreliable, or in certain other circumstances. When determining the fair value of an investment, the Pricing Committee and, if required under the Trust’s securities valuation procedures, the Valuation Committee, seeks to determine the price that the Fund might reasonably expect to receive from current sale of that portfolio investment in an arms-length transaction. Fair value determinations shall be based upon consideration of all available facts and information, including, but not limited to (i) attributes specific to the investment; (ii) fundamental and analytical data relating to the investment; and (iii) the value of other comparable securities or relevant financial instruments, including derivative securities, traded on other markets or among dealers.
The values assigned to fair value portfolio investments are based on available information and do not necessarily represent amounts that might ultimately be realized in the future, since such amounts depend on future developments inherent in long-term investments. Because of the inherent uncertainty of valuation, those estimated values may differ significantly from the values that would have been used had a ready market for the investments existed, and the differences could be material. The Board will be presented with a quarterly report showing as of the most recent quarter end, all outstanding securities fair valued by the Fund, including a comparison with the prior quarter end and the percentage of the Fund that the security represents at each quarter end.
With respect to foreign equity securities and certain foreign fixed income securities, the Board has adopted a policy that securities held in a Fund that can be fair valued by the applicable fair value pricing service are fair valued on each business day provided that each individual price exceeds a pre-established confidence level.
U.S. GAAP defines fair value as the price that a fund would receive to sell an asset or pay to transfer a liability in an orderly transaction between market participants at the measurement date. U.S. GAAP also establishes a framework for measuring fair value, and a three level hierarchy for fair value measurements based upon the transparency of inputs to the valuation of an asset or liability. Inputs may be observable or unobservable and refer broadly to the assumptions that market participants would use in pricing the asset or liability. Observable inputs reflect the assumptions market participants would use in pricing the asset or liability based on market data obtained from sources independent of the Funds. Unobservable inputs reflect the Funds’ own assumptions about the assumptions that market participants would use in pricing the asset or liability developed based on the best information available in the circumstances. Each investment is assigned a level based upon the observability of the inputs which are significant to the overall valuation.
The three-tier hierarchy of inputs is summarized below:
Level 1 – inputs are quoted prices in active markets for identical investments (e.g., equity securities, open-end investment companies)
Level 2 – other observable inputs (including, but not limited to: quoted prices for similar assets or liabilities in markets that are active, quoted prices for identical or similar assets or liabilities in markets that are not active, inputs other than quoted prices that are observable for the assets or liabilities (such as interest rates, yield curves, volatilities, prepayment speeds, loss severities, credit risks and default rates) or other market corroborated inputs) (e.g., debt securities, government securities, foreign currency exchange contracts, foreign securities utilizing international fair value pricing, fair valued securities with observable inputs)
Notes to Financial Statements (continued)
Level 3 – inputs are significant unobservable inputs (including the Fund’s own assumptions used to determine the fair value of investments) (e.g., fair valued securities with unobservable inputs)
Changes in inputs or methodologies used for valuing investments may result in a transfer in or out of levels within the fair value hierarchy. The inputs or methodologies used for valuing investments may not necessarily be an indication of the risk associated with investing in those investments. Transfers between different levels of the fair value disclosure hierarchy are deemed to have occurred as of the beginning of the reporting period.
b. SECURITY TRANSACTIONS
Security transactions are accounted for as of trade date. Realized gains and losses on securities sold are determined on the basis of identified cost.
c. INVESTMENT INCOME AND EXPENSES
Dividend income is recorded on the ex-dividend date. Dividends from foreign securities are recorded on the ex-dividend date, and if after the fact, as soon as the Fund becomes aware of the ex-dividend date. Interest income, which includes amortization of premium and accretion of discount on debt securities, is accrued as earned. Dividend and interest income on foreign securities is recorded gross of any withholding tax. Non-cash dividends included in dividend income, if any, are reported at the fair market value of the securities received. Other income and expenses are recorded on an accrual basis. Expenses that cannot be directly attributed to a Fund are apportioned among the funds in the Trust and other trusts within the AMG Funds family of mutual funds (collectively the “AMG Funds Family”) based upon their relative average net assets or number of shareholders.
d. DIVIDENDS AND DISTRIBUTIONS
Fund distributions resulting from either net investment income or realized net capital gains, if any, will normally be declared and paid at least annually in December. Distributions to shareholders are recorded on the ex-dividend date. Distributions are determined in accordance with federal income tax regulations, which may differ from net investment income and net realized capital gains for financial statement purposes (U.S. GAAP). Differences may be permanent or temporary. Permanent differences are reclassified among capital accounts in the financial statements to reflect their tax character. Permanent book and tax basis differences, if any, relating to shareholder distributions will result in reclassifications to paid-in capital. Temporary differences arise when certain items of income, expense and gain or loss are recognized in different periods for financial statement and tax purposes; these differences will reverse at some time in the future. Permanent differences are primarily due to expired capital loss carryovers and a net operating loss write off. Temporary differences are primarily due to qualified late year ordinary losses and wash sales.
As of September 30, 2018, the components of distributable earnings (excluding unrealized appreciation/depreciation) on a tax basis consisted of:
| | | | | | | | |
| | | Brandywine | | | Brandywine Blue | |
Capital loss carryforward | | | — | | | | — | |
Undistributed ordinary income | | | — | | | | — | |
Undistributed short-term capital gains | | | — | | | | — | |
Undistributed long-term capital gains | | | — | | | | — | |
Late-year loss deferral | | $ | 2,965,324 | | | $ | 708,354 | |
At September 30, 2018, the approximate cost of investments and the aggregate gross unrealized appreciation and depreciation for federal income tax purposes were as follows:
| | | | | | | | | | | | | | | | |
| Fund | | Cost | | | Appreciation | | | Depreciation | | | Net | |
Brandywine | | $ | 687,941,002 | | | $ | 245,742,819 | | | $ | (4,046,117 | ) | | $ | 241,696,702 | |
Brandywine Blue | | | 153,336,466 | | | | 56,614,514 | | | | (823,009 | ) | | | 55,791,505 | |
e. FEDERAL TAXES
Each Fund currently qualifies as an investment company and intends to comply with the requirements under Subchapter M of the Internal Revenue Code of 1986, as amended, and to distribute substantially all of its taxable income and gains to its shareholders and to meet certain diversification and income requirements with respect to investment companies. Therefore, no provision for federal income or excise tax is included in the accompanying financial statements.
Additionally, based on each Fund’s understanding of the tax rules and rates related to income, gains and transactions for the foreign jurisdictions in which it invests, each Fund will provide for foreign taxes, and where appropriate, deferred foreign taxes.
Management has analyzed the Funds’ tax positions taken on federal income tax returns as of September 30, 2018, and for all open tax years (generally, the three prior taxable years), and has concluded that no provision for federal income tax is required in the Funds’ financial statements. Additionally, Management is not aware of any tax position for which it is reasonably possible that the total amounts of unrecognized tax benefits will change materially in the next twelve months.
Net capital losses incurred may be carried forward for an unlimited time period, and retain their tax character as either short-term or long-term capital losses.
f. CAPITAL LOSS CARRYOVERS AND DEFERRALS
As of September 30, 2018, the Funds had no accumulated net realized capital loss carryovers from securities transactions for federal income tax purposes. Should the Fund incur net capital losses for the fiscal year ended September 30, 2019, such amounts may be used to offset future realized capital gains, for an unlimited time period.
Notes to Financial Statements (continued)
For the fiscal year ended September 30, 2018, the following Funds utilized capital loss carryovers in the amount of:
| | | | | | | | |
| | | Capital Loss Carryover Utilized | |
| Fund | | Short-Term | | | Long-Term | |
Brandywine | | $ | 98,467,559 | | | | — | |
Brandywine Blue | | $ | 19,949,580 | | | | — | |
g. CAPITAL STOCK
The Trust’s Declaration of Trust authorizes for each Fund the issuance of an unlimited number of shares of beneficial interest, without par value. Each Fund records sales and repurchases of its capital stock on the trade date.
For the fiscal years ended September 30, 2018 and September 30, 2017, the capital stock transactions by class for the Funds were as follows:
| | | | | | | | | | | | | | | | | | | | | | | | | | | | | | | | |
| | | | | | Brandywine | | | | | | | | | Brandywine Blue | | | | |
| | | September 30, 2018 | | | September 30, 2017 | | | September 30, 2018 | | | September 30, 2017 | |
| | | Shares | | | Amount | | | Shares | | | Amount | | | Shares | | | Amount | | | Shares | | | Amount | |
Class I: | | | | | | | | | | | | | | | | | | | | | | | | | | | | | | | | |
Proceeds from sale of shares | | | 70,754 | | | $ | 3,508,461 | | | | 69,268 | | | $ | 2,793,859 | | | | 68,721 | | | $ | 3,551,878 | | | | 47,038 | | | $ | 1,908,164 | |
Cost of shares repurchased | | | (1,466,670 | ) | | | (71,698,029 | ) | | | (1,984,696 | ) | | | (79,073,858 | ) | | | (365,341 | ) | | | (18,413,594 | ) | | | (529,513 | ) | | | (21,045,597 | ) |
| | | | | | | | | | | | | | | | | | | | | | | | | | | | | | | | |
Net decrease | | | (1,395,916 | ) | | $ | (68,189,568 | ) | | | (1,915,428 | ) | | $ | (76,279,999 | ) | | | (296,620 | ) | | $ | (14,861,716 | ) | | | (482,475 | ) | | $ | (19,137,433 | ) |
| | | | | | | | | | | | | | | | | | | | | | | | | | | | | | | | |
h. REPURCHASE AGREEMENTS AND JOINT REPURCHASE AGREEMENTS
The Funds may enter into third-party repurchase agreements for temporary cash management purposes and third-party or bilateral joint repurchase agreements for reinvestment of cash collateral on securities lending transactions under the securities lending program offered by The Bank of New York Mellon (“BNYM”) (the “Program”) (collectively, “Repurchase Agreements”). The value of the underlying collateral, including accrued interest, must equal or exceed the value of the Repurchase Agreements during the term of the agreement. For joint repurchase agreements, the Funds participate on a pro rata basis with other clients of BNYM in its share of the underlying collateral under such joint repurchase agreements and in its share of proceeds from any repurchase or other disposition of the underlying collateral. The underlying collateral for all Repurchase Agreements is held in safekeeping by the Funds’ custodian or at the Federal Reserve Bank. If the seller defaults and the value of the collateral declines, or if bankruptcy proceedings commence with respect to the seller of the security, realization of the collateral by the Funds may be delayed or limited. Pursuant to the Program, the Funds are indemnified for such losses by BNYM on joint repurchase agreements.
At September 30, 2018, the market value of Repurchase Agreements outstanding for Brandywine and Brandywine Blue were $37,779,640 and $11,492,345, respectively.
2. AGREEMENTS AND TRANSACTIONS WITH AFFILIATES
For each of the Funds, the Trust has entered into an investment advisory agreement under which the Investment Manager, a subsidiary and the U.S. retail distribution arm of Affiliated Managers Group, Inc. (“AMG”), serves as investment manager to the Funds and is responsible for the Funds’ overall administration and operations. The Investment Manager selects one or more subadvisers for the Funds (subject to Board approval) and monitors each subadviser’s investment performance, security holdings and investment strategies. Each Fund’s investment portfolio is managed by Friess Associates, LLC (“Friess”) and Friess Associates of Delaware, LLC (“Friess of Delaware”) who serve pursuant to a subadvisory agreement with the Investment Manager.
Investment management fees are paid directly by the Funds to the Investment Manager based on average daily net assets. For the fiscal year ended September 30, 2018, the Funds’ investment management fees were paid at the following annual rate of each Fund’s respective average daily net assets:
| | | | |
Brandywine | | | 0.88 | % |
Brandywine Blue | | | 0.88 | % |
The Trust, on behalf of the Funds, has entered into an amended and restated Administration Agreement under which the Investment Manager serves as the Funds’ administrator (the “Administrator”) and is responsible for all non-portfolio management aspects of managing the Fund’s operations, including administration and shareholder services to each Fund. Each Fund pays a fee to the Administrator at the rate of 0.15% per annum of the Fund’s average daily net assets for this service. The Administrator for Brandywine is contractually obligated to waive a portion of the administration fee in an amount equal to an annual rate of 0.004% of the Fund’s average daily net assets which expired on September 30, 2018. For the fiscal year ended September 30, 2018, Brandywine waived $32,662.
The Funds are distributed by AMG Distributors, Inc. (the “Distributor”), a wholly-owned subsidiary of the Investment Manager. The Distributor serves as the distributor and underwriter for each Fund and is a registered broker-dealer and member of the Financial Industry Regulatory Authority, Inc. (“FINRA”). Shares of each Fund will be continuously offered and will be sold directly to prospective purchasers and through brokers, dealers or other financial intermediaries who have executed selling agreements with the Distributor. Generally the Distributor bears all or a portion of the expenses of providing services pursuant to the distribution agreement, including the payment of the expenses relating to the distribution of prospectuses for sales purposes and any advertising or sales literature.
For Class I shares, the Board has approved reimbursement payments to the Investment Manager for shareholder servicing expenses (“shareholder servicing fees”) incurred. Shareholder servicing fees include payments to financial intermediaries, such as broker-dealers (including fund supermarket platforms),
Notes to Financial Statements (continued)
banks, and trust companies who provide shareholder recordkeeping, account servicing and other services. The Class I shares may reimburse the Investment Manager for the actual amount incurred up to a maximum annual rate of each Class I shares average daily net assets as shown in the table below.
The impact on the annualized expense ratio for the fiscal year ended September 30, 2018, were as follows:
| | | | | | | | |
| Fund | | Maximum Annual
Amount
Approved | | | Actual
Amount
Incurred | |
Brandywine | | | | | | | | |
Class I | | | 0.15 | % | | | 0.02 | % |
Brandywine Blue | | | | | | | | |
Class I | | | 0.15 | % | | | 0.05 | % |
The Board provides supervision of the affairs of the Trust and other trusts within the AMG Funds family. The Trustees of the Trust who are not affiliated with the Investment Manager receive an annual retainer and per meeting fees for regular, special and telephonic meetings, and they are reimbursed for out-of-pocket expenses incurred while carrying out their duties as Board members. The Chairman of the Board and the Audit Committee Chair receive additional annual retainers. Certain Trustees and Officers of the Funds are Officers and/or Directors of the Investment Manager, AMG and/or the Distributor.
The Securities and Exchange Commission (the “SEC”) granted an exemptive order that permits the Funds to lend and borrow money for certain temporary purposes directly to and from other eligible funds in the AMG Funds family. Participation in this interfund lending program is voluntary for both the borrowing and lending funds, and an interfund loan is only made if it benefits each participating fund. The Administrator manages the program according to procedures approved by the Board, and the Board monitors the operation of the program. An interfund loan must comply with certain conditions set out in the exemptive order, which are designed to assure fairness and protect all participating funds. For the fiscal year ended September 30, 2018, the Funds neither borrowed from nor lent to other funds in the AMG Funds family. At September 30, 2018, the Funds had no interfund loans outstanding.
3. PURCHASES AND SALES OF SECURITIES
Purchases and sales of securities (excluding short-term securities and U.S. Government Obligations) for the fiscal year ended September 30, 2018, were as follows:
| | | | | | | | |
| | | Long Term Securities | |
| Fund | | Purchases | | | Sales | |
Brandywine | | $ | 1,095,371,711 | | | $ | 1,156,057,440 | |
Brandywine Blue | | | 211,783,429 | | | | 226,548,278 | |
The Funds had no purchases or sales of U.S. Government Obligations during the fiscal year ended September 30, 2018.
4. PORTFOLIO SECURITIES LOANED
The Funds participate in the Program providing for the lending of securities to qualified brokers. Securities lending income includes earnings of such temporary cash investments, plus or minus any rebate to a borrower. These earnings (after any rebate) are then divided between BNYM, as a fee for its services under the Program, and the Funds, according to agreed-upon rates. Collateral on all securities loaned is accepted in cash and is maintained at a minimum level of 102% (105% in the case of certain foreign securities) of the market value, plus interest, if applicable, of investments on loan. It is the Funds’ policy to obtain additional collateral from or return excess collateral to the borrower by the end of the next business day, following the valuation date of the securities loaned. Therefore, the value of the collateral held may be temporarily less than the value of the securities on loan. Lending securities entails a risk of loss to the Funds if and to the extent that the market value of the securities loaned were to increase and the borrower did not increase the collateral accordingly, and the borrower fails to return the securities. Under the terms of the Program, the Funds are indemnified for such losses by BNYM. Cash collateral is held in a separate omnibus account managed by BNYM, who is authorized to exclusively enter into joint repurchase agreements. BNYM bears the risk of any deficiency in the amount of the cash collateral available for return to the borrower due to any loss on the collateral invested.
The value of securities loaned on positions held and cash collateral received at September 30, 2018, were as follows:
| | | | | | | | |
| Fund | | Securities
Loaned | | | Cash
Collateral
Received | |
Brandywine | | $ | 36,568,135 | | | $ | 37,779,640 | |
Brandywine Blue | | | 10,992,953 | | | | 11,492,345 | |
5. COMMITMENTS AND CONTINGENCIES
Under the Trust’s organizational documents, its trustees and officers are indemnified against certain liabilities arising out of the performance of their duties to the Trust. In addition, in the normal course of business, the Funds may enter into contracts and agreements that contain a variety of representations and warranties, which provide general indemnifications. The maximum exposure to the Funds under these arrangements is unknown, as this would involve future claims that may be made against a Fund that have not yet occurred. However, based on experience, the Funds had no prior claims or losses and expect the risks of loss to be remote.
6. MASTER NETTING AGREEMENTS
The Funds may enter into master netting agreements with their counterparties for the securities lending program and Repurchase Agreements, which provide the right, in the event of default (including bankruptcy or insolvency) for the non-defaulting party to liquidate the collateral and calculate net exposure to the defaulting party or request additional collateral. For financial reporting purposes, the Funds do not offset financial assets and financial liabilities that are subject to master netting agreements in the Statement of Assets and Liabilities. For securities lending transactions, see Note 4.
Notes to Financial Statements (continued)
The following table is a summary of the Funds’ open Repurchase Agreements that are subject to a master netting agreement as of September 30, 2018:
| | | | | | | | | | | | | | | | |
| | | | | | Gross Amount Not Offset in the
Statement of Assets and Liabilities | | | | |
| Fund | | Net Amounts of Assets
Presented in the Statement
of Assets and Liabilities | | | Financial
Instruments
Collateral | | | Cash Collateral
Received | | | Net Amount | |
Brandywine | | | | | | | | | | | | | | | | |
Cantor Fitzgerald Securities, Inc. | | $ | 8,973,238 | | | $ | 8,973,238 | | | | — | | | | — | |
Merrill Lynch, Pierce, Fenner & Smith, Inc. | | | 1,886,688 | | | | 1,886,688 | | | | — | | | | — | |
Nomura Securities International, Inc. | | | 8,973,238 | | | | 8,973,238 | | | | — | | | | — | |
RBC Dominion Securities, Inc. | | | 8,973,238 | | | | 8,973,238 | | | | — | | | | — | |
State of Wisconsin Investment Board | | | 8,973,238 | | | | 8,973,238 | | | | — | | | | — | |
| | | | | | | | | | | | | | | | |
Totals | | $ | 37,779,640 | | | $ | 37,779,640 | | | | — | | | | — | |
| | | | | | | | | | | | | | | | |
Brandywine Blue | | | | | | | | | | | | | | | | |
Cantor Fitzgerald Securities, Inc. | | $ | 2,729,488 | | | $ | 2,729,488 | | | | — | | | | — | |
Mizuho Securities USA, LLC | | | 485,393 | | | | 485,393 | | | | — | | | | — | |
Nomura Securities International, Inc. | | | 2,729,488 | | | | 2,729,488 | | | | — | | | | — | |
RBC Dominion Securities, Inc. | | | 2,729,488 | | | | 2,729,488 | | | | — | | | | — | |
State of Wisconsin Investment Board | | | 2,818,488 | | | | 2,818,488 | | | | — | | | | — | |
| | | | | | | | | | | | | | | | |
Totals | | $ | 11,492,345 | | | $ | 11,492,345 | | | | — | | | | — | |
| | | | | | | | | | | | | | | | |
7. REGULATORY UPDATES
In August 2018, the FASB issued Accounting Standards Update No. 2018-13, Fair Value Measurement (Topic 820), Disclosure Framework—Changes to the Disclosure Requirements for Fair Value Measurement (“ASU 2018-13”) which is effective for periods starting after December 15, 2019. The primary focus of the update is to improve the effectiveness of ASC 820’s disclosure in the notes to financial statements. Management is currently evaluating the impact, if any, of applying ASU 2018-13.
Effective November 15, 2018, the SEC amended existing rules intended to modernize reporting and disclosure of information. These amendments relate to
Regulation S-X which sets forth the form and content of financial statements. Management is evaluating the implications of adopting these amendments and their impact on the financial statements and accompanying notes.
8. SUBSEQUENT EVENTS
The Funds have determined that no material events or transactions occurred through the issuance date of the Funds’ financial statements, which require an additional disclosure in or adjustment of the Funds’ financial statements.
Report of Independent Registered Public Accounting Firm
TO THE BOARD OF TRUSTEES OF AMG FUNDS I AND SHAREHOLDERS OF AMG MANAGERS BRANDYWINE FUND AND AMG MANAGERS BRANDYWINE BLUE FUND
Opinions on the Financial Statements
We have audited the accompanying statements of assets and liabilities, including the schedules of portfolio investments, of AMG Managers Brandywine Fund and AMG Managers Brandywine Blue Fund (constituting two of the funds constituting AMG Funds I, hereafter collectively referred to as the “Funds”) as of September 30, 2018, the related statements of operations for the year ended September 30, 2018, the statements of changes in net assets for each of the two years in the period ended September 30, 2018, including the related notes, and the financial highlights for each of the five years in the period ended September 30, 2018 (collectively referred to as the “financial statements”). In our opinion, the financial statements present fairly, in all material respects, the financial position of each of the Funds as of September 30, 2018, the results of each of their operations for the year then ended, the changes in each of their net assets for each of the two years in the period ended September 30, 2018 and each of the financial highlights for each of the five years in the period ended September 30, 2018 in conformity with accounting principles generally accepted in the United States of America.
Basis for Opinions
These financial statements are the responsibility of the Funds’ management. Our responsibility is to express an opinion on the Funds’ financial statements based on our audits. We are a public accounting firm registered with the Public Company Accounting Oversight Board (United States) (“PCAOB”) and are required to be independent with respect to the Funds in accordance with the U.S. federal securities laws and the applicable rules and regulations of the Securities and Exchange Commission and the PCAOB.
We conducted our audits of these financial statements in accordance with the standards of the PCAOB. Those standards require that we plan and perform the audit to obtain reasonable assurance about whether the financial statements are free of material misstatement, whether due to error or fraud.
Our audits included performing procedures to assess the risks of material misstatement of the financial statements, whether due to error or fraud, and performing procedures that respond to those risks. Such procedures included examining, on a test basis, evidence regarding the amounts and disclosures in the financial statements. Our audits also included evaluating the accounting principles used and significant estimates made by management, as well as evaluating the overall presentation of the financial statements. Our procedures included confirmation of securities owned as of September 30, 2018 by correspondence with the custodian and brokers, and the application of alternative auditing procedures where securities purchased had not been received. We believe that our audits provide a reasonable basis for our opinions.
PricewaterhouseCoopers LLP
Boston, Massachusetts
November 5, 2018
We have served as the auditor of one or more investment companies in AMG Funds Family since 1993.
Other Information
TAX INFORMATION
The AMG Managers Brandywine Fund and AMG Managers Brandywine Blue Fund each hereby designates the maximum amount allowable of its net taxable income as qualified dividends as provided in the Jobs and Growth Tax Relief Reconciliation Act of 2003. The 2017/2018 Form 1099-DIV you receive for each Fund will show the tax status of all distributions paid to you during the year.
Pursuant to section 852 of the Internal Revenue Code, AMG Managers Brandywine Fund and AMG Managers Brandywine Blue Fund each hereby designates $0 as a capital gain distribution with respect to the taxable year ended September 30, 2018, or if subsequently determined to be different, the net capital gains of such fiscal year.
AMG Funds
Trustees and Officers
The Trustees and Officers of the Trust, their business addresses, principal occupations for the past five years and ages are listed below. The Trustees provide broad supervision over the affairs of the Trust and the Funds. The Trustees are experienced executives who meet periodically throughout the year to oversee the Funds’ activities, review contractual arrangements with companies that provide services to the Funds, and
review the Funds’ performance. Unless otherwise noted, the address of each Trustee or Officer is the address of the Trust: 600 Steamboat Road, Suite 300, Greenwich, Connecticut 06830.
There is no stated term of office for Trustees. Trustees serve until their resignation, retirement or removal in
accordance with the Trust’s organizational documents and policies adopted by the Board from time to time. The Chairman of the Trustees, President, Treasurer and Secretary of the Trust are elected by the Trustees annually. Other officers hold office at the pleasure of the Trustees.
Independent Trustees
The following Trustees are not “interested persons” of the Trust within the meaning of the 1940 Act:
| | |
Number of Funds Overseen in Fund Complex | | Name, Age, Principal Occupation(s) During Past 5 Years and Other Directorships Held by Trustee |
• Trustee since 2012 • Oversees 59 Funds in Fund Complex | | Bruce B. Bingham, 69 Partner, Hamilton Partners (real estate development firm) (1987-Present); Director of The Yacktman Funds (2000-2012). |
| |
• Trustee since 2000 • Oversees 59 Funds in Fund Complex | | Edward J. Kaier, 73 Attorney at Law and Partner, Teeters Harvey Marrone & Kaier LLP (2007-Present); Attorney at Law and Partner, Hepburn Willcox Hamilton & Putnam, LLP (1977-2007); Trustee of Third Avenue Trust (5 portfolios); Trustee of Third Avenue Variable Trust (1 portfolio). |
| |
• Trustee since 2013 • Oversees 61 Funds in Fund Complex | | Kurt A. Keilhacker, 55 Managing Partner, TechFund Capital (1997-Present); Managing Partner, TechFund Europe (2000-Present); Board Member, 6wind SA, (2002-Present); Managing Partner, Elementum Ventures (2013-Present); Director, MetricStory, Inc. (2017-Present); Trustee, Gordon College (2001-2016). |
| |
• Trustee since 2000 • Oversees 59 Funds in Fund Complex | | Steven J. Paggioli, 68 Independent Consultant (2002-Present); Trustee, Professionally Managed Portfolios (32 portfolios); Advisory Board Member, Sustainable Growth Advisors, LP; Independent Director, Chase Investment Counsel (2008–Present); Executive Vice President, Secretary and Director, Investment Company Administration, LLC (1990-2001). |
| |
• Trustee since 2013 • Oversees 59 Funds in Fund Complex | | Richard F. Powers III, 72 Adjunct Professor, U.S. Naval War College (2016-Present); Adjunct Professor, Boston College (2010-2013); President and CEO of Van Kampen Investments Inc. (1998-2003). |
| |
• Independent Chairman • Trustee since 2000 • Oversees 61 Funds in Fund Complex | | Eric Rakowski, 60 Professor of Law, University of California at Berkeley School of Law - Boalt Hall (1990-Present); Director of Harding, Loevner Funds, Inc. (9 portfolios); Trustee of Third Avenue Trust (5 portfolios); Trustee of Third Avenue Variable Trust (1 portfolio). |
| |
• Trustee since 2013 • Oversees 61 Funds in Fund Complex | | Victoria L. Sassine, 53 Adjunct Professor, Babson College (2007 – Present). |
| |
• Trustee since 2000 • Oversees 59 Funds in Fund Complex | | Thomas R. Schneeweis, 71 Professor Emeritus, University of Massachusetts (2013-Present); Partner, S Capital Wealth Advisors (2015-Present); President, TRS Associates (1982-Present); Board Member, Chartered Alternative Investment Association (“CAIA”) (2002-Present); Director, CAIA Foundation (Education) (2010-Present); Director, Institute for Global Asset and Risk Management (Education) (2010-Present); Partner, S Capital Management, LLC (2007-2015); Director, CISDM at the University of Massachusetts, (1996-2013); President, Alternative Investment Analytics, LLC, (formerly Schneeweis Partners, LLC) (2001-2013); Professor of Finance, University of Massachusetts (1977-2013). |
AMG Funds
Trustees and Officers (continued)
Interested Trustees
Each Trustee in the following table is an “interested person” of the Trust within the meaning of the 1940 Act. Ms. Carsman is an interested person of the Trust within the meaning of the 1940 Act by virtue of her position with, and interest in securities of, AMG.
| | |
Number of Funds Overseen in Fund Complex | | Name, Age, Principal Occupation(s) During Past 5 Years and Other Directorships Held by Trustee |
• Trustee since 2011 • Oversees 61 Funds in Fund Complex | | Christine C. Carsman, 66 Executive Vice President, Deputy General Counsel and Chief Regulatory Counsel, Affiliated Managers Group, Inc. (2017-Present); Director (2010-Present) and Chair of the Board of Directors (2015-Present), AMG Funds plc; Director of Harding, Loevner Funds, Inc. (9 portfolios); Senior Vice President and Deputy General Counsel, Affiliated Managers Group, Inc. (2011-2016); Senior Vice President and Chief Regulatory Counsel, Affiliated Managers Group, Inc. (2007-2011); Vice President and Chief Regulatory Counsel, Affiliated Managers Group, Inc. (2004-2007); Secretary and Chief Legal Officer, AMG Funds, AMG Funds I, AMG Funds II and AMG Funds III (2004-2011); Senior Counsel, Vice President and Director of Operational Risk Management and Compliance, Wellington Management Company, LLP (1995-2004). |
| |
| Officers | | |
| |
Position(s) Held with Fund and Length of Time Served | | Name, Age, Principal Occupation(s) During Past 5 Years |
• President since 2018 • Principal Executive Officer since 2018 • Chief Executive Officer since 2018 • Chief Operating Officer since 2007 | | Keitha L. Kinne, 60 Chief Operating Officer, AMG Funds LLC (2007-Present); Chief Investment Officer, AMG Funds LLC (2008-Present); President and Principal, AMG Distributors, Inc. (2018-Present); Chief Operating Officer, AMG Distributors, Inc. (2007-Present); President, Chief Executive Officer and Principal Executive Officer, AMG Funds, AMG Funds I, AMG Funds II, AMG Funds III and AMG Funds IV (2018-Present); Chief Operating Officer, AMG Funds, AMG Funds I, AMG Funds II, and AMG Funds III (2007-Present); Chief Operating Officer, AMG Funds IV (2016-Present); Chief Operating Officer and Chief Investment Officer, Aston Asset Management, LLC (2016); President and Principal Executive Officer, AMG Funds, AMG Funds I, AMG Funds II and AMG Funds III (2012-2014); Managing Partner, AMG Funds LLC (2007-2014); President and Principal, AMG Distributors, Inc. (2012-2014); Managing Director, Legg Mason & Co., LLC (2006-2007); Managing Director, Citigroup Asset Management (2004-2006). |
| |
• Secretary since 2015 • Chief Legal Officer since 2015 | | Mark J. Duggan, 53 Senior Vice President and Senior Counsel, AMG Funds LLC (2015-Present); Secretary and Chief Legal Officer, AMG Funds, AMG Funds I, AMG Funds II, AMG Funds III and AMG Funds IV (2015-Present); Attorney, K&L Gates, LLP (2009-2015). |
| |
• Chief Financial Officer since 2017 • Treasurer since 2017 • Principal Financial Officer since 2017 • Principal Accounting Officer since 2017 | | Thomas G. Disbrow, 52 Vice President, Mutual Fund Treasurer & CFO, AMG Funds, AMG Funds LLC (2017-Present); Chief Financial Officer, Principal Financial Officer, Treasurer and Principal Accounting Officer, AMG Funds, AMG Funds I, AMG Funds II, AMG Funds III and AMG Funds IV (2017-Present); Managing Director—Global Head of Traditional Funds Product Control, UBS Asset Management (Americas), Inc. (2015-2017); Managing Director—Head of North American Funds Treasury, UBS Asset Management (Americas), Inc. (2011-2015). |
| |
• Deputy Treasurer since 2017 | | John A. Starace, 47 Director, Mutual Fund Accounting, AMG Funds LLC (2017-Present); Vice President, Deputy Treasurer of Mutual Funds Services, AMG Funds LLC (2014-2017); Deputy Treasurer, AMG Funds, AMG Funds I, AMG Funds II, AMG Funds III and AMG Funds IV (2017-Present); Vice President, Citi Hedge Fund Services (2010-2014); Audit Senior Manager (2005-2010) and Audit Manager (2001-2005), Deloitte & Touche LLP. |
| |
• Controller since 2017 | | Christopher R. Townsend, 51 Vice President, Business Finance, AMG Funds LLC (2017-Present); Head of Business Finance, AMG Funds LLC (2015-2017); Chief Financial Officer and Financial and Operations Principal, AMG Distributors, Inc. (2016-Present); Controller, AMG Funds, AMG Funds I, AMG Funds II, AMG Funds III and AMG Funds IV (2017-Present); Treasurer, Chief Financial Officer, Principal Financial Officer, Principal Accounting Officer, AMG Funds, AMG Funds I, AMG Funds II, AMG Funds III and AMG Funds IV (2017); Chief Financial Officer, Aston Asset Management LLC (2016); Head of Finance and Accounting, Allianz Asset Management (2006-2015). |
| |
• Chief Compliance Officer since 2016 | | Gerald F. Dillenburg, 51 Vice President, Chief Compliance Officer AMG Funds, AMG Funds LLC (2017-Present); Chief Compliance Officer AMG Funds, AMG Funds LLC (2016-2017); Chief Compliance Officer and Sarbanes-Oxley Code of Ethics Compliance Officer, AMG Funds, AMG Funds I, AMG Funds II and AMG Funds III (2016-Present); Chief Compliance Officer, AMG Funds IV (1996-Present); Sarbanes-Oxley Code of Ethics Compliance Officer, AMG Funds IV (2016-Present); Chief Compliance Officer, Aston Asset Management, LLC (2006-2016); Chief Operating Officer, Aston Funds (2003-2016); Secretary, Aston Funds (1996-2015); Chief Financial Officer, Aston Funds (1997-2010); Chief Financial Officer, Aston Asset Management, LLC (2006-2010); Treasurer, Aston Funds (1996-2010). |
AMG Funds
Trustees and Officers (continued)
| | |
Position(s) Held with Fund and Length of Time Served | | Name, Age, Principal Occupation(s) During Past 5 Years |
• Anti-Money Laundering Compliance Officer since 2014 | | Patrick J. Spellman, 44 Vice President, Chief Compliance Officer, AMG Funds LLC (2017-Present); Senior Vice President, Chief Compliance Officer, AMG Funds LLC (2011-2017); Chief Compliance Officer, AMG Distributors, Inc., (2010-Present); Anti-Money Laundering Compliance Officer, AMG Funds, AMG Funds I, AMG Funds II, and AMG Funds III (2014-Present); Anti-Money Laundering Officer, AMG Funds IV, (2016-Present); Compliance Manager, Legal and Compliance, Affiliated Managers Group, Inc. (2005-2011). |
| |
• Assistant Secretary since 2016 | | Maureen A. Meredith, 33 Director, Counsel, AMG Funds LLC (2017-Present); Vice President, Counsel, AMG Funds LLC (2015-2017); Assistant Secretary, AMG Funds, AMG Funds I, AMG Funds II, AMG Funds III and AMG Funds IV (2016-Present); Associate, Ropes & Gray LLP (2011-2015); Law Fellow, Massachusetts Appleseed Center for Law and Justice (2010-2011). |
Annual Renewal of Investment Management and Subadvisory Agreements
AMG Managers Brandywine Fund and AMG Managers Brandywine Blue Fund: Approval of Investment Management, Subadvisory and Sub-Subadvisory Agreements on June 27-28, 2018
At an in-person meeting held on June 27-28, 2018, the Board of Trustees (the “Board” or the “Trustees”), and separately a majority of the Trustees who are not “interested persons” of AMG Funds I (the “Trust”) (the “Independent Trustees”), approved (i) the Investment Management Agreement, as amended pursuant to letter agreements at any time prior to the date of the meeting, with AMG Funds LLC (the “Investment Manager”) for each of AMG Managers Brandywine Fund and AMG Managers Brandywine Blue Fund (each, a “Fund,” and collectively, the “Funds”) and separately each of Amendment No. 1 thereto dated July 1, 2015, and Amendment No. 2 thereto dated October 1, 2016 (collectively, the “Investment Management Agreement”) and (ii) the Subadvisory Agreement, as amended at any time prior to the date of the meeting, with the Subadviser with respect to each Fund and the Sub-Subadvisory Agreement with the Sub-Subadviser with respect to each Fund (collectively, the “Friess Agreements”). The Subadviser and the Sub-Subadviser are referred to collectively herein as “Friess.” The Independent Trustees were separately represented by independent legal counsel in connection with their consideration of the approval of these agreements. In considering the Investment Management Agreement and the Friess Agreements, the Trustees reviewed a variety of materials relating to each Fund, the Investment Manager and Friess including comparative performance, fee and expense information for an appropriate peer group of similar mutual funds (each, a “Peer Group”), performance information for the relevant benchmark index for each Fund (each, a “Fund Benchmark”) and other information provided to them on a periodic basis throughout the year, as well as information provided in connection with the meetings of June 27-28, 2018, regarding the nature, extent and quality of services provided by the Investment Manager and Friess under their respective
agreements and other relevant matters. Prior to voting, the Independent Trustees: (a) reviewed the foregoing information with their independent legal counsel; (b) received materials from their independent legal counsel discussing the legal standards applicable to their consideration of the Investment Management Agreement and the Friess Agreements; and (c) met
with their independent legal counsel in private sessions at which no representatives of management were present.
NATURE, EXTENT AND QUALITY OF SERVICES
In considering the nature, extent and quality of the services provided by the Investment Manager, the Trustees reviewed information relating to the Investment Manager’s operations and personnel. Among other things, the Investment Manager provided financial information, biographical information on its supervisory and professional staff and descriptions of its organizational and management structure. The Trustees also took into account information provided periodically throughout the previous year by the Investment Manager in Board meetings relating to the performance of its duties with respect to the Funds and the Trustees’ knowledge of the Investment Manager’s management and the quality of the performance of the Investment Manager’s duties under the Investment Management Agreement and Administration Agreement. In the course of their deliberations regarding the Investment Manager, the Trustees evaluated, among other things: (a) the extent and quality of the Investment Manager’s oversight of the operation and management of the Funds; (b) the quality of the search, selection and monitoring services performed by the Investment Manager in overseeing the portfolio management responsibilities of Friess; (c) the Investment Manager’s ability to supervise the Funds’ other service providers; and (d) the Investment Manager’s compliance program. The Trustees also took into account that, in performing its functions under the Investment Management Agreement and supervising Friess, the Investment Manager: performs periodic detailed analyses and reviews of the performance by Friess of its obligations to each Fund, including without limitation, analysis and review of portfolio and other compliance matters and review of Friess’s investment performance with respect to a Fund; prepares and presents periodic reports to the Board regarding the investment performance of Friess and other information regarding Friess, at such times and in such forms as the Board may reasonably request; reviews and considers any changes in the personnel of Friess responsible for performing Friess’s obligations and makes appropriate reports to the Board; reviews and considers any changes in the ownership or senior management of Friess and makes appropriate reports to the Board; performs periodic in-person or telephonic diligence meetings,
including with respect to compliance matters, with representatives of Friess; assists the Board and management of the Trust in developing and reviewing information with respect to the initial approval of each Friess Agreement and annual consideration of each Friess Agreement thereafter; prepares recommendations with respect to the continued retention of Friess or the replacement of Friess, including at the request of the Board; identifies potential successors to or replacements of Friess or potential additional subadvisers, performs appropriate due diligence, and develops and presents to the Board a recommendation as to any such successor, replacement, or additional subadviser, including at the request of the Board; designates and compensates from its own resources such personnel as the Investment Manager may consider necessary or appropriate to the performance of its services; and performs such other review and reporting functions as the Board shall reasonably request consistent with the Investment Management Agreement and applicable law. The Trustees also took into account the financial condition of the Investment Manager with respect to its ability to provide the services required under the Investment Management Agreement. The Trustees also considered the Investment Manager’s risk management processes.
For each Fund, the Trustees also reviewed information relating to Friess’s operations and personnel and the investment philosophy, strategies and techniques (its “Investment Strategy”) used in managing the Fund. Among other things, the Trustees reviewed biographical information on portfolio management and other professional staff, information regarding Friess’s organizational and management structure and Friess’s brokerage policies and practices. The Trustees considered specific information provided regarding the experience of the individuals at Friess with portfolio management responsibility for the Funds, including the information set forth in the Funds’ prospectus and statement of additional information. In the course of their deliberations, the Trustees evaluated, among other things: (a) the services rendered by Friess in the past; (b) the qualifications and experience of Friess’s personnel; and (c) Friess’s compliance program. The Trustees also took into account the financial condition of Friess with respect to its ability to provide the services required under each Friess Agreement. The Trustees also considered Friess’s risk management processes.
Annual Renewal of Investment Management and Subadvisory Agreements (continued)
PERFORMANCE
As noted above, the Board considered each Fund’s net performance during relevant time periods as compared to the Fund’s Peer Group and Fund Benchmark and considered the gross performance of the Fund as compared to Friess’s relevant performance composite that utilizes the same investment strategy and approach and noted that the Board reviews on a quarterly basis detailed information about both the Fund’s performance results and portfolio composition, as well as Friess’s Investment Strategy. The Board noted the Investment Manager’s expertise and resources in monitoring the performance, investment style and risk-adjusted performance of Friess. The Board was mindful of the Investment Manager’s attention to monitoring Friess’s performance with respect to the Funds and its discussions with management regarding the factors that contributed to the performance of the Funds.
ADVISORY AND SUBADVISORY FEES AND PROFITABILITY
In considering the reasonableness of the advisory fee charged by the Investment Manager for managing each Fund, the Trustees noted that the Investment Manager, and not the Fund, is responsible for paying the fees charged by the Fund’s Subadviser, and, in turn, the Subadviser is responsible for paying the fees charged by the Fund’s Sub-Subadviser and, therefore, that the fees paid to the Investment Manager cover the cost of providing portfolio management services as well as the cost of providing search, selection and monitoring services in operating a “manager-of-managers” complex of mutual funds. The Trustees also considered the amount of the advisory fee retained by the Investment Manager after payment of the subadvisory fee with respect to each Fund. The Trustees concluded that, in light of the high quality supervisory services provided by the Investment Manager and the fact that the Investment Manager and the Subadviser are paying the fees under the Subadvisory Agreements and Sub-Subadvisory Agreements, respectively, the advisory fee payable by each Fund to the Investment Manager can reasonably be expected to exceed the median advisory fee for the Peer Group, which consists of many funds that do not operate with a manager-of-managers structure.
In addition, in considering the reasonableness of the advisory fee payable to the Investment Manager, the Trustees also reviewed information provided by the
Investment Manager setting forth all revenues and other benefits, both direct and indirect (including any so-called “fallout benefits” such as reputational value derived from the Investment Manager serving as Investment Manager to a Fund), received by the Investment Manager and its affiliates attributable to managing each Fund and all the mutual funds in the AMG Funds Family of Funds, the cost of providing such services, the significant risks undertaken as Investment Manager and sponsor of the Funds, including investment, operational, enterprise, entrepreneurial, litigation, regulatory and compliance risks, and the resulting profitability to the Investment Manager and its affiliates from these relationships. The Trustees also considered management’s discussion of the current asset levels of the Funds, and the impact on profitability of both the current asset levels and any future growth of assets of the Funds. The Board took into account management’s discussion of the advisory fee structure, and, as noted above, the services the Investment Manager provides in performing its functions under the Investment Management Agreement and supervising Friess. In this regard, the Trustees noted that, unlike a mutual fund that is managed by a single investment adviser, the Funds operate in a manager-of-managers structure. Based on the foregoing, the Trustees concluded that the profitability to the Investment Manager is reasonable and that the Investment Manager is not realizing material benefits from economies of scale that would warrant adjustments to the advisory fees for any Fund at this time. With respect to economies of scale, the Trustees also noted that as a Fund’s assets increase over time, the Fund may realize other economies of scale to the extent that the increase in assets is proportionally greater than the increase in certain other expenses.
In considering the reasonableness of the fee payable by the Investment Manager to Friess, the Trustees relied on the ability of the Investment Manager to negotiate the terms of the Friess Agreements at arm’s length as part of the manager-of-managers structure, noting that the Investment Manager is not affiliated with Friess. In addition, the Trustees considered other potential benefits of the subadvisory relationship to Friess, including, among others, the indirect benefits that Friess may receive from its relationship with a Fund, including any so-called “fallout benefits” to Friess, such as reputational value derived from the Subadviser and Sub-Subadviser serving as Subadviser and Sub-Subadviser, respectively, to the Fund. In addition, the Trustees noted that the subadvisory
fees are paid by the Investment Manager out of its advisory fee and, in turn, the sub-subadvisory fees are paid by the Subadviser. As a consequence of all of the foregoing, the cost of services to be provided by Friess and the profitability to Friess of its relationship with a Fund were not material factors in the Trustees’ deliberations. For similar reasons, the Trustees did not consider potential economies of scale in the management of a Fund by Friess to be a material factor in their deliberations at this time.
In addition to the foregoing, the Trustees considered the specific factors and related conclusions set forth below with respect to each Fund, the Investment Manager and Friess.
AMG Managers Brandywine Fund
Fund Performance
Among other information relating to the Fund’s performance (including the predecessor fund’s performance for periods prior to its acquisition by the Trust on October 1, 2013), the Trustees noted that the Fund’s performance for Class I shares for the 1-year, 3-year, 5-year and 10-year periods ended March 31, 2018 was above, above, above and below, respectively, the median performance of the Peer Group and below the performance of the Fund Benchmark, the Russell 3000® Growth Index. The Trustees also took into account management’s discussion of the Fund’s performance, including the reasons for the Fund’s underperformance relative to the Fund Benchmark. The Trustees also noted the Fund’s more recent improved performance relative to its Peer Group. The Trustees concluded that the Fund’s overall performance has been satisfactory in light of the Fund’s investment objective, strategies and policies.
Advisory and Subadvisory Fees
The Trustees noted that the Fund’s management fees (which include both the advisory and administration fees) and total expenses as of March 31, 2018 were both higher than the average for the Fund’s Peer Group. The Trustees also took into account management’s discussion of the Fund’s expenses and competitiveness with comparably sized funds. The Trustees concluded that, in light of the nature, extent and quality of the services provided by the Investment Manager and Friess and the considerations noted above with respect to the Investment Manager and Friess, the Fund’s advisory, subadvisory and sub-subadvisory fees are reasonable.
Annual Renewal of Investment Management and Subadvisory Agreements (continued)
AMG Managers Brandywine Blue Fund
Fund Performance
Among other information relating to the Fund’s performance (including the predecessor fund’s performance for periods prior to its acquisition by the Trust on October 1, 2013), the Trustees noted that the Fund’s performance for Class I shares for the 1-year, 3-year, 5-year and 10-year periods ended March 31, 2018 was above, below, below and below, respectively, the median performance of the Peer Group and above, below, below and below, respectively, the performance of the Fund Benchmark, the Russell 1000® Growth Index. The Trustees also took into account management’s discussion of the Fund’s performance, including the reasons for the Fund’s underperformance. The Trustees also noted the Fund’s more recent improved performance relative to its Peer Group and Fund Benchmark. The Trustees concluded that the Fund’s overall performance has been satisfactory in light of the Fund’s investment objective, strategies and policies.
Advisory and Subadvisory Fees
The Trustees noted that the Fund’s management fees (which include both the advisory and administration fees) and total expenses as of March 31, 2018 were both higher than the average for the Peer Group. The Trustees also took into account management’s discussion of the Fund’s expenses and competitiveness with comparably sized funds. The Trustees concluded that, in light of the nature, extent and quality of the services provided by the Investment Manager and Friess, and the considerations noted above with respect to the Investment Manager and Friess, the Fund’s advisory, subadvisory and sub-subadvisory fees are reasonable.
* * * *
After consideration of the foregoing, the Trustees also reached the following conclusions (in addition to the conclusions discussed above) regarding the Investment Management Agreement and each Friess
Agreement: (a) the Investment Manager and Friess have demonstrated that they possess the capability and resources to perform the duties required of them under the Investment Management Agreement and the Friess Agreements; (b) Friess’s Investment Strategy is appropriate for pursuing the applicable Fund’s investment objectives; and (c) the Investment Manager and Friess maintain appropriate compliance programs.
Based on all of the above-mentioned factors and their related conclusions, with no single factor or conclusion being determinative and with each Trustee not necessarily attributing the same weight to each factor, the Trustees concluded that approval of the Investment Management Agreement and each Friess Agreement would be in the best interests of the applicable Fund and its shareholders.
Accordingly, on June 27-28, 2018, the Trustees, and separately a majority of the Independent Trustees, voted to approve the Investment Management Agreement and the Friess Agreements for each Fund.
THIS PAGE INTENTIONALLY LEFT BLANK
INVESTMENT MANAGER AND ADMINISTRATOR
AMG Funds LLC
600 Steamboat Road, Suite 300
Greenwich, CT 06830
800.835.3879
DISTRIBUTOR
AMG Distributors, Inc.
600 Steamboat Road, Suite 300
Greenwich, CT 06830
800.835.3879
SUBADVISER
Friess Associates, LLC
P.O. Box 576
Jackson, Wyoming 83001
Friess Associates of Delaware, LLC
P.O. Box 4166
Greenville, DE 19807
CUSTODIAN
The Bank of New York Mellon
111 Sanders Creek Parkway
East Syracuse, NY 13057
LEGAL COUNSEL
Ropes & Gray LLP
Prudential Tower, 800 Boylston Street
Boston, MA 02199-3600
TRANSFER AGENT
BNY Mellon Investment Servicing (US) Inc.
Attn: AMG Funds
P.O. Box 9769
Providence, RI 02940
800.548.4539
This report is prepared for the Funds’ shareholders. It is authorized for distribution to prospective investors only when preceded or accompanied by an effective prospectus. To receive a free copy of the prospectus or Statement of Additional Information, which includes additional information about Fund Trustees, please contact us by calling 800.835.3879. Distributed by AMG Distributors, Inc., member FINRA/SIPC.
Current net asset values per share for each Fund are available on the Funds’ website at amgfunds.com.
A description of the policies and procedures each Fund uses to vote its proxies is available: (i) without charge, upon request, by calling 800.835.3879, or (ii) on the Securities and Exchange Commission’s (SEC) website at sec.gov. For information regarding the Funds’ proxy voting record for the 12-month period ended June 30, call 800.835.3879 or visit the SEC website at sec.gov.
The Funds file their complete schedule of portfolio holdings with the SEC for the first and third quarters of each fiscal year on Form N-Q. The Funds’ Forms N-Q are available on the SEC’s website at sec.gov. A Fund’s Forms N-Q may be reviewed and copied at the SEC’s Public Reference Room in Washington, DC. Information on the operation of the Public Reference Room may be obtained by calling 1.800.SEC.0330. To review a complete list of the Funds’ portfolio holdings, or to view the most recent quarterly holdings report, semiannual report, or annual report, please visit amgfunds.com.
| | |
| | | |
AFFILIATE SUBADVISED FUNDS
BALANCED FUNDS
AMG Chicago Equity Partners Balanced
Chicago Equity Partners, LLC
AMG FQ Global Risk-Balanced
First Quadrant, L.P.
EQUITY FUNDS
AMG FQ Tax-Managed U.S. Equity AMG FQ Long-Short Equity
First Quadrant, L.P.
AMG Frontier Small Cap Growth
Frontier Capital Management Co., LLC
AMG GW&K Small Cap Core
AMG GW&K Small/Mid Cap
AMG GW&K U.S. Small Cap Growth
GW&K Investment Management, LLC
AMG Renaissance International Equity
AMG Renaissance Large Cap Growth
The Renaissance Group LLC
AMG River Road Dividend All Cap Value
AMG River Road Dividend All Cap Value II
AMG River Road Focused Absolute Value
AMG River Road Long-Short
AMG River Road Small-Mid Cap Value
AMG River Road Small Cap Value
River Road Asset Management, LLC
AMG SouthernSun Small Cap
AMG SouthernSun Global Opportunities
AMG SouthernSun U.S. Equity
SouthernSun Asset Management, LLC
AMG Systematic Mid Cap Value
Systematic Financial Management L.P.
AMG TimesSquare Emerging Markets Small Cap
AMG TimesSquare Global Small Cap
AMG TimesSquare International Small Cap
AMG TimesSquare Mid Cap Growth
AMG TimesSquare Small Cap Growth
TimesSquare Capital Management, LLC
AMG Trilogy Emerging Markets Equity
AMG Trilogy Emerging Wealth Equity
Trilogy Global Advisors, L.P.
AMG Yacktman
AMG Yacktman Focused
AMG Yacktman Focused Fund - Security Selection Only
AMG Yacktman Special Opportunities
Yacktman Asset Management LP
FIXED INCOME FUNDS
AMG GW&K Core Bond
AMG GW&K Enhanced Core Bond
AMG GW&K Municipal Bond
AMG GW&K Municipal Enhanced Yield
GW&K Investment Management, LLC
OPEN-ARCHITECTURE FUNDS
ALTERNATIVE FUNDS
AMG Managers Lake Partners LASSO Alternative
Lake Partners, Inc.
EQUITY FUNDS
AMG Managers Brandywine
AMG Managers Brandywine Advisors Mid Cap Growth
AMG Managers Brandywine Blue
Friess Associates, LLC
AMG Managers Cadence Emerging Companies
AMG Managers Cadence Mid Cap
Cadence Capital Management LLC
AMG Managers CenterSquare Real Estate
CenterSquare Investment Management LLC
AMG Managers Emerging Opportunities
Lord, Abbett & Co. LLC
WEDGE Capital Management L.L.P.
Next Century Growth Investors LLC
RBC Global Asset Management (U.S.) Inc.
AMG Managers Essex Small/Micro Cap Growth
Essex Investment Management Company, LLC
AMG Managers Fairpointe ESG Equity
AMG Managers Fairpointe Mid Cap
Fairpointe Capital LLC
AMG Managers Guardian Capital Global Dividend
Guardian Capital LP
AMG Managers LMCG Small Cap Growth
LMCG Investments, LLC
AMG Managers Montag & Caldwell Growth
Montag & Caldwell, LLC
AMG Managers Pictet International
Pictet Asset Management Limited
AMG Managers Silvercrest Small Cap
Silvercrest Asset Management Group LLC
AMG Managers Skyline Special Equities
Skyline Asset Management, L.P.
AMG Managers Special Equity
Ranger Investment Management, L.P.
Lord, Abbett & Co. LLC
Smith Asset Management Group, L.P.
Federated MDTA LLC
AMG Managers Value Partners Asia Dividend
Value Partners Hong Kong Limited
FIXED INCOME FUNDS
AMG Managers Amundi Intermediate Government
AMG Managers Amundi Short Duration Government
Amundi Pioneer Institutional Asset Management, Inc.
AMG Managers Doubleline Core Plus Bond
DoubleLine Capital LP
AMG Managers Global Income Opportunity
AMG Managers Loomis Sayles Bond
Loomis, Sayles & Company, L.P.
| | |
| amgfunds.com | | 093018 AR073 |
| | |
| | | ANNUAL REPORT |
AMG Funds
September 30, 2018
AMG Managers Brandywine Advisors Mid Cap Growth Fund
Class N: BWAFX
| | |
| amgfunds.com | | 093018 AR075 |
AMG Funds
Annual Report — September 30, 2018
| | | | |
TABLE OF CONTENTS | | PAGE | |
LETTER TO SHAREHOLDERS | | | 2 | |
| |
ABOUT YOUR FUND’S EXPENSES | | | 3 | |
| |
PORTFOLIO MANAGER’S COMMENTS, FUND SNAPSHOTS, ROSES AND THORNS AND SCHEDULE OF PORTFOLIO INVESTMENTS | | | 4 | |
| |
FINANCIAL STATEMENTS | | | | |
| |
Statement of Assets and Liabilities | | | 11 | |
| |
Balance sheet, net asset value (NAV) per share computation and cumulative undistributed amounts | | | | |
| |
Statement of Operations | | | 12 | |
| |
Detail of sources of income, expenses, and realized and unrealized gains (losses) during the fiscal year | | | | |
| |
Statements of Changes in Net Assets | | | 13 | |
| |
Detail of changes in assets for the past two fiscal years | | | | |
| |
Financial Highlights | | | 14 | |
| |
Historical net asset values per share, distributions, total returns, income and expense ratios, turnover ratios and net assets | | | | |
| |
Notes to Financial Statements | | | 15 | |
| |
Accounting and distribution policies, details of agreements and transactions with Fund management and affiliates, and descriptions of certain investment risks | | | | |
| |
REPORT OF INDEPENDENT REGISTERED PUBLIC ACCOUNTING FIRM | | | 20 | |
| |
OTHER INFORMATION | | | 21 | |
| |
TRUSTEES AND OFFICERS | | | 22 | |
| |
ANNUAL RENEWAL OF INVESTMENT MANAGEMENT AND SUBADVISORY AGREEMENTS | | | 25 | |
Nothing contained herein is to be considered an offer, sale or solicitation of an offer to buy shares of any series of the AMG Funds family of mutual funds. Such offering is made only by prospectus, which includes details as to offering price and other material information.
| | |
| | | AMG Managers Brandywine Advisors Mid Cap Growth Fund |
DEAR FELLOW SHAREHOLDER:
Buoyed by “remarkably positive” economic conditions, stocks extended their gains in the three months through September. Enthusiasm among investors swelled as year-over-year earnings continued to grow at the fastest pace in years.
AMG Managers Brandywine Advisors Mid Cap Growth Fund rose 12.49 percent in the September quarter. The S&P 500®, Russell Midcap® and Russell Midcap® Growth Indexes gained 7.71, 5.00 and 7.57 percent, respectively.
According to CNBC, the current bull market became the longest on record since World War II on August 22. Depending on the benchmark and criteria used, a minority still argues otherwise, but there’s no debating that the September quarter represented the continuation of something special.
A 0.76 percent decline in this year’s first quarter is the only setback that prevented the S&P 500® Index from posting a perfect record of quarterly gains over the past two-and-a-half years. There were no exceptions for the Russell Midcap® Growth Index, which over that stretch went 10 for 10 in gaining ground from one quarter to the next.
The persistent upside bias is evident even when the period is doubled. The S&P 500® Index declined in just two quarters out of the past 20 quarters that comprised the trailing five years through September. The Russell Midcap® Growth Index declined in three quarters in that period.
The economic conditions cultivating continued optimism among investors were cited by the Federal Reserve Bank on September 26 when its Open Market Committee raised the federal funds rate by 0.25 percent. The Committee forecasts 3.1 percent growth in gross domestic product (GDP) this year followed by 2.5 percent in 2019.
The Federal Reserve Chairman’s words at an economic conference held the week after the interest rate hike were more telling than any figures. “This historically rare pairing of steady, low inflation and very low unemployment is a testament to the fact we remain in extraordinary times,” he said. “I was asked at last week’s news conference whether these forecasts are too good to be true—a reasonable question.”
Good times, indeed.
The Fund gained ground in six out of the eight economic sectors represented in its portfolio during the three months through September. The Fund outperformed the sector within the Russell Midcap® Growth Index in four out of those eight instances.
Technology holdings comprised the largest Fund position and contributed the most to absolute results and performance relative to the benchmark. Semiconductor and software holdings were top performers.
Advanced Micro Devices was the top contributor. The semiconductor company grew June-quarter revenue 53 percent, helping it earn $0.14 per share versus $0.02
the year before. The Trade Desk was also a significant performance contributor from the sector. The company, which provides technology to manage digital advertising campaigns, grew revenue 54 percent in the June quarter. Earnings exceeded the consensus estimate by 38 percent.
Communication services holdings, including CarGurus and Match Group, were the next most notable contributors to absolute and relative results. CarGurus, an online auto shopping company, grew June-quarter revenue 45 percent and exceeded earnings expectations on increases in dealer participation, users and advertising. Match Group grew June-quarter revenue 36 percent and also topped earnings estimates. Subscriber growth and higher revenue per user for its online dating services drove results.
Consumer discretionary holdings, representing the second largest Fund position, contributed to absolute performance but were the biggest drag on results versus the Russell Midcap® Growth Index. Weight Watchers was the primary reason that the Fund’s contribution from consumer discretionary holdings fell short of the sector’s return. Investors were displeased with the company’s June-quarter subscriber growth.
Energy detracted from the Fund’s September-quarter absolute and relative results. The Fund’s exposure consisted of just one holding, which underperformed the sector. Delek US Holdings refines product pumped from the Permian Basin, where energy transport options were strained during a recent run up in oil prices. The demand gave Delek pricing leverage, but investors questioned the company’s ability to maintain it as customers announced plans to move production to other fields due to the Permian congestion.
For more information on companies that influenced September-quarter performance, please see Roses & Thorns on page 7.
Technology, health care and consumer discretionary holdings represent the largest positions in the Fund at the start of the December quarter. For more information on portfolio characteristics, please see page 6.
Thank you for your confidence in the AMG Brandywine Advisors Mid Cap Growth Fund. We’re committed to building on recent results on your behalf.
Scott Gates
Chief Investment Officer
Friess Associates, LLC
About Your Fund’s Expenses
As a shareholder of a Fund, you may incur two types of costs: (1) transaction costs, which may include sales charges (loads) on purchase payments; redemption fees; and exchange fees; and (2) ongoing costs, including management fees; distribution (12b-1) fees; and other Fund expenses. This example is intended to help you understand your ongoing costs (in dollars) of investing in the Fund and to compare these costs with the ongoing costs of investing in other mutual funds. The example is based on $1,000 invested at the beginning of the period and held for the entire period as indicated below.
ACTUAL EXPENSES
The first line of the following table provides information about the actual account values and
actual expenses. You may use the information in this line, together with the amount you invested, to estimate the expenses that you paid over the period. Simply divide your account value by $1,000 (for example, an $8,600 account value divided by $1,000 = 8.6), then multiply the result by the number in the first line under the heading entitled “Expenses Paid During Period” to estimate the expenses you paid on your account during this period.
HYPOTHETICAL EXAMPLE FOR COMPARISON PURPOSES
The second line of the following table provides information about hypothetical account values and hypothetical expenses based on the Fund’s actual expense ratio and an assumed annual rate of return of 5% before expenses, which is not the Fund’s
actual return. The hypothetical account values and expenses may not be used to estimate the actual ending account balance or expenses you paid for the period. You may use this information to compare the ongoing costs of investing in the Fund and other funds by comparing this 5% hypothetical example with the 5% hypothetical examples that appear in the shareholder reports of other funds.
Please note that the expenses shown in the table are meant to highlight your ongoing costs only and do not reflect any transactional costs, such as sales charges (loads), redemption fees, or exchange fees. Therefore, the second line of the table is useful in comparing ongoing costs only, and will not help you determine the relative total costs of owning different funds.
| | | | | | | | | | | | | | | | |
| | | | | | Beginning | | | Ending | | | Expenses | |
| | | Expense | | | Account | | | Account | | | Paid | |
| Six Months Ended September 30, 2018 | | Ratio for
the Period | | | Value
04/01/18 | | | Value
09/30/18 | | | During
the Period* | |
AMG Managers Brandywine Advisors Mid Cap Growth Fund | | | | | | | | | | | | | | | | |
Based on Actual Fund Return | | | | | | | | | | | | | | | | |
Class N | | | 1.12 | % | | $ | 1,000 | | | $ | 1,136 | | | $ | 6.00 | |
| | | | | | | | | | | | | | | | |
Based on Hypothetical 5% Annual Return | | | | | | | | | | | | | | | | |
Class N | | | 1.12 | % | | $ | 1,000 | | | $ | 1,019 | | | $ | 5.67 | |
| | | | | | | | | | | | | | | | |
| * | Expenses are equal to the Fund’s annualized expense ratio multiplied by the average account value over the period, multiplied by the number of days in the most recent fiscal half-year (183), then divided by 365. |
AMG Managers Brandywine Advisors Mid Cap Growth Fund
Portfolio Manager’s Comments (unaudited)
Solid economic conditions and robust earnings growth combined to outshine all else in competing to influence market sentiment in the fiscal year. The stock market’s prolonged ascent continued in the 12 months through September 30, 2018, with some drama but, in the end, little lasting disruption.
AMG Managers Brandywine Advisors Mid Cap Growth Fund (the “Fund”) employs an investment strategy that is based on the premise that earnings drive stock prices. While conceding that broader trends can influence stocks as a group for fleeting periods, this approach relies on investors to judge each company on its individual merits over the long haul.
We believe conditions in the fiscal year were good for the Fund’s earnings-driven investment strategy. The Fund rose 20.36 percent during its fiscal year, posting positive absolute returns in each of the year’s four quarters.
The fiscal year got off to a good start in the final three months of 2017, when the prelude to and passage of the Tax Cuts and Jobs Act positively influenced investor spirits. The Federal Reserve Bank (the “Fed”) continued a running series of interest rate increases amid encouraging economic reports.
Committed as they were to end the year on a high note, investors still appeared to consider how both developments—tax cuts and interest rates—could rearrange fortunes in a bull market that might be due for some change. Technology stocks, which were high-profile leaders in recent years, still posted solid
gains in the quarter but lost momentum in December as investors showed appreciation for lesser-loved sectors.
Still, the final quarter of 2017 was broadly positive, and a celebratory mood emerged to start 2018. The S&P 500® Index enjoyed its best January in 21 years. Just over a week into February, the index was in correction territory for the first time in two years as trade tensions and inflation fears increased.
The quarter was a bit of a rollercoaster ride, with most indexes reclaiming the ground they lost in the correction by the end of March. Economically sensitive sectors, including technology and consumer discretionary, led the comeback.
Volatility, however, would persist. The first day of trading ended as the worst on record for a second-quarter start since the Great Depression, according to Bloomberg. A budding trade war with China was the spark. While concerns resurfaced occasionally during the three months through June, optimism triumphed as investors got the chance to assess first-quarter earnings reports, the first reports to show the profit-boosting impact of reduced corporate tax rates. Technology and consumer discretionary holdings fared well again.
Positive momentum carried, even accelerated, into the September quarter, the final three months of the fiscal year. While continuing to raise interest rates in modest increments, the Fed described the economy in glowing terms. Second-quarter earnings reports, like the first-quarter’s tally, revealed some of the fastest earnings growth in years.
The three months through September represented the strongest quarter in the fiscal year. Again, companies from technology and consumer discretionary sectors stood out.
Technology and consumer discretionary holdings comprised the Fund’s largest positions during the fiscal year. Technology holdings contributed the most to performance, generating roughly half of the Fund’s return. The sector also contributed the most to the Fund’s performance relative to the Russell Midcap® Growth Index. Consumer discretionary holdings were the second greatest contributors to the Fund’s return, while ranking fifth in terms of the sector’s relative performance contribution.
Six out of nine sectors represented in the Fund generated positive performance in the fiscal year. Financial holdings followed technology in terms of relative performance contribution. Holdings from the industrial and energy sectors detracted the most from absolute results. Performance from industrial holdings, which represented the Fund’s third largest position and underperformed the sector, offset relative performance gains the Fund generated in other sectors.
This commentary reflects the viewpoints of Friess Associates, LLC as of September 30, 2018 and is not intended as a forecast or guarantee of future results.
AMG Managers Brandywine Advisors Mid Cap Growth Fund
Portfolio Manager’s Comments (continued)
CUMULATIVE TOTAL RETURN PERFORMANCE
AMG Managers Brandywine Advisors Mid Cap Growth Fund’s cumulative total return is based on the daily change in net asset value (NAV), and assumes that all dividends and distributions were reinvested. The graph compares a hypothetical $10,000 investment made in the AMG Managers Brandywine Advisors Mid Cap Growth Fund’s Class N shares on September 30, 2008, to a $10,000 investment made in the Russell Midcap® Growth Index, Russell Midcap® Index and S&P 500® Index for the same time period. The graph and table do not reflect the deduction of taxes that a shareholder would pay on a Fund distribution or redemption of shares. The listed returns for the Fund are net of expenses and the returns for the index exclude expenses.
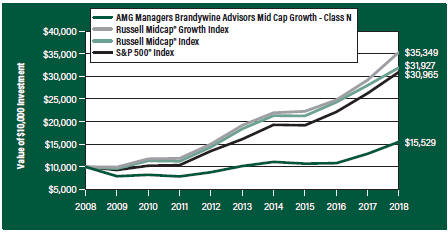
The table below shows the average annual total returns for the AMG Managers Brandywine Advisors Mid Cap Growth Fund and the Russell Midcap® Growth Index, Russell Midcap® Index and S&P 500® Index for the same time periods ended September 30, 2018.
| | | | | | | | | | | | |
| Average Annual Total Returns1 | | One Year | | | Five
Years | | | Ten Years | |
AMG Managers Brandywine Advisors Mid Cap Growth Fund2, 3, 4, 5, 6, 7 | | | | | | | | | | | | |
Class N | | | 20.36 | % | | | 8.81 | % | | | 4.50 | % |
| | | | | | | | | | | | |
Russell Midcap® Growth Index8, 11 | | | 21.10 | % | | | 13.00 | % | | | 13.46 | % |
Russell Midcap® Index9, 11 | | | 13.98 | % | | | 11.65 | % | | | 12.31 | % |
S&P 500® Index10, 11 | | | 17.91 | % | | | 13.95 | % | | | 11.97 | % |
| | | | | | | | | | | | |
The performance data shown represents past performance. Past performance is not a guarantee of future results. Current performance may be lower or higher than the performance data quoted. The investment return and principal value of an investment will fluctuate so that an investor’s shares, when redeemed, may be worth more or less than their original cost.
Investors should carefully consider the Fund’s investment objectives, risks, charges and expenses before investing. For performance information through the most recent month end, current net asset values per share for the Fund and other information, please call 800.835.3879 or visit our website at amgfunds.com for a free prospectus. Read it carefully before investing or sending money.
Distributed by AMG Distributors, Inc., member FINRA/SIPC.
| 1 | Total return equals income yield plus share price change and assumes reinvestment of all dividends and capital gain distributions. Returns are net of fees and may reflect offsets of Fund expenses as described in the prospectus. No adjustment has been made for taxes payable by shareholders on their reinvested dividends and capital gain distributions. Returns for periods greater than one year are annualized. The listed returns on the Fund are net of expenses and based on the published NAV as of September 30, 2018. All returns are in U.S. dollars ($). |
| 2 | The Fund returns for all periods beginning prior to October 1, 2013, reflect performance of the predecessor fund, Brandywine Advisors Midcap Growth Fund, and was managed by Friess Associates, LLC with the same investment objectives and substantially similar investment policies. |
| 3 | The Fund is subject to risks associated with investments in mid-capitalization companies such as greater price volatility, lower trading volume, and less liquidity than the stocks of larger, more established companies. Growth stocks may underperform value stocks during given periods. |
| 4 | Active and frequent trading of a fund may result in higher transaction costs and increased tax liability. |
| 5 | A greater percentage of the Fund’s holdings may be focused in a smaller number of securities which may place the Fund at greater risk than a more diversified fund. |
| 6 | The Fund invests in growth stocks, which may be more sensitive to market movements because their prices tend to reflect future investor expectations rather than just current profits. Growth stocks may underperform value stocks during given periods. |
| 7 | Investments in international securities are subject to certain risks of overseas investing including currency fluctuations and changes in political and economic conditions, which could result in significant market fluctuations. These risks are magnified in emerging markets. |
| 8 | The Russell Midcap® Growth Index measures the performance of the Russell Midcap® companies with higher price/book ratios and higher forecasted growth values. The stocks are also members of the Russell 1000® Growth Index. |
| 9 | The Russell Midcap® Index measures the performance of the 800 smallest companies in the Russell 1000® Index, which represent approximately 25% of the total market capitalization of the Russell 1000® Index. |
| 10 | The S&P 500® Index is a capitalization-weighted index of 500 stocks. The S&P 500® Index is designed to measure performance of the broad domestic economy through changes in the aggregate market value of 500 stocks representing all major industries. |
| 11 | Unlike the Fund, indices are unmanaged, are not available for investment and do not incur expenses. |
The Russell Indices are trademarks of the London Stock Exchange Group companies.
The S&P 500® Index is proprietary data of Standard & Poor’s, a division of McGraw-Hill Companies, Inc. All rights reserved.
Not FDIC insured, nor bank guaranteed. May lose value.
AMG Managers Brandywine Advisors Mid Cap Growth Fund
Fund Snapshots (unaudited)
September 30, 2018
PORTFOLIO BREAKDOWN
| | | | | | | | |
Industry (Top Ten) | | Brandywine
Advisors
Mid Cap
Growth Fund1 | | | Russell
Midcap®
Growth
Index | |
Application Software | | | 8.9 | % | | | 7.4 | % |
Data Processing & Outsourced Services | | | 8.5 | % | | | 7.4 | % |
Life Sciences Tools & Services | | | 8.3 | % | | | 1.6 | % |
Semiconductors | | | 7.8 | % | | | 4.0 | % |
Interactive Media & Services | | | 5.5 | % | | | 0.8 | % |
Communications Equipment | | | 5.1 | % | | | 1.7 | % |
Footwear | | | 4.3 | % | | | 0.1 | % |
Movies & Entertainment | | | 4.0 | % | | | 0.3 | % |
Leisure Facilities | | | 4.0 | % | | | 0.5 | % |
Health Care Equipment | | | 3.8 | % | | | 4.7 | % |
Other Common Stock | | | 35.9 | % | | | 71.5 | % |
Short-Term Investments2 | | | 12.0 | % | | | 0.0 | % |
Other Assets3 | | | (8.1 | )% | | | 0.0 | % |
| 1 | As a percentage of net assets. |
| 2 | Includes reinvestment of cash collateral into joint repurchase agreements on security lending transactions. |
| 3 | Includes repayment of cash collateral on securities lending transactions. |
TOP TEN HOLDINGS
| | | | | | | | |
Security Name | | % of
Net Assets | | | % Change from
Book Cost | |
Advanced Micro Devices, Inc. | | | 3.3 | | | | 140.2 | |
Ciena Corp. | | | 2.8 | | | | 16.9 | |
Match Group, Inc. | | | 2.8 | | | | 52.7 | |
PRA Health Sciences, Inc. | | | 2.8 | | | | 67.1 | |
Cargurus, Inc. | | | 2.7 | | | | 50.0 | |
Take-Two Interactive Software, Inc. | | | 2.7 | | | | 36.7 | |
The Trade Desk, Inc., Class A | | | 2.6 | | | | 59.3 | |
Universal Display Corp. | | | 2.4 | | | | 35.3 | |
GrubHub, Inc. | | | 2.4 | | | | 32.8 | |
Global Payments, Inc. | | | 2.3 | | | | 72.7 | |
| | | | | | | | |
Top Ten as a Group | | | 26.8 | | | | | |
| | | | | | | | |
PORTFOLIO MARKET CAPITALIZATION
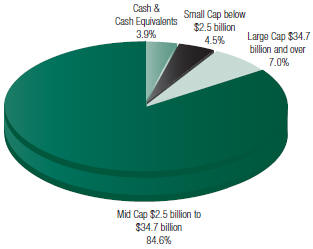
ESTIMATED EARNINGS GROWTH RATE OF THE FUND’S INVESTMENTS
Forecasted Increase in Earnings Per Share 2019 vs 2018
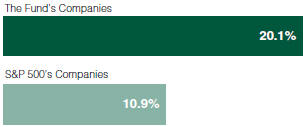
Source: Consensus estimates from FactSet Research Systems Inc.
This is not a forecast of the Fund’s future performance. Earnings growth for a Fund holding does not guarantee a corresponding increase in the market value of the holding or the Fund.
Because a fund’s strategy may result in multiple investments in particular sectors of the economy, its performance may depend on the performance of those sectors and may fluctuate more widely than investments diversified across more sectors. For additional information on these and other risk considerations, please see the Fund’s prospectus.
Any sectors, industries, or securities discussed should not be perceived as investment recommendations. Mention of a specific security should not be considered a recommendation to buy or solicitation to sell that security. Specific securities mentioned in this report may have been sold from the Fund’s portfolio of investments by the time you receive this report.
AMG Managers Brandywine Advisors Mid Cap Growth Fund
Roses and Thorns (unaudited)
Quarter Ending September 30, 2018
| | | | | | | | | | |
$ Gain
(in millions) | | | % Gain | | | Biggest $ Winners Reason for Move |
| $ | 3.2 | | | | 101.8 | % | | Advanced Micro Devices Inc. (AMD) The semiconductor manufacturer reported June-quarter revenue of $1.8 billion, up 53 percent from the previous year on strong sales of its Ryzen processors. The company grew earnings to $0.14 per share from $0.02 per share in the year-ago period, exceeding the consensus estimate. |
| $ | 2.1 | | | | 59.4 | % | | The Trade Desk Inc. (TTD) The provider of a technology platform for ad buyers grew June-quarter revenue 54 percent from the year-ago period to a company record of $112 million. Increased spending among existing clients and new customer wins both contributed to performance. Earnings rose 15 percent, exceeding expectations. |
| $ | 1.5 | | | | 52.7 | % | | Match Group Inc. (MTCH) The online dating and test preparation services provider earned $0.41 per share in the June quarter, up from $0.16 the year before and ahead of the consensus estimate. Revenue for the company’s Tinder mobile app jumped 136 percent, driven by 81 percent subscriber growth and 33 percent growth in revenue per user. Total revenue climbed 36 percent. |
| $ | 1.4 | | | | 50.0 | % | | CarGurus Inc. (CARG) The online auto shopping company earned $0.06 per share in the June quarter, up from $0.04 per share in the year-ago period and ahead of the consensus estimate. Increases in dealer participation, end users and advertising contributed to a 45 percent revenue growth to $110 million. |
| $ | 1.0 | | | | 35.3 | % | | Universal Display Corp. (OLED) This provider of organic light emitting diode (OLED) technology solutions reported June-quarter earnings of $0.23 per share versus the street consensus estimate of $0.15 per share. Management stated that it anticipated new OLED product launches from major manufacturers that could increase demand in the second half of the year. |
| | |
$ Loss
(in millions) | | | % Loss | | | Biggest $ Losers Reason for Move |
| $ | 1.2 | | | | 29.8 | % | | Weight Watchers International Inc. (WTW) The weight management services company grew June-quarter earnings 53 percent, exceeding the consensus estimate. The company also raised its full-year earnings guidance. Insider stock sales and a lack of sequential growth in end-of-period subscribers dampened earlier investor enthusiasm. We sold Weight Watchers to fund a new opportunity. |
| $ | 0.6 | | | | 18.6 | % | | MasTec Inc. (MTZ) The infrastructure construction company earned $1.04 per share in the June quarter, topping the consensus estimate by a penny. Revenue fell short of expectations due to a slower-than-anticipated start of its Mountain Valley Pipeline project. We sold MasTec to fund a new opportunity. |
| $ | 0.5 | | | | 19.9 | % | | Floor & Decor Holdings Inc. (FND) The retailer of flooring and related accessories beat expectations with 35 percent June-quarter earnings growth. Revenue, which grew 26 percent, was modestly below forecasts, putting pressure on shares. We sold Floor & Decor to fund a new opportunity. |
| $ | 0.5 | | | | 14.2 | % | | Broadcom Inc. (AVGO) The semiconductor company beat expectations with 21 percent June-quarter earnings growth. Investor concerns over a proposed acquisition stoked volatility in the stock. We sold Broadcom to fund an opportunity with better visibility. |
| $ | 0.4 | | | | 15.4 | % | | Delek US Holdings Inc. (DK) The energy refining and distribution company earned $1.03 per share in the June quarter, rebounding from a $0.09 per share loss in the year-ago period. Shares fell after statistics showed slowing drilling activity in the Permian basin, an area to which Delek is broadly exposed. |
All gains/losses are calculated on an average cost basis from June 30, 2018 through September 30, 2018.
This commentary reflects the viewpoints of Friess Associates, LLC as of September 30, 2018, and is not intended as a forecast or guarantee of future results.
AMG Managers Brandywine Advisors Mid Cap Growth Fund
Schedule of Portfolio Investments
September 30, 2018
| | | | | | | | | | | | |
Shares | | | | | Cost | | | Value | |
| | Common Stocks - 96.1% | | | | | | | | |
| | Communication Services | | | | | | | | |
| | | | Interactive Home Entertainment - 2.7% | |
| | 30,200 | | | Take-Two Interactive Software, Inc.* | | $ | 3,048,930 | | | $ | 4,167,298 | |
| | | | Interactive Media & Services - 5.5% | |
| | 76,000 | | | Cargurus, Inc.* | | | 2,820,832 | | | | 4,232,440 | |
| | 75,000 | | | Match Group, Inc.*,1 | | | 2,844,390 | | | | 4,343,250 | |
| | | | Movies & Entertainment - 4.0% | |
| | 88,075 | | | Liberty Media Corp.-Liberty Formula One, Class C* | | | 3,105,556 | | | | 3,275,509 | |
| | 16,019 | | | Spotify Technology SA (Sweden)* | | | 2,515,120 | | | | 2,896,716 | |
| | | | | | | | | | | | |
| | Total Communication Services | | | 14,334,828 | | | | 18,915,213 | |
| | | | This sector is 32.0% above your Fund’s cost. | | | | | |
| | Consumer Discretionary | | | | | | | | |
| | | | Apparel Retail - 2.0% | |
| | 62,344 | | | Foot Locker, Inc. | | | 2,980,620 | | | | 3,178,297 | |
| | | | Apparel, Accessories & Luxury Goods - 3.8% | |
| | 18,662 | | | PVH Corp. | | | 2,989,924 | | | | 2,694,793 | |
| | 33,911 | | | VF Corp. | | | 2,756,918 | | | | 3,168,983 | |
| | | | Automotive Retail - 1.9% | |
| | 40,500 | | | CarMax, Inc.* | | | 2,721,394 | | | | 3,024,135 | |
| | | | Footwear - 4.3% | |
| | 27,500 | | | Deckers Outdoor Corp.* | | | 2,676,979 | | | | 3,260,950 | |
| | 89,700 | | | Wolverine World Wide, Inc. | | | 2,511,526 | | | | 3,502,785 | |
| | | | Internet & Direct Marketing Retail - 2.4% | |
| | 26,558 | | | GrubHub, Inc.* | | | 2,771,536 | | | | 3,681,470 | |
| | | | Leisure Facilities - 4.0% | |
| | 41,585 | | | Six Flags Entertainment Corp.1 | | | 2,719,413 | | | | 2,903,465 | |
| | 11,880 | | | Vail Resorts, Inc. | | | 2,595,482 | | | | 3,260,109 | |
| | | | | | | | | | | | |
| | Total Consumer Discretionary | | | 24,723,792 | | | | 28,674,987 | |
| | | | This sector is 16.0% above your Fund’s cost. | | | | | |
| | Consumer Staples | | | | | | | | |
| | | | Hypermarkets & Super Centers - 1.9% | |
| | 112,225 | | | BJ’s Wholesale Club Holdings, Inc.* | | | 2,886,142 | | | | 3,005,385 | |
| | | | Packaged Foods & Meats - 0.7% | |
| | 40,289 | | | B&G Foods, Inc.1 | | | 1,264,345 | | | | 1,105,933 | |
| | | | | | | | | | | | |
| | Total Consumer Staples | | | 4,150,487 | | | | 4,111,318 | |
| | | | This sector is 0.9% below your Fund’s cost. | | | | | |
| | Energy | | | | | | | | |
| | | | Oil & Gas Refining & Marketing - 1.5% | |
| | 56,448 | | | Delek US Holdings, Inc. | | | 2,640,565 | | | | 2,395,089 | |
| | | | This sector is 9.3% below your Fund’s cost. | | | | | |
| | | | | | | | | | | | |
Shares | | | | | Cost | | | Value | |
| | Financials | | | | | | | | |
| | | | Consumer Finance - 2.1% | |
| | 36,600 | | | Green Dot Corp., Class A* | | $ | 1,763,754 | | | $ | 3,250,812 | |
| | | | This sector is 84.3% above your Fund’s cost. | | | | | |
| | Health Care | | | | | | | | |
| | | | Biotechnology - 2.1% | | | | | | | | |
| | 40,631 | | | Exact Sciences Corp.*,1 | | | 2,806,831 | | | | 3,206,599 | |
| | | | Health Care Equipment - 3.8% | | | | | | | | |
| | 67,000 | | | Tandem Diabetes Care, Inc.* | | | 3,064,486 | | | | 2,870,280 | |
| | 106,800 | | | Wright Medical Group, N.V.
(Netherlands)* | | | 3,076,589 | | | | 3,099,336 | |
| | | | Health Care Supplies - 2.7% | | | | | | | | |
| | 8,217 | | | Align Technology, Inc.* | | | 3,109,468 | | | | 3,214,654 | |
| | 3,685 | | | ICU Medical, Inc.* | | | 1,011,045 | | | | 1,041,934 | |
| | | | Health Care Technology - 2.0% | | | | | | | | |
| | 93,800 | | | HMS Holdings Corp.* | | | 2,975,660 | | | | 3,077,578 | |
| | | | Life Sciences Tools & Services - 8.3% | | | | | | | | |
| | 17,566 | | | Bio-Techne Corp. | | | 2,042,773 | | | | 3,585,396 | |
| | 39,400 | | | PRA Health Sciences, Inc.* | | | 2,597,647 | | | | 4,341,486 | |
| | 75,755 | | | QIAGEN, N.V. (Netherlands)* | | | 2,729,804 | | | | 2,869,600 | |
| | 8,531 | | | Thermo Fisher Scientific, Inc. | | | 1,134,218 | | | | 2,082,246 | |
| | | | | | | | | | | | |
| | Total Health Care | | | 24,548,521 | | | | 29,389,109 | |
| | | | This sector is 19.7% above your Fund’s cost. | | | | | |
| | Industrials | | | | | | | | |
| | | | Aerospace & Defense - 2.1% | | | | | | | | |
| | 19,000 | | | Harris Corp. | | | 2,855,026 | | | | 3,214,990 | |
| | | | Air Freight & Logistics - 2.3% | | | | | | | | |
| | 31,500 | | | XPO Logistics, Inc.* | | | 3,183,516 | | | | 3,596,355 | |
| | | | Environmental & Facilities Services - 2.1% | | | | | |
| | 44,972 | | | Clean Harbors, Inc.* | | | 3,055,557 | | | | 3,219,096 | |
| | | | | | | | | | | | |
| | Total Industrials | | | 9,094,099 | | | | 10,030,441 | |
| | | | This sector is 10.3% above your Fund’s cost. | | | | | |
| | Information Technology | | | | | | | | |
| | | | Application Software - 8.9% | | | | | | | | |
| | 137,752 | | | Avaya Holdings Corp.* | | | 2,952,908 | | | | 3,049,829 | |
| | 82,450 | | | Ceridian HCM Holding, Inc.*,1 | | | 2,708,828 | | | | 3,465,374 | |
| | 35,000 | | | RingCentral, Inc., Class A* | | | 2,900,620 | | | | 3,256,750 | |
| | 26,855 | | | The Trade Desk, Inc., Class A* | | | 2,543,883 | | | | 4,052,688 | |
| | | | Communications Equipment - 5.1% | | | | | | | | |
| | 139,900 | | | Ciena Corp.* | | | 3,739,086 | | | | 4,370,476 | |
| | 60,541 | | | Lumentum Holdings, Inc.*,1 | | | 3,523,858 | | | | 3,629,433 | |
| | | | Data Processing & Outsourced Services - 8.5% | | | | | |
| | 57,976 | | | Black Knight, Inc.* | | | 1,508,143 | | | | 3,011,853 | |
|
The accompanying notes are an integral part of these financial statements. 8 |
AMG Managers Brandywine Advisors Mid Cap Growth Fund
Schedule of Portfolio Investments (continued)
| | | | | | | | | | | | |
Shares | | | | | Cost | | | Value | |
| | Information Technology (continued) | | | | | | | | |
| | | | Data Processing & Outsourced Services - 8.5% (continued) | | | | | |
| | 28,555 | | | Global Payments, Inc. | | $ | 2,106,166 | | | $ | 3,637,907 | |
| | 16,000 | | | WEX, Inc.* | | | 3,079,328 | | | | 3,212,160 | |
| | 34,124 | | | Worldpay, Inc., Class A* | | | 1,573,442 | | | | 3,455,738 | |
| | | | IT Consulting & Other Services - 2.0% | | | | | |
| | 61,685 | | | Booz Allen Hamilton Holding Corp. | | | 2,715,808 | | | | 3,061,426 | |
| | | | Semiconductors - 7.8% | | | | | | | | |
| | 166,455 | | | Advanced Micro Devices, Inc.* | | | 2,140,189 | | | | 5,141,795 | |
| | 11,193 | | | NVIDIA Corp. | | | 1,249,604 | | | | 3,145,457 | |
| | 32,250 | | | Universal Display Corp.1 | | | 2,810,488 | | | | 3,802,275 | |
| | | | Systems Software - 1.6% | | | | | | | | |
| | 12,413 | | | ServiceNow, Inc.* | | | 1,259,357 | | | | 2,428,355 | |
| | | | | | | | | | | | |
| | Total Information Technology | | | 36,811,708 | | | | 52,721,516 | |
| | | | This sector is 43.2% above your Fund’s cost. | | | | | |
| | Total Common Stocks | | | 118,067,754 | | | | 149,488,485 | |
| | | |
Principal
Amount | | | | | | | | | |
| | Short-Term Investments - 12.0% | | | | | | | | |
| | Commercial Paper - 3.4% | | | | | |
| | $5,350,000 | | | Western Union Co., 2.40%, 10/01/182 | | | 5,350,000 | | | | 5,350,000 | |
| | Joint Repurchase Agreements - 8.5%3 | | | | | |
| | 3,146,933 | | | Cantor Fitzgerald Securities, Inc., dated 09/28/18, due 10/01/18, 2.270% total to be received $3,147,528 (collateralized by various U.S. Government Agency Obligations and U.S. Treasuries, 0.000% - 9.000%, 10/25/18 - 08/20/68, totaling $3,209,872) | | | 3,146,933 | | | | 3,146,933 | |
| | 661,659 | | | Merrill Lynch, Pierce, Fenner & Smith, Inc., dated 09/28/18, due 10/01/18, 2.250% total to be received $661,783 (collateralized by various U.S. Government Agency Obligations and U.S. Treasuries, 0.000% - 1.625%, 05/23/19 - 09/09/49, totaling $674,892) | | | 661,659 | | | | 661,659 | |
| | | | | | | | | | | | |
Principal
Amount | | | | | Cost | | | Value | |
| | $3,146,933 | | | Nomura Securities International, Inc., dated 09/28/18, due 10/01/18, 2.270% total to be received $3,147,528 (collateralized by various U.S. Government Agency Obligations and U.S. Treasuries, 0.000% - 9.500%, 10/01/18 -08/20/68, totaling $3,209,872) | | $ | 3,146,933 | | | $ | 3,146,933 | |
| | 3,146,933 | | | RBC Dominion Securities, Inc., dated 09/28/18, due 10/01/18, 2.260% total to be received $3,147,526 (collateralized by various U.S. Government Agency Obligations and U.S. Treasuries, 0.000% - 7.000%, 10/04/18 - 09/09/49, totaling $3,209,872) | | | 3,146,933 | | | | 3,146,933 | |
| | 3,146,933 | | | State of Wisconsin Investment Board, dated 09/28/18, due 10/01/18, 2.510% total to be received $3,147,591 (collateralized by various U.S. Government Agency Obligations and U.S. Treasuries, 0.125% - 3.875%, 04/15/20 - 02/15/48, totaling $3,210,320) | | | 3,146,933 | | | | 3,146,933 | |
| | | | | | | | | | | | |
| | | | Total Joint Repurchase Agreements | | | 13,249,391 | | | | 13,249,391 | |
| | | |
| Shares | | | | | | | | | |
| | | | Other Investment Companies - 0.1% | | | | | |
| | 36,515 | | | Dreyfus Government Cash Management Fund, Institutional Shares, 1.95%4 | | | 36,515 | | | | 36,515 | |
| | 36,515 | | | Dreyfus Institutional Preferred Government Money Market Fund, Institutional Shares, 1.97%4 | | | 36,515 | | | | 36,515 | |
| | 37,621 | | | JPMorgan U.S. Government Money Market Fund, IM Shares, 1.98%4 | | | 37,621 | | | | 37,621 | |
| | | | | | | | | | | | |
| | | | Total Other Investment Companies | | | 110,651 | | | | 110,651 | |
| | | | | | | | | | | | |
| | Total Short-Term Investments | | | 18,710,042 | | | | 18,710,042 | |
| | Total Investments - 108.1% | | $ | 136,777,796 | | | | 168,198,527 | |
| | Other Assets, less Liabilities - (8.1%) | | | | | | | (12,632,410 | ) |
| | Total Net Assets - 100.0% | | | | | | $ | 155,566,117 | |
| | | | | | | | | | | | |
| * | Non-income producing security. |
| 1 | Some or all of these securities, amounting to $12,844,650 or 8.3% of net assets, were out on loan to various brokers. |
| 2 | Percentage rate represents yield to maturity at September 30, 2018. |
| 3 | Collateral received from brokers for securities lending was invested in these joint repurchase agreements. |
| 4 | Yield shown represents the September 30, 2018, seven day average yield, which refers to the sum of the previous seven days’ dividends paid, expressed as an annual percentage. |
|
The accompanying notes are an integral part of these financial statements. 9 |
AMG Managers Brandywine Advisors Mid Cap Growth Fund
Schedule of Portfolio Investments (continued)
The following table summarizes the inputs used to value the Fund’s investments by the fair value hierarchy levels as of September 30, 2018:
| | | | | | | | | | | | | | | | |
| | | Level 1 | | | Level 2 | | | Level 3 | | | Total | |
Investments in Securities | | | | | | | | | | | | | | | | |
Common Stocks† | | $ | 149,488,485 | | | | — | | | | — | | | $ | 149,488,485 | |
Short-Term Investments | | | | | | | | | | | | | | | | |
Commercial Paper | | | — | | | $ | 5,350,000 | | | | — | | | | 5,350,000 | |
Joint Repurchase Agreements | | | — | | | | 13,249,391 | | | | — | | | | 13,249,391 | |
Other Investment Companies | | | 110,651 | | | | — | | | | — | | | | 110,651 | |
| | | | | | | | | | | | | | | | |
Total Investments in Securities | | $ | 149,599,136 | | | $ | 18,599,391 | | | | — | | | $ | 168,198,527 | |
| | | | | | | | | | | | | | | | |
| † | All common stocks held in the Fund are Level 1 securities. For a detailed breakout of common stocks by major industry classification, please refer to the Fund’s Schedule of Portfolio Investments. |
As of September 30, 2018, the Fund had no transfers between levels from the beginning of the reporting period.
|
The accompanying notes are an integral part of these financial statements. 10 |
Statement of Assets and Liabilities
September 30, 2018
| | | | |
| | | AMG
Managers
Brandywine Advisors
Mid Cap
Growth Fund | |
Assets: | | | | |
Investments at Value* (including securities on loan valued at $12,844,650) | | $ | 168,198,527 | |
Receivable for investments sold | | | 859,102 | |
Dividend, interest and other receivables | | | 54,993 | |
Receivable for Fund shares sold | | | 254 | |
Receivable from affiliate | | | 408 | |
Prepaid expenses and other assets | | | 14,779 | |
Total assets | | | 169,128,063 | |
Liabilities: | | | | |
Payable upon return of securities loaned | | | 13,249,391 | |
Payable for investments purchased | | | 106,670 | |
Payable for Fund shares repurchased | | | 61 | |
Accrued expenses: | | | | |
Investment advisory and management fees | | | 111,818 | |
Administrative fees | | | 19,060 | |
Distribution fees | | | 5,752 | |
Professional fees | | | 33,344 | |
Trustee fees and expenses | | | 1,752 | |
Other | | | 34,098 | |
Total liabilities | | | 13,561,946 | |
Net Assets | | $ | 155,566,117 | |
* Investments at cost | | $ | 136,777,796 | |
Net Assets Represent: | | | | |
Paid-in capital | | $ | 120,767,601 | |
Accumulated net investment loss | | | (493,536 | ) |
Accumulated net realized gain from investments | | | 3,871,321 | |
Net unrealized appreciation on investments | | | 31,420,731 | |
Net Assets | | $ | 155,566,117 | |
Class N: | | | | |
Net Assets | | $ | 155,566,117 | |
Shares outstanding | | | 11,592,339 | |
Net asset value, offering and redemption price per share | | $ | 13.42 | |
|
The accompanying notes are an integral part of these financial statements. 11 |
Statement of Operations
For the fiscal year ended September 30, 2018
| | | | |
| | | AMG
Managers
Brandywine Advisors
Mid Cap
Growth Fund | |
Investment Income: | | | | |
Dividend income | | $ | 756,751 | |
Interest income | | | 158,699 | |
Securities lending income | | | 35,872 | |
Total investment income | | | 951,322 | |
Expenses: | | | | |
Investment advisory and management fees | | | 1,231,852 | |
Administrative fees | | | 209,975 | |
Distribution fees - Class N | | | 11,607 | |
Shareholder servicing fees - Class N | | | 2,774 | |
Professional fees | | | 36,205 | |
Custodian fees | | | 25,069 | |
Registration fees | | | 23,214 | |
Reports to shareholders | | | 20,137 | |
Trustee fees and expenses | | | 9,418 | |
Transfer agent fees | | | 3,925 | |
Miscellaneous | | | 3,298 | |
Total expenses | | | 1,577,474 | |
Net investment loss | | | (626,152 | ) |
Net Realized and Unrealized Gain: | | | | |
Net realized gain on investments | | | 16,749,239 | |
Net change in unrealized appreciation/depreciation on investments | | | 10,192,093 | |
Net realized and unrealized gain | | | 26,941,332 | |
Net increase in net assets resulting from operations | | $ | 26,315,180 | |
|
The accompanying notes are an integral part of these financial statements. 12 |
Statements of Changes in Net Assets
For the fiscal years ended September 30,
| | | | | | | | |
| | | AMG
Managers
Brandywine Advisors
Mid Cap Growth Fund | |
| | | 2018 | | | 20171 | |
Increase in Net Assets Resulting From Operations: | | | | | | | | |
Net investment loss | | $ | (626,152 | ) | | $ | (790,066 | ) |
Net realized gain on investments | | | 16,749,239 | | | | 17,852,140 | |
Net change in unrealized appreciation/depreciation on investments | | | 10,192,093 | | | | 5,539,078 | |
Net increase in net assets resulting from operations | | | 26,315,180 | | | | 22,601,152 | |
Capital Share Transactions:2 | | | | | | | | |
Net decrease from capital share transactions | | | (281,454 | ) | | | (25,862,265 | ) |
Total increase (decrease) in net assets | | | 26,033,726 | | | | (3,261,113 | ) |
Net Assets: | | | | | | | | |
Beginning of year | | | 129,532,391 | | | | 132,793,504 | |
End of year | | $ | 155,566,117 | | | $ | 129,532,391 | |
End of year accumulated net investment loss | | $ | (493,536 | ) | | $ | (599,149 | ) |
| | | | | | | | |
| 1 | Effective October 1, 2016, the Fund’s share class was reclassified and redesignated as described in Note 1 of the Notes to the Financial Statements. |
| 2 | See Note 1(g) of the Notes to Financial Statements. |
|
The accompanying notes are an integral part of these financial statements. 13 |
AMG Managers Brandywine Advisors Mid Cap Growth Fund
Financial Highlights
For a share outstanding throughout each fiscal year
| | | | | | | | | | | | | | | | | | | | |
| | | For the fiscal years ended September 30, | |
| Class N | | 2018 | | | 20171 | | | 2016 | | | 2015 | | | 20142 | |
Net Asset Value, Beginning of Year | | $ | 11.15 | | | $ | 9.35 | | | $ | 9.26 | | | $ | 9.59 | | | $ | 8.80 | |
Income (loss) from Investment Operations: | | | | | | | | | | | | | | | | | | | | |
Net investment income (loss)3 | | | (0.05 | ) | | | (0.06 | ) | | | (0.03 | ) | | | 0.03 | 4 | | | (0.05 | ) |
Net realized and unrealized gain (loss) on investments | | | 2.32 | | | | 1.86 | | | | 0.12 | | | | (0.36 | ) | | | 0.84 | |
Total income (loss) from investment operations | | | 2.27 | | | | 1.80 | | | | 0.09 | | | | (0.33 | ) | | | 0.79 | |
Net Asset Value, End of Year | | $ | 13.42 | | | $ | 11.15 | | | $ | 9.35 | | | $ | 9.26 | | | $ | 9.59 | |
Total Return5 | | | 20.36 | % | | | 19.25 | % | | | 0.97 | % | | | (3.44 | )% | | | 8.98 | % |
Ratio of expenses to average net assets | | | 1.13 | % | | | 1.15 | % | | | 1.15 | % | | | 1.14 | % | | | 1.12 | % |
Ratio of net investment income (loss) to average net assets | | | (0.45 | )% | | | (0.62 | )% | | | (0.33 | )% | | | 0.28 | % | | | (0.54 | )% |
Portfolio turnover | | | 167 | % | | | 215 | % | | | 195 | % | | | 204 | % | | | 249 | % |
Net assets end of year (000’s) omitted | | $ | 155,566 | | | $ | 129,532 | | | $ | 132,794 | | | $ | 143,205 | | | $ | 148,847 | |
| | | | | | | | | | | | | | | | | | | | |
| 1 | Effective October 1, 2016, the Fund’s shares were reclassified and redesignated to Class N shares. |
| 2 | At the start of business October 1, 2013, the Fund was reorganized into a fund of AMG Funds I. |
| 3 | Per share numbers have been calculated using average shares. |
| 4 | Includes non-recurring dividends. Without these dividends, net investment loss per share would have been $(0.03). |
| 5 | The total return is calculated using the published Net Asset Value as of fiscal year end. |
Notes to Financial Statements
September 30, 2018
1. SUMMARY OF SIGNIFICANT ACCOUNTING POLICIES
AMG Funds I (the “Trust”) is an open-end management investment company, organized as a Massachusetts business trust, and registered under the Investment Company Act of 1940, as amended (the “1940 Act”). Currently, the Trust consists of a number of different funds, each having distinct investment management objectives, strategies, risks, and policies. Included in this report is the AMG Managers Brandywine Advisors Mid Cap Growth Fund (the “Fund”).
A significant portion of the Fund’s holdings may be focused in a relatively small number of securities, which may make the Fund more volatile and subject to greater risk than a more diversified fund.
Effective October 1, 2016, the Fund’s shares were reclassified and redesignated to Class N shares. Please refer to the current prospectus for additional information.
The Fund’s financial statements are prepared in accordance with accounting principles generally accepted in the United States of America (“U.S. GAAP”), including accounting and reporting guidance pursuant to Accounting Standards Codification Topic 946 applicable to investment companies. U.S. GAAP requires management to make estimates and assumptions that affect the reported amounts of assets and liabilities and disclosure of contingent assets and liabilities at the date of the financial statements and the reported amounts of income and expenses during the reporting period. Actual results could differ from those estimates and such differences could be material. The following is a summary of significant accounting policies followed by the Fund in the preparation of its financial statements:
a. VALUATION OF INVESTMENTS
Equity securities traded on a national securities exchange or reported on the NASDAQ national market system (“NMS”) are valued at the last quoted sales price on the primary exchange or, if applicable, the NASDAQ official closing price or the official closing price of the relevant exchange or, lacking any sales, at the last quoted bid price or the mean between the last quoted bid and ask prices (the “exchange mean price”). Equity securities traded in the over-the-counter market (other than NMS securities) are valued at the exchange mean price. Foreign equity securities (securities principally traded in markets other than U.S. markets) are valued at the official closing price on the primary exchange or, for markets that either do not offer an official closing price or where the official closing price may not be representative of the overall market, the last quoted sale price.
Fixed income securities purchased with a remaining maturity of 60 days or less are valued at amortized cost, provided that the amortized cost value is approximately the same as the fair value of the security valued without the use of amortized cost. Investments in other open-end regulated investment companies are valued at their end of day net asset value per share.
The Fund’s portfolio investments are generally valued based on independent market quotations or prices or, if none, “evaluative” or other market based valuations provided by third party pricing services approved by the Board of Trustees of the Trust (the “Board”). Under certain circumstances, the value of certain Fund portfolio investments may be based on an evaluation of fair value, pursuant to procedures established by and under the general supervision of the Board. The Valuation Committee, which is comprised of the Independent Trustees of the Board, and the Pricing Committee, which is comprised of representatives from AMG Funds LLC (the “Investment Manager”) are the committees appointed by the Board to make fair value determinations. The Fund may use the fair value of a portfolio investment to calculate its net asset value (“NAV”) in the event that the
market quotation, price or market based valuation for the portfolio investment is not readily available or otherwise not determinable pursuant to the Board’s valuation procedures, if the Investment Manager or the Pricing Committee believes the quotation, price or market based valuation to be unreliable, or in certain other circumstances. When determining the fair value of an investment, the Pricing Committee and, if required under the Trust’s securities valuation procedures, the Valuation Committee, seeks to determine the price that the Fund might reasonably expect to receive from current sale of that portfolio investment in an arms-length transaction. Fair value determinations shall be based upon consideration of all available facts and information, including, but not limited to (i) attributes specific to the investment; (ii) fundamental and analytical data relating to the investment; and (iii) the value of other comparable securities or relevant financial instruments, including derivative securities, traded on other markets or among dealers.
The values assigned to fair value portfolio investments are based on available information and do not necessarily represent amounts that might ultimately be realized in the future, since such amounts depend on future developments inherent in long-term investments. Because of the inherent uncertainty of valuation, those estimated values may differ significantly from the values that would have been used had a ready market for the investments existed, and the differences could be material. The Board will be presented with a quarterly report showing as of the most recent quarter end, all outstanding securities fair valued by the Fund, including a comparison with the prior quarter end and the percentage of the Fund that the security represents at each quarter end.
With respect to foreign equity securities and certain foreign fixed income securities, the Board has adopted a policy that securities held in a Fund that can be fair valued by the applicable fair value pricing service are fair valued on each business day provided that each individual price exceeds a pre-established confidence level.
U.S. GAAP defines fair value as the price that a fund would receive to sell an asset or pay to transfer a liability in an orderly transaction between market participants at the measurement date. U.S. GAAP also establishes a framework for measuring fair value, and a three level hierarchy for fair value measurements based upon the transparency of inputs to the valuation of an asset or liability. Inputs may be observable or unobservable and refer broadly to the assumptions that market participants would use in pricing the asset or liability. Observable inputs reflect the assumptions market participants would use in pricing the asset or liability based on market data obtained from sources independent of the Fund. Unobservable inputs reflect the Fund’s own assumptions about the assumptions that market participants would use in pricing the asset or liability developed based on the best information available in the circumstances. Each investment is assigned a level based upon the observability of the inputs which are significant to the overall valuation.
The three-tier hierarchy of inputs is summarized below:
Level 1 – inputs are quoted prices in active markets for identical investments (e.g., equity securities, open-end investment companies)
Level 2 – other observable inputs (including, but not limited to: quoted prices for similar assets or liabilities in markets that are active, quoted prices for identical or similar assets or liabilities in markets that are not active, inputs other than quoted prices that are observable for the assets or liabilities (such as interest rates, yield curves, volatilities, prepayment speeds, loss severities, credit risks and default rates) or other market corroborated inputs) (e.g., debt securities, government securities, foreign currency exchange contracts, foreign securities utilizing international fair value pricing, fair valued securities with observable inputs)
Notes to Financial Statements (continued)
Level 3 – inputs are significant unobservable inputs (including the Fund’s own assumptions used to determine the fair value of investments) (e.g., fair valued securities with unobservable inputs)
Changes in inputs or methodologies used for valuing investments may result in a transfer in or out of levels within the fair value hierarchy. The inputs or methodologies used for valuing investments may not necessarily be an indication of the risk associated with investing in those investments. Transfers between different levels of the fair value disclosure hierarchy are deemed to have occurred as of the beginning of the reporting period.
b. SECURITY TRANSACTIONS
Security transactions are accounted for as of trade date. Realized gains and losses on securities sold are determined on the basis of identified cost.
c. INVESTMENT INCOME AND EXPENSES
Dividend income is recorded on the ex-dividend date. Dividends from foreign securities are recorded on the ex-dividend date, and if after the fact, as soon as the Fund becomes aware of the ex-dividend date. Interest income, which includes amortization of premium and accretion of discount on debt securities, is accrued as earned. Dividend and interest income on foreign securities is recorded gross of any withholding tax. Non-cash dividends included in dividend income, if any, are reported at the fair market value of the securities received. Other income and expenses are recorded on an accrual basis. Expenses that cannot be directly attributed to a Fund are apportioned among the funds in the Trust and other trusts within the AMG Funds family of mutual funds (collectively the “AMG Funds Family”) based upon their relative average net assets or number of shareholders.
d. DIVIDENDS AND DISTRIBUTIONS
Fund distributions resulting from either net investment income or realized net capital gains, if any, will normally be declared and paid at least annually in December. Distributions to shareholders are recorded on the ex-dividend date. Distributions are determined in accordance with federal income tax regulations, which may differ from net investment income and net realized capital gains for financial statement purposes (U.S. GAAP). Differences may be permanent or temporary. Permanent differences are reclassified among capital accounts in the financial statements to reflect their tax character. Permanent book and tax basis differences, if any, relating to shareholder distributions will result in reclassifications to paid-in capital. Temporary differences arise when certain items of income, expense and gain or loss are recognized in different periods for financial statement and tax purposes; these differences will reverse at some time in the future. Permanent differences are primarily due to a net operating loss write off. Temporary differences are primarily due to qualified late year ordinary losses and wash sales.
As of September 30, 2018, the components of distributable earnings (excluding unrealized appreciation/depreciation) on a tax basis consisted of:
| | | | |
Capital loss carryforward | | | — | |
Undistributed ordinary income | | | — | |
Undistributed short-term capital gains | | | — | |
Undistributed long-term capital gains | | $ | 4,203,766 | |
Late-year loss deferral | | | 493,536 | |
At September 30, 2018, the approximate cost of investments and the aggregate gross unrealized appreciation and depreciation for federal income tax purposes were as follows:
| | | | | | | | | | | | | | |
| Cost | | | Appreciation | | | Depreciation | | | Net | |
| $ | 137,110,241 | | | $ | 32,313,957 | | | $ | (1,225,671 | ) | | $ | 31,088,286 | |
e. FEDERAL TAXES
The Fund currently qualifies as an investment company and intends to comply with the requirements under Subchapter M of the Internal Revenue Code of 1986, as amended, and to distribute substantially all of its taxable income and gains to its shareholders and to meet certain diversification and income requirements with respect to investment companies. Therefore, no provision for federal income or excise tax is included in the accompanying financial statements.
Additionally, based on the Fund’s understanding of the tax rules and rates related to income, gains and transactions for the foreign jurisdictions in which it invests, the Fund will provide for foreign taxes, and where appropriate, deferred foreign taxes.
Management has analyzed the Fund’s tax positions taken on federal income tax returns as of September 30, 2018, and for all open tax years (generally, the three prior taxable years), and has concluded that no provision for federal income tax is required in the Fund’s financial statements. Additionally, Management is not aware of any tax position for which it is reasonably possible that the total amounts of unrecognized tax benefits will change materially in the next twelve months.
Net capital losses incurred may be carried forward for an unlimited time period, and retain their tax character as either short-term or long-term capital losses.
f. CAPITAL LOSS CARRYOVERS AND DEFERRALS
As of September 30, 2018, the Fund had no accumulated net realized capital loss carryovers from securities transactions for federal income tax purposes. Should the Fund incur net capital losses for the fiscal year ended September 30, 2019, such amounts may be used to offset future realized capital gains, for an unlimited time period.
For the fiscal year ended September 30, 2018, the Fund utilized short-term capital loss carryovers in the amount of $12,838,786.
g. CAPITAL STOCK
The Trust’s Declaration of Trust authorizes for the Fund the issuance of an unlimited number of shares of beneficial interest, without par value. The Fund records sales and repurchases of its capital stock on the trade date.
Notes to Financial Statements (continued)
For the fiscal years ended September 30, 2018 and September 30, 2017, the capital stock transactions by class for the Fund were as follows:
| | | | | | | | | | | | | | | | |
| | | September 30, 2018 | | | September 30, 2017 | |
| | | Shares | | | Amount | | | Shares | | | Amount | |
Class N: | | | | | | | | | | | | | | | | |
Proceeds from sale of shares | | | 14,767 | | | $ | 177,132 | | | | 18,825 | | | $ | 221,949 | |
Cost of shares repurchased | | | (38,082 | ) | | | (458,586 | ) | | | (2,613,175 | ) | | | (26,084,214 | ) |
| | | | | | | | | | | | | | | | |
Net decrease | | | (23,315 | ) | | $ | (281,454 | ) | | | (2,594,350 | ) | | $ | (25,862,265 | ) |
| | | | | | | | | | | | | | | | |
At September 30, 2018, certain affiliated shareholders of record individually or collectively held greater than 10% of the net assets of the Fund as follows: one owns 96%. Transactions by this shareholder may have a material impact on the Fund.
h. REPURCHASE AGREEMENTS AND JOINT REPURCHASE AGREEMENTS
The Fund may enter into third-party repurchase agreements for temporary cash management purposes and third-party or bilateral joint repurchase agreements for reinvestment of cash collateral on securities lending transactions under the securities lending program offered by The Bank of New York Mellon (“BNYM”) (the “Program”) (collectively, “Repurchase Agreements”). The value of the underlying collateral, including accrued interest, must equal or exceed the value of the Repurchase Agreements during the term of the agreement. For joint repurchase agreements, the Fund participates on a pro rata basis with other clients of BNYM in its share of the underlying collateral under such joint repurchase agreements and in its share of proceeds from any repurchase or other disposition of the underlying collateral. The underlying collateral for all Repurchase Agreements is held in safekeeping by the Fund’s custodian or at the Federal Reserve Bank. If the seller defaults and the value of the collateral declines, or if bankruptcy proceedings commence with respect to the seller of the security, realization of the collateral by the Fund may be delayed or limited. Pursuant to the Program, the Fund is indemnified for such losses by BNYM on joint repurchase agreements.
At September 30, 2018, the market value of Repurchase Agreements outstanding was $13,249,391.
2. AGREEMENTS AND TRANSACTIONS WITH AFFILIATES
The Trust has entered into an investment advisory agreement under which the Investment Manager, a subsidiary and the U.S. retail distribution arm of Affiliated Managers Group, Inc. (“AMG”), serves as investment manager to the Fund and is responsible for the Fund’s overall administration and operations. The Investment Manager selects one or more subadvisers for the Fund (subject to Board approval) and monitors each subadviser’s investment performance, security holdings and investment strategies. The Fund’s investment portfolio is managed by Friess Associates, LLC (“Friess”) and Friess Associates of Delaware, LLC (“Friess of Delaware”) who serve pursuant to a subadvisory agreement with the Investment Manager.
Investment management fees are paid directly by the Fund to the Investment Manager based on average daily net assets. For the fiscal year ended September 30, 2018, the Fund paid an investment management fee at the annual rate of 0.88% of the average daily net assets of the Fund.
The Trust, on behalf of the Fund, has entered into an amended and restated Administration Agreement under which the Investment Manager serves as the
Fund’s administrator (the “Administrator”) and is responsible for all non-portfolio management aspects of managing the Fund’s operations, including administration and shareholder services to the Fund. The Fund pays a fee to the Administrator at the rate of 0.15% per annum of the Fund’s average daily net assets for this service.
The Fund is distributed by AMG Distributors, Inc. (the “Distributor”), a wholly-owned subsidiary of the Investment Manager. The Distributor serves as the distributor and underwriter for the Fund and is a registered broker-dealer and member of the Financial Industry Regulatory Authority, Inc. (“FINRA”). Shares of the Fund will be continuously offered and will be sold directly to prospective purchasers and through brokers, dealers or other financial intermediaries who have executed selling agreements with the Distributor. Generally the Distributor bears all or a portion of the expenses of providing services pursuant to the distribution agreement, including the payment of the expenses relating to the distribution of prospectuses for sales purposes and any advertising or sales literature.
The Trust has adopted a distribution and service plan (the “Plan”) with respect to the Class N shares, in accordance with the requirements of Rule 12b-1 under the 1940 Act and the requirements of the applicable rules of FINRA regarding asset-based sales charges. Pursuant to the Plan, the Fund may make payments to the Distributor for its expenditures in financing any activity primarily intended to result in the sale of the Fund’s Class N shares and for maintenance and personal service provided to existing shareholders of that class. The Plan authorizes payments to the Distributor up to 0.25% annually of the Fund’s average daily net assets attributable to the Class N shares. The actual amount incurred for Class N shares was 0.01%.
The Board has approved reimbursement payments to the Investment Manager for shareholder servicing expenses (“shareholder servicing fees”) incurred.
Shareholder servicing fees include payments to financial intermediaries, such as broker-dealers (including fund supermarket platforms), banks, and trust companies who provide shareholder recordkeeping, account servicing and other services. The Fund may reimburse the Investment Manager for the actual amount incurred up to a maximum annual rate of the Class N shares’ average daily net assets as shown in the table below.
Notes to Financial Statements (continued)
The impact on the annualized expense ratio for the fiscal year ended September 30, 2018, were as follows:
| | | | | | | | |
| | | Maximum
Annual
Amount
Approved | | | Actual
Amount
Incurred | |
Class N | | | 0.15 | % | | | 0.00 | %1 |
The Board provides supervision of the affairs of the Trust and other trusts within the AMG Funds family. The Trustees of the Trust who are not affiliated with the Investment Manager receive an annual retainer and per meeting fees for regular, special and telephonic meetings, and they are reimbursed for out-of-pocket expenses incurred while carrying out their duties as Board members. The Chairman of the Board and the Audit Committee Chair receive additional annual retainers. Certain Trustees and Officers of the Fund are Officers and/or Directors of the Investment Manager, AMG and/or the Distributor.
The Securities and Exchange Commission (the “SEC”) granted an exemptive order that permits the Fund to lend and borrow money for certain temporary purposes directly to and from other eligible funds in the AMG Funds family. Participation in this interfund lending program is voluntary for both the borrowing and lending funds, and an interfund loan is only made if it benefits each participating fund. The Administrator manages the program according to procedures approved by the Board, and the Board monitors the operation of the program. An interfund loan must comply with certain conditions set out in the exemptive order, which are designed to assure fairness and protect all participating funds. For the fiscal year ended September 30, 2018, the Fund neither borrowed from nor lent to other funds in the AMG Funds family. At September 30, 2018, the Fund had no interfund loans outstanding.
3. PURCHASES AND SALES OF SECURITIES
Purchases and sales of securities (excluding short-term securities and U.S. Government Obligations) for the fiscal year ended September 30, 2018, were $221,179,784 and $224,356,704, respectively.
The Fund had no purchases or sales of U.S. Government Obligations during the fiscal year ended September 30, 2018.
4. PORTFOLIO SECURITIES LOANED
The Fund participates in the Program providing for the lending of securities to qualified brokers. Securities lending income includes earnings of such temporary
cash investments, plus or minus any rebate to a borrower. These earnings (after any rebate) are then divided between BNYM, as a fee for its services under the Program, and the Fund, according to agreed-upon rates. Collateral on all securities loaned is accepted in cash and is maintained at a minimum level of 102% (105% in the case of certain foreign securities) of the market value, plus interest, if applicable, of investments on loan. It is the Fund’s policy to obtain additional collateral from or return excess collateral to the borrower by the end of the next business day, following the valuation date of the securities loaned. Therefore, the value of the collateral held may be temporarily less than the value of the securities on loan. Lending securities entails a risk of loss to the Fund if and to the extent that the market value of the securities loaned were to increase and the borrower did not increase the collateral accordingly, and the borrower fails to return the securities. Under the terms of the Program, the Fund is indemnified for such losses by BNYM. Cash collateral is held in a separate omnibus account managed by BNYM, who is authorized to exclusively enter into joint repurchase agreements. BNYM bears the risk of any deficiency in the amount of the cash collateral available for return to the borrower due to any loss on the collateral invested.
The value of securities loaned on positions held and cash collateral received at September 30, 2018 was $12,844,650 and $13,249,391, respectively.
5. COMMITMENTS AND CONTINGENCIES
Under the Trust’s organizational documents, its trustees and officers are indemnified against certain liabilities arising out of the performance of their duties to the Trust. In addition, in the normal course of business, the Fund may enter into contracts and agreements that contain a variety of representations and warranties, which provide general indemnifications. The maximum exposure to the Fund under these arrangements is unknown, as this would involve future claims that may be made against the Fund that have not yet occurred. However, based on experience, the Fund had no prior claims or losses and expects the risks of loss to be remote.
6. MASTER NETTING AGREEMENTS
The Fund may enter into master netting agreements with its counterparties for the securities lending program and Repurchase Agreements, which provide the right, in the event of default (including bankruptcy or insolvency) for the non-defaulting party to liquidate the collateral and calculate net exposure to the defaulting party or request additional collateral. For financial reporting purposes, the Fund does not offset financial assets and financial liabilities that are subject to master netting agreements in the Statement of Assets and Liabilities. For securities lending transactions, see Note 4.
Notes to Financial Statements (continued)
| | | | | | | | | | | | | | | | |
| | | | | | Gross Amount Not Offset in the
Statement of Assets and Liabilities | | | | |
| | | Net Amounts of Assets
Presented in the Statement
of Assets and Liabilities | | | Financial
Instruments
Collateral | | | Cash Collateral
Received | | | Net Amount | |
Cantor Fitzgerald Securities, Inc. | | $ | 3,146,933 | | | $ | 3,146,933 | | | | — | | | | — | |
Merrill Lynch, Pierce, Fenner & Smith, Inc. | | | 661,659 | | | | 661,659 | | | | — | | | | — | |
Nomura Securities International, Inc. | | | 3,146,933 | | | | 3,146,933 | | | | — | | | | — | |
RBC Dominion Securities, Inc. | | | 3,146,933 | | | | 3,146,933 | | | | — | | | | — | |
State of Wisconsin Investment Board | | | 3,146,933 | | | | 3,146,933 | | | | — | | | | — | |
| | | | | | | | | | | | | | | | |
Totals | | $ | 13,249,391 | | | $ | 13,249,391 | | | | — | | | | — | |
| | | | | | | | | | | | | | | | |
7. REGULATORY UPDATES
In August 2018, the FASB issued Accounting Standards Update No. 2018-13, Fair Value Measurement (Topic 820), Disclosure Framework—Changes to the Disclosure Requirements for Fair Value Measurement (“ASU 2018-13”) which is effective for periods starting after December 15, 2019. The primary focus of the update is to improve the effectiveness of ASC 820’s disclosure in the notes to financial statements. Management is currently evaluating the impact, if any, of applying ASU 2018-13.
Effective November 15, 2018, the SEC amended existing rules intended to modernize reporting and disclosure of information. These amendments relate to
Regulation S-X which sets forth the form and content of financial statements. Management is evaluating the implications of adopting these amendments and their impact on the financial statements and accompanying notes.
8. SUBSEQUENT EVENTS
The Fund has determined that no material events or transactions occurred through the issuance date of the Fund’s financial statements, which require an additional disclosure in or adjustment of the Fund’s financial statements.
Report of Independent Registered Public Accounting Firm
TO THE BOARD OF TRUSTEES OF AMG FUNDS I AND SHAREHOLDERS OF AMG MANAGERS BRANDYWINE ADVISORS MID CAP GROWTH FUND
Opinion on the Financial Statements
We have audited the accompanying statement of assets and liabilities, including the schedule of portfolio investments, of AMG Managers Brandywine Advisors Mid Cap Growth Fund (the “Fund”) as of September 30, 2018, the related statement of operations for the year ended September 30, 2018, the statement of changes in net assets for each of the two years in the period ended September 30, 2018 including the related notes, and the financial highlights for each of the five years in the period ended September 30, 2018 (collectively referred to as the “financial statements”). In our opinion, the financial statements present fairly, in all material respects, the financial position of the Fund as of September 30, 2018, the results of its operations for the year then ended, the changes in its net assets for each of the two years in the period ended September 30, 2018 and the financial highlights for each of the five years in the period ended September 30, 2018 in conformity with accounting principles generally accepted in the United States of America.
Basis for Opinion
These financial statements are the responsibility of the Fund’s management. Our responsibility is to express an opinion on the Fund’s financial statements based on our audits. We are a public accounting firm registered with the Public Company Accounting Oversight Board (United States) (“PCAOB”) and are required to be independent with respect to the Fund in accordance with the U.S. federal securities laws and the applicable rules and regulations of the Securities and Exchange Commission and the PCAOB.
We conducted our audits of these financial statements in accordance with the standards of the PCAOB. Those standards require that we plan and perform the audit to obtain reasonable assurance about whether the financial statements are free of material misstatement, whether due to error or fraud.
Our audits included performing procedures to assess the risks of material misstatement of the financial statements, whether due to error or fraud, and performing procedures that respond to those risks. Such procedures included examining, on a test basis, evidence regarding the amounts and disclosures in the financial statements. Our audits also included evaluating the accounting principles used and significant estimates made by management, as well as evaluating the overall presentation of the financial statements. Our procedures included confirmation of securities owned as of September 30, 2018 by correspondence with the custodian and brokers, and the application of alternative auditing procedures where securities purchased had not been received. We believe that our audits provide a reasonable basis for our opinion.
PricewaterhouseCoopers LLP
Boston, Massachusetts
November 5, 2018
We have served as the auditor of one or more investment companies in AMG Funds Family since 1993.
Other Information
TAX INFORMATION
The AMG Managers Brandywine Advisors Mid Cap Growth Fund hereby designates the maximum amount allowable of its net taxable income as qualified dividends as provided in the Jobs and Growth Tax Relief Reconciliation Act of 2003. The 2017/2018 Form 1099-DIV you receive for the Fund will show the tax status of all distributions paid to you during the year.
Pursuant to section 852 of the Internal Revenue Code, AMG Managers Brandywine Advisors Mid Cap Growth Fund hereby designates $0 as a capital gain distribution with respect to the taxable fiscal year ended September 30, 2018, or if subsequently determined to be different, the net capital gains of such year.
AMG Funds
Trustees and Officers
The Trustees and Officers of the Trust, their business addresses, principal occupations for the past five years and ages are listed below. The Trustees provide broad supervision over the affairs of the Trust and the Funds. The Trustees are experienced executives who meet periodically throughout the year to oversee the Funds’ activities, review contractual arrangements with companies that provide services to the Funds, and
review the Funds’ performance. Unless otherwise noted, the address of each Trustee or Officer is the address of the Trust: 600 Steamboat Road, Suite 300, Greenwich, Connecticut 06830.
There is no stated term of office for Trustees. Trustees serve until their resignation, retirement or removal in
accordance with the Trust’s organizational documents and policies adopted by the Board from time to time. The Chairman of the Trustees, President, Treasurer and Secretary of the Trust are elected by the Trustees annually. Other officers hold office at the pleasure of the Trustees.
Independent Trustees
The following Trustees are not “interested persons” of the Trust within the meaning of the 1940 Act:
| | |
Number of Funds Overseen in Fund Complex | | Name, Age, Principal Occupation(s) During Past 5 Years and Other Directorships Held by Trustee |
• Trustee since 2012 • Oversees 59 Funds in Fund Complex | | Bruce B. Bingham, 69 Partner, Hamilton Partners (real estate development firm) (1987-Present); Director of The Yacktman Funds (2000-2012). |
| |
• Trustee since 2000 • Oversees 59 Funds in Fund Complex | | Edward J. Kaier, 73 Attorney at Law and Partner, Teeters Harvey Marrone & Kaier LLP (2007-Present); Attorney at Law and Partner, Hepburn Willcox Hamilton & Putnam, LLP (1977-2007); Trustee of Third Avenue Trust (5 portfolios); Trustee of Third Avenue Variable Trust (1 portfolio). |
| |
• Trustee since 2013 • Oversees 61 Funds in Fund Complex | | Kurt A. Keilhacker, 55 Managing Partner, TechFund Capital (1997-Present); Managing Partner, TechFund Europe (2000-Present); Board Member, 6wind SA, (2002-Present); Managing Partner, Elementum Ventures (2013-Present); Director, MetricStory, Inc. (2017-Present); Trustee, Gordon College (2001-2016). |
| |
• Trustee since 2000 • Oversees 59 Funds in Fund Complex | | Steven J. Paggioli, 68 Independent Consultant (2002-Present); Trustee, Professionally Managed Portfolios (32 portfolios); Advisory Board Member, Sustainable Growth Advisors, LP; Independent Director, Chase Investment Counsel (2008–Present); Executive Vice President, Secretary and Director, Investment Company Administration, LLC (1990-2001). |
| |
• Trustee since 2013 • Oversees 59 Funds in Fund Complex | | Richard F. Powers III, 72 Adjunct Professor, U.S. Naval War College (2016-Present); Adjunct Professor, Boston College (2010-2013); President and CEO of Van Kampen Investments Inc. (1998-2003). |
| |
• Independent Chairman • Trustee since 2000 • Oversees 61 Funds in Fund Complex | | Eric Rakowski, 60 Professor of Law, University of California at Berkeley School of Law—Boalt Hall (1990-Present); Director of Harding, Loevner Funds, Inc. (9 portfolios); Trustee of Third Avenue Trust (5 portfolios); Trustee of Third Avenue Variable Trust (1 portfolio). |
| |
• Trustee since 2013 • Oversees 61 Funds in Fund Complex | | Victoria L. Sassine, 53 Adjunct Professor, Babson College (2007 – Present). |
| |
• Trustee since 2000 • Oversees 59 Funds in Fund Complex | | Thomas R. Schneeweis, 71 Professor Emeritus, University of Massachusetts (2013-Present); Partner, S Capital Wealth Advisors (2015-Present); President, TRS Associates (1982-Present); Board Member, Chartered Alternative Investment Association (“CAIA”) (2002-Present); Director, CAIA Foundation (Education) (2010-Present); Director, Institute for Global Asset and Risk Management (Education) (2010-Present); Partner, S Capital Management, LLC (2007-2015); Director, CISDM at the University of Massachusetts, (1996-2013); President, Alternative Investment Analytics, LLC, (formerly Schneeweis Partners, LLC) (2001-2013); Professor of Finance, University of Massachusetts (1977-2013). |
AMG Funds
Trustees and Officers (continued)
Interested Trustees
Each Trustee in the following table is an “interested person” of the Trust within the meaning of the 1940 Act. Ms. Carsman is an interested person of the Trust within the meaning of the 1940 Act by virtue of her position with, and interest in securities of, AMG.
| | |
Number of Funds Overseen in Fund Complex | | Name, Age, Principal Occupation(s) During Past 5 Years and Other Directorships Held by Trustee |
• Trustee since 2011 • Oversees 61 Funds in Fund Complex | | Christine C. Carsman, 66 Executive Vice President, Deputy General Counsel and Chief Regulatory Counsel, Affiliated Managers Group, Inc. (2017-Present); Director (2010-Present) and Chair of the Board of Directors (2015-Present), AMG Funds plc; Director of Harding, Loevner Funds, Inc. (9 portfolios); Senior Vice President and Deputy General Counsel, Affiliated Managers Group, Inc. (2011-2016); Senior Vice President and Chief Regulatory Counsel, Affiliated Managers Group, Inc. (2007-2011); Vice President and Chief Regulatory Counsel, Affiliated Managers Group, Inc. (2004-2007); Secretary and Chief Legal Officer, AMG Funds, AMG Funds I, AMG Funds II and AMG Funds III (2004-2011); Senior Counsel, Vice President and Director of Operational Risk Management and Compliance, Wellington Management Company, LLP (1995-2004). |
| |
Officers | | |
| |
Position(s) Held with Fund and Length of Time Served | | Name, Age, Principal Occupation(s) During Past 5 Years |
• President since 2018 • Principal Executive Officer since 2018 • Chief Executive Officer since 2018 • Chief Operating Officer since 2007 | | Keitha L. Kinne, 60 Chief Operating Officer, AMG Funds LLC (2007-Present); Chief Investment Officer, AMG Funds LLC (2008-Present); President and Principal, AMG Distributors, Inc. (2018-Present); Chief Operating Officer, AMG Distributors, Inc. (2007-Present); President, Chief Executive Officer and Principal Executive Officer, AMG Funds, AMG Funds I, AMG Funds II, AMG Funds III and AMG Funds IV (2018-Present); Chief Operating Officer, AMG Funds, AMG Funds I, AMG Funds II, and AMG Funds III (2007-Present); Chief Operating Officer, AMG Funds IV (2016-Present); Chief Operating Officer and Chief Investment Officer, Aston Asset Management, LLC (2016); President and Principal Executive Officer, AMG Funds, AMG Funds I, AMG Funds II and AMG Funds III (2012-2014); Managing Partner, AMG Funds LLC (2007-2014); President and Principal, AMG Distributors, Inc. (2012-2014); Managing Director, Legg Mason & Co., LLC (2006-2007); Managing Director, Citigroup Asset Management (2004-2006). |
| |
• Secretary since 2015 • Chief Legal Officer since 2015 | | Mark J. Duggan, 53 Senior Vice President and Senior Counsel, AMG Funds LLC (2015-Present); Secretary and Chief Legal Officer, AMG Funds, AMG Funds I, AMG Funds II, AMG Funds III and AMG Funds IV (2015-Present); Attorney, K&L Gates, LLP (2009-2015). |
| |
• Chief Financial Officer since 2017 • Treasurer since 2017 • Principal Financial Officer since 2017 • Principal Accounting Officer since 2017 | | Thomas G. Disbrow, 52 Vice President, Mutual Fund Treasurer & CFO, AMG Funds, AMG Funds LLC (2017-Present); Chief Financial Officer, Principal Financial Officer, Treasurer and Principal Accounting Officer, AMG Funds, AMG Funds I, AMG Funds II, AMG Funds III and AMG Funds IV (2017-Present); Managing Director—Global Head of Traditional Funds Product Control, UBS Asset Management (Americas), Inc. (2015-2017); Managing Director—Head of North American Funds Treasury, UBS Asset Management (Americas), Inc. (2011-2015). |
| |
• Deputy Treasurer since 2017 | | John A. Starace, 47 Director, Mutual Fund Accounting, AMG Funds LLC (2017-Present); Vice President, Deputy Treasurer of Mutual Funds Services, AMG Funds LLC (2014-2017); Deputy Treasurer, AMG Funds, AMG Funds I, AMG Funds II, AMG Funds III and AMG Funds IV (2017-Present); Vice President, Citi Hedge Fund Services (2010-2014); Audit Senior Manager (2005-2010) and Audit Manager (2001-2005), Deloitte & Touche LLP. |
| |
• Controller since 2017 | | Christopher R. Townsend, 51 Vice President, Business Finance, AMG Funds LLC (2017-Present); Head of Business Finance, AMG Funds LLC (2015-2017); Chief Financial Officer and Financial and Operations Principal, AMG Distributors, Inc. (2016-Present); Controller, AMG Funds, AMG Funds I, AMG Funds II, AMG Funds III and AMG Funds IV (2017-Present); Treasurer, Chief Financial Officer, Principal Financial Officer, Principal Accounting Officer, AMG Funds, AMG Funds I, AMG Funds II, AMG Funds III and AMG Funds IV (2017); Chief Financial Officer, Aston Asset Management LLC (2016); Head of Finance and Accounting, Allianz Asset Management (2006-2015). |
| |
• Chief Compliance Officer since 2016 | | Gerald F. Dillenburg, 51 Vice President, Chief Compliance Officer AMG Funds, AMG Funds LLC (2017-Present); Chief Compliance Officer AMG Funds, AMG Funds LLC (2016-2017); Chief Compliance Officer and Sarbanes-Oxley Code of Ethics Compliance Officer, AMG Funds, AMG Funds I, AMG Funds II and AMG Funds III (2016-Present); Chief Compliance Officer, AMG Funds IV (1996-Present); Sarbanes-Oxley Code of Ethics Compliance Officer, AMG Funds IV (2016-Present); Chief Compliance Officer, AstonAsset Management, LLC (2006-2016); Chief Operating Officer, Aston Funds (2003-2016); Secretary, Aston Funds (1996-2015); Chief Financial Officer, Aston Funds(1997-2010); Chief Financial Officer, Aston Asset Management, LLC (2006-2010); Treasurer, Aston Funds (1996-2010). |
AMG Funds
Trustees and Officers (continued)
| | |
Position(s) Held with Fund and Length of Time Served | | Name, Age, Principal Occupation(s) During Past 5 Years |
• Anti-Money Laundering Compliance Officer since 2014 | | Patrick J. Spellman, 44 Vice President, Chief Compliance Officer, AMG Funds LLC (2017-Present); Senior Vice President, Chief Compliance Officer, AMG Funds LLC (2011-2017); Chief Compliance Officer, AMG Distributors, Inc., (2010-Present); Anti-Money Laundering Compliance Officer, AMG Funds, AMG Funds I, AMG Funds II, and AMG Funds III (2014-Present); Anti-Money Laundering Officer, AMG Funds IV, (2016-Present); Compliance Manager, Legal and Compliance, Affiliated Managers Group, Inc. (2005-2011). |
| |
• Assistant Secretary since 2016 | | Maureen A. Meredith, 33 Director, Counsel, AMG Funds LLC (2017-Present); Vice President, Counsel, AMG Funds LLC (2015-2017); Assistant Secretary, AMG Funds, AMG Funds I, AMG Funds II, AMG Funds III and AMG Funds IV (2016-Present); Associate, Ropes & Gray LLP (2011-2015); Law Fellow, Massachusetts Appleseed Center for Law and Justice (2010-2011). |
Annual Renewal of Investment Management and Subadvisory Agreements
AMG Managers Brandywine Advisors Mid Cap Growth Fund: Approval of Investment Management, Subadvisory and Sub-Subadvisory Agreements on June 27-28, 2018
At an in-person meeting held on June 27-28, 2018, the Board of Trustees (the “Board” or the “Trustees”), and separately a majority of the Trustees who are not “interested persons” of AMG Funds I ( the “Trust”) (the “Independent Trustees”), approved (i) the Investment Management Agreement, as amended pursuant to letter agreements at any time prior to the date of the meeting, with AMG Funds LLC (the “Investment Manager”) for AMG Managers Brandywine Advisors Mid Cap Growth Fund (the “Fund”) and separately each of Amendment No. 1 thereto dated July 1, 2015, and Amendment No. 2 thereto dated October 1, 2016 (collectively, the “Investment Management Agreement”) and (ii) the Subadvisory Agreement, as amended at any time prior to the date of the meeting, with the Subadviser with respect to the Fund and the Sub-Subadvisory Agreement with the Sub-Subadviser with respect to the Fund (collectively, the “Friess Agreements”). The Subadviser and the Sub-Subadviser are referred to collectively herein as “Friess.” The Independent Trustees were separately represented by independent legal counsel in connection with their consideration of the approval of these agreements. In considering the Investment Management Agreement and the Friess Agreements, the Trustees reviewed a variety of materials relating to the Fund, the Investment Manager and Friess including comparative performance, fee and expense information for an appropriate peer group of similar mutual funds (the “Peer Group”), performance information for the relevant benchmark index (the “Fund Benchmark”) and other information provided to them on a periodic basis throughout the year, as well as information provided in connection with the meetings of June 27-28, 2018, regarding the nature, extent and quality of services provided by the Investment Manager and Friess under their respective agreements and other relevant matters. Prior to voting, the Independent Trustees: (a) reviewed the foregoing information with their independent legal counsel; (b) received materials from their independent legal counsel discussing the legal standards applicable to their consideration of the Investment Management Agreement and the Friess Agreements; and (c) met with their independent legal counsel in private sessions at which no representatives of management were present.
NATURE, EXTENT AND QUALITY OF SERVICES
In considering the nature, extent and quality of the services provided by the Investment Manager, the Trustees reviewed information relating to the Investment Manager’s operations and personnel. Among other things, the Investment Manager provided financial information, biographical information on its supervisory and professional staff and descriptions of its organizational and management structure. The Trustees also took into account information provided periodically throughout the previous year by the Investment Manager in Board meetings relating to the performance of its duties with respect to the Fund and the Trustees’ knowledge of the Investment Manager’s management and the quality of the performance of the Investment Manager’s duties under the Investment Management Agreement and Administration Agreement. In the course of their deliberations regarding the Investment Manager, the Trustees evaluated, among other things: (a) the extent and quality of the Investment Manager’s oversight of the operation and management of the Fund; (b) the quality of the search, selection and monitoring services performed by the Investment Manager in overseeing the portfolio management responsibilities of Friess; (c) the Investment Manager’s ability to supervise the Fund’s other service providers; and (d) the Investment Manager’s compliance program. The Trustees also took into account that, in performing its functions under the Investment Management Agreement and supervising Friess, the Investment Manager: performs periodic detailed analyses and reviews of the performance by Friess of its obligations to the Fund, including without limitation, analysis and review of portfolio and other compliance matters and review of Friess’s investment performance with respect to the Fund; prepares and presents periodic reports to the Board regarding the investment performance of Friess and other information regarding Friess, at such times and in such forms as the Board may reasonably request; reviews and considers any changes in the personnel of Friess responsible for performing Friess’s obligations and makes appropriate reports to the Board; reviews and considers any changes in the ownership or senior management of Friess and makes appropriate reports to the Board; performs periodic in-person or telephonic diligence meetings, including with respect to compliance matters, with representatives of Friess; assists the Board and management of the Trust in developing and reviewing information with respect to the initial approval of each Friess Agreement and annual
consideration of each Friess Agreement thereafter; prepares recommendations with respect to the continued retention of Friess or the replacement of Friess, including at the request of the Board; identifies potential successors to or replacements of Friess or potential additional subadvisers, performs appropriate due diligence, and develops and presents to the Board a recommendation as to any such successor, replacement, or additional subadviser, including at the request of the Board; designates and compensates from its own resources such personnel as the Investment Manager may consider necessary or appropriate to the performance of its services; and performs such other review and reporting functions as the Board shall reasonably request consistent with the Investment Management Agreement and applicable law. The Trustees also took into account the financial condition of the Investment Manager with respect to its ability to provide the services required under the Investment Management Agreement. The Trustees also considered the Investment Manager’s risk management processes.
The Trustees also reviewed information relating to Friess’s operations and personnel and the investment philosophy, strategies and techniques (its “Investment Strategy”) used in managing the Fund. Among other things, the Trustees reviewed biographical information on portfolio management and other professional staff, information regarding Friess’s organizational and management structure and Friess’s brokerage policies and practices. The Trustees considered specific information provided regarding the experience of the individuals at Friess with portfolio management responsibility for the Fund, including the information set forth in the Fund’s prospectus and statement of additional information. In the course of their deliberations, the Trustees evaluated, among other things: (a) the services rendered by Friess in the past; (b) the qualifications and experience of Friess’s personnel; and (c) Friess’s compliance program. The Trustees also took into account the financial condition of Friess with respect to its ability to provide the services required under each Friess Agreement. The Trustees also considered Friess’s risk management processes.
Annual Renewal of Investment Management and Subadvisory Agreements (continued)
PERFORMANCE
As noted above, the Board considered the Fund’s net performance during relevant time periods as compared to the Fund’s Peer Group and Fund Benchmark and considered the gross performance of the Fund as compared to Friess’s relevant performance composite that utilizes the same investment strategy and approach and noted that the Board reviews on a quarterly basis detailed information about both the Fund’s performance results and portfolio composition, as well as Friess’s Investment Strategy. The Board noted the Investment Manager’s expertise and resources in monitoring the performance, investment style and risk-adjusted performance of Friess. The Board was mindful of the Investment Manager’s attention to monitoring Friess’s performance with respect to the Fund and its discussions with management regarding the factors that contributed to the performance of the Fund.
Among other information relating to the Fund’s performance (including the predecessor fund’s performance for periods prior to its acquisition by the Trust on October 1, 2013), the Trustees noted that the Fund’s performance for Class N shares for the 1-year, 3-year, 5-year and 10-year periods ended March 31, 2018 was below the median performance of the Peer Group and below the performance of the Fund Benchmark, the Russell Midcap® Growth Index. The Trustees also took into account management’s discussion of the Fund’s performance, including the reasons for the Fund’s underperformance. The Trustees concluded that the Fund’s overall performance has been satisfactory in light of the Fund’s investment objective, strategies and policies.
ADVISORY AND SUBADVISORY FEES AND PROFITABILITY
In considering the reasonableness of the advisory fee charged by the Investment Manager for managing the Fund, the Trustees noted that the Investment Manager, and not the Fund, is responsible for paying the fees charged by the Fund’s Subadviser, and, in turn, the Subadviser is responsible for paying the fees charged by the Fund’s Sub-Subadviser and, therefore, that the fees paid to the Investment Manager cover the cost of providing portfolio management services as well as the cost of providing search, selection and monitoring services in operating a “manager-of-managers” complex of mutual funds. The Trustees also considered the amount of the advisory fee retained by the Investment Manager after payment of the subadvisory fee. The Trustees
concluded that, in light of the high quality supervisory services provided by the Investment Manager and the fact that the Investment Manager and the Subadviser are paying the fees under the Subadvisory Agreement and Sub-Subadvisory Agreement, respectively, the advisory fee payable by the Fund to the Investment Manager can reasonably be expected to exceed the median advisory fee for the Peer Group, which consists of many funds that do not operate with a manager-of-managers structure.
In addition, in considering the reasonableness of the advisory fee payable to the Investment Manager, the Trustees also reviewed information provided by the Investment Manager setting forth all revenues and other benefits, both direct and indirect (including any so-called “fallout benefits” such as reputational value derived from the Investment Manager serving as Investment Manager to the Fund), received by the Investment Manager and its affiliates attributable to managing the Fund and all the mutual funds in the AMG Funds Family of Funds, the cost of providing such services, the significant risks undertaken as Investment Manager and sponsor of the Fund, including investment, operational, enterprise, entrepreneurial, litigation, regulatory and compliance risks, and the resulting profitability to the Investment Manager and its affiliates from these relationships. The Trustees also considered management’s discussion of the current asset level of the Fund, and the impact on profitability of both the current asset level and any future growth of assets of the Fund. The Board took into account management’s discussion of the advisory fee structure, and, as noted above, the services the Investment Manager provides in performing its functions under the Investment Management Agreement and supervising Friess. In this regard, the Trustees noted that, unlike a mutual fund that is managed by a single investment adviser, the Fund operates in a manager-of-managers structure. Based on the foregoing, the Trustees concluded that the profitability to the Investment Manager is reasonable and that the Investment Manager is not realizing material benefits from economies of scale that would warrant adjustments to the advisory fee at this time. With respect to economies of scale, the Trustees also noted that as the Fund’s assets increase over time, the Fund may realize other economies of scale to the extent that the increase in assets is proportionally greater than the increase in certain other expenses.
In considering the reasonableness of the fee payable by the Investment Manager to Friess, the Trustees relied on the ability of the Investment Manager to negotiate the terms of the Friess Agreements at arm’s length as part of the manager-of-managers structure, noting that the Investment Manager is not affiliated with Friess. In addition, the Trustees considered other potential benefits of the subadvisory relationship to Friess, including, among others, the indirect benefits that Friess may receive from its relationship with the Fund, including any so-called “fallout benefits” to Friess, such as reputational value derived from the Subadviser and Sub-Subadviser serving as Subadviser and Sub-Subadviser, respectively, to the Fund. In addition, the Trustees noted that the subadvisory fees are paid by the Investment Manager out of its advisory fee and, in turn, the sub-subadvisory fees are paid by the Subadviser. As a consequence of all of the foregoing, the cost of services to be provided by Friess and the profitability to Friess of its relationship with the Fund were not material factors in the Trustees’ deliberations. For similar reasons, the Trustees did not consider potential economies of scale in the management of the Fund by Friess to be a material factor in their deliberations at this time.
The Trustees noted that the Fund’s management fees (which include both the advisory and administration fees) and total expenses as of March 31, 2018 were both higher than the average for the Fund’s Peer Group. The Trustees also took into account management’s discussion of the Fund’s expenses and competitiveness with comparably sized funds. The Trustees concluded that, in light of the nature, extent and quality of the services provided by the Investment Manager and Friess, and the considerations noted above with respect to the Investment Manager and Friess, the Fund’s advisory, subadvisory and sub-subadvisory fees are reasonable.
* * * *
After consideration of the foregoing, the Trustees also reached the following conclusions (in addition to the conclusions discussed above) regarding the Investment Management Agreement and each Friess Agreement: (a) the Investment Manager and Friess have demonstrated that they possess the capability and resources to perform the duties required of them under the Investment Management Agreement and the Friess Agreements; (b) Friess’s Investment Strategy is appropriate for pursuing the Fund’s
Annual Renewal of Investment Management and Subadvisory Agreements (continued)
investment objectives; and (c) the Investment Manager and Friess maintain appropriate compliance programs.
Based on all of the above-mentioned factors and their related conclusions, with no single factor or
conclusion being determinative and with each Trustee not necessarily attributing the same weight to each factor, the Trustees concluded that approval of the Investment Management Agreement and each Friess Agreement would be in the best interests of the Fund and its shareholders. Accordingly, on June
27-28, 2018, the Trustees, and separately a majority of the Independent Trustees, voted to approve the Investment Management Agreement and the Friess Agreements for the Fund.
THIS PAGE INTENTIONALLY LEFT BLANK
INVESTMENT MANAGER AND ADMINISTRATOR
AMG Funds LLC
600 Steamboat Road, Suite 300
Greenwich, CT 06830
800.835.3879
DISTRIBUTOR
AMG Distributors, Inc.
600 Steamboat Road, Suite 300
Greenwich, CT 06830
800.835.3879
SUBADVISER
Friess Associates, LLC
P.O. Box 576
Jackson, Wyoming 83001
Friess Associates of Delaware, LLC
P.O. Box 4166
Greenville, DE 19807
CUSTODIAN
The Bank of New York Mellon
111 Sanders Creek Parkway
East Syracuse, NY 13057
LEGAL COUNSEL
Ropes & Gray LLP
Prudential Tower, 800 Boylston Street
Boston, MA 02199-3600
TRANSFER AGENT
BNY Mellon Investment Servicing (US) Inc.
Attn: AMG Funds
P.O. Box 9769
Providence, RI 02940
800.548.4539
This report is prepared for the Fund’s shareholders. It is authorized for distribution to prospective investors only when preceded or accompanied by an effective prospectus. To receive a free copy of the prospectus or Statement of Additional Information, which includes additional information about Fund Trustees, please contact us by calling 800.835.3879. Distributed by AMG Distributors, Inc., member FINRA/SIPC.
Current net asset values per share for the Fund are available on the Fund’s website at amgfunds.com.
A description of the policies and procedures the Fund uses to vote its proxies is available: (i) without charge, upon request, by calling 800.835.3879, or (ii) on the Securities and Exchange Commission’s (SEC) website at sec.gov. For information regarding the Fund’s proxy voting record for the 12-month period ended June 30, call 800.835.3879 or visit the SEC website at sec.gov.
The Fund files its complete schedule of portfolio holdings with the SEC for the first and third quarters of each fiscal year on Form N-Q. The Fund’s Forms N-Q are available on the SEC’s website at sec.gov. A Fund’s Forms N-Q may be reviewed and copied at the SEC’s Public Reference Room in Washington, DC. Information on the operation of the Public Reference Room may be obtained by calling 1.800.SEC.0330. To review a complete list of the Fund’s portfolio holdings, or to view the most recent quarterly holdings report, semiannual report, or annual report, please visit amgfunds.com.
| | |
| | | |
AFFILIATE SUBADVISED FUNDS
BALANCED FUNDS
AMG Chicago Equity Partners Balanced
Chicago Equity Partners, LLC
AMG FQ Global Risk-Balanced
First Quadrant, L.P.
EQUITY FUNDS
AMG FQ Tax-Managed U.S. Equity
AMG FQ Long-Short Equity
First Quadrant, L.P.
AMG Frontier Small Cap Growth
Frontier Capital Management Co., LLC
AMG GW&K Small Cap Core
AMG GW&K Small/Mid Cap
AMG GW&K U.S. Small Cap Growth
GW&K Investment Management, LLC
AMG Renaissance International Equity
AMG Renaissance Large Cap Growth
The Renaissance Group LLC
AMG River Road Dividend All Cap Value
AMG River Road Dividend All Cap Value II
AMG River Road Focused Absolute Value
AMG River Road Long-Short
AMG River Road Small-Mid Cap Value
AMG River Road Small Cap Value
River Road Asset Management, LLC
AMG SouthernSun Small Cap
AMG SouthernSun Global Opportunities
AMG SouthernSun U.S. Equity
SouthernSun Asset Management, LLC
AMG Systematic Mid Cap Value
Systematic Financial Management L.P.
AMG TimesSquare Emerging Markets Small Cap
AMG TimesSquare Global Small Cap
AMG TimesSquare International Small Cap
AMG TimesSquare Mid Cap Growth
AMG TimesSquare Small Cap Growth
TimesSquare Capital Management, LLC
AMG Trilogy Emerging Markets Equity
AMG Trilogy Emerging Wealth Equity
Trilogy Global Advisors, L.P.
AMG Yacktman
AMG Yacktman Focused
AMG Yacktman Focused Fund - Security Selection Only
AMG Yacktman Special Opportunities
Yacktman Asset Management LP
FIXED INCOME FUNDS
AMG GW&K Core Bond
AMG GW&K Enhanced Core Bond
AMG GW&K Municipal Bond
AMG GW&K Municipal Enhanced Yield
GW&K Investment Management, LLC
OPEN-ARCHITECTURE FUNDS
ALTERNATIVE FUNDS
AMG Managers Lake Partners LASSO Alternative
Lake Partners, Inc.
EQUITY FUNDS
AMG Managers Brandywine
AMG Managers Brandywine Advisors Mid Cap Growth
AMG Managers Brandywine Blue
Friess Associates, LLC
AMG Managers Cadence Emerging Companies
AMG Managers Cadence Mid Cap
Cadence Capital Management LLC
AMG Managers CenterSquare Real Estate
CenterSquare Investment Management LLC
AMG Managers Emerging Opportunities
Lord, Abbett & Co. LLC
WEDGE Capital Management L.L.P.
Next Century Growth Investors LLC
RBC Global Asset Management (U.S.) Inc.
AMG Managers Essex Small/Micro Cap Growth
Essex Investment Management Company, LLC
AMG Managers Fairpointe ESG Equity
AMG Managers Fairpointe Mid Cap
Fairpointe Capital LLC
AMG Managers Guardian Capital Global Dividend
Guardian Capital LP
AMG Managers LMCG Small Cap Growth
LMCG Investments, LLC
AMG Managers Montag & Caldwell Growth
Montag & Caldwell, LLC
AMG Managers Pictet International
Pictet Asset Management Limited
AMG Managers Silvercrest Small Cap
Silvercrest Asset Management Group LLC
AMG Managers Skyline Special Equities
Skyline Asset Management, L.P.
AMG Managers Special Equity
Ranger Investment Management, L.P.
Lord, Abbett & Co. LLC
Smith Asset Management Group, L.P.
Federated MDTA LLC
AMG Managers Value Partners Asia Dividend
Value Partners Hong Kong Limited
FIXED INCOME FUNDS
AMG Managers Amundi Intermediate Government
AMG Managers Amundi Short Duration Government
Amundi Pioneer Institutional Asset Management, Inc.
AMG Managers Doubleline Core Plus Bond
DoubleLine Capital LP
AMG Managers Global Income Opportunity
AMG Managers Loomis Sayles Bond
Loomis, Sayles & Company, L.P.
| | |
| amgfunds.com | | 093018 AR075 |
Item 2. CODE OF ETHICS
Registrant has adopted a Code of Ethics. See attached Exhibit (a)(1).
Item 3. AUDIT COMMITTEE FINANCIAL EXPERT
Registrant’s Board of Trustees has determined that independent Trustee Mr. Steven J. Paggioli qualifies as an Audit Committee Financial Expert. Mr. Paggioli is “independent” as such term is defined in Form N-CSR.
Item 4. PRINCIPAL ACCOUNTANT FEES AND SERVICES
(a) Audit Fees
The aggregate fees billed by the Funds’ independent registered public accounting firm, PricewaterhouseCoopers LLP (“PwC”), to the Funds for the Funds’ two most recent fiscal years for professional services rendered for audits of annual financial statements, or services that are normally provided in connection with statutory and regulatory filings or engagements (“Audit Fees”) were as follows:
| | | | | | | | |
| | | Fiscal 2018 | | | Fiscal 2017 | |
AMG Managers Brandywine Fund | | $ | 28,599 | | | $ | 38,605 | |
AMG Managers Brandywine Blue Fund | | $ | 24,447 | | | $ | 32,817 | |
AMG Managers Brandywine Advisors Mid Cap Growth Fund | | $ | 24,079 | | | $ | 32,592 | |
(b) Audit-Related Fees
There were no fees billed by PwC to the Funds in its two recent fiscal years for services rendered for assurance and related services that are reasonably related to the performance of the audit or review of the Fund’s financial statements, but are not reported as Audit Fees (“Audit-Related Fees”).
For the Funds’ two most recent fiscal years, there were no Audit-Related Fees billed by PwC for engagements related directly to the operations and financial reporting of one or more Funds by a Fund Service Provider. A Fund Service Provider is (a) any investment adviser to the Fund (not including any Subadvisor whose role is primarily portfolio management and is subcontracted with or overseen by another investment adviser) or (b) any entity that provides ongoing services to the Fund and is controlling, controlled by or under common control with a Fund investment adviser described in (a).
(c) Tax Fees
The aggregate fees billed by PwC to the Funds for the two most recent fiscal years for professional services rendered for tax compliance, tax advice, and tax planning (“Tax Fees”) were as follows:
| | | | | | | | |
| | | Fiscal 2018 | | | Fiscal 2017 | |
AMG Managers Brandywine Fund | | $ | 7,369 | | | $ | 7,369 | |
AMG Managers Brandywine Blue Fund | | $ | 7,369 | | | $ | 7,369 | |
AMG Managers Brandywine Advisors Mid Cap Growth Fund | | $ | 7,369 | | | $ | 7,369 | |
For the Funds’ two most recent fiscal years, Tax Fees billed by PwC for engagements by Fund Service Providers that related directly to the operations and financial reporting of the Funds were $0 for fiscal 2018 and $0 for fiscal 2017, respectively.
The services for which Tax Fees were charged comprise all services performed by professional staff in PwC’s tax division except those services related to the audit. Typically, this category would include fees for tax compliance, tax planning, and tax advice. Tax compliance, tax advice, and tax planning services include preparation of original and amended tax returns, claims for refund and tax payment-planning services, assistance with tax audits and appeals, tax advice related to mergers and acquisitions and requests for rulings or technical advice from taxing authorities.
(d) All Other Fees
There were no other fees billed by PwC to the Funds for all other non-audit services (“Other Fees”) during the Funds’ two most recent fiscal years. During the same period, there were no Other Fees billed by PwC for engagements by Fund Service Providers that related directly to the operations and financial reporting of the Funds.
(e)(1) According to policies adopted by the Audit Committee, services provided by PwC to the Funds must be pre-approved by the Audit Committee. On an annual basis, the Audit Committee reviews and pre-approves various types of services that PwC may perform for the Funds without specific approval of each engagement, subject to specified budget limitations. As contemplated by the Sarbanes-Oxley Act of 2002 and related SEC rules, the Audit Committee also pre-approves non-audit services provided by PwC to any Fund Service Provider for any engagement that relates directly to the operations and financial reporting of the Funds. Any engagement that is not already pre-approved or that will exceed a pre-approved budget must be submitted to the Audit Committee for pre-approval. The Chairman of the Audit Committee is authorized on behalf of the Board of Trustees and the Audit Committee to approve the engagement of PwC to perform non-audit services subject to certain conditions, including notification to the Audit Committee of such pre-approval not later than the next meeting of the Audit Committee following the date of such pre-approval.
(e)(2) None.
(f) Not applicable.
(g) The aggregate fees billed by PwC in 2018 and 2017 for non-audit services rendered to the Funds and Fund Service Providers were $71,607 and $101,532, respectively. For the fiscal year ended September 30, 2018, this amount reflects the amounts disclosed above in Item 4(b),(c),(d), plus $49,500 in fees billed to the Fund Service Providers for non-audit services that did not relate directly to the operations and financial reporting of the Funds. For the fiscal year ended September 30, 2017, this amount reflects the amounts disclosed above in Item 4(b),(c),(d), plus $79,425 in fees billed to the Fund Service Providers for non-audit services that did not relate directly to the operations and financial reporting of the Funds.
(h) The Trust’s Audit Committee has considered whether the provision of non-audit services by registrant’s independent registered public accounting firm to the registrant’s investment advisor, and any entity controlling, controlled, or under common control with the investment advisor that provided ongoing services to the registrant that were not pre-approved by the Committee (because such services did not relate directly to the operations and financial reporting of the registrant) was compatible with maintaining the independence of the independent registered public accounting firm.
Item 5. AUDIT COMMITTEE OF LISTED REGISTRANTS
Not applicable.
Item 6. SCHEDULE OF INVESTMENTS
The schedule of investments in unaffiliated issuers as of the close of the reporting period is included as part of the shareholder report contained in Item 1 hereof.
Item 7. DISCLOSURE OF PROXY VOTING POLICIES AND PROCEDURES FOR CLOSED-END MANAGEMENT INVESTMENT COMPANIES
Not applicable.
Item 8. PORTFOLIO MANAGERS OF CLOSED-END MANAGEMENT INVESTMENT COMPANIES
Not applicable.
Item 9. PURCHASES OF EQUITY SECURITIES BY CLOSED-END MANAGEMENT INVESTMENT COMPANIES AND AFFILIATED PURCHASERS
Not applicable.
Item 10. SUBMISSION OF MATTERS TO A VOTE OF SECURITY HOLDERS
Not applicable.
Item 11. CONTROLS AND PROCEDURES
(a) The Registrant’s principal executive and principal financial officers have concluded, based on their evaluation of the registrant’s disclosure controls and procedures as of a date within 90 days of the filing of this report, that the Registrant’s disclosure controls and procedures are reasonably designed to ensure that information required to be disclosed by the Registrant on Form N-CSR is recorded, processed, summarized and reported within the required time
periods and that information required to be disclosed by the registrant in the reports that it files or submits on Form N-CSR is accumulated and communicated to the Registrant’s management, including its principal executive and principal financial officers, as appropriate to allow timely decisions regarding required disclosure.
(b) There were no changes in the Registrant’s internal control over financial reporting during the Registrant’s fourth fiscal quarter of the period covered by this report that have materially affected, or are reasonably likely to affect, the internal control over financial reporting.
Item 12. DISCLOSURE OF SECURITIES LENDING ACTIVITIES FOR CLOSED-END MANAGEMENT INVESTMENT COMPANIES
Not applicable.
Item 13. EXHIBITS
| | |
| (a)(1) | | Any Code of Ethics or amendments hereto. Filed herewith. |
| |
| (a)(2) | | Certifications pursuant to Rule 30a-2(a) under the Investment Company Act of 1940 - Filed herewith. |
| |
| (a)(3) | | Not applicable. |
| |
| (b) | | Certifications pursuant to Rule 30a-2(b) under the Investment Company Act of 1940 - Filed herewith. |
SIGNATURES
Pursuant to the requirements of the Securities Exchange Act of 1934 and the Investment Company Act of 1940, the registrant has duly caused this report to be signed on its behalf by the undersigned, thereunto duly authorized.
AMG FUNDS I
| | |
| By: | | /s/ Keitha L. Kinne |
| | Keitha L. Kinne, Principal Executive Officer |
| |
| Date: | | November 14, 2018 |
Pursuant to the requirements of the Securities Exchange Act of 1934 and the Investment Company Act of 1940, this report has been signed below by the following persons on behalf of the registrant and in the capacities and on the dates indicated.
| | |
| By: | | /s/ Keitha L. Kinne |
| | Keitha L. Kinne, Principal Executive Officer |
| |
| Date: | | November 14, 2018 |
| |
| By: | | /s/ Thomas Disbrow |
| | Thomas Disbrow, Principal Financial Officer |
| |
| Date: | | November 14, 2018 |