UNITED STATES
SECURITIES AND EXCHANGE COMMISSION
Washington, D.C. 20549
FORM N-CSR
CERTIFIED SHAREHOLDER REPORT OF REGISTERED
MANAGEMENT INVESTMENT COMPANIES
Investment Company Act file number: 811-09521
AMG FUNDS I
(Exact name of registrant as specified in charter)
600 Steamboat Road, Suite 300, Greenwich, Connecticut 06830
(Address of principal executive offices) (Zip code)
AMG Funds LLC
600 Steamboat Road, Suite 300, Greenwich, Connecticut 06830
(Name and address of agent for service)
Registrant’s telephone number, including area code: (203) 299-3500
Date of fiscal year end: September 30
Date of reporting period: OCTOBER 1, 2016 – SEPTEMBER 30, 2017
(Annual Shareholder Report)
Item 1. Reports to Shareholders
| | |
 | | ANNUAL REPORT |
AMG Funds
September 30, 2017

AMG Managers Brandywine Fund: Class I: BRWIX
AMG Managers Brandywine Blue Fund: Class I: BLUEX
| | |
| www.amgfunds.com | | AR073-0917 |
AMG Funds
Annual Report—September 30, 2017
| | | | |
TABLE OF CONTENTS | | PAGE | |
LETTER TO SHAREHOLDERS | | | 2 | |
| |
ABOUT YOUR FUND’S EXPENSES | | | 3 | |
| |
PORTFOLIO MANAGER’S COMMENTS, PORTFOLIO STATISTICS, AND SCHEDULES OF PORTFOLIO INVESTMENTS | | | | |
| |
AMG Managers Brandywine Fund | | | 4 | |
| |
AMG Managers Brandywine Blue Fund | | | 11 | |
| |
NOTES TO SCHEDULES OF PORTFOLIO INVESTMENTS | | | 17 | |
| |
FINANCIAL STATEMENTS | | | | |
| |
Statement of Assets and Liabilities | | | 18 | |
Balance sheets, net asset value (NAV) per share computations and cumulative undistributed amounts | | | | |
| |
Statement of Operations | | | 19 | |
Detail of sources of income, expenses, and realized and unrealized gains (losses) during the fiscal year | | | | |
| |
Statements of Changes in Net Assets | | | 20 | |
Detail of changes in assets for the past two fiscal years | | | | |
| |
Financial Highlights | | | 21 | |
Historical net asset values per share, distributions, total returns, income and expense ratios, turnover ratios and net assets | | | | |
| |
Notes to Financial Statements | | | 23 | |
Accounting and distribution policies, details of agreements and transactions with Fund management and affiliates, and descriptions of certain investment risks | | | | |
| |
REPORT OF INDEPENDENT REGISTERED PUBLIC ACCOUNTING FIRM | | | 29 | |
| |
ANNUAL RENEWAL OF INVESTMENT MANAGEMENT AND SUBADVISORY AGREEMENTS | | | 30 | |
| |
TRUSTEES AND OFFICERS | | | 33 | |
Nothing contained herein is to be considered an offer, sale or solicitation of an offer to buy shares of any series of the AMG Funds family of mutual funds. Such offering is made only by prospectus, which includes details as to offering price and other material information.
| | |
| | | AMG Managers Brandywine Fund AMG Managers Brandywine Blue Fund |
DEAR FELLOW SHAREHOLDER:
Sabers rattled and hurricanes raged, yet investors remained cool throughout the summer’s waning months. Using the S&P 500 Index as a proxy, the stock market extended its streak of consecutive quarterly gains to the two-year mark thanks to another move higher in the three months through September.
AMG Managers Brandywine Fund grew 7.00 percent in the September quarter, outpacing gains in the Russell 3000® and Russell 3000® Growth Indexes of 4.57 and 5.93 percent. AMG Managers Brandywine Blue Fund grew 7.38 percent as the S&P 500, Russell 1000® and Russell 1000® Growth Indexes added 4.48, 4.48 and 5.90 percent, respectively.
North Korea test-launched a ballistic missile on July 4th that demonstrated an astonishing advance in the unpredictable nation’s capabilities. The United States denounced the testing in unusually harsh terms and performed military exercises with allies in the region as more tests followed. In the meantime, Harvey, Irma and Maria threatened, then punished Texas, Florida and Puerto Rico with significant damage. Neither the heightened geopolitical tensions nor the potential economic implications of the storms made a lasting impression on investors.
Then, late in the quarter, came the Federal Reserve (the Fed). Nearly a decade after global markets plunged into history-making crisis, the Fed announced it would begin unwinding some of the $4.5 trillion balance sheet that was the centerpiece of the central bank’s post-crisis stimulus efforts. That, too, was digested by the stock market without incident.
Some market watchers credited prospects for corporate tax cuts with buoying the market’s mood in the turbulent macro conditions. Though a tax reform blueprint was unveiled, it was done with only a couple trading days left in the quarter, so it’s hard to imagine tax-related optimism playing a much more pronounced role than in it did in the first six months of the year.
Rather than fret about an unpredictable threat or celebrate a “good for business” proposal that, during the timeframe, lacked detail on substance and support, investors appeared focused on near-term earnings trends. Earnings progress continued against a steady, albeit slow-growing, economic backdrop.
Share price action seemed rational and company-specific in the September quarter. Companies that delivered on the earnings front and showed signs of continuing in the right direction drew positive investor attention. Companies that disappointed and/or tempered expectations for the future did not.
The Brandywine Fund posted gains in all 10 of the economic sectors represented in the Fund’s portfolio during the September quarter. The Fund outperformed its primary benchmark, the Russell 3000® Growth Index, in seven out of those 10 sectors. Brandywine Blue generated positive returns in nine out of nine economic sectors and outperformed those sectors within the Russell 1000® Growth Index in all but one instance.
Outperformance among consumer discretionary holdings played the most significant role in generating Brandywine’s relative performance advantage over its benchmark in the September quarter. Consumer discretionary holdings comprised the Fund’s second largest position and represented a slightly overweight position relative to the Index. The sector was the second greatest contributor to absolute performance.
Discount retailer Dollar Tree and recreational vehicle maker Winnebago Industries were standouts. Dollar Tree and Winnebago grew earnings in their
most recently reported quarters 24 and 57 percent, respectively, beating expectations in both cases. Netflix also contributed to results after announcing that its subscriber base passed 100 million in the three months through June and, for the first time, international subscribers outnumbered domestic ones.
Small and roughly equal-weight positions in the consumer staples, materials and energy sectors were the next biggest contributors to Brandywine’s relative performance thanks to a handful of companies, including Estee Lauder Cos., Albemarle Corp. and HollyFrontier Corp. Industrial holdings, which influenced relative performance less, were the third biggest contributors to Brandywine’s absolute return.
Technology holdings, although the biggest contributors to Brandywine’s absolute results, were the second greatest detractors from relative results. That was not the case for Brandywine Blue, where technology contributed the most to both absolute and relative performance versus the Russell 1000® Growth Index. Technology represented the largest position in both Funds.
Semiconductor manufacturers Micron Technology and Nvidia Corp. both exceeded estimates by more than doubling year-over-year earnings on strong pricing and volume trends. Other top contributors included Arista Networks, Activision Blizzard and ServiceNow, which all reported June-quarter results that topped consensus earnings estimates. While both Funds held all five companies, Brandywine Blue benefited from its mix of holdings being tilted more toward semiconductors and software, and less toward communications equipment.
Due in part to common holdings, Brandywine Blue’s next most significant contributors to relative results were holdings from the consumer staples (Estee Lauder Cos.), consumer discretionary (Dollar Tree and Netflix) and materials (Albemarle Corp.) sectors. After technology, holdings from the consumer discretionary and industrial sectors contributed the most to Brandywine Blue’s absolute return.
While positive contributors to return, health care holdings were the most significant relative performance detractors in both Funds. Health care holdings underperformed the sector within benchmarks as holdings such as Evolent Health (Brandywine), Hologic (both Funds) and Medtronic (Brandywine Blue) weighed on results. Contract renewal concerns arose regarding Evolent Health as the company announced an equity offering. After reporting solid June-quarter results, Hologic tempered revenue guidance. Medtronic reported lower-than-expected revenue growth due to manufacturing-related delays.
For more information on companies that influenced September-quarter performance, please see Roses & Thorns on page 7 for Brandywine and page 14 for Brandywine Blue.
We’re working hard to build on recent results. Best wishes from your entire Friess team.

Scott Gates
Chief Investment Officer
Friess Associates, LLC
About Your Fund’s Expenses
As a shareholder of a Fund, you may incur two types of costs: (1) transaction costs, which may include sales charges (loads) on purchase payments; redemption fees; and exchange fees; and (2) ongoing costs, including management fees; distribution (12b-1) fees; and other Fund expenses. This example is intended to help you understand your ongoing costs (in dollars) of investing in the Fund and to compare these costs with the ongoing costs of investing in other mutual funds. The example is based on $1,000 invested at the beginning of the period and held for the entire period as indicated below.
ACTUAL EXPENSES
The first line of the following table provides information about the actual account values and actual expenses. You may use the information in this line, together with the amount you invested, to estimate the expenses that you paid over the period. Simply divide your account value by $1,000 (for example, an $8,600 account value divided by $1,000 = 8.6), then multiply the result by the number in the first line under the heading entitled “Expenses Paid During Period” to estimate the expenses you paid on your account during this period.
HYPOTHETICAL EXAMPLE FOR COMPARISON PURPOSES
The second line of the following table provides information about hypothetical account values and hypothetical expenses based on the Fund’s actual expense ratio and an assumed annual rate of return of 5% before expenses, which is not the Fund’s actual return. The hypothetical account values and expenses may not be used to estimate the actual ending account balance or expenses you paid for the period. You may use this information to compare the ongoing costs of investing in the Fund and other funds by comparing this 5% hypothetical example with the 5% hypothetical examples that appear in the shareholder reports of other funds.
Please note that the expenses shown in the table are meant to highlight your on going costs only and do not reflect any transactional costs, such as sales charges (loads), redemption fees, or exchange fees. Therefore, the second line of the table is useful in comparing ongoing costs only, and will not help you determine the relative total costs of owning different funds.
| | | | | | | | | | | | | | | | |
| Six Months Ended September 30, 2017 | | Expense
Ratio for
the Period | | | Beginning
Account
Value
04/01/17 | | | Ending
Account
Value
09/30/17 | | | Expenses
Paid
During
the
Period* | |
AMG Managers Brandywine Fund | | | | | | | | | | | | | | | | |
Based on Actual Fund Return | | | 1.12 | % | | $ | 1,000 | | | $ | 1,109 | | | $ | 5.92 | |
Hypothetical (5% return before expenses) | | | 1.12 | % | | $ | 1,000 | | | $ | 1,019 | | | $ | 5.67 | |
AMG Managers Brandywine Blue Fund | | | | | | | | | | | | | | | | |
Based on Actual Fund Return | | | 1.20 | % | | $ | 1,000 | | | $ | 1,127 | | | $ | 6.40 | |
Hypothetical (5% return before expenses) | | | 1.20 | % | | $ | 1,000 | | | $ | 1,019 | | | $ | 6.07 | |
| * | Expenses are equal to the Fund’s annualized expense ratio multiplied by the average account value over the period, multiplied by the number of days in the most recent fiscal half-year (183), then divided by 365. |
AMG Managers Brandywine Fund
Portfolio Manager’s Comments (unaudited)
The fiscal year began with momentum. Roughly seven-and-a-half years and counting, the bull market was bolstering its status as the second-longest run of all time one quarter after the other. Major market indexes notched four consecutive quarters of positive returns in the year prior to fiscal 2017.
The stock market reflected optimism and relative calm among investors throughout most of the fiscal year. Sentiment, even when challenged by macro factors with market-moving potential, remained biased toward the bright side.
AMG Managers Brandywine Fund (“Brandywine”) employs an investment strategy that emphasizes individual-company fundamentals as the primary influence on stock prices. While there were periods during the fiscal year when share prices seemed to move for other reasons, the environment was generally good for bottom-up investors.
Brandywine grew 18.87 percent in the 12 months through September 30, 2017.
The period started during the climactic months of the 2016 presidential election cycle. While the December quarter of 2016 included its fair share of potentially market-moving events, including a landmark pact among major oil-producing nations to curb output and the first interest rate hike in a year, nothing proved capable of trumping the presidential election’s influence on stocks. The election outcome was well-received by investors, and the reaction to it reflected the market’s best guesses as to how the landscape might change under the new administration.
Political themes shaped performance, with investors betting that the financial sector would benefit from looser regulation and the industrial sector would enjoy demand fueled by
infrastructure spending. The technology and consumer discretionary sectors, where Brandywine identified the biggest pockets of near-term earnings strength, drew less enthusiasm as investors identified them as likely to face costs related to import tariffs that were part of the new administration’s economic talking points. Brandywine posted a modest gain in the quarter.
High hopes for business-friendly actions from the White House kept the mood mainly upbeat in the March quarter of 2017. Optimism regarding the Trump administration’s pro-growth promises on taxation, deregulation and infrastructure spending remained the prevailing theme.
Technology and consumer discretionary holdings led Brandywine’s performance. Health care holdings also contributed to the cause after Congressional efforts to reform health care stalled. Energy holdings weighed on results as falling oil prices raised investor concerns about the staying power of a fledgling profit recovery in the energy sector. Brandywine generated a solid March-quarter return.
The market’s move higher proved to be persistent in the June quarter, with stocks gaining ground despite political drama stemming from the controversial dismissal of the director of the F.B.I., rising questions about the ability of Congress to advance the new administration’s legislative priorities and a continuation of the Federal Reserve’s series of interest rate increases.
It was a strong quarter for technology stocks. Health care holdings also aided the cause. Meanwhile, energy holdings weighed on results as oil prices declined anew. With gains broadly distributed, Brandywine added to the progress it made in the previous six months.
Investors remained undeterred in the final three months of the fiscal year. Despite test missile launches from North Korea, damaging hurricanes in the Caribbean and southern United States, and an announcement from the Federal Reserve that it would begin reversing its post-crisis stimulus, stocks continued an orderly climb in the September quarter. Of the fiscal year’s four quarters, this one was Brandywine’s best.
Technology and consumer discretionary holdings were again standout performers. All 10 economic sectors represented in the Brandywine Fund’s portfolio gained ground during the period.
For the entire fiscal year, technology holdings, which comprised the largest position throughout the period, contributed the most to Brandywine’s performance, accounting for about half of total return. Consumer discretionary holdings, the Fund’s second largest position, were the next most significant contributors. The two sectors combined generated roughly two-thirds of the fiscal year return.
Energy and telecommunications services, two of the smallest positions in the Fund, were the only sectors to decline during the fiscal year. Energy weighed the most on performance.
Turns out the market maintained the momentum with which it began the fiscal year. Major indexes, and Brandywine, posted positive returns in all four quarters.
This commentary reflects the viewpoints of Friess Associates, LLC as of September 30, 2017 and is not intended as a forecast or guarantee of future results.
AMG Managers Brandywine Fund
Portfolio Manager’s Comments (continued)
CUMULATIVE TOTAL RETURN PERFORMANCE
AMG Managers Brandywine Fund’s cumulative total return is based on the daily change in net asset value (NAV), and assumes that all dividends and distributions were reinvested. This graph compares a hypothetical $10,000 investment made in the Fund’s Class I shares on September 30, 2007, to a $10,000 investment made in the Russell 3000® Growth Index, Russell 3000® Index and S&P 500 Index for the same time period. The graph and table do not reflect the deduction of taxes that a shareholder would pay on a Fund distribution or redemption of shares. The listed returns for the Fund are net of expenses and the returns for the index exclude expenses. Total returns would have been lower had certain expenses not been reduced.
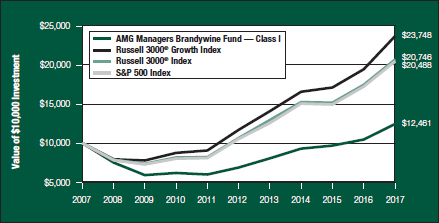
The table below shows the average annual total returns for the AMG Managers Brandywine Fund and the Russell 3000® Growth Index, Russell 3000® Index and S&P 500 Index for the same time periods ended September 30, 2017.
| | | | | | | | | | | | |
| Average Annual Total Returns1 | | One
Year | | | Five
Years | | | Ten
Years | |
AMG Managers Brandywine Fund2,3,4,5,6,7,8 | | | 18.87 | % | | | 12.57 | % | | | 2.23 | % |
Russell 3000® Growth Index9,12 | | | 21.87 | % | | | 15.18 | % | | | 9.03 | % |
Russell 3000® Index10,12 | | | 18.71 | % | | | 14.23 | % | | | 7.57 | % |
S&P 500 Index11,12 | | | 18.61 | % | | | 14.22 | % | | | 7.44 | % |
The performance data shown represents past performance. Past performance is not a guarantee of future results. Current performance may be lower or higher than the performance data quoted. The investment return and principal value of an investment will fluctuate so that an investor’s shares, when redeemed, may be worth more or less than their original cost.
Investors should carefully consider the Fund’s investment objectives, risks, charges, and expenses before investing. For performance information through the most recent month end, current net asset values per share for the Fund and other information, please call 800.835.3879 or visit our website at www.amgfunds.com for a free prospectus. Read it carefully before investing or sending money.
Distributed by AMG Distributors, Inc., member FINRA/SIPC.
| 1 | Total return equals income yield plus share price change and assumes reinvestment of all dividends and capital gain distributions. Returns are net of fees and may reflect offsets of Fund expenses as described in the prospectus. No adjustment has been made for taxes payable by shareholders on their reinvested dividends and capital gain distributions. Returns for periods greater than one year are annualized. The listed returns on the Fund are net of expenses and based on the published NAV as of September 30, 2017. All returns are in U.S. dollars ($). |
| 2 | The Fund inception dates and returns for all periods prior to October 1, 2013, reflect performance of the Predecessor Fund, Brandywine Fund, Inc., and was managed by Friess Associates, LLC with the same investment objective and substantially similar investment policies. |
| 3 | Active and frequent trading of a fund may result in higher transaction costs and increased tax liability. |
| 4 | The Fund invests in growth stocks, which may be more sensitive to market movements because their prices tend to reflect future investor expectations rather than just current profits. |
| 5 | Investments in international securities are subject to certain risks of overseas investing including currency fluctuations and changes in political and economic conditions, which could result in significant market fluctuations. |
| 6 | The Fund is subject to risks associated with investments in mid-capitalization companies such as greater price volatility, lower trading volume and less liquidity then the stocks of larger, more established companies. |
| 7 | The Fund is subject to risks associated with investments in small-capitalization companies, such as erratic earnings patterns, competitive conditions, limited earnings history, and a reliance on one or a limited number of products. |
| 8 | Effective February 27, 2017, the Fund’s Class S shares were renamed Class I. |
| 9 | The Russell 3000® Growth Index measures the performance of those Russell 3000® Index companies with higher price-to-book ratios and higher forecasted growth values. |
| 10 | The Russell 3000® Index is composed of the 3,000 largest U.S. companies as measured by market capitalization and represents about 98% of the U.S. stock market. |
| 11 | The S&P 500 Index is a capitalization-weighted index of 500 stocks. The S&P 500 Index is designed to measure performance of the broad domestic economy through changes in the aggregate market value of 500 stocks representing all major industries. |
| 12 | Unlike the Fund, the indices are unmanaged, are not available for investment and do not incur expenses. |
The Russell Indices are trademarks of the London Stock Exchange Group companies.
The S&P 500 Index is proprietary data of Standard & Poor’s, a division of McGraw-Hill Companies, Inc. All rights reserved.
Not FDIC insured, nor bank guaranteed. May lose value.
AMG Managers Brandywine Fund
Fund Snapshots (unaudited)
September 30, 2017
PORTFOLIO BREAKDOWN
| | | | | | | | | | | | | | | | |
Industry (Top Ten) | | AMG
Managers
Brandywine
Fund* | | | Russell
3000®
Growth
Index | | | Russell
3000®
Index | | | S&P
500
Index | |
Semiconductors | | | 10.4 | % | | | 3.9 | % | | | 3.1 | % | | | 3.3 | % |
Internet Software & Services | | | 9.0 | % | | | 8.3 | % | | | 4.4 | % | | | 4.8 | % |
Internet & Direct Marketing Retail | | | 6.2 | % | | | 4.5 | % | | | 2.3 | % | | | 2.7 | % |
Data Processing & Outsourced Services | | | 5.4 | % | | | 5.0 | % | | | 2.6 | % | | | 2.6 | % |
Life Sciences Tools & Services | | | 5.2 | % | | | 1.0 | % | | | 0.8 | % | | | 0.8 | % |
Apparel Retail | | | 4.2 | % | | | 0.6 | % | | | 0.5 | % | | | 0.4 | % |
Home Entertainment Software | | | 4.0 | % | | | 0.7 | % | | | 0.4 | % | | | 0.4 | % |
General Merchandise Stores | | | 3.2 | % | | | 0.2 | % | | | 0.3 | % | | | 0.3 | % |
Systems Software | | | 3.0 | % | | | 5.2 | % | | | 3.2 | % | | | 3.6 | % |
Trading Companies & Distributors | | | 2.8 | % | | | 0.5 | % | | | 0.3 | % | | | 0.2 | % |
Other Common Stock | | | 43.1 | % | | | 70.1 | % | | | 82.1 | % | | | 80.9 | % |
Cash & Cash Equivalents† | | | 3.5 | % | | | 0.0 | % | | | 0.0 | % | | | 0.0 | % |
| * | As a percentage of net assets. |
| † | Includes Other Assets and Liabilities. |
TOP TEN HOLDINGS
| | | | | | | | |
Security Name | | % of
Net Assets | | |
% Change
from Book
Cost | |
Alphabet, Inc., Class A** | | | 2.2 | % | | | 41.7 | % |
Facebook, Inc., Class A** | | | 2.2 | % | | | 154.1 | % |
Broadcom, Ltd.** | | | 2.2 | % | | | 192.7 | % |
Albemarle Corp.** | | | 2.1 | % | | | 49.9 | % |
The Trade Desk, Inc., Class A | | | 2.0 | % | | | 56.7 | % |
Cigna Corp.** | | | 1.9 | % | | | 41.1 | % |
T-Mobile US, Inc. | | | 1.9 | % | | | -1.6 | % |
Amazon.com, Inc.** | | | 1.9 | % | | | 138.8 | % |
Netflix, Inc. | | | 1.9 | % | | | 74.3 | % |
Thermo Fisher Scientific, Inc.** | | | 1.8 | % | | | 45.4 | % |
| | | | | | | | |
Top Ten as a Group | | | 20.1 | % | | | | |
| | | | | | | | |
| ** | Also Top Ten Holding as of June 30, 2017. |
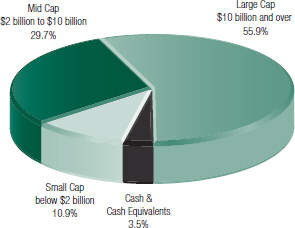
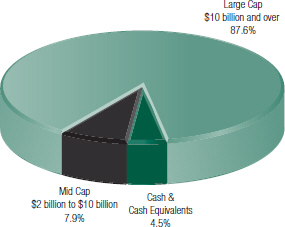
PORTFOLIO MARKET CAPITALIZATION
ESTIMATED EARNINGS GROWTH RATE
OF THE FUND’S INVESTMENTS
Forecasted Increase in Earnings Per Share 2017 vs 2016
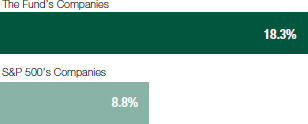
Source: Consensus estimates from FactSet Research Systems Inc.
This is not a forecast of the Fund’s future performance. Earnings growth for a Fund holding does not guarantee a corresponding increase in the market value of the holding or the Fund.
Because a fund’s strategy may result in multiple investments in particular sectors of the economy, its performance may depend on the performance of those sectors and may fluctuate more widely than investments diversified across more sectors. For additional information on these and other risk considerations, please see the Fund’s prospectus.
Any sectors, industries, or securities discussed should not be perceived as investment recommendations. Mention of a specific security should not be considered a recommendation to buy or solicitation to sell that security. Specific securities mentioned in this report may have been sold from the Fund’s portfolio of investments by the time you receive this report.
AMG Managers Brandywine Fund
Roses & Thorns (unaudited)
Quarter Ending September 30, 2017
| | | | | | | | | | |
$ Gain
(in millions) | | | % Gain | | | Biggest $ Winners | | Reason for Move |
| | | | | | | | |
| | | | | | | | Albemarle Corp. (ALB) |
| $ | 3.7 | | | | 29.2 | % | | The global developer, manufacturer and marketer of highly engineered specialty chemicals grew June-quarter earnings 21 percent, exceeding the consensus estimate. Albemarle reaffirmed 2017 earnings guidance and noted that new lithium production capacity it plans to add this year and next should support profit margins and earnings growth. |
| | |
| | | | | | | | Micron Technology Inc. (MU) |
| $ | 3.3 | | | | 31.7 | % | | The semiconductor and memory solutions developer reported August-quarter earnings of $2.02 per share, up from a year-ago loss and ahead of the consensus estimate. Sales rose 91 percent amid better DRAM pricing and NAND volumes. The company increased revenue and profit-margin guidance for its fiscal year ending August 2018. |
| | |
| | | | | | | | The Trade Desk Inc. (TTD) |
| $ | 2.8 | | | | 22.8 | % | | The company, which offers agencies, aggregators and advertisers technology to manage and display advertising campaigns, reported June-quarter earnings of $0.52 per share versus $0.23 a year ago, exceeding the consensus estimate. Revenue increased 54 percent, reflecting customer wins and strong growth in international and mobile markets. Trade Desk also raised full year revenue guidance. |
| | |
| | | | | | | | United Rentals Inc. (URI) |
| $ | 2.6 | | | | 23.1 | % | | The equipment rental company grew June-quarter earnings 15 percent, topping the consensus estimate. Improved demand across all segments increased equipment utilization. Shares gained as the company reported stronger industry pricing was sustainable due to tight supply. |
| | |
| | | | | | | | Dollar Tree Inc. (DLTR) |
| $ | 2.6 | | | | 22.7 | % | | The discount variety store operator grew July-quarter earnings 24 percent, topping the consensus estimate. At 3.9 percent, Dollar Tree enjoyed better-than- expected growth in same-store sales. Improved traffic at the company’s Family Dollar unit was a notable contributor. |
| | | |
$Loss
(in millions) | | | % Loss | | | Biggest $ Losers | | Reason for Move |
| | | | | | | | |
| | | | | | | | Evolent Health Inc. (EVH) |
| $ | 2.7 | | | | 32.7 | % | | The provider of health system management solutions grew June-quarter sales 90 percent, exceeding expectations. Evolent reported 2.8 million lives on its platform, more than double the prior year. Shares traded lower due to contract renewal concerns and an announced equity offering. We sold Evolent to fund a new opportunity. |
| | |
| | | | | | | | Ulta Beauty Inc. (ULTA) |
| $ | 2.6 | | | | 21.3 | % | | The beauty supply retailer, which offers cosmetics, fragrance, skin and hair care products, and salon services, grew July-quarter earnings 28 percent, exceeding the consensus estimate. Ulta eliminated previously offered promotions, resulting in increased profit margins and stronger same store sales. Shares came under pressure as Amazon increased its presence in the beauty space. |
| | |
| | | | | | | | Finisar Corp. (FNSR) |
| $ | 1.6 | | | | 16.2 | % | | The manufacturer of fiber optic subsystems and components reported July-quarter earnings of $0.40 per share. Shares declined when the company provided October-quarter guidance below expectations due to production delays in 3-D sensing and weakness in equipment sales in Chinese markets. We sold Finisar to fund a new opportunity with greater visibility. |
| | |
| | | | | | | | Apogee Enterprises Inc. (APOG) |
| $ | 1.4 | | | | 18.1 | % | | The designer and developer of glass solutions for commercial buildings saw its stock price come under pressure with concerns that construction spending would slow. We sold Apogee just prior to the company issuing a tempered outlook primarily driven by downward adjustments to revenue and profit-margin assumptions regarding EFCO Corp., a recent acquisition. |
| | |
| | | | | | | | Hologic Inc. (HOLX) |
| $ | 1.3 | | | | 11.1 | % | | The maker of diagnostic products, medical imaging systems and surgical supplies reported June-quarter earnings per share of $0.50, exceeding the consensus estimate. The company lowered revenue guidance for the year due to slower-than-expected organic growth. We sold Hologic to fund a new opportunity with better visibility. |
All gains/losses are calculated on an average cost basis from June 30, 2017 through September 30, 2017.
This commentary reflects the viewpoints of Friess Associates, LLC as of September 30, 2017 and is not intended as a forecast or guarantee of future results.
AMG Managers Brandywine Fund
Schedule of Portfolio Investments
September 30, 2017
| | | | | | | | | | | | |
| Shares | | | | | Cost | | | Value | |
| | Common Stocks - 96.5% | | | | | | | | |
| | Consumer Discretionary | | | | | | | | |
| | | | Apparel Retail - 4.2% | | | | | |
| | 799,334 | | | American Eagle Outfitters, Inc. | | $ | 10,596,606 | | | $ | 11,430,476 | |
| | 76,245 | | | The Children’s Place, Inc.1 | | | 7,480,454 | | | | 9,008,347 | |
| | 161,200 | | | The TJX Cos., Inc. | | | 11,248,724 | | | | 11,885,276 | |
| | | | Apparel, Accessories & Luxury Goods - 1.0% | | | | | |
| | 61,420 | | | PVH Corp. | | | 7,748,641 | | | | 7,742,605 | |
| | | | Auto Parts & Equipment - 0.5% | | | | | |
| | 198,844 | | | Modine Manufacturing Co.* | | | 3,139,018 | | | | 3,827,747 | |
| | | | Automobile Manufacturers - 1.0% | | | | | |
| | 179,300 | | | Winnebago Industries, Inc. | | | 6,962,458 | | | | 8,023,675 | |
| | | | Cable & Satellite - 1.6% | | | | | |
| | 34,276 | | | Charter Communications, Inc., Class A* | | | 7,957,387 | | | | 12,456,584 | |
| | | | Footwear - 1.4% | | | | | |
| | 370,564 | | | Wolverine World Wide, Inc. | | | 10,364,579 | | | | 10,690,771 | |
| | | | General Merchandise Stores - 3.2% | | | | | |
| | 163,000 | | | Dollar Tree, Inc.* | | | 11,530,734 | | | | 14,151,660 | |
| | 226,345 | | | Ollie’s Bargain Outlet Holdings, Inc.* | | | 9,914,790 | | | | 10,502,408 | |
| | | | Home Furnishings - 1.0% | | | | | |
| | 233,820 | | | Ethan Allen Interiors, Inc. | | | 7,333,136 | | | | 7,575,768 | |
| | | | Hotels, Resorts & Cruise Lines - 0.2% | | | | | |
| | 31,410 | | | Hilton Grand Vacations, Inc.* | | | 1,091,344 | | | | 1,213,368 | |
| | | | Household Appliances - 1.0% | | | | | |
| | 77,475 | | | Helen of Troy, Ltd.* | | | 7,100,359 | | | | 7,507,328 | |
| | | | Internet & Direct Marketing Retail - 6.2% | | | | | |
| | 15,213 | | | Amazon.com, Inc.* | | | 6,123,740 | | | | 14,625,018 | |
| | 80,409 | | | Netflix, Inc.* | | | 8,364,077 | | | | 14,582,172 | |
| | 6,123 | | | The Priceline Group, Inc.* | | | 8,702,441 | | | | 11,210,111 | |
| | 115,025 | | | Wayfair, Inc., Class A* | | | 8,100,811 | | | | 7,752,685 | |
| | | | Movies & Entertainment - 1.6% | | | | | |
| | 314,660 | | | Liberty Media Corp.-Liberty Formula One, Class C*,1 | | | 11,276,573 | | | | 11,985,399 | |
| | | | Specialty Stores - 1.2% | | | | | |
| | 41,680 | | | Ulta Beauty, Inc.* | | | 10,395,630 | | | | 9,422,181 | |
| | | | | | | | | | | | |
| | Total Consumer Discretionary | | | 155,431,502 | | | | 185,593,579 | |
| | | | This sector is 19.4% above your Fund’s cost. | | | | | |
| | |
| | Consumer Staples | | | | | | | | |
| | | | Food Distributors - 1.2% | | | | | |
| | 323,409 | | | Performance Food Group Co.* | | | 7,664,763 | | | | 9,136,304 | |
| | | | Packaged Foods & Meats - 1.2% | | | | | |
| | 17,060 | | | Calavo Growers, Inc.1 | | | 855,811 | | | | 1,248,792 | |
| | 535,730 | | | Nomad Foods, Ltd.* | | | 7,724,787 | | | | 7,805,586 | |
| | | | | | | | | | | | |
| Shares | | | | | Cost | | | Value | |
| | | | Personal Products - 1.7% | | | | | |
| | 123,970 | | | The Estee Lauder Cos., Inc., Class A | | $ | 10,583,694 | | | $ | 13,368,925 | |
| | | | | | | | | | | | |
| | Total Consumer Staples | | | 26,829,055 | | | | 31,559,607 | |
| | | | This sector is 17.6% above your Fund’s cost. | | | | | |
| | Energy | | | | | | | | |
| | | | Oil & Gas Exploration & Production - 1.1% | | | | | |
| | 1,091,864 | | | Kosmos Energy, Ltd.*,1 | | | 7,528,085 | | | | 8,691,237 | |
| | | | Oil & Gas Refining & Marketing - 1.6% | | | | | |
| | 341,470 | | | HollyFrontier Corp. | | | 10,980,480 | | | | 12,282,676 | |
| | | | | | | | | | | | |
| | Total Energy | | | 18,508,565 | | | | 20,973,913 | |
| | | | This sector is 13.3% above your Fund’s cost. | | | | | |
| | |
| | Financials | | | | | | | | |
| | | | Financial Exchanges & Data - 1.7% | | | | | |
| | 93,140 | | | CME Group, Inc. | | | 8,750,461 | | | | 12,637,235 | |
| | | | This sector is 44.4% above your Fund’s cost. | | | | | |
| | |
| | Health Care | | | | | | | | |
| | | | Health Care Equipment - 0.5% | | | | | |
| | 39,535 | | | Penumbra, Inc.* | | | 3,139,409 | | | | 3,570,010 | |
| | | | Health Care Services - 1.0% | | | | | |
| | 232,920 | | | Teladoc, Inc.*,1 | | | 7,229,029 | | | | 7,721,298 | |
| | | | Life Sciences Tools & Services - 5.2% | | | | | |
| | 105,319 | | | Bio-Techne Corp. | | | 12,129,213 | | | | 12,732,014 | |
| | 66,825 | | | Illumina, Inc.* | | | 11,156,593 | | | | 13,311,540 | |
| | 74,950 | | | Thermo Fisher Scientific, Inc. | | | 9,754,872 | | | | 14,180,540 | |
| | | | Managed Health Care - 1.9% | | | | | |
| | 79,890 | | | Cigna Corp. | | | 10,582,869 | | | | 14,934,637 | |
| | | | Pharmaceuticals - 2.0% | | | | | |
| | 57,230 | | | Prestige Brands Holdings, Inc.* | | | 3,004,653 | | | | 2,866,651 | |
| | 199,975 | | | Zoetis, Inc. | | | 10,716,542 | | | | 12,750,406 | |
| | | | | | | | | | | | |
| | Total Health Care | | | 67,713,180 | | | | 82,067,096 | |
| | | | This sector is 21.2% above your Fund’s cost. | | | | | |
| | Industrials | | | | | | | | |
| | | | Aerospace & Defense - 1.4% | | | | | |
| | 203,500 | | | Mercury Systems, Inc.* | | | 8,635,348 | | | | 10,557,580 | |
| | | | Air Freight & Logistics - 1.0% | | | | | |
| | 320,266 | | | Air Transport Services Group, Inc.* | | | 7,390,600 | | | | 7,795,274 | |
| | | | Airlines - 1.4% | | | | | |
| | 220,760 | | | Delta Air Lines, Inc. | | | 11,357,594 | | | | 10,645,047 | |
| | | | Construction & Engineering - 2.1% | | | | | |
| | 238,100 | | | MasTec, Inc.* | | | 9,442,517 | | | | 11,047,840 | |
| | 128,405 | | | Quanta Services, Inc.* | | | 4,649,937 | | | | 4,798,495 | |
| | | | Construction Machinery & Heavy Trucks - 1.6% | | | | | |
| | 154,075 | | | Oshkosh Corp. | | | 10,854,599 | | | | 12,717,350 | |
|
The accompanying notes are an integral part of these financial statements. 8 |
AMG Managers Brandywine Fund
Schedule of Portfolio Investments (continued)
| | | | | | | | | | | | |
| Shares | | | | | Cost | | | Value | |
| | Industrials (continued) | | | | | | | | |
| | | | Industrial Machinery - 0.2% | | | | | |
| | 46,200 | | | SPX Corp.* | | $ | 1,124,020 | | | $ | 1,355,508 | |
| | | | Trading Companies & Distributors - 2.8% | | | | | |
| | 224,050 | | | GMS, Inc.* | | | 4,926,353 | | | | 7,931,370 | |
| | 100,915 | | | United Rentals, Inc.* | | | 12,399,490 | | | | 14,000,947 | |
| | | | Trucking - 1.4% | | | | | |
| | 290,990 | | | Avis Budget Group, Inc.*,1 | | | 11,106,060 | | | | 11,075,079 | |
| | | | | | | | | | | | |
| | Total Industrials | | | 81,886,518 | | | | 91,924,490 | |
| | | | This sector is 12.3% above your Fund’s cost. | |
| | Information Technology | | | | | | | | |
| | | | Application Software - 2.7% | | | | | |
| | 208,680 | | | Atlassian Corp. PLC, Class A* | | | 5,231,754 | | | | 7,335,102 | |
| | 142,880 | | | Salesforce.com, Inc.* | | | 10,821,895 | | | | 13,347,850 | |
| | | | Communications Equipment - 1.5% | | | | | |
| | 62,699 | | | Arista Networks, Inc.* | | | 5,848,006 | | | | 11,888,357 | |
| | | | Data Processing & Outsourced Services - 5.4% | | | | | |
| | 176,960 | | | Black Knight Financial Services, Inc., Class A*,1 | | | 4,502,085 | | | | 7,618,128 | |
| | 177,635 | | | Blackhawk Network Holdings, Inc.* | | | 7,130,803 | | | | 7,780,413 | |
| | 139,960 | | | Global Payments, Inc. | | | 10,039,962 | | | | 13,300,399 | |
| | 119,890 | | | Visa, Inc., Class A | | | 8,635,439 | | | | 12,617,224 | |
| | | | Home Entertainment Software - 4.0% | | | | | |
| | 207,755 | | | Activision Blizzard, Inc. | | | 11,084,770 | | | | 13,402,275 | |
| | 86,540 | | | Electronic Arts, Inc.* | | | 8,324,154 | | | | 10,216,912 | |
| | 73,200 | | | Take-Two Interactive Software, Inc.* | | | 6,913,963 | | | | 7,483,236 | |
| | | | Internet Software & Services - 9.0% | | | | | |
| | 17,429 | | | Alphabet, Inc., Class A* | | | 11,980,700 | | | | 16,970,966 | |
| | 98,643 | | | Facebook, Inc., Class A* | | | 6,633,348 | | | | 16,855,129 | |
| | 303,159 | | | Five9, Inc.*,1 | | | 7,155,957 | | | | 7,245,500 | |
| | 117,660 | | | LogMeln, Inc. | | | 12,462,324 | | | | 12,948,483 | |
| | 246,357 | | | The Trade Desk, Inc., Class A*,1 | | | 9,669,304 | | | | 15,153,419 | |
| | | | Semiconductors - 10.4% | | | | | |
| | 855,120 | | | Advanced Micro Devices, Inc.*,1 | | | 9,810,726 | | | | 10,902,780 | |
| | 69,190 | | | Broadcom, Ltd. | | | 5,733,996 | | | | 16,781,343 | |
| | 759,150 | | | Himax Technologies, Inc., ADR | | | 7,587,780 | | | | 8,297,510 | |
| | 347,485 | | | Micron Technology, Inc.* | | | 11,293,923 | | | | 13,666,585 | |
| | 67,631 | | | NVIDIA Corp. | | | 5,953,664 | | | | 12,090,394 | |
| | 130,323 | | | Silicon Motion Technology Corp., ADR1 | | | 7,060,066 | | | | 6,259,414 | |
| | 175,155 | | | Xilinx, Inc. | | | 11,340,943 | | | | 12,406,229 | |
| | | | Systems Software - 3.0% | | | | | |
| | 169,255 | | | Microsoft Corp. | | | 10,853,934 | | | | 12,607,805 | |
| | 91,815 | | | ServiceNow, Inc.* | | | 7,306,472 | | | | 10,791,017 | |
| | | | | | | | | | | | |
| | |
| | Total Information Technology | | | 203,375,968 | | | | 277,966,470 | |
| | | | This sector is 36.7% above your Fund’s cost. | |
| | |
| | Materials | | | | | | | | |
| | | | Commodity Chemicals - 0.3% | | | | | |
| | 53,305 | | | AdvanSix, Inc.* | | | 1,590,388 | | | | 2,118,874 | |
| | | | | | | | | | | | |
| Shares | | | | | Cost | | | Value | |
| | | | Specialty Chemicals - 2.1% | | | | | |
| | 119,065 | | | Albemarle Corp. | | $ | 10,828,703 | | | $ | 16,229,750 | |
| | | | | | | | | | | | |
| | Total Materials | | | 12,419,091 | | | | 18,348,624 | |
| | | | This sector is 47.7% above your Fund’s cost. | |
| | Real Estate | | | | | | | | |
| | | | Specialized REITs - 1.1% | | | | | |
| | 167,410 | | | Potlatch Corp. | | | 7,307,519 | | | | 8,537,910 | |
| | | | This sector is 16.8% above your Fund’s cost. | |
| | |
| | Telecommunication Services | | | | | | | | |
| | | | Wireless Telecommunication Services - 1.9% | |
| | 238,395 | | | T-Mobile US, Inc.* | | | 14,941,354 | | | | 14,699,436 | |
| | | | This sector is 1.6% below your Fund’s cost. | | | | | |
| | |
| | Total Common Stocks | | | 597,163,213 | | | | 744,308,360 | |
| | | |
Principal
Amount | | | | | | | | | |
| | Short-Term Investments - 7.0% | | | | | | | | |
| | Repurchase Agreements - 4.3%2 | | | | | | | | |
| | $7,906,555 | | | Citigroup Global Markets, Inc., dated 09/29/17, due 10/02/17, 1.080% total to be received $7,907,267 (collateralized by various U.S. Government Agency Obligations, 1.898% - 9.000%, 12/01/17 - 06/01/51, totaling $8,064,686) | | | 7,906,555 | | | $ | 7,906,555 | |
| | 7,906,555 | | | Daiwa Capital Markets America, dated 09/29/17, due 10/02/17, 1.070% total to be received $7,907,260 (collateralized by various U.S. Government Agency Obligations, 0.000% - 6.500%, 10/12/17 - 12/01/51, totaling $8,064,686) | | | 7,906,555 | | | | 7,906,555 | |
| | 7,906,555 | | | Nomura Securities International, Inc., dated 09/29/17, due 10/02/17, 1.080% total to be received $7,907,267 (collateralized by various U.S. Government Agency Obligations, 0.000% - 9.000%, 11/15/17 - 08/20/67, totaling $8,064,686) | | | 7,906,555 | | | | 7,906,555 | |
| | 3,415,935 | | | Royal Bank of Scotland PLC, dated 09/29/17, due 10/02/17, 1.050% total to be received $3,416,234 (collateralized by various U.S. Government Agency Obligations, 0.488% - 3.500%, 10/31/17 - 11/15/42, totaling $3,484,264) | | | 3,415,935 | | | | 3,415,935 | |
|
The accompanying notes are an integral part of these financial statements. 9 |
AMG Managers Brandywine Fund
Schedule of Portfolio Investments (continued)
| | | | | | | | | | | | |
Principal
Amount | | | | | Cost | | | Value | |
| | $6,154,086 | | | State of Wisconsin Investment Board, dated 09/29/17, due 10/02/17, 1.200% total to be received $6,154,701 (collateralized by various U.S. Government Agency Obligations, 0.125% - 3.875%, 01/15/19 - 02/15/46, totaling $6,288,445) | | $ | 6,154,086 | | | $ | 6,154,086 | |
| | | | | | | | | | | | |
| | Total Repurchase Agreements | | | 33,289,686 | | | | 33,289,686 | |
| | | | | | | | | | | | |
Shares | | | | | Cost | | | Value | |
| | Other Investment Companies - 2.7% | | | | | |
| | 20,920,437 | | | Dreyfus Government Cash Management Fund, Institutional Class Shares, 0.92%3 | | $ | 20,920,437 | | | $ | 20,920,437 | |
| | | | | | | | | | | | |
| | Total Short-Term Investments | | | 54,210,123 | | | | 54,210,123 | |
| | Total Investments - 103.5% | | $ | 651,373,336 | | | | 798,518,483 | |
| | | | | | | | | | | | |
| | Other Assets, less Liabilities - (3.5)% | | | | | | | (27,044,537 | ) |
| | Total Net Assets - 100.0% | | | | | | $ | 771,473,946 | |
| | | | | | | | | | | | |
|
The accompanying notes are an integral part of these financial statements. 10 |
AMG Managers Brandywine Blue Fund
Portfolio Manager’s Comments (unaudited)
AMG Managers Brandywine Blue Fund (“Brandywine Blue”) employs an investment strategy that relies on bottom-up research to identify companies with above-average earnings growth potential. The strategy is designed to capitalize on the long-running relationship between earnings performance and stock prices.
The Fund’s strategy was effective in the 12 months through September, delivering positive absolute returns in all four of the year’s quarters as the second longest bull market on record continued higher. The environment was positive, with favorable conditions for a company-by-company investment approach. Brandywine Blue grew 23.92 percent in its fiscal year ended September 30, 2017.
The fiscal year began during the final months of the presidential election cycle, with the outcome dictating the market’s mood in the three months through December 2016. Investors applauded the election outcome because it brought to office a president who ran on a pro-business platform. Companies from the financial and industrial sectors fared particularly well amid high hopes for looser regulations in the financial sector and major infrastructure spending.
Results of the election-driven enthusiasm, which reflected a willingness among investors to reward companies for benefits they had yet to realize, were mixed for Brandywine Blue. The Fund’s financial holdings performed well. At the same time, the Fund’s relatively low exposure to the industrial sector limited upside. Brandywine Blue posted a gain during the December quarter.
Continued optimism for business-friendly actions from the White House kept sentiment mainly positive in the March quarter of 2017. The new administration’s pro-growth stance on taxation, deregulation and infrastructure spending remained a major theme. Trends in consumer confidence, employment and earnings aided the mood.
Technology holdings, particularly semiconductor-related companies, were an outsized positive influence on March-quarter results. Consumer discretionary holdings also contributed to performance thanks in part to holdings whose businesses are primarily online. Energy holdings weighed on results as a drop in oil prices led investors to question the sector’s near-term profit potential. Brandywine Blue generated its highest quarterly return in the fiscal year during the quarter.
The market’s climb continued in the three months through June, during which political uncertainty dominated the news cycle and the Federal Reserve initiated another rate hike in a series the central bank initiated in December. Sentiment remained positive despite the challenges.
Technology holdings again drove performance, with software makers leading the way. Health care holdings also contributed to performance as Congressional discord lowered the likelihood of near-term health care reform. Energy holdings detracted from results as oil prices continued to sag. Brandywine Blue rose again in the June quarter.
The final three months of the fiscal year included a new lineup of threats to market calm, including
test missile launches from North Korea, damaging hurricanes in the Caribbean and southern United States, and an announcement from the Federal Reserve that it would begin reversing its post-crisis stimulus. Still, the market remained upbeat.
Technology and consumer-related holdings were again standout performers. Nine out of nine economic sectors represented in the Fund’s portfolio gained ground during the period.
For the entire fiscal year, technology holdings, which comprised the largest position throughout the period, contributed the most to Brandywine Blue’s performance, accounting for more than half of total return. Consumer discretionary holdings, the Fund’s second largest position, were the next most significant contributors. The two sectors combined generated roughly three-fourths of the fiscal year return.
Energy and telecommunications services, two of the smallest positions in the Fund, were the only sectors to decline during the fiscal year. Energy weighed the most on performance. Oil price volatility in the spring and summer made investors wary regarding the sector’s profit outlook.
This commentary reflects the viewpoints of Friess Associates, LLC as of September 30, 2017 and is not intended as a forecast or guarantee of future results.
AMG Managers Brandywine Blue Fund
Portfolio Manager’s Comments (continued)
CUMULATIVE TOTAL RETURN PERFORMANCE
AMG Managers Brandywine Blue Fund’s cumulative total return is based on the daily change in net asset value (NAV), and assumes that all dividends and distributions were reinvested. This graph compares a hypothetical $10,000 investment made in the Fund’s Class I shares on September 30, 2007 to a $10,000 investment made in the Russell 1000® Growth Index, Russell 1000® Index and S&P 500 Index for the same time period. The graph and table do not reflect the deduction of taxes that a shareholder would pay on a Fund distribution or redemption of shares. The listed returns for the Fund are net of expenses and the returns for the index exclude expenses.
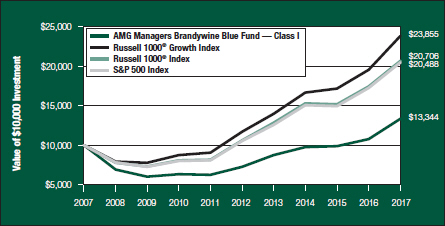
The table below shows the average annual total returns for the AMG Managers Brandywine Blue Fund and the Russell 1000® Growth Index, Russell 1000® Index and S&P 500 Index for the same time periods ended September 30, 2017.
| | | | | | | | | | | | |
| Average Annual Total Returns1 | | One
Year | | | Five
Years | | | Ten
Years | |
AMG Managers Brandywine Blue Fund2,3,4,5,6,7 | | | 23.92 | % | | | 12.87 | % | | | 2.93 | % |
Russell 1000® Growth Index8,11 | | | 21.94 | % | | | 15.26 | % | | | 9.08 | % |
Russell 1000® Index9,11 | | | 18.54 | % | | | 14.27 | % | | | 7.55 | % |
S&P 500 Index10,11 | | | 18.61 | % | | | 14.22 | % | | | 7.44 | % |
The performance data shown represents past performance. Past performance is not a guarantee of future results. Current performance may be lower or higher than the performance data quoted. The investment return and principal value of an investment will fluctuate so that an investor’s shares, when redeemed, may be worth more or less than their original cost.
Investors should carefully consider the Fund’s investment objectives, risks, charges, and expenses before investing. For performance information through the most recent month end, current net asset values per share for the Fund and other information, please call 800.835.3879 or visit our website at www.amgfunds.com for a free prospectus. Read it carefully before investing or sending money.
Distributed by AMG Distributors, Inc., member FINRA/SIPC.
| 1 | Total return equals income yield plus share price change and assumes reinvestment of all dividends and capital gain distributions. Returns are net of fees and may reflect offsets of Fund expenses as described in the prospectus. No adjustment has been made for taxes payable by shareholders on their reinvested dividends and capital gain distributions. |
| | Returns for periods greater than one year are annualized. The listed returns on the Fund are net of expenses and based on the published NAV as of September 30, 2017. All returns are in U.S. dollars ($). |
| 2 | The Fund inception dates and returns for all periods prior to October 1, 2013, reflect performance of the Predecessor Fund, Brandywine Blue Fund, and was managed by Friess Associates, LLC with the same investment objective and substantially similar investment policies. |
| 3 | Active and frequent trading of a fund may result in higher transaction costs and increased tax liability. |
| 4 | A greater percentage of the Fund’s holdings may be focused in a smaller number of securities which may place the Fund at greater risk than a more diversified fund. |
| 5 | Investments in international securities are subject to certain risks of overseas investing including currency fluctuations and changes in political and economic conditions, which could result in significant market fluctuations. |
| 6 | The Fund is subject to risks associated with investments in mid-capitalization companies such as greater price volatility, lower trading volume and less liquidity then the stocks of larger, more established companies. |
| 7 | Effective February 27, 2017, the Fund’s Class S shares were renamed Class I. |
| 8 | The Russell 1000® Growth Index is a market capitalization weighted index that measures the performance of those Russell 1000® companies with higher price-to-book ratios and higher forecasted growth values. |
| 9 | The Russell 1000® Index measures the performance of approximately 1,000 of the largest securities based on a combination of their market cap and current index membership. The Russell 1000® Index represents approximately 92% of the U.S. market. |
| 10 | The S&P 500 Index is a capitalization-weighted index of 500 stocks. The S&P 500 Index is designed to measure performance of the broad domestic economy through changes in the aggregate market value of 500 stocks representing all major industries. |
| 11 | Unlike the Fund, the indices are unmanaged, are not available for investment and do not incur expenses. |
The Russell Indices are trademarks of the London Stock Exchange Group companies.
The S&P 500 Index is proprietary data of Standard & Poor’s, a division of McGraw-Hill Companies, Inc. All rights reserved.
Not FDIC insured, nor bank guaranteed. May lose value.
AMG Managers Brandywine Blue Fund
Fund Snapshots (unaudited)
September 30, 2017
PORTFOLIO BREAKDOWN
| | | | | | | | | | | | | | | | |
Industry (Top Ten) | | AMG
Managers
Brandywine
Blue Fund* | | | Russell
1000®
Growth
Index | | | Russell
1000®
Index | | | S&P
500
Index | |
Semiconductors | | | 12.0 | % | | | 4.0 | % | | | 3.2 | % | | | 3.3 | % |
Internet & Direct Marketing Retail | | | 8.2 | % | | | 4.8 | % | | | 2.4 | % | | | 2.7 | % |
Home Entertainment Software | | | 6.5 | % | | | 0.8 | % | | | 0.4 | % | | | 0.4 | % |
Systems Software | | | 6.5 | % | | | 5.5 | % | | | 3.3 | % | | | 3.6 | % |
Data Processing & Outsourced Services | | | 6.3 | % | | | 5.3 | % | | | 2.7 | % | | | 2.6 | % |
Internet Software & Services | | | 4.9 | % | | | 8.5 | % | | | 4.5 | % | | | 4.8 | % |
Life Sciences Tools & Services | | | 4.8 | % | | | 1.0 | % | | | 0.8 | % | | | 0.8 | % |
General Merchandise Stores | | | 3.4 | % | | | 0.2 | % | | | 0.3 | % | | | 0.3 | % |
Wireless Telecommunication Services | | | 2.9 | % | | | 0.1 | % | | | 0.1 | % | | | 0.0 | % |
Biotechnology | | | 2.7 | % | | | 5.2 | % | | | 3.2 | % | | | 3.2 | % |
Other Common Stock | | | 37.3 | % | | | 64.6 | % | | | 79.1 | % | | | 78.3 | % |
Cash & Cash Equivalents† | | | 4.5 | % | | | 0.0 | % | | | 0.0 | % | | | 0.0 | % |
| * | As a percentage of net assets. |
| † | Includes Other Assets and Liabilities. |
TOP TEN HOLDINGS
| | | | | | | | |
Security Name | | % of
Net Assets | | |
% Change
from
Book Cost | |
Microsoft Corp.** | | | 4.1 | % | | | 16.5 | % |
Dollar Tree, Inc. | | | 3.4 | % | | | 20.7 | % |
Broadcom, Ltd.** | | | 2.9 | % | | | 194.9 | % |
Amazon.com, Inc. | | | 2.9 | % | | | 61.2 | % |
T-Mobile US, Inc. | | | 2.9 | % | | | (1.9 | )% |
Netflix, Inc.** | | | 2.8 | % | | | 70.9 | % |
Alphabet, Inc., Class A** | | | 2.7 | % | | | 41.5 | % |
Alexion Pharmaceuticals, Inc.** | | | 2.7 | % | | | 38.0 | % |
Arista Networks, Inc.** | | | 2.7 | % | | | 103.0 | % |
Illumina, Inc. | | | 2.5 | % | | | 17.9 | % |
| | | | | | | | |
Top Ten as a Group | | | 29.6 | % | | | | |
| | | | | | | | |
| ** | Also Top Ten Holding as of June 30, 2017. |
PORTFOLIO MARKET CAPITALIZATION
ESTIMATED EARNINGS GROWTH RATE
OF THE FUND’S INVESTMENTS
Forecasted Increase in Earnings Per Share 2017 vs 2016

Source: Consensus estimates from FactSet Research Systems Inc.
This is not a forecast of the Fund’s future performance. Earnings growth for a Fund holding does not guarantee a corresponding increase in the market value of the holding or the Fund.
Because a fund’s strategy may result in multiple investments in particular sectors of the economy, its performance may depend on the performance of those sectors and may fluctuate more widely than investments diversified across more sectors. For additional information on these and other risk considerations, please see the Fund’s prospectus.
Any sectors, industries, or securities discussed should not be perceived as investment recommendations. Mention of a specific security should not be considered a recommendation to buy or solicitation to sell that security. Specific securities mentioned in this report may have been sold from the Fund’s portfolio of investments by the time you receive this report.
AMG Managers Brandywine Blue Fund
Roses & Thorns (unaudited)
Quarter Ending September 30, 2017
| | | | | | | | | | |
$ Gain
(in millions) | | | % Gain | | | Biggest $ Winners | | Reason for Move |
| | | | | | | | |
| | | | | | | | NVIDIA Corp. (NVDA) |
| $ | 1.1 | | | | 17.3 | % | | The maker of computer graphics processors grew July-quarter earnings 130 percent, exceeding the consensus estimate. Revenue increased 56 percent. Chipset sales for gaming applications and crypto currency were strong. NVIDIA also raised its September-quarter revenue forecast. |
| | |
| | | | | | | | Micron Technology Inc. (MU) |
| $ | 1.0 | | | | 31.6 | % | | The semiconductor and memory solutions developer reported August-quarter earnings of $2.02 per share, up from a year-ago loss and ahead of the consensus estimate. Sales rose 91 percent amid better DRAM pricing and NAND volumes. The company increased revenue and profit-margin guidance for its fiscal year ending August 2018. |
| | |
| | | | | | | | Dollar Tree Inc. (DLTR) |
| $ | 1.0 | | | | 20.7 | % | | The discount variety store operator grew July-quarter earnings 24 percent, topping the consensus estimate. At 3.9 percent, Dollar Tree enjoyed better-than- expected growth in same-store sales. Improved traffic at the company’s Family Dollar unit was a notable contributor. |
| | |
| | | | | | | | Arista Networks Inc. (ANET) |
| $ | 1.0 | | | | 26.6 | % | | The cloud networking solutions provider grew June-quarter earnings 81 percent, topping the consensus estimate. Revenue increased 51 percent, with new customer additions, new products and greater international penetration contributing to growth. Results showed Arista benefiting from the rapid adoption of its 100G equipment used in data centers. |
| | |
| | | | | | | | Albemarle Corp. (ALB) |
| $ | 0.9 | | | | 29.2 | % | | The global developer, manufacturer and marketer of highly engineered specialty chemicals grew June-quarter earnings 21 percent, exceeding the consensus estimate. Albemarle reaffirmed 2017 earnings guidance and noted that new lithium production capacity it plans to add this year and next should support profit margins and earnings growth. |
| | | |
$ Loss
(in millions) | | | % Loss | | | Biggest $ Losers | | Reason for Move |
| | | | | | | | |
| | | | | | | | Ulta Beauty Inc. (ULTA) |
| $ | 0.7 | | | | 21.3 | % | | The beauty supply retailer, which offers cosmetics, fragrance, skin and hair care products, and salon services, grew July-quarter earnings 28 percent, exceeding the consensus estimate. Ulta eliminated previously offered promotions, resulting in increased profit margins and stronger same store sales. Shares came under pressure as Amazon increased its presence in the beauty space. |
| | |
| | | | | | | | Hologic Inc. (HOLX) |
| $ | 0.4 | | | | 12.6 | % | | The maker of diagnostic products, medical imaging systems and surgical supplies reported June-quarter earnings per share of $0.50, exceeding the consensus estimate. The company lowered revenue guidance for the year due to slower-than-expected organic growth. We sold Hologic to fund a new opportunity with better visibility. |
| | |
| | | | | | | | Delta Air Lines Inc. (DAL) |
| $ | 0.4 | | | | 10.4 | % | | The passenger and air cargo transporter grew June-quarter earnings 12 percent. Shares traded lower in the quarter on investor concerns about rising labor and fuel cost pressures. |
| | |
| | | | | | | | Medtronic PLC (MDT) |
| $ | 0.4 | | | | 12.4 | % | | The manufacturer of implantable cardiac pacemakers and external defibrillators grew July-quarter earnings 13 percent, topping the consensus estimate. Shares traded lower as revenue growth was less than expected due to diabetes sensor manufacturing delays. |
| | |
| | | | | | | | Lowe’s Cos. Inc. (LOW) |
| $ | 0.2 | | | | 7.1 | % | | The home improvement product retailer grew July-quarter earnings 15 percent. Same store sales grew 4.5 percent. Shares declined due to investor disappointment with profit-margin contraction and reduced earnings guidance. We sold Lowe’s to fund a new opportunity with better visibility. |
All gains/losses are calculated on an average cost basis from June 30, 2017 through September 30, 2017.
This commentary reflects the viewpoints of Friess Associates, LLC as of September 30, 2017 and is not intended as a forecast or guarantee of future results.
AMG Managers Brandywine Blue Fund
Schedule of Portfolio Investments
September 30, 2017
| | | | | | | | | | | | |
| Shares | | | | | Cost | | | Value | |
| | Common Stocks - 95.5% | | | | | | | | |
| | Consumer Discretionary | | | | | |
| | | | Apparel Retail - 2.0% | | | | | |
| | 47,855 | | | The TJX Cos., Inc. | | $ | 3,344,675 | | | $ | 3,528,349 | |
| | | | Apparel, Accessories & Luxury Goods -1.6% | | | | | |
| | 21,730 | | | PVH Corp. | | | 2,738,997 | | | | 2,739,284 | |
| | | | Cable & Satellite - 2.1% | | | | | |
| | 9,822 | | | Charter Communications, Inc., Class A* | | | 2,358,747 | | | | 3,569,511 | |
| | | | General Merchandise Stores - 3.4% | | | | | |
| | 68,035 | | | Dollar Tree, Inc.* | | | 4,894,324 | | | | 5,906,799 | |
| | | | Internet & Direct Marketing Retail -8.2% | | | | | |
| | 5,243 | | | Amazon.com, Inc.* | | | 3,126,233 | | | | 5,040,358 | |
| | 26,980 | | | Netflix, Inc.* | | | 2,862,795 | | | | 4,892,823 | |
| | 2,316 | | | The Priceline Group, Inc.* | | | 3,495,338 | | | | 4,240,179 | |
| | | | Movies & Entertainment - 2.1% | | | | | |
| | 94,285 | | | Liberty Media Corp.-Liberty Formula One, Class C*,1 | | | 3,354,439 | | | | 3,591,316 | |
| | | | Specialty Stores - 1.5% | | | | | |
| | 11,409 | | | Ulta Beauty, Inc.* | | | 2,841,090 | | | | 2,579,119 | |
| | | | | | | | | | | | |
| | Total Consumer Discretionary | | | 29,016,638 | | | | 36,087,738 | |
| | | | This sector is 24.4% above your Fund’s cost. | | | | | |
| | |
| | Consumer Staples | | | | | | | | |
| | | | Personal Products - 2.1% | | | | | |
| | 34,000 | | | The Estee Lauder Cos., Inc., Class A | | | 2,915,561 | | | | 3,666,560 | |
| | | | This sector is 25.8% above your Fund’s cost. | | | | | |
| | |
| | Energy | | | | | | | | |
| | | | Oil & Gas Refining & Marketing - 2.2% | | | | | |
| | 104,000 | | | HollyFrontier Corp. | | | 3,344,643 | | | | 3,740,880 | |
| | | | This sector is 11.8% above your Fund’s cost. | | | | | |
| | |
| | Financials | | | | | | | | |
| | | | Financial Exchanges & Data - 2.2% | | | | | |
| | 27,025 | | | CME Group, Inc. | | | 2,538,801 | | | | 3,666,752 | |
| | | | This sector is 44.4% above your Fund’s cost. | | | | | |
| | |
| | Health Care | | | | | | | | |
| | | | Biotechnology - 2.7% | | | | | |
| | 32,995 | | | Alexion Pharmaceuticals, Inc.* | | | 3,354,334 | | | | 4,628,869 | |
| | | | Health Care Equipment - 1.5% | | | | | |
| | 34,100 | | | Medtronic PLC | | | 2,810,518 | | | | 2,651,957 | |
| | | | Life Sciences Tools & Services - 4.8% | | | | | |
| | 21,920 | | | Illumina, Inc.* | | | 3,702,494 | | | | 4,366,464 | |
| | 20,500 | | | Thermo Fisher Scientific, Inc. | | | 2,685,695 | | | | 3,878,600 | |
| | | | | | | | | | | | |
| Shares | | | | | Cost | | | Value | |
| | | | Managed Health Care - 2.1% | | | | | |
| | 19,000 | | | Cigna Corp. | | $ | 3,356,732 | | | $ | 3,551,860 | |
| | | | Pharmaceuticals - 2.2% | | | | | |
| | 60,060 | | | Zoetis, Inc. | | | 3,229,833 | | | | 3,829,426 | |
| | | | | | | | | | | | |
| | Total Health Care | | | 19,139,606 | | | | 22,907,176 | |
| | | | This sector is 19.7% above your Fund’s cost. | | | | | |
| | |
| | Industrials | | | | | | | | |
| | | | Airlines - 2.0% | | | | | |
| | 70,500 | | | Delta Air Lines, Inc. | | | 3,660,463 | | | | 3,399,510 | |
| | | | Construction & Engineering - 2.0% | | | | | |
| | 94,455 | | | Quanta Services, Inc.* | | | 3,397,978 | | | | 3,529,783 | |
| | | | Trading Companies & Distributors -2.4% | | | | | |
| | 29,855 | | | United Rentals, Inc.* | | | 3,643,882 | | | | 4,142,083 | |
| | | | | | | | | | | | |
| | Total Industrials | | | 10,702,323 | | | | 11,071,376 | |
| | | | This sector is 3.4% above your Fund’s cost. | | | | | |
| | |
| | Information Technology | | | | | | | | |
| | | | Application Software - 2.2% | | | | | |
| | 41,060 | | | Salesforce.com, Inc.* | | | 3,187,380 | | | | 3,835,825 | |
| | | | Communications Equipment - 2.7% | | | | | |
| | 24,250 | | | Arista Networks, Inc.* | | | 2,265,468 | | | | 4,598,042 | |
| | | | Data Processing & Outsourced Services - 6.3% | | | | | |
| | 37,520 | | | Global Payments, Inc. | | | 2,696,027 | | | | 3,565,526 | |
| | 51,000 | | | Vantiv, Inc., Class A*,1 | | | 2,339,257 | | | | 3,593,970 | |
| | 34,550 | | | Visa, Inc., Class A | | | 2,485,668 | | | | 3,636,042 | |
| | | | Home Entertainment Software - 6.5% | | | | | |
| | 61,045 | | | Activision Blizzard, Inc. | | | 3,265,429 | | | | 3,938,013 | |
| | 35,315 | | | Electronic Arts, Inc.* | | | 3,657,040 | | | | 4,169,289 | |
| | 30,800 | | | Take-Two Interactive Software, Inc.* | | | 2,911,926 | | | | 3,148,684 | |
| | | | Internet Software & Services - 4.9% | | | | | |
| | 4,807 | | | Alphabet, Inc., Class A* | | | 3,308,126 | | | | 4,680,672 | |
| | 21,933 | | | Facebook, Inc., Class A* | | | 1,476,755 | | | | 3,747,692 | |
| | | | Semiconductors - 12.0% | | | | | |
| | 320,170 | | | Advanced Micro Devices, Inc.*,1 | | | 3,716,528 | | | | 4,082,167 | |
| | 20,865 | | | Broadcom, Ltd. | | | 1,716,293 | | | | 5,060,597 | |
| | 109,460 | | | Micron Technology, Inc.* | | | 3,543,029 | | | | 4,305,062 | |
| | 20,507 | | | NVIDIA Corp. | | | 1,776,598 | | | | 3,666,036 | |
| | 50,145 | | | Xilinx, Inc. | | | 3,246,664 | | | | 3,551,770 | |
| | | | Systems Software - 6.5% | | | | | |
| | 95,800 | | | Microsoft Corp. | | | 6,123,044 | | | | 7,136,142 | |
| | 34,800 | | | ServiceNow, Inc.* | | | 2,867,874 | | | | 4,090,044 | |
|
The accompanying notes are an integral part of these financial statements. 15 |
AMG Managers Brandywine Blue Fund
Schedule of Portfolio Investments (continued)
| | | | | | | | | | | | |
Shares | | | | | Cost | | | Value | |
| | Information Technology (continued) | | | | | |
| | | | Technology Hardware, Storage & Peripherals - 2.0% | | | | | |
| | 40,755 | | | Western Digital Corp. | | $ | 2,930,760 | | | $ | 3,521,232 | |
| | | | | | | | | | | | |
| | Total Information Technology | | | 53,513,866 | | | | 74,326,805 | |
| | | | This sector is 38.9% above your Fund’s cost. | | | | | |
| | |
| | Materials | | | | | | | | |
| | | | Specialty Chemicals - 2.4% | | | | | |
| | 30,695 | | | Albemarle Corp. | | | 2,790,726 | | | | 4,184,035 | |
| | | | This sector is 49.9% above your Fund’s cost. | | | | | |
| |
| | Telecommunication Services | | | | | |
| | | | Wireless Telecommunication Services - 2.9% | | | | | |
| | 80,640 | | | T-Mobile US, Inc.* | | | 5,066,721 | | | | 4,972,262 | |
| | | | This sector is 1.9% below your Fund’s cost. | | | | | |
| | |
| | Total Common Stocks | | | 129,028,885 | | | | 164,623,584 | |
| | | |
Principal
Amount | | | | | | | | | |
| | Short-Term Investments - 9.0% | | | | | |
| | Repurchase Agreements - 4.2%2 | | | | | |
| | $359,603 | | | Citibank N.A., dated 09/29/17, due 10/02/17, 1.060% total to be received $359,635 (collateralized by various U.S. Government Agency Obligations, 0.000% - 8.000%, 10/05/17 - 05/15/46, totaling $366,795) | | | 359,603 | | | $ | 359,603 | |
| | 1,709,102 | | | Daiwa Capital Markets America, dated 09/29/17, due 10/02/17, 1.070% total to be received $1,709,254 (collateralized by various U.S. Government Agency Obligations, 0.000% - 6.500%, 10/12/17 - 12/01/51, totaling $1,743,284) | | | 1,709,102 | | | | 1,709,102 | |
| | | | | | | | | | | | |
Principal
Amount | | | | | Cost | | | Value | |
| | $1,709,102 | | | Merrill Lynch Pierce Fenner & Smith, Inc., dated 09/29/17, due 10/02/17, 1.070% total to be received $1,709,254 (collateralized by various U.S. Government Agency Obligations, 1.830% - 4.500%, 01/01/26 - 07/15/52, totaling $1,743,284) | | $ | 1,709,102 | | | $ | 1,709,102 | |
| | 1,709,102 | | | Nomura Securities International, Inc., dated 09/29/17, due 10/02/17, 1.080% total to be received $1,709,256 (collateralized by various U.S. Government Agency Obligations, 0.000% - 9.000%, 11/15/17 - 08/20/67, totaling $1,743,284) | | | 1,709,102 | | | | 1,709,102 | |
| | 1,709,102 | | | RBC Dominion Securities, Inc., dated 09/29/17, due 10/02/17, 1.050% total to be received $1,709,252 (collateralized by various U.S. Government Agency Obligations, 0.125% - 7.000%, 02/08/18 - 08/20/47, totaling $1,743,284) | | | 1,709,102 | | | | 1,709,102 | |
| | | | | | | | | | | | |
| | Total Repurchase Agreements | | | 7,196,011 | | | | 7,196,011 | |
| | | |
| Shares | | | | | | | | | |
| | Other Investment Companies - 4.8% | | | | | |
| | 8,396,192 | | | Dreyfus Government Cash Management Fund, Institutional Class Shares, 0.92%3 | | | 8,396,192 | | | | 8,396,192 | |
| | | | | | | | | | | | |
| | Total Short-Term Investments | | | 15,592,203 | | | | 15,592,203 | |
| | Total Investments - 104.5% | | $ | 144,621,088 | | | | 180,215,787 | |
| | | | | | | | | | | | |
| | Other Assets, less Liabilities - (4.5)% | | | | | | | (7,762,011 | ) |
| | Total Net Assets - 100.0% | | | | | | $ | 172,453,776 | |
| | | | | | | | | | | | |
|
The accompanying notes are an integral part of these financial statements. 16 |
Notes to Schedule of Portfolio Investments (unaudited)
The following footnotes should be read in conjunction with each of the Schedules of Portfolio Investments previously presented in this report.
| * | Non-income producing security. |
| 1 | Some or all of these shares were out on loan to various brokers as of September 30, 2017, amounting to the following: |
| | | | | | | | |
| | | Market Value | | | % of Net Assets | |
AMG Managers Brandywine Fund | | $ | 32,862,514 | | | | 4.3 | % |
AMG Managers Brandywine Blue Fund | | | 7,023,163 | | | | 4.1 | % |
| 2 | Collateral received from brokers for securities lending was invested in these joint repurchase agreements. |
| 3 | Yield shown represents the September 30, 2017, seven-day average yield, which refers to the sum of the previous seven days’ dividends paid, expressed as an annual percentage. |
The following tables summarize the inputs used to value the Funds’ investments by the fair value hierarchy levels as of September 30, 2017:
(See Note 1(a) in the Notes to Financial Statements.)
| | | | | | | | | | | | | | | | |
| | | Level 1 | | | Level 2 | | | Level 3 | | | Total | |
AMG Managers Brandywine Fund | | | | | | | | | | | | | | | | |
Investments in Securities | | | | | | | | | | | | | | | | |
Common Stocks† | | $ | 744,308,360 | | | | — | | | | — | | | $ | 744,308,360 | |
Short-Term Investments | | | | | | | | | | | | | | | | |
Repurchase Agreements | | | — | | | $ | 33,289,686 | | | | — | | | | 33,289,686 | |
Other Investment Companies | | | 20,920,437 | | | | — | | | | — | | | | 20,920,437 | |
| | | | | | | | | | | | | | | | |
Total Investments in Securities | | $ | 765,228,797 | | | $ | 33,289,686 | | | | — | | | $ | 798,518,483 | |
| | | | | | | | | | | | | | | | |
| | | | |
| | | Level 1 | | | Level 2 | | | Level 3 | | | Total | |
AMG Managers Brandywine Blue Fund | | | | | | | | | | | | | | | | |
Investments in Securities | | | | | | | | | | | | | | | | |
Common Stocks† | | $ | 164,623,584 | | | | — | | | | — | | | $ | 164,623,584 | |
Short-Term Investments | | | | | | | | | | | | | | | | |
Repurchase Agreements | | | — | | | $ | 7,196,011 | | | | — | | | | 7,196,011 | |
Other Investment Companies | | | 8,396,192 | | | | — | | | | — | | | | 8,396,192 | |
| | | | | | | | | | | | | | | | |
Total Investments in Securities | | $ | 173,019,776 | | | $ | 7,196,011 | | | | — | | | $ | 180,215,787 | |
| | | | | | | | | | | | | | | | |
| † | All common stocks held in the Funds are Level 1 securities. For a detailed breakout of common stocks by major industry classification, please refer to the respective Schedule of Portfolio Investments. |
As of September 30, 2017, the Funds had no transfers between levels from the beginning of the reporting period.
INVESTMENT DEFINITIONS AND ABBREVIATIONS:
ADR: ADR after the name of a holding stands for American Depositary Receipt, representing ownership of foreign securities on deposit with a domestic custodian bank. The value of the ADR securities is determined or significantly influenced by trading on exchanges not located in the United States or Canada. Sponsored ADRs are initiated by the underlying foreign company.
|
The accompanying notes are an integral part of these financial statements. 17 |
Statement of Assets and Liabilities
September 30, 2017
| | | | | | | | |
| | | AMG Managers
Brandywine
Fund# | | | AMG Managers
Brandywine
Blue Fund# | |
Assets: | | | | | | | | |
Investments at value* (including securities on loan valued at $32,862,514 and $7,023,163, respectively) | | $ | 798,518,483 | | | $ | 180,215,787 | |
Receivable for investments sold | | | 14,911,426 | | | | — | |
Dividend, interest and other receivables | | | 274,718 | | | | 51,914 | |
Receivable for Fund shares sold | | | 682 | | | | 5,094 | |
Receivable from affiliate | | | 2,489 | | | | 565 | |
Prepaid expenses | | | 12,327 | | | | 8,674 | |
Total assets | | | 813,720,125 | | | | 180,282,034 | |
Liabilities: | | | | | | | | |
Payable upon return of securities loaned | | | 33,289,686 | | | | 7,196,011 | |
Payable for investments purchased | | | 7,633,676 | | | | 300,679 | |
Payable for Fund shares repurchased | | | 516,125 | | | | 104,896 | |
Accrued expenses: | | | | | | | | |
Investment advisory and management fees | | | 547,647 | | | | 123,808 | |
Administrative fees | | | 93,349 | | | | 21,104 | |
Shareholder servicing fees | | | 9,401 | | | | — | |
Trustee fees and expenses | | | 8,138 | | | | 1,832 | |
Other | | | 148,157 | | | | 79,928 | |
Total liabilities | | | 42,246,179 | | | | 7,828,258 | |
| | |
Net Assets | | $ | 771,473,946 | | | $ | 172,453,776 | |
Net Assets Represent: | | | | | | | | |
Paid-in capital | | $ | 1,089,118,228 | | | $ | 333,311,797 | |
Accumulated net investment loss | | | (2,622,386 | ) | | | (451,815 | ) |
Accumulated net realized loss from investments | | | (462,167,043 | ) | | | (196,000,905 | ) |
Net unrealized appreciation of investments | | | 147,145,147 | | | | 35,594,699 | |
Net Assets | | $ | 771,473,946 | | | $ | 172,453,776 | |
Shares outstanding - Class I | | | 17,344,485 | | | | 3,774,620 | |
Net asset value, offering and redemption price per share - Class I | | $ | 44.48 | | | $ | 45.69 | |
* Investments at cost | | $ | 651,373,336 | | | $ | 144,621,088 | |
| # | Effective February 27, 2017, the Funds’ shares were renamed as described in Note 1 of the Notes to the Financial Statements. |
|
The accompanying notes are an integral part of these financial statements. 18 |
Statement of Operations
For the fiscal year ended September 30, 2017
| | | | | | | | |
| | | AMG Managers
Brandywine
Fund# | | | AMG Managers
Brandywine
Blue Fund# | |
Investment Income: | | | | | | | | |
Dividend income | | $ | 4,269,343 | 1 | | $ | 1,361,710 | 1 |
Securities lending income | | | 470,993 | | | | 6,009 | |
Interest income | | | 232,149 | | | | 103,178 | |
Foreign withholding tax | | | (688 | ) | | | (3,240 | ) |
Total investment income | | | 4,971,797 | | | | 1,467,657 | |
Expenses: | | | | | | | | |
Investment advisory and management fees | | | 6,429,107 | | | | 1,415,781 | |
Administrative fees | | | 1,095,871 | | | | 241,327 | |
Shareholder servicing fees - Class I | | | 181,125 | | | | 88,835 | |
Transfer agent fees | | | 108,995 | | | | 15,879 | |
Professional fees | | | 95,595 | | | | 51,208 | |
Reports to shareholders | | | 93,175 | | | | 63,740 | |
Trustee fees and expenses | | | 53,916 | | | | 11,926 | |
Custodian fees | | | 49,431 | | | | 13,565 | |
Registration fees | | | 33,229 | | | | 28,314 | |
Miscellaneous | | | 28,517 | | | | 6,807 | |
Total expenses before offsets | | | 8,168,961 | | | | 1,937,382 | |
Fee waivers | | | (29,223 | ) | | | — | |
Net expenses | | | 8,139,738 | | | | 1,937,382 | |
| | |
Net investment loss | | | (3,167,941 | ) | | | (469,725 | ) |
Net Realized and Unrealized Gain: | | | | | | | | |
Net realized gain on investments | | | 79,635,473 | | | | 19,449,670 | |
Net change in unrealized appreciation/depreciation of investments | | | 50,520,064 | | | | 15,658,514 | |
Net realized and unrealized gain | | | 130,155,537 | | | | 35,108,184 | |
| | |
Net increase in net assets resulting from operations | | $ | 126,987,596 | | | $ | 34,638,459 | |
| # | Effective February 27, 2017, the Funds’ shares were renamed as described in Note 1 of the Notes to the Financial Statements. |
| 1 | Includes non-recurring dividends of $872,011 and $220,511 for AMG Managers Brandywine Fund and AMG Managers Brandywine Blue Fund, respectively. |
|
The accompanying notes are an integral part of these financial statements. 19 |
Statements of Changes in Net Assets
For the fiscal years ended September 30,
| | | | | | | | | | | | | | | | |
| | | AMG Managers
Brandywine Fund | | | AMG Managers
Brandywine Blue Fund | |
| | | 2017# | | | 2016 | | | 2017# | | | 2016 | |
Increase (Decrease) in Net Assets From Operations: | | | | | | | | | | | | | | | | |
Net investment loss | | $ | (3,167,941 | ) | | $ | (1,739,804 | ) | | $ | (469,725 | ) | | $ | (82,881 | ) |
Net realized gain (loss) on investments | | | 79,635,473 | | | | (9,004,284 | ) | | | 19,449,670 | | | | 931,856 | |
Net change in unrealized appreciation/depreciation of investments | | | 50,520,064 | | | | 67,876,591 | | | | 15,658,514 | | | | 12,712,119 | |
Net increase in net assets resulting from operations | | | 126,987,596 | | | | 57,132,503 | | | | 34,638,459 | | | | 13,561,094 | |
Distributions to Shareholders: | | | | | | | | | | | | | | | | |
From net investment income | | | — | | | | — | | | | — | | | | (403,233 | ) |
Total distributions to shareholders | | | — | | | | — | | | | — | | | | (403,233 | ) |
Capital Share Transactions - Class I: | | | | | | | | | | | | | | | | |
Proceeds from sale of shares | | | 2,793,859 | | | | 2,672,006 | | | | 1,908,164 | | | | 1,687,155 | |
Reinvestment of dividends | | | — | | | | — | | | | — | | | | 373,025 | |
Cost of shares repurchased | | | (79,073,858 | ) | | | (98,222,751 | ) | | | (21,045,597 | ) | | | (27,445,759 | ) |
Net decrease from capital share transactions | | | (76,279,999 | ) | | | (95,550,745 | ) | | | (19,137,433 | ) | | | (25,385,579 | ) |
Total increase (decrease) in net assets | | | 50,707,597 | | | | (38,418,242 | ) | | | 15,501,026 | | | | (12,227,718 | ) |
Net Assets: | | | | | | | | | | | | | | | | |
Beginning of year | | | 720,766,349 | | | | 759,184,591 | | | | 156,952,750 | | | | 169,180,468 | |
End of year | | $ | 771,473,946 | | | $ | 720,766,349 | | | $ | 172,453,776 | | | $ | 156,952,750 | |
End of year accumulated net investment loss | | $ | (2,622,386 | ) | | $ | (1,637,305 | ) | | $ | (451,815 | ) | | $ | (172,678 | ) |
| | | | | | | | | | | | | | | | |
Capital Share Transactions - Class I: | | | | | | | | | | | | | | | | |
Sale of shares | | | 69,268 | | | | 76,221 | | | | 47,038 | | | | 48,842 | |
Reinvested shares from dividends | | | — | | | | — | | | | — | | | | 10,473 | |
Shares repurchased | | | (1,984,696 | ) | | | (2,795,333 | ) | | | (529,513 | ) | | | (785,787 | ) |
Net decrease in shares | | | (1,915,428 | ) | | | (2,719,112 | ) | | | (482,475 | ) | | | (726,472 | ) |
| # | Effective February 27, 2017, the Funds’ shares were renamed as described in Note 1 of the Notes to the Financial Statements. |
|
The accompanying notes are an integral part of these financial statements. 20 |
AMG Managers Brandywine Fund
Financial Highlights
For a share outstanding throughout each fiscal year
| | | | | | | | | | | | | | | | | | | | |
| | | For the fiscal years ended September 30, | |
| Class I | | 2017# | | | 2016 | | | 2015 | | | 20145 | | | 2013 | |
Net Asset Value, Beginning of Year | | $ | 37.42 | | | $ | 34.54 | | | $ | 33.25 | | | $ | 28.75 | | | $ | 24.62 | |
Income (loss) from Investment Operations: | | | | | | | | | | | | | | | | | | | | |
Net investment income (loss)1 | | | (0.17 | )2 | | | (0.08 | )3 | | | 0.04 | 4 | | | (0.12 | ) | | | (0.03 | ) |
Net realized and unrealized gain on investments | | | 7.23 | | | | 2.96 | | | | 1.25 | | | | 4.62 | | | | 4.16 | |
Total income from investment operations | | | 7.06 | | | | 2.88 | | | | 1.29 | | | | 4.50 | | | | 4.13 | |
Net Asset Value, End of Year | | $ | 44.48 | | | $ | 37.42 | | | $ | 34.54 | | | $ | 33.25 | | | $ | 28.75 | |
Total Return | | | 18.87 | % | | | 8.34 | % | | | 3.88 | % | | | 15.65 | % | | | 16.77 | % |
Ratio of net expenses to average net assets | | | 1.11 | % | | | 1.11 | % | | | 1.10 | % | | | 1.10 | % | | | 1.11 | %6 |
Ratio of gross expenses to average net assets7 | | | 1.12 | % | | | 1.11 | % | | | 1.10 | % | | | 1.10 | % | | | 1.11 | % |
Ratio of net investment income (loss) to average net assets | | | (0.43 | )% | | | (0.24 | )% | | | 0.10 | % | | | (0.37 | )% | | | (0.12 | )% |
Portfolio turnover | | | 187 | % | | | 185 | % | | | 190 | % | | | 219 | % | | | 214 | % |
Net assets at end of year (000’s omitted) | | $ | 771,474 | | | $ | 720,766 | | | $ | 759,185 | | | $ | 799,045 | | | $ | 816,222 | |
| | | | | | | | | | | | | | | | | | | | |
AMG Managers Brandywine Blue Fund
Financial Highlights
For a share outstanding throughout each fiscal year
| | | | | | | | | | | | | | | | | | | | |
| | | For the fiscal years ended September 30, | |
| Class I | | 2017# | | | 2016 | | | 2015 | | | 20145 | | | 2013 | |
Net Asset Value, Beginning of Year | | $ | 36.87 | | | $ | 33.95 | | | $ | 33.51 | | | $ | 30.01 | | | $ | 25.00 | |
Income (loss) from Investment Operations: | | | | | | | | | | | | | | | | | | | | |
Net investment income (loss)1 | | | (0.12 | )2 | | | (0.02 | )3 | | | 0.10 | 4 | | | (0.03 | ) | | | 0.12 | |
Net realized and unrealized gain on investments | | | 8.94 | | | | 3.02 | | | | 0.34 | | | | 3.53 | | | | 4.89 | |
Total income from investment operations | | | 8.82 | | | | 3.00 | | | | 0.44 | | | | 3.50 | | | | 5.01 | |
Less Distributions to Shareholders from: | | | | | | | | | | | | | | | | | | | | |
Net investment income | | | — | | | | (0.08 | ) | | | — | | | | — | | | | — | |
Net Asset Value, End of Year | | $ | 45.69 | | | $ | 36.87 | | | $ | 33.95 | | | $ | 33.51 | | | $ | 30.01 | |
Total Return | | | 23.92 | % | | | 8.86 | % | | | 1.31 | % | | | 11.66 | % | | | 20.04 | % |
Ratio of gross expenses to average net assets | | | 1.20 | % | | | 1.20 | % | | | 1.20 | % | | | 1.19 | % | | | 1.22 | %6 |
Ratio of net investment income (loss) to average net assets | | | (0.29 | )% | | | (0.05 | )% | | | 0.29 | % | | | (0.11 | )% | | | 0.45 | % |
Portfolio turnover | | | 167 | % | | | 139 | % | | | 156 | % | | | 182 | % | | | 202 | % |
Net assets at end of year (000’s omitted) | | $ | 172,454 | | | $ | 156,953 | | | $ | 169,180 | | | $ | 215,941 | | | $ | 278,620 | |
| | | | | | | | | | | | | | | | | | | | |
Notes to Financial Highlights
| # | Effective February 27, 2017, each Fund’s Class S shares were renamed to Class I shares. |
| 1 | Per share numbers have been calculated using average shares. |
| 2 | Includes non-recurring dividends. Without these dividends, net investment loss per share would have been ($0.22) and ($0.18) for AMG Managers Brandywine Fund and AMG Managers Brandywine Blue Fund, respectively. |
| 3 | Includes non-recurring dividends. Without these dividends, net investment loss per share would have been ($0.10) and ($0.04) for AMG Managers Brandywine Fund and AMG Managers Brandywine Blue Fund, respectively. |
| 4 | Includes non-recurring dividends. Without these dividends, net investment loss per share would have been ($0.07) and ($0.08) for the AMG Managers Brandywine Fund and AMG Managers Brandywine Blue Fund, respectively. |
| 5 | At the start of business October 1, 2013, AMG Managers Brandywine Fund and AMG Managers Brandywine Blue Fund were each reorganized into a respective fund of AMG Funds I. |
| 6 | Interest expense is less than 0.005% of average net assets. |
| 7 | Excludes the impact of expense reimbursement or fee waivers and expense reductions such as brokerage credits, but includes expense repayments and non-reimbursable expenses, if any, such as interest, taxes, and extraordinary expenses. (See Note 1(c) and 2 in the Notes to Financial Statements.) |
Notes to Financial Statements
September 30, 2017
1. SUMMARY OF SIGNIFICANT ACCOUNTING POLICIES
AMG Funds I (the “Trust”) is an open-end management investment company, organized as a Massachusetts business trust, and registered under the Investment Company Act of 1940, as amended (the “1940 Act”). Currently, the Trust consists of a number of different funds, each having distinct investment management objectives, strategies, risks and policies. Included in this report are AMG Managers Brandywine Fund (“Brandywine”) and AMG Managers Brandywine Blue Fund (“Brandywine Blue”), each a “Fund” and collectively the “Funds.”
A significant portion of the Brandywine Blue’s holdings may be focused in a relatively small number of securities, which may make the Fund more volatile and subject to greater risk than a more diversified fund.
Effective October 1, 2016, each Fund’s shares were reclassified and redesignated as Class S shares. Effective February 27, 2017, each Fund’s Class S shares were renamed to Class I shares. Please refer to a current prospectus for additional information.
The Funds’ financial statements are prepared in accordance with accounting principles generally accepted in the United States of America (“U.S. GAAP”), including accounting and reporting guidance pursuant to Accounting Standards Codification Topic 946 applicable to investment companies. U.S. GAAP requires management to make estimates and assumptions that affect the reported amounts of assets and liabilities and disclosure of contingent assets and liabilities at the date of the financial statements and the reported amounts of income and expenses during the reporting period. Actual results could differ from those estimates and such differences could be material. The following is a summary of significant accounting policies followed by the Funds in the preparation of their financial statements:
a. VALUATION OF INVESTMENTS
Equity securities traded on a national securities exchange or reported on the NASDAQ national market system (“NMS”) are valued at the last quoted sales price on the primary exchange or, if applicable, the NASDAQ official closing price or the official closing price of the relevant exchange or, lacking any sales, at the last quoted bid price or the mean between the last quoted bid and ask prices (the “exchange mean price”). Equity securities traded in the over-the-counter market (other than NMS securities) are valued at the exchange mean price. Foreign equity securities (securities principally traded in markets other than U.S. markets) are valued at the official closing price on the primary exchange or, for markets that either do not offer an official closing price or where the official closing price may not be representative of the overall market, the last quoted sale price.
Fixed income securities purchased with a remaining maturity of 60 days or less are valued at amortized cost, provided that the amortized cost value is approximately the same as the fair value of the security valued without the use of amortized cost. Investments in other open-end regulated investment companies are valued at their end of day net asset value per share.
The Funds’ portfolio investments are generally valued based on independent market quotations or prices or, if none, “evaluative” or other market based valuations provided by third-party pricing services approved by the Board of
Trustees of the Trust (the “Board”). Under certain circumstances, the value of certain Fund portfolio investments (including derivatives) may be based on an evaluation of fair value, pursuant to procedures established by and under the general supervision of the Board. The Valuation Committee, which is comprised of the Independent Trustees of the Board, and the Pricing Committee, which is comprised of representatives from AMG Funds LLC (the “Investment Manager”) are the committees appointed by the Board to make fair value determinations. Each Fund may use the fair value of a portfolio instrument to calculate its net asset value (“NAV”) in the event that the market quotation, price or market based valuation for the portfolio instrument is not readily available or otherwise not determinable pursuant to the Board’s valuation procedures, if the Investment Manager or the Pricing Committee believes the quotation, price or market based valuation to be unreliable, or in certain other circumstances. When determining the fair value of an investment, the Pricing Committee and, if required under the Trust’s securities valuation procedures, the Valuation Committee, seeks to determine the price that the Fund might reasonably expect to receive from current sale of that portfolio investment in an arms-length transaction. Fair value determinations shall be based upon consideration of all available facts and information, including, but not limited to (i) attributes specific to the investment; (ii) fundamental and analytical data relating to the investment; and (iii) the value of other comparable securities or relevant financial instruments, including derivative securities, traded on other markets or among dealers.
The values assigned to fair value portfolio investments are based on available information and do not necessarily represent amounts that might ultimately be realized in the future, since such amounts depend on future developments inherent in long-term investments. Because of the inherent uncertainty of valuation, those estimated values may differ significantly from the values that would have been used had a ready market for the investments existed, and the differences could be material. The Board will be presented with a quarterly report showing as of the most recent quarter end, all outstanding securities fair valued by the Fund, including a comparison with the prior quarter end and the percentage of the Fund that the security represents at each quarter end.
With respect to foreign equity securities and certain foreign fixed income securities, the Board has adopted a policy that securities held in a Fund that can be fair valued by the applicable fair value pricing service are fair valued on each business day provided that each individual price exceeds a pre-established confidence level.
U.S. GAAP defines fair value as the price that a fund would receive to sell an asset or pay to transfer a liability in an orderly transaction between market participants at the measurement date. U.S. GAAP also establishes a framework for measuring fair value, and a three-level hierarchy for fair value measurements based upon the transparency of inputs to the valuation of an asset or liability. Inputs may be observable or unobservable and refer broadly to the assumptions that market participants would use in pricing the asset or liability. Observable inputs reflect the assumptions market participants would use in pricing the asset or liability based on market data obtained from sources independent of the Funds. Unobservable inputs reflect the Funds’ own assumptions about the assumptions that market participants would use in pricing the asset or liability developed based on the best information available in the circumstances. Each investment is assigned a level based upon the observability of the inputs which are significant to the overall valuation.
Notes to Financial Statements (continued)
The three-tier hierarchy of inputs is summarized below:
Level 1 – inputs are quoted prices in active markets for identical investments (e.g., equity securities, open-end investment companies)
Level 2 – other observable inputs (including, but not limited to: quoted prices for similar assets or liabilities in markets that are active, quoted prices for identical or similar assets or liabilities in markets that are not active, inputs other than quoted prices that are observable for the assets or liabilities (such as interest rates, yield curves, volatilities, prepayment speeds, loss severities, credit risks and default rates) or other market corroborated inputs) (e.g., debt securities, government securities, foreign currency exchange contracts, foreign securities utilizing international fair value pricing, broker-quoted securities, fair valued securities with observable inputs)
Level 3 – inputs are significant unobservable inputs (including the Fund’s own assumptions used to determine the fair value of investments) (e.g., fair valued securities with unobservable inputs)
Changes in inputs or methodologies used for valuing investments may result in a transfer in or out of levels within the fair value hierarchy. The inputs or methodologies used for valuing investments may not necessarily be an indication of the risk associated with investing in those investments. Transfers between different levels of the fair value disclosure hierarchy are deemed to have occurred as of the beginning of the reporting period.
b. SECURITY TRANSACTIONS
Security transactions are accounted for as of trade date. Realized gains and losses on securities sold are determined on the basis of identified cost.
c. INVESTMENT INCOME AND EXPENSES
Dividend income is recorded on the ex-dividend date. Dividends from foreign securities are recorded on the ex-dividend date, and if after the fact, as soon as the Fund becomes aware of the ex-dividend date. Interest income, which includes amortization of premium and accretion of discount on debt securities, is accrued as earned. Dividend and interest income on foreign securities is recorded gross of any withholding tax. Non-cash dividends included in dividend income, if any, are reported at the fair market value of the securities received. Upon notification from issuers, distributions received from a real estate investment trust (“REIT”) may be redesignated as a reduction of cost of investments and/or realized gain. Other income and expenses are recorded on an accrual basis. Expenses that cannot be directly attributed to a Fund are apportioned among the funds in the Trust and other trusts within the AMG Funds family of mutual funds (collectively, the “AMG Funds family”) based upon their relative average net assets or number of shareholders.
d. DIVIDENDS AND DISTRIBUTIONS
Fund distributions resulting from either net investment income or realized net capital gains, if any, will normally be declared and paid at least annually in December, as described in the Funds’ prospectus. Distributions to shareholders are recorded on the ex-dividend date. Distributions are determined in accordance with federal income tax regulations, which may differ from net
investment income and net realized capital gains for financial statement purposes (U.S. GAAP). Differences may be permanent or temporary. Permanent differences are reclassified among capital accounts in the financial statements to reflect their tax character. Permanent book and tax basis differences, if any, relating to shareholder distributions will result in reclassifications to paid-in capital. Temporary differences arise when certain items of income, expense and gain or loss are recognized in different periods for financial statement and tax purposes; these differences will reverse at some time in the future. Permanent differences are primarily due to expired capital loss carryovers and a net operating loss write off. Temporary differences are primarily due to qualified late year ordinary losses and wash sales.
As of September 30, 2017, the components of distributable earnings (excluding unrealized appreciation/depreciation) on a tax basis consisted of:
| | | | | | | | |
| | | Brandywine | | | Brandywine Blue | |
Capital loss carryforward | | $ | 461,674,006 | * | | $ | 195,886,232 | * |
Undistributed ordinary income | | | — | | | | — | |
Undistributed short-term capital gains | | | — | | | | — | |
Undistributed long-term capital gains | | | — | | | | — | |
Late-year loss deferral | | | 2,622,386 | | | | 451,815 | |
| * | Includes realized losses of $4,355,923 and $334,991 for Brandywine and Brandywine Blue, respectively, relating to sales of each portfolio made from September 5 to September 30, 2017, that may be deferred, as wash sales under the internal Revenue Code, if repurchased within 30 days. Such deferrals may decrease each Fund’s capital loss carryforward for tax purposes as shown above. |
At September 30, 2017, the approximate cost of investments and the aggregate gross unrealized appreciation and depreciation for federal income tax were as follows:
| | | | | | | | | | | | | | | | |
| Fund | | Cost | | | Appreciation | | | Depreciation | | | Net | |
Brandywine | | $ | 651,866,373 | | | $ | 150,396,860 | | | $ | (3,744,750 | ) | | $ | 146,652,110 | |
Brandywine Blue | | | 144,735,761 | | | | 36,370,643 | | | | (890,617 | ) | | | 35,480,026 | |
e. FEDERAL TAXES
Each Fund currently qualifies as an investment company and intends to comply with the requirements under Subchapter M of the Internal Revenue Code of 1986, as amended, to distribute substantially all of its taxable income and gains to its shareholders and to meet certain diversification and income requirements with respect to investment companies. Therefore, no provision for federal income or excise tax is included in the accompanying financial statements.
Additionally, based on each Fund’s understanding of the tax rules and rates related to income, gains and transactions for the foreign jurisdictions in which it invests, each Fund will provide for foreign taxes, and where appropriate, deferred foreign taxes.
Management has analyzed the Funds’ tax positions taken on federal income tax returns as of September 30, 2017 for all open tax years (generally, the three prior taxable years), and has concluded that no provision for federal income tax is required in the Funds’ financial statements. Additionally, management is not aware of any tax position for which it is reasonably possible that the total amounts of unrecognized tax benefits will change materially in the next twelve months.
Notes to Financial Statements (continued)
Net capital losses incurred in taxable years beginning after the enactment of the Regulated Investment Company Modernization Act of 2010, may be carried forward for an unlimited time period. Such losses will be required to be utilized prior to any loss carryovers incurred in pre-enactment taxable years, which generally expire eight years following the close of the taxable year in which they were incurred. As a result of this ordering rule, pre-enactment capital loss carryovers may be more likely to expire unused. Additionally, post-enactment capital losses that are carried forward retain their tax character as either short-term or long-term capital losses, unlike pre-enactment losses which are considered all short-term.
f. CAPITAL LOSS CARRYOVERS AND DEFERRALS
As of September 30, 2017, the following Funds had accumulated net realized capital loss carryovers from securities transactions for federal income tax purposes as shown in the following chart. These amounts may be used to offset future realized capital gains, if any, through the expiration dates listed, or in the case of post-enactment losses, for an unlimited time period.
| | | | | | | | | | | | |
| | | Capital Loss Carryover Amount | | | Expires | |
| Fund | | Short-Term | | | Long-Term | | | September 30, | |
Brandywine | | | | | | | | | | | | |
(Pre-Enactment) | | $ | 461,674,006 | | | | — | | | | 2018 | |
| | | | | | | | | | | | |
Totals | | $ | 461,674,006 | | | | — | | | | | |
| | | | | | | | | | | | |
Brandywine Blue | | | | | | | | | | | | |
(Pre-Enactment) | | $ | 195,886,232 | | | | — | | | | 2018 | |
| | | | | | | | | | | | |
Totals | | $ | 195,886,232 | | | | — | | | | | |
| | | | | | | | | | | | |
For the fiscal year ended September 30, 2017, the Funds utilized capital loss carryovers in the amount of:
| | | | | | | | |
| | | Capital Loss Carryovers Utilized | |
| | | Short-Term | | | Long-Term | |
Brandywine | | $ | 49,553,648 | | | | — | |
Brandywine Blue | | | 13,079,861 | | | | — | |
g. CAPITAL STOCK
The Trust’s Declaration of Trust authorizes for each Fund the issuance of an unlimited number of shares of beneficial interest, without par value. Each Fund records sales and repurchases of its capital stock on the trade date. The cost of securities contributed to the Funds in connection with the issuance of shares is based on the valuation of those securities in accordance with the Funds’ policy on investment valuation.
At September 30, 2017, certain unaffiliated shareholders of record, including omnibus accounts, individually or collectively held greater than 10% of the net assets of the Funds as follows: Brandywine Blue - two own 24%. Transactions by these shareholders may have a material impact on the Fund.
h. REPURCHASE AGREEMENTS AND JOINT REPURCHASE AGREEMENTS
The Funds may enter into third-party repurchase agreements for temporary cash management purposes and third-party joint repurchase agreements for reinvestment of cash collateral on securities lending transactions under the securities lending program offered by The Bank of New York Mellon (“BNYM”) (the “Program”) (collectively, “Repurchase Agreements”). The value of the underlying collateral, including accrued interest, must equal or exceed the value of the Repurchase Agreements during the term of the agreement. For joint repurchase agreements, the Funds participate on a pro rata basis with other clients of BNYM in its share of the underlying collateral under such joint repurchase agreements and in its share of proceeds from any repurchase or other disposition of the underlying collateral. The underlying collateral for all Repurchase Agreements is held in safekeeping by the Fund’s custodian or at the Federal Reserve Bank. If the seller defaults and the value of the collateral declines, or if bankruptcy proceedings commence with respect to the seller of the security, realization of the collateral by the Funds may be delayed or limited. Pursuant to the Program, the Funds are indemnified for such losses by BNYM on joint repurchase agreements.
At September 30, 2017, the market value of Repurchase Agreements for Brandywine and Brandywine Blue were $33,289,686 and $7,196,011, respectively.
2. AGREEMENTS AND TRANSACTIONS WITH AFFILIATES
For each of the Funds, the Trust has entered into an investment advisory agreement under which the Investment Manager, a subsidiary and the U.S. retail distributor arm of Affiliated Managers Group, Inc. (“AMG”), serves as investment manager to the Funds and is responsible for the Funds’ overall administration and operations. The Investment Manager selects one or more subadvisers for the Funds (subject to Board approval) and monitors each subadviser’s investment performance, security holdings and investment strategies. Each Fund’s investment portfolio is managed by Friess Associates, LLC (“Friess”) and Friess Associates of Delaware, LLC (“Friess of Delaware”), who serve pursuant to a subadvisory agreement with the Investment Manager.
Investment management fees are paid directly by the Funds to the Investment Manager based on average daily net assets. Effective October 1, 2016, the Funds’ investment management fees were paid at the following annual rate of each Fund’s respective average daily net assets:
| | | | |
Brandywine | | | 0.88 | % |
Brandywine Blue | | | 0.88 | % |
Prior to October 1, 2016, the annual rate for the investment management fees was 1.00% of both Funds’ average daily net assets.
The Trust, on behalf of the Funds, has entered into an amended and restated Administration Agreement under which the Investment Manager serves as the Funds’ administrator (the “Administrator”) and is responsible for all non-portfolio management aspects of managing the Funds’ operations, including administration and shareholder services to each Fund as further described in each Fund’s prospectus. Effective October 1, 2016, each Fund pays a fee to the Administrator at the rate of 0.15% per annum of the Fund’s average daily net
Notes to Financial Statements (continued)
assets for this service. Prior to October 1, 2016, the Funds paid an administrative fee under a similar contract at an annual rate of 0.03% of each Fund’s average net assets for the first $300 million of assets under management, 0.025% for the next $200 million and 0.02% on amounts in excess of $500 million. The Administrator for Brandywine is contractually obligated to waive a portion of the administration fee in an amount equal to an annual rate of 0.004% of the Fund’s average daily net assets through October 1, 2018. For the fiscal year ended September 30, 2017, Brandywine waived $29,223.
The Funds are distributed by AMG Distributors, Inc. (the “Distributor”), a wholly-owned subsidiary of the Investment Manager. The Distributor serves as the distributor and underwriter for each Fund and is a registered broker-dealer and member of the Financial Industry Regulatory Authority, Inc. (“FINRA”). Shares of each Fund will be continuously offered and will be sold directly to prospective purchasers and through brokers, dealers or other financial intermediaries who have executed selling agreements with the Distributor. Generally the Distributor bears all or a portion of the expenses of providing services pursuant to the distribution agreement, including the payment of the expenses relating to the distribution of prospectuses for sales purposes and any advertising or sales literature.
For Class I shares, the Board has approved reimbursement payments to the Investment Manager for shareholder servicing expenses (“shareholder servicing fees”) incurred. Shareholder servicing fees include payments to each financial intermediary such as broker-dealers (including fund supermarket platforms), banks and trust companies that provide shareholder recordkeeping, account servicing and other services.
The impact on the annualized expense ratio for the fiscal year ended September 30, 2017, were as follows:
| | | | | | | | |
| Fund | | Maximum
Annual Amount
Approved | | | Actual
Amount
Incurred | |
Brandywine | | | | | | | | |
Class I* | | | 0.15 | % | | | 0.02 | % |
Brandywine Blue | | | | | | | | |
Class I* | | | 0.15 | % | | | 0.06 | % |
| * | Effective October 1, 2016, the maximum annual rate was decreased to 0.15% from 0.20%. |
The Board provides supervision of the affairs of the Trust and other trusts within the AMG Funds family. The Trustees of the Trust who are not affiliated with an Investment Manager receive an annual retainer and per meeting fees for regular, special and telephonic meetings, and they are reimbursed for out-of-pocket expenses incurred while carrying out their duties as Board members. The Chairman of the Board and the Audit Committee Chair receive additional annual retainers. Certain Trustees and Officers of the Funds are Officers and/or Directors of the Investment Manager, AMG, and/or the Distributor.
The Securities and Exchange Commission (the “SEC”) has granted an exemptive order that permits the Funds to lend and borrow money for certain temporary purposes directly to and from other eligible funds in the AMG Funds family.
Participation in this interfund lending program is voluntary for both the borrowing and lending funds, and an interfund loan is only made if it benefits each participating fund. The Administrator manages the program according to procedures approved by the Board, and the Board monitors the operation of the program. An interfund loan must comply with certain conditions set out in the exemptive order, which are designed to assure fairness and protect all participating funds. For the fiscal year ended September 30, 2017, the Funds neither borrowed from nor lent to other funds in the AMG Funds family. At September 30, 2017, the Funds had no interfund loans outstanding.
3. PURCHASES AND SALES OF SECURITIES
Purchases and sales of securities (excluding short-term and U.S. Government Obligations) for the fiscal year ended September 30, 2017, were as follows:
| | | | | | | | |
| | | Long-Term Securities | |
| Fund | | Purchases | | | Sales | |
Brandywine | | $ | 1,328,651,123 | | | $ | 1,410,446,096 | |
Brandywine Blue | | | 255,048,449 | | | | 272,309,182 | |
The Funds had no purchases or sales of U.S. Government Obligations during the fiscal year ended September 30, 2017.
4. PORTFOLIO SECURITIES LOANED
The Funds participate in the Program providing for the lending of securities to qualified brokers. Securities lending income includes earnings of such temporary cash investments, plus or minus any rebate to a borrower. These earnings (after any rebate) are then divided between BNYM, as a fee for its services under the Program, and the Funds, according to agreed-upon rates. Collateral on all securities loaned is accepted in cash and is maintained at a minimum level of 102% (105% in the case of certain foreign securities) of the market value, plus interest, if applicable, of investments on loan. It is the Funds’ policy to obtain additional collateral from or return excess collateral to the borrower by the end of the next business day, following the valuation date of the securities loaned. Therefore, the value of the collateral held may be temporarily less than the value of the securities on loan. Lending securities entails a risk of loss to the Funds if and to the extent that the market value of the securities loaned were to increase and the borrower did not increase the collateral accordingly, and the borrower fails to return the securities. Under the terms of the Program, the Funds are indemnified for such losses by BNYM. Cash collateral is held in a separate omnibus account managed by BNYM, who is authorized to exclusively enter into joint repurchase agreements. BNYM bears the risk of any deficiency in the amount of the cash collateral available for return to the borrower due to any loss on the collateral invested.
At September 30, 2017, the value of the securities loaned and cash collateral received, were as follows:
| | | | | | | | |
| Fund | | Securities
Loaned | | | Cash Collateral
Received | |
Brandywine | | $ | 32,862,514 | | | $ | 33,289,686 | |
Brandywine Blue | | | 7,023,163 | | | | 7,196,011 | |
Notes to Financial Statements (continued)
5. COMMITMENTS AND CONTINGENCIES
Under the Trust’s organizational documents, its trustees and officers are indemnified against certain liabilities arising out of the performance of their duties to the Trust. In addition, in the normal course of business, the Funds may enter into contracts and agreements that contain a variety of representations and warranties, which provide general indemnifications. The maximum exposure to the Funds under these arrangements is unknown, as this would involve future claims that may be made against a Fund that have not yet occurred. However, based on experience, the Funds had no prior claims or losses and expect the risks of loss to be remote.
6. MASTER NETTING AGREEMENTS
The Funds may enter into master netting agreements with their counterparties for the securities lending program and Repurchase Agreements, which provide the right, in the event of default (including bankruptcy or insolvency) for the non-defaulting party to liquidate the collateral and calculate net exposure to the defaulting party or request additional collateral. For financial reporting purposes, the Funds do not offset financial assets and financial liabilities that are subject to master netting agreements in the Statement of Assets and Liabilities. For securities lending transactions, see Note 4.
The following table is a summary of the Funds’ open Repurchase Agreements that are subject to a master netting agreement as of September 30, 2017:
| | | | | | | | | | | | | | | | |
| | | | | | Gross Amount Not Offset in the
Statement of Assets and Liabilities | | | | |
| | | Net Amounts of Assets
Presented in the Statement
of Assets and Liabilities | | | Financial
Instruments
Collateral | | | Cash Collateral
Received | | | Net Amount | |
Brandywine | | | | | | | | | | | | | | | | |
Citigroup Global Markets, Inc. | | $ | 7,906,555 | | | $ | 7,906,555 | | | | — | | | | — | |
Daiwa Capital Markets America | | | 7,906,555 | | | | 7,906,555 | | | | — | | | | — | |
Nomura Securities International, Inc. | | | 7,906,555 | | | | 7,906,555 | | | | — | | | | — | |
Royal Bank of Scotland PLC | | | 3,415,935 | | | | 3,415,935 | | | | — | | | | — | |
State of Wisconsin Investment Board | | | 6,154,086 | | | | 6,154,086 | | | | — | | | | — | |
| | | | | | | | | | | | | | | | |
Totals | | $ | 33,289,686 | | | $ | 33,289,686 | | | | — | | | | — | |
| | | | | | | | | | | | | | | | |
Brandywine Blue | | | | | | | | | | | | | | | | |
Citibank N.A. | | $ | 359,603 | | | $ | 359,603 | | | | — | | | | — | |
Daiwa Capital Markets America | | | 1,709,102 | | | | 1,709,102 | | | | — | | | | — | |
Merrill Lynch Pierce Fenner & Smith, Inc. | | | 1,709,102 | | | | 1,709,102 | | | | — | | | | — | |
Nomura Securities International, Inc. | | | 1,709,102 | | | | 1,709,102 | | | | — | | | | — | |
RBC Dominion Securities, Inc. | | | 1,709,102 | | | | 1,709,102 | | | | — | | | | — | |
| | | | | | | | | | | | | | | | |
Totals | | $ | 7,196,011 | | | $ | 7,196,011 | | | | — | | | | — | |
| | | | | | | | | | | | | | | | |
7. REGULATORY UPDATES
On October 13, 2016, the SEC amended existing rules intended to modernize reporting and disclosure of information. These amendments relate to Regulation S-X which sets forth the form and content of financial statements. Effective August 1, 2017, the Fund’s have adopted these amendments.
8. SUBSEQUENT EVENTS
The Funds have determined that no material events or transactions occurred through the issuance date of the Funds’ financial statements which require an additional disclosure in or adjustment of the Funds’ financial statements.
Notes to Financial Statements (continued)
TAX INFORMATION (unaudited)
AMG Managers Brandywine Fund and AMG Managers Brandywine Blue Fund each hereby designate the maximum amount allowable of its net taxable income as qualified dividends as provided in the Jobs and Growth Tax Relief Reconciliation Act of 2003. The 2016/2017 Form 1099-DIV you receive for the Fund will show the tax status of all distributions paid to you during the year.
Pursuant to section 852 of the Internal Revenue Code, both AMG Managers Brandywine Fund and AMG Managers Brandywine Blue Fund hereby designate $0 as a capital gain distribution with respect to the taxable fiscal year ended September 30, 2017, or if subsequently determined to be different, the net capital gains of such year.
Report of Independent Registered Public Accounting Firm
TO THE BOARD OF TRUSTEES OF AMG FUNDS I AND SHAREHOLDERS OF AMG MANAGERS BRANDYWINE FUND AND AMG MANAGERS BRANDYWINE BLUE FUND
In our opinion, the accompanying statements of assets and liabilities, including the schedules of portfolio investments, and the related statements of operations and of changes in net assets and the financial highlights present fairly, in all material respects, the financial position of the AMG Managers Brandywine Fund and AMG Managers Brandywine Blue Fund (the “Funds”) as of September 30, 2017, and the results of each of their operations, the changes in each of their net assets and the financial highlights for each of the periods indicated, in conformity with accounting principles generally accepted in the United States of America. These financial statements and financial highlights (hereafter referred to as “financial statements”) are the responsibility of the Funds’ management. Our responsibility is to express an opinion on these financial statements based on our audits. We conducted our audits of these financial statements in accordance with the standards of the Public Company Accounting Oversight Board (United States). Those standards require that we plan and perform the audit to obtain reasonable assurance about whether the financial statements are free of material misstatement. An audit includes examining, on a test basis, evidence supporting the amounts and disclosures in the financial statements, assessing the accounting principles used and significant estimates made by management, and evaluating the overall financial statement presentation. We believe that our audits, which included confirmation of securities as of September 30, 2017 by correspondence with the custodian and brokers, and the application of alternative auditing procedures where securities purchased had not been received, provide a reasonable basis for our opinion.
PricewaterhouseCoopers LLP
Boston, Massachusetts
October 26, 2017
Annual Renewal of Investment Management and Subadvisory Agreements (unaudited)
AMG Managers Brandywine Fund and AMG Managers Brandywine Blue Fund: Approval of Investment Management, Subadvisory and Sub-Subadvisory Agreements on June 28-29, 2017.
At an in-person meeting held on June 28-29, 2017, the Board of Trustees (the “Board” or the “Trustees”), and separately a majority of the Trustees who are not “interested persons” of the Trust (the “Independent Trustees”), approved (i) the Investment Management Agreement, as amended pursuant to letter agreements at any time prior to the date of the meeting, with AMG Funds LLC (the “Investment Manager”) for each of AMG Managers Brandywine Fund and AMG Managers Brandywine Blue Fund (each, a “Fund,” and collectively, the “Funds”) and separately each of Amendment No. 1 thereto dated July 1, 2015, and Amendment No. 2 thereto dated October 1, 2016 (collectively, the “Investment Management Agreement”) and (ii) the Subadvisory Agreement, as amended at any time prior to the date of the meeting, with the Subadviser with respect to each Fund and the Sub-Subadvisory Agreement with the Sub-Subadviser with respect to each Fund (collectively, the “Friess Agreements”). The Subadviser and the Sub-Subadviser are referred to collectively herein as “Friess.” The Independent Trustees were separately represented by independent legal counsel in connection with their consideration of the approval of these agreements. In considering the Investment Management Agreement and the Friess Agreements, the Trustees reviewed a variety of materials relating to each Fund, the Investment Manager and Friess including comparative performance, fee and expense information for an appropriate peer group of similar mutual funds (each, a “Peer Group”), performance information for relevant benchmark indices (each, a “Fund Benchmark”) and, as to all other matters, other information provided to them on a periodic basis throughout the year, as well as information provided in connection with the meetings of June 28-29, 2017, regarding the nature, extent and quality of services provided by the Investment Manager and Friess under their respective agreements. Prior to voting, the Independent Trustees: (a) reviewed the foregoing information
with their independent legal counsel and with management; (b) received materials from their independent legal counsel discussing the legal standards applicable to their consideration of the Investment Management Agreement and the Friess Agreements; and (c) met with their independent legal counsel in private sessions at which no representatives of management were present.
NATURE, EXTENT AND QUALITY OF SERVICES
In considering the nature, extent and quality of the services provided by the Investment Manager, the Trustees reviewed information relating to the Investment Manager’s operations and personnel. Among other things, the Investment Manager provided financial information, biographical information on its supervisory and professional staff and descriptions of its organizational and management structure. The Trustees also took into account information provided periodically throughout the previous year by the Investment Manager in Board meetings relating to the performance of its duties with respect to the Funds and the Trustees’ knowledge of the Investment Manager’s management and the quality of the performance of the Investment Manager’s duties under the Investment Management Agreement and Administration Agreement. In the course of their deliberations regarding the Investment Manager, the Trustees evaluated, among other things: (a) the extent and quality of the Investment Manager’s oversight of the operation and management of the Funds; (b) the quality of the search, selection and monitoring services performed by the Investment Manager in overseeing the portfolio management responsibilities of Friess; (c) the Investment Manager’s ability to supervise the Funds’ other service providers; and (d) the Investment Manager’s compliance program. The Trustees also took into account that, in performing its functions under the Investment Management Agreement and supervising Friess, the Investment Manager: performs periodic detailed analyses and reviews of the performance by Friess of its obligations to each Fund, including without limitation, analysis
and review of portfolio and other compliance matters and review of Friess’s investment performance with respect to a Fund; prepares and presents periodic reports to the Board regarding the investment performance of Friess and other information regarding Friess, at such times and in such forms as the Board may reasonably request; reviews and considers any changes in the personnel of Friess responsible for performing Friess’s obligations and makes appropriate reports to the Board; reviews and considers any changes in the ownership or senior management of Friess and makes appropriate reports to the Board; performs periodic in-person or telephonic diligence meetings, including with respect to compliance matters, with representatives of Friess; assists the Board and management of the Trust in developing and reviewing information with respect to the initial approval of each Friess Agreement and annual consideration of each Friess Agreement thereafter; prepares recommendations with respect to the continued retention of Friess or the replacement of Friess, including at the request of the Board; identifies potential successors to or replacements of Friess or potential additional subadvisers, performs appropriate due diligence, and develops and presents to the Board a recommendation as to any such successor, replacement, or additional subadviser, including at the request of the Board; designates and compensates from its own resources such personnel as the Investment Manager may consider necessary or appropriate to the performance of its services; and performs such other review and reporting functions as the Board shall reasonably request consistent with the Investment Management Agreement and applicable law. The Trustees also took into account the financial condition of the Investment Manager with respect to its ability to provide the services required under the Investment Management Agreement. The Trustees also considered the Investment Manager’s risk management processes.
For each Fund, the Trustees also reviewed information relating to Friess’s operations and personnel and the investment philosophy,
Annual Renewal of Investment Management and Subadvisory Agreements (continued)
strategies and techniques (its “Investment Strategy”) used in managing the Fund. Among other things, the Trustees reviewed biographical information on portfolio management and other professional staff, information regarding Friess’s organizational and management structure and Friess’s brokerage policies and practices. The Trustees considered specific information provided regarding the experience of the individuals at Friess with portfolio management responsibility for the Funds, including the information set forth in the Funds’ prospectus and statement of additional information. In the course of their deliberations, the Trustees evaluated, among other things: (a) the services rendered by Friess in the past; (b) the qualifications and experience of Friess’s personnel; and (c) Friess’s compliance program. The Trustees also took into account the financial condition of Friess with respect to its ability to provide the services required under each Friess Agreement. The Trustees also considered Friess’s risk management processes.
PERFORMANCE
As noted above, the Board considered each Fund’s net performance during relevant time periods as compared to the Fund’s Peer Group and Fund Benchmark and considered the gross performance of the Fund as compared to Friess’s relevant performance composite that utilizes the same investment strategy and approach and noted that the Board reviews on a quarterly basis detailed information about both the Fund’s performance results and portfolio composition, as well as Friess’s Investment Strategy. The Board noted the Investment Manager’s expertise and resources in monitoring the performance, investment style and risk-adjusted performance of Friess. The Board was mindful of the Investment Manager’s attention to monitoring Friess’s performance with respect to the Funds and its discussions with management regarding the factors that contributed to the performance of the Funds.
ADVISORY FEES AND PROFITABILITY
In considering the reasonableness of the advisory fee charged by the Investment Manager for managing each Fund, the Trustees noted that the
Investment Manager, and not the Fund, is responsible for paying the fees charged by the Fund’s Subadviser, and, in turn, the Subadviser is responsible for paying the fees charged by the Fund’s Sub-Subadviser and, therefore, that the fees paid to the Investment Manager cover the cost of providing portfolio management services as well as the cost of providing search, selection and monitoring services in operating a “manager-of-managers” complex of mutual funds. The Trustees also considered the amount of the advisory fee retained by the Investment Manager after payment of the subadvisory fee with respect to each Fund. The Trustees concluded that, in light of the high quality supervisory services provided by the Investment Manager and the fact that the Investment Manager and the Subadviser are paying the fees under the Subadvisory Agreements and Sub-Subadvisory Agreements, respectively, the advisory fee payable by each Fund to the Investment Manager can reasonably be expected to exceed the median advisory fee for the Peer Group, which consists of many funds that do not operate with a manager-of-managers structure.
In addition, in considering the reasonableness of the advisory fee payable to the Investment Manager, the Trustees also reviewed information provided by the Investment Manager setting forth all revenues and other benefits, both direct and indirect (including any so-called “fallout benefits” such as reputational value derived from the Investment Manager serving as Investment Manager to a Fund), received by the investment manager and its affiliates attributable to managing each Fund and all the mutual funds in the AMG Funds Family of Funds, the cost of providing such services, the enterprise and entrepreneurial risks undertaken as investment manager and sponsor of the Funds and the resulting profitability to the Investment Manager and its affiliates from these relationships. The Trustees also noted the current asset levels of each Fund and the willingness of the Investment Manager to waive fees and pay expenses for all of the Funds from time to time as a means of limiting total expenses. The Trustees also considered management’s discussion of the current asset levels of the Funds, and the impact
on profitability of both the current asset levels and any future growth of assets of the Funds. The Board took into account management’s discussion of the advisory fee structure, and, as noted above, the services the Investment Manager provides in performing its functions under the Investment Management Agreement and supervising Friess. In this regard, the Trustees noted that, unlike a mutual fund that is managed by a single investment adviser, the Funds operate in a manager-of-managers structure. Based on the foregoing, the Trustees concluded that the profitability to the Investment Manager is reasonable and that the Investment Manager is not realizing material benefits from economies of scale that would warrant adjustments to the advisory fees for any Fund at this time. With respect to economies of scale, the Trustees also noted that as a Fund’s assets increase over time, the Fund may realize other economies of scale to the extent that the increase in assets is proportionally greater than the increase in certain other expenses.
In considering the reasonableness of the fee payable by the Investment Manager to Friess, the Trustees relied on the ability of the Investment Manager to negotiate the terms of the Friess Agreements at arm’s length as part of the manager-of-managers structure, noting that the Investment Manager is not affiliated with Friess. In addition, the Trustees considered other potential benefits of the subadvisory relationship to Friess, including, among others, the indirect benefits that Friess may receive from its relationship with a Fund, including any so-called “fallout benefits” to Friess, such as reputational value derived from the Subadviser and Sub-Subadviser serving as Subadviser and Sub-Subadviser, respectively, to the Fund. In addition, the Trustees noted that the subadvisory fees are paid by the Investment Manager out of its advisory fee and, in turn, the sub-subadvisory fees are paid by the Subadviser. As a consequence of all of the foregoing, the cost of services to be provided by Friess and the profitability to Friess of its relationship with a Fund were not material factors in the Trustees’ deliberations. For similar reasons, the Trustees did not consider potential economies of scale in the management of a Fund by Friess to be a material factor in their deliberations at this time.
Annual Renewal of Investment Management and Subadvisory Agreements (continued)
In addition to the foregoing, the Trustees considered the specific factors and related conclusions set forth below with respect to each Fund, the Investment Manager and Friess.
AMG Managers Brandywine Fund
Fund Performance
Among other information relating to the Fund’s performance (including the predecessor fund’s performance for periods prior to its acquisition by the Trust on October 1, 2013), the Trustees noted that the Fund’s performance for Class I shares for the 1-year, 3-year, 5-year and 10-year periods ended March 31, 2017 was above, above, below and below, respectively, the median performance of the Peer Group and above, below, below and below, respectively, the performance of the Fund Benchmark, the Russell 3000® Growth Index. The Trustees also took into account management’s discussion of the Fund’s performance, including its more recent improved performance relative to its Peer Group and Fund Benchmark. The Trustees noted that Class I shares of the Fund ranked in the second quintile relative to its Peer Group for the 1-year and 3-year periods. The Trustees concluded that the Fund’s overall performance has been satisfactory.
Advisory and Subadvisory Fees
The Trustees noted that the Fund’s management fees (which include both the advisory and administration fees) and total expenses (net of applicable expense waivers/reimbursements) as of March 31, 2017 were both higher than the average for the Fund’s Peer Group. The Trustees also took into account management’s discussion of the Fund’s expenses and competitiveness with comparably sized funds. The Trustees concluded that, in light of the nature, extent and quality of the services provided by the Investment Manager and Friess and the considerations noted above with respect to the Investment Manager and Friess, the Fund’s advisory, subadvisory and sub-subadvisory fees are reasonable.
AMG Managers Brandywine Blue Fund
Fund Performance
Among other information relating to the Fund’s performance (including the predecessor fund’s performance for periods prior to its acquisition by the Trust on October 1, 2013), the Trustees noted that the Fund’s performance for Class I shares for the 1-year, 3-year, 5-year and 10-year periods ended March 31, 2017 was above, below, below and below, respectively, the median performance of the Peer Group and above, below, below and below, respectively, the performance of the Fund Benchmark, the Russell 1000® Growth Index. The Trustees also took into account management’s discussion of the Fund’s performance, including its more recent improved performance relative to its Peer Group and Fund Benchmark. The Trustees noted that Class I shares of the Fund ranked in the second quintile relative to its Peer Group for the 1-year period. The Trustees concluded that the Fund’s overall performance has been satisfactory in light of all factors considered.
Advisory and Subadvisory Fees
The Trustees noted that the Fund’s management fees (which include both the advisory and administration fees) and total expenses (net of applicable expense waivers/reimbursements) as of March 31, 2017 were both higher than the average for the Peer Group. The Trustees also took into account management’s discussion of the Fund’s expenses and competitiveness with comparably sized funds. The Trustees concluded that, in light of the nature, extent and quality of the services provided by the Investment Manager and Friess, and the considerations noted above with respect to the Investment Manager and Friess, the Fund’s advisory, subadvisory and sub-subadvisory fees are reasonable.
* * * *
After consideration of the foregoing, the Trustees also reached the following conclusions (in addition to the conclusions discussed above) regarding the Investment Management Agreement and each Friess Agreement: (a) the Investment Manager and
Friess have demonstrated that they possess the capability and resources to perform the duties required of them under the Investment Management Agreement and the Friess Agreements; (b) Friess’s Investment Strategy is appropriate for pursuing the applicable Fund’s investment objectives; and (c) the Investment Manager and Friess maintain appropriate compliance programs.
Based on all of the above-mentioned factors and their related conclusions, with no single factor or conclusion being determinative and with each Trustee not necessarily attributing the same weight to each factor, the Trustees concluded that approval of the Investment Management Agreement and each Friess Agreement would be in the best interests of the applicable Fund and its shareholders. Accordingly, on June 28-29, 2017, the Trustees, and separately a majority of the Independent Trustees, voted to approve the Investment Management Agreement and the Friess Agreements for each Fund.
AMG Funds
Trustees and Officers
The Trustees and Officers of the Trust, their business addresses, principal occupations for the past five years and ages are listed below. The Trustees provide broad supervision over the affairs of the Trust and the Funds. The Trustees are experienced executives who meet periodically throughout the year to oversee the Funds’ activities, review contractual arrangements with
companies that provide services to the Funds, and review the Funds’ performance. Unless otherwise noted, the address of each Trustee or Officer is the address of the Trust: 600 Steamboat Road, Suite 300, Greenwich, CT 06830.
There is no stated term of office for Trustees. Trustees serve until their resignation, retirement or removal in accordance with the Trust’s
organizational documents and policies adopted by the Board from time to time. The Chairman of the Trustees, President, Treasurer and Secretary of the Trust are elected by the Trustees annually. Other officers hold office at the pleasure of the Trustees.
Independent Trustees
The following Trustees are not “interested persons” of the Trust within the meaning of the 1940 Act:
| | |
Number of Funds Overseen in Fund Complex | | Name, Age, Principal Occupation(s) During Past 5 Years and Other Directorships Held by Trustee |
• Trustee since 2012 • Oversees 62 Funds in Fund Complex | | Bruce B. Bingham, 68 Partner, Hamilton Partners (real estate development firm) (1987-Present); Director of The Yacktman Funds (2000-2012). |
| |
• Trustee since 2000 • Oversees 62 Funds in Fund Complex | | Edward J. Kaier, 72 Attorney at Law and Partner, Teeters Harvey Marrone & Kaier LLP (2007-Present); Attorney at Law and Partner, Hepburn Willcox Hamilton & Putnam, LLP (1977-2007); Trustee of Third Avenue Trust (5 portfolios); Trustee of Third Avenue Variable Trust (1 portfolio). |
| |
• Trustee since 2013 • Oversees 64 Funds in Fund Complex | | Kurt A. Keilhacker, 54 Managing Member, TechFund Capital (1997-Present); Managing Member, TechFund Europe (2000-Present); Board Member, 6wind SA, (2002-Present); Managing Member, Elementum Ventures (2013-Present); Trustee, Gordon College (2001-2016). |
| |
• Trustee since 2000 • Oversees 62 Funds in Fund Complex | | Steven J. Paggioli, 67 Independent Consultant (2002-Present); Formerly Executive Vice President and Director, The Wadsworth Group (1986-2001); Executive Vice President, Secretary and Director, Investment Company Administration, LLC (1990-2001); Vice President, Secretary and Director, First Fund Distributors, Inc. (1991-2001); Trustee, Professionally Managed Portfolios (32 portfolios); Advisory Board Member, Sustainable Growth Advisors, LP; Independent Director, Chase Investment Counsel (2008 – Present). |
| |
• Trustee since 2013 • Oversees 62 Funds in Fund Complex | | Richard F. Powers III, 71 Adjunct Professor, U.S. Naval War College (2016); Adjunct Professor, Boston College (2010-2013); President and CEO of Van Kampen Investments Inc. (1998-2003). |
| |
• Independent Chairman • Trustee since 2000 • Oversees 64 Funds in Fund Complex | | Eric Rakowski, 59 Professor, University of California at Berkeley School of Law (1990-Present); Director of Harding, Loevner Funds, Inc. (9 portfolios); Trustee of Third Avenue Trust (5 portfolios); Trustee of Third Avenue Variable Trust (1 portfolio). |
| |
• Trustee since 2013 • Oversees 64 Funds in Fund Complex | | Victoria L. Sassine, 52 Lecturer, Babson College (2007 – Present). |
| |
• Trustee since 2000 • Oversees 62 Funds in Fund Complex | | Thomas R. Schneeweis, 70 Professor Emeritus, University of Massachusetts (2013-Present); Partner, S Capital Wealth Advisors (2015-Present); President, TRS Associates (1982-Present); Board Member, Chartered Alternative Investment Association (“CAIA”) (2002-Present); Director, CAIA Foundation (Education) (2010-Present); Director, Institute for Global Asset and Risk Management (Education) (2010-Present); Partner, S Capital Management, LLC (2007-2015); Director, CISDM at the University of Massachusetts, (1996-2013); President, Alternative Investment Analytics, LLC, (formerly Schneeweis Partners, LLC) (2001-2013); Professor of Finance, University of Massachusetts (1977-2013). |
Interested Trustees
Each Trustee in the following table is an “interested person” of the Trust within the meaning of the 1940 Act. Ms. Carsman is an interested person of the Trust within the meaning of the 1940 Act by virtue of her position with, and interest in securities of, AMG.
| | |
Number of Funds Overseen in Fund Complex | | Name, Age, Principal Occupation(s) During Past 5 Years and Other Directorships Held by Trustee |
• Trustee since 2011 • Oversees 64 Funds in Fund Complex | | Christine C. Carsman, 65 Executive Vice President, Deputy General Counsel and Chief Regulatory Counsel, Affiliated Managers Group, Inc. (2017-Present); Director (2010-Present) and Chair of the Board of Directors (2015-Present), AMG Funds plc; Director of Harding, Loevner Funds, Inc. (9 portfolios); Senior Vice President and Deputy General Counsel, Affiliated Managers Group, Inc. (2011-2016); Senior Vice President and Chief Regulatory Counsel, Affiliated Managers Group, Inc. (2007-2011); Vice President and Chief Regulatory Counsel, Affiliated Managers Group, Inc. (2004-2007); Secretary and Chief Legal Officer, AMG Funds, AMG Funds I, AMG Funds II and AMG Funds III (2004-2011); Senior Counsel, Vice President and Director of Operational Risk Management and Compliance, Wellington Management Company, LLP (1995-2004). |
AMG Funds
Trustees and Officers (continued)
| | |
Officers | | |
Position(s) Held with Fund and Length of Time Served | | Name, Age, Principal Occupation(s) During Past 5 Years |
• President since 2014 • Principal Executive Officer since 2014 • Chief Executive Officer since 2016 | | Jeffrey T. Cerutti, 49 Chief Executive Officer, AMG Funds LLC (2014-Present); Director, President and Principal, AMG Distributors, Inc. (2014-Present); President and Principal Executive Officer, AMG Funds, AMG Funds I, AMG Funds II and AMG Funds III (2014-Present); Chief Executive Officer, President and Principal Executive Officer, AMG Funds IV, (2015-Present); Chief Executive Officer, AMG Funds, AMG Funds I, AMG Funds II and AMG Funds III (2016-Present); Chief Executive Officer, Aston Asset Management, LLC (2016); President, VP Distributors, (2011-2014); Executive Vice President, Head of Distribution, Virtus Investment Partners, Inc. (2010-2014); Managing Director, Head of Sales, UBS Global Asset Management (2001-2010). |
| |
• Chief Operating Officer since 2007 | | Keitha L. Kinne, 59 Chief Operating Officer, AMG Funds LLC (2007-Present); Chief Investment Officer, AMG Funds LLC (2008-Present); Chief Operating Officer, AMG Distributors, Inc. (2007-Present); Chief Operating Officer, AMG Funds, AMG Funds I, AMG Funds II, and AMG Funds III (2007-Present); Chief Compliance Officer, AMG Funds IV (2016-Present); Chief Operating Officer and Chief Investment Officer, Aston Asset Management, LLC (2016); Chief Operating Officer, Aston Funds (2016); President and Principal Executive Officer, AMG Funds, AMG Funds I, AMG Funds II and AMG Funds III (2012-2014); Managing Partner, AMG Funds LLC (2007-2014); President, AMG Funds (2012-2014); President, AMG Distributors, Inc. (2012-2014); Managing Director, Legg Mason & Co., LLC (2006-2007); Managing Director, Citigroup Asset Management (2004-2006). |
| |
• Secretary since 2015 • Chief Legal Officer since 2015 | | Mark J. Duggan, 52 Senior Vice President and Senior Counsel, AMG Funds LLC (2015-Present); Secretary and Chief Legal Officer, AMG Funds, AMG Funds I, AMG Funds II and AMG Funds III (2015-Present); Secretary and Chief Legal Officer, AMG Funds IV, (2015-Present); Attorney, K&L Gates, LLP (2009-2015). |
| |
• Chief Financial Officer since 2017 • Treasurer since 2017 • Principal Financial Officer since 2017 • Principal Accounting Officer since 2017 | | Thomas G. Disbrow, 51 Vice President, Mutual Fund Treasurer & CFO, AMG Funds, AMG Funds LLC (2017-Present); Chief Financial Officer, Principal Financial Officer, Treasurer and Principal Accounting Officer, AMG Funds, AMG Funds I, AMG Funds II, AMG Funds III and AMG Funds IV (2017-Present); Managing Director - Global Head of Traditional Funds Product Control, UBS Asset Management (Americas), Inc. (2015-2017); Managing Director - Head of North American Funds Treasury, UBS Asset Management (Americas), Inc. (2011-2015). |
| |
• Deputy Treasurer since 2017 | | John A. Starace, 46 Vice President, Deputy Treasurer of Mutual Funds Services, AMG Funds LLC (2014-Present); Deputy Treasurer, AMG Funds, AMG Funds I, AMG Funds II, AMG Funds III and AMG Funds IV (2017-Present); Vice President, Citi Hedge Fund Services (2010-2014); Audit Senior Manager (2005-2010) and Audit Manager (2001-2005), Deloitte & Touche LLP. |
| |
• Controller since 2017 | | Christopher R. Townsend, 50 Head of Business Finance, AMG Funds LLC (2015-Present); Chief Financial Officer and Financial and Operations Principal, AMG Distributors, Inc. (2016-Present); Controller, AMG Funds, AMG Funds I, AMG Funds II, AMG Funds III and AMG Funds IV (2017-Present); Treasurer, Chief Financial Officer, Principal Financial Officer, Principal Accounting Officer, AMG Funds, AMG Funds II, AMG Funds III and AMG Funds IV (2017); Chief Financial Officer, Aston Asset Management LLC (2016); Head of Finance and Accounting, Allianz Asset Management (2006-2015). |
| |
• Chief Compliance Officer since 2016 | | Gerald F. Dillenburg, 50 Chief Compliance Officer and Sarbanes Oxley Code of Ethics Compliance Officer, AMG Funds, AMG Funds I, AMG Funds II and AMG Funds III (2016-Present); Chief Compliance Officer, AMG Funds IV (1996-Present); Sarbanes-Oxley Code of Ethics Compliance Officer, AMG Funds IV (2016-Present); Chief Compliance Officer, Aston Asset Management, LLC (2006-2016); Chief Operating Officer, Aston Funds (2003-2016); Secretary, Aston Funds (1996-2015); Chief Financial Officer, Aston Funds (1997-2010); Chief Financial Officer, Aston Asset Management, LLC (2006-2010); Treasurer, Aston Funds (1996-2010). |
| |
• Anti-Money Laundering Compliance Officer since 2014 | | Patrick J. Spellman, 43 Senior Vice President, Chief Compliance Officer, AMG Funds LLC (2011-Present); Chief Compliance Officer, AMG Distributors, Inc., (2010-Present); Anti-Money Laundering Compliance Officer, AMG Funds, AMG Funds I, AMG Funds II, AMG Funds III (2014-Present); Anti-Money Laundering Officer, AMG Funds IV, (2016-Present); Compliance Manager, Legal and Compliance, Affiliated Managers Group, Inc. (2005-2011). |
| |
• Assistant Secretary since 2016 | | Maureen A. Meredith, 32 Vice President, Counsel, AMG Funds LLC (2015-Present); Assistant Secretary, AMG Funds, AMG Funds I, AMG Funds II, AMG Funds III and AMG Funds IV (2016-Present); Associate, Ropes & Gray LLP (2011-2015); Law Fellow, Massachusetts Appleseed Center for Law and Justice (2010-2011). |
| |
• Assistant Secretary since 2016 | | Diana M. Podgorny, 38 Vice President, Counsel, AMG Funds LLC (2016-Present); Assistant Secretary, AMG Funds, AMG Funds I, AMG Funds II and AMG Funds III (2016-Present); Assistant Secretary, AMG Funds IV (2010-Present); Vice President, Counsel, Aston Asset Management, LLC (2010-2016). |
| |
• Assistant Secretary since 2016 | | Marc J. Pierce, 55 Vice President, Compliance Officer, AMG Funds LLC (2016-Present); Assistant Secretary, AMG Funds IV (2001-Present); Assistant Secretary, AMG Funds, AMG Funds I, AMG Funds II and AMG Funds III (2016-Present); Vice President, Aston Asset Management, LLC (1998-2016); Assistant Chief Compliance Officer, Aston Asset Management, LLC (2006-2016). |
THIS PAGE INTENTIONALLY LEFT BLANK
THIS PAGE INTENTIONALLY LEFT BLANK
INVESTMENT MANAGER AND ADMINISTRATOR
AMG Funds LLC
600 Steamboat Road, Suite 300
Greenwich, CT 06830
800.835.3879
DISTRIBUTOR
AMG Distributors, Inc.
600 Steamboat Road, Suite 300
Greenwich, CT 06830
800.835.3879
SUBADVISER
Friess Associates, LLC
P.O. Box 576
Jackson, Wyoming 83001
Friess Associates of Delaware, LLC
P.O. Box 4166
Greenville, DE 19807
CUSTODIAN
The Bank of New York Mellon
111 Sanders Creek Parkway
East Syracuse, NY 13057
LEGAL COUNSEL
Ropes & Gray LLP
Prudential Tower, 800 Boylston Street
Boston, MA 02199-3600
TRANSFER AGENT
BNY Mellon Investment Servicing (US) Inc.
Attn: AMG Funds
P.O. Box 9769
Providence, RI 02940
800.548.4539
This report is prepared for the Funds’ shareholders. It is authorized for distribution to prospective investors only when preceded or accompanied by an effective prospectus. To receive a free copy of the prospectus or Statement of Additional Information, which includes additional information about Fund Trustees, please contact us by calling 800.835.3879. Distributed by AMG Distributors, Inc., member FINRA/SIPC.
Current net asset values per share for each Fund are available on the Funds’ website at www.amgfunds.com.
A description of the policies and procedures each Fund uses to vote its proxies is available: (i) without charge, upon request, by calling 800.835.3879, or (ii) on the Securities and Exchange Commission’s (SEC) website at www.sec.gov. For information regarding each Fund’s proxy voting record for the 12-month period ended June 30, call 800.835.3879 or visit the SEC website at www.sec.gov.
Each Fund files its complete schedule of portfolio holdings with the SEC for the first and third quarters of each fiscal year on Form N-Q. The Funds’ Forms N-Q are available on the SEC’s website at www.sec.gov. A Fund’s Forms N-Q may be reviewed and copied at the SEC’s Public Reference Room in Washington, DC. Information on the operation of the Public Reference Room may be obtained by calling 1-800-SEC-0330. To review a complete list of the Funds’ portfolio holdings, or to view the most recent quarterly holdings report, semiannual report, or annual report, please visit www.amgfunds.com. www.amgfunds.com
| | |
 | | |
AFFILIATE SUBADVISED FUNDS
BALANCED FUNDS
AMG Chicago Equity Partners Balanced
Chicago Equity Partners, LLC
AMG FQ Global Risk-Balanced
First Quadrant, L.P.
EQUITY FUNDS
AMG Chicago Equity Partners Small Cap Value
Chicago Equity Partners, LLC
AMG FQ Tax-Managed U.S. Equity
AMG FQ Long-Short Equity
First Quadrant, L.P.
AMG Frontier Small Cap Growth
Frontier Capital Management Company, LLC
AMG GW&K Small Cap Core
AMG GW&K Small/Mid Cap
AMG GW&K U.S. Small Cap Growth
GW&K Investment Management, LLC
AMG Renaissance International Equity
AMG Renaissance Large Cap Growth
The Renaissance Group LLC
AMG River Road Dividend All Cap Value
AMG River Road Dividend All Cap Value II
AMG River Road Focused Absolute Value
AMG River Road Long-Short
AMG River Road Small-Mid Cap Value
AMG River Road Small Cap Value
River Road Asset Management, LLC
AMG SouthernSun Small Cap
AMG SouthernSun Global Opportunities
AMG SouthernSun U.S. Equity
SouthernSun Asset Management, LLC
AMG Systematic Large Cap Value
AMG Systematic Mid Cap Value
Systematic Financial Management, L.P.
AMG TimesSquare Emerging Markets Small Cap
AMG TimesSquare International Small Cap
AMG TimesSquare Mid Cap Growth
AMG TimesSquare Small Cap Growth
TimesSquare Capital Management, LLC
AMG Trilogy Emerging Markets Equity
AMG Trilogy Emerging Wealth Equity
Trilogy Global Advisors, L.P.
AMG Yacktman
AMG Yacktman Focused
AMG Yacktman Focused Fund - Security Selection Only
AMG Yacktman Special Opportunities
Yacktman Asset Management LP
FIXED INCOME FUNDS
AMG GW&K Core Bond
AMG GW&K Enhanced Core Bond
AMG GW&K Municipal Bond
AMG GW&K Municipal Enhanced Yield
GW&K Investment Management, LLC
OPEN-ARCHITECTURE FUNDS
ALTERNATIVE FUNDS
AMG Managers Lake Partners LASSO Alternatives
Lake Partners, Inc.
BALANCED FUNDS
AMG Managers Montag & Caldwell Balanced
Montag & Caldwell, LLC
EQUITY FUNDS
AMG Managers Brandywine
AMG Managers Brandywine Advisors Mid Cap Growth
AMG Managers Brandywine Blue
Friess Associates, LLC
AMG Managers Cadence Emerging Companies
AMG Managers Cadence Mid Cap
Cadence Capital Management, LLC
AMG Managers CenterSquare Real Estate
CenterSquare Investment Management, Inc.
AMG Managers Emerging Opportunities
Lord, Abbett & Co. LLC
WEDGE Capital Management L.L.P.
Next Century Growth Investors LLC
RBC Global Asset Management (U.S.) Inc.
AMG Managers Essex Small/Micro Cap Growth
Essex Investment Management Co., LLC
AMG Managers Fairpointe ESG Equity
AMG Managers Fairpointe Mid Cap
Fairpointe Capital LLC
AMG Managers Guardian Capital Global Dividend
Guardian Capital LP
AMG Managers LMCG Small Cap Growth
LMCG Investments, LLC
AMG Managers Montag & Caldwell Growth
AMG Managers Montag & Caldwell Mid Cap Growth
Montag & Caldwell, LLC
AMG Managers Pictet International
Pictet Asset Management Limited
AMG Managers Silvercrest Small Cap
Silvercrest Asset Management Group LLC
AMG Managers Skyline Special Equities
Skyline Asset Management, L.P.
AMG Managers Special Equity
Ranger Investment Management, L.P. Lord, Abbett & Co. LLC
Smith Asset Management Group, L.P. Federated MDTA LLC
AMG Managers Value Partners Asia Dividend
Value Partners Hong Kong Limited
FIXED INCOME FUNDS
AMG Managers Amundi Intermediate Government
AMG Managers Short Duration Government
Amundi Smith Breeden LLC
AMG Managers Doubleline Core Plus Bond
DoubleLine Capital LP
AMG Managers Global Income Opportunity
AMG Managers Loomis Sayles Bond
Loomis, Sayles & Co., L.P.
| | |
| AR073-0917 | | | www.amgfunds.com |
| | |
 | | ANNUAL REPORT |
AMG Funds
September 30, 2017

AMG Managers Brandywine Advisors Mid Cap Growth Fund: Class N: BWAFX
| | |
| www.amgfunds.com | | AR075-0917 |
AMG Funds
Annual Report—September 30, 2017
| | | | |
TABLE OF CONTENTS | | PAGE | |
LETTER TO SHAREHOLDERS | | | 2 | |
| |
ABOUT YOUR FUND’S EXPENSES | | | 3 | |
| |
PORTFOLIO MANAGER’S COMMENTS, PORTFOLIO STATISTICS, AND SCHEDULE OF PORTFOLIO INVESTMENTS | | | 4 | |
| |
NOTES TO SCHEDULE OF PORTFOLIO INVESTMENTS | | | 10 | |
| |
FINANCIAL STATEMENTS | | | | |
| |
Statement of Assets and Liabilities | | | 11 | |
Balance sheet, net asset value (NAV) per share computation and cumulative undistributed amounts | | | | |
| |
Statement of Operations | | | 12 | |
Detail of sources of income, expenses, and realized and unrealized gains (losses) during the fiscal year | | | | |
| |
Statements of Changes in Net Assets | | | 13 | |
Detail of changes in assets for the past two fiscal years | | | | |
| |
Financial Highlights | | | 14 | |
Historical net asset values per share, distributions, total returns, income and expense ratios, turnover ratios and net assets | | | | |
| |
Notes to Financial Statements | | | 15 | |
Accounting and distribution policies, details of agreements and transactions with Fund management and affiliates, and descriptions of certain investment risks | | | | |
| |
REPORT OF INDEPENDENT REGISTERED PUBLIC ACCOUNTING FIRM | | | 20 | |
| |
ANNUAL RENEWAL OF INVESTMENT MANAGEMENT AND SUBADVISORY AGREEMENTS | | | 21 | |
| |
TRUSTEES AND OFFICERS | | | 24 | |
Nothing contained herein is to be considered an offer, sale or solicitation of an offer to buy shares of any series of the AMG Funds family of mutual funds. Such offering is made only by prospectus, which includes details as to offering price and other material information.
| | |
| | | AMG Managers Brandywine Advisors Mid Cap Growth Fund |
DEAR FELLOW SHAREHOLDER:
Sabers rattled and hurricanes raged, yet investors remained cool throughout the summer’s waning months. Using the S&P 500 Index as a proxy, the stock market extended its streak of consecutive quarterly gains to the two-year mark thanks to another move higher in the three months through September. AMG Managers Brandywine Advisors Mid Cap Growth Fund grew 7.01 percent in the September quarter, outpacing gains in the S&P 500, Russell Midcap® and Russell Midcap® Growth Indexes of 4.48, 3.47 and 5.28 percent, respectively.
Recent results bring the Fund’s fiscal year return to 19.25 percent. The S&P 500, Russell Midcap® and Russell Midcap® Growth Indexes gained 18.61, 15.32 and 17.82 percent, respectively, in the 12 months through September.
North Korea test-launched a ballistic missile on July 4th that demonstrated an astonishing advance in the unpredictable nation’s capabilities. The United States denounced the testing in unusually harsh terms and performed military exercises with allies in the region as more tests followed. In the meantime, Harvey, Irma and Maria threatened, then punished Texas, Florida and Puerto Rico with significant damage. Neither the heightened geopolitical tensions nor the potential economic implications of the storms made a lasting impression on investors.
Then, late in the quarter, came the Federal Reserve (the Fed). Nearly a decade after global markets plunged into history-making crisis, the Fed announced it would begin unwinding some of the $4.5 trillion balance sheet that was the centerpiece of the central bank’s post-crisis stimulus efforts. That, too, was digested by the stock market without incident.
Some market watchers credited prospects for corporate tax cuts with buoying the market’s mood in the turbulent macro conditions. Though a tax reform blueprint was unveiled, it was done with only a couple trading days left in the quarter, so it’s hard to imagine tax-related optimism playing a much more pronounced role than in it did in the first six months of the year.
Rather than fret about an unpredictable threat or celebrate a “good for business” proposal that, during the timeframe, lacked detail on substance and support, investors appeared focused on near-term earnings trends. Earnings progress continued against a steady, albeit slow-growing, economic backdrop.
Share price action seemed rational and company-specific in the September quarter. Companies that delivered on the earnings front and showed signs of continuing in the right direction drew positive investor attention. Companies that disappointed and/or tempered expectations for the future did not.
Brandywine Mid Cap Growth posted gains in all eight of the economic sectors represented in the Fund’s portfolio during the September quarter. The Fund outperformed its primary benchmark, the Russell Midcap® Growth Index, in six out of those eight sectors.
Holdings from the industrial sector contributed the most to results relative to the benchmark in the September quarter, with United Rentals among the strongest performers. The equipment rental company credited high utilization rates and firm pricing for its expectation-beating, June-quarter results. Storm damage in the south promised to increase demand.
Mercury Systems, MasTec and Huntington Ingalls Industries, which all exceeded June-quarter earnings estimates, also contributed to results. The industrial sector was the second biggest contributor to absolute performance.
Outperformance among consumer discretionary holdings also contributed to the Fund’s relative performance advantage over its benchmark in the quarter. The sector was the third greatest contributor to absolute performance.
Discount retailer Dollar Tree and children’s apparel retailer Children’s Place were standouts. Dollar Tree grew earnings 24 percent in the July quarter, exceeding the consensus estimate by 14 percent. Children’s Place earned $0.86 per share in the July quarter, up from a $0.01 loss in the year-ago period. The company also exceeded the consensus estimate by 14 percent.
Holdings from the energy sector, where exposure was limited to two companies, and the health care sector, which represented the second largest portfolio position, were also material contributors to results versus the Russell Midcap® Growth Index. Exploration and production company Kosmos Energy and biotechnology company Alexion Pharmaceuticals were the top contributors from the energy and health care sectors, respectively.
Technology holdings, although the biggest contributors to absolute results, were the greatest detractors from relative performance. The technology sector comprised the largest percentage of assets and represented an overweight position relative to the benchmark.
Upside driven by semiconductor-related holdings, including Nvidia Corp. and Microchip Technology, was limited by weakness in communications equipment holdings. Ciena Corp. and Finisar Corp. were the primary detractors. Both companies make equipment used in fiber optic network infrastructure, and both companies lowered revenue guidance for the three months through October.
Dycom Industries also weighed on overall results. In another sign of slowing in the telecommunications space, the industrial company that performs construction and engineering services for telecom companies also reduced guidance for the upcoming quarter. Ulta Beauty was the most significant performance detractor. The company exceeded July-quarter expectations, but its shares fell due to concerns about competitive pressure from Amazon. For more information on companies that influenced September-quarter performance, please see Roses & Thorns on page 7.
We’re working hard to build on recent results. Your entire Friess team joins me in sending best wishes.

Scott Gates
Chief Investment Officer
Friess Associates, LLC
About Your Fund’s Expenses
As a shareholder of a Fund, you may incur two types of costs: (1) transaction costs, which may include sales charges (loads) on purchase payments; redemption fees; and exchange fees; and (2) ongoing costs, including management fees; distribution (12b-1) fees; and other Fund expenses. This example is intended to help you understand your ongoing costs (in dollars) of investing in the Fund and to compare these costs with the ongoing costs of investing in other mutual funds. The example is based on $1,000 invested at the beginning of the period and held for the entire period as indicated below.
ACTUAL EXPENSES
The first line of the following table provides information about the actual account values and actual expenses. You may use the information in this line, together with the amount you invested, to estimate the expenses that you paid over the period. Simply divide your account value by $1,000 (for example, an $8,600 account value divided by $1,000 = 8.6), then multiply the result by the number in the first line under the heading entitled “Expenses Paid During Period” to estimate the expenses you paid on your account during this period.
HYPOTHETICAL EXAMPLE FOR COMPARISON PURPOSES
The second line of the following table provides information about hypothetical account values and hypothetical expenses based on the Fund’s actual expense ratio and an assumed annual rate of return of 5% before expenses, which is not the Fund’s actual return. The hypothetical account values and expenses may not be used to estimate the actual ending account balance or expenses you paid for the period. You may use this information to compare the ongoing costs of investing in the Fund and other funds by comparing this 5% hypothetical example with the 5% hypothetical examples that appear in the shareholder reports of other funds.
Please note that the expenses shown in the table are meant to highlight your on going costs only and do not reflect any transactional costs, such as sales charges (loads), redemption fees, or exchange fees. Therefore, the second line of the table is useful in comparing ongoing costs only, and will not help you determine the relative total costs of owning different funds.
| | | | | | | | | | | | | | | | |
| Six Months Ended September 30, 2017 | | Expense Ratio for the Period | | | Beginning Account Value 04/01/17 | | | Ending Account Value 09/30/17 | | | Expenses Paid During the Period* | |
AMG Managers Brandywine Advisors Mid Cap Growth Fund | | | | | |
Based on Actual Fund Return | | | 1.13 | % | | $ | 1,000 | | | $ | 1,114 | | | $ | 5.99 | |
Hypothetical (5% return before expenses) | | | 1.13 | % | | $ | 1,000 | | | $ | 1,019 | | | $ | 5.72 | |
| * | Expenses are equal to the Fund’s annualized expense ratio multiplied by the average account value over the period, multiplied by the number of days in the most recent fiscal half-year (183), then divided by 365. |
AMG Managers Brandywine Advisors Mid Cap Growth Fund
Portfolio Manager’s Comments (unaudited)
The fiscal year began with momentum. Roughly seven-and-a-half years and counting, the bull market was bolstering its status as the second-longest run of all time one quarter after the other. Major market indexes notched four consecutive quarters of positive returns in the year prior to fiscal 2017.
The stock market reflected optimism and relative calm among investors throughout most of the fiscal year. Sentiment, even when challenged by macro factors with market-moving potential, remained biased toward the bright side.
AMG Managers Brandywine Advisors Mid Cap Growth Fund (“Brandywine Advisors”) employs an investment strategy that emphasizes individual-company fundamentals as the primary influence on stock prices. While there were periods during the fiscal year when share prices seemed to move for other reasons, the environment was generally good for bottom-up investors. Brandywine Advisors grew 19.25 percent in the 12 months through September 30, 2017.
The period started during the climactic months of the 2016 presidential election cycle. While the December quarter of 2016 included its fair share of potentially market-moving events, including a landmark pact among major oil-producing nations to curb output and the first interest rate hike in a year, nothing proved capable of trumping the presidential election’s influence on stocks. The election outcome was well-received by investors, and the reaction to it reflected the market’s best guesses as to how the landscape might change under the new administration.
Political themes shaped performance, with investors betting that the financial sector would
benefit from looser regulation and the industrial sector would enjoy demand fueled by infrastructure spending. The consumer discretionary sector, where the Fund identified considerable near-term earnings strength, drew less enthusiasm as investors identified the sector as likely to face costs related to import tariffs that were part of the new administration’s economic talking points. The Fund posted a modest gain in the quarter.
High hopes for business-friendly actions from the White House kept the mood mainly upbeat in the March quarter of 2017. Optimism regarding the Trump administration’s pro-growth promises on taxation, deregulation and infrastructure spending remained the prevailing theme.
Technology and health care holdings drove performance. Energy holdings weighed on results as falling oil prices raised investor concerns about the staying power of a fledgling profit recovery in the energy sector. Brandywine Advisors generated a solid March-quarter return.
The market’s move higher proved to be persistent in the June quarter, with stocks gaining ground despite political drama stemming from the controversial dismissal of the director of the F.B.I., rising questions about the ability of Congress to advance the new administration’s legislative priorities and the Federal Reserve’s third interest rate increase since December.
It was a strong quarter for technology stocks. Health care holdings also aided the cause. Meanwhile, energy holdings weighed on results as oil prices declined anew. With gains broadly distributed, the Fund added to the progress it made in the previous six months.
Investors remained undeterred in the final three months of the fiscal year. Despite test missile launches from North Korea, damaging hurricanes in the Caribbean and southern United States, and an announcement from the Federal Reserve that it would begin reversing its post-crisis stimulus, stocks continued an orderly climb in the September quarter. Of the fiscal year’s four quarters, this one was the Fund’s best.
Industrial and consumer discretionary holdings were standout performers. All eight economic sectors represented in the Fund’s portfolio gained ground during the period.
For the entire fiscal year, technology holdings, which comprised the largest position throughout the period, contributed the most to performance, accounting for more than half of total return. Health care holdings, the Fund’s second largest position, were the next most significant contributors.
Energy was the only sector to decline during the fiscal year. The energy and financial sectors, which were among the smallest in the Fund, detracted the most from relative results.
Turns out the market maintained the momentum with which it began the fiscal year. Major indexes, and Brandywine Advisors, posted positive returns in all four quarters.
This commentary reflects the viewpoints of Friess Associates, LLC as of September 30, 2017 and is not intended as a forecast or guarantee of future results.
AMG Managers Brandywine Advisors Mid Cap Growth Fund
Portfolio Manager’s Comments (continued)
CUMULATIVE TOTAL RETURN PERFORMANCE
AMG Managers Brandywine Advisors Mid Cap Growth Fund’s cumulative total return is based on the daily change in net asset value (NAV), and assumes that all dividends and distributions were reinvested. The graph compares a hypothetical $10,000 investment made in the Fund’s Class N shares on September 30, 2007, to a $10,000 investment made in the Russell Midcap® Growth Index, Russell Midcap® Index and S&P 500 Index for the same time period. The graph and table do not reflect the deduction of taxes that a shareholder would pay on a Fund distribution or redemption of shares. The listed returns for the Fund are net of expenses and the returns for the index exclude expenses. Total returns would have been lower had certain expenses not been reduced.
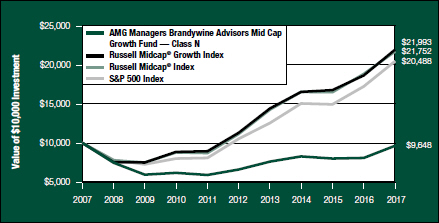
The table below shows the average annual total returns for the AMG Managers Brandywine Advisors Mid Cap Growth Fund and the Russell Midcap® Growth Index, Russell Midcap® Index and S&P 500 Index for the same time periods ended September 30, 2017.
| | | | | | | | | | | | |
| Average Annual Total Returns1 | | One
Year | | | Five
Years | | | Ten
Years | |
AMG Managers Brandywine Advisors Mid Cap Growth Fund2,3,4,5,6,7,8 | | | 19.25 | % | | | 7.90 | % | | | (0.36 | )% |
Russell Midcap® Growth Index9,12 | | | 17.82 | % | | | 14.18 | % | | | 8.20 | % |
Russell Midcap® Index10,12 | | | 15.32 | % | | | 14.26 | % | | | 8.08 | % |
S&P 500 Index11,12 | | | 18.61 | % | | | 14.22 | % | | | 7.44 | % |
The performance data shown represents past performance. Past performance is not a guarantee of future results. Current performance may be lower or higher than the performance data quoted. The investment return and principal value of an investment will fluctuate so that an investor’s shares, when redeemed, may be worth more or less than their original cost.
Investors should carefully consider the Fund’s investment objectives, risks, charges, and expenses before investing. For performance information through the most recent month end, current net asset values per share for the Fund and other information, please call 800.835.3879 or visit our website at www.amgfunds.com for a free prospectus. Read it carefully before investing or sending money.
Distributed by AMG Distributors, Inc., member FINRA/SIPC.
| 1 | Total return equals income yield plus share price change and assumes reinvestment of all dividends and capital gain distributions. Returns are net of fees and may reflect offsets of Fund expenses as described in the Prospectus. No adjustment has been made for taxes payable by shareholders on their reinvested dividends and capital gain distributions. Returns for periods greater than one year are annualized. The listed returns on the Fund are net of expenses and based on the published NAV as of September 30, 2017. All returns are in U.S. dollars ($). |
| 2 | The Fund inception dates and returns for all periods beginning prior to October 1, 2013 reflect performance of the predecessor Fund, Brandywine Advisors Midcap Growth Fund, and was managed by Friess Associates, LLC with the same investment objectives and substantially similar investment policies. |
| 3 | The Fund is subject to risks associated with investments in mid-capitalization companies such as greater price volatility, lower trading volume, and less liquidity than the stocks of larger, more established companies. |
| 4 | Active and frequent trading of a fund may result in higher transaction costs and increased tax liability. |
| 5 | A greater percentage of the Fund’s holdings may be focused in a smaller number of securities which may place the Fund at greater risk than a more diversified fund. |
| 6 | The Fund invests in growth stocks, which may be more sensitive to market movements because their prices tend to reflect future investor expectations rather than just current profits. |
| 7 | Investments in international securities are subject to certain risks of overseas investing including currency fluctuations and changes in political and economic conditions, which could result in significant market fluctuations. |
| 8 | Effective October 1, 2016, the Fund’s shares were reclassified and redesignated to Class N. |
| 9 | The Russell Midcap® Growth Index measures the performance of the Russell Midcap companies with higher price/book ratios and higher forecasted growth values. The stocks are also members of the Russell 1000® Growth Index. |
| 10 | The Russell Midcap® Index measures the performance of the 800 smallest companies in the Russell 1000® Index, which represent approximately 25% of the total market capitalization of the Russell 1000® Index. |
| 11 | The S&P 500 Index is a capitalization-weighted index of 500 stocks. The S&P 500 Index is designed to measure performance of the broad domestic economy through changes in the aggregate market value of 500 stocks representing all major industries. |
| 12 | Unlike the Fund, the indices are unmanaged, are not available for investment, and do not incur expenses. |
The Russell Indices are trademarks of the London Stock Exchange Group companies.
The S&P 500 Index is proprietary data of Standard & Poor’s, a division of McGraw-Hill Companies, Inc. All rights reserved.
Not FDIC insured, nor bank guaranteed. May lose value.
AMG Managers Brandywine Advisors Mid Cap Growth Fund
Fund Snapshots (unaudited)
September 30, 2017
PORTFOLIO BREAKDOWN
| | | | | | | | | | | | | | | | |
Industry (Top Ten) | | Brandywine
Advisors
Mid Cap
Growth
Fund* | | | Russell
Midcap®
Growth
Index | | | Russell
Midcap®
Index | | | S&P
500
Index | |
Semiconductors | | | 9.9 | % | | | 4.5 | % | | | 2.3 | % | | | 3.3 | % |
Life Sciences Tools & Services | | | 8.8 | % | | | 2.9 | % | | | 1.9 | % | | | 0.8 | % |
Data Processing & Outsourced Services | | | 8.5 | % | | | 6.4 | % | | | 3.1 | % | | | 2.6 | % |
General Merchandise Stores | | | 5.1 | % | | | 0.9 | % | | | 0.6 | % | | | 0.3 | % |
Apparel Retail | | | 4.0 | % | | | 1.1 | % | | | 0.8 | % | | | 0.4 | % |
Construction & Engineering | | | 3.5 | % | | | 0.0 | % | | | 0.4 | % | | | 0.1 | % |
Pharmaceuticals | | | 2.9 | % | | | 1.2 | % | | | 1.0 | % | | | 4.9 | % |
Biotechnology | | | 2.6 | % | | | 3.2 | % | | | 1.6 | % | | | 3.2 | % |
Oil & Gas Exploration & Production | | | 2.5 | % | | | 1.5 | % | | | 3.1 | % | | | 1.4 | % |
Construction Machinery & Heavy Trucks | | | 2.4 | % | | | 0.8 | % | | | 1.3 | % | | | 0.6 | % |
Other Common Stock | | | 46.8 | % | | | 77.5 | % | | | 83.9 | % | | | 82.4 | % |
Cash & Cash Equivalents† | | | 3.0 | % | | | 0.0 | % | | | 0.0 | % | | | 0.0 | % |
| * | As a percentage of net assets. |
| † | Includes Other Assets and Liabilities. |
TOP TEN HOLDINGS
| | | | | | | | |
Security Name | | %of
Net Assets | | | %Change
from
Book Cost | |
Dollar Tree, Inc. | | | 3.4 | % | | | 20.6 | % |
Alexion Pharmaceuticals, Inc.** | | | 2.6 | % | | | 38.0 | % |
Vantiv, Inc., Class A** | | | 2.5 | % | | | 53.1 | % |
Kosmos Energy, Ltd. | | | 2.5 | % | | | 17.8 | % |
Broadcom, Ltd.** | | | 2.5 | % | | | 176.8 | % |
Illumina, Inc. | | | 2.5 | % | | | 18.0 | % |
Oshkosh Corp. | | | 2.4 | % | | | 18.3 | % |
Albemarle Corp. | | | 2.4 | % | | | 50.1 | % |
Arista Networks, Inc. | | | 2.3 | % | | | 103.1 | % |
United Rentals, Inc. | | | 2.3 | % | | | 13.0 | % |
| | | | | | | | |
Top Ten as a Group | | | 25.4 | % | | | | |
| | | | | | | | |
| ** | Also Top Ten Holding as of June 30, 2017. |
PORTFOLIO MARKET CAPITALIZATION
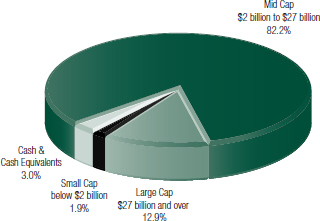
ESTIMATED EARNINGS GROWTH RATE
OF THE FUND’S INVESTMENTS
Forecasted Increase in Earnings Per Share 2017 vs 2016
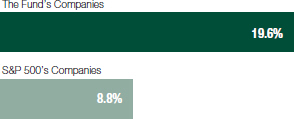
Source: Consensus estimates from FactSet Research Systems Inc.
This is not a forecast of the Fund’s future performance. Earnings growth for a Fund holding does not guarantee a corresponding increase in the market value of the holding or the Fund.
Because a fund’s strategy may result in multiple investments in particular sectors of the economy, its performance may depend on the performance of those sectors and may fluctuate more widely than investments diversified across more sectors. For additional information on these and other risk considerations, please see the Fund’s prospectus.
Any sectors, industries, or securities discussed should not be perceived as investment recommendations. Mention of a specific security should not be considered a recommendation to buy or solicitation to sell that security. Specific securities mentioned in this report may have been sold from the Fund’s portfolio of investments by the time you receive this report.
AMG Managers Brandywine Advisors Mid Cap Growth Fund
Roses & Thorns (unaudited)
Quarter Ending September 30, 2017
| | | | | | |
$ Gain
(in millions) | | % Gain | | Biggest $ Winners Reason for Move |
| | | | Dollar Tree Inc. (DLTR) | | |
| $0.7 | | 20.7% | | The discount variety store operator grew July-quarter earnings 24 percent, topping the consensus estimate. At 3.9 percent, Dollar Tree enjoyed better-than-expected growth in same-store sales. Improved traffic at the company’s Family Dollar unit was a notable contributor. |
| | | |
| | | | Albemarle Corp. (ALB) | | |
| $0.7 | | 29.2% | | The global developer, manufacturer and marketer of highly engineered specialty chemicals grew June-quarter earnings 21 percent, exceeding the consensus estimate. Albemarle reaffirmed 2017 earnings guidance and noted that new lithium production capacity it plans to add this year and next should support profit margins and earnings growth. |
| | | |
| | | | Arista Networks Inc. (ANET) | | |
| $0.6 | | 26.6% | | The cloud networking solutions provider grew June-quarter earnings 81 percent, topping the consensus estimate. Revenue increased 51 percent, with new customer additions, new products and greater international penetration contributing to growth. Results showed Arista benefiting from the rapid adoption of its 100G equipment used in data centers. |
| | | |
| | | | Kosmos Energy Ltd. (KOS) | | |
| $0.6 | | 24.2% | | Already traded on the New York Stock Exchange, the oil and gas exploration and production company expanded its exposure to European investors by adding a listing on the London Stock Exchange. Joint venture partners, Kosmos and BP announced a significant oil find offshore Senegal earlier this year. Kosmos reported that it plans to drill five more wells by the end of 2018. |
| | | |
| | | | NVIDIA Corp. (NVDA) | | |
| $0.6 | | 19.5% | | The maker of computer graphics processors grew July-quarter earnings 130 percent, exceeding the consensus estimate. Revenue increased 56 percent. Chipset sales for gaming applications and crypto currency were strong. NVIDIA also raised its September-quarter revenue forecast. |
| | | |
| $ Loss | | | | | | |
| (in millions) | | % Loss | | Biggest $ Losers Reason for Move |
| | | | Ulta Beauty Inc. (ULTA) | | |
| $0.5 | | 21.3% | | The beauty supply retailer, which offers cosmetics, fragrance, skin and hair care products, and salon services, grew July-quarter earnings 28 percent, exceeding the consensus estimate. Ulta eliminated previously offered promotions, resulting in increased profit margins and stronger same store sales. Shares came under pressure as Amazon increased its presence in the beauty space. |
| | | |
| | | | Finisar Corp. (FNSR) | | |
| $0.4 | | 15.6% | | The manufacturer of fiber optic subsystems and components reported July-quarter earnings of $0.40 per share. Shares declined when the company provided October-quarter guidance below expectations due to production delays in 3-D sensing and weakness in equipment sales in Chinese markets. We sold Finisar to fund a new opportunity with greater visibility. |
| | | |
| | | | Ciena Corp. (CIEN) | | |
| $0.3 | | 13.2% | | The provider of network and communications infrastructure equipment grew July-quarter earnings 21 percent, topping the consensus estimate. Shares traded lower when management lowered its October-quarter revenue forecast due to weaker government spending and slower growth in the overall optical market. We sold Ciena to fund a new opportunity with better visibility. |
| | | |
| | | | Hologic Inc. (HOLX) | | |
| $0.3 | | 12.6% | | The maker of diagnostic products, medical imaging systems and surgical supplies reported June-quarter earnings per share of $0.50, exceeding the consensus estimate. The company lowered revenue guidance for the year due to slower-than-expected organic growth. We sold Hologic to fund a new opportunity with better visibility. |
| | | |
| | | | Dycom Industries Inc. (DY) | | |
| $0.2 | | 8.9% | | The engineering and construction company focused on utilities infrastructure reported July-quarter earnings of $1.47 per share, exceeding the consensus estimate. Shares traded lower when the company reduced earnings guidance due to slower customer spending. We sold Dycom to fund a new purchase. |
All gains/losses are calculated on an average cost basis from June 30, 2017 through September 30, 2017.
This commentary reflects the viewpoints of Friess Associates, LLC as of September 30, 2017 and is not intended as a forecast or guarantee of future results.
AMG Managers Brandywine Advisors Mid Cap Growth Fund
Schedule of Portfolio Investments
September 30, 2017
| | | | | | | | | | | | |
| Shares | | | | | Cost | | | Value | |
| | Common Stocks - 97.0% | | | | | | | | |
| | Consumer Discretionary | | | | | | | | |
| | | | Apparel Retail - 4.0% | |
| | 191,990 | | | American Eagle Outfitters, Inc. | | $ | 2,570,591 | | | $ | 2,745,457 | |
| | 20,500 | | | The Children’s Place, Inc.1 | | | 2,290,541 | | | | 2,422,075 | |
| | | | Apparel, Accessories & Luxury Goods - 1.6% | |
| | 16,450 | | | PVH Corp. | | | 2,073,447 | | | | 2,073,687 | |
| | | | Cable & Satellite - 1.9% | |
| | 6,618 | | | Charter Communications, Inc., Class A* | | | 1,546,808 | | | | 2,405,114 | |
| | | | Footwear - 2.0% | |
| | 89,700 | | | Wolverine World Wide, Inc. | | | 2,511,526 | | | | 2,587,845 | |
| | | | General Merchandise Stores - 5.1% | |
| | 50,215 | | | Dollar Tree, Inc.* | | | 3,613,621 | | | | 4,359,666 | |
| | 48,540 | | | Ollie’s Bargain Outlet Holdings, Inc.* | | | 2,123,071 | | | | 2,252,256 | |
| | | | Hotels, Resorts & Cruise Lines - 0.9% | |
| | 31,495 | | | Hilton Grand Vacations, Inc.* | | | 1,104,498 | | | | 1,216,652 | |
| | | | Household Appliances - 2.0% | |
| | 27,020 | | | Helen of Troy, Ltd.* | | | 2,501,255 | | | | 2,618,238 | |
| | | | Internet & Direct Marketing Retail - 1.3% | |
| | 24,125 | | | Wayfair, Inc., Class A* | | | 1,700,813 | | | | 1,626,025 | |
| | | | Movies & Entertainment - 2.0% | |
| | 69,075 | | | Liberty Media Corp.-Liberty Formula One, Class C* | | | 2,484,790 | | | | 2,631,067 | |
| | | | Specialty Stores - 1.4% | |
| | 7,989 | | | Ulta Beauty, Inc.* | | | 1,983,587 | | | | 1,805,993 | |
| | | | | | | | | | | | |
| | Total Consumer Discretionary | | | 26,504,548 | | | | 28,744,075 | |
| | | | This sector is 8.4% above your Fund’s cost. | | | | | |
| | Consumer Staples | | | | | | | | |
| | | | Food Distributors - 1.9% | |
| | 89,070 | | | Performance Food Group Co.* | | | 2,108,373 | | | | 2,516,227 | |
| | | | Packaged Foods & Meats - 1.7% | |
| | 153,035 | | | Nomad Foods, Ltd.* | | | 2,204,854 | | | | 2,229,720 | |
| | | | Personal Products - 2.3% | |
| | 27,300 | | | The Estee Lauder Cos., Inc., Class A | | | 2,322,064 | | | | 2,944,032 | |
| | | | | | | | | | | | |
| | Total Consumer Staples | | | 6,635,291 | | | | 7,689,979 | |
| | | | This sector is 15.9% above your Fund’s cost. | | | | | |
| | Energy | | | | | | | | |
| | | | Oil & Gas Exploration & Production - 2.5% | |
| | 402,715 | | | Kosmos Energy, Ltd.*,1 | | | 2,721,835 | | | | 3,205,611 | |
| | | | Oil & Gas Refining & Marketing - 2.1% | |
| | 77,520 | | | HollyFrontier Corp. | | | 2,492,368 | | | | 2,788,394 | |
| | | | | | | | | | | | |
| | Total Energy | | | 5,214,203 | | | | 5,994,005 | |
| | | | This sector is 15.0% above your Fund’s cost. | | | | | |
| | | | | | | | | | | | |
| Shares | | | | | Cost | | | Value | |
| | Financials | | | | | | | | |
| | | | Consumer Finance - 2.0% | |
| | 53,000 | | | Green Dot Corp., Class A* | | $ | 2,554,070 | | | $ | 2,627,740 | |
| | | | This sector is 2.9% above your Fund’s cost. | | | | | |
| | Health Care | | | | | | | | |
| | | | Biotechnology - 2.6% | |
| | 23,905 | | | Alexion Pharmaceuticals, Inc.* | | | 2,430,138 | | | | 3,353,632 | |
| | | | Health Care Equipment - 2.0% | |
| | 29,020 | | | Penumbra, Inc.*,1 | | | 2,369,625 | | | | 2,620,506 | |
| | | | Life Sciences Tools & Services - 8.8% | |
| | 20,981 | | | Bio-Techne Corp. | | | 2,427,672 | | | | 2,536,393 | |
| | 15,950 | | | Illumina, Inc.* | | | 2,691,852 | | | | 3,177,240 | |
| | 36,200 | | | PRA Health Sciences, Inc.* | | | 2,324,272 | | | | 2,757,354 | |
| | 15,631 | | | Thermo Fisher Scientific, Inc. | | | 2,064,412 | | | | 2,957,385 | |
| | | | Pharmaceuticals - 2.9% | |
| | 19,665 | | | Prestige Brands Holdings, Inc.* | | | 1,033,465 | | | | 985,020 | |
| | 43,800 | | | Zoetis, Inc. | | | 2,351,483 | | | | 2,792,688 | |
| | | | | | | | | | | | |
| | Total Health Care | | | 17,692,919 | | | | 21,180,218 | |
| | | | This sector is 19.7% above your Fund’s cost. | | | | | |
| | Industrials | | | | | | | | |
| | | | Aerospace & Defense - 1.4% | |
| | 36,154 | | | Mercury Systems, Inc.* | | | 1,513,518 | | | | 1,875,670 | |
| | | | Construction & Engineering - 3.5% | |
| | 59,670 | | | MasTec, Inc.* | | | 2,369,265 | | | | 2,768,688 | |
| | 45,840 | | | Quanta Services, Inc.* | | | 1,662,108 | | | | 1,713,041 | |
| | | | Construction Machinery & Heavy Trucks - 2.4% | |
| | 37,500 | | | Oshkosh Corp. | | | 2,615,540 | | | | 3,095,250 | |
| | | | Trading Companies & Distributors - 2.3% | |
| | 21,380 | | | United Rentals, Inc.* | | | 2,626,009 | | | | 2,966,261 | |
| | | | Trucking - 2.0% | | | | | | | | |
| | 67,680 | | | Avis Budget Group, Inc.*,1 | | | 2,582,618 | | | | 2,575,901 | |
| | | | | | | | | | | | |
| | Total Industrials | | | 13,369,058 | | | | 14,994,811 | |
| | | | This sector is 12.2% above your Fund’s cost. | | | | | |
| | Information Technology | | | | | | | | |
| | | | Application Software - 2.0% | |
| | 73,452 | | | Atlassian Corp. PLC, Class A* | | | 2,231,206 | | | | 2,581,838 | |
| | | | Communications Equipment - 2.3% | |
| | 15,911 | | | Arista Networks, Inc.* | | | 1,485,424 | | | | 3,016,885 | |
| | | | Data Processing & Outsourced Services - 8.5% | |
| | 57,976 | | | Black Knight Financial Services, Inc., Class A*,1 | | | 1,508,143 | | | | 2,495,867 | |
| | 62,285 | | | Blackhawk Network Holdings, Inc.* | | | 2,574,016 | | | | 2,728,083 | |
| | 26,570 | | | Global Payments, Inc. | | | 1,895,729 | | | | 2,524,947 | |
| | 45,824 | | | Vantiv, Inc., Class A*,1 | | | 2,108,842 | | | | 3,229,217 | |
|
The accompanying notes are an integral part of these financial statements. 8 |
AMG Managers Brandywine Advisors Mid Cap Growth Fund
Schedule of Portfolio Investments (continued)
| | | | | | | | | | | | |
Shares | | | | | Cost | | | Value | |
| | Information Technology (continued) | |
| | | | Electronic Components - 1.9% | | | | | |
| | 18,680 | | | Universal Display Corp. | | $ | 1,107,359 | | | $ | 2,406,918 | |
| | | | Home Entertainment Software - 1.7% | |
| | 21,000 | | | Take-Two Interactive Software, Inc.* | | | 1,985,239 | | | | 2,146,830 | |
| | | | Internet Software & Services - 2.1% | |
| | 25,000 | | | LogMeln, Inc. | | | 2,531,787 | | | | 2,751,250 | |
| | | | Semiconductors - 9.9% | |
| | 191,550 | | | Advanced Micro Devices, Inc.*,1 | | | 2,195,621 | | | | 2,442,262 | |
| | 13,185 | | | Broadcom, Ltd. | | | 1,155,180 | | | | 3,197,890 | |
| | 28,300 | | | Microchip Technology, Inc.1 | | | 2,439,873 | | | | 2,540,774 | |
| | 11,193 | | | NVIDIA Corp. | | | 1,249,604 | | | | 2,000,973 | |
| | 37,200 | | | Xilinx, Inc. | | | 2,408,771 | | | | 2,634,876 | |
| | | | Systems Software - 1.6% | | | | | |
| | 18,058 | | | ServiceNow, Inc.* | | | 1,430,780 | | | | 2,122,357 | |
| | | | Technology Hardware, Storage &
Peripherals - 2.0% | | | | | |
| | 30,256 | | | Western Digital Corp. | | | 2,182,713 | | | | 2,614,118 | |
| | | | | | | | | | | | |
| | Total Information Technology | | | 30,490,287 | | | | 41,435,085 | |
| | | | This sector is 35.9% above your Fund’s cost. | | | | | |
| | Materials | | | | | | | | |
| | | | Specialty Chemicals - 2.4% | |
| | 22,476 | | | Albemarle Corp. | | | 2,040,603 | | | | 3,063,704 | |
| | | | This sector is 50.1% above your Fund’s cost. | | | | | |
| | Total Common Stocks | | | 104,500,979 | | | | 125,729,617 | |
| | | |
Principal
Amount | | | | | | | | | |
| | Short-Term Investments - 11.3% | | | | | | | | |
| | Repurchase Agreements - 8.6%2 | | | | | |
| | $558,055 | | | Citibank N.A., dated 09/29/17, due 10/02/17, 1.060% total to be received $558,104 (collateralized by various U.S. Government Agency Obligations, 0.000% - 8.000%, 10/05/17 - 05/15/46, totaling $569,216) | | | 558,055 | | | | 558,055 | |
| | 2,652,332 | | | Daiwa Capital Markets America, dated 09/29/17, due 10/02/17, 1.070% total to be received $2,652,568 (collateralized by various U.S. Government Agency Obligations, 0.000% - 6.500%, 10/12/17 - 12/01/51, totaling $2,705,379) | | | 2,652,332 | | | | 2,652,332 | |
| | | | | | | | | | | | |
Principal
Amount | | | | | Cost | | | Value | |
| | $2,652,332 | | | Merrill Lynch Pierce Fenner & Smith, Inc., dated 09/29/17, due 10/02/17, 1.070% total to be received $2,652,568 (collateralized by various U.S. Government Agency Obligations, 1.830% - 4.500%, 01/01/26 - 07/15/52, totaling $2,705,379) | | $ | 2,652,332 | | | $ | 2,652,332 | |
| | 2,652,332 | | | Nomura Securities International, Inc., dated 09/29/17, due 10/02/17, 1.080% total to be received $2,652,571 (collateralized by various U.S. Government Agency Obligations, 0.000% - 9.000%, 11/15/17 - 08/20/67, totaling $2,705,379) | | | 2,652,332 | | | | 2,652,332 | |
| | 2,652,332 | | | RBC Dominion Securities, Inc., dated 09/29/17, due 10/02/17, 1.050% total to be received $2,652,564 (collateralized by various U.S. Government Agency Obligations, 0.125% - 7.000%, 02/08/18 - 08/20/47, totaling $2,705,379) | | | 2,652,332 | | | | 2,652,332 | |
| | | | | | | | | | | | |
| | Total Repurchase Agreements | | | 11,167,383 | | | | 11,167,383 | |
| | | |
| Shares | | | | | | | | | |
| | Other Investment Companies - 2.7% | | | | | | | | |
| | 3,425,792 | | | Dreyfus Government Cash Management Fund, Institutional Class Shares, 0.92%3 | | | 3,425,792 | | | | 3,425,792 | |
| | | | | | | | | | | | |
| | Total Short-Term Investments | | | 14,593,175 | | | | 14,593,175 | |
| | Total Investments - 108.3% | | $ | 119,094,154 | | | | 140,322,792 | |
| | | | | | | | | | | | |
| | Other Assets, less Liabilities - (8.3)% | | | | | | | (10,790,401 | ) |
| | Total Net Assets - 100.0% | | | | | | $ | 129,532,391 | |
| | | | | | | | | | | | |
|
The accompanying notes are an integral part of these financial statements. 9 |
Notes to Schedule of Portfolio Investments (unaudited)
The following footnotes should be read in conjunction with the Schedule of Portfolio Investments previously presented in this report.
| * | Non-income producing security. |
| 1 | Some or all of these securities, amounting to a market value of $10,896,187, or 8.4% of net assets, were out on loan to various brokers. |
| 2 | Collateral received from brokers for securities lending was invested in these joint repurchase agreements. |
| 3 | Yield shown represents the September 30, 2017, seven-day average yield, which refers to the sum of the previous seven days’ dividends paid, expressed as an annual percentage. |
The following table summarizes the inputs used to value the Fund’s investments by the fair value hierarchy levels as of September 30, 2017: (See Note 1(a) in the Notes to the Financial Statements.)
| | | | | | | | | | | | | | | | |
| | | Level 1 | | | Level 2 | | | Level 3 | | | Total | |
AMG Managers Brandywine Advisors Mid Cap Growth Fund | | | | | | | | | | | | | | | | |
Investments in Securities | | | | | | | | | | | | | | | | |
Common Stocks† | | $ | 125,729,617 | | | | — | | | | — | | | $ | 125,729,617 | |
Short-Term Investments | | | | | | | | | | | | | | | | |
Repurchase Agreements | | | — | | | $ | 11,167,383 | | | | — | | | | 11,167,383 | |
Other Investment Companies | | | 3,425,792 | | | | — | | | | — | | | | 3,425,792 | |
| | | | | | | | | | | | | | | | |
Total Investments in Securities | | $ | 129,155,409 | | | $ | 11,167,383 | | | | — | | | $ | 140,322,792 | |
| | | | | | | | | | | | | | | | |
| † | All common stocks held in the Fund are Level 1 securities. For a detailed breakout of common stocks by major industry classification, please refer to the Schedule of Portfolio Investments. |
As of September 30, 2017, the Fund had no transfers between levels from the beginning of the reporting period.
|
The accompanying notes are an integral part of these financial statements. 10 |
AMG Managers Brandywine Advisors Mid Cap Growth Fund
Statement of Assets and Liabilities
September 30, 2017
| | | | |
Assets: | | | | |
Investments at value* (including securities on loan valued at $10,896,187) | | $ | 140,322,792 | |
Receivable for investments sold | | | 2,416,197 | |
Dividend, interest and other receivables | | | 42,039 | |
Receivable from affiliate | | | 4,484 | |
Prepaid expenses | | | 5,134 | |
Total assets | | | 142,790,646 | |
Liabilities: | | | | |
Payable upon return of securities loaned | | | 11,167,383 | |
Payable for investments purchased | | | 1,923,122 | |
Accrued expenses: | | | | |
Investment advisory and management fees | | | 92,192 | |
Administrative fees | | | 15,715 | |
Distribution fees - Class N# | | | 482 | |
Trustee fees and expenses | | | 1,353 | |
Other | | | 58,008 | |
Total liabilities | | | 13,258,255 | |
Net Assets | | $ | 129,532,391 | |
Net Assets Represent: | | | | |
Paid-in capital | | $ | 121,780,820 | |
Accumulated net investment loss | | | (599,149 | ) |
Accumulated net realized loss from investments | | | (12,877,918 | ) |
Net unrealized appreciation of investments | | | 21,228,638 | |
Net Assets | | $ | 129,532,391 | |
Shares outstanding - Class N# | | | 11,615,654 | |
Net asset value, offering and redemption price per share - Class N# | | $ | 11.15 | |
* Investments at cost | | $ | 119,094,154 | |
| # | Effective October 1, 2016, the Fund’s share class was reclassified and redesignated as described in Note 1 of the Notes to the Financial Statements. |
|
The accompanying notes are an integral part of these financial statements. 11 |
AMG Managers Brandywine Advisors Mid Cap Growth Fund
Statement of Operations
For the fiscal year ended September 30, 2017
| | | | |
Investment Income: | | | | |
Dividend income | | $ | 563,619 | |
Securities lending income | | | 23,223 | |
Interest income | | | 77,995 | |
Foreign withholding tax | | | (3,287 | ) |
Total investment income | | | 661,550 | |
Expenses: | | | | |
Investment advisory and management fees | | | 1,114,769 | |
Administrative fees | | | 190,017 | |
Shareholder servicing fees - Class N# | | | 3,482 | |
Distribution fees - Class N# | | | 5,827 | |
Professional fees | | | 48,712 | |
Registration fees | | | 38,364 | |
Reports to shareholders | | | 18,206 | |
Custodian fees | | | 12,912 | |
Trustee fees and expenses | | | 9,704 | |
Transfer agent fees | | | 3,983 | |
Miscellaneous | | | 5,640 | |
Total expenses | | | 1,451,616 | |
Net investment loss | | | (790,066 | ) |
Net Realized and Unrealized Gain: | | | | |
Net realized gain on investments | | | 17,852,140 | |
Net change in unrealized appreciation/depreciation of investments | | | 5,539,078 | |
Net realized and unrealized gain | | | 23,391,218 | |
Net increase in net assets resulting from operations | | $ | 22,601,152 | |
| # | Effective October 1, 2016, the Fund’s share class was reclassified and redesignated as described in Note 1 of the Notes to the Financial Statements. |
|
The accompanying notes are an integral part of these financial statements. 12 |
AMG Managers Brandywine Advisors Mid Cap Growth Fund
Statements of Changes in Net Assets
For the fiscal years ended September 30,
| | | | | | | | |
| | | 2017# | | | 2016 | |
Increase (Decrease) in Net Assets Resulting From Operations: | | | | | | | | |
Net investment loss | | $ | (790,066 | ) | | $ | (439,982 | ) |
Net realized gain (loss) on investments | | | 17,852,140 | | | | (14,380,438 | ) |
Net change in unrealized appreciation/depreciation of investments | | | 5,539,078 | | | | 15,124,137 | |
Net increase in net assets resulting from operations | | | 22,601,152 | | | | 303,717 | |
Capital Share Transactions - Class N: | | | | | | | | |
Proceeds from sale of shares | | | 221,949 | | | | 333,498 | |
Cost of shares repurchased | | | (26,084,214 | ) | | | (11,048,641 | ) |
Net decrease from capital share transactions | | | (25,862,265 | ) | | | (10,715,143 | ) |
Total decrease in net assets | | | (3,261,113 | ) | | | (10,411,426 | ) |
Net Assets: | | | | | | | | |
Beginning of year | | | 132,793,504 | | | | 143,204,930 | |
End of year | | $ | 129,532,391 | | | $ | 132,793,504 | |
End of year accumulated net investment loss | | $ | (599,149 | ) | | $ | (275,274 | ) |
| | | | | | | | |
Share Transactions - Class N: | | | | | | | | |
Sale of shares | | | 18,825 | | | | 37,820 | |
Shares repurchased | | | (2,613,175 | ) | | | (1,292,865 | ) |
Net decrease in shares | | | (2,594,350 | ) | | | (1,255,045 | ) |
| # | Effective October 1, 2016, the Fund’s share class was reclassified and redesignated as described in Note 1 of the Notes to the Financial Statements. |
|
The accompanying notes are an integral part of these financial statements. 13 |
AMG Managers Brandywine Advisors Mid Cap Growth Fund
Financial Highlights
For a share outstanding throughout each fiscal year
| | | | | | | | | | | | | | | | | | | | |
| | | For the fiscal years ended September 30, | |
| Class N | | 2017# | | | 2016 | | | 2015 | | | 20142 | | | 2013 | |
Net Asset Value, Beginning of Year | | $ | 9.35 | | | $ | 9.26 | | | $ | 9.59 | | | $ | 8.80 | | | $ | 7.63 | |
Income (loss) from Investment Operations: | | | | | | | | | | | | | | | | | | | | |
Net investment income (loss)1 | | | (0.06 | ) | | | (0.03 | ) | | | 0.03 | 3 | | | (0.05 | ) | | | (0.02 | ) |
Net realized and unrealized gain (loss) on investments | | | 1.86 | | | | 0.12 | | | | (0.36 | ) | | | 0.84 | | | | 1.20 | |
Total income (loss) from investment operations | | | 1.80 | | | | 0.09 | | | | (0.33 | ) | | | 0.79 | | | | 1.18 | |
Distributions to Shareholders from: | | | | | | | | | | | | | | | | | | | | |
Net investment income | | | — | | | | — | | | | — | | | | — | | | | (0.01 | ) |
Net Asset Value, End of Year | | $ | 11.15 | | | $ | 9.35 | | | $ | 9.26 | | | $ | 9.59 | | | $ | 8.80 | |
Total Return | | | 19.25 | % | | | 0.97 | % | | | (3.44 | )% | | | 8.98 | % | | | 15.43 | % |
Ratio of expenses to average net assets | | | 1.15 | % | | | 1.15 | % | | | 1.14 | % | | | 1.12 | % | | | 1.22 | % |
Ratio of net investment income (loss) to average net assets | | | (0.62 | )% | | | (0.33 | )% | | | 0.28 | % | | | (0.54 | )% | | | (0.20 | )% |
Portfolio turnover | | | 215 | % | | | 195 | % | | | 204 | % | | | 249 | % | | | 235 | % |
Net assets at end of year (000’s omitted) | | $ | 129,532 | | | $ | 132,794 | | | $ | 143,205 | | | $ | 148,847 | | | $ | 137,246 | |
| | | | | | | | | | | | | | | | | | | | |
Notes to Financial Highlights
| # | Effective October 1, 2016, the Fund’s shares were reclassified and redesignated to Class N shares. |
| 1 | Per share numbers have been calculated using average shares. |
| 2 | At the start of business October 1, 2013, AMG Managers Brandywine Advisors Midcap Growth Fund was re-organized into a fund of AMG Funds I. |
| 3 | Includes non-recurring dividends. Without these dividends, net investment loss per share would have been $(0.03). |
Notes to Financial Statements
September 30, 2017
1. SUMMARY OF SIGNIFICANT ACCOUNTING POLICIES
AMG Funds I (the “Trust”) is an open-end management investment company, organized as a Massachusetts business trust and registered under the Investment Company Act of 1940, as amended (the “1940 Act”). Currently, the Trust consists of a number of different funds, each having distinct investment management objectives, strategies, risks and policies. Included in this report is the AMG Managers Brandywine Advisors Mid Cap Growth Fund (the “Fund”).
A significant portion of the Fund’s holdings may be focused in a relatively small number of securities, which may make the Fund more volatile and subject to greater risk than a more diversified fund.
Effective October 1, 2016, the Fund’s shares were reclassified and redesignated to Class N shares. Please refer to a current prospectus for additional information.
The Fund’s financial statements are prepared in accordance with accounting principles generally accepted in the United States of America (“U.S. GAAP”), including accounting and reporting guidance pursuant to Accounting Standards Codification Topic 946 applicable to investment companies. U.S. GAAP requires management to make estimates and assumptions that affect the reported amounts of assets and liabilities and disclosure of contingent assets and liabilities at the date of the financial statements and the reported amounts of income and expenses during the reporting period. Actual results could differ from those estimates and such differences could be material. The following is a summary of significant accounting policies followed by the Fund in the preparation of their financial statements:
a. VALUATION OF INVESTMENTS
Equity securities traded on a national securities exchange or reported on the NASDAQ national market system (“NMS”) are valued at the last quoted sales price on the primary exchange or, if applicable, the NASDAQ official closing price or the official closing price of the relevant exchange or, lacking any sales, at the last quoted bid price or the mean between the last quoted bid and ask prices (the “exchange mean price”). Equity securities traded in the over-the-counter market (other than NMS securities) are valued at the exchange mean price. Foreign equity securities (securities principally traded in markets other than U.S. markets) are valued at the official closing price on the primary exchange or, for markets that either do not offer an official closing price or where the official closing price may not be representative of the overall market, the last quoted sale price.
Fixed income securities purchased with a remaining maturity of 60 days or less are valued at amortized cost, provided that the amortized cost value is approximately the same as the fair value of the security valued without the use of amortized cost. Investments in other open-end regulated investment companies are valued at their end of day net asset value per share.
The Fund’s portfolio investments are generally valued based on independent market quotations or prices or, if none, “evaluative” or other market based valuations provided by third-party pricing services approved by the Board of Trustees of the Trust (the “Board”). Under certain circumstances, the value of certain Fund portfolio investments (including derivatives) may be based on an evaluation of fair value, pursuant to procedures established by and under the
general supervision of the Board. The Valuation Committee, which is comprised of the Independent Trustees of the Board, and the Pricing Committee, which is comprised of representatives from AMG Funds LLC (the “Investment Manager”) are the committees appointed by the Board to make fair value determinations. The Fund may use the fair value of a portfolio investment to calculate its net asset value (“NAV”) in the event that the market quotation, price or market based valuation for the portfolio investment is not readily available or otherwise not determinable pursuant to the Board’s valuation procedures, if the Investment Manager or the Pricing Committee believes the quotation, price or market based valuation to be unreliable, or in certain other circumstances. When determining the fair value of an investment, the Pricing Committee and, if required under the Trust’s securities valuation procedures, the Valuation Committee, seeks to determine the price that the Fund might reasonably expect to receive from current sale of that portfolio investment in an arms-length transaction. Fair value determinations shall be based upon consideration of all available facts and information, including, but not limited to (i) attributes specific to the investment; (ii) fundamental and analytical data relating to the investment; and (iii) the value of other comparable securities or relevant financial instruments, including derivative securities, traded on other markets or among dealers.
The values assigned to fair value portfolio investments are based on available information and do not necessarily represent amounts that might ultimately be realized in the future, since such amounts depend on future developments inherent in long-term investments. Because of the inherent uncertainty of valuation, those estimated values may differ significantly from the values that would have been used had a ready market for the investments existed, and the differences could be material. The Board will be presented with a quarterly report showing as of the most recent quarter end, all outstanding securities fair valued by the Fund, including a comparison with the prior quarter end and the percentage of the Fund that the security represents at each quarter end.
With respect to foreign equity securities and certain foreign fixed income securities, the Board has adopted a policy that securities held in a Fund that can be fair valued by the applicable fair value pricing service are fair valued on each business day provided that each individual price exceeds a pre-established confidence level.
U.S. GAAP defines fair value as the price that a fund would receive to sell an asset or pay to transfer a liability in an orderly transaction between market participants at the measurement date. U.S. GAAP also establishes a framework for measuring fair value, and a three-level hierarchy for fair value measurements based upon the transparency of inputs to the valuation of an asset or liability. Inputs may be observable or unobservable and refer broadly to the assumptions that market participants would use in pricing the asset or liability. Observable inputs reflect the assumptions market participants would use in pricing the asset or liability based on market data obtained from sources independent of the Fund. Unobservable inputs reflect the Fund’s own assumptions about the assumptions that market participants would use in pricing the asset or liability developed based on the best information available in the circumstances. Each investment is assigned a level based upon the observability of the inputs which are significant to the overall valuation.
Notes to Financial Statements (continued)
The three-tier hierarchy of inputs is summarized below:
Level 1 – inputs are quoted prices in active markets for identical investments (e.g., equity securities, open-end investment companies)
Level 2 – other observable inputs (including, but not limited to: quoted prices for similar assets or liabilities in markets that are active, quoted prices for identical or similar assets or liabilities in markets that are not active, inputs other than quoted prices that are observable for the assets or liabilities (such as interest rates, yield curves, volatilities, prepayment speeds, loss severities, credit risks and default rates) or other market corroborated inputs) (e.g., debt securities, government securities, foreign currency exchange contracts, foreign securities utilizing international fair value pricing, broker-quoted securities, fair valued securities with observable inputs)
Level 3 – inputs are significant unobservable inputs (including the Fund’s own assumptions used to determine the fair value of investments) (e.g., fair valued securities with unobservable inputs)
Changes in inputs or methodologies used for valuing investments may result in a transfer in or out of levels within the fair value hierarchy. The inputs or methodologies used for valuing investments may not necessarily be an indication of the risk associated with investing in those investments. Transfers between different levels of the fair value disclosure hierarchy are deemed to have occurred as of the beginning of the reporting period.
b. SECURITY TRANSACTIONS
Security transactions are accounted for as of trade date. Realized gains and losses on securities sold are determined on the basis of identified cost.
c. INVESTMENT INCOME AND EXPENSES
Dividend income is recorded on the ex-dividend date. Dividends from foreign securities are recorded on the ex-dividend date, and if after the fact, as soon as the Fund becomes aware of the ex-dividend date. Interest income, which includes amortization of premium and accretion of discount on debt securities, is accrued as earned. Dividend and interest income on foreign securities is recorded gross of any withholding tax. Non-cash dividends included in dividend income, if any, are reported at the fair market value of the securities received. Upon notification from issuers, distributions received from a real estate investment trust (“REIT”) may be redesignated as a reduction of cost of investments and/or realized gain. Other income and expenses are recorded on an accrual basis. Expenses that cannot be directly attributed to a Fund are apportioned among the funds in the Trust and other trusts within the AMG Funds family of mutual funds (collectively, the “AMG Funds family”) based upon their relative average net assets or number of shareholders.
d. DIVIDENDS AND DISTRIBUTIONS
Fund distributions resulting from either net investment income or realized net capital gains, if any, will normally be declared and paid at least annually in December, as described in the Fund’s prospectus. Distributions to shareholders are recorded on the ex-dividend date. Distributions are determined in accordance with federal income tax regulations, which may differ from net investment income and net realized capital gains for financial statement purposes (U.S. GAAP). Differences may be permanent or temporary. Permanent
differences are reclassified among capital accounts in the financial statements to reflect their tax character. Permanent book and tax basis differences, if any, relating to shareholder distributions will result in reclassifications to paid-in capital. Temporary differences arise when certain items of income, expense and gain or loss are recognized in different periods for financial statement and tax purposes; these differences will reverse at some time in the future. Permanent differences are primarily due to a net operating loss write off. Temporary differences are primarily due to qualified late year ordinary losses and wash sales.
As of September 30, 2017, the components of distributable earnings (excluding unrealized appreciation/depreciation) on a tax basis consisted of:
| | | | |
Capital loss carryforward | | $ | 12,838,786 | * |
Undistributed ordinary income | | | — | |
Undistributed short-term capital gains | | | — | |
Undistributed long-term capital gains | | | — | |
Late-year loss deferral | | | 599,149 | |
| * | Includes realized losses of $963,623 related to sales of the portfolio made from September 5 to September 30, 2017, that may be deferred, as wash sales under the internal Revenue Code, if repurchased within 30 days. Such deferral may decrease the Fund’s capital loss carryforward for tax purposes as shown above. |
Based on the approximate cost of investments of $119,133,286 for federal income tax purposes at September 30, 2017, the aggregate gross unrealized appreciation and depreciation were $21,536,181 and $346,675, respectively, resulting in net unrealized appreciation of investments of $21,189,506.
e. FEDERAL TAXES
The Fund currently qualifies as an investment company and intends to comply with the requirements under Subchapter M of the Internal Revenue Code of 1986, as amended, to distribute substantially all of its taxable income and gains to its shareholders and to meet certain diversification and income requirements with respect to investment companies. Therefore, no provision for federal income or excise tax is included in the accompanying financial statements.
Additionally, based on the Fund’s understanding of the tax rules and rates related to income, gains and transactions for the foreign jurisdictions in which it invests, the Fund will provide for foreign taxes, and where appropriate, deferred foreign taxes.
Management has analyzed the Fund’s tax positions taken on federal income tax returns as of September 30, 2017 for all open tax years (generally, the three prior taxable years), and has concluded that no provision for federal income tax is required in the Fund’s financial statements. Additionally, management is not aware of any tax position for which it is reasonably possible that the total amounts of unrecognized tax benefits will change materially in the next twelve months.
Net capital losses incurred in taxable years beginning after the enactment of the Regulated Investment Company Modernization Act of 2010, may be carried forward for an unlimited time period. Such losses will be required to be utilized prior to any loss carryovers incurred in pre-enactment taxable years, which
Notes to Financial Statements (continued)
generally expire eight years following the close of the taxable year in which they were incurred. As a result of this ordering rule, pre-enactment capital loss carryovers may be more likely to expire unused. Additionally, post-enactment capital losses that are carried forward retain their tax character as either short-term or long-term capital losses, unlike pre-enactment losses which are considered all short-term.
f. CAPITAL LOSS CARRYOVERS AND DEFERRALS
As of September 30, 2017, the Fund had accumulated net realized capital loss carryovers from securities transactions for federal income tax purposes as shown in the following chart. These amounts may be used to offset future realized capital gain, if any, through the expiration date listed, or in the case of post-enactment losses, for an unlimited time period.
| | | | | | | | | | | | |
| | | Capital Loss Carryover
Amounts | | | | |
| | | Short-Term | | | Long-Term | | | Expires
September 30, | |
(Pre-Enactment) | | $ | 12,838,786 | | | | — | | | | 2018 | |
For the fiscal year ended September 30, 2017, the Fund utilized short-term capital loss carryovers in the amount of $8,127,444.
g. CAPITAL STOCK
The Trust’s Declaration of Trust authorizes for the Fund the issuance of an unlimited number of shares of beneficial interest, without par value. The Fund records sales and repurchases of its capital stock on the trade date. The cost of securities contributed to the Fund in connection with the issuance of shares is based on the valuation of those securities in accordance with the Fund’s policy on investment valuation.
At September 30, 2017, certain affiliated shareholders of record, individually or collectively, held greater than 10% of the net assets of the Fund as follows: one owns 98%. Transactions by this shareholder may have a material impact on the Fund.
h. REPURCHASE AGREEMENTS AND JOINT REPURCHASE AGREEMENTS
The Fund may enter into third-party repurchase agreements for temporary cash management purposes and third-party joint repurchase agreements for reinvestment of cash collateral on securities lending transactions under the securities lending program offered by The Bank of New York Mellon (“BNYM”) (the “Program”) (collectively, “Repurchase Agreements”). The value of the underlying collateral, including accrued interest, must equal or exceed the value of the Repurchase Agreements during the term of the agreement. For joint repurchase agreements, the Fund participates on a pro rata basis with other clients of BNYM in its share of the underlying collateral under such joint repurchase agreements and in its share of proceeds from any repurchase or other disposition of the underlying collateral. The underlying collateral for all Repurchase Agreements is held in safekeeping by the Fund’s custodian or at the Federal Reserve Bank. If the seller defaults and the value of the collateral declines, or if bankruptcy proceedings commence with respect to the seller of the security, realization of the collateral by the Fund may be delayed or limited. Pursuant to the Program, the Fund is indemnified for such losses by BNYM on joint repurchase agreements.
At September 30, 2017, the market value of Repurchase Agreements outstanding was $11,167,383.
2. AGREEMENTS AND TRANSACTIONS WITH AFFILIATES
The Trust has entered into an investment advisory agreement under which the Investment Manager, a subsidiary and the U.S. retail distribution arm of Affiliated Managers Group, Inc. (“AMG”), serves as investment manager to the Fund and is responsible for the Fund’s overall administration and operations. The Investment Manager selects one or more subadvisers for the Fund (subject to Board approval) and monitors the subadviser’s investment performance, security holdings and investment strategies. The Fund’s investment portfolio is managed by Friess Associates, LLC (“Friess”) and Friess Associates of Delaware, LLC (“Friess of Delaware”) who serve pursuant to a subadvisory agreement with the Investment Manager.
Investment management fees are paid directly by the Fund to the Investment Manager based on average daily net assets. Effective October 1, 2016, the Fund paid an investment management fee at the annual rate of 0.88% of the average daily net assets of the Fund. Prior to October 1, 2016, the annual rate for the investment management fees was 1.00% of the Fund’s average daily net assets.
The Trust, on behalf of the Fund, has entered into an amended and restated Administration Agreement under which the Investment Manager serves as the Fund’s administrator (the “Administrator”) and is responsible for all non-portfolio management aspects of managing the Fund’s operations, including administration and shareholder services to the Fund as further described in the Fund’s prospectus. Effective October 1, 2016, the Fund pays a fee to the Administrator at the rate of 0.15% per annum of the Fund’s average daily net assets for this service. Prior to October 1, 2016, the Fund paid an administrative fee under a similar contract at an annual rate of 0.03% of the Fund’s average net assets for the first $300 million of assets under management, 0.025% for the next $200 million and 0.02% on amounts in excess of $500 million.
The Fund is distributed by AMG Distributors, Inc. (the “Distributor”), a wholly-owned subsidiary of the Investment Manager. The Distributor serves as the distributor and underwriter for the Fund and is a registered broker-dealer and member of the Financial Industry Regulatory Authority, Inc. (“FINRA”). Shares of the Fund will be continuously offered and will be sold directly to prospective purchasers and through brokers, dealers or other financial intermediaries who have executed selling agreements with the Distributor. Generally the Distributor bears all or a portion of the expenses of providing services pursuant to the distribution agreement, including the payment of the expenses relating to the distribution of prospectuses for sales purposes and any advertising or sales literature.
The Trust has adopted a distribution and service plan (the “Plan”) with respect to the Class N shares in accordance with the requirements of Rule 12b-1 under the 1940 Act and the requirements of the applicable rules of FINRA regarding asset-based sales charges. Pursuant to the Plan, the Fund may make payments to the Distributor for its expenditures in financing any activity primarily intended to result in the sale of the Fund’s Class N shares and for maintenance and personal service provided to existing shareholders. The Plan authorizes
payments to the Distributors up to 0.25% annually of the Fund’s average daily net assets attributable to the Class N shares.
Notes to Financial Statements (continued)
The Board has approved reimbursement payments to the Investment Manager for shareholder servicing expenses (“shareholder servicing fees”) incurred. Shareholder servicing fees include payments to each financial intermediary such as broker-dealers (including fund supermarket platforms), banks and trust companies that provide shareholder recordkeeping, account servicing and other services.
The impact on the annualized expense ratio for the fiscal year ended September 30, 2017, was as follows:
| | | | | | | | |
| | | Maximum | | | Actual | |
| | | Annual Amount | | | Amount | |
| Fund | | Approved | | | Incurred | |
Brandywine Advisors | |
Class N | | | 0.15 | % | | | 0.00 | %* |
| * | Rounds to less than 0.01%. |
Effective October 1, 2016, the maximum annual rate was decreased to 0.15% from 0.20%.
The Board provides supervision of the affairs of the Trust and other trusts within the AMG Funds family. The Trustees of the Trust who are not affiliated with an Investment Manager receive an annual retainer and per meeting fees for regular, special and telephonic meetings, and they are reimbursed for out-of-pocket expenses incurred while carrying out their duties as Board members. The Chairman of the Board and the Audit Committee Chair receive additional annual retainers. Certain Trustees and Officers of the Fund are Officers and/or Directors of the Investment Manager, AMG and/or the Distributor.
The Securities and Exchange Commission (the “SEC”) has granted an exemptive order that permits the Fund to lend and borrow money for certain temporary purposes directly to and from other eligible funds in the AMG Funds family. Participation in this interfund lending program is voluntary for both the borrowing and lending funds, and an interfund loan is only made if it benefits each participating fund. The Administrator manages the program according to procedures approved by the Board, and the Board monitors the operation of the program. An interfund loan must comply with certain conditions set out in the exemptive order, which are designed to assure fairness and protect all participating funds. For the fiscal year ended September 30, 2017, the Fund neither borrowed from nor lent to other funds in the AMG Funds family. At September 30, 2017, the Fund had no interfund loans outstanding.
3. PURCHASES AND SALES OF SECURITIES
Purchases and sales of securities (excluding short-term and U.S. Government Obligations) for the fiscal year ended September 30, 2017, were $259,141,400 and $285,692,946, respectively. The Fund had no purchases or sales of U.S. Government Obligations during the fiscal year ended September 30, 2017.
4. PORTFOLIO SECURITIES LOANED
The Fund participates in the Program providing for the lending of securities to qualified brokers. Securities lending income includes earnings of such temporary cash investments, plus or minus any rebate to a borrower. These earnings (after any rebate) are then divided between BNYM, as a fee for its services under the Program, and the Fund, according to agreed-upon rates. Collateral on all securities loaned is accepted in cash and is maintained at a minimum level of 102% (105% in the case of certain foreign securities) of the market value, plus interest, if applicable, of investments on loan. It is the Fund’s policy to obtain additional collateral from or return excess collateral to the borrower by the end of the next business day, following the valuation date of the securities loaned. Therefore, the value of the collateral held may be temporarily less than the value of the securities on loan. Lending securities entails a risk of loss to the Fund if and to the extent that the market value of the securities loaned were to increase and the borrower did not increase the collateral accordingly, and the borrower fails to return the securities. Under the terms of the Program, the Fund is indemnified for such losses by BNYM. Cash collateral is held in a separate omnibus account managed by BNYM, who is authorized to exclusively enter into joint repurchase agreements. BNYM bears the risk of any deficiency in the amount of the cash collateral available for return to the borrower due to any loss on the collateral invested. At September 30, 2017, the value of the securities loaned and cash collateral received was $10,896,187 and $11,167,383, respectively.
5. COMMITMENTS AND CONTINGENCIES
Under the Trust’s organizational documents, its trustees and officers are indemnified against certain liabilities arising out of the performance of their duties to the Trust. In addition, in the normal course of business, the Fund may enter into contracts and agreements that contain a variety of representations and warranties, which provide general indemnifications. The maximum exposure to the Fund under these arrangements is unknown, as this would involve future claims that may be made against a Fund that have not yet occurred. However, based on experience, the Fund had no prior claims or losses and expects the risk of loss to be remote.
6. MASTER NETTING AGREEMENTS
The Fund may enter into master netting agreements with its counterparties for the securities lending program and Repurchase Agreements, which provide the right, in the event of default (including bankruptcy or insolvency) for the non-defaulting party to liquidate the collateral and calculate net exposure to the defaulting party or request additional collateral. For financial reporting purposes, the Fund does not offset financial assets and financial liabilities that are subject to master netting agreements in the Statement of Assets and Liabilities. For securities lending transactions, see Note 4.
Notes to Financial Statements (continued)
The following table is a summary of the Fund’s open Repurchase Agreements that are subject to a master netting agreement as of September 30, 2017:
| | | | | | | | | | | | | | | | |
| | | | | | Gross Amount Not Offset in
the Statement of Assets and
Liabilities | | | | |
| | | Net Amounts of Assets
Presented in the Statement
of Assets and Liabilities | | | Financial
Instruments
Collateral | | | Cash
Collateral
Received | | | Net
Amount | |
Citibank N.A. | | $ | 558,055 | | | $ | 558,055 | | | | — | | | | — | |
Daiwa Capital Markets America | | | 2,652,332 | | | | 2,652,332 | | | | — | | | | — | |
Merrill Lynch Pierce Fenner & Smith, Inc. | | | 2,652,332 | | | | 2,652,332 | | | | — | | | | — | |
Nomura Securities International, Inc. | | | 2,652,332 | | | | 2,652,332 | | | | — | | | | — | |
RBC Dominion Securities, Inc. | | | 2,652,332 | | | | 2,652,332 | | | | — | | | | — | |
| | | | | | | | | | | | | | | | |
Totals | | $ | 11,167,383 | | | $ | 11,167,383 | | | | — | | | | — | |
| | | | | | | | | | | | | | | | |
7. REGULATORY UPDATES
On October 13, 2016, the SEC amended existing rules intended to modernize reporting and disclosure of information. These amendments relate to Regulation S-X which sets forth the form and content of financial statements. Effective August 1, 2017, the Fund has adopted these amendments.
8. SUBSEQUENT EVENTS
The Fund has determined that no material events or transactions occurred through the issuance date of the Fund’s financial statements which require an additional disclosure in or adjustment of the Fund’s financial statements.
TAX INFORMATION (unaudited)
The AMG Managers Brandywine Advisors Mid Cap Growth Fund hereby designates the maximum amount allowable of its net taxable income as qualified dividends as provided in the Jobs and Growth Tax Relief Reconciliation Act of 2003. The 2016/2017 Form 1099-DIV you receive for the Fund will show the tax status of all distributions paid to you during the year.
Pursuant to section 852 of the Internal Revenue Code, AMG Managers Brandywine Advisors Mid Cap Growth Fund hereby designates $0 as a capital gain distribution with respect to the taxable fiscal year ended September 30, 2017, or if subsequently determined to be different, the net capital gains of such year.
Report of Independent Registered Public Accounting Firm
TO THE BOARD OF TRUSTEES OF AMG FUNDS I AND SHAREHOLDERS OF AMG MANAGERS BRANDYWINE ADVISORS MID CAP GROWTH FUND:
In our opinion, the accompanying statement of assets and liabilities, including the schedule of portfolio investments, and the related statements of operations and of changes in net assets and the financial highlights present fairly, in all material respects, the financial position of the AMG Managers Brandywine Advisors Mid Cap Growth Fund (the “Fund”) as of September 30, 2017, and the results of its operations, the changes in its net assets and the financial highlights for each of the periods indicated, in conformity with accounting principles generally accepted in the United States of America. These financial statements and financial highlights (hereafter referred to as “financial statements”) are the responsibility of the Fund’s management. Our responsibility is to express an opinion on these financial statements based on our audits. We conducted our audits of these financial statements in accordance with the standards of the Public Company Accounting Oversight Board (United States). Those standards require that we plan and perform the audit to obtain reasonable assurance about whether the financial statements are free of material misstatement. An audit includes examining, on a test basis, evidence supporting the amounts and disclosures in the financial statements, assessing the accounting principles used and significant estimates made by management, and evaluating the overall financial statement presentation. We believe that our audits, which included confirmation of securities as of September 30, 2017 by correspondence with the custodian and brokers, and the application of alternative auditing procedures where securities purchased had not been received, provide a reasonable basis for our opinion.
PricewaterhouseCoopers LLP
Boston, Massachusetts
October 26, 2017
Annual Renewal of Investment Management and Subadvisory Agreements
AMG Managers Brandywine Advisors Mid Cap Growth Fund: Approval of Investment Management, Subadvisory and Sub-Subadvisory Agreements on June 28-29, 2017
At an in-person meeting held on June 28-29, 2017, the Board of Trustees (the “Board” or the “Trustees”), and separately a majority of the Trustees who are not “interested persons” of the Trust (the “Independent Trustees”), approved (i) the Investment Management Agreement, as amended pursuant to letter agreements at any time prior to the date of the meeting, with AMG Funds LLC (the “Investment Manager”) for AMG Managers Brandywine Advisors Mid Cap Growth Fund (the “Fund”) and separately each of Amendment No. 1 thereto dated July 1, 2015, and Amendment No. 2 thereto dated October 1, 2016 (collectively, the “Investment Management Agreement”) and (ii) the Subadvisory Agreement, as amended at any time prior to the date of the meeting, with the Subadviser with respect to the Fund and the Sub-Subadvisory Agreement with the Sub-Subadviser with respect to the Fund (collectively, the “Friess Agreements”). The Subadviser and the Sub-Subadviser are referred to collectively herein as “Friess.” The Independent Trustees were separately represented by independent legal counsel in connection with their consideration of the approval of these agreements. In considering the Investment Management Agreement and the Friess Agreements, the Trustees reviewed a variety of materials relating to the Fund, the Investment Manager and Friess including comparative performance, fee and expense information for an appropriate peer group of similar mutual funds (the “Peer Group”), performance information for the relevant benchmark index (the “Fund Benchmark”) and, as to all other matters, other information provided to them on a periodic basis throughout the year, as well as information provided in connection with the meetings of June 28-29, 2017, regarding the nature, extent and quality of services provided by the Investment Manager and Friess under their respective agreements. Prior to voting, the Independent Trustees: (a) reviewed the foregoing information with their independent legal counsel and with
management; (b) received materials from their independent legal counsel discussing the legal standards applicable to their consideration of the Investment Management Agreement and the Friess Agreements; and (c) met with their independent legal counsel in private sessions at which no representatives of management were present.
NATURE, EXTENT AND QUALITY OF SERVICES
In considering the nature, extent and quality of the services provided by the Investment Manager, the Trustees reviewed information relating to the Investment Manager’s operations and personnel. Among other things, the Investment Manager provided financial information, biographical information on its supervisory and professional staff and descriptions of its organizational and management structure. The Trustees also took into account information provided periodically throughout the previous year by the Investment Manager in Board meetings relating to the performance of its duties with respect to the Fund and the Trustees’ knowledge of the Investment Manager’s management and the quality of the performance of the Investment Manager’s duties under the Investment Management Agreement and Administration Agreement. In the course of their deliberations regarding the Investment Manager, the Trustees evaluated, among other things: (a) the extent and quality of the Investment Manager’s oversight of the operation and management of the Fund; (b) the quality of the search, selection and monitoring services performed by the Investment Manager in overseeing the portfolio management responsibilities of Friess; (c) the Investment Manager’s ability to supervise the Fund’s other service providers; and (d) the Investment Manager’s compliance program. The Trustees also took into account that, in performing its functions under the Investment Management Agreement and supervising Friess, the Investment Manager: performs periodic detailed analyses and reviews of the performance by Friess of its obligations to the Fund, including without limitation, analysis and review of portfolio and other compliance matters and review of Friess’s investment performance
with respect to the Fund; prepares and presents periodic reports to the Board regarding the investment performance of Friess and other information regarding Friess, at such times and in such forms as the Board may reasonably request; reviews and considers any changes in the personnel of Friess responsible for performing Friess’s obligations and makes appropriate reports to the Board; reviews and considers any changes in the ownership or senior management of Friess and makes appropriate reports to the Board; performs periodic in-person or telephonic diligence meetings, including with respect to compliance matters, with representatives of Friess; assists the Board and management of the Trust in developing and reviewing information with respect to the initial approval of each Friess Agreement and annual consideration of each Friess Agreement thereafter; prepares recommendations with respect to the continued retention of Friess or the replacement of Friess, including at the request of the Board; identifies potential successors to or replacements of Friess or potential additional subadvisers, performs appropriate due diligence, and develops and presents to the Board a recommendation as to any such successor, replacement, or additional subadviser, including at the request of the Board; designates and compensates from its own resources such personnel as the Investment Manager may consider necessary or appropriate to the performance of its services; and performs such other review and reporting functions as the Board shall reasonably request consistent with the Investment Management Agreement and applicable law. The Trustees also took into account the financial condition of the Investment Manager with respect to its ability to provide the services required under the Investment Management Agreement. The Trustees also considered the Investment Manager’s risk management processes.
The Trustees also reviewed information relating to Friess’s operations and personnel and the investment philosophy, strategies and techniques (its “Investment Strategy”) used in managing the Fund. Among other things, the Trustees reviewed biographical information on portfolio management and other professional staff, information
Annual Renewal of Investment Management and Subadvisory Agreements (continued)
regarding Friess’s organizational and management structure and Friess’s brokerage policies and practices. The Trustees considered specific information provided regarding the experience of the individuals at Friess with portfolio management responsibility for the Fund, including the information set forth in the Fund’s prospectus and statement of additional information. In the course of their deliberations, the Trustees evaluated, among other things: (a) the services rendered by Friess in the past; (b) the qualifications and experience of Friess’s personnel; and (c) Friess’s compliance program. The Trustees also took into account the financial condition of Friess with respect to its ability to provide the services required under each Friess Agreement. The Trustees also considered Friess’s risk management processes.
PERFORMANCE
As noted above, the Board considered the Fund’s net performance during relevant time periods as compared to the Fund’s Peer Group and Fund Benchmark and considered the gross performance of the Fund as compared to Friess’s relevant performance composite that utilizes the same investment strategy and approach and noted that the Board reviews on a quarterly basis detailed information about both the Fund’s performance results and portfolio composition, as well as Friess’s Investment Strategy. The Board noted the Investment Manager’s expertise and resources in monitoring the performance, investment style and risk-adjusted performance of Friess. The Board was mindful of the Investment Manager’s attention to monitoring Friess’s performance with respect to the Fund and its discussions with management regarding the factors that contributed to the performance of the Fund.
Among other information relating to the Fund’s performance (including the predecessor fund’s performance for periods prior to its acquisition by the Trust on October 1, 2013), the Trustees noted that the Fund’s performance for Class N shares for the 1-year, 3-year, 5-year and 10-year periods ended March 31, 2017 was above, below, below
and below, respectively, the median performance of the Peer Group and above, below, below and below, respectively, the performance of the Fund Benchmark, the Russell Midcap Growth Index. The Trustees also took into account management’s discussion of the Fund’s performance, including the reasons for the Fund’s underperformance and any actions being taken to address such performance. The Trustees noted that Class N shares of the Fund ranked in the second quartile relative to its Peer Group for the 1-year period. The Trustees concluded that the Fund’s performance is being addressed.
ADVISORY FEES AND PROFITABILITY
In considering the reasonableness of the advisory fee charged by the Investment Manager for managing the Fund, the Trustees noted that the Investment Manager, and not the Fund, is responsible for paying the fees charged by the Fund’s Subadviser, and, in turn, the Subadviser is responsible for paying the fees charged by the Fund’s Sub-Subadviser and, therefore, that the fees paid to the Investment Manager cover the cost of providing portfolio management services as well as the cost of providing search, selection and monitoring services in operating a “manager-of-managers” complex of mutual funds. The Trustees also considered the amount of the advisory fee retained by the Investment Manager after payment of the subadvisory fee. The Trustees concluded that, in light of the high quality supervisory services provided by the Investment Manager and the fact that the Investment Manager and the Subadviser are paying the fees under the Subadvisory Agreement and Sub-Subadvisory Agreement, respectively, the advisory fee payable by the Fund to the Investment Manager can reasonably be expected to exceed the median advisory fee for the Peer Group, which consists of many funds that do not operate with a manager-of-managers structure.
In addition, in considering the reasonableness of the advisory fee payable to the Investment Manager, the Trustees also reviewed information provided by the Investment Manager setting forth all revenues and other benefits, both direct and
indirect (including any so-called “fallout benefits” such as reputational value derived from the Investment Manager serving as Investment Manager to the Fund), received by the investment manager and its affiliates attributable to managing the Fund and all the mutual funds in the AMG Funds Family of Funds, the cost of providing such services, the enterprise and entrepreneurial risks undertaken as investment manager and sponsor of the Fund and the resulting profitability to the Investment Manager and its affiliates from these relationships. The Trustees also noted the current asset levels of the Fund and the willingness of the Investment Manager to waive fees and pay expenses for the Fund from time to time as a means of limiting total expenses of the Fund. The Trustees also considered management’s discussion of the current asset level of the Fund, and the impact on profitability of both the current asset level and any future growth of assets of the Fund. The Board took into account management’s discussion of the advisory fee structure, and, as noted above, the services the Investment Manager provides in performing its functions under the Investment Management Agreement and supervising Friess. In this regard, the Trustees noted that, unlike a mutual fund that is managed by a single investment adviser, the Fund operates in a manager-of-managers structure. Based on the foregoing, the Trustees concluded that the profitability to the Investment Manager is reasonable and that the Investment Manager is not realizing material benefits from economies of scale that would warrant adjustments to the advisory fee at this time. With respect to economies of scale, the Trustees also noted that as the Fund’s assets increase over time, the Fund may realize other economies of scale to the extent that the increase in assets is proportionally greater than the increase in certain other expenses.
In considering the reasonableness of the fee payable by the Investment Manager to Friess, the Trustees relied on the ability of the Investment Manager to negotiate the terms of the Friess Agreements at arm’s length as part of the manager-of-managers structure, noting that the Investment Manager is not affiliated with Friess. In
Annual Renewal of Investment Management and Subadvisory Agreements (continued)
addition, the Trustees considered other potential benefits of the subadvisory relationship to Friess, including, among others, the indirect benefits that Friess may receive from its relationship with the Fund, including any so-called “fallout benefits” to Friess, such as reputational value derived from the Subadviser and Sub-Subadviser serving as Subadviser and Sub-Subadviser, respectively, to the Fund. In addition, the Trustees noted that the subadvisory fees are paid by the Investment Manager out of its advisory fee and, in turn, the sub-subadvisory fees are paid by the Subadviser. As a consequence of all of the foregoing, the cost of services to be provided by Friess and the profitability to Friess of its relationship with the Fund were not material factors in the Trustees’ deliberations. For similar reasons, the Trustees did not consider potential economies of scale in the management of the Fund by Friess to be a material factor in their deliberations at this time.
The Trustees noted that the Fund’s management fees (which include both the advisory and administration fees) and total expenses (net of applicable expense waivers/reimbursements) as of March 31, 2017 were both higher than the average for the Fund’s Peer Group. The Trustees also took into account management’s discussion of the Fund’s expenses and competitiveness with comparably sized funds. The Trustees concluded that, in light of the nature, extent and quality of the services provided by the Investment Manager and Friess, and the considerations noted above with respect to the Investment Manager and Friess, the Fund’s advisory, subadvisory and sub-subadvisory fees are reasonable.
* * * *
After consideration of the foregoing, the Trustees also reached the following conclusions (in addition to the conclusions discussed above) regarding the Investment Management Agreement and each Friess Agreement: (a) the Investment Manager and
Friess have demonstrated that they possess the capability and resources to perform the duties required of them under the Investment Management Agreement and the Friess Agreements; (b) Friess’s Investment Strategy is appropriate for pursuing the Fund’s investment objectives; and (c) the Investment Manager and Friess maintain appropriate compliance programs.
Based on all of the above-mentioned factors and their related conclusions, with no single factor or conclusion being determinative and with each Trustee not necessarily attributing the same weight to each factor, the Trustees concluded that approval of the Investment Management Agreement and each Friess Agreement would be in the best interests of the Fund and its shareholders. Accordingly, on June 28-29, 2017, the Trustees, and separately a majority of the Independent Trustees, voted to approve the Investment Management Agreement and the Friess Agreements for the Fund.
AMG Funds
Trustees and Officers
The Trustees and Officers of the Trust, their business addresses, principal occupations for the past five years and ages are listed below. The Trustees provide broad supervision over the affairs of the Trust and the Funds. The Trustees are experienced executives who meet periodically throughout the year to oversee the Funds’ activities, review contractual arrangements with
companies that provide services to the Funds, and review the Funds’ performance. Unless otherwise noted, the address of each Trustee or Officer is the address of the Trust: 600 Steamboat Road, Suite 300, Greenwich, CT 06830.
There is no stated term of office for Trustees. Trustees serve until their resignation, retirement or removal in accordance with the Trust’s
organizational documents and policies adopted by the Board from time to time. The Chairman of the Trustees, President, Treasurer and Secretary of the Trust are elected by the Trustees annually. Other officers hold office at the pleasure of the Trustees.
Independent Trustees
The following Trustees are not “interested persons” of the Trust within the meaning of the 1940 Act:
| | |
Number of Funds Overseen in Fund Complex | | Name, Age, Principal Occupation(s) During Past 5 Years and Other Directorships Held by Trustee |
• Trustee since 2012 • Oversees 62 Funds in Fund Complex | | Bruce B. Bingham, 68 Partner, Hamilton Partners (real estate development firm) (1987-Present); Director of The Yacktman Funds (2000-2012). |
| |
• Trustee since 2000 • Oversees 62 Funds in Fund Complex | | Edward J. Kaier, 72 Attorney at Law and Partner, Teeters Harvey Marrone & Kaier LLP (2007-Present); Attorney at Law and Partner, Hepburn Willcox Hamilton & Putnam, LLP (1977-2007); Trustee of Third Avenue Trust (5 portfolios); Trustee of Third Avenue Variable Trust (1 portfolio). |
| |
• Trustee since 2013 • Oversees 64 Funds in Fund Complex | | Kurt A. Keilhacker, 54 Managing Member, TechFund Capital (1997-Present); Managing Member, TechFund Europe (2000-Present); Board Member, 6wind SA, (2002-Present); Managing Member, Elementum Ventures (2013-Present); Trustee, Gordon College (2001-2016). |
| |
• Trustee since 2000 • Oversees 62 Funds in Fund Complex | | Steven J. Paggioli, 67 Independent Consultant (2002-Present); Formerly Executive Vice President and Director, The Wadsworth Group (1986-2001); Executive Vice President, Secretary and Director, Investment Company Administration, LLC (1990-2001); Vice President, Secretary and Director, First Fund Distributors, Inc. (1991-2001); Trustee, Professionally Managed Portfolios (32 portfolios); Advisory Board Member, Sustainable Growth Advisors, LP; Independent Director, Chase Investment Counsel (2008 – Present). |
| |
• Trustee since 2013 • Oversees 62 Funds in Fund Complex | | Richard F. Powers III, 71 Adjunct Professor, U.S. Naval War College (2016); Adjunct Professor, Boston College (2010-2013); President and CEO of Van Kampen Investments Inc. (1998-2003). |
| |
• Independent Chairman • Trustee since 2000 • Oversees 64 Funds in Fund Complex | | Eric Rakowski, 59 Professor, University of California at Berkeley School of Law (1990-Present); Director of Harding, Loevner Funds, Inc. (9 portfolios); Trustee of Third Avenue Trust (5 portfolios); Trustee of Third Avenue Variable Trust (1 portfolio). |
| |
• Trustee since 2013 • Oversees 64 Funds in Fund Complex | | Victoria L. Sassine, 52 Lecturer, Babson College (2007 – Present). |
| |
• Trustee since 2000 • Oversees 62 Funds in Fund Complex | | Thomas R. Schneeweis, 70 Professor Emeritus, University of Massachusetts (2013-Present); Partner, S Capital Wealth Advisors (2015-Present); President, TRS Associates (1982-Present); Board Member, Chartered Alternative Investment Association (“CAIA”) (2002-Present); Director, CAIA Foundation (Education) (2010-Present); Director, Institute for Global Asset and Risk Management (Education) (2010-Present); Partner, S Capital Management, LLC (2007-2015); Director, CISDM at the University of Massachusetts, (1996-2013); President, Alternative Investment Analytics, LLC, (formerly Schneeweis Partners, LLC) (2001-2013); Professor of Finance, University of Massachusetts (1977-2013). |
Interested Trustees Each Trustee in the following table is an “interested person” of the Trust within the meaning of the 1940 Act. Ms. Carsman is an interested person of the Trust within the meaning of the 1940 Act by virtue of her position with, and interest in securities of, AMG. |
| |
Number of Funds Overseen in Fund Complex | | Name, Age, Principal Occupation(s) During Past 5 Years and Other Directorships Held by Trustee |
• Trustee since 2011 • Oversees 64 Funds in Fund Complex | | Christine C. Carsman, 65 Executive Vice President, Deputy General Counsel and Chief Regulatory Counsel, Affiliated Managers Group, Inc. (2017-Present); Director (2010-Present) and Chair of the Board of Directors (2015-Present), AMG Funds plc; Director of Harding, Loevner Funds, Inc. (9 portfolios); Senior Vice President and Deputy General Counsel, Affiliated Managers Group, Inc. (2011-2016); Senior Vice President and Chief Regulatory Counsel, Affiliated Managers Group, Inc. (2007-2011); Vice President and Chief Regulatory Counsel, Affiliated Managers Group, Inc. (2004-2007); Secretary and Chief Legal Officer, AMG Funds, AMG Funds I, AMG Funds II and AMG Funds III (2004-2011); Senior Counsel, Vice President and Director of Operational Risk Management and Compliance, Wellington Management Company, LLP (1995-2004). |
AMG Funds
Trustees and Officers (continued)
Officers
| | |
Position(s) Held with Fund and
Length of Time Served | | Name, Age, Principal Occupation(s) During Past 5 Years |
| |
• President since 2014 • Principal Executive Officer since 2014 • Chief Executive Officer since 2016 | | Jeffrey T. Cerutti, 49 Chief Executive Officer, AMG Funds LLC (2014-Present); Director, President and Principal, AMG Distributors, Inc. (2014-Present); President and Principal Executive Officer, AMG Funds, AMG Funds I, AMG Funds II and AMG Funds III (2014-Present); Chief Executive Officer, President and Principal Executive Officer, AMG Funds IV, (2015-Present); Chief Executive Officer, AMG Funds, AMG Funds I, AMG Funds II and AMG Funds III (2016-Present); Chief Executive Officer, Aston Asset Management, LLC (2016); President, VP Distributors, (2011-2014); Executive Vice President, Head of Distribution, Virtus Investment Partners, Inc. (2010-2014); Managing Director, Head of Sales, UBS Global Asset Management (2001-2010). |
| |
• Chief Operating Officer since 2007 | | Keitha L. Kinne, 59 Chief Operating Officer, AMG Funds LLC (2007-Present); Chief Investment Officer, AMG Funds LLC (2008-Present); Chief Operating Officer, AMG Distributors, Inc. (2007-Present); Chief Operating Officer, AMG Funds, AMG Funds I, AMG Funds II, and AMG Funds III (2007-Present); Chief Compliance Officer, AMG Funds IV (2016-Present); Chief Operating Officer and Chief Investment Officer, Aston Asset Management, LLC (2016); Chief Operating Officer, Aston Funds (2016); President and Principal Executive Officer, AMG Funds, AMG Funds I, AMG Funds II and AMG Funds III (2012-2014); Managing Partner, AMG Funds LLC (2007-2014); President, AMG Funds (2012-2014); President, AMG Distributors, Inc. (2012-2014); Managing Director, Legg Mason & Co., LLC (2006-2007); Managing Director, Citigroup Asset Management (2004-2006). |
| |
• Secretary since 2015 • Chief Legal Officer since 2015 | | Mark J. Duggan, 52 Senior Vice President and Senior Counsel, AMG Funds LLC (2015-Present); Secretary and Chief Legal Officer, AMG Funds, AMG Funds I, AMG Funds II and AMG Funds III (2015-Present); Secretary and Chief Legal Officer, AMG Funds IV, (2015-Present); Attorney, K&L Gates, LLP (2009-2015). |
| |
• Chief Financial Officer since 2017 • Treasurer since 2017 • Principal Financial Officer since 2017 • Principal Accounting Officer since 2017 | | Thomas G. Disbrow, 51 Vice President, Mutual Fund Treasurer & CFO, AMG Funds, AMG Funds LLC (2017-Present); Chief Financial Officer, Principal Financial Officer, Treasurer and Principal Accounting Officer, AMG Funds, AMG Funds I, AMG Funds II, AMG Funds III and AMG Funds IV (2017-Present); Managing Director - Global Head of Traditional Funds Product Control, UBS Asset Management (Americas), Inc. (2015-2017); Managing Director - Head of North American Funds Treasury, UBS Asset Management (Americas), Inc. (2011-2015). |
| |
• Deputy Treasurer since 2017 | | John A. Starace, 46 Vice President, Deputy Treasurer of Mutual Funds Services, AMG Funds LLC (2014-Present); Deputy Treasurer, AMG Funds, AMG Funds I, AMG Funds II, AMG Funds III and AMG Funds IV (2017-Present); Vice President, Citi Hedge Fund Services (2010-2014); Audit Senior Manager (2005-2010) and Audit Manager (2001-2005), Deloitte & Touche LLP. |
| |
• Controller since 2017 | | Christopher R. Townsend, 50 Head of Business Finance, AMG Funds LLC (2015-Present); Chief Financial Officer and Financial and Operations Principal, AMG Distributors, Inc. (2016-Present); Controller, AMG Funds, AMG Funds I, AMG Funds II, AMG Funds III and AMG Funds IV (2017-Present); Treasurer, Chief Financial Officer, Principal Financial Officer, Principal Accounting Officer, AMG Funds, AMG Funds I, AMG Funds II, AMG Funds III and AMG Funds IV (2017); Chief Financial Officer, Aston Asset Management LLC (2016); Head of Finance and Accounting, Allianz Asset Management (2006-2015). |
| |
• Chief Compliance Officer since 2016 | | Gerald F. Dillenburg, 50 Chief Compliance Officer and Sarbanes Oxley Code of Ethics Compliance Officer, AMG Funds, AMG Funds I, AMG Funds II and AMG Funds III (2016-Present); Chief Compliance Officer, AMG Funds IV (1996-Present); Sarbanes-Oxley Code of Ethics Compliance Officer, AMG Funds IV (2016-Present); Chief Compliance Officer, Aston Asset Management, LLC (2006-2016); Chief Operating Officer, Aston Funds (2003-2016); Secretary, Aston Funds (1996-2015); Chief Financial Officer, Aston Funds (1997-2010); Chief Financial Officer, Aston Asset Management, LLC (2006-2010); Treasurer, Aston Funds (1996-2010). |
| |
• Anti-Money Laundering Compliance Officer since 2014 | | Patrick J. Spellman, 43 Senior Vice President, Chief Compliance Officer, AMG Funds LLC (2011-Present); Chief Compliance Officer, AMG Distributors, Inc., (2010-Present); Anti-Money Laundering Compliance Officer, AMG Funds, AMG Funds I, AMG Funds II, AMG Funds III (2014-Present); Anti-Money Laundering Officer, AMG Funds IV, (2016-Present); Compliance Manager, Legal and Compliance, Affiliated Managers Group, Inc. (2005-2011). |
| |
• Assistant Secretary since 2016 | | Maureen A. Meredith, 32 Vice President, Counsel, AMG Funds LLC (2015-Present); Assistant Secretary, AMG Funds, AMG Funds I, AMG Funds II, AMG Funds III and AMG Funds IV (2016-Present); Associate, Ropes & Gray LLP (2011-2015); Law Fellow, Massachusetts Appleseed Center for Law and Justice (2010-2011). |
| |
• Assistant Secretary since 2016 | | Diana M. Podgorny, 38 Vice President, Counsel, AMG Funds LLC (2016-Present); Assistant Secretary, AMG Funds, AMG Funds I, AMG Funds II and AMG Funds III (2016-Present); Assistant Secretary, AMG Funds IV (2010-Present); Vice President, Counsel, Aston Asset Management, LLC (2010-2016). |
| |
• Assistant Secretary since 2016 | | Marc J. Pierce, 55 Vice President, Compliance Officer, AMG Funds LLC (2016-Present); Assistant Secretary, AMG Funds IV (2001-Present); Assistant Secretary, AMG Funds, AMG Funds I, AMG Funds II and AMG Funds III (2016-Present); Vice President, Aston Asset Management, LLC (1998-2016); Assistant Chief Compliance Officer, Aston Asset Management, LLC (2006-2016). |
THIS PAGE INTENTIONALLY LEFT BLANK
THIS PAGE INTENTIONALLY LEFT BLANK
THIS PAGE INTENTIONALLY LEFT BLANK
INVESTMENT MANAGER AND ADMINISTRATOR
AMG Funds LLC
600 Steamboat Road, Suite 300
Greenwich, CT 06830
800.835.3879
DISTRIBUTOR
AMG Distributors, Inc.
600 Steamboat Road, Suite 300
Greenwich, CT 06830
800.835.3879
SUBADVISER
Friess Associates, LLC
P.O. Box 576
Jackson, Wyoming 83001
Friess Associates of Delaware, LLC
P.O. Box 4166
Greenville, DE 19807
CUSTODIAN
The Bank of New York Mellon
111 Sanders Creek Parkway
East Syracuse, NY 13057
LEGAL COUNSEL
Ropes & Gray LLP
Prudential Tower, 800 Boylston Street Boston, MA 02199-3600
TRANSFER AGENT
BNY Mellon Investment Servicing (US) Inc. Attn: AMG Funds
P.O. Box 9769
Providence, RI 02940
800.548.4539
This report is prepared for the Fund’s shareholders. It is authorized for distribution to prospective investors only when preceded or accompanied by an effective prospectus. To receive a free copy of the prospectus or Statement of Additional Information, which includes additional information about Fund Trustees, please contact us by calling 800.835.3879. Distributed by AMG Distributors, Inc., member FINRA/SIPC.
Current net asset values per share for the Fund are available on the Fund’s website at www.amgfunds.com.
A description of the policies and procedures the Fund uses to vote its proxies is available: (i) without charge, upon request, by calling 800.835.3879, or (ii) on the Securities and Exchange Commission’s (SEC) website at www.sec.gov For information regarding the Fund’s proxy voting record for the 12-month period ended June 30, call 800.835.3879 or visit the SEC website at www.sec.gov.
The Fund files its complete schedule of portfolio holdings with the SEC for the first and third quarters of each fiscal year on Form N-Q. The Fund’s Forms N-Q are available on the SEC’s website at www.sec.gov. A Fund’s Forms N-Q may be reviewed and copied at the SEC’s Public Reference Room in Washington, DC. Information on the operation of the Public Reference Room may be obtained by calling 1-800-SEC-0330. To review a complete list of the Fund’s portfolio holdings, or to view the most recent quarterly holdings report, semiannual report, or annual report, please visit www.amgfunds.com.
| | |
| | | |
AFFILIATE SUBADVISED FUNDS
BALANCED FUNDS
AMG Chicago Equity Partners Balanced
Chicago Equity Partners, LLC
AMG FQ Global Risk-Balanced
First Quadrant, L.P.
EQUITY FUNDS
AMG Chicago Equity Partners Small Cap Value
Chicago Equity Partners, LLC
AMG FQ Tax-Managed U.S. Equity
AMG FQ Long-Short Equity
First Quadrant, L.P.
AMG Frontier Small Cap Growth
Frontier Capital Management Company, LLC
AMG GW&K Small Cap Core
AMG GW&K Small/Mid Cap
AMG GW&K U.S. Small Cap Growth
GW&K Investment Management, LLC
AMG Renaissance International Equity
AMG Renaissance Large Cap Growth
The Renaissance Group LLC
AMG River Road Dividend All Cap Value
AMG River Road Dividend All Cap Value II
AMG River Road Focused Absolute Value
AMG River Road Long-Short
AMG River Road Small-Mid Cap Value
AMG River Road Small Cap Value
River Road Asset Management, LLC
AMG SouthernSun Small Cap
AMG SouthernSun Global Opportunities
AMG SouthernSun U.S. Equity
SouthernSun Asset Management, LLC
AMG Systematic Large Cap Value
AMG Systematic Mid Cap Value
Systematic Financial Management, L.P.
AMG TimesSquare Emerging Markets Small Cap
AMG TimesSquare International Small Cap
AMG TimesSquare Mid Cap Growth
AMG TimesSquare Small Cap Growth
TimesSquare Capital Management, LLC
AMG Trilogy Emerging Markets Equity
AMG Trilogy Emerging Wealth Equity
Trilogy Global Advisors, L.P.
AMG Yacktman
AMG Yacktman Focused
AMG Yacktman Focused Fund - Security Selection Only
AMG Yacktman Special Opportunities
Yacktman Asset Management LP
FIXED INCOME FUNDS
AMG GW&K Core Bond
AMG GW&K Enhanced Core Bond
AMG GW&K Municipal Bond
AMG GW&K Municipal Enhanced Yield
GW&K Investment Management, LLC
OPEN-ARCHITECTURE FUNDS
ALTERNATIVE FUNDS
AMG Managers Lake Partners LASSO Alternative
Lake Partners, Inc.
BALANCED FUNDS
AMG Managers Montag & Caldwell Balanced
Montag & Caldwell, LLC
EQUITY FUNDS
AMG Managers Brandywine
AMG Managers Brandywine Advisors Mid Cap Growth
AMG Managers Brandywine Blue
Friess Associates, LLC
AMG Managers Cadence Emerging Companies
AMG Managers Cadence Mid Cap
Cadence Capital Management, LLC
AMG Managers CenterSquare Real Estate
CenterSquare Investment Management, Inc.
AMG Managers Emerging Opportunities
Lord, Abbett & Co. LLC
WEDGE Capital Management L.L.P.
Next Century Growth Investors LLC
RBC Global Asset Management (U.S.) Inc.
AMG Managers Essex Small/Micro Cap Growth
Essex Investment Management Co., LLC
AMG Managers Fairpointe ESG Equity
AMG Managers Fairpointe Mid Cap
Fairpointe Capital LLC
AMG Managers Guardian Capital Global Dividend
Guardian Capital LP
AMG Managers LMCG Small Cap Growth
LMCG Investments, LLC
AMG Managers Montag & Caldwell Growth
AMG Managers Montag & Caldwell Mid Cap Growth
Montag & Caldwell, LLC
AMG Managers Pictet International
Pictet Asset Management Limited
AMG Managers Silvercrest Small Cap
Silvercrest Asset Management Group LLC
AMG Managers Skyline Special Equities
Skyline Asset Management, L.P.
AMG Managers Special Equity
Ranger Investment Management, L.P.
Lord, Abbett & Co. LLC
Smith Asset Management Group, L.P. Federated MDTA LLC
AMG Managers Value Partners Asia Dividend
Value Partners Hong Kong Limited
FIXED INCOME FUNDS
AMG Managers Amundi Intermediate Government
AMG Managers Amundi Short Duration Government
Amundi Smith Breeden LLC
AMG Managers Doubleline Core Plus Bond
DoubleLine Capital LP
AMG Managers Global Income Opportunity
AMG Managers Loomis Sayles Bond
Loomis, Sayles & Co., L.P.
| | | | |
| AR075-0917 | | | | www.amgfunds.com |
Item 2. CODE OF ETHICS
Registrant has adopted a Code of Ethics. See attached Exhibit (a)(1).
Item 3. AUDIT COMMITTEE FINANCIAL EXPERT
Registrant’s Board of Trustees has determined that independent Trustee Mr. Steven J. Paggioli qualifies as an Audit Committee Financial Expert. Mr. Paggioli is “independent” as such term is defined in Form N-CSR.
Item 4. PRINCIPAL ACCOUNTANT FEES AND SERVICES
(a) Audit Fees
The aggregate fees billed by the Funds’ independent registered public accounting firm, PricewaterhouseCoopers LLP (“PwC”), to the Funds for the Funds’ two most recent fiscal years for professional services rendered for audits of annual financial statements, or services that are normally provided in connection with statutory and regulatory filings or engagements (“Audit Fees”) were as follows:
| | | | | | | | |
| | | Fiscal 2017 | | | Fiscal 2016 | |
AMG Managers Brandywine Fund | | $ | 38,605 | | | $ | 40,349 | |
AMG Managers Brandywine Blue Fund | | $ | 32,817 | | | $ | 36,693 | |
AMG Managers Brandywine Advisors Mid Cap Growth Fund | | $ | 32,592 | | | $ | 37,022 | |
(b) Audit-Related Fees
There were no fees billed by PwC to the Funds in its two recent fiscal years for services rendered for assurance and related services that are reasonably related to the performance of the audit or review of the Fund’s financial statements, but are not reported as Audit Fees (“Audit-Related Fees”).
For the Funds’ two most recent fiscal years, there were no Audit-Related Fees billed by PwC for engagements related directly to the operations and financial reporting of one or more Funds by a Fund Service Provider. A Fund Service Provider is (a) any investment adviser to the Fund (not including any Subadvisor whose role is primarily portfolio management and is subcontracted with or overseen by another investment adviser) or (b) any entity that provides ongoing services to the Fund and is controlling, controlled by or under common control with a Fund investment adviser described in (a).
(c) Tax Fees
The aggregate fees billed by PwC to the Funds for the two most recent fiscal years for professional services rendered for tax compliance, tax advice, and tax planning (“Tax Fees”) were as follows:
| | | | | | | | |
| | | Fiscal 2017 | | | Fiscal 2016 | |
AMG Managers Brandywine Fund | | $ | 7,369 | | | $ | 7,225 | |
AMG Managers Brandywine Blue Fund | | $ | 7,369 | | | $ | 7,225 | |
AMG Managers Brandywine Advisors Mid Cap Growth Fund | | $ | 7,369 | | | $ | 7,225 | |
For the Funds’ two most recent fiscal years, Tax Fees billed by PwC for engagements by Fund Service Providers that related directly to the operations and financial reporting of the Funds were $0 for fiscal 2017 and $0 for fiscal 2016, respectively.
The services for which Tax Fees were charged comprise all services performed by professional staff in PwC’s tax division except those services related to the audit. Typically, this category would include fees for tax compliance, tax planning, and tax advice. Tax compliance, tax advice, and tax planning services include preparation of original and amended tax returns, claims for refund and tax payment-planning services, assistance with tax audits and appeals, tax advice related to mergers and acquisitions and requests for rulings or technical advice from taxing authorities.
(d) All Other Fees
There were no other fees billed by PwC to the Funds for all other non-audit services (“Other Fees”) during the Funds’ two most recent fiscal years. During the same period, there were no Other Fees billed by PwC for engagements by Fund Service Providers that related directly to the operations and financial reporting of the Funds.
(e)(1)According to policies adopted by the Audit Committee, services provided by PwC to the Funds must be pre-approved by the Audit Committee. On an annual basis, the Audit Committee reviews and pre-approves various types of services that PwC may perform for the Funds without specific approval of each engagement, subject to specified budget limitations. As contemplated by the Sarbanes-Oxley Act of 2002 and related SEC rules, the Audit Committee also pre-approves non-audit services provided by PwC to any Fund Service Provider for any engagement that relates directly to the operations and financial reporting of the Funds. Any engagement that is not already pre-approved or that will exceed a pre-approved budget must be submitted to the Audit Committee for pre-approval. The Chairman of the Audit Committee is authorized on behalf of the Board of Trustees and the Audit Committee to approve the engagement of PwC to perform non-audit services subject to certain conditions, including notification to the Audit Committee of such pre-approval not later than the next meeting of the Audit Committee following the date of such pre-approval.
(e)(2) None.
(f) Not applicable.
(g) The aggregate fees billed by PwC in 2017 and 2016 for non-audit services rendered to the Funds and Fund Service Providers were $101,532 and $54,075, respectively. For the fiscal year ended September 30, 2017, this amount reflects the amounts disclosed above in Item 4(b),(c),(d), plus $79,425 in fees billed to the Fund Service Providers for non-audit services that did not relate directly to the operations and financial reporting of the Funds. For the fiscal year ended September 30, 2016, this amount reflects the amounts disclosed above in Item 4(b),(c),(d), plus $32,400 in fees billed to the Fund Service Providers for non-audit services that did not relate directly to the operations and financial reporting of the Funds.
(h) The Trust’s Audit Committee has considered whether the provision of non-audit services by registrant’s independent registered public accounting firm to the registrant’s investment advisor, and any entity controlling, controlled, or under common control with the investment advisor that provided ongoing services to the registrant that were not pre-approved by the Committee (because such services did not relate directly to the operations and financial reporting of the registrant) was compatible with maintaining the independence of the independent registered public accounting firm.
Item 5. AUDIT COMMITTEE OF LISTED REGISTRANTS
Not applicable.
Item 6. SCHEDULE OF INVESTMENTS
The schedule of investments in unaffiliated issuers as of the close of the reporting period is included as part of the shareholder report contained in Item 1 hereof.
Item 7. DISCLOSURE OF PROXY VOTING POLICIES AND PROCEDURES FOR CLOSED-END MANAGEMENT INVESTMENT COMPANIES
Not applicable.
Item 8. PORTFOLIO MANAGERS OF CLOSED-END MANAGEMENT INVESTMENT COMPANIES
Not applicable.
Item 9. PURCHASES OF EQUITY SECURITIES BY CLOSED-END MANAGEMENT INVESTMENT COMPANIES AND AFFILIATED PURCHASERS
Not applicable.
Item 10. SUBMISSION OF MATTERS TO A VOTE OF SECURITY HOLDERS
Not applicable.
Item 11. CONTROLS AND PROCEDURES
(a) The Registrant’s principal executive and principal financial officers have concluded, based on their evaluation of the registrant’s disclosure controls and procedures as of a date within 90 days of the filing of this report, that the Registrant’s disclosure controls and procedures are reasonably designed to ensure that information required to be disclosed by the Registrant on Form N-CSR is recorded, processed, summarized and reported within the required time
periods and that information required to be disclosed by the registrant in the reports that it files or submits on Form N-CSR is accumulated and communicated to the Registrant’s management, including its principal executive and principal financial officers, as appropriate to allow timely decisions regarding required disclosure.
(b) There were no changes in the Registrant’s internal control over financial reporting during the Registrant’s fourth fiscal quarter of the period covered by this report that have materially affected, or are reasonably likely to affect, the internal control over financial reporting.
| | |
(a)(1) | | Any Code of Ethics or amendments hereto. Filed herewith. |
| |
(a)(2) | | Certificationspursuant to Rule 30a-2(a) under the Investment Company Act of 1940 - Filed herewith. |
| |
(a)(3) | | Not applicable. |
| |
(b) | | Certificationspursuant to Rule 30a-2(b) under the Investment Company Act of 1940 - Filed herewith. |
SIGNATURES
Pursuant to the requirements of the Securities Exchange Act of 1934 and the Investment Company Act of 1940, the registrant has duly caused this report to be signed on its behalf by the undersigned, thereunto duly authorized.
AMG FUNDS I
| | |
| By: | | /s/ Jeffrey T. Cerutti |
| | Jeffrey T. Cerutti, Principal Executive Officer |
| |
| Date: | | November 3, 2017 |
Pursuant to the requirements of the Securities Exchange Act of 1934 and the Investment Company Act of 1940, this report has been signed below by the following persons on behalf of the registrant and in the capacities and on the dates indicated.
| | |
| By: | | /s/ Jeffrey T. Cerutti |
| | Jeffrey T. Cerutti, Principal Executive Officer |
| |
| Date: | | November 3, 2017 |
| | |
| By: | | /s/ Thomas Disbrow |
| | Thomas Disbrow, Principal Financial Officer |
| |
| Date: | | November 3, 2017 |