UNITED STATES
SECURITIES AND EXCHANGE COMMISSION
Washington, D.C. 20549
FORM N-CSR
CERTIFIED SHAREHOLDER REPORT OF REGISTERED
MANAGEMENT INVESTMENT COMPANIES
Investment Company Act file number: 811-06520
AMG Funds I
(Exact name of registrant as specified in charter)
600 Steamboat Road, Suite 300, Greenwich, Connecticut 06830
(Address of principal executive offices) (Zip code)
AMG Funds LLC
600 Steamboat Road, Suite 300, Greenwich, Connecticut 06830
(Name and address of agent for service)
Registrant’s telephone number, including area code: (203) 299-3500
Date of fiscal year end: OCTOBER 31
Date of reporting period: NOVEMBER 1, 2014 – OCTOBER 31, 2015
(Annual Shareholder Report)
Item 1. Reports to Shareholders
| | |
 | | ANNUAL REPORT |
AMG Funds
October 31, 2015

AMG FQ Tax-Managed U.S. Equity Fund
Investor Class: MFQAX | Institutional Class: MFQTX
AMG FQ U.S. Equity Fund
Investor Class: FQUAX | Institutional Class: MEQFX
AMG FQ Global Risk-Balanced Fund
Investor Class: MMAVX | Service Class: MMASX | Institutional Class: MMAFX
| | |
| www.amgfunds.com | | | AR014-1015 |
AMG Funds
Annual Report—October 31, 2015
| | | | |
TABLE OF CONTENTS | | PAGE | |
LETTER TO SHAREHOLDERS | | | 2 | |
| |
ABOUT YOUR FUND’S EXPENSES | | | 3 | |
| |
PORTFOLIO MANAGER’S COMMENTS, FUND SNAPSHOTS, AND SCHEDULES OF PORTFOLIO INVESTMENTS | | | | |
| |
AMG FQ Tax-Managed U.S. Equity Fund | | | 4 | |
AMG FQ U.S. Equity Fund | | | 10 | |
AMG FQ Global Risk-Balanced Fund | | | 16 | |
| |
NOTES TO SCHEDULES OF PORTFOLIO INVESTMENTS | | | 21 | |
| |
FINANCIAL STATEMENTS | | | | |
| |
Statement of Assets and Liabilities | | | 28 | |
Balance sheets, net asset value (NAV) per share computations and cumulative undistributed amounts | | | | |
| |
Statement of Operations | | | 30 | |
Detail of sources of income, expenses, and realized and unrealized gains (losses) during the fiscal year | | | | |
| |
Statements of Changes in Net Assets | | | 31 | |
Detail of changes in assets for the past two fiscal years | | | | |
| |
Financial Highlights | | | 33 | |
Historical net asset values per share, distributions, total returns, income and expense ratios, turnover ratios and net assets | | | | |
| |
Notes to Financial Statements | | | 37 | |
Accounting and distribution policies, details of agreements and transactions with Fund management and affiliates, and descriptions of certain investment risks | | | | |
| |
REPORT OF INDEPENDENT REGISTERED PUBLIC ACCOUNTING FIRM | | | 46 | |
| |
TRUSTEES AND OFFICERS | | | 47 | |
| |
ANNUAL RENEWAL OF INVESTMENT MANAGEMENT AND SUBADVISORY AGREEMENTS | | | 49 | |
Nothing contained herein is to be considered an offer, sale or solicitation of an offer to buy shares of any series of the AMG Funds family of mutual funds. Such offering is made only by prospectus, which includes details as to offering price and other material information.
| | |
| | | Letter to Shareholders |
DEAR SHAREHOLDER:
Overall, U.S. equity investors were rewarded with positive, albeit modest, returns despite increasing market volatility for the fiscal year ended October 31, 2015. The S&P 500 Index, a widely followed barometer of the U.S. equity market, returned 5.2% during the past twelve months. However, the U.S. equity market did experience its first correction in four years in August as investors worried about slowing China growth and the potential impact of a U.S. Federal Reserve (the Fed) rate hike on the slow recovery in the U.S. During the year, there was significant dispersion in performance across sectors with consumer discretionary stocks returning more than 21% while companies within the energy sector fell (19)%, driven in large part by the precipitous fall in oil prices. Meanwhile, international stocks fell during the prior year, returning (4.7)%, as measured by the MSCI ACWI ex USA (in U.S. Dollar terms). International investment returns in U.S. Dollar terms were negatively impacted by continued strengthening in the U.S. Dollar. Despite the more recent difficult performance for equities, it’s worth noting that the first quarter of 2015 marked the six-year anniversary of the equity bull market.
The Barclays U.S. Aggregate Bond Index, a broad U.S. bond market benchmark, returned 2.0% for the fiscal year ended October 31, 2015. Interest rates fell throughout much of 2014 and for periods throughout the past fiscal year, lending positive support to bond prices. Investors, however, enter the new fiscal year with a close watch on the strength of the underlying U.S. economy and its potential impact on the Fed’s zero-interest-rate policy (and its subsequent impact on bond prices).
Our foremost goal at AMG Funds is to provide investment solutions that help our shareholders successfully reach their long-term investment goals. By partnering with AMG’s affiliated investment boutiques, AMG Funds provides access to a distinctive array of actively-managed, return-oriented investment strategies. Additionally, we oversee and distribute a number of complementary open-architecture mutual funds subadvised by unaffiliated investment managers. We thank you for your continued confidence and investment in AMG Funds. You can rest assured that under all market conditions our team is focused on delivering excellent investment management services for your benefit.
Respectfully,

Jeffery Cerutti
President
AMG Funds
| | | | | | | | | | | | | | |
Average Annual Total Returns | | Periods ended October 31, 2015 | |
| | | | | 1 Year | | | 3 Years | | | 5 Years | |
Stocks: | | | | | | | | | | | | | | |
Large Caps | | (S&P 500 Index) | | | 5.20 | % | | | 16.20 | % | | | 14.33 | % |
Small Caps | | (Russell 2000® Index) | | | 0.34 | % | | | 13.90 | % | | | 12.06 | % |
International | | (MSCI All Country World Index ex USA Index) | | | (4.68 | )% | | | 4.69 | % | | | 2.60 | % |
Bonds: | | | | | | | | | | | | | | |
Investment Grade | | (Barclays U.S. Aggregate Bond Index) | | | 1.96 | % | | | 1.65 | % | | | 3.03 | % |
High Yield | | (Barclays U.S. Corporate High Yield Bond Index) | | | (1.94 | )% | | | 4.15 | % | | | 6.18 | % |
Tax-exempt | | (Barclays Municipal Bond Index) | | | 2.87 | % | | | 2.91 | % | | | 4.28 | % |
Treasury Bills | | (BofA Merrill Lynch 6-month U.S. Treasury Bill) | | | 0.20 | % | | | 0.18 | % | | | 0.19 | % |
2
About Your Fund’s Expenses
As a shareholder of a Fund, you may incur two types of costs: (1) transaction costs, which may include sales charges (loads) on purchase payments; redemption fees; and exchange fees; and (2) ongoing costs, including management fees; distribution (12b-1) fees; and other Fund expenses. This example is intended to help you understand your ongoing costs (in dollars) of investing in the Fund and to compare these costs with the ongoing costs of investing in other mutual funds. The example is based on $1,000 invested at the beginning of the period and held for the entire period as indicated below.
ACTUAL EXPENSES
The first line of the following table provides information about the actual account values and actual expenses. You may use the information in this line, together with the amount you invested, to estimate the expenses that you paid over the period. Simply divide your account value by $1,000 (for example, an $8,600 account value divided by $1,000 = 8.6), then multiply the result by the number in the first line under the heading entitled “Expenses Paid During Period” to estimate the expenses you paid on your account during this period.
HYPOTHETICAL EXAMPLE FOR COMPARISON PURPOSES
The second line of the following table provides information about hypothetical account values and hypothetical expenses based on the Fund’s actual expense ratio and an assumed annual rate of return of 5% before expenses, which is not the Fund’s actual return. The hypothetical account values and expenses may not be used to estimate the actual ending account balance or expenses you paid for the period. You may use this information to compare the ongoing costs of investing in the Fund and other funds by comparing this 5% hypothetical example with the 5% hypothetical examples that appear in the shareholder reports of other funds.
Please note that the expenses shown in the table are meant to highlight your ongoing costs only and do not reflect any transactional costs, such as sales charges (loads), redemption fees, or exchange fees. Therefore, the second line of the table is useful in comparing ongoing costs only, and will not help you determine the relative total costs of owning different funds.
| | | | | | | | | | | | | | | | |
| | | Expense | | | Beginning | | | Ending | | | Expenses | |
| | | Ratio for | | | Account Value | | | Account Value | | | Paid During | |
Six Months Ended October 31, 2015 | | the Period | | | 5/01/15 | | | 10/31/15 | | | the Period* | |
AMG FQ Tax-Managed U.S. Equity Fund | | | | | | | | | | | | | | | | |
Investor Class Shares | | | | | | | | | | | | | | | | |
Based on Actual Fund Return | | | 1.17 | % | | $ | 1,000 | | | $ | 984 | | | $ | 5.85 | |
Hypothetical (5% return before expenses) | | | 1.17 | % | | $ | 1,000 | | | $ | 1,019 | | | $ | 5.95 | |
Institutional Class Shares | | | | | | | | | | | | | | | | |
Based on Actual Fund Return | | | 0.92 | % | | $ | 1,000 | | | $ | 985 | | | $ | 4.60 | |
Hypothetical (5% return before expenses) | | | 0.92 | % | | $ | 1,000 | | | $ | 1,021 | | | $ | 4.69 | |
AMG FQ U.S. Equity Fund | | | | | | | | | | | | | | | | |
Investor Class Shares | | | | | | | | | | | | | | | | |
Based on Actual Fund Return | | | 1.04 | % | | $ | 1,000 | | | $ | 1,000 | | | $ | 5.24 | |
Hypothetical (5% return before expenses) | | | 1.04 | % | | $ | 1,000 | | | $ | 1,020 | | | $ | 5.30 | |
Institutional Class Shares | | | | | | | | | | | | | | | | |
Based on Actual Fund Return | | | 0.79 | % | | $ | 1,000 | | | $ | 1,001 | | | $ | 3.98 | |
Hypothetical (5% return before expenses) | | | 0.79 | % | | $ | 1,000 | | | $ | 1,021 | | | $ | 4.02 | |
AMG FQ Global Risk-Balanced Fund | | | | | | | | | | | | | | | | |
Investor Class Shares | | | | | | | | | | | | | | | | |
Based on Actual Fund Return | | | 1.39 | % | | $ | 1,000 | | | $ | 914 | | | $ | 6.71 | |
Hypothetical (5% return before expenses) | | | 1.39 | % | | $ | 1,000 | | | $ | 1,018 | | | $ | 7.07 | |
Service Class Shares | | | | | | | | | | | | | | | | |
Based on Actual Fund Return | | | 0.98 | % | | $ | 1,000 | | | $ | 916 | | | $ | 4.73 | |
Hypothetical (5% return before expenses) | | | 0.98 | % | | $ | 1,000 | | | $ | 1,020 | | | $ | 4.99 | |
Institutional Class Shares | | | | | | | | | | | | | | | | |
Based on Actual Fund Return | | | 0.89 | % | | $ | 1,000 | | | $ | 916 | | | $ | 4.30 | |
Hypothetical (5% return before expenses) | | | 0.89 | % | | $ | 1,000 | | | $ | 1,021 | | | $ | 4.53 | |
| * | Expenses are equal to the Fund’s annualized expense ratio multiplied by the average account value over the period, multiplied by the number of days in the most recent fiscal half-year (184), then divided by 365. |
3
AMG FQ Tax-Managed U.S. Equity Fund
Portfolio Manager’s Comments (unaudited)
For the fiscal year ended October 31, 2015, the AMG FQ Tax-Managed U.S. Equity Fund (Institutional Class) (the “Fund”) returned 4.03%, compared to 4.49% for its benchmark, the Russell 3000® Index.
U.S. equity returns were positive yet subdued for the period. Several macro themes along with full valuations weighed on the market. With respect to macro, the sharp drop in oil prices damaged the prospects for many energy companies. Also, U.S. Dollar appreciation reduced earnings for exporters. U.S. and global economic growth have been disappointing and inflation has been below target, which have kept interest rates in check. In this environment, both corporate earnings and equity returns have been modest.
While broad index returns have been tepid, there have been notable movements in a number of market segments. Growth stocks outperformed value as, in the midst of lackluster earnings, investors were drawn to those companies exhibiting growth. Large-capitalization stocks outperformed small caps. Sector returns reflected macro themes, with energy and commodity-related sectors underperforming, while consumer sectors performed well. Further reflecting the cautious tone in the market, investors preferred low-volatility stocks.
The Fund underperformed the benchmark, with negative contributions from stock selection
outweighing positive contributions from industry positions and from exposures to common risk factors. The industry positions that contributed most to performance were overweights to airlines and insurance – other, and an underweight to oil extraction. The industry positions that had the greatest negative impact were the underweights to tobacco and electronics and the overweight to oil-integrated majors.
With respect to common risk factors, the greatest positive contributions were from price momentum and exposure to companies with relatively low earnings variability. The main negative contributor was exposure to stocks with above-average price volatility.
POSITIONING
The outlook for growth stocks has improved somewhat relative to value, mainly because of increased risk aversion due to concerns about global growth. At times when investors are concerned about prospects for growth, they tend to seek solvent companies with visible earnings. Such companies are typically more growth than value oriented.
Price momentum: We are cautious on the outlook for price momentum. In Q3, we had reduced the weight of momentum as concerns deepened about economic growth and as volatility increased. Moreover, momentum had become something of a crowded trade – there were signs of above-
average inflows into the strategy. More recently, broad market volatility has moderated but the volatility of the momentum factor itself is above average. Going into Q4, we increased the weight of price momentum slightly, though it remains below the strategic average.
This commentary reflects the viewpoints of the portfolio manager, First Quadrant, L.P., as of October 31, 2015 and is not intended as a forecast or guarantee of future results, and is subject to change without notice.
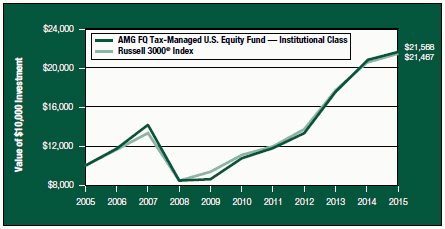
CUMULATIVE TOTAL RETURN PERFORMANCE
AMG FQ Tax-Managed U.S. Equity Fund’s cumulative total return is based on the daily change in net asset value (NAV), and assumes that all distributions were reinvested. This graph compares a hypothetical $10,000 investment made in the Institutional Class Shares of the Fund on October 31, 2005 with a $10,000 investment made in the Russell 3000® Index for the same time period. Performance for periods longer than one year is annualized. The graph and table do not reflect the deduction of taxes that a shareholder would pay on a Fund distribution or redemption of shares. The listed returns for the Fund are net of expenses and the returns for the index exclude expenses. Total returns would have been lower had certain expenses not been reduced.
4
AMG FQ Tax-Managed U.S. Equity Fund
Portfolio Manager’s Comments (continued)
CUMULATIVE TOTAL RETURN PERFORMANCE (continued)
The table below shows the average annual total returns for the AMG FQ Tax-Managed U.S. Equity Fund and the Russell 3000® Index for the same time periods ended October 31, 2015.
| | | | | | | | | | | | | | | | | | | | |
| | | One | | | Five | | | Ten | | | Since | | | Inception | |
| Average Annual Total Returns1 | | Year | | | Years | | | Years | | | Inception | | | Date | |
AMG FQ Tax-Managed U.S. Equity Fund2,3,4,5 | | | | | | | | | | | | | |
Investor Class | | | 3.79 | % | | | 14.67 | % | | | — | | | | 7.04 | % | | | 03/01/06 | |
Institutional Class | | | 4.03 | % | | | 14.95 | % | | | 7.99 | % | | | 6.70 | % | | | 12/18/00 | |
Russell 3000® Index6,7 | | | 4.49 | % | | | 14.14 | % | | | 7.94 | % | | | 5.55 | % | | | 12/18/00 | |
Return After Taxes on Distributions:8 | | | | | | | | | | | | | | | | | | | | |
Investor Class | | | 3.74 | % | | | 14.62 | % | | | — | | | | 6.99 | % | | | 03/01/06 | |
Institutional Class | | | 3.94 | % | | | 14.86 | % | | | 7.90 | % | | | 6.60 | % | | | 12/18/00 | |
Return After Taxes on Distributions & Sale of Fund Shares:8 | | | | | | | | | | | | | | | | | | | | |
Investor Class | | | 2.19 | % | | | 11.83 | % | | | — | | | | 5.69 | % | | | 03/01/06 | |
Institutional Class | | | 2.36 | % | | | 12.06 | % | | | 6.51 | % | | | 5.53 | % | | | 12/18/00 | |
The performance data shown represents past performance. Past performance is not a guarantee of future results. Current performance may be lower or higher than the performance data quoted. The investment return and principal value of an investment in the Fund will fluctuate so that an investor’s shares, when redeemed, may be worth more or less than their original cost.
Investors should carefully consider the Fund’s investment objectives, risks, charges, and expenses before investing. For performance information through the most recent month end, current net asset per share for the Fund and other information, please call (800) 835-3879 or visit our website at www.amgfunds.com for a free prospectus. Read it carefully before investing or sending money.
Distributed by AMG Distributors, Inc., member FINRA/SIPC.
| 1 | Total return equals income yield plus share price change and assumes reinvestment of all dividends and capital gain distributions. Returns are net of fees and may reflect offsets of Fund expenses as described in the prospectus. No adjustment has been made for taxes payable by shareholders on their reinvested dividends and capital gain distributions. Returns for periods greater than one year are the average annual returns. The listed returns on the Fund are net of expenses and based on the published NAV as of October 31, 2015. All returns are in U.S. dollars ($). |
| 2 | From time to time, the Fund’s advisor has waived its fees and/or absorbed Fund expenses, which has resulted in higher returns. |
| 3 | The Fund invests in large-capitalization companies that may underperform other stock funds (such as funds that focus on small- and medium-capitalization companies) when stocks of large-capitalization companies are out of favor. |
| 4 | The Fund is managed to minimize taxable distributions, it may not be able to avoid taxable distributions. |
| 5 | The Fund may invest in derivatives; the complexity and rapidly changing structure of derivatives markets may increase the possibility of market losses. |
| 6 | The Russell 3000® Index is composed of the 3,000 largest U.S. companies as measured by market capitalization, and represents approximately 98% of the U.S. stock market. Unlike the Fund, the Russell 3000® Index is unmanaged, is not available for investment, and does not incur expenses. |
| 7 | Date reflects the inception date of the Fund, not the index. |
| 8 | After-tax returns are calculated using the historical highest individual federal marginal income tax rates and do not reflect the impact of state and local taxes. Actual after-tax returns depend on an investor’s tax situation and may differ from those shown, and after-tax returns are not relevant to investors who hold their Fund shares through tax-deferred arrangements, such as 401(k) plans or individual retirement accounts. |
The Russell 3000® Index is a trademark of Russell Investments. Russell is a trademark of Russell Investments.
Not FDIC insured, nor bank guaranteed. May lose value.
5
AMG FQ Tax-Managed U.S. Equity Fund
Fund Snapshots (unaudited)
October 31, 2015
PORTFOLIO BREAKDOWN
| | | | | | | | |
| | | AMG FQ | | | | |
| | | Tax-Managed | | | Russell 3000® | |
Sector | | U.S.Equity Fund** | | | Index | |
Information Technology | | | 19.9 | % | | | 19.9 | % |
Health Care | | | 15.2 | % | | | 14.2 | % |
Financials | | | 13.1 | % | | | 17.9 | % |
Consumer Discretionary | | | 11.9 | % | | | 13.7 | % |
Industrials | | | 11.1 | % | | | 10.8 | % |
Consumer Staples | | | 9.6 | % | | | 8.5 | % |
Energy | | | 7.2 | % | | | 6.6 | % |
Materials | | | 3.5 | % | | | 3.3 | % |
Telecommunication Services | | | 3.3 | % | | | 2.1 | % |
Utilities | | | 2.2 | % | | | 3.0 | % |
Other Assets and Liabilities | | | 3.0 | % | | | 0.0 | % |
| ** | As a percentage of net assets. |
TOP TEN HOLDINGS
| | | | |
| | | %of | |
Security Name | | Net Assets | |
Apple, Inc.* | | | 4.1 | % |
Exxon Mobil Corp.* | | | 2.3 | |
Visa, Inc., Class A* | | | 2.1 | |
Alaska Air Group, Inc.* | | | 2.0 | |
MasterCard, Inc., Class A* | | | 1.9 | |
Berkshire Hathaway, Inc., Class B* | | | 1.7 | |
Gilead Sciences, Inc. | | | 1.6 | |
Microsoft Corp.* | | | 1.5 | |
UnitedHealth Group, Inc. | | | 1.5 | |
Amgen, Inc. | | | 1.4 | |
| | | | |
Top Ten as a Group | | | 20.1 | % |
| | | | |
| * | Top Ten Holdings as of April 30, 2015. |
Because a fund’s strategy may result in multiple investments in particular sectors of the economy, its performance may depend on the performance of those sectors and may fluctuate more widely than investments diversified across more sectors. For additional information on these and other risk considerations, please see the Fund’s prospectus.
Any sectors, industries, or securities discussed should not be perceived as investment recommendations. Mention of a specific security should not be considered a recommendation to buy or solicitation to sell that security. Specific securities mentioned in this report may have been sold from the Fund’s portfolio of investments by the time you receive this report.
6
AMG FQ Tax-Managed U.S. Equity Fund
Schedule of Portfolio Investments
October 31, 2015
| | | | | | | | |
| | | Shares | | | Value | |
Common Stocks - 97.0% | | | | | | | | |
Consumer Discretionary - 11.9% | | | | | |
Aaron’s, Inc. | | | 20,700 | | | $ | 510,669 | |
Citi Trends, Inc. | | | 4,900 | | | | 130,193 | |
Comcast Corp., Class A | | | 11,300 | | | | 707,606 | |
Denny’s Corp.* | | | 41,300 | | | | 452,648 | |
Dick’s Sporting Goods, Inc. | | | 14,100 | | | | 628,155 | |
Dillard’s, Inc., Class A | | | 8,900 | | | | 796,372 | |
DISH Network Corp., Class A* | | | 11,300 | | | | 711,561 | |
Dollar General Corp. | | | 8,400 | | | | 569,268 | |
Express, Inc.* | | | 10,400 | | | | 200,720 | |
Isle of Capri Casinos, Inc.* | | | 27,000 | | | | 516,510 | |
Jack in the Box, Inc. | | | 12,200 | | | | 909,266 | |
K12, Inc.* | | | 18,100 | | | | 175,751 | |
Lowe’s Cos., Inc. | | | 8,400 | | | | 620,172 | |
Marriott Vacations Worldwide Corp. | | | 9,100 | | | | 586,040 | |
Morningstar, Inc. | | | 1,100 | | | | 90,321 | |
Outerwall, Inc.1 | | | 11,600 | | | | 696,000 | |
Ruth’s Hospitality Group, Inc. | | | 8,300 | | | | 128,733 | |
ServiceMaster Global Holdings, Inc.* | | | 1,300 | | | | 46,345 | |
Shoe Carnival, Inc. | | | 2,400 | | | | 53,928 | |
Skechers U.S.A., Inc., Class A* | | | 3,700 | | | | 115,440 | |
Target Corp. | | | 900 | | | | 69,462 | |
The TJX Cos., Inc. | | | 11,600 | | | | 849,004 | |
The Walt Disney Co. | | | 1,100 | | | | 125,114 | |
Total Consumer Discretionary | | | | | | | 9,689,278 | |
Consumer Staples - 9.6% | | | | | | | | |
Archer-Daniels-Midland Co. | | | 9,000 | | | | 410,940 | |
Bunge, Ltd. | | | 1,100 | | | | 80,256 | |
Central Garden and Pet Co., Class A* | | | 46,800 | | | | 789,984 | |
Coca-Cola Enterprises, Inc. | | | 16,300 | | | | 836,842 | |
CVS Health Corp. | | | 10,100 | | | | 997,678 | |
The Estee Lauder Cos., Inc., Class A | | | 2,000 | | | | 160,920 | |
Herbalife, Ltd.*,1 | | | 6,900 | | | | 386,676 | |
Hormel Foods Corp. | | | 13,700 | | | | 925,435 | |
Mead Johnson Nutrition Co. | | | 4,600 | | | | 377,200 | |
National Beverage Corp.*,1 | | | 5,800 | | | | 218,312 | |
Pilgrim’s Pride Corp.1 | | | 36,800 | | | | 698,832 | |
The Procter & Gamble Co. | | | 4,500 | | | | 343,710 | |
Sanderson Farms, Inc.1 | | | 3,400 | | | | 236,334 | |
| | | | | | | | |
| | | Shares | | | Value | |
Tyson Foods, Inc., Class A | | | 14,900 | | | $ | 660,964 | |
Wal-Mart Stores, Inc. | | | 11,400 | | | | 652,536 | |
Total Consumer Staples | | | | | | | 7,776,619 | |
Energy - 7.2% | | | | | | | | |
Chevron Corp. | | | 2,000 | | | | 181,760 | |
Dril-Quip, Inc.* | | | 11,300 | | | | 695,628 | |
Exxon Mobil Corp. | | | 22,200 | | | | 1,836,828 | |
FMC Technologies, Inc.* | | | 8,200 | | | | 277,406 | |
Marathon Petroleum Corp. | | | 9,400 | | | | 486,920 | |
Oil States International, Inc.* | | | 17,100 | | | | 513,171 | |
Par Pacific Holdings, Inc.* | | | 4,000 | | | | 91,200 | |
Phillips 66 | | | 4,600 | | | | 409,630 | |
Schlumberger, Ltd. | | | 10,100 | | | | 789,416 | |
Valero Energy Corp. | | | 9,100 | | | | 599,872 | |
Total Energy | | | | | | | 5,881,831 | |
Financials - 13.1% | | | | | | | | |
Alleghany Corp.* | | | 1,297 | | | | 643,662 | |
American Financial Group, Inc. | | | 1,800 | | | | 129,942 | |
American International Group, Inc. | | | 4,900 | | | | 308,994 | |
American Tower Corp. | | | 800 | | | | 81,784 | |
Arch Capital Group, Ltd.*,1 | | | 11,700 | | | | 876,213 | |
Argo Group International Holdings, Ltd. | | | 1,000 | | | | 62,520 | |
Bank of America Corp. | | | 13,700 | | | | 229,886 | |
Berkshire Hathaway, Inc., Class A* | | | 1 | | | | 204,596 | |
Berkshire Hathaway, Inc., Class B* | | | 10,287 | | | | 1,399,238 | |
CenterState Banks, Inc. | | | 5,600 | | | | 81,648 | |
The Chubb Corp. | | | 2,000 | | | | 258,700 | |
Citigroup, Inc. | | | 6,700 | | | | 356,239 | |
Discover Financial Services | | | 10,500 | | | | 590,310 | |
Erie Indemnity Co., Class A | | | 2,000 | | | | 174,920 | |
Everest Re Group, Ltd. | | | 2,200 | | | | 391,534 | |
FelCor Lodging Trust, Inc. | | | 7,300 | | | | 58,765 | |
First Defiance Financial Corp. | | | 1,500 | | | | 57,450 | |
Franklin Resources, Inc. | | | 1,800 | | | | 73,368 | |
GAMCO Investors, Inc., Class A | | | 3,900 | | | | 224,952 | |
Great Southern Bancorp, Inc. | | | 1,200 | | | | 57,996 | |
Guaranty Bancorp | | | 6,800 | | | | 112,064 | |
Heritage Insurance Holdings, Inc.* | | | 8,700 | | | | 192,444 | |
JPMorgan Chase & Co. | | | 4,600 | | | | 295,550 | |
The accompanying notes are an integral part of these financial statements.
7
AMG FQ Tax-Managed U.S. Equity Fund
Schedule of Portfolio Investments (continued)
| | | | | | | | |
| | | Shares | | | Value | |
Financials - 13.1% (continued) | | | | | |
KeyCorp | | | 25,800 | | | $ | 320,436 | |
Metro Bancorp, Inc. | | | 2,400 | | | | 74,352 | |
PrivateBancorp, Inc. | | | 15,300 | | | | 639,999 | |
SEI Investments Co. | | | 9,400 | | | | 487,108 | |
Stonegate Bank | | | 1,700 | | | | 53,057 | |
SunTrust Banks, Inc. | | | 10,300 | | | | 427,656 | |
Third Point Reinsurance, Ltd.* | | | 8,200 | | | | 112,094 | |
Universal Insurance Holdings, Inc. | | | 16,800 | | | | 530,040 | |
Voya Financial, Inc. | | | 16,800 | | | | 681,576 | |
Wells Fargo & Co. | | | 7,400 | | | | 400,636 | |
WR Berkley Corp. | | | 1,300 | | | | 72,579 | |
Total Financials | | | | | | | 10,662,308 | |
Health Care - 15.2% | | | | | | | | |
Air Methods Corp.* | | | 1,400 | | | | 57,302 | |
Amgen, Inc. | | | 7,300 | | | | 1,154,714 | |
Anika Therapeutics, Inc.* | | | 10,300 | | | | 396,756 | |
Atrion Corp. | | | 251 | | | | 92,619 | |
Biogen, Inc.* | | | 2,352 | | | | 683,280 | |
Cambrex Corp.* | | | 14,400 | | | | 661,968 | |
Charles River Laboratories International, Inc.* | | | 12,700 | | | | 828,548 | |
CorVel Corp.* | | | 4,800 | | | | 159,360 | |
CR Bard, Inc. | | | 1,746 | | | | 325,367 | |
Gilead Sciences, Inc. | | | 11,700 | | | | 1,265,121 | |
HCA Holdings, Inc.* | | | 10,200 | | | | 701,658 | |
Hologic, Inc.* | | | 10,200 | | | | 396,372 | |
Humana, Inc. | | | 1,600 | | | | 285,808 | |
IMS Health Holdings, Inc.* | | | 25,700 | | | | 699,554 | |
Johnson & Johnson | | | 9,800 | | | | 990,094 | |
Lannett Co., Inc.*,1 | | | 8,900 | | | | 398,453 | |
LHC Group, Inc.* | | | 4,000 | | | | 180,260 | |
LifePoint Hospitals, Inc.* | | | 5,800 | | | | 399,504 | |
McKesson Corp. | | | 1,200 | | | | 214,560 | |
Pfizer, Inc. | | | 5,200 | | | | 175,864 | |
SciClone Pharmaceuticals, Inc.* | | | 13,200 | | | | 100,584 | |
SurModics, Inc.* | | | 10,800 | | | | 230,364 | |
UnitedHealth Group, Inc. | | | 10,100 | | | | 1,189,578 | |
Universal Health Services, Inc.,
Class B | | | 6,200 | | | | 756,958 | |
Total Health Care | | | | | | | 12,344,646 | |
| | | | | | | | |
| | | Shares | | | Value | |
Industrials - 11.1% | | | | | | | | |
Air Transport Services Group, Inc.* | | | 22,900 | | | $ | 224,191 | |
Alaska Air Group, Inc. | | | 21,100 | | | | 1,608,875 | |
AMERCO | | | 500 | | | | 203,155 | |
Delta Air Lines, Inc. | | | 20,650 | | | | 1,049,846 | |
Deluxe Corp. | | | 1,300 | | | | 77,415 | |
FedEx Corp. | | | 700 | | | | 109,235 | |
General Dynamics Corp. | | | 5,900 | | | | 876,622 | |
General Electric Co. | | | 17,300 | | | | 500,316 | |
Huntington Ingalls Industries, Inc. | | | 5,800 | | | | 695,652 | |
Jacobs Engineering Group, Inc.* | | | 1,900 | | | | 76,266 | |
JetBlue Airways Corp.* | | | 2,500 | | | | 62,100 | |
Landstar System, Inc. | | | 9,900 | | | | 624,096 | |
PAM Transportation Services, Inc.* | | | 1,300 | | | | 46,423 | |
Southwest Airlines Co. | | | 4,500 | | | | 208,305 | |
Spirit AeroSystems Holdings, Inc., Class A* | | | 15,000 | | | | 791,100 | |
UniFirst Corp. | | | 4,000 | | | | 420,280 | |
Union Pacific Corp. | | | 7,600 | | | | 679,060 | |
USA Truck, Inc.* | | | 3,100 | | | | 56,358 | |
Wabash National Corp.* | | | 56,600 | | | | 677,502 | |
Total Industrials | | | | | | | 8,986,797 | |
Information Technology - 19.9% | | | | | | | | |
Activision Blizzard, Inc. | | | 2,600 | | | | 90,376 | |
Alphabet, Inc., Class A* | | | 816 | | | | 601,710 | |
Alphabet, Inc., Class C* | | | 400 | | | | 284,324 | |
Apple, Inc. | | | 27,741 | | | | 3,315,049 | |
Electronic Arts, Inc.* | | | 12,900 | | | | 929,703 | |
EMC Corp. | | | 2,800 | | | | 73,416 | |
ePlus, Inc.* | | | 9,200 | | | | 776,664 | |
F5 Networks, Inc.* | | | 5,600 | | | | 617,120 | |
II-VI, Inc.* | | | 20,200 | | | | 366,024 | |
International Business Machines Corp. | | | 3,600 | | | | 504,288 | |
Intuit, Inc. | | | 7,700 | | | | 750,211 | |
Ixia* | | | 36,400 | | | | 524,524 | |
Jabil Circuit, Inc. | | | 6,100 | | | | 140,178 | |
MasterCard, Inc., Class A | | | 15,580 | | | | 1,542,264 | |
Microsoft Corp. | | | 23,400 | | | | 1,231,776 | |
MicroStrategy, Inc., Class A* | | | 4,500 | | | | 774,315 | |
NeuStar, Inc., Class A*,1 | | | 28,800 | | | | 783,072 | |
The accompanying notes are an integral part of these financial statements.
8
AMG FQ Tax-Managed U.S. Equity Fund
Schedule of Portfolio Investments (continued)
| | | | | | | | |
| | | Shares | | | Value | |
Information Technology - 19.9% (continued) | |
Nuance Communications, Inc.* | | | 3,200 | | | $ | 54,304 | |
Oracle Corp. | | | 22,900 | | | | 889,436 | |
PC Connection, Inc. | | | 4,800 | | | | 111,552 | |
Tessera Technologies, Inc. | | | 2,500 | | | | 87,425 | |
Visa, Inc., Class A | | | 22,400 | | | | 1,737,792 | |
Total Information Technology | | | | | | | 16,185,523 | |
Materials - 3.5% | | | | | | | | |
AEP Industries, Inc.* | | | 2,600 | | | | 208,000 | |
Bemis Co., Inc. | | | 3,800 | | | | 173,964 | |
Celanese Corp., Series A | | | 2,000 | | | | 142,100 | |
Graphic Packaging Holding Co. | | | 25,300 | | | | 358,248 | |
LyondellBasell Industries N.V., Class A | | | 8,100 | | | | 752,571 | |
Reliance Steel & Aluminum Co. | | | 700 | | | | 41,972 | |
Sealed Air Corp. | | | 12,900 | | | | 633,648 | |
The Sherwin-Williams Co. | | | 930 | | | | 248,152 | |
Westlake Chemical Corp. | | | 4,900 | | | | 295,323 | |
Total Materials | | | | | | | 2,853,978 | |
Telecommunication Services - 3.3% | | | | | | | | |
AT&T, Inc. | | | 34,201 | | | | 1,146,076 | |
Telephone & Data Systems, Inc. | | | 27,100 | | | | 776,144 | |
T-Mobile US, Inc.* | | | 1,850 | | | | 70,096 | |
Verizon Communications, Inc. | | | 15,500 | | | | 726,640 | |
Total Telecommunication Services | | | | | | | 2,718,956 | |
Utilities - 2.2% | | | | | | | | |
American Electric Power Co., Inc. | | | 2,400 | | | | 135,960 | |
American Water Works Co, Inc. | | | 12,400 | | | | 711,264 | |
Ormat Technologies, Inc.1 | | | 3,600 | | | | 135,792 | |
Public Service Enterprise Group, Inc. | | | 19,700 | | | | 813,413 | |
Total Utilities | | | | | | | 1,796,429 | |
Total Common Stocks
(cost $60,188,816) | | | | | | | 78,896,365 | |
| | | | | | | | |
| | | Principal Amount | | | Value | |
Short-Term Investments - 6.0% | |
Repurchase Agreements - 3.1%2 | |
Daiwa Capital Markets America, dated 10/30/15, due 11/02/15, 0.090%, total to be received $1,000,008 (collateralized by various U.S. Government Agency Obligations, 0.000% - 7.500%, 11/05/15 - 02/01/49,totaling $1,020,000) | | $ | 1,000,000 | | | $ | 1,000,000 | |
HSBC Securities USA Inc., dated 10/30/15, due 11/02/15, 0.070%, total to be received $537,949 (collateralized by various U.S. Government Agency Obligations, 2.500% - 8.000%, 05/01/22 - 10/01/45,totaling $548,706) | | | 537,946 | | | | 537,946 | |
Nomura Securities International Inc., dated 10/30/15, due 11/02/15, 0.080%, total to be received $1,000,007 (collateralized by various U.S. Government Agency Obligations, 0.000% - 10.500%, 11/04/15 - 09/20/65,totaling $1,020,000) | | | 1,000,000 | | | | 1,000,000 | |
Total Repurchase Agreements | | | | | | | 2,537,946 | |
| | |
| | | Shares | | | | |
Other Investment Companies - 2.9%3 | |
Dreyfus Institutional Cash Advantage Fund, Institutional Class Shares, 0.09% | | | 2,357,460 | | | | 2,357,460 | |
Total Short-Term Investments
(cost $4,895,406) | | | | | | | 4,895,406 | |
Total Investments - 103.0%
(cost $65,084,222) | | | | | | | 83,791,771 | |
Other Assets, less Liabilities - (3.0)% | | | | (2,473,968 | ) |
Net Assets - 100.0% | | | | | | $ | 81,317,803 | |
The accompanying notes are an integral part of these financial statements.
9
AMG FQ U.S. Equity Fund
Portfolio Manager’s Comments (unaudited)
For the fiscal year ended October 31, 2015, the AMG FQ U.S. Equity Fund (Institutional Class) (the “Fund”) returned 2.16%, compared to 4.49% for its benchmark, the Russell 3000® Index.
U.S. equity returns were positive yet subdued for the period. Several macro themes plus full valuations weighed on the market. With respect to macro, the sharp drop in oil prices damaged the prospects for many energy companies. Also, U.S. Dollar appreciation reduced earnings for exporters. U.S. and global economic growth have been disappointing and inflation has been below target, which have kept interest rates in check. In this environment, both corporate earnings and equity returns have been modest.
While broad index returns have been tepid, there have been notable movements in a number of market segments. Growth stocks outperformed value as, in the midst of lackluster earnings, investors were drawn to those companies exhibiting growth. Large-capitalization stocks outperformed small caps. Sector returns reflected macro themes, with energy and commodity-related sectors underperforming, while consumer sectors performed well. Further reflecting the cautious tone in the market, investors preferred low-volatility stocks.
The Fund underperformed the benchmark, with most of the underperformance coming from the protective options strategy. The options mitigate downside risk but also restrain returns when the
Index has positive returns, which was the case in this fiscal year. The equity component added to the underperformance, with negative contributions from stock selection outweighing positive contributions from industry positions and from exposures to common risk factors. The industry positions that contributed most to performance were overweights to airlines and oil refining and sales, and an underweight to oil extraction. The industry positions that had the greatest negative impact were the underweights to tobacco and drugs and the overweight to oil services. With respect to common risk factors, the greatest positive contributions were from price momentum and exposure to companies with relatively low earnings variability. The main negative contributor was exposure to stocks with above-average price volatility.
POSITIONING
The outlook for growth stocks has improved somewhat relative to value, mainly because of increased risk aversion due to concerns about global growth. At times when investors are concerned about prospects for growth, they tend to seek solvent companies with visible earnings. Such companies are typically more growth than value oriented.
Price momentum: We are cautious on the outlook for price momentum. In Q3, we had reduced the weight of momentum as concerns deepened about economic growth and as volatility increased. Moreover, momentum had become something of a
crowded trade – there were signs of above-average inflows into the strategy. More recently, broad market volatility has moderated but the volatility of the momentum factor itself is above average. Going into Q4, we increased the weight of price momentum slightly, though it remains below the strategic average.
This commentary reflects the viewpoints of the portfolio manager, First Quadrant, L.P., as of October 31, 2015 and is not intended as a forecast or guarantee of future results, and is subject to change without notice.
CUMULATIVE TOTAL RETURN PERFORMANCE
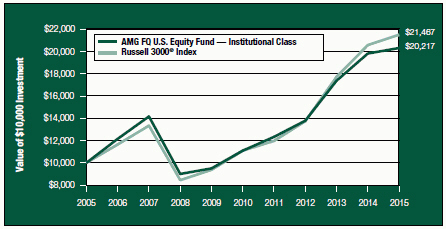
AMG FQ U.S. Equity Fund’s cumulative total return is based on the daily change in net asset value (NAV), and assumes that all distributions were reinvested. This graph compares a hypothetical $10,000 investment made in the Institutional Class Shares of the Fund on October 31, 2005 with a $10,000 investment made in the Russell 3000® Index for the same time period.
Performance for periods longer than one year is annualized. The graph and table do not reflect the deduction of taxes that a shareholder would pay on a Fund distribution or redemption of shares. The listed returns for the Fund are net of expenses and the returns for the index exclude expenses. Total returns would have been lower had certain expenses not been reduced.
10
AMG FQ U.S. Equity Fund
Portfolio Manager’s Comments (continued)
CUMULATIVE TOTAL RETURN PERFORMANCE (continued)
The table below shows the average annual total returns for the AMG FQ U.S. Equity Fund and the Russell 3000® Index for the same time periods ended October 31, 2015.
| | | | | | | | | | | | | | | | | | | | |
| | | One | | | Five | | | Ten | | | Since | | | Inception | |
| Average Annual Total Returns1 | | Year | | | Years | | | Years | | | Inception | | | Date | |
AMG FQ U.S. Equity Fund2,3,4 | | | | | | | | | | | | | | | | | | | | |
Investor Class | | | 1.90 | % | | | 12.45 | % | | | — | | | | 6.19 | % | | | 03/01/06 | |
Institutional Class | | | 2.16 | % | | | 12.77 | % | | | 7.29 | % | | | 8.18 | % | | | 08/14/92 | |
Russell 3000® Index5,6 | | | 4.49 | % | | | 14.14 | % | | | 7.94 | % | | | 9.42 | % | | | 08/14/92 | |
The performance data shown represents past performance. Past performance is not a guarantee of future results. Current performance may be lower or higher than the performance data quoted. The investment return and principal value of an investment in the Fund will fluctuate so that an investor’s shares, when redeemed, may be worth more or less than their original cost.
Investors should carefully consider the Fund’s investment objectives, risks, charges and expenses before investing. For performance information through the most recent month end, current net asset values per share for the Fund and other information, please call (800) 835-3879 or visit our website at www.amgfunds.com for a free prospectus. Read it carefully before investing or sending money.
Distributed by AMG Distributors, Inc., member FINRA/SIPC.
| 1 | Total return equals income yield plus share price change and assumes reinvestment of all dividends and capital gain distributions. Returns are net of fees and may reflect offsets of Fund expenses as described in the prospectus. No adjustment has been made for taxes payable by shareholders on their reinvested dividends and capital gain distributions. Returns for periods greater than one year are the average annual returns. The listed returns on the Fund are net of expenses and based on the published NAV as of October 31, 2015. All returns are in U.S. dollars ($). |
| 2 | From time to time, the Fund’s advisor has waived its fees and/or absorbed Fund expenses, which has resulted in higher returns. |
| 3 | The Fund invests in large-capitalization companies that may underperform other stock funds (such as funds that focus on small- and medium-capitalization companies) when stocks of large-capitalization companies are out of favor. |
| 4 | The Fund may invest in derivatives; the complexity and rapidly changing structure of derivatives markets may increase the possibility of market losses. |
| 5 | The Russell 3000® Index is composed of the 3,000 largest U.S. companies as measured by market capitalization, and represents approximately 98% of the U.S. stock market. Unlike the Fund, the Russell 3000® Index is unmanaged, is not available for investment, and does not incur expenses. |
| 6 | Date reflects the inception date of the Fund, not the index. |
The Russell 3000® Index is a trademark of Russell Investments. Russell is a trademark of Russell Investments.
Not FDIC insured, nor bank guaranteed. May lose value.
11
AMG FQ U.S. Equity Fund
Fund Snapshots (unaudited)
October 31, 2015
PORTFOLIO BREAKDOWN
| | | | | | | | |
| | | AMG FQ | | | | |
| | | U.S. | | | Russell 3000® | |
Sector | | Equity Fund** | | | Index | |
Financials | | | 18.4 | % | | | 17.9 | % |
Information Technology | | | 18.0 | % | | | 19.9 | % |
Health Care | | | 14.6 | % | | | 14.2 | % |
Consumer Discretionary | | | 12.6 | % | | | 13.7 | % |
Industrials | | | 10.9 | % | | | 10.8 | % |
Consumer Staples | | | 9.2 | % | | | 8.5 | % |
Energy | | | 7.2 | % | | | 6.6 | % |
Materials | | | 4.7 | % | | | 3.3 | % |
Telecommunication Services | | | 2.9 | % | | | 2.1 | % |
Utilities | | | 1.8 | % | | | 3.0 | % |
Purchased Options | | | 0.3 | % | | | 0.0 | % |
Other Assets and Liabilities | | | (0.6 | )% | | | 0.0 | % |
| ** | As a percentage of net assets. |
TOP TEN HOLDINGS
| | | | |
| | | %of | |
Security Name | | Net Assets | |
Apple, Inc.* | | | 4.1 | % |
Berkshire Hathaway, Inc., Class B* | | | 2.3 | |
JPMorgan Chase & Co.* | | | 2.3 | |
Verizon Communications, Inc. | | | 2.0 | |
The Home Depot, Inc. | | | 2.0 | |
Gilead Sciences, Inc. | | | 1.9 | |
UnitedHealth Group, Inc.* | | | 1.8 | |
Citigroup, Inc. | | | 1.8 | |
Bank of America Corp. | | | 1.8 | |
Amgen, Inc. | | | 1.7 | |
| | | | |
Top Ten as a Group | | | 21.7 | % |
| | | | |
| * | Top Ten Holdings as of April 30, 2015. |
Because a fund’s strategy may result in multiple investments in particular sectors of the economy, its performance may depend on the performance of those sectors and may fluctuate more widely than investments diversified across more sectors. For additional information on these and other risk considerations, please see the Fund’s prospectus.
Any sectors, industries, or securities discussed should not be perceived as investment recommendations. Mention of a specific security should not be considered a recommendation to buy or solicitation to sell that security. Specific securities mentioned in this report may have been sold from the Fund’s portfolio of investments by the time you receive this report.
12
AMG FQ U.S. Equity Fund
Schedule of Portfolio Investments
October 31, 2015
| | | | | | | | |
| | | Shares | | | Value | |
Common Stocks - 100.3% | | | | | |
Consumer Discretionary - 12.6% | | | | | |
Amazon.com, Inc.* | | | 270 | | | $ | 168,993 | |
Comcast Corp., Class A4 | | | 13,100 | | | | 820,322 | |
Denny’s Corp.* | | | 34,500 | | | | 378,120 | |
DISH Network Corp., Class A* | | | 12,340 | | | | 777,050 | |
Dollar General Corp.4 | | | 11,400 | | | | 772,578 | |
Entravision Communications Corp., Class A | | | 7,500 | | | | 65,700 | |
Expedia, Inc. | | | 600 | | | | 81,780 | |
Foot Locker, Inc.4 | | | 12,100 | | | | 819,775 | |
The Goodyear Tire & Rubber Co. | | | 17,900 | | | | 587,836 | |
The Home Depot, Inc.4 | | | 11,000 | | | | 1,360,040 | |
Isle of Capri Casinos, Inc.* | | | 13,600 | | | | 260,168 | |
Liberty Interactive Corp. QVC Group, Class A* | | | 9,910 | | | | 271,237 | |
Morningstar, Inc. | | | 500 | | | | 41,055 | |
Outerwall, Inc.1 | | | 900 | | | | 54,000 | |
PetMed Express, Inc. | | | 20,400 | | | | 343,128 | |
Ruby Tuesday, Inc.* | | | 13,600 | | | | 71,128 | |
Ruth’s Hospitality Group, Inc. | | | 5,400 | | | | 83,754 | |
Starbucks Corp. | | | 6,400 | | | | 400,448 | |
Target Corp. | | | 6,000 | | | | 463,080 | |
The Walt Disney Co. | | | 1,400 | | | | 159,236 | |
Winnebago Industries, Inc.1 | | | 25,300 | | | | 531,047 | |
Total Consumer Discretionary | | | | | | | 8,510,475 | |
Consumer Staples - 9.2% | | | | | | | | |
Brown-Forman Corp., Class B | | | 450 | | | | 47,781 | |
Central Garden and Pet Co., Class A* | | | 11,300 | | | | 190,744 | |
Church & Dwight Co., Inc. | | | 700 | | | | 60,263 | |
The Clorox Co. | | | 400 | | | | 48,776 | |
Coca-Cola Enterprises, Inc. | | | 15,500 | | | | 795,770 | |
Coty, Inc., Class A | | | 26,900 | | | | 778,755 | |
CVS Health Corp.4 | | | 8,600 | | | | 849,508 | |
The Estee Lauder Cos., Inc., Class A | | | 5,400 | | | | 434,484 | |
Flowers Foods, Inc. | | | 2,700 | | | | 72,900 | |
Hormel Foods Corp. | | | 10,820 | | | | 730,891 | |
The Kroger Co. | | | 1,800 | | | | 68,040 | |
Mead Johnson Nutrition Co. | | | 1,000 | | | | 82,000 | |
PepsiCo, Inc.4 | | | 6,180 | | | | 631,534 | |
Philip Morris International, Inc. | | | 7,000 | | | | 618,800 | |
Pilgrim’s Pride Corp.1 | | | 18,900 | | | | 358,911 | |
| | | | | | | | |
| | | Shares | | | Value | |
The Procter & Gamble Co.4 | | | 5,300 | | | $ | 404,814 | |
Total Consumer Staples | | | | | | | 6,173,971 | |
Energy - 7.2% | | | | | | | | |
Chevron Corp.4 | | | 800 | | | | 72,704 | |
CVR Energy, Inc.1 | | | 12,000 | | | | 533,520 | |
Dril-Quip, Inc.* | | | 1,000 | | | | 61,560 | |
Exxon Mobil Corp.4 | | | 7,300 | | | | 604,002 | |
Frank’s International NV | | | 6,700 | | | | 114,972 | |
Marathon Petroleum Corp.4 | | | 18,400 | | | | 953,120 | |
Phillips 66 | | | 800 | | | | 71,240 | |
Schlumberger, Ltd.4 | | | 13,700 | | | | 1,070,792 | |
Tesoro Corp. | | | 3,500 | | | | 374,255 | |
Valero Energy Corp.4 | | | 14,900 | | | | 982,208 | |
Total Energy | | | | | | | 4,838,373 | |
Financials - 18.4% | | | | | | | | |
The Allstate Corp. | | | 7,900 | | | | 488,852 | |
Altisource Portfolio Solutions, S.A.* | | | 2,400 | | | | 64,344 | |
American Express Co.4 | | | 8,400 | | | | 615,384 | |
Ameriprise Financial, Inc. | | | 500 | | | | 57,680 | |
Arch Capital Group, Ltd.* | | | 1,100 | | | | 82,379 | |
Bank of America Corp.4 | | | 70,450 | | | | 1,182,151 | |
The Bank of New York Mellon Corp. | | | 3,600 | | | | 149,940 | |
Berkshire Hathaway, Inc., Class B*,4 | | | 11,300 | | | | 1,537,026 | |
CBL & Associates Properties, Inc. | | | 28,000 | | | | 408,240 | |
Citigroup, Inc. | | | 22,310 | | | | 1,186,223 | |
Erie Indemnity Co., Class A | | | 700 | | | | 61,222 | |
Everest Re Group, Ltd. | | | 1,300 | | | | 231,361 | |
Flagstar Bancorp, Inc.* | | | 7,900 | | | | 175,696 | |
Franklin Resources, Inc. | | | 6,200 | | | | 252,712 | |
GAMCO Investors, Inc., Class A | | | 2,700 | | | | 155,736 | |
The Hanover Insurance Group, Inc. | | | 800 | | | | 67,400 | |
Host Hotels & Resorts, Inc. | | | 2,900 | | | | 50,257 | |
JPMorgan Chase & Co.4 | | | 23,700 | | | | 1,522,725 | |
LaSalle Hotel Properties | | | 1,600 | | | | 47,056 | |
Lazard, Ltd., Class A | | | 8,300 | | | | 384,456 | |
Morgan Stanley | | | 1,900 | | | | 62,643 | |
Northern Trust Corp. | | | 2,940 | | | | 206,947 | |
OFG Bancorp | | | 4,800 | | | | 44,208 | |
Paramount Group, Inc. | | | 3,300 | | | | 58,641 | |
The Progressive Corp. | | | 2,600 | | | | 86,138 | |
The accompanying notes are an integral part of these financial statements.
13
AMG FQ U.S. Equity Fund
Schedule of Portfolio Investments (continued)
| | | | | | | | |
| | | Shares | | | Value | |
Financials - 18.4% (continued) | |
Public Storage | | | 300 | | | $ | 68,838 | |
SEI Investments Co. | | | 1,700 | | | | 88,094 | |
Simon Property Group, Inc. | | | 3,510 | | | | 707,125 | |
Synovus Financial Corp. | | | 1,480 | | | | 46,812 | |
Taubman Centers, Inc. | | | 800 | | | | 61,584 | |
The Travelers Cos., Inc. | | | 8,100 | | | | 914,409 | |
Voya Financial, Inc. | | | 15,300 | | | | 620,721 | |
Wells Fargo & Co.4 | | | 13,200 | | | | 714,648 | |
Total Financials | | | | | | | 12,401,648 | |
Health Care - 14.6% | | | | | | | | |
Agilent Technologies, Inc. | | | 1,470 | | | | 55,507 | |
Alliance HealthCare Services, Inc.* | | | 2,600 | | | | 21,996 | |
Amgen, Inc.4 | | | 7,100 | | | | 1,123,078 | |
Biogen, Inc.* | | | 2,100 | | | | 610,071 | |
Charles River Laboratories International, Inc.* | | | 1,000 | | | | 65,240 | |
Chemed Corp. | | | 2,100 | | | | 330,309 | |
CR Bard, Inc. | | | 4,100 | | | | 764,035 | |
Gilead Sciences, Inc.4 | | | 11,700 | | | | 1,265,121 | |
HCA Holdings, Inc.* | | | 3,800 | | | | 261,402 | |
Hologic, Inc.* | | | 5,600 | | | | 217,616 | |
Johnson & Johnson4 | | | 9,700 | | | | 979,991 | |
LifePoint Hospitals, Inc.* | | | 3,300 | | | | 227,304 | |
McKesson Corp. | | | 800 | | | | 143,040 | |
Merck & Co., Inc.4 | | | 6,600 | | | | 360,756 | |
PDL BioPharma, Inc.1 | | | 38,000 | | | | 174,040 | |
Pfizer, Inc. | | | 13,100 | | | | 443,042 | |
SciClone Pharmaceuticals, Inc.* | | | 4,700 | | | | 35,814 | |
St. Jude Medical, Inc. | | | 7,000 | | | | 446,670 | |
Sucampo Pharmaceuticals, Inc.,
Class A* | | | 1,700 | | | | 32,912 | |
UnitedHealth Group, Inc.4 | | | 10,300 | | | | 1,213,134 | |
Universal Health Services, Inc.,
Class B | | | 6,900 | | | | 842,421 | |
Waters Corp.* | | | 200 | | | | 25,560 | |
Zoetis, Inc. | | | 4,000 | | | | 172,040 | |
Total Health Care | | | | | | | 9,811,099 | |
Industrials - 10.9% | | | | | | | | |
3M Co. | | | 1,400 | | | | 220,094 | |
Air Transport Services Group, Inc.* | | | 10,500 | | | | 102,795 | |
Alaska Air Group, Inc. | | | 4,700 | | | | 358,375 | |
Atlas Air Worldwide Holdings, Inc.* | | | 12,800 | | | | 527,872 | |
| | | | | | | | |
| | | Shares | | | Value | |
The Boeing Co. | | | 1,100 | | | $ | 162,877 | |
Delta Air Lines, Inc. | | | 9,700 | | | | 493,148 | |
Ennis, Inc. | | | 11,200 | | | | 224,336 | |
Expeditors International of Washington, Inc. | | | 4,300 | | | | 214,097 | |
General Dynamics Corp.4 | | | 6,800 | | | | 1,010,344 | |
General Electric Co.4 | | | 22,600 | | | | 653,592 | |
Illinois Tool Works, Inc. | | | 2,700 | | | | 248,238 | |
JetBlue Airways Corp.* | | | 3,100 | | | | 77,004 | |
Roper Technologies, Inc. | | | 1,200 | | | | 223,620 | |
Southwest Airlines Co. | | | 21,400 | | | | 990,606 | |
Spirit AeroSystems Holdings, Inc., Class A* | | | 15,100 | | | | 796,374 | |
United Parcel Service, Inc., Class B4 | | | 9,530 | | | | 981,781 | |
WABCO Holdings, Inc.* | | | 500 | | | | 56,115 | |
Total Industrials | | | | | | | 7,341,268 | |
Information Technology - 18.0% | | | | | | | | |
Activision Blizzard, Inc. | | | 30,400 | | | | 1,056,704 | |
Alphabet, Inc., Class A*,4 | | | 882 | | | | 650,378 | |
Alphabet, Inc., Class C*,4 | | | 382 | | | | 271,529 | |
Apple, Inc.4 | | | 23,307 | | | | 2,785,186 | |
eBay, Inc.* | | | 1,390 | | | | 38,781 | |
ePlus, Inc.* | | | 4,000 | | | | 337,680 | |
F5 Networks, Inc.* | | | 6,900 | | | | 760,380 | |
FEI Co. | | | 8,800 | | | | 635,272 | |
II-VI, Inc.* | | | 10,400 | | | | 188,448 | |
Intuit, Inc. | | | 690 | | | | 67,227 | |
Jabil Circuit, Inc. | | | 37,140 | | | | 853,477 | |
Leidos Holdings, Inc. | | | 2,800 | | | | 147,196 | |
Marchex, Inc., Class B | | | 9,800 | | | | 42,336 | |
Mercury Systems, Inc.* | | | 4,200 | | | | 72,072 | |
Microsoft Corp.4 | | | 17,300 | | | | 910,672 | |
MicroStrategy, Inc., Class A* | | | 4,100 | | | | 705,487 | |
NeuStar, Inc., Class A*,1 | | | 11,000 | | | | 299,090 | |
PayPal Holdings, Inc.* | | | 1,000 | | | | 36,010 | |
Plantronics, Inc. | | | 700 | | | | 37,534 | |
QLogic Corp.* | | | 3,800 | | | | 47,120 | |
Tessera Technologies, Inc. | | | 4,500 | | | | 157,365 | |
Texas Instruments, Inc.4 | | | 18,100 | | | | 1,026,632 | |
Visa, Inc., Class A | | | 10,800 | | | | 837,864 | |
Web.com Group, Inc.* | | | 2,900 | | | | 68,063 | |
The accompanying notes are an integral part of these financial statements.
14
AMG FQ U.S. Equity Fund
Schedule of Portfolio Investments (continued)
| | | | | | | | |
| | | Shares | | | Value | |
Information Technology - 18.0% (continued) | |
Xerox Corp. | | | 7,700 | | | $ | 72,303 | |
Total Information Technology | | | | | | | 12,104,806 | |
Materials - 4.7% | | | | | | | | |
Bemis Co., Inc. | | | 8,700 | | | | 398,286 | |
Domtar Corp. | | | 19,000 | | | | 783,560 | |
FutureFuel Corp. | | | 3,100 | | | | 47,771 | |
LyondellBasell Industries N.V., Class A | | | 9,900 | | | | 919,809 | |
Reliance Steel & Aluminum Co. | | | 12,300 | | | | 737,508 | |
Sealed Air Corp. | | | 4,800 | | | | 235,776 | |
SunCoke Energy, Inc. | | | 15,100 | | | | 74,896 | |
Total Materials | | | | | | | 3,197,606 | |
Telecommunication Services - 2.9% | | | | | | | | |
AT&T, Inc. | | | 4,381 | | | | 146,807 | |
CenturyLink, Inc.1 | | | 1,300 | | | | 36,673 | |
Telephone & Data Systems, Inc. | | | 13,800 | | | | 395,232 | |
Verizon Communications, Inc.4 | | | 29,200 | | �� | | 1,368,896 | |
Total Telecommunication Services | | | | | | | 1,947,608 | |
Utilities - 1.8% | | | | | | | | |
AES Corp. | | | 5,000 | | | | 54,750 | |
American Electric Power Co., Inc. | | | 3,600 | | | | 203,940 | |
American Water Works Co, Inc. | | | 1,200 | | | | 68,832 | |
NextEra Energy, Inc. | | | 600 | | | | 61,596 | |
Public Service Enterprise Group, Inc. | | | 20,000 | | | | 825,800 | |
Total Utilities | | | | | | | 1,214,918 | |
Total Common Stocks
(cost $62,688,206) | | | | | | | 67,541,772 | |
| | | | | | | | |
| | | Contracts | | | Value | |
Purchased Options - 0.3% | | | | | | | | |
S&P 500 Puts, 1,825 Strike Price, Expiration 12/19/15 | | | 119 | | | $ | 55,335 | |
S&P 500 Puts, 1,875 Strike Price, Expiration 11/20/15 | | | 108 | | | | 17,820 | |
S&P 500 Puts, 1,885 Strike Price, Expiration 01/15/16 | | | 101 | | | | 141,400 | |
Total Purchased Options
(cost $1,211,992) | | | | | | | 214,555 | |
| | |
| | | Principal
Amount | | | | |
Short-Term Investments - 2.6% | | | | | | | | |
Repurchase Agreements - 2.2%2 | | | | | | | | |
Daiwa Capital Markets America, dated 10/30/15, due 11/02/15, 0.090%, total to be received $479,783 (collateralized by various U.S. Government Agency Obligations, 0.000% - 7.500%, 11/05/15 - 02/01/49,totaling $489,374) | | $ | 479,779 | | | | 479,779 | |
Nomura Securities International Inc., dated 10/30/15, due 11/02/15, 0.080%, total to be received $1,000,007 (collateralized by various U.S. Government Agency Obligations, 0.000% - 10.500%, 11/04/15 - 09/20/65,totaling $1,020,000) | | | 1,000,000 | | | | 1,000,000 | |
Total Repurchase Agreements | | | | | | | 1,479,779 | |
| | |
| | | Shares | | | | |
Other Investment Companies - 0.4%3 | | | | | |
Dreyfus Institutional Cash Advantage Fund, Institutional Class Shares, 0.09% | | | 271,926 | | | | 271,926 | |
Total Short-Term Investments
(cost $1,751,705) | | | | | | | 1,751,705 | |
Total Investments - 103.2%
(cost $65,651,903) | | | | | | | 69,508,032 | |
Other Assets, less Liabilities - (3.2)% | | | | | | | (2,152,042 | ) |
Net Assets - 100.0% | | | | | | $ | 67,355,990 | |
The accompanying notes are an integral part of these financial statements.
15
AMG FQ Global Risk-Balanced Fund
Portfolio Manager’s Comments (unaudited)
The AMG FQ Global Risk-Balanced Fund (the Fund) (Institutional Class) returned (3.92)%, while its benchmark, which consists of 60% of the return of MSCI World (hedged) Index and 40% of the return of the Citigroup World Government Bond (hedged) Index, returned 3.87% for the fiscal year ending October 31, 2015.
Primarily, the negative performance was limited to commodities and Emerging Markets. Energy prices fell dramatically in late 2014 and into 2015 as increasing supply followed by the OPEC decision not to take action sent oil prices plummeting. Industrial metals also suffered due to a stronger U.S. Dollar and a slowdown in China. Most Emerging Market securities followed suit. Meanwhile, the Greek crisis, combined with deflationary pressures in Europe, caused a selloff in European equities. In the end, sovereign bonds, which many perceived as being the weak asset class, rallied during the period even though the prospect of increased U.S. interest rates loomed on the horizon. Expectations of higher rates in the U.S. also drove the U.S. Dollar higher, putting further pressure on commodities and Emerging Markets. So while equities and bonds turned in positive performance, negative returns from commodities and Emerging Markets eroded those returns for the period.
While market uncertainty feels high, the Market Risk Index only recently went to levels consistent with a fragile market state. The Market Risk Index began the 2014 year at its lowest reading, but in December 2014 moved up slightly. It remained at that level until early September 2015, when stock market sentiment, as measured by the implied volatility of index options, crossed its long-term median. This signaled a shift from resilient markets to fragile markets. Resilient markets are characterized by low volatility, low “tail” risk and an environment where risk is rewarded by return. Fragile markets, by contrast, have high volatility,
frequent large events (both positive and negative) and an environment where risk is not necessarily rewarded with return. The shift to a fragile market state means that the investing landscape is likely to be quite different in the coming months than it has been in the last few years.
Early 2015, markets rallied as there was optimism that the European Central Bank would be able to stimulate the European economy and the U.S. economy was strengthening. However, that changed in Q2 as uncertainty increased, primarily because of political risks associated with Greece. As expected, resolution of the Greek situation in July helped markets stabilize in the short term however, the market focus then moved to the real issue, China.
China has been a drag on Emerging Markets and industrial commodities throughout 2015. While the Fund does not have a direct investment in China, the speculative bubble of the last year appears to be deflating. The Chinese government is already embarking on a series of actions which will likely make the situation worse rather than better. How China will deal with the aftermath of their market retrenchment is unknown though their recent actions were not encouraging and caused a significant stock market decline in August.
Deflationary pressures were felt in the inflation hedging components in the Fund. Oversupply in both the industrial and agricultural sectors weighed on commodities. While we reduced commodity positions in early July to reflect their higher risk, commodities were the biggest drag on the Fund. In a similar vein, inflation-linked bonds were also a drag on returns.
In the coming year there are many issues that investors will face. In the U.S., monetary policy is likely to become more restrictive, though in the grand scheme of things the U.S. Federal Reserve remains accommodative. Unfortunately, their plan
to raise interest rates soon will complicate efforts throughout the globe to combat deflationary pressures by causing a continued rise in the U.S. Dollar. The rise in the Dollar will inhibit the earnings of multi-national companies and U.S. exports. The situations in Europe and China remain unresolved and could cause future market volatility in 2016. The Market Risk Index is likely to decline to a moderate stance in the near future. While lower, we would still be in the fragile market environment. The Fund is positioned for growth but also has protective measures in place to seek to minimize risk and maximize the opportunity for returns.
This commentary reflects the viewpoints of the portfolio manager, First Quadrant, L.P., as of October 31, 2015 and is not intended as a forecast or guarantee of future results, and is subject to change without notice.
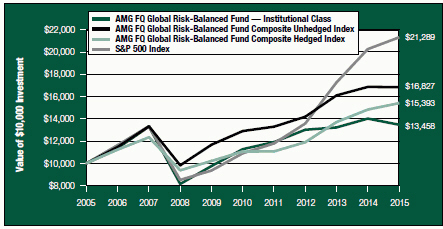
CUMULATIVE TOTAL RETURN PERFORMANCE
AMG FQ Global Risk-Balanced Fund’s cumulative total return is based on the daily change in net asset value (NAV), and assumes that all distributions were reinvested. This graph compares a hypothetical $10,000 investment made in the Institutional Class Shares of the Fund on October 31, 2005, to a $10,000 investment made in the Hedged Index and the Unhedged Index for the same time period. Figures include reinvestment of capital gains and dividends. The listed returns for the Fund are net of expenses and the returns for the index exclude expenses. Performance for periods longer than one year is annualized. The graph and table do not reflect the deduction of taxes that a shareholder would pay on a Fund distribution or redemption of shares. The listed returns for the Fund are net of expenses and the returns for the index exclude expenses. Total returns would have been lower had certain expenses not been reduced.
16
AMG FQ Global Risk-Balanced Fund
Portfolio Manager’s Comments (continued)
CUMULATIVE TOTAL RETURN PERFORMANCE (continued)
The table below shows the average annual total returns for the AMG FQ Global Risk-Balanced Fund and the AMG FQ Global Risk-Balanced Fund Composite Hedged and Unhedged Indexes for the same time periods ended October 31, 2015.
| | | | | | | | | | | | | | | | | | | | |
| | | One | | | Five | | | Ten | | | Since | | | Inception | |
| Average Annual Total Returns1 | | Year | | | Years | | | Years | | | Inception | | | Date | |
AMG FQ Global Risk-Balanced Fund2,3,4,5,6,7,8,9,10 | | | | | | | | | | | | | |
Investor Class | | | (4.31 | )% | | | 3.10 | % | | | — | | | | 4.69 | % | | | 01/01/10 | |
Service Class | | | (3.98 | )% | | | 3.50 | % | | | — | | | | 5.09 | % | | | 01/01/10 | |
Institutional Class | | | (3.92 | )% | | | 3.61 | % | | | 3.01 | % | | | 5.81 | % | | | 11/18/88 | |
AMG FQ Global Risk-Balanced Fund
Composite Hedged Index11,12 | | | 3.87 | % | | | 6.84 | % | | | 4.41 | % | | | 5.78 | % | | | 11/30/88 | |
AMG FQ Global Risk-Balanced Fund
Composite Unhedged Index11,12 | | | (0.12 | )% | | | 5.47 | % | | | 5.34 | % | | | 6.63 | % | | | 11/30/88 | |
S&P 500 Index13 | | | 5.20 | % | | | 14.33 | % | | | 7.85 | % | | | 10.30 | % | | | 11/18/88 | † |
The performance data shown represents past performance. Past performance is not a guarantee of future results. Current performance may be lower or higher than the performance data quoted. The investment return and principal value of an investment in the Fund will fluctuate so that an investor’s shares, when redeemed, may be worth more or less than their original cost.
Investors should carefully consider the Fund’s investment objectives, risks, charges and expenses before investing. For performance information through the most recent month end, current net asset values per share for the Fund and other information, please call (800) 835-3879 or visit our website at www.amgfunds.com for a free prospectus. Read it carefully before investing or sending money.
Distributed by AMG Distributors, Inc., member FINRA/SIPC.
| † | Date reflects inception date of the Fund, not the index. |
| 1 | Total return equals income yield plus share price change and assumes reinvestment of all dividends and capital gain distributions. Returns are net of fees and may reflect offsets of Fund expenses as described in the prospectus. No adjustment has been made for taxes payable by shareholders on their reinvested dividends and capital gain distributions. Returns for periods greater than one year are the average annual returns. The listed returns on the Fund are net of expenses and based on the published NAV as of October 31, 2015. All returns are in U.S. dollars ($). |
| 2 | From time to time, the Fund’s advisor has waived its fees and/or absorbed Fund expenses, which has resulted in higher returns. |
| 3 | Investments in foreign securities, even though publicly traded in the United States, may involve risks which are in addition to those inherent in domestic investments. |
| 4 | The use of leverage in a Fund’s strategy can magnify relatively small market movements into relatively larger losses for the Fund. |
| 5 | The Fund is subject to special risk considerations similar to those associated with the direct ownership of real estate. Real estate valuations may be subject to factors such as changing general and local economic, financial, competitive and environmental conditions. |
| 6 | Because the Fund invests in exchange traded funds (ETFs) which incur their own costs, investing in them could result in a higher cost to the investor. Additionally, the Fund will be indirectly exposed to all the risks of securities held by the ETFs. |
| 7 | Obligations of certain government agencies are not backed by the full faith and credit of the U.S. Government. If one of these agencies defaulted on a loan, there is no guarantee that the U.S. Government will provide financial support. Additionally, debt securities of the U.S. Government may be affected by changing interest rates and subject to prepayment risk. |
| 8 | The Fund is subject to risks associated with investments in small- and mid-capitalization companies, such as erratic earnings patterns, competitive conditions, limited earnings history, and a reliance on one or a limited number of products. |
| 9 | The Fund is subject to the risks associated with investments in debt securities, such as default risk and fluctuations in the perception of the debtor’s ability to pay its creditors. Changing interest rates may adversely affect the value of an investment. An increase in interest rates typically causes the value of bonds and other fixed-income securities to fall. |
17
AMG FQ Global Risk-Balanced Fund
Portfolio Manager’s Comments (continued)
CUMULATIVE TOTAL RETURN PERFORMANCE (continued)
| 10 | The Fund may invest in derivatives such as options and futures; the complexity and rapidly changing structure of derivatives markets may increase the possibility of market losses. |
| 11 | The Fund’s index is comprised of 60% MSCI World Index and 40% Citigroup World Government Index (Composite Index). The MSCI World Index is a free float-adjusted market capitalization weighted index that is designed to measure the equity market performance of developed and emerging markets. The MSCI World Index consists of 23 developed country indices. The Citigroup World Government Bond Index is a market capitalization weighted index consisting of the government bond markets. Country eligibility is determined based on market capitalization and investability criteria. All issues have a remaining maturity of at least one year. Unlike the Fund, the Composite Index is unmanaged, is not available for investment, and does not incur fees. All MSCI data is provided ’as is.’ The products described herein are not sponsored or endorsed and have not been reviewed or passed on by MSCI. In no event shall MSCI, its affiliates, or any MSCI data provider have any liability of any kind in connection with the MSCI data or the products described herein. Copying or redistributing the MSCI data is strictly prohibited. |
| 12 | The date reflects the closest available index date to the Fund’s inception date. |
| 13 | The S&P 500 Index is capitalization-weighted index of 500 stocks. The S&P 500 Index is designed to measure performance of the broad domestic economy through changes in the aggregate market value of 500 stocks representing all major industries. |
The S&P 500 Index is proprietary data of Standard & Poor’s, a division of McGraw-Hill Companies, Inc.
Not FDIC insured, nor bank guaranteed. May lose value.
18
AMG FQ Global Risk-Balanced Fund
Schedule of Portfolio Investments
October 31, 2015
| | | | | | | | |
| | | Shares | | | Value | |
Exchange Traded Funds—46.6% | | | | | | | | |
iShares Barclays TIPS Bond Fund4 | | | 123,196 | | | $ | 13,669,828 | |
iShares iBoxx $ Investment Grade Corporate Bond4 | | | 74,262 | | | | 8,645,582 | |
Jefferies TR/J CRB Global Commodity Equity Index Fund | | | 20,609 | | | | 657,841 | |
Market Vectors Gold Miners1 | | | 44,461 | | | | 665,137 | |
Market Vectors Natural Resources1 | | | 22,929 | | | | 672,278 | |
Materials Select Sector SPDR Fund1 | | | 15,412 | | | | 697,855 | |
SPDR DB International Government Inflation-Protected Bond4 | | | 62,563 | | | | 3,292,691 | |
Vanguard REIT4 | | | 37,831 | | | | 3,022,319 | |
Total Exchange Traded Funds
(cost $32,345,488) | | | | | | | 31,323,531 | |
| | |
| | | Notes | | | | |
Exchange Traded Notes—11.2% | | | | | | | | |
Barclays, Inc., iPath Bloomberg Agriculture Subindex Total Return, 10/22/37 | | | 20,148 | | | | 723,112 | |
Barclays, Inc., iPath Dow Jones-UBS Copper Subindex Total Return, 10/22/371 | | | 42,417 | | | | 1,149,501 | |
Barclays, Inc., iPath Dow Jones-UBS Grains Subindex Total Return, 10/22/37 | | | 20,323 | | | | 669,236 | |
Deutsche Bank AG, PowerShares DB Gold Double Long, 02/15/38 | | | 62,828 | | | | 1,333,210 | |
Goldman Sachs, Connect S&P GSCI Enhanced Commodity Index Total Return, 5/8/37 | | | 42,775 | | | | 1,021,039 | |
Swedish Export Credit Corp., ELEMENTS Linked to the Rogers International Commodity Index Total Return, 10/24/22 | | | 511,920 | | | | 2,677,342 | |
Total Exchange Traded Notes
(cost $10,301,886) | | | | | | | 7,573,440 | |
| | |
| | | Number of
Contracts | | | | |
Purchased Options—0.2% | | | | | | | | |
EURO STOXX 50 Puts, 2,850 Strike Price, Expiration 12/18/15 | | | 27 | | | | 1,871 | |
EURO STOXX 50 Puts, 2,900 Strike Price, Expiration 03/18/16 | | | 70 | | | | 31,252 | |
EURO STOXX 50 Puts, 2,900 Strike Price, Expiration 12/18/15 | | | 40 | | | | 3,475 | |
EURO STOXX 50 Puts, 2,975 Strike Price, Expiration 12/18/15 | | | 1 | | | | 124 | |
EURO STOXX 50 Puts, 3,000 Strike Price, Expiration 11/20/15 | | | 67 | | | | 1,768 | |
S&P 500 Puts, 1,825 Strike Price, Expiration 12/19/15 | | | 49 | | | | 22,785 | |
S&P 500 Puts, 1,875 Strike Price, Expiration 11/20/15 | | | 50 | | | | 8,250 | |
S&P 500 Puts, 1,885 Strike Price, Expiration 01/15/16 | | | 49 | | | | 68,600 | |
S&P 500 Puts, 1,910 Strike Price, Expiration 12/19/15 | | | 1 | | | | 960 | |
Total Purchased Options
(cost $729,628) | | | | | | | 139,085 | |
| | |
| | | Principal Amount | | | | |
U.S. Government Obligations—13.4% | | | | | | | | |
United States Treasury Bills, 0.003%, 11/27/155,6 (cost $8,999,448) | | $ | 9,000,000 | | | | 8,999,910 | |
Short-Term Investments—30.8% | | | | | | | | |
Repurchase Agreements—1.3%2 | | | | | | | | |
Nomura Securities International Inc., dated 10/30/15, due 11/02/15, 0.080%, total to be received $888,407 (collateralized by various U.S. Government Agency Obligations, 0.000%—10.500%, 11/04/15—09/20/65,totaling $906,169) | | | 888,401 | | | | 888,401 | |
The accompanying notes are an integral part of these financial statements.
19
AMG FQ Global Risk-Balanced Fund
Schedule of Portfolio Investments (continued)
| | | | | | | | |
| | | Shares | | | Value | |
Other Investment Companies—29.5%3 | | | | | | | | |
Dreyfus Cash Management Fund, Institutional Class Shares, 0.05% | | | 5,891,000 | | | $ | 5,891,000 | |
Dreyfus Institutional Cash Advantage Fund, Institutional Class Shares, 0.09% | | | 5,262,814 | | | | 5,262,814 | |
JPMorgan Liquid Assets Money Market Fund, Capital Shares, 0.12% | | | 4,351,113 | | | | 4,351,113 | |
JPMorgan Prime Money Market Fund, Capital Shares, 0.11% | | | 4,300,840 | | | | 4,300,840 | |
Total Other Investment Companies | | | | | | | 19,805,767 | |
Total Short-Term Investments
(cost $20,694,168) | | | | | | | 20,694,168 | |
Total Investments—102.2%
(cost $73,070,618) | | | | | | | 68,730,134 | |
Other Assets, less Liabilities—(2.2)% | | | | | | | (1,509,367 | ) |
Net Assets—100.0% | | | | | | $ | 67,220,767 | |
The accompanying notes are an integral part of these financial statements.
20
Notes to Schedule of Portfolio Investments
The following footnotes should be read in conjunction with each of the Schedules of Portfolio Investments previously presented in this report.
At October 31, 2015, the approximate cost of investments for federal income tax purposes and the aggregate gross unrealized appreciation and depreciation based on tax cost were as follows:
| | | | | | | | | | | | | | | | |
| Fund | | Cost | | | Appreciation | | | Depreciation | | | Net | |
AMG FQ Tax-Managed U.S. Equity Fund | | $ | 65,083,447 | | | $ | 20,663,730 | | | $ | (1,955,406 | ) | | $ | 18,708,324 | |
AMG FQ U.S. Equity Fund | | | 65,671,175 | | | | 6,890,197 | | | | (3,053,340 | ) | | | 3,836,857 | |
AMG FQ Global Risk-Balanced Fund | | | 74,613,849 | | | | 311,452 | | | | (6,195,167 | ) | | | (5,883,715 | ) |
| * | Non-income producing security. |
| 1 | Some or all of these shares were out on loan to various brokers as of October 31, 2015, amounting to the following: |
| | | | | | | | |
| Fund | | Market Value | | | % of Net Assets | |
AMG FQ Tax-Managed U.S. Equity Fund | | $ | 2,500,165 | | | | 3.1 | % |
AMG FQ U.S. Equity Fund | | | 1,454,130 | | | | 2.2 | % |
AMG FQ Global Risk-Balanced Fund | | | 867,248 | | | | 1.3 | % |
| 2 | Collateral received from brokers for securities lending was invested in these joint repurchase agreements. |
| 3 | Yield shown represents the October 31, 2015, seven-day average yield, which refers to the sum of the previous seven days’ dividends paid, expressed as an annual percentage. |
| 4 | Some or all of these securities were held as collateral for options written as of October 31, 2015, amounting to the following: |
| | | | | | | | |
| Fund | | Market Value | | | % of Net Assets | |
AMG FQ U.S. Equity Fund | | $ | 29,514,421 | | | | 43.8 | % |
AMG FQ Global Risk-Balanced Fund | | | 28,630,420 | | | | 42.6 | % |
| 5 | Represents effective yield at the time of purchase. |
| 6 | Some or all of these securities were held as collateral for futures contracts as of October 31, 2015, amounting to the following: |
| | | | | | | | |
| Fund | | Market Value | | | % of Net Assets | |
AMG FQ Global Risk-Balanced Fund | | $ | 8,999,910 | | | | 13.4 | % |
The following tables summarize the inputs used to value the Funds’ investments by the fair value hierarchy levels as of October 31, 2015: (See Note 1(a) in the Notes to Financial Statements.)
| | | | | | | | | | | | | | | | |
| | | Quoted Prices in Active Markets for
Identical
Investments
Level 1 | | | Significant Other
Observable
Inputs Level 2 | | | Significant
Unobservable
Inputs Level 3 | | | Total | |
AMG FQ Tax-Managed U.S. Equity Fund | | | | | | | | | | | | | | | | |
Investments in Securities | | | | | | | | | | | | | | | | |
Common Stocks† | | $ | 78,896,365 | | | | — | | | | — | | | $ | 78,896,365 | |
Short-Term Investments | | | | | | | | | | | | | | | | |
Repurchase Agreements | | | — | | | $ | 2,537,946 | | | | — | | | | 2,537,946 | |
Other Investment Companies | | | 2,357,460 | | | | — | | | | — | | | | 2,357,460 | |
| | | | | | | | | | | | | | | | |
Total Investments in Securities | | $ | 81,253,825 | | | $ | 2,537,946 | | | | — | | | $ | 83,791,771 | |
| | | | | | | | | | | | | | | | |
The accompanying notes are an integral part of these financial statements.
21
Notes to Schedule of Portfolio Investments (continued)
| | | | | | | | | | | | | | | | |
| | | Quoted
Prices in
Active
Markets for
Identical
Investments
Level 1 | | | Significant Other
Observable
Inputs
Level 2 | | | Significant
Unobservable
Inputs
Level 3 | | | Total | |
AMG FQ U.S. Equity Fund | | | | | | | | | | | | | | | | |
Investments in Securities | | | | | | | | | | | | | | | | |
Common Stocks† | | $ | 67,541,772 | | | | — | | | | — | | | $ | 67,541,772 | |
Purchased Options | | | 214,555 | | | | — | | | | — | | | | 214,555 | |
Short-Term Investments | | | | | | | | | | | | | | | | |
Repurchase Agreements | | | — | | | $ | 1,479,779 | | | | — | | | | 1,479,779 | |
Other Investment Companies | | | 271,926 | | | | — | | | | — | | | | 271,926 | |
| | | | | | | | | | | | | | | | |
Total Investments in Securities | | $ | 68,028,253 | | | $ | 1,479,779 | | | | — | | | $ | 69,508,032 | |
| | | | | | | | | | | | | | | | |
Financial Derivative Instruments-Assets†† | | | | | | | | | | | | | | | | |
Equity Contracts | | $ | 14,016 | | | | — | | | | — | | | $ | 14,016 | |
| | | | | | | | | | | | | | | | |
Financial Derivative Instruments-Liabilities†† | | | | | | | | | | | | | | | | |
Equity Contracts | | | (710,330 | ) | | | — | | | | — | | | | (710,330 | ) |
| | | | | | | | | | | | | | | | |
Total Financial Derivative Instruments | | $ | (696,314 | ) | | | — | | | | — | | | $ | (696,314 | ) |
| | | | | | | | | | | | | | | | |
| | | | |
| |
| Quoted
Prices in
Active
Markets for
Identical
Investments
Level 1 |
| |
| Significant Other
Observable
Inputs
Level 2 |
| |
| Significant
Unobservable
Inputs
Level 3 |
| | | Total | |
AMG FQ Global Risk-Balanced Fund | | | | | | | | | | | | | | | | |
Investments in Securities | | | | | | | | | | | | | | | | |
Exchange Traded Funds††† | | $ | 31,323,531 | | | | — | | | | — | | | $ | 31,323,531 | |
Exchange Traded Notes††† | | | 7,573,440 | | | | — | | | | — | | | | 7,573,440 | |
Purchased Options | | | 139,085 | | | | — | | | | — | | | | 139,085 | |
U.S. Government Obligations | | | — | | | $ | 8,999,910 | | | | — | | | | 8,999,910 | |
Short-Term Investments | | | | | | | | | | | | | | | | |
Repurchase Agreements | | | — | | | | 888,401 | | | | — | | | | 888,401 | |
Other Investment Companies | | | 19,805,767 | | | | — | | | | — | | | | 19,805,767 | |
| | | | | | | | | | | | | | | | |
Total Investments in Securities | | $ | 58,841,823 | | | $ | 9,888,311 | | | | — | | | $ | 68,730,134 | |
| | | | | | | | | | | | | | | | |
Financial Derivative Instruments-Assets†† | | | | | | | | | | | | | | | | |
Equity Contracts | | $ | 1,018,448 | | | | — | | | | — | | | $ | 1,018,448 | |
Interest Rate Contracts | | | 195,701 | | | | — | | | | — | | | | 195,701 | |
| | | | | | | | | | | | | | | | |
| | | 1,214,149 | | | | — | | | | — | | | | 1,214,149 | |
| | | | | | | | | | | | | | | | |
Financial Derivative Instruments-Liabilities†† | | | | | | | | | | | | | | | | |
Equity Contracts | | | (425,995 | ) | | | — | | | | — | | | | (425,995 | ) |
Interest Rate Contracts | | | (184,463 | ) | | | — | | | | — | | | | (184,463 | ) |
| | | | | | | | | | | | | | | | |
| | | (610,458 | ) | | | — | | | | — | | | | (610,458 | ) |
| | | | | | | | | | | | | | | | |
Total Financial Derivative Instruments | | $ | 603,691 | | | | — | | | | — | | | $ | 603,691 | |
| | | | | | | | | | | | | | | | |
| † | All common stocks held in the Funds are Level 1 securities. For a detailed break-out of the common stocks by major industry classification, please refer to the respective Fund’s Schedule of Portfolio Investments. |
The accompanying notes are an integral part of these financial statements.
22
Notes to Schedule of Portfolio Investments (continued)
| †† | Derivative instruments, such as futures and written options are not reflected in the Schedule of Portfolio Investments. Futures are valued at the unrealized appreciation/depreciation of the instrument and written options are shown at value. |
| ††† | All exchange traded funds and exchange traded notes held in the Fund are level 1 securities. For a detailed breakout of these securities, please refer to the respective Fund’s Schedule of Portfolio Investments. |
As of October 31, 2015, the Funds had no transfers between levels from the beginning of the reporting period.
The following schedule shows the value of derivative instruments at October 31, 2015:
| | | | | | | | | | | | | | |
| | | | | Asset Derivatives | | | Liability Derivatives | |
| Fund | | Derivatives not accounted for as hedging instruments | | Statement of Assets and
Liabilities Location | | Fair Value | | | Statement of Assets and
Liabilities Location | | Fair Value | |
AMG FQ U.S. Equity Fund | | | | | | | | | | | | | | |
| | Equity contracts | | Options purchased2 | | $ | 214,555 | | | Options written | | $ | 710,330 | |
| | Equity contracts | | Receivable for variation margin1 | | | — | | | Payable for variation margin1 | | | 930 | |
| | | | | | | | | | | | | | |
| | | | Totals | | $ | 214,555 | | | | | $ | 711,260 | |
| | | | | | | | | | | | | | |
| | | |
| | | | | Asset Derivatives | | | Liability Derivatives | |
| Fund | | Derivatives not accounted for as hedging instruments | | Statement of Assets and
Liabilities Location | | Fair Value | | | Statement of Assets and
Liabilities Location | | Fair Value | |
AMG FQ Global Risk-Balanced Fund | | | | | | | | | | | | | | |
| | Equity contracts | | Options purchased2 | | $ | 139,085 | | | Options Written | | $ | 406,538 | |
| | Equity contracts | | Receivable for variation margin1 | | | 31,043 | | | Payable for variation margin1 | | | 93,090 | |
| | Interest rate contracts | | Receivable for variation margin1 | | | 54,210 | | | Payable for variation margin1 | | | 25,996 | |
| | | | | | | | | | | | | | |
| | | | Totals | | $ | 224,338 | | | | | $ | 525,624 | |
| | | | | | | | | | | | | | |
For the fiscal year ended October 31, 2015, the effect of derivative instruments on the Statement of Operations for the Funds and the amount of realized gain (loss) and unrealized gain (loss) on derivatives recognized in income is as follows:
| | | | | | | | | | | | | | |
| | | | | Realized Gain (Loss) | | | Change in Unrealized Gain (Loss) | |
| Fund | | Derivatives not accounted
for as hedging instruments | | Statement of Operations
Location | | Realized
Gain/(Loss) | | | Statement of Operations
Location | | Change in Unrealized
Gain/(Loss) | |
AMG FQ U.S. Equity Fund | | | | | | | | | | | | | | |
| | Equity contracts | | Net realized loss on options purchased2 | | $ | (2,766,581 | ) | | Net change in unrealized appreciation- (depreciation) options purchased2 | | $ | (466,292 | ) |
| | Equity contracts | | Net realized gain on options written | | | 1,726,513 | | | Net change in unrealized appreciation- (depreciation) options written | | | 886,687 | |
| | Equity contracts | | Net realized loss on futures contracts | | | (2,260 | ) | | Net change in unrealized appreciation- (depreciation) of futures contracts | | | 11,602 | |
| | | | | | | | | | | | | | |
| | | | Totals | | $ | (1,042,328 | ) | | | | $ | 431,997 | |
| | | | | | | | | | | | | | |
The accompanying notes are an integral part of these financial statements.
23
Notes to Schedule of Portfolio Investments (continued)
| | | | | | | | | | | | | | |
| | | | | Realized Gain (Loss) | | | Change in Unrealized Gain (Loss) | |
| Fund | | Derivatives not accounted for as hedging instruments | | Statement of Operations
Location | | Realized Gain/(Loss) | | | Statement of Operations
Location | | Change in Unrealized
Gain/(Loss) | |
AMG FQ Global Risk-Balanced Fund | | | | |
| | Equity contracts | | Net realized loss on options purchased2 | | $ | (2,601,202 | ) | | Net change in unrealized appreciation- (depreciation) options purchased2 | | $ | 101,278 | |
| | | | | |
| | Equity contracts | | Net realized gain on options written | | | 1,186,270 | | | Net change in unrealized appreciation- (depreciation) options written | | | 477,058 | |
| | Equity contracts | | Net realized gain on futures contracts | | | (1,087,960 | ) | | Net change in unrealized appreciation- (depreciation) of futures contracts | | | 1,290,876 | |
| | | | | |
| | Interest rate contracts | | Net realized gain on futures contracts | | | 2,399,361 | | | Net change in unrealized appreciation- (depreciation) of futures contracts | | | (441,579 | ) |
| | | | | | | | | | | | | | |
| | | | Totals | | ($ | 103,531 | ) | | | | $ | 1,427,633 | |
| | | | | | | | | | | | | | |
| 1 | Only current day’s variation margin is reported within the Statement of Assets and Liabilities. The variation margin is included in the open futures cumulative appreciation/ (depreciation) for AMG FQ U.S. Equity Fund and AMG FQ Global Risk-Balanced Fund of $14,016 and $1,010,229, respectively, as reported in the Notes to Schedule of Portfolio Investments. |
| 2 | Options purchased are included in Investments at value on the Statement of Assets and Liabilities. Net realized gain (loss) on options purchased and net change in unrealized appreciation (depreciation) on options purchased are included in the net realized gain (loss) on investments and net change in unrealized appreciation (depreciation) of investments on the Statement of Operations. |
At October 31, 2015, the following Funds had open written options:
(See Note 9 in the Notes to Financial Statements.)
AMG FQ U.S. Equity Fund—Written Option Contracts
| | | | | | | | | | | | | | | | | | | | |
| Description | | Strike
Price | | | Expiration
Date | | | Number of
Contracts | | | Premium | | | Unrealized
Gain/(Loss) | |
S&P 500 Index (Call) | | | 2,100 | | | | 12/19/15 | | | | 119 | | | $ | 222,512 | | | $ | (88,078 | ) |
S&P 500 Index (Call) | | | 2,130 | | | | 01/15/16 | | | | 101 | | | | 111,959 | | | | (139,531 | ) |
S&P 500 Index (Call) | | | 2,140 | | | | 11/20/15 | | | | 108 | | | | 129,438 | | | | 102,438 | |
S&P 500 Index (Put) | | | 1,725 | | | | 12/19/15 | | | | 119 | | | | 380,621 | | | | 356,821 | |
S&P 500 Index (Put) | | | 1,800 | | | | 11/20/15 | | | | 108 | | | | 221,238 | | | | 213,678 | |
S&P 500 Index (Put) | | | 1,800 | | | | 01/15/16 | | | | 101 | | | | 171,548 | | | | 81,658 | |
| | | | | | | | | | | | | | | | | | | | |
| | | | | | | | | | | Totals | | | $ | 1,237,316 | | | $ | 526,986 | |
| | | | | | | | | | | | | | | | | | | | |
| | | |
| AMG FQ Global Risk-Balanced Fund—Written Option Contracts | | | | | | | | | | | | | |
| | | | | |
| Description | | Strike
Price | | | Expiration
Date | | | Number of
Contracts | | | Premium | | | Unrealized Gain/(Loss) | |
EURO STOXX 50 (Call) | | | 3,500 | | | | 11/20/15 | | | | 67 | | | $ | 30,378 | | | $ | 16,527 | |
EURO STOXX 50 (Call) | | | 3,500 | | | | 12/18/15 | | | | 1 | | | | 247 | | | | (326 | ) |
EURO STOXX 50 (Call) | | | 3,650 | | | | 03/18/16 | | | | 70 | | | | 25,315 | | | | (23,333 | ) |
EURO STOXX 50 (Call) | | | 3,850 | | | | 12/18/15 | | | | 27 | | | | 8,872 | | | | 8,219 | |
The accompanying notes are an integral part of these financial statements.
24
Notes to Schedule of Portfolio Investments (continued)
| | | | | | | | | | | | | | | | |
| Description | | Strike Price | | Expiration Date | | Number of
Contracts | | | Premium | | | Unrealized
Gain/(Loss) | |
EURO STOXX 50 (Call) | | 3,950 | | 12/18/15 | | | 25 | | | $ | 7,538 | | | $ | 7,291 | |
EURO STOXX 50 (Call) | | 3,975 | | 12/18/15 | | | 15 | | | | 4,373 | | | | 4,258 | |
EURO STOXX 50 (Put) | | 2,650 | | 12/18/15 | | | 27 | | | | 10,934 | | | | 10,073 | |
EURO STOXX 50 (Put) | | 2,700 | | 12/18/15 | | | 40 | | | | 15,118 | | | | 13,578 | |
EURO STOXX 50 (Put) | | 2,700 | | 03/18/16 | | | 70 | | | | 33,385 | | | | 16,219 | |
EURO STOXX 50 (Put) | | 2,775 | | 12/18/15 | | | 1 | | | | 199 | | | | 148 | |
EURO STOXX 50 (Put) | | 2,800 | | 11/20/15 | | | 33 | | | | 21,872 | | | | 21,545 | |
EURO STOXX 50 (Put) | | 2,850 | | 11/20/15 | | | 34 | | | | 26,289 | | | | 25,878 | |
S&P 500 Index (Call) | | 2,100 | | 12/19/15 | | | 49 | | | | 92,996 | | | | (34,894 | ) |
S&P 500 Index (Call) | | 2,110 | | 12/19/15 | | | 1 | | | | 948 | | | | (1,312 | ) |
S&P 500 Index (Call) | | 2,130 | | 01/15/16 | | | 49 | | | | 54,287 | | | | (67,723 | ) |
S&P 500 Index (Call) | | 2,140 | | 11/20/15 | | | 50 | | | | 54,894 | | | | 42,394 | |
S&P 500 Index (Put) | | 1,725 | | 12/19/15 | | | 49 | | | | 151,797 | | | | 141,997 | |
S&P 500 Index (Put) | | 1,800 | | 11/20/15 | | | 50 | | | | 108,394 | | | | 104,894 | |
S&P 500 Index (Put) | | 1,800 | | 01/15/16 | | | 49 | | | | 83,197 | | | | 39,587 | |
S&P 500 Index (Put) | | 1,835 | | 12/19/15 | | | 1 | | | | 1,228 | | | | 703 | |
| | | | | | | | | | | | | | | | |
| | | | | | | Totals | | | $ | 732,261 | | | $ | 325,723 | |
| | | | | | | | | | | | | | | | |
Transactions in written put and call options for the fiscal year ended October 31, 2015, were as follows: (See Note 9 in the Notes to Financial Statements.)
AMG FQ U.S. Equity Fund
| | | | | | | | |
| | | Number of | | | Amount of | |
| | | Contracts | | | Premiums | |
Options outstanding at October 31, 2014 | | | 684 | | | $ | 694,579 | |
Options written | | | 2,746 | | | | 3,734,986 | |
Options exercised/expired/closed | | | (2,774 | ) | | | (3,192,249 | ) |
| | | | | | | | |
Options outstanding at October 31, 2015 | | | 656 | | | $ | 1,237,316 | |
| | | | | | | | |
The accompanying notes are an integral part of these financial statements.
25
Notes to Schedule of Portfolio Investments (continued)
AMG FQ Global Risk-Balanced Fund
| | | | | | | | |
| | | Number of | | | Amount of | |
| | | Contracts | | | Premiums | |
Options outstanding at October 31, 2014 | | | 1,420 | | | $ | 939,802 | |
Options written | | | 4,965 | | | | 3,443,085 | |
Options exercised/expired/closed | | | (5,677 | ) | | | (3,650,626 | ) |
| | | | | | | | |
Options outstanding at October 31, 2015 | | | 708 | | | $ | 732,261 | |
| | | | | | | | |
All futures contracts are exchange traded unless otherwise noted. At October 31, 2015, the following Funds had open futures contracts: (See Note 8 in the Notes to Financial Statements.)
AMG FQ U.S. Equity Fund—Futures Contracts
| | | | | | | | | | | | | | | | |
| | | Number of | | | | | | Expiration | | | Unrealized | |
| Type | | Contracts | | | Position | | | Date | | | gain | |
S&P 500 E-Mini Index | | | 2 | | | | Long | | | | 12/18/15 | | | $ | 14,016 | |
| | | | | | | | | | | | | | | | |
The accompanying notes are an integral part of these financial statements.
26
Notes to Schedule of Portfolio Investments (continued)
AMG FQ Global Risk-Balanced Fund — Futures Contracts
| | | | | | | | | | | | | | |
| Type | | Currency | | Number of Contracts | | Position | | Expiration
Date | | | Unrealized
Gain/(Loss) | |
Amsterdam Index | | EUR | | 12 | | Long | | | 11/20/15 | | | $ | 73,346 | |
Australia 10-Year Bond | | AUD | | 119 | | Long | | | 12/16/15 | | | | 110,626 | |
Australian SPI 200 Index | | AUD | | 26 | | Long | | | 12/18/15 | | | | 104,423 | |
CAC 40 Index | | EUR | | 21 | | Long | | | 11/23/15 | | | | 51,350 | |
Canadian 10-Year Bond | | CAD | | 101 | | Long | | | 12/31/15 | | | | (184,463 | ) |
DAX Index | | EUR | | 4 | | Long | | | 12/18/15 | | | | 79,279 | |
E-Mini MSCI Index | | USD | | 91 | | Long | | | 12/18/15 | | | | 193,225 | |
FTSE 100 Index | | GBP | | 16 | | Long | | | 12/21/15 | | | | 72,740 | |
FTSE/MIB Index | | EUR | | 9 | | Long | | | 12/18/15 | | | | 52,314 | |
Hang Seng Index | | HKD | | 8 | | Long | | | 11/30/15 | | | | (19,457 | ) |
IBEX 35 Index | | EUR | | 10 | | Long | | | 11/23/15 | | | | 29,589 | |
Russell 2000 E-Mini Index | | USD | | 50 | | Long | | | 12/18/15 | | | | 83,260 | |
S&P 500 E-Mini Index | | USD | | 20 | | Long | | | 12/18/15 | | | | 140,156 | |
S&P/TSX 60 Index | | CAD | | 16 | | Long | | | 12/18/15 | | | | 11,535 | |
TOPIX Index | | JPY | | 13 | | Long | | | 12/11/15 | | | | 127,231 | |
U.K. 10-Year Gilt | | GBP | | 120 | | Long | | | 12/31/15 | | | | 26,076 | |
U.S. Treasury Long Bond | | USD | | 90 | | Long | | | 12/31/15 | | | | 58,999 | |
| | | | | | | | | | | | | | |
| | | | | | | | | Total | | | $ | 1,010,229 | |
| | | | | | | | | | | | | | |
| | | | | | |
| INVESTMENT DEFINITIONS AND ABBREVIATIONS: | | |
| | | |
REIT: | | Real Estate Investment Trust | | | | |
| | | |
TIPS: | | Treasury Inflation-Protected Securities | | | | |
| | |
CURRENCY ABBREVIATIONS: | | | | |
| | | |
AUD: | | Australian Dollar | | HKD: | | Hong Kong Dollar |
| | | |
CAD: | | Canadian Dollar | | JPY: | | Japanese Yen |
| | | |
EUR: | | Euro | | USD: | | U.S. Dollar |
| | | |
GBP: | | British Pound | | | | |
The accompanying notes are an integral part of these financial statements.
27
Statement of Assets and Liabilities
October 31, 2015
| | | | | | | | | | | | |
| | | AMG FQ
Tax-Managed
U.S. Equity Fund | | | AMG FQ U.S.
Equity Fund | | | AMG FQ Global
Risk-Balanced
Fund | |
Assets: | | | | | | | | | | | | |
Investments at value* (including securities on loan valued at $2,500,165, $1,454,130 and $867,248, respectively) | | $ | 83,791,771 | | | $ | 69,508,032 | | | $ | 68,730,134 | |
Cash collateral for financial derivative instruments | | | — | | | | 77,000 | | | | — | |
Receivable for Fund shares sold | | | 170,058 | | | | 444 | | | | 11,547 | |
Dividends, interest and other receivables | | | 46,660 | | | | 67,456 | | | | 2,020 | |
Receivable for variation margin on futures contracts | | | — | | | | — | | | | 85,253 | |
Receivable from affiliate | | | 14,101 | | | | 8,230 | | | | 11,434 | |
Prepaid expenses | | | 3,029 | | | | 8,510 | | | | 8,407 | |
Total assets | | | 84,025,619 | | | | 69,669,672 | | | | 68,848,795 | |
Liabilities: | | | | | | | | | | | | |
Payable upon return of securities loaned | | | 2,537,946 | | | | 1,479,779 | | | | 888,401 | |
Payable for Fund shares repurchased | | | 64,859 | | | | 34,027 | | | | 15,479 | |
Written options (premiums received $0, $1,237,316 and $732,261, respectively) | | | — | | | | 710,330 | | | | 406,538 | |
Payable for variation margin on futures contracts | | | — | | | | 930 | | | | 119,086 | |
Payable for investments purchased | | | — | | | | — | | | | 105,223 | |
Accrued expenses: | | | | | | | | | | | | |
Investment advisory and management fees | | | 57,250 | | | | 19,739 | | | | 34,610 | |
Administrative fees | | | — | | | | 14,099 | | | | 14,421 | |
Shareholder servicing fees—Investor Class | | | — | | | | — | | | | 447 | |
Shareholder servicing fees—Service Class | | | — | | | | — | | | | 127 | |
Distribution fees—Investor Class | | | 5,121 | | | | 6,285 | | | | 447 | |
Trustees fees and expenses | | | 309 | | | | 226 | | | | 306 | |
Other | | | 42,331 | | | | 48,267 | | | | 42,943 | |
Total liabilities | | | 2,707,816 | | | | 2,313,682 | | | | 1,628,028 | |
Net Assets | | $ | 81,317,803 | | | $ | 67,355,990 | | | $ | 67,220,767 | |
* Investments at cost | | $ | 65,084,222 | | | $ | 65,651,903 | | | $ | 73,070,618 | |
The accompanying notes are an integral part of these financial statements.
28
Statement of Assets and Liabilities (continued)
| | | | | | | | | | | | |
| | | AMG FQ
Tax-Managed
U.S. Equity Fund | | | AMG FQ U.S.
Equity Fund | | | AMG FQ Global
Risk-Balanced
Fund | |
Net Assets Represent: | | | | | | | | | | | | |
Paid-in capital | | $ | 72,469,531 | | | $ | 56,427,176 | | | $ | 83,769,004 | |
Undistributed net investment income | | | 377,115 | | | | 28,564 | | | | 1,291,299 | |
Accumulated net realized gain (loss) from investments, options, futures and foreign currency transactions | | | (10,236,392 | ) | | | 6,503,119 | | | | (14,832,983 | ) |
Net unrealized appreciation (depreciation) of investments, options, futures and foreign currency translations | | | 18,707,549 | | | | 4,397,131 | | | | (3,006,553 | ) |
Net Assets | | $ | 81,317,803 | | | $ | 67,355,990 | | | $ | 67,220,767 | |
Investor Class: | | | | | | | | | | | | |
Net Assets | | $ | 24,824,894 | | | $ | 30,043,346 | | | $ | 2,083,198 | |
Shares outstanding | | | 1,016,717 | | | | 1,728,368 | | | | 161,148 | |
Net asset value, offering and redemption price per share | | $ | 24.42 | | | $ | 17.38 | | | $ | 12.93 | |
Service Class: | | | | | | | | | | | | |
Net Assets | | | n/a | | | | n/a | | | $ | 1,652,143 | |
Shares outstanding | | | n/a | | | | n/a | | | | 126,904 | |
Net asset value, offering and redemption price per share | | | n/a | | | | n/a | | | $ | 13.02 | |
Institutional Class: | | | | | | | | | | | | |
Net Assets | | $ | 56,492,909 | | | $ | 37,312,644 | | | $ | 63,485,426 | |
Shares outstanding | | | 2,313,454 | | | | 2,148,085 | | | | 4,863,894 | |
Net asset value, offering and redemption price per share | | $ | 24.42 | | | $ | 17.37 | | | $ | 13.05 | |
The accompanying notes are an integral part of these financial statements.
29
Statement of Operations
For the fiscal year ended October 31, 2015
| | | | | | | | | | | | |
| | | AMG FQ
Tax-Managed
U.S. Equity Fund | | | AMG FQ U.S.
Equity Fund | | | AMG FQ Global
Risk-Balanced
Fund | |
Investment Income: | | | | | | | | | | | | |
Dividend income | | $ | 1,170,508 | 1 | | $ | 1,388,096 | 2 | | $ | 1,262,564 | |
Interest income | | | — | | | | — | | | | 5,436 | |
Securities lending income | | | 29,197 | | | | 13,934 | | | | 42,481 | |
Foreign withholding tax | | | (190 | ) | | | (112 | ) | | | — | |
Total investment income | | | 1,199,515 | | | | 1,401,918 | | | | 1,310,481 | |
Expenses: | | | | | | | | | | | | |
Investment advisory and management fees | | | 633,231 | | | | 245,889 | | | | 445,240 | |
Administrative fees | | | — | | | | 175,636 | | | | 185,517 | |
Distribution fees—Investor Class | | | 46,675 | | | | 72,394 | | | | 5,549 | |
Shareholder servicing fees—Investor Class | | | — | | | | — | | | | 5,549 | |
Shareholder servicing fees—Service Class | | | — | | | | — | | | | 2,003 | |
Professional fees | | | 32,946 | | | | 34,859 | | | | 40,450 | |
Registration fees | | | 31,872 | | | | 30,934 | | | | 38,659 | |
Transfer agent | | | 21,033 | | | | 30,124 | | | | 14,263 | |
Reports to shareholders | | | 25,400 | | | | 21,788 | | | | 15,297 | |
Custodian | | | 9,912 | | | | 11,646 | | | | 8,106 | |
Trustees fees and expenses | | | 4,195 | | | | 3,964 | | | | 3,989 | |
Miscellaneous | | | 2,261 | | | | 2,245 | | | | 3,064 | |
Expense repayments | | | 3,979 | | | | 14,935 | | | | — | |
Total expenses before offsets | | | 811,504 | | | | 644,414 | | | | 767,686 | |
Expense waiver | | | — | | | | — | | | | (4,147 | ) |
Expense reimbursements | | | (53,538 | ) | | | (17,004 | ) | | | (94,113 | ) |
Net expenses | | | 757,966 | | | | 627,410 | | | | 669,426 | |
Net investment income (loss) | | | 441,549 | | | | 774,508 | | | | 641,055 | |
Net Realized and Unrealized Gain (Loss): | | | | | | | | | | | | |
Net realized gain (loss) on investments | | | 4,093,681 | | | | 5,245,550 | | | | (5,750,389 | ) |
Net realized gain (loss) on futures contracts | | | — | | | | (2,260 | ) | | | 1,311,401 | |
Net realized gain on foreign currency transactions | | | — | | | | — | | | | 216,454 | |
Net realized gain on written options | | | — | | | | 1,726,513 | | | | 1,186,270 | |
Net change in unrealized appreciation (depreciation) of investments | | | (1,962,556 | ) | | | (7,238,224 | ) | | | (1,694,305 | ) |
Net change in unrealized appreciation (depreciation) of futures contracts | | | — | | | | 11,602 | | | | 849,297 | |
Net change in unrealized appreciation (depreciation) on foreign currency translations | | | — | | | | — | | | | (2,554 | ) |
Net change in unrealized appreciation (depreciation) on written options | | | — | | | | 886,687 | | | | 477,058 | |
Net realized and unrealized gain (loss) | | | 2,131,125 | | | | 629,868 | | | | (3,406,768 | ) |
Net increase (decrease) in net assets resulting from operations | | $ | 2,572,674 | | | $ | 1,404,376 | | | $ | (2,765,713 | ) |
| 1 | Includes non-recurring dividends of $234,726. |
| 2 | Includes non-recurring dividends of $182,560. |
The accompanying notes are an integral part of these financial statements.
30
Statements of Changes in Net Assets
For the fiscal years ended October 31,
| | | | | | | | | | | | | | | | |
| | | AMG FQ Tax-Managed
U.S. Equity Fund | | | AMG FQ U.S.
Equity Fund | |
| | | 2015 | | | 2014 | | | 2015 | | | 2014 | |
Increase (Decrease) in Net Assets Resulting From Operations: | | | | | | | | | | | | | | | | |
Net investment income | | $ | 441,549 | | | $ | 204,056 | | | $ | 774,508 | | | $ | 670,053 | |
Net realized gain on investments, options and futures | | | 4,093,681 | | | | 4,366,025 | | | | 6,969,803 | | | | 7,816,759 | |
Net change in unrealized appreciation (depreciation) of investments, options and futures | | | (1,962,556 | ) | | | 4,758,305 | | | | (6,339,935 | ) | | | (62,611 | ) |
Net increase in net assets resulting from operations | | | 2,572,674 | | | | 9,328,386 | | | | 1,404,376 | | | | 8,424,201 | |
Distributions to Shareholders: | | | | | | | | | | | | | | | | |
From net investment income: | | | | | | | | | | | | | | | | |
Investor Class | | | (33,326 | ) | | | (8,882 | ) | | | (235,901 | ) | | | (184,111 | ) |
Institutional Class | | | (210,340 | ) | | | (145,414 | ) | | | (526,958 | ) | | | (457,090 | ) |
Total distributions to shareholders | | | (243,666 | ) | | | (154,296 | ) | | | (762,859 | ) | | | (641,201 | ) |
Capital Share Transactions:1 | | | | | | | | | | | | | | | | |
Net increase (decrease) from capital share transactions | | | 15,762,306 | | | | 4,520,547 | | | | (852,147 | ) | | | (1,279,198 | ) |
Total increase (decrease) in net assets | | | 18,091,314 | | | | 13,694,637 | | | | (210,630 | ) | | | 6,503,802 | |
Net Assets: | | | | | | | | | | | | | | | | |
Beginning of year | | | 63,226,489 | | | | 49,531,852 | | | | 67,566,620 | | | | 61,062,818 | |
End of year | | $ | 81,317,803 | | | $ | 63,226,489 | | | $ | 67,355,990 | | | $ | 67,566,620 | |
End of year undistributed net investment income | | $ | 377,115 | | | $ | 157,508 | | | $ | 28,564 | | | $ | 7,147 | |
| | | | | | | | | | | | | | | | |
| 1 | See Note 1(g) of the Notes to Financial Statements. |
The accompanying notes are an integral part of these financial statements.
31
Statements of Changes in Net Assets (continued)
For the fiscal years ended October 31,
| | | | | | | | |
| | | AMG FQ Global | |
| | | Risk-Balanced Fund | |
| | | 2015 | | | 2014 | |
Increase (Decrease) in Net Assets Resulting From Operations: | | | | | | | | |
Net investment income (loss) | | $ | 641,055 | | | $ | 1,465,320 | |
Net realized gain on investments, futures, options and foreign currency transactions | | | (3,036,264 | ) | | | 7,350,130 | |
Net change in unrealized appreciation (depreciation) of investments, futures, options and foreign currency translations | | | (370,504 | ) | | | (4,233,300 | ) |
Net increase (decrease) in net assets resulting from operations | | | (2,765,713 | ) | | | 4,582,150 | |
Distributions to Shareholders: | | | | | | | | |
From net investment income: | | | | | | | | |
Investor Class | | | (48,688 | ) | | | — | |
Service Class | | | (73,547 | ) | | | — | |
Institutional Class | | | (2,216,938 | ) | | | — | |
Total distributions to shareholders | | | (2,339,173 | ) | | | — | |
Capital Share Transactions:1 | | | | | | | | |
Net decrease from capital share transactions | | | (5,876,865 | ) | | | (26,162,709 | ) |
Total decrease in net assets | | | (10,981,751 | ) | | | (21,580,559 | ) |
Net Assets: | | | | | | | | |
Beginning of year | | | 78,202,518 | | | | 99,783,077 | |
End of year | | $ | 67,220,767 | | | $ | 78,202,518 | |
End of year undistributed net investment income | | $ | 1,291,299 | | | $ | 2,157,962 | |
| | | | | | | | |
| 1 | See Note 1(g) of the Notes to Financial Statements. |
The accompanying notes are an integral part of these financial statements.
32
AMG FQ Tax-Managed U.S. Equity Fund
Financial Highlights
For a share outstanding throughout each fiscal year
| | | | | | | | | | | | | | | | | | | | |
| | | For the fiscal years ended October 31, | |
Investor Class | | | 2015 | | | | 2014 | | | | 2013 | | | | 2012 | | | | 2011 | |
Net Asset Value, Beginning of Year | | $ | 23.58 | | | $ | 20.02 | | | $ | 15.37 | | | $ | 13.63 | | | $ | 12.47 | |
Income (Loss) from Investment Operations: | | | | | | | | | | | | | | | | | | | | |
Net investment income (loss)1,2 | | | 0.08 | 12 | | | 0.03 | | | | 0.06 | 4 | | | 0.05 | 5 | | | (0.01 | ) |
Net realized and unrealized gain on investments | | | 0.81 | | | | 3.55 | | | | 4.71 | | | | 1.69 | | | | 1.18 | |
Total income from investment operations | | | 0.89 | | | | 3.58 | | | | 4.77 | | | | 1.74 | | | | 1.17 | |
Less Distributions to Shareholders from: | | | | | | | | | | | | | | | | | | | | |
Net investment income | | | (0.05 | ) | | | (0.02 | ) | | | (0.12 | ) | | | — | | | | (0.01 | ) |
Net Asset Value, End of Year | | $ | 24.42 | | | $ | 23.58 | | | $ | 20.02 | | | $ | 15.37 | | | $ | 13.63 | |
Total Return2 | | | 3.79 | % | | | 17.91 | % | | | 31.31 | % | | | 12.77 | % | | | 9.40 | % |
Ratio of net expenses to average net assets (with offsets/reductions) | | | 1.20 | % | | | 1.24 | % | | | 1.26 | %6 | | | 1.24 | % | | | 1.24 | % |
Ratio of expenses to average net assets (with offsets) | | | 1.20 | % | | | 1.24 | % | | | 1.26 | %6 | | | 1.24 | % | | | 1.24 | % |
Ratio of total expenses to average net assets (without offsets/reductions)3 | | | 1.27 | % | | | 1.29 | % | | | 1.35 | %6 | | | 1.39 | % | | | 1.36 | % |
Ratio of net investment income (loss) to average net assets2 | | | 0.34 | % | | | 0.13 | % | | | 0.35 | %6 | | | 0.35 | % | | | (0.07 | )% |
Portfolio turnover | | | 62 | % | | | 45 | % | | | 49 | % | | | 36 | % | | | 40 | % |
Net assets at end of year (000’s omitted) | | $ | 24,825 | | | $ | 12,541 | | | $ | 6,324 | | | $ | 3,026 | | | $ | 3,049 | |
| | | | | | | | | | | | | | | | | | | | |
| |
| | | For the fiscal years ended October 31, | |
Institutional Class | | | 2015 | | | | 2014 | | | | 2013 | | | | 2012 | | | | 2011 | |
Net Asset Value, Beginning of Year | | $ | 23.56 | | | $ | 19.99 | | | $ | 15.33 | | | $ | 13.58 | | | $ | 12.43 | |
Income (Loss) from Investment Operations: | | | | | | | | | | | | | | | | | | | | |
Net investment income1,2 | | | 0.17 | 12 | | | 0.09 | | | | 0.11 | 4 | | | 0.09 | 5 | | | 0.02 | |
Net realized and unrealized gain on investments | | | 0.78 | | | | 3.54 | | | | 4.70 | | | | 1.67 | | | | 1.19 | |
Total income from investment operations | | | 0.95 | | | | 3.63 | | | | 4.81 | | | | 1.76 | | | | 1.21 | |
Less Distributions to Shareholders from: | | | | | | | | | | | | | | | | | | | | |
Net investment income | | | (0.09 | ) | | | (0.06 | ) | | | (0.15 | ) | | | (0.01 | ) | | | (0.06 | ) |
Net Asset Value, End of Year | | $ | 24.42 | | | $ | 23.56 | | | $ | 19.99 | | | $ | 15.33 | | | $ | 13.58 | |
Total Return2 | | | 4.03 | % | | | 18.22 | %7 | | | 31.65 | %7 | | | 13.00 | % | | | 9.70 | % |
Ratio of net expenses to average net assets (with offsets/reductions) | | | 0.96 | % | | | 0.99 | % | | | 1.01 | %6 | | | 0.99 | % | | | 0.99 | % |
Ratio of expenses to average net assets (with offsets) | | | 0.96 | % | | | 0.99 | % | | | 1.01 | %6 | | | 0.99 | % | | | 0.99 | % |
Ratio of total expenses to average net assets (without offsets/reductions)3 | | | 1.03 | % | | | 1.04 | % | | | 1.10 | %6 | | | 1.14 | % | | | 1.11 | % |
Ratio of net investment income to average net assets2 | | | 0.68 | % | | | 0.40 | % | | | 0.62 | %6 | | | 0.60 | % | | | 0.18 | % |
Portfolio turnover | | | 62 | % | | | 45 | % | | | 49 | % | | | 36 | % | | | 40 | % |
Net assets at end of year (000’s omitted) | | $ | 56,493 | | | $ | 50,686 | | | $ | 43,207 | | | $ | 36,884 | | | $ | 35,741 | |
| | | | | | | | | | | | | | | | | | | | |
33
AMG FQ U.S. Equity Fund
Financial Highlights
For a share outstanding throughout each fiscal year
| | | | | | | | | | | | | | | | | | | | |
| | | For the fiscal years ended October 31, | |
| Investor Class | | 2015 | | | 2014 | | | 2013 | | | 2012 | | | 2011 | |
Net Asset Value, Beginning of Year | | $ | 17.20 | | | $ | 15.23 | | | $ | 12.29 | | | $ | 11.30 | | | $ | 10.29 | |
Income (Loss) from Investment Operations: | | | | | | | | | | | | | | | | | | | | |
Net investment income1,2 | | | 0.16 | 12 | | | 0.14 | | | | 0.19 | 4 | | | 0.22 | | | | 0.09 | |
Net realized and unrealized gain on investments | | | 0.17 | | | | 1.95 | | | | 2.94 | | | | 1.07 | | | | 1.01 | |
Total income from investment operations | | | 0.33 | | | | 2.09 | | | | 3.13 | | | | 1.29 | | | | 1.10 | |
Less Distributions to Shareholders from: | | | | | | | | | | | | | | | | | | | | |
Net investment income | | | (0.15 | ) | | | (0.12 | ) | | | (0.19 | ) | | | (0.30 | ) | | | (0.09 | ) |
Net Asset Value, End of Year | | $ | 17.38 | | | $ | 17.20 | | | $ | 15.23 | | | $ | 12.29 | | | $ | 11.30 | |
Total Return2 | | | 1.90 | % | | | 13.76 | % | | | 25.66 | % | | | 11.50 | % | | | 10.72 | % |
Ratio of net expenses to average net assets (with offsets/reductions) | | | 1.04 | % | | | 1.04 | % | | | 1.06 | %8 | | | 1.04 | % | | | 1.04 | %9 |
Ratio of expenses to average net assets (with offsets) | | | 1.04 | % | | | 1.04 | % | | | 1.06 | %8 | | | 1.04 | % | | | 1.04 | %9 |
Ratio of total expenses to average net assets (without offsets/reductions)3 | | | 1.05 | % | | | 1.05 | % | | | 1.10 | %8 | | | 1.15 | % | | | 1.13 | %9 |
Ratio of net investment income to average net assets2 | | | 0.93 | % | | | 0.88 | % | | | 1.37 | %8 | | | 1.84 | % | | | 0.83 | %9 |
Portfolio turnover | | | 139 | % | | | 87 | % | | | 91 | % | | | 132 | % | | | 138 | % |
Net assets at end of year (000’s omitted) | | $ | 30,043 | | | $ | 25,931 | | | $ | 23,103 | | | $ | 12,764 | | | $ | 12,966 | |
| | | | | | | | | | | | | | | | | | | | |
| |
| | | For the fiscal years ended October 31, | |
| Institutional Class | | 2015 | | | 2014 | | | 2013 | | | 2012 | | | 2011 | |
Net Asset Value, Beginning of Year | | $ | 17.22 | | | $ | 15.27 | | | $ | 12.34 | | | $ | 11.38 | | | $ | 10.35 | |
Income (Loss) from Investment Operations: | | | | | | | | | | | | | | | | | | | | |
Net investment income1,2 | | | 0.21 | 12 | | | 0.18 | | | | 0.24 | 4 | | | 0.25 | | | | 0.12 | |
Net realized and unrealized gain on investments | | | 0.16 | | | | 1.96 | | | | 2.93 | | | | 1.07 | | | | 1.03 | |
Total income from investment operations | | | 0.37 | | | | 2.14 | | | | 3.17 | | | | 1.32 | | | | 1.15 | |
Less Distributions to Shareholders from: | | | | | | | | | | | | | | | | | | | | |
Net investment income | | | (0.22 | ) | | | (0.19 | ) | | | (0.24 | ) | | | (0.36 | ) | | | (0.12 | ) |
Net Asset Value, End of Year | | $ | 17.37 | | | $ | 17.22 | | | $ | 15.27 | | | $ | 12.34 | | | $ | 11.38 | |
Total Return2 | | | 2.16 | % | | | 14.05 | % | | | 26.00 | % | | | 11.78 | % | | | 11.12 | % |
Ratio of net expenses to average net assets (with offsets/reductions) | | | 0.79 | % | | | 0.79 | % | | | 0.81 | %8 | | | 0.79 | % | | | 0.79 | %9 |
Ratio of expenses to average net assets (with offsets) | | | 0.79 | % | | | 0.79 | % | | | 0.81 | %8 | | | 0.79 | % | | | 0.79 | %9 |
Ratio of total expenses to average net assets (without offsets/reductions)3 | | | 0.79 | % | | | 0.80 | % | | | 0.85 | %8 | | | 0.90 | % | | | 0.88 | %9 |
Ratio of net investment income to average net assets2 | | | 1.22 | % | | | 1.13 | % | | | 1.73 | %8 | | | 2.09 | % | | | 1.08 | %9 |
Portfolio turnover | | | 139 | % | | | 87 | % | | | 91 | % | | | 132 | % | | | 138 | % |
Net assets at end of year (000’s omitted) | | $ | 37,313 | | | $ | 41,636 | | | $ | 37,960 | | | $ | 34,231 | | | $ | 33,250 | |
| | | | | | | | | | | | | | | | | | | | |
34
AMG FQ Global Risk-Balanced Fund
Financial Highlights
For a share outstanding throughout each fiscal year
| | | | | | | | | | | | | | | | | | | | |
| | | For the fiscal years ended October 31, | |
| Investor Class | | 2015 | | | 2014 | | | 2013 | | | 2012 | | | 2011 | |
Net Asset Value, Beginning of Year | | $ | 13.84 | | | $ | 13.14 | | | $ | 13.36 | | | $ | 12.80 | | | $ | 12.73 | |
Income (Loss) from Investment Operations: | | | | | | | | | | | | | | | | | | | | |
Net investment income (loss)1,2 | | | 0.05 | | | | 0.17 | | | | 0.03 | | | | (0.04 | ) | | | 0.01 | |
Net realized and unrealized gain (loss) on investments | | | (0.64 | ) | | | 0.53 | | | | 0.13 | | | | 1.11 | | | | 0.62 | |
Total income (loss) from investment operations | | | (0.59 | ) | | | 0.70 | | | | 0.16 | | | | 1.07 | | | | 0.63 | |
Less Distributions to Shareholders from: | | | | | | | | | | | | | | | | | | | | |
Net investment income | | | (0.32 | ) | | | — | | | | (0.38 | )10 | | | (0.51 | )10 | | | (0.56 | )10 |
Net Asset Value, End of Year | | $ | 12.93 | | | $ | 13.84 | | | $ | 13.14 | | | $ | 13.36 | | | $ | 12.80 | |
Total Return2 | | | (4.31 | )% | | | 5.33 | % | | | 1.16 | % | | | 8.67 | %7 | | | 5.23 | %7 |
Ratio of net expenses to average net assets (with offsets/reductions) | | | 1.38 | % | | | 1.38 | % | | | 1.41 | %11 | | | 1.44 | % | | | 1.47 | % |
Ratio of expenses to average net assets (with offsets) | | | 1.38 | % | | | 1.38 | % | | | 1.41 | %11 | | | 1.44 | % | | | 1.47 | % |
Ratio of total expenses to average net assets (without offsets/reductions)3 | | | 1.51 | % | | | 1.52 | % | | | 1.55 | %11 | | | 1.50 | % | | | 1.49 | % |
Ratio of net investment income (loss) to average net assets2 | | | 0.36 | % | | | 1.30 | % | | | 0.25 | %11 | | | (0.32 | )% | | | 0.06 | % |
Portfolio turnover | | | 55 | % | | | 5 | % | | | 36 | % | | | 43 | % | | | 80 | % |
Net assets at end of year (000’s omitted) | | $ | 2,083 | | | $ | 2,228 | | | $ | 5,520 | | | $ | 13,043 | | | $ | 7,824 | |
| | | | | | | | | | | | | | | | | | | | |
| |
| | | For the fiscal years ended October 31, | |
| Service Class | | 2015 | | | 2014 | | | 2013 | | | 2012 | | | 2011 | |
Net Asset Value, Beginning of Year | | $ | 13.98 | | | $ | 13.21 | | | $ | 13.44 | | | $ | 12.86 | | | $ | 12.77 | |
Income (Loss) from Investment Operations: | | | | | | | | | | | | | | | | | | | | |
Net investment income (loss)1,2 | | | 0.11 | | | | 0.23 | | | | 0.08 | | | | (0.02 | ) | | | 0.03 | |
Net realized and unrealized gain (loss) on investments | | | (0.65 | ) | | | 0.54 | | | | 0.14 | | | | 1.15 | | | | 0.62 | |
Total income (loss) from investment operations | | | (0.54 | ) | | | 0.77 | | | | 0.22 | | | | 1.13 | | | | 0.65 | |
Less Distributions to Shareholders from: | | | | | | | | | | | | | | | | | | | | |
Net investment income | | | (0.42 | ) | | | — | | | | (0.45 | )10 | | | (0.55 | )10 | | | (0.56 | )10 |
Net Asset Value, End of Year | | $ | 13.02 | | | $ | 13.98 | | | $ | 13.21 | | | $ | 13.44 | | | $ | 12.86 | |
Total Return2 | | | (3.98 | )% | | | 5.83 | % | | | 1.61 | % | | | 9.11 | % | | | 5.44 | % |
Ratio of net expenses to average net assets (with offsets/reductions) | | | 0.98 | % | | | 0.96 | % | | | 0.99 | %11 | | | 0.99 | % | | | 1.15 | % |
Ratio of expenses to average net assets (with offsets) | | | 0.98 | % | | | 0.96 | % | | | 0.99 | %11 | | | 0.99 | % | | | 1.15 | % |
Ratio of total expenses to average net assets (without offsets/reductions)3 | | | 1.11 | % | | | 1.10 | % | | | 1.13 | %11 | | | 1.08 | % | | | 1.17 | % |
Ratio of net investment income (loss) to average net assets2 | | | 0.83 | % | | | 1.72 | % | | | 0.63 | %11 | | | (0.14 | )% | | | 0.24 | % |
Portfolio turnover | | | 55 | % | | | 5 | % | | | 36 | % | | | 43 | % | | | 80 | % |
Net assets at end of year (000’s omitted) | | $ | 1,652 | | | $ | 2,537 | | | $ | 5,844 | | | $ | 11,738 | | | $ | 1,103 | |
| | | | | | | | | | | | | | | | | | | | |
35
AMG FQ Global Risk-Balanced Fund
Financial Highlights
For a share outstanding throughout each fiscal year
| | | | | | | | | | | | | | | | | | | | |
| | | For the fiscal years ended October 31, | |
| Institutional Class | | 2015 | | | 2014 | | | 2013 | | | 2012 | | | 2011 | |
Net Asset Value, Beginning of Year | | $ | 14.02 | | | $ | 13.23 | | | $ | 13.47 | | | $ | 12.88 | | | $ | 12.77 | |
Income (Loss) from Investment Operations: | | | | | | | | | | | | | | | | | | | | |
Net investment income1,2 | | | 0.12 | | | | 0.24 | | | | 0.10 | | | | 0.03 | | | | 0.08 | |
Net realized and unrealized gain (loss) on investments | | | (0.66 | ) | | | 0.55 | | | | 0.12 | | | | 1.12 | | | | 0.61 | |
Total income (loss) from investment operations | | | (0.54 | ) | | | 0.79 | | | | 0.22 | | | | 1.15 | | | | 0.69 | |
Less Distributions to Shareholders from: | | | | | | | | | | | | | | | | | | | | |
Net investment income | | | (0.43 | ) | | | — | | | | (0.46 | )10 | | | (0.56 | )10 | | | (0.58 | )10 |
Net Asset Value, End of Year | | $ | 13.05 | | | $ | 14.02 | | | $ | 13.23 | | | $ | 13.47 | | | $ | 12.88 | |
Total Return2 | | | (3.92 | )% | | | 5.97 | % | | | 1.61 | % | | | 9.29 | % | | | 5.70 | %7 |
Ratio of net expenses to average net assets (with offsets/reductions) | | | 0.88 | % | | | 0.88 | % | | | 0.91 | %11 | | | 0.94 | % | | | 0.97 | % |
Ratio of expenses to average net assets (with offsets) | | | 0.88 | % | | | 0.88 | % | | | 0.91 | %11 | | | 0.94 | % | | | 0.97 | % |
Ratio of total expenses to average net assets (without offsets/reductions)3 | | | 1.01 | % | | | 1.02 | % | | | 1.05 | %11 | | | 1.00 | % | | | 0.99 | % |
Ratio of net investment income to average net assets2 | | | 0.88 | % | | | 1.76 | % | | | 0.75 | %11 | | | 0.20 | % | | | 0.64 | % |
Portfolio turnover | | | 55 | % | | | 5 | % | | | 36 | % | | | 43 | % | | | 80 | % |
Net assets at end of year (000’s omitted) | | $ | 63,485 | | | $ | 73,437 | | | $ | 88,419 | | | $ | 99,173 | | | $ | 86,935 | |
| | | | | | | | | | | | | | | | | | | | |
Notes to Financial Highlights
| 1 | Per share numbers have been calculated using average shares. |
| 2 | Total returns and net investment income would have been lower had certain expenses not been offset. |
| 3 | Excludes the impact of expense reimbursements or fee waivers and expense reductions such as brokerage credits, but includes non-reimbursable expenses, if any, such as interest and taxes. (See Notes 1(c) and 2 in the Notes to Financial Statements.) |
| 4 | Includes non-recurring dividends. Without these dividends, net investment income per class would have been $0.00 and $0.05 for AMG FQ Tax-Managed U.S. Equity Fund’s Investor Class and Institutional Class, respectively, and $0.16 and $0.21 for AMG FQ U.S. Equity Fund’s Investor Class and Institutional Class, respectively. |
| 5 | Includes non-recurring dividends. Without these dividends, net investment income per class would have been $0.01, and $0.05 for AMG FQ Tax-Managed U.S. Equity Fund’s Investor Class and Institutional Class, respectively. |
| 6 | Includes non-routine extraordinary expenses amounting to 0.025% and 0.024% of average net assets for the Investor Class and Institutional Class, respectively. |
| 7 | The total return is based on the Financial Statement Net Asset Values as shown above. |
| 8 | Includes non-routine extraordinary expenses amounting to 0.022% and 0.023% of average net assets for the Investor Class, and Institutional Class, respectively. |
| 9 | Excludes tax expense for the fiscal year ended October 31, 2011, of $2,454 or 0.01%. |
| 10 | The per share income distribution shown for the Institutional, Service, and Investor Class shares represents income derived primarily from foreign currency gains. (See Note 1(i) in the Notes to Financial Statements.) |
| 11 | Includes non-routine extraordinary expenses amounting to 0.026%, 0.023% and 0.026% of average net assets for the Investor Class, Service Class and Institutional Class, respectively. |
| 12 | Includes non-recurring dividends. Without these dividends, net investment income per class would have been $0.00 and $0.09 for AMG FQ Tax-Managed U.S. Equity Fund’s Investor Class and Institutional Class, respectively, and $0.11 and $0.16 for AMG FQ U.S. Equity Fund’s Investor Class and Institutional Class, respectively. |
36
Notes to Financial Statements
October 31, 2015
1. SUMMARY OF SIGNIFICANT ACCOUNTING POLICIES
AMG Funds I (the “Trust”) is an open-end management investment company, organized as a Massachusetts business trust, and registered under the Investment Company Act of 1940, as amended (the “1940 Act”). Currently, the Trust consists of a number of different funds, each having distinct investment management objectives, strategies, risks, and policies. Included in this report are: AMG FQ Tax-Managed U.S. Equity Fund (“Tax-Managed”), AMG FQ U.S. Equity Fund (“U.S. Equity”) and AMG FQ Global Risk-Balanced Fund (“Global Risk-Balanced”), each a “Fund” and collectively, the “Funds.”
Tax-Managed and U.S. Equity each offer two classes of shares: Investor Class and Institutional Class. Global Risk-Balanced offers three classes of shares: Investor Class, Service Class and Institutional Class. Each class represents an interest in the same assets of the Fund. Although all share classes generally have identical voting rights, each share class votes separately when required by law. Different share classes may pay different distribution amounts to the extent the net asset value per share and/or the expenses of such share classes differ. Each share class has its own expense structure. Please refer to a current prospectus for additional information on each share class.
The Funds’ financial statements are prepared in accordance with accounting principles generally accepted in the United States of America (“U.S. GAAP”), which require management to make estimates and assumptions that affect the reported amounts of assets and liabilities and disclosure of contingent assets and liabilities at the date of the financial statements and the reported amounts of income and expenses during the reporting period. Actual results could differ from those estimates and such differences could be material. The following is a summary of significant accounting policies followed by the Funds in the preparation of their financial statements:
a. VALUATION OF INVESTMENTS
Equity securities, including option contracts, traded on a national securities exchange or reported on the NASDAQ national market system (“NMS”) are valued at the last quoted sales price on the primary exchange or, if applicable, the NASDAQ official closing price or the official closing price of the relevant exchange or, lacking any sales, at the last quoted bid price or the mean between the last quoted bid and ask prices (the “exchange mean price”). Equity securities traded in the over-the-counter market (other than NMS securities) are valued at the exchange mean price. Foreign equity securities (securities principally traded in markets other than U.S. markets) are valued at the official closing price on the primary exchange or, for markets that either do not offer an official closing price or where the official closing price may not be representative of the overall market, the last quoted sale price.
Fixed income securities purchased with a remaining maturity exceeding 60 days are valued at the evaluated bid price or the mean price provided by an authorized pricing service or, if an evaluated price is not available, by reference to other securities which are considered comparable in credit rating, interest rate, due date and other features (generally referred to as “matrix pricing”) or other similar pricing methodologies. Investments in certain mortgage-backed and stripped mortgage-backed securities, preferred stocks, convertible securities, derivatives and other debt securities not traded on an organized securities market are valued on the basis of valuations provided by dealers or by a pricing service which uses information with respect to transactions in such securities and various relationships between such securities and yield to maturity in determining value.
Fixed income securities purchased with a remaining maturity of 60 days or less are valued at amortized cost, provided that the amortized cost value is approximately the same as the fair value of the security valued without the use of amortized cost. Investments in other open-end regulated investment companies are valued at their end of day net asset value per share.
Futures contracts for which market quotations are readily available are valued at the settlement price as of the close of the futures exchange.
The Funds’ portfolio investments are generally valued based on independent market quotations or prices or, if none, “evaluative” or other market based valuations provided by third-party pricing services approved by the Board of Trustees of the Trust (the “Board”). Under certain circumstances, the value of certain Fund portfolio investments (including derivatives) may be based on an evaluation of fair value, pursuant to procedures established by and under the general supervision of the Board. The Valuation Committee, which is comprised of the Independent Trustees of the Board, and the Pricing Committee, which is comprised of representatives from AMG Funds LLC (the “Investment Manager”) are the committees appointed by the Board to make fair value determinations. Each Fund may use the fair value of a portfolio investment to calculate its net asset value (“NAV”) in the event that the market quotation, price or market based valuation for the portfolio investment is not readily available or otherwise not determinable pursuant to the Board’s valuation procedures, if the Investment Manager for the Pricing Committee believes the quotation, price or market based valuation to be unreliable, or in certain other circumstances. When determining the fair value of an investment, the Pricing Committee and, if required under the Trust’s securities valuation procedures, the Valuation Committee, seeks to determine the price that the Fund might reasonably expect to receive from current sale of that portfolio investment in an arms-length transaction. Fair value determinations shall be based upon consideration of all available facts and information, including, but not limited to (i) attributes specific to the investment; (ii) fundamental and analytical data relating to the investment; and (iii) the value of other comparable securities or relevant financial instruments, including derivative securities, traded on other markets or among dealers.
The values assigned to fair value portfolio investments are based on available information and do not necessarily represent amounts that might ultimately be realized in the future, since such amounts depend on future developments inherent in long-term investments. Because of the inherent uncertainty of valuation, those estimated values may differ significantly from the values that would have been used had a ready market for the investments existed, and the differences could be material. The Board will be presented with a quarterly report showing as of the most recent quarter end, all outstanding securities fair valued by the Pricing Committee, including a comparison with the prior quarter end and the percentage of the Fund that the security represents at each quarter end.
With respect to foreign equity securities and certain foreign fixed income securities, the Board has adopted a policy that securities held in a Fund that can be fair valued by the applicable fair value pricing service are fair valued on each business day provided that each individual price exceeds a pre-established confidence level.
37
Notes to Financial Statements (continued)
U.S. GAAP defines fair value as the price that a fund would receive to sell an asset or pay to transfer a liability in an orderly transaction between market participants at the measurement date. U.S. GAAP also establishes a framework for measuring fair value, and a three-level hierarchy for fair value measurements based upon the transparency of inputs to the valuation of an asset or liability. Inputs may be observable or unobservable and refer broadly to the assumptions that market participants would use in pricing the asset or liability. Observable inputs reflect the assumptions market participants would use in pricing the asset or liability based on market data obtained from sources independent of the Funds. Unobservable inputs reflect the Funds’ own assumptions about the assumptions that market participants would use in pricing the asset or liability developed based on the best information available in the circumstances. Each investment is assigned a level based upon the observability of the inputs which are significant to the overall valuation.
The three-tier hierarchy of inputs is summarized below:
Level 1 – inputs are quoted prices in active markets for identical investments (e.g., equity securities, open-end investment companies, futures contracts, option contracts)
Level 2 – other observable inputs (including, but not limited to: quoted prices for similar assets or liabilities in markets that are active, quoted prices for identical or similar assets or liabilities in markets that are not active, inputs other than quoted prices that are observable for the assets or liabilities (such as interest rates, yield curves, volatilities, prepayment speeds, loss severities, credit risks and default rates) or other market corroborated inputs) (e.g., debt securities, government securities, foreign currency exchange contracts, foreign securities utilizing international fair value pricing, broker-quoted securities, fair valued securities with observable inputs)
Level 3 – inputs are significant unobservable inputs (including the Fund’s own assumptions used to determine the fair value of investments) (e.g., fair valued securities with unobservable inputs)
Changes in inputs or methodologies used for valuing investments may result in a transfer in or out of levels within the fair value hierarchy. The inputs or methodologies used for valuing investments are not necessarily an indication of the risk associated with investing in those investments. Transfers between different levels of the fair value disclosure hierarchy are deemed to have occurred as of the beginning of the reporting period.
b. SECURITY TRANSACTIONS
Security transactions are accounted for as of trade date. Realized gains and losses on securities sold are determined on the basis of identified cost.
c. INVESTMENT INCOME AND EXPENSES
Dividend income is recorded on the ex-dividend date. Dividend and interest income on foreign securities is recorded gross of any withholding tax. Interest income, which includes amortization of premium and accretion of discount on debt securities, is accrued as earned. Non-cash dividends included in dividend income, if any, are reported at the fair market value of the securities received.
Distributions received in excess of income from return of capital including real estate investment trusts (REITs) are recorded as a reduction of the cost of the related investment and/or as a realized gain. If the Funds no longer own the applicable securities, any distributions received in excess of income are recorded as an adjustment to realized gain. Other income and expenses are recorded on an accrual basis. Expenses that cannot be directly attributed to a Fund are apportioned among the Funds in the Trust and other affiliated funds based upon their relative average net assets or number of shareholders. Investment income, realized and unrealized gains and losses, the common expenses of each Fund, and certain Fund level expense reductions, if any, are allocated on a pro-rata basis to each class based on the relative net assets of each class to the total net assets of each Fund.
The Funds have a “balance credit” arrangement with The Bank of New York Mellon (“BNYM”), the Funds’ custodian, whereby each Fund is credited with an interest factor equal to 0.75% below the effective 90-day T-Bill rate for account balances left uninvested overnight. If the T-Bill rate falls below 0.75%, no credits will be earned. These credits serve to reduce custodian expenses that would otherwise be charged to each Fund. For the fiscal year ended October 31, 2015, the Funds’ custodian expense was not reduced.
Overdraft fees are computed at 1% above the effective Federal Funds rate on the day of the overdraft. For the fiscal year ended October 31, 2015, overdraft fees for U.S. Equity equaled $9.
d. DIVIDENDS AND DISTRIBUTIONS
Fund distributions resulting from either net investment income or realized net capital gains, if any, will normally be declared and paid at least annually in December, as described in the Funds’ prospectus. Distributions to shareholders are recorded on the ex-dividend date. Distributions are determined in accordance with federal income tax regulations, which may differ from net investment income and net realized capital gains for financial statement purposes (U.S. GAAP). Differences may be permanent or temporary. Permanent differences are reclassified among capital accounts in the financial statements to reflect their tax character. Permanent book and tax basis differences, if any, relating to shareholder distributions will result in reclassifications to paid-in capital. Temporary differences arise when certain items of income, expense and gain or loss are recognized in different periods for financial statement and tax purposes; these differences will reverse at some time in the future. Permanent differences are due to foreign currency transactions, fair fund settlements, tax equalization and partnership investments. Temporary differences are due to wash sales, mark-to-market of open futures and option contracts, and partnership investments.
38
Notes to Financial Statements (continued)
The tax character of distributions paid during the fiscal years ended October 31, 2015 and October 31, 2014 were as follows:
| | | | | | | | | | | | | | | | | | | | | | | | |
| | | Tax-Managed | | | U.S. Equity | | | Global Risk-Balanced | |
| Distributions paid from: | | 2015 | | | 2014 | | | 2015 | | | 2014 | | | 2015 | | | 2014 | |
Ordinary income | | $ | 243,666 | | | $ | 154,296 | | | $ | 762,859 | | | $ | 641,201 | | | $ | 2,339,173 | | | | — | |
Short-term capital gains | | | — | | | | — | | | | — | | | | — | | | | — | | | | — | |
Long-term capital gains | | | — | | | | — | | | | — | | | | — | | | | — | | | | — | |
Totals | | $ | 243,666 | | | $ | 154,296 | | | $ | 762,859 | | | $ | 641,201 | | | $ | 2,339,173 | | | | — | |
| | | | | | | | | | | | | | | | | | | | | | | | |
As of October 31, 2015, the components of distributable earnings (excluding unrealized appreciation/depreciation) on tax basis consisted of:
| | | | | | | | | | | | |
| | | Tax-Managed | | | U.S. Equity | | | Global
Risk-Balanced | |
Capital loss carryforward | | $ | 10,237,167 | | | | — | | | $ | 14,173,442 | |
Late-year loss deferral | | | — | | | | — | | | | — | |
Undistributed ordinary income | | | 377,115 | | | $ | 28,564 | | | | 1,256,435 | |
Undistributed short-term capital gains | | | — | | | | — | | | | — | |
Undistributed long-term capital gains | | | — | | | | 6,065,955 | | | | — | |
e. FEDERAL TAXES
Each Fund intends to comply with the requirements under Subchapter M of the Internal Revenue Code of 1986, as amended, and to distribute substantially all of its taxable income and gains to its shareholders and to meet certain diversification and income requirements with respect to investment companies. Therefore, no provision for federal income or excise tax is included in the accompanying financial statements.
Additionally, based on each Fund’s understanding of the tax rules and rates related to income, gains and transactions for the foreign jurisdictions in which it invests, each Fund will provide for foreign taxes, and where appropriate, deferred foreign taxes.
Management has analyzed the Funds’ tax positions taken on federal income tax returns as of October 31, 2015, and for all open tax years (generally, the three prior taxable years), and has concluded that no provision for federal income tax is required in the Funds’ financial statements. Additionally, Management is not aware of any tax position for which it is reasonably possible that the total amounts of unrecognized tax benefits will change materially in the next twelve months.
Net capital losses incurred in taxable years beginning after the enactment of the Regulated Investment Company Modernization Act of 2010, may be carried forward for an unlimited time period. Such losses will be required to be utilized prior to any loss carryovers incurred in pre-enactment taxable years, which generally expire eight years following the close of the taxable year in which they were incurred. As a result of this ordering rule, pre-enactment capital loss carryovers may be more likely to expire unused. Additionally, post-enactment capital losses that are carried forward retain their tax character as either short-term or long-term capital losses, unlike pre-enactment losses which are considered all short-term.
f. CAPITAL LOSS CARRYOVERS AND DEFERRALS
As of October 31, 2015, the following Funds had accumulated net realized capital loss carryovers from securities transactions for federal income tax purposes as shown in the following chart. These amounts may be used to offset future realized capital gains, if any, through the expiration dates listed or in the case of post-enactment losses, for an unlimited time period.
| | | | | | | | | | | | |
| | | Capital Loss Carryover
Amounts | | | Expires October 31, | |
| Fund | | Short-
Term | | | Long-Term | | |
Tax-Managed | | | | | | | | | | | | |
(Pre-Enactment) | | $ | 10,237,167 | | | | — | | | | 2017 | |
U.S. Equity | | | | | | | | | | | | |
(Pre-Enactment) | | | — | | | | — | | | | n/a | |
Global Risk-Balanced | | | | | | | | | | | | |
(Pre-Enactment) | | $ | 10,671,887 | | | | — | | | | 2017 | |
(Post-Enactment) | | $ | 1,847,269 | | | $ | 1,654,286 | | | | n/a | |
For the fiscal year ended October 31, 2015, the following Funds utilized capital loss carryovers in the amount of:
| | | | | | | | |
| | | Capital Loss Carryover Utilized | |
| | | Short-Term | | | Long-Term | |
Tax-Managed | | $ | 4,084,505 | | | | — | |
U.S. Equity | | | 738,454 | | | | — | |
Global Risk-Balanced | | | — | | | | — | |
As of October 31, 2015, U.S. Equity had no accumulated net realized capital loss carryovers from securities transactions for federal income tax purposes. Should the Fund incur net capital losses for the fiscal year ended October 31, 2016, such amounts may be used to offset future realized capital gains, for an unlimited time period.
39
Notes to Financial Statements (continued)
g. CAPITAL STOCK
The Trust’s Declaration of Trust authorizes for each fund the issuance of an unlimited number of shares of beneficial interest, without par value. Each Fund records sales and repurchases of its capital stock on the trade date. The cost of securities contributed to the Funds in connection with the issuance of shares is based on the valuation of those securities in accordance with the Funds’ policy on investment valuation.
For the fiscal years ended October 31, 2015 and 2014, the capital stock transactions by class for Tax-Managed, U.S. Equity and Global Risk-Balanced were as follows:
| | | | | | | | | | | | | | | | | | | | | | | | | | | | | | | | |
| | | Tax-Managed | | | U.S. Equity | |
| | | 2015 | | | 2014 | | | 2015 | | | 2014 | | | | |
| | | Shares | | | Amount | | | Shares | | | Amount | | | Shares | | | Amount | | | Shares | | | Amount | |
Investor Class: | | | | | | | | | | | | | | | | | | | | | | | | | | | | | | | | |
Proceeds from sale of shares | | | 693,423 | | | $ | 17,092,257 | | | | 386,272 | | | $ | 8,486,117 | | | | 498,352 | | | $ | 8,731,848 | | | | 286,365 | | | $ | 4,693,895 | |
Reinvestment of distributions | | | 1,135 | | | | 27,945 | | | | 344 | | | | 7,388 | | | | 13,423 | | | | 233,187 | | | | 11,048 | | | | 182,960 | |
Cost of shares repurchased | | | (209,624 | ) | | | (5,179,546 | ) | | | (170,687 | ) | | | (3,673,280 | ) | | | (291,154 | ) | | | (5,088,974 | ) | | | (306,778 | ) | | | (5,050,651 | ) |
| | | | | | | | | | | | | | | | | | | | | | | | | | | | | | | | |
Net Increase (Decrease) | | | 484,934 | | | $ | 11,940,656 | | | | 215,929 | | | $ | 4,820,225 | | | | 220,621 | | | $ | 3,876,061 | | | | (9,365 | ) | | $ | (173,796 | ) |
| | | | | | | | | | | | | | | | | | | | | | | | | | | | | | | | |
Institutional Class: | | | | | | | | | | | | | | | | | | | | | | | | | | | | | | | | |
Proceeds from sale of shares | | | 530,640 | | | $ | 12,897,236 | | | | 400,535 | | | $ | 8,695,253 | | | | 201,315 | | | $ | 3,551,191 | | | | 138,039 | | | $ | 2,237,936 | |
Reinvestment of distributions | | | 8,250 | | | | 202,788 | | | | 6,540 | | | | 139,886 | | | | 29,742 | | | | 518,265 | | | | 27,209 | | | | 448,821 | |
Cost of shares repurchased | | | (376,621 | ) | | | (9,278,374 | ) | | | (416,905 | ) | | | (9,134,817 | ) | | | (501,422 | ) | | | (8,797,664 | ) | | | (233,359 | ) | | | (3,792,159 | ) |
| | | | | | | | | | | | | | | | | | | | | | | | | | | | | | | | |
Net Increase (Decrease) | | | 162,269 | | | $ | 3,821,650 | | | | (9,830 | ) | | $ | (299,678 | ) | | | (270,365 | ) | | $ | (4,728,208 | ) | | | (68,111 | ) | | $ | (1,105,402 | ) |
| | | | | | | | | | | | | | | | | | | | | | | | | | | | | | | | |
| | | | | | | | | | | | | | | | |
| | | Global Risk-Balanced | |
| | | 2015 | | | 2014 | |
| | | Shares | | | Amount | | | Shares | | | Amount | |
Investor Class: | | | | | | | | | | | | | | | | |
Proceeds from sale of shares | | | 39,445 | | | $ | 546,703 | | | | 86,533 | | | $ | 1,189,918 | |
Reinvestment of distributions | | | 3,650 | | | | 48,688 | | | | — | | | | — | |
Cost of shares repurchased | | | (42,903 | ) | | | (585,471 | ) | | | (345,704 | ) | | | (4,665,337 | ) |
| | | | | | | | | | | | | | | | |
Net Increase (Decrease) | | | 192 | | | $ | 9,920 | | | | (259,171 | ) | | $ | (3,475,419 | ) |
| | | | | | | | | | | | | | | | |
Service Class: | | | | | | | | | | | | | | | | |
Proceeds from sale of shares | | | 16,552 | | | $ | 228,703 | | | | 94,233 | | | $ | 1,331,001 | |
Reinvestment of distributions | | | 5,497 | | | | 73,547 | | | | — | | | | — | |
Cost of shares repurchased | | | (76,679 | ) | | | (1,022,616 | ) | | | (355,211 | ) | | | (4,688,878 | ) |
| | | | | | | | | | | | | | | | |
Net Decrease | | | (54,630 | ) | | $ | (720,366 | ) | | | (260,978 | ) | | $ | (3,357,877 | ) |
| | | | | | | | | | | | | | | | |
Institutional Class: | | | | | | | | | | | | | | | | |
Proceeds from sale of shares | | | 132,355 | | | $ | 1,829,715 | | | | 187,750 | | | $ | 2,519,242 | |
Reinvestment of distributions | | | 162,499 | | | | 2,179,110 | | | | — | | | | — | |
Cost of shares repurchased | | | (670,555 | ) | | | (9,175,244 | ) | | | (1,631,080 | ) | | | (21,848,655 | ) |
| | | | | | | | | | | | | | | | |
Net Decrease | | | (375,701 | ) | | $ | (5,166,419 | ) | | | (1,443,330 | ) | | $ | (19,329,413 | ) |
| | | | | | | | | | | | | | | | |
At October 31, 2015, certain unaffiliated shareholders of record, specifically omnibus accounts, individually or collectively held greater than 10% of the net assets of the Funds as follows: Tax-Managed—one owns 17%. Transactions by these shareholders may have a material impact on their respective Funds.
40
Notes to Financial Statements (continued)
h. REPURCHASE AGREEMENTS AND JOINT REPURCHASE AGREEMENTS
The Funds may enter into repurchase agreements for temporary cash management purposes provided that the value of the underlying collateral, including accrued interest, will equal or exceed the value of the repurchase agreement during the term of the agreement. The underlying collateral for all repurchase agreements is held in safekeeping by the Fund’s custodian or at the Federal Reserve Bank. If the seller defaults and the value of the collateral declines, or if bankruptcy proceedings commence with respect to the seller of the security, realization of the collateral by the Funds may be delayed or limited.
Additionally, the Funds may enter into joint repurchase agreements for reinvestment of cash collateral on securities lending transactions under the securities lending program offered by BNYM (the “Program”), provided that the value of the underlying collateral, including accrued interest, will equal or exceed the value of the joint repurchase agreement during the term of the agreement. The Funds participate on a pro rata basis with other clients of BNYM in its share of the underlying collateral under such joint repurchase agreements and in its share of proceeds from any repurchase or other disposition of the underlying collateral. The underlying collateral for joint repurchase agreements is held in safekeeping by the Fund’s custodian or at the Federal Reserve Bank. If the seller defaults and the value of the collateral declines, or if bankruptcy proceedings commence with respect to the seller of the security, realization of the collateral by the Funds may be delayed or limited. Pursuant to the Program, the Funds are indemnified for such losses by BNYM.
At October 31, 2015, the market value of repurchase agreements or joint repurchase agreements outstanding for Tax-Managed, U.S. Equity and Global Risk-Balanced was $2,537,946, $1,479,779 and $888,401, respectively.
i. FOREIGN CURRENCY TRANSLATION
The books and records of the Funds are maintained in U.S. dollars. The value of investments, assets and liabilities denominated in currencies other than U.S. dollars are translated into U.S. dollars based upon current foreign exchange rates. Purchases and sales of foreign investments, income and expenses are converted into U.S. dollars based on currency exchange rates prevailing on the respective dates of such transactions. Net realized and unrealized gain (loss) on foreign currency transactions represent: (1) foreign exchange gains and losses from the sale and holdings of foreign currencies; (2) gains and losses between trade date and settlement date on investment securities transactions and forward foreign currency exchange contracts; and (3) gains and losses from the difference between amounts of interest and dividends recorded and the amounts actually received.
The Funds do not isolate the net realized and unrealized gain or loss resulting from changes in exchange rates from the fluctuations in market prices of securities held. Such fluctuations are included with the net realized and unrealized gain or loss on investments.
j. FOREIGN SECURITIES
Certain Funds invest in securities of foreign entities and in instruments denominated in foreign currencies which involve risks not typically associated with investments in domestic securities. Non-domestic securities carry special risks, such as exposure to currency fluctuations, less developed or less efficient
trading markets, political instability, a lack of company information, differing auditing and legal standards, and, potentially, less liquidity.
Realized gains in certain countries may be subject to foreign taxes at the Fund level, and would pay such foreign taxes at the appropriate rate for each jurisdiction.
2. AGREEMENTS AND TRANSACTIONS WITH AFFILIATES
For each of the Funds, the Trust has entered into an investment advisory agreement under which the Investment Manager, a subsidiary and the U.S. retail distribution arm of Affiliated Managers Group, Inc. (“AMG”), serves as investment manager to the Funds and is responsible for the Funds’ overall administration and operations. The Investment Manager selects one or more subadvisors for the Funds (subject to Board approval) and monitors each subadvisor’s investment performance, security holdings and investment strategies. Each Fund’s investment portfolios are managed by First Quadrant, L.P. (“First Quadrant”), who serves pursuant to a subadvisory agreement with the Investment Manager. AMG indirectly owns a majority interest in First Quadrant.
Tax Managed, U.S. Equity and Global Risk-Balanced are obligated by their respective Investment Management Agreements to pay a management fee to the Investment Manager at the annual rate of 0.85%, 0.35% and 0.60%, respectively, of the average daily net assets of the applicable Fund. The Investment Manager, in turn, pays all or a portion of this fee to First Quadrant for its services as subadvisor.
The Investment Manager has contractually agreed, through at least March 1, 2016, to waive management fees (but not below zero) and/or reimburse Fund expenses in order to limit total annual Fund operating expenses after fee waiver and expense reimbursements (exclusive of taxes, interest (including interest incurred in connection with bank and custody overdrafts), shareholder servicing fees, distribution and service (12b-1) fees, brokerage commissions and other transaction costs, acquired fund fees and expenses and extraordinary expenses) of Tax-Managed, U.S. Equity and Global Risk-Balanced to 0.89%, 0.79% and 0.89%, respectively, of each Fund’s average daily net assets subject to later reimbursement by the Funds in certain circumstances. The contractual expense limitation may only be terminated in the event the Investment Manager or a successor ceases to be the Investment Manager of the Fund or a successor fund, by mutual agreement between the Investment Manager and the Trust’s Board of Trustees, or in the event of the Fund’s liquidation unless the Fund is reorganized or is a party to a merger in which the surviving entity is successor to the accounting and performance information of the Fund. Effective July 1, 2015 for Tax-Managed the expense limitation was dropped to 0.89% from 0.99%.
Each Fund is obligated to repay the Investment Manager such amounts waived, paid or reimbursed in future years provided that the repayment occurs within thirty-six (36) months after the waiver or reimbursement and that such repayment would not cause the Fund’s total annual operating expenses after fee waiver and respective expense reimbursements in any such future year to exceed that Funds’ respective contractual expense limitation amount.
41
Notes to Financial Statements (continued)
For the fiscal year ended October 31, 2015, each Fund’s components of reimbursement available are detailed in the following chart:
| | | | | | | | | | | | |
| | | Tax-Managed | | | U.S. Equity | | | Global Risk-Balanced | |
Reimbursement Available - 10/31/14 | | $ | 129,265 | | | $ | 82,645 | | | $ | 305,969 | |
Additional Reimbursements | | | 53,538 | | | | 17,004 | | | | 94,113 | |
Repayments | | | (3,979 | ) | | | (14,935 | ) | | | — | |
Expired Reimbursements | | | (57,758 | ) | | | (35,285 | ) | | | (49,509 | ) |
| | | | | | | | | | | | |
Reimbursement Available - 10/31/15 | | $ | 121,066 | | | $ | 49,429 | | | $ | 350,573 | |
| | | | | | | | | | | | |
|
The expiration of each Fund’s reimbursement are as follows: | |
| | | |
| | | | | | | | | Global Risk-Balanced | |
| Expiration Period | | Tax-Managed | | | U.S. Equity | | |
Less than 1 year | | $ | 40,131 | | | $ | 22,874 | | | $ | 144,328 | |
Within 2 years | | | 27,397 | | | | 9,551 | | | | 112,132 | |
Within 3 years | | | 53,538 | | | | 17,004 | | | | 94,113 | |
| | | | | | | | | | | | |
Total Amount Subject to Reimbursement | | $ | 121,066 | | | $ | 49,429 | | | $ | 350,573 | |
| | | | | | | | | | | | |
The Investment Manager has agreed to waive a portion of its management fee in consideration of shareholder servicing fees that it has received from JPMorgan Distribution Services, Inc., with respect to short-term cash investments each Fund may have made in the JPMorgan Liquid Assets Money Market Fund, Capital Shares. For the fiscal year ended October 31, 2015, the management fee for Global Risk-Balanced was reduced by $4,147 or 0.01%.
U.S Equity and Global Risk-Balanced have entered into an Administration and Shareholder Servicing Agreement under which the Investment Manager serves as each Fund’s administrator (the “Administrator”) and provides a variety of administrative services to the Funds. Each Fund pays a fee to the Administrator at the rate of 0.25% per annum of the Fund’s average daily net assets for these services.
Effective January 1, 2015, the Board provides supervision of the affairs of the Trust, other trusts within the AMG Funds family of mutual funds (collectively, the “AMG Funds family”) and other affiliated funds. Previously, the Board provided supervision to only the Trust and other trusts within the AMG Funds family.
Beginning January 1, 2015, the aggregate annual retainer paid to each Independent Trustee of the Board is $200,000, plus $16,000, $4,000 or $2,000 for each regular, in-person special or telephonic special meeting attended, respectively. The Independent Chairman of the Trusts receives an additional payment of $55,000 per year. The Chairman of the Audit Committee receives an additional payment of $25,000 per year.
Prior to January 1, 2015, the aggregate annual retainer paid to each Independent Trustee of the Board was $130,000, plus $7,000 or $2,500 for each regular or special meeting attended, respectively. The Independent Chairman of the Trusts formerly received an additional payment of $35,000 per year. The Chairman of the Audit Committee formerly received an additional payment of $15,000 per year.
Effective January 1, 2015, the Trustees’ fees and expenses are generally allocated among all of the funds in the Trust, other trusts within the AMG Funds family and other affiliated funds based on the relative net assets of such funds. Before January 1, 2015, the Trustees’ fees and expenses were generally allocated among all of the funds in the Trust and other trusts within the AMG Funds family. The “Trustees fees and expenses” shown in the financial statements represents each Fund’s allocated portion of the total fees and expenses paid to the Independent Trustees of the Board.
The Funds are distributed by AMG Distributors, Inc. (the “Distributor”), a wholly-owned subsidiary of the Investment Manager. The Distributor serves as the distributor and underwriter for each Fund and is a registered broker-dealer and member of the Financial Industry Regulatory Authority, Inc. (“FINRA”). Shares of each Fund will be continuously offered and will be sold directly to prospective purchasers through brokers, dealers or other financial intermediaries who have executed selling agreements with the Distributor. Subject to the compensation arrangement discussed below, generally the Distributor bears all or a portion of the expenses of providing services pursuant to the distribution agreement, including the payment of the expenses relating to the distribution of prospectuses for sales purposes and any advertising or sales literature. Certain Trustees and Officers of the Funds are Officers and/or Directors of the Investment Manager, AMG and/or the Distributor.
The Trust has adopted a distribution and service plan (the “Plan”) with respect to the Investor Class shares, in accordance with the requirements of Rule 12b-1 under the 1940 Act and the requirements of the applicable rules of FINRA regarding asset based sales charges. Pursuant to the Plan, each Fund may make payments to the Distributor for its expenditures in financing any activity primarily intended to result in the sale of each such class of Fund’s shares and for maintenance and personal service provided to existing shareholders of that class. The Plan authorizes payments to the Distributor up to 0.25% annually of each Fund’s average daily net assets attributable to the Investor Class shares.
For Global Risk-Balanced of the Investor and Service Classes, the Board has approved reimbursement payments to the Investment Manager for shareholder servicing expenses (“shareholder servicing fees”) incurred. Shareholder servicing fees include payments to third parties such as a bank, broker-dealer, trust company or other financial intermediaries who provide shareholder recordkeeping, account servicing and other services. The Investor and Service Class shares may reimburse the Investment Manager for the actual amount incurred up to a maximum annual rate of each Class’s average daily net assets as shown in the table below.
The impact on the annualized expense ratios for the fiscal year ended October 31, 2015 were as follows:
| | | | | | | | |
| Fund | | Maximum
Amount
Allowed | | | Actual
Amount
Incurred | |
Global Risk-Balanced | | | | | | | | |
Investor Class | | | 0.25 | % | | | 0.25 | % |
Service Class | | | 0.25 | % | | | 0.09 | % |
42
Notes to Financial Statements (continued)
The Securities and Exchange Commission has granted an exemptive order that permits the Funds to lend and borrow money for certain temporary purposes directly to and from other eligible Funds in the AMG Funds family. Participation in this interfund lending program is voluntary for both the borrowing and lending Funds, and an interfund loan is only made if it benefits each participating Fund. The Investment Manager administers the program according to procedures approved by the Board, and the Board monitors the operation of the program. An interfund loan must comply with certain conditions set out in the exemptive order, which are designed to assure fairness and protect all participating Funds. For the fiscal year ended October 31, 2015, the following Funds either borrowed from or lent to other Funds in the AMG Funds family: Global Risk-Balanced lent varying amounts not exceeding $5,930,313 for six days earning interest of $192. The interest amount is included in the Statement of Operations as interest income. At October 31, 2015, the Funds had no loans outstanding.
3. PURCHASES AND SALES OF SECURITIES
Purchases and sales of securities (excluding short-term securities and U.S. Government obligations) for the fiscal year ended October 31, 2015, were as follows:
| | | | | | | | |
| | | Long-Term Securities | |
| Fund | | Purchases | | | Sales | |
Tax-Managed | | $ | 59,623,423 | | | $ | 44,757,062 | |
U.S. Equity | | | 95,705,968 | | | | 97,233,504 | |
Global Risk-Balanced | | | 27,034,676 | | | | 38,859,681 | |
The Funds had no purchases or sales of U.S Government obligations during the fiscal year ended October 31, 2015.
4. PORTFOLIO SECURITIES LOANED
The Funds participate in the Program providing for the lending of securities to qualified brokers. Securities lending income includes earnings of such temporary cash investments, plus or minus any rebate to a borrower. These earnings (after any rebate) are then divided between BNYM, as a fee for its services under the Program, and the Funds, according to agreed-upon rates. Collateral on all securities loaned is accepted in cash and is maintained at a minimum level of 102% (105% in the case of certain foreign securities) of the market value, plus interest, if applicable, of investments on loan. It is the Funds’ policy to obtain additional collateral from or return excess collateral to the borrower by the end of the next business day, following the valuation date of the securities loaned. Therefore, the value of the collateral held may be temporarily less than the value of the securities on loan. Lending securities entails a risk of loss to the Funds if and to the extent that the market value of the securities loaned were to increase and the borrower did not increase the collateral accordingly, and the borrower fails to return the securities. Under the terms of the Program, the Funds are indemnified for such losses by BNYM. Cash collateral is held in a separate omnibus account managed by BNYM, who is authorized to exclusively enter into joint overnight government repurchase agreements. BNYM bears the risk of any deficiency in the amount of the cash collateral available for return to the borrower due to any loss on the collateral invested.
At October 31, 2015, the value of the securities loaned and cash collateral received, were as follows:
| | | | | | | | |
| Fund | | Securities
Loaned | | | Cash Collateral
Received | |
Tax-Managed | �� | $ | 2,500,165 | | | $ | 2,537,946 | |
U.S. Equity | | | 1,454,130 | | | | 1,479,779 | |
Global Risk-Balanced | | | 867,248 | | | | 888,401 | |
5. COMMITMENTS AND CONTINGENCIES
Under the Trust’s organizational documents, its trustees and officers are indemnified against certain liabilities arising out of the performance of their duties to the Trust. In addition, in the normal course of business, the Funds may enter into contracts and agreements that contain a variety of representations and warranties, which provide general indemnifications. The maximum exposure to the Funds under these arrangements is unknown, as this would involve future claims that may be made against the Funds that have not yet occurred. However, based on experience, the Funds had no prior claims or losses and expect the risks of loss to be remote.
6. FORWARD COMMITMENTS
Certain transactions, such as futures and forward transactions may have a similar effect on the Fund’s net asset value as if the Fund had created a degree of leverage in its portfolio. However, if a Fund enters into such a transaction, the Fund will establish a segregated account with its custodian in which it will maintain cash, U.S. government securities or other liquid securities equal in value to its obligations in respect to such transaction. Securities and other assets held in the segregated account may not be sold while the transaction is outstanding, unless other suitable assets are substituted.
7. DERIVATIVE INSTRUMENTS
The following disclosures contain information on how and why the Funds use derivative instruments, the credit risk and how derivative instruments affect the Fund’s financial position, and results of operations. The location and fair value amounts of these instruments on the Statement of Assets and Liabilities and the realized and changes in unrealized gains and losses on the Statement of Operations, each categorized by type of derivative contract, are included in a table in the Notes to the Schedules of Portfolio Investments. For the fiscal year ended October 31, 2015, the average quarterly balances of outstanding derivative financial instruments were as follows:
| | | | | | | | |
| | | U.S.
Equity | | | Global Risk-
Balanced | |
Financial futures contracts: | | | | | | | | |
Average number of contracts purchased | | | 2 | | | | 736 | |
Average notional value of contracts purchased | | $ | 205,016 | | | $ | 81,874,070 | |
Options: | | | | | | | | |
Average value of option contracts purchased | | $ | 390,352 | | | $ | 363,529 | |
Average value of option contracts written | | $ | 624,826 | | | $ | 560,919 | |
43
Notes to Financial Statements (continued)
8. FUTURES CONTRACTS
U.S. Equity entered into equity index futures contracts with the objective of maintaining exposure to equity stock markets while maintaining liquidity. Global Risk-Balanced entered into futures contracts, including futures contracts on fixed-income securities, interest rate futures contracts, foreign currency futures contracts and futures contracts on security indices (including broad-based security indices). U.S. Equity and Global Risk-Balanced purchased and sold futures contracts to achieve a desired level of investment, whether to accommodate portfolio turnover or cash flows from capital shares transactions. There are certain risks associated with futures contracts. Prices may not move as expected or the Fund may not be able to close out the contract when it desires to do so, resulting in losses.
On entering into a futures contract, either cash or securities in an amount equal to a certain percentage of the contract value (initial margin) must be deposited with the futures broker. Subsequent payments (variation margin) are made or received each day. The variation margin payments equal the daily changes in the contract value and are recorded as unrealized gains or losses. For OTC futures, daily variation margin is not required. The Fund recognizes a realized gain or loss when the contract is closed or expires equal to the difference between the value of the contract at the time it was opened and the value at the time it was closed. Futures are valued at their quoted daily settlement prices. The aggregate principal amounts of the contracts are not recorded in the financial statements. Fluctuations in the value of the contracts are recorded in the Statement of Assets and Liabilities as an asset (liability) and in the Statement of Operations as unrealized appreciation (depreciation) until the contracts are closed, when they are recorded as realized gains (losses) on futures contracts.
9. OPTIONS
A written option contract is a contract in which the writer of the option grants the buyer of the option the right to purchase from (call option) or sell to (put option) the writer a designated instrument at a specified price within a specified period of time. Options written (sold) are recorded as liabilities. U.S. Equity and Global Risk-Balanced, as writer of written options, bears the risk of an unfavorable change in the market value of the instrument underlying the written option. When an option expires, the premium (original option value) is realized as a gain if the option was written or as a loss if the option was purchased. When the exercise of an option results in a cash settlement, the difference between the premium and the settlement proceeds is recognized as realized gain or loss. When securities are acquired or delivered upon exercise of an option, the acquisition cost or sale proceeds are adjusted by the amount of the premium. When an option is closed, the difference between the premium and the cost to close the position is realized as a gain or loss.
10. EXCHANGE TRADED NOTES
Global Risk-Balanced invests in Exchange Traded Notes (“ETNs”). ETNs are senior, unsecured, unsubordinated debt securities issued by a financial institution, listed on an exchange and traded in the secondary market. There are no periodic interest payments, and principal is not protected. The Fund could lose some or all of the amount invested. The price in the secondary market is determined by supply and demand, the current performance of the index, and the credit rating of the ETN issuer. At maturity, the issuer pays the Fund a return linked to the performance of the market index, such as a commodity index, to
which the ETN is linked, minus the issuer’s fee. ETNs are subject to the risk of a breakdown in the futures markets that they use. As a means to obtain commodity exposure, the Fund invests in ETNs linked to commodity indices. The Fund may be exposed to a wide variety of commodity sectors, including, without limitation, agriculture, livestock, base/industrial metals, oil, energy and precious metals. Commodity prices, and the value of stocks of companies exposed to commodities, can be extremely volatile and are affected by a wide range of factors.
11. MARKET, CREDIT AND COUNTERPARTY RISKS
In the normal course of business, Global Risk-Balanced invests in securities and enters into transactions where risks exist due to market fluctuations and is exposed to credit risk with parties with whom it trades (issuers or counterparties). Market prices of investments held by the Fund may fall rapidly or unpredictably and will rise and fall due to changing economic, political, or market conditions or in response to events that affect particular industries or companies. The Fund may be exposed to credit or counterparty risk, or the risk that an institution or other entity with which the Fund has unsettled or open transactions will default or not perform under the contract. The Fund minimizes credit risk and counterparty risk by undertaking transactions with a large number of customers and counterparties on recognized and reputable exchanges. The Fund could lose money if the issuer or guarantor of a fixed income security, or the counterparty to a financial derivatives contract, repurchase agreement or a loan of portfolio securities, is unable or unwilling to make timely principal and/or interest payments, or to otherwise honor its obligations.
The Funds are subject to various Master Agreements, which govern the terms of certain transactions with select counterparties. These Master Agreements reduce the counterparty risk associated with relevant transactions by specifying credit protection mechanisms and providing standardization that improves legal certainty. Master Agreements can also help limit counterparty risk by specifying collateral posting arrangements at pre-arranged exposure levels. Under the Master Agreements, collateral is routinely transferred if the total net exposure to certain transactions (net of existing collateral already in place) governed under the relevant master agreement with a counterparty in a given account exceeds a specified threshold, which typically ranges from zero to $250,000 depending on the counterparty and the type of Master Agreement.
International Swaps and Derivatives Association, Inc. Master Agreements (“ISDA Master Agreements”) govern OTC financial derivative transactions entered into by the Funds and the respective counterparty. The ISDA Master Agreements maintain provisions for general obligations, representations, agreements, collateral and events of default or termination. Certain ISDA Master Agreements allow counterparties to OTC derivatives to terminate derivative contracts prior to maturity in the event the Funds’ net assets decline by a stated percentage or the Funds fail to meet the terms of the ISDA Master Agreement, which requires accelerated settlement of all outstanding transactions under the applicable ISDA Master Agreement. Any election to terminate early could be material to the financial statements.
44
Notes to Financial Statements (continued)
12. MASTER NETTING AGREEMENTS
The Funds may enter into master netting agreements with their counterparties for the securities lending program, repurchase agreements and derivative instruments, which provide the right, in the event of default (including bankruptcy or insolvency) for the non-defaulting party to liquidate the collateral
and calculate net exposure to the defaulting party or request additional collateral. For financial reporting purposes, the Funds do not offset financial assets and financial liabilities that are subject to master netting agreements in the Statement of Assets and Liabilities. For securities lending transactions, see Note 4.
The following table is a summary of the Funds’ open repurchase agreements and derivative instruments that are subject to a master netting agreements as of October 31, 2015:
| | | | | | | | | | | | | | | | |
| | | | | | Gross Amount Not Offset in the
Statement of Assets and Liabilities | | | | |
| Fund | | Net Amounts of Assets
Presented in the Statement
of Assets and Liabilities | | | Financial Instruments
Collateral | | | Cash Collateral
Received | | | Net Amount | |
Tax-Managed | | | | | | | | | | | | | | | | |
Daiwa Capital Markets America | | $ | 1,000,000 | | | $ | 1,000,000 | | | | — | | | | — | |
HSBC Securities USA Inc. | | | 537,946 | | | | 537,946 | | | | — | | | | — | |
Nomura Securities International, Inc. | | | 1,000,000 | | | | 1,000,000 | | | | — | | | | — | |
| | | | | | | | | | | | | | | | |
Total | | $ | 2,537,946 | | | $ | 2,537,946 | | | | — | | | | — | |
| | | | | | | | | | | | | | | | |
U.S. Equity | | | | | | | | | | | | | | | | |
Daiwa Capital Markets America | | $ | 479,779 | | | $ | 479,779 | | | | — | | | | — | |
Nomura Securities International, Inc. | | | 1,000,000 | | | | 1,000,000 | | | | — | | | | — | |
| | | | | | | | | | | | | | | | |
Total | | $ | 1,479,779 | | | $ | 1,479,779 | | | | — | | | | — | |
| | | | | | | | | | | | | | | | |
Global Risk-Balanced | | | | | | | | | | | | | | | | |
Nomura Securities International, Inc. | | $ | 888,401 | | | $ | 888,401 | | | | — | | | | — | |
| | | | | | | | | | | | | | | | |
Total | | $ | 888,401 | | | $ | 888,401 | | | | — | | | | — | |
| | | | | | | | | | | | | | | | |
Each Fund has determined that no material events or transactions occurred through the issuance date of the Funds’ financial statements which require additional disclosure in or adjustment of the Funds’ financial statements.
TAX INFORMATION (unaudited)
The AMG FQ Tax-Managed U.S. Equity, AMG FQ U.S. Equity and AMG FQ Global Risk-Balanced Funds each hereby designates the maximum amount allowable of its net taxable income as qualified dividends as provided in the Jobs and Growth Tax Relief Reconciliation Act of 2003. The 2014/2015 Form 1099-DIV you receive for each Fund will show the tax status of all distributions paid to you during the year.
Pursuant to section 852 of the Internal Revenue Code, AMG FQ Tax-Managed U.S. Equity, AMG FQ U.S. Equity and AMG FQ Global Risk-Balanced Funds each hereby designate $0, $579,182, and $0, respectively, as a capital gain distribution with respect to the taxable year ended October 31, 2015, or if subsequently determined to be different, the net capital gains of such fiscal year.
45
Report of Independent Registered Public Accounting Firm
TO THE BOARD OF TRUSTEES OF AMG FUNDS I AND THE SHAREHOLDERS OF AMG FQ TAX-MANAGED U.S. EQUITY FUND, AMG FQ U.S. EQUITY FUND AND AMG FQ GLOBAL RISK-BALANCED FUND:
In our opinion, the accompanying statements of assets and liabilities, including the schedules of portfolio investments, and the related statements of operations and of changes in net assets and the financial highlights present fairly, in all material respects, the financial positions of AMG FQ Tax-Managed U.S. Equity Fund, AMG FQ U.S. Equity Fund and AMG FQ Global Risk-Balanced Fund (the “Funds”) at October 31, 2015, and the results of each of their operations, the changes in each of their net assets and the financial highlights for each of the periods indicated, in conformity with accounting principles generally accepted in the United States of America. These financial statements and financial highlights (hereafter referred to as “financial statements”) are the responsibility of the Funds’ management. Our responsibility is to express an opinion on these financial statements based on our audits. We conducted our audits of these financial statements in accordance with the standards of the Public Company Accounting Oversight Board (United States). Those standards require that we plan and perform the audit to obtain reasonable assurance about whether the financial statements are free of material misstatement. An audit includes examining, on a test basis, evidence supporting the amounts and disclosures in the financial statements, assessing the accounting principles used and significant estimates made by management, and evaluating the overall financial statement presentation. We believe that our audits, which included confirmation of securities at October 31, 2015 by correspondence with the custodian, brokers and transfer agent, and the application of alternative auditing procedures where securities purchased had not been received, provide a reasonable basis for our opinion.
PricewaterhouseCoopers LLP
Boston, Massachusetts
December 23, 2015
46
AMG Funds
Trustees and Officers
The Trustees and Officers of the Trust, their business addresses, principal occupations for the past five years and dates of birth are listed below. The Trustees provide broad supervision over the affairs of the Trust and the Funds. The Trustees are experienced executives who meet periodically throughout the year to oversee the Funds’ activities, review contractual arrangements with
companies that provide services to the Funds, and review the Funds’ performance. Unless otherwise noted, the address of each Trustee or Officer is the address of the Trust: 600 Steamboat Road, Suite 300, Greenwich, Connecticut 06830.
There is no stated term of office for Trustees. Trustees serve until their resignation, retirement or removal in accordance with the Trust’s
organizational documents and policies adopted by the Board from time to time. The Chairman of the Trustees, President, Treasurer and Secretary of the Trust are elected by the Trustees annually. Other officers hold office at the pleasure of the Trustees.
Independent Trustees
The following Trustees are not “interested persons” of the Trust within the meaning of the 1940 Act:
| | |
Number of Funds
Overseen in Fund Complex | | Name, Date of Birth, Principal Occupation(s) During Past 5 Years and Other Directorships Held by Trustee |
• Trustee since 2012 | | Bruce B. Bingham, 12/1/48 |
• Oversees 45 Funds in Fund Complex | | Partner, Hamilton Partners (real estate development firm) (1987-Present); Trustee of Aston Funds (27 portfolios) (2014-Present); Director of The Yacktman Funds (2000-2012). |
| |
• Independent Chairman | | William E. Chapman, II, 9/23/41 |
• Trustee since 2000 • Oversees 45 Funds in Fund Complex | | President and Owner, Longboat Retirement Planning Solutions (1998-Present); Hewitt Associates, LLC (part time) (provider of Retirement and Investment Education Seminars) (2002-2009); Trustee Emeritus of Bowdoin College (2013-Present); Trustee of Bowdoin College (2002-2013); Director of Harding, Loevner Funds, Inc. (6 portfolios); Trustee of Third Avenue Trust (5 portfolios); Trustee of Third Avenue Variable Trust (1 portfolio); Trustee of Aston Funds (27 portfolios) (2010-Present). |
| |
| |
• Trustee since 2000 | | Edward J. Kaier, 9/23/45 |
• Oversees 45 Funds in Fund Complex | | Attorney at Law and Partner, Teeters Harvey Marrone & Kaier LLP (2007-Present); Attorney at Law and Partner, Hepburn Willcox Hamilton & Putnam, LLP (1977-2007); Trustee of Third Avenue Trust (5 portfolios); Trustee of Third Avenue Variable Trust (1 portfolio); Trustee of Aston Funds (27 portfolios) (2010-Present). |
| |
• Trustee since 2013 | | Kurt A. Keilhacker, 10/5/63 |
• Oversees 47 Funds in Fund Complex | | Managing Member, TechFund Capital (1997-Present); Managing Member, TechFund Europe (2000-Present); Trustee, Gordon College (2001-Present); Board Member, 6wind SA, (2002-Present); Managing Member, Elementum Ventures (2013-Present); Trustee of Aston Funds (27 portfolios) (2014-Present). |
| |
• Trustee since 2000 | | Steven J. Paggioli, 4/3/50 |
• Oversees 45 Funds in Fund Complex | | Independent Consultant (2002-Present); Formerly Executive Vice President and Director, The Wadsworth Group (1986-2001); Executive Vice President, Secretary and Director, Investment Company Administration, LLC (1990-2001); Vice President, Secretary and Director, First Fund Distributors, Inc. (1991-2001); Trustee, Professionally Managed Portfolios (43 portfolios); Advisory Board Member, Sustainable Growth Advisors, LP; Independent Director, Chase Investment Counsel (2008 – Present); Trustee of Aston Funds (27 portfolios) (2010-Present). |
| |
• Trustee since 2013 | | Richard F. Powers III, 2/2/46 |
• Oversees 45 Funds in Fund Complex | | Adjunct Professor, Boston College (2011-Present); Trustee of Aston Funds (27 portfolios) (2014-Present); President and CEO of Van Kampen Investments Inc. (1998-2003). |
| |
• Trustee since 2000 | | Eric Rakowski, 6/5/58 |
• Oversees 47 Funds in Fund Complex | | Professor, University of California at Berkeley School of Law (1990-Present); Director of Harding, Loevner Funds, Inc. (6 portfolios); Trustee of Third Avenue Trust (5 portfolios); Trustee of Third Avenue Variable Trust (1 portfolio); Trustee of Aston Funds (27 portfolios) (2010-Present). |
| |
• Trustee since 2013 | | Victoria L. Sassine, 8/11/65 |
• Oversees 47 Funds in Fund Complex | | Lecturer, Babson College (2007 – Present); Trustee of Aston Funds (27 portfolios) (2014-Present). |
| |
• Trustee since 2000 | | Thomas R. Schneeweis, 5/10/47 |
• Oversees 45 Funds in Fund Complex | | Professor Emeritus, University of Massachusetts (2013—Present); Partner, S Capital Management, LLC (2007-Present); President, TRS Associates (1982-Present); Director, CISDM at the University of Massachusetts, (1996-2013); President, Alternative Investment Analytics, LLC, (formerly Schneeweis Partners, LLC) (2001-2013); Professor of Finance, University of Massachusetts (1977-2013); Partner, White Bear Partners, LLC (2007-2010); Partner, Northampton Capital Management, LLC (2004-2010); Trustee of Aston Funds (27 portfolios) (2010-Present). |
47
AMG Funds
Trustees and Officers (continued)
Interested Trustees
Each Trustee in the following table is an “interested person” of the Trust within the meaning of the 1940 Act. Ms. Carsman is an interested person of the Trust within the meaning of the 1940 Act by virtue of her position with, and interest in securities of AMG.
| | |
Name, Date of Birth, Number
of Funds Overseen in Fund
Complex* | | Principal Occupation(s) During Past 5 Years and Other Directorships Held by Trustee |
| |
Christine C. Carsman, 4/2/52 • Trustee since 2011 • Oversees 47 Funds in Fund Complex | | Senior Vice President and Deputy General Counsel, Affiliated Managers Group, Inc. (2011-Present); Trustee of Aston Funds (27 portfolios) (2014-Present); Senior Vice President and Chief Regulatory Counsel, Affiliated Managers Group, Inc. (2007-2011); Vice President and Chief Regulatory Counsel, Affiliated Managers Group, Inc. (2004-2007); Secretary and Chief Legal Officer, AMG Funds, AMG Funds I, AMG Funds II and AMG Funds III (2004-2011); Senior Counsel, Vice President and Director of Operational Risk Management and Compliance, Wellington Management Company, LLP (1995-2004). |
| | |
Officers |
Position(s) Held with Fund and Length of Time Served | | Name, Date of Birth, Principal Occupation(s) During Past 5 Years |
• President since 2014 | | Jeffrey T. Cerutti, 2/7/68 |
• Principal Executive Officer since 2014 | | Chief Executive Officer, AMG Funds LLC (2014-Present); Director, President and Principal, AMG Distributors, Inc. (2014-Present); Chief Executive Officer and President, Aston Funds (2015-Present); President, VP Distributors, (2011-2014); Executive Vice President, Head of Distribution, Virtus Investment Partners, Inc. (2010-2014); Managing Director, Head of Sales, UBS Global Asset Management (2001-2010). |
| |
• Chief Operating Officer since 2007 | | Keitha L. Kinne, 5/16/58 Chief Operating Officer, AMG Funds LLC (2007-Present); Chief Investment Officer, AMG Funds LLC (2008-Present); Chief Operating Officer, AMG Distributors, Inc. (2007-Present); Managing Partner, AMG Funds LLC (2007-2014); President, AMG Funds (2012-2014); President, AMG Distributors, Inc. (2012-2014); Managing Director, Legg Mason & Co., LLC (2006-2007); Managing Director, Citigroup Asset Management (2004-2006). |
| |
• Secretary since 2015 | | Mark J. Duggan, 2/20/65 |
• Chief Legal Officer since 2015 | | Senior Vice President and Senior Counsel, AMG Funds LLC (2015-Present); Secretary and Chief Legal Officer, AMG Funds, AMG Funds I, AMG Funds II and AMG Funds III (2015-Present); Attorney, K&L Gates, LLP (2009-2015). |
| |
• Chief Financial Officer since 2007 | | Donald S. Rumery, 5/29/58 Senior Vice President, Director of Mutual Funds Services, AMG Funds LLC (2005-Present); Treasurer, AMG Funds III (1995-Present); Treasurer, AMG Funds |
• Treasurer since 1999 | | (1999-Present); Treasurer, AMG Funds I (2000-Present); Chief Financial Officer, AMG Funds, AMG Fund I, and AMG Funds III (2007-Present); Treasurer and Chief |
• Principal Financial Officer since 2008 | | Financial Officer, AMG Distributors, Inc. (2000-2012); Vice President, AMG Funds LLC, (1994-2004). |
| |
• Assistant Treasurer since 2014 | | John C. Ball, 01/09/76 Vice President, Assistant Treasurer, AMG Funds LLC (2014-Present); Vice President, State Street Corp. (2010-2014); Vice President, State Street International (Ireland) Limited (2007-2010). |
| |
• Chief Compliance Officer since 2010 | | John J. Ferencz, 3/09/62 Vice President, Chief Compliance Officer—AMG Family of Funds, AMG Funds LLC (2010-Present); Code of Ethics Reporting Officer and Sarbanes Oxley Code of Ethics Compliance Officer, AMG Funds, AMG Funds I, AMG Funds II and AMG Funds III (2010-Present); Senior Compliance Analyst, Mutual Funds and Regulatory, GE Asset Management Incorporated (2005-2010). |
| |
• Anti-Money Laundering Compliance Officer since 2014 | | Patrick J. Spellman, 03/15/74 Senior Vice President, Chief Compliance Officer, AMG Funds LLC (2011-Present); Chief Compliance Officer, AMG Distributors, Inc., (2010-Present); Compliance Manager, Legal and Compliance, Affiliated Managers Group, Inc. (2005-2011). |
48
Annual Renewal of Investment Management and Subadvisory Agreements
At an in-person meeting held on June 24-25, 2015, the Board of Trustees (the “Board” or the “Trustees”), and separately a majority of the Trustees who are not “interested persons” of the Trust (the “Independent Trustees”), approved each Investment Management Agreement and separately an amendment to each Investment Management Agreement, (collectively the “Investment Management Agreements”) in each case with AMG Funds LLC (the “Investment Manager”) for each of AMG FQ U.S. Equity Fund, AMG FQ Tax-Managed U.S. Equity Fund and AMG FQ Global Risk-Balanced Fund (each a “Fund”) and the Subadvisory Agreement with respect to each Fund. The Independent Trustees were separately represented by independent legal counsel in connection with their consideration of the approval of these agreements. In considering the Investment Management and Subadvisory Agreements, the Trustees reviewed a variety of materials relating to each Fund, the Investment Manager and the Subadvisor, including comparative performance, fee and expense information for an appropriate peer group of similar mutual funds for each Fund (each a “Peer Group”), performance information for the relevant benchmark index for each Fund (each a “Fund Benchmark”) and, with respect to the Subadvisor, comparative performance information for an appropriate peer group of managed accounts, and, as to all other matters, other information provided to them on a periodic basis throughout the year, as well as information provided in connection with the meetings of June 24-25, 2015, regarding the nature, extent and quality of services provided by the Investment Manager and the Subadvisor under their respective agreements. Prior to voting, the Independent Trustees: (a) reviewed the foregoing information with their independent legal counsel and with management; (b) received materials from their independent legal counsel discussing the legal standards applicable to their consideration of the Investment Management and Subadvisory
Agreements; and (c) met with their independent legal counsel in private sessions at which no representatives of management were present.
NATURE, EXTENT AND QUALITY OF SERVICES.
In considering the nature, extent and quality of the services provided by the Investment Manager, the Trustees reviewed information relating to the Investment Manager’s operations and personnel. Among other things, the Investment Manager provided financial information, biographical information on its supervisory and professional staff and descriptions of its organizational and management structure. The Trustees also took into account information provided periodically throughout the previous year by the Investment Manager in Board meetings relating to the performance of its duties with respect to the Funds and the Trustees’ knowledge of the Investment Manager’s management and the quality of the performance of the Investment Manager’s duties. In the course of their deliberations regarding the Investment Management Agreements, the Trustees evaluated, among other things: (a) the extent and quality of the Investment Manager’s oversight of the operation and management of the Funds; (b) the quality of the Investment Manager’s oversight of the performance by the Subadvisor of its portfolio management duties; (c) the Investment Manager’s ability to supervise the Funds’ other service providers; and (d) the Investment Manager’s compliance program. The Trustees also took into account that, in performing its functions under the Investment Management Agreements and supervising the Subadvisor, the Investment Manager: performs periodic detailed analysis and reviews of the performance by the Subadvisor of its obligations to each Fund, including without limitation, analysis and review of portfolio and other compliance matters and review of the Subadvisor’s investment performance in respect of each Fund; prepares and presents periodic reports to the Board regarding the investment performance of the Subadvisor and other information regarding the Subadvisor, at such times and in such forms as the Board may reasonably request; reviews and considers any changes in the personnel of the Subadvisor
responsible for performing the Subadvisor’s obligations and makes appropriate reports to the Board; reviews and considers any changes in the ownership or senior management of the Subadvisor and makes appropriate reports to the Board; performs periodic in-person or telephonic diligence meetings, including with respect to compliance matters, with representatives of the Subadvisor; assists the Board and management of the Trust in developing and reviewing information with respect to the initial approval of each Subadvisory Agreement and annual consideration of each Subadvisory Agreement thereafter; prepares recommendations with respect to the continued retention of the Subadvisor or the replacement of the Subadvisor, including at the request of the Board; identifies potential successors to or replacements of the Subadvisor or potential additional subadvisors, performs appropriate due diligence, and develops and presents to the Board a recommendation as to any such successor, replacement, or additional subadvisor, including at the request of the Board; designates and compensates from its own resources such personnel as the Investment Manager may consider necessary or appropriate to the performance of its services; and performs such other review and reporting functions as the Board shall reasonably request consistent with the Investment Management Agreements and applicable law. The Trustees noted the affiliation of the Subadvisor with the Investment Manager, noting any potential conflicts of interest. The Trustees also took into account the financial condition of the Investment Manager with respect to its ability to provide the services required under the Investment Management Agreements and the Investment Manager’s undertaking to maintain contractual expense limitations for the Funds. The Trustees also considered the Investment Manager’s risk management processes.
The Trustees also reviewed information relating to the Subadvisor’s financial condition, operations and personnel and the investment philosophy, strategies and techniques (its “Investment
49
Annual Renewal of Investment Management and Subadvisory Agreements (continued)
Strategy”) used in managing each Fund. Among other things, the Trustees reviewed biographical information on portfolio management and other professional staff, information regarding the Subadvisor’s organizational and management structure and the Subadvisor’s brokerage policies and practices. The Trustees considered specific information provided regarding the experience of the individuals at the Subadvisor with portfolio management responsibility for the Funds, including the information set forth in each Fund’s prospectus and statement of additional information. In the course of their deliberations, the Trustees evaluated, among other things: (a) the services rendered by the Subadvisor in the past; (b) the qualifications and experience of the Subadvisor’s personnel; and (c) the Subadvisor’s compliance program. The Trustees also took into account the financial condition of the Subadvisor with respect to its ability to provide the services required under each Subadvisory Agreement. The Trustees also considered the Subadvisor’s risk management processes.
PERFORMANCE.
As noted above, the Board considered each Fund’s net performance during relevant time periods as compared to the Fund’s Peer Group and Fund Benchmark and considered the Subadvisor’s performance as compared to an appropriate peer group of managed accounts and also considered the gross performance of the Fund as compared to the Subadvisor’s relevant performance composite that utilizes the same investment strategy and approach and noted that the Board reviews on a quarterly basis detailed information about each Fund’s performance results and portfolio composition, as well as the Subadvisor’s Investment Strategy. The Board noted the Investment Manager’s expertise and resources in monitoring the performance, investment style and risk-adjusted performance of the Subadvisor. The Board was mindful of the Investment Manager’s attention to monitoring the Subadvisor’s performance with respect to the Funds and its discussions with management regarding the factors that contributed to the performance of the Funds.
With respect to AMG FQ U.S. Equity Fund, among other information related to the Fund’s
performance, the Trustees noted that the Fund’s performance for Institutional Class shares (which share class has the earliest inception date and the largest assets of all the share classes of the Fund) for the 1-year, 3-year, 5-year and 10-year periods ended March 31, 2015 was below, below, above and above, respectively, the median performance of the Peer Group and below the performance of the Fund Benchmark, the Russell 3000® Index. The Trustees took into account management’s discussion of the Fund’s performance, including the reasons for the Fund’s underperformance for the relevant time periods. The Trustees concluded that the Fund’s performance is being addressed.
With respect to AMG FQ Tax-Managed U.S. Equity Fund, among other information related to the Fund’s performance, the Trustees noted that the Fund’s performance for Institutional Class shares (which share class has the earliest inception date and the largest assets of all the share classes of the Fund) for the 1-year, 3-year, 5-year and 10-year periods ended March 31, 2015 was above the median performance of the Peer Group and above the performance of the Fund Benchmark, the Russell 3000® Index. The Trustees also took into account management’s discussion of the Fund’s performance. The Trustees noted that the Fund ranked in the top decile relative to its Peer Group for the 3-year, 5-year and 10-year periods. The Trustees concluded that the Fund’s performance has been satisfactory.
With respect to AMG FQ Global Risk-Balanced Fund, among other information related to the Fund’s performance, the Trustees noted that the Fund’s performance for Institutional Class shares (which share class has the earliest inception date and the largest assets of all the share classes of the Fund) for the 1-year, 3-year, 5-year and 10-year periods ended March 31, 2015 was above, below, above and below, respectively, the median performance of the Peer Group and below the performance of the Fund Benchmark, a Composite Index (60% MSCI World Index and 40% Citigroup World Government Bond Index (Hedged)). The Trustees took into account management’s discussion of the Fund’s performance, including the Fund’s more recent improved performance.
The Trustees concluded that the Fund’s overall performance has been satisfactory in light of all factors considered.
ADVISORY AND SUBADVISORY FEES AND PROFITABILITY.
In considering the reasonableness of the advisory fee payable to the Investment Manager, the Trustees reviewed information provided by the Investment Manager setting forth all revenues and other benefits, both direct and indirect (including any so-called “fallout benefits” such as reputational value derived from the Investment Manager serving as Investment Manager to a Fund), received by the Investment Manager and its affiliates attributable to managing each Fund and all the mutual funds in the AMG Funds Family of Funds, the cost of providing such services and the resulting profitability to the Investment Manager and its affiliates from these relationships. The Trustees noted that the Investment Manager and the Subadvisor are affiliated and that, in the case of AMG FQ Tax-Managed U.S. Equity Fund and AMG FQ U.S. Equity Fund, the Investment Manager pays the Subadvisor a subadvisory fee that is equal to the advisory fee that it receives from the Fund. In the case of AMG FQ Global Risk-Balanced Fund, the Trustees also considered the amount of the advisory fee retained by the Investment Manager after payment of the subadvisory fee with respect to the Fund. The Trustees also noted any payments that were made from the Subadvisor to the Investment Manager. The Trustees also noted management’s discussion of the current asset levels of the Funds, and considered the impact on profitability of the current asset levels and any future growth of assets of the Funds.
In considering the cost of services to be provided by the Investment Manager under each Investment Management Agreement and the profitability to the Investment Manager of its relationship with the Funds, the Trustees noted the undertaking by the Investment Manager to maintain contractual expense limitations for the Funds. The Board also took into account management’s discussion of the current advisory fee structure, and, as noted above, the services the Investment Manager provides in performing its functions under each
Annual Renewal of Investment Management and Subadvisory Agreements (continued)
Investment Management Agreement and supervising the Subadvisor. Based on the foregoing, the Trustees concluded that the profitability to the Investment Manager is reasonable and that the Investment Manager is not realizing material benefits from economies of scale that would warrant adjustments to the advisory fee at this time. Also with respect to economies of scale, the Trustees noted that as a Fund’s assets increase over time, the Fund may realize other economies of scale to the extent the increase in assets is proportionally greater than the increase in certain other expenses.
In considering the reasonableness of the subadvisory fees payable by the Investment Manager to the Subadvisor, the Trustees reviewed information regarding the cost of providing subadvisory services to each of the Funds and the resulting profitability to the Subadvisor from these relationships and noted that, because the Subadvisor is an affiliate of the Investment Manager, a portion of such profitability or the Subadvisor’s revenues might be shared directly or indirectly with the Investment Manager. The Trustees also noted that the subadvisory fees are paid by the Investment Manager out of its advisory fee. The Board also took into account management’s discussion of the current subadvisory fee structure, and the services the Subadvisor provides in performing its functions under each Subadvisory Agreement. Based on the foregoing, the Trustees concluded that the profitability to the Subadvisor is reasonable and that the Subadvisor is not realizing material benefits from economies of scale that would warrant adjustments to the subadvisory fees at this time. Also with respect to economies of scale, the Trustees noted that as a Fund’s assets increase over time, the Fund may realize other economies of scale to the extent the increase in assets is proportionally greater than the increase in certain other expenses.
With respect to AMG FQ U.S. Equity Fund, the Trustees noted that the Fund’s advisory fees (which include both the advisory and administration fee) and total expenses (net of applicable expense waivers/reimbursements) as of March 31, 2015 were both lower than the average
for the Fund’s Peer Group. The Trustees took into account the fact that the Investment Manager has contractually agreed, through March 1, 2016, to limit the Fund’s net annual operating expenses (subject to certain excluded expenses) to 0.79%. The Trustees concluded that, in light of the nature, extent and quality of the services provided by the Investment Manager and the Subadvisor (which is an affiliate of the Investment Manager), the foregoing expense limitation and the considerations noted above with respect to the Investment Manager and the Subadvisor, the Fund’s advisory and subadvisory fees are reasonable.
With respect to AMG FQ Tax-Managed U.S. Equity Fund, the Trustees noted that the Fund’s advisory fee and total expenses (net of applicable expense waivers/reimbursements) as of March 31, 2015 were both higher than the average for the Fund’s Peer Group. The Trustees took into account the fact that the Investment Manager has contractually agreed to lower the Fund’s contractual expense limitation from 0.99% to 0.89% of the Fund’s net annual operating expenses (subject to certain excluded expenses) effective July 1, 2015 through at least March 1, 2017. The Board also took into account management’s discussion of the Fund’s expenses and the current size of the Fund. The Board also considered the differences in the Fund’s investment strategy relative to its Peer Group. The Trustees concluded that, in light of the nature, extent and quality of the services provided by the Investment Manager and the Subadvisor (which is an affiliate of the Investment Manager), the foregoing expense limitation and the considerations noted above with respect to the Investment Manager and the Subadvisor, the Fund’s advisory and subadvisory fees are reasonable.
With respect to AMG FQ Global Risk-Balanced Fund, the Trustees noted that the Fund’s advisory fees (which include both the advisory and administration fee) and total expenses (net of applicable expense waivers/reimbursements) as of March 31, 2015 were both lower than the average for the Fund’s Peer Group. The Trustees took into account the fact that the Investment Manager has contractually agreed, through March 1, 2016, to
limit the Fund’s net annual operating expenses (subject to certain excluded expenses) to 0.89%. The Trustees also noted that the Investment Manager reduced the Fund’s expense limitation in 2012. The Trustees concluded that, in light of the nature, extent and quality of the services provided by the Investment Manager and the Subadvisor (which is an affiliate of the Investment Manager), the foregoing expense limitation and the considerations noted above with respect to the Investment Manager and the Subadvisor, the Fund’s advisory and subadvisory fees are reasonable.
* * * *
After consideration of the foregoing, the Trustees also reached the following conclusions (in addition to the conclusions discussed above) regarding the Investment Management and Subadvisory Agreements: (a) the Investment Manager has demonstrated that it possesses the resources and capability to perform its duties under the Investment Management Agreements; (b) the Subadvisor has the resources to perform its duties under the Subadvisory Agreements and is qualified to manage each Fund’s assets in accordance with its investment objectives and policies; and (c) the Investment Manager and Subadvisor maintain appropriate compliance programs.
Based on all of the above-mentioned factors and their related conclusions, with no single factor or conclusion being determinative and with each Trustee not necessarily attributing the same weight to each factor, the Trustees concluded that approval of each Investment Management Agreement and each Subadvisory Agreement with respect to AMG FQ Global Risk-Balanced Fund, AMG FQ U.S. Equity Fund and AMG FQ Tax-Managed U.S. Equity Fund would be in the best interests of the applicable Fund and its shareholders. Accordingly, on June 24-25, 2015, the Trustees, and separately a majority of the Independent Trustees, voted to approve the Investment Management Agreement and the Subadvisory Agreement for each of AMG FQ Global Risk-Balanced Fund, AMG FQ U.S. Equity Fund and AMG FQ Tax-Managed U.S. Equity Fund.
51
THIS PAGE INTENTIONALLY LEFT BLANK
INVESTMENT MANAGER AND ADMINISTRATOR
AMG Funds LLC
600 Steamboat Road, Suite 300 Greenwich, CT 06830
(800) 835-3879
DISTRIBUTOR
AMG Distributors, Inc.
600 Steamboat Road, Suite 300 Greenwich, CT 06830
(800) 835-3879
SUBADVISOR
First Quadrant, L.P.
800 E. Colorado Boulevard, Suite 900 Pasadena, CA 91101
CUSTODIAN
The Bank of New York Mellon
2 Hanson Place
Brooklyn, NY 11217
LEGAL COUNSEL
Ropes & Gray LLP
Prudential Tower, 800 Boylston Street Boston, MA 02199-3600
TRANSFER AGENT
BNY Mellon Investment Servicing
(US) Inc.
Attn: AMG Funds
P.O. Box 9769
Providence, RI 02940
(800) 548-4539
FOR MANAGERSCHOICETM ONLY
AMG Funds
c/o BNY Mellon Investment Servicing (US) Inc.
P.O. Box 9847
Providence, Rhode Island 02940-8047
(800) 358-7668
This report is prepared for the Funds’ shareholders. It is authorized for distribution to prospective investors only when preceded or accompanied by an effective prospectus. To receive a free copy of the prospectus or Statement of Additional Information, which includes additional information about Fund Trustees, please contact us by calling 800.835.3879. Distributed by AMG Distributors, Inc., member FINRA/SIPC.
Current net asset values per share for each Fund are available on the Funds’ website at www.amgfunds.com
A description of the policies and procedures each Fund uses to vote its proxies is available: (i) without charge, upon request, by calling 800.835.3879, or (ii) on the Securities and Exchange Commission’s (SEC) website at www.sec.gov. For information regarding each Fund’s proxy voting record for the 12-month period ended June 30, call 800.835.3879 or visit the SEC website at www.sec.gov.
Each Fund files its complete schedule of portfolio holdings with the SEC for the first and third quarters of each fiscal year on Form N-Q. The Funds’ Forms N-Q are available on the SEC’s website at www.sec.gov. A Fund’s Forms N-Q may be reviewed and copied at the SEC’s Public Reference Room in Washington, DC. Information on the operation of the Public Reference Room may be obtained by calling 1-800-SEC-0330. To review a complete list of the Fund’s portfolio holdings, or to view the most recent quarterly holdings report, semiannual report, or annual report, please visit www.amgfunds.com.
www.amgfunds.com |
AFFILIATE SUBADVISED FUNDS
BALANCED FUNDS
AMG Chicago Equity Partners Balanced
Chicago Equity Partners, LLC
AMG FQ Global Risk-Balanced
First Quadrant, L.P.
EQUITY FUNDS
AMG Chicago Equity Partners Small Cap Value
Chicago Equity Partners, LLC
AMG FQ Tax-Managed U.S. Equity AMG FQ U.S. Equity
First Quadrant, L.P.
AMG Frontier Small Cap Growth
Frontier Capital Management Company, LLC
AMG GW&K Small Cap Core
AMG GW&K Small Cap Growth
GW&K Investment Management, LLC
AMG Renaissance International Equity
AMG Renaissance Large Cap Growth
The Renaissance Group LLC
AMG SouthernSun Small Cap
AMG SouthernSun U.S. Equity
SouthernSun Asset Management, LLC
AMG Systematic Large Cap Value AMG Systematic Mid Cap Value
Systematic Financial Management, L.P.
AMG TimesSquare All Cap Growth
AMG TimesSquare International Small Cap
AMG TimesSquare Mid Cap Growth
AMG TimesSquare Small Cap Growth
TimesSquare Capital Management, LLC
AMG Trilogy Emerging Markets Equity
AMG Trilogy Emerging Wealth Equity
AMG Trilogy Global Equity
AMG Trilogy International Small Cap
Trilogy Global Advisors, L.P.
AMG Yacktman
AMG Yacktman Focused
AMG Yacktman Special Opportunities
Yacktman Asset Management LP
FIXED INCOME FUNDS
AMG GW&K Core Bond
(formerly AMG Managers Total Return Bond)
AMG GW&K Enhanced Core Bond AMG GW&K Municipal Bond AMG GW&K Municipal Enhanced Yield
GW&K Investment Management, LLC
OPEN-ARCHITECTURE FUNDS
EQUITY FUNDS
AMG Managers Brandywine
AMG Managers Brandywine Advisors Mid Cap Growth
AMG Managers Brandywine Blue
Friess Associates, LLC
AMG Managers Cadence Capital Appreciation
AMG Managers Cadence Emerging Companies
AMG Managers Cadence Mid Cap
Cadence Capital Management, LLC
AMG Managers Emerging Opportunities
Lord, Abbett & Co. LLC
WEDGE Capital Management L.L.P.
Next Century Growth Investors LLC
RBC Global Asset Management (U.S.) Inc.
AMG Managers Essex Small/Micro Cap Growth
Essex Investment Management Co., LLC
AMG Managers Real Estate Securities
CenterSquare Investment Management, Inc.
AMG Managers Skyline Special Equities
Skyline Asset Management, L.P.
AMG Managers Special Equity
Ranger Investment Management, L.P. Lord, Abbett & Co. LLC
Smith Asset Management Group, L.P. Federated MDTA LLC
FIXED INCOME FUNDS
AMG Managers Bond
AMG Managers Global Income Opportunity
Loomis, Sayles & Co., L.P.
AMG Managers High Yield
J.P. Morgan Investment Management Inc.
AMG Managers Intermediate Duration Government
AMG Managers Short Duration Government
Amundi Smith Breeden LLC
| | |
 | | | www.amgfunds.com |
| | |
| | | ANNUAL REPORT |
AMG Funds
October 31, 2015
AMG GW&K Core Bond Fund
(formerly AMG Managers Total Return Bond Fund)
Investor Class: MBGVX | Service Class: MBDFX | Institutional Class: MBDLX
| | |
| www.amgfunds.com | | | AR021-1015 |
AMG GW&K Core Bond Fund
Annual Report—October 31, 2015
| | | | |
TABLE OF CONTENTS | | PAGE | |
LETTER TO SHAREHOLDERS | | | 2 | |
| |
ABOUT YOUR FUND’S EXPENSES | | | 3 | |
| |
PORTFOLIO MANAGER’S COMMENTS, FUND SNAPSHOTS, AND SCHEDULE OF PORTFOLIO INVESTMENTS | | | 4 | |
| |
NOTES TO SCHEDULE OF PORTFOLIO INVESTMENTS | | | 9 | |
| |
FINANCIAL STATEMENTS | | | | |
| |
Statement of Assets and Liabilities | | | 11 | |
Balance sheet, net asset value (NAV) per share computation and cumulative undistributed amounts | | | | |
| |
Statement of Operations | | | 12 | |
Detail of sources of income, expenses, and realized and unrealized gains (losses) during the fiscal year | | | | |
| |
Statements of Changes in Net Assets | | | 13 | |
Detail of changes in assets for the past two fiscal years | | | | |
| |
Financial Highlights | | | 14 | |
Historical net asset values per share, distributions, total returns, income and expense ratios, turnover ratios and net assets | | | | |
| |
Notes to Financial Statements | | | 16 | |
Accounting and distribution policies, details of agreements and transactions with Fund management and affiliates, and descriptions of certain investment risks | | | | |
| |
REPORT OF INDEPENDENT REGISTERED PUBLIC ACCOUNTING FIRM | | | 25 | |
| |
TRUSTEES AND OFFICERS | | | 26 | |
| |
ANNUAL RENEWAL OF INVESTMENT MANAGEMENT AND SUBADVISORY AGREEMENTS | | | 28 | |
Nothing contained herein is to be considered an offer, sale or solicitation of an offer to buy shares of any series of the AMG Funds family of mutual funds. Such offering is made only by prospectus, which includes details as to offering price and other material information.
| | |
| | | Letter to Shareholders |
DEAR SHAREHOLDER:
Overall, U.S. equity investors were rewarded with positive, albeit modest, returns despite increasing market volatility for the fiscal year ended October 31, 2015. The S&P 500 Index, a widely followed barometer of the U.S. equity market, returned 5.2% during the past twelve months. However, the U.S. equity market did experience its first correction in four years in August as investors worried about slowing China growth and the potential impact of a U.S. Federal Reserve (the Fed) rate hike on the slow recovery in the U.S. During the year, there was significant dispersion in performance across sectors with consumer discretionary stocks returning more than 21% while companies within the energy sector fell (19)%, driven in large part by the precipitous fall in oil prices. Meanwhile, international stocks fell during the prior year, returning (4.7)%, as measured by the MSCI ACWI ex USA (in U.S. Dollar terms). International investment returns in U.S. Dollar terms were negatively impacted by continued strengthening in the U.S. Dollar. Despite the more recent difficult performance for equities, it’s worth noting that the first quarter of 2015 marked the six-year anniversary of the equity bull market.
The Barclays U.S. Aggregate Bond Index, a broad U.S. bond market benchmark, returned 2.0% for the fiscal year ended October 31, 2015. Interest rates fell throughout much of 2014 and for periods throughout the past fiscal year, lending positive support to bond prices. Investors, however, enter the new fiscal year with a close watch on the strength of the underlying U.S. economy and its potential impact on the Fed’s zero-interest-rate policy (and its subsequent impact on bond prices).
Our foremost goal at AMG Funds is to provide investment solutions that help our shareholders successfully reach their long-term investment goals. By partnering with AMG’s affiliated investment boutiques, AMG Funds provides access to a distinctive array of actively-managed, return-oriented investment strategies. Additionally, we oversee and distribute a number of complementary open-architecture mutual funds subadvised by unaffiliated investment managers. We thank you for your continued confidence and investment in AMG Funds. You can rest assured that under all market conditions our team is focused on delivering excellent investment management services for your benefit.
Respectfully,
Jeffery Cerutti
President
AMG Funds
| | | | | | | | | | | | | | |
Average Annual Total Returns | | Periods ended October 31, 2015 | |
| | | | | 1 Year | | | 3 Years | | | 5 Years | |
Stocks: | | | | | | | | | | | | | | |
Large Caps | | (S&P 500 Index) | | | 5.20 | % | | | 16.20 | % | | | 14.33 | % |
Small Caps | | (Russell 2000® Index) | | | 0.34 | % | | | 13.90 | % | | | 12.06 | % |
International | | (MSCI All Country World Index ex USA Index) | | | (4.68 | )% | | | 4.69 | % | | | 2.60 | % |
Bonds: | | | | | | | | | | | | | | |
Investment Grade | | (Barclays U.S. Aggregate Bond Index) | | | 1.96 | % | | | 1.65 | % | | | 3.03 | % |
High Yield | | (Barclays U.S. Corporate High Yield Bond Index) | | | (1.94 | )% | | | 4.15 | % | | | 6.18 | % |
Tax-exempt | | (Barclays Municipal Bond Index) | | | 2.87 | % | | | 2.91 | % | | | 4.28 | % |
Treasury Bills | | (BofA Merrill Lynch 6-Month U.S. Treasury Bill) | | | 0.20 | % | | | 0.18 | % | | | 0.19 | % |
About Your Fund’s Expenses
As a shareholder of a Fund, you may incur two types of costs: (1) transaction costs, which may include sales charges (loads) on purchase payments; redemption fees; and exchange fees; and (2) ongoing costs, including management fees; distribution (12b-1) fees; and other Fund expenses. This example is intended to help you understand your ongoing costs (in dollars) of investing in the Fund and to compare these costs with the ongoing costs of investing in other mutual funds. The example is based on $1,000 invested at the beginning of the period and held for the entire period as indicated below.
ACTUAL EXPENSES
The first line of the following table provides information about the actual account values and actual expenses. You may use the information in this line, together with the amount you invested, to estimate the expenses that you paid over the period. Simply divide your account value by $1,000 (for example, an $8,600 account value divided by $1,000 = 8.6), then multiply the result by the number in the first line under the heading entitled “Expenses Paid During Period” to estimate the expenses you paid on your account during this period.
HYPOTHETICAL EXAMPLE FOR COMPARISON PURPOSES
The second line of the following table provides information about hypothetical account values and hypothetical expenses based on the Fund’s actual expense ratio and an assumed annual rate of return of 5% before expenses, which is not the Fund’s actual return. The hypothetical account values and expenses may not be used to estimate the actual ending account balance or expenses you paid for the period. You may use this information to compare the ongoing costs of investing in the Fund and other funds by comparing this 5% hypothetical example with the 5% hypothetical examples that appear in the shareholder reports of other funds.
Please note that the expenses shown in the table are meant to highlight your ongoing costs only and do not reflect any transactional costs, such as sales charges (loads), redemption fees, or exchange fees. Therefore, the second line of the table is useful in comparing ongoing costs only, and will not help you determine the relative total costs of owning different funds.
| | | | | | | | | | | | | | | | |
| Six Months Ended October 31, 2015 | | Expense
Ratio for
the Period | | | Beginning
Account Value
05/01/15 | | | Ending
Account Value
10/31/15 | | | Expenses
Paid During
the Period* | |
AMG GW&K Core Bond Fund | | | | | | | | | | | | | | | | |
Service Class** | | | | | | | | | | | | | | | | |
Based on Actual Fund Return | | | 0.55 | % | | $ | 1,000 | | | $ | 989 | | | $ | 2.76 | |
Hypothetical (5% return before expenses) | | | 0.55 | % | | $ | 1,000 | | | $ | 1,022 | | | $ | 2.80 | |
| * | Expenses are equal to the Fund’s annualized expense ratio multiplied by the average account value over the period, multiplied by the number of days in the period (184), then divided by 365. |
| ** | Investor and Institutional Classes launched on May 8, 2015. The Shares of the Fund prior to May 8, 2015 were renamed Service Class. |
| | | | | | | | | | | | | | | | |
| Period Ended October 31, 2015 | | Expense
Ratio for
the Period | | | Beginning
Account Value
05/11/15 | | | Ending
Account Value
10/31/15 | | | Expenses
Paid During
the Period*** | |
AMG GW&K Core Bond Fund | | | | | | | | | | | | | | | | |
Investor Class** | | | | | | | | | | | | | | | | |
Based on Actual Fund Return | | | 0.83 | % | | $ | 1,000 | | | $ | 992 | | | $ | 3.94 | |
Hypothetical (5% return before expenses) | | | 0.83 | % | | $ | 1,000 | | | $ | 1,020 | | | $ | 4.00 | |
Institutional Class** | | | | | | | | | | | | | | | | |
Based on Actual Fund Return | | | 0.48 | % | | $ | 1,000 | | | $ | 994 | | | $ | 2.28 | |
Hypothetical (5% return before expenses) | | | 0.48 | % | | $ | 1,000 | | | $ | 1,022 | | | $ | 2.31 | |
| ** | Investor and Institutional Classes launched on May 8, 2015. The Shares of the Fund prior to May 8, 2015, were renamed Service Class. |
| *** | Expenses are equal to the Fund’s annualized expense ratio multiplied by the average account value over the period, multiplied by the number of days in the period (174) then divided by 365. |
3
AMG GW&K Core Bond Fund
Portfolio Manager’s Comments (unaudited)
AMG GW&K Core Bond Fund seeks to maximize total return consistent with the preservation of capital by investing in debt securities such as corporate, mortgage-backed, international and government bonds. Normally, the Fund invests at least 80% of its net assets in these types of bonds.
THE YEAR IN REVIEW
For the 12 months ending October 31, 2015, the AMG GW&K Core Bond Fund (Service Class) (the Fund) returned 0.68% compared to the return of 1.96% for the Barclays U.S. Aggregate Bond Index.
On February 13, 2015, the Fund’s Board of Trustees appointed GW&K Investment Management, LLC (“GW&K”) as interim subadvisor for the Fund, replacing Pacific Investment Management Company LLC, pending shareholder approval of a new subadvisory agreement between GW&K and AMG Funds with respect to the Fund. Effective February 26, 2015, the Fund changed its name from AMG Managers Total Return Bond Fund to AMG GW&K Core Bond Fund. On May 4, 2015, shareholders approved the appointment of GW&K as subadvisor of the Fund. For more information on these changes, see the Fund’s prospectus.
Fixed-income markets were under significant pressure in the second quarter, but rather than signaling the start of a prolonged downturn, the selloff felt more like the typical downdraft of a volatile market. Rates rose amid a rout in European bond markets and broadly improved U.S. economic readings. However, this steady march higher in yields was off a low base and ultimately did little more than reverse the gains we saw in the first quarter. Investors remain cautious and the economy is still sensitive to the effects of higher borrowing costs, so fixed-income markets are likely to trade in a fairly narrow range in the second half and the severity of any further increases in rates is therefore likely to remain limited.
Investor sentiment turned decisively negative in the third quarter. Anxiety over deteriorating growth prospects in China, rapidly falling commodity prices and the possibility of the first rate hike in nine years led to an intense risk-off environment.
For fixed-income markets this was a double-edged sword: safe haven assets rallied while credit spreads widened to levels not seen since 2012. In the end, the U.S. Federal Reserve (the Fed) left interest rates unchanged, but caused a further selloff by offering surprisingly negative commentary that highlighted the downside risks from slowing global growth and low inflation. Corporate bonds bounced back in October as spreads narrowed, while Treasuries sold off as Fed language indicated a December base case for the first rate hike since 2006.
PERFORMANCE
Since GW&K began managing the Fund in February duration has been relatively in line with the benchmark, thus interest rates had no meaningful effect on relative performance during this period. Yield-curve positioning was beneficial to performance, however, as the Fund was underweight the very long end, which experienced the largest increase in rates. Additionally, the Fund’s overweight to the 5-to 7-year area of the curve was beneficial, as this part of the curve saw some of the smallest jumps in rates.
Our overweight corporate allocation detracted from performance, with BBB-rated debt a notable laggard. The underweight to U.S. Treasuries hurt returns, thus the corporate positioning at the expense of Treasuries was a net detractor. One of our better allocation decisions was an underweight to utilities, as this segment of the corporate market dropped the most. Within corporates, security selection subtracted from returns, with the industrial space as the largest detractor and financials as the largest contributor. We overweighted taxable municipal bonds, which underperformed the Index due to their longer duration. Our mortgage allocation was mostly neutral, but an overweight to higher coupon mortgages underperformed in a period when the sector beat the Index and lower coupons generated better returns. The Fund’s agency debenture holdings were neutral, as the underweight allocation to their benchmark-trailing performance was offset by negative security selection.
POSITIONING/OUTLOOK
The Fund is essentially neutral-weight with respect to duration. Our yield curve positioning reflects a
small underweight to the short and long ends, with more concentration in the 5-to-10-year part of the curve.
While we anticipate modest upward pressure on rates in advance of the first rate hike, we ultimately expect macroeconomic uncertainty and worries about global deflation to limit upside. We see the greatest value in intermediate maturities on both the Treasury and credit curves, given the attractive carry and roll for the interest rate risk being assumed.
We have turned more cautious on corporate bonds in recent months. While margins and interest coverage remain near peak levels, leverage has recently ticked up, new issue volumes are at record levels, and central bank policy remains highly uncertain. Market stress has been a fixture in the energy and commodity-related sectors, but as we approach the late innings of the credit cycle this stress may spill over into other areas of the market.
We upgraded the quality of the Fund over recent months and assumed a more defensive posture with respect to sector allocation, credit quality and exposure to commodity prices and global growth. We have decreased our allocation to corporates and increased our allocation to Treasuries. Within the corporate space we have reduced our exposure to BBB-rated bonds on the investment-grade side.
We remain neutral on mortgages, which offer only a modest spread premium but benefit from their low sensitivity to rising rates. Within mortgage-backed securities we see relative value in higher coupons, specified collateral and shorter paper. We expect the basis to remain in a narrow range over the next few months as we believe prepayments are not much of a concern at current rate levels and the dovish Fed outlook mitigates concerns surrounding an end to the central bank’s reinvestments any time soon.
This commentary reflects the viewpoints of the portfolio manager, GW&K Investment Management, LLC (formerly Gannett Welsh & Kotler, LLC) as of October 31, 2015 and is not intended as a forecast or guarantee of future results.
4
AMG GW&K Core Bond Fund
Portfolio Manager’s Comments (continued)
CUMULATIVE TOTAL RETURN PERFORMANCE
The Fund’s cumulative total return is based on the daily change in net asset value (NAV), and assumes that all dividends and distributions were reinvested. This graph compares a hypothetical $10,000 investment made in the AMG GW&K Core Bond Fund’s Service Class on October 31, 2005, to a $10,000 investment made in the Barclays U.S. Aggregate Bond Index® for the same time period. Performance for periods longer than one year is annualized. The graph and table do not reflect the deduction of taxes that a shareholder would pay on a Fund distribution or redemption of shares. The listed returns for the Fund are net of expenses and the returns for the index exclude expenses. Total returns would have been lower had certain expenses not been reduced.
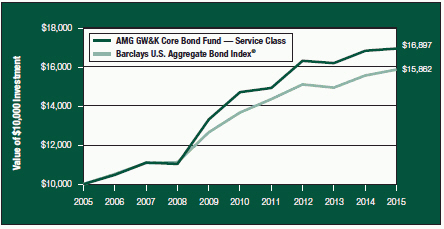
The table below shows the average annual total returns for the AMG GW&K Core Bond Fund and the Barclays U.S. Aggregate Bond Index® for the same time periods ended October 31, 2015.
| | | | | | | | | | | | | | | | | | | | |
| Average Annual Total Returns1 | | One
Year | | | Five
Years | | | Ten
Years | | | Since
Inception | | | Inception
Date | |
AMG GW&K Core Bond Fund2,3,4 | | | | | | | | | | | | | | | | | | | | |
Investor Class | | | — | | | | — | | | | — | | | | (0.76 | )% | | | 05/08/15 | |
Service Class | | | 0.68 | % | | | 2.82 | % | | | 5.39 | % | | | 6.26 | % | | | 04/30/93 | |
Institutional Class | | | — | | | | — | | | | — | | | | (0.58 | )% | | | 05/08/15 | |
Barclays U.S. Aggregate Bond Index®5 | | | 1.96 | % | | | 3.03 | % | | | 4.72 | % | | | 5.62 | % | | | 04/30/93 | † |
The performance data shown represents past performance. Past performance is not a guarantee of future results. Current performance may be lower or higher than the performance data quoted. The investment return and principal value of an investment in the Fund will fluctuate so that an investor’s shares, when redeemed, may be worth more or less than their original cost.
Investors should carefully consider the Fund’s investment objectives, risks, charges and expenses before investing. For performance information through the most recent month end, current net asset values per share for the Fund and other information, please call (800) 835-3879 or visit our website at www.amgfunds.com for a free prospectus. Read it carefully before investing or sending money.
Distributed by AMG Distributors, Inc., member FINRA/SIPC.
| † | Date reflects inception date of the Fund, not the index. |
| 1 | Total return equals income yield plus share price change and assumes reinvestment of all dividends and capital gain distributions. Returns are net of fees and may reflect offsets of Fund expenses as described in the prospectus. No adjustment has been made for taxes payable by shareholders on their reinvested dividends and capital gain distributions. Returns for periods greater than one year are annualized. The listed returns on the Fund are net of expenses and based on the published NAV as of October 31, 2015. All returns are in U.S.
dollars($). |
| 2 | From time to time, the Fund’s advisor has waived its fees and/or absorbed Fund expenses, which has resulted in higher returns. |
| 3 | Fixed-income funds are subject to the risks associated with investments in debt securities, such as default risk and fluctuations in the perception of the debtor’s ability to pay its creditors. Changing interest rates may adversely affect the value of a fixed income investment. An increase in interest rates typically causes the value of bonds and other fixed-income securities to fall. |
| 4 | To the extent that the Fund invests in asset-backed or mortgage-backed securities, its exposure to prepayment and extension risks may be greater than investments in other fixed-income securities. |
| 5 | The Barclays U.S. Aggregate Bond Index® is an index of the U.S. investment-grade fixed-rate bond market, including both government and corporate bonds. Unlike the Fund, the Barclays U.S. Aggregate Bond Index® is unmanaged, is not available for investment, and does not incur expenses. |
Not FDIC insured, nor bank guaranteed. May lose value.
5
AMG GW&K Core Bond Fund
Fund Snapshots (unaudited)
October 31, 2015
PORTFOLIO BREAKDOWN
| | | | | | | | |
Category | | AMG GW&K Core
Bond Fund** | | | Barclays U.S.
Aggregate
Bond Index® | |
U.S. Government and Agency Obligations | | | 44.1 | % | | | 39.1 | % |
Corporate Bonds and Notes | | | 37.6 | % | | | 24.2 | % |
Municipal Bonds | | | 3.3 | % | | | 0.0 | % |
Mortgage-Backed Securities | | | 0.0 | % | | | 30.4 | % |
Foreign Government and Agency Obligations | | | 0.0 | % | | | 5.7 | % |
Asset-Backed Securities | | | 0.0 | % | | | 0.6 | % |
Other Assets and Liabilities | | | 15.0 | % | | | 0.0 | % |
| ** | As a percentage of net assets. |
| | | | | | | | |
Rating | | AMG GW&K Core
Bond Fund*** | | | Barclays U.S.
Aggregate
Bond Index® | |
U.S. Government & Agency Obligations | | | 49.6 | % | | | 67.6 | % |
Aaa | | | 2.7 | % | | | 4.9 | % |
Aa | | | 6.2 | % | | | 3.5 | % |
A | | | 13.0 | % | | | 11.4 | % |
Baa | | | 28.5 | % | | | 12.6 | % |
| *** | As a percentage of market value of fixed-income securities. |
TOP TEN HOLDINGS
| | | | |
Security Name | | % of
Net Assets | |
U.S. Treasury Bonds, 6.250%, 08/15/23 | | | 6.5 | % |
U.S. Treasury Notes, 2.250%, 11/15/24 | | | 3.8 | |
FNMA, 4.500%, 06/01/41* | | | 2.2 | |
FNMA, 4.500%, 04/01/39* | | | 2.1 | |
FNMA, 5.500%, 08/01/37* | | | 2.1 | |
FHLMC Gold Pool, 3.500%, 11/01/25* | | | 2.1 | |
FNMA, 4.000%, 01/01/29* | | | 2.1 | |
FNMA, 5.500%, 07/01/40* | | | 2.1 | |
FNMA, 4.500%, 04/01/39* | | | 2.1 | |
FNMA, 5.000%, 02/01/34 | | | 2.1 | |
| | | | |
Top Ten as a Group | | | 27.2 | % |
| | | | |
| * | Top Ten Holdings as of April 30, 2015 |
Credit quality ratings shown above reflect the highest rating assigned by either Standard & Poor’s (“S&P”) or Moody’s Investors Service, Inc. (“Moody’s”). These rating agencies are independent, nationally recognized statistical rating organizations and are widely used. Investment grade ratings are credit ratings of BBB/Baa or higher. Below investment grade ratings are credit ratings of BB/Ba or lower. Investments designated N/R are not rated by either rating agency. Unrated investments do not necessarily indicate low credit quality. Credit quality ratings are subject to change.
Because a fund’s strategy may result in multiple investments in particular sectors of the economy, its performance may depend on the performance of those sectors and may fluctuate more widely than investments diversified across more sectors. For additional information on these and other risk considerations, please see the Fund’s prospectus.
Any sectors, industries, or securities discussed should not be perceived as investment recommendations. Mention of a specific security should not be considered a recommendation to buy or solicitation to sell that security. Specific securities mentioned in this report may have been sold from the Fund’s portfolio of investments by the time you receive this report.
6
AMG GW&K Core Bond Fund
Schedule of Portfolio Investments
October 31, 2015
| | | | | | | | |
| | | Principal Amount | | | Value | |
Corporate Bonds and Notes - 37.6% | | | | | | | | |
Financials - 11.4% | | | | | | | | |
Bank of America Corp., 5.625%, 07/01/20 | | $ | 5,607,000 | | | $ | 6,322,470 | |
General Electric Capital Corp., GMTN, 6.000%, 08/07/19 | | | 9,194,000 | | | | 10,548,938 | |
General Motors Financial Co., Inc., 4.250%, 05/15/23 | | | 5,225,000 | | | | 5,319,254 | |
The Goldman Sachs Group, Inc., 6.125%, 02/15/33 | | | 6,520,000 | | | | 7,848,776 | |
JPMorgan Chase & Co., Series 1, 7.900%, 04/29/491,2 | | | 7,274,000 | | | | 7,566,778 | |
Morgan Stanley, GMTN, 5.500%, 07/28/21 | | | 6,809,000 | | | | 7,712,956 | |
National Rural Utilities Cooperative Finance Corp., MTN, 3.250%, 11/01/25 | | | 5,778,000 | | | | 5,803,342 | |
US Bancorp, MTN, 2.950%, 07/15/22 | | | 7,090,000 | | | | 7,091,588 | |
Wells Fargo & Co., Series K, 7.980%, 03/29/491,2 | | | 7,081,000 | | | | 7,550,116 | |
Total Financials | | | | | | | 65,764,218 | |
Industrials - 26.2% | | | | | | | | |
AbbVie, Inc., 3.200%, 11/06/22 | | | 5,000,000 | | | | 4,957,950 | |
Actavis Funding SCS, 3.800%, 03/15/25 | | | 4,484,000 | | | | 4,452,047 | |
Automatic Data Processing, Inc., 3.375%, 09/15/25 | | | 7,439,000 | | | | 7,635,018 | |
BorgWarner, Inc., 3.375%, 03/15/25 | | | 10,800,000 | | | | 10,491,671 | |
Burlington Northern Santa Fe LLC, 6.150%, 05/01/37 | | | 4,159,000 | | | | 4,968,142 | |
Canadian Pacific Railway Co., 2.900%, 02/01/25 | | | 4,995,000 | | | | 4,776,609 | |
CF Industries, Inc., 7.125%, 05/01/20 | | | 7,988,000 | | | | 9,317,139 | |
Comcast Corp., 7.050%, 03/15/33 | | | 3,030,000 | | | | 3,973,094 | |
CVS Health Corp., 4.000%, 12/05/23 | | | 7,250,000 | | | | 7,673,356 | |
Ford Motor Co., 7.450%, 07/16/31 | | | 6,206,000 | | | | 7,985,608 | |
Georgia-Pacific LLC, 8.000%, 01/15/24 | | | 5,601,000 | | | | 7,189,528 | |
Host Hotels & Resorts, L.P., Series C, 4.750%, 03/01/23 | | | 4,964,000 | | | | 5,171,421 | |
International Paper Co., 3.800%, 01/15/26 | | | 5,250,000 | | | | 5,249,785 | |
Joy Global, Inc., 5.125%, 10/15/21 | | | 3,561,000 | | | | 3,185,400 | |
Microsoft Corp., Series, 2.650%, 11/03/22 | | | 11,482,000 | | | | 11,562,822 | |
Mohawk Industries, Inc., 3.850%, 02/01/23 | | | 6,255,000 | | | | 6,318,288 | |
Owens Corning, 4.200%, 12/15/22 | | | 5,038,000 | | | | 5,101,559 | |
Starwood Hotels & Resorts Worldwide, Inc., 4.500%, 10/01/34 | | | 3,810,000 | | | | 3,484,870 | |
Thermo Fisher Scientific, Inc., 4.150%, 02/01/24 | | | 4,525,000 | | | | 4,738,182 | |
Tyson Foods, Inc., 4.875%, 08/15/34 | | | 5,373,000 | | | | 5,503,118 | |
Verizon Communications, Inc., 5.150%, 09/15/23 | | | 7,199,000 | | | | 8,037,172 | |
Viacom, Inc., 6.875%, 04/30/36 | | | 4,850,000 | | | | 5,068,973 | |
Weyerhaeuser Co., 7.375%, 03/15/32 | | | 5,862,000 | | | | 7,339,083 | |
Xerox Corp., 2.750%, 09/01/20 | | | 7,214,000 | | | | 6,823,860 | |
Total Industrials | | | | | | | 151,004,695 | |
Total Corporate Bonds and Notes (cost $223,194,054) | | | | | | | 216,768,913 | |
The accompanying notes are an integral part of these financial statements.
7
AMG GW&K Core Bond Fund
Schedule of Portfolio Investments (continued)
| | | | | | | | |
| | | Principal Amount | | | Value | |
Municipal Bonds - 3.3% | | | | | | | | |
California State General Obligation, Build America Bonds, 7.550%, 04/01/39 | | $ | 4,465,000 | | | $ | 6,594,716 | |
Metropolitan Transportation Authority Revenue, Build America Bonds, 6.687%, 11/15/40 | | | 3,900,000 | | | | 5,104,281 | |
New Jersey Transportation Trust Fund Authority Revenue, Build America Bonds, Series C, 5.754%, 12/15/28 | | | 6,280,000 | | | | 6,532,016 | |
Ohio Jobs Beverage System Statewide Revenue Bonds, Taxable Series B, 4.532%, 01/01/35 | | | 1,065,000 | | | | 1,128,282 | |
Total Municipal Bonds (cost $19,800,284) | | | | | | | 19,359,295 | |
U.S. Government and Agency Obligations - 44.1% | | | | | | | | |
Federal Home Loan Mortgage Corporation - 7.4% | | | | | | | | |
FHLMC Gold Pool, | | | | | | | | |
3.500%, 11/01/25 | | | 11,420,360 | | | | 12,144,003 | |
4.000%, 05/01/26 | | | 459,024 | | | | 489,591 | |
5.000%, 06/01/41 to 07/01/44 | | | 20,594,810 | | | | 22,839,089 | |
6.000%, 12/01/39 | | | 6,269,510 | | | | 7,127,924 | |
Total Federal Home Loan Mortgage Corporation | | | | | | | 42,600,607 | |
Federal National Mortgage Association - 21.3% | | | | | | | | |
FNMA, | | | | | | | | |
3.500%, 07/01/28 | | | 6,186,788 | | | | 6,584,884 | |
4.000%, 01/01/29 | | | 11,436,884 | | | | 12,119,243 | |
4.500%, 04/01/39 to 06/01/41 | | | 38,905,820 | | | | 42,742,200 | |
5.000%, 02/01/34 to 08/01/40 | | | 23,116,106 | | | | 25,577,614 | |
5.500%, 08/01/37 to 10/01/41 | | | 32,014,574 | | | | 36,133,419 | |
Total Federal National Mortgage Association | | | | | | | 123,157,360 | |
U.S. Government Obligations - 15.4% | | | | | | | | |
U.S. Treasury Bonds, | | | | | | | | |
3.500%, 02/15/39 | | | 4,101,000 | | | | 4,605,296 | |
4.500%, 02/15/36 | | | 2,900,000 | | | | 3,770,812 | |
6.250%, 08/15/23 to 05/15/30 | | | 35,472,000 | | | | 47,578,552 | |
U.S. Treasury Notes, | | | | | | | | |
2.125%, 09/30/21 | | | 10,600,000 | | | | 10,825,663 | |
2.250%, 11/15/24 | | | 21,850,000 | | | | 22,088,842 | |
Total U.S. Government Obligations | | | | | | | 88,869,165 | |
Total U.S. Government and Agency Obligations (cost $255,062,701) | | | | | | | 254,627,132 | |
| | |
| | | Shares | | | | |
Other Investment Companies - 2.8%3 | | | | | | | | |
Dreyfus Institutional Cash Advantage Fund, Institutional Class Shares, 0.09% (cost $15,956,621) | | | 15,956,621 | | | | 15,956,621 | |
Total Investments - 87.8% (cost $514,013,660) | | | | | | | 506,711,961 | |
Other Assets, less Liabilities - 12.2% | | | | | | | 70,412,875 | |
Net Assets - 100.0% | | | | | | $ | 577,124,836 | |
The accompanying notes are an integral part of these financial statements.
8
Notes to Schedule of Portfolio Investments
The following footnotes should be read in conjunction with the Schedule of Portfolio Investments previously presented in this report.
Based on the approximate cost of investments of $514,470,265 for federal income tax purposes at October 31, 2015, the aggregate gross unrealized appreciation and depreciation were $1,331,931 and $9,090,235, respectively, resulting in net unrealized depreciation of investments of $7,758,304.
| 1 | Variable Rate Security. The rate listed is as of October 31, 2015, and is periodically reset subject to terms and conditions set forth in the debenture. |
| 2 | Perpetuity Bond. The date shown is the final call date. |
| 3 | Yield shown represents the October 31, 2015, seven-day average yield, which refers to the sum of the previous seven days’ dividends paid, expressed as an annual percentage. |
INVESTMENTS DEFINITIONS AND ABBREVIATIONS:
| | |
| FHLMC: | | Federal Home Loan Mortgage Corporation |
| FNMA: | | Federal National Mortgage Association |
| GMTN: | | Global Medium-Term Note |
| MTN: | | Medium-Term Note |
The following table summarizes the inputs used to value the Fund’s investments by the fair value hierarchy levels as of October 31, 2015: (See Note 1(a) in the Notes to the Financial Statements.)
| | | | | | | | | | | | | | | | |
| | | Quoted Prices in Active Markets
for Identical
Investments Level 1 | | | Significant Other
Observable Inputs
Level 2 | | | Significant Unobservable
Inputs Level 3 | | | Total | |
AMG GW&K Core Bond Fund | | | | | | | | | | | | | | | | |
Investments in Securities | | | | | | | | | | | | | | | | |
Corporate Bonds and Notes† | | | — | | | $ | 216,768,913 | | | | — | | | $ | 216,768,913 | |
Municipal Bonds | | | — | | | | 19,359,295 | | | | — | | | | 19,359,295 | |
U.S. Government and Agency Obligations† | | | — | | | | 254,627,132 | | | | — | | | | 254,627,132 | |
Other Investment Companies | | $ | 15,956,621 | | | | — | | | | — | | | | 15,956,621 | |
| | | | | | | | | | | | | | | | |
Total Investments in Securities | | $ | 15,956,621 | | | $ | 490,755,340 | | | | — | | | $ | 506,711,961 | |
| | | | | | | | | | | | | | | | |
| † | All corporate bonds and notes and U.S. government and agency obligations held in the Fund are level 2 securities. For a detailed breakout of the corporate bonds and notes and U.S. government and agency obligations by major industry or agency classification, please refer to the Schedule of Portfolio Investments. |
As of October 31, 2015, the Fund had no transfers between levels from the beginning of the reporting period.
The accompanying notes are an integral part of these financial statements.
9
Notes to Schedule of Portfolio Investments (continued)
For the fiscal year ended October 31, 2015, the effect of derivative instruments on the Statement of Operations and the amount of realized gain (loss) and unrealized gain (loss) on derivatives recognized in income were as follows:
| | | | | | | | | | | | |
| | | Realized Gain (Loss) | | | Change in Unrealized Gain (Loss) | |
Derivatives not accounted for as
hedging instruments | | Statement of Operations Location | | Realized
Gain/(Loss) | | | Statement of Operations Location | | Change In
Unrealized
Gain/(Loss) | |
Credit contracts | | Net realized gain on written option contracts | | $ | 44,763 | | | Net change in unrealized appreciation (depreciation) of written option contracts | | $ | (17,424 | ) |
Credit contracts | | Net realized loss on swap contracts | | | (582,391 | ) | | Net change in unrealized appreciation (depreciation) of swap contracts | | | (1,317,132 | ) |
Interest rate contracts | | Net realized gain on futures contracts | | | 9,470,412 | | | Net change in unrealized appreciation (depreciation) of futures contracts | | | (1,231,752 | ) |
Interest rate contracts | | Net realized loss on purchased options | | | (176,133 | ) | | Net change in unrealized appreciation (depreciation) of purchased options | | | — | |
Interest rate contracts | | Net realized gain on written option contracts | | | 1,915,571 | | | Net change in unrealized appreciation (depreciation) of written option contracts | | | (352,873 | ) |
Interest rate contracts | | Net realized loss on swap contracts | | | (6,749,570 | ) | | Net change in unrealized appreciation (depreciation) of swap contracts | | | 2,412,294 | |
Foreign exchange contracts | | Net realized gain on foreign currency transactions | | | 29,717,059 | | | Net change in unrealized appreciation (depreciation) of foreign currency translations | | | (13,469,416 | ) |
Foreign exchange contracts | | Net realized gain on written option contracts | | | 502,072 | | | Net change in unrealized appreciation (depreciation) of written option contracts | | | 8,884 | |
| | | | | | | | | | | | |
| | Totals | | $ | 34,141,783 | | | | | $ | (13,967,419 | ) |
| | | | | | | | | | | | |
Net realized gain (loss) on options purchased/written and net change in unrealized appreciation (depreciation) on options purchased are included in the net realized gain (loss) on investments on the Statement of Operations.
Transactions in written put and call options and swaptions for the fiscal year ended October 31, 2015, were as follows: (See Note 10 in the Notes to the Financial Statements.)
| | | | | | | | | | | | |
| | | Number of
Contracts | | | Notional
Amount | | | Amount of
Premiums | |
Options and swaptions outstanding at October 31, 2014 | | | 384 | | | $ | 398,300,000 | | | $ | 1,974,733 | |
Options and swaptions written | | | 1,571 | | | | 212,600,000 | | | | 1,664,314 | |
Options and swaptions exercised/expired/closed | | | (1,955 | ) | | | (610,900,000 | ) | | | (3,639,047 | ) |
| | | | | | | | | | | | |
Options and swaptions outstanding at October 31, 2015 | | | 0 | | | $ | 0 | | | $ | 0 | |
| | | | | | | | | | | | |
The accompanying notes are an integral part of these financial statements.
10
Statement of Assets and Liabilities
October 31, 2015
| | | | |
Assets: | | | | |
Investments at value* | | $ | 506,711,961 | |
Receivable for investments sold | | | 81,365,976 | |
Dividends, interest and other receivables | | | 4,100,492 | |
Receivable from affiliate | | | 75,808 | |
Receivable for Fund shares sold | | | 67,051 | |
Prepaid expenses | | | 11,194 | |
Total assets | | | 592,332,482 | |
Liabilities: | | | | |
Payable for investments purchased | | | 14,176,166 | |
Payable for Fund shares repurchased | | | 645,251 | |
Accrued expenses: | | | | |
Investment advisory and management fees | | | 148,674 | |
Administrative fees | | | 99,116 | |
Shareholder servicing fees - Service Class | | | 7,349 | |
Shareholder servicing fees - Investor Class | | | 16 | |
Distribution fees - Investor Class | | | 26 | |
Trustee fees and expenses | | | 3,659 | |
Other | | | 127,389 | |
Total liabilities | | | 15,207,646 | |
Net Assets | | $ | 577,124,836 | |
Net Assets Represent: | | | | |
Paid-in capital | | $ | 573,423,569 | |
Accumulated net realized gain from investments, options, futures contracts, swaps and foreign currency transactions | | | 11,002,966 | |
Net unrealized depreciation of investments | | | (7,301,699 | ) |
Net Assets | | $ | 577,124,836 | |
Investor Class: | | | | |
Net Assets | | $ | 124,253 | |
Shares outstanding | | | 12,146 | |
Net asset value, offering and redemption price per share | | $ | 10.23 | |
Service Class: | | | | |
Net Assets | | $ | 572,110,063 | |
Shares outstanding | | | 55,889,049 | |
Net asset value, offering and redemption price per share | | $ | 10.24 | |
Institutional Class: | | | | |
Net Assets | | $ | 4,890,520 | |
Shares outstanding | | | 478,015 | |
Net asset value, offering and redemption price per share | | $ | 10.23 | |
| |
* Investments at cost | | $ | 514,013,660 | |
The accompanying notes are an integral part of these financial statements.
11
Statement of Operations
For the fiscal year ended October 31, 2015
| | | | |
Investment Income: | | | | |
Interest income | | $ | 15,406,320 | |
Dividend income | | | 33,688 | |
Securities lending income | | | 5,819 | |
Total investment income | | | 15,445,827 | |
Expenses: | | | | |
Investment advisory and management fees | | | 2,298,793 | |
Administrative fees | | | 1,364,213 | |
Shareholder servicing fees - Service Class | | | 303,636 | |
Shareholder servicing fees - Investor Class | | | 83 | |
Distribution fees - Investor Class | | | 138 | |
Custodian fees | | | 134,273 | |
Transfer agent fees | | | 120,295 | |
Professional fees | | | 115,385 | |
Reports to shareholders | | | 103,181 | |
Registration fees | | | 68,281 | |
Trustees fees and expenses | | | 38,491 | |
Miscellaneous | | | 20,281 | |
Total expenses before offsets | | | 4,567,050 | |
Expense reimbursements | | | (729,874 | ) |
Net expenses | | | 3,837,176 | |
Net investment income | | | 11,608,651 | |
Net Realized and Unrealized Gain (Loss): | | | | |
Net realized loss on investments | | | (2,865,759 | ) |
Net realized gain on futures contracts | | | 9,470,412 | |
Net realized gain on foreign currency transactions | | | 27,932,905 | |
Net realized gain on written options | | | 2,462,406 | |
Net realized loss on swap transactions | | | (7,331,961 | ) |
Net change in unrealized appreciation (depreciation) of investments | | | (21,597,595 | ) |
Net change in unrealized appreciation (depreciation) of futures contracts | | | (1,231,752 | ) |
Net change in unrealized appreciation (depreciation) on foreign currency translations | | | (13,443,768 | ) |
Net change in unrealized appreciation (depreciation) on written options | | | (361,413 | ) |
Net change in unrealized appreciation (depreciation) on swap transactions | | | 1,095,162 | |
Net realized and unrealized loss | | | (5,871,363 | ) |
Net increase in net assets resulting from operations | | $ | 5,737,288 | |
The accompanying notes are an integral part of these financial statements.
12
Statements of Changes in Net Assets
For the fiscal years ended October 31,
| | | | | | | | |
| | | 2015 | | | 2014 | |
Increase (Decrease) in Net Assets Resulting From Operations: | | | | | | | | |
Net investment income | | $ | 11,608,651 | | | $ | 17,328,095 | |
Net realized gain on investments, futures contracts, foreign currency transactions, written options and swap transactions | | | 29,668,003 | | | | 24,551,416 | |
Net change in unrealized appreciation (depreciation) of investments, futures contracts, foreign currency translations, written options and swap transactions | | | (35,539,366 | ) | | | 683,288 | |
Net increase in net assets resulting from operations | | | 5,737,288 | | | | 42,562,799 | |
Distributions to Shareholders: | | | | | | | | |
From net investment income: | | | | | | | | |
Investor Class | | | (915 | ) | | | — | |
Service Class | | | (23,460,521 | ) | | | (16,020,069 | ) |
Institutional Class | | | (45,135 | ) | | | — | |
From net realized gain on investments: | | | | | | | | |
Investor Class | | | — | | | | — | |
Service Class | | | (24,637,228 | ) | | | — | |
Institutional Class | | | — | | | | — | |
Total distributions to shareholders | | | (48,143,799 | ) | | | (16,020,069 | ) |
Capital Share Transactions:1 | | | | | | | | |
Net decrease from capital share transactions | | | (323,424,795 | ) | | | (327,097,024 | ) |
Total decrease in net assets | | | (365,831,306 | ) | | | (300,554,294 | ) |
Net Assets: | | | | | | | | |
Beginning of year | | | 942,956,142 | | | | 1,243,510,436 | |
End of year | | $ | 577,124,836 | | | $ | 942,956,142 | |
End of year accumulated net investment loss | | | — | | | $ | (986,160 | ) |
| | | | | | | | |
| 1 | See Note 1(g) of the Notes to Financial Statements. |
The accompanying notes are an integral part of these financial statements.
13
AMG GW&K Core Bond Fund
Financial Highlights
For a share outstanding throughout each period
| | | | |
| Investor Class | | For the period ended
October 31, 2015* | |
Net Asset Value, Beginning of Period | | $ | 10.39 | |
Income from Investment Operations: | | | | |
Net investment income1,2 | | | 0.08 | |
Net realized and unrealized loss on investments | | | (0.16 | ) |
Total loss from investment operations | | | (0.08 | ) |
Less Distributions to Shareholders from: | | | | |
Net investment income | | | (0.08 | ) |
Net Asset Value, End of Period | | $ | 10.23 | |
Total Return1 | | | (0.76 | )%6 |
Ratio of net expenses to average net assets (with offsets/reductions) | | | 0.88 | %7 |
Ratio of expenses to average net assets (with offsets) | | | 0.88 | %7 |
Ratio of total expenses to average net assets (without offsets/reductions)3 | | | 0.99 | %7 |
Ratio of net investment income to average net assets1 | | | 1.67 | %7 |
Portfolio turnover | | | 175 | %6 |
Net assets at end of period (000’s omitted) | | $ | 124 | |
| | | | |
| | | | | | | | | | | | | | | | | | | | |
| | | For the fiscal years ended October 31, | |
| Service Class | | 2015 | | | 2014 | | | 2013 | | | 2012 | | | 2011 | |
Net Asset Value, Beginning of Year | | $ | 10.87 | | | $ | 10.63 | | | $ | 11.14 | | | $ | 10.53 | | | $ | 11.24 | |
Net investment income1 | | | 0.18 | 2 | | | 0.16 | 2 | | | 0.16 | 2 | | | 0.24 | 2 | | | 0.38 | |
Net realized and unrealized gain (loss) on investments | | | (0.11 | ) | | | 0.22 | | | | (0.24 | ) | | | 0.72 | | | | (0.25 | ) |
Total income (loss) from investment operations | | | 0.07 | | | | 0.38 | | | | (0.08 | ) | | | 0.96 | | | | 0.13 | |
Less Distributions to Shareholders from: | | | | | | | | | | | | | | | | | | | | |
Net investment income | | | (0.35 | ) | | | (0.14 | ) | | | (0.26 | ) | | | (0.35 | ) | | | (0.35 | ) |
Net realized gain on investments | | | (0.35 | ) | | | — | | | | (0.15 | ) | | | — | | | | (0.49 | ) |
Return of capital | | | — | | | | — | | | | (0.02 | ) | | | — | | | | — | |
Total distributions to shareholders | | | (0.70 | ) | | | (0.14 | ) | | | (0.43 | ) | | | (0.35 | ) | | | (0.84 | ) |
Net Asset Value, End of Year | | $ | 10.24 | | | $ | 10.87 | | | $ | 10.63 | | | $ | 11.14 | | | $ | 10.53 | |
Total Return1 | | | 0.68 | % | | | 3.64 | % | | | (0.72 | )% | | | 9.31 | % | | | 1.45 | % |
Ratio of net expenses to average net assets (with offsets and reductions) | | | 0.56 | % | | | 0.58 | % | | | 0.61 | %4 | | | 0.58 | % | | | 0.58 | % |
Ratio of expenses to average net assets (with offsets) | | | 0.56 | % | | | 0.58 | % | | | 0.61 | %4 | | | 0.58 | % | | | 0.58 | % |
Ratio of total expenses to average net assets (without offsets and reductions)3 | | | 0.67 | % | | | 0.67 | % | | | 0.70 | %4 | | | 0.70 | % | | | 0.71 | % |
Ratio of net investment income to average net assets1 | | | 1.70 | % | | | 1.46 | % | | | 1.45 | %4 | | | 2.22 | % | | | 2.54 | % |
Portfolio turnover | | | 175 | % | | | 177 | % | | | 255 | % | | | 375 | % | | | 495 | %5 |
Net assets at end of year (000’s omitted) | | $ | 572,110 | | | $ | 942,956 | | | $ | 1,243,510 | | | $ | 1,446,671 | | | $ | 1,239,141 | |
| | | | | | | | | | | | | | | | | | | | |
14
AMG GW&K Core Bond Fund
Financial Highlights
For a share outstanding throughout each period
| | | | |
| Institutional Class | | For the period ended
October 31, 2015* | |
Net Asset Value, Beginning of Period | | $ | 10.39 | |
Income from Investment Operations: | | | | |
Net investment income1,2 | | | 0.10 | |
Net realized and unrealized loss on investments | | | (0.16 | ) |
Total loss from investment operations | | | (0.06 | ) |
Less Distributions to Shareholders from: | | | | |
Net investment income | | | (0.10 | ) |
Net Asset Value, End of Period | | $ | 10.23 | |
Total Return1 | | | (0.58 | )%6 |
Ratio of net expenses to average net assets (with offsets/reductions) | | | 0.48 | %7 |
Ratio of expenses to average net assets (with offsets) | | | 0.48 | %7 |
Ratio of total expenses to average net assets (without offsets/reductions)3 | | | 0.59 | %7 |
Ratio of net investment income to average net assets1 | | | 2.05 | %7 |
Portfolio turnover | | | 175 | %6 |
Net assets at end of period (000’s omitted) | | $ | 4,891 | |
| | | | |
Notes to Financial Highlights
| * | Commencement of operations was May 8, 2015. |
| 1 | Total returns and net investment income would have been lower had certain expenses not been offset. |
| 2 | Per share numbers have been calculated using average shares. |
| 3 | Excludes the impact of expense reimbursements or fee waivers and expense reductions such as brokerage credits, but includes non-reimbursable expense, if any, such as interest, taxes and extraordinary expenses. (See Notes 1(c) and 2, in the Notes to Financial Statements.) |
| 4 | Includes non-routine extraordinary expenses amounting to 0.025% of average net assets. |
| 5 | Turnover ratio includes TBA dollar roll transactions. Had the TBA transactions been excluded, the turnover ratio for the fiscal year ended 2011 would have been 411%. |
15
Notes to Financial Statements
October 31, 2015
1. SUMMARY OF SIGNIFICANT ACCOUNTING POLICIES
AMG Funds I (the “Trust”) is an open-end management investment company, organized as a Massachusetts business trust, and registered under the Investment Company Act of 1940, as amended (the “1940 Act”). Currently, the Trust consists of a number of different funds, each having distinct investment management objectives, strategies, risks, and policies. Included in this report is the AMG GW&K Core Bond Fund (the “Fund”) (formerly AMG Managers Total Return Bond Fund).
Effective February 28, 2015, the Trust’s Board of Trustees approved the appointment of GW&K Investment Management, LLC (formerly Gannett Welsh & Kotler, LLC) (“GWK”) as the subadvisor to the Fund replacing Pacific Investment Management Company LLC. In conjunction with the Fund’s change in investment strategy and change in subadvisor, the Fund sold all open positions, including unwinding over-the-counter derivative positions, held as of February 28, 2015. Subsequently, the Fund purchased new investments within the Fund’s, and new subadvisor’s investment strategy.
Effective May 8, 2015, the Fund began offering three classes of shares: Investor Class, Service Class and Institutional Class. Each class represents an interest in the same assets of the Fund. Although all share classes generally have identical voting rights, each share class votes separately when required by law. Different share classes may pay different distribution amounts to the extent the net asset value per share and/or the expenses of such share classes differ. Each share class has its own expense structure. Shares of the Fund as of May 7, 2015, were designated as Service Class shares. Please refer to a current prospectus for additional information on each share class.
The Fund’s financial statements are prepared in accordance with accounting principles generally accepted in the United States of America (“U.S. GAAP”), which require management to make estimates and assumptions that affect the reported amounts of assets and liabilities and disclosure of contingent assets and liabilities at the date of the financial statements and the reported amounts of income and expenses during the reporting period. Actual results could differ from those estimates and such differences may be material. The following is a summary of significant accounting policies followed by the Fund in the preparation of its financial statements:
a. VALUATION OF INVESTMENTS
Equity securities traded on a national securities exchange or reported on the NASDAQ national market system (“NMS”) are valued at the last quoted sales price on the primary exchange or, if applicable, the NASDAQ official closing price or the official closing price of the relevant exchange or, lacking any sales, at the last quoted bid price or the mean between the last quoted bid and ask prices (the “exchange mean price”). Equity securities traded in the over-the-counter market (other than NMS securities) are valued at the exchange mean price. Foreign equity securities (securities principally traded in markets other than U.S. markets) are valued at the official closing price on the primary exchange or, for markets that either do not offer an official closing price or where the official closing price may not be representative of the overall market, the last quoted sale price.
Fixed income securities purchased with a remaining maturity exceeding 60 days are valued at the evaluated bid price or the mean price provided by an
authorized pricing service or, if an evaluated price is not available, by reference to other securities which are considered comparable in credit rating, interest rate, due date and other features (generally referred to as “matrix pricing”) or other similar pricing methodologies. Investments in certain mortgage-backed and stripped mortgage-backed securities, preferred stocks, convertible securities, derivatives and other debt securities not traded on an organized securities market are valued on the basis of valuations provided by dealers or by a pricing service which uses information with respect to transactions in such securities and various relationships between such securities and yield to maturity in determining value.
Fixed income securities purchased with a remaining maturity of 60 days or less are valued at amortized cost, provided that the amortized cost value is approximately the same as the fair value of the security valued without the use of amortized cost. Investments in other open-end regulated investment companies are valued at their end of day net asset value per share.
Futures contracts for which market quotations are readily available are valued at the settlement price as of the close of the futures exchange.
The Fund’s portfolio investments are generally valued based on independent market quotations or prices or, if none, “evaluative” or other market based valuations provided by third-party pricing services approved by the Board of Trustees of the Trust (the “Board”). Under certain circumstances, the value of certain Fund portfolio investments (including derivatives) may be based on an evaluation of fair value, pursuant to procedures established by and under the general supervision of the Board. The Valuation Committee, which is comprised of the Independent Trustees of the Board, and the Pricing Committee, which is comprised of representatives from AMG Funds LLC (the “Investment Manager”) are the committees appointed by the Board to make fair value determinations. The Fund may use the fair value of a portfolio investment to calculate its net asset value (“NAV”) in the event that the market quotation, price or market based valuation for the portfolio investment is not readily available or otherwise not determinable pursuant to the Board’s valuation procedures, if the Investment Manager for the Pricing Committee believes the quotation, price or market based valuation to be unreliable, or in certain other circumstances. When determining the fair value of an investment, the Pricing Committee and, if required under the Trust’s securities valuation procedures, the Valuation Committee, seeks to determine the price that the Fund might reasonably expect to receive from current sale of that portfolio investment in an arms-length transaction. Fair value determinations shall be based upon consideration of all available facts and information, including, but not limited to (i) attributes specific to the investment; (ii) fundamental and analytical data relating to the investment; and (iii) the value of other comparable securities or relevant financial instruments, including derivative securities, traded on other markets or among dealers.
The values assigned to fair value portfolio investments are based on available information and do not necessarily represent amounts that might ultimately be realized in the future, since such amounts depend on future developments inherent in long-term investments. Because of the inherent uncertainty of valuation, those estimated values may differ significantly from the values that would have been used had a ready market for the investments existed, and the differences could be material. The Board will be presented with a quarterly
16
Notes to Financial Statements (continued)
report showing as of the most recent quarter end, all outstanding securities fair valued by the Fund, including a comparison with the prior quarter end and the percentage of the Fund that the security represents at each quarter end.
With respect to foreign equity securities and certain foreign fixed income securities, the Board has adopted a policy that securities held in a Fund that can be fair valued by the applicable fair value pricing service are fair valued on each business day provided that each individual price exceeds a pre-established confidence level.
U.S. GAAP defines fair value as the price that a Fund would receive to sell an asset or pay to transfer a liability in an orderly transaction between market participants at the measurement date. U.S. GAAP also establishes a framework for measuring fair value, and a three-level hierarchy for fair value measurements based upon the transparency of inputs to the valuation of an asset or liability. Inputs may be observable or unobservable and refer broadly to the assumptions that market participants would use in pricing the asset or liability. Observable inputs reflect the assumptions market participants would use in pricing the asset or liability based on market data obtained from sources independent of the Fund. Unobservable inputs reflect the Fund’s own assumptions about the assumptions that market participants would use in pricing the asset or liability developed based on the best information available in the circumstances. Each investment is assigned a level based upon the observability of the inputs which are significant to the overall valuation.
The three-tier hierarchy of inputs is summarized below:
Level 1 – inputs are quoted prices in active markets for identical investments (e.g., equity securities, open-end investment companies, futures contracts, options contracts)
Level 2 – other observable inputs (including, but not limited to: quoted prices for similar assets or liabilities in markets that are active, quoted prices for identical or similar assets or liabilities in markets that are not active, inputs other than quoted prices that are observable for the assets or liabilities (such as interest rates, yield curves, volatilities, prepayment speeds, loss severities, credit risks and default rates) or other market corroborated inputs) (e.g., debt securities, government securities, swap contracts, foreign currency exchange contracts, foreign securities utilizing international fair value pricing, broker-quoted securities, fair valued securities with observable inputs)
Level 3 – inputs are significant unobservable inputs (including the Fund’s own assumptions used to determine the fair value of investments) (e.g., fair valued securities with unobservable inputs)
Changes in inputs or methodologies used for valuing investments may result in a transfer in or out of levels within the fair value hierarchy. The inputs or methodologies used for valuing investments may not necessarily be an indication of the risk associated with investing in those investments. Transfers between different levels of the fair value disclosure hierarchy are deemed to have occurred as of the beginning of the reporting period.
b. SECURITY TRANSACTIONS
Security transactions are accounted for as of trade date. Realized gains and losses on securities sold are determined on the basis of identified cost.
c. INVESTMENT INCOME AND EXPENSES
Dividend income is recorded on the ex-dividend date. Dividend and interest income on foreign securities is recorded gross of any withholding tax. Interest income, which includes amortization of premium and accretion of discount on debt securities, is accrued as earned. Non-cash dividends included in dividend income, if any, are reported at the fair market value of the securities received. Other income and expenses are recorded on an accrual basis. Expenses that cannot be directly attributed to a Fund are apportioned among the Funds in the Trust and in some cases other affiliated funds based upon their relative average net assets or number of shareholders. Investment income, realized and unrealized capital gains and losses, the common expenses of each Fund, and certain Fund level expense reductions, if any, are allocated on a pro-rata basis to each class based on the relative net assets of each class to the total net assets of each Fund.
The Fund has a “balance credit” arrangement with The Bank of New York Mellon (“BNYM”), the Fund’s custodian, whereby the Fund is credited with an interest factor equal to 0.75% below the effective 90-day T-Bill rate for account balances left uninvested overnight. If the T-Bill rate falls below 0.75%, no credits will be earned. These credits serve to reduce custodian expenses that would otherwise be charged to the Fund. For the fiscal year ended October 31, 2015, the Fund’s custodian expense was not reduced.
Overdraft fees are computed at 1% above the effective Federal Funds rate on the day of the overdraft. For the fiscal year ended October 31, 2015, overdraft fees for the Fund equaled $9,734.
d. DIVIDENDS AND DISTRIBUTIONS
Fund distributions resulting from either net investment income or realized net capital gains, if any, will normally be declared and paid at least annually in December, as described in the Fund’s prospectus. Distributions to shareholders are recorded on the ex-dividend date. Distributions are determined in accordance with federal income tax regulations, which may differ from net investment income and net realized capital gains for financial statement purposes (U.S. GAAP). Differences may be permanent or temporary. Permanent differences are reclassified among capital accounts in the financial statements to reflect their tax character. Permanent book and tax basis differences, if any, relating to shareholder distributions will result in reclassifications to paid-in capital. Temporary differences arise when certain items of income, expense and gain or loss are recognized in different periods for financial statement and tax purposes; these differences will reverse at some time in the future. Temporary differences are due to wash sales. Permanent differences are due to equalization, currency gains and losses and inflation protected securities.
17
Notes to Financial Statements (continued)
The tax character of distributions paid during the fiscal years ended October 31, 2015 and October 31, 2014 were as follows:
| | | | | | | | |
| Distributions paid from: | | 2015 | | | 2014 | |
Ordinary income | | $ | 24,349,032 | | | $ | 16,174,618 | |
Short-term capital gains | | | 14,804,810 | | | | — | |
Long-term capital gains | | | 8,989,957 | | | | — | |
Return of capital | | | — | | | | — | |
| | | | | | | | |
Totals | | $ | 48,143,799 | | | $ | 16,174,618 | |
| | | | | | | | |
As of October 31, 2015, the components of distributable earnings (excluding unrealized appreciation/depreciation) on a tax basis consisted of:
| | | | |
Capital loss carryforward | | | — | |
Undistributed ordinary income | | | — | |
Undistributed short-term capital gains | | | — | |
Undistributed long-term capital gains | | $ | 11,459,571 | |
Late year loss deferral | | | — | |
e. FEDERAL TAXES
The Fund intends to comply with the requirements under Subchapter M of the Internal Revenue Code of 1986, as amended, to distribute substantially all of its taxable income and gains to its shareholders and to meet certain diversification and income requirements with respect to investment companies. Therefore, no provision for federal income or excise tax is included in the accompanying financial statements.
Additionally, based on the Fund’s understanding of the tax rules and rates related to income, gains and transactions for the foreign jurisdictions in which it invests, the Fund will provide for foreign taxes, and where appropriate, deferred foreign taxes.
Management has analyzed the Fund’s tax positions taken on federal income tax returns as of October 31, 2015, and for all open tax years (generally, the three prior taxable years), and has concluded that no provision for federal income tax is required in the Fund’s financial statements. Additionally, the Fund is not aware of any tax position for which it is reasonably possible that the total amounts of unrecognized tax benefits will change materially in the next twelve months.
Net capital losses incurred in taxable years beginning after the enactment of the Regulated Investment Company Modernization Act of 2010, may be carried forward for an unlimited time period, and retain their tax character as either short-term or long-term capital losses.
f. CAPITAL LOSS CARRYOVERS
As of October 31, 2015, the Fund had no accumulated net realized capital loss carryovers from securities transactions for federal income tax purposes. Should the Fund incur net capital losses for the fiscal year ended October 31, 2016, such amounts may be used to offset future realized capital gains, for an unlimited time period.
g. CAPITAL STOCK
The Trust’s Declaration of Trust authorizes for each fund the issuance of an unlimited number of shares of beneficial interest, without par value. The Fund records sales and repurchases of its capital stock on the trade date. The cost of securities contributed to the Fund in connection with the issuance of shares is based on the valuation of those securities in accordance with the Fund’s policy on investment valuation.
18
Notes to Financial Statements (continued)
For the fiscal years ended October 31, 2015 and October 31, 2014, the capital stock transactions by class were as follows:
| | | | | | | | | | | | | | | | |
| | | 2015 | | | 2014 | |
| | | Shares | | | Amount | | | Shares | | | Amount | |
Investor Class Shares*: | | | | | | | | | | | | | | | | |
Proceeds from sale of shares | | | 12,057 | | | $ | 125,000 | | | | — | | | | — | |
Reinvestment of distributions | | | 89 | | | | 915 | | | | — | | | | — | |
Cost of shares repurchased | | | — | | | | — | | | | — | | | | — | |
| | | | | | | | | | | | | | | | |
Net increase | | | 12,146 | | | $ | 125,915 | | | | — | | | | — | |
| | | | | | | | | | | | | | | | |
Service Class Shares**: | | | | | | | | | | | | | | | | |
Proceeds from sale of shares | | | 3,954,392 | | | $ | 41,731,038 | | | | 22,918,825 | | | $ | 244,902,657 | |
Reinvestment of distributions | | | 4,305,556 | | | | 44,557,354 | | | | 1,262,078 | | | | 13,489,957 | |
Cost of shares repurchased | | | (39,114,592 | ) | | | (414,771,685 | ) | | | (54,463,680 | ) | | | (585,489,638 | ) |
| | | | | | | | | | | | | | | | |
Net decrease | | | (30,854,644 | ) | | $ | (328,483,293 | ) | | | (30,282,777 | ) | | $ | (327,097,024 | ) |
| | | | | | | | | | | | | | | | |
Institutional Class Shares*: | | | | | | | | | | | | | | | | |
Proceeds from sale of shares | | | 485,932 | | | $ | 5,014,470 | | | | — | | | | — | |
Reinvestment of distributions | | | 4,409 | | | | 45,135 | | | | — | | | | — | |
Cost of shares repurchased | | | (12,326 | ) | | | (127,022 | ) | | | — | | | | — | |
| | | | | | | | | | | | | | | | |
Net increase | | | 478,015 | | | $ | 4,932,583 | | | | — | | | | — | |
| | | | | | | | | | | | | | | | |
| * | Commencement of operations was on May 8, 2015. |
| ** | Shares of the Fund as of May 7, 2015, were designated as Service Class shares on May 8, 2015. |
At October 31, 2015, certain unaffiliated shareholders of record, specifically omnibus accounts, individually or collectively held greater than 10% of the net assets of the Fund as follows: three collectively own 48%. Transactions by these shareholders may have a material impact on the Fund.
h. REPURCHASE AGREEMENTS AND JOINT REPURCHASE AGREEMENTS
The Fund may enter into repurchase agreements for temporary cash management purposes provided that the value of the underlying collateral, including accrued interest, will equal or exceed the value of the repurchase agreement during the term of the agreement. The underlying collateral for all repurchase agreements is held in safekeeping by the Fund’s custodian or at the Federal Reserve Bank. If the seller defaults and the value of the collateral declines, or if bankruptcy proceedings commence with respect to the seller of the security, realization of the collateral by the Funds may be delayed or limited.
Additionally, the Fund may enter into joint repurchase agreements for reinvestment of cash collateral on securities lending transactions under the securities lending program offered by BNYM (the “Program”), provided that the value of the underlying collateral, including accrued interest, will equal or exceed the value of the joint repurchase agreement during the term of the agreement. The Fund participates on a pro rata basis with other clients of BNYM in its share of the underlying collateral under such joint repurchase agreements and in its share of proceeds from any repurchase or other disposition of the
underlying collateral. The underlying collateral for joint repurchase agreements is held in safekeeping by the Fund’s custodian or at the Federal Reserve Bank. If the seller defaults and the value of the collateral declines, or if bankruptcy proceedings commence with respect to the seller of the security, realization of the collateral by the Funds may be delayed or limited. Pursuant to the Program, the Fund is indemnified for such losses by BNYM.
At October 31, 2015, the Fund had no outstanding repurchase agreements or joint repurchase agreements.
i. FOREIGN CURRENCY TRANSLATION
The books and records of the Fund are maintained in U.S. dollars. The value of investments, assets and liabilities denominated in currencies other than U.S. dollars are translated into U.S. dollars based upon current foreign exchange rates. Purchases and sales of foreign investments, income and expenses are converted into U.S. dollars based on currency exchange rates prevailing on the respective dates of such transactions. Net realized and unrealized gain (loss) on foreign currency transactions represent: (1) foreign exchange gains and losses from the sale and holdings of foreign currencies; (2) gains and losses between trade date and settlement date on investment securities transactions and forward foreign currency exchange contracts; and (3) gains and losses from the difference between amounts of interest and dividends recorded and the amounts actually received.
19
Notes to Financial Statements (continued)
The Fund does not isolate the net realized and unrealized gain or loss resulting from changes in exchange rates from the fluctuations in market prices of securities held. Such fluctuations are included with the net realized and unrealized gain or loss on investments.
j. FOREIGN SECURITIES
Prior to February 28, 2015, the Fund invested in securities of foreign entities and in instruments denominated in foreign currencies which involve risks not typically associated with investments in domestic securities. Non-domestic securities carry special risks, such as exposure to currency fluctuations, less developed or less efficient trading markets, political instability, a lack of company information, differing auditing and legal standards, and, potentially, less liquidity.
Realized gains in certain countries may be subject to foreign taxes at the Fund level. The Fund would pay such foreign taxes on net realized gains at the appropriate rate for each jurisdiction.
k. SECURITIES TRANSACTED ON A WHEN ISSUED BASIS
Prior to February 28, 2015, the Fund entered into To Be Announced (“TBA”) sale commitments to hedge its portfolio positions or to sell mortgage-backed securities it owns under delayed delivery arrangements. Proceeds of TBA sale commitments are not received until the contractual settlement date. During the time a TBA sale commitment is outstanding, equivalent deliverable securities, or an offsetting TBA purchase commitment deliverable on or before the sale commitment date, are held as “cover” for the transaction. TBA sale commitments are valued at the current market value of the underlying securities according to the procedures described under “Valuation of Investments,” in footnote 1a above. Each contract is marked-to market daily and the change in market value is recorded by the Fund as an unrealized gain or loss. If the TBA sale commitment is closed through the acquisition of an offsetting purchase commitment, the Fund realizes a gain or loss. If the Fund delivers securities under the commitment, the Fund realizes a gain or a loss from the sale of the securities based upon the unit price established at the date the commitment was entered into.
2. AGREEMENTS AND TRANSACTIONS WITH AFFILIATES
The Trust has entered into an investment advisory agreement under which the Investment Manager, a subsidiary and the U.S. retail distribution arm of Affiliated Managers Group, Inc. (“AMG”), serves as investment manager to the Fund and is responsible for the Fund’s overall administration and operations. The Investment Manager selects one or more subadvisors for the Fund (subject to Board approval) and monitors each subadvisor’s investment performance, security holdings and investment strategies. The Fund’s investment portfolio is managed by one or more portfolio managers who serves pursuant to a subadvisory agreement with the Investment Manager. The Fund’s investment portfolio is managed by GW&K, who serves pursuant to a subadvisory agreement with the Investment Manager. AMG indirectly owns a majority interest in GW&K.
Investment management fees are paid directly by the Fund to the Investment Manager based on average daily net assets. Effective February 28, 2015, the Fund’s management fee was reduced from an annual rate of 0.40% to 0.30% of the Fund’s average daily net assets.
Effective February 28, 2015, the Investment Manager has contractually agreed, through at least March 1, 2017, to waive management fees (but not below zero) and/or reimburse Fund expenses in order to limit total annual Fund operating expenses (exclusive of taxes, interest (including interest incurred in connection with bank and custody overdrafts), shareholder servicing fees, distribution and service (12b-1) fees, brokerage commissions and other transaction costs, acquired fund fees and expenses, and extraordinary expenses) to 0.48% of the Fund’s average daily net assets, subject to later reimbursement by the Fund in certain circumstances. Prior to February 28, 2015, the Fund had a contractual expense limitation of 0.58% of the Fund’s average daily net assets. The contractual expense limitation may only be terminated in the event the Investment Manager or a successor ceases to be the investment manager of the Fund or a successor fund, by mutual agreement between the Investment Manager and the Board, or in the event of the Fund’s liquidation unless the Fund is reorganized or is a party to a merger in which the surviving entity is successor to the accounting and performance information of the Fund.
The Fund is obligated to repay the Investment Manager such amounts waived, paid or reimbursed in future years provided that the repayment occurs within thirty-six (36) months after the waiver or reimbursement and that such repayment would not cause the Fund’s total annual operating expenses after fee waiver and expense reimbursements in any such future year to exceed the Fund’s contractual expense limitation amount. For the fiscal year ended October 31, 2015, the Fund’s components of reimbursement available are detailed in the following chart:
| | | | |
Reimbursement Available - 10/31/14 | | $ | 3,996,969 | |
Additional Reimbursements | | | 729,874 | |
Expired Reimbursements | | | (1,534,145 | ) |
| | | | |
Reimbursement Available - 10/31/15 | | $ | 3,192,698 | |
| | | | |
| |
| Expiration Date | | | |
Less than 1 year | | $ | 1,338,557 | |
Within 2 years | | | 1,124,267 | |
Within 3 years | | | 729,874 | |
| | | | |
Total Amount Subject to Reimbursement | | $ | 3,192,698 | |
| | | | |
The Fund has entered into an Administration and Shareholder Servicing Agreement under which the Investment Manager serves as the Fund’s administrator (the “Administrator”) and is responsible for all aspects of managing the Fund’s operations, including administration and shareholder services to the Fund, its shareholders, and certain institutions, such as bank trust departments, broker-dealers and registered investment advisers, that advise or act as an intermediary with the Fund’s shareholders. The Fund pays a fee to the Administrator at the rate of 0.20% per annum of the Fund’s average daily net assets for these services.
Effective January 1, 2015, the Board provides supervision of the affairs of the Trust, other trusts within the AMG Funds family of mutual funds (collectively, the “AMG Funds family”) and other affiliated funds. Previously, the Board provided supervision to only the Trust and other trusts within the AMG Funds family.
20
Notes to Financial Statements (continued)
Beginning January 1, 2015, the aggregate annual retainer paid to each Independent Trustee of the Board is $200,000, plus $16,000, $4,000 or $2,000 for each regular, in-person special or telephonic special meeting attended, respectively. The Independent Chairman of the Trusts receives an additional payment of $55,000 per year. The Chairman of the Audit Committee receives an additional payment of $25,000 per year.
Prior to January 1, 2015, the aggregate annual retainer paid to each Independent Trustee of the Board was $130,000, plus $7,000 or $2,500 for each regular or special meeting attended, respectively. The Independent Chairman of the Trusts formerly received an additional payment of $35,000 per year. The Chairman of the Audit Committee formerly received an additional payment of $15,000 per year.
Effective January 1, 2015, the Trustees’ fees and expenses are generally allocated among all of the Funds in the Trust, other trusts within the AMG Funds family and other affiliated funds based on the relative net assets of such funds. Before January 1, 2015, the Trustees’ fees and expenses were generally allocated among all of the funds in the Trust and other trusts within the AMG Funds family. The “Trustees fees and expenses” shown in the financial statements represent the Fund’s allocated portion of the total fees and expenses paid to the Independent Trustees of the Board.
Effective February 28, 2015, the Board approved reimbursement payments to the Investment Manager for shareholder servicing expenses incurred (“shareholder servicing fees”). Shareholder servicing fees include payments to third parties such as a bank, broker-dealer, trust company or other financial intermediaries who provide shareholder recordkeeping, account servicing and other services. The Fund may reimburse the Investment Manager for the actual amount incurred up to a maximum annual rate of the Fund’s average daily net assets as shown in the table below. The impact on the annualized expense ratios for the fiscal year ended October 31, 2015, were as follows:
| | | | | | | | |
| | | Maximum | | | Actual | |
| | | Amount | | | Amount | |
| | | Allowed | | | Incurred | |
Investor Class | | | 0.15 | % | | | 0.15 | % |
Service Class | | | 0.10 | % | | | 0.04 | % |
The Fund is distributed by AMG Distributors, Inc. (the “Distributor”), a wholly owned subsidiary of the Investment Manager. The Distributor serves as the distributor and underwriter for the Fund and is a registered broker-dealer and member of the Financial Industry Regulatory Authority, Inc. (“FINRA”). Shares of the Fund will be continuously offered and will be sold directly to prospective purchasers and through brokers, dealers or other financial intermediaries who have executed selling agreements with the Distributor. Subject to the compensation arrangement discussed below, generally the Distributor bears all or a portion of the expenses of providing services pursuant to the distribution agreement, including the payment of the expenses relating to the distribution of prospectuses for sales purposes and any advertising or sales literature. Certain Trustees and Officers of the Fund are Officers and/or Directors of the Investment Manager, AMG and/or the Distributor.
Effective May 8, 2015, the Trust adopted a distribution and service plan (the “Plan”) with respect to the Investor Class shares of the Fund, in accordance with the requirements of Rule 12b-1 under the 1940 Act and the requirements of the applicable rules of FINRA regarding asset-based sales charges. Pursuant to the Plan, the Fund may make payments to the Distributor for its expenditures in financing any activity primarily intended to result in the sale of Investor Class shares and for maintenance and personal service provided to existing shareholders of that class. The Plan authorizes payments to the Distributors of up to 0.25% annually of the Fund’s average daily net assets attributable to the Investor Class shares.
The Securities and Exchange Commission has granted an exemptive order that permits the Fund to lend and borrow money for certain temporary purposes directly to and from other eligible Funds in the AMG Funds family. Participation in this interfund lending program is voluntary for both the borrowing and lending Funds, and an interfund loan is only made if it benefits each participating Fund. The Investment Manager administers the program according to procedures approved by the Board, and the Board monitors the operation of the program. An interfund loan must comply with certain conditions set out in the exemptive order, which are designed to assure fairness and protect all participating Funds. For the fiscal year ended October 31, 2015, the Fund lent $1,238,166 for four days earning interest of $92. The interest amount is included in the Statement of Operations as interest income. The Fund borrowed varying amounts not exceeding $2,791,224, for seven days paying interest of $142. The interest amount is included in the Statement of Operations as miscellaneous expense. At October 31, 2015, the Fund had no interfund loans outstanding.
3. PURCHASES AND SALES OF SECURITIES
Purchases and sales of securities (excluding short-term securities and U.S. Government obligations) for the fiscal year ended October 31, 2015, were $450,185,297 and $672,272,003, respectively. Purchases and sales of U.S. Government obligations for the fiscal year ended October 31, 2015, were $739,491,368 and $699,756,254, respectively.
4. PORTFOLIO SECURITIES LOANED
The Fund participates in the Program providing for the lending of securities to qualified brokers. Securities lending income includes earnings of such temporary cash investments, plus or minus any rebate to a borrower. These earnings (after any rebate) are then divided between BNYM, as a fee for its services under the Program, and the Funds, according to agreed-upon rates. Collateral on all securities loaned is accepted in cash and is maintained at a minimum level of 102% (105% in the case of certain foreign securities) of the market value, plus interest, if applicable, of investments on loan. It is the Fund’s policy to obtain additional collateral from or return excess collateral to the borrower by the end of the next business day, following the valuation date of the securities loaned. Therefore, the value of the collateral held may be temporarily less than the value of the securities on loan. Lending securities entails a risk of loss to the Fund if and to the extent that the market value of the securities loaned were to increase and the borrower did not increase the collateral accordingly, and the borrower fails to return the securities. Under the terms of the Program, the Fund is indemnified for such losses by BNYM. Cash collateral is held in a separate omnibus account managed by BNYM, who is authorized to exclusively enter into joint overnight government repurchase agreements. BNYM
21
Notes to Financial Statements (continued)
bears the risk of any deficiency in the amount of the cash collateral available for return to the borrower due to any loss on the collateral invested.
5. COMMITMENTS AND CONTINGENCIES
Under the Trust’s organizational documents, its trustees and officers are indemnified against certain liabilities arising out of the performance of their duties to the Trust. In addition, in the normal course of business, the Fund may enter into contracts and agreements that contain a variety of representations and warranties, which provide general indemnifications. The maximum exposure to the Fund under these arrangements is unknown, as this would involve future claims that may be made against a Fund that have not yet occurred. However, based on experience, the Fund had no prior claims or losses and expects the risks of loss to be remote.
6. FORWARD COMMITMENTS
Certain transactions, such as futures and forward transactions, dollar roll agreements, or purchases of when-issued or delayed delivery securities may have a similar effect on the Fund’s net asset value as if the Fund had created a degree of leverage in its portfolio. However, if the Fund enters into such a transaction, the Fund will establish a segregated account with its custodian in which it will maintain cash, U.S. government securities or other liquid securities equal in value to its obligations in respect to such transaction. Securities and other assets held in the segregated account may not be sold while the transaction is outstanding, unless other suitable assets are substituted.
7. DERIVATIVE INSTRUMENTS
The following disclosures contain information on how and why the Fund used derivative instruments, the credit risk and how derivative instruments affect the Fund’s financial position and results of operations. The location and fair value amounts of these instruments on the Statement of Assets and Liabilities and the realized and changes in unrealized gains and losses on the Statement of Operations, each categorized by type of derivative contract, are included in a table in the Notes to the Schedule of Portfolio Investments. For the period from November 1, 2014 through February 28, 2015, the average quarterly balances of derivative financial instruments outstanding were as follows:
| | | | |
Financial futures contracts: | | | | |
Average number of contracts purchased | | | 2,113 | |
Average number of contracts sold | | | 522 | |
Average notional value of contracts purchased | | $ | 382,042,411 | |
Average notional value of contracts sold | | $ | 110,018,491 | |
Foreign currency exchange contracts: | | | | |
Average US dollar amounts purchased/sold | | $ | 500,695,468 | |
Options: | | | | |
Average value of option contracts written | | $ | 408,514 | |
Average notional value of swaption written | | $ | 163,500,000 | |
Credit default swaps: | | | | |
Average notional value - sell protection | | $ | 96,893,773 | |
Interest rate swaps: | | | | |
Average notional value - pays fixed rate | | $ | 1,228,200,000 | |
Average notional value - receives fixed rate | | $ | 279,800,000 | |
After February 28, 2015, the Fund did not invest in derivative instruments in accordance with the new subadvisor’s investment strategy.
8. FORWARD FOREIGN CURRENCY CONTRACTS
Prior to February 28, 2015, the Fund invested in forward foreign currency contracts to facilitate transactions in foreign securities and to hedge against foreign currency exchange rate risk on its non-U.S. dollar denominated investment securities.
A forward foreign currency contract is an agreement between a fund and another party to buy or sell a currency at a set price at a future date. The market value of the contract will fluctuate with changes in currency exchange rates. The contract is marked-to-market daily, and the change in market value is recorded as an unrealized gain or loss. Gain or loss on the purchase or sale of contracts having the same settlement date, amount and counterparty is realized on the date of offset, otherwise gain or loss is realized on the settlement date. Risks may arise upon entering into these contracts from the potential inability of counterparties to meet the terms of their contracts and from unanticipated movements in the value of a foreign currency relative to the U.S. dollar.
9. FUTURES CONTRACTS
Prior to February 28, 2015, the Fund entered into futures contracts to achieve a desired level of investment, whether to accommodate portfolio turnover or cash flows from capital shares transactions. There are certain risks associated with futures contracts. Prices may not move as expected or the Fund may not be able to close out the contract when it desires to do so, resulting in losses.
On entering into a futures contract, either cash or securities in an amount equal to a certain percentage of the contract value (initial margin) must be deposited with the futures broker. Subsequent payments (variation margin) are made or received each day. The variation margin payments equal the daily changes in the contract value and are recorded as unrealized gains or losses. For over-the-counter (“OTC”) futures, daily variation margin is not required. The Fund recognizes a realized gain or loss when the contract is closed or expires equal to the difference between the value of the contract at the time it was opened and the value at the time it was closed. Futures are valued at their quoted daily settlement prices. The aggregate principal amounts of the contracts are not recorded in the financial statements. Fluctuations in the value of the contracts are recorded in the Statement of Assets and Liabilities as an asset (liability) and in the Statement of Operations as unrealized appreciation (depreciation) until the contracts are closed, when they are recorded as realized gains (losses) on futures contracts.
10. INTEREST RATE CAPS AND FLOORS, SWAP CONTRACTS AND OPTIONS
Prior to February 28, 2015, the Fund entered into over-the-counter transactions involving interest rate caps and floors, swap contracts, or purchased and written (sold) options, in order to manage its exposure to credit, currency, equity, interest rate and inflation risk.
In interest rate caps and floor agreements, one party agrees to make payments only when interest rates exceed a specified rate or “cap” or fall below a specified rate or “floor,” usually in return for payment of a fee by the other party. Interest rate caps and floors entitle the purchaser, to the extent that a specified
22
Notes to Financial Statements (continued)
index exceeds or falls below a predetermined interest rate, to receive payments of interest on a notional principal amount from the party selling such interest rate caps or floors.
Interest rate swap contracts represent an agreement between counterparties to exchange cash flows based on the difference between two rates applied to a notional principal amount for a specified period. The most common type of interest rate swap involves the exchange of fixed-rate cash flows for variable-rate cash flows. Swaps ordinarily do not involve the exchange of principal between the parties. Purchased options on swap contracts (“swaptions”) give the holder the right, but not the obligation, to enter into a swap contract with the counterparty which has written the option on a date, at an interest rate, and with a notional amount as specified in the swaption agreement. If the counterparty to the swap transaction defaults, the Fund will be limited to contractual remedies pursuant to the agreements governing the transaction. There is no assurance that swap or swaption contract counterparties will be able to meet their obligations under the contracts or that, in the event of default, the Fund will succeed in pursuing contractual remedies. The Fund may thus assume the risk that payments owed to the Fund under a swap or swaption contract will be delayed, or not received at all. During the term of the swap agreement or swaption, unrealized gains or losses are recorded as a result of “marking to market.” When the swap agreement or swaption is terminated, the Fund will record a realized gain or loss equal to the difference between the proceeds from (or cost of) the closing transaction and the Fund’s basis in the contract, if any. Accrued interest and interest paid are recognized as unrealized and realized gain (loss), respectively. In each of the contracts, the Fund pays a premium to the counterparty in return for the swaption. These swaptions may be exercised by entering into a swap contract with the counterparty only on the date specified in each contract. The Fund also sold credit protection through credit default swaps. Under the terms of the swaps, the seller of the credit protection receives a periodic payment amount (premium) from the buyer that is a fixed percentage amount applied to a notional principal amount. In return, the seller agrees to pay the buyer the notional amount and take delivery of a debt instrument of the reference issuer of the same notional par amount if the reference entity is subject to a credit event (such as bankruptcy, failure to pay, or obligation acceleration) during the term of the swap.
Centrally cleared swaps listed or traded on a multilateral or trade facility platform, such as a registered exchange, are valued at the daily settlement price determined by the respective exchange. For centrally cleared credit default swaps the clearing facility requires its members to provide actionable levels across complete term structures. Daily changes in valuation of centrally cleared swaps, if any, are recorded as a receivable or payable for the change in value as appropriate (“variation margin”) in the Statement of Assets and Liabilities.
A written option contract is a contract in which the writer of the option grants the buyer of the option the right to purchase from (call option) or sell to (put option) the writer a designated instrument at a specified price within a specified period of time. Options written (sold) are recorded as liabilities. The Fund, as writer of written options, bears the risk of an unfavorable change in the market value of the instrument underlying the written option. When an option expires, the premium (original option value) is realized as a gain if the option was written or as a loss if the option was purchased. When the exercise of an option results in a cash settlement, the difference between the premium and the settlement
proceeds is recognized as realized gain or loss. When securities are acquired or delivered upon exercise of an option, the acquisition cost or sale proceeds are adjusted by the amount of the premium. When an option is closed, the difference between the premium and the cost to close the position is realized as a gain or loss.
11. RISKS ASSOCIATED WITH COLLATERALIZED MORTGAGE OBLIGATIONS (“CMOS”)
Prior to February 28, 2015, the net asset value of the Fund was sensitive to interest rate fluctuations because the Fund held several instruments, including CMOs and other derivatives, whose values could have been significantly impacted by interest rate movements. CMOs are obligations collateralized by a portfolio of mortgages or mortgage-related securities. Payments of principal and interest on the mortgages are passed through to the holder of the CMOs on the same schedule as they are received, although certain classes of CMOs have priority over others with respect to the receipt of prepayments on the mortgages. Therefore, the investment in CMOs may be subject to a greater or lesser risk of prepayment than other types of mortgage-related securities. CMOs are subject to principal paydowns as a result of prepayment or refinancing of the underlying mortgage instruments. As a result, the average life may be substantially less than the original maturity. CMOs may have a fixed or variable rate of interest.
12. DOLLAR ROLL AGREEMENTS
Prior to February 28, 2015, the Fund entered dollar rolls in which it sells debt securities for delivery currently and simultaneously contract to repurchase similar, but not identical, securities at the same price or a lower price on an agreed date. The Fund receives compensation as consideration for entering into the commitment to repurchase. The compensation is the difference between the current sale price and the forward price for the future purchase (often referred to as the “drop”) as well as by the interest earned on the cash proceeds of the initial sale. The Fund may also be compensated by the receipt of a commitment fee. As the holder, the counterparty receives all principal and interest payments, including prepayments, made with respect to the similar security sold. Dollar rolls may be renewed with a new sale and repurchase price with a cash settlement made at renewal without physical delivery of the securities subject to the contract.
Certain risks may arise upon entering into dollar rolls from the potential inability of counterparties to meet the terms of their commitments. Additionally, the value of such securities may change adversely before the Fund is able to repurchase them. There can be no assurance that the Fund’s use of the cash that it receives from a dollar roll will provide a return that exceeds its cost.
13. MARKET, CREDIT AND COUNTERPARTY RISKS
Prior to February 28, 2015, the Fund invested in securities and entered into transactions where risks existed due to market fluctuations and were exposed to credit risk with parties with whom it trades (issuers or counterparties). Market prices of investments held by the Fund may fall rapidly or unpredictably and will rise and fall due to changing economic, political, or market conditions or in response to events that affect particular industries or companies. The Fund may be exposed to credit or counterparty risk, or the risk that an institution or other entity with which the Fund has unsettled or open transactions will default or not perform under the contract. The Fund minimized credit risk and counterparty
23
Notes to Financial Statements (continued)
risk by undertaking transactions with a large number of customers and counterparties on recognized and reputable exchanges. The Fund could lose money if the issuer or guarantor of a fixed income security, or the counterparty to a financial derivatives contract, repurchase agreement or a loan of portfolio securities, is unable or unwilling to make timely principal and/or interest payments, or to otherwise honor its obligations.
The Fund was subject to various Master Agreements, which govern the terms of certain transactions with select counterparties. These Master Agreements reduce the counterparty risk associated with relevant transactions by specifying credit protection mechanisms and providing standardization that improves legal certainty. Master Agreements can also help limit counterparty risk by specifying collateral posting arrangements at pre-arranged exposure levels. Under the Master Agreements, collateral is routinely transferred if the total net exposure to certain transactions (net of existing collateral already in place) governed under the relevant master agreement with a counterparty in a given account exceeds a specified threshold, which typically ranges from zero to $250,000 depending on the counterparty and the type of Master Agreement.
International Swaps and Derivatives Association, Inc. Master Agreements (“ISDA Master Agreements”) govern OTC financial derivative transactions entered into by the Fund and the respective counterparty. The ISDA Master Agreements maintain provisions for general obligations, representations, agreements, collateral and events of default or termination. Certain ISDA Master Agreements allow counterparties to OTC derivatives to terminate derivative contracts prior to maturity in the event the Fund’s net assets decline by a stated percentage or the Fund fails to meet the terms of the ISDA Master Agreement, which requires accelerated settlement of all outstanding transactions under the applicable ISDA Master Agreement. Any election to early terminate could be material to the financial statements.
14. SUBSEQUENT EVENTS
The Fund has determined that no material events or transactions occurred through the issuance date of the Fund’s financial statements which require additional disclosure in or adjustment of the Fund’s financial statements.
TAX INFORMATION (unaudited)
The AMG GW&K Core Bond Fund hereby designates the maximum amount allowable of its net taxable income as qualified dividends as provided in the Jobs and Growth Tax Relief Reconciliation Act of 2003. The 2014/2015 Form 1099-DIV you receive for the Fund will show the tax status of all distributions paid to you during the year.
Pursuant to section 852 of the Internal Revenue Code, AMG GW&K Core Bond Fund hereby designates $12,475,455, as a capital gain distribution with respect to the taxable year ended October 31, 2015, or if subsequently determined to be different, the net capital gains of such year.
24
Report of Independent Registered Public Accounting Firm
TO THE BOARD OF TRUSTEES OF AMG FUNDS I AND THE SHAREHOLDERS OF AMG GW&K CORE BOND FUND (FORMERLY AMG MANAGERS TOTAL RETURN BOND FUND):
In our opinion, the accompanying statement of assets and liabilities, including the schedule of portfolio investments, and the related statements of operations and of changes in net assets and the financial highlights present fairly, in all material respects, the financial position of AMG GW&K Core Bond Fund (formerly AMG Managers Total Return Bond Fund), (the “Fund”) at October 31, 2015, and the results of its operations, the changes in its net assets and the financial highlights for each of the periods indicated, in conformity with accounting principles generally accepted in the United States of America. These financial statements and financial highlights (hereafter referred to as “financial statements”) are the responsibility of the Fund’s management. Our responsibility is to express an opinion on these financial statements based on our audits. We conducted our audits of these financial statements in accordance with the standards of the Public Company Accounting Oversight Board (United States). Those standards require that we plan and perform the audit to obtain reasonable assurance about whether the financial statements are free of material misstatement. An audit includes examining, on a test basis, evidence supporting the amounts and disclosures in the financial statements, assessing the accounting principles used and significant estimates made by management, and evaluating the overall financial statement presentation. We believe that our audits, which included confirmation of securities at October 31, 2015 by correspondence with the custodian and brokers, and the application of alternative auditing procedures where securities purchased had not been received, provide a reasonable basis for our opinion.
PricewaterhouseCoopers LLP
Boston, Massachusetts
December 23, 2015
25
AMG Funds
Trustees and Officers
The Trustees and Officers of the Trust, their business addresses, principal occupations for the past five years and dates of birth are listed below. The Trustees provide broad supervision over the affairs of the Trust and the Funds. The Trustees are experienced executives who meet periodically throughout the year to oversee the Funds’ activities, review contractual arrangements with
companies that provide services to the Funds, and review the Funds’ performance. Unless otherwise noted, the address of each Trustee or Officer is the address of the Trust: 600 Steamboat Road, Suite 300, Greenwich, Connecticut 06830.
There is no stated term of office for Trustees. Trustees serve until their resignation, retirement or removal in accordance with the Trust’s
organizational documents and policies adopted by the Board from time to time. The Chairman of the Trustees, President, Treasurer and Secretary of the Trust are elected by the Trustees annually. Other officers hold office at the pleasure of the Trustees.
Independent Trustees
The following Trustees are not “interested persons” of the Trust within the meaning of the 1940 Act:
| | |
Number of Funds Overseen in Fund Complex | | Name, Date of Birth, Principal Occupation(s) During Past 5 Years and Other Directorships Held by Trustee |
• Trustee since 2012 | | Bruce B. Bingham, 12/1/48 |
• Oversees 45 Funds in Fund Complex | | Partner, Hamilton Partners (real estate development firm) (1987-Present); Trustee of Aston Funds (27 portfolios) (2014-Present) Director of The Yacktman Funds (2000-2012). |
| |
• Independent Chairman | | William E. Chapman II, 9/23/41 |
• Trustee since 2000 • Oversees 45 Funds in Fund Complex | | President and Owner, Longboat Retirement Planning Solutions (1998-Present); Hewitt Associates, LLC (part time) (provider of Retirement and Investment Education Seminars) (2002-2009); Trustee Emeritus of Bowdoin College (2013-Present); Trustee of Bowdoin College (2002-2013); Director of Harding, Loevner Funds, Inc. (6 portfolios); Trustee of Third Avenue Trust (5 portfolios); Trustee of Third Avenue Variable Trust (1 portfolio); Trustee of Aston Funds (27 portfolios) (2010-Present). |
| |
• Trustee since 2000 | | Edward J. Kaier, 9/23/45 |
• Oversees 45 Funds in Fund Complex | | Attorney at Law and Partner, Teeters Harvey Marrone & Kaier LLP (2007-Present); Attorney at Law and Partner, Hepburn Willcox Hamilton & Putnam, LLP (1977-2007); Trustee of Third Avenue Trust (5 portfolios); Trustee of Third Avenue Variable Trust (1 portfolio); Trustee of Aston Funds (27 portfolios) (2010-Present). |
| |
• Trustee since 2013 | | Kurt A. Keilhacker, 10/5/63 |
• Oversees 47 Funds in Fund Complex | | Managing Member, TechFund Capital (1997-Present); Managing Member, TechFund Europe (2000-Present); Trustee, Gordon College (2001-Present); Board Member, 6wind SA, (2002-Present); Managing Member, Elementum Ventures (2013-Present); Trustee of Aston Funds (27 portfolios) (2014-Present). |
| |
• Trustee since 2000 | | Steven J. Paggioli, 4/3/50 |
• Oversees 45 Funds in Fund Complex | | Independent Consultant (2002-Present); Formerly Executive Vice President and Director, The Wadsworth Group (1986-2001); Executive Vice President, Secretary and Director, Investment Company Administration, LLC (1990-2001); Vice President, Secretary and Director, First Fund Distributors, Inc. (1991-2001); Trustee, Professionally Managed Portfolios (43 portfolios); Advisory Board Member, Sustainable Growth Advisors, LP; Independent Director, Chase Investment Counsel (2008 – Present); Trustee of Aston Funds (27 portfolios) (2010-Present). |
| |
• Trustee since 2013 | | Richard F. Powers III, 2/2/46 |
• Oversees 45 Funds in Fund Complex | | Adjunct Professor, Boston College (2011-Present); Trustee of Aston Funds (27 portfolios) (2014-Present); President and CEO of Van Kampen Investments Inc. (1998-2003). |
| |
• Trustee since 2000 | | Eric Rakowski, 6/5/58 |
• Oversees 47 Funds in Fund Complex | | Professor, University of California at Berkeley School of Law (1990-Present); Director of Harding, Loevner Funds, Inc. (6 portfolios); Trustee of Third Avenue Trust (5 portfolios); Trustee of Third Avenue Variable Trust (1 portfolio); Trustee of Aston Funds (27 portfolios) (2010-Present). |
| |
• Trustee since 2013 | | Victoria L. Sassine, 8/11/65 |
• Oversees 47 Funds in Fund Complex | | Lecturer, Babson College (2007 – Present); Trustee of Aston Funds (27 portfolios) (2014-Present). |
| |
• Trustee since 2000 | | Thomas R. Schneeweis, 5/10/47 |
• Oversees 45 Funds in Fund Complex | | Professor Emeritus, University of Massachusetts (2013—Present); Partner, S Capital Management, LLC (2007-Present); President, TRS Associates (1982-Present); Director, CISDM at the University of Massachusetts, (1996-2013); President, Alternative Investment Analytics, LLC, (formerly Schneeweis Partners, LLC) (2001-2013); Professor of Finance, University of Massachusetts (1977-2013); Partner, White Bear Partners, LLC (2007-2010); Partner, Northampton Capital Management, LLC (2004-2010); Trustee of Aston Funds (27 portfolios) (2010-Present). |
26
AMG Funds
Trustees and Officers (continued)
Interested Trustees
Each Trustee in the following table is an “interested person” of the Trust within the meaning of the 1940 Act. Ms. Carsman is an interested person of the Trust within the meaning of the 1940 Act by virtue of her position with, and interest in securities of, AMG.
| | |
Number of Funds Overseen in Fund Complex | | Name, Date of Birth, Principal Occupation(s) During Past 5 Years and Other Directorships Held by Trustee |
• Trustee since 2011 | | Christine C. Carsman, 4/2/52 |
• Oversees 47 Funds in Fund Complex | | Senior Vice President and Deputy General Counsel, Affiliated Managers Group, Inc. (2011-Present); Trustee of Aston Funds (27 portfolios) (2014-Present); Senior Vice President and Chief Regulatory Counsel, Affiliated Managers Group, Inc. (2007-2011); Vice President and Chief Regulatory Counsel, Affiliated Managers Group, Inc. (2004-2007); Secretary and Chief Legal Officer, AMG Funds, AMG Funds I, AMG Funds II and AMG Funds III (2004-2011); Senior Counsel, Vice President and Director of Operational Risk Management and Compliance, Wellington Management Company, LLP (1995-2004). |
Officers
| | |
Position(s) Held with Fund and Length of Time Served | | Name, Date of Birth, Principal Occupation(s) During Past 5 Years |
• President since 2014 | | Jeffrey T. Cerutti, 2/7/68 |
• Principal Executive Officer since 2014 | | Chief Executive Officer, AMG Funds LLC (2014-Present); Director, President and Principal, AMG Distributors, Inc. (2014-Present); Chief Executive Officer and President, Aston Funds (2015-Present); President, VP Distributors, (2011-2014); Executive Vice President, Head of Distribution, Virtus Investment Partners, Inc. (2010-2014); Managing Director, Head of Sales, UBS Global Asset Management (2001-2010). |
| |
• Chief Operating Officer since 2007 | | Keitha L. Kinne, 5/16/58 Chief Operating Officer, AMG Funds LLC (2007-Present); Chief Investment Officer, AMG Funds LLC (2008-Present); Chief Operating Officer, AMG Distributors, Inc. (2007-Present); Managing Partner, AMG Funds LLC (2007-2014); President, AMG Funds (2012-2014); President, AMG Distributors, Inc. (2012-2014); Managing Director, Legg Mason & Co., LLC (2006-2007); Managing Director, Citigroup Asset Management (2004-2006). |
| |
• Secretary since 2015 | | Mark J. Duggan, 2/20/65 |
• Chief Legal Officer since 2015 | | Senior Vice President and Senior Counsel, AMG Funds LLC (2015-Present); Secretary, and Chief Legal Officer, AMG Funds, AMG Funds I, AMG Funds II and AMG Funds III (2015-Present); Attorney, K&L Gates, LLP (2009-2015). |
| |
• Chief Financial Officer since 2007 • Treasurer since 1999 • Principal Financial Officer since 2008 | | Donald S. Rumery, 5/29/58 Senior Vice President, Director of Mutual Funds Services, AMG Funds LLC (2005-Present); Treasurer, AMG Funds III (1995-Present); Treasurer, AMG Funds (1999-Present); Treasurer, AMG Funds II (2000-Present); Chief Financial Officer, AMG Funds, AMG Funds III and AMG Funds III (2007-Present); Treasurer and Chief Financial Officer, AMG Distributors, Inc. (2000-2012); Vice President, AMG Funds LLC, (1994-2004). |
| |
• Assistant Treasurer since 2014 | | John C. Ball, 1/9/76 Vice President, Assistant Treasurer, AMG Funds LLC (2014-Present); Vice President, State Street Corp. (2010-2014); Vice President, State Street International (Ireland) Limited (2007-2010). |
| |
• Chief Compliance Officer since 2010 | | John J. Ferencz, 3/9/62 Vice President, Chief Compliance Officer - AMG Family of Funds, AMG Funds LLC (2010-Present); Code of Ethics Reporting Officer and Sarbanes Oxley Code of Ethics Compliance Officer, AMG Funds, AMG Funds I, AMG Funds II and AMG Funds III (2010-Present); Senior Compliance Analyst, Mutual Funds and Regulatory, GE Asset Management Incorporated (2005-2010). |
| |
• Anti-Money Laundering Compliance Officer since 2014 | | Patrick J. Spellman, 3/15/74 Senior Vice President, Chief Compliance Officer, AMG Funds LLC (2011-Present); Chief Compliance Officer, AMG Distributors, Inc., (2010-Present); Compliance Manager, Legal and Compliance, Affiliated Managers Group, Inc. (2005-2011). |
27
Annual Renewal of Investment Management and Subadvisory Agreements (unaudited)
At an in-person meeting held on June 24-25, 2015, the Board of Trustees (the “Board” or the “Trustees”), and separately a majority of the Trustees who are not “interested persons” of the Trust (the “Independent Trustees”), approved the Investment Management Agreement (collectively the “Investment Management Agreement”) and separately an amendment to the Investment Management Agreement and separately a letter agreement to the Investment Management Agreement to reduce the management fee, in each case with AMG Funds LLC (the “Investment Manager”) for AMG GW&K Core Bond Fund (formerly AMG Managers Total Return Bond Fund) (the “Fund”). On February 13, 2015, the Board of Trustees, and separately a majority of the Independent Trustees, approved the Subadvisory Agreement for the Fund’s Subadvisor, which was subsequently approved by Fund shareholders at a special meeting held on May 4, 2015, for an initial two-year period; therefore, the Trustees were not asked to approve the Subadvisory Agreement at the June 2015 meeting. The Independent Trustees were separately represented by independent legal counsel in connection with their consideration of the approval of the Investment Management Agreement. In considering the Investment Management Agreement, the Trustees reviewed a variety of materials relating to the Fund, the Investment Manager and the Subadvisor, including comparative performance, fee and expense information for an appropriate peer group of similar mutual funds (the “Peer Group”), performance information for the relevant benchmark index (the “Fund Benchmark”) and, as to all other matters, other information provided to them on a periodic basis throughout the year, as well as information provided in connection with the meetings of June 24-25, 2015, regarding the nature, extent and quality of services provided by the Investment Manager under the Investment Management Agreement. Prior to voting, the Independent Trustees: (a) reviewed the foregoing information with their independent legal counsel and with management; (b) received materials from their independent legal counsel discussing the legal standards applicable to their consideration of the Investment Management Agreement; and (c)
met with their independent legal counsel in private sessions at which no representatives of management were present.
NATURE, EXTENT, AND QUALITY OF SERVICES.
In considering the nature, extent and quality of the services provided by the Investment Manager, the Trustees reviewed information relating to the Investment Manager’s operations and personnel. Among other things, the Investment Manager provided financial information, biographical information on its supervisory and professional staff and descriptions of its organizational and management structure. The Trustees also took into account information provided periodically throughout the previous year by the Investment Manager in Board meetings relating to the performance of its duties with respect to the Fund and the Trustees’ knowledge of the Investment Manager’s management and the quality of the performance of the Investment Manager’s duties. In the course of their deliberations regarding the Investment Management Agreement, the Trustees evaluated, among other things: (a) the extent and quality of the Investment Manager’s oversight of the operation and management of the Fund; (b) the quality of the Investment Manager’s oversight of the performance by the Subadvisor of its portfolio management duties; (c) the Investment Manager’s ability to supervise the Fund’s other service providers; and (d) the Investment Manager’s compliance program. The Trustees also took into account that, in performing its functions under the Investment Management Agreement and supervising the Subadvisor, the Investment Manager: performs periodic detailed analysis and reviews of the performance by the Subadvisor of its obligations to the Fund, including without limitation, analysis and review of portfolio and other compliance matters and review of the Subadvisor’s investment performance in respect of the Fund; prepares and presents periodic reports to the Board regarding the investment performance of the Subadvisor and other information regarding the Subadvisor, at such times and in such forms as the Board may reasonably request; reviews and considers any
changes in the personnel of the Subadvisor responsible for performing the Subadvisor’s obligations and makes appropriate reports to the Board; reviews and considers any changes in the ownership or senior management of the Subadvisor and makes appropriate reports to the Board; performs periodic in-person or telephonic diligence meetings, including with respect to compliance matters, with representatives of the Subadvisor; assists the Board and management of the Trust in developing and reviewing information with respect to the initial approval of the Subadvisory Agreement and annual consideration of the Subadvisory Agreement thereafter; prepares recommendations with respect to the continued retention of the Subadvisor or the replacement of the Subadvisor, including at the request of the Board; identifies potential successors to or replacements of the Subadvisor or potential additional subadvisors, performs appropriate due diligence, and develops and presents to the Board a recommendation as to any such successor, replacement, or additional subadvisor, including at the request of the Board; designates and compensates from its own resources such personnel as the Investment Manager may consider necessary or appropriate to the performance of its services; and performs such other review and reporting functions as the Board shall reasonably request consistent with the Investment Management Agreement and applicable law. The Trustees noted the affiliation of the Subadvisor with the Investment Manager, noting any potential conflicts of interest. The Trustees also took into account the financial condition of the Investment Manager with respect to its ability to provide the services required under the Investment Management Agreement and the Investment Manager’s undertaking to maintain a contractual expense limitation for the Fund. The Trustees also considered the Investment Manager’s risk management processes.
PERFORMANCE.
As noted above, the Board considered the Fund’s net performance during relevant time periods as compared to the Fund’s Peer Group and Fund Benchmark and considered the Subadvisor’s
28
Annual Renewal of Investment Management and Subadvisory Agreements (continued)
performance as compared to an appropriate peer group of managed accounts and also considered the gross performance of the Fund as compared to the Subadvisor’s relevant performance composite that utilizes the same investment strategy and approach and noted that the Board reviews on a quarterly basis detailed information about the Fund’s performance results, portfolio composition and investment philosophy, strategies and techniques in managing the Fund. The Board noted the Investment Manager’s expertise and resources in monitoring the performance, investment style and risk-adjusted performance of the Subadvisor. The Board was mindful of the Investment Manager’s attention to monitoring the Subadvisor’s performance with respect to the Fund and its discussions with management regarding the factors that contributed to the performance of the Fund
Among other information relating to the Fund’s performance, the Trustees noted that the Fund’s performance for the 1-year, 3-year, 5-year and 10-year periods ended March 31, 2015 was above, above, below and above, respectively, the median performance of the Peer Group and below, above, above and above, respectively, the performance of the Fund Benchmark, the Barclays U.S. Aggregate Bond Index. The Trustees took into account management’s discussion of the Fund’s performance, including the change in the Fund’s Subadvisor in February 2015. The Trustees concluded that the Fund’s overall performance has been satisfactory.
ADVISORY FEES AND PROFITABILITY.
In considering the reasonableness of the advisory fee payable to the Investment Manager, the Trustees reviewed information provided by the Investment Manager setting forth all revenues and other benefits, both direct and indirect (including any so-called “fallout benefits” such as reputational value derived from the Investment Manager serving as Investment Manager to the Fund), received by the Investment Manager and its affiliates attributable to managing the Fund and all the mutual funds in the AMG Funds Family of Funds, the cost of providing such services and the
resulting profitability to the Investment Manager and its affiliates from these relationships. The Trustees noted that the Investment Manager and the Subadvisor are affiliated. The Trustees also considered the amount of the advisory fee retained by the Investment Manager after payment of the subadvisory fee. The Trustees also noted any payments that were made from the Subadvisor to the Investment Manager. The Trustees also noted management’s discussion of the current asset level of the Fund, and considered the impact on profitability of the current asset level and any future growth of assets of the Fund.
In considering the cost of services to be provided by the Investment Manager under the Investment Management Agreement and the profitability to the Investment Manager of its relationship with the Fund, the Trustees noted the undertaking by the Investment Manager to maintain a contractual expense limitation for the Fund. The Board also took into account management’s discussion of the current advisory fee structure, and, as noted above, the services the Investment Manager provides in performing its functions under the Investment Management Agreement and supervising the Subadvisor. Based on the foregoing, the Trustees concluded that the profitability to the Investment Manager is reasonable and that the Investment Manager is not realizing material benefits from economies of scale that would warrant adjustments to the advisory fee at this time. Also with respect to economies of scale, the Trustees noted that as the Fund’s assets increase over time, the Fund may realize other economies of scale to the extent the increase in assets is proportionally greater than the increase in certain other expenses.
The Trustees noted that the Fund’s advisory fees (which include both the advisory and administration fee) and total expenses (net of applicable expense waivers/reimbursements) as of March 31, 2015 were higher and lower, respectively, than the average for the Peer Group. The Trustees took into account the fact that the Investment Manager has contractually agreed, from February 28, 2015 through March 1, 2017,
to limit the Fund’s net annual operating expenses (subject to certain excluded expenses) to 0.48%. The Trustees also considered that the previous limitations on the Fund’s net annual operating expenses were higher. The Board also considered that the Investment Manager contractually agreed to reduce, or waive a portion of, its advisory fee for the Fund effective February 28, 2015. The Trustees also took into account management’s discussion of the Fund’s expenses. The Trustees also noted that, effective May 8, 2015, the Fund’s share class structure was revised to better conform to the Investment Manager’s platform share class structure. The Trustees concluded that, in light of the nature, extent and quality of the services provided by the Investment Manager, the foregoing expense limitation and the considerations noted above with respect to the Investment Manager, the Fund’s advisory fees are reasonable.
* * * *
After consideration of the foregoing, the Trustees also reached the following conclusions (in addition to the conclusions discussed above) regarding the Investment Management Agreement: (a) the Investment Manager has demonstrated that it possesses the capability and resources to perform its duties under the Investment Management Agreement; and (b) the Investment Manager maintains an appropriate compliance program.
Based on all of the above-mentioned factors and their related conclusions, with no single factor or conclusion being determinative and with each Trustee not necessarily attributing the same weight to each factor, the Trustees concluded that approval of the Investment Management Agreement would be in the best interests of the Fund and its shareholders. Accordingly, on June 24-25, 2015, the Trustees, and separately a majority of the Independent Trustees, voted to approve the Investment Management Agreement for the Fund.
29
PROXY RESULTS
A special meeting of shareholders of AMG Funds I was held on May 4, 2015. With respect to the proposals to approved a new subadvisory agreement between AMG Funds LLC and Gannett Welsh & Kotler, LLC with respect to the Fund. The proposals and results of the votes are summarized below.
| | | | | | | | | | | | | | | | | | | | |
| | | AMG GW&K Core Bond Fund | |
| | | For | | | Against | | | Abstain | | | Uninstructed | | | Total | |
1. Approval of a new subadvisory agreement between the Investment Manager and Gannett Welsh & Kotler, LLC with respect to the Fund. | | | 24,956,167 | | | | 715,721 | | | | 1,226,778 | | | | 8,378,902 | | | | 35,277,568 | |
% of Outstanding Shares | | | 35.53 | % | | | 1.02 | % | | | 1.75 | % | | | 11.93 | % | | | 50.23 | % |
% of Shares Present | | | 70.74 | % | | | 2.03 | % | | | 3.48 | % | | | 23.75 | % | | | 100.00 | % |
| |
| | | AMG GW&K Core Bond Fund | |
| | | For | | | Against | | | Abstain | | | Uninstructed | | | Total | |
2. Transaction of such other business as may properly come before the meeting or any adjournment(s) or postponement(s) | | | 22,832,012 | | | | 2,552,868 | | | | 1,513,784 | | | | 8,378,902 | | | | 35,277,566 | |
% of Outstanding Shares | | | 32.51 | % | | | 3.63 | % | | | 2.16 | % | | | 11.93 | % | | | 50.23 | % |
% of Shares Present | | | 64.72 | % | | | 7.24 | % | | | 4.29 | % | | | 23.75 | % | | | 100.00 | % |
| | | | |
| Fund Totals: | | Shares | |
Record Total | | | 70,232,008 | |
Shares Voted | | | 35,277,568 | |
Percent present | | | 50.23 | % |
30
THIS PAGE INTENTIONALLY LEFT BLANK
THIS PAGE INTENTIONALLY LEFT BLANK
INVESTMENT MANAGER AND ADMINISTRATOR
AMG Funds LLC
600 Steamboat Road
Greenwich, CT 06830
(800) 835-3879
DISTRIBUTOR
AMG Distributors, Inc.
600 Steamboat Road
Greenwich, CT 06830
(800) 835-3879
SUBADVISOR
GW&K Investment Management, LLC
222 Berkeley Street
Boston, MA 02116
CUSTODIAN
The Bank of New York Mellon
2 Hanson Place
Brooklyn, NY 11217
LEGAL COUNSEL
Ropes & Gray LLP
Prudential Tower, 800 Boylston Street
Boston, MA 02199-3600
TRANSFER AGENT
BNY Mellon Investment Servicing
(US) Inc.
Attn: AMG Funds
P.O. Box 9769
Providence, RI 02940
(800) 548-4539
FOR MANAGERSCHOICETM ONLY
AMG Funds
c/o BNY Mellon Investment Servicing (US) Inc.
P.O. Box 9847
Providence, Rhode Island 02940-8047
(800) 358-7668
This report is prepared for the Fund’s shareholders. It is authorized for distribution to prospective investors only when preceded or accompanied by an effective prospectus. To receive a free copy of the prospectus or Statement of Additional Information, which includes additional information about Fund Trustees, please contact us by calling 800.835.3879. Distributed by AMG Distributors, Inc., member FINRA/SIPC.
Current net asset values per share for the Fund are available on the Fund’s website at www.amgfunds.com.
A description of the policies and procedures the Fund uses to vote its proxies is available: (i) without charge, upon request, by calling 800.835.3879, or (ii) on the Securities and Exchange Commission’s (SEC) website at www.sec.gov. For information regarding the Fund’s proxy voting record for the 12-month period ended June 30, call 800.835.3879 or visit the SEC website at www.sec.gov.
The Fund files its complete schedule of portfolio holdings with the SEC for the first and third quarters of each fiscal year on Form N-Q. The Fund’s Forms N-Q are available on the SEC’s website at www.sec.gov. A Fund’s Forms N-Q may be reviewed and copied at the SEC’s Public Reference Room in Washington, DC. Information on the operation of the Public Reference Room may be obtained by calling 1-800-SEC-0330. To review a complete list of the Fund’s portfolio holdings, or to view the most recent quarterly holdings report, semiannual report, or annual report, please visit www.amgfunds.com.
www.amgfunds.com |
AFFILIATE SUBADVISED FUNDS
BALANCED FUNDS
AMG Chicago Equity Partners Balanced
Chicago Equity Partners, LLC
AMG FQ Global Risk-Balanced
First Quadrant, L.P.
EQUITY FUNDS
AMG Chicago Equity Partners Small Cap Value
Chicago Equity Partners, LLC
AMG FQ Tax-Managed U.S. Equity
AMG FQ U.S. Equity
First Quadrant, L.P.
AMG Frontier Small Cap Growth
Frontier Capital Management Company, LLC
AMG GW&K Small Cap Core
AMG GW&K Small Cap Growth
GW&K Investment Management, LLC
AMG Renaissance International Equity
AMG Renaissance Large Cap Growth
The Renaissance Group LLC
AMG SouthernSun Small Cap
AMG SouthernSun U.S. Equity
SouthernSun Asset Management, LLC
AMG Systematic Large Cap Value
AMG Systematic Mid Cap Value
Systematic Financial Management, L.P.
AMG TimesSquare All Cap Growth
AMG TimesSquare International Small Cap
AMG TimesSquare Mid Cap Growth
AMG TimesSquare Small Cap Growth
TimesSquare Capital Management, LLC
AMG Trilogy Emerging Markets Equity
AMG Trilogy Emerging Wealth Equity
AMG Trilogy Global Equity
AMG Trilogy International Small Cap
Trilogy Global Advisors, L.P.
AMG Yacktman
AMG Yacktman Focused
AMG Yacktman Special Opportunities
Yacktman Asset Management LP
FIXED INCOME FUNDS
AMG GW&K Core Bond
(formerly AMG Managers Total Return Bond)
AMG GW&K Enhanced Core Bond
AMG GW&K Municipal Bond
AMG GW&K Municipal Enhanced Yield
GW&K Investment Management, LLC
OPEN-ARCHITECTURE FUNDS
EQUITY FUNDS
AMG Managers Brandywine
AMG Managers Brandywine Advisors Mid Cap Growth
AMG Managers Brandywine Blue
Friess Associates, LLC
AMG Managers Cadence Capital Appreciation
AMG Managers Cadence Emerging Companies
AMG Managers Cadence Mid Cap
Cadence Capital Management, LLC
AMG Managers Emerging Opportunities
Lord, Abbett & Co. LLC
WEDGE Capital Management L.L.P.
Next Century Growth Investors LLC
RBC Global Asset Management (U.S.) Inc.
AMG Managers Essex Small/Micro Cap Growth
Essex Investment Management Co., LLC
AMG Managers Real Estate Securities
CenterSquare Investment Management, Inc.
AMG Managers Skyline Special Equities
Skyline Asset Management, L.P.
AMG Managers Special Equity
Ranger Investment Management, L.P. Lord, Abbett & Co. LLC
Smith Asset Management Group, L.P. Federated MDTA LLC
FIXED INCOME FUNDS
AMG Managers Bond
AMG Managers Global Income Opportunity
Loomis, Sayles & Co., L.P.
AMG Managers High Yield
J.P. Morgan Investment Management Inc.
AMG Managers Intermediate Duration Government
AMG Managers Short Duration Government
Amundi Smith Breeden LLC
| | | | |
 | | | | | www.amgfunds.com |
| | | | |
| | |
| | | ANNUAL REPORT |
AMG Funds
October 31, 2015
AMG Frontier Small Cap Growth Fund
Investor Class: MSSVX | Service Class: MSSCX | Institutional Class: MSSYX
AMG TimesSquare All Cap Growth Fund
Investor Class: MTGVX | Service Class: MTGSX | Institutional Class: MTGIX
AMG Managers Emerging Opportunities Fund
Service Class: MMCFX | Institutional Class: MIMFX
AMG Managers Real Estate Securities Fund: MRESX
| | |
| www.amgfunds.com | | | AR022-1015 |
AMG Funds
Annual Report—October 31, 2015
| | | | |
TABLE OF CONTENTS | | PAGE | |
LETTER TO SHAREHOLDERS | | | 2 | |
| |
ABOUT YOUR FUND’S EXPENSES | | | 3 | |
| |
PORTFOLIO MANAGER’S COMMENTS, FUND SNAPSHOTS, AND SCHEDULES OF PORTFOLIO INVESTMENTS | | | | |
AMG Frontier Small Cap Growth Fund | | | 4 | |
AMG TimesSquare All Cap Growth Fund | | | 10 | |
AMG Managers Emerging Opportunities Fund | | | 17 | |
AMG Managers Real Estate Securities Fund | | | 27 | |
| |
NOTES TO SCHEDULES OF PORTFOLIO INVESTMENTS | | | 31 | |
| |
FINANCIAL STATEMENTS | | | | |
| |
Statement of Assets and Liabilities | | | 33 | |
Balance sheets, net asset value (NAV) per share computations and cumulative undistributed amounts | | | | |
| |
Statement of Operations | | | 35 | |
Detail of sources of income, expenses, and realized and unrealized gains (losses) during the fiscal year | | | | |
| |
Statements of Changes in Net Assets | | | 36 | |
Detail of changes in assets for the past two fiscal years | | | | |
| |
Financial Highlights | | | 38 | |
Historical net asset values per share, distributions, total returns, income and expense ratios, turnover ratios and net assets | | | | |
| |
Notes to Financial Highlights | | | 44 | |
| |
Notes to Financial Statements | | | 45 | |
Accounting and distribution policies, details of agreements and transactions with Fund management and affiliates, and descriptions of certain investment risks | | | | |
| |
REPORT OF INDEPENDENT REGISTERED PUBLIC ACCOUNTING FIRM | | | 53 | |
| |
TRUSTEES AND OFFICERS | | | 54 | |
| |
ANNUAL RENEWAL OF INVESTMENT MANAGEMENT AND SUBADVISORY AGREEMENTS | | | 56 | |
Nothing contained herein is to be considered an offer, sale or solicitation of an offer to buy shares of any series of the AMG Funds family of mutual funds. Such offering is made only by prospectus, which includes details as to offering price and other material information.
| | |
| | | Letter to Shareholders |
DEAR SHAREHOLDER:
Overall, U.S. equity investors were rewarded with positive, albeit modest, returns despite increasing market volatility for the fiscal year ended October 31, 2015. The S&P 500 Index, a widely followed barometer of the U.S. equity market, returned 5.2% during the past twelve months. However, the U.S. equity market did experience its first correction in four years in August as investors worried about slowing China growth and the potential impact of a U.S. Federal Reserve (the Fed) rate hike on the slow recovery in the U.S. During the year, there was significant dispersion in performance across sectors with consumer discretionary stocks returning more than 21% while companies within the energy sector fell (19)%, driven in large part by the precipitous fall in oil prices. Meanwhile, international stocks fell during the prior year, returning (4.7)%, as measured by the MSCI ACWI ex USA (in U.S. Dollar terms). International investment returns in U.S. Dollar terms were negatively impacted by continued strengthening in the U.S. Dollar. Despite the more recent difficult performance for equities, it’s worth noting that the first quarter of 2015 marked the six-year anniversary of the equity bull market.
The Barclays U.S. Aggregate Bond Index, a broad U.S. bond market benchmark, returned 2.0% for the fiscal year ended October 31, 2015. Interest rates fell throughout much of 2014 and for periods throughout the past fiscal year, lending positive support to bond prices. Investors, however, enter the new fiscal year with a close watch on the strength of the underlying U.S. economy and its potential impact on the Fed’s zero-interest-rate policy (and its subsequent impact on bond prices).
Our foremost goal at AMG Funds is to provide investment solutions that help our shareholders successfully reach their long-term investment goals. By partnering with AMG’s affiliated investment boutiques, AMG Funds provides access to a distinctive array of actively-managed, return-oriented investment strategies. Additionally, we oversee and distribute a number of complementary open-architecture mutual funds subadvised by unaffiliated investment managers. We thank you for your continued confidence and investment in AMG Funds. You can rest assured that under all market conditions our team is focused on delivering excellent investment management services for your benefit.
Respectfully,

Jeffery Cerutti
President
AMG Funds
| | | | | | | | | | | | | | |
| | | Periods ended October 31, 2015 | |
Average Annual Total Returns | | 1 Year | | | 3 Years | | | 5 Years | |
| Stocks: | | | | | | | | | | | | | | |
Large Caps | | (S&P 500 Index) | | | 5.20 | % | | | 16.20 | % | | | 14.33 | % |
Small Caps | | (Russell 2000® Index) | | | 0.34 | % | | | 13.90 | % | | | 12.06 | % |
International | | (MSCI All Country World Index ex USA Index) | | | (4.68 | )% | | | 4.69 | % | | | 2.60 | % |
| | | | |
Bonds: | | | | | | | | | | | |
Investment Grade | | (Barclays U.S. Aggregate Bond Index) | | | 1.96 | % | | | 1.65 | % | | | 3.03 | % |
High Yield | | (Barclays U.S. Corporate High Yield Bond Index) | | | (1.94 | )% | | | 4.15 | % | | | 6.18 | % |
Tax-exempt | | (Barclays Municipal Bond Index) | | | 2.87 | % | | | 2.91 | % | | | 4.28 | % |
Treasury Bills | | (BofA Merrill Lynch 6-month U.S. Treasury Bill) | | | 0.20 | % | | | 0.18 | % | | | 0.19 | % |
2
About Your Fund’s Expenses
As a shareholder of a Fund, you may incur two types of costs: (1) transaction costs, which may include sales charges (loads) on purchase payments; redemption fees; and exchange fees; and (2) ongoing costs, including management fees; distribution (12b-1) fees; and other Fund expenses. This example is intended to help you understand your ongoing costs (in dollars) of investing in the Fund and to compare these costs with the ongoing costs of investing in other mutual funds. The example is based on $1,000 invested at the beginning of the period and held for the entire period as indicated below.
ACTUAL EXPENSES
The first line of the following table provides information about the actual account values and actual expenses. You may use the information in this line, together with the amount you invested, to estimate the expenses that you paid over the period. Simply divide your account value by $1,000 (for example, an $8,600 account value divided by $1,000 = 8.6), then multiply the result by the number in the first line under the heading entitled “Expenses Paid During Period” to estimate the expenses you paid on your account during this period.
HYPOTHETICAL EXAMPLE FOR COMPARISON PURPOSES
The second line of the following table provides information about hypothetical account values and hypothetical expenses based on the Fund’s actual expense ratio and an assumed annual rate of return of 5% before expenses, which is not the Fund’s actual return. The hypothetical account values and expenses may not be used to estimate the actual ending account balance or expenses you paid for the period. You may use this information to compare the ongoing costs of investing in the Fund and other funds by comparing this 5% hypothetical example with the 5% hypothetical examples that appear in the shareholder reports of other funds.
Please note that the expenses shown in the table are meant to highlight your ongoing costs only and do not reflect any transactional costs, such as sales charges (loads), redemption fees, or exchange fees. Therefore, the second line of the table is useful in comparing ongoing costs only, and will not help you determine the relative total costs of owning different funds.
| | | | | | | | | | | | | | | | |
| | | | | | Beginning | | | Ending | | | | |
| | | Expense | | | Account | | | Account | | | Expenses | |
| | | Ratio for | | | Value | | | Value | | | Paid During | |
| Six Months Ended October 31, 2015 | | the Period | | | 05/01/15 | | | 10/31/15 | | | the Period* | |
AMG Frontier Small Cap Growth Fund | | | | | | | | | | | | | | | | |
Investor Class | | | | | | | | | | | | | | | | |
Based on Actual Fund Return | | | 1.55 | % | | $ | 1,000 | | | $ | 897 | | | $ | 7.41 | |
Hypothetical (5% return before expenses) | | | 1.55 | % | | $ | 1,000 | | | $ | 1,017 | | | $ | 7.88 | |
Service Class | | | | | | | | | | | | | | | | |
Based on Actual Fund Return | | | 1.29 | % | | $ | 1,000 | | | $ | 898 | | | $ | 6.17 | |
Hypothetical (5% return before expenses) | | | 1.29 | % | | $ | 1,000 | | | $ | 1,019 | | | $ | 6.56 | |
Institutional Class | | | | | | | | | | | | | | | | |
Based on Actual Fund Return | | | 1.05 | % | | $ | 1,000 | | | $ | 899 | | | $ | 5.03 | |
Hypothetical (5% return before expenses) | | | 1.05 | % | | $ | 1,000 | | | $ | 1,020 | | | $ | 5.35 | |
AMG TimesSquare All Cap Growth Fund | | | | | | | | | | | | | | | | |
Investor Class | | | | | | | | | | | | | | | | |
Based on Actual Fund Return | | | 1.36 | % | | $ | 1,000 | | | $ | 1,007 | | | $ | 6.88 | |
Hypothetical (5% return before expenses) | | | 1.36 | % | | $ | 1,000 | | | $ | 1,018 | | | $ | 6.92 | |
Service Class | | | | | | | | | | | | | | | | |
Based on Actual Fund Return | | | 0.90 | % | | $ | 1,000 | | | $ | 1,009 | | | $ | 4.56 | |
Hypothetical (5% return before expenses) | | | 0.90 | % | | $ | 1,000 | | | $ | 1,021 | | | $ | 4.58 | |
Institutional Class | | | | | | | | | | | | | | | | |
Based on Actual Fund Return | | | 0.79 | % | | $ | 1,000 | | | $ | 1,010 | | | $ | 4.00 | |
Hypothetical (5% return before expenses) | | | 0.79 | % | | $ | 1,000 | | | $ | 1,021 | | | $ | 4.02 | |
AMG Managers Emerging Opportunities Fund | | | | | | | | | | | | | | | | |
Service Class | | | | | | | | | | | | | | | | |
Based on Actual Fund Return | | | 1.43 | % | | $ | 1,000 | | | $ | 920 | | | $ | 6.92 | |
Hypothetical (5% return before expenses) | | | 1.43 | % | | $ | 1,000 | | | $ | 1,018 | | | $ | 7.27 | |
Institutional Class | | | | | | | | | | | | | | | | |
Based on Actual Fund Return | | | 1.18 | % | | $ | 1,000 | | | $ | 921 | | | $ | 5.71 | |
Hypothetical (5% return before expenses) | | | 1.18 | % | | $ | 1,000 | | | $ | 1,019 | | | $ | 6.01 | |
AMG Managers Real Estate Securities Fund | | | | | | | | | | | | | | | | |
Based on Actual Fund Return | | | 1.19 | % | | $ | 1,000 | | | $ | 1,041 | | | $ | 6.12 | |
Hypothetical (5% return before expenses) | | | 1.19 | % | | $ | 1,000 | | | $ | 1,019 | | | $ | 6.06 | |
| * | Expenses are equal to the Fund’s annualized expense ratio multiplied by the average account value over the period, multiplied by the number of days in the most recent fiscal half-year (184), then divided by 365. |
3
AMG Frontier Small Cap Growth Fund
Portfolio Manager’s Comments (unaudited)
THE PORTFOLIO MANAGER
Frontier Capital Management Co. LLC (“Frontier”) manages client assets in small-, small/mid-, mid-and large-cap U.S. equity strategies. The AMG Frontier Small Cap Growth Fund follows a small-cap growth discipline as Frontier implements its “GARP” investment approach to select attractive small-cap stocks.
Frontier believes:
| | • | | Fundamental research is the cornerstone to adding value |
| | • | | Stock prices ultimately are linked to sales and earnings growth |
| | • | | Growth must be purchased at a reasonable price (“GARP”) |
| | • | | Research is a continuous process |
Frontier utilizes and draws support from its entire team of 17 investment professionals to identify opportunities and conduct fundamental research. Through fundamental bottom-up research, Frontier seeks long-term capital appreciation by investing in small-capitalization companies that it believes have above-average earnings growth potential and are available at reasonable valuations.
Frontier looks for companies it believes can generate long-term, sustainable earnings, managed by qualified professionals capable of executing a well-conceived strategic plan. Frontier seeks businesses that can generate superior rates of return on capital in excess of their cost of capital over a business cycle, due to above-average secular growth prospects or a competitive advantage.
THE YEAR IN REVIEW
For the fiscal year ended October 31, 2015, the AMG Frontier Small Cap Growth Fund (Service Class) (the “Fund”) returned (2.7)%, compared with the Russell 2000® Growth Index, which returned 3.5%.
U.S. equities finished the twelve months ending October 31, 2015 with modest positive returns. Small caps trailed large caps as the Russell 2000® Index rose 0.3% versus the 4.9% gain of the large cap Russell 1000® Index. From a style perspective, growth led the small cap segment as the Russell 2000® Growth Index advanced 3.5%. An economic slowdown in China has resulted in persistent weakness in commodity prices and deteriorating fundamentals for Emerging Markets. As a result, global equities suffered broad losses
during the third calendar quarter with approximate declines of 7% for the S&P 500 Index – the worst quarter in four years, 9% in Europe’s main indices and almost 30% in China’s Shanghai Stock Exchange Composite Index.
The Fund’s underperformance relative to the Russell 2000® Growth Index was due to negative stock selection, with sector selection nearly flat. After being our top sector last year, technology was our largest detracting sector, falling 4% versus a gain of 12% for the Index. Our worst technology stock was three dimensional printing company 3D Systems, down 73%. The stock declined after lowering financial guidance earlier in the year. We continue to believe that 3D Systems is well positioned in the large secular growing market of three dimensional printing and the overall industry could increase by five fold in the next decade as it moves from prototype-only products to production manufacturing. However, we significantly reduced the position size in the Fund given current weak fundamentals. We were also hurt by our semiconductor holdings that declined nearly 23%. Weakness in China led to a slowdown in mobile handset sales as well as excess inventory in the wireless infrastructure segment. While the weakness impacted many hardware technology companies, our holding in Qorvo, Inc. has significant exposure to the wireless industry and it resulted in the company missing its second quarter and full year financial results, causing a 38% decline in the stock. Although we believe many semiconductor stocks are reasonably valued, we have greatly reduced our exposure. Another technology detractor was Tangoe, down 44%, a recurring revenue software company that has continued to disappoint. Tangoe addresses a large market with no significant competitors, but growth has slowed as the company works on larger deals that are taking longer to close. With the stock trading at one times sales, we are maintaining our position as either we hope the current management will fix the sales execution problem or a new management team will likely be put in place.
While underweighting the sector, producer durables was our second largest detractor to relative performance as our 24% decline lagged the benchmark, down 5%. Laggards included engineering firm MasTec, Inc., down 42%, and industrial distribution company Wesco, down 28%.
MasTec was hurt by a significant slowdown in wireless capital spend by its largest customer, AT&T, as they deferred spending while closing their acquisition of DIRECTV. In addition, investors are concerned that lower oil prices will hurt the company’s pipeline construction business. We believe the company will take share in wireless, posting substantial growth, and that capital spend is poised to rise over 20% at AT&T in 2016. Additionally, the company has had substantial pipeline project wins that we believe will materialize in 2016 and we expect that the pipeline business will remain robust through at least 2018. We believe that the stock is undervalued, that there is material upside to consensus earnings expectations, and there recently have been large insider purchases of the stock. We have added to our position. Wesco was hurt by its large exposure to the Canadian market as well as weak industrial spend. We sold the position.
Consumer discretionary, where we were roughly equal weight, also detracted as our 3% decline trailed the 4% gain of the sector. Discount shoe retailer DSW declined 14% and had the largest impact on the sector. The company is being hurt by unseasonably warm fall weather across much of the country, high inventory levels across the industry and the resultant highly promotional environment. This caused the company to reduce its earnings guidance by 20% and we have reduced the position. Restaurateur Fiesta Restaurant Group, Inc., owner of the Polo Tropical and Taco Cabana chains, declined 36% as same restaurant sales decelerated along with industry-wide trends. We continue to hold the stock as the company has significant opportunity to grow its highly profitable Polo Tropical brand, which has strong consumer appeal.
Energy, despite being a small weighting, at less than 2% of the Fund’s portfolio, energy was also a detractor as our return, down 62%, trailed the 41% decline of the Index. While we have been underweight the sector all year, the June rebalance of the Russell 2000® Growth index left us in an overweight position just as oil prices started a decline of almost 25% for the quarter. We own four exploration and production (E&P) companies whose stock prices fluctuate significantly with changes in the price of oil. These stocks have come under significant pressure as
4
AMG Frontier Small Cap Growth Fund
Portfolio Manager’s Comments (continued)
investors are concerned about the debt levels at these companies. Our largest energy decliner, Bonanza Creek Energy, Inc., down 78%, has access to over $500M of senior secured financing and does not have any debt maturing until 2021 and 2023. Bonanza has extremely low production costs and almost eight years of inventory. All of our E&P companies hold property in the lowest cost shale areas of the U.S. and have balance sheets to withstand several years of depressed oil prices. The U.S. rig count continues to fall so overall U.S. shale production should start to decline, but if oil prices remain depressed beyond 2016, we believe that there will be significant consolidation of smaller oil companies with the best acreage. We currently are underweight the energy sector. Materials and processing, a sector we are slightly overweight, was our top contributor as our positive 1% return outpaced the sector, down 4%. Our holdings within the sector tend to be operating companies rather than the mostly commodity-oriented companies that are in the benchmark. Our performance was driven by our two top positions in the sector including HVAC distributor Watsco, Inc., up 24%, and roofing distributor Beacon Roofing Supply, Inc., up 25%. Both companies have highly predicable, recurring business models, as air conditioners get repaired or replaced when they eventually break and re-roofing occurs when roofs eventually leak. Watsco is poised to benefit from energy efficiency regulations affecting the Sunbelt that will drive a mix shift to higher-end air conditioners. They are the only industry participant making significant investments in e-commerce that should drive substantial market share gains. Beacon Roofing is poised to garner significant synergies from its recent acquisition of RSG. Both companies are also a beneficiary of an improving new home construction market.
Health care, a slightly underweight sector, was our second strongest contributor, with our holdings up 13% versus a return of 9% for the benchmark. Our returns were driven largely by our pharmaceutical and biotechnology holdings. Intrexon Corp., a synthetic biology company, was our top contributing stock, up 56%. Earlier in the year they announced two important partnerships in the area of cancer research that increased investor awareness of the company’s technology
platform. Intrexon entered into a licensing pact with MD Anderson Cancer Center related to maximizing therapeutic efficacy. The second announcement was with German-based Merck Serono, the biotechnology division of Merck. Intrexon will receive upfront payments and subsequent milestone payments tied to the success of developing chimeric antigen receptor products. Given the strong surge in the stock, we materially reduced our position. Bluebird Bio, Inc. rose 88% during the period as investors continue to be optimistic that the company’s gene therapy solution will gain approval to treat a rare blood disorder called beta thalassemia. Additionally, many believe that the company’s gene therapy solutions may also address an even larger market opportunity, sickle cell disease, a serious disorder in which the body makes sickle-shaped red blood cells. Our third contributor was DexCom, up 85%, a developer of continuous glucose monitoring systems addressing the Type 1 diabetes market. The company continues to consistently grow its business over 40% per year as its sensor product is gaining substantial share.
China’s substantial economic deceleration has stifled growth in most Emerging Markets that thrived off China’s decade-long investment boom. The economic headwinds facing Emerging Markets have, in turn, dampened earnings for exporters and commodity-linked producers. The concurrent ascent of the Dollar depressed profits for multi-national corporations and led to credit spreads widening for many Emerging Market countries as well as commodity and related industrial producers. This has resulted in a short term “earnings recession” as S&P earnings expectations have been marked down for a number of quarters. The resulting stress in global markets and associated drop in inflation has led to uncertainty in U.S. Federal Reserve policy, prompting further worries in financial markets. The silver lining to the current situation, however, is that the U.S. economy is 70% consumer driven and a strong Dollar and low commodity prices should, in time, boost consumer purchasing power. Despite significant challenges in Emerging Markets, fundamentals for developed markets, and the U.S. specifically, have shown improved trends. Domestic areas of strength include employment, housing, auto production, real domestic profits and
disposable income. In the short term, the tug-of-war between improving domestic conditions and deteriorating Emerging Market conditions is being won by the latter. Over the long term, however, we think markets will take their direction from improved domestic fundamentals, as was the case during the 1998 Asian Contagion and Russian Default, with the bull market resuming after a period of volatility.
In terms of positioning the Fund, we believe investors have been seeking out safe haven growth areas that are less dependent on global macroeconomic conditions. The resulting crowding effect has driven multiples in select areas of the market to lofty levels. We have taken profits in several of these perceived winners as valuation became less appealing, particularly in the biotech industry. We have added exposure to domestic-centric consumer investments, given improved employment and the benefits of lower commodity prices on discretionary spending.
This commentary reflects the viewpoints of the portfolio manager, Frontier Capital Management Company, LLC as of October 31, 2015 and is not intended as a forecast or guarantee of future results.
The Russell 2000®Growth Index measures the performance of the Russell 2000 companies with higher price-to-book ratios and higher forecasted growth values. Unlike the Fund, the Russell 2000® Growth Index is unmanaged, is not available for investment and does not uncur expenses.
The Russell 2000®Index is composed of the 2,000 smallest stocks in the Russell 3000®Index and is widely regarded in the industry as the premier measure of small-cap stock performance. Unlike the Fund, the Russell 2000® Index is unmanaged, is not available for investment and does not incur expenses.
The Russell 1000® Index measures the performance of approximately 1,000 of the largest securities based on a combination of their market cap and current index membership. The Russell 1000 represents approximately 92% of the U.S. market. Unlike the Fund, the Russell 1000® Index is unmanaged, is not available for investment, and does not incur expenses.
5
AMG Frontier Small Cap Growth Fund
Portfolio Manager’s Comments (continued)
CUMULATIVE TOTAL RETURN PERFORMANCE
AMG Frontier Small Cap Growth Fund’s cumulative total return is based on the daily change in net asset value (NAV), and assumes that all dividends and distributions were reinvested. This graph compares a hypothetical $10,000 investment made in AMG Frontier Small Cap Growth Fund’s Service Class on October 31, 2005, to a $10,000 investment made in the Russell 2000® Growth Index for the same time period. The graph and table do not reflect the deduction of taxes that a shareholder would pay on a Fund distribution or redemption of shares. The listed returns for the Fund are net of expenses and the returns for the index exclude expenses. Total returns would have been lower had certain expenses not been reduced.
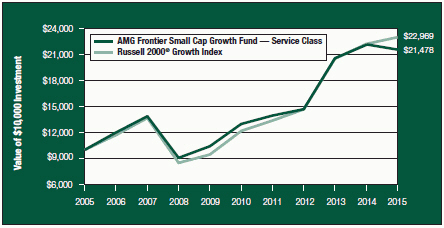
The table below shows the average annual total returns for the AMG Frontier Small Cap Growth Fund and the Russell 2000® Growth Index for the same time periods ended October 31, 2015.
| | | | | | | | | | | | | | | | | | | | |
| | | One | | | Five | | | Ten | | | Since | | | Inception | |
| Average Annual Total Returns1 | | Year | | | Years | | | Years | | | Inception | | | Date | |
AMG Frontier Small Cap Growth Fund2,3,4 | | | | | | | | | | | | | | | | | | | | |
Investor Class | | | (3.02 | )% | | | 10.33 | % | | | — | | | | 11.28 | % | | | 01/01/10 | |
Service Class | | | (2.74 | )% | | | 10.61 | % | | | 7.94 | % | | | 7.11 | % | | | 09/24/97 | |
Institutional Class | | | (2.51 | )% | | | 10.89 | % | | | — | | | | 11.81 | % | | | 01/01/10 | |
Russell 2000® Growth Index5 | | | 3.52 | % | | | 13.56 | % | | | 8.67 | % | | | 5.29 | % | | | 09/24/97 | † |
The performance data shown represents past performance. Past performance is not a guarantee of future results. Current performance may be lower or higher than the performance data quoted. The investment return and principal value of an investment in the Fund will fluctuate so that an investor’s shares, when redeemed, may be worth more or less than their original cost.
Investors should carefully consider the Fund’s investment objectives, risks, charges and expenses before investing. For performance information through the most recent month end, current net asset values per share for the Fund and other information, please call (800) 835-3879 or visit our website at www.amgfunds.com for a free prospectus. Read it carefully before investing or sending money.
Distributed by AMG Distributors, Inc., member FINRA/SIPC.
| † | Date reflects inception date of the Fund, not the index. |
| 1 | Total return equals income yield plus share price change and assumes reinvestment of all dividends and capital gain distributions. Returns are net of fees and may reflect offsets of Fund expenses as described in the prospectus. No adjustment has been made for taxes payable by shareholders on their reinvested dividends and capital gain distributions. Returns for periods greater than one year are annualized. The listed returns on the Fund are net of expenses and based on the published NAV as of October 31, 2015. All returns are in U.S. dollars ($). |
| 2 | From time to time, the Fund’s advisor has waived its fees and/or absorbed Fund expenses, which has resulted in higher returns. |
| 3 | The Fund invests in growth stocks, which may be more sensitive to market movements because their prices tend to reflect future investor expectations rather than just current profits. Growth stocks may underperform value stocks during given periods. |
| 4 | The Fund is subject to risks associated with investments in small-capitalization companies, such as erratic earnings patterns, competitive conditions, limited earnings history, and a reliance on one or a limited number of products. |
| 5 | The Russell 2000® Growth Index measures the performance of Russell 2000 companies with higher price-to-book ratios and higher forecasted growth values. Unlike the Fund, the Russell 2000® Growth Index is unmanaged, is not available for investment, and does not incur expenses. |
The Russell 2000® Growth Index is a registered trademark of Russell Investments. Russell is a trademark of Russell Investments.
Not FDIC insured, nor bank guaranteed. May lose value.
6
AMG Frontier Small Cap Growth Fund
Fund Snapshots (unaudited)
October 31, 2015
PORTFOLIO BREAKDOWN
| | | | | | | | |
| | | AMG Frontier | | | Russell | |
| | | Small Cap | | | 2000® | |
Sector | | Growth Fund** | | | Growth Index | |
Information Technology | | | 28.2 | % | | | 24.9 | % |
Health Care | | | 20.8 | % | | | 26.1 | % |
Industrials | | | 18.3 | % | | | 13.1 | % |
Consumer Discretionary | | | 14.7 | % | | | 17.9 | % |
Financials | | | 10.2 | % | | | 7.9 | % |
Telecommunication Services | | | 1.3 | % | | | 0.8 | % |
Consumer Staples | | | 1.1 | % | | | 3.5 | % |
Materials | | | 0.9 | % | | | 4.3 | % |
Energy | | | 0.6 | % | | | 1.4 | % |
Utilities | | | 0.0 | % | | | 0.1 | % |
Other Assets and Liabilities | | | 3.9 | % | | | 0.0 | % |
| ** | As a percentage of net assets. |
TOP TEN HOLDINGS
| | | | |
| | | % of | |
Security Name | | Net Assets | |
Watsco, Inc.* | | | 3.5 | % |
Signature Bank* | | | 2.6 | |
Raymond James Financial, Inc.* | | | 2.6 | |
Blackhawk Network Holdings, Inc. | | | 2.4 | |
LKQ Corp. | | | 2.1 | |
MasTec, Inc. | | | 2.1 | |
Ellie Mae, Inc.* | | | 2.0 | |
Jack Henry & Associates, Inc. | | | 2.0 | |
HealthSouth Corp. | | | 1.9 | |
Fleetmatics Group PLC | | | 1.8 | |
| | | | |
Top Ten as a Group | | | 23.0 | % |
| | | | |
| * | Top Ten Holdings as of April 30, 2015. |
Because a fund’s strategy may result in multiple investments in particular sectors of the economy, its performance may depend on the performance of those sectors and may fluctuate more widely than investments diversified across more sectors. For additional information on these and other risk considerations, please see the Fund’s prospectus.
Any sectors, industries, or securities discussed should not be perceived as investment recommendations. Mention of a specific security should not be considered a recommendation to buy or solicitation to sell that security. Specific securities mentioned in this report may have been sold from the Fund’s portfolio of investments by the time you receive this report.
7
AMG Frontier Small Cap Growth Fund
Schedule of Portfolio Investments
October 31, 2015
| | | | | | | | |
| | | Shares | | | Value | |
Common Stocks - 96.1% | | | | | | | | |
Consumer Discretionary - 14.7% | | | | | | | | |
2U, Inc.*,1 | | | 16,232 | | | $ | 340,547 | |
American Eagle Outfitters, Inc.1 | | | 5,359 | | | | 81,886 | |
Boot Barn Holdings, Inc.*,1 | | | 11,327 | | | | 169,905 | |
Chico’s FAS, Inc. | | | 19,249 | | | | 266,021 | |
Deckers Outdoor Corp.*,1 | | | 5,208 | | | | 289,877 | |
Dorman Products, Inc.*,1 | | | 7,798 | | | | 364,011 | |
DSW, Inc., Class A | | | 15,877 | | | | 395,972 | |
Fiesta Restaurant Group, Inc.* | | | 5,278 | | | | 186,630 | |
Fox Factory Holding Corp.*,1 | | | 18,188 | | | | 322,837 | |
The Habit Restaurants, Inc., Class A* | | | 2,433 | | | | 58,100 | |
Harman International Industries, Inc. | | | 3,965 | | | | 435,991 | |
IMAX Corp.* | | | 8,509 | | | | 326,661 | |
LKQ Corp.* | | | 20,827 | | | | 616,687 | |
Noodles & Co.* | | | 3,741 | | | | 55,255 | |
Rentrak Corp.*,1 | | | 1,774 | | | | 97,889 | |
Tilly’s, Inc., Class A* | | | 16,083 | | | | 117,245 | |
Visteon Corp.* | | | 1,542 | | | | 168,186 | |
Total Consumer Discretionary | | | | | | | 4,293,700 | |
Consumer Staples - 1.1% | | | | | | | | |
Natural Grocers by Vitamin Cottage, Inc.* | | | 13,641 | | | | 326,702 | |
Energy - 0.6% | | | | | | | | |
Bonanza Creek Energy, Inc.* | | | 23,560 | | | | 134,056 | |
Carrizo Oil & Gas, Inc.* | | | 128 | | | | 4,817 | |
Oasis Petroleum, Inc.*,1 | | | 2,553 | | | | 29,691 | |
Total Energy | | | | | | | 168,564 | |
Financials - 10.2% | | | | | | | | |
Allied World Assurance Co. Holdings AG | | | 12,811 | | | | 465,808 | |
Argo Group International Holdings, Ltd. | | | 5,728 | | | | 358,115 | |
Jones Lang LaSalle, Inc. | | | 2,326 | | | | 387,767 | |
Raymond James Financial, Inc. | | | 13,635 | | | | 751,425 | |
Renasant Corp. | | | 7,058 | | | | 244,419 | |
Signature Bank* | | | 5,124 | | | | 763,066 | |
Total Financials | | | | | | | 2,970,600 | |
Health Care - 20.8% | | | | | | | | |
ABIOMED, Inc.* | | | 2,046 | | | | 150,708 | |
Alkermes PLC* | | | 4,997 | | | | 359,384 | |
Amsurg Corp.* | | | 1,230 | | | | 86,211 | |
Avalanche Biotechnologies, Inc.*,1 | | | 2,706 | | | | 22,812 | |
Bluebird Bio, Inc.* | | | 61 | | | | 4,705 | |
| | | | | | | | |
| | | Shares | | | Value | |
Celldex Therapeutics, Inc.*,1 | | | 40,957 | | | $ | 493,941 | |
Cynosure, Inc., Class A* | | | 300 | | | | 11,292 | |
DexCom, Inc.* | | | 5,982 | | | | 498,420 | |
Foundation Medicine, Inc.* | | | 1,503 | | | | 33,697 | |
HealthSouth Corp. | | | 15,625 | | | | 544,219 | |
HeartWare International, Inc.* | | | 7,063 | | | | 305,051 | |
Insys Therapeutics, Inc.*,1 | | | 1,575 | | | | 40,572 | |
Intrexon Corp.*,1 | | | 2,863 | | | | 96,197 | |
Kite Pharma, Inc.*,1 | | | 5,333 | | | | 362,911 | |
The Medicines Co.* | | | 4,138 | | | | 141,685 | |
Medidata Solutions, Inc.* | | | 9,547 | | | | 410,521 | |
MEDNAX, Inc.* | | | 6,879 | | | | 484,763 | |
Molina Healthcare, Inc.*,1 | | | 5,376 | | | | 333,312 | |
Myriad Genetics, Inc.*,1 | | | 11,116 | | | | 448,753 | |
NantKwest, Inc.* | | | 1,261 | | | | 15,006 | |
PAREXEL International Corp.* | | | 7,231 | | | | 456,421 | |
PTC Therapeutics, Inc.* | | | 4,930 | | | | 122,609 | |
Sangamo BioSciences, Inc.* | | | 4,215 | | | | 29,716 | |
STERIS Corp.*,1 | | | 4,433 | | | | 332,253 | |
Team Health Holdings, Inc.* | | | 2,576 | | | | 153,710 | |
Unilife Corp.* | | | 20,941 | | | | 15,781 | |
United Therapeutics Corp.* | | | 800 | | | | 117,304 | |
Total Health Care | | | | | | | 6,071,954 | |
Industrials - 18.3% | | | | | | | | |
A. O. Smith Corp. | | | 3,627 | | | | 278,626 | |
The Advisory Board Co.* | | | 6,545 | | | | 286,867 | |
American Woodmark Corp.* | | | 1,755 | | | | 127,589 | |
Beacon Roofing Supply, Inc.* | | | 12,519 | | | | 443,047 | |
Caesarstone Sdot-Yam, Ltd. | | | 5,403 | | | | 191,861 | |
Carlisle Cos., Inc. | | | 2,432 | | | | 211,584 | |
CEB, Inc. | | | 1,676 | | | | 125,298 | |
FTI Consulting, Inc.* | | | 2,998 | | | | 101,962 | |
Generac Holdings, Inc.*,1 | | | 6,662 | | | | 210,253 | |
KAR Auction Services, Inc. | | | 12,918 | | | | 496,051 | |
Kirby Corp.* | | | 1,618 | | | | 105,639 | |
MasTec, Inc.* | | | 36,402 | | | | 610,462 | |
On Assignment, Inc.* | | | 2,815 | | | | 126,985 | |
Quanta Services, Inc.* | | | 10,013 | | | | 201,361 | |
Stock Building Supply Holdings, Inc.* | | | 3,314 | | | | 57,266 | |
Swift Transportation Co.* | | | 16,660 | | | | 260,396 | |
TransUnion* | | | 13,813 | | | | 355,132 | |
The accompanying notes are an integral part of these financial statements.
8
AMG Frontier Small Cap Growth Fund
Schedule of Portfolio Investments (continued)
| | | | | | | | |
| | | Shares | | | Value | |
Industrials - 18.3% (continued) | | | | | | | | |
WABCO Holdings, Inc.* | | | 1,361 | | | $ | 152,745 | |
Watsco, Inc. | | | 8,190 | | | | 1,007,616 | |
Total Industrials | | | | | | | 5,350,740 | |
Information Technology - 28.2% | | | | | | | | |
3D Systems Corp.*,1 | | | 12,770 | | | | 128,466 | |
Belden, Inc. | | | 6,584 | | | | 421,574 | |
Benefitfocus, Inc.*,1 | | | 8,572 | | | | 273,961 | |
Blackhawk Network Holdings, Inc.* | | | 16,188 | | | | 689,285 | |
Callidus Software, Inc.* | | | 19,535 | | | | 339,323 | |
Cornerstone OnDemand, Inc.* | | | 11,455 | | | | 360,832 | |
Ellie Mae, Inc.* | | | 8,021 | | | | 585,373 | |
Envestnet, Inc.*,1 | | | 2,390 | | | | 71,365 | |
Euronet Worldwide, Inc.* | | | 5,163 | | | | 414,279 | |
Fair Isaac Corp. | | | 2,056 | | | | 189,913 | |
Fleetmatics Group PLC* | | | 9,548 | | | | 531,442 | |
FLIR Systems, Inc. | | | 6,131 | | | | 163,514 | |
Fortinet, Inc.* | | | 2,163 | | | | 74,321 | |
Genpact, Ltd.* | | | 4,768 | | | | 118,151 | |
Gogo, Inc.*,1 | | | 993 | | | | 14,031 | |
Ingram Micro, Inc., Class A | | | 10,625 | | | | 316,412 | |
Jack Henry & Associates, Inc. | | | 7,428 | | | | 574,482 | |
Kulicke & Soffa Industries, Inc.* | | | 4,876 | | | | 51,686 | |
Leidos Holdings, Inc. | | | 2,227 | | | | 117,073 | |
Marketo, Inc.* | | | 4,176 | | | | 122,900 | |
MAXIMUS, Inc. | | | 6,136 | | | | 418,475 | |
New Relic, Inc.* | | | 4,080 | | | | 161,772 | |
ON Semiconductor Corp.* | | | 15,972 | | | | 175,692 | |
QLogic Corp.* | | | 30,628 | | | | 379,787 | |
Qorvo, Inc.* | | | 4,508 | | | | 198,036 | |
RealPage, Inc.* | | | 11,584 | | | | 195,770 | |
Rovi Corp.* | | | 19,719 | | | | 180,429 | |
Semtech Corp.* | | | 1,747 | | | | 30,572 | |
Synchronoss Technologies, Inc.* | | | 2,063 | | | | 72,576 | |
Tangoe, Inc.* | | | 34,412 | | | | 284,931 | |
Tessera Technologies, Inc. | | | 9,414 | | | | 329,208 | |
Virtusa Corp.* | | | 1,458 | | | | 83,733 | |
Web.com Group, Inc.* | | | 7,521 | | | | 176,518 | |
Total Information Technology | | | | | | | 8,245,882 | |
| | | | | | | | |
| | | Shares | | | Value | |
Materials - 0.9% | | | | | | | | |
Globe Specialty Metals, Inc. | | | 10,483 | | | $ | 132,295 | |
Kraton Performance Polymers, Inc.* | | | 7,264 | | | | 148,113 | |
Total Materials | | | | | | | 280,408 | |
Telecommunication Services - 1.3% | | | | | |
Cogent Communications Holdings, Inc. | | | 12,490 | | | | 383,693 | |
Total Common Stocks
(cost $22,771,727) | | | | | | | 28,092,243 | |
| | |
| | | Principal
Amount | | | | |
Short-Term Investments - 14.3% | | | | | | | | |
Repurchase Agreements - 8.6%2 | | | | | | | | |
Daiwa Capital Markets America, dated 10/30/15, due 11/02/15, 0.090%, total to be received $1,000,008 (collateralized by various U.S. Government Agency Obligations, 0.000% - 7.500%, 11/05/15 - 02/01/49, totaling $1,020,000) | | $ | 1,000,000 | | | | 1,000,000 | |
ING Financial Markets, LLC, dated 10/30/15, due 11/02/15, 0.080%, total to be received $507,954 (collateralized by various U.S. Government Agency Obligations, 1.696% - 6.260%, 12/01/19 - 08/01/46, totaling $518,114) | | | 507,951 | | | | 507,951 | |
Nomura Securities International, Inc., dated 10/30/15, due 11/02/15, 0.080%, total to be received $1,000,007 (collateralized by various U.S. Government Agency Obligations, 0.000% - 10.500%, 11/04/15 - 09/20/65 totaling $1,020,000) | | | 1,000,000 | | | | 1,000,000 | |
Total Repurchase Agreements | | | | | | | 2,507,951 | |
| | |
| | | Shares | | | | |
Other Investment Companies - 5.7%3 | | | | | |
Dreyfus Institutional Cash Advantage Fund, Institutional Class Shares, 0.09% | | | 1,659,792 | | | | 1,659,792 | |
Total Short-Term Investments
(cost $4,167,743) | | | | | | | 4,167,743 | |
Total Investments - 110.4%
(cost $26,939,470) | | | | | | | 32,259,986 | |
Other Assets, less Liabilities - (10.4)% | | | | | | | (3,043,434 | ) |
Net Assets - 100.0% | | | | | | $ | 29,216,552 | |
The accompanying notes are an integral part of these financial statements.
9
AMG TimesSquare All Cap Growth Fund
Portfolio Manager’s Comments (unaudited)
The AMG TimesSquare All Cap Growth Fund
(the “Fund”) seeks to achieve long-term capital appreciation by investing in the stocks of large-, mid- and small-capitalization companies.
THE PORTFOLIO MANAGER
TimesSquare Capital Management, LLC (“TimesSquare”), the Fund’s subadvisor, utilizes a bottom-up fundamental approach to all-cap investing. Led by co-managers Kenneth Duca, Tony Rosenthal and Grant Babyak, the investment team at TimesSquare believes its proprietary fundamental research skills, which place a particular emphasis on the assessment of management quality and an in-depth understanding of superior business models, enable the team to build a diversified portfolio of large-cap, mid-cap and small-cap growth stocks designed to generate solid risk-adjusted returns. When selecting growth stocks, Fund management utilizes a fundamental, bottom-up process to identify companies that demonstrate consistent and sustainable revenue and earnings growth, offer distinct and sustainable competitive advantages, have strong, experienced management teams, have stocks selling at reasonable valuations and that Fund management believes have the potential to appreciate in price by 25 to 50% within the next 12 to 18 months.
THE PERIOD IN REVIEW
For the fiscal year ended October 31, 2015, the AMG TimesSquare All Cap Growth Fund (Investor Class Shares) returned 7.9%, underperforming the Russell 3000® Growth Index, which returned 8.7%.
Looking back, 2014 was a year punctuated with notable highs and lows across the U.S. economic landscape. The third-quarter 2014 GDP growth rate of 5.0% was the highest economic activity level in 11 years and, coincidentally, the U.S. Dollar reached an 11-year high compared with the other major currencies. Meanwhile, commodity prices fell to depths not seen since the 2008 recession. Of particular note was the decline in oil prices, which were nearly cut in half during the fourth quarter of 2014. In other pre-2008 comparisons,
annual sales of U.S. automobiles appeared to stabilize above 16 million and the unemployment rate steadily declined throughout 2014 as it approached its pre-recession level. The U.S. Federal Reserve (the Fed) consistently tapered its billions of dollars of monthly bond purchases (i.e., quantitative easing) throughout the year and ended the program as expected in October. A final high note for 2014 was that the broad U.S. equity markets notched their sixth consecutive positive calendar year with roughly 12-13% returns. Much of those gains occurred in the fourth quarter, where the broad U.S. equity markets posted roughly 5% returns. Supporting the GDP growth rates were stable measures of manufacturing and service activity as the Institute for Supply Management’s (ISM’s) readings moderated, but consistently remained in the economic expansion range. Particularly notable this quarter was the rapid decline in oil prices, which fell to 12-month lows month after month, and ended at $53 per barrel. Likely influenced by the resulting lower gasoline prices, this quarter’s measures of consumer confidence and sentiment reached their highest levels in years.
Although U.S. equities stumbled in January, the next two months more than recovered that ground, and all major indices posted gains for the first quarter of 2015. Underlying those market increases, however, were some economic retrenchments. The final measure of fourth-quarter GDP growth was dampened to 2.2%, lower than the earlier readings and below expectations. According to measures from the ISM, manufacturing activity slowed and approached the transition point from economic expansion to contraction. Meanwhile, the ISM’s metric for non-manufacturing activity–which represents a larger portion of the U.S. economy–held steady in the expansion zone. After falling sharply at the end of 2014, energy prices were relatively stable during the quarter, although the U.S. Dollar continued its climbing appreciation compared with other major currencies.
A series of macroeconomic stresses sapped the energy from the U.S. equity markets in the waning days of the second quarter, leaving the major indices with flat-to-negative returns. Overseas, the financial situation worsened for Greece as its government prepared to default on payments owed to its International Monetary Fund (IMF) and European Central Bank (ECB) creditors. Concerns about European disunion and the potential economic costs of Greece staying or going spilled over into the global equity markets and affected any company generating revenue in Europe. Further east, weakness in China continued as it officially entered bear-market territory, which had ripple effects on companies with any exposure to Chinese businesses or retail consumers. Moving back to the U.S., Puerto Rico’s governor announced that its $72 billion of public debt could not be repaid without significant restructuring by its creditors. Lastly among the notable events moving markets in the second quarter was the U.S. Supreme Court’s affirmation of a key provision in the Affordable Care Act (ACA) that seemed to quell any further judicial challenges to 2010’s health care reform, which had begun to take effect in 2014. Delving into the U.S. markets in more detail, the final measure of first quarter GDP growth stood at (0.2)%, which was a slight improvement over the prior estimate and was in what typically would be a seasonal economic lull. The ISM’s measure of manufacturing activity climbed, though the level of non-manufacturing activity–which represents a larger portion of the U.S. economy–was below expectations. Both readings, however, remained well within the economic expansion zone. Oil and natural gas prices seemed to have stabilized at their current levels, albeit near their respective one-year lows. Moving upward sharply were measures of consumer confidence and sentiment, both of which exceeded expectations. The unemployment rate dipped to 5.3%, a level not seen since early 2008, although real wage growth has slowed recently.
10
AMG TimesSquare All Cap Growth Fund
Portfolio Manager’s Comments (continued)
Global equities retreated sharply in the third quarter, sending nearly all equity markets into negative territory for the year. In July, Greece agreed to austerity measures for continued monetary support from its IMF and ECB creditors, though the results of that weighed on the rest of the Euro Zone. Then, in August, China surprised the markets by devaluing its currency and enacting additional stimulus measures to combat its domestic economic weakness. Later in September, there were two significant non-events in the U.S.: the avoidance of a federal government shutdown and the absence of an increase in the federal funds rate — though both had the possibility of occurring later this year. A new spending bill was passed just before the federal fiscal year ended on September 30, but it only extended current spending levels until mid-December. Meanwhile the Fed let its current zero-interest-rate policy stand, however, Fed Chair Janet Yellen subsequently indicated that the Fed remained comfortable with the prospect for a rate increase by the end of the year.
While the U.S. markets held up better than their overseas counterparts, the broad-based indices declined by more than (6)%. Equity market volatility spiked upward in late August and has since remained at levels higher than seen over the last year. Economic signals ran the gamut this quarter. The final reading on the second-quarter’s GDP growth rate edged higher to 3.9%, boosted by gains in consumer spending and construction, and there was an atypical revision to the first-quarter’s growth rate up from (0.2)% to positive territory at 0.6%. However, the ISM’s measures of manufacturing and non-manufacturing activities steadily declined during this quarter, with manufacturing toeing the line that separated economic expansion from contraction. Measures of consumer confidence and sentiment took divergent paths during the quarter. Confidence strengthened to its highest level since 2007 with an improved labor market that saw the unemployment rate decline to 5.1% over the quarter. Consumer Sentiment, however, was shaken by a weaker stock market. Further fueling
future economic concerns, Fed projections for third-quarter GDP growth have been lowered. Although oil and commodity prices spiked sharply upward at the end of August, they had been falling steadily previously and ended the quarter at low levels not seen since 2009. Perhaps not unconnected, the seasonal rate of annual automotive sales reached a new post-financial crisis high.
Shaking off the ghosts of Octobers past — as well as poor returns from earlier in the year — the U.S. equity markets rose sharply in October 2015. The broad market indices climbed more than 8% at a steady pace, which led to a significant decline of recent market volatility. The initial reading for the third-quarter’s GDP growth rate was 1.5%, slightly lower than expected. The ISM’s measure of manufacturing activity dipped slightly to the cusp that separated expansion from contraction, though the level of non-manufacturing activity — which represents a larger portion of the U.S. economy — climbed faster than expected. Also better than expected was this month’s annual rate of U.S. auto sales. Even though the unemployment level fell to 5% - the lowest level since April 2008, measures of consumer sentiment and confidence retreated from prior levels and were below expectations.
The Fund underperformed the Russell 3000® Growth Index for the twelve months ending October 31, 2015. Stocks in the Fund’s consumer discretionary, consumer staples, energy and health care sectors lagged their index counterparts. Relative strength was found in financial services, materials and processing, producer durables and technology. Sector allocation had a net positive effect, although sector weights are a bi-product of bottom-up stock selection for this concentrated all-cap fund.
In the consumer discretionary sector, BorgWarner Inc. develops powertrain technologies that improve fuel economy and performance with products such as turbochargers, transmission systems and thermal management systems. Concerns over
weakness in China weighed on the auto suppliers industry. Further strains for Borg Warner are associated with having Volkswagen as a customer, though it’s important to note that none of Borg Warner’s products are associated with the diesel emissions issue. Nevertheless, these factors led management to lower forward guidance and its shares retreated (15)%. We liquidated the position during the third quarter of 2015. Dollar Tree Inc. was added to the Fund during the third quarter of 2015. They own and operate discount variety stores offering merchandise at fixed prices. Dollar Tree’s core business remains healthy. The challenge is that its management has been unable thus far to provide earnings guidance following the acquisition of Family Dollar. The difficulty of projecting profitability and forecasting the pace of integration represent uncertainty for investors, thereby causing a (15)% sell-off. Hilton Worldwide Holdings, Inc. owns, manages and franchises hotels, resorts and timeshare properties. Its brands include its namesake, Conrad, DoubleTree and Embassy Suites. The company is high quality, well managed, and possessing a large pipeline of hotel development. They also possess a sizable recurring revenue stream from franchise, management and timeshare financing fees. However, domestic demand across the hotel industry was weaker than expected during the third quarter. Initial revenue per available room guidance for 2016 represents a modest deceleration from the 2015 level and caused its stock to fall (3)%. On the positive side of the ledger, The Walt Disney Co. jumped 26%. This entertainment company possesses business segments including broadcast television, radio network, theme parks, resort hotels, motion pictures, staged plays and licensed consumer products. Disney reported solid results across all business segments in their latest quarter. The company’s Consumer Products and Studio units were especially strong. U.S. park attendance and hotel occupancy outweighed a slight drag from international results. Its upcoming movie slate features the latest chapter in the Star Wars saga, which will be released in December.
11
AMG TimesSquare All Cap Growth Fund
Portfolio Manager’s Comments (continued)
Development of a sequel to Frozen was also announced. NIKE Inc. is the largest athletic company in the world. They design, develop and market footwear, apparel, equipment and accessories. The company continues to generate growth through product innovation, market share gains and expanding into new markets. In their latest period, they reported broad-based global revenue growth and strong margins stemming from disciplined expense management. Shares of Nike leaped 41% over the year. Ross Stores Inc. is an off-price retailer of apparel and home accessories. Second-quarter results were strong, same store sales comparisons were slightly better than estimates and new store openings are on plan. Management modestly raised full year guidance. We used this strength to book the 28% increase for the year and sell the position out of the Fund.
We had mixed performance in consumer staples. TreeHouse Foods Inc., a private label food company, dropped (17)%. The company reported a soft first quarter due to a decline in single-serve coffee and continued weakness in their snack business. We sold the stock out of the Fund in the second quarter of 2015 due to uncertainty with respect to the timing of a potential turnaround. WhiteWave Foods Co. produces plant-based foods, beverages, coffee creamers and dairy products. Its brands include Silk, Alpro, Land O’ Lakes and Horizon Organic. Europe has been a notable area of strength with double-digit growth. WhiteWave made two acquisitions: Vega (a marketer of powdered shakes and snack bars) and Wallaby Yogurt (a producer of Kefir drinks as well as Greek and Australian yogurts). These developments served to lift the stock by 14%.
The decline in the underlying commodity prices pressured companies within the energy sector. Schlumberger NV, an oilfield services company, slid (15)%. Schlumberger reported a strong fourth quarter of 2014, driven by record activity in North America, the Middle East and Asia. Lower oil prices caused an uncertain outlook. As such, management did not have good visibility in either
the short or long term. We exited the position during the first quarter of 2015. Exploration and production company EP Energy Corp. fell (21)%. Their operations are located in Texas, Utah and Louisiana. EP Energy’s fourth quarter 2014 results were in line with expectations. Forward production and capital expenditure guidance were lowered. Investors had expected the company to continue producing and spending according to plan given their strong hedged position. We decided to liquidate the position during the first quarter of 2015. Continental Resources Inc. is an exploration and production company with operations in North Dakota, Montana and Oklahoma. They reported stronger-than-expected second-quarter earnings along with better production volumes. Despite increasing their natural gas mix and prudently reducing capital expenditures, lower production levels and oil prices caused the stock to slide (36)%. We sold the stock out of the Fund during the third quarter of 2015.
In health care, Envision Healthcare Holdings Inc. offers an array of services to the health care industry including physician services, emergency, anesthesiology, radiology, administration and ambulance transportation. Envision reported disappointing results in their latest quarter. Overstaffing issues in the face of lighter-than-expected volumes of emergency room visits hurt the company as did higher startup losses from new contracts. We believe the former can be managed and the latter should be temporary. Nevertheless, this caused its shares to fall by (20)%. Illumina Inc. is a developer of life science tools and integrated systems for analyzing genetic variation and biological function including DNA, RNA and protein analysis. Second-quarter earnings were slightly ahead of the consensus while sales fell short. Sequencing revenues were up, though offset by a decline in the microarray business. Illumina dropped (24)% and we sold the stock in October 2015. On a brighter note, shares of Allergan plc rose 26%. This is a specialty pharmaceutical company focused on generic, brand-name, biosimilar and other over-the-counter products. Allergan made two acquisitions of note.
They acquired Kybella in order to continue building their Botox franchise and bought AqueSys, which produces glaucoma products. They also sold their generic drug business to TEVA. Management’s forward guidance is in line with Wall Street estimates. As the month of October 2015 wound down, news that Pfizer was considering a bid for Allergan served to boost its shares. Biogen Inc. develops therapies for treating neurological, autoimmune and hematologic disorders. They reported mixed results from a Phase II trial for its new multiple sclerosis drug. This trial was an important near-term catalyst for the stocks and we exited the position during the first quarter of 2015.
Within the financial services sector, WisdomTree Investments Inc., a sponsor and asset manager focused on exchange-traded funds (ETFs), climbed 33%. A shift to fee-based advisors and asset allocation models has prompted the flow of funds away from mutual funds and separate accounts into ETFs. Over the last year, WisdomTree has experienced strong inflows, with particular interest in their Japan hedged equity product and its Europe hedged equity product. Global Payments Inc. provides payment solutions for merchants, enterprise software providers, financial institutions and government agencies. We added the stock to the Fund in the third quarter of 2015. Global Payments has stable business fundamentals and an improving business mix. Canada has stabilized and new European Union interchange rules are going into effect in December which should benefit its U.K. operations. Management raised forward earnings guidance. Shares of Global Payments have risen 27% since it was added. Payments network company MasterCard Inc. advanced 18%. The company is well positioned for the continued global migration to electronic payments and with new technology, inclusive of mobile. In the latest quarter, MasterCard reported a beat to earnings estimates driven by purchase transaction volume growth in both the U.S. and International markets. McGraw Hill Financial Inc. was added to the Fund during the second quarter of 2015. They supply data and analytics to the capital, commodities and commercial markets. A meaningful second-quarter
12
AMG TimesSquare All Cap Growth Fund
Portfolio Manager’s Comments (continued)
earnings beat was overshadowed by investor concern over dilution from the pending acquisition of SNL Financial. Shares of McGraw Hill Financial fell (11)%.
In materials and processing, shares of Ecolab Inc. gained 9%. Their products and services are used in water treatment, pollution control and energy conservation. Weakness in the energy space has been offset by strength in its consumer-facing businesses and lower raw materials costs. In August 2015, Ecolab announced the acquisition of Swisher Hygiene’s U.S. operations.
Within the producer durables sector, Allegiant Travel Co. ascended 18% since it was added to the Fund in the second quarter of 2015. Allegiant is a low-cost airline focused on transporting leisure travelers from underserved cities to popular destinations such as Las Vegas, Phoenix, Orlando, Tampa/St. Petersburg, Fort Lauderdale and Honolulu. Improved second-quarter earnings were driven by better-than-expected operating income and lower fuel costs. Allegiant’s business model is differentiated versus peers. Management is committed to building a network based on targeting markets that other airlines can’t serve profitably on a non-stop basis. On Assignment Inc. is a provider of professional flexible and permanent staffing services in life sciences, health care, physician, information technology and engineering. We sold the position out of the Fund in the first quarter of 2015 and booked the 38% increase for the year after they reported strong fourth-quarter results. We added CoStar Group Inc. to the Fund during the first quarter of 2015. CoStar provides information and marketing services to the commercial real estate industry. Consistent and strong quarterly results throughout the year led to an 18% surge in their shares. They gained good traction after releasing a revamped Apartments.com website early in the year. We believe the upgraded version offers a compelling
value proposition with a more useful front-end coupled with CoStar’s superior market data. Towers Watson & Co. provides benefits consulting, administration and financial consulting services. In June, Towers announced their intentions to merge with Willis Group Holdings, which represented a departure from our investment thesis on the company. Therefore, we decided to book the 17% increase for the year and liquidate the position. CSX Corp. is a supplier of traditional rail services, transporting intermodal containers and trailers in the U.S. and Canada. First quarter 2015 results for CSX were better than expected. Forward guidance was, however, lowered and the stock traded down (5)%. We sold the stock from the Fund in the second quarter of 2015.
In technology, Cognizant Technology Solutions Corp. provides information technology, consulting and business process services to industries including financial services, health care, manufacturing and retail. The combination of a strong second quarter and guidance raise served to lift Cognizant’s shares by 33%. Revenues from banking, financial services, retail and manufacturing drove the upside. We decided to sell our position in the third quarter of 2015 due to the company’s large exposure to managed care. The consolidation in the space may lead to substantial delays in new IT projects and service engagements over the next several quarters. Paycom Software Inc., a provider of cloud-based human capital management software solutions, advanced 22%. Their Software-as-a-Service is targeted to small and mid-sized companies. They produced strong results and raised their forward guidance. Social networking company Facebook gained 35%. The company has had a great year, outpacing estimates quarter after quarter. Mobile now represents 75% of total advertising revenues as users migrate away from PCs to smartphones. Facebook’s business includes Instagram, Messenger, WhatsApp and Oculus. Applied
Materials Inc. specializes in manufacturing equipment and services for the semiconductor, flat panel display and solar photovoltaic industries. Second quarter revenues fell short of estimates while earnings were inline. Forward guidance was worse than expected and caused the stock to tumble (29)%. Management expects gross margins to contract for a period of time and the company will be implementing a round of cost cuts. We decided to sell the position during the third quarter of 2015. DigitalGlobe Inc. provides commercial earth imagery products and services in support of a wide range of clients in areas such as defense, intelligence, homeland security, mapping, analysis, environmental monitoring, oil and gas exploration and infrastructure management. Third-quarter 2015 results were below consensus estimates due to weakness in their commercial business, which typically is strong in the second half of the year. Management lowered forward guidance and the shares traded down (47)%. Our patience ran out and we liquidated the position.
Moving toward the end of 2015, the U.S markets are likely forecasting the end of the Fed’s zero-interest-rate policy. That would place the U.S. in a unique position relative to other countries and regions, where the monetary policies were biased toward further easing, and has potential ramifications on the U.S. Dollar’s relative strength. Regardless of those outcomes, our focus remains on fundamentally-based active management, seeking companies with sound business models and reasonable valuations.
This commentary reflects the viewpoints of the portfolio manager, TimesSquare Capital Management, LLC as of October 31, 2015 and is not intended as a forecast or guarantee of future results, and is subject to change without notice.
13
AMG TimesSquare All Cap Growth Fund
Portfolio Manager’s Comments (continued)
CUMULATIVE TOTAL RETURN PERFORMANCE
AMG TimesSquare All Cap Growth Fund’s cumulative total return is based on the daily change in net asset value (NAV), and assumes that all dividends and distributions were reinvested. This graph compares a hypothetical $10,000 investment made in AMG TimesSquare All Cap Growth Fund’s Institutional Class on July 30, 2010 (commencement of operations) to a $10,000 investment made in the Russell 3000® Growth Index for the same time period. The graph and table do not reflect the deduction of taxes that a shareholder would pay on a Fund distribution or redemption of shares. The listed returns for the Fund are net of expenses and the returns for the index exclude expenses. Total returns would have been lower had certain expenses not been reduced.
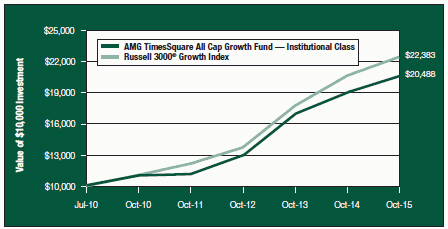
The table below shows the average annual total returns for the AMG TimesSquare All Cap Growth Fund and the Russell 3000® Growth Index for the same time periods ended October 31, 2015.
| | | | | | | | | | | | | | | | |
| | | One | | | Five | | | Since | | | Inception | |
| Average Annual Total Returns1 | | Year | | | Years | | | Inception | | | Date | |
AMG TimesSquare All Cap Growth Fund2,3,4,5,6 | | | | | | | | | | | | | | | | |
Investor Class | | | 7.85 | % | | | 12.86 | % | | | 14.12 | % | | | 07/30/10 | |
Service Class | | | 8.24 | % | | | 13.32 | % | | | 14.58 | % | | | 07/30/10 | |
Institutional Class | | | 8.36 | % | | | 13.37 | % | | | 14.63 | % | | | 07/30/10 | |
Russell 3000® Growth Index7 | | | 8.72 | % | | | 15.16 | % | | | 16.59 | % | | | 07/30/10 | † |
The performance data shown represents past performance. Past performance is not a guarantee of future results. Current performance may be lower or higher than the performance data quoted. The investment return and principal value of an investment in the Fund will fluctuate so that an investor’s shares, when redeemed, may be worth more or less than their original cost.
Investors should carefully consider the Fund’s investment objectives, risks, charges and expenses before investing. For performance information through the most recent month end, current net asset values per share for the Fund and other information, please call (800) 835-3879 or visit our website at www.amgfunds.com for a free prospectus. Read it carefully before investing or sending money.
Distributed by AMG Distributors, Inc., member FINRA/SIPC.
| † | Date reflects the inception date of the Fund, not the index. |
| 1 | Total return equals income yield plus share price change and assumes reinvestment of all dividends and capital gain distributions. Returns are net of fees and may reflect offsets of Fund expenses as described in the prospectus. No adjustment has been made for taxes payable by shareholders on their reinvested dividends and capital gain distributions. Returns for periods greater than one year are annualized. The listed returns on the Fund are net of expenses and based on the published NAV as of October 31, 2015. All returns are in U.S. dollars ($). |
| 2 | From time to time, the Fund’s advisor has waived its fees and/or absorbed Fund expenses, which has resulted in higher returns. |
| 3 | The Fund invests in growth stocks, which may be more sensitive to market movements because their prices tend to reflect future investor expectations rather than just current profits. Growth stocks may underperform value stocks during given periods. |
| 4 | The Fund is subject to risks associated with small-and mid-capitalization companies, such as erratic earnings patterns, competitive conditions, limited earnings history, and a reliance on one or a limited number of products. |
| 5 | A greater percentage of the Fund’s holdings may be focused in a smaller number of securities which may place the Fund at greater risk than a more diversified fund. |
| 6 | Investing in initial public offerings (IPOs) is risky and the prices of stocks purchased in IPOs tend to fluctuate more widely than stocks of companies that have been publicly traded for a longer period of time. Stocks purchased in IPOs generally do not have a trading history, and information about the companies may be available for very limited periods. |
| 7 | The Russell 3000® Growth Index measures the performance of those Russell 3000® Index companies with higher price-to-book ratios and higher forecasted growth values. Unlike the Fund, the Russell 3000® Growth Index is unmanaged, is not available for investment, and does not incur expenses. |
The Russell 3000® Growth Index is a registered trademark of Russell Investments. Russell is a trademark of Russell Investments.
Not FDIC insured, nor bank guaranteed. May lose value.
14
AMG TimesSquare All Cap Growth Fund
Fund Snapshots (unaudited)
October 31, 2015
PORTFOLIO BREAKDOWN
| | | | | | | | |
| | | AMG TimesSquare | | | Russell | |
| | | All Cap | | | 3000® | |
Sector | | Growth Fund** | | | Growth Index | |
Information Technology | | | 33.3 | % | | | 17.6 | % |
Consumer Discretionary | | | 18.5 | % | | | 14.1 | % |
Industrials | | | 16.6 | % | | | 12.5 | % |
Financials | | | 9.3 | % | | | 25.7 | % |
Health Care | | | 8.4 | % | | | 15.1 | % |
Materials | | | 5.0 | % | | | 3.8 | % |
Consumer Staples | | | 4.5 | % | | | 3.4 | % |
Utilities | | | 0.0 | % | | | 3.8 | % |
Energy | | | 0.0 | % | | | 3.1 | % |
Telecommunication Services | | | 0.0 | % | | | 0.9 | % |
Other Assets and Liabilities | | | 4.4 | % | | | 0.0 | % |
| ** | As a percentage of net assets. |
TOP TEN HOLDINGS
| | | | |
| | | % of | |
Security Name | | Net Assets | |
Alphabet, Inc., Class C | | | 5.4 | % |
Charter Communications, Inc., Class A | | | 4.7 | |
Alliance Data Systems Corp.* | | | 4.7 | |
CoStar Group, Inc.* | | | 4.5 | |
American Tower Corp.* | | | 4.1 | |
Facebook, Inc., Class A | | | 3.4 | |
Allergan PLC | | | 3.3 | |
Lowe’s Cos., Inc. | | | 3.3 | |
Apple, Inc.* | | | 3.2 | |
On Assignment, Inc. | | | 3.0 | |
| | | | |
Top Ten as a Group | | | 39.6 | % |
| | | | |
| * | Top Ten Holdings as of April 30, 2015. |
Because a fund’s strategy may result in multiple investments in particular sectors of the economy, its performance may depend on the performance of those sectors and may fluctuate more widely than investments diversified across more sectors. For additional information on these and other risk considerations, please see the Fund’s prospectus.
Any sectors, industries, or securities discussed should not be perceived as investment recommendations. Mention of a specific security should not be considered a recommendation to buy or solicitation to sell that security. Specific securities mentioned in this report may have been sold from the Fund’s portfolio of investments by the time you receive this report.
15
AMG TimesSquare All Cap Growth Fund
Schedule of Portfolio Investments
October 31, 2015
| | | | | | | | |
| | | Shares | | | Value | |
Common Stocks - 95.6% | | | | | | | | |
Consumer Discretionary - 18.5% | | | | | | | | |
Charter Communications, Inc., Class A*,1 | | | 12,800 | | | $ | 2,444,032 | |
Dollar Tree, Inc.* | | | 7,220 | | | | 472,838 | |
Hilton Worldwide Holdings, Inc. | | | 33,770 | | | | 843,912 | |
Lowe’s Cos., Inc. | | | 23,185 | | | | 1,711,749 | |
NIKE, Inc., Class B | | | 11,850 | | | | 1,552,706 | |
Starbucks Corp. | | | 24,235 | | | | 1,516,384 | |
The Walt Disney Co. | | | 9,555 | | | | 1,086,786 | |
Total Consumer Discretionary | | | | | | | 9,628,407 | |
Consumer Staples - 4.5% | | | | | | | | |
Mead Johnson Nutrition Co. | | | 12,615 | | | | 1,034,430 | |
The WhiteWave Foods Co.* | | | 31,825 | | | | 1,304,188 | |
Total Consumer Staples | | | | | | | 2,338,618 | |
Financials - 9.3% | | | | | | | | |
American Tower Corp. | | | 20,920 | | | | 2,138,652 | |
McGraw Hill Financial, Inc. | | | 4,690 | | | | 434,482 | |
Prudential Financial, Inc. | | | 11,720 | | | | 966,900 | |
WisdomTree Investments, Inc.1 | | | 67,220 | | | | 1,292,641 | |
Total Financials | | | | | | | 4,832,675 | |
Health Care - 8.4% | | | | | | | | |
Acadia Healthcare Co., Inc.* | | | 12,070 | | | | 741,219 | |
Allergan PLC* | | | 5,615 | | | | 1,732,059 | |
Cardinal Health, Inc. | | | 10,510 | | | | 863,922 | |
Envision Healthcare Holdings, Inc.* | | | 37,885 | | | | 1,068,357 | |
Total Health Care | | | | | | | 4,405,557 | |
Industrials - 16.6% | | | | | | | | |
Allegiant Travel Co. | | | 7,615 | | | | 1,503,582 | |
Avis Budget Group, Inc.* | | | 16,845 | | | | 841,239 | |
CLARCOR, Inc. | | | 15,700 | | | | 782,802 | |
Equifax, Inc. | | | 10,895 | | | | 1,161,080 | |
Nielsen Holdings PLC | | | 22,625 | | | | 1,074,914 | |
On Assignment, Inc.* | | | 34,985 | | | | 1,578,173 | |
Union Pacific Corp. | | | 8,630 | | | | 771,090 | |
West Corp. | | | 38,275 | | | | 911,328 | |
Total Industrials | | | | | | | 8,624,208 | |
Information Technology - 33.3% | | | | | | | | |
Alliance Data Systems Corp.* | | | 8,195 | | | | 2,436,455 | |
Alphabet, Inc., Class C* | | | 3,986 | | | | 2,833,289 | |
Apple, Inc. | | | 13,819 | | | | 1,651,371 | |
| | | | | | | | |
| | | Shares | | | Value | |
CoStar Group, Inc.* | | | 11,575 | | | $ | 2,350,535 | |
Facebook, Inc., Class A* | | | 17,125 | | | | 1,746,236 | |
Global Payments, Inc. | | | 11,305 | | | | 1,542,115 | |
MasterCard, Inc., Class A | | | 15,465 | | | | 1,530,880 | |
PayPal Holdings, Inc.* | | | 43,500 | | | | 1,566,435 | |
TE Connectivity, Ltd. | | | 17,255 | | | | 1,111,912 | |
Xactly Corp.* | | | 62,819 | | | | 584,217 | |
Total Information Technology | | | | | | | 17,353,445 | |
Materials - 5.0% | | | | | | | | |
Ecolab, Inc. | | | 8,755 | | | | 1,053,664 | |
PolyOne Corp. | | | 46,510 | | | | 1,555,294 | |
Total Materials | | | | | | | 2,608,958 | |
Total Common Stocks
(cost $42,205,746) | | | | | | | 49,791,868 | |
| | |
| | | Principal
Amount | | | | |
Short-Term Investments - 9.4% | | | | | | | | |
Repurchase Agreements - 4.2%2 | | | | | | | | |
Daiwa Capital Markets America, dated 10/30/15, due 11/02/15, 0.090%, total to be received $1,000,008 (collateralized by various U.S. Government Agency Obligations, 0.000% - 7.500%, 11/05/15 - 02/01/49, totaling $1,020,000) | | $ | 1,000,000 | | | | 1,000,000 | |
Nomura Securities International, Inc., dated 10/30/15, due 11/02/15, 0.080%, total to be received $1,000,007 (collateralized by various U.S. Government Agency Obligations, 0.000% - 10.500%, 11/04/15 - 09/20/65 totaling $1,020,000) | | | 1,000,000 | | | | 1,000,000 | |
Royal Bank of Scotland PLC, dated 10/30/15, due 11/02/15, 0.070%, total to be received $163,611 (collateralized by various U.S. Government Agency Obligations, 0.074% - 3.375%, 08/15/16 - 08/15/21, totaling $166,882) | | | 163,610 | | | | 163,610 | |
Total Repurchase Agreements | | | | | | | 2,163,610 | |
| | |
| | | Shares | | | | |
Other Investment Companies - 5.2%3 | | | | | | | | |
Dreyfus Institutional Cash Advantage Fund, Institutional Class Shares, 0.09% | | | 2,734,531 | | | | 2,734,531 | |
Total Short-Term Investments
(cost $4,898,141) | | | | | | | 4,898,141 | |
Total Investments - 105.0%
(cost $47,103,887) | | | | | | | 54,690,009 | |
Other Assets, less Liabilities - (5.0)% | | | | | | | (2,611,531 | ) |
Net Assets - 100.0% | | | | | | $ | 52,078,478 | |
The accompanying notes are an integral part of these financial statements.
16
AMG Managers Emerging Opportunities Fund
Portfolio Manager’s Comments (unaudited)
The AMG Managers Emerging Opportunities Fund primarily invests in the stocks of U.S. micro-capitalization companies. Normally the Fund invests at least 80% of its net assets in U.S. micro-cap stocks. The Fund employs multiple portfolio managers who specialize in distinct investment approaches. This “intelligence diversification” not only serves to manage risk, but also seeks to incorporate into the Fund’s portfolio the breadth of the micro-cap market by focusing different analytical insights on micro-cap investing. The Fund’s team of subadvisors strives to achieve this performance and diversification while ensuring that the Fund operates within the framework of its investment objective and principal investment strategies. The Russell Microcap® Index is the benchmark for the Fund.
THE PORTFOLIO MANAGERS
Lord, Abbett & Co., LLC (“Lord Abbett”)
The team focuses its stock selection effort on companies that have revenue growth of at least 15%, are experiencing year-to-year operating margin improvement and are experiencing earnings growth that is driven by top-line growth rather than being driven by one-time events or simple cost-cutting measures. The focus is also on identifying companies with higher-quality balance sheets (often captured by finding companies with manageable debt-to-total-capital ratios) and that are already profitable. Once this process is completed, the focus for the team is on forecasting both revenue and earnings growth over the next several years. To achieve this goal, and to find companies that are expected to grow faster than their industry average, members of the team spend an extensive amount of time understanding the competitive advantages of a firm, the industry dynamics within which they operate and the strength of management.
The sell discipline is enacted if there is a fundamental change in the business, a more attractive alternative is found or if a holding reaches a 5% weight in the overall portfolio The Lord Abbett portfolio typically holds between 75 and 100 stocks with no individual holding typically exceeding 5%. There is a risk constraint that prevents any individual industry from being greater than 25% of the total portfolio weight. The annual
turnover of the portfolio is expected to be relatively high, although there is no explicit target as part of either the stock selection or the portfolio-construction process.
Next Century Growth Investors, LLC (“Next Century”)
The team requires historical revenue growth of at least 15% for a company before conducting further research. Other key factors considered initially by the team are strong historical revenue growth, low debt and high Return On Equity (“ROE”). Quantitative screening is done on a regular basis to see which stocks over the past year are experiencing significant growth. The next stage of this process involves intensive first-hand research to determine the growth prospects of a company, with the team choosing a stock only when it has become convinced a company has an extraordinary opportunity to grow their business. The uniqueness of this process lies in the fact that the team seeks out these companies regardless of their short-term prospects and\or current valuation. The team is looking for “home runs” and companies that will grow to the point that they will eventually reach a small-market capitalization.
The sell discipline is enacted if there is a change in the original investment thesis or a fundamental change in the business of the company. In addition, a holding will become a candidate for sale if it reaches an extreme valuation, becomes larger than 5% of the overall portfolio or as it exceeds $1 billion in market capitalization. Typically, companies are sold out of the micro-cap portfolio because they have approached $1 billion in market capitalization.
The Next Century portion of the Fund is concentrated and typically has 40-60 holdings, which can create a high level of volatility. The only risk constraints are that sector weights can not exceed two times the Russell 2000® Growth sector weights, and no individual holding can be greater than 5% of the portfolio.
RBC Global Asset Management (U.S.) Inc. (“RBC”)
The team uses an investment process that focuses on generating solid stock selection by identifying companies with strong, long-term, attractive
business fundamentals that are selling at low valuations. In order to initially generate ideas, the team at RBC uses quantitative screens and industry research to concentrate stock selection on a narrower sub-universe of micro-cap companies. The team then focuses a majority of its time on conducting intensive “on-the-ground” fundamental research in order to uncover these opportunities. The focus is on identifying companies with long-term, solid business fundamentals and near-term profitability improvement potential. In terms of short-term factors, the team looks for companies that have shown institutional investor neglect or avoidance and sizeable insider ownership with the potential for both improving profit margins and accelerating earnings in the near future. In terms of long-term factors, the team looks for companies with proven products or services that are leading in market share within their respective industries while maintaining a sustainable competitive advantage and a solid balance sheet.
The resulting portfolio that is generated by this stock selection process tends to exhibit low turnover, with company stocks generally held for several years. The portfolio is well diversified with anywhere from 60 to 90 holdings with a maximum of 5% in any single holding.
WEDGE Capital Management LLP (“WEDGE”) The investment process is a combination of both quantitative and fundamental research insights. The quantitative portion of the investment process uses commonly found factors and characteristics that can be accessed via any number of commercial databases. The value-added portion of the process, therefore, uses a number of different factors across five major categories: valuation, earnings quality, operating efficiency, capital usage and momentum, whose efficacy has been verified via long-term regression analysis. This is referred to as the Fundamental Value model. The top results of this model are combined with the best resulting stocks from the Financial Quality model, which measures stocks across categories such as multiple earnings growth, profitability, leverage and liquidity. The top stocks that appear in both models are eligible for fundamental research. The fundamental research portion of the investment
17
AMG Managers Emerging Opportunities Fund
Portfolio Manager’s Comments (continued)
process is exclusionary in nature and meant to eliminate stocks that are not strong in earnings forecasts, valuation metrics, sector\industry outlook or any factor that cannot be easily captured quantitatively.
A stock is scrutinized for possible sale if it falls below the top four deciles in the Fundamental Value model. Stocks are sold when they become fairly-valued, an upgrade opportunity develops or the original investment thesis materially deteriorates. The portion of the Fund managed by WEDGE is confined to plus or minus 10% of the index weight in any given sector, although sector positions tend to be much closer to the Index weight than this (it should be noted that these self-imposed sector weighting constraints are based on a proprietary liquidity analysis conducted on an ongoing basis by the micro-cap team and is NOT driven by the sector weightings of any micro-cap benchmark). The final portfolio seeks to be a well-diversified, micro-cap portfolio holding approximately 150 securities and consistently maintaining a value bias relative to the benchmark. The portfolio tends to hold securities within the $50 million to $500 million market capitalization range, although it does not require a sale of a holding until it reaches $1 billion in market capitalization.
THE YEAR IN REVIEW
Over the past year, equities within the U.S., as measured by the S&P 500 Index, posted modest gains despite ongoing macroeconomic headwinds that continue to threaten what has been, thus far, a gradual economic recovery from the 2008 and 2009 deep recession. Within the U.S. equity market, large-cap equities, as measured by the Russell 1000® Index, outperformed small-cap equities as the Russell 2000® Index finished the year ending October 2015 barely positive. U.S. equity gains were achieved in fitful spurts as the U.S. Federal Reserve (the Fed) policy changes, commodity price volatility and waning global growth continued to create uncertainty. Despite these risks, U.S. equity indices across the market cap spectrum generated strong gains in the fourth quarter of 2014 as the U.S. economy posted solid
economic growth and the unemployment rate fell to 5.8%, according to the Department of Labor. From January 1 to October 31, 2015, large-cap equities significantly outperformed micro-cap and small-cap equities as equity market volatility increased, global growth slowed, commodity prices declined and Fed policy uncertainty continued. Investors tentatively entered the fourth quarter of 2015 firmly focused on the Fed’s next move to potentially raise short-term interest rates and U.S. economics, including unemployment, housing statistics and inflation. During the last fiscal year ending October 31, 2015, micro-cap equities delivered returns of 0.8%, as measured by the Russell Microcap® Index, which underperformed returns of their large-cap stocks of 4.9%, as measured by Russell 1000® Index, but slightly outperformed the 0.3% return for small-cap stocks, as measured by the Russell 2000® Index.
For the 12 months ended October 31, 2015, the AMG Managers Emerging Opportunities Fund (Service Class) returned (3.0)%, compared with 0.8% for its benchmark, the Russell Microcap® Index. A majority of the underperformance was driven by the Fund’s unfavorable sector positioning, which is primarily a residual of the stock selection process for each of the Fund’s subadvisors. The Fund’s underweights within the financials and health care sectors (particularly the biotechnology industry), and overweights within the industrials and consumer discretionary sectors, detracted most from relative performance. The Fund’s stock selection also detracted from relative performance as weak stock selection within the health care and consumer discretionary sectors was only partially offset by strong stock selection in the information technology and energy sectors.
At the subadvisor level, RBC and Next Century underperformed the Russell Microcap® Index, partially offset by outperformance from WEDGE. Lord Abbett generated returns in-line with the Russell Microcap® Index. RBC’s core growth process experienced unfavorable sector positioning with its significant overweight to the industrials sector and significant underweight to
the health care sector (particularly the biotechnology industry), as well as weak stock selection within the health care and materials sectors, partially offset by strong stock selection within the energy sector. Next Century’s aggressive growth style experienced unfavorable stock selection in the consumer discretionary sector, high-growth biotechnology-related industries and the industrials sector, partially offset by strong stock selection in the information technology sector. Lord Abbett’s weak stock selection within the consumer discretionary and information technology sectors was offset by the favorable sector positioning of the overweights to the health care sector and the biotechnology industry, and underweight to the industrials sector. WEDGE’s quantitative process and value style produced strong stock selection within information technology, consumer discretionary, industrials and materials sectors, partially offset by weak stock selection within the consumer staples sector.
LOOKING FORWARD
The portfolio managers are cautiously optimistic about forward-looking prospects for micro-cap equities. The portfolio managers believe that each of their respective investment processes, focused on finding companies with solid secular growth prospects, have the potential to perform well if investors focus on company fundamentals and less so on uncertainties related to Fed policy or other macro risks. The Fund generally remains positioned for ongoing economic recovery, with overweights in economically sensitive consumer discretionary, information technology and industrials sectors. The portfolio managers continue to avoid financials with a large underweight to this sector relative to the benchmark.
This commentary reflects the viewpoints of the portfolio managers, Lord, Abbett & Co. LLC, Next Century Growth Investors LLC, RBC Global Asset Management (U.S.) Inc. and WEDGE Capital Management L.L.P., as of October 31, 2015 and is not intended as a forecast or guarantee of future results.
18
AMG Managers Emerging Opportunities Fund
Portfolio Manager’s Comments (continued)
CUMULATIVE TOTAL RETURN PERFORMANCE
AMG Managers Emerging Opportunities Fund’s cumulative total return is based on the daily change in net asset value (NAV), and assumes that all dividends and distributions were reinvested. This graph compares a hypothetical $10,000 investment made in the AMG Managers Emerging Opportunities Fund’s Service Class on October 31, 2005 to a $10,000 investment made in the Russell Microcap® Index and the Russell 2000® Index for the same time period. The graph and table do not reflect the deduction of taxes that a shareholder would pay on a Fund distribution or redemption of shares. The listed returns for the Fund are net of expenses and the returns for the index exclude expenses. Total returns would have been lower had certain expenses not been reduced.
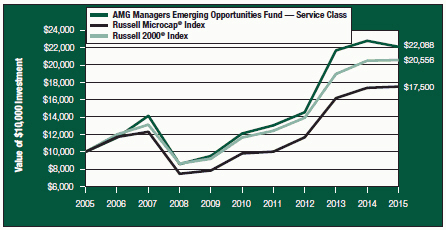
The table below shows the average annual total returns for the AMG Managers Emerging Opportunities Fund and the Russell Microcap® Index and Russell 2000® Index for the same time periods ended October 31, 2015.
| | | | | | | | | | | | | | | | | | | | |
| | | One | | | Five | | | Ten | | | Since | | | Inception | |
| Average Annual Total Returns1 | | Year | | | Years | | | Years | | | Inception | | | Date | |
AMG Managers Emerging Opportunities Fund2,3,4,5 | | | | | | | | | | | | | | | | | | | | |
Service Class | | | (3.01 | )% | | | 12.80 | % | | | 8.25 | % | | | 12.69 | % | | | 06/30/94 | |
Institutional Class | | | (2.76 | )% | | | — | | | | — | | | | 18.33 | % | | | 10/01/11 | |
Russell Microcap® Index6 | | | 0.82 | % | | | 12.30 | % | | | 5.76 | % | | | 6.94 | %7 | | | 06/30/00 | |
Russell 2000® Index8 | | | 0.34 | % | | | 12.06 | % | | | 7.47 | % | | | 9.12 | % | | | 06/30/94 | † |
The performance data shown represents past performance. Past performance is not a guarantee of future results. Current performance may be lower or higher than the performance data quoted. The investment return and principal value of an investment in the Fund will fluctuate so that an investor’s shares, when redeemed, may be worth more or less than their original cost.
Investors should carefully consider the Fund’s investment objectives, risks, charges, and expenses before investing. For performance information through the most recent month end, current net asset values per share for the Fund and other information, please call (800) 835-3879 or visit our website at www.amgfunds.com for a free prospectus. Read it carefully before investing or sending money.
Distributed by AMG Distributors, Inc., member FINRA/SIPC.
| † | Date reflects the inception date of the Fund, not the index. |
| 1 | Total return equals income yield plus share price change and assumes reinvestment of all dividends and capital gain distributions. Returns are net of fees and may reflect offsets of Fund expenses as described in the prospectus. No adjustment has been made for taxes payable by shareholders on their reinvested dividends and capital gain distributions. Returns for periods greater than one year are annualized. The listed returns on the Fund are net of expenses and based on the published NAV as of October 31, 2015. All returns are in U.S. dollars ($). |
| 2 | From time to time, the Fund’s advisor has waived its fees and/or absorbed Fund expenses, which has resulted in higher returns. |
| 3 | The Fund is subject to the special risks associated with investments in micro-cap companies, such as relatively short earnings histories, competitive conditions, less publicly available corporate information, and reliance on a limited number of products. |
| 4 | Investing in intial public offerings (IPOs) is risky, and the prices of stocks purchased in IPOs tend to fluctuate more widely than stocks of companies that have been publicly traded for a longer period of time. Stocks purchased in IPOs generally do not have a trading history, and information about the companies may be available for very limited periods. |
| 5 | Companies that are in similar businesses may be similarly affected by particular economic or market events; to the extent the Fund has substantial holdings within a particular sector, the risks associated with that sector increase. |
| 6 | The Russell Microcap® Index tracks the microcap segment of the U.S. equity market. It makes up less than 3% of the U.S. equity market and is represented by the smallest 1,000 securities in the small-cap Russell 2000® Index plus the next 1,000 securities. Unlike the Fund, the Russell Microcap® Index is unmanaged, is not available for investment, and does not incur expenses |
| 7 | Since the Russell Microcap Index’s Inception date of June 30, 2000, the average annual return for the index is 6.94%. |
| 8 | The Russell 2000® Index is composed of the 2,000 smallest stocks in the Russell 3000® Index and is widely regarded in the industry as the premier measure of small-cap stock performance. Unlike the Fund, the Russell 2000® Index is unmanaged, is not available for investment, and does not incur expenses. |
The Russell Microcap® Index and Russell 2000® Index are registered trademarks of Russell Investments. Russell is a trademark of Russell Investments.
Not FDIC insured, nor bank guaranteed. May lose value.
19
AMG Managers Emerging Opportunities Fund
Fund Snapshots (unaudited)
October 31, 2015
PORTFOLIO BREAKDOWN
| | | | | | | | | | | | |
| | | AMG Managers | | | Russell | | | Russell | |
| | | Emerging | | | Microcap® | | | 2000® | |
Sector | | Opportunities Fund** | | | Index | | | Index | |
Information Technology | | | 22.0 | % | | | 15.2 | % | | | 17.6 | % |
Consumer Discretionary | | | 19.4 | % | | | 12.9 | % | | | 14.1 | % |
Health Care | | | 16.4 | % | | | 19.5 | % | | | 15.1 | % |
Industrials | | | 14.1 | % | | | 10.5 | % | | | 12.5 | % |
Financials | | | 14.0 | % | | | 29.3 | % | | | 25.7 | % |
Materials | | | 3.2 | % | | | 2.8 | % | | | 3.8 | % |
Consumer Staples | | | 2.8 | % | | | 2.4 | % | | | 3.4 | % |
Energy | | | 2.6 | % | | | 4.0 | % | | | 3.1 | % |
Telecommunication Services | | | 1.6 | % | | | 2.2 | % | | | 0.9 | % |
Utilities | | | 1.0 | % | | | 1.2 | % | | | 3.8 | % |
Exchange Traded Fund | | | 0.2 | % | | | 0.0 | % | | | 0.0 | % |
Other Assets and Liabilities | | | 2.7 | % | | | 0.0 | % | | | 0.0 | % |
| ** | As a percentage of net assets. |
TOP TEN HOLDINGS
| | | | |
| | | % of | |
Security Name | | Net Assets | |
Universal Electronics, Inc.* | | | 1.3 | % |
Tyler Technologies, Inc.* | | | 1.2 | |
Inphi Corp. | | | 1.1 | |
AZZ, Inc.* | | | 1.1 | |
Compass Diversified Holdings | | | 1.0 | |
LGI Homes, Inc. | | | 1.0 | |
Columbus McKinnon Corp.* | | | 1.0 | |
Libbey, Inc.* | | | 1.0 | |
U.S. Physical Therapy, Inc.* | | | 1.0 | |
AMERISAFE, Inc. | | | 0.9 | |
| | | | |
Top Ten as a Group | | | 10.6 | % |
| | | | |
| * | Top Ten Holdings as of April 30, 2015. |
Because a fund’s strategy may result in multiple investments in particular sectors of the economy, its performance may depend on the performance of those sectors and may fluctuate more widely than investments diversified across more sectors. For additional information on these and other risk considerations, please see the Fund’s prospectus.
Any sectors, industries, or securities discussed should not be perceived as investment recommendations. Mention of a specific security should not be considered a recommendation to buy or solicitation to sell that security. Specific securities mentioned in this report may have been sold from the Fund’s portfolio of investments by the time you receive this report.
20
AMG Managers Emerging Opportunities Fund
Schedule of Portfolio Investments
October 31, 2015
| | | | | | | | |
| | | Shares | | | Value | |
Common Stocks - 97.1% | | | | | | | | |
Consumer Discretionary - 19.4% | | | | | | | | |
2U, Inc.*,1 | | | 34,196 | | | $ | 717,432 | |
BJ’s Restaurants, Inc.* | | | 9,459 | | | | 406,075 | |
Bravo Brio Restaurant Group, Inc.* | | | 35,476 | | | | 416,488 | |
Bridgepoint Education, Inc.* | | | 60,142 | | | | 466,100 | |
Build-A-Bear Workshop, Inc.* | | | 6,700 | | | | 104,252 | |
Carmike Cinemas, Inc.* | | | 15,510 | | | | 397,211 | |
Century Casinos, Inc.* | | | 18,100 | | | | 123,080 | |
Chegg, Inc.*,1 | | | 76,620 | | | | 528,678 | |
Chuy’s Holdings, Inc.* | | | 15,307 | | | | 416,503 | |
Citi Trends, Inc. | | | 15,900 | | | | 422,463 | |
Culp, Inc. | | | 7,700 | | | | 231,077 | |
Delta Apparel, Inc.* | | | 41,600 | | | | 683,488 | |
Destination Maternity Corp. | | | 24,700 | | | | 171,171 | |
Destination XL Group, Inc.* | | | 180,612 | | | | 1,054,774 | |
Entravision Communications Corp., Class A | | | 108,245 | | | | 948,226 | |
Etsy, Inc.* | | | 20,592 | | | | 224,453 | |
Famous Dave’s of America, Inc.* | | | 6,025 | | | | 69,348 | |
Good Times Restaurants, Inc.* | | | 49,952 | | | | 296,215 | |
Grand Canyon Education, Inc.* | | | 26,520 | | | | 1,102,171 | |
The Habit Restaurants, Inc., Class A* | | | 49,954 | | | | 1,192,902 | |
Harte-Hanks, Inc. | | | 50,500 | | | | 214,625 | |
Haverty Furniture Cos., Inc. | | | 10,950 | | | | 256,340 | |
Hooker Furniture Corp. | | | 9,185 | | | | 227,972 | |
iRobot Corp.* | | | 11,609 | | | | 348,386 | |
Johnson Outdoors, Inc., Class A | | | 4,925 | | | | 105,543 | |
Kirkland’s, Inc. | | | 9,200 | | | | 211,508 | |
Kona Grill, Inc.*,1 | | | 84,121 | | | | 1,156,664 | |
LGI Homes, Inc.*,1 | | | 65,047 | | | | 1,823,267 | |
Libbey, Inc. | | | 52,100 | | | | 1,752,644 | |
Liberty Tax, Inc.1 | | | 9,000 | | | | 207,810 | |
Lifetime Brands, Inc. | | | 24,200 | | | | 371,954 | |
M/I Homes, Inc.* | | | 14,342 | | | | 329,149 | |
Malibu Boats, Inc., Class A* | | | 30,289 | | | | 430,407 | |
The Marcus Corp. | | | 24,325 | | | | 503,284 | |
MarineMax, Inc.* | | | 33,677 | | | | 532,097 | |
Monarch Casino & Resort, Inc.* | | | 16,800 | | | | 368,592 | |
Papa Murphy’s Holdings, Inc.* | | | 62,349 | | | | 861,040 | |
Performance Sports Group, Ltd.* | | | 44,810 | | | | 514,419 | |
Potbelly Corp.*,1 | | | 19,900 | | | | 222,880 | |
| | | | | | | | |
| | | Shares | | | Value | |
Red Robin Gourmet Burgers, Inc.* | | | 10,160 | | | $ | 760,882 | |
Rentrak Corp.*,1 | | | 8,650 | | | | 477,307 | |
Rocky Brands, Inc. | | | 5,725 | | | | 72,994 | |
Ruth’s Hospitality Group, Inc. | | | 33,600 | | | | 521,136 | |
Saga Communications, Inc., Class A | | | 2,900 | | | | 124,758 | |
Salem Media Group, Inc. | | | 73,840 | | | | 464,454 | |
Sequential Brands Group, Inc.*,1 | | | 77,578 | | | | 970,501 | |
Skullcandy, Inc.* | | | 28,500 | | | | 159,600 | |
Smith & Wesson Holding Corp.* | | | 89,999 | | | | 1,607,382 | |
Spartan Motors, Inc. | | | 27,100 | | | | 111,923 | |
Sportsman’s Warehouse Holdings, Inc.* | | | 90,676 | | | | 975,674 | |
Stein Mart, Inc. | | | 21,900 | | | | 194,034 | |
Stoneridge, Inc.* | | | 28,700 | | | | 364,203 | |
Strattec Security Corp. | | | 3,400 | | | | 203,388 | |
Superior Uniform Group, Inc. | | | 15,700 | | | | 267,528 | |
Tandy Leather Factory, Inc.* | | | 101,200 | | | | 768,108 | |
Tile Shop Holdings, Inc.* | | | 18,055 | | | | 261,978 | |
Tower International, Inc.* | | | 9,200 | | | | 252,724 | |
Unifi, Inc.* | | | 10,700 | | | | 327,313 | |
Universal Electronics, Inc.* | | | 47,400 | | | | 2,254,818 | |
West Marine, Inc.* | | | 24,300 | | | | 247,374 | |
William Lyon Homes, Class A* | | | 11,913 | | | | 254,223 | |
ZAGG, Inc.* | | | 99,257 | | | | 841,699 | |
Zoe’s Kitchen, Inc.*,1 | | | 40,021 | | | | 1,377,923 | |
Total Consumer Discretionary | | | | | | | 34,272,612 | |
Consumer Staples - 2.8% | | | | | | | | |
Calavo Growers, Inc. | | | 23,452 | | | | 1,205,667 | |
Craft Brew Alliance, Inc.* | | | 43,800 | | | | 335,508 | |
Diamond Foods, Inc.* | | | 13,965 | | | | 553,293 | |
Farmer Bros. Co.* | | | 17,000 | | | | 482,460 | |
John B Sanfilippo & Son, Inc. | | | 15,310 | | | | 990,863 | |
Landec Corp.* | | | 63,900 | | | | 785,970 | |
Lifeway Foods, Inc.* | | | 15,600 | | | | 177,060 | |
Nature’s Sunshine Products, Inc. | | | 9,200 | | | | 109,020 | |
Primo Water Corp.* | | | 31,184 | | | | 274,419 | |
Total Consumer Staples | | | | | | | 4,914,260 | |
Energy - 2.6% | | | | | | | | |
Aspen Aerogels, Inc.* | | | 43,505 | | | | 364,137 | |
Callon Petroleum Co.* | | | 79,370 | | | | 688,932 | |
Dawson Geophysical Co.* | | | 173,559 | | | | 564,067 | |
The accompanying notes are an integral part of these financial statements.
21
AMG Managers Emerging Opportunities Fund
Schedule of Portfolio Investments (continued)
| | | | | | | | |
| | | Shares | | | Value | |
Energy - 2.6% (continued) | | | | | | | | |
GasLog, Ltd. | | | 15,689 | | | $ | 181,522 | |
Gulf Island Fabrication, Inc. | | | 46,791 | | | | 473,057 | |
Gulfport Energy Corp.* | | | 22,990 | | | | 700,505 | |
Panhandle Oil and Gas, Inc., Class A1 | | | 15,100 | | | | 277,538 | |
Ring Energy, Inc.*,1 | | | 57,100 | | | | 593,269 | |
Synergy Resources Corp.* | | | 62,360 | | | | 697,808 | |
Total Energy | | | | | | | 4,540,835 | |
Financials - 14.0% | | | | | | | | |
AMERISAFE, Inc. | | | 29,800 | | | | 1,630,954 | |
Arrow Financial Corp. | | | 13,347 | | | | 368,377 | |
Ashford Hospitality Prime, Inc. | | | 29,500 | | | | 433,650 | |
Asta Funding, Inc.* | | | 48,800 | | | | 419,680 | |
Atlas Financial Holdings, Inc.* | | | 53,000 | | | | 1,008,060 | |
Blue Capital Reinsurance Holdings, Ltd. | | | 7,000 | | | | 124,110 | |
Boston Private Financial Holdings, Inc. | | | 20,000 | | | | 229,200 | |
Cardinal Financial Corp. | | | 19,925 | | | | 452,895 | |
CoBiz Financial, Inc. | | | 76,110 | | | | 948,331 | |
Compass Diversified Holdings | | | 111,200 | | | | 1,829,240 | |
Consumer Portfolio Services, Inc.* | | | 20,600 | | | | 111,652 | |
Crawford & Co., Class B | | | 29,800 | | | | 178,800 | |
Diamond Hill Investment Group, Inc. | | | 1,800 | | | | 360,090 | |
Farmland Partners, Inc. | | | 11,100 | | | | 113,886 | |
FBR & Co. | | | 19,500 | | | | 385,710 | |
Fidelity Southern Corp. | | | 13,000 | | | | 272,350 | |
Financial Institutions, Inc. | | | 18,375 | | | | 479,955 | |
First Bancorp | | | 33,090 | | | | 613,158 | |
First Community Bancshares, Inc. | | | 12,900 | | | | 248,067 | |
First Connecticut Bancorp, Inc. | | | 7,500 | | | | 130,350 | |
First Defiance Financial Corp. | | | 9,000 | | | | 344,700 | |
The First of Long Island Corp. | | | 4,800 | | | | 133,296 | |
Flushing Financial Corp. | | | 22,250 | | | | 468,140 | |
GAIN Capital Holdings, Inc. | | | 31,300 | | | | 233,185 | |
Gladstone Land Corp. | | | 11,000 | | | | 101,200 | |
Gramercy Property Trust, Inc. | | | 17,025 | | | | 386,127 | |
Hallmark Financial Services, Inc.* | | | 10,500 | | | | 136,395 | |
HCI Group, Inc. | | | 5,700 | | | | 248,577 | |
Heritage Commerce Corp. | | | 11,800 | | | | 124,844 | |
Heritage Financial Corp. | | | 28,747 | | | | 529,520 | |
HomeStreet, Inc.* | | | 18,456 | | | | 386,284 | |
| | | | | | | | |
| | | Shares | | | Value | |
Horizon Bancorp Indiana | | | 5,100 | | | $ | 133,110 | |
Independence Realty Trust, Inc.1 | | | 59,100 | | | | 463,344 | |
JMP Group LLC1 | | | 32,700 | | | | 201,432 | |
LaSalle Hotel Properties | | | 13,800 | | | | 405,858 | |
LegacyTexas Financial Group, Inc. | | | 7,886 | | | | 226,328 | |
LendingTree, Inc.* | | | 5,134 | | | | 623,062 | |
Live Oak Bancshares, Inc.1 | | | 22,229 | | | | 318,764 | |
MainSource Financial Group, Inc. | | | 11,300 | | | | 244,532 | |
Marlin Business Services Corp. | | | 14,000 | | | | 247,240 | |
Mercantile Bank Corp. | | | 15,870 | | | | 350,092 | |
Merchants Bancshares, Inc. | | | 4,000 | | | | 126,080 | |
Metro Bancorp, Inc. | | | 11,400 | | | | 353,172 | |
MidWestOne Financial Group, Inc. | | | 4,100 | | | | 125,624 | |
National Interstate Corp. | | | 4,600 | | | | 132,020 | |
Northrim BanCorp, Inc. | | | 35,426 | | | | 978,466 | |
OceanFirst Financial Corp. | | | 23,550 | | | | 434,733 | |
One Liberty Properties, Inc.1 | | | 16,200 | | | | 381,672 | |
Oppenheimer Holdings, Inc., Class A | | | 32,000 | | | | 587,200 | |
Orrstown Financial Services, Inc. | | | 7,300 | | | | 129,940 | |
Pacific Continental Corp. | | | 17,700 | | | | 253,818 | |
Pacific Premier Bancorp, Inc.* | | | 44,630 | | | | 952,851 | |
Preferred Bank | | | 12,510 | | | | 414,206 | |
ServisFirst Bancshares, Inc. | | | 11,168 | | | | 473,300 | |
Sierra Bancorp | | | 7,100 | | | | 115,091 | |
Southwest Bancorp, Inc. | | | 13,500 | | | | 228,285 | |
State Bank Financial Corp. | | | 16,790 | | | | 359,306 | |
Stock Yards Bancorp, Inc. | | | 12,790 | | | | 481,927 | |
Territorial Bancorp, Inc. | | | 8,525 | | | | 237,677 | |
Universal Insurance Holdings, Inc. | | | 10,097 | | | | 318,560 | |
Washington Trust Bancorp, Inc. | | | 8,675 | | | | 336,590 | |
West Bancorporation, Inc. | | | 6,225 | | | | 123,006 | |
Whitestone REIT | | | 44,400 | | | | 548,784 | |
Total Financials | | | | | | | 24,736,853 | |
Health Care - 16.4% | | | | | | | | |
AAC Holdings, Inc.* | | | 20,766 | | | | 481,771 | |
Acceleron Pharma, Inc.* | | | 9,704 | | | | 302,862 | |
Addus HomeCare Corp.* | | | 7,600 | | | | 189,848 | |
AMN Healthcare Services, Inc.* | | | 14,491 | | | | 411,110 | |
AtriCure, Inc.* | | | 56,987 | | | | 1,055,684 | |
The accompanying notes are an integral part of these financial statements.
22
AMG Managers Emerging Opportunities Fund
Schedule of Portfolio Investments (continued)
| | | | | | | | |
| | | Shares | | | Value | |
Health Care - 16.4% (continued) | | | | | | | | |
aTyr Pharma, Inc.*,1 | | | 16,194 | | | $ | 201,777 | |
BioScrip, Inc.* | | | 101,490 | | | | 199,935 | |
BioTelemetry, Inc.* | | | 22,900 | | | | 298,158 | |
Blueprint Medicines Corp.*,1 | | | 27,602 | | | | 554,524 | |
Celldex Therapeutics, Inc.*,1 | | | 20,510 | | | | 247,351 | |
Coherus Biosciences, Inc.*,1 | | | 20,004 | | | | 557,111 | |
Cross Country Healthcare, Inc.* | | | 57,396 | | | | 774,846 | |
Cutera, Inc.* | | | 16,700 | | | | 226,619 | |
Digirad Corp. | | | 26,200 | | | | 155,104 | |
Dynavax Technologies Corp.* | | | 20,602 | | | | 467,871 | |
EndoChoice Holdings, Inc.*,1 | | | 28,414 | | | | 293,232 | |
Endologix, Inc.* | | | 33,819 | | | | 288,814 | |
Entellus Medical, Inc.*,1 | | | 14,776 | | | | 251,044 | |
Epizyme, Inc.*,1 | | | 11,028 | | | | 144,357 | |
Evolent Health, Inc., Class A*,1 | | | 22,874 | | | | 293,931 | |
Exactech, Inc.* | | | 65,200 | | | | 1,110,356 | |
Five Prime Therapeutics, Inc.* | | | 11,096 | | | | 356,736 | |
Foundation Medicine, Inc.* | | | 17,451 | | | | 391,251 | |
Glaukos Corp.*,1 | | | 40,178 | | | | 805,167 | |
Global Blood Therapeutics, Inc.*,1 | | | 5,672 | | | | 264,485 | |
Harvard Bioscience, Inc.* | | | 44,100 | | | | 129,654 | |
HealthEquity, Inc.*,1 | | | 18,382 | | | | 601,275 | |
HealthStream, Inc.* | | | 6,009 | | | | 143,074 | |
Heska Corp.* | | | 3,900 | | | | 119,964 | |
Imprivata, Inc.* | | | 10,500 | | | | 113,295 | |
Inogen, Inc.* | | | 33,665 | | | | 1,438,842 | |
Intersect ENT, Inc.* | | | 19,839 | | | | 380,115 | |
Intra-Cellular Therapies, Inc.* | | | 16,678 | | | | 798,042 | |
iRadimed Corp.*,1 | | | 13,700 | | | | 363,050 | |
Juniper Pharmaceuticals, Inc.* | | | 17,200 | | | | 208,120 | |
K2M Group Holdings, Inc.* | | | 51,874 | | | | 946,701 | |
LDR Holding Corp.* | | | 16,807 | | | | 425,217 | |
MiMedx Group, Inc.*,1 | | | 37,935 | | | | 276,167 | |
NeoGenomics, Inc.* | | | 51,343 | | | | 361,968 | |
Nevro Corp.* | | | 8,084 | | | | 329,585 | |
Nobilis Health Corp.*,1 | | | 55,552 | | | | 156,657 | |
NxStage Medical, Inc.* | | | 24,476 | | | | 408,994 | |
Ophthotech Corp.* | | | 9,627 | | | | 480,676 | |
Pacific Biosciences of California, Inc.* | | | 32,724 | | | | 232,340 | |
Penumbra, Inc.* | | | 8,954 | | | | 331,567 | |
| | | | | | | | |
| | | Shares | | | Value | |
Press Ganey Holdings, Inc.* | | | 14,993 | | | $ | 469,881 | |
The Providence Service Corp.* | | | 9,400 | | | | 485,510 | |
Repligen Corp.* | | | 12,927 | | | | 429,693 | |
Retrophin, Inc.* | | | 16,097 | | | | 307,936 | |
Revance Therapeutics, Inc.*,1 | | | 17,644 | | | | 691,115 | |
RTI Surgical, Inc.* | | | 87,700 | | | | 368,778 | |
Sage Therapeutics, Inc.*,1 | | | 13,892 | | | | 697,795 | |
Sarepta Therapeutics, Inc.* | | | 7,036 | | | | 169,286 | |
Seres Therapeutics, Inc.*,1 | | | 8,113 | | | | 240,469 | |
Sharps Compliance Corp.* | | | 35,270 | | | | 266,994 | |
Spark Therapeutics, Inc.*,1 | | | 12,008 | | | | 647,231 | |
Streamline Health Solutions, Inc.* | | | 107,021 | | | | 208,691 | |
SurModics, Inc.* | | | 53,500 | | | | 1,141,155 | |
Symmetry Surgical, Inc.* | | | 11,775 | | | | 100,088 | |
Synergy Pharmaceuticals, Inc.*,1 | | | 80,924 | | | | 518,723 | |
Teladoc, Inc.*,1 | | | 37,052 | | | | 728,813 | |
U.S. Physical Therapy, Inc. | | | 34,946 | | | | 1,714,451 | |
Utah Medical Products, Inc. | | | 2,100 | | | | 123,837 | |
Vascular Solutions, Inc.* | | | 12,000 | | | | 385,440 | |
Zeltiq Aesthetics, Inc.* | | | 25,744 | | | | 868,603 | |
Total Health Care | | | | | | | 29,133,736 | |
Industrials - 14.1% | | | | | | | | |
ACCO Brands Corp.* | | | 121,400 | | | | 979,698 | |
Air Transport Services Group, Inc.* | | | 17,580 | | | | 172,108 | |
Alamo Group, Inc. | | | 8,859 | | | | 415,664 | |
Ameresco, Inc., Class A*,1 | | | 40,100 | | | | 259,848 | |
American Woodmark Corp.* | | | 11,327 | | | | 823,473 | |
AZZ, Inc. | | | 35,600 | | | | 1,969,748 | |
Barrett Business Services, Inc. | | | 14,962 | | | | 732,839 | |
Builders FirstSource, Inc.* | | | 59,144 | | | | 699,082 | |
Celadon Group, Inc. | | | 17,228 | | | | 249,461 | |
Columbus McKinnon Corp. | | | 96,000 | | | | 1,794,240 | |
Comfort Systems USA, Inc. | | | 15,516 | | | | 495,426 | |
Covenant Transportation Group, Inc., Class A* | | | 52,518 | | | | 1,013,597 | |
CRA International, Inc.* | | | 14,750 | | | | 345,150 | |
Ducommun, Inc.* | | | 21,620 | | | | 467,857 | |
Dynamic Materials Corp. | | | 21,000 | | | | 149,730 | |
Ennis, Inc. | | | 79,690 | | | | 1,596,191 | |
FreightCar America, Inc. | | | 21,200 | | | | 385,416 | |
Furmanite Corp.* | | | 69,600 | | | | 483,720 | |
Gibraltar Industries, Inc.* | | | 15,675 | | | | 396,891 | |
The accompanying notes are an integral part of these financial statements.
23
AMG Managers Emerging Opportunities Fund
Schedule of Portfolio Investments (continued)
| | | | | | | | |
| | | Shares | | | Value | |
Industrials - 14.1% (continued) | | | | | | | | |
Global Brass & Copper Holdings, Inc. | | | 10,700 | | | $ | 240,643 | |
GP Strategies Corp.* | | | 24,280 | | | | 609,185 | |
The Greenbrier Cos., Inc. | | | 26,300 | | | | 1,000,452 | |
Hudson Technologies, Inc.* | | | 161,140 | | | | 552,710 | |
Hurco Cos., Inc. | | | 3,500 | | | | 94,045 | |
Interface, Inc. | | | 35,300 | | | | 690,115 | |
The KEYW Holding Corp.* | | | 39,520 | | | | 281,778 | |
Kforce, Inc. | | | 8,351 | | | | 234,747 | |
Lawson Products, Inc.* | | | 9,100 | | | | 236,691 | |
Lydall, Inc.* | | | 17,800 | | | | 609,294 | |
Marten Transport, Ltd. | | | 22,840 | | | | 374,348 | |
Neff Corp., Class A* | | | 30,765 | | | | 180,283 | |
NN, Inc. | | | 38,980 | | | | 537,924 | |
Old Dominion Freight Line, Inc.* | | | 14,225 | | | | 881,096 | |
Orion Marine Group, Inc.* | | | 29,900 | | | | 116,909 | |
PAM Transportation Services, Inc.* | | | 2,000 | | | | 71,420 | |
Patrick Industries, Inc.*,1 | | | 33,430 | | | | 1,356,589 | |
PGT, Inc.* | | | 58,470 | | | | 705,148 | |
Radiant Logistics, Inc.* | | | 137,780 | | | | 546,987 | |
RBC Bearings, Inc.* | | | 5,726 | | | | 391,601 | |
Rush Enterprises, Inc., Class A* | | | 9,542 | | | | 232,634 | |
Sparton Corp.* | | | 40,330 | | | | 948,965 | |
Sun Hydraulics Corp. | | | 13,230 | | | | 387,507 | |
US Ecology, Inc. | | | 8,291 | | | | 325,090 | |
Total Industrials | | | | | | | 25,036,300 | |
Information Technology - 22.0% | | | | | | | | |
Actua Corp.* | | | 10,718 | | | | 148,444 | |
American Software, Inc., Class A | | | 38,950 | | | | 398,459 | |
Apigee Corp.* | | | 57,522 | | | | 555,087 | |
Appfolio, Inc., Class A*,1 | | | 20,864 | | | | 365,329 | |
Applied Optoelectronics, Inc.* | | | 23,054 | | | | 475,373 | |
Aspen Technology, Inc.* | | | 5,300 | | | | 219,367 | |
Bel Fuse, Inc., Class B | | | 10,200 | | | | 183,906 | |
Benefitfocus, Inc.*,1 | | | 32,520 | | | | 1,039,339 | |
BroadSoft, Inc.* | | | 16,049 | | | | 513,087 | |
CalAmp Corp.* | | | 28,207 | | | | 534,805 | |
Calix, Inc.* | | | 29,900 | | | | 209,001 | |
Callidus Software, Inc.* | | | 83,816 | | | | 1,455,884 | |
Cascade Microtech, Inc.* | | | 28,218 | | | | 432,300 | |
| | | | | | | | |
| | | Shares | | | Value | |
Ciber, Inc.* | | | 94,600 | | | $ | 337,722 | |
comScore, Inc.* | | | 5,590 | | | | 239,140 | |
CTS Corp. | | | 24,500 | | | | 445,410 | |
Cvent, Inc.* | | | 19,777 | | | | 625,151 | |
CYREN, Ltd.* | | | 172,400 | | | | 346,524 | |
Digi International, Inc.* | | | 22,683 | | | | 292,611 | |
ePlus, Inc.* | | | 3,100 | | | | 261,702 | |
Evolving Systems, Inc. | | | 12,900 | | | | 73,917 | |
Exa Corp.* | | | 10,900 | | | | 104,749 | |
Gigamon, Inc.* | | | 20,466 | | | | 536,823 | |
Globant, S.A.*,1 | | | 17,197 | | | | 594,500 | |
Glu Mobile, Inc.* | | | 297,881 | | | | 1,227,270 | |
Gogo, Inc.*,1 | | | 35,274 | | | | 498,422 | |
GSI Group, Inc.* | | | 100,760 | | | | 1,361,268 | |
The Hackett Group, Inc. | | | 17,300 | | | | 257,424 | |
Hortonworks, Inc.* | | | 21,976 | | | | 427,653 | |
Information Services Group, Inc. | | | 51,000 | | | | 187,170 | |
Inphi Corp.* | | | 67,154 | | | | 1,999,175 | |
Interactive Intelligence Group, Inc.* | | | 30,330 | | | | 980,872 | |
IXYS Corp. | | | 34,612 | | | | 431,266 | |
Lionbridge Technologies, Inc.* | | | 85,000 | | | | 458,150 | |
Luxoft Holding, Inc.* | | | 9,946 | | | | 662,801 | |
Marchex, Inc., Class B | | | 56,200 | | | | 242,784 | |
Materialise N.V., ADR*,1 | | | 63,129 | | | | 532,809 | |
Mattersight Corp.* | | | 43,204 | | | | 311,501 | |
MaxLinear, Inc., Class A* | | | 61,873 | | | | 804,349 | |
MINDBODY, Inc., Class A*,1 | | | 30,247 | | | | 473,063 | |
NCI, Inc., Class A | | | 18,400 | | | | 285,936 | |
Paylocity Holding Corp.* | | | 17,323 | | | | 581,533 | |
PC Connection, Inc. | | | 21,646 | | | | 503,053 | |
PC-Tel, Inc. | | | 40,600 | | | | 232,029 | |
PFSweb, Inc.* | | | 9,200 | | | | 147,384 | |
Q2 Holdings, Inc.* | | | 53,972 | | | | 1,330,410 | |
QAD, Inc., Class A | | | 4,800 | | | | 122,592 | |
Radisys Corp.* | | | 81,300 | | | | 208,941 | |
Rapid7, Inc.*,1 | | | 16,897 | | | | 347,402 | |
The Rubicon Project, Inc.* | | | 35,805 | | | | 542,804 | |
Ruckus Wireless, Inc.* | | | 71,327 | | | | 804,569 | |
Sapiens International Corp. N.V. | | | 61,700 | | | | 728,677 | |
ShoreTel, Inc.* | | | 60,300 | | | | 569,232 | |
The accompanying notes are an integral part of these financial statements.
24
AMG Managers Emerging Opportunities Fund
Schedule of Portfolio Investments (continued)
| | | | | | | | |
| | | Shares | | | Value | |
Information Technology - 22.0% (continued) | | | | | |
Silicon Motion Technology Corp., ADR | | | 13,207 | | | $ | 419,851 | |
Silver Spring Networks, Inc.* | | | 49,896 | | | | 654,137 | |
SPS Commerce, Inc.* | | | 10,006 | | | | 718,631 | |
Stamps.com, Inc.* | | | 6,143 | | | | 464,472 | |
Tangoe, Inc.* | | | 31,650 | | | | 262,062 | |
TechTarget, Inc.* | | | 77,770 | | | | 725,594 | |
TESSCO Technologies, Inc. | | | 62,300 | | | | 1,360,632 | |
Textura Corp.* | | | 30,475 | | | | 894,746 | |
TrueCar, Inc.*,1 | | | 37,700 | | | | 231,478 | |
Tucows, Inc., Class A* | | | 4,200 | | | | 113,526 | |
Tyler Technologies, Inc.* | | | 12,270 | | | | 2,090,317 | |
Ultra Clean Holdings, Inc.* | | | 104,000 | | | | 507,520 | |
Virtusa Corp.* | | | 19,852 | | | | 1,140,100 | |
Vishay Precision Group, Inc.* | | | 46,390 | | | | 544,155 | |
Wix.com, Ltd.*,1 | | | 21,133 | | | | 467,462 | |
Xactly Corp.* | | | 39,739 | | | | 369,573 | |
Xplore Technologies Corp.* | | | 71,670 | | | | 402,069 | |
Total Information Technology | | | | | | | 39,015,494 | |
Materials - 3.2% | | | | | | | | |
Flotek Industries, Inc.*,1 | | | 26,444 | | | | 478,636 | |
FutureFuel Corp. | | | 15,600 | | | | 240,396 | |
Koppers Holdings, Inc. | | | 29,200 | | | | 553,632 | |
Materion Corp. | | | 18,725 | | | | 564,559 | |
Myers Industries, Inc. | | | 23,400 | | | | 365,274 | |
OMNOVA Solutions, Inc.* | | | 186,000 | | | | 1,335,480 | |
Real Industry, Inc.* | | | 53,610 | | | | 509,295 | |
Trecora Resources* | | | 25,300 | | | | 360,272 | |
UFP Technologies, Inc.* | | | 5,325 | | | | 130,516 | |
Universal Stainless & Alloy Products, Inc.* | | | 46,000 | | | | 400,200 | |
US Concrete, Inc.* | | | 12,717 | | | | 705,285 | |
Total Materials | | | | | | | 5,643,545 | |
Telecommunication Services - 1.6% | | | | | | | | |
8x8, Inc.* | | | 35,410 | | | | 377,471 | |
Boingo Wireless, Inc.* | | | 108,884 | | | | 841,673 | |
IDT Corp., Class B | | | 27,400 | | | | 354,830 | |
inContact, Inc.*,1 | | | 69,138 | | | | 615,328 | |
Premiere Global Services, Inc.* | | | 40,400 | | | | 552,672 | |
| | | | | | | | |
| | | Shares | | | Value | |
Towerstream Corp.* | | | 216,300 | | | $ | 172,175 | |
Total Telecommunication Services | | | | | | | 2,914,149 | |
Utilities - 1.0% | | | | | | | | |
Chesapeake Utilities Corp. | | | 8,962 | | | | 467,906 | |
Connecticut Water Service, Inc. | | | 6,700 | | | | 246,627 | |
Middlesex Water Co. | | | 10,500 | | | | 270,585 | |
Unitil Corp. | | | 21,000 | | | | 744,870 | |
Total Utilities | | | | | | | 1,729,988 | |
Total Common Stocks (cost $145,617,487) | | | | | | | 171,937,772 | |
Exchange Traded Funds - 0.2% | | | | | | | | |
SPDR S&P Regional Banking ETF1
(cost $250,802) | | | 8,500 | | | | 364,055 | |
Warrants - 0.0% | | | | | | | | |
Imperial Holdings, Inc. Warrants,* (cost $36) | | | 3,571 | | | | — | |
| | |
| | | Principal
Amount | | | | |
Short-Term Investments - 10.7% | | | | | | | | |
Repurchase Agreements - 7.5%2 | | | | | | | | |
Daiwa Capital Markets America, dated 10/30/15, due 11/02/15, 0.090%, total to be received $3,176,343 (collateralized by various U.S. Government Agency Obligations, 0.000% - 7.500%, 11/05/15 - 02/01/49, totaling $3,239,845) | | $ | 3,176,319 | | | | 3,176,319 | |
HSBC Securities USA Inc., dated 10/30/15, due 11/02/15, 0.060%, total to be received $3,176,335 (collateralized by various U.S. Government Agency Obligations, 0.000% - 8.950%, 11/15/15 - 07/15/37, totaling $3,239,853) | | | 3,176,319 | | | | 3,176,319 | |
ING Financial Markets, LLC, dated 10/30/15, due 11/02/15, 0.080%, total to be received $3,176,340 (collateralized by various U.S. Government Agency Obligations, 1.696% - 6.260%, 12/01/19 - 08/01/46, totaling $3,239,873) | | | 3,176,319 | | | | 3,176,319 | |
Nomura Securities International, Inc., dated 10/30/15, due 11/02/15, 0.080%, total to be received $3,176,340 (collateralized by various U.S. Government Agency Obligations, 0.000% - 10.500%, 11/04/15 - 09/20/65 totaling $3,239,845) | | | 3,176,319 | | | | 3,176,319 | |
The accompanying notes are an integral part of these financial statements.
25
AMG Managers Emerging Opportunities Fund
Schedule of Portfolio Investments (continued)
| | | | | | | | |
| | | Principal Amount | | | Value | |
Royal Bank of Scotland PLC, dated 10/30/15, due 11/02/15, 0.070%, total to be received $668,676 (collateralized by various U.S. Government Agency Obligations, 0.074% - 3.375%, 08/15/16 - 08/15/21, totaling $682,046) | | $ | 668,672 | | | $ | 668,672 | |
Total Repurchase Agreements | | | | | | | 13,373,948 | |
| | |
| | | Shares | | | | |
Other Investment Companies -3.2%3 | | | | | | | | |
Dreyfus Institutional Cash Advantage Fund, Institutional Class Shares, 0.09% | | | 5,660,666 | | | | 5,660,667 | |
Total Short-Term Investments
(cost $19,034,615) | | | | | | | 19,034,615 | |
| | | | | | |
| | | Shares | | Value | |
Total Investments - 108.0%
(cost $164,902,940) | | | | $ | 191,336,442 | |
Other Assets, less Liabilities - (8.0)% | | | | | (14,245,977 | ) |
Net Assets - 100.0% | | | | $ | 177,090,465 | |
The accompanying notes are an integral part of these financial statements.
26
AMG Managers Real Estate Securities Fund
Portfolio Manager’s Comments (unaudited)
AMG Managers Real Estate Securities Fund seeks a combination of income and long-term capital appreciation by investing in stocks of companies that are principally engaged in owning and operating commercial real estate properties for the benefit of their investors, including real estate investment trusts (REITs). AMG Funds LLC utilizes an independent subadvisor, CenterSquare Investment Management, LLC (“CenterSquare”), to manage the assets of this Fund.
THE PORTFOLIO MANAGER
CenterSquare Investment Management, Inc.
The investment team at CenterSquare believes real estate securities play an important role in a multi-asset class investment portfolio. CenterSquare’s strategy recognizes that real estate securities are not simply stocks or real estate. They are hybrid financial investments that must be valued on the basis of a number of meaningful factors, only one of which is the value of the firm’s property portfolio. To accurately assess the relative value of a REIT, CenterSquare takes into account critical business and market factors, such as: the company’s capitalization, its position within public capital markets and the quality of the management team.
CenterSquare believes that investment success is the result of the company’s ability to provide a consistently accurate answer to the question at the heart of its value-oriented investment strategy: which REITs do they believe will generate the highest risk-adjusted returns? CenterSquare believes that a diversified portfolio with a value orientation will result in strong risk-adjusted returns.
CenterSquare employs a value-oriented investment process with two distinct and complementary components: bottom-up real estate research and the company’s proprietary Relative Value Model (RVM) securities valuation process, which was designed to provide a uniform basis for evaluating the validity of a security’s trading price. Combining real estate research and the RVM process has been central to CenterSquare’s track record of delivering strong returns without incurring high levels of risk.
THE YEAR IN REVIEW
For the 12 months ending October 31, 2015, the AMG Managers Real Estate Securities Fund
returned 7.7%, compared with 6.9% for its benchmark, the Dow Jones U.S. Select REIT Index. During the same period, the S&P 500 Index returned 5.2%.
The U.S. REIT market outperformed the broader equity markets during the fiscal year ended October 31, 2015. Investor sentiment for REITs and other income-oriented investments continues to be affected by the short-term outlook for the U.S. Federal Reserve’s (the Fed) interest policy outlook. The global uncertainty that peaked in the late summer may have caused the Fed to delay raising interest rates, however recent economic data and commentary from the Fed suggest they may act to increase short-term rates before year end. Regardless of whether or not the Fed lifts short-term rates, we believe today’s REIT valuations already reflect higher future interest rates. Furthermore, as REITs use limited short-term debt, a slightly higher federal funds rate is unlikely to alter their cost of capital materially. Long-term interest rates will rise eventually, but slowly in our view. A measured rate increase should allow for a gradual adjustment period, which should be a positive for REITs.
Nearly all property sectors generated positive total returns during the fiscal year. Property sector performance was led by the self-storage, apartment and regional mall sectors, which posted total returns of 30.5%, 14.6% and 12.8%, respectively. The major underperformer for the year was hotels, returning (16.7)%. Health care and suburban office also underperformed, posting total returns of (7.3)% and 0.8%, respectively.
Outperformance for the year was driven by stock selection in the hotel, specialty and health care sectors, as well as the Fund’s underweight to health care. Stock selection was particularly strong in hotels, as we managed to avoid the lower-quality owners and instead focused our exposure on upscale assets. Our overweight to West Coast assets also fared well and generated alpha across individual holdings in a variety of sectors, particularly through the first half of the year.
Sector selection was a negative contributor during the trailing 12 months. The Fund’s overweight position to office, both in-fill/downtown office and suburban office, did not help relative performance as the office sector lagged other property sectors
in 2015. The alternative housing sector was a detractor as well as we did not own the strongly performing manufactured housing REITs. On the other hand, in general, our underweight to long-duration leases and low growth, high-yield assets helped relative performance. While regional malls were only a small contributor to relative performance, the Fund benefitted from not owning low quality, B-class and C-class malls.
Unfortunately these stocks only represent a small portion of the Index so the outperformance was somewhat limited. An underweight to hotels was also beneficial to relative performance, particularly late in the year as hotel performance lagged greatly beginning around July. We had been overweight hotels early in the year before shifting to a large underweight late in the year. An overweight to higher growth property sectors also helped performance, particularly our overweight to the data center space which performed very strongly on the back of secular, technology-led fundamental demand.
OUTLOOK
Interest rates may change, but the reasons for owning REITs do not — growing current income linked to the overall growth in the economy, enhanced diversification through low correlation with other financial assets and hard-assets. U.S. REITs reported strong earnings throughout the year. Real estate fundamentals are healthy. Low new supply, high occupancies and rental rate growth has generated good cash flow and dividend growth. The U.S. macro-economy is one of the strongest economies in the world today. A healthy economy is the most important driver of demand for real estate. Even though we expect interest rates to eventually increase, the absolute levels for yields will remain very low by historical comparison and we are likely to remain in a low rate environment for some time. In general, our strategy is to own REITs with above-average growth potential and those that are likely to benefit from an improving economy.
This commentary reflects the viewpoints of the portfolio manager, CenterSquare Investment Management, Inc. as of October 31, 2015 and is not intended as a forecast or guarantee of future results.
27
AMG Managers Real Estate Securities Fund
Portfolio Manager’s Comments (continued)
CUMULATIVE TOTAL RETURN PERFORMANCE
AMG Managers Real Estate Securities Fund’s cumulative total return is based on the daily change in net asset value (NAV), and assumes that all dividends and distributions were reinvested. This graph compares a hypothetical $10,000 investment made in AMG Managers Real Estate Securities Fund on October 31, 2005, to a $10,000 investment made in the Dow Jones U.S. Select REIT Index for the same time period. The graph and table do not reflect the deduction of taxes that a shareholder would pay on a Fund distribution or redemption of shares. The listed returns for the Fund are net of expenses and the returns for the index exclude expenses. Total returns would have been lower had certain expenses not been reduced.
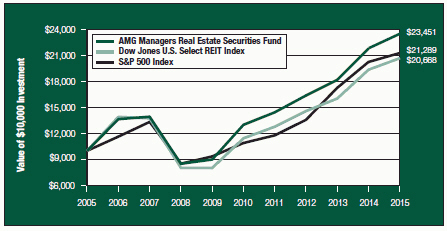
The table below shows the average annual total returns for the AMG Managers Real Estate Securities Fund and the S&P 500 and Dow Jones U.S. Select REIT indices for the same time periods ended October 31, 2015.
| | | | | | | | | | | | |
| Average Annual Total Returns1 | | One
Year | | | Five
Years | | | Ten
Years | |
AMG Managers Real Estate Securities Fund2,3,4,5,6 | | | 7.68 | % | | | 12.54 | % | | | 8.90 | % |
Dow Jones U.S. Select REIT Index7 | | | 6.87 | % | | | 12.56 | % | | | 7.53 | % |
S&P 500 Index8 | | | 5.20 | % | | | 14.33 | % | | | 7.85 | % |
The performance data shown represents past performance. Past performance is not a guarantee of future results. Current performance may be lower or higher than the performance data quoted. The investment return and principal value of an investment in the Fund will fluctuate so that an investor’s shares, when redeemed, may be worth more or less than their original cost.
Investors should carefully consider the Fund’s investment objectives, risks, charges and expenses before investing. For performance information through the most recent month end, current net asset values per share for the Fund and other information, please call (800) 835-3879 or visit our website at www.amgfunds.com for a free prospectus. Read it carefully before investing or sending money.
Distributed by AMG Distributors, Inc., member FINRA/SIPC.
| 1 | Total return equals income yield plus share price change and assumes reinvestment of all dividends and capital gain distributions. Returns are net of fees and may reflect offsets of Fund expenses as described in the prospectus. No adjustment has been made for taxes payable by shareholders on their reinvested dividends and capital gain distributions. Returns for periods greater than one year are annualized. The listed returns on the Fund are net of expenses and based on the published NAV as of October 31, 2015. All returns are in U.S. dollars ($). |
| 2 | From time to time, the Fund’s advisor has waived its fees and/or absorbed Fund expenses, which has resulted in higher returns. |
| 3 | The Fund is subject to special risk considerations similar to those associated with the direct ownership of real estate. Real estate valuations may be subject to factors such as changing general and local economic, financial, competitive, and environmental conditions. |
| 4 | Companies that are in similar businesses may be similarly affected by particular economic or market events; to the extent the Fund has substantial holdings within a particular sector, the risks associated with that sector increase. |
| 5 | A greater percentage of the Fund’s holdings may be focused in a smaller number of securities which may place the Fund at greater risk than a more diversified fund. |
| 6 | Investing in initial public offerings (IPOs) is risky and the prices of stocks purchased in IPOs tend to fluctuate more widely than stocks of companies that have been publicly traded for a longer period of time. Stocks purchased in IPOs generally do not have a trading history, and information about the companies may be available for very limited periods. |
| 7 | The Dow Jones U.S. Select REIT Index measures U.S. publicly traded Real Estate Investment Trusts. Unlike the Fund, the Dow Jones U.S. Select REIT Index is unmanaged, is not available for investment, and does not incur expenses. |
| 8 | The S&P 500 Index is a capitalization-weighted index of 500 stocks. The S&P 500 Index is designed to measure performance of the broad domestic economy through changes in the aggregate market value of 500 stocks representing all major industries. Unlike the Fund, the Index is unmanaged, is not available for investment, and does not incur expenses. |
The S&P 500 Index is proprietary data of Standard & Poor’s, a division of McGraw-Hill Companies, Inc. All rights reserved.
The Dow Jones U.S. Select REIT Index is proprietary data of Standard & Poor’s Dow Jones Indices LLC, a division of McGraw-Hill Companies, Inc. All rights reserved.
Not FDIC insured, nor bank guaranteed. May lose value.
28
AMG Managers Real Estate Securities Fund
Fund Snapshots (unaudited)
October 31, 2015
PORTFOLIO BREAKDOWN
| | | | |
| | | AMG Managers | |
| | | Real Estate | |
Sector | | Securities Fund** | |
REITS (Apartments) | | | 18.7 | % |
REITS (Office Properties) | | | 15.5 | % |
REITS (Regional Malls) | | | 12.6 | % |
REITS (Diversified) | | | 12.0 | % |
REITS (Health Care) | | | 10.3 | % |
REITS (Shopping Centers) | | | 8.6 | % |
REITS (Storage) | | | 8.0 | % |
REITS (Hotels) | | | 5.5 | % |
REITS (Warehouse/Industrials) | | | 5.3 | % |
Other Assets and Liabilities | | | 3.5 | % |
| ** | As a percentage of net assets. |
TOP TEN HOLDINGS
| | | | |
Security Name | | % of
Net Assets | |
Simon Property Group, Inc.* | | | 7.4 | % |
Public Storage* | | | 5.6 | |
Boston Properties, Inc.* | | | 5.0 | |
AvalonBay Communities, Inc.* | | | 4.9 | |
Essex Property Trust, Inc.* | | | 4.2 | |
Equity Residential* | | | 4.2 | |
General Growth Properties, Inc.* | | | 4.0 | |
Vornado Realty Trust* | | | 3.4 | |
Ventas, Inc.* | | | 3.3 | |
Host Hotels & Resorts, Inc. | | | 3.2 | |
| | | | |
Top Ten as a Group | | | 45.2 | % |
| | | | |
| * | Top Ten Holdings as of April 30, 2015. |
Because a fund’s strategy may result in multiple investments in particular sectors of the economy, its performance may depend on the performance of those sectors and may fluctuate more widely than investments diversified across more sectors. For additional information on these and other risk considerations, please see the Fund’s prospectus.
Any sectors, industries, or securities discussed should not be perceived as investment recommendations. Mention of a specific security should not be considered a recommendation to buy or solicitation to sell that security. Specific securities mentioned in this report may have been sold from the Fund’s portfolio of investments by the time you receive this report.
29
AMG Managers Real Estate Securities Fund
Schedule of Portfolio Investments
October 31, 2015
| | | | | | | | |
| | | Shares | | | Value | |
REITs - 96.5% | | | | | | | | |
Apartments - 18.7% | | | | | | | | |
Apartment Investment & Management Co., Class A | | | 209,820 | | | $ | 8,222,846 | |
AvalonBay Communities, Inc. | | | 98,670 | | | | 17,250,476 | |
Camden Property Trust | | | 72,560 | | | | 5,354,202 | |
Equity Residential | | | 188,070 | | | | 14,541,572 | |
Essex Property Trust, Inc. | | | 66,010 | | | | 14,551,244 | |
UDR, Inc. | | | 156,220 | | | | 5,383,341 | |
Total Apartments | | | | | | | 65,303,681 | |
Diversified - 12.0% | | | | | | | | |
Digital Realty Trust, Inc. | | | 50,730 | | | | 3,751,991 | |
Duke Realty Corp. | | | 420,520 | | | | 8,704,764 | |
Liberty Property Trust | | | 187,810 | | | | 6,389,296 | |
PS Business Parks, Inc. | | | 57,230 | | | | 4,909,762 | |
Retail Properties of America, Inc., Class A | | | 152,900 | | | | 2,288,913 | |
Vornado Realty Trust | | | 118,090 | | | | 11,873,950 | |
Washington Real Estate Investment Trust | | | 156,780 | | | | 4,234,628 | |
Total Diversified | | | | | | | 42,153,304 | |
Health Care - 10.3% | | | | | | | | |
Care Capital Properties, Inc. | | | 152,670 | | | | 5,030,476 | |
Healthcare Trust of America, Inc., Class A | | | 107,260 | | | | 2,822,011 | |
Physicians Realty Trust | | | 133,560 | | | | 2,134,289 | |
Senior Housing Properties Trust | | | 223,160 | | | | 3,389,800 | |
Ventas, Inc. | | | 215,350 | | | | 11,568,602 | |
Welltower, Inc. | | | 173,380 | | | | 11,247,161 | |
Total Health Care | | | | | | | 36,192,339 | |
Hotels - 5.5% | | | | | | | | |
Ashford Hospitality Prime, Inc. | | | 10,600 | | | | 155,820 | |
Chesapeake Lodging Trust | | | 118,720 | | | | 3,269,549 | |
Host Hotels & Resorts, Inc. | | | 652,790 | | | | 11,312,851 | |
Sunstone Hotel Investors, Inc. | | | 300,830 | | | | 4,350,002 | |
Total Hotels | | | | | | | 19,088,222 | |
Office Properties - 15.5% | | | | | | | | |
Boston Properties, Inc. | | | 139,900 | | | | 17,606,415 | |
Brandywine Realty Trust | | | 289,930 | | | | 3,914,055 | |
Empire State Realty Trust, Inc., Class A | | | 290,370 | | | | 5,174,393 | |
Equity Commonwealth* | | | 74,900 | | | | 2,150,379 | |
Highwoods Properties, Inc. | | | 141,630 | | | | 6,153,823 | |
Hudson Pacific Properties, Inc. | | | 288,580 | | | | 8,244,731 | |
| | | | | | | | |
| | | Shares | | | Value | |
Kilroy Realty Corp. | | | 80,850 | | | $ | 5,323,164 | |
Paramount Group, Inc. | | | 68,530 | | | | 1,217,778 | |
SL Green Realty Corp. | | | 37,740 | | | | 4,476,719 | |
Total Office Properties | | | | | | | 54,261,457 | |
Regional Malls - 12.6% | | | | | | | | |
General Growth Properties, Inc. | | | 489,350 | | | | 14,166,682 | |
Simon Property Group, Inc. | | | 128,860 | | | | 25,960,136 | |
Taubman Centers, Inc. | | | 52,350 | | | | 4,029,903 | |
Total Regional Malls | | | | | | | 44,156,721 | |
Shopping Centers - 8.6% | | | | | | | | |
Equity One, Inc. | | | 102,850 | | | | 2,733,753 | |
Federal Realty Investment Trust | | | 14,990 | | | | 2,150,915 | |
Kimco Realty Corp. | | | 146,180 | | | | 3,913,239 | |
Ramco-Gershenson Properties Trust | | | 211,830 | | | | 3,558,744 | |
Regency Centers Corp. | | | 79,420 | | | | 5,397,383 | |
Retail Opportunity Investments Corp. | | | 104,370 | | | | 1,892,228 | |
Urban Edge Properties | | | 152,010 | | | | 3,608,717 | |
Weingarten Realty Investors | | | 188,520 | | | | 6,741,475 | |
Total Shopping Centers | | | | | | | 29,996,454 | |
Storage - 8.0% | | | | | | | | |
CubeSmart | | | 185,680 | | | | 5,165,618 | |
Public Storage | | | 85,500 | | | | 19,618,830 | |
Sovran Self Storage, Inc. | | | 33,590 | | | | 3,354,633 | |
Total Storage | | | | | | | 28,139,081 | |
Warehouse/Industrials - 5.3% | | | | | | | | |
CyrusOne, Inc. | | | 160,650 | | | | 5,667,732 | |
First Industrial Realty Trust, Inc. | | | 121,851 | | | | 2,641,730 | |
Prologis, Inc. | | | 224,970 | | | | 9,612,968 | |
QTS Realty Trust, Inc., Class A | | | 17,520 | | | | 753,535 | |
Total Warehouse/Industrials | | | | | | | 18,675,965 | |
Total REITs
(cost $306,267,752) | | | | | | | 337,967,224 | |
Other Investment Companies - 3.3%3 | | | | | | | | |
Dreyfus Institutional Cash Advantage Fund, Institutional Class Shares, 0.09%
(cost $11,445,674) | | | 11,445,674 | | | | 11,445,674 | |
Total Investments - 99.8%
(cost $317,713,426) | | | | | | | 349,412,898 | |
Other Assets, less Liabilities - 0.2% | | | | | | | 765,005 | |
Net Assets - 100.0% | | | | | | $ | 350,177,903 | |
The accompanying notes are an integral part of these financial statements.
30
Notes to Schedules of Portfolio Investments
The following footnotes should be read in conjunction with each of the Schedules of Portfolio Investments previously presented in this report.
At October 31, 2015, the approximate cost of investments for federal income tax purposes and the aggregate gross unrealized appreciation and depreciation based on tax cost were as follows:
| | | | | | | | | | | | | | | | |
| Fund | | Cost | | | Appreciation | | | Depreciation | | | Net | |
AMG Frontier Small Cap Growth Fund | | $ | 27,816,444 | | | $ | 7,493,457 | | | $ | (3,049,915 | ) | | $ | 4,443,542 | |
AMG TimesSquare All Cap Growth Fund | | | 47,240,509 | | | | 8,208,422 | | | | (758,922 | ) | | | 7,449,500 | |
AMG Managers Emerging Opportunities Fund | | | 168,049,066 | | | | 38,484,306 | | | | (15,196,930 | ) | | | 23,287,376 | |
AMG Managers Real Estate Securities Fund | | | 319,379,466 | | | | 36,433,181 | | | | (6,399,749 | ) | | | 30,033,432 | |
| * | Non-income producing security. |
| 1 | Some or all of these shares were out on loan to various brokers as of October 31, 2015 amounting to the following: |
| | | | | | | | |
| Fund | | Market Value | | | % of Net Assets | |
AMG Frontier Small Cap Growth Fund | | $ | 2,439,231 | | | | 8.3 | % |
AMG TimesSquare All Cap Growth Fund | | | 2,106,623 | | | | 4.0 | % |
AMG Managers Emerging Opportunities Fund | | | 12,803,485 | | | | 7.2 | % |
| 2 | Collateral received from brokers for securities lending was invested in these joint repurchase agreements. |
| 3 | Yield shown represents the October 31, 2015, seven-day average yield, which refers to the sum of the previous seven days’ dividends paid, expressed as an annual percentage. |
As of October 31, 2015, the securities in the AMG Managers Real Estate Securities Fund were all valued using Level 1 inputs. For a detailed breakout of the REITs by major industry classification, please refer to the Schedule of Portfolio Investments previously presented in this report.
The following tables summarizes the inputs used to value the Funds’ investments by the fair value hierarchy levels as of October 31, 2015: (See Note 1(a) in the Notes to Financial Statements.)
| | | | | | | | | | | | | | | | |
| | | Quoted Prices in Active Markets | | | Significant Other | | | Significant | | | | |
| | | for Identical Investments | | | Observable Inputs | | | Unobservable Inputs | | | | |
| | | Level 1 | | | Level 2 | | | Level 3 | | | Total | |
AMG Frontier Small Cap Growth Fund | | | | | | | | | | | | | | | | |
Investments in Securities | | | | | | | | | | | | | | | | |
Common Stocks† | | $ | 28,092,243 | | | | — | | | | — | | | $ | 28,092,243 | |
Short-Term Investments | | | | | | | | | | | | | | | | |
Repurchase Agreements | | | — | | | $ | 2,507,951 | | | | — | | | | 2,507,951 | |
Other Investment Companies | | | 1,659,792 | | | | — | | | | — | | | | 1,659,792 | |
| | | | | | | | | | | | | | | | |
Total Investments in Securities | | $ | 29,752,035 | | | $ | 2,507,951 | | | | — | | | $ | 32,259,986 | |
| | | | | | | | | | | | | | | | |
The accompanying notes are an integral part of these financial statements.
31
Notes to Schedules of Portfolio Investments (continued)
| | | | | | | | | | | | | | | | |
| | | Quoted Prices in Active Markets | | | Significant Other | | | Significant | | | | |
| | | for Identical Investments | | | Observable Inputs | | | Unobservable Inputs | | | | |
| | | Level 1 | | | Level 2 | | | Level 3 | | | Total | |
AMG TimesSquare All Cap Growth Fund | | | | | | | | | | | | | | | | |
Investments in Securities | | | | | | | | | | | | | | | | |
Common Stocks† | | $ | 49,791,868 | | | | — | | | | — | | | $ | 49,791,868 | |
Short-Term Investments | | | | | | | | | | | | | | | | |
Repurchase Agreements | | | — | | | $ | 2,163,610 | | | | — | | | | 2,163,610 | |
Other Investment Companies | | | 2,734,531 | | | | — | | | | — | | | | 2,734,531 | |
| | | | | | | | | | | | | | | | |
Total Investments in Securities | | $ | 52,526,399 | | | $ | 2,163,610 | | | | — | | | $ | 54,690,009 | |
| | | | | | | | | | | | | | | | |
| | | | | | | | | | | | | | | | |
| | | Quoted Prices in Active Markets | | | Significant Other | | | Significant | | | | |
| | | for Identical Investments | | | Observable Inputs | | | Unobservable Inputs | | | | |
| | | Level 1 | | | Level 2 | | | Level 3 | | | Total | |
AMG Managers Emerging Opportunities Fund | | | | | | | | | | | | | | | | |
Investments in Securities | | | | | | | | | | | | | | | | |
Common Stocks† | | $ | 171,937,772 | | | | — | | | | — | | | $ | 171,937,772 | |
Exchange Traded Funds | | | 364,055 | | | | — | | | | — | | | | 364,055 | |
Warrants | | | — | | | | — | | | | — | | | | — | |
Short-Term Investments | | | | | | | | | | | | | | | | |
Repurchase Agreements | | | — | | | $ | 13,373,948 | | | | — | | | | 13,373,948 | |
Other Investment Companies | | | 5,660,667 | | | | — | | �� | | — | | | | 5,660,667 | |
| | | | | | | | | | | | | | | | |
Total Investments in Securities | | $ | 177,962,494 | | | $ | 13,373,948 | | | | — | | | $ | 191,336,442 | |
| | | | | | | | | | | | | | | | |
| † | All common stocks held in the Funds are Level 1 securities. For a detailed breakout of the common stocks by major industry classification, please refer to the respective Schedule of Portfolio Investments. |
As of October 31, 2015, the Funds had no transfers between levels from the beginning of the reporting period.
INVESTMENTS DEFINITIONS AND ABBREVIATIONS:
ADR: ADR after the name of a holding stands for American Depositary Receipt, representing ownership of foreign securities on deposit with a domestic custodian bank. The value of the ADR securities is determined or significantly influenced by trading on exchanges not located in the United States or Canada. Sponsored ADRs are initiated by the underlying foreign company.
ETF: Exchange Traded Fund
REIT: Real Estate Investment Trust
The accompanying notes are an integral part of these financial statements.
32
Statement of Assets and Liabilities
October 31, 2015
| | | | | | | | | | | | |
| | | | | | AMG | | | AMG Managers | |
| | | AMG Frontier | | | TimesSquare | | | Emerging | |
| | | Small Cap | | | All Cap | | | Opportunities | |
| | | Growth Fund | | | Growth Fund | | | Fund | |
Assets: | | | | | | | | | | | | |
Investments at value* (including securities on loan valued at $2,439,231, $2,106,623 and $12,803,485, respectively) | | $ | 32,259,986 | | | $ | 54,690,009 | | | $ | 191,336,442 | |
Receivable for investments sold | | | 450,019 | | | | 615,940 | | | | 1,395,754 | |
Dividends, interest and other receivables | | | 3,963 | | | | 9,539 | | | | 80,289 | |
Receivable from affiliate | | | 11,873 | | | | 24,819 | | | | 44,520 | |
Receivable for Fund shares sold | | | 100 | | | | 145,855 | | | | 29,616 | |
Prepaid expenses | | | 10,321 | | | | 14,710 | | | | 12,449 | |
Total assets | | | 32,736,262 | | | | 55,500,872 | | | | 192,899,070 | |
Liabilities: | | | | | | | | | | | | |
Payable upon return of securities loaned | | | 2,507,951 | | | | 2,163,610 | | | | 13,373,948 | |
Payable for investments purchased | | | 935,025 | | | | 1,148,421 | | | | 1,938,815 | |
Payable for Fund shares repurchased | | | 9,411 | | | | 23,391 | | | | 202,426 | |
Accrued expenses: | | | | | | | | | | | | |
Investment advisory and management fees | | | 24,906 | | | | 32,072 | | | | 151,857 | |
Administrative fees | | | — | | | | 10,691 | | | | 37,964 | |
Shareholder servicing fees - Investor Class | | | 38 | | | | 208 | | | | — | |
Shareholder servicing fees - Service Class | | | 4,281 | | | | 4,040 | | | | 31,294 | |
Distribution fees - Investor Class | | | 38 | | | | 74 | | | | — | |
Trustees fees and expenses | | | 150 | | | | 188 | | | | 815 | |
Other | | | 37,910 | | | | 39,699 | | | | 71,486 | |
Total liabilities | | | 3,519,710 | | | | 3,422,394 | | | | 15,808,605 | |
Net Assets | | $ | 29,216,552 | | | $ | 52,078,478 | | | $ | 177,090,465 | |
Net Assets Represent: | | | | | | | | | | | | |
Paid-in capital | | $ | 18,554,919 | | | $ | 41,637,313 | | | $ | 134,670,975 | |
Undistributed net investment income (distributions in excess of income) | | | — | | | | (28,471 | ) | | | 716 | |
Accumulated net realized gain from investments | | | 5,341,117 | | | | 2,883,514 | | | | 15,985,272 | |
Net unrealized appreciation of investments | | | 5,320,516 | | | | 7,586,122 | | | | 26,433,502 | |
Net Assets | | $ | 29,216,552 | | | $ | 52,078,478 | | | $ | 177,090,465 | |
Investor Class: | | | | | | | | | | | | |
Net Assets | | $ | 179,264 | | | $ | 354,045 | | | | n/a | |
Shares outstanding | | | 13,210 | | | | 21,714 | | | | n/a | |
Net asset value, offering and redemption price per share | | $ | 13.57 | | | $ | 16.30 | | | | n/a | |
Service Class: | | | | | | | | | | | | |
Net Assets | | $ | 12,671,400 | | | $ | 30,742,753 | | | $ | 145,979,959 | |
Shares outstanding | | | 920,759 | | | | 1,849,751 | | | | 3,581,166 | |
Net asset value, offering and redemption price per share | | $ | 13.76 | | | $ | 16.62 | | | $ | 40.76 | |
Institutional Class: | | | | | | | | | | | | |
Net Assets | | $ | 16,365,888 | | | $ | 20,981,680 | | | $ | 31,110,506 | |
Shares outstanding | | | 1,173,062 | | | | 1,263,670 | | | | 757,870 | |
Net asset value, offering and redemption price per share | | $ | 13.95 | | | $ | 16.60 | | | $ | 41.05 | |
| | | |
* Investments at cost | | $ | 26,939,470 | | | $ | 47,103,887 | | | $ | 164,902,940 | |
The accompanying notes are an integral part of these financial statements.
33
Statement of Assets and Liabilities (continued)
| | | | |
| | | AMG Managers
Real Estate
Securities Fund | |
Assets: | | | | |
Investments at value* | | $ | 349,412,898 | |
Receivable for investments sold | | | 1,788,096 | |
Receivable for Fund shares sold | | | 609,021 | |
Dividends, interest and other receivables | | | 117,402 | |
Prepaid expenses | | | 3,381 | |
Total assets | | | 351,930,798 | |
Liabilities: | | | | |
Payable for investments purchased | | | 711,167 | |
Payable for Fund shares repurchased | | | 638,146 | |
Accrued expenses: | | | | |
Investment advisory and management fees | | | 176,507 | |
Administrative fees | | | 73,545 | |
Shareholder servicing fees | | | 73,545 | |
Trustees fees and expenses | | | 1,539 | |
Other | | | 78,446 | |
Total liabilities | | | 1,752,895 | |
Net Assets | | $ | 350,177,903 | |
Net Assets Represent: | | | | |
Paid-in capital | | $ | 288,601,814 | |
Accumulated net realized gain from investments | | | 29,876,617 | |
Net unrealized appreciation of investments | | | 31,699,472 | |
Net Assets | | $ | 350,177,903 | |
Shares outstanding | | | 28,370,953 | |
Net asset value, offering and redemption price per share | | $ | 12.34 | |
| |
* Investments at cost | | $ | 317,713,426 | |
The accompanying notes are an integral part of these financial statements.
34
Statement of Operations
For the fiscal year ended October 31, 2015
| | | | | | | | | | | | | | | | |
| | | | | | AMG | | | AMG Managers | | | | |
| | | AMG Frontier | | | TimesSquare | | | Emerging | | | AMG Managers | |
| | | Small Cap | | | All Cap | | | Opportunities | | | Real Estate | |
| | | Growth Fund | | | Growth Fund | | | Fund | | | Securities Fund | |
Investment Income: | | | | | | | | | | | | | | | | |
Dividend income | | $ | 213,405 | | | $ | 386,056 | | | $ | 1,491,399 | 1 | | $ | 8,503,089 | 2 |
Securities lending income | | | 57,716 | | | | 6,745 | | | | 242,894 | | | | — | |
Interest income | | | — | | | | 92 | | | | 7 | | | | — | |
Foreign withholding tax | | | (825 | ) | | | (2,607 | ) | | | — | | | | — | |
Total investment income | | | 270,296 | | | | 390,286 | | | | 1,734,300 | | | | 8,503,089 | |
Expenses: | | | | | | | | | | | | | | | | |
Investment advisory and management fees | | | 349,287 | | | | 345,107 | | | | 2,002,261 | | | | 2,048,275 | |
Administrative fees | | | — | | | | 115,036 | | | | 500,565 | | | | 853,448 | |
Distribution fees - Investor Class | | | 830 | | | | 2,547 | | | | — | | | | — | |
Shareholder servicing fees - Service Class | | | 33,537 | | | | 32,543 | | | | 414,023 | | | | — | |
Shareholder servicing fees - Investor Class | | | 830 | | | | 2,547 | | | | — | | | | — | |
Shareholder servicing fees | | | — | | | | — | | | | — | | | | 853,448 | |
Registration fees | | | 39,228 | | | | 40,413 | | | | 36,830 | | | | 31,519 | |
Professional fees | | | 31,975 | | | | 32,482 | | | | 44,267 | | | | 63,408 | |
Custodian fees | | | 22,825 | | | | 8,430 | | | | 62,634 | | | | 26,879 | |
Transfer agent fees | | | 8,508 | | | | 19,441 | | | | 38,429 | | | | 30,296 | |
Reports to shareholders | | | 5,276 | | | | 10,018 | | | | 22,823 | | | | 68,953 | |
Trustees fees and expenses | | | 2,010 | | | | 2,379 | | | | 10,991 | | | | 19,951 | |
Miscellaneous | | | 2,223 | | | | 2,290 | | | | 4,870 | | | | 6,220 | |
Total expenses before offsets/reductions | | | 496,529 | | | | 613,233 | | | | 3,137,693 | | | | 4,002,397 | |
Expense reimbursements | | | (94,472 | ) | | | (211,933 | ) | | | (360,980 | ) | | | — | |
Expense reductions | | | — | | | | (6,282 | ) | | | (27,774 | ) | | | (15,895 | ) |
Net expenses | | | 402,057 | | | | 395,018 | | | | 2,748,939 | | | | 3,986,502 | |
Net investment income (loss) | | | (131,761 | ) | | | (4,732 | ) | | | (1,014,639 | ) | | | 4,516,587 | |
Net Realized and Unrealized Gain (Loss): | | | | | | | | | | | | | | | | |
Net realized gain on investments | | | 5,961,808 | | | | 2,968,003 | | | | 20,184,413 | | | | 31,657,902 | |
Net change in unrealized appreciation (depreciation) of investments | | | (6,262,262 | ) | | | (277,059 | ) | | | (23,639,257 | ) | | | (12,476,535 | ) |
Net realized and unrealized gain (loss) | | | (300,454 | ) | | | 2,690,944 | | | | (3,454,844 | ) | | | 19,181,367 | |
Net increase (decrease) in net assets resulting from operations | | $ | (432,215 | ) | | $ | 2,686,212 | | | $ | (4,469,483 | ) | | $ | 23,697,954 | |
| 1 | Includes non-recurring dividends of $253,122. |
| 2 | Includes non-recurring dividends of $922,651. |
The accompanying notes are an integral part of these financial statements.
35
Statements of Changes in Net Assets
For the fiscal years ended October 31,
| | | | | | | | | | | | | | | | | | | | | | | | |
| | | AMG Frontier | | | AMG TimesSquare All | | | AMG Managers Emerging | |
| | | Small Cap Growth Fund | | | Cap Growth Fund | | | Opportunities Fund | |
| | | 2015 | | | 2014 | | | 2015 | | | 2014 | | | 2015 | | | 2014 | |
Increase (Decrease) in Net Assets Resulting From Operations: | | | | | | | | | | | | | | | | | | | | | | | | |
Net investment loss | | $ | (131,761 | ) | | $ | (205,421 | ) | | $ | (4,732 | ) | | $ | (67,736 | ) | | $ | (1,014,639 | ) | | $ | (1,226,649 | ) |
Net realized gain on investments | | | 5,961,808 | | | | 16,786,267 | | | | 2,968,003 | | | | 3,340,666 | | | | 20,184,413 | | | | 22,310,331 | |
Net change in unrealized appreciation (depreciation) of investments | | | (6,262,262 | ) | | | (11,092,183 | ) | | | (277,059 | ) | | | 994,416 | | | | (23,639,257 | ) | | | (11,389,106 | ) |
Net increase (decrease) in net assets resulting from operations | | | (432,215 | ) | | | 5,488,663 | | | | 2,686,212 | | | | 4,267,346 | | | | (4,469,483 | ) | | | 9,694,576 | |
Distributions to Shareholders: | | | | | | | | | | | | | | | | | | | | | | | | |
From net investment income: | | | | | | | | | | | | | | | | | | | | | | | | |
Investor Class | | | — | | | | — | | | | — | | | | — | | | | — | | | | — | |
Service Class | | | — | | | | — | | | | (18,354 | ) | | | — | | | | — | | | | — | |
Institutional Class | | | — | | | | — | | | | (5,352 | ) | | | — | | | | — | | | | — | |
From net realized gain on investments: | | | | | | | | | | | | | | | | | | | | | | | | |
Investor Class | | | (160,440 | ) | | | (41,612 | ) | | | (21,941 | ) | | | (535,996 | ) | | | — | | | | — | |
Service Class | | | (6,794,785 | ) | | | (1,754,199 | ) | | | (2,931,374 | ) | | | (3,026,191 | ) | | | (18,810,876 | ) | | | (23,264,454 | ) |
Institutional Class | | | (9,202,305 | ) | | | (6,547,364 | ) | | | (321,056 | ) | | | (314,008 | ) | | | (3,864,439 | ) | | | (5,190,571 | ) |
Total distributions to shareholders | | | (16,157,530 | ) | | | (8,343,175 | ) | | | (3,298,077 | ) | | | (3,876,195 | ) | | | (22,675,315 | ) | | | (28,455,025 | ) |
Capital Share Transactions:1 | | | | | | | | | | | | | | | | | | | | | | | | |
Net increase (decrease) from capital share transactions | | | 9,529,111 | | | | (34,624,118 | ) | | | 13,748,922 | | | | 2,258,667 | | | | (444,065 | ) | | | 6,392,011 | |
Total increase (decrease) in net assets | | | (7,060,634 | ) | | | (37,478,630 | ) | | | 13,137,057 | | | | 2,649,818 | | | | (27,588,863 | ) | | | (12,368,438 | ) |
Net Assets: | | | | | | | | | | | | | | | | | | | | | | | | |
Beginning of year | | | 36,277,186 | | | | 73,755,816 | | | | 38,941,421 | | | | 36,291,603 | | | | 204,679,328 | | | | 217,047,766 | |
End of year | | $ | 29,216,552 | | | $ | 36,277,186 | | | $ | 52,078,478 | | | $ | 38,941,421 | | | $ | 177,090,465 | | | $ | 204,679,328 | |
End of year Undistributed net investment income (distributions in excess of income) | | | — | | | | — | | | $ | (28,471 | ) | | | — | | | $ | 716 | | | $ | 126,489 | |
| | | | | | | | | | | | | | | | | | | | | | | | |
| 1 | See Note 1(g) of the Notes to Financial Statements. |
The accompanying notes are an integral part of these financial statements.
36
Statements of Changes in Net Assets (continued)
For the fiscal years ended October 31,
| | | | | | | | |
| | | AMG Managers Real | |
| | | Estate Securities Fund | |
| | | 2015 | | | 2014 | |
Increase (Decrease) in Net Assets Resulting From Operations: | | | | | | | | |
Net investment income | | $ | 4,516,587 | | | $ | 3,200,514 | |
Net realized gain on investments | | | 31,657,902 | | | | 10,848,695 | |
Net change in unrealized appreciation (depreciation) of investments | | | (12,476,535 | ) | | | 34,560,852 | |
Net increase in net assets resulting from operations | | | 23,697,954 | | | | 48,610,061 | |
Distributions to Shareholders: | | | | | | | | |
From net investment income | | | (5,877,674 | ) | | | (2,925,112 | ) |
From net realized gain on investments | | | (10,367,813 | ) | | | (12,258,881 | ) |
Total distributions to shareholders | | | (16,245,487 | ) | | | (15,183,993 | ) |
Capital Share Transactions: | | | | | | | | |
Proceeds from sale of shares | | | 151,157,837 | | | | 135,347,394 | |
Reinvestment of dividends and distributions | | | 14,068,721 | | | | 13,118,901 | |
Cost of shares repurchased | | | (138,458,625 | ) | | | (78,560,763 | ) |
Net increase from capital share transactions | | | 26,767,933 | | | | 69,905,532 | |
Total increase in net assets | | | 34,220,400 | | | | 103,331,600 | |
Net Assets: | | | | | | | | |
Beginning of year | | | 315,957,503 | | | | 212,625,903 | |
End of year | | $ | 350,177,903 | | | $ | 315,957,503 | |
End of year undistributed net investment income | | | — | | | $ | 1,227,254 | |
| | | | | | | | |
Share Transactions: | | | | | | | | |
Sale of shares | | | 12,302,143 | | | | 12,516,599 | |
Reinvested shares from dividends and distributions | | | 1,159,190 | | | | 1,345,243 | |
Shares repurchased | | | (11,358,708 | ) | | | (7,291,385 | ) |
Net increase in shares | | | 2,102,625 | | | | 6,570,457 | |
The accompanying notes are an integral part of these financial statements.
37
AMG Frontier Small Cap Growth Fund
Financial Highlights
For a share outstanding throughout each fiscal year
| | | | | | | | | | | | | | | | | | | | |
| | | For the fiscal years ended October 31, | |
| Investor Class | | 2015 | | | 2014 | | | 2013 | | | 2012 | | | 2011 | |
Net Asset Value, Beginning of Year | | $ | 25.12 | | | $ | 26.26 | | | $ | 18.81 | | | $ | 17.90 | | | $ | 16.70 | |
Income (loss) from Investment Operations: | | | | | | | | | | | | | | | | | | | | |
Net investment loss1,2 | | | (0.12 | ) | | | (0.21 | )4 | | | (0.14 | )5 | | | (0.13 | )6 | | | (0.16 | ) |
Net realized and unrealized gain on investments | | | 0.19 | | | | 2.05 | | | | 7.59 | | | | 1.04 | | | | 1.36 | |
Total income from investment operations | | | 0.07 | | | | 1.84 | | | | 7.45 | | | | 0.91 | | | | 1.20 | |
Distributions to Shareholders from: | | | | | | | | | | | | | | | | | | | | |
Net realized gain on investments | | | (11.62 | ) | | | (2.98 | ) | | | — | | | | — | | | | — | |
Net Asset Value, End of Year | | $ | 13.57 | | | $ | 25.12 | | | $ | 26.26 | | | $ | 18.81 | | | $ | 17.90 | |
Total Return2 | | | (3.06 | )%8 | | | 7.24 | %8 | | | 39.61 | % | | | 5.08 | % | | | 7.19 | % |
Ratio of net expenses to average net assets (with offsets/reductions) | | | 1.55 | % | | | 1.55 | % | | | 1.58 | %7 | | | 1.55 | % | | | 1.55 | % |
Ratio of expenses to average net assets (with offsets) | | | 1.55 | % | | | 1.55 | % | | | 1.58 | %7 | | | 1.55 | % | | | 1.55 | % |
Ratio of total expenses to average net assets (without offsets/reductions)3 | | | 1.81 | % | | | 1.74 | % | | | 1.65 | %7 | | | 1.65 | % | | | 1.72 | % |
Ratio of net investment loss to average net assets2 | | | (0.76 | )% | | | (0.86 | )% | | | (0.64 | )%7 | | | (0.70 | )% | | | (0.86 | )% |
Portfolio turnover | | | 99 | % | | | 63 | % | | | 65 | % | | | 38 | % | | | 44 | % |
Net assets at end of year (000’s omitted) | | $ | 179 | | | $ | 365 | | | $ | 366 | | | $ | 474 | | | $ | 563 | |
| | | | | | | | | | | | | | | | | | | | |
| |
| | | For the fiscal years ended October 31, | |
| Service Class | | 2015 | | | 2014 | | | 2013 | | | 2012 | | | 2011 | |
Net Asset Value, Beginning of Year | | $ | 25.40 | | | $ | 26.48 | | | $ | 18.92 | | | $ | 17.96 | | | $ | 16.72 | |
Income (loss) from Investment Operations: | | | | | | | | | | | | | | | | | | | | |
Net investment loss1,2 | | | (0.08 | ) | | | (0.15 | )4 | | | (0.10 | )5 | | | (0.09 | )6 | | | (0.12 | ) |
Net realized and unrealized gain on investments | | | 0.20 | | | | 2.08 | | | | 7.66 | | | | 1.05 | | | | 1.36 | |
Total income from investment operations | | | 0.12 | | | | 1.93 | | | | 7.56 | | | | 0.96 | | | | 1.24 | |
Distributions to Shareholders from: | | | | | | | | | | | | | | | | | | | | |
Net realized gain on investments | | | (11.76 | ) | | | (3.01 | ) | | | — | | | | — | | | | — | |
Net Asset Value, End of Year | | $ | 13.76 | | | $ | 25.40 | | | $ | 26.48 | | | $ | 18.92 | | | $ | 17.96 | |
Total Return2 | | | (2.78 | )%8 | | | 7.54 | %8 | | | 39.96 | %8 | | | 5.35 | %8 | | | 7.42 | %8 |
Ratio of net expenses to average net assets (with offsets/reductions) | | | 1.28 | % | | | 1.28 | % | | | 1.33 | %7 | | | 1.30 | % | | | 1.30 | % |
Ratio of expenses to average net assets (with offsets) | | | 1.28 | % | | | 1.28 | % | | | 1.33 | %7 | | | 1.30 | % | | | 1.30 | % |
Ratio of total expenses to average net assets (without offsets/reductions)3 | | | 1.55 | % | | | 1.47 | % | | | 1.40 | %7 | | | 1.40 | % | | | 1.47 | % |
Ratio of net investment loss to average net assets2 | | | (0.51 | )% | | | (0.59 | )% | | | (0.43 | )%7 | | | (0.48 | )% | | | (0.63 | )% |
Portfolio turnover | | | 99 | % | | | 63 | % | | | 65 | % | | | 38 | % | | | 44 | % |
Net assets at end of year (000’s omitted) | | $ | 12,671 | | | $ | 14,842 | | | $ | 15,273 | | | $ | 12,664 | | | $ | 18,199 | |
| | | | | | | | | | | | | | | | | | | | |
38
AMG Frontier Small Cap Growth Fund
Financial Highlights
For a share outstanding throughout each fiscal year
| | | | | | | | | | | | | | | | | | | | |
| | | For the fiscal years ended October 31, | |
| Institutional Class | | 2015 | | | 2014 | | | 2013 | | | 2012 | | | 2011 | |
Net Asset Value, Beginning of Year | | $ | 25.69 | | | $ | 26.72 | | | $ | 19.04 | | | $ | 18.03 | | | $ | 16.74 | |
Income (loss) from Investment Operations: | | | | | | | | | | | | | | | | | | | | |
Net investment loss1,2 | | | (0.05 | ) | | | (0.09 | )4 | | | (0.04 | )5 | | | (0.04 | )6 | | | (0.08 | ) |
Net realized and unrealized gain on investments | | | 0.21 | | | | 2.10 | | | | 7.72 | | | | 1.05 | | | | 1.37 | |
Total income from investment operations | | | 0.16 | | | | 2.01 | | | | 7.68 | | | | 1.01 | | | | 1.29 | |
Distributions to Shareholders from: | | | | | | | | | | | | | | | | | | | | |
Net realized gain on investments | | | (11.90 | ) | | | (3.04 | ) | | | — | | | | — | | | | — | |
Net Asset Value, End of Year | | $ | 13.95 | | | $ | 25.69 | | | $ | 26.72 | | | $ | 19.04 | | | $ | 18.03 | |
Total Return2 | | | (2.55 | )%8 | | | 7.78 | %8 | | | 40.34 | % | | | 5.60 | % | | | 7.71 | % |
Ratio of net expenses to average net assets (with offsets/reductions) | | | 1.05 | % | | | 1.05 | % | | | 1.08 | %7 | | | 1.05 | % | | | 1.05 | % |
Ratio of expenses to average net assets (with offsets) | | | 1.05 | % | | | 1.05 | % | | | 1.08 | %7 | | | 1.05 | % | | | 1.05 | % |
Ratio of total expenses to average net assets (without offsets/reductions)3 | | | 1.32 | % | | | 1.24 | % | | | 1.15 | %7 | | | 1.15 | % | | | 1.22 | % |
Ratio of net investment loss to average net assets2 | | | (0.28 | )% | | | (0.34 | )% | | | (0.17 | )%7 | | | (0.20 | )% | | | (0.41 | )% |
Portfolio turnover | | | 99 | % | | | 63 | % | | | 65 | % | | | 38 | % | | | 44 | % |
Net assets at end of year (000’s omitted) | | $ | 16,366 | | | $ | 21,070 | | | $ | 58,117 | | | $ | 73,762 | | | $ | 77,217 | |
| | | | | | | | | | | | | | | | | | | | |
39
AMG TimesSquare All Cap Growth Fund
Financial Highlights
For a share outstanding throughout each fiscal year
| | | | | | | | | | | | | | | | | | | | |
| | | For the fiscal years ended October 31, | |
| Investor Class | | 2015 | | | 2014 | | | 2013 | | | 2012 | | | 2011 | |
Net Asset Value, Beginning of Year | | $ | 16.68 | | | $ | 16.60 | | | $ | 12.75 | | | $ | 11.02 | | | $ | 10.93 | |
Income (loss) from Investment Operations: | | | | | | | | | | | | | | | | | | | | |
Net investment income (loss)1,2 | | | 0.02 | | | | (0.08 | ) | | | (0.02 | )9 | | | (0.02 | )6 | | | (0.10 | ) |
Net realized and unrealized gain on investments | | | 1.21 | | | | 1.92 | | | | 3.89 | | | | 1.75 | | | | 0.19 | |
Total income from investment operations | | | 1.23 | | | | 1.84 | | | | 3.87 | | | | 1.73 | | | | 0.09 | |
Distributions to Shareholders from: | | | | | | | | | | | | | | | | | | | | |
Net investment income | | | — | | | | — | | | | (0.02 | ) | | | — | | | | (0.00 | )# |
Net realized gain on investments | | | (1.61 | ) | | | (1.76 | ) | | | — | | | | — | | | | — | |
Total distributions to shareholders | | | (1.61 | ) | | | (1.76 | ) | | | (0.02 | ) | | | — | | | | (0.00 | )# |
Net Asset Value, End of Year | | $ | 16.30 | | | $ | 16.68 | | | $ | 16.60 | | | $ | 12.75 | | | $ | 11.02 | |
Total Return2 | | | 7.78 | %8 | | | 11.59 | % | | | 30.41 | % | | | 15.70 | % | | | 0.84 | % |
Ratio of net expenses to average net assets (with offsets/reductions) | | | 1.28 | % | | | 1.25 | % | | | 1.30 | %10 | | | 1.17 | % | | | 1.11 | % |
Ratio of expenses to average net assets (with offsets) | | | 1.29 | % | | | 1.28 | % | | | 1.32 | %10 | | | 1.19 | % | | | 1.19 | % |
Ratio of total expenses to average net assets (without offsets/reductions)3 | | | 1.75 | % | | | 1.79 | % | | | 1.85 | %10 | | | 1.80 | % | | | 2.04 | % |
Ratio of net investment income (loss) to average net assets2 | | | 0.09 | % | | | (0.52 | )% | | | (0.17 | )%10 | | | (0.14 | )% | | | (0.86 | )% |
Portfolio turnover | | | 141 | % | | | 94 | % | | | 102 | % | | | 87 | % | | | 102 | % |
Net assets at end of year (000’s omitted) | | $ | 354 | | | $ | 5,417 | | | $ | 5,046 | | | $ | 3,608 | | | $ | 2,465 | |
| | | | | | | | | | | | | | | | | | | | |
| |
| | | For the fiscal years ended October 31, | |
| Service Class | | 2015 | | | 2014 | | | 2013 | | | 2012 | | | 2011 | |
Net Asset Value, Beginning of Year | | $ | 16.95 | | | $ | 16.80 | | | $ | 12.88 | | | $ | 11.10 | | | $ | 10.94 | |
Income (loss) from Investment Operations: | | | | | | | | | | | | | | | | | | | | |
Net investment income (loss)1,2 | | | (0.00 | )# | | | (0.02 | ) | | | 0.03 | 9 | | | 0.01 | 6 | | | (0.02 | ) |
Net realized and unrealized gain on investments | | | 1.33 | | | | 1.95 | | | | 3.93 | | | | 1.77 | | | | 0.18 | |
Total income from investment operations | | | 1.33 | | | | 1.93 | | | | 3.96 | | | | 1.78 | | | | 0.16 | |
Distributions to Shareholders from: | | | | | | | | | | | | | | | | | | | | |
Net investment income | | | (0.01 | ) | | | — | | | | (0.04 | ) | | | — | | | | — | |
Net realized gain on investments | | | (1.65 | ) | | | (1.78 | ) | | | — | | | | — | | | | — | |
Total distributions to shareholders | | | (1.66 | ) | | | (1.78 | ) | | | (0.04 | ) | | | — | | | | — | |
Net Asset Value, End of Year | | $ | 16.62 | | | $ | 16.95 | | | $ | 16.80 | | | $ | 12.88 | | | $ | 11.10 | |
Total Return2 | | | 8.24 | % | | | 12.04 | % | | | 30.88 | % | | | 16.04 | %8 | | | 1.46 | %8 |
Ratio of net expenses to average net assets (with offsets/reductions) | | | 0.88 | % | | | 0.86 | % | | | 0.90 | %10 | | | 0.96 | % | | | 0.96 | % |
Ratio of expenses to average net assets (with offsets) | | | 0.89 | % | | | 0.89 | % | | | 0.92 | %10 | | | 0.98 | % | | | 1.04 | % |
Ratio of total expenses to average net assets (without offsets/reductions)3 | | | 1.35 | % | | | 1.40 | % | | | 1.45 | %10 | | | 1.59 | % | | | 1.89 | % |
Ratio of net investment income (loss) to average net assets2 | | | (0.02 | )% | | | (0.13 | )% | | | 0.23 | %10 | | | 0.09 | % | | | (0.17 | )% |
Portfolio turnover | | | 141 | % | | | 94 | % | | | 102 | % | | | 87 | % | | | 102 | % |
Net assets at end of year (000’s omitted) | | $ | 30,743 | | | $ | 30,198 | | | $ | 28,281 | | | $ | 19,498 | | | $ | 18,321 | |
| | | | | | | | | | | | | | | | | | | | |
40
AMG TimesSquare All Cap Growth Fund
Financial Highlights
For a share outstanding throughout each fiscal year
| | | | | | | | | | | | | | | | | | | | |
| | | For the fiscal years ended October 31, | |
| Institutional Class | | 2015 | | | 2014 | | | 2013 | | | 2012 | | | 2011 | |
Net Asset Value, Beginning of Year | | $ | 16.93 | | | $ | 16.77 | | | $ | 12.87 | | | $ | 11.07 | | | $ | 10.94 | |
Income (loss) from Investment Operations: | | | | | | | | | | | | | | | | | | | | |
Net investment income (loss)1,2 | | | (0.00 | )# | | | (0.01 | ) | | | 0.05 | 9 | | | 0.03 | 6 | | | 0.00 | # |
Net realized and unrealized gain on investments | | | 1.34 | | | | 1.95 | | | | 3.92 | | | | 1.77 | | | | 0.13 | |
Total income from investment operations | | | 1.34 | | | | 1.94 | | | | 3.97 | | | | 1.80 | | | | 0.13 | |
Distributions to Shareholders from: | | | | | | | | | | | | | | | | | | | | |
Net investment income | | | (0.03 | ) | | | — | | | | (0.07 | ) | | | — | | | | (0.00 | )# |
Net realized gain on investments | | | (1.64 | ) | | | (1.78 | ) | | | — | | | | — | | | | — | |
Total distributions to shareholders | | | (1.67 | ) | | | (1.78 | ) | | | (0.07 | ) | | | — | | | | (0.00 | )# |
Net Asset Value, End of Year | | $ | 16.60 | | | $ | 16.93 | | | $ | 16.77 | | | $ | 12.87 | | | $ | 11.07 | |
Total Return2 | | | 8.36 | % | | | 12.10 | %8 | | | 31.00 | %8 | | | 16.26 | % | | | 1.23 | % |
Ratio of net expenses to average net assets (with offsets/reductions) | | | 0.78 | % | | | 0.76 | % | | | 0.80 | %10 | | | 0.77 | % | | | 0.71 | % |
Ratio of expenses to average net assets (with offsets) | | | 0.79 | % | | | 0.79 | % | | | 0.82 | %10 | | | 0.79 | % | | | 0.79 | % |
Ratio of total expenses to average net assets (without offsets/reductions)3 | | | 1.25 | % | | | 1.30 | % | | | 1.35 | %10 | | | 1.40 | % | | | 1.64 | % |
Ratio of net investment income (loss) to average net assets2 | | | (0.01 | )% | | | (0.04 | )% | | | 0.35 | %10 | | | 0.26 | % | | | 0.03 | % |
Portfolio turnover | | | 141 | % | | | 94 | % | | | 102 | % | | | 87 | % | | | 102 | % |
Net assets at end of year (000’s omitted) | | $ | 20,982 | | | $ | 3,327 | | | $ | 2,965 | | | $ | 2,279 | | | $ | 1,982 | |
| | | | | | | | | | | | | | | | | | | | |
41
AMG Managers Emerging Opportunities Fund
Financial Highlights
For a share outstanding throughout each fiscal period
| | | | | | | | | | | | | | | | | | | | |
| | | For the fiscal years ended October 31, | |
| Service Class† | | 2015 | | | 2014 | | | 2013 | | | 2012 | | | 2011 | |
Net Asset Value, Beginning of Period | | $ | 47.11 | | | $ | 51.19 | | | $ | 37.26 | | | $ | 36.03 | | | $ | 33.42 | |
Income (loss) from Investment Operations: | | | | | | | | | | | | | | | | | | | | |
Net investment loss1,2 | | | (0.24 | )16 | | | (0.29 | )4 | | | (0.14 | )5 | | | (0.23 | ) | | | (0.27 | ) |
Net realized and unrealized gain (loss) on investments | | | (0.79 | ) | | | 3.01 | | | | 16.99 | | | | 4.12 | | | | 2.88 | |
Total income (loss) from investment operations | | | (1.03 | ) | | | 2.72 | | | | 16.85 | | | | 3.89 | | | | 2.61 | |
Distributions to Shareholders from: | | | | | | | | | | | | | | | | | | | | |
Net investment income | | | — | | | | — | | | | (0.07 | ) | | | — | | | | — | |
Net realized gain on investments | | | (5.32 | ) | | | (6.80 | ) | | | (2.85 | ) | | | (2.66 | ) | | | — | |
Total distributions to shareholders | | | (5.32 | ) | | | (6.80 | ) | | | (2.92 | ) | | | (2.66 | ) | | | — | |
Net Asset Value, End of Period | | $ | 40.76 | | | $ | 47.11 | | | $ | 51.19 | | | $ | 37.26 | | | $ | 36.03 | |
Total Return2 | | | (3.01 | )% | | | 5.09 | % | | | 49.00 | % | | | 11.55 | %††† | | | 7.78 | % |
Ratio of net expenses to average net assets (with offsets/reductions) | | | 1.42 | % | | | 1.41 | %11 | | | 1.44 | %12 | | | 1.41 | % | | | 1.41 | % |
Ratio of expenses to average net assets (with offsets) | | | 1.42 | % | | | 1.44 | %11 | | | 1.45 | %12 | | | 1.43 | % | | | 1.43 | % |
Ratio of total expenses to average net assets (without offsets/reductions)3 | | | 1.61 | % | | | 1.61 | %11 | | | 1.65 | %12 | | | 1.68 | % | | | 1.66 | % |
Ratio of net investment loss to average net assets2 | | | (0.55 | )% | | | (0.61 | )%11 | | | (0.33 | )%12 | | | (0.62 | )% | | | (0.73 | )% |
Portfolio turnover | | | 89 | % | | | 98 | % | | | 96 | % | | | 64 | % | | | 85 | % |
Net assets at end of period (000’s omitted) | | $ | 145,980 | | | $ | 169,398 | | | $ | 172,959 | | | $ | 110,732 | | | $ | 113,742 | |
| | | | | | | | | | | | | | | | | | | | |
| | | | | | | | | | | | | | | | | | | | |
| | | For the fiscal years ended October 31, | | | For the fiscal period
October 1, 2011 | |
| Institutional Class†† | | 2015 | | | 2014 | | | 2013 | | | 2012 | | | through October 31, 2011 | |
Net Asset Value, Beginning of Period | | $ | 47.32 | | | $ | 51.31 | | | $ | 37.37 | | | $ | 36.03 | | | $ | 31.02 | |
Income (loss) from Investment Operations: | | | | | | | | | | | | | | | | | | | | |
Net investment loss1,2 | | | (0.13 | )16 | | | (0.17 | )4 | | | (0.03 | )5 | | | (0.13 | ) | | | (0.01 | ) |
Net realized and unrealized gain (loss) on investments | | | (0.80 | ) | | | 3.00 | | | | 16.99 | | | | 4.13 | | | | 5.02 | |
Total income (loss) from investment operations | | | (0.93 | ) | | | 2.83 | | | | 16.96 | | | | 4.00 | | | | 5.01 | |
Distributions to Shareholders from: | | | | | | | | | | | | | | | | | | | | |
Net investment income | | | — | | | | — | | | | (0.17 | ) | | | — | | | | — | |
Net realized gain on investments | | | (5.34 | ) | | | (6.82 | ) | | | (2.85 | ) | | | (2.66 | ) | | | — | |
Total distributions to shareholders | | | (5.34 | ) | | | (6.82 | ) | | | (3.02 | ) | | | (2.66 | ) | | | — | |
Net Asset Value, End of Period | | $ | 41.05 | | | $ | 47.32 | | | $ | 51.31 | | | $ | 37.37 | | | $ | 36.03 | |
Total Return2 | | | (2.76 | )% | | | 5.33 | % | | | 49.36 | % | | | 11.84 | %††† | | | 16.18 | %14 |
Ratio of net expenses to average net assets (with offsets/reductions) | | | 1.17 | % | | | 1.16 | %11 | | | 1.19 | %12 | | | 1.16 | % | | | 1.17 | %15 |
Ratio of expenses to average net assets (with offsets) | | | 1.17 | % | | | 1.19 | %11 | | | 1.20 | %12 | | | 1.18 | % | | | 1.19 | %15 |
Ratio of total expenses to average net assets (without offsets/reductions)3 | | | 1.36 | % | | | 1.36 | %11 | | | 1.40 | %12 | | | 1.43 | % | | | 1.50 | %15 |
Ratio of net investment loss to average net assets2 | | | (0.30 | )% | | | (0.36 | )%11 | | | (0.08 | )%12 | | | (0.37 | )% | | | (0.42 | )%15 |
Portfolio turnover | | | 89 | % | | | 98 | % | | | 96 | % | | | 64 | % | | | 85 | % |
Net assets at end of period (000’s omitted) | | $ | 31,111 | | | $ | 35,282 | | | $ | 44,089 | | | $ | 29,791 | | | $ | 31,735 | |
| | | | | | | | | | | | | | | | | | | | |
42
AMG Managers Real Estate Securities Fund
Financial Highlights
For a share outstanding throughout each fiscal year
| | | | | | | | | | | | | | | | | | | | |
| | | For the fiscal years ended October 31, | |
| | | 2015 | | | 2014 | | | 2013 | | | 2012 | | | 2011 | |
Net Asset Value, Beginning of Year | | $ | 12.03 | | | $ | 10.79 | | | $ | 10.07 | | | $ | 8.95 | | | $ | 8.12 | |
Income from Investment Operations: | | | | | | | | | | | | | | | | | | | | |
Net investment income1,2 | | | 0.16 | 16 | | | 0.14 | | | | 0.11 | | | | 0.09 | | | | 0.06 | |
Net realized and unrealized gain on investments | | | 0.75 | | | | 1.84 | | | | 0.96 | | | | 1.11 | | | | 0.83 | |
Total income from investment operations | | | 0.91 | | | | 1.98 | | | | 1.07 | | | | 1.20 | | | | 0.89 | |
Distributions to Shareholders from: | | | | | | | | | | | | | | | | | | | | |
Net investment income | | | (0.21 | ) | | | (0.13 | ) | | | (0.10 | ) | | | (0.08 | ) | | | (0.06 | ) |
Net realized gain on investments | | | (0.39 | ) | | | (0.61 | ) | | | (0.25 | ) | | | — | | | | — | |
Total distributions to shareholders | | | (0.60 | ) | | | (0.74 | ) | | | (0.35 | ) | | | (0.08 | ) | | | (0.06 | ) |
Net Asset Value, End of Year | | $ | 12.34 | | | $ | 12.03 | | | $ | 10.79 | | | $ | 10.07 | | | $ | 8.95 | |
Total Return2 | | | 7.68 | % | | | 19.88 | % | | | 10.89 | %8 | | | 13.43 | % | | | 11.06 | % |
Ratio of net expenses to average net assets (with offsets/reductions) | | | 1.16 | % | | | 1.19 | % | | | 1.26 | %13 | | | 1.26 | % | | | 1.41 | % |
Ratio of expenses to average net assets (with offsets) | | | 1.17 | % | | | 1.20 | % | | | 1.27 | %13 | | | 1.27 | % | | | 1.42 | % |
Ratio of total expenses to average net assets (without offsets/reductions)3 | | | 1.17 | % | | | 1.20 | % | | | 1.27 | %13 | | | 1.28 | % | | | 1.48 | % |
Ratio of net investment income to average net assets2 | | | 1.32 | % | | | 1.27 | % | | | 1.08 | %13 | | | 0.92 | % | | | 0.69 | % |
Portfolio turnover | | | 61 | % | | | 49 | % | | | 86 | % | | | 36 | % | | | 75 | % |
Net assets at end of year (000’s omitted) | | $ | 350,178 | | | $ | 315,958 | | | $ | 212,626 | | | $ | 168,368 | | | $ | 55,568 | |
| | | | | | | | | | | | | | | | | | | | |
43
Notes to Financial Highlights
| # | Rounds to less than $0.01 per share or 0.01% or (0.01)%. |
| † | Effective October 1, 2011, existing shares of AMG Managers Emerging Opportunities Fund were reclassified and redesignated as Service Class shares. |
| †† | As of the close of business on September 30, 2011, Managers Institutional Micro-Cap Fund (“Institutional Micro-Cap”) merged into AMG Managers Emerging Opportunities Fund. Each full and partial share of Institutional Micro-Cap was exchanged for shares in the new Institutional Class of AMG Managers Emerging Opportunities Fund in an equivalent dollar amount. |
| ††† | Returns would have been lower if not for capital inflow resulting from market timing settlements. |
| 1 | Per share numbers have been calculated using average shares. |
| 2 | Total returns and net investment income (loss) would have been lower had certain expenses not been offset. |
| 3 | Excludes the impact of expense reimbursement and expense reductions such as brokerage credits, but includes expense repayments and non-reimbursable expenses, if any, such as interest, taxes and extraordinary expenses. (See Notes 1(c) and 2 in the Notes to Financial Statements.) |
| 4 | Includes non-recurring dividends. Without these dividends, net investment income per share would have been $(0.22), $(0.16), and $(0.10) for AMG Frontier Small Cap Growth Fund’s Investor Class, Service Class, and Institutional Class shares, respectively, and $(0.33) and $(0.21) for AMG Managers Emerging Opportunities Fund’s Service Class and Institutional Class shares, respectively. |
| 5 | Includes non-recurring dividends. Without these dividends, net investment income per share would have been $(0.20), $(0.17), and $(0.09) for AMG Frontier Small Cap Growth Fund’s Investor Class, Service Class, and Institutional Class shares, respectively, and $(0.31) and $(0.20) for AMG Managers Emerging Opportunities Fund’s Service Class and Institutional Class shares, respectively. |
| 6 | Includes non-recurring dividends. Without these dividends, net investment income per share would have been $(0.16), $(0.12), and $(0.07) for AMG Frontier Small Cap Growth Fund’s Investor Class, Service Class, and Institutional Class shares, respectively, and $(0.03), $(0.01), and $0.02 for AMG TimesSquare All Cap Growth Fund’s Investor Class, Service Class, and Institutional Class shares, respectively. |
| 7 | Includes non-routine extraordinary expenses amounting to 0.026%, 0.026% and 0.026% of average net assets for the Investor Class, Service Class and Institutional Class, respectively. |
| 8 | The Total Return is based on the Financial Statement Net Asset Values as shown above. |
| 9 | Includes a non-recurring dividend. Without this dividend, net investment income per share would have been $(0.05), $0.00, and $0.03 for AMG TimesSquare All Cap Growth Fund’s Investor Class, Service Class, and Institutional Class shares, respectively. |
| 10 | Includes non-routine extraordinary expenses amounting to 0.023%, 0.023% and 0.026% of average net assets for the Investor Class, Service Class and Institutional Class, respectively. |
| 11 | Includes tax expense of $23,725 or 0.01%. |
| 12 | Includes non-routine extraordinary expenses amounting to 0.022% and 0.022% of average net assets for the Service Class and Institutional Class, respectively. |
| 13 | Includes non-routine extraordinary expenses amounting to 0.027% of average net assets. |
| 16 | Includes non-recurring dividends. Without these dividends, net investment loss per share would have been $(0.30) and $(0.19) for AMG Managers Emerging Opportunities Fund’s Service Class and Institutional Class shares, respectively, and net investment income per share would have been $0.13 for AMG Real Estate Securities Fund. |
44
Notes to Financial Statements
October 31, 2015
1. SUMMARY OF SIGNIFICANT ACCOUNTING POLICIES
AMG Funds I (the “Trust”), is an open-end management investment company, organized as a Massachusetts business trust, and registered under the Investment Company Act of 1940, as amended (the “1940 Act”). Currently, the Trust consists of a number of different funds, each having distinct investment management objectives, strategies, risks and policies. Included in this report are the AMG Frontier Small Cap Growth Fund (“Small Cap”), AMG TimesSquare All Cap Growth Fund (“All Cap Growth”), AMG Managers Emerging Opportunities Fund (“Emerging Opportunities”) and AMG Managers Real Estate Securities Fund (“Real Estate Securities”), each a “Fund” and collectively, the “Funds.”
Small Cap and All Cap Growth each offer three classes of shares: Investor Class, Service Class, and Institutional Class. Emerging Opportunities currently offers two classes of shares: Institutional Class and Service Class. Each class represents an interest in the same assets of the Fund. Although all share classes generally have identical voting rights, each share class votes separately when required by law. Different share classes may pay different distribution amounts to the extent the net asset value per share and/or the expenses of such share classes differ. Each share class has its own expense structure. Please refer to a current prospectus for additional information on each share class.
Real Estate Securities is a non-diversified fund. A greater percentage of the Fund’s holdings may be focused in a smaller number of securities which may place the Fund at greater risk than a more diversified fund.
The Funds’ financial statements are prepared in accordance with accounting principles generally accepted in the United States of America (“U.S. GAAP”), which require management to make estimates and assumptions that affect the reported amounts of assets and liabilities and disclosure of contingent assets and liabilities at the date of the financial statements and the reported amounts of income and expenses during the reporting period. Actual results could differ from those estimates and such differences could be material. The following is a summary of significant accounting policies followed by the Funds in the preparation of their financial statements:
a. VALUATION OF INVESTMENTS
Equity securities traded on a national securities exchange or reported on the NASDAQ national market system (“NMS”) are valued at the last quoted sales price on the primary exchange or, if applicable, the NASDAQ official closing price or the official closing price of the relevant exchange or, lacking any sales, at the last quoted bid price or the mean between the last quoted bid and ask prices (the “exchange mean price”). Equity securities traded in the over-the-counter market (other than NMS securities) are valued at the exchange mean price. Foreign equity securities (securities principally traded in markets other than U.S. markets) are valued at the official closing price on the primary exchange or, for markets that either do not offer an official closing price or where the official closing price may not be representative of the overall market, the last quoted sale price.
Fixed income securities purchased with a remaining maturity of 60 days or less are valued at amortized cost, provided that the amortized cost value is approximately the same as the fair value of the security valued without the use of amortized cost. Investments in other open-end regulated investment companies are valued at their end of day net asset value per share.
The Funds’ portfolio investments are generally valued based on independent market quotations or prices or, if none, “evaluative” or other market based valuations provided by third-party pricing services approved by the Board of Trustees of the Trust (the “Board”). Under certain circumstances, the value of certain Fund portfolio investments (including derivatives) may be based on an evaluation of fair value, pursuant to procedures established by and under the general supervision of the Board. The Valuation Committee, which is comprised of the Independent Trustees of the Board, and the Pricing Committee, which is comprised of representatives from AMG Funds LLC (the “Investment Manager”) are the committees appointed by the Board to make fair value determinations. Each Fund may use the fair value of a portfolio investment to calculate its net asset value (“NAV”) in the event that the market quotation, price or market based valuation for the portfolio investment is not readily available or otherwise not determinable pursuant to the Board’s valuation procedures, if the Investment Manager for the Pricing Committee believes the quotation, price or market based valuation to be unreliable, or in certain other circumstances. When determining the fair value of an investment, the Pricing Committee and, if required under the Trust’s securities valuation procedures, the Valuation Committee, seeks to determine the price that the Fund might reasonably expect to receive from current sale of that portfolio investment in an arms-length transaction. Fair value determinations shall be based upon consideration of all available facts and information, including, but not limited to (i) attributes specific to the investment; (ii) fundamental and analytical data relating to the investment; and (iii) the value of other comparable securities or relevant financial instruments, including derivative securities, traded on other markets or among dealers.
The values assigned to fair value portfolio investments are based on available information and do not necessarily represent amounts that might ultimately be realized in the future, since such amounts depend on future developments inherent in long-term investments. Because of the inherent uncertainty of valuation, those estimated values may differ significantly from the values that would have been used had a ready market for the investments existed, and the differences could be material. The Board will be presented with a quarterly report showing as of the most recent quarter end, all outstanding securities fair valued by the Fund, including a comparison with the prior quarter end and the percentage of the Fund that the security represents at each quarter end.
With respect to foreign equity securities and certain foreign fixed income securities, the Board has adopted a policy that securities held in a Fund that can be fair valued by the applicable fair value pricing service are fair valued on each business day provided that each individual price exceeds a pre-established confidence level.
U.S. GAAP defines fair value as the price that a fund would receive to sell an asset or pay to transfer a liability in an orderly transaction between market participants at the measurement date. U.S. GAAP also establishes a framework for measuring fair value, and a three-level hierarchy for fair value measurements based upon the transparency of inputs to the valuation of an asset or liability. Inputs may be observable or unobservable and refer broadly to the assumptions that market participants would use in pricing the asset or
45
Notes to Financial Statements (continued)
liability. Observable inputs reflect the assumptions market participants would use in pricing the asset or liability based on market data obtained from sources independent of the Funds. Unobservable inputs reflect the Funds’ own assumptions about the assumptions that market participants would use in pricing the asset or liability developed based on the best information available in the circumstances. Each investment is assigned a level based upon the observability of the inputs which are significant to the overall valuation.
The three-tier hierarchy of inputs is summarized below:
Level 1 – inputs are quoted prices in active markets for identical investments (e.g., equity securities, open-end investment companies)
Level 2 – other observable inputs (including, but not limited to: quoted prices for similar assets or liabilities in markets that are active, quoted prices for identical or similar assets or liabilities in markets that are not active, inputs other than quoted prices that are observable for the assets or liabilities (such as interest rates, yield curves, volatilities, prepayment speeds, loss severities, credit risks and default rates) or other market corroborated inputs) (e.g., debt securities, government securities, foreign securities utilizing international fair value pricing, broker-quoted securities, fair valued securities with observable inputs)
Level 3 – inputs are significant unobservable inputs (including the Fund’s own assumptions used to determine the fair value of investments) (e.g., fair valued securities with unobservable inputs)
Changes in inputs or methodologies used for valuing investments may result in a transfer in or out of levels within the fair value hierarchy. The inputs or methodologies used for valuing investments may not necessarily be an indication of the risk associated with investing in those investments. Transfers between different levels of the fair value disclosure hierarchy are deemed to have occurred as of the beginning of the reporting period.
b. SECURITY TRANSACTIONS
Security transactions are accounted for as of trade date. Realized gains and losses on securities sold are determined on the basis of identified cost.
c. INVESTMENT INCOME AND EXPENSES
Dividend income is recorded on the ex-dividend date. Dividend and interest income on foreign securities is recorded gross of any withholding tax. Interest income, which includes amortization of premium and accretion of discount on debt securities, is accrued as earned. Upon notification from issuers, distributions received from a real estate investment trust (“REIT”) may be redesignated as a reduction of cost of investments and/or realized gain. Non-cash dividends included in dividend income, if any, are reported at the fair market value of the securities received. Distributions received in excess of income from return of capital are recorded as a reduction of the cost of the related investment and/or as a realized gain. If the Funds no longer own the applicable securities, any distributions received in excess of income are recorded as an adjustment to realized gain. Other income and expenses are recorded on an accrual basis. Expenses that cannot be directly attributed to a Fund are apportioned among the Funds in the Trust and in some cases other affiliated funds based upon their relative average net assets or number of shareholders. For Small Cap, All Cap Growth and Emerging Opportunities
Funds, investment income, realized and unrealized gains and losses, the common expenses of each Fund, and certain Fund level expense reductions, if any, are allocated on a pro rata basis to each class based on the relative net assets of each class to the total net assets of each Fund.
The following Funds had certain portfolio trades directed to various brokers, under a brokerage recapture program, which paid a portion of such Fund’s expenses. For the fiscal year ended October 31, 2015, the amount by which the Funds’ expenses were reduced and the impact on the expense ratios, if any, were as follows: All Cap Growth - $6,282 or 0.01%, Emerging Opportunities - $27,774 or 0.01% and Real Estate Securities - $15,895 or 0.01%.
The Funds have a “balance credit” arrangement with The Bank of New York Mellon (“BNYM”), the Funds’ custodian, whereby each Fund is credited with an interest factor equal to 0.75% below the effective 90-day T-Bill rate for account balances left uninvested overnight. If the T-Bill rate falls below 0.75%, no credits will be earned. These credits serve to reduce custodian expenses that would otherwise be charged to each Fund. For the fiscal year ended October 31, 2015, the Funds’ custodian expense was not reduced.
Overdraft fees are computed at 1% above the effective Federal Funds rate on the day of the overdraft. For the fiscal year ended October 31, 2015, the overdraft fees for Small Cap, Emerging Opportunities and Real Estate equaled $109, $21 and $76, respectively.
d. DIVIDENDS AND DISTRIBUTIONS
Fund distributions resulting from either net investment income or realized net capital gains, if any, will normally be declared and paid at least annually in December, as described in the Funds’ prospectus. Distributions to shareholders are recorded on the ex-dividend date. Distributions are determined in accordance with federal income tax regulations, which may differ from net investment income and net realized capital gains for financial statement purposes (U.S. GAAP). Differences may be permanent or temporary. Permanent differences are reclassified among capital accounts in the financial statements to reflect their tax character. Permanent book and tax basis differences are due to a net operating loss and partnership investments. Temporary differences arise when certain items of income, expense and gain or loss are recognized in different periods for financial statement and tax purposes; these differences will reverse at some time in the future. Temporary differences are due to wash sales and mark-to-market on passive foreign investment companies. Permanent differences are due to a net operating loss and partnership investments.
46
Notes to Financial Statements (continued)
The tax character of distributions paid during the fiscal years ended October 31, 2015 and October 31, 2014 were as follows:
| | | | | | | | | | | | | | | | | | | | | | | | | | | | | | | | |
| | | Small Cap | | | All Cap Growth | | | Emerging Opportunities | | | Real Estate Securities | |
| Distributions paid from: | | 2015 | | | 2014 | | | 2015 | | | 2014 | | | 2015 | | | 2014 | | | 2015 | | | 2014 | |
Ordinary income | | | — | | | | — | | | $ | 23,739 | | | | — | | | | — | | | | — | | | $ | 5,743,841 | | | $ | 2,628,242 | |
Short-term capital gains | | $ | 3,363,648 | | | $ | 3,323,514 | | | | 878,919 | | | $ | 1,451,179 | | | $ | 3,416,718 | | | $ | 13,504,881 | | | | 1,528,882 | | | | 2,795,836 | |
Long-term capital gains | | | 12,793,882 | | | | 5,019,661 | | | | 2,395,419 | | | | 2,425,016 | | | | 19,258,597 | | | | 14,950,144 | | | | 8,972,764 | | | | 9,759,915 | |
| | | | | | | | | | | | | | | | | | | | | | | | | | | | | | | | |
Total | | $ | 16,157,530 | | | $ | 8,343,175 | | | $ | 3,298,077 | | | $ | 3,876,195 | | | $ | 22,675,315 | | | $ | 28,455,025 | | | $ | 16,245,487 | | | $ | 15,183,993 | |
| | | | | | | | | | | | | | | | | | | | | | | | | | | | | | | | |
As of October 31, 2015, the components of distributable earnings (excluding unrealized appreciation/depreciation) on a tax basis consisted of:
| | | | | | | | | | | | | | | | |
| | | Small Cap | | | All Cap Growth | | | Emerging
Opportunities | | | Real Estate
Securities | |
Capital loss carryforward | | | — | | | | — | | | | — | | | | — | |
Undistributed ordinary income | | | — | | | | — | | | | — | | | | — | |
Undistributed short-term capital gains | | $ | 115,478 | | | | — | | | $ | 3,281,565 | | | $ | 4,288,192 | |
Undistributed long-term capital gains | | | 6,102,613 | | | $ | 3,020,136 | | | | 15,850,549 | | | | 26,547,632 | |
Late year loss deferral | | | — | | | | (28,471 | ) | | | — | | | | — | |
e. FEDERAL TAXES
Each Fund intends to comply with the requirements under Subchapter M of the Internal Revenue Code of 1986, as amended, to distribute substantially all of its taxable income and gains to its shareholders and to meet certain diversification and income requirements with respect to investment companies. Therefore, no provision for federal income or excise tax is included in the accompanying financial statements.
Additionally, based on each Fund’s understanding of the tax rules and rates related to income, gains and transactions for the foreign jurisdictions in which it invests, each Fund will provide for foreign taxes, and where appropriate, deferred foreign taxes.
Management has analyzed the Funds’ tax positions taken on federal income tax returns as of October 31, 2015 and for all open tax years (generally, the three prior taxable years), and has concluded that no provision for federal income tax is required in the Funds’ financial statements. Additionally, Management is not aware of any tax position for which it is reasonably possible that the total amounts of unrecognized tax benefits will change materially in the next twelve months.
Net capital losses incurred in taxable years beginning after the enactment of the Regulated Investment Company Modernization Act of 2010, may be carried forward for an unlimited time period, and retain their tax character as either short-term or long-term capital losses.
f. CAPITAL LOSS CARRYOVERS AND DEFERRALS
As of October 31, 2015, the Funds had no accumulated net realized capital loss carryovers from securities transactions for federal income tax purposes. Should the Funds incur net capital losses for the fiscal year ended October 31, 2016, such amounts may be used to offset future realized capital gains, for an unlimited time period.
g. CAPITAL STOCK
The Trust’s Declaration of Trust authorizes for each fund the issuance of an unlimited number of shares of beneficial interest, without par value. Each Fund records sales and repurchases of its capital stock on the trade date. The cost of securities contributed to the Funds in connection with the issuance of shares is based on the valuation of those securities in accordance with the Funds’ policy on investment valuation.
47
Notes to Financial Statements (continued)
For the fiscal years ended October 31, 2015 and 2014, the capital stock transactions by class for the Small Cap, All Cap Growth and Emerging Opportunities were:
| | | | | | | | | | | | | | | | | | | | | | | | | | | | | | | | |
| | | Small Cap | | | All Cap Growth | |
| | | 2015 | | | 2014 | | | 2015 | | | 2014 | |
| | | Shares | | | Amount | | | Shares | | | Amount | | | Shares | | | Amount | | | Shares | | | Amount | |
Investor Class: | | | | | | | | | | | | | | | | | | | | | | | | | | | | | | | | |
Proceeds from sale of shares | | | — | | | | — | | | | 26 | | | $ | 650 | | | | 10,584 | | | $ | 165,874 | | | | 20,952 | | | $ | 332,090 | |
Reinvestment of distributions | | | 10,967 | | | $ | 160,440 | | | | 1,687 | | | | 41,612 | | | | 1,398 | | | | 21,941 | | | | 33,626 | | | | 535,996 | |
Cost of shares repurchased | | | (12,277 | ) | | | (192,991 | ) | | | (1,134 | ) | | | (26,633 | ) | | | (315,089 | ) | | | (5,334,288 | ) | | | (33,772 | ) | | | (541,949 | ) |
| | | | | | | | | | | | | | | | | | | | | | | | | | | | | | | | |
Net increase (decrease) | | | (1,310 | ) | | $ | (32,551 | ) | | | 579 | | | $ | 15,629 | | | | (303,107 | ) | | $ | (5,146,473 | ) | | | 20,806 | | | $ | 326,137 | |
| | | | | | | | | | | | | | | | | | | | | | | | | | | | | | | | |
Service Class: | | | | | | | | | | | | | | | | | | | | | | | | | | | | | | | | |
Proceeds from sale of shares | | | 42,791 | | | $ | 651,443 | | | | 36,361 | | | $ | 941,064 | | | | 504,700 | | | $ | 8,427,743 | | | | 323,639 | | | $ | 5,257,143 | |
Reinvestment of distributions | | | 448,945 | | | | 6,644,386 | | | | 69,579 | | | | 1,731,122 | | | | 185,168 | | | | 2,949,727 | | | | 187,380 | | | | 3,026,191 | |
Cost of shares repurchased | | | (155,390 | ) | | | (2,420,094 | ) | | | (98,207 | ) | | | (2,449,400 | ) | | | (621,768 | ) | | | (10,348,924 | ) | | | (412,684 | ) | | | (6,674,101 | ) |
| | | | | | | | | | | | | | | | | | | | | | | | | | | | | | | | |
Net increase | | | 336,346 | | | $ | 4,875,735 | | | | 7,733 | | | $ | 222,786 | | | | 68,100 | | | $ | 1,028,546 | | | | 98,335 | | | $ | 1,609,233 | |
| | | | | | | | | | | | | | | | | | | | | | | | | | | | | | | | |
Institutional Class: | | | | | | | | | | | | | | | | | | | | | | | | | | | | | | | | |
Proceeds from sale of shares | | | 17,893 | | | $ | 300,334 | | | | 20,110 | | | $ | 517,471 | | | | 1,076,726 | | | $ | 18,037,900 | | | | 25,695 | | | $ | 414,520 | |
Reinvestment of distributions | | | 614,716 | | | | 9,202,305 | | | | 259,755 | | | | 6,525,038 | | | | 20,528 | | | | 326,409 | | | | 19,479 | | | | 314,008 | |
Costs of shares repurchased | | | (279,790 | ) | | | (4,816,712 | ) | | | (1,634,808 | ) | | | (41,905,042 | ) | | | (30,077 | ) | | | (497,460 | ) | | | (25,502 | ) | | | (405,231 | ) |
| | | | | | | | | | | | | | | | | | | | | | | | | | | | | | | | |
Net increase (decrease) | | | 352,819 | | | $ | 4,685,927 | | | | (1,354,943 | ) | | $ | (34,862,533 | ) | | | 1,067,177 | | | $ | 17,866,849 | | | | 19,672 | | | $ | 323,297 | |
| | | | | | | | | | | | | | | | | | | | | | | | | | | | | | | | |
| | | | | | | | | | | | | | | | |
| | | Emerging Opportunities | |
| | | 2015 | | | 2014 | |
| | | Shares | | | Amount | | | Shares | | | Amount | |
Service Class: | | | | | | | | | | | | | | | | |
Proceeds from sale of shares | | | 197,011 | | | $ | 8,772,968 | | | | 1,097,506 | | | $ | 52,817,257 | 1 |
Reinvestment of distributions | | | 423,995 | | | | 18,626,107 | | | | 480,130 | | | | 22,993,403 | |
Costs of shares repurchased | | | (635,639 | ) | | | (28,317,054 | ) | | | (1,360,770 | ) | | | (63,737,132 | ) |
| | | | | | | | | | | | | | | | |
Net increase (decrease) | | | (14,633 | ) | | $ | (917,979 | ) | | | 216,866 | | | $ | 12,073,528 | |
| | | | | | | | | | | | | | | | |
Institutional Class: | | | | | | | | | | | | | | | | |
Proceeds from sale of shares | | | 42,380 | | | $ | 1,888,191 | | | | 69,044 | | | $ | 3,338,393 | |
Reinvestment of distributions | | | 86,690 | | | | 3,827,375 | | | | 107,315 | | | | 5,151,130 | |
Costs of shares repurchased | | | (116,795 | ) | | | (5,241,652 | ) | | | (290,013 | ) | | | (14,171,040 | ) |
| | | | | | | | | | | | | | | | |
Net increase (decrease) | | | 12,275 | | | $ | 473,914 | | | | (113,654 | ) | | $ | (5,681,517 | ) |
| | | | | | | | | | | | | | | | |
| 1 | Includes a contribution of capital by the Investment Manager. (See Note 2 in the Notes to Financial Statements.) |
At October 31, 2015, certain unaffiliated shareholders of record, specifically omnibus accounts, individually or collectively held greater than 10% of the net assets of the Funds as follows: Small Cap - two collectively own 45%; All Cap Growth - one owns 25%; Emerging Opportunities - two collectively own 47%; Real Estate Securities - three collectively own 63%. Transactions by these shareholders may have a material impact on their respective Fund.
h. REPURCHASE AGREEMENTS AND JOINT REPURCHASE AGREEMENTS
The Funds may enter into repurchase agreements for temporary cash management purposes provided that the value of the underlying collateral, including accrued interest, will equal or exceed the value of the repurchase agreement during the term of the agreement. The underlying collateral for all
repurchase agreements is held in safekeeping by the Fund’s custodian or at the Federal Reserve Bank. If the seller defaults and the value of the collateral declines, or if bankruptcy proceedings commence with respect to the seller of the security, realization of the collateral by the Funds may be delayed or limited.
48
Notes to Financial Statements (continued)
Additionally, the Funds, other than Real Estate Securities, may enter into joint repurchase agreements for reinvestment of cash collateral on securities lending transactions under the securities lending program offered by BNYM (the “Program”), provided that the value of the underlying collateral, including accrued interest, will equal or exceed the value of the joint repurchase agreement during the term of the agreement. The Funds participate on a pro rata basis with other clients of BNYM in its share of the underlying collateral under such joint repurchase agreements and in its share of proceeds from any repurchase or other disposition of the underlying collateral. The underlying collateral for joint repurchase agreements is held in safekeeping by the Fund’s custodian or at the Federal Reserve Bank. If the seller defaults and the value of the collateral declines, or if bankruptcy proceedings commence with respect to the seller of the security, realization of the collateral by the Funds may be delayed or limited. Pursuant to the Program, the Funds are indemnified for such losses by BNYM.
At October 31, 2015, the market value of repurchase agreements or joint repurchase agreements outstanding for Small Cap, All Cap Growth and Emerging Opportunities were $2,507,951, $2,163,610 and $13,373,948, respectively.
2. AGREEMENTS AND TRANSACTIONS WITH AFFILIATES
For each of the Funds, the Trust has entered into an investment advisory agreement under which the Investment Manager, a subsidiary and the U.S. retail distribution arm of Affiliated Managers Group, Inc. (“AMG”), serves as investment manager to the Funds and is responsible for the Funds’ overall administration and operations. The Investment Manager selects one or more subadvisors for the Funds (subject to Board approval) and monitors each subadvisor’s investment performance, security holdings and investment strategies. Each Fund’s investment portfolio is managed by one or more portfolio managers who serve pursuant to a subadvisory agreement with the Investment Manager. Small Cap is managed by Frontier Capital Management Co., LLC (“Frontier”). All Cap Growth is managed by TimesSquare Capital Management, LLC (“TimesSquare”). AMG indirectly owns a majority interest in Frontier and TimesSquare.
Investment management fees are paid directly by the Funds to the Investment Manager based on average daily net assets. For the fiscal year ended October 31, 2015, the Funds’ investment management fees were paid at the following annual rate of each Fund’s respective average daily net assets:
| | | | |
Small Cap | | | 1.00 | % |
All Cap Growth | | | 0.75 | % |
Emerging Opportunities | | | 1.00 | % |
Real Estate Securities | | | 0.60 | % |
The Investment Manager has contractually agreed, through March 1, 2016, to waive management fees (but not below zero) and/or reimburse Fund expenses in order to limit total annual fund operating expenses after fee waiver and expense reimbursements (exclusive of taxes, interest (including interest incurred in connection with bank and custody overdrafts), shareholder servicing fees, distribution and service (12b-1) fees, brokerage commissions, and other transaction costs, acquired fund fees and expenses and extraordinary expenses) of Small Cap, All Cap Growth, and Emerging Opportunities to 1.05%, 0.79%,
and 1.18%, respectively, of each Fund’s average daily net assets subject to later reimbursement by the Funds in certain circumstances. The contractual expense limitation may only be terminated in the event the Investment Manager or a successor ceases to be the Investment Manager of each Fund or a successor fund, by mutual agreement of the Investment Manager and the Board, or in the event of each Fund’s liquidation unless the Fund is reorganized or is a party to a merger in which the surviving entity is successor to the accounting and performance information of the Fund.
Effective July 1, 2012, the Investment Manager has contractually agreed through March 1, 2015 to waive management fees and/or reimburse Fund expenses in order to limit the Real Estate Securities Fund’s total annual Fund operating expenses after fee waiver and expense reimbursements (exclusive of taxes, interest (including interest incurred in connection with bank and custody overdrafts), brokerage commissions and other transaction costs, acquired fund fees and expenses, and extraordinary expenses) to 1.24% of the Fund’s average daily net assets.
Each Fund is obligated to repay the Investment Manager such amounts waived, paid or reimbursed in future years provided that the repayment occurs within thirty-six (36) months after the waiver or reimbursement and that such repayment would not cause the Fund’s total annual operating expenses after fee waiver and expense reimbursements in any such future year to exceed that Fund’s respective contractual expense limitation amount. For the fiscal year ended October 31, 2015, each Fund’s components of reimbursement available are detailed in the following chart:
| | | | | | | | | | | | |
| | | Small Cap | | | All Cap Growth | | | Emerging
Opportunities | |
Reimbursement Available - 10/31/14 | | $ | 245,082 | | | $ | 501,326 | | | $ | 1,037,842 | |
Additional Reimbursements | | | 94,472 | | | | 211,933 | | | | 360,980 | |
Repayments | | | — | | | | — | | | | — | |
Expired Reimbursements | | | (89,364 | ) | | | (147,989 | ) | | | (358,192 | ) |
| | | | | | | | | | | | |
Reimbursement Available - 10/31/15 | | $ | 250,190 | | | $ | 565,270 | | | $ | 1,040,630 | |
| | | | | | | | | | | | |
The expiration of each Fund’s reimbursement are as follows:
| | | | | | | | | | | | |
| | | | | | All Cap | | | Emerging | |
| Expiration Period | | Small Cap | | | Growth | | | Opportunities | |
Less than 1 year | | $ | 62,432 | | | $ | 159,765 | | | $ | 319,323 | |
Within 2 years | | | 93,286 | | | | 193,572 | | | | 360,327 | |
Within 3 years | | | 94,472 | | | | 211,933 | | | | 360,980 | |
| | | | | | | | | | | | |
Total Amount Subject to Reimbursement | | $ | 250,190 | | | $ | 565,270 | | | $ | 1,040,630 | |
| | | | | | | | | | | | |
Small Cap is obligated by its investment management contract to pay an annual management fee to the Investment Manager. The Investment Manager, in turn, pays all or a portion of this fee to Frontier. Under its Investment Manager Agreement with the Fund, the Investment Manager provides a variety of administrative services to the Fund. The Investment Manager receives compensation from Frontier for its administrative services to the Fund pursuant to a separate agreement between the Investment Manager and Frontier. For each of the Funds other than Small Cap, the Trust has entered into an
49
Notes to Financial Statements (continued)
Administration and Shareholder Servicing Agreement under which the Investment Manager serves as the Fund’s administrator (the “Administrator”) and is responsible for all aspects of managing the Funds’ operations, including administration and shareholder services to each Fund, its shareholders, and certain institutions, such as bank trust departments, broker-dealers and registered investment advisers, that advise or act as an intermediary with the Funds’ shareholders. Each Fund pays a fee to the Administrator at the rate of 0.25% per annum of each Fund’s average daily net assets for these services.
Effective January 1, 2015, the Board provides supervision of the affairs of the Trust, other trusts within the AMG Funds family of mutual funds (collectively the “AMG Funds family”) and other affiliated funds. Previously, the Board provided supervision to only the Trust and other trusts within the AMG Funds family.
Beginning January 1, 2015,the aggregate annual retainer paid to each Independent Trustee of the Board is $200,000, plus $16,000, $4,000 or $2,000 for each regular, in-person special or telephonic special meeting attended, respectively. The Independent Chairman of the Trusts receives an additional payment of $55,000 per year. The Chairman of the Audit Committee receives an additional payment of $25,000 per year.
Prior to January 1, 2015, the aggregate annual retainer paid to each Independent Trustee of the Board was $130,000, plus $7,000 or $2,500 for each regular or special meeting attended, respectively. The Independent Chairman of the Trusts formerly received an additional payment of $35,000 per year. The Chairman of the Audit Committee formerly received an additional payment of $15,000 per year.
Effective January 1, 2015, the Trustees’ fees and expenses are generally allocated among all of the funds in the Trust, other trusts within the AMG Funds family and other affiliated funds based on the relative net assets of such funds. Before January 1, 2015, the Trustees’ fees and expenses were generally allocated among all of the funds in the Trust and other trusts within the AMG Funds family. The “Trustees fees and expenses” shown in the financial statements represents each Fund’s allocated portion of the total fees and expenses paid to the Independent Trustees of the Board.
The Funds are distributed by AMG Distributors, Inc. (the “Distributor”), a wholly owned subsidiary of the Investment Manager. The Distributor serves as the distributor and underwriter for each Fund and is a registered broker-dealer and member of the Financial Industry Regulatory Authority, Inc. (“FINRA”). Shares of each Fund will be continuously offered and will be sold directly to prospective purchasers and through brokers, dealers or other financial intermediaries who have executed selling agreements with the Distributor. Subject to the compensation arrangement discussed below, generally the Distributor bears all or a portion of the expenses of providing services pursuant to the distribution agreement, including the payment of the expenses relating to the distribution of prospectuses for sales purposes and any advertising or sales literature. Certain Trustees and Officers of the Funds are Officers and/or Directors of the Investment Manager, AMG and/or the Distributor.
Small Cap and All Cap Growth have adopted a distribution and service plan (the “Plan”) with respect to the Investor Class shares in accordance with the requirements of Rule 12b-1 under the 1940 Act and the requirements of the
applicable rules of FINRA regarding asset based sales charges. Pursuant to the Plan, each Fund may make payments to the Distributor for its expenditures in financing any activity primarily intended to result in the sale of each such class of the Fund’s shares and for maintenance and personal service provided to existing shareholders of that class. The Plan authorizes payments to the Distributor up to 0.25% annually of each Fund’s average daily net assets attributable to the Investor Class shares.
For each of the Investor and Service Classes, the Board has approved reimbursement payments to the Investment Manager for shareholder servicing expenses (“shareholder servicing fees”) incurred. Shareholder servicing fees include payments to third parties such as a bank, broker-dealer, trust company or other financial intermediaries who provide shareholder recordkeeping, account servicing and other services. The Investor and Service Class shares may reimburse the Investment Manager for the actual amount incurred up to a maximum annual rate of each Class’s average daily net asset value as shown in the table below.
The impact on the annualized expense ratios for the fiscal year ended October 31, 2015 were as follows:
| | | | | | | | |
| | | Maximum | | | Actual | |
| | | Amount | | | Amount | |
| Fund | | Allowed | | | Incurred | |
Small Cap | | | | | | | | |
Investor Class | | | 0.25 | % | | | 0.25 | % |
Service Class | | | 0.25 | % | | | 0.23 | % |
All Cap Growth | | | | | | | | |
Investor Class | | | 0.25 | % | | | 0.25 | % |
Service Class | | | 0.25 | % | | | 0.10 | % |
Emerging Opportunities | | | | | | | | |
Service Class | | | 0.25 | % | | | 0.25 | % |
Real Estate | | | | | | | | |
Fund | | | 0.25 | % | | | 0.25 | % |
During the fiscal year ended October 2014, the Service Class of Emerging Opportunities Fund recorded a captial contribution by the Investment Manager of $61,744. The contribution represented a payment in connection with the reallocation of certain shareholder servicing expenses for which the Class had reimbursed the Investment Manager in prior periods, plus interest.
The Securities and Exchange Commission granted an exemptive order that permits the Funds to lend and borrow money for certain temporary purposes directly to and from other eligible Funds in the AMG Funds family. Participation in this interfund lending program is voluntary for both borrowing and lending Funds, and an interfund loan is only made if it benefits each participating Fund. The Investment Manager administers the program according to procedures approved by the Board, and the Board monitors the operation of the program. An interfund loan must comply with certain conditions set out in the exemptive order, which are designed to assure fairness and protect all participating Funds. For the fiscal year ended October 31, 2015, the following Funds either borrowed from or lent to other Funds in the AMG Funds family: All Cap
50
Notes to Financial Statements (continued)
Growth borrowed varying amounts not exceeding $4,101,223, for four days paying interest of $150 and Real Estate borrowed $1,473,139, for one day paying interest of $25. The interest amount is included in the Statement of Operations as miscellaneous expense. All Cap Growth lent $1,205,258 for four days earning interest of $92 and Emerging Opportunities lent $402,540 for one day earning interest of $7. The interest amount is included in the Statement of Operations as interest income. At October 31, 2015, the Funds had no loans outstanding.
For the fiscal year ended October 31, 2015, Emerging Opportunities executed security transactions with other funds affiliated with Lord, Abbett & Co., LLC, one of the Fund’s subadvisors. Each of the transactions were executed at the closing price of the security transacted and with no commissions under Rule 17a-7 procedures approved by the Board. The amounts purchased and sold during the fiscal year ended October 31, 2015, are reflected in the following chart:
| | | | | | | | | | | | |
| | | Number of | | | Total | | | | |
| | | Transactions | | | Quantity | | | Cost/Proceeds | |
Purchases | | | 2 | | | | 62,484 | | | $ | 725,851 | |
Sales | | | 5 | | | | 41,016 | | | | (1,740,877 | ) |
3. PURCHASES AND SALES OF SECURITIES
Purchases and sales of securities (excluding short-term securities and U.S. Government Obligations) for the fiscal year ended October 31, 2015, were as follows:
| | | | | | | | |
| | | Long-Term Securities | |
| Fund | | Purchases | | | Sales | |
Small Cap | | $ | 33,667,972 | | | $ | 41,413,003 | |
All Cap Growth | | | 71,430,313 | | | | 62,545,038 | |
Emerging Opportunities | | | 171,429,405 | | | | 196,398,292 | |
Real Estate Securities | | | 212,908,148 | | | | 205,148,307 | |
The Funds had no purchases or sales of U.S. Government obligations during the fiscal year ended October 31, 2015.
4. PORTFOLIO SECURITIES LOANED
The Funds, other than Real Estate Securities, participate in the Program, providing for the lending of securities to qualified brokers. Securities lending income includes earnings of such temporary cash investments, plus or minus any rebate to a borrower. These earnings (after any rebate) are then divided between BNYM, as a fee for its services under the Program, and the Funds, according to agreed-upon rates. Collateral on all securities loaned is accepted in cash and is maintained at a minimum level of 102% (105% in the case of certain foreign securities) of the market value, plus interest, if applicable, of investments on loan. It is the Funds’ policy to obtain additional collateral from or return excess collateral to the borrower by the end of the next business day, following the valuation date of the securities loaned. Therefore, the value of the collateral held may be temporarily less than the value of the securities on loan. Lending securities entails a risk of loss to the Funds if and to the extent that the market value of the securities loaned were to increase and the borrower did not increase the collateral accordingly, and the borrower fails to return the
securities. Under the terms of the Program, the Funds are indemnified for such losses by BNYM. Cash collateral is held in a separate omnibus account managed by BNYM, who is authorized to exclusively enter into joint overnight government repurchase agreements. BNYM bears the risk of any deficiency in the amount of the cash collateral available for return to the borrower due to any loss on the collateral invested.
At October 31, 2015, the value of securities loaned and cash collateral received were as follows:
| | | | | | | | |
| | | Securities | | | Cash Collateral | |
| Fund | | Loaned | | | Received | |
Small Cap | | $ | 2,439,231 | | | $ | 2,507,951 | |
All Cap Growth | | | 2,106,623 | | | | 2,163,610 | |
Emerging Opportunities | | | 12,803,485 | | | | 13,373,948 | |
5. COMMITMENTS AND CONTINGENCIES
Under the Trust’s organizational documents, its trustees and officers are indemnified against certain liabilities arising out of the performance of their duties to the Trust. In addition, in the normal course of business, the Funds may enter into contracts and agreements that contain a variety of representations and warranties, which provide general indemnifications. The maximum exposure to the Funds under these arrangements is unknown, as this would involve future claims that may be made against the Funds that have not yet occurred.
However, based on experience, the Funds had no prior claims or losses and expect the risks of loss to be remote.
6. MASTER NETTING AGREEMENTS
The Funds may enter into master netting agreements with their counterparties for the securities lending program and repurchase agreements, which provide the right, in the event of default (including bankruptcy or insolvency) for the non-defaulting party to liquidate the collateral and calculate net exposure to the defaulting party or request additional collateral. For financial reporting purposes, the Funds do not offset financial assets and financial liabilities that are subject to master netting agreements in the Statement of Assets and Liabilities. For securities lending transactions, see Note 4.
51
Notes to Financial Statements (continued)
The following table is a summary of the Funds’ open repurchase agreements that are subject to a master netting agreement as of October 31, 2015:
| | | | | | | | | | | | | | | | |
| | | | | | Gross Amount Not Offset in the | | | | |
| | | | | | Statement of Assets and Liabilities | | | | |
| | | Net Amounts of Assets | | | Financial | | | | | | | |
| | | Presented in the Statement | | | Instruments | | | Cash Collateral | | | | |
| Fund | | of Assets and Liabilities | | | Collateral | | | Received | | | Net Amount | |
Small Cap | | | | | | | | | | | | | | | | |
Daiwa Capital Markets America | | $ | 1,000,000 | | | $ | 1,000,000 | | | | — | | | | — | |
ING Financial Markets, LLC | | | 507,951 | | | | 507,951 | | | | — | | | | — | |
Nomura Securities International, Inc. | | | 1,000,000 | | | | 1,000,000 | | | | — | | | | — | |
| | | | | | | | | | | | | | | | |
Total | | $ | 2,507,951 | | | $ | 2,507,951 | | | | — | | | | — | |
| | | | | | | | | | | | | | | | |
All Cap Growth | | | | | | | | | | | | | | | | |
Daiwa Capital Markets America | | $ | 1,000,000 | | | $ | 1,000,000 | | | | — | | | | — | |
Nomura Securities International, Inc. | | | 1,000,000 | | | | 1,000,000 | | | | — | | | | — | |
Royal Bank of Scotland PLC | | | 163,610 | | | | 163,610 | | | | — | | | | — | |
| | | | | | | | | | | | | | | | |
Total | | $ | 2,163,610 | | | $ | 2,163,610 | | | | — | | | | — | |
| | | | | | | | | | | | | | | | |
Emerging Opportunities | | | | | | | | | | | | | | | | |
Daiwa Capital Markets America | | $ | 3,176,319 | | | $ | 3,176,319 | | | | — | | | | — | |
HSBC Securities USA Inc. | | | 3,176,319 | | | | 3,176,319 | | | | — | | | | — | |
ING Financial Markets, LLC | | | 3,176,319 | | | | 3,176,319 | | | | — | | | | — | |
Nomura Securities International, Inc. | | | 3,176,319 | | | | 3,176,319 | | | | — | | | | — | |
Royal Bank of Scotland PLC | | | 668,672 | | | | 668,672 | | | | — | | | | — | |
| | | | | | | | | | | | | | | | |
Total | | $ | 13,373,948 | | | $ | 13,373,948 | | | | — | | | | — | |
| | | | | | | | | | | | | | | | |
7. SUBSEQUENT EVENTS
Each Fund has determined that no material events or transactions occurred through the issuance date of the Funds’ financial statements which require additional disclosure in or adjustment of the Funds’ financial statements.
TAX INFORMATION (unaudited)
The AMG Frontier Small Cap Growth Fund, AMG TimesSquare All Cap Growth Fund, AMG Managers Emerging Opportunities Fund and AMG Managers Real Estate Securities Fund each hereby designates the maximum amount allowable of its net taxable income as qualified dividends as provided in the Jobs and Growth Tax Relief Reconciliation Act of 2003. The 2014/2015 Form 1099-DIV you receive for each Fund will show the tax status of all distributions paid to you during the year.
Pursuant to section 852 of the Internal Revenue Code, AMG Frontier Small Cap Growth Fund, AMG TimesSquare All Cap Growth Fund, AMG Managers Emerging Opportunities Fund and AMG Managers Real Estate Securities Fund each hereby designates $12,793,882, $2,395,439, $19,258,597 and $8,972,764, respectively, as a capital gain distribution with respect to the taxable fiscal year ended October 31, 2015, or if subsequently determined to be different, the net capital gains of such year.
52
Report of Independent Registered Public Accounting Firm
TO THE BOARD OF TRUSTEES OF AMG FUNDS I AND THE SHAREHOLDERS OF AMG FRONTIER SMALL CAP GROWTH FUND, AMG TIMESSQUARE ALL CAP GROWTH FUND, AMG MANAGERS EMERGING OPPORTUNITIES FUND AND AMG MANAGERS REAL ESTATE SECURITIES FUND:
In our opinion, the accompanying statements of assets and liabilities, including the schedules of portfolio investments, and the related statements of operations and of changes in net assets and the financial highlights present fairly, in all material respects, the financial positions of AMG Frontier Small Cap Growth Fund, AMG TimesSquare All Cap Growth Fund, AMG Managers Emerging Opportunities Fund and AMG Managers Real Estate Securities Fund (the “Funds”) at October 31, 2015, and the results of each of their operations, the changes in each of their net assets and the financial highlights for each of the periods indicated, in conformity with accounting principles generally accepted in the United States of America. These financial statements and financial highlights (hereafter referred to as “financial statements”) are the responsibility of the Funds’ management. Our responsibility is to express an opinion on these financial statements based on our audits. We conducted our audits of these financial statements in accordance with the standards of the Public Company Accounting Oversight Board (United States). Those standards require that we plan and perform the audit to obtain reasonable assurance about whether the financial statements are free of material misstatement. An audit includes examining, on a test basis, evidence supporting the amounts and disclosures in the financial statements, assessing the accounting principles used and significant estimates made by management, and evaluating the overall financial statement presentation. We believe that our audits, which included confirmation of securities at October 31, 2015 by correspondence with the custodian and brokers, and the application of alternative auditing procedures where securities purchased had not been received, provide a reasonable basis for our opinion.
PricewaterhouseCoopers LLP
Boston, Massachusetts
December 23, 2015
53
AMG Funds
Trustees and Officers
The Trustees and Officers of the Trust, their business addresses, principal occupations for the past five years and dates of birth are listed below. The Trustees provide broad supervision over the affairs of the Trust and the Funds. The Trustees are experienced executives who meet periodically throughout the year to oversee the Funds’ activities, review contractual arrangements with
companies that provide services to the Funds, and review the Funds’ performance. Unless otherwise noted, the address of each Trustee or Officer is the address of the Trust: 600 Steamboat Road, Suite 300, Greenwich, Connecticut 06830.
There is no stated term of office for Trustees. Trustees serve until their resignation, retirement or removal in accordance with the Trust’s
organizational documents and policies adopted by the Board from time to time. The Chairman of the Trustees, President, Treasurer and Secretary of the Trust are elected by the Trustees annually. Other officers hold office at the pleasure of the Trustees.
Independent Trustees
The following Trustees are not “interested persons” of the Trust within the meaning of the 1940 Act:
| | |
Number of Funds Overseen in Fund Complex | | Name, Date of Birth, Principal Occupation(s) During Past 5 Years and Other Directorships Held by Trustee |
• Trustee since 2012 | | Bruce B. Bingham, 12/1/48 |
• Oversees 45 Funds in Fund Complex | | Partner, Hamilton Partners (real estate development firm) (1987-Present); Trustee of Aston Funds (27 portfolios) (2014-Present) Director of The Yacktman Funds (2000-2012). |
| |
• Independent Chairman | | William E. Chapman II, 9/23/41 |
• Trustee since 2000 | | President and Owner, Longboat Retirement Planning Solutions (1998-Present); Hewitt Associates, LLC (part time) (provider of Retirement and Investment Education |
• Oversees 45 Funds in Fund Complex | | Seminars) (2002-2009); Trustee Emeritus of Bowdoin College (2013-Present); Trustee of Bowdoin College (2002-2013); Director of Harding, Loevner Funds, Inc. (6 portfolios); Trustee of Third Avenue Trust (5 portfolios); Trustee of Third Avenue Variable Trust (1 portfolio); Trustee of Aston Funds (27 portfolios) (2010-Present). |
| |
• Trustee since 2000 | | Edward J. Kaier, 9/23/45 |
• Oversees 45 Funds in Fund Complex | | Attorney at Law and Partner, Teeters Harvey Marrone & Kaier LLP (2007-Present); Attorney at Law and Partner, Hepburn Willcox Hamilton & Putnam, LLP (1977-2007); Trustee of Third Avenue Trust (5 portfolios); Trustee of Third Avenue Variable Trust (1 portfolio); Trustee of Aston Funds (27 portfolios) (2010-Present). |
| |
• Trustee since 2013 | | Kurt A. Keilhacker, 10/5/63 |
• Oversees 47 Funds in Fund Complex | | Managing Member, TechFund Capital (1997-Present); Managing Member, TechFund Europe (2000-Present); Trustee, Gordon College (2001-Present); Board Member, 6wind SA, (2002-Present); Managing Member, Elementum Ventures (2013-Present); Trustee of Aston Funds (27 portfolios) (2014-Present). |
| |
• Trustee since 2000 | | Steven J. Paggioli, 4/3/50 |
• Oversees 45 Funds in Fund Complex | | Independent Consultant (2002-Present); Formerly Executive Vice President and Director, The Wadsworth Group (1986-2001); Executive Vice President, Secretary and Director, Investment Company Administration, LLC (1990-2001); Vice President, Secretary and Director, First Fund Distributors, Inc. (1991-2001); Trustee, Professionally Managed Portfolios (43 portfolios); Advisory Board Member, Sustainable Growth Advisors, LP; Independent Director, Chase Investment Counsel (2008 – Present); Trustee of Aston Funds (27 portfolios) (2010-Present). |
| |
• Trustee since 2013 | | Richard F. Powers III, 2/2/46 |
• Oversees 45 Funds in Fund Complex | | Adjunct Professor, Boston College (2011-Present); Trustee of Aston Funds (27 portfolios) (2014-Present); President and CEO of Van Kampen Investments Inc. (1998-2003). |
| |
• Trustee since 2000 | | Eric Rakowski, 6/5/58 |
• Oversees 47 Funds in Fund Complex | | Professor, University of California at Berkeley School of Law (1990-Present); Director of Harding, Loevner Funds, Inc. (6 portfolios); Trustee of Third Avenue Trust (5 portfolios); Trustee of Third Avenue Variable Trust (1 portfolio); Trustee of Aston Funds (27 portfolios) (2010-Present). |
| |
• Trustee since 2013 | | Victoria L. Sassine, 8/11/65 |
• Oversees 47 Funds in Fund Complex | | Lecturer, Babson College (2007 – Present); Trustee of Aston Funds (27 portfolios) (2014-Present). |
| |
• Trustee since 2000 | | Thomas R. Schneeweis, 5/10/47 |
• Oversees 45 Funds in Fund Complex | | Professor Emeritus, University of Massachusetts (2013 - Present); Partner, S Capital Management, LLC (2007-Present); President, TRS Associates (1982-Present); Director, CISDM at the University of Massachusetts, (1996-2013); President, Alternative Investment Analytics, LLC, (formerly Schneeweis Partners, LLC) (2001-2013); Professor of Finance, University of Massachusetts (1977-2013); Partner, White Bear Partners, LLC (2007-2010); Partner, Northampton Capital Management, LLC (2004-2010); Trustee of Aston Funds (27 portfolios) (2010-Present). |
54
AMG Funds
Trustees and Officers (continued)
Interested Trustees
Each Trustee in the following table is an “interested person” of the Trust within the meaning of the 1940 Act. Ms. Carsman is an interested person of the Trust within the meaning of the 1940 Act by virtue of her position with, and interest in securities of, AMG.
| | |
Number of Funds Overseen in Fund Complex | | Name, Date of Birth, Principal Occupation(s) During Past 5 Years and Other Directorships Held by Trustee |
• Trustee since 2011 | | Christine C. Carsman, 4/2/52 |
• Oversees 47 Funds in Fund Complex | | Senior Vice President and Deputy General Counsel, Affiliated Managers Group, Inc. (2011-Present); Trustee of Aston Funds (27 portfolios) (2014-Present); Senior Vice President and Chief Regulatory Counsel, Affiliated Managers Group, Inc. (2007-2011); Vice President and Chief Regulatory Counsel, Affiliated Managers Group, Inc. (2004-2007); Secretary and Chief Legal Officer, AMG Funds, AMG Funds I, AMG Funds II and AMG Funds III (2004-2011); Senior Counsel, Vice President and Director of Operational Risk Management and Compliance, Wellington Management Company, LLP (1995-2004). |
Officers
| | |
Position(s) Held with Fund
and Length of Time Served | | Name, Date of Birth, Principal Occupation(s) During Past 5 Years |
• President since 2014 | | Jeffrey T. Cerutti, 2/7/68 |
• Principal Executive Officer since 2014 | | Chief Executive Officer, AMG Funds LLC (2014-Present); Director, President and Principal, AMG Distributors, Inc. (2014-Present); Chief Executive Officer and President, Aston Funds (2015-Present); President, VP Distributors, (2011-2014); Executive Vice President, Head of Distribution, Virtus Investment Partners, Inc. (2010-2014); Managing Director, Head of Sales, UBS Global Asset Management (2001-2010). |
| |
• Chief Operating Officer | | Keitha L. Kinne, 5/16/58 |
since 2007 | | Chief Operating Officer, AMG Funds LLC (2007-Present); Chief Investment Officer, AMG Funds LLC (2008-Present); Chief Operating Officer, AMG Distributors, Inc. (2007-Present); Managing Partner, AMG Funds LLC (2007-2014); President, AMG Funds (2012-2014); President, AMG Distributors, Inc. (2012-2014); Managing Director, Legg Mason & Co., LLC (2006-2007); Managing Director, Citigroup Asset Management (2004-2006). |
| |
• Secretary since 2015 | | Mark J. Duggan, 2/20/65 |
• Chief Legal Officer since 2015 | | Senior Vice President and Senior Counsel, AMG Funds LLC (2015-Present); Secretary, and Chief Legal Officer, AMG Funds, AMG Funds I, AMG Funds II and AMG Funds III (2015-Present); Attorney, K&L Gates, LLP (2009-2015). |
| |
• Chief Financial | | Donald S. Rumery, 5/29/58 |
Officer since 2007 | | Senior Vice President, Director of Mutual Funds Services, AMG Funds LLC (2005-Present); Treasurer, AMG Funds III (1995-Present); Treasurer, AMG Funds |
• Treasurer since 1999 | | (1999-Present); Treasurer, AMG Funds II (2000-Present); Chief Financial Officer, AMG Funds, AMG Funds III and AMG Funds III (2007-Present); Treasurer and Chief |
• Principal Financial Officer since 2008 | | Financial Officer, AMG Distributors, Inc. (2000-2012); Vice President, AMG Funds LLC, (1994-2004). |
| |
• Assistant Treasurer | | John C. Ball, 1/9/76 |
since 2014 | | Vice President, Assistant Treasurer, AMG Funds LLC (2014-Present); Vice President, State Street Corp. (2010-2014); Vice President, State Street International (Ireland) Limited (2007-2010). |
| |
• Chief Compliance Officer | | John J. Ferencz, 3/9/62 |
since 2010 | | Vice President, Chief Compliance Officer - AMG Family of Funds, AMG Funds LLC (2010-Present); Code of Ethics Reporting Officer and Sarbanes Oxley Code of Ethics Compliance Officer, AMG Funds, AMG Funds I, AMG Funds II and AMG Funds III (2010-Present); Senior Compliance Analyst, Mutual Funds and Regulatory, GE Asset Management Incorporated (2005-2010). |
| |
• Anti-Money Laundering | | Patrick J. Spellman, 3/15/74 |
Compliance Officer since 2014 | | Senior Vice President, Chief Compliance Officer, AMG Funds LLC (2011-Present); Chief Compliance Officer, AMG Distributors, Inc., (2010-Present); Compliance Manager, Legal and Compliance, Affiliated Managers Group, Inc. (2005-2011). |
55
Annual Renewal of Investment Management and Subadvisory Agreements (unaudited)
At an in-person meeting held on June 24-25, 2015, the Board of Trustees (the “Board” or the “Trustees”), and separately a majority of the Trustees who are not “interested persons” of the Trust (the “Independent Trustees”), approved each Investment Management Agreement (collectively the “Investment Management Agreements”) and separately an amendment to each Investment Management Agreement, in each case AMG Funds LLC (the “Investment Manager”) for each of AMG Managers Emerging Opportunities Fund, AMG Frontier Small Cap Growth Fund, AMG TimesSquare All Cap Growth Fund and AMG Managers Real Estate Securities Fund (each a “Fund”) and the Subadvisory Agreement for each of the Subadvisors to the Funds. The Independent Trustees were separately represented by independent legal counsel in connection with their consideration of the approval of these agreements. In considering the Investment Management and Subadvisory Agreements, the Trustees reviewed a variety of materials relating to each Fund, the Investment Manager and each Subadvisor, including comparative performance, fee and expense information for an appropriate peer group of similar mutual funds (each a “Peer Group”), performance information for relevant benchmark indices (each a “Fund Benchmark”) and, with respect to each Subadvisor, comparative performance information for an appropriate peer group of managed accounts, and, as to all other matters, other information provided to them on a periodic basis throughout the year, as well as information provided in connection with the meetings of June 24-25, 2015, regarding the nature, extent and quality of services provided by the Investment Manager and the Subadvisors under their respective agreements. Prior to voting, the Independent Trustees: (a) reviewed the foregoing information with their independent legal counsel and with management; (b) received materials from their independent legal counsel discussing the legal standards applicable to their consideration of the Investment Management and Subadvisory Agreements; and (c) met with their independent legal counsel in private sessions at which no representatives of management were present.
NATURE, EXTENT AND QUALITY OF SERVICES
In considering the nature, extent and quality of the services provided by the Investment Manager, the Trustees reviewed information relating to the Investment Manager’s operations and personnel. Among other things, the Investment Manager provided financial information, biographical information on its supervisory and professional staff and descriptions of its organizational and management structure. The Trustees also took into account information provided periodically throughout the previous year by the Investment Manager in Board meetings relating to the performance of its duties with respect to the Funds and the Trustees’ knowledge of the Investment Manager’s management and the quality of the performance of the Investment Manager’s duties. In the course of their deliberations regarding the Investment Management Agreements, the Trustees evaluated, among other things: (a) the extent and quality of the Investment Manager’s oversight of the operation and management of the Funds; (b) the quality of the search, selection and monitoring services performed by the Investment Manager in overseeing the portfolio management responsibilities of the Subadvisors; (c) the Investment Manager’s ability to supervise the Funds’ other service providers; and (d) the Investment Manager’s compliance program. The Trustees also took into account that, in performing its functions under the Investment Management Agreements and supervising each Subadvisor, the Investment Manager: performs periodic detailed analysis and reviews of the performance by each Subadvisor of its obligations to a Fund, including without limitation, analysis and review of portfolio and other compliance matters and review of each Subadvisor’s investment performance in respect of a Fund; prepares and presents periodic reports to the Board regarding the investment performance of each Subadvisor and other information regarding each Subadvisor, at such times and in such forms as the Board may reasonably request; reviews and considers any changes in the personnel of each Subadvisor responsible for performing the Subadvisor’s obligations and
makes appropriate reports to the Board; reviews and considers any changes in the ownership or senior management of each Subadvisor and makes appropriate reports to the Board; performs periodic in-person or telephonic diligence meetings, including with respect to compliance matters, with representatives of each Subadvisor; assists the Board and management of the Trust in developing and reviewing information with respect to the initial approval of each Subadvisory Agreement and annual consideration of each Subadvisory Agreement thereafter; prepares recommendations with respect to the continued retention of any Subadvisor or the replacement of any Subadvisor, including at the request of the Board; identifies potential successors to or replacements of any Subadvisor or potential additional subadvisors, performs appropriate due diligence, and develops and presents to the Board a recommendation as to any such successor, replacement, or additional subadvisor, including at the request of the Board; designates and compensates from its own resources such personnel as the Investment Manager may consider necessary or appropriate to the performance of its services; and performs such other review and reporting functions as the Board shall reasonably request consistent with the Investment Management Agreements and applicable law. With respect to AMG Frontier Small Cap Growth Fund and AMG TimesSquare All Cap Growth Fund, the Trustees noted the affiliation of each Subadvisor with the Investment Manager, noting any potential conflicts of interest. The Trustees also took into account the financial condition of the Investment Manager with respect to its ability to provide the services required under the Investment Management Agreements and the Investment Manager’s undertaking to maintain contractual expense limitations for the Funds. The Trustees also considered the Investment Manager’s risk management processes.
The Trustees also reviewed information relating to each Subadvisor’s operations and personnel and the investment philosophy, strategies and techniques (for each Subadvisor, its “Investment Strategy”) used in managing a Fund or the portion of a Fund for which the Subadvisor has portfolio
56
Annual Renewal of Investment Management and Subadvisory Agreements (unaudited) (continued)
management responsibility. Among other things, the Trustees reviewed biographical information on portfolio management and other professional staff, information regarding each Subadvisor’s organizational and management structure and each Subadvisor’s brokerage policies and practices. The Trustees considered specific information provided regarding the experience of the individual(s) at each Subadvisor with portfolio management responsibility for a Fund or the portion of a Fund managed by the Subadvisor, including the information set forth in the Fund’s prospectus and statement of additional information. With respect to AMG Managers Emerging Opportunities Fund, which is managed by multiple Subadvisors, the Trustees also noted information provided by the Investment Manager regarding the manner in which each Subadvisor’s Investment Strategy complements those utilized by the Fund’s other Subadvisors. In the course of their deliberations, the Trustees evaluated, among other things: (a) the services rendered by each Subadvisor in the past; (b) the qualifications and experience of the Subadvisor’s personnel; and (c) the Subadvisor’s compliance program. The Trustees also took into account the financial condition of each Subadvisor with respect to its ability to provide the services required under its Subadvisory Agreement. The Trustees also considered each Subadvisor’s risk management processes.
PERFORMANCE
As noted above, the Board considered each Fund’s net performance during relevant time periods as compared to each Fund’s Peer Group and Fund Benchmark and considered each Subadvisor’s performance as compared to an appropriate peer group of managed accounts and also considered the gross performance of the Fund or the portion of the Fund managed by each Subadvisor as compared to the Subadvisor’s relevant performance composite that utilizes the same investment strategy and approach and noted that the Board reviews on a quarterly basis detailed information about each Fund’s performance results, portfolio composition and Investment Strategies, including, with respect to AMG
Managers Emerging Opportunities Fund, the portion of the Fund managed by each Subadvisor. The Board noted the Investment Manager’s expertise and resources in monitoring the performance, investment style and risk-adjusted performance of each Subadvisor. The Board also noted each Subadvisor’s performance record with respect to AMG Managers Emerging Opportunities Fund. The Board was mindful of the Investment Manager’s attention to monitoring each Subadvisor’s performance with respect to the Funds and its discussions with management regarding the factors that contributed to the performance of the Funds.
ADVISORY AND SUBADVISORY FEES AND PROFITABILITY
In considering the reasonableness of the advisory fee charged by the Investment Manager for managing each Fund, the Trustees noted that the Investment Manager, and not the Fund, is responsible for paying the fees charged by the Fund’s Subadvisor(s) and, therefore, that the fees paid to the Investment Manager cover the cost of providing portfolio management services as well as the cost of providing search, selection and monitoring services in operating a “manager-of-managers” complex of mutual funds. With respect to AMG Managers Emerging Opportunities Fund, AMG TimesSquare All Cap Growth Fund and AMG Managers Real Estate Securities Fund, the Trustees also considered the amount of the advisory fee retained by the Investment Manager after payment of the subadvisory fee with respect to each Fund. With respect to AMG Frontier Small Cap Growth Fund, the Trustees noted that the Investment Manager pays the Subadvisor a subadvisory fee that is equal to the advisory fee that it receives from the Fund. The Trustees also noted any payments that were made from Frontier Capital Management Company, LLC (“Frontier”) and TimesSquare Capital Management, LLC (“TimesSquare”) to the Investment Manager. The Trustees concluded that, in light of the additional high quality supervisory services provided by the Investment Manager and the fact that the subadvisory fees are paid out of the advisory fee, the advisory fee payable by each Fund to the
Investment Manager can reasonably be expected to exceed the median advisory fee for the Peer Group, which consists of many funds that do not operate with a manager-of-managers structure. In this regard, the Trustees also noted that the Investment Manager has undertaken to maintain contractual expense limitations for the Funds.
In addition, in considering the reasonableness of the advisory fee payable to the Investment Manager, the Trustees also reviewed information provided by the Investment Manager setting forth all revenues and other benefits, both direct and indirect (including any so-called “fallout benefits” such as reputational value derived from the Investment Manager serving as Investment Manager to a Fund), received by the Investment Manager and its affiliates attributable to managing each Fund and all the mutual funds in the AMG Funds Family of Funds, the cost of providing such services and the resulting profitability to the Investment Manager and its affiliates from these relationships. The Trustees also noted the current asset levels of each Fund and the willingness of the Investment Manager to waive fees and pay expenses for all of the Funds from time to time as a means of limiting total expenses. The Trustees also considered management’s discussion of the current asset levels of the Funds, and considered the impact on profitability of the current asset levels and any future growth of assets of the Funds. The Board took into account management’s discussion of the current advisory fee structure, and, as noted above, the services the Investment Manager provides in performing its functions under the Investment Management Agreements and supervising each Subadvisor. In this regard, the Trustees noted that, unlike a mutual fund that is managed by a single investment adviser, the Funds operate in a manager-of-managers structure. Based on the foregoing, the Trustees concluded that the profitability to the Investment Manager is reasonable and that the Investment Manager is not realizing material benefits from economies of scale that would warrant adjustments to the advisory fees for any Fund at this time. With respect to economies of scale, the Trustees also noted that
57
Annual Renewal of Investment Management and Subadvisory Agreements (unaudited) (continued)
as a Fund’s assets increase over time, the Fund may realize other economies of scale to the extent that the increase in assets is proportionally greater than the increase in certain other expenses.
SUBADVISORY FEES AND PROFITABILITY
In considering the reasonableness of the fee payable by the Investment Manager to each Subadvisor (other than Frontier and TimesSquare, which are affiliates of the Investment Manager), the Trustees relied on the ability of the Investment Manager to negotiate the terms of the Subadvisory Agreement at arm’s length as part of the manager-of-managers structure, noting that the Subadvisor (other than Frontier and TimesSquare) is not affiliated with the Investment Manager. In addition, the Trustees considered other potential benefits of the subadvisory relationship to a Subadvisor, including, among others, the indirect benefits that the Subadvisor may receive from the Subadvisor’s relationship with a Fund, including any so-called “fallout benefits” to the Subadvisor, such as reputational value derived from the Subadvisor serving as Subadvisor to the Fund. In addition, the Trustees noted that the subadvisory fees are paid by the Investment Manager out of its advisory fee. As a consequence of all of the foregoing, the cost of services to be provided by each unaffiliated Subadvisor and the profitability to the Subadvisor of its relationship with a Fund were not material factors in the Trustees’ deliberations. For similar reasons, the Trustees did not consider potential economies of scale in the management of a Fund or the portion of a Fund managed by each unaffiliated Subadvisor to be a material factor in their deliberations at this time.
In considering the reasonableness of the fees payable by the Investment Manager to each of Frontier and TimesSquare, the Trustees noted that each of Frontier and TimesSquare is an affiliate of the Investment Manager and reviewed information regarding the cost to Frontier and TimesSquare, respectively, of providing subadvisory services to a Fund and the resulting profitability from such relationship and noted that, because each of Frontier and TimesSquare is an affiliate of the Investment Manager, a portion of such profitability or Frontier’s or TimesSquare’s revenues might be
shared directly or indirectly with the Investment Manager. The Trustees also noted that the subadvisory fees are paid by the Investment Manager out of its advisory fee. The Board also took into account management’s discussion of the current subadvisory fee structure, and the services each of Frontier and TimesSquare provides in performing its functions under the applicable Subadvisory Agreement. Based on the foregoing, the Trustees concluded that the profitability to each of Frontier and TimesSquare is reasonable and that neither Frontier nor TimesSquare is realizing material benefits from economies of scale that would warrant adjustments to the subadvisory fees at this time. Also with respect to economies of scale, the Trustees noted that as a Fund’s assets increase over time, the Fund may realize other economies of scale to the extent the increase in assets is proportionally greater than the increase in certain other expenses.
In addition to the foregoing, the Trustees considered the specific factors and related conclusions set forth below with respect to each Fund, the Investment Manager and each Subadvisor.
AMG MANAGERS EMERGING OPPORTUNITIES FUND
FUND PERFORMANCE
Among other information relating to the Fund’s performance, the Trustees noted that the Fund’s performance for Service Class shares (which share class has the earliest inception date and the largest assets of all the share classes of the Fund) for the 1-year, 3-year, 5-year and 10-year periods ended March 31, 2015 was below, above, above and above, respectively, the median performance of the Peer Group and below, above, above and above, respectively, the performance of the Fund Benchmark, the Russell Microcap® Index. The Trustees took into account management’s discussion of the Fund’s performance, including the reasons for the Fund’s more recent underperformance. The Trustees also took into account the fact that the Fund ranked in the top quintile relative to the Peer Group for the 3-year, 5-year and 10-year periods and noted the Fund’s
favorable 5-year track record as a multi-manager, multi-style Fund. The Trustees concluded that the Fund’s overall performance has been satisfactory.
ADVISORY FEES
The Trustees noted that the Fund’s advisory fees (which include both the advisory and administration fee) and total expenses (net of applicable expense waivers/reimbursements) as of March 31, 2015 were both higher than the average for the Peer Group. The Trustees took into account the fact that the Investment Manager has contractually agreed, through March 1, 2016, to limit the Fund’s net annual operating expenses (subject to certain excluded expenses) to 1.18%. The Trustees also noted that the Investment Manager had reduced the Fund’s expense limitation in previous years. The Trustees took into account management’s discussion of the Fund’s expenses and competitiveness with comparably sized funds. The Trustees concluded that, in light of the nature, extent and quality of the services provided by the Investment Manager and the Subadvisors, the foregoing expense limitation and the considerations noted above with respect to the Investment Manager and the Subadvisors, the Fund’s advisory and subadvisory fees are reasonable.
AMG FRONTIER SMALL CAP GROWTH FUND
FUND PERFORMANCE
Among other information relating to the Fund’s performance, the Trustees noted that the Fund’s performance for Service Class shares (which share class has the earliest inception date of all the share classes of the Fund) for the 1-year, 3-year, 5-year and 10-year periods ended March 31, 2015 was above the median performance of the Peer Group and below, below, below and above, respectively, the performance of the Fund Benchmark, the Russell 2000® Growth Index. The Trustees took into account management’s discussion of the Fund’s performance, including the reasons for the Fund’s underperformance relative to the Fund Benchmark for the relevant time periods. The Trustees also noted that the
58
Annual Renewal of Investment Management and Subadvisory Agreements (unaudited) (continued)
Fund ranked in the top quintile relative to its Peer Group for the 10-year period. The Trustees concluded that the Fund’s performance has been satisfactory.
ADVISORY FEES
The Trustees noted that the Fund’s advisory fee and total expenses (net of applicable expense waivers/reimbursements) as of March 31, 2015 were both lower than the average for the Peer Group. The Trustees took into account the fact that the Investment Manager has contractually agreed, through March 1, 2016, to limit the Fund’s net annual operating expenses (subject to certain excluded expenses) to 1.05%. The Board also took into account management’s discussion of the Fund’s expenses and the current size of the Fund. The Trustees concluded that, in light of the nature, extent and quality of the services provided by the Investment Manager and the Subadvisor (which is an affiliate of the Investment Manager), the foregoing expense limitation and the considerations noted above with respect to the Investment Manager and the Subadvisor, the Fund’s advisory and subadvisory fees are reasonable.
AMG TIMESSQUARE ALL CAP GROWTH FUND
FUND PERFORMANCE
Among other information relating to the Fund’s performance, the Trustees noted that the Fund’s performance for Service Class shares (which share class has the largest assets of all the share classes of the Fund) for the 1-year and 3-year periods ended March 31, 2015 and the period from the Fund’s inception on July 30, 2010 through March 31, 2015 was above the median performance of the Peer Group and below, above and below, respectively, the performance of the Fund Benchmark, the Russell 3000® Growth Index. The Trustees took into account management’s discussion of the Fund’s performance, including its more recent improved performance. The Trustees concluded that the Fund’s performance has been satisfactory.
ADVISORY FEES
The Trustees noted that the Fund’s advisory fees (which include both the advisory and administration fee) and total expenses (net of
applicable expense waivers/reimbursements) as of March 31, 2015 were higher and lower, respectively, than the average for the Peer Group. The Trustees took into account the fact that the Investment Manager has contractually agreed, through March 1, 2016, to limit the Fund’s net annual operating expenses (subject to certain excluded expenses) to 0.79%. The Board took into account management’s discussion of the Fund’s expenses and the current size of the Fund. The Trustees concluded that, in light of the nature, extent and quality of the services provided by the Investment Manager and the Subadvisor (which is an affiliate of the Investment Manager), the foregoing expense limitation and the considerations noted above with respect to the Investment Manager and the Subadvisor, the Fund’s advisory and subadvisory fees are reasonable.
AMG MANAGERS REAL ESTATE SECURITIES FUND
FUND PERFORMANCE
Among other information relating to the Fund’s performance, the Trustees noted that the Fund’s performance for the 1-year, 3-year, 5-year and 10-year periods ended March 31, 2015 was above the median performance of the Peer Group and above, below, above and above, respectively, the performance of the Fund Benchmark, the Dow Jones U.S. Select REIT Index. The Trustees noted that the Fund ranked in the top quartile relative to its Peer Group for all relevant time periods. The Trustees concluded that the Fund’s overall performance has been satisfactory.
ADVISORY FEES
The Trustees noted that the Fund’s advisory fees (which include both the advisory and administration fee) and total expenses (net of applicable expense waivers/reimbursements) as of March 31, 2015 were both higher than the average for the Peer Group. The Trustees took into account the fact that the Investment Manager has contractually agreed, through March 31, 2016, to limit the Fund’s net annual operating expenses (subject to certain excluded expenses) to 1.24%
and noted that the Fund was operating below its expense cap as of March 31, 2015. The Trustees also noted that the Investment Manager reduced the Fund’s expense limitation in 2012. The Trustees also took into account management’s discussion of the Fund’s expenses and competitiveness with comparably sized funds. The Trustees concluded that, in light of the nature, extent and quality of the services provided by the Investment Manager and the Subadvisor, the foregoing expense limitation and the considerations noted above with respect to the Investment Manager and the Subadvisor, the Fund’s advisory and subadvisory fees are reasonable.
* * * *
After consideration of the foregoing, the Trustees also reached the following conclusions (in addition to the conclusions discussed above) regarding each Investment Management Agreement and each Subadvisory Agreement: (a) the Investment Manager and each Subadvisor have demonstrated that they possess the capability and resources to perform the duties required of them under each Investment Management Agreement and the applicable Subadvisory Agreements; (b) each Subadvisor’s Investment Strategy is appropriate for pursuing the applicable Fund’s investment objectives; and (c) the Investment Manager and each Subadvisor maintain appropriate compliance programs.
Based on all of the above-mentioned factors and their related conclusions, with no single factor or conclusion being determinative and with each Trustee not necessarily attributing the same weight to each factor, the Trustees concluded that approval of each Investment Management Agreement and each Subadvisory Agreement would be in the best interests of the applicable Fund and its shareholders. Accordingly, on June 24-25, 2015, the Trustees, and separately a majority of the Independent Trustees, voted to approve the Investment Management and the Subadvisory Agreements (as applicable) for each Fund.
59
THIS PAGE INTENTIONALLY LEFT BLANK
Investment Manager and Administrator
AMG Funds LLC
600 Steamboat Road, Suite 300
Greenwich, CT 06830
(800) 835-3879
Distributor
AMG Distributors, Inc.
600 Steamboat Road, Suite 300
Greenwich, CT 06830
(800) 835-3879
Custodian
The Bank of New York Mellon
2 Hanson Place
Brooklyn, NY 11217
Legal Counsel
Ropes & Gray LLP
Prudential Tower, 800 Boylston Street
Boston, MA 02199-3600
Transfer Agent
BNY Mellon Investment Servicing (US) Inc.
Attn: AMG Funds
P.O. Box 9769
Providence, RI 02940
(800) 548-4539
For ManagersChoiceTM Only
AMG Funds
c/o BNY Mellon Investment Servicing (US) Inc.
P.O. Box 9847
Providence, RI 02940-8047
(800) 358-7668
This report is prepared for the Funds’ shareholders. It is authorized for distribution to prospective investors only when preceded or accompanied by an effective prospectus. To receive a free copy of the prospectus or Statement of Additional Information, which includes additional information about Fund Trustees, please contact us by calling 800.835.3879. Distributed by AMG Distributors, Inc., member FINRA/SIPC.
Current net asset values per share for each Fund are available on the Funds’ website at www.amgfunds.com.
A description of the policies and procedures each Fund uses to vote its proxies is available: (i) without charge, upon request, by calling 800.835.3879, or (ii) on the Securities and Exchange Commission’s (SEC) website at www.sec.gov. For information regarding each Fund’s proxy voting record for the 12-month period ended June 30, call 800.835.3879 or visit the SEC website at www.sec.gov.
Each Fund files its complete schedule of portfolio holdings with the SEC for the first and third quarters of each fiscal year on Form N-Q. The Funds’ Forms N-Q are available on the SEC’s website at www.sec.gov. A Fund’s Forms N-Q may be reviewed and copied at the SEC’s Public Reference Room in Washington, DC. Information on the operation of the Public Reference Room may be obtained by calling 1-800-SEC-0330. To review a complete list of the Funds’ portfolio holdings, or to view the most recent quarterly holdings report, semiannual report, or annual report, please visit www.amgfunds.com.
www.amgfunds.com |
AFFILIATE SUBADVISED FUNDS
BALANCED FUNDS
AMG Chicago Equity Partners Balanced
Chicago Equity Partners, LLC
AMG FQ Global Risk-Balanced
First Quadrant, L.P.
EQUITY FUNDS
AMG Chicago Equity Partners Small
Cap Value
Chicago Equity Partners, LLC
AMG FQ Tax-Managed U.S. Equity AMG FQ U.S. Equity
First Quadrant, L.P.
AMG Frontier Small Cap Growth
Frontier Capital Management Company, LLC
AMG GW&K Small Cap Core
AMG GW&K Small Cap Growth
GW&K Investment Management, LLC
AMG Renaissance International Equity
AMG Renaissance Large Cap Growth
The Renaissance Group LLC
AMG SouthernSun Small Cap
AMG SouthernSun U.S. Equity
SouthernSun Asset Management, LLC
AMG Systematic Large Cap Value
AMG Systematic Mid Cap Value
Systematic Financial Management, L.P.
AMG TimesSquare All Cap Growth
AMG TimesSquare International Small Cap
AMG TimesSquare Mid Cap Growth
AMG TimesSquare Small Cap Growth
TimesSquare Capital Management, LLC
AMG Trilogy Emerging Markets Equity
AMG Trilogy Emerging Wealth Equity
AMG Trilogy Global Equity
AMG Trilogy International Small Cap
Trilogy Global Advisors, L.P.
AMG Yacktman
AMG Yacktman Focused
AMG Yacktman Special Opportunities
Yacktman Asset Management LP
FIXED INCOME FUNDS
AMG GW&K Core Bond
(formerly AMG Managers Total Return Bond)
AMG GW&K Enhanced Core Bond
AMG GW&K Municipal Bond
AMG GW&K Municipal Enhanced Yield
GW&K Investment Management, LLC
OPEN-ARCHITECTURE FUNDS
EQUITY FUNDS
AMG Managers Brandywine
AMG Managers Brandywine Advisors
Mid Cap Growth
AMG Managers Brandywine Blue
Friess Associates, LLC
AMG Managers Cadence Capital Appreciation
AMG Managers Cadence Emerging Companies
AMG Managers Cadence Mid Cap
Cadence Capital Management, LLC
AMG Managers Emerging Opportunities
Lord, Abbett & Co. LLC
WEDGE Capital Management L.L.P.
Next Century Growth Investors LLC
RBC Global Asset Management (U.S.) Inc.
AMG Managers Essex Small/Micro Cap Growth
Essex Investment Management Co., LLC
AMG Managers Real Estate Securities
CenterSquare Investment Management, Inc.
AMG Managers Skyline Special Equities
Skyline Asset Management, L.P.
AMG Managers Special Equity
Ranger Investment Management, L.P.
Lord, Abbett & Co. LLC
Smith Asset Management Group, L.P.
Federated MDTA LLC
FIXED INCOME FUNDS
AMG Managers Bond
AMG Managers Global Income Opportunity
Loomis, Sayles & Co., L.P.
AMG Managers High Yield
J.P. Morgan Investment Management Inc.
AMG Managers Intermediate Duration Government
AMG Managers Short Duration Government
Amundi Smith Breeden LLC
| | |

| | | www.amgfunds.com |
Item 2. CODE OF ETHICS
Registrant has adopted a Code of Ethics. See attached Exhibit (a)(1).
Item 3. AUDIT COMMITTEE FINANCIAL EXPERT
Registrant’s Board of Trustees has determined that independent Trustees Mr. Edward J. Kaier and Mr. Steven J. Paggioli each qualify as the Audit Committee Financial Expert. Mr. Kaier and Mr. Paggioli are “independent” as such term is defined in Form N-CSR.
Item 4. PRINCIPAL ACCOUNTANT FEES AND SERVICES
The aggregate fees billed by PwC to the Fund for the Funds’ two most recent fiscal years for professional services rendered for audits of annual financial statements, or services that are normally provided in connection with statutory and regulatory filings or engagements (“Audit Fees”) were as follows:
| | | | | | | | |
| | | Fiscal
2015 | | | Fiscal
2014 | |
AMG FQ Tax-Managed U.S. Equity Fund | | $ | 22,455 | | | $ | 22,031 | |
AMG FQ U.S. Equity Fund | | $ | 23,496 | | | $ | 21,503 | |
AMG FQ Global Alternatives Fund | | $ | 0 | | | $ | 18,329 | |
AMG FQ Global Risk-Balanced Fund | | $ | 25,303 | | | $ | 25,516 | |
AMG Frontier Small Cap Growth Fund | | $ | 23,236 | | | $ | 22,095 | |
AMG Managers Emerging Opportunities Fund | | $ | 27,376 | | | $ | 22,662 | |
AMG Managers Real Estate Securities Fund | | $ | 39,111 | | | $ | 33,045 | |
AMG GW&K Core Bond Fund | | $ | 67,860 | | | $ | 103,620 | |
AMG TimesSquare All Cap Growth Fund | | $ | 23,215 | | | $ | 25,058 | |
There were no fees billed by PwC to the Fund in its two recent fiscal years for services rendered for assurance and related services that are reasonably related to the performance of the audit or review of the Fund’s financial statements, but are not reported as Audit Fees (“Audit-Related Fees”).
For the Funds’ two most recent fiscal years, there were no Audit-Related Fees billed by PwC for engagements related directly to the operations and financial reporting of one or more Funds by a Fund Service Provider. A Fund Service Provider is (a) any investment adviser to the Fund (not including any Subadvisor whose role is primarily portfolio management and is subcontracted with or overseen by another investment adviser) or (b) any entity that provides ongoing services to the Fund and is controlling, controlled by or under common control with a Fund investment adviser described in (a).
The aggregate fees billed by PwC to the Funds for the two most recent fiscal years for professional services rendered for tax compliance, tax advice, and tax planning (“Tax Fees”) were as follows:
| | | | | | | | |
| | | Fiscal
2015 | | | Fiscal
2014 | |
AMG FQ Tax-Managed U.S. Equity Fund | | $ | 7,225 | | | $ | 6,985 | |
AMG FQ U.S. Equity Fund | | $ | 8,305 | | | $ | 8,045 | |
AMG FQ Global Alternatives Fund | | $ | 0 | | | $ | 10,720 | |
AMG FQ Global Risk-Balanced Fund | | $ | 11,130 | | | $ | 10,720 | |
AMG Frontier Small Cap Growth Fund | | $ | 7,225 | | | $ | 6,885 | |
AMG Managers Emerging Opportunities Fund | | $ | 8,305 | | | $ | 8,045 | |
AMG Managers Real Estate Securities Fund | | $ | 9,240 | | | $ | 8,960 | |
AMG GW&K Core Bond Fund | | $ | 10,290 | | | $ | 10,970 | |
AMG TimesSquare All Cap Growth Fund | | $ | 7,225 | | | $ | 6,985 | |
For the Funds’ two most recent fiscal years, Tax Fees billed by PwC for engagements by Fund Service Providers that related directly to the operations and financial reporting of the Funds were $0 for fiscal 2015 and $0 for fiscal 2014, respectively.
The services for which Tax Fees were charged comprise all services performed by professional staff in PwC’s tax division except those services related to the audit. Typically, this category would include fees for tax compliance, tax planning, and tax advice. Tax compliance, tax advice, and tax planning services include preparation of original and amended tax returns, claims for refund and tax payment-planning services, assistance with tax audits and appeals, tax advice related to mergers and acquisitions and requests for rulings or technical advice from taxing authorities.
There were no other fees billed by PwC to the Funds for all other non-audit services (“Other Fees”) during the Funds’ two most recent fiscal years. During the same period, there were no Other Fees billed by PwC for engagements by Fund Service Providers that related directly to the operations and financial reporting of the Funds.
According to policies adopted by the Audit Committee, services provided by PwC to the Funds must be pre-approved by the Audit Committee. On an annual basis, the Audit Committee reviews and pre-approves various types of services that PwC may perform for the Funds without specific approval of each engagement, subject to specified budget limitations. As contemplated by the Sarbanes-Oxley Act of 2002 and related SEC rules, the Audit Committee also pre-approves non-audit services provided by PwC to any Fund Service Provider for any engagement that relates directly to the operations and financial reporting of the Funds. Any engagement that is not already pre-approved or that will exceed a pre-approved budget must be submitted to the Audit Committee for pre-approval. The Chairman of the Audit Committee is authorized on behalf of the Board of Trustees and the Audit Committee to approve the
engagement of PwC to perform non-audit services subject to certain conditions, including notification to the Audit Committee of such pre-approval not later than the next meeting of the Audit Committee following the date of such pre-approval.
(e) (2) None.
(g) The aggregate fees billed by PwC in 2015 and 2014 for non-audit services rendered to the Funds and Fund Service Providers were $164,513 and $126,315, respectively. For the fiscal year ended October 31, 2015, this amount reflects the amounts disclosed above in Item 4(b),(c),(d), plus $95,568 in fees billed to the Fund Service Providers for non-audit services that did not relate directly to the operations and financial reporting of the Funds. For the fiscal year ended October 31, 2014, this amount reflects the amounts disclosed above in Item 4(b),(c),(d), plus $48,000 in fees billed to the Fund Service Providers for non-audit services that did not relate directly to the operations and financial reporting of the Funds.
(h) The Trust’s Audit Committee has considered whether the provision of non-audit services by registrant’s independent registered public accounting firm to the registrant’s investment advisor, and any entity controlling, controlled, or under common control with the investment advisor that provided ongoing services to the registrant that were not pre-approved by the Committee (because such services did not relate directly to the operations and financial reporting of the registrant) was compatible with maintaining the independence of the independent registered public accounting firm.
Item 5. AUDIT COMMITTEE OF LISTED REGISTRANTS
Not applicable.
Item 6. SCHEDULE OF INVESTMENTS
The schedule of investments in unaffiliated issuers as of the close of the reporting period is included as part of the shareholder report contained in Item 1 hereof.
Item 7. DISCLOSURE OF PROXY VOTING POLICIES AND PROCEDURES FOR CLOSED-END MANAGEMENT INVESTMENT COMPANIES
Not applicable.
Item 8. PORTFOLIO MANAGERS OF CLOSED-END MANAGEMENT INVESTMENT COMPANIES
Not applicable.
Item 9. PURCHASES OF EQUITY SECURITIES BY CLOSED-END MANAGEMENT INVESTMENT COMPANIES AND AFFILIATED PURCHASERS
Not applicable.
Item 10. SUBMISSION OF MATTERS TO A VOTE OF SECURITY HOLDERS
Not applicable.
Item 11. CONTROLS AND PROCEDURES
(a) The Registrant’s principal executive and principal financial officers have concluded, based on their evaluation of the registrant’s disclosure controls and procedures as of a date within 90 days of the filing of this report, that the Registrant’s disclosure controls and procedures are reasonably designed to ensure that information required to be disclosed by the Registrant on Form N-CSR is recorded, processed, summarized and reported within the required time periods and that information required to be disclosed by the registrant in the reports that it files or submits on Form N-CSR is accumulated and communicated to the Registrant’s management, including its principal executive and principal financial officers, as appropriate to allow timely decisions regarding required disclosure.
(b) There were no changes in the Registrant’s internal control over financial reporting during the Registrant’s fourth fiscal quarter of the period covered by this report that have materially affected, or are reasonably likely to affect, the internal control over financial reporting.
Item 12. EXHIBITS
| | |
| (a)(1) | | Any Code of Ethics or amendments hereto. Filed herewith. |
| |
| (a)(2) | | Certifications pursuant to Rule 30a-2(a) under the Investment Company Act of 1940 - Filed herewith. |
| |
| (a)(3) | | Not applicable. |
| |
| (b) | | Certifications pursuant to Rule 30a-2(b) under the Investment Company Act of 1940 - Filed herewith. |
SIGNATURES
Pursuant to the requirements of the Securities Exchange Act of 1934 and the Investment Company Act of 1940, the registrant has duly caused this report to be signed on its behalf by the undersigned, thereunto duly authorized.
AMG Funds I
| | |
| By: | | /s/ Jeffrey T. Cerutti |
| | Jeffrey T. Cerutti, Principal Executive Officer |
| |
| Date: | | January 7, 2016 |
Pursuant to the requirements of the Securities Exchange Act of 1934 and the Investment Company Act of 1940, this report has been signed below by the following persons on behalf of the registrant and in the capacities and on the dates indicated.
| | | | |
| By: | | /s/ Jeffrey T. Cerutti |
| | Jeffrey T. Cerutti, Principal Executive Officer |
| |
| Date: | | January 7, 2016 |
| |
| By: | | /s/ Donald S. Rumery |
| | Donald S. Rumery, Principal Financial Officer |
| |
| Date: | | January 7, 2016 |