UNITED STATES
SECURITIES AND EXCHANGE COMMISSION
Washington, D.C. 20549
FORM N-CSR
CERTIFIED SHAREHOLDER REPORT OF
REGISTERED MANAGEMENT INVESTMENT COMPANIES
Investment Company Act file number: 811-09521
AMG FUNDS I
(Exact name of registrant as specified in charter)
800 Connecticut Avenue, Norwalk, Connecticut 06854
(Address of principal executive offices) (Zip code)
AMG Funds LLC
800 Connecticut Avenue, Norwalk, Connecticut 06854
(Name and address of agent for service)
Registrant’s telephone number, including area code: (203) 299-3500
Date of fiscal year end: September 30
Date of reporting period: OCTOBER 1, 2013 – SEPTEMBER 30, 2014
(Annual Shareholder Report)
Item 1. Reports to Shareholders
| | | | |
 | | | | ANNUAL REPORT |
AMG Funds
September 30, 2014

AMG Managers Brandywine Fund: BRWIX
(formerly Brandywine Fund, Inc.)
AMG Managers Brandywine Blue Fund: BLUEX
(formerly Brandywine Blue Fund)
| | | | |
| www.amgfunds.com | | | | AR073-0914 |
| | |
| | | AMG Funds Annual Report—September 30, 2014 |
| | | | |
TABLE OF CONTENTS | | PAGE | |
LETTER TO SHAREHOLDERS | | | 2 | |
| |
ABOUT YOUR FUND’S EXPENSES | | | 3 | |
| |
PORTFOLIO MANAGER’S COMMENTS, PORTFOLIO STATISTICS, AND SCHEDULES OF PORTFOLIO INVESTMENTS | | | | |
AMG Managers Brandywine Fund | | | 4 | |
AMG Managers Brandywine Blue Fund | | | 11 | |
| |
NOTES TO SCHEDULES OF PORTFOLIO INVESTMENTS | | | 17 | |
| |
FINANCIAL STATEMENTS | | | | |
| |
Statement of Assets and Liabilities | | | 19 | |
Balance sheets, net asset value (NAV) per share computations and cumulative undistributed amounts | | | | |
| |
Statement of Operations | | | 20 | |
Detail of sources of income, expenses, and realized and unrealized gains (losses) during the fiscal year | | | | |
| |
Statements of Changes in Net Assets | | | 21 | |
Detail of changes in assets for the past two fiscal years | | | | |
| |
FINANCIAL HIGHLIGHTS | | | 22 | |
Historical net asset values per share, distributions, total returns, income and expense ratios, turnover ratios and net assets | | | | |
| |
NOTES TO FINANCIAL STATEMENTS | | | 24 | |
Accounting and distribution policies, details of agreements and transactions with Fund management and affiliates, and descriptions of certain investment risks | | | | |
| |
REPORT OF INDEPENDENT REGISTERED PUBLIC ACCOUNTING FIRM | | | 30 | |
| |
TRUSTEES AND OFFICERS | | | 31 | |
Nothing contained herein is to be considered an offer, sale or solicitation of an offer to buy shares of any series of the AMG Funds family of mutual funds. Such offering is made only by Prospectus, which includes details as to offering price and other material information.
| | | | |
| | | | AMG Managers Brandywine Fund AMG Managers Brandywine Blue Fund |
DEAR FELLOW SHAREHOLDER:
The stock market was slowed but not deterred in the September quarter. While cautious sentiment arose amid an uptick in geopolitical uncertainty, stocks still managed to take a small step up in an ongoing march higher.
AMG Managers Brandywine Fund generated a positive return for the seventh consecutive quarter in the three months through September, marking the longest streak of quarterly gains in the Fund’s 28-year history. Brandywine grew 1.19 percent in the September quarter, outpacing gains in the Russell 3000® and Russell 3000® Growth Indexes of 0.01 and 0.88 percent.
AMG Managers Brandywine Blue Fund grew 0.24 percent in the quarter as the S&P 500®, Russell 1000® and Russell 1000® Growth Indexes gained 1.13, 0.65 and 1.49 percent.
From Russia stirring conflict in Ukraine to U.S. airstrikes in the Middle East, developments on the geopolitical front provided investors numerous reasons for pause during the September quarter. Questions arose about economic conditions in Europe and China as well.
In mid-September, the Federal Reserve indicated that it would end its quantitative easing program in October. As part of the announcement, the Fed retained previously released language stating that interest rates would rise “a considerable time” after the central bank ended its bond-buying program – a point that could help explain the market’s ability to maintain a modestly positive bias despite competing macro threats. Potential for rising U.S. interest rates remains a pressing concern among investors, and the Fed made a deliberate effort to put that concern to rest for the time being.
Brandywine generated positive returns in six of the nine economic sectors represented in its portfolio during the quarter. The Russell 3000® Growth Index posted gains in four sectors.
Industrial holdings contributed the most to Brandywine’s results versus the Russell 3000® Growth Index. Industrial holdings represented the portfolio’s second largest commitment and constituted an overweight position relative to the benchmark. Companies with earnings driven by strong transport trends enabled industrial holdings to contribute to absolute performance even as the sector declined within the index.
Greenbrier Cos., which makes railroad freight cars and marine barges, was a standout industrial sector contributor for Brandywine. Greenbrier beat May-quarter estimates by 39 percent by more than doubling year-over-year earnings on strong demand for tank cars driven by North American energy and agricultural customers. XPO Logistics, a third-party logistics provider, also aided results as it enjoyed volume and pricing gains due to rail congestion driving increased demand for truck shipment options.
Holdings from the consumer staples sector were the next most significant contributors to performance for Brandywine versus the Russell 3000® Growth Index. Hain Celestial Group, the largest company focused on organic and natural foods, was the most notable contributor. Hain Celestial grew June-quarter earnings 38 percent, beating the consensus estimate for the seventh time out of the last eight quarters.
While health care contributed to the Brandywine portfolio’s absolute return, the sector was the most pronounced relative performance detractor. Brandywine’s health care position was underweight versus the benchmark during a quarter when the health care sector outperformed all others in the index.
The consumer discretionary sector was the only other material negative influence on relative results. Kate Spade & Co. shares declined on concerns that promotional activity would pressure profit margins within its line of premium brands sold through retailers. Media companies Twenty-First Century Fox and CBS Corp. also detracted from results. Both media companies were also held by Brandywine Blue.
Within the Brandywine Blue portfolio, technology holdings comprised the largest position. Although roughly equal-weighted versus the Russell 1000® Growth Index, the technology sector outperformed the portfolio’s technology holdings, helping make the technology sector the largest detractor from relative results by a substantial margin.
Corning, which makes specialty glass displays for electronic devices, detracted from Brandywine Blue’s results. The company met the consensus estimate with 16 percent June-quarter earnings growth, but shares declined on concerns that future results could be impacted by softness in the tablet and touch notebook end markets. Flash memory maker SanDisk Corp. and 3D printer manufacturer 3D Systems Corp. also detracted from results. Brandywine also held Corning and 3D Systems.
Health care holdings, which were significant contributors to absolute return, were the next greatest detractors from Brandywine Blue’s relative results. The majority of health care holdings gained ground, with just two holdings posting modest declines. The portfolio was slightly underweight versus the index and underperformed the sector at a time when health care was the index’s best performing sector.
Holdings from the financial and consumer staples sectors contributed the most to performance versus the Russell 1000® Growth Index. American Tower, which leases antenna space to wireless service providers, was a standout in the financial sector after reporting 29 percent June-quarter earnings growth, which exceeded the consensus estimate. CVS Health Corp. was a strong consumer staples sector contributor. The company beat June-quarter expectations with 16 percent earnings growth. Brandywine also held American Tower and CVS.
We’re excited to note that closing out fiscal 2014 also marked the first anniversary of the Brandywine Funds joining the AMG Funds family. All of us at Friess Associates are grateful for the opportunity to serve you.

Scott Gates
Chief Investment Officer
Friess Associates, LLC
| | |
| | | About Your Fund’s Expenses |
As a shareholder of a Fund, you may incur two types of costs: (1) transaction costs, which may include sales charges (loads) on purchase payments; redemption fees; and exchange fees; and (2) ongoing costs, including management fees; distribution (12b-1) fees; and other Fund expenses. This example is intended to help you understand your ongoing costs (in dollars) of investing in the Fund and to compare these costs with the ongoing costs of investing in other mutual funds. The example is based on $1,000 invested at the beginning of the period and held for the entire period as indicated below.
ACTUAL EXPENSES
The first line of the following table provides information about the actual account values and actual expenses. You may use the information in this line, together with the amount you invested, to estimate the expenses that you paid over the period. Simply divide your account value by $1,000 (for example, an $8,600 account value divided by $1,000 = 8.6), then multiply the result by the number in the first line under the heading entitled “Expenses Paid During Period” to estimate the expenses you paid on your account during this period.
HYPOTHETICAL EXAMPLE FOR COMPARISON PURPOSES
The second line of the following table provides information about hypothetical account values and hypothetical expenses based on the Fund’s actual expense ratio and an assumed annual rate of return of 5% before expenses, which is not the Fund’s actual return. The hypothetical account values and expenses may not be used to estimate the actual ending account balance or expenses you paid for the period. You may use this information to compare the ongoing costs of investing in the Fund and other funds by comparing this 5% hypothetical example with the 5% hypothetical examples that appear in the shareholder reports of other funds.
Please note that the expenses shown in the table are meant to highlight your on going costs only and do not reflect any transactional costs, such as sales charges (loads), redemption fees, or exchange fees. Therefore, the second line of the table is useful in comparing ongoing costs only, and will not help you determine the relative total costs of owning different funds.
| | | | | | | | | | | | | | | | |
| Six Months Ended September 30, 2014 | | Expense
Ratio for
the Period | | | Beginning
Account Value
4/01/14 | | | Ending
Account Value
9/30/14 | | | Expenses
Paid During
the Period* | |
AMG Managers Brandywine Fund | | | | | | | | | | | | | | | | |
Based on Actual Fund Return | | | 1.10 | % | | $ | 1,000 | | | $ | 1,024 | | | $ | 5.58 | |
Hypothetical (5% return before expenses) | | | 1.10 | % | | $ | 1,000 | | | $ | 1,020 | | | $ | 5.57 | |
AMG Managers Brandywine Blue Fund | | | | | | | | | | | | | | | | |
Based on Actual Fund Return | | | 1.14 | % | | $ | 1,000 | | | $ | 1,042 | | | $ | 5.84 | |
Hypothetical (5% return before expenses) | | | 1.14 | % | | $ | 1,000 | | | $ | 1,019 | | | $ | 5.77 | |
| * | Expenses are equal to the Fund’s annualized expense ratio multiplied by the average account value over the period, multiplied by the number of days in the most recent fiscal half-year (183), then divided by 365. |
| | |
| | | AMG Managers Brandywine Fund Portfolio Manager’s Comments |
Macro factors in the 12 months ended September 30, 2014, which included everything from international conflict to questions about China’s economic growth, did not prevent stocks from moving higher in AMG Managers Brandywine Fund’s (“Brandywine”) fiscal year.
Both Brandywine and its benchmark, the Russell 3000® Growth Index, generated positive absolute returns in all four of the fiscal year’s quarters. Still, one significant event – winter weather that contributed to a 2.9 percent drop in first-quarter GDP – changed the complexion of the market’s move higher, impacting relative performance in the fiscal year’s final tally.
The fiscal year began on a high note, with investor sentiment still projecting the confidence inspired by the Federal Reserve’s decision roughly a year earlier to extend and expand its monthly bond-buying program. Despite the Federal Reserve telegraphing a plan to begin winding down that stimulus, the market’s mood remained upbeat in the December quarter (the first quarter of the fiscal year) thanks to evidence of economic progress strong enough to make investors comfortable with the Federal Reserve’s announced intentions.
Investors embraced the notion that the economy was poised to accelerate from the slow-growth trajectory evident throughout much of the recovery. Brandywine’s earnings-driven investment strategy fared particularly well in this environment, as companies with above-average growth prospects attracted positive attention.
Holdings from the technology sector, such as Micron Technology, and the industrial sector, such as United Rentals, drove December-quarter performance. In what was the strongest quarter of the fiscal year for Brandywine and the benchmark, Brandywine outperformed.
In the March quarter, Mother Nature let it be known that expectations are subject to change. Nasty winter weather, including record
snow accumulation in major metropolitan regions in the Northeast and Midwest, left its mark, disrupting shipping and at times shuttering businesses.
As investors debated the potential implications of the weather, unremarkable economic reports released during the period added to the uncertainty. They also added to the belief that support from the Federal Reserve remained in place for the foreseeable future, helping maintain a positive bias.
Industrial holdings, particularly companies with limited exposure to the worst of the winter weather, remained top performers in the March quarter. United Rentals continued as a standout. Financial sector holdings also aided performance. Both Brandywine and the benchmark posted modest March-quarter returns, and Brandywine outperformed.
The environment remained mostly calm in the June quarter, but the main concerns that surfaced in the March quarter carried forward. As companies reported earnings results from the first quarter, investors debated whether the period represented a one-time, winter-related setback or something of more lasting economic consequence.
Rather than change the direction of the market, the uncertainty contributed to a change in the leadership driving the advance. Utility sector companies were notable performers in the June quarter as low-interest rates heightened the appeal of dividends and the market’s rise adopted a more defensive stance. Energy companies also fared well as a terrorist push into Iraq sent oil prices higher.
Technology holdings, such as FireEye, detracted the most from performance versus the benchmark. Industrial holdings, which drove Brandywine’s performance in the previous two quarters, also underperformed. Manitowoc Co. was a noteworthy detractor from the industrial
sector. Both Brandywine and the benchmark gained ground in the June quarter, and Brandywine underperformed.
From geopolitical developments in Ukraine, Syria and Iraq to economic uncertainty in Europe and China, the macro environment gave investors plenty to consider in the September quarter (the final quarter of the fiscal year). Still, stocks maintained a modestly positive bias. Even though the Federal Reserve announced its intention to discontinue its monthly bond-buying program in October, investors drew comfort in the Federal Reserve stating that interest rates were unlikely to rise for a considerable time.
Holdings from the industrial and consumer staples sectors contributed the most to Brandywine’s performance versus the benchmark. Holdings from the health care and consumer discretionary sectors were negative influences on relative results.
Brandywine outperformed the benchmark in the September quarter, marking its third quarter out of four for the fiscal year. Still, the benchmark’s relative performance advantage in the June quarter proved to be a wide enough margin to preserve a relative performance edge for the full fiscal year. Brandywine grew 15.65 percent for the 12 months ended September 30, 2014. The Russell 3000® Growth Index gained 17.87 percent during that time.
Synaptics, United Rentals, Micron Technology and Trinity Industries contributed the most to the portfolio’s fiscal-year performance. The most significant performance detractors were Himax Technologies, Nu Skin Enterprises, GameStop Corp. and Vonage Holdings Corp.
This commentary reflects the viewpoints of Friess Associates, LLC as of September 30, 2014 and is not intended as a forecast or guarantee of future results.
| | |
| | | AMG Managers Brandywine Fund Portfolio Manager’s Comments (continued) |
CUMULATIVE TOTAL RETURN PERFORMANCE
AMG Managers Brandywine Fund’s cumulative total return is based on the daily change in net asset value (NAV), and assumes that all dividends and distributions were reinvested. This graph compares a hypothetical $10,000 investment made in AMG Managers Brandywine Fund on September 30, 2004, to a $10,000 investment made in the Russell 3000® Growth Index, Russell 3000® Index and S&P 500® Index for the same time period. The graph and table do not reflect the deduction of taxes that a shareholder would pay on a Fund distribution or redemption of shares. The listed returns for the Fund are net of expenses and the returns for the index exclude expenses.
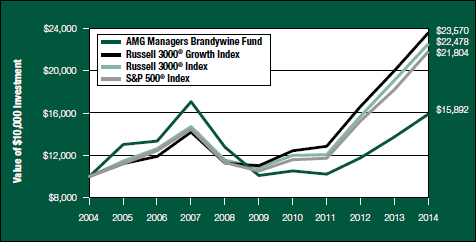
The table below shows the average annual total returns for the AMG Managers Brandywine Fund and the Russell 3000® Growth Index, Russell 3000® Index and S&P 500® Index for the same time periods ended September 30, 2014.
| | | | | | | | | | | | |
| | | One | | | Five | | | Ten | |
| Average Annual Total Returns1 | | Year | | | Years | | | Years | |
AMG Managers Brandywine Fund2,3 | | | 15.65 | % | | | 9.51 | % | | | 4.74 | % |
Russell 3000® Growth Index4 | | | 17.87 | % | | | 16.43 | % | | | 8.95 | % |
Russell 3000® Index5 | | | 17.76 | % | | | 15.78 | % | | | 8.44 | % |
S&P 500® Index6 | | | 19.73 | % | | | 15.70 | % | | | 8.11 | % |
| | | | | | |
| The performance data shown represents past performance. Past performance is not a guarantee of future results. Current performance may be lower or higher than the performance data quoted. The investment return and principal value of an investment in the Fund will fluctuate so that an investor’s shares, when redeemed, may be worth more or less than their original cost. |
Investors should carefully consider the Fund’s investment objectives, risks, charges, and expenses before investing. For performance information through the most recent month end, current net asset values per share for the Fund and other information, please call (800) 835-3879 or visit our website at www.amgfunds.com for a free prospectus. Read it carefully before investing or sending money.
Distributed by AMG Distributors, Inc., member FINRA.
| 1 | Total return equals income yield plus share price change and assumes reinvestment of all dividends and capital gain distributions. Returns are net of fees and may reflect offsets of Fund expenses as described in the Prospectus. No adjustment has been made for taxes payable by shareholders on their reinvested dividends and capital gain distributions. Returns for periods greater than one year are annualized. The listed returns on the Fund are net of expenses and based on the published NAV as of September 30, 2014. All returns are in U.S. dollars ($). |
| 2 | The Fund inception dates and returns for all periods prior to October 1, 2013, reflect performance of the Predecessor Fund, Brandywine Fund, Inc., and was managed by Friess Associates, LLC with the same investment objective and substantially similar investment policies. |
| 3 | The Fund invests in growth stocks, which may be more sensitive to market movements because their prices tend to reflect future investor expectations rather than just current profits. Growth stocks may underperform value stocks during given periods. |
| 4 | The Russell 3000® Growth Index measures the performance of those Russell 3000® Index companies with higher price-to-book ratios and higher forecasted growth values. Unlike the Fund, the Russell 3000® Growth Index is unmanaged, is not available for investment and does not incur expenses. |
| 5 | The Russell 3000® Index is composed of the 3,000 largest U.S. companies as measured by market capitalization and represents about 98% of the U.S. stock market. Unlike the Fund, the Russell 3000® Index is unmanaged, is not available for investment and does not incur expenses. |
| 6 | The S&P 500® Index is a capitalization-weighted index of 500 stocks. The S&P 500® Index is designed to measure performance of the broad domestic economy through changes in the aggregate market value of 500 stocks representing all major industries. Unlike the Fund, the S&P 500® Index is unmanaged, is not available for investment and does not incur expenses. |
The Russell 3000® Growth Index and Russell 3000® Index are registered trademarks of Russell Investments. Russell® is a trademark of Russell Investments.
The S&P 500® Index is proprietary data of Standard & Poor’s, a division of McGraw-Hill Companies, Inc. All rights reserved.
Not FDIC insured, nor bank guaranteed. May lose value.
| | |
| | | AMG Managers Brandywine Fund Fund Snapshots (unaudited) September 30, 2014 |
PORTFOLIO BREAKDOWN
| | | | | | | | | | | | | | | | |
| | | AMG | | | Russell | | | | | | | |
| | | Managers | | | 3000® | | | Russell | | | | |
| | | Brandywine | | | Growth | | | 3000® | | | S&P 500® | |
Industry (Top Ten) | | Fund** | | | Index | | | Index | | | Index | |
Semiconductors | | | 11.2 | % | | | 2.4 | % | | | 2.5 | % | | | 2.4 | % |
Construction Machinery & Heavy Trucks | | | 7.4 | % | | | 0.2 | % | | | 0.3 | % | | | 0.1 | % |
Technology Hardware, Storage & Peripherals | | | 6.9 | % | | | 5.9 | % | | | 3.8 | % | | | 4.6 | % |
Internet Software & Services | | | 5.7 | % | | | 6.3 | % | | | 3.4 | % | | | 3.5 | % |
Packaged Foods & Meats | | | 4.2 | % | | | 1.7 | % | | | 1.6 | % | | | 1.6 | % |
Apparel, Accessories & Luxury Goods | | | 3.9 | % | | | 1.6 | % | | | 0.8 | % | | | 0.8 | % |
Trading Companies & Distributors | | | 3.7 | % | | | 0.5 | % | | | 0.4 | % | | | 0.2 | % |
Application Software | | | 2.8 | % | | | 5.9 | % | | | 3.9 | % | | | 3.8 | % |
Restaurants | | | 2.7 | % | | | 3.1 | % | | | 1.9 | % | | | 1.6 | % |
Apparel Retail | | | 2.6 | % | | | 3.7 | % | | | 2.3 | % | | | 2.1 | % |
Cash & Cash Equivalents | | | 7.6 | % | | | 0.0 | % | | | 0.0 | % | | | 0.0 | % |
Other Assets and Liabilities | | | 41.3 | % | | | 68.7 | % | | | 79.1 | % | | | 79.3 | % |
| ** | As a percentage of net assets |
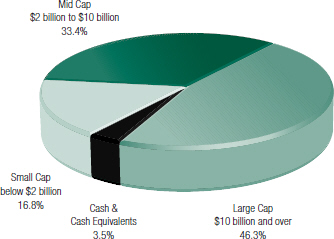
PORTFOLIO MARKET CAPITALIZATION
TOP TEN HOLDINGS
| | | | | | | | |
| | | % of | | | % Change from | |
Security Name | | Net Assets | | | Book Cost | |
Apple, Inc. | | | 5.0 | % | | | 4.3 | % |
Facebook, Inc., Class A | | | 3.0 | | | | 17.4 | |
Synchronoss Technologies, Inc.* | | | 2.8 | | | | 30.0 | |
United Rentals, Inc.* | | | 2.7 | | | | 115.4 | |
Celgene Corp.* | | | 2.5 | | | | 265.3 | |
RF Micro Devices, Inc. | | | 2.4 | | | | 20.2 | |
XPO Logistics, Inc. | | | 2.3 | | | | 38.7 | |
Trinity Industries, Inc. | | | 2.3 | | | | 63.8 | |
Costco Wholesale Corp. | | | 2.2 | | | | 11.4 | |
Wabtec Corp.* | | | 2.2 | | | | 198.1 | |
| | | | | | | | |
Top Ten as a Group | | | 27.4 | % | | | | |
| | | | | | | | |
| * | Also Top Ten Holding as June 30, 2014. |
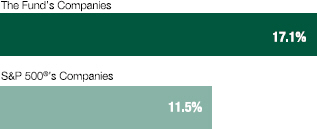
ESTIMATED EARNINGS GROWTH RATE
OF THE FUND’S INVESTMENTS
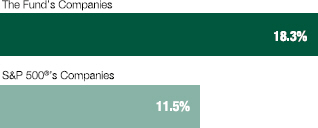
Forecasted Increase in Earnings Per Share 2015 vs 2014
Source: Consensus estimates from FactSet Research Systems Inc.
This is not a forecast of the Fund’s future performance. Earnings growth for a Fund holding does not guarantee a corresponding increase in the market value of the holding or the Fund. As of September 30, 2014, the S&P 500® Index’s average annual total returns for 1, 5 and 10 years were 19.73, 15.70 and 8.11 percent, respectively.
|
Because a fund’s strategy may result in multiple investments in particular sectors of the economy, its performance may depend on the performance of those sectors and may fluctuate more widely than investments diversified across more sectors. For additional information on these and other risk considerations, please see the Fund’s prospectus. Any sectors, industries, or securities discussed should not be perceived as investment recommendations. Mention of a specific security should not be considered a recommendation to buy or solicitation to sell that security. Specific securities mentioned in this report may have been sold from the Fund’s portfolio of investments by the time you receive this report. |
| | |
| | | AMG Managers Brandywine Fund Roses and Thorns (unaudited) Quarter Ending September 30, 2014 |
| | | | | | |
| $ Gain | | | | | | |
(in millions) | | % Gain | | Biggest $ Winners | | Reason for Move |
| | | | | Synchronoss Technologies Inc. | | |
$5.3 | | 31.0 | | The company, which makes software-based activation services and cloud storage technologies used by wireless communications service providers, grew June-quarter earnings 32 percent, beating the consensus estimate. Cloud storage grew 70 percent from the year-ago period, helping drive better-than- expected revenue and earnings. |
| | | |
| | | | XPO Logistics Inc. | | |
$4.8 | | 35.0 | | The provider of transportation and logistics services exceeded earnings and revenue expectations in the June quarter. The company benefited from price and volume increases as customers sought trucking shipment options amid rail congestion. Management raised earnings guidance and reported plans to use additional funds from private investors to accelerate its growth strategy. |
| | | |
| | | | The Greenbrier Companies Inc. | | |
$4.4 | | 27.7 | | The manufacturer of railroad freight cars and marine barges grew May-quarter earnings more than 100 percent, beating the consensus estimate by 39 percent. The company benefited from strong demand for tank cars amid a jump in volume in North American crops and energy-related commodities. We believe an increase in backlogged orders provides visibility into Greenbrier’s earnings potential and positions the company to set up longer production runs and improve profit margins. |
| | | |
| | | | International Rectifier Corp. | | |
$4.1 | | 25.6 | | The manufacturer of power management semiconductors grew June-quarter earnings to $0.18 per share from a loss of $0.09 a year ago. Shares gained ground and passed our target price in the September quarter after Infineon Technologies announced it would purchase International Rectifier. Following the news, we sold the shares we held. |
| | | |
| | | | Ambarella Inc. | | |
$3.6 | | 40.1 | | The provider of low-power, high-definition video compression and image processing solutions reported 42 percent July-quarter earnings growth, beating the consensus estimate by 32 percent. Results were driven by professional and consumer video surveillance products as well as consumer adoption of sports cameras. Video surveillance-equipped drones represent a promising new market for Ambarella. |
| | | |
| $ Loss | | | | | | |
(in millions) | | % Loss | | Biggest $ Losers | | Reason for Move |
| | | | Marchex Inc. | | |
$2.1 | | 53.0 | | The provider of mobile advertising products built to analyze and improve advertising performance beat June-quarter earnings estimates as revenue jumped 22 percent. Shares declined during the quarter following news of the loss of a large client relationship. We sold Marchex during the September quarter to fund an idea with better near-term earnings visibility. |
| | | |
| | | | Synaptics Inc. | | |
$2.2 | | 12.2 | | The supplier of touch-based interface solutions for mobile computing, communications and entertainment devices topped June-quarter earnings estimates. Shares declined during the September quarter as investors grew concerned that competitive pressures were increasing. We believe Synaptics continues to win new customers with integrated chip solutions that include fingerprint sensing technology. |
| | | |
| | | | Kate Spade & Co. | | |
$2.3 | | 13.0 | | The premium-brand retailer grew June-quarter earnings to $0.05 from a loss of $0.12 a year ago, topping expectations. Shares declined during the September quarter on concerns that profit-margin expansion would be delayed due to an increasingly promotional environment. We sold Kate Spade to fund an idea with greater near-term earnings visibility. |
| | | |
| | | | Halcon Resources Corp. | | |
$2.4 | | 36.0 | | The exploration and production company focused in the Bakken, Eagle Ford and other U.S. shale fields grew June-quarter earnings 75 percent, beating estimates by 55 percent. While fundamentals reflected stronger-than-expected production results, shares traded down in the September quarter due to a competitor’s weak drilling results in the high-profile Tuscaloosa Marine Shale. Commodity prices also came under pressure. |
| | | |
| | | | 3D Systems Corp. | | |
$3.2 | | 19.2 | | Shares of the developer and manufacturer of 3D printers declined during the September quarter as revenue from new products was accompanied by higher costs, creating profit-margin pressure. Based on the consensus, analysts expected the company to earn $0.02 per share more in the June quarter. |
All gains/losses are calculated on an average cost basis from June 30, 2014 through September 30, 2014.
This commentary reflects the viewpoints of Friess Associates, LLC as of September 30, 2014 and is not intended as a forecast or guarantee of future results.
| | |
| | | AMG Managers Brandywine Fund Schedule of Portfolio Investments September 30, 2014 |
| | | | | | | | | | |
Shares | | | | Cost | | | Value | |
Common Stocks - 96.7% | | | | | |
Consumer Discretionary | | | | | |
| | Apparel Retail - 2.6% | | | | | |
577,440 | | American Eagle Outfitters, Inc. | | $ | 8,224,067 | | | $ | 8,384,429 | |
210,410 | | The TJX Cos., Inc. | | | 12,630,037 | | | | 12,449,960 | |
| | Apparel, Accessories & Luxury
Goods - 3.9% | | | | | |
172,495 | | Carter’s, Inc. | | | 14,012,443 | | | | 13,371,812 | |
99,310 | | Sequential Brands Group, Inc.*,1 | | | 1,282,545 | | | | 1,241,375 | |
246,830 | | VF Corp. | | | 9,327,030 | | | | 16,298,185 | |
| | Auto Parts & Equipment - 0.1% | | | | | |
15,200 | | Motorcar Parts of America, Inc.* | | | 395,200 | | | | 413,592 | |
| | Cable & Satellite - 1.9% | | | | | |
280,535 | | Comcast Corp., Class A | | | 14,541,000 | | | | 15,087,172 | |
| | Footwear - 2.0% | | | | | |
61,250 | | NIKE, Inc., Class B | | | 4,519,809 | | | | 5,463,500 | |
46,455 | | Skechers U.S.A., Inc., Class A* | | | 2,526,140 | | | | 2,476,516 | |
259,490 | | Steven Madden, Ltd.* | | | 8,839,192 | | | | 8,363,363 | |
| | Housewares & Specialties - 2.0% | | | | | |
270,980 | | Jarden Corp.* | | | 11,449,619 | | | | 16,288,608 | |
| | Movies & Entertainment - 2.3% | | | | | |
107,810 | | Regal Entertainment Group, Class A | | | 2,279,225 | | | | 2,143,263 | |
474,035 | | Twenty-First Century Fox, Inc., Class A | | | 16,336,964 | | | | 16,254,660 | |
| | | Restaurants - 2.7% | | | | |
10,147 | | Chipotle Mexican Grill, Inc.* | | | 5,052,212 | | | | 6,763,889 | |
9,850 | | Fiesta Restaurant Group, Inc.* | | | 444,135 | | | | 489,348 | |
109,395 | | Red Robin Gourmet Burgers, Inc.* | | | 6,289,183 | | | | 6,224,576 | |
347,420 | | Sonic Corp.* | | | 7,551,011 | | | | 7,768,311 | |
| | | | | | | | | | |
| | Total Consumer Discretionary | | | 125,699,812 | | | | 139,482,559 | |
| | |
| | This sector is 11.0% above your Fund’s cost. | | | | | |
| |
Consumer Staples | | | | | |
| | Drug Retail - 2.0% | | | | | |
196,050 | | CVS Health Corp. | | | 15,295,384 | | | | 15,603,620 | |
| | Food Retail - 0.7% | | | | | |
394,245 | | Smart & Final Stores, Inc.*,1 | | | 4,799,459 | | | | 5,688,955 | |
| | Hypermarkets & Super
Centers - 2.2% | | | | | |
142,665 | | Costco Wholesale Corp. | | | 16,050,872 | | | | 17,878,778 | |
| | Packaged Foods & Meats - 4.2% | | | | | |
170,115 | | The Hain Celestial Group, Inc.* | | | 14,233,490 | | | | 17,411,270 | |
523,938 | | Pilgrim’s Pride Corp.* | | | 16,475,292 | | | | 16,011,545 | |
| | | | | | | | | | |
| | Total Consumer Staples | | | 66,854,497 | | | | 72,594,168 | |
| | |
| | This sector is 8.6% above your Fund’s cost. | | | | | |
| |
Energy | | | | | |
| | Oil & Gas Exploration & Production -0.9% | | | | | |
133,505 | | Bonanza Creek Energy, Inc.* | | | 7,939,511 | | | | 7,596,435 | |
| | |
| | This sector is 4.3% below your Fund’s cost. | | | | | |
| | | | | | | | | | |
Shares | | | | Cost | | | Value | |
Financials | | | | | |
| | Hotel & Resort REITs - 0.7% | | | | | |
143,240 | | Pebblebrook Hotel Trust | | $ | 5,421,305 | | | $ | 5,348,582 | |
| | Property & Casualty
Insurance - 2.0% | | | | | |
255,075 | | The Allstate Corp. | | | 8,528,764 | | | | 15,653,953 | |
| | Specialized REITs - 1.8% | | | | | |
158,295 | | American Tower Corp. | | | 12,835,835 | | | | 14,821,161 | |
| | | | | | | | | | |
| | Total Financials | | | 26,785,904 | | | | 35,823,696 | |
| | |
| | This sector is 33.7% above your Fund’s cost. | | | | | |
| |
Health Care | | | | | |
| | Biotechnology - 2.4% | | | | | |
200,760 | | Celgene Corp.* | | | 5,208,548 | | | | 19,028,033 | |
| | Health Care Equipment - 2.5% | | | | | |
246,390 | | Medtronic, Inc. | | | 15,109,066 | | | | 15,263,861 | |
129,620 | | NuVasive, Inc.* | | | 4,592,682 | | | | 4,519,849 | |
| | Health Care Technology - 1.3% | | | | | |
170,490 | | Cerner Corp.* | | | 10,002,124 | | | | 10,156,089 | |
| | Managed Health Care - 1.0% | | | | | |
92,640 | | UnitedHealth Group, Inc. | | | 7,152,976 | | | | 7,990,200 | |
| | Pharmaceuticals - 1.1% | | | | | |
245,120 | | Roche Holding AG, Sponsored ADR | | | 8,305,555 | | | | 9,066,989 | |
| | | | | | | | | | |
| | Total Health Care | | | 50,370,951 | | | | 66,025,021 | |
| | |
| | This sector is 31.1% above your Fund’s cost. | | | | | |
Industrials | | | | | |
| | Air Freight & Logistics - 2.3% | | | | | |
491,805 | | XPO Logistics, Inc.*,1 | | | 13,352,600 | | | | 18,526,294 | |
| | Construction & Engineering - 2.0% | | | | | |
417,330 | | Primoris Services Corp. | | | 11,159,468 | | | | 11,201,137 | |
166,830 | | Tutor Perini Corp.* | | | 4,803,200 | | | | 4,404,312 | |
| | Construction Machinery & Heavy Trucks - 7.4% | | | | | |
213,320 | | Allison Transmission Holdings, Inc. | | | 6,268,100 | | | | 6,077,487 | |
232,780 | | The Greenbrier Cos., Inc.1 | | | 11,697,364 | | | | 17,081,396 | |
386,200 | | Trinity Industries, Inc. | | | 11,013,271 | | | | 18,043,264 | |
215,425 | | Wabtec Corp. | | | 5,856,942 | | | | 17,458,042 | |
| | Diversified Support Services - 1.9% | | | | | |
515,270 | | KAR Auction Services, Inc. | | | 16,030,235 | | | | 14,752,180 | |
| | Human Resources & Employment
Services - 0.9% | | | | | |
280,970 | | TriNet Group, Inc.* | | | 5,647,115 | | | | 7,234,977 | |
| | Marine - 0.5% | | | | | |
36,605 | | Kirby Corp.* | | | 4,347,989 | | | | 4,313,899 | |
| | Trading Companies &
Distributors - 3.7% | | | | | |
206,370 | | H&E Equipment Services, Inc. | | | 5,762,139 | | | | 8,312,584 | |
193,290 | | United Rentals, Inc.* | | | 9,971,014 | | | | 21,474,519 | |
|
The accompanying notes are an integral part of these financial statements. 8 |
| | |
| | | AMG Managers Brandywine Fund Schedule of Portfolio Investments (continued) |
| | | | | | | | | | |
Shares | | | | Cost | | | Value | |
Industrials (continued) | | | | | |
| | Trucking - 1.2% | | | | | | | | |
109,695 | | Ryder System, Inc. | | $ | 9,049,018 | | | $ | 9,869,259 | |
| | | | | | | | | | |
| | Total Industrials | | | 114,958,455 | | | | 158,749,350 | |
| | |
| | This sector is 38.1% above your Fund’s cost. | | | | | |
Information Technology | | | | | |
| | Application Software - 2.8% | | | | | |
492,430 | | Synchronoss Technologies, Inc.* | | | 17,344,765 | | | | 22,543,445 | |
| | Communications Equipment - 1.9% | |
776,665 | | Infinera Corp.* | | | 8,560,886 | | | | 8,287,016 | |
511,725 | | Ruckus Wireless, Inc.* | | | 7,157,978 | | | | 6,836,646 | |
| | Data Processing & Outsourced Services - 1.1% | | | | | |
188,590 | | Heartland Payment Systems, Inc. | | | 7,958,167 | | | | 8,999,515 | |
| | Electronic Components - 1.9% | |
781,850 | | Corning, Inc. | | | 16,183,509 | | | | 15,120,979 | |
| | Internet Software &
Services - 5.7% | | | | | |
| | Alibaba Group Holding, Ltd., | | | | | | | | |
166,635 | | Sponsored ADR* | | | 14,960,596 | | | | 14,805,520 | |
298,980 | | Facebook, Inc., Class A* | | | 20,122,098 | | | | 23,631,379 | |
155,406 | | LogMeln, Inc.* | | | 7,172,432 | | | | 7,159,554 | |
| | Semiconductors - 11.2% | | | | | |
288,865 | | Ambarella, Inc.*,1 | | | 8,368,042 | | | | 12,614,735 | |
115,850 | | Avago Technologies, Ltd. | | | 9,825,469 | | | | 10,078,950 | |
613,245 | | Integrated Device Technology, Inc.* | | | 9,947,605 | | | | 9,781,258 | |
64,275 | | Microsemi Corp.* | | | 1,657,675 | | | | 1,633,228 | |
248,035 | | NXP Semiconductors N.V.* | | | 17,578,787 | | | | 16,973,035 | |
211,684 | | Rambus, Inc.* | | | 2,445,744 | | | | 2,641,816 | |
1,713,270 | | RF Micro Devices, Inc.* | | | 16,453,653 | | | | 19,771,136 | |
218,533 | | Synaptics, Inc.* | | | 12,099,344 | | | | 15,996,616 | |
| | Systems Software - 2.1% | | | | | |
306,610 | | Red Hat, Inc.* | | | 14,375,216 | | | | 17,216,152 | |
| | Technology Hardware, Storage &
Peripherals - 6.9% | | | | | |
168,890 | | 3D Systems Corp.*,1 | | | 9,261,176 | | | | 7,831,429 | |
394,748 | | Apple, Inc. | | | 38,128,201 | | | | 39,770,861 | |
124,515 | | QLogic Corp.* | | | 1,182,220 | | | | 1,140,557 | |
106,135 | | Seagate Technology PLC | | | 6,335,339 | | | | 6,078,351 | |
| | | | | | | | | | |
| | Total Information Technology | | | 247,118,902 | | | | 268,912,178 | |
| | |
| | This sector is 8.8% above your Fund’s cost. | | | | | |
Materials | | | | | |
| | Construction Materials - 1.2% | | | | | |
92,875 | | Eagle Materials, Inc. | | | 7,842,187 | | | | 9,457,461 | |
| | Diversified Metals & Mining - 0.8% | | | | | |
367,710 | | Globe Specialty Metals, Inc. | | | 7,544,660 | | | | 6,688,645 | |
| | | | | | | | | | |
| | Total Materials | | | 15,386,847 | | | | 16,146,106 | |
| | |
| | This sector is 4.9% above your Fund’s cost. | | | | | |
| | | | | | | | | | |
Shares | | | | Cost | | | Value | |
Telecommunication Services | | | | | |
| | Wireless Telecommunication Services - 0.9% | | | | | |
67,245 | | SBA Communications Corp., Class A* | | $ | 6,001,361 | | | $ | 7,457,470 | |
| | |
| | This sector is 24.3% above your Fund’s cost. | | | | | |
| | Total Common Stocks | | | 661,116,240 | | | | 772,786,983 | |
| | | |
| | | | | Principal
Amount | | | | |
| Short-Term Investments - 7.6% | |
Commercial Paper - 3.4% | | | | | |
| | Cabot Corp.due 10/01/14, discount of 0.21% | | $ | 12,301,000 | | | | 12,301,000 | |
| | Commonwealth Edison due 10/01/14, discount of 0.20% | | | 8,000,000 | | | | 8,000,000 | |
| | Northwestern Corp. due 10/01/14, discount of 0.22% | | | 6,590,000 | | | | 6,590,000 | |
| | | | | | | | | | |
| | Total Commercial Paper | | | 26,891,000 | | | | 26,891,000 | |
Repurchase Agreements - 4.2%2 | |
| | Barclays Capital, dated 09/30/14, due 10/01/14, 0.010%, total to be received $1,661,919 (collateralized by various U.S. Government Agency Obligations, 1.250% - 3.375%, 01/31/19 - 05/15/44, totaling $1,695,158) | | | 1,661,919 | | | | 1,661,919 | |
| | Citigroup Global Markets, Inc., dated 09/30/14, due 10/01/14, 0.010%,total to be received $7,894,312 (collateralized by various U.S. Government Agency Obligations, 0.000% - 7.000%, 09/01/15 - 09/15/49, totaling $8,052,197) | | | 7,894,310 | | | | 7,894,310 | |
| | Daiwa Capital Markets America, dated 09/30/14, due 10/01/14, 0.010%,total to be received $7,894,312 (collateralized by various U.S. Government Agency Obligations, 0.000% - 11.250%, 10/23/14 - 03/01/48, totaling $8,052,196) | | | 7,894,310 | | | | 7,894,310 | |
|
The accompanying notes are an integral part of these financial statements. 9 |
| | |
| | | AMG Managers Brandywine Fund Schedule of Portfolio Investments (continued) |
| | | | | | | | | | |
| | | | | Principal Amount | | | Value | |
Repurchase Agreements - 4.2% (continued)2 | |
| | | HSBC Securities USA, Inc., dated 09/30/14, due 10/01/14, 0.000%,total to be received $7,894,310 (collateralized by various U.S. Government Agency Obligations, 0.000% - 9.375%, 10/15/14 - 07/15/32, totaling $8,052,225) | | $ | 7,894,310 | | | $ | 7,894,310 | |
| | Mizuho Securities USA, Inc., dated 09/30/14, due 10/01/14, 0.010%,total to be received $7,894,312 (collateralized by various U.S. Government Agency Obligations, 0.000% - 9.000%, 03/12/15 - 06/20/44, totaling $8,052,201) | | | 7,894,310 | | | | 7,894,310 | |
| | | | | | | | | | |
| | Total Repurchase Agreements | | | 33,239,159 | | | | 33,239,159 | |
| | | | | | | | | | |
Shares | | | | Cost | | | Value | |
Other Investment Companies - 0.0%#,3 | |
| 332,004 | | Dreyfus Institutional Cash Advantage Fund, Institutional Class Shares, 0.06% | | $ | 332,004 | | | $ | 332,004 | |
| | | | | | | | | | |
| | Total Short-Term Investments | | | 60,462,163 | | | | 60,462,163 | |
| | | |
| | Total Investments - 104.3% | | $ | 721,578,403 | | | | 833,249,146 | |
| | | | | | | | | | |
| | Other Assets, less Liabilities - (4.3)% | | | | | | | (34,204,607 | ) |
| | | |
| | Total Net Assets - 100.0% | | | | | | $ | 799,044,539 | |
| | | | | | | | | | |
|
The accompanying notes are an integral part of these financial statements. 10 |
| | |
| | | AMG Managers Brandywine Blue Fund Portfolio Manager’s Comments |
Despite macro forces ranging from minor distractions to major disruptions in the 12 months ended September 30, 2014, stocks maintained a positive bias throughout AMG Managers Brandywine Blue Fund’s (“Brandywine Blue”) fiscal year.
While Brandywine Blue’s benchmark, the Russell 1000® Growth Index, demonstrated consistency with four consecutive quarters of positive returns, investor sentiment fluctuated with events that unfolded at different times in the fiscal year.
Measured by share price performance, the December quarter (the first quarter of the fiscal year) marked the fiscal year’s high point in terms of investor enthusiasm. The final three months of 2013 closed out a calendar year in which most major large-cap indices posted returns that rivaled their best year during the late-1990s technology boom.
Spirits were high as the U.S. Federal Reserve’s (the Fed) expanded bond-buying program approached its first anniversary amid signs of renewed life in the economy. As the launch of aspects of the Affordable Care Act brought attention to the sector, health care holdings helped Brandywine Blue generate a strong December-quarter return. Although the Fund also benefited from technology holdings, the portfolio’s position was smaller than the benchmark’s in a period when technology outperformed all other sectors within the index.
Given its earnings-driven investment strategy, Brandywine Blue seemed well-positioned at the start of the March quarter as economic optimism favored companies with promising earnings outlooks. The Fund’s investment strategy isolated
the largest concentration of earnings strength among consumer discretionary companies.
Weather emerged as an economic spoiler, with record-setting snowfall creating major hurdles for businesses and consumers alike. Companies sensitive to consumer discretion were among the poorest performers during the March quarter as investors questioned the strength of consumer spending amid unwelcoming weather conditions. Detractors included GameStop Corp. and LKQ Corp.
The June quarter was noteworthy for its calm. Stock market volatility dropped to levels not recorded since the 1990s. Brandywine Blue’s performance improved markedly relative to the March quarter.
Consumer discretionary companies, which detracted from relative performance in the previous quarter, were the strongest contributors to relative results in the June quarter. Contributors included TripAdvisor and Chipotle Mexican Grill. At the other end of the spectrum, Brandywine Blue held no energy companies due to a lack of earnings strength in the sector. That became a relative performance detractor when hostile forces unexpectedly overtook Iraq’s second largest city, causing oil prices to jump and sparking interest in energy companies.
The September quarter (the final quarter of the fiscal year) seemed like a period primed for some sort of macro-driven volatility. Having alluded to it throughout the year, the Fed announced a hard target, October, to bring an end to its long-running stimulus. Investors demonstrated numerous times that potential for higher interest rates ranks above
virtually all else in dictating the market’s mood in the current climate.
While the Fed did commit to discontinuing its monthly bond-buying program, it stated that considerable time would likely pass before it moved to raise interest rates. That was enough to keep multiple threats from rattling the market. Menacing tension between Ukraine and Russia, U.S. airstrikes in the Middle East and signs of softening Chinese demand were highlights among developments with potential to stifle stock prices. Instead, the stock market managed another modest quarterly gain.
Holdings from the financial and consumer staples sectors contributed the most to Brandywine Blue’s performance versus the benchmark. Holdings from the health care and technology sectors were negative influences on relative results.
Brandywine Blue grew 11.66 percent for the 12 months ended September 30, 2014. The Russell 1000® Growth Index gained 19.15 percent during that time.
Micron Technology, Under Armour, Apple and Gilead Sciences contributed the most to the portfolio’s fiscal-year performance. The most significant performance detractors were FireEye, Nu Skin Enterprises, GameStop Corp. and LKQ Corp.
This commentary reflects the viewpoints of Friess Associates, LLC as of September 30, 2014 and is not intended as a forecast or guarantee of future results.
| | |
| | | AMG Managers Brandywine Blue Fund Portfolio Manager’s Comments (continued) |
CUMULATIVE TOTAL RETURN PERFORMANCE
AMG Managers Brandywine Blue Fund’s cumulative total return is based on the daily change in net asset value (NAV), and assumes that all dividends and distributions were reinvested. This graph compares a hypothetical $10,000 investment made in the AMG Managers Brandywine Blue Fund on September 30, 2004 to a $10,000 investment made in the Russell 1000® Growth Index, Russell 1000® Index and S&P 500® Index for the same time period. The graph and table do not reflect the deduction of taxes that a shareholder would pay on a Fund distribution or redemption of shares. The listed returns for the Fund are net of expenses and the returns for the index exclude expenses.

The table below shows the average annual total returns for the AMG Managers Brandywine Blue Fund and the Russell 1000® Growth Index, Russell 1000® Index and S&P 500® Index for the same time periods ended September 30, 2014.
| | | | | | | | | | | | |
| Average Annual Total Returns1 | | One
Year | | | Five
Years | | | Ten
Years | |
AMG Managers Brandywine Blue Fund2 | | | 11.66 | % | | | 10.22 | % | | | 4.77 | % |
Russell 1000® Growth Index3 | | | 19.15 | % | | | 16.50 | % | | | 8.94 | % |
Russell 1000® Index4 | | | 19.01 | % | | | 15.90 | % | | | 8.46 | % |
S&P 500® Index5 | | | 19.73 | % | | | 15.70 | % | | | 8.11 | % |
The performance data shown represents past performance. Past performance is not a guarantee of future results. Current performance may be lower or higher than the performance data quoted. The investment return and principal value of an investment in the Fund will fluctuate so that an investor’s shares, when redeemed, may be worth more or less than their original cost.
Investors should carefully consider the Fund’s investment objectives, risks, charges, and expenses before investing. For performance information through the most recent month end, current net asset values per share for the Fund and other information, please call (800) 835-3879 or visit our website at www.amgfunds.com for a free prospectus. Read it carefully before investing or sending money.
Distributed by AMG Distributors, Inc., member FINRA.
| 1 | Total return equals income yield plus share price change and assumes reinvestment of all dividends and capital gain distributions. Returns are net of fees and may reflect offsets of Fund expenses as described in the Prospectus. No adjustment has been made for taxes payable by shareholders on their reinvested dividends and capital gain distributions. Returns for periods greater than one year are annualized. The listed returns on the Fund are net of expenses and based on the published NAV as of September 30, 2014. All returns are in U.S. dollars ($). |
| 2 | The Fund inception dates and returns for all periods prior to October 1, 2013, reflect performance of the Predecessor Fund, Brandywine Blue Fund, and was managed by Friess Associates, LLC with the same investment objective and substantially similar investment policies. |
| 3 | The Russell 1000® Growth Index is a market capitalization weighted index that measures the performance of those Russell 1000® companies with higher price-to-book ratio and higher forecasted growth values. Unlike the Fund, the Russell 1000® Growth Index is unmanaged, is not available for investment and does not incur expenses. |
| 4 | The Russell 1000® Index measures the performance of approximately 1,000 of the largest securities based on a combination of their market cap and current index membership. The Russell 1000® Index represents approximately 92% of the U.S. market. Unlike the Fund, the Russell 1000® Index is unmanaged, is not available for investment and does not incur expenses. |
| 5 | The S&P 500® Index is a capitalization-weighted index of 500 stocks. The S&P 500® Index is designed to measure performance of the broad domestic economy through changes in the aggregate market value of 500 stocks representing all major industries. Unlike the Fund, the S&P 500® Index is unmanaged, is not available for investment and does not incur expenses. |
The Russell 1000® Growth Index and Russell 1000® Index are registered trademarks of Russell Investments. Russell® is a trademark of Russell Investments.
The S&P 500® Index is proprietary data of Standard & Poor’s, a division of McGraw-Hill Companies, Inc. All rights reserved.
Not FDIC insured, nor bank guaranteed. May lose value.
| | |
| | | AMG Managers Brandywine Blue Fund Fund Snapshots (unaudited) September 30, 2014 |
PORTFOLIO BREAKDOWN
| | | | | | | | | | | | | | | | |
Industry (Top Ten) | | AMG
Managers
Brandywine
Blue
Fund** | | | Russell
1000®
Growth
Index | | | Russell
1000®
Index | | | S&P 500®
Index | |
Biotechnology | | | 4.3 | % | | | 5.6 | % | | | 2.9 | % | | | 2.9 | % |
Construction Machinery & Heavy Trucks | | | 3.7 | % | | | 0.2 | % | | | 0.2 | % | | | 0.1 | % |
Drug Retail | | | 3.4 | % | | | 3.8 | % | | | 5.6 | % | | | 6.2 | % |
Cable & Satellite | | | 3.2 | % | | | 0.0 | % | | | 0.0 | % | | | 0.0 | % |
Apparel Retail | | | 3.1 | % | | | 3.7 | % | | | 2.2 | % | | | 2.1 | % |
Apparel, Accessories & Luxury Goods | | | 3.1 | % | | | 1.6 | % | | | 0.8 | % | | | 0.8 | % |
Construction Materials | | | 2.9 | % | | | 0.1 | % | | | 0.1 | % | | | 0.1 | % |
Electronic Components | | | 2.7 | % | | | 0.4 | % | | | 0.5 | % | | | 0.4 | % |
Airlines | | | 2.4 | % | | | 0.8 | % | | | 0.6 | % | | | 0.3 | % |
Footwear | | | 1.9 | % | | | 0.0 | % | | | 0.0 | % | | | 0.0 | % |
Cash & Cash Equivalent | | | 3.1 | % | | | 0.0 | % | | | 0.0 | % | | | 0.0 | % |
Other Assets and Liabilities | | | 66.2 | % | | | 83.8 | % | | | 87.1 | % | | | 87.1 | % |
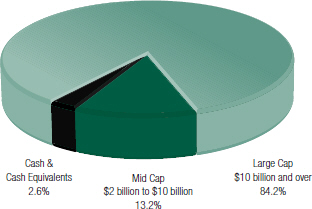
PORTFOLIO MARKET CAPITALIZATION
TOP TEN HOLDINGS
| | | | | | | | |
Security Name | | % of
Net Assets | | | % Change from
Book Cost | |
Apple, Inc.* | | | 5.8 | % | | | 23.1 | % |
Celgene Corp.* | | | 4.3 | | | | 265.3 | |
Wabtec Corp.* | | | 3.8 | | | | 18.7 | |
American Tower Corp.* | | | 3.7 | | | | 12.7 | |
The Allstate Corp. | | | 3.5 | | | | 80.6 | |
Cerner Corp. | | | 3.4 | | | | 1.8 | |
Costco Wholesale Corp. | | | 3.4 | | | | 11.8 | |
Marsh & McLennan Cos., Inc.* | | | 3.4 | | | | 61.6 | |
CVS Health Corp. | | | 3.4 | | | | 3.2 | |
First Solar, Inc. | | | 3.3 | | | | 1.2 | |
| | | | | | | | |
Top Ten as a Group | | | 38.0 | % | | | | |
| | | | | | | | |
| * | Also Top Ten Holding as June 30, 2014. |
ESTIMATED EARNINGS GROWTH RATE
OF THE FUND’S INVESTMENTS
Forecasted Increase in Earnings Per Share 2015 vs 2014
Source: Consensus estimates from FactSet Research Systems Inc.
This is not a forecast of the Fund’s future performance. Earnings growth for a Fund holding does not guarantee a corresponding increase in the market value of the holding or the Fund. As of September 30, 2014, the S&P 500® Index’s average annual total returns for 1, 5 and 10 years were 19.73, 15.70 and 8.11 percent, respectively.
Because a fund’s strategy may result in multiple investments in particular sectors of the economy, its performance may depend on the performance of those sectors and may fluctuate more widely than investments diversified across more sectors. For additional information on these and other risk considerations, please see the Fund’s prospectus.
Any sectors, industries, or securities discussed should not be perceived as investment recommendations. Mention of a specific security should not be considered a recommendation to buy or solicitation to sell that security. Specific securities mentioned in this report may have been sold from the Fund’s portfolio of investments by the time you receive this report.
| | |
| | | AMG Managers Brandywine Blue Fund Roses and Thorns (unaudited) Quarter Ending September 30, 2014 |
| | | | | | |
$ Gain
(in millions) | | % Gain | | Biggest $ Winners | | Reason for Move |
| | | | Facebook Inc. | | |
$1.0 | | 17.5 | | The provider of a social networking platform grew June-quarter earnings 121 percent, beating the consensus estimate. Results were driven by a sharp increase in advertising revenue. More agencies turned to Facebook for targeted marketing, which has a higher return on investment for the advertiser and higher profit margins for Facebook. Management increased revenue and earnings guidance for 2014 and 2015. |
| | | |
| | | | Chipotle Mexican Grill Inc. | | |
$1.0 | | 13.0 | | The operator of fast-casual Mexican restaurants grew June-quarter earnings 24 percent, beating estimates by 13 percent. Same store sales jumped 17 percent, driven by a 12 percent increase in traffic. Strategies related to improved work flow activities, enhanced marketing and expanding the company’s catering services helped boost profitability. |
| | | |
| | | | Apple Inc. | | |
$0.9 | | 8.1 | | The maker of personal computers, software and mobile computing devices grew June-quarter earnings 20 percent, topping expectations. Better-than-expected profit margins helped drive strong earnings. Shares gained ground in the September quarter, during which the company unveiled new products and technologies, including the iPhone 6, ApplePay and iWatch. |
| | | |
| | | | Celgene Corp. | | |
$0.9 | | 10.4 | | The global biopharmaceutical company focused on discovery, development and sale of therapies designed to treat cancer and immune-inflammatory related diseases grew June-quarter earnings 18 percent, beating the consensus estimate. Shares gained ground in the September quarter as investors grew increasingly confident in the potential for Celgene’s Crohn’s disease treatment. Celgene also benefitted from strong sales related to cancer treatments. |
| | | |
| | | | Nike Inc. | | |
$0.6 | | 9.2 | | The maker of footwear, apparel, equipment and accessories grew August-quarter earnings 26 percent, beating estimates by 24 percent. Merchandising and store initiatives surpassed expectations. Nike continued to capture market share at an elevated rate globally, which we believe positions the company for solid long-term revenue growth. |
| | | |
$ Loss
(in millions) | | % Loss | | Biggest $ Losers | | Reason for Move |
| | | | Salesforce.com Inc. | | |
$0.6 | | 8.2 | | The provider of enterprise cloud computing applications grew July-quarter earnings 44 percent, beating consensus expectations by 9 percent. Revenue jumped 38 percent, also ahead of estimates. Despite the strong results, shares came under pressure as investors grew concerned that new business awards from larger clients were slowing. We sold salesforce.com, Inc. during the September quarter to fund an idea with better near-term earnings visibility. |
| | | |
| | | | SanDisk Corp. | | |
$0.8 | | 13.2 | | The world’s largest supplier of flash memory data storage products grew June-quarter earnings 17 percent, beating the consensus estimate. Shares fell after management’s prediction that supply constraints and the company’s product mix would keep profit margins at current levels fueled concerns regarding weaker memory pricing in general. We sold SanDisk during the September quarter. |
| | | |
| | | | Corning Inc. | | |
$0.8 | | 11.9 | | The diversified manufacturer of technology-based products grew June-quarter earnings 16 percent. Shares came under pressure during the quarter due to softness in the company’s tablet and touch notebook end markets. We continue to hold Corning shares, encouraged by the adoption of its Gorilla Glass among electronic device manufacturers. |
| | | |
| | | | American Airlines Group Inc. | | |
$1.1 | | 17.4 | | The holding company for American Airlines and US Airways grew June-quarter earnings to $1.98 per share from $0.93 a year ago, topping expectations. The company, which continues to make progress integrating its two legacy airlines, also announced it would be purchasing its own stock earlier than expected. Shares declined in the September quarter due to concerns of declining travel to Eastern Europe and a weakness in the Venezuelan market. |
| | | |
| | | | 3D Systems Corp. | | |
$1.2 | | 17.2 | | Shares of the developer and manufacturer of 3D printers declined during the September quarter as revenue from new products was accompanied by higher costs, creating profit-margin pressure. We sold 3D Systems to fund an idea with better near-term earnings visibility. |
All gains/losses are calculated on an average cost basis from June 30, 2014 through September 30, 2014.
This commentary reflects the viewpoints of Friess Associates, LLC as of September 30, 2014 and is not intended as a forecast or guarantee of future results.
| | |
| | | AMG Managers Brandywine Blue Fund Schedule of Portfolio Investments September 30, 2014 |
| | | | | | | | | | | | |
Shares | | | | | Cost | | | Value | |
| Common Stocks - 97.9% | | | | | |
| Consumer Discretionary | | | | | | | | |
| | | | Apparel Retail - 3.1% | | | | | |
| | 115,000 | | | The TJX Cos., Inc. | | $ | 6,925,909 | | | $ | 6,804,550 | |
| | | | Apparel, Accessories & Luxury Goods - 3.1% | |
| | 101,000 | | | VF Corp. | | | 4,233,671 | | | | 6,669,030 | |
| | | | Cable & Satellite - 3.2% | | | | | |
| | 127,700 | | | Comcast Corp., Class A | | | 6,602,704 | | | | 6,867,706 | |
| | | | Footwear - 1.9% | | | | | |
| | 46,895 | | | NIKE, Inc., Class B | | | 3,561,526 | | | | 4,183,034 | |
| | | | Movies & Entertainment - 2.7% | | | | | |
| | 168,560 | | | Twenty-First Century Fox, Inc., Class A | | | 5,871,278 | | | | 5,779,922 | |
| | | | Restaurants - 6.1% | | | | | |
| | 9,065 | | | Chipotle Mexican Grill, Inc.* | | | 4,548,888 | | | | 6,042,638 | |
| | 93,300 | | | Starbucks Corp. | | | 6,871,560 | | | | 7,040,418 | |
| | | | | | | | | | | | |
| | | | Total Consumer Discretionary | | | 38,615,536 | | | | 43,387,298 | |
| | |
| | | | This sector is 12.4% above your Fund’s cost. | | | | | |
|
| Consumer Staples | |
| | | | Drug Retail - 3.4% | | | | | |
| | 92,000 | | | CVS Health Corp. | | | 7,098,323 | | | | 7,322,280 | |
| | | | Hypermarkets & Super Centers - 3.4% | |
| | 59,410 | | | Costco Wholesale Corp. | | | 6,659,410 | | | | 7,445,261 | |
| | | | Packaged Foods & Meats - 2.8% | |
| | 196,365 | | | Pilgrim’s Pride Corp.* | | | 6,189,341 | | | | 6,000,914 | |
| | | | | | | | | | | | |
| | | | Total Consumer Staples | | | 19,947,074 | | | | 20,768,455 | |
| | |
| | | | This sector is 4.1% above your Fund’s cost. | | | | | |
|
| Energy | |
| | | | Oil & Gas Equipment & Services - 2.5% | |
| | 260,000 | | | Weatherford International PLC* | | | 5,870,696 | | | | 5,408,000 | |
| | |
| | | | This sector is 7.9% below your Fund’s cost. | | | | | |
|
| Financials | |
| | | | Insurance Brokers - 3.4% | | | | | |
| | 142,165 | | | Marsh & McLennan Cos., Inc. | | | 4,604,952 | | | | 7,440,916 | |
| | | | Property & Casualty Insurance - 3.5% | |
| | 122,120 | | | The Allstate Corp. | | | 4,149,281 | | | | 7,494,504 | |
| | | | Specialized REITs - 3.7% | | | | | |
| | 85,630 | | | American Tower Corp. | | | 7,114,488 | | | | 8,017,537 | |
| | | | | | | | | | | | |
| | | | Total Financials | | | 15,868,721 | | | | 22,952,957 | |
| | |
| | | | This sector is 44.6% above your Fund’s cost. | | | | | |
|
| Health Care | |
| | | | Biotechnology - 4.3% | | | | | |
| | 97,840 | | | Celgene Corp.* | | | 2,538,376 | | | | 9,273,275 | |
| | | | | | | | | | | | |
Shares | | | | | Cost | | | Value | |
| | | | Health Care Equipment - 2.5% | | | | | |
| | 87,995 | | | Medtronic, Inc. | | $ | 5,396,966 | | | $ | 5,451,290 | |
| | | | Health Care Technology - 3.5% | | | | | |
| | 125,000 | | | Cerner Corp.* | | | 7,317,783 | | | | 7,446,250 | |
| | | | Pharmaceuticals - 4.2% | | | | | |
| | 83,160 | | | AbbVie, Inc. | | | 4,184,476 | | | | 4,803,322 | |
| | 117,560 | | | Roche Holding AG, Sponsored ADR | | | 4,167,878 | | | | 4,348,544 | |
| | | | | | | | | | | | |
| | | | Total Health Care | | | 23,605,479 | | | | 31,322,681 | |
| | |
| | | | This sector is 32.7% above your Fund’s cost. | | | | | |
|
| Industrials | |
| | | | Airlines - 2.4% | | | | | |
| | 144,635 | | | American Airlines Group, Inc. | | | 4,872,753 | | | | 5,131,650 | |
| | | | Construction Machinery & Heavy Trucks - 3.7% | |
| | 100,000 | | | Wabtec Corp. | | | 6,825,428 | | | | 8,104,000 | |
| | | | Marine - 0.6% | | | | | |
| | 10,255 | | | Kirby Corp.* | | | 1,218,298 | | | | 1,208,552 | |
| | | | | | | | | | | | |
| | | | Total Industrials | | | 12,916,479 | | | | 14,444,202 | |
| | |
| | | | This sector is 11.8% above your Fund’s cost. | | | | | |
|
| Information Technology | |
| | | | Electronic Components - 2.7% | | | | | |
| | 303,470 | | | Corning, Inc. | | | 5,980,402 | | | | 5,869,110 | |
| | | | Internet Software & Services - 5.1% | |
| | 45,215 | | | Alibaba Group Holding, Ltd., Sponsored ADR*,1 | | | 4,059,434 | | | | 4,017,353 | |
| | 87,665 | | | Facebook, Inc., Class A* | | | 5,902,511 | | | | 6,929,042 | |
| | | | Semiconductors - 8.6% | | | | | |
| | 57,835 | | | Avago Technologies, Ltd. | | | 4,870,315 | | | | 5,031,645 | |
| | 107,550 | | | First Solar, Inc.* | | | 6,995,806 | | | | 7,077,866 | |
| | 95,000 | | | NXP Semiconductors N.V.* | | | 6,656,997 | | | | 6,500,850 | |
| | | | Systems Software - 3.1% | | | | | |
| | 121,360 | | | Red Hat, Inc.* | | | 5,725,162 | | | | 6,814,364 | |
| | | | Technology Hardware, Storage &
Peripherals - 8.4% | |
| | 125,000 | | | Apple, Inc. | | | 10,230,632 | | | | 12,593,750 | |
| | 95,815 | | | Seagate Technology PLC | | | 5,694,927 | | | | 5,487,325 | |
| | | | | | | | | | | | |
| | | | Total Information Technology | | | 56,116,186 | | | | 60,321,305 | |
| | |
| | | | This sector is 7.5% above your Fund’s cost. | | | | | |
|
| Materials | |
| | | | Construction Materials - 2.9% | |
| | 103,910 | | | Vulcan Materials Co. | | | 6,610,265 | | | | 6,258,499 | |
| | |
| | | | This sector is 5.3% below your Fund’s cost. | | | | | |
|
The accompanying notes are an integral part of these financial statements. 15 |
| | |
| | | AMG Managers Brandywine Blue Fund Schedule of Portfolio Investments (continued) |
| | | | | | | | | | |
Shares | | | | Cost | | | Value | |
Telecommunication Services | | | | | | | | |
| | Wireless Telecommunication
Services - 3.1% | | | | | |
59,235 | | SBA Communications Corp., Class A* | | $ | 5,246,529 | | | $ | 6,569,162 | |
| | |
| | This sector is 25.2% above your Fund’s cost. | | | | | |
| | | |
| | Total Common Stocks | | | 184,796,965 | | | | 211,432,559 | |
| | | |
| | | | | Principal
Amount | | | | |
Short-Term Investments - 3.1% | | | | | | | | |
Commercial Paper - 3.0% | | | | | | | | |
| | Northwestern Corp. due 10/01/14, discount of 0.22% | | $ | 6,500,000 | | | | 6,500,000 | |
Repurchase Agreements - 0.0%#,2 | | | | | |
| | Daiwa Capital Markets America, dated 09/30/14, due 10/01/14, 0.010%, total to be received $90,750 (collateralized by various U.S. Government Agency Obligations, 0.000% - 11.250%, 10/23/14 - 03/01/48, totaling $92,565) | | | 90,750 | | | | 90,750 | |
| | | | | | | | | | |
Shares | | | | Cost | | | Value | |
Other Investment Companies - 0.1%3 | | | | | |
102,902 | | Dreyfus Institutional Cash Advantage Fund, Institutional Class Shares, 0.06% | | $ | 102,902 | | | $ | 102,902 | |
| | | | | | | | | | |
| | Total Short-Term Investments | | | 6,693,652 | | | | 6,693,652 | |
| | Total Investments - 101.0% | | $ | 191,490,617 | | | | 218,126,211 | |
| | | | | | | | | | |
Other Assets, less Liabilities - (1.0)% | | | | (2,185,654 | ) |
| | Total Net Assets - 100.0% | | | | | | $ | 215,940,557 | |
| | | | | | | | | | |
|
The accompanying notes are an integral part of these financial statements. 16 |
| | |
| | | Notes to Schedules of Portfolio Investments |
The following footnotes and abbreviations should be read in conjunction with each of the Schedules of Portfolio Investments previously presented in this report. At September 30, 2014, the approximate cost of investments for federal income tax purposes and the aggregate gross unrealized appreciation and/or depreciation based on tax cost were as follows:
| | | | | | | | | | | | | | | | |
| Fund | | Cost | | | Appreciation | | | Depreciation | | | Net | |
AMG Managers Brandywine Fund | | $ | 721,794,328 | | | $ | 121,185,695 | | | $ | (9,730,877 | ) | | $ | 111,454,818 | |
AMG Managers Brandywine Blue Fund | | | 191,499,405 | | | | 28,369,278 | | | | (1,742,472 | ) | | | 26,626,806 | |
| * | Non-income producing security. |
| # | Rounds to less than 0.1%. |
| 1 | Some or all of these shares were out on loan to various brokers as of September 30, 2014, amounting to the following: |
| | | | | | | | |
| Fund | | Market Value | | | % of Net Assets | |
AMG Managers Brandywine Fund | | $ | 32,476,913 | | | | 4.1 | % |
AMG Managers Brandywine Blue Fund | | | 88,750 | | | | 0.04 | % |
| 2 | Collateral received from brokers for securities lending was invested in these short-term investments. |
| 3 | Yield shown represents the September 30, 2014, seven-day average yield, which refers to the sum of the previous seven days’ dividends paid, expressed as an annual percentage. |
The following tables summarizes the inputs used to value the Funds’ net assets by the fair value hierarchy levels as of September 30, 2014. (See Note 1(a) in the Notes to Financial Statements.)
| | | | | | | | | | | | | | | | |
| | | Quoted Prices in Active
Markets for Identical
Investments Level 1 | | | Significant Other
Observable
Inputs Level 2 | | | Significant
Unobservable
Inputs Level 3 | | | Total | |
AMG Managers Brandywine Fund | | | | | | | | | | | | | | | | |
Investments in Securities | | | | | | | | | | | | | | | | |
Common Stocks† | | $ | 772,786,983 | | | | — | | | | — | | | $ | 772,786,983 | |
Short-Term Investments | | | | | | | | | | | | | | | | |
Commercial Paper | | | — | | | $ | 26,891,000 | | | | — | | | | 26,891,000 | |
Repurchase Agreements | | | — | | | | 33,239,159 | | | | — | | | | 33,239,159 | |
Other Investment Companies | | | 332,004 | | | | — | | | | — | | | | 332,004 | |
| | | | | | | | | | | | | | | | |
Total Investments in Securities | | $ | 773,118,987 | | | $ | 60,130,159 | | | | — | | | $ | 833,249,146 | |
| | | | | | | | | | | | | | | | |
|
The accompanying notes are an integral part of these financial statements. 17 |
| | |
| | | Notes to Schedules of Portfolio Investments (continued) |
| | | | | | | | | | | | | | | | |
| | | Quoted Prices in Active
Markets for Identical
Investments Level 1 | | | Significant Other
Observable Inputs
Level 2 | | | Significant
Unobservable
Inputs Level 3 | | | Total | |
AMG Managers Brandywine Blue Fund | | | | | | | | | | | | | | | | |
Investments in Securities | | | | | | | | | | | | | | | | |
Common Stocks† | | $ | 211,432,559 | | | | — | | | | — | | | $ | 211,432,559 | |
Short-Term Investments | | | | | | | | | | | | | | | | |
Commercial Paper | | | — | | | $ | 6,500,000 | | | | — | | | | 6,500,000 | |
Repurchase Agreements | | | — | | | | 90,750 | | | | — | | | | 90,750 | |
Other Investment Companies | | | 102,902 | | | | — | | | | — | | | | 102,902 | |
| | | | | | | | | | | | | | | | |
Total Investments in Securities | | $ | 211,535,461 | | | $ | 6,590,750 | | | | — | | | $ | 218,126,211 | |
| | | | | | | | | | | | | | | | |
| † | All common stocks held in the Funds are Level 1 securities. For a detailed breakout of the common stocks by major industry classification, please refer to the respective Schedule of Portfolio Investments. |
As of September 30, 2014, the Funds had no transfers between levels from the beginning of the reporting period.
INVESTMENT DEFINITIONS AND ABBREVIATIONS:
ADR: ADR after the name of a holding stands for American Depositary Receipt, representing ownership of foreign securities on deposit with a domestic custodian bank. The value of the ADR securities is determined or significantly influenced by trading on exchanges not located in the United States or Canada. Sponsored ADRs are initiated by the underlying foreign company.
|
The accompanying notes are an integral part of these financial statements. 18 |
| | |
| | | Statement of Assets and Liabilities September 30, 2014 |
| | | | | | | | |
| | | AMG Managers
Brandywine Fund | | | AMG Managers
Brandywine Blue
Fund | |
Assets: | | | | | | | | |
Investments at value* (including securities on loan valued at $32,476,913 and $88,750, respectively) | | $ | 833,249,146 | | | $ | 218,126,211 | |
Receivable for investments sold | | | 10,317,243 | | | | — | |
Dividends, interest and other receivables | | | 789,226 | | | | 136,771 | |
Receivable for Fund shares sold | | | 14,958 | | | | 11,666 | |
Prepaid expenses | | | 4,358 | | | | 756 | |
Receivable from affiliate | | | — | | | | 5,198 | |
| | | | | | | | |
Total assets | | | 844,374,931 | | | | 218,280,602 | |
| | | | | | | | |
Liabilities: | | | | | | | | |
Payable upon return of securities loaned | | | 33,239,159 | | | | 90,750 | |
Payable for investments purchased | | | 10,365,164 | | | | 1,218,298 | |
Payable for Fund shares repurchased | | | 861,613 | | | | 744,935 | |
Accrued expenses: | | | | | | | | |
Investment advisory and management fees | | | 673,050 | | | | 183,363 | |
Shareholder servicing fees | | | 51,596 | | | | — | |
Administrative fees | | | 20,087 | | | | 8,839 | |
Trustees fees and expenses | | | 9,027 | | | | 3,434 | |
Other | | | 110,696 | | | | 90,426 | |
| | | | | | | | |
Total liabilities | | | 45,330,392 | | | | 2,340,045 | |
| | | | | | | | |
Net Assets | | $ | 799,044,539 | | | $ | 215,940,557 | |
| | | | | | | | |
Net Assets Represent: | | | | | | | | |
Paid-in capital | | $ | 1,339,698,150 | | | $ | 1,212,865,182 | |
Undistributed net investment loss | | | (2,364,460 | ) | | | (319,569 | ) |
Accumulated net realized loss from investments | | | (649,959,894 | ) | | | (1,023,240,650 | ) |
Net unrealized appreciation of investments | | | 111,670,743 | | | | 26,635,594 | |
| | | | | | | | |
Net Assets | | $ | 799,044,539 | | | $ | 215,940,557 | |
| | | | | | | | |
Shares outstanding | | | 24,029,752 | | | | 6,444,519 | |
| | | | | | | | |
Net asset value, offering and redemption price per share | | $ | 33.25 | | | $ | 33.51 | |
| | | | | | | | |
* Investments at cost | | $ | 721,578,403 | | | $ | 191,490,617 | |
|
The accompanying notes are an integral part of these financial statements. 19 |
| | |
| | | Statement of Operations For the fiscal year ended September 30, 2014 |
| | | | | | | | |
| | | AMG Managers
Brandywine Fund | | | AMG Managers
Brandywine Blue
Fund | |
Investment Income: | | | | | | | | |
Dividend income | | $ | 5,272,986 | | | $ | 2,589,058 | |
Securities lending income | | | 732,390 | | | | 82,585 | |
Interest income | | | 29,062 | | | | 16,113 | |
Foreign withholding tax | | | (95,915 | ) | | | (13,704 | ) |
| | | | | | | | |
Total investment income | | | 5,938,523 | | | | 2,674,052 | |
| | | | | | | | |
Expenses: | | | | | | | | |
Investment advisory and management fees | | | 8,201,360 | | | | 2,479,614 | |
Administrative fees | | | 206,712 | | | | 77,073 | |
Shareholder servicing fees | | | 164,520 | | | | 173,910 | |
Transfer agent | | | 139,492 | | | | 11,889 | |
Reports to shareholders | | | 75,630 | | | | 88,809 | |
Custodian | | | 72,765 | | | | 25,300 | |
Professional fees | | | 51,665 | | | | 31,346 | |
Trustees fees and expenses | | | 33,516 | | | | 10,974 | |
Registration fees | | | 31,868 | | | | 38,782 | |
Miscellaneous | | | 15,054 | | | | 5,052 | |
| | | | | | | | |
Total expenses | | | 8,992,582 | | | | 2,942,749 | |
| | | | | | | | |
Net investment loss | | | (3,054,059 | ) | | | (268,697 | ) |
| | | | | | | | |
Net Realized and Unrealized Gain (Loss): | | | | | | | | |
Net realized gain on investments | | | 136,874,008 | | | | 49,369,990 | |
Net change in unrealized appreciation (depreciation) of investments | | | (13,784,277 | ) | | | (21,262,048 | ) |
| | | | | | | | |
Net realized and unrealized gain | | | 123,089,731 | | | | 28,107,942 | |
| | | | | | | | |
Net increase in net assets resulting from operations | | $ | 120,035,672 | | | $ | 27,839,245 | |
| | | | | | | | |
|
The accompanying notes are an integral part of these financial statements. 20 |
| | |
| | | Statements of Changes in Net Assets For the fiscal years ended September 30, |
| | | | | | | | | | | | | | | | |
| | | AMG Managers
Brandywine Fund | | | AMG Managers
Brandywine Blue Fund | |
| | | 2014 | | | 2013 | | | 2014 | | | 2013 | |
Increase (Decrease) in Net Assets From Operations: | | | | | | | | | | | | | | | | |
Net investment income (loss) | | $ | (3,054,059 | ) | | $ | (1,068,400 | ) | | $ | (268,697 | ) | | $ | 1,946,441 | |
Net realized gain on investments | | | 136,874,008 | | | | 145,947,216 | | | | 49,369,990 | | | | 104,298,858 | |
Net change in unrealized appreciation (depreciation) of investments | | | (13,784,277 | ) | | | (23,872,113 | ) | | | (21,262,048 | ) | | | (37,743,866 | ) |
| | | | | | | | | | | | | | | | |
Net increase in net assets resulting from operations | | | 120,035,672 | | | | 121,006,703 | | | | 27,839,245 | | | | 68,501,433 | |
| | | | | | | | | | | | | | | | |
Capital Share Transactions: | | | | | | | | | | | | | | | | |
Proceeds from sale of shares | | | 4,928,378 | | | | 9,111,537 | | | | 10,719,994 | | | | 44,927,307 | |
Cost of shares repurchased | | | (142,141,834 | ) | | | (376,439,668 | ) | | | (101,238,732 | ) | | | (462,430,622 | ) |
| | | | | | | | | | | | | | | | |
Net decrease from capital share transactions | | | (137,213,456 | ) | | | (367,328,131 | ) | | | (90,518,738 | ) | | | (417,503,315 | ) |
| | | | | | | | | | | | | | | | |
| | | | |
Total decrease in net assets | | | (17,177,784 | ) | | | (246,321,428 | ) | | | (62,679,493 | ) | | | (349,001,882 | ) |
| | | | | | | | | | | | | | | | |
Net Assets: | | | | | | | | | | | | | | | | |
Beginning of year | | | 816,222,323 | | | | 1,062,543,751 | | | | 278,620,050 | | | | 627,621,932 | |
| | | | | | | | | | | | | | | | |
End of year | | $ | 799,044,539 | | | $ | 816,222,323 | | | $ | 215,940,557 | | | $ | 278,620,050 | |
| | | | | | | | | | | | | | | | |
End of year undistributed net investment loss | | $ | (2,364,460 | ) | | $ | (2,109,586 | ) | | $ | (319,569 | ) | | | — | |
| | | | | | | | | | | | | | | | |
Share Transactions: | | | | | | | | | | | | | | | | |
Sale of shares | | | 156,337 | | | | 370,501 | | | | 333,891 | | | | 1,714,608 | |
Shares repurchased | | | (4,517,062 | ) | | | (15,145,877 | ) | | | (3,172,984 | ) | | | (17,532,796 | ) |
| | | | | | | | | | | | | | | | |
Net decrease in shares | | | (4,360,725 | ) | | | (14,775,376 | ) | | | (2,839,093 | ) | | | (15,818,188 | ) |
| | | | | | | | | | | | | | | | |
|
The accompanying notes are an integral part of these financial statements. 21 |
| | |
| | | AMG Managers Brandywine Fund Financial Highlights For a share outstanding throughout each fiscal year |
| | | | | | | | | | | | | | | | | | | | |
| | | For the fiscal year ended September 30, | |
| | | 20143 | | | 2013 | | | 2012 | | | 2011 | | | 2010 | |
Net Asset Value, Beginning of Year | | $ | 28.75 | | | $ | 24.62 | | | $ | 21.38 | | | $ | 22.02 | | | $ | 21.11 | |
| | | | | | | | | | | | | | | | | | | | |
Income from Investment Operations: | | | | | | | | | | | | | | | | | | | | |
Net investment loss1 | | | (0.12 | ) | | | (0.03 | ) | | | (0.05 | ) | | | (0.09 | ) | | | (0.07 | ) |
Net realized and unrealized gain (loss) on investments1 | | | 4.62 | | | | 4.16 | | | | 3.29 | | | | (0.55 | ) | | | 0.98 | |
| | | | | | | | | | | | | | | | | | | | |
Total from investment operations | | | 4.50 | | | | 4.13 | | | | 3.24 | | | | (0.64 | ) | | | 0.91 | |
| | | | | | | | | | | | | | | | | | | | |
Net Asset Value, End of Year | | $ | 33.25 | | | $ | 28.75 | | | $ | 24.62 | | | $ | 21.38 | | | $ | 22.02 | |
| | | | | | | | | | | | | | | | | | | | |
Total Return | | | 15.65 | % | | | 16.77 | % | | | 15.15 | % | | | (2.91 | )% | | | 4.31 | % |
| | | | | | | | | | | | | | | | | | | | |
Ratio of total expenses to average net assets | | | 1.10 | % | | | 1.11 | %2 | | | 1.08 | % | | | 1.09 | % | | | 1.11 | % |
Ratio of net investment loss to average net assets | | | (0.37 | )% | | | (0.12 | )% | | | (0.23 | )% | | | (0.36 | )% | | | (0.33 | )% |
Portfolio turnover | | | 219 | % | | | 214 | % | | | 256 | % | | | 234 | % | | | 225 | % |
Net assets at end of year (000’s omitted) | | $ | 799,045 | | | $ | 816,222 | | | $ | 1,062,544 | | | $ | 1,336,871 | | | $ | 1,755,754 | |
| | | | | | | | | | | | | | | | | | | | |
| | |
| | | AMG Managers Brandywine Blue Fund Financial Highlights For a share outstanding throughout each fiscal year |
| | | | | | | | | | | | | | | | | | | | |
| | | For the fiscal year ended September 30, | |
| | | 20143 | | | 2013 | | | 2012 | | | 2011 | | | 2010 | |
Net Asset Value, Beginning of Year | | $ | 30.01 | | | $ | 25.00 | | | $ | 21.50 | | | $ | 21.78 | | | $ | 20.67 | |
Income from Investment Operations: | | | | | | | | | | | | | | | | | | | | |
Net investment income (loss)1 | | | (0.03 | ) | | | 0.12 | | | | (0.11 | ) | | | (0.10 | ) | | | (0.06 | ) |
Net realized and unrealized gain (loss) on investments1 | | | 3.53 | | | | 4.89 | | | | 3.61 | | | | (0.18 | ) | | | 1.24 | |
Total from investment operations | | | 3.50 | | | | 5.01 | | | | 3.50 | | | | (0.28 | ) | | | 1.18 | |
Distributions to Shareholders from: | | | | | | | | | | | | | | | | | | | | |
Net investment income | | | — | | | | — | | | | — | | | | — | | | | (0.07 | ) |
Net Asset Value, End of Year | | $ | 33.51 | | | $ | 30.01 | | | $ | 25.00 | | | $ | 21.50 | | | $ | 21.78 | |
Total Return | | | 11.66 | % | | | 20.04 | % | | | 16.28 | % | | | (1.29 | )% | | | 5.71 | % |
Ratio of total expenses to average net assets | | | 1.19 | % | | | 1.22 | %2 | | | 1.23 | % | | | 1.18 | % | | | 1.17 | % |
Ratio of net investment income (loss) to average net assets | | | (0.11 | )% | | | 0.45 | % | | | (0.46 | )% | | | (0.38 | )% | | | (0.27 | )% |
Portfolio turnover | | | 182 | % | | | 202 | % | | | 243 | % | | | 250 | % | | | 212 | % |
Net assets at end of year (000’s omitted) | | $ | 215,941 | | | $ | 278,620 | | | $ | 627,622 | | | $ | 1,487,517 | | | $ | 2,057,591 | |
| | | | | | | | | | | | | | | | | | | | |
Notes to Financial Highlights
| 1 | Per share numbers have been calculated using average shares. |
| 2 | Interest expense is less then 0.005% of average net assets. |
| 3 | At the start of business October 1, 2013, Brandywine Fund and Brandywine Blue Fund were re-organized into a series of the Managers AMG Funds. |
| | |
| | | Notes to Financial Statements September 30, 2014 |
1. SUMMARY OF SIGNIFICANT ACCOUNTING POLICIES
AMG Funds I (formerly Managers Trust I) (the “Trust”) is an open-end management investment company, organized as a Massachusetts business trust, and registered under the Investment Company Act of 1940, as amended (the “1940 Act”). Currently, the Trust consists of a number of different funds, each having distinct investment management objectives, strategies, risks, and policies. Included in this report are AMG Managers Brandywine Fund (“Brandywine”) (formerly Brandywine Fund, Inc.) and AMG Managers Brandywine Blue Fund (“Brandywine Blue”) (formerly Brandywine Blue Fund), each a “Fund” and collectively the “Funds.”
At the start of business on October 1, 2013, Brandywine, a series of Brandywine Fund, Inc. and Brandywine Blue, a series of Brandywine Blue Fund, Inc. (the “Predecessor Funds”), were each reorganized into a respective series of the Trust. As a result of the reorganization, the Funds are the successors to the accounting and performance information of the Predecessor Funds.
The Funds’ financial statements are prepared in accordance with accounting principles generally accepted in the United States of America (“U.S. GAAP”), which require management to make estimates and assumptions that affect the reported amounts of assets and liabilities and disclosure of contingent assets and liabilities at the date of the financial statements and the reported amounts of income and expenses during the reporting periods. Actual results could differ from those estimates and such differences could be material. The following is a summary of significant accounting policies followed by the Funds in the preparation of their financial statements:
a. VALUATION OF INVESTMENTS
Equity securities traded on a domestic or international securities exchange are valued at the last quoted sale price, or, lacking any sales, at the last quoted bid price. Equity securities primarily traded on an international securities exchange and equity securities traded on NASDAQ or in a U.S. or non-U.S. over-the counter market are valued at the market’s official closing price, or, if there are no trades on the applicable date, at the last quoted bid price. In addition, if the applicable market does not offer an official closing price or if the official closing price is not representative of the overall market, equity securities primarily traded on an international securities exchange and equity securities traded in a non-U.S. over-the counter market are valued at the last quoted sales price. The Funds’ investments are generally valued based on independent market quotations or prices or, if none, “evaluative” or other market based valuations provided by third-party pricing services approved by the Board of Trustees of the Funds (the “Board”).
Short-term debt obligations (debt obligations with maturities of one year or less at the time of issuance) that have 60 days or less remaining until maturity will be valued at amortized cost. Investments in other open-end regulated investment companies are valued at their end of day net asset value per share.
Under certain circumstances, the value of certain Fund investments (including derivatives) may be based on an evaluation of fair value, pursuant to procedures established by and under the general supervision of the Board. The Pricing Committee is the committee formed by the Board to make fair value determinations for such investments. The Funds may use the fair value of a portfolio investment to calculate its net asset value (“NAV”) in the event that the
market quotation, price or market based valuation for the portfolio investment is not deemed to be readily available or otherwise not determinable pursuant to the Board’s valuation procedures, if AMG Funds LLC (formerly Managers Investment Group LLC) (the “Investment Manager”) believes the quotation, price or market based valuation to be unreliable, or in certain other circumstances. When determining the fair value of an investment, the Pricing Committee seeks to determine the price that the Fund might reasonably expect to receive from a current sale of that investment in an arms-length transaction. Fair value determinations shall be based upon consideration of all available facts and information, including, but not limited to (i) attributes specific to the investment; (ii) fundamental analytical data and press releases relating to the investment and its issuer; and (iii) the value of other comparable securities or relevant financial instruments, including derivative securities, traded on other markets or among dealers.
The values assigned to fair value investments are based on available information and do not necessarily represent amounts that might ultimately be realized in the future, since such amounts depend on future developments inherent in long-term investments. Because of the inherent uncertainty of valuation, those estimated values may differ significantly from the values that would have been used had a ready market for the investments existed, and the differences could be material. The Board will be presented with a quarterly report showing as of the most recent quarter end, all outstanding securities fair valued by the Pricing Committee, including a comparison with the prior quarter end and the percentage of the Fund that the security represents at each quarter end.
Portfolio investments that trade primarily on foreign markets are priced based upon the market quotation of such securities as of the close of their respective principal markets. Under certain circumstances, on behalf of a fund that invests primarily in international securities, the Investment Manager or applicable subadvisor may recommend an adjustment of such prices based on its determination of the impact of events occurring subsequent to the close of such markets but prior to the time as of which each Fund calculates its NAV. The Board has also adopted a policy that securities held in a fund that invests primarily in international securities and certain foreign debt obligations held by a fund, in each case, that can be fair valued by the applicable fair value pricing service are fair valued on each business day without regard to a “trigger” (e.g., without regard to invoking fair value based upon a change in a U.S. equity securities index exceeding a pre-determined level). The Funds may invest in securities that may be thinly traded. The Board has adopted procedures to adjust prices of securities that are judged to be stale so that they reflect fair value. An investment valued on the basis of its fair value may be valued at a price higher or lower than available market quotations.
U.S. GAAP defines fair value as the price that a fund would receive to sell an asset or pay to transfer a liability in an orderly transaction between market participants at the measurement date. U.S. GAAP also establishes a framework for measuring fair value, and a three-level hierarchy for fair value measurements based upon the transparency of inputs to the valuation of an asset or liability. Inputs may be observable or unobservable and refer broadly to the assumptions that market participants would use in pricing the asset or liability. Observable inputs reflect the assumptions market participants would use in pricing the asset or liability based on market data obtained from sources
| | |
| | | Notes to Financial Statements (continued) |
independent of the Funds. Unobservable inputs reflect the Funds’ own assumptions about the assumptions that market participants would use in pricing the asset or liability developed based on the best information available in the circumstances. Each investment is assigned a level based upon the observability of the inputs which are significant to the overall valuation.
The three-tier hierarchy of inputs is summarized below:
Level 1 – inputs are quoted prices in active markets for identical investments (e.g., equity securities, open-end investment companies)
Level 2 – other observable inputs (including, but not limited to: quoted prices for similar assets or liabilities in markets that are active, quoted prices for identical or similar assets or liabilities in markets that are not active, inputs other than quoted prices that are observable for the assets or liabilities (such as interest rates, yield curves, volatilities, prepayment speeds, loss severities, credit risks and default rates) or other market corroborated inputs) (e.g., debt securities, government securities, foreign currency exchange contracts, foreign securities utilizing international fair value pricing, broker-quoted securities, fair valued securities with observable inputs)
Level 3 – inputs are significant unobservable inputs (including the Fund’s own assumptions used to determine the fair value of investments) (e.g., fair valued securities with unobservable inputs)
Changes in inputs or methodologies used for valuing investments may result in a transfer in or out of levels within the fair value hierarchy. The inputs or methodologies used for valuing investments may not necessarily be an indication of the risk associated with investing in those investments.
b. SECURITY TRANSACTIONS
Security transactions are accounted for as of trade date. Realized gains and losses on securities sold are determined on the basis of identified cost.
c. INVESTMENT INCOME AND EXPENSES
Dividend income is recorded on the ex-dividend date. Dividend and interest income on foreign securities is recorded gross of any withholding tax. Interest income, which includes amortization of premium and accretion of discount on debt securities, is accrued as earned. Non-cash dividends included in dividend income, if any, are reported at the fair market value of the securities received. Other income and expenses are recorded on an accrual basis. Expenses that cannot be directly attributed to a Fund are apportioned among the Funds in the Trust and in some cases other affiliated funds based upon their relative average net assets or number of shareholders.
Effective as of November 25, 2013, the Funds have a “balance credit” arrangement with The Bank of New York Mellon (“BNYM”), the Funds’ custodian, whereby each Fund is credited with an interest factor equal to 0.75% below the effective 90-day T-Bill rate for account balances left uninvested overnight. If the T-Bill rate falls below 0.75%, no credits will be earned. These credits serve to reduce custodian expenses that would otherwise be charged to each Fund. For the period from November 25, 2013 to September 30, 2014, the Funds’ custodian expense was not reduced.
Overdraft fees are computed at 1% above the effective Federal Funds rate on the day of the overdraft. For the fiscal year ended September 30, 2014, overdraft fees for Brandywine and Brandywine Blue equaled $31 and $5, respectively.
d. DIVIDENDS AND DISTRIBUTIONS
Fund distributions resulting from either net investment income or realized net capital gains, if any, will normally be declared and paid at least annually in December, as described in the Funds’ prospectus. Distributions to shareholders are recorded on the ex-dividend date. Distributions are determined in accordance with federal income tax regulations, which may differ from net investment income and net realized capital gains for financial statement purposes (U.S. GAAP). Differences may be permanent or temporary. Permanent differences are reclassified among capital accounts in the financial statements to reflect their tax character. Temporary differences arise when certain items of income, expense and gain or loss are recognized in different periods for financial statement and tax purposes; these differences will reverse at some time in the future. The differences are due to differing treatments for wash sales. Permanent book and tax basis differences, if any, relating to shareholder distributions will result in reclassifications to paid-in capital.
As of September 30, 2014, the components of distributable earnings (excluding unrealized appreciation/depreciation) on a tax basis consisted of:
| | | | | | | | |
| | | | | | Brandywine | |
| | | Brandywine | | | Blue | |
Capital loss carryforward | | $ | 649,743,969 | | | $ | 1,023,231,862 | |
Undistributed ordinary income | | | — | | | | — | |
Undistributed short-term capital gains | | | — | | | | — | |
Undistributed long-term capital gains | | | — | | | | — | |
Late-year loss deferral | | | 2,364,460 | | | | 319,569 | |
e. FEDERAL TAXES
Each Fund intends to comply with the requirements under Subchapter M of the Internal Revenue Code of 1986, as amended, and to distribute substantially all of its taxable income and gains to its shareholders and to meet certain diversification and income requirements with respect to investment companies. Therefore, no provision for federal income or excise tax is included in the accompanying financial statements.
Additionally, based on each Fund’s understanding of the tax rules and rates related to income, gains and transactions for the foreign jurisdictions in which it invests, each Fund will provide for foreign taxes, and where appropriate, deferred foreign taxes.
Management has analyzed the Funds’ tax positions taken on federal income tax returns as of September 30, 2014, and for all open tax years (generally, the three prior taxable years), and has concluded that no provision for federal income tax is required in the Funds’ financial statements. Additionally, the Funds are not aware of any tax position for which it is reasonably possible that the total amounts of unrecognized tax benefits will change materially in the next twelve months.
| | |
| | | Notes to Financial Statements (continued) |
Net capital losses incurred in taxable years beginning after the enactment of the Regulated Investment Company Modernization Act of 2010, post-enactment capital losses may be carried forward for an unlimited time period. Such losses will be required to be utilized prior to any loss carryovers incurred in pre-enactment taxable years, which generally expire eight years following the close of the taxable year in which they were incurred. As a result of this ordering rule, pre-enactment capital loss carryovers may be more likely to expire unused. Additionally, post-enactment capital losses that are carried forward retain their tax character as either short-term or long-term capital losses, unlike pre-enactment losses which are considered all short-term.
f. CAPITAL LOSS CARRYOVERS AND DEFERRALS
As of September 30, 2014, the following Funds had accumulated net realized capital loss carryovers from securities transactions for federal income tax purposes as shown in the following chart. These amounts may be used to offset future realized capital gains, if any, through the expiration dates listed or in the case of post-enactment losses, for an unlimited time period.
| | | | | | | | | | | | |
| | | Capital Loss Carryover | | | | |
| | | Amount | | | Expires | |
| | | | | | | | | September | |
Fund | | Short-Term | | | Long-Term | | | 30, | |
Brandywine | | | | | | | | | | | | |
(Pre-Enactment) | | $ | 146,599,760 | | | | — | | | | 2017 | |
(Pre-Enactment) | | $ | 503,144,209 | | | | — | | | | 2018 | |
Brandywine Blue | | | | | | | | | | | | |
(Pre-Enactment) | | $ | 827,345,630 | | | | — | | | | 2017 | |
(Pre-Enactment) | | $ | 195,886,232 | | | | — | | | | 2018 | |
|
| For the fiscal year ended September 30, 2014, the following Funds utilized capital loss carryovers in the amount of: | |
| |
| | | Capital Loss Carryovers Utilized | |
| | | Short-Term | | | Long-Term | |
Brandywine Fund | | $ | 137,400,439 | | | | — | |
Brandywine Blue Fund | | | 49,268,639 | | | | — | |
g. CAPITAL STOCK
The Trust’s Declaration of Trust authorizes for each series the issuance of an unlimited number of shares of beneficial interest, without par value. Each Fund records sales and repurchases of its capital stock on the trade date. The cost of securities contributed to the Funds in connection with the issuance of shares is based on the valuation of those securities in accordance with the Funds’ policy on investment valuation.
At September 30, 2014, certain unaffiliated shareholders of record, specifically omnibus accounts, individually or collectively held greater than 10% of the net assets of Brandywine Blue as follows: two collectively own 25%. Transactions by these shareholders may have a material impact on the Fund.
h. REPURCHASE AGREEMENTS
The Funds may enter into repurchase agreements provided that the value of the underlying collateral, including accrued interest, will equal or exceed the value
of the repurchase agreement during the term of the agreement. The underlying collateral for all repurchase agreements is held in safekeeping by the Fund’s custodian or at the Federal Reserve Bank. If the seller defaults and the value of the collateral declines, or if bankruptcy proceedings commence with respect to the seller of the security, realization of the collateral by the Fund may be delayed or limited. At September 30, 2014, the market value of repurchase agreements outstanding for Brandywine and Brandywine Blue was $33,239,159, and $90,750, respectively.
2. AGREEMENTS AND TRANSACTIONS WITH AFFILIATES
For each of the Funds, the Trust has entered into an investment advisory agreement under which the Investment Manager, a subsidiary and the U.S. retail distributor arm of Affiliated Managers Group, Inc. (“AMG”), serves as investment manager to the Funds and is responsible for the Funds’ overall administration and operations. Prior to October 1, 2013, the Predecessor Funds had a similar Investment Advisory Agreement with Friess Associates, LLC (“Friess”). The Investment Manager selects one or more subadvisors for the Funds (subject to Board approval) and monitors each subadvisor’s investment performance, security holdings and investment strategies. Each Fund’s investment portfolio is managed by Friess through a subadvisory agreement between the Investment Manager and Friess relating to each Fund, and Friess Associates of Delaware, LLC (“Friess of Delaware”) through a sub-subadvisor agreement among the Investment Manager, Friess and Friess of Delaware relating to each Fund.
Investment management fees are paid directly by the Funds to the Investment Manager based on average daily net assets. For the fiscal year ended September 30, 2014, the Funds’ investment management fees were paid at the following annual rates of each Fund’s respective average daily net assets:
| | | | |
Brandywine | | | 1.00 | % |
Brandywine Blue | | | 1.00 | % |
Prior to October 1, 2013, the Predecessor Funds paid a management fee to Friess at the same investment management fee rates.
The Investment Manager has contractually agreed, through at least February 1, 2016, to waive management fees (but not below zero) and/or reimburse each Fund’s expenses in order to limit total annual Fund operating expenses after fee waiver and expense reimbursements (exclusive of taxes, interest (including interest incurred in connection with bank and custody overdrafts), brokerage commissions and other transaction costs, acquired fund fees and expenses, and extraordinary expenses) to 2.00% of each Fund’s average daily net assets subject to later reimbursement by the Fund in certain circumstances. Each contractual expense limitation may only be terminated in the event the Investment Manager or a successor ceases to be the investment manager of the Fund or a successor fund, by mutual agreement of the Investment Manager and the AMG Funds’ Board of Trustees, or in the event of the Fund’s liquidation unless the Fund is reorganized or is a party to a merger in which the surviving entity is successor to the accounting and performance information of the Fund. Prior to October 1, 2013, the Predecessor Funds, had similar arrangements in place.
| | |
| | | Notes to Financial Statements (continued) |
Each Fund is obligated to repay the Investment Manager such amounts waived, paid, or reimbursed in future years provided that the repayment occurs within thirty-six (36) months after the waiver or reimbursement and that such repayment would not cause the Fund’s total annual operating expenses after fee waiver and expense reimbursements in any such future year to exceed that Fund’s contractual expense limitation amount. For the fiscal year ended September 30, 2014, the Funds’ expenses were not reimbursed.
Each Fund has entered into an Administration and Shareholder Servicing Agreement under which the Investment Manager serves as the Funds’ administrator (the “Administrator”) and is responsible for all aspects of managing the Funds’ operations, including administration and shareholder services to each Fund, its shareholders, and certain institutions, such as bank trust departments, broker-dealers and registered investment advisers, that advise or act as intermediary with the Funds’ shareholders. The Funds pays a fee to the Administrator at the rate of 0.03% of each Fund’s average daily net assets for the first $300 million of assets under management, 0.025% for the next $200 million, and 0.02% on amounts in excess of $500 million per annum, subject to a $40,000 annual minimum.
Prior to October 1, 2013, the Predecessor Funds had in place a similar agreement with US Bancorp Fund Services, LLC.
The aggregate annual retainer paid to each Independent Trustee of the Board is $130,000, plus $7,000 or $2,500 for each regular or special meeting attended, respectively. The Independent Chairman of the Trust receives an additional payment of $35,000 per year. The Chairman of the Audit Committee receives an additional payment of $15,000 per year. The Trustees’ fees and expenses are allocated among all of the Funds in the Trusts for which the Investment Manager serves as the advisor based on the relative net assets of such Funds. The “Trustees fees and expenses” shown in the financial statements represents each Fund’s allocated portion of the total fees and expenses paid by the AMG Funds family of mutual funds (“AMG Funds family”).
For the period from October 1, 2013 to January 1, 2014, the aggregate annual retainer paid to each Independent Trustee of the Board was $105,000, plus $6,000 or $2,500 for each regular or special meeting attended, respectively. The Independent Chairman of the Trust formerly received an additional payment of $25,000 per year. The Chairman of the Audit Committee formerly received an additional payment of $10,000 per year.
Prior to October 1, 2013, the Predecessor Funds each paid the Independent Directors an annual fee of $23,300 each. The Independent Chairman of the Trust formerly received an additional payment of $8,000 per year. The Chairman of the Audit Committee formerly received an additional payment of $5,000 per year. The additional payments made to the Independent Chairman of the Trust and Chairman of the Audit Committee were allocated amongst all of the funds in the Brandywine family of funds.
The Funds are distributed by AMG Distributors, Inc. (formerly Managers Distributors, Inc.) (the “Distributor”), a wholly-owned subsidiary of the Investment Manager. The Distributor serves as the distributor and underwriter for each Fund and is a registered broker-dealer and member of the Financial Industry Regulatory Authority, Inc. (“FINRA”). Shares of each Fund will be
continuously offered and will be sold directly to prospective purchasers and through brokers, dealers or other financial intermediaries who have executed selling agreements with the Distributor. Subject to the compensation arrangement discussed below, generally the Distributor bears all or a portion of the expenses of providing services pursuant to the distribution agreement, including the payment of the expenses relating to the distribution of prospectuses for sales purposes and any advertising or sales literature. Certain Trustees and Officers of the Funds are Officers and/or Directors of the Investment Manager, AMG and/or the Distributor.
The Board has approved reimbursement payments to the Investment Manager for shareholder servicing expenses incurred (“shareholder servicing fees”). Shareholder servicing fees include payments to third parties such as a bank, broker-dealer, trust company or other financial intermediaries who provide shareholder recordkeeping, account servicing and other services. To the extent the Investment Manager makes shareholder servicing payments to a third party, the Fund may reimburse the Investment Manager up to the amounts incurred. For the fiscal year ended September 30, 2014, Brandywine and Brandywine Blue paid $164,520 or 0.02% and $173,910 or 0.07%, respectively.
The Securities and Exchange Commission granted an exemptive order that permits the Funds to lend and borrow money for certain temporary purposes directly to and from other eligible Funds in the AMG Funds family. Participation in this interfund lending program is voluntary for both borrowing and lending Funds, and an interfund loan is only made if it benefits each participating Fund. The Investment Manager administers the program according to procedures approved by the Board, and the Board monitors the operation of the program. An interfund loan must comply with certain conditions set out in the exemptive order, which are designed to assure fairness and protect all participating Funds. For the fiscal year ended September 30, 2014, the Funds neither borrowed from nor lent to other Funds in the AMG Funds family.
3. LINE OF CREDIT
Prior to October 1, 2013, the Predecessor Funds had established a line of credit (“LOC”) with U.S. Bank, N.A. to be used for temporary or emergency purposes, primarily for financing redemption payments, using the securities in the Fund’s respective portfolio as collateral. The LOC matured on September 30, 2013 for the Predecessor Fund. The Fund borrowing under the LOC was limited to $4,000,000 unsecured credit, as defined in the LOC. Principal and interest of such loan under the Credit Agreement was due not more than 20 days after the date of the loan. Amounts under the credit facility bore interest at a rate per annum equal to the current prime rate minus one percent on the amount borrowed. For the fiscal year ended September 30, 2013, there were no borrowings for the Predecessor Funds.
| | |
| | | Notes to Financial Statements (continued) |
4. PURCHASES AND SALES OF SECURITIES
Purchases and sales of securities (excluding short-term securities and U.S. Government obligations) for the fiscal year ended September 30, 2014, were as follows:
| | | | | | | | |
| | | Long-Term Securities | |
| Fund | | Purchases | | | Sales | |
Brandywine | | $ | 1,751,046,965 | | | $ | 1,880,347,371 | |
Brandywine Blue | | | 433,172,269 | | | | 516,593,531 | |
The Funds had no purchases or sales of U.S. Government obligations during the fiscal year ended September 30, 2014.
5. PORTFOLIO SECURITIES LOANED
Effective January 29, 2014, the Funds participate in a securities lending program offered by BNYM (the “Program”), providing for the lending of securities to qualified brokers. Securities lending income includes earnings of such temporary cash investments, plus or minus any rebate to a borrower. These earnings (after any rebate) are then divided between BNYM, as a fee for its services under the program, and the Funds, according to agreed-upon rates. Collateral received on all securities loaned is accepted in cash and is maintained at a minimum level of 102% (105% in the case of certain foreign securities) of the market value, plus interest, if applicable, of investments on loan. It is the Funds’ policy to obtain additional collateral from or return excess collateral to the borrower by the end of the next business day, following the valuation date of the securities loaned. Therefore, the value of the collateral held may be temporarily less than the value of the securities on loan. Lending securities entails a risk of loss to the Funds if and to the extent that the market value of the securities loaned were to increase and the borrower did not increase the collateral accordingly, and the borrower fails to return the securities. Under the terms of the Program, the Funds are indemnified for such losses by BNYM. Cash collateral is held in a separate account managed by
BNYM, who is authorized to exclusively enter into overnight government repurchase agreements. BNYM bears the risk of any deficiency in the amount of the cash collateral available for return to the borrower due to any loss on the collateral invested.
At September 30, 2014, the value of the securities loaned and cash collateral received were as follows:
| | | | | | | | |
| | | Securities | | | Cash Collateral | |
| Fund | | Loaned | | | Received | |
Brandywine | | $ | 32,476,913 | | | $ | 33,239,159 | |
Brandywine Blue | | | 88,750 | | | | 90,750 | |
6. COMMITMENTS AND CONTINGENCIES
Under the Trust’s organizational documents, its trustees and officers are indemnified against certain liabilities arising out of the performance of their duties to the Trust. In addition, in the normal course of business, the Funds may enter into contracts and agreements that contain a variety of representations and warranties, which provide general indemnifications. The maximum exposure to the Funds under these arrangements is unknown, as this would involve future claims that may be made against a Fund that have not yet occurred. However, based on experience, the Funds had no prior claims or losses and expect the risks of loss to be remote.
7. MASTER NETTING AGREEMENTS
The Funds may enter into master netting agreements with their counterparties for the securities lending program and repurchase agreements, which provide the right, in the event of default (including bankruptcy or insolvency) for the non-defaulting party to liquidate the collateral and calculate net exposure to the defaulting party or request additional collateral. For financial reporting purposes, the Funds do not offset financial assets and financial liabilities that are subject to master netting agreements in the Statement of Assets and Liabilities. For security lending transactions, see Note 5.
The following table is a summary of the Funds’ open repurchase agreements which are subject to a master netting agreement as of September 30, 2014:
| | | | | | | | | | | | | | | | |
| | | | | | Gross Amount Not Offset in the | | | | |
| | | | | | Statement of Assets and Liabilities | | | | |
| | | Net Amounts of Assets
Presented in the Statement of
Assets and Liabilities | | | Financial Instruments
Collateral | | | Cash Collateral
Received | | | Net Amount | |
Brandywine | | | | | | | | | | | | | | | | |
Barclays Capital | | $ | 1,661,919 | | | $ | 1,661,919 | | | | — | | | | — | |
Citigroup Global Markets, Inc. | | | 7,894,310 | | | | 7,894,310 | | | | — | | | | — | |
Daiwa Capital Markets America | | | 7,894,310 | | | | 7,894,310 | | | | — | | | | — | |
HSBC Securities USA, Inc. | | | 7,894,310 | | | | 7,894,310 | | | | — | | | | — | |
Mizuho Securities USA, Inc. | | | 7,894,310 | | | | 7,894,310 | | | | — | | | | — | |
| | | | | | | | | | | | | | | | |
Total | | $ | 33,239,159 | | | $ | 33,239,159 | | | | — | | | | — | |
| | | | | | | | | | | | | | | | |
Brandywine Blue | | | | | | | | | | | | | | | | |
Daiwa Capital Markets America | | $ | 90,750 | | | $ | 90,750 | | | | — | | | | — | |
| | | | | | | | | | | | | | | | |
Total | | $ | 90,750 | | | $ | 90,750 | | | | — | | | | — | |
| | | | | | | | | | | | | | | | |
| | |
| | | Notes to Financial Statements (continued) |
8. SUBSEQUENT EVENTS
Each Fund has determined that no material events or transactions occurred through the issuance date of the Funds’ financial statements which require additional disclosure in or adjustment of the Funds’ financial statements.
TAX INFORMATION (unaudited)
The AMG Managers Brandywine Fund and AMG Managers Brandywine Blue Fund each hereby designates the maximum amount allowable of its net taxable income as qualified dividends as provided in the Jobs and Growth Tax Relief Reconciliation Act of 2003. The 2013/2014 Form 1099-DIV you receive for each Fund will show the tax status of all distributions paid to you during the year.
Pursuant to section 852 of the Internal Revenue Code, AMG Managers Brandywine Fund and AMG Managers Brandywine Blue Fund hereby designates $0 and $0, respectively, as a capital gain distribution with respect to the taxable year ended September 30, 2014, or if subsequently determined to be different, the net capital gains of such year.
| | |
| | | Report of Independent Registered Public Accounting Firm |
TO THE BOARD OF TRUSTEES OF AMG FUNDS I AND THE SHAREHOLDERS OF AMG MANAGERS BRANDYWINE FUND AND AMG MANAGERS BRANDYWINE BLUE FUND
In our opinion, the accompanying statements of assets and liabilities, including the schedules of portfolio investments, and the related statements of operations and of changes in net assets and the financial highlights present fairly, in all material respects, the financial positions of AMG Managers Brandywine Fund (formerly, Brandywine Fund, Inc.) and AMG Managers Brandywine Blue Fund (formerly, Brandywine Blue Fund) (the “Funds”) at September 30, 2014, and the results of each of their operations, the changes in each of their net assets and the financial highlights for each of the periods indicated, in conformity with accounting principles generally accepted in the United States of America. These financial statements and financial highlights (hereafter referred to as “financial statements”) are the responsibility of the Funds’ management. Our responsibility is to express an opinion on these financial statements based on our audits. We conducted our audits of these financial statements in accordance with the standards of the Public Company Accounting Oversight Board (United States). Those standards require that we plan and perform the audit to obtain reasonable assurance about whether the financial statements are free of material misstatement. An audit includes examining, on a test basis, evidence supporting the amounts and disclosures in the financial statements, assessing the accounting principles used and significant estimates made by management, and evaluating the overall financial statement presentation. We believe that our audits, which included confirmation of securities at September 30, 2014 by correspondence with the custodian and brokers, and the application of alternative auditing procedures where securities purchased had not been received, provide a reasonable basis for our opinion.
PricewaterhouseCoopers LLP
Boston, Massachusetts
October 17, 2014
| | |
| | | AMG Funds Trustees and Officers |
The Trustees and Officers of the Trust, their business addresses, principal occupations for the past five years and dates of birth are listed below. The Trustees provide broad supervision over the affairs of the Trust and the Funds. The Trustees are experienced executives who meet periodically throughout the year to oversee the Funds’ activities, review contractual arrangements with
companies that provide services to the Funds, and review the Funds’ performance. Unless otherwise noted, the address of each Trustee or Officer is the address of the Trust: 800 Connecticut Avenue, Norwalk, Connecticut 06854.
There is no stated term of office for Trustees. Trustees serve until their resignation, retirement or removal in accordance with the Trust’s
organizational documents and policies adopted by the Board from time to time. The Chairman of the Trustees, President, Treasurer and Secretary of the Trust are elected by the Trustees annually. Other officers hold office at the pleasure of the Trustees.
Independent Trustees
The following Trustees are not “interested persons” of the Trust within the meaning of the 1940 Act:
| | |
Number of Funds Overseen in Fund Complex | | Name, Date of Birth, Principal Occupation(s) During Past 5 Years and Other Directorships Held by Trustee |
• Trustee since 2012 • Oversees 43 Funds in Fund Complex | | Bruce B. Bingham, 12/1/48 Partner, Hamilton Partners (real estate development firm) (1987-Present); Trustee of Aston Funds (25 portfolios) (2014-Present). |
| |
• Independent Chairman • Trustee since 2000 • Oversees 43 Funds in Fund Complex | | William E. Chapman II, 9/23/41 President and Owner, Longboat Retirement Planning Solutions (1998-Present); Hewitt Associates, LLC (part time) (provider of Retirement and Investment Education Seminars) (2002-2009); Trustee Emeritus of Bowdoin College (2013-Present); Trustee of Bowdoin College (2002-2013); Director of Harding, Loevner Funds, Inc. (6 portfolios); Trustee of Third Avenue Trust (5 portfolios); Trustee of Third Avenue Variable Trust (1 portfolio); Trustee of Aston Funds (25 portfolios) (2010-Present). |
| |
• Trustee since 2000 • Oversees 43 Funds in Fund Complex | | Edward J. Kaier, 9/23/45 Attorney at Law and Partner, Teeters Harvey Marrone & Kaier LLP (2007-Present); Attorney at Law and Partner, Hepburn Willcox Hamilton & Putnam, LLP (1977-2007); Trustee of Third Avenue Trust (5 portfolios); Trustee of Third Avenue Variable Trust (1 portfolio); Trustee of Aston Funds (25 portfolios) (2010-Present). |
| |
• Trustee since 2013 • Oversees 45 Funds in Fund Complex | | Kurt A. Keilhacker, 10/5/63 Managing Member, TechFund Capital (1997-Present); Managing Member, TechFund Europe (2000-Present); Trustee, Gordon College (2001-Present); Board Member, 6wind SA, (2002-Present); Managing Member, Clapham Partners I, LLC (2013-Present); Trustee of Aston Funds (25 portfolios) (2014-Present). |
| |
• Trustee since 2000 • Oversees 43 Funds in Fund Complex | | Steven J. Paggioli, 4/3/50 Independent Consultant (2002-Present); Formerly Executive Vice President and Director, The Wadsworth Group (1986-2001); Executive Vice President, Secretary and Director, Investment Company Administration, LLC (1990-2001); Vice President, Secretary and Director, First Fund Distributors, Inc. (1991-2001); Trustee, Professionally Managed Portfolios (45 portfolios); Advisory Board Member, Sustainable Growth Advisors, LP; Independent Director, Chase Investment Counsel (2008 – Present); Trustee of Aston Funds (25 portfolios) (2010-Present). |
| |
• Trustee since 2013 • Oversees 43 Funds in Fund Complex | | Richard F. Powers III, 2/2/46 Adjunct Professor, Boston College (2011-Present); Trustee of Aston Funds (25 portfolios) (2014-Present); Director of Ameriprise Financial Inc. (2005-2009); President and CEO of Van Kampen Investments Inc. (1998-2003). |
| |
• Trustee since 2000 • Oversees 45 Funds in Fund Complex | | Eric Rakowski, 6/5/58 Professor, University of California at Berkeley School of Law (1990-Present); Director of Harding, Loevner Funds, Inc. (6 portfolios); Trustee of Third Avenue Trust (5 portfolios); Trustee of Third Avenue Variable Trust (1 portfolio); Trustee of Aston Funds (25 portfolios) (2010-Present). |
| |
• Trustee since 2013 • Oversees 45 Funds in Fund Complex | | Victoria L. Sassine, 8/11/65 Lecturer, Babson College (2007 – Present); Trustee of Aston Funds (25 portfolios) (2014-Present). |
| |
• Trustee since 2000 • Oversees 43 Funds in Fund Complex | | Thomas R. Schneeweis, 5/10/47 Professor Emeritus, University of Massachusetts (2013 - Present); Partner, S Capital Management, LLC (2007-Present); President, TRS Associates (1982-Present); Director, CISDM at the University of Massachusetts, (1996-2013); President, Alternative Investment Analytics, LLC, (formerly Schneeweis Partners, LLC) (2001-2013); Professor of Finance, University of Massachusetts (1977-2013); Partner, White Bear Partners, LLC (2007-2010); Partner, Northampton Capital Management, LLC (2004-2010); Trustee of Aston Funds (25 portfolios) (2010-Present). |
| | |
| | | AMG Funds Trustees and Officers (continued) |
Interested Trustees
Each Trustee in the following table is an “interested person” of the Trust within the meaning of the 1940 Act. Ms. Carsman is an interested person of the Trust within the meaning of the 1940 Act by virtue of her position with, and interest in securities of, AMG, and her former position as Chief Legal Officer of the Trust.
| | |
Number of Funds Overseen in Fund Complex | | Name, Date of Birth, Principal Occupation(s) During Past 5 Years and Other Directorships Held by Trustee |
• Trustee since 2011 • Oversees 45 Funds in Fund Complex | | Christine C. Carsman, 4/2/52 Senior Vice President and Deputy General Counsel, Affiliated Managers Group, Inc. (2011-Present); Trustee of Aston Funds (25 portfolios) (2014-Present); Senior Vice President and Chief Regulatory Counsel, Affiliated Managers Group, Inc. (2007-2011); Vice President and Chief Regulatory Counsel, Affiliated Managers Group, Inc. (2004-2007); Secretary and Chief Legal Officer, AMG Funds, AMG Funds I, AMG Funds II and AMG Funds III (2004-2011); Senior Counsel, Vice President and Director of Operational Risk Management and Compliance, Wellington Management Company, LLP (1995-2004). |
Officers
| | |
Position(s) Held with Fund and Length of Time Served | | Name, Date of Birth, Principal Occupation(s) During Past 5 Years |
• President since 2014 • Principal Executive Officer since 2014 | | Jeffrey T. Cerutti, 2/7/68 Chief Executive Officer, AMG Funds LLC (2014-Present); Director, President and Principal, AMG Distributors, Inc. (2014-Present); President and Principal Executive Officer, AMG Pantheon Private Equity Fund LLC and AMG Pantheon Private Equity Master Fund LLC (2014-Present); President, VP Distributors, (2011-2014); Executive Vice President, Head of Distribution, Virtus Investment Partners, Inc. (2010-2014); Managing Director, Head of Sales, UBS Global Asset Management (2001-2010). |
| |
• Chief Operating Officer since 2007 | | Keitha L. Kinne, 5/16/58 Chief Operating Officer, AMG Funds LLC (2007-Present); Chief Investment Officer, AMG Funds LLC (2008-Present); Chief Operating Officer, AMG Distributors, Inc. (2007-Present); Chief Operating Officer, AMG Pantheon Private Equity Fund LLC and AMG Pantheon Private Equity Master Fund LLC (2014-Present); Managing Partner, AMG Funds LLC (2007-2014); President, AMG Funds (2012-2014); President, AMG Distributors, Inc. (2012-2014); Managing Director, Legg Mason & Co., LLC (2006-2007); Managing Director, Citigroup Asset Management (2004-2006). |
| |
• Secretary since 2011 • Chief Legal Officer since 2011 | | Lewis Collins, 2/22/66 Senior Vice President and Senior Counsel, Affiliated Managers Group, Inc. (2010-Present); Secretary, AMG Pantheon Private Equity Fund LLC and AMG Pantheon Private Equity Master Fund LLC (2014-Present); Vice President and Senior Counsel, Affiliated Managers Group, Inc. (2006-2010); Senior Counsel, Affiliated Managers Group, Inc. (2002-2006); Attorney, Ropes & Gray LLP (1998-2002). |
| |
• Chief Financial Officer since 2007 • Treasurer since 1999 • Principal Financial Officer since 1999 | | Donald S. Rumery, 5/29/58 Senior Vice President, AMG Funds LLC (2005-Present); Treasurer, AMG Funds III (1995-Present); Treasurer, AMG Funds I and AMG Funds II (2000-Present); Chief Financial Officer, AMG Funds I, AMG Funds II and AMG Funds III (2007-Present); Treasurer, Principal Financial Officer and Principal Accounting Officer, AMG Pantheon Private Equity Fund LLC and AMG Pantheon Private Equity Master Fund LLC (2014-Present); Treasurer and Chief Financial Officer, AMG Distributors, Inc. (2000-2012); Vice President, AMG Funds LLC (1994-2004). |
| |
• Assistant Treasurer since 2014 | | John C. Ball, 1/9/76 Vice President, Assistant Treasurer, AMG Funds LLC (2014-Present); Assistant Treasurer, AMG Pantheon Private Equity Fund, LLC and AMG Pantheon Private Equity Master Fund, LLC (2014-Present); Vice President, State Street Corp. (2010-2014); Vice President, State Street International (Ireland) Limited (2007-2010). |
| |
• Chief Compliance Officer since 2010 | | John J. Ferencz, 3/9/62 Vice President, Legal and Compliance, AMG Funds LLC (2010-Present); Senior Compliance Analyst, Mutual Funds and Regulatory, GE Asset Management Incorporated (2005-2010). |
| |
• Assistant Secretary since 2011 | | Michael S. Ponder, 9/12/73 Senior Vice President and Counsel, AMG Funds LLC (2011-Present); Attorney, DeNovo Legal (2009-2010); Vice President, Credit Suisse (2007-2009); Associate, Willkie Farr & Gallagher LLP (2006-2007). |
| |
• Anti-Money Laundering Compliance Officer since 2014 | | Patrick J. Spellman, 3/15/74 Senior Vice President, Chief Compliance Officer, Legal and Compliance, AMG Funds LLC (2011-Present); Chief Compliance Officer, AMG Distributors, Inc., (2010-Present); Anti-Money Laundering Compliance Officer, AMG Pantheon Private Equity Fund, LLC and AMG Pantheon Private Equity Master Fund, LLC (2014-Present); Compliance Manager, Legal and Compliance, Affiliated Managers Group, Inc. (2005-2011). |
INVESTMENT MANAGER AND ADMINISTRATOR
AMG Funds LLC
800 Connecticut Avenue
Norwalk, CT 06854
(800) 835-3879
DISTRIBUTOR
AMG Distributors, Inc.
800 Connecticut Avenue
Norwalk, CT 06854
(800) 835-3879
SUBADVISOR
Friess Associates, LLC
P.O. Box 576
Jackson, Wyoming 83001
Friess Associates of Delaware, LLC
P.O. Box 4166
Greenville, DE 19807
CUSTODIAN
The Bank of New York Mellon
2 Hanson Place
Brooklyn, NY 11217
LEGAL COUNSEL
Ropes & Gray LLP
Prudential Tower, 800 Boylston Street
Boston, MA 02199-3600
TRANSFER AGENT
BNY Mellon Investment Servicing (US) Inc.
Attn: AMG Funds
P.O. Box 9769
Providence, RI 02940
(800) 548-4539
This report is prepared for the Funds’ shareholders. It is authorized for distribution to prospective investors only when preceded or accompanied by an effective prospectus. To receive a free copy of the prospectus or Statement of Additional Information, which includes additional information about Fund Trustees, please contact us by calling 800.835.3879. Distributed by AMG Distributors, Inc., member FINRA.
Current net asset values per share for each Fund are available on the Funds’ website at www.amgfunds.com.
A description of the policies and procedures each Fund uses to vote its proxies is available: (i) without charge, upon request, by calling 800.835.3879, or (ii) on the Securities and Exchange Commission’s (SEC) website at www.sec.gov For information regarding each Fund’s proxy voting record for the 12-month period ended June 30, call 800.835.3879 or visit the SEC website at www.sec.gov.
Each Fund files its complete schedule of portfolio holdings with the SEC for the first and third quarters of each fiscal year on Form N-Q. The Funds’ Forms N-Q are available on the SEC’s website at www.sec.gov. A Fund’s Forms N-Q may be reviewed and copied at the SEC’s Public Reference Room in Washington, DC. Information on the operation of the Public Reference Room may be obtained by calling 1-800-SEC-0330. To review a complete list of the Funds’ portfolio holdings, or to view the most recent quarterly holdings report, semiannual report, or annual report, please visit www.amgfunds.com.
AFFILIATE SUBADVISED FUNDS
ALTERNATIVE FUNDS
| AMG | FQ Global Alternatives |
First Quadrant, L.P.
BALANCED FUNDS
| AMG | Chicago Equity Partners Balanced |
Chicago Equity Partners, LLC
| AMG | FQ Global Risk-Balanced |
(formerly Managers AMG FQ Global Essentials)
First Quadrant, L.P.
EQUITY FUNDS
| AMG | FQ Tax-Managed U.S. Equity |
First Quadrant, L.P.
| AMG | Frontier Small Cap Growth |
Frontier Capital Management Company, LLC
(formerly GW&K Small Cap Equity)
Gannett Welsh & Kotler, LLC
| AMG | Renaissance International Equity |
| AMG | Renaissance Large Cap Growth |
The Renaissance Group LLC
| AMG | SouthernSun U.S. Equity |
SouthernSun Asset Management, LLC
| AMG | Systematic Large Cap Value |
(formerly Systematic Value)
| AMG | Systematic Mid Cap Value |
Systematic Financial Management, L.P.
| AMG | TimesSquare All Cap Growth |
(formerly Managers AMG TSCM Growth Equity)
| AMG | TimesSquare International Small Cap |
| AMG | TimesSquare Mid Cap Growth |
| AMG | TimesSquare Small Cap Growth |
TimesSquare Capital Management, LLC
| AMG | Trilogy Emerging Markets Equity |
| AMG | Trilogy International Small Cap |
Trilogy Global Advisors, L.P.
Yacktman Asset Management LP
FIXED INCOME FUNDS
| AMG | GW&K Enhanced Core Bond |
(formerly Managers AMG GW&K Fixed Income)
| AMG | GW&K Municipal Enhanced Yield |
Gannett Welsh & Kotler, LLC
OPEN-ARCHITECTURE FUNDS
EQUITY FUNDS
| AMG | Managers Brandywine Advisors Mid Cap Growth |
| AMG | Managers Brandywine Blue |
Friess Associates, LLC
| AMG | Managers Cadence Capital Appreciation |
| AMG | Managers Cadence Emerging Companies |
| AMG | Managers Cadence Mid Cap |
Cadence Capital Management, LLC
| AMG | Managers Emerging Opportunities |
(formerly Managers Micro-Cap)
Lord, Abbett & Co. LLC
WEDGE Capital Management L.L.P.
Next Century Growth Investors LLC
RBC Global Asset Management (U.S.) Inc.
| AMG | Managers Essex Small/Micro Cap Growth |
Essex Investment Management Co., LLC
| AMG | Managers Real Estate Securities |
CenterSquare Investment Management, Inc.
| AMG | Managers Skyline Special Equities |
(formerly Skyline Special Equities Portfolio)
Skyline Asset Management, L.P.
| AMG | Managers Special Equity |
Ranger Investment Management, L.P.
Lord, Abbett & Co. LLC
Smith Asset Management Group, L.P.
Federated MDTA LLC
FIXED INCOME FUNDS
AMG Managers Bond
| AMG | Managers Global Income Opportunity |
Loomis, Sayles & Co., L.P.
J.P. Morgan Investment Management Inc.
| AMG | Managers Intermediate Duration Government |
| AMG | Managers Short Duration Government |
Amundi Smith Breeden LLC
| AMG | Managers Total Return Bond |
(formerly Managers PIMCO Bond)
Pacific Investment Management Co. LLC
| | |

| | | www.amgfunds.com |
| | | | |
| | | | ANNUAL REPORT |
AMG Funds
September 30, 2014
AMG Managers Brandywine Advisors Mid Cap Growth Fund: BWAFX
(formerly Brandywine Advisors Midcap Growth Fund)
| | | | |
| www.amgfunds.com | | | | AR077-0914 |
| | |
| | | AMG Funds Annual Report—September 30, 2014 |
| | | | |
TABLE OF CONTENTS | | PAGE | |
LETTER TO SHAREHOLDERS | | | 2 | |
| |
ABOUT YOUR FUND’S EXPENSES | | | 3 | |
| |
PORTFOLIO MANAGER’S COMMENTS, PORTFOLIO STATISTICS, AND SCHEDULE OF PORTFOLIO INVESTMENTS | | | | |
| |
AMG Managers Brandywine Advisors Mid Cap Growth Fund | | | 4 | |
| |
NOTES TO SCHEDULE OF PORTFOLIO INVESTMENTS | | | 10 | |
| |
FINANCIAL STATEMENTS | | | | |
| |
Statement of Assets and Liabilities | | | 11 | |
Balance sheet, net asset value (NAV) per share computation and cumulative undistributed amounts | | | | |
| |
Statement of Operations | | | 12 | |
Detail of sources of income, expenses, and realized and unrealized gains (losses) during the fiscal year | | | | |
| |
Statements of Changes in Net Assets | | | 13 | |
Detail of changes in assets for the past two fiscal years | | | | |
| |
FINANCIAL HIGHLIGHTS | | | 14 | |
Historical net asset values per share, distributions, total returns, income and expense ratios, turnover ratios and net assets | | | | |
| |
NOTES TO FINANCIAL STATEMENTS | | | 15 | |
Accounting and distribution policies, details of agreements and transactions with Fund management and affiliates, and descriptions of certain investment risks | | | | |
| |
REPORT OF INDEPENDENT REGISTERED PUBLIC ACCOUNTING FIRM | | | 21 | |
| |
TRUSTEES AND OFFICERS | | | 22 | |
Nothing contained herein is to be considered an offer, sale or solicitation of an offer to buy shares of any series of the AMG Funds family of mutual funds. Such offering is made only by Prospectus, which includes details as to offering price and other material information.
| | | | |
| | | | AMG Managers Brandywine Advisors Mid Cap Growth Fund |
DEAR FELLOW SHAREHOLDER:
Cautious sentiment arose amid an uptick in geopolitical uncertainty in the September quarter, weighing on the quarterly results of mid-cap benchmarks for the first time this year. As a group, larger companies managed modest gains.
AMG Managers Brandywine Advisors Mid Cap Growth Fund (“Brandywine Advisors”) declined 3.13 percent in the September quarter as the Russell Midcap® and Russell Midcap® Growth Indexes declined 1.66 and 0.73 percent. The S&P 500® Index gained 1.13 percent.
From Russia stirring conflict in Ukraine to U.S. airstrikes in the Middle East, developments on the geopolitical front provided investors numerous reasons for pause during the September quarter. Questions arose about economic conditions in Europe and China as well.
In mid-September, the Federal Reserve indicated that it would end its quantitative easing program in October. As part of the announcement, the Fed retained previously released language stating that interest rates would rise “a considerable time” after the central bank ended its bond-buying program. Still, potential for rising U.S. interest rates remains a pressing concern among investors.
Brandywine Advisors outperformed the Russell Mid Cap® Growth Index in five out of nine economic sectors represented in the portfolio. The degree of outperformance that the index enjoyed in the consumer discretionary and technology sectors, however, earned the index the relative performance advantage for the period.
The consumer discretionary sector was the most pronounced negative influence on relative results. Although the portfolio’s position was underweight relative to the benchmark, holdings from the sector underperformed the sector within the index.
Kate Spade & Co. shares declined on concerns that promotional activity would pressure profit margins within its line of premium brands of clothing, handbags and other fashion items sold through retailers. Although Dorman Products, which supplies replacement parts in the automotive aftermarket, grew June-quarter earnings 21 percent, investors showed disappointment in a shift in the merchandise mix and a provision for obsolete inventory due to negative profit-margin implications.
Energy holdings were the next most significant negative influence on relative results. Halcon Resources Corp. was the most notable detractor. The company exceeded estimates with 75 percent June-quarter earnings growth. Although Halcon reported better-than-expected production results, a subsequent disappointing report from a competitor raised concerns. Sentiment regarding Halcon and other exploration and production companies also deteriorated as energy prices declined.
Industrial holdings represented the portfolio’s largest position. While performance was roughly in line with the sector, the portfolio’s position was
overweight versus the benchmark. The additional exposure to the sector at a time when the sector was among the index’s poorer performers detracted from relative results.
Holdings from the materials sector provided the portfolio’s biggest boost relative to the benchmark. Eagle Materials was a standout performer. The company, which makes wallboard, cement and other building materials, grew June-quarter earnings 25 percent on revenue growth of 17 percent.
SBA Communications Corp. from the telecommunications services sector and Hain Celestial Group from the consumer staples sector also aided results. Growth in storage and data usage continues to force major U.S. wireless carriers to build out their 4G LTE networks, drawing investor attention to increased demand for antenna space provided by SBA Communications. Shares of Hain Celestial, the largest company focused on organic and natural foods, rose in the wake of June-quarter earnings growth of 38 percent, marking the seventh time out of the last eight quarters that the company exceeded the consensus estimate.
For more on companies that influenced September-quarter performance, please see Roses & Thorns on page 7.
Holdings from the industrial, technology and consumer discretionary sectors represent Brandywine Advisors’ largest positions as we head into the final months of 2014. Please see page 6 for more portfolio characteristics.
Given the significant concentration of earnings strength we’ve uncovered among industrial companies, industrial holdings continue to represent a noteworthy overweight position relative to the index. The Brandywine Advisor portfolio’s exposure is limited in the financial sector and, to a lesser extent, in the health care sector.
We’re excited to note that closing out fiscal 2014 also marked the first anniversary of Brandywine Advisors joining the AMG Funds family. All of us at Friess Associates are grateful for the opportunity to serve you through AMG Managers Brandywine Advisors Mid Cap Growth Fund.
Thanks for your confidence in our research-driven investment approach and the team that implements it. Best wishes from your entire Friess team.
Scott Gates
Chief Investment Officer
Friess Associates, LLC
| | |
| | | About Your Fund’s Expenses |
As a shareholder of a Fund, you may incur two types of costs: (1) transaction costs, which may include sales charges (loads) on purchase payments; redemption fees; and exchange fees; and (2) ongoing costs, including management fees; distribution (12b-1) fees; and other Fund expenses. This example is intended to help you understand your ongoing costs (in dollars) of investing in the Fund and to compare these costs with the ongoing costs of investing in other mutual funds. The example is based on $1,000 invested at the beginning of the period and held for the entire period as indicated below.
ACTUAL EXPENSES
The first line of the following table provides information about the actual account values and actual expenses. You may use the information in this line, together with the amount you invested, to estimate the expenses that you paid over the period. Simply divide your account value by $1,000 (for example, an $8,600 account value divided by $1,000 = 8.6), then multiply the result by the number in the first line under the heading entitled “Expenses Paid During Period” to estimate the expenses you paid on your account during this period.
HYPOTHETICAL EXAMPLE FOR COMPARISON PURPOSES
The second line of the following table provides information about hypothetical account values and hypothetical expenses based on the Fund’s actual expense ratio and an assumed annual rate of return of 5% before expenses, which is not the Fund’s actual return. The hypothetical account values and expenses may not be used to estimate the actual ending account balance or expenses you paid for the period. You may use this information to compare the ongoing costs of investing in the Fund and other funds by comparing this 5% hypothetical example with the 5% hypothetical examples that appear in the shareholder reports of other funds.
Please note that the expenses shown in the table are meant to highlight your on going costs only and do not reflect any transactional costs, such as sales charges (loads), redemption fees, or exchange fees. Therefore, the second line of the table is useful in comparing ongoing costs only, and will not help you determine the relative total costs of owning different funds.
| | | | | | | | | | | | | | | | |
Six Months Ended
September 30, 2014 | | Expense
Ratio for
the Period | | | Beginning
Account Value
4/01/14 | | | Ending
Account Value
9/30/14 | | | Expenses
Paid During
the Period* | |
AMG Managers Brandywine Advisors Mid Cap Growth Fund | |
Based on Actual Fund Return | | | 1.10 | % | | $ | 1,000 | | | $ | 965 | | | $ | 5.42 | |
Hypothetical (5% return before expenses) | | | 1.10 | % | | $ | 1,000 | | | $ | 1,020 | | | $ | 5.57 | |
| * | Expenses are equal to the Fund’s annualized expense ratio multiplied by the average account value over the period,multiplied by the number of days in the most recent fiscal half-year (183), then divided by 365. |
| | |
| | | AMG Managers Brandywine Advisors Mid Cap Growth Fund Portfolio Manager’s Comments |
Macro factors in the 12 months ended September 30, 2014, which included everything from international conflict to questions about China’s economic growth, did not prevent stocks from moving higher in AMG Managers Brandywine Advisors Mid Cap Growth Fund’s (“Brandywine Advisors”) fiscal year. Still, one significant event – winter weather that contributed to a 2.9 percent drop in first-quarter GDP – changed the complexion of the market’s move higher, impacting relative performance.
The fiscal year began on a high note, with investor sentiment still projecting the confidence inspired by the Federal Reserve’s decision roughly a year earlier to extend and expand its monthly bond-buying program. Despite the Federal Reserve telegraphing a plan to begin winding down that stimulus, the market’s mood remained upbeat in the December quarter (the first quarter of the fiscal year) thanks to evidence of economic progress strong enough to make investors comfortable with the Federal Reserve’s announced intentions.
Investors embraced the notion that the economy was poised to accelerate from the slow-growth trajectory evident throughout much of the recovery. Brandywine Advisors’ earnings-driven investment strategy fared particularly well in this environment, as companies with above-average growth prospects attracted positive attention.
Holdings from the technology sector, such as Micron Technology, and the industrial sector, such as United Rentals, drove December-quarter performance. In what was the strongest quarter of the fiscal year for Brandywine Advisors and the benchmark, Brandywine Advisors outperformed.
In the March quarter, Mother Nature let it be known that expectations are subject to change.
Nasty winter weather, including record snow accumulation in major metropolitan regions in the Northeast and Midwest, left its mark, disrupting shipping and at times shuttering businesses.
As investors debated the potential implications of the weather, unremarkable economic reports released during the period added to the uncertainty. They also added to the belief that support from the Federal Reserve remained in place for the foreseeable future, helping maintain a positive bias.
Industrial holdings, particularly companies with limited exposure to the worst of the winter weather, remained top performers in the March quarter. United Rentals continued as a standout. Technology holdings also aided performance. Both Brandywine Advisors and the benchmark posted positive March-quarter returns, and Brandywine Advisors outperformed.
The environment remained mostly calm in the June quarter, but the main concerns that surfaced in the March quarter carried forward. As companies reported earnings results from the first quarter, investors debated whether the period represented a one-time, winter-related setback or something of more lasting economic consequence.
Rather than change the direction of the market, the uncertainty contributed to a change in the leadership driving the advance. Utility sector companies were notable performers in the June quarter as low-interest rates heightened the appeal of dividends and the market’s rise adopted a more defensive stance. Energy companies also fared well as a terrorist push into Iraq sent oil prices higher.
Technology holdings, such as FireEye and JDS Uniphase Corp., detracted the most from
performance. Industrial holdings, which helped drive performance in the previous two quarters, also underperformed. Manitowoc Co. was a noteworthy detractor from the industrial sector. The benchmark gained ground in the June quarter, while Brandywine Advisors declined slightly.
From geopolitical developments in Ukraine, Syria and Iraq to economic uncertainty in Europe and China, the macro environment gave investors plenty to consider in the September quarter (the final quarter of the fiscal year). While larger companies still fared relatively well in this environment, conditions were more volatile for mid-cap companies.
Brandywine Advisors and its benchmark lost ground during the September quarter. The benchmark’s decline was more modest.
Brandywine Advisors grew 8.98 percent for the 12 months ended September 30, 2014. The Russell Midcap® Growth Index gained 14.43 percent during that time.
United Rentals, Trinity Industries, Under Armour and Wabtec Corp. contributed the most to the portfolio’s fiscal-year performance. The most significant performance detractors were Nu Skin Enterprises, Himax Technologies, JDS Uniphase Corp. and GT Advanced Technologies.
This commentary reflects the viewpoints of Friess Associates, LLC as of September 30, 2014 and is not intended as a forecast or guarantee of future results.
| | |
| | | AMG Managers Brandywine Advisors Mid Cap Growth Fund Portfolio Manager’s Comments (continued) |
CUMULATIVE TOTAL RETURN PERFORMANCE
The Fund’s cumulative total return is based on the daily change in net asset value (NAV), and assumes that all dividends and distributions were reinvested. The chart compares a hypothetical $10,000 investment made in the Fund on September 30, 2004, to a $10,000 investment made in the Russell Midcap® Growth Index, Russell Midcap® Index and S&P 500® Index for the same time period. The graph and table do not reflect the deduction of taxes that a shareholder would pay on a Fund distribution or redemption of shares. The listed returns for the Fund are net of expenses and the returns for the index exclude expenses.
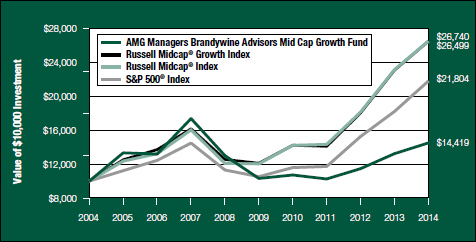
The table below shows the average annual total returns for the AMG Managers Brandywine Advisors Mid Cap Growth Fund and the Russell Midcap® Growth Index, Russell Midcap® Index and S&P 500® Index for the same time periods ended September 30, 2014.
| | | | | | | | | | | | |
| | | One | | | Five | | | Ten | |
| Average Annual Total Returns1 | | Year | | | Years | | | Years | |
AMG Managers Brandywine Advisors Mid Cap Growth Fund2,3 | | | 8.98 | % | | | 6.95 | % | | | 3.73 | % |
Russell Midcap® Growth Index4 | | | 14.43 | % | | | 17.12 | % | | | 10.24 | % |
Russell Midcap® Index5 | | | 15.83 | % | | | 17.19 | % | | | 10.34 | % |
S&P 500® Index6 | | | 19.73 | % | | | 15.70 | % | | | 8.11 | % |
The performance data shown represents past performance. Past performance is not a guarantee of future results. Current performance may be lower or higher than the performance data quoted. The investment return and principal value of an investment in the Fund will fluctuate so that an investor’s shares, when redeemed, may be worth more or less than their original cost.
Investors should carefully consider the Fund’s investment objectives, risks, charges, and expenses before investing. For performance information through the most recent month end, current net asset values per share for the Fund and other information, please call (800) 835-3879 or visit our website at www.amgfunds.com for a free prospectus. Read it carefully before investing or sending money.
Distributed by AMG Distributors, Inc., member FINRA.
| 1 | Total return equals income yield plus share price change and assumes reinvestment of all dividends and capital gain distributions. Returns are net of fees and may reflect offsets of Fund expenses as described in the Prospectus. No adjustment has been made for taxes payable by shareholders on their reinvested dividends and capital gain distributions. Returns for periods greater than one year are annualized. The listed returns on the Fund are net of expenses and based on the published NAV as of September 30, 2014. All returns are in U.S. dollars ($). |
| 2 | The Fund inception dates and returns for all periods beginning prior to October 1, 2013 reflects performance of the predecessor Fund, Brandywine Advisors Midcap Growth Fund, and was managed by Friess Associates, LLC with the same investment objectives and substantially similar investment policies. |
| 3 | The Fund is subject to risks associated with investments in mid-capitalization companies such as erratic earnings patterns, competitive conditions, limited earnings history, and a reliance on one or a limited number of products. |
| 4 | The Russell Midcap® Growth Index measures the performance of the Russell Midcap companies with higher price-to-book ratios and higher forecasted growth values. The stocks are also members of the Russell 1000® Growth Index. Unlike the Fund, the Indices are unmanaged, are not available for investment, and do not incur expenses. |
| 5 | The Russell Midcap® Index measures the performance of the 800 smallest companies in the Russell 1000® Index, which represent approximately 25 percent of the total market capitalization of the Russell 1000® Index. Unlike the Fund, the Indices are unmanaged, are not available for investment, and do not incur expenses. |
| 6 | The S&P 500® Index is a capitalization-weighted index of 500 stocks. The S&P 500® Index is designed to measure performance of the broad domestic economy through changes in the aggregate market value of 500 stocks representing all major industries. Unlike the Fund, the S&P 500® Index is unmanaged, is not available for investment, and does not incur expenses. |
The Russell Midcap® Growth Index and Russell Midcap® Index are registered trademarks of Russell Investments. Russell® is a trademark of Russell Investments.
The S&P 500® Index is proprietary data of Standard & Poor’s, a division of McGraw-Hill Companies, Inc. All rights reserved.
Not FDIC insured, nor bank guaranteed. May lose value.
| | |
| | | AMG Managers Brandywine Advisors Mid Cap Growth Fund Fund Snapshots (unaudited) September 30, 2014 |
PORTFOLIO BREAKDOWN
| | | | | | | | | | | | | | | | |
Industry (Top Ten) | | Brandywine
Advisors
Mid Cap
Growth
Fund** | | | Russell
Midcap®
Growth
Index | | | Russell
Midcap®
Index | | | S&P 500®
Index | |
Semiconductors | | | 16.4 | % | | | 4.1 | % | | | 3.6 | % | | | 2.4 | % |
Construction Machinery & Heavy Trucks | | | 11.0 | % | | | 0.5 | % | | | 0.7 | % | | | 0.1 | % |
Trading Companies & Distributors | | | 7.5 | % | | | 1.5 | % | | | 1.0 | % | | | 0.2 | % |
Construction Materials | | | 5.3 | % | | | 0.4 | % | | | 0.3 | % | | | 0.1 | % |
Packaged Foods & Meats | | | 4.8 | % | | | 2.8 | % | | | 2.4 | % | | | 1.6 | % |
Technology Hardware, Storage & Peripherals | | | 4.3 | % | | | 0.9 | % | | | 1.3 | % | | | 4.6 | % |
Housewares & Specialties | | | 3.5 | % | | | 0.7 | % | | | 0.5 | % | | | 1.9 | % |
Oil & Gas Equipment & Services | | | 3.4 | % | | | 5.0 | % | | | 4.5 | % | | | 7.9 | % |
Systems Software | | | 3.1 | % | | | 4.5 | % | | | 3.2 | % | | | 3.8 | % |
Wireless Telecommunication Services | | | 3.1 | % | | | 0.5 | % | | | 0.3 | % | | | 0.0 | % |
Cash & Cash Equivalents | | | 7.3 | % | | | 0.0 | % | | | 0.0 | % | | | 0.0 | % |
Other Assets and Liabilities | | | 30.3 | % | | | 79.1 | % | | | 82.2 | % | | | 77.4 | % |
| ** | As a percentage of net assets |
PORTFOLIO MARKET CAPITALIZATION
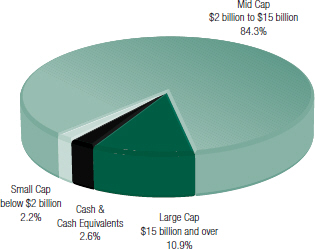
TOP TEN HOLDINGS
| | | | | | | | |
Security Name | | % of
Net Assets | | | % Change from
Book Cost | |
United Rentals, Inc.* | | | 4.9 | % | | | 111.6 | % |
Wabtec Corp.* | | | 4.2 | | | | 168.1 | |
Trinity Industries, Inc.* | | | 4.2 | | | | 63.7 | |
Jarden Corp.* | | | 3.5 | | | | 42.0 | |
Red Hat, Inc.* | | | 3.1 | | | | 19.4 | |
RF Micro Devices, Inc. | | | 3.1 | | | | 20.4 | |
SBA Communications Corp., Class A | | | 3.0 | | | | 24.8 | |
Eagle Materials, Inc. | | | 2.9 | | | | 22.8 | |
Guidewire Software, Inc. | | | 2.9 | | | | 13.2 | |
American Eagle Outfitters, Inc. | | | 2.9 | | | | 4.3 | |
| | | | | | | | |
Top Ten as a Group | | | 34.7 | % | | | | |
| | | | | | | | |
| * | Also Top Ten Holding as of June 30, 2014. |
ESTIMATED EARNINGS GROWTH RATE
OF THE FUND’S INVESTMENTS
Forecasted Increase in Earnings Per Share 2015 vs 2014

Source: Consensus estimates from FactSet Research Systems Inc.
This is not a forecast of the Fund’s future performance. Earnings growth for a Fund holding does not guarantee a corresponding increase in the market value of the holding or the Fund. As of September 30, 2014, the S&P 500® Index’s average annual total returns for 1, 5 and 10 years were 19.73, 15.70 and 8.11 percent, respectively.
Because a fund’s strategy may result in multiple investments in particular sectors of the economy, its performance may depend on the performance of those sectors and may fluctuate more widely than investments diversified across more sectors. For additional information on these and other risk considerations, please see the Fund’s prospectus.
Any sectors, industries, or securities discussed should not be perceived as investment recommendations. Mention of a specific security should not be considered a recommendation to buy or solicitation to sell that security. Specific securities mentioned in this report may have been sold from the Fund’s portfolio of investments by the time you receive this report.
| | |
| | | AMG Managers Brandywine Advisors Mid Cap Growth Fund Roses and Thorns (unaudited) Quarter Ending September 30, 2014 |
| | | | | | |
$ Gain
(in millions) | | % Gain | | Biggest $ Winners | | Reason for Move |
| | | | | International Rectifier Corp. |
| $1.1 | | 27.1 | | The manufacturer of power management semiconductors grew June-quarter earnings to $0.18 per share from a loss of $0.09 a year ago. Shares gained ground and passed our target price in the September quarter after Infineon Technologies announced it would purchase International Rectifier. Following the news, we sold the shares we held. |
| | |
| | | | RF Micro Devices Inc. |
| $0.8 | | 20.4 | | The manufacturer of semiconductors used in wireless communications applications grew June-quarter earnings 167 percent, beating consensus expectations by 41 percent. June-quarter revenue jumped 8 percent, also exceeding expectations. RF Micro Devices benefited from higher average selling prices amid a trend toward increased cell phone complexity and an ongoing shift from 2G components to 3G and 4G components. Management raised its earnings guidance for the September quarter. |
| | |
| | | | The Hain Celestial Group Inc. |
| $0.5 | | 15.3 | | The manufacturer of natural food and personal care products grew June-quarter earnings 38 percent, beating expectations for the seventh time out of the past eight quarters. Revenue grew 26 percent. Net sales reached a record $584 million as natural and organic foods continued to win shelf space in more mainstream grocery stores. |
| | |
| | | | Chipotle Mexican Grill Inc. |
| $0.4 | | 13.4 | | The operator of fast-casual Mexican restaurants grew June-quarter earnings 24 percent, beating estimates by 13 percent. Same store sales jumped 17 percent, driven by a 12 percent increase in traffic. Strategies related to improved work flow activities, enhanced marketing and expanding the company’s catering services helped boost profitability. |
| | |
| | | | DexCom Inc. |
| $0.4 | | 9.5 | | The medical device company focused on the design and development of glucose monitoring systems for people with diabetes reported a 36 percent improvement in earnings during the June quarter on revenue $58.8 million. Accelerating pediatric adoption and strong international sales helped drive revenue growth and profit-margin expansion. We sold Dexcom during the September quarter when shares hit our target price. |
| | | |
$ Loss
(in millions) | | % Loss | | Biggest $ Losers | | Reason for Move |
| | | | Halcon Resources Corp. | | |
| $1.1 | | 34.8 | | The exploration and production company focused in the Bakken, Eagle Ford and other U.S. shale fields grew June-quarter earnings 75 percent, beating estimates by 55 percent. While fundamentals reflected stronger-than-expected production results, shares traded down in the September quarter due to a competitor’s weak drilling results in the high-profile Tuscaloosa Marine Shale. Commodity prices also came under pressure. |
| | |
| | | | 3D Systems Corp. |
| $1.0 | | 22.1 | | Shares of the developer and manufacturer of 3D printers declined during the September quarter as revenue from new products was accompanied by higher costs, creating profit-margin pressure. Based on the consensus, analysts expected the company to earn $0.02 per share more in the June quarter. |
| | |
| | | | Kate Spade & Co. |
| $0.8 | | 15.9 | | The premium-brand retailer grew June-quarter earnings to $0.05 from a loss of $0.12 a year ago, topping expectations. Shares declined during the September quarter on concerns that profit-margin expansion would be delayed due to an increasingly promotional environment. We sold Kate Spade to fund an idea with greater near-term earnings visibility. |
| | |
| | | | Synaptics Inc. |
| $0.8 | | 16.8 | | The supplier of touch-based interface solutions for mobile computing, communications and entertainment devices topped June-quarter earnings estimates. Shares declined during the September quarter as investors grew concerned that competitive pressures were increasing. We believe Synaptics continues to win new customers with integrated chip solutions that include fingerprint sensing technology. |
| | |
| | | | Air Lease Corp. |
| $0.7 | | 15.0 | | The aircraft leasing company engaged in purchasing commercial aircraft and leasing them to airlines around the world reported 41 percent June-quarter earnings growth, beating the consensus estimate by 14 percent. Air Lease shares traded lower in the September quarter due to concerns of oversupply. We sold Air Lease to fund an idea with better near-term earnings visibility. |
All gains/losses are calculated on an average cost basis from June 30, 2014 through September 30, 2014.
This commentary reflects the viewpoints of Friess Associates, LLC as of September 30, 2014 and is not intended as a forecast or guarantee of future results.
| | |
| | | AMG Managers Brandywine Advisors Mid Cap Growth Fund Schedule of Portfolio Investments September 30, 2014 |
| | | | | | | | | | |
Shares | | | | Cost | | | Value | |
Common Stocks - 97.5% | | | | | | | | |
Consumer Discretionary | | | | | | | | |
| | Apparel Retail - 2.9% | |
295,000 | | American Eagle Outfitters, Inc.1 | | $ | 4,106,085 | | | $ | 4,283,400 | |
| | Apparel, Accessories & Luxury Goods - 2.6% | |
50,300 | | Carter’s, Inc. | | | 4,040,559 | | | | 3,899,256 | |
| | Footwear - 3.0% | | | | | | | | |
8,720 | | Skechers U.S.A., Inc., Class A* | | | 474,189 | | | | 464,863 | |
124,500 | | Steven Madden, Ltd.* | | | 4,326,740 | | | | 4,012,635 | |
| | Housewares & Specialties - 3.5% | |
87,000 | | Jarden Corp.* | | | 3,683,142 | | | | 5,229,570 | |
| | Movies & Entertainment - 2.7% | |
199,000 | | Regal Entertainment Group, Class A1 | | | 4,216,177 | | | | 3,956,120 | |
| | Restaurants - 1.2% | |
2,771 | | Chipotle Mexican Grill, Inc.* | | | 1,485,394 | | | | 1,847,121 | |
| | | | | | | | | | |
| | Total Consumer Discretionary | | | 22,332,286 | | | | 23,692,965 | |
| | |
| | This sector is 6.1% above your Fund’s cost. | | | | | |
| | |
Consumer Staples | | | | | | | | |
| | Packaged Foods & Meats - 4.8% | |
38,600 | | The Hain Celestial Group, Inc.* | | | 3,210,933 | | | | 3,950,710 | |
105,595 | | Pilgrim’s Pride Corp.* | | | 3,323,041 | | | | 3,226,983 | |
| | | | | | | | | | |
| | Total Consumer Staples | | | 6,533,974 | | | | 7,177,693 | |
| | |
| | This sector is 9.9% above your Fund’s cost. | | | | | |
| | |
Energy | | | | | | | | |
| | Oil & Gas Equipment & Services - 3.4% | |
67,930 | | Helix Energy Solutions Group, Inc.* | | | 1,594,741 | | | | 1,498,536 | |
167,270 | | Weatherford International PLC* | | | 3,625,979 | | | | 3,479,216 | |
| | Oil & Gas Exploration & Production - 2.5% | |
66,000 | | Bonanza Creek Energy, Inc.* | | | 3,967,904 | | | | 3,755,400 | |
| | | | | | | | | | |
| | Total Energy | | | 9,188,624 | | | | 8,733,152 | |
| | |
| | This sector is 5.0% below your Fund’s cost. | | | | | |
| | |
Financials | | | | | | | | |
| | Hotel & Resort REITs - 2.5% | |
101,000 | | Pebblebrook Hotel Trust | | | 3,812,846 | | | | 3,771,340 | |
| | |
| | This sector is 1.1% below your Fund’s cost. | | | | | |
| | |
Health Care | | | | | | | | |
| | Health Care Facilities - 2.7% | |
67,000 | | Tenet Healthcare Corp.* | | | 3,719,572 | | | | 3,979,130 | |
| | Health Care Technology - 2.0% | |
50,000 | | Cerner Corp.* | | | 2,935,173 | | | | 2,978,500 | |
| | | | | | | | | | |
| | Total Health Care | | | 6,654,745 | | | | 6,957,630 | |
| | |
| | This sector is 4.6% above your Fund’s cost. | | | | | |
| | | | | | | | | | |
Shares | | | | Cost | | | Value | |
Industrials | | | | | | | | |
| | Construction Machinery & Heavy Trucks - 11.0% | |
| 135,860 | | Allison Transmission Holdings, Inc. | | $ | 3,998,664 | | | $ | 3,870,651 | |
| 134,000 | | Trinity Industries, Inc. | | | 3,824,252 | | | | 6,260,480 | |
| 77,400 | | Wabtec Corp. | | | 2,339,470 | | | | 6,272,496 | |
| | Diversified Support Services - 2.0% | |
| 103,500 | | KAR Auction Services, Inc. | | | 3,174,069 | | | | 2,963,205 | |
| | Environmental & Facilities Services - 2.6% | |
| 79,000 | | Waste Connections, Inc. | | | 3,796,835 | | | | 3,833,080 | |
| | Human Resources & Employment Services - 2.2% | |
| 125,000 | | TriNet Group, Inc.* | | | 3,269,715 | | | | 3,218,750 | |
| | Marine - 0.5% | |
| 6,920 | | Kirby Corp.* | | | 822,128 | | | | 815,522 | |
| | Trading Companies & Distributors - 7.5% | |
| 121,400 | | Air Lease Corp. | | | 3,418,662 | | | | 3,945,500 | |
| 65,000 | | United Rentals, Inc.* | | | 3,412,456 | | | | 7,221,500 | |
| | Trucking - 2.8% | |
| 46,315 | | Ryder System, Inc. | | | 3,702,836 | | | | 4,166,961 | |
| | | | | | | | | | |
| | Total Industrials | | | 31,759,087 | | | | 42,568,145 | |
| | |
| | This sector is 34.0% above your Fund’s cost. | | | | | |
| | |
Information Technology | | | | | | | | |
| | Application Software - 2.9% | |
| 97,000 | | Guidewire Software, Inc.* | | | 3,798,945 | | | | 4,300,980 | |
| | Semiconductors - 16.4% | |
| 23,815 | | Avago Technologies, Ltd. | | | 2,089,888 | | | | 2,071,905 | |
| 64,500 | | First Solar, Inc.* | | | 4,189,607 | | | | 4,244,745 | |
| 237,115 | | Integrated Device Technology, Inc.* | | | 3,836,976 | | | | 3,781,984 | |
| 116,020 | | Microsemi Corp.* | | | 3,041,886 | | | | 2,948,068 | |
| 43,500 | | NXP Semiconductors N.V.* | | | 3,110,497 | | | | 2,976,705 | |
| 395,100 | | RF Micro Devices, Inc.* | | | 3,785,530 | | | | 4,559,454 | |
| 52,580 | | Synaptics, Inc.* | | | 3,262,312 | | | | 3,848,856 | |
| | Systems Software - 3.1% | |
| 82,500 | | Red Hat, Inc.* | | | 3,878,660 | | | | 4,632,375 | |
| | Technology Hardware, Storage &
Peripherals - 4.3% | |
| 74,000 | | 3D Systems Corp.*,1 | | | 4,104,277 | | | | 3,431,380 | |
| 51,700 | | Seagate Technology PLC | | | 3,062,429 | | | | 2,960,859 | |
| | | | | | | | | | |
| | Total Information Technology | | | 38,161,007 | | | | 39,757,311 | |
| | |
| | This sector is 4.2% above your Fund’s cost. | | | | | |
|
The accompanying notes are an integral part of these financial statements. 8 |
| | |
| | | AMG Managers Brandywine Advisors Mid Cap Growth Fund Schedule of Portfolio Investments (continued) |
| | | | | | | | | | | | |
Shares | | | | | Cost | | | Value | |
| Materials | | | | | |
| | | | Construction Materials - 5.3% | | | | | |
| | 42,500 | | | Eagle Materials, Inc. | | $ | 3,524,021 | | | $ | 4,327,775 | |
| | 60,000 | | | Vulcan Materials Co. | | | 3,813,413 | | | | 3,613,800 | |
| | | | | | | | | | | | �� |
| | | | Total Materials | | | 7,337,434 | | | | 7,941,575 | |
| | |
| | | | This sector is 8.2% above your Fund’s cost. | | | | | |
| | |
| Telecommunication Services | | | | | | | | |
| | | | Wireless Telecommunication Services - 3.1% | | | | | |
| | 40,925 | | | SBA Communications Corp., Class A* | | | 3,635,820 | | | | 4,538,583 | |
| | |
| | | | This sector is 24.8% above your Fund’s cost. | | | | | |
| | | |
| | | | Total Common Stocks | | | 129,415,823 | | | | 145,138,394 | |
| | | |
| | | | | | Principal
Amount | | | | |
| Short-Term Investments - 7.3% | | | | | |
| Commercial Paper - 2.9% | | | | | | | | |
| | | | Northwestern Corp. due 10/01/14, discount of 0.22% | | $ | 4,323,000 | | | | 4,323,000 | |
| Repurchase Agreements - 4.3%2 | | | | | |
| | | | Barclays Capital, dated 09/30/14, due 10/01/14, 0.010%, total to be received $321,578 (collateralized by various U.S. Government Agency Obligations, 1.250% - 3.375%, 01/31/19 - 05/15/44, totaling $328,010) | | | 321,578 | | | | 321,578 | |
| | | | BNP Paribas Securities Corp., dated 09/30/14, due 10/01/14, 0.010%, total to be received $1,527,548 (secured by various U.S. Government Agency Obligations, 3.000% - 4.500%, 09/15/42 - 04/20/44, totaling $1,558,099) | | | 1,527,548 | | | | 1,527,548 | |
| | | | | | | | | | |
Shares | | | | Principal
Amount | | | Value | |
| | HSBC Securities USA, Inc., dated 09/30/14, due 10/01/14, 0.000%, total to be received $1,527,548 (collateralized by various U.S. Government Agency Obligations, 0.000% - 9.375%, 10/15/14 - 07/15/32, totaling $1,558,105) | | $ | 1,527,548 | | | $ | 1,527,548 | |
| | Mizuho Securities USA, Inc., dated 09/30/14, due 10/01/14, 0.010%, total to be received $1,527,548 (secured by various U.S. Government Agency Obligations, 0.000% - 9.000%, 03/12/15 - 06/20/44, totaling $1,558,100) | | | 1,527,548 | | | | 1,527,548 | |
| | Morgan Stanley & Co. LLC, dated 09/30/14, due 10/01/14, 0.000%, total to be received $1,527,548 (collateralized by various U.S. Government Agency Obligations, 0.000% - 11.500%, 11/05/14 - 10/01/44, totaling $1,558,099) | | | 1,527,548 | | | | 1,527,548 | |
| | | | | | | | | | |
| | Total Repurchase Agreements | | | 6,431,770 | | | | 6,431,770 | |
| | | |
| | | | | Cost | | | | |
Other Investment Companies - 0.1%3 | | | | | |
100,921 | | Dreyfus Institutional Cash Advantage Fund, Institutional Class Shares, 0.06% | | | 100,921 | | | | 100,921 | |
| | | | | | | | | | |
| | Total Short-Term Investments | | | 10,855,691 | | | | 10,855,691 | |
| | Total Investments - 104.8% | | $ | 140,271,514 | | | | 155,994,085 | |
| | | | | | | | | | |
Other Assets, less Liabilities - (4.8)% | | | | (7,147,182 | ) |
| | Total Net Assets - 100.0% | | | | | | $ | 148,846,903 | |
| | | | | | | | | | |
|
The accompanying notes are an integral part of these financial statements. 9 |
| | |
| | | Notes to Schedule of Portfolio Investments |
The following footnotes and abbreviations should be read in conjunction with the Schedule of Portfolio Investments previously presented in this report.
Based on the approximate cost of investments of $140,271,514 for federal income tax purposes at September 30, 2014, the aggregate gross unrealized appreciation and depreciation were $18,711,510 and $2,988,939, respectively, resulting in net unrealized appreciation of investments of $15,722,571.
| * | Non-income producing security. |
| 1 | Some or all of these securities, amounting to a market value of $6,258,932, or 4.2% of net assets, were out on loan to various brokers. |
| 2 | Collateral received from brokers for securities lending was invested in these short-term investments. |
| 3 | Yield shown represents the September 30, 2014, seven-day average yield, which refers to the sum of the previous seven days’ dividends paid, expressed as an annual percentage. |
The following table summarizes the inputs used to value the Fund’s net assets by the fair value hierarchy levels as of September 30, 2014. (See Note 1(a) in the Notes to the Financial Statements.)
| | | | | | | | | | | | | | | | |
| | | Quoted Prices in Active
Markets for Identical
Investments | | | Significant Other
Observable Inputs | | | Significant
Unobservable
Inputs | | | | |
| | | Level 1 | | | Level 2 | | | Level 3 | | | Total | |
AMG Managers Brandywine Advisors Mid Cap Growth Fund | | | | | | | | | | | | | | | | |
Investments in Securities | | | | | | | | | | | | | | | | |
| | | | |
Common Stocks† | | $ | 145,138,394 | | | | — | | | | — | | | $ | 145,138,394 | |
Short-Term Investments | | | | | | | | | | | | | | | | |
Commercial Paper | | | — | | | $ | 4,323,000 | | | | — | | | | 4,323,000 | |
Repurchase Agreements | | | — | | | | 6,431,770 | | | | — | | | | 6,431,770 | |
Other Investment Companies | | | 100,921 | | | | — | | | | — | | | | 100,921 | |
| | | | | | | | | | | | | | | | |
Total Investments in Securities | | $ | 145,239,315 | | | $ | 10,754,770 | | | | — | | | $ | 155,994,085 | |
| | | | | | | | | | | | | | | | |
| † | All common stocks held in the Fund are Level 1 securities. For a detailed breakout of the common stocks by major industry classification, please refer to the Schedule of Portfolio Investments. |
As of September 30, 2014, the Fund had no transfers between levels from the beginning of the reporting period.
|
The accompanying notes are an integral part of these financial statements. 10 |
| | |
| | | Statement of Assets and Liabilities September 30, 2014 |
| | | | |
Assets: | | | | |
Investments at value* (including securities on loan valued at $6,258,932) | | $ | 155,994,085 | |
Receivable for investments sold | | | 520,145 | |
Dividends, interest and other receivables | | | 138,197 | |
Receivable for Fund shares sold | | | 2,438 | |
Prepaid expenses | | | 1,585 | |
| | | | |
Total assets | | | 156,656,450 | |
| | | | |
Liabilities: | | | | |
Payable upon return of securities loaned | | | 6,431,770 | |
Payable for investments purchased | | | 1,153,266 | |
Payable for Fund shares repurchased | | | 45,894 | |
Accrued expenses: | | | | |
Investment advisory and management fees | | | 122,542 | |
Administrative fees | | | 7,141 | |
Shareholder servicing fees | | | 1,141 | |
Trustees fees and expenses | | | 1,634 | |
Other | | | 46,159 | |
| | | | |
Total liabilities | | | 7,809,547 | |
| | | | |
Net Assets | | $ | 148,846,903 | |
| | | | |
Net Assets Represent: | | | | |
Paid-in capital | | $ | 159,650,502 | |
Undistributed net investment loss | | | (599,248 | ) |
Accumulated net realized loss from investments | | | (25,926,922 | ) |
Net unrealized appreciation of investments | | | 15,722,571 | |
| | | | |
Net Assets | | $ | 148,846,903 | |
| | | | |
Shares outstanding | | | 15,514,984 | |
| | | | |
Net asset value, offering and redemption price per share | | $ | 9.59 | |
| | | | |
* Investments at cost | | $ | 140,271,514 | |
|
The accompanying notes are an integral part of these financial statements. 11 |
| | |
| | | Statement of Operations For the fiscal year ended September 30, 2014 |
| | | | |
Investment Income: | | | | |
Dividend income | | $ | 667,706 | |
Securities lending income | | | 179,309 | |
Interest income | | | 12,870 | |
Foreign withholding tax | | | (359 | ) |
| | | | |
Total investment income | | | 859,526 | |
| | | | |
Expenses: | | | | |
Investment advisory and management fees | | | 1,485,193 | |
Administrative fees | | | 47,241 | |
Shareholder servicing fees | | | 13,367 | |
Distribution fees | | | 7,582 | |
Reports to shareholders | | | 28,259 | |
Professional fees | | | 27,591 | |
Custodian | | | 21,115 | |
Registration fees | | | 18,582 | |
Transfer agent | | | 10,150 | |
Trustees fees and expenses | | | 6,017 | |
Miscellaneous | | | 2,698 | |
| | | | |
Total expenses | | | 1,667,795 | |
| | | | |
Net investment loss | | | (808,269 | ) |
| | | | |
Net Realized and Unrealized Gain (Loss): | | | | |
Net realized gain on investments | | | 15,378,496 | |
Net change in unrealized appreciation (depreciation) of investments | | | (2,276,747 | ) |
| | | | |
Net realized and unrealized gain | | | 13,101,749 | |
| | | | |
Net increase in net assets resulting from operations | | $ | 12,293,480 | |
| | | | |
|
The accompanying notes are an integral part of these financial statements. 12 |
| | |
| | | Statements of Changes in Net Assets For the fiscal years ended September 30, |
| | | | | | | | |
| | | 2014 | | | 2013 | |
Increase (Decrease) in Net Assets From Operations: | | | | | | | | |
Net investment loss | | $ | (808,269 | ) | | $ | (255,893 | ) |
Net realized gain on investments | | | 15,378,496 | | | | 10,128,477 | |
Net change in unrealized appreciation (depreciation) of investments | | | (2,276,747 | ) | | | 8,506,279 | |
| | | | | | | | |
Net increase in net assets resulting from operations | | | 12,293,480 | | | | 18,378,863 | |
| | | | | | | | |
Distributions to Shareholders: | | | | | | | | |
From net investment income | | | — | | | | (96,485 | ) |
Capital Share Transactions: | | | | | | | | |
Proceeds from sale of shares | | | 562,812 | | | | 982,334 | |
Reinvestment of dividends and distributions | | | — | | | | 3,171 | |
Cost of shares repurchased | | | (1,255,676 | ) | | | (1,790,607 | ) |
| | | | | | | | |
Net decrease from capital share transactions | | | (692,864 | ) | | | (805,102 | ) |
| | | | | | | | |
Total increase in net assets | | | 11,600,616 | | | | 17,477,276 | |
| | | | | | | | |
Net Assets: | | | | | | | | |
Beginning of year | | | 137,246,287 | | | | 119,769,011 | |
| | | | | | | | |
End of year | | $ | 148,846,903 | | | $ | 137,246,287 | |
| | | | | | | | |
End of year undistributed net investment loss | | $ | (599,248 | ) | | $ | (549,647 | ) |
| | | | | | | | |
Share Transactions: | | | | | | | | |
Sale of shares | | | 58,832 | | | | 118,240 | |
Reinvested shares from dividends and distributions | | | — | | | | 439 | |
Shares repurchased | | | (131,593 | ) | | | (226,959 | ) |
| | | | | | | | |
Net decrease in shares | | | (72,761 | ) | | | (108,280 | ) |
| | | | | | | | |
|
The accompanying notes are an integral part of these financial statements. 13 |
| | |
| | | AMG Managers Brandywine Advisors Mid Cap Growth Fund Financial Highlights For a share outstanding throughout each fiscal year |
| | | | | | | | | | | | | | | | | | | | |
| | | For the fiscal years ended September 30, | |
| | | 20143 | | | 2013 | | | 2012 | | | 2011 | | | 2010 | |
Net Asset Value, Beginning of Year | | $ | 8.80 | | | $ | 7.63 | | | $ | 6.82 | | | $ | 7.13 | | | $ | 6.86 | |
| | | | | | | | | | | | | | | | | | | | |
Income from Investment Operations: | | | | | | | | | | | | | | | | | | | | |
Net investment loss1 | | | (0.05 | ) | | | (0.02 | ) | | | (0.03 | ) | | | (0.05 | ) | | | (0.02 | ) |
Net realized and unrealized gain (loss) on investments1 | | | 0.84 | | | | 1.20 | | | | 0.84 | | | | (0.26 | ) | | | 0.29 | |
| | | | | | | | | | | | | | | | | | | | |
Total from investment operations | | | 0.79 | | | | 1.18 | | | | 0.81 | | | | (0.31 | ) | | | 0.27 | |
| | | | | | | | | | | | | | | | | | | | |
Distributions to Shareholders from: | | | | | | | | | | | | | | | | | | | | |
Net investment income | | | — | | | | (0.01 | ) | | | — | | | | — | | | | — | |
| | | | | | | | | | | | | | | | | | | | |
Net Asset Value, End of Year | | $ | 9.59 | | | $ | 8.80 | | | $ | 7.63 | | | $ | 6.82 | | | $ | 7.13 | |
| | | | | | | | | | | | | | | | | | | | |
Total Return | | | 8.98 | % | | | 15.43 | % | | | 11.88 | % | | | (4.35 | )% | | | 3.94 | % |
| | | | | | | | | | | | | | | | | | | | |
Ratio of total expenses to average net assets | | | 1.12 | % | | | 1.22 | % | | | 1.22 | %2 | | | 1.25 | %2 | | | 1.28 | % |
Ratio of net investment loss to average net assets | | | (0.54 | )% | | | (0.20 | )% | | | (0.37 | )% | | | (0.63 | )% | | | (0.30 | )% |
Portfolio turnover | | | 249 | % | | | 235 | % | | | 266 | % | | | 241 | % | | | 226 | % |
Net assets at end of year (000’s omitted) | | $ | 148,847 | | | $ | 137,246 | | | $ | 119,769 | | | $ | 122,926 | | | $ | 178,780 | |
| | | | | | | | | | | | | | | | | | | | |
Notes to Financial Highlights
| 1 | Per share numbers have been calculated using average shares. |
| 2 | Interest expense is less than 0.005% of average net assets. |
| 3 | At the start of business October 1, 2013, Brandywine Advisors Midcap Growth Fund was re-organized into a series of the Managers AMG Funds. |
| | |
| | | Notes to Financial Statements September 30, 2014 |
1. SUMMARY OF SIGNIFICANT ACCOUNTING POLICIES
AMG Funds I (formerly Managers Trust I) (the “Trust”) is an open-end management investment company, organized as a Massachusetts business trust and registered under the Investment Company Act of 1940, as amended (the “1940 Act”). Currently, the Trust consists of a number of different funds, each having distinct investment management objectives, strategies, risks, and policies. Included in this report is the AMG Managers Brandywine Advisors Mid Cap Growth Fund (formerly Brandywine Advisors Midcap Growth Fund) (the “Fund”).
At the start of business on October 1, 2013, Brandywine Advisors Midcap Growth Fund, a series of Brandywine Blue Fund, Inc. (the “Predecessor Fund”), was reorganized into a series of the Trust. As a result of the reorganization, the Fund is the successor to the accounting and performance information of the Predecessor Fund.
The Fund’s financial statements are prepared in accordance with accounting principles generally accepted in the United States of America (“U.S. GAAP”), which require management to make estimates and assumptions that affect the reported amount of assets and liabilities and disclosure of contingent assets and liabilities at the date of the financial statements and the reported amounts of income and expenses during the reporting periods. Actual results could differ from those estimates and such differences may be material. The following is a summary of significant accounting policies followed by the Fund in the preparation of its financial statements:
a. VALUATION OF INVESTMENTS
Equity securities traded on a domestic or international securities exchange are valued at the last quoted sale price, or, lacking any sales, at the last quoted bid price. Equity securities primarily traded on an international securities exchange and equity securities traded on NASDAQ or in a U.S. or non-U.S. over-the-counter market are valued at the market’s official closing price, or, if there are no trades on the applicable date, at the last quoted bid price. In addition, if the applicable market does not offer an official closing price or if the official closing price is not representative of the overall market, equity securities primarily traded on an international securities exchange and equity securities traded in a non-U.S. over-the-counter market are valued at the last quoted sales price. The Fund’s investments are generally valued based on independent market quotations or prices or, if none, “evaluative” or other market based valuations provided by third-party pricing services approved by the Board of Trustees of the Fund (the “Board”).
Short-term debt obligations (debt obligations with maturities of one year or less at the time of issuance) that have 60 days or less remaining until maturity will be valued at amortized cost. Investments in other open-end regulated investment companies are valued at their end of day net asset value per share.
Under certain circumstances, the value of certain Fund investments (including derivatives) may be based on an evaluation of fair value, pursuant to procedures established by and under the general supervision of the Board. The Pricing Committee is the committee formed by the Board to make fair value determinations for such investments. The Fund may use the fair value of a portfolio investment to calculate its net asset value (“NAV”) in the event that the market quotation, price or market based valuation for the portfolio investment is
not deemed to be readily available or otherwise not determinable pursuant to the Board’s valuation procedures, if AMG Funds LLC (formerly Managers Investment Group LLC) (the “Investment Manager”) believes the quotation, price or market based valuation to be unreliable, or in certain other circumstances. When determining the fair value of an investment, the Pricing Committee seeks to determine the price that the Fund might reasonably expect to receive from a current sale of that investment in an arms-length transaction. Fair value determinations shall be based upon consideration of all available facts and information, including, but not limited to (i) attributes specific to the investment; (ii) fundamental analytical data and press releases relating to the investment and its issuer; and (iii) the value of other comparable securities or relevant financial instruments, including derivative securities, traded on other markets or among dealers.
The values assigned to fair value investments are based on available information and do not necessarily represent amounts that might ultimately be realized in the future, since such amounts depend on future developments inherent in long-term investments. Because of the inherent uncertainty of valuation, those estimated values may differ significantly from the values that would have been used had a ready market for the investments existed, and the differences could be material. The Board will be presented with a quarterly report showing as of the most recent quarter end, all securities fair valued by the Pricing Committee, including a comparison with the prior quarter end and the percentage of the Fund that the security represents at each quarter end.
Portfolio investments that trade primarily on foreign markets are priced based upon the market quotation of such securities as of the close of their respective principal markets. Under certain circumstances, on behalf of a fund that invests primarily in international securities, the Investment Manager or applicable subadvisor may recommend an adjustment of such prices based on its determination of the impact of events occurring subsequent to the close of such markets but prior to the time as of which the Fund calculates its NAV. The Board has also adopted a policy that securities held in a fund that invests primarily in international securities and certain foreign debt obligations held by a fund, in each case, that can be fair valued by the applicable fair value pricing service are fair valued on each business day without regard to a “trigger” (e.g., without regard to invoking fair value based upon a change in a U.S. equity securities index exceeding a pre-determined level). The Fund may invest in securities that may be thinly traded. The Board has adopted procedures to adjust prices of securities that are judged to be stale so that they reflect fair value. An investment valued on the basis of its fair value may be valued at a price higher or lower than available market quotations.
U.S. GAAP defines fair value as the price that a fund would receive to sell an asset or pay to transfer a liability in an orderly transaction between market participants at the measurement date. U.S. GAAP also establishes a framework for measuring fair value, and a three-level hierarchy for fair value measurements based upon the transparency of inputs to the valuation of an asset or liability. Inputs may be observable or unobservable and refer broadly to the assumptions that market participants would use in pricing the asset or liability. Observable inputs reflect the assumptions market participants would use in pricing the asset or liability based on market data obtained from sources independent of the Fund. Unobservable inputs reflect the Fund’s own assumptions about the assumptions that market participants would use in
| | |
| | | Notes to Financial Statements (continued) |
pricing the asset or liability developed based on the best information available in the circumstances. Each investment is assigned a level based upon the observability of the inputs which are significant to the overall valuation.
The three-tier hierarchy of inputs is summarized below:
Level 1 – inputs are quoted prices in active markets for identical investments (e.g., equity securities, open-end investment companies)
Level 2 – other observable inputs (including, but not limited to: quoted prices for similar assets or liabilities in markets that are active, quoted prices for identical or similar assets or liabilities in markets that are not active, inputs other than quoted prices that are observable for the assets or liabilities (such as interest rates, yield curves, volatilities, prepayment speeds, loss severities, credit risks and default rates) or other market corroborated inputs) (e.g., debt securities, government securities, foreign currency exchange contracts, foreign securities utilizing international fair value pricing, broker-quoted securities, fair valued securities with observable inputs)
Level 3 – inputs are significant unobservable inputs (including the Fund’s own assumptions used to determine the fair value of investments) (e.g., fair valued securities with unobservable inputs)
Changes in inputs or methodologies used for valuing investments may result in a transfer in or out of levels within the fair value hierarchy. The inputs or methodologies used for valuing investments are not necessarily an indication of the risk associated with investing in those investments.
b. SECURITY TRANSACTIONS
Security transactions are accounted for as of trade date. Realized gains and losses on securities sold are determined on the basis of identified cost.
c. INVESTMENT INCOME AND EXPENSES
Dividend income is recorded on the ex-dividend date. Dividend and interest income on foreign securities is recorded gross of any withholding tax. Interest income, which includes amortization of premium and accretion of discount on debt securities, is accrued as earned. Non-cash dividends included in dividend income, if any, are reported at the fair market value of the securities received. Other income and expenses are recorded on an accrual basis. Expenses that cannot be directly attributed to a Fund are apportioned among the Funds in the Trust and in some cases other affiliated funds based upon their relative average net assets or number of shareholders.
Effective as of November 25, 2013, the Fund has a “balance credit” arrangement with The Bank of New York Mellon (“BNYM”), the Fund’s custodian, whereby the Fund is credited with an interest factor equal to 0.75% below the effective 90-day T-Bill rate for account balances left uninvested overnight. If the T-Bill rate falls below 0.75%, no credits will be earned. These credits serve to reduce custodian expenses that would otherwise be charged to the Fund. For the period from November 25, 2013 to September 30, 2014, the Fund’s custodian expense was not reduced.
Overdraft fees are computed at 1% above the Federal Funds rate on the day of the overdraft. For the fiscal year ended September 30, 2014, the Fund did not incur overdraft fees.
d. DIVIDENDS AND DISTRIBUTIONS
Fund distributions resulting from either net investment income or realized net capital gains, if any, will normally be declared and paid at least annually in December, as described in the Fund’s prospectus. Distributions to shareholders are recorded on the ex-dividend date. Distributions are determined in accordance with federal income tax regulations, which may differ from net investment income and net realized capital gains for financial statement purposes (U.S. GAAP). Differences may be permanent or temporary. Permanent differences are reclassified among capital accounts in the financial statements to reflect their tax character. Temporary differences arise when certain items of income, expense and gain or loss are recognized in different periods for financial statement and tax purposes; these differences will reverse at some time in the future. The differences are primarily due to differing treatments for wash sales. Permanent book and tax basis differences, if any, relating to shareholder distributions will result in reclassifications to paid-in capital.
The tax character of distributions paid during the fiscal years ended September 30, 2014 and September 30, 2013 were as follows:
| | | | | | | | |
| Distributions paid from: | | 2014 | | | 2013 | |
Ordinary income | | | — | | | $ | 96,485 | |
Short-term capital gains | | | — | | | | — | |
Long-term capital gains | | | — | | | | — | |
| | | | | | | | |
Totals | | | — | | | $ | 96,485 | |
| | | | | | | | |
As of September 30, 2014, the components of distributable earnings (excluding unrealized appreciation/depreciation) on a tax basis consisted of:
| | | | |
Capital loss carryforward | | $ | 25,926,922 | |
Undistributed ordinary income | | | — | |
Undistributed short-term capital gains | | | — | |
Undistributed long-term capital gains | | | — | |
Late-year loss deferral | | | 599,248 | |
e. FEDERAL TAXES
The Fund intends to comply with the requirements under Subchapter M of the Internal Revenue Code of 1986, as amended, to distribute substantially all of its taxable income and gains to its shareholders and to meet certain diversification and income requirements with respect to investment companies. Therefore, no provision for federal income or excise tax is included in the accompanying financial statements.
Additionally, based on the Fund’s understanding of the tax rules and rates related to income, gains and transactions for the foreign jurisdictions in which it invests, the Fund will provide for foreign taxes, and where appropriate, deferred foreign taxes.
Management has analyzed the Fund’s tax positions taken on federal income tax returns as of September 30, 2014, and for all open tax years (generally, the three prior taxable years), and has concluded that no provision for federal income tax is required in the Fund’s financial statements. Additionally, the Fund
| | |
| | | Notes to Financial Statements (continued) |
is not aware of any tax position for which it is reasonably possible that the total amounts of unrecognized tax benefits will change materially in the next twelve months.
Net capital losses incurred in taxable years beginning after the enactment of the Regulated Investment Company Modernization Act of 2010, post-enactment capital losses may be carried forward for an unlimited time period. Such losses will be required to be utilized prior to any loss carryovers incurred in pre-enactment taxable years, which generally expire eight years following the close of the taxable year in which they were incurred. As a result of this ordering rule, pre-enactment capital loss carryovers may be more likely to expire unused. Additionally, post-enactment capital losses that are carried forward retain their tax character as either short-term or long-term capital losses, unlike pre-enactment losses which are considered all short-term.
f. CAPITAL LOSS CARRYOVERS AND DEFERRALS
As of September 30, 2014, the Fund had accumulated net realized capital loss carryovers from securities transactions for federal income tax purposes as shown in the following chart. These amounts may be used to offset future realized capital gains, if any, through the expiration dates listed or in the case of post-enactment losses, for an unlimited time period.
| | | | | | | | | | | | |
| | | Capital Loss
Carryover Amounts | | | | |
| | | | | | | | | Expires | |
| | | Short-Term | | | Long-Term | | | September 30, | |
(Pre-Enactment) | | $ | 25,926,922 | | | | — | | | | 2018 | |
| | | | | | | | | | | | |
For the fiscal year ended September 30, 2014, the Fund utilized capital loss carryovers in the amount of $15,393,523.
g. CAPITAL STOCK
The Trust’s Declaration of Trust authorizes for each series the issuance of an unlimited number of shares of beneficial interest, without par value. The Fund records sales and repurchases of its capital stock on the trade date. The cost of securities contributed to the Fund in connection with the issuance of shares is based on the valuation of those securities in accordance with the Fund’s policy on investment valuation.
At September 30, 2014, certain affiliated shareholders of record, individually or collectively, held greater than 10% of the net assets of the Fund as follows: one owns 97%. Transactions by this shareholder may have a material impact on the Fund.
h. REPURCHASE AGREEMENTS
The Fund may enter into repurchase agreements provided that the value of the underlying collateral, including accrued interest, will equal or exceed the value of the repurchase agreement during the term of the agreement. The underlying collateral for all repurchase agreements is held in safekeeping by the Fund’s custodian or at the Federal Reserve Bank. If the seller defaults and the value of the collateral declines, or if bankruptcy proceedings commence with respect to the seller of the security, realization of the collateral by the Fund may be delayed
or limited. At September 30, 2014, the market value of repurchase agreements outstanding was $6,431,770.
2. AGREEMENTS AND TRANSACTIONS WITH AFFILIATES
The Trust has entered into an investment advisory agreement under which the Investment Manager, a subsidiary and the U.S. retail distribution arm of Affiliated Managers Group, Inc. (“AMG”), serves as investment manager to the Fund and is responsible for the Fund’s overall administration and operations. Prior to October 1, 2013, the Predecessor Fund had a similar Investment Advisory Agreement with Friess Associates, LLC (“Friess”). The Investment Manager selects subadvisors for the Fund (subject to Board approval) and monitors the subadvisor’s investment performance, security holdings and investment strategies. The Fund’s investment portfolio is managed by Friess through a subadvisory agreement between the Investment Manager and Friess relating to the Fund, and Friess Associates of Delaware, LLC (“Friess of Delaware”) through a sub-subadvisory agreement among the Investment Manager, Friess and Friess of Delaware relating to the Fund.
Investment management fees are paid directly by the Fund to the Investment Manager based on average daily net assets. For the fiscal year ended September 30, 2014, the Fund paid an investment management fee at the annual rate of 1.00% of the average daily net assets of the Fund. Prior to October 1, 2013, the Predecessor Fund paid a management fee to Friess at the same investment management fee rate.
The Investment Manager has contractually agreed, through at least February 1, 2016, to waive management fees (but not below zero) and/or reimburse Fund expenses in order to limit total annual Fund operating expenses after fee waiver and expense reimbursements (exclusive of taxes, interest (including interest incurred in connection with bank and custody overdrafts), brokerage commissions and other transaction costs, acquired fund fees and expenses, and extraordinary expenses) to 1.95% of the Fund’s average daily net assets subject to later reimbursement by the Fund in certain circumstances. The contractual expense limitation may only be terminated in the event the Investment Manager or a successor ceases to be the investment manager of the Fund or a successor fund, by mutual agreement of the Investment Manager and the AMG Funds’ Board of Trustees, or in the event of the Fund’s liquidation unless the Fund is reorganized or is a party to a merger in which the surviving entity is successor to the accounting and performance information of the Fund. Prior to October 1, 2013, the Predecessor Fund had similar arrangements in place.
| | |
| | | Notes to Financial Statements (continued) |
The Fund is obligated to repay the Investment Manager such amounts waived, paid or reimbursed in future years provided that the repayment occurs within thirty-six (36) months after the waiver or reimbursement and that such repayment would not cause the Fund’s total annual operating expenses after fee waiver and expense reimbursement in any such future year to exceed the Fund’s expense contractual expense limitation amount. For the fiscal year ended September 30, 2014, the Fund’s expenses were not reimbursed.
The Fund has entered into an Administration and Shareholder Servicing Agreement under which the Investment Manager serves as the Fund’s administrator (the “Administrator”) and is responsible for all aspects of managing the Fund’s operations, including administration and shareholder services to the Fund, its shareholders, and certain institutions, such as bank trust departments, broker-dealers and registered investment advisers, that advise or act as intermediary with the Fund’s shareholders. The Fund pays a fee to the Administrator at the rate of 0.03% of the Fund’s average daily net assets for the first $300 million of assets under management, 0.025% for the next $200 million, and 0.02% on amounts in excess of $500 million per annum, subject to a $40,000 annual minimum.
Prior to November 25, 2013, the Predecessor Fund had in place a similar agreement with US Bancorp Fund Services, LLC.
The aggregate annual retainer paid to each Independent Trustee of the Board is $130,000, plus $7,000 or $2,500 for each regular or special meeting attended, respectively. The Independent Chairman of the Trust receives an additional payment of $35,000 per year. The Chairman of the Audit Committee receives an additional payment of $15,000 per year. The Trustees’ fees and expenses are allocated among all of the Funds in the Trusts for which the Investment Manager serves as the advisor based on the relative net assets of such Funds. The “Trustees fees and expenses” shown in the financial statements represents each Fund’s allocated portion of the total fees and expenses paid by the AMG Funds family of mutual funds (“AMG Funds family”).
For the period from October 1, 2013 to January 1, 2014, the aggregate annual retainer paid to each Independent Trustee of the Board was $105,000, plus $6,000 or $2,500 for each regular or special meeting attended, respectively. The Independent Chairman of the Trust formerly received an additional payment of $25,000 per year. The Chairman of the Audit Committee formerly received an additional payment of $10,000 per year.
Prior to October 1, 2013, the Predecessor Fund paid the Independent Directors an annual fee of $3,400 each. The Independent Chairman of the Trust formerly received an additional payment of $8,000 per year. The Chairman of the Audit Committee formerly received an additional payment of $5,000 per year. The additional payments made to the Independent Chairman of the Trust and Chairman of the Audit Committee were allocated amongst all of the funds in the Brandywine family of funds.
The Fund is distributed by AMG Distributors, Inc. (formerly Managers Distributors, Inc.) (the “Distributor”), a wholly-owned subsidiary of the Investment Manager. The Distributor serves as the distributor and underwriter for the Fund and is a registered broker-dealer and member of the Financial Industry Regulatory Authority, Inc. (“FINRA”). Shares of the Fund will be
continuously offered and will be sold directly to prospective purchasers and through brokers, dealers or other financial intermediaries who have executed selling agreements with the Distributor. Subject to the compensation arrangement discussed below, generally the Distributor bears all or a portion of the expenses of providing services pursuant to the distribution agreement, including the payment of the expenses relating to the distribution of prospectuses for sales purposes and any advertising or sales literature. Certain Trustees and Officers of the Fund are Officers and/or Directors of the Investment Manager, AMG and/or the Distributor.
The Trust has adopted a distribution and service plan (the “Plan”) with respect to the Fund in accordance with the requirements of Rule 12b-1 under the 1940 Act and the requirements of the applicable rules of FINRA regarding asset-based sales charges. Pursuant to the Plan, the Fund may make payments to reimburse the Distributor for its expenditures in financing any activity primarily intended to result in the sale of Fund shares and for maintenance and personal service provided to existing shareholders. The Plan authorizes payments to the Distributors of up to 0.25% annually of the Fund’s average daily net assets attributable to the sale of the Fund’s shares.
Prior to October 1, 2013, the Predecessor Fund had a similar plan in place.
The Board has approved reimbursement payments to the Investment Manager for shareholder servicing expenses incurred (“shareholder servicing fees”). Shareholder servicing fees include payments to third parties such as a bank, broker-dealer, trust company or other financial intermediaries who provide shareholder recordkeeping, account servicing and other services. To the extent the Investment Manager makes shareholder servicing payments to a third party, the Fund may reimburse the Investment Manager up to the amounts incurred. For the fiscal year ended September 30, 2014, the Fund paid $13,367 or 0.01%.
The Securities and Exchange Commission granted an exemptive order that permits the Fund to lend and borrow money for certain temporary purposes directly to and from other eligible Funds in the AMG Funds family. Participation in this interfund lending program is voluntary for both borrowing and lending Funds, and an interfund loan is only made if it benefits each participating Fund. The Investment Manager administers the program according to procedures approved by the Board, and the Board monitors the operation of the program. An interfund loan must comply with certain conditions set out in the exemptive order, which are designed to assure fairness and protect all participating Funds. For the fiscal year ended September 30, 2014, the Fund neither borrowed from nor lent to other Funds in the AMG Funds family.
3. LINE OF CREDIT
Prior to October 1, 2013, the Predecessor Fund had established a line of credit (“LOC”) with U.S. Bank, N.A. to be used for temporary or emergency purposes, primarily for financing redemption payments, using the securities in the Fund’s respective portfolio as collateral. The LOC matured on September 30, 2013 for the Predecessor Fund. The Fund borrowing under the LOC was limited to $4,000,000 unsecured credit, as defined in the LOC. Principal and interest of such loan under the Credit Agreement was due not more than 20 days after the date of the loan. Amounts under the credit facility bore interest at a rate per annum equal to the current prime rate minus one percent on the amount
| | |
| | | Notes to Financial Statements (continued) |
borrowed. For the fiscal year ended September 30, 2013, there were no borrowings for the Predecessor Fund.
4. PURCHASES AND SALES OF SECURITIES
Purchases and sales of securities (excluding short-term securities and U.S. Government obligations) for the fiscal year ended September 30, 2014, were $358,272,520 and $353,084,216, respectively. There were no purchases or sales of U.S. Government obligations for the Fund.
5. PORTFOLIO SECURITIES LOANED
Effective January 29, 2014, the Fund commenced participation in a securities lending program offered by BNYM (the “Program”), providing for the lending of securities to qualified brokers. Securities lending income includes earnings of such temporary cash investments, plus or minus any rebate to a borrower. These earnings (after any rebate) are then divided between BNYM, as a fee for its services under the program, and the Fund, according to agreed-upon rates. Collateral received on all securities loaned is accepted in cash and is maintained at a minimum level of 102% (105% in the case of certain foreign securities) of the market value, plus interest, if applicable, of investments on loan. It is the Fund’s policy to obtain additional collateral from or return excess collateral to the borrower by the end of the next business day, following the valuation date of the securities loaned. Therefore, the value of the collateral held may be temporarily less than the value of the securities on loan. Lending securities entails a risk of loss to the Fund if and to the extent that the market value of the securities loaned were to increase and the borrower did not increase the collateral accordingly, and the borrower fails to return the securities.
Under the terms of the Program, the Fund is indemnified for such losses by BNYM. Cash collateral is held in a separate account managed by BNYM, who is authorized to exclusively enter into overnight government repurchase agreements. BNYM bears the risk of any deficiency in the amount of the cash collateral available for return to the borrower due to any loss on the collateral invested. At September 30, 2014, the value of the securities loaned and cash collateral received was $6,258,932 and $6,431,770, respectively.
6. COMMITMENTS AND CONTINGENCIES
Under the Trust’s organizational documents, its trustees and officers are indemnified against certain liabilities arising out of the performance of their duties to the Trust. In addition, in the normal course of business, the Fund may enter into contracts and agreements that contain a variety of representations and warranties, which provide general indemnifications. The maximum exposure to the Fund under these arrangements is unknown, as this would involve future claims that may be made against a Fund that have not yet occurred. However, based on experience, the Fund had no prior claims or losses and expects the risk of loss to be remote.
7. MASTER NETTING AGREEMENTS
The Fund may enter into master netting agreements with its counterparties for the securities lending program and repurchase agreements, which provide the right, in the event of default (including bankruptcy or insolvency) for the non-defaulting party to liquidate the collateral and calculate net exposure to the defaulting party or request additional collateral. For financial reporting purposes, the Fund does not offset financial assets and financial liabilities that are subject to master netting agreements in the Statement of Assets and Liabilities. For Securities lending transactions, see Note 5.
The following table is a summary of the Fund’s open repurchase agreements which are subject to a master netting agreement as of September 30, 2014:
| | | | | | | | | | | | | | | | |
| | | | | | Gross Amount Not Offset in the | | | | |
| | | Net Amounts of | | | Statement of Assets and Liabilities | | | | |
| | | Assets Presented
in the Statement
of Assets and | | | Financial
Instruments | | | Cash Collateral | | | | |
| | | Liabilities | | | Collateral | | | Received | | | Net Amount | |
Barclays Capital | | $ | 321,578 | | | $ | 321,578 | | | | — | | | | — | |
BNP Paribas Securities Corp. | | | 1,527,548 | | | | 1,527,548 | | | | — | | | | — | |
HSBC Securities USA, Inc. | | | 1,527,548 | | | | 1,527,548 | | | | — | | | | — | |
Mizuho Securities USA, Inc. | | | 1,527,548 | | | | 1,527,548 | | | | — | | | | — | |
Morgan Stanley & Co. LLC | | | 1,527,548 | | | | 1,527,548 | | | | — | | | | — | |
| | | | | | | | | | | | | | | | |
Total | | $ | 6,431,770 | | | $ | 6,431,770 | | | | — | | | | — | |
| | | | | | | | | | | | | | | | |
8. SUBSEQUENT EVENTS
The Fund has determined that no material events or transactions occurred through the issuance date of the Fund’s financial statements which require additional disclosure in or adjustment of the Fund’s financial statements.
| | |
| | | Notes to Financial Statements (continued) |
TAX INFORMATION (unaudited)
The AMG Managers Brandywine Advisors Mid Cap Growth Fund hereby designates the maximum amount allowable of its net taxable income as qualified dividends as provided in the Jobs and Growth Tax Relief Reconciliation Act of 2003. The 2013/2014 Form 1099-DIV you receive for the Fund will show the tax status of all distributions paid to you during the year.
Pursuant to section 852 of the Internal Revenue Code, AMG Managers Brandywine Advisors Mid Cap Growth Fund hereby designates $0, as a capital gain distribution with respect to the taxable year ended September 30, 2014, or if subsequently determined to be different, the net capital gains of such year.
| | |
| | | Report of Independent Registered Public Accounting Firm |
TO THE BOARD OF TRUSTEES OF AMG FUNDS I AND THE SHAREHOLDERS OF AMG MANAGERS BRANDYWINE ADVISORS MID CAP GROWTH FUND:
In our opinion, the accompanying statement of assets and liabilities, including the schedule of portfolio investments, and the related statements of operations and of changes in net assets and the financial highlights present fairly, in all material respects, the financial position of AMG Managers Brandywine Advisors Mid Cap Growth Fund (formerly, Brandywine Advisors Midcap Growth Fund) (the “Fund”) at September 30, 2014, and the results of its operations, the changes in its net assets and the financial highlights for each of the periods indicated, in conformity with accounting principles generally accepted in the United States of America. These financial statements and financial highlights (hereafter referred to as “financial statements”) are the responsibility of the Fund’s management. Our responsibility is to express an opinion on these financial statements based on our audits. We conducted our audits of these financial statements in accordance with the standards of the Public Company Accounting Oversight Board (United States). Those standards require that we plan and perform the audit to obtain reasonable assurance about whether the financial statements are free of material misstatement. An audit includes examining, on a test basis, evidence supporting the amounts and disclosures in the financial statements, assessing the accounting principles used and significant estimates made by management, and evaluating the overall financial statement presentation. We believe that our audits, which included confirmation of securities at September 30, 2014 by correspondence with the custodian and brokers, and the application of alternative auditing procedures where securities purchased had not been received, provide a reasonable basis for our opinion.
PricewaterhouseCoopers LLP
Boston, Massachusetts
October 17, 2014
| | |
| | | AMG Funds Trustees and Officers |
The Trustees and Officers of the Trust, their business addresses, principal occupations for the past five years and dates of birth are listed below. The Trustees provide broad supervision over the affairs of the Trust and the Funds. The Trustees are experienced executives who meet periodically throughout the year to oversee the Funds’ activities, review contractual arrangements with
companies that provide services to the Funds, and review the Funds’ performance. Unless otherwise noted, the address of each Trustee or Officer is the address of the Trust: 800 Connecticut Avenue, Norwalk, Connecticut 06854.
There is no stated term of office for Trustees. Trustees serve until their resignation, retirement or removal in accordance with the Trust’s
organizational documents and policies adopted by the Board from time to time. The Chairman of the Trustees, President, Treasurer and Secretary of the Trust are elected by the Trustees annually. Other officers hold office at the pleasure of the Trustees.
Independent Trustees
The following Trustees are not “interested persons” of the Trust within the meaning of the 1940 Act:
| | |
Number of Funds Overseen in Fund Complex | | Name, Date of Birth, Principal Occupation(s) During Past 5 Years and Other Directorships Held by Trustee |
• Trustee since 2012 • Oversees 43 Funds in Fund Complex | | Bruce B. Bingham, 12/1/48 Partner, Hamilton Partners (real estate development firm) (1987-Present); Trustee of Aston Funds (25 portfolios) (2014-Present). |
| |
• Independent Chairman • Trustee since 2000 • Oversees 43 Funds in Fund Complex | | William E. Chapman II, 9/23/41 President and Owner, Longboat Retirement Planning Solutions (1998-Present); Hewitt Associates, LLC (part time) (provider of Retirement and Investment Education Seminars) (2002-2009); Trustee Emeritus of Bowdoin College (2013-Present); Trustee of Bowdoin College (2002-2013); Director of Harding, Loevner Funds, Inc. (6 portfolios); Trustee of Third Avenue Trust (5 portfolios); Trustee of Third Avenue Variable Trust (1 portfolio); Trustee of Aston Funds (25 portfolios) (2010-Present). |
| |
• Trustee since 2000 • Oversees 43 Funds in Fund Complex | | Edward J. Kaier, 9/23/45 Attorney at Law and Partner, Teeters Harvey Marrone & Kaier LLP (2007-Present); Attorney at Law and Partner, Hepburn Willcox Hamilton & Putnam, LLP (1977-2007); Trustee of Third Avenue Trust (5 portfolios); Trustee of Third Avenue Variable Trust (1 portfolio); Trustee of Aston Funds (25 portfolios) (2010-Present). |
| |
• Trustee since 2013 • Oversees 45 Funds in Fund Complex | | Kurt A. Keilhacker,10/5/63 Managing Member, TechFund Capital (1997-Present); Managing Member, TechFund Europe (2000-Present); Trustee, Gordon College (2001-Present); Board Member, 6wind SA, (2002-Present); Managing Member, Clapham Partners I, LLC (2013-Present); Trustee of Aston Funds (25 portfolios) (2014-Present). |
| |
• Trustee since 2000 • Oversees 43 Funds in Fund Complex | | Steven J. Paggioli, 4/3/50 Independent Consultant (2002-Present); Formerly Executive Vice President and Director, The Wadsworth Group (1986-2001); Executive Vice President, Secretary and Director, Investment Company Administration, LLC (1990-2001); Vice President, Secretary and Director, First Fund Distributors, Inc. (1991-2001); Trustee, Professionally Managed Portfolios (45 portfolios); Advisory Board Member, Sustainable Growth Advisors, LP; Independent Director, Chase Investment Counsel (2008 – Present); Trustee of Aston Funds (25 portfolios) (2010-Present). |
| |
• Trustee since 2013 • Oversees 43 Funds in Fund Complex | | Richard F. Powers III, 2/2/46 Adjunct Professor, Boston College (2011-Present); Trustee of Aston Funds (25 portfolios) (2014-Present); Director of Ameriprise Financial Inc. (2005-2009); President and CEO of Van Kampen Investments Inc. (1998-2003). |
| |
• Trustee since 2000 • Oversees 45 Funds in Fund Complex | | Eric Rakowski, 6/5/58 Professor, University of California at Berkeley School of Law (1990-Present); Director of Harding, Loevner Funds, Inc. (6 portfolios); Trustee of Third Avenue Trust (5 portfolios); Trustee of Third Avenue Variable Trust (1 portfolio); Trustee of Aston Funds (25 portfolios) (2010-Present). |
| |
• Trustee since 2013 • Oversees 45 Funds in Fund Complex | | Victoria L. Sassine, 8/11/65 Lecturer, Babson College (2007 – Present); Trustee of Aston Funds (25 portfolios) (2014-Present). |
| |
• Trustee since 2000 • Oversees 43 Funds in Fund Complex | | Thomas R. Schneeweis, 5/10/47 Professor Emeritus, University of Massachusetts (2013 - Present); Partner, S Capital Management, LLC (2007-Present); President, TRS Associates (1982-Present); Director, CISDM at the University of Massachusetts, (1996-2013); President, Alternative Investment Analytics, LLC, (formerly Schneeweis Partners, LLC) (2001-2013); Professor of Finance, University of Massachusetts (1977-2013); Partner, White Bear Partners, LLC (2007-2010); Partner, Northampton Capital Management, LLC (2004-2010); Trustee of Aston Funds (25 portfolios) (2010-Present). |
| | |
| | | AMG Funds Trustees and Officers (continued) |
Interested Trustees
Each Trustee in the following table is an “interested person” of the Trust within the meaning of the 1940 Act. Ms. Carsman is an interested person of the Trust within the meaning of the 1940 Act by virtue of her position with, and interest in securities of, AMG, and her former position as Chief Legal Officer of the Trust.
| | |
Number of Funds Overseen in Fund Complex | | Name, Date of Birth, Principal Occupation(s) During Past 5 Years and Other Directorships Held by Trustee |
• Trustee since 2011 • Oversees 45 Funds in Fund Complex | | Christine C. Carsman, 4/2/52 Senior Vice President and Deputy General Counsel, Affiliated Managers Group, Inc. (2011-Present); Trustee of Aston Funds (25 portfolios) (2014-Present); Senior Vice President and Chief Regulatory Counsel, Affiliated Managers Group, Inc. (2007-2011); Vice President and Chief Regulatory Counsel, Affiliated Managers Group, Inc. (2004-2007); Secretary and Chief Legal Officer, AMG Funds, AMG Funds I, AMG Funds II and AMG Funds III (2004-2011); Senior Counsel, Vice President and Director of Operational Risk Management and Compliance, Wellington Management Company, LLP (1995-2004). |
Officers
| | |
Position(s) Held with Fund and Length of Time Served | | Name, Date of Birth, Principal Occupation(s) During Past 5 Years |
• President since 2014 • Principal Executive Officer since 2014 | | Jeffrey T. Cerutti, 2/7/68 Chief Executive Officer, AMG Funds LLC (2014-Present); Director, President and Principal, AMG Distributors, Inc. (2014-Present); President and Principal Executive Officer, AMG Pantheon Private Equity Fund LLC and AMG Pantheon Private Equity Master Fund LLC (2014-Present); President, VP Distributors, (2011-2014); Executive Vice President, Head of Distribution, Virtus Investment Partners, Inc. (2010-2014); Managing Director, Head of Sales, UBS Global Asset Management (2001-2010). |
| |
• Chief Operating Officer since 2007 | | Keitha L. Kinne, 5/16/58 Chief Operating Officer, AMG Funds LLC (2007-Present); Chief Investment Officer, AMG Funds LLC (2008-Present); Chief Operating Officer, AMG Distributors, Inc. (2007-Present); Chief Operating Officer, AMG Pantheon Private Equity Fund LLC and AMG Pantheon Private Equity Master Fund LLC (2014-Present); Managing Partner, AMG Funds LLC (2007-2014); President, AMG Funds (2012-2014); President, AMG Distributors, Inc. (2012-2014); Managing Director, Legg Mason & Co., LLC (2006-2007); Managing Director, Citigroup Asset Management (2004-2006). |
| |
• Secretary since 2011 • Chief Legal Officer since 2011 | | Lewis Collins, 2/22/66 Senior Vice President and Senior Counsel, Affiliated Managers Group, Inc. (2010-Present); Secretary, AMG Pantheon Private Equity Fund LLC and AMG Pantheon Private Equity Master Fund LLC (2014-Present); Vice President and Senior Counsel, Affiliated Managers Group, Inc. (2006-2010); Senior Counsel, Affiliated Managers Group, Inc. (2002-2006); Attorney, Ropes & Gray LLP (1998-2002). |
| |
• Chief Financial Officer since 2007 • Treasurer since 1999 • Principal Financial Officer since 1999 | | Donald S. Rumery, 5/29/58 Senior Vice President, AMG Funds LLC (2005-Present); Treasurer, AMG Funds III (1995-Present); Treasurer, AMG Funds I and AMG Funds II (2000-Present); Chief Financial Officer, AMG Funds I, AMG Funds II and AMG Funds III (2007-Present); Treasurer, Principal Financial Officer and Principal Accounting Officer, AMG Pantheon Private Equity Fund LLC and AMG Pantheon Private Equity Master Fund LLC (2014-Present); Treasurer and Chief Financial Officer, AMG Distributors, Inc. (2000-2012); Vice President, AMG Funds LLC (1994-2004). |
| |
• Assistant Treasurer since 2014 | | John C. Ball, 1/9/76 Vice President, Assistant Treasurer, AMG Funds LLC (2014-Present); Assistant Treasurer, AMG Pantheon Private Equity Fund, LLC and AMG Pantheon Private Equity Master Fund, LLC (2014-Present); Vice President, State Street Corp. (2010-2014); Vice President, State Street International (Ireland) Limited (2007-2010). |
| |
• Chief Compliance Officer since 2010 | | John J. Ferencz, 3/9/62 Vice President, Legal and Compliance, AMG Funds LLC (2010-Present); Senior Compliance Analyst, Mutual Funds and Regulatory, GE Asset Management Incorporated (2005-2010). |
| |
• Assistant Secretary since 2011 | | Michael S. Ponder, 9/12/73 Senior Vice President and Counsel, AMG Funds LLC (2011-Present); Attorney, DeNovo Legal (2009-2010); Vice President, Credit Suisse (2007-2009); Associate, Willkie Farr & Gallagher LLP (2006-2007). |
| |
• Anti-Money Laundering Compliance Officer since 2014 | | Patrick J. Spellman, 3/15/74 Senior Vice President, Chief Compliance Officer, Legal and Compliance, AMG Funds LLC (2011-Present); Chief Compliance Officer, AMG Distributors, Inc., (2010-Present); Anti-Money Laundering Compliance Officer, AMG Pantheon Private Equity Fund, LLC and AMG Pantheon Private Equity Master Fund, LLC (2014-Present); Compliance Manager, Legal and Compliance, Affiliated Managers Group, Inc. (2005-2011). |
THIS PAGE INTENTIONALLY LEFT BLANK
INVESTMENT MANAGER AND ADMINISTRATOR
AMG Funds LLC
800 Connecticut Avenue
Norwalk, CT 06854
(800) 835-3879
DISTRIBUTOR
AMG Distributors, Inc.
800 Connecticut Avenue
Norwalk, CT 06854
(800) 835-3879
SUBADVISOR
Friess Associates, LLC
P.O. Box 576
Jackson, Wyoming 83001
Friess Associates of Delaware, LLC P.O. Box 4166
Greenville, DE 19807
CUSTODIAN
The Bank of New York Mellon
2 Hanson Place
Brooklyn, NY 11217
LEGAL COUNSEL
Ropes & Gray LLP
Prudential Tower, 800 Boylston Street Boston, MA 02199-3600
TRANSFER AGENT
BNY Mellon Investment Servicing (US) Inc.
Attn: AMG Funds
P.O. Box 9769
Providence, RI 02940
(800) 548-4539
This report is prepared for the Fund’s shareholders. It is authorized for distribution to prospective investors only when preceded or accompanied by an effective prospectus. To receive a free copy of the prospectus or Statement of Additional Information, which includes additional information about Fund Trustees, please contact us by calling 800.835.3879. Distributed by AMG Distributors, Inc., member FINRA.
Current net asset values per share for the Fund are available on the Fund’s website at www.amgfunds.com.
A description of the policies and procedures the Fund uses to vote its proxies is available: (i) without charge, upon request, by calling 800.835.3879, or (ii) on the Securities and Exchange Commission’s (SEC) website at www.sec.gov For information regarding the Fund’s proxy voting record for the 12-month period ended June 30, call 800.835.3879 or visit the SEC website at www.sec.gov.
The Fund files its complete schedule of portfolio holdings with the SEC for the first and third quarters of each fiscal year on Form N-Q. The Fund’s Forms N-Q are available on the SEC’s website at www.sec.gov. A Fund’s Forms N-Q may be reviewed and copied at the SEC’s Public Reference Room in Washington, DC. Information on the operation of the Public Reference Room may be obtained by calling 1-800-SEC-0330. To review a complete list of the Fund’s portfolio holdings, or to view the most recent quarterly holdings report, semiannual report, or annual report, please visit www.amgfunds.com.
AFFILIATE SUBADVISED FUNDS
ALTERNATIVE FUNDS
AMG FQ Global Alternatives
First Quadrant, L.P.
BALANCED FUNDS
| AMG | Chicago Equity Partners Balanced |
Chicago Equity Partners, LLC
AMG FQ Global Risk-Balanced
(formerly Managers AMG FQ Global Essentials)
First Quadrant, L.P.
EQUITY FUNDS
AMG FQ Tax-Managed U.S. Equity AMG FQ U.S. Equity
First Quadrant, L.P.
AMG Frontier Small Cap Growth
Frontier Capital Management Company, LLC
AMG GW&K Small Cap Core
(formerly GW&K Small Cap Equity)
Gannett Welsh & Kotler, LLC
| AMG | Renaissance International Equity |
| AMG | Renaissance Large Cap Growth |
The Renaissance Group LLC
AMG SouthernSun Small Cap
AMG SouthernSun U.S. Equity
SouthernSun Asset Management, LLC
AMG Systematic Large Cap Value
(formerly Systematic Value)
AMG Systematic Mid Cap Value
Systematic Financial Management, L.P.
AMG TimesSquare All Cap Growth
(formerly Managers AMG TSCM Growth Equity)
| AMG | TimesSquare International Small Cap |
AMG TimesSquare Mid Cap Growth
| AMG | TimesSquare Small Cap Growth |
TimesSquare Capital Management, LLC
| AMG | Trilogy Emerging Markets Equity |
AMG Trilogy Global Equity
| AMG | Trilogy International Small Cap |
Trilogy Global Advisors, L.P.
AMG Yacktman Focused
AMG Yacktman
Yacktman Asset Management LP
FIXED INCOME FUNDS
AMG GW&K Enhanced Core Bond
(formerly Managers AMG GW&K Fixed Income)
AMG GW&K Municipal Bond
| AMG | GW&K Municipal Enhanced Yield |
Gannett Welsh & Kotler, LLC
OPEN-ARCHITECTURE FUNDS
EQUITY FUNDS
| AMG | Managers Brandywine Advisors Mid Cap Growth |
AMG Managers Brandywine Blue
AMG Managers Brandywine
Friess Associates, LLC
| AMG | Managers Cadence Capital Appreciation |
| AMG | Managers Cadence Emerging Companies |
AMG Managers Cadence Mid Cap
Cadence Capital Management, LLC
| AMG | Managers Emerging Opportunities |
(formerly Managers Micro-Cap)
Lord, Abbett & Co. LLC
WEDGE Capital Management L.L.P.
Next Century Growth Investors LLC
RBC Global Asset Management (U.S.) Inc.
| AMG | Managers Essex Small/Micro Cap Growth |
Essex Investment Management Co., LLC
| AMG | Managers Real Estate Securities |
CenterSquare Investment Management, Inc.
| AMG | Managers Skyline Special Equities |
(formerly Skyline Special Equities Portfolio)
Skyline Asset Management, L.P.
AMG Managers Special Equity
Ranger Investment Management, L.P.
Lord, Abbett & Co. LLC
Smith Asset Management Group, L.P.
Federated MDTA LLC
FIXED INCOME FUNDS
AMG Managers Bond
| AMG | Managers Global Income Opportunity |
Loomis, Sayles & Co., L.P.
AMG Managers High Yield
J.P. Morgan Investment Management Inc.
| AMG | Managers Intermediate Duration Government |
| AMG | Managers Short Duration Government |
Amundi Smith Breeden LLC
AMG Managers Total Return Bond
(formerly Managers PIMCO Bond)
Pacific Investment Management Co. LLC
| | |

| | | www.amgfunds.com |
Item 2. CODE OF ETHICS
Registrant has adopted a Code of Ethics. See attached Exhibit (a)(1).
Item 3. AUDIT COMMITTEE FINANCIAL EXPERT
Registrant’s Board of Trustees has determined that independent Trustee Mr. Steven J. Paggioli qualifies as an Audit Committee Financial Expert. Mr. Paggioli is “independent” as such term is defined in Form N-CSR.
Item 4. PRINCIPAL ACCOUNTANT FEES AND SERVICES
(a) Audit Fees
The aggregate fees billed by the Funds’ independent registered public accounting firm, PricewaterhouseCoopers LLP (“PwC”), to the Funds for the Funds’ two most recent fiscal years for professional services rendered for audits of annual financial statements, or services that are normally provided in connection with statutory and regulatory filings or engagements (“Audit Fees”) were as follows:
| | | | | | | | |
| | | Fiscal 2014 | | | Fiscal 2013 | |
AMG Managers Brandywine Fund | | $ | 24,969 | | | $ | 30,392 | |
AMG Managers Brandywine Blue Fund | | $ | 22,307 | | | $ | 31,747 | |
AMG Managers Brandywine Advisors Mid Cap Growth Fund | | $ | 21,268 | | | $ | 21,338 | |
(b) Audit-Related Fees
There were no fees billed by PwC to the Funds in its two recent fiscal years for services rendered for assurance and related services that are reasonably related to the performance of the audit or review of the Fund’s financial statements, but are not reported as Audit Fees (“Audit-Related Fees”).
For the Funds’ two most recent fiscal years, there were no Audit-Related Fees billed by PwC for engagements related directly to the operations and financial reporting of one or more Funds by a Fund Service Provider. A Fund Service Provider is (a) any investment adviser to the Fund (not including any Subadvisor whose role is primarily portfolio management and is subcontracted with or overseen by another investment adviser) or (b) any entity that provides ongoing services to the Fund and is controlling, controlled by or under common control with a Fund investment adviser described in (a).
(c) Tax Fees
The aggregate fees billed by PwC to the Funds for the two most recent fiscal years for professional services rendered for tax compliance, tax advice, and tax planning (“Tax Fees”) were as follows:
| | | | | | | | |
| | | Fiscal 2014 | | | Fiscal 2013 | |
AMG Managers Brandywine Fund | | $ | 4,080 | | | $ | 0 | |
AMG Managers Brandywine Blue Fund | | $ | 4,080 | | | $ | 0 | |
AMG Managers Brandywine Advisors Mid Cap Growth Fund | | $ | 4,080 | | | $ | 0 | |
For the Funds’ two most recent fiscal years, Tax Fees billed by PwC for engagements by Fund Service Providers that related directly to the operations and financial reporting of the Funds were $0 for fiscal 2014 and $0 for fiscal 2013, respectively.
The services for which Tax Fees were charged comprise all services performed by professional staff in PwC’s tax division except those services related to the audit. Typically, this category would include fees for tax compliance, tax planning, and tax advice. Tax compliance, tax advice, and tax planning services include preparation of original and amended tax returns, claims for refund and tax payment-planning services, assistance with tax audits and appeals, tax advice related to mergers and acquisitions and requests for rulings or technical advice from taxing authorities.
(d) All Other Fees
There were no other fees billed by PwC to the Funds for all other non-audit services (“Other Fees”) during the Funds’ two most recent fiscal years. During the same period, there were no Other Fees billed by PwC for engagements by Fund Service Providers that related directly to the operations and financial reporting of the Funds.
(e) (1)According to policies adopted by the Audit Committee, services provided by PwC to the Funds must be pre-approved by the Audit Committee. On an annual basis, the Audit Committee reviews and pre-approves various types of services that PwC may perform for the Funds without specific approval of each engagement, subject to specified budget limitations. As contemplated by the Sarbanes-Oxley Act of 2002 and related SEC rules, the Audit Committee also pre-approves non-audit services provided by PwC to any Fund Service Provider for any engagement that relates directly to the operations and financial reporting of the Funds. Any engagement that is not already pre-approved or that will exceed a pre-approved budget must be submitted to the Audit Committee for pre-approval. The Chairman of the Audit Committee is authorized on behalf of the Board of Trustees and the Audit Committee to approve the engagement of PwC to perform non-audit services subject to certain conditions, including notification to the Audit Committee of such pre-approval not later than the next meeting of the Audit Committee following the date of such pre-approval.
(e) (2) None.
(f) Not applicable.
(g) The aggregate fees billed by PwC in 2014 and 2013 for non-audit services rendered to the Funds and Fund Service Providers were $305,390 and $137,611, respectively. For the fiscal year ended September 30, 2014, this amount reflects the amounts disclosed above in Item 4(b),(c),(d), plus $48,000 in fees billed to the Fund Service Providers for non-audit services that did not relate directly to the operations and financial reporting of the Funds. For the fiscal year ended September 30, 2013, this amount reflects the amounts disclosed above in Item 4(b),(c),(d), with no additional fees billed to the Fund Service Providers for non-audit services that did not relate directly to the operations and financial reporting of the Funds.
(h) The Trust’s Audit Committee has considered whether the provision of non-audit services by registrant’s independent registered public accounting firm to the registrant’s investment advisor, and any entity controlling, controlled, or under common control with the investment advisor that provided ongoing services to the registrant that were not pre-approved by the Committee (because such services did not relate directly to the operations and financial reporting of the registrant) was compatible with maintaining the independence of the independent registered public accounting firm.
Item 5. AUDIT COMMITTEE OF LISTED REGISTRANTS
Not applicable.
Item 6. SCHEDULE OF INVESTMENTS
The schedule of investments in unaffiliated issuers as of the close of the reporting period is included as part of the shareholder report contained in Item 1 hereof.
Item 7. DISCLOSURE OF PROXY VOTING POLICIES AND PROCEDURES FOR CLOSED-END MANAGEMENT INVESTMENT COMPANIES
Not applicable.
Item 8. PORTFOLIO MANAGERS OF CLOSED-END MANAGEMENT INVESTMENT COMPANIES
Not applicable.
Item 9. PURCHASES OF EQUITY SECURITIES BY CLOSED-END MANAGEMENT INVESTMENT COMPANIES AND AFFILIATED PURCHASERS
Not applicable.
Item 10. SUBMISSION OF MATTERS TO A VOTE OF SECURITY HOLDERS
Not applicable.
Item 11. CONTROLS AND PROCEDURES
(a) The Registrant’s principal executive and principal financial officers have concluded, based on their evaluation of the registrant’s disclosure controls and procedures as of a date within 90 days of the filing of this report, that the Registrant’s disclosure controls and procedures are reasonably designed to ensure that information required to be disclosed by the Registrant on Form N-CSR is recorded, processed, summarized and reported within the required time
periods and that information required to be disclosed by the registrant in the reports that it files or submits on Form N-CSR is accumulated and communicated to the Registrant’s management, including its principal executive and principal financial officers, as appropriate to allow timely decisions regarding required disclosure.
(b) There were no changes in the Registrant’s internal control over financial reporting during the Registrant’s fourth fiscal quarter of the period covered by this report that have materially affected, or are reasonably likely to affect, the internal control over financial reporting.
Item 12. EXHIBITS
| | |
| |
| (a) (1) | | Any Code of Ethics or amendments hereto. Filed herewith. |
| |
| (a) (2) | | Certifications pursuant to Rule 30a-2(a) under the Investment Company Act of 1940 - Filed herewith. |
| |
| (a) (3) | | Not applicable. |
| |
| (b) | | Certifications pursuant to Rule 30a-2(b) under the Investment Company Act of 1940 - Filed herewith. |
SIGNATURES
Pursuant to the requirements of the Securities Exchange Act of 1934 and the Investment Company Act of 1940, the registrant has duly caused this report to be signed on its behalf by the undersigned, thereunto duly authorized.
AMG FUNDS I
| | |
| By: | | /s/ Jeffrey T. Cerutti |
| | Jeffrey T. Cerutti, President |
| |
| Date: | | October 30, 2014 |
Pursuant to the requirements of the Securities Exchange Act of 1934 and the Investment Company Act of 1940, this report has been signed below by the following persons on behalf of the registrant and in the capacities and on the dates indicated.
| | |
| By: | | /s/ Jeffrey T. Cerutti |
| | Jeffrey T. Cerutti, President |
| |
| Date: | | October 30, 2014 |
| | |
| By: | | /s/ Donald S. Rumery |
| | Donald S. Rumery, Chief Financial Officer |
| |
| Date: | | October 30, 2014 |