UNITED STATES
SECURITIES AND EXCHANGE COMMISSION
Washington, D.C. 20549
FORM N-CSR
CERTIFIED SHAREHOLDER REPORT OF REGISTERED
MANAGEMENT INVESTMENT COMPANIES
Investment Company Act file number: 811-06520
MANAGERS TRUST I
(Exact name of registrant as specified in charter)
800 Connecticut Avenue, Norwalk, Connecticut 06854
(Address of principal executive offices) (Zip code)
Managers Investment Group LLC
800 Connecticut Avenue, Norwalk, Connecticut 06854
(Name and address of agent for service)
Registrant’s telephone number, including area code: (203) 299-3500
Date of fiscal year end: OCTOBER 31
Date of reporting period: NOVEMBER 1, 2011 – OCTOBER 31, 2012
(Annual Shareholder Report)
| Item 1. | Reports to Shareholders |
ANNUAL REPORT
Managers AMG
October 31, 2012
FQ Tax-Managed U.S. Equity Fund
FQ U.S. Equity Fund
FQ Global Alternatives Fund
FQ Global Essentials Fund

AR014-1012
Managers AMG FQ Funds
Annual Report – October 31, 2012
| | | | |
TABLE OF CONTENTS | | Page | |
| |
LETTER TO SHAREHOLDERS | | | 1 | |
| |
ABOUT YOUR FUND’S EXPENSES | | | 4 | |
| |
INVESTMENT MANAGER’S COMMENTS, FUND SNAPSHOTS, AND SCHEDULES OF PORTFOLIO INVESTMENTS | | | | |
| |
Managers AMG FQ Tax-Managed U.S. Equity Fund | | | 5 | |
| |
Managers AMG FQ U.S. Equity Fund | | | 11 | |
| |
Managers AMG FQ Global Alternatives Fund | | | 17 | |
| |
Managers AMG FQ Global Essentials Fund | | | 20 | |
| |
NOTES TO SCHEDULES OF PORTFOLIO INVESTMENTS | | | 23 | |
| |
FINANCIAL STATEMENTS | | | | |
| |
Statement of Assets and Liabilities | | | 31 | |
Balance sheets, net asset value (NAV) per share computations and cumulative undistributed amounts | | | | |
| |
Statement of Operations | | | 33 | |
Detail of sources of income, expenses, and realized and unrealized gains (losses) during the fiscal year | | | | |
| |
Statements of Changes in Net Assets | | | 34 | |
Detail of changes in assets for the past two fiscal years | | | | |
| |
FINANCIAL HIGHLIGHTS | | | 36 | |
Historical net asset values per share, distributions, total returns, income and expense ratios, turnover ratios and net assets | | | | |
| |
NOTES TO FINANCIAL STATEMENTS | | | 44 | |
Accounting and distribution policies, details of agreements and transactions with Fund management and affiliates, and descriptions of certain investment risks | | | | |
| |
REPORT OF INDEPENDENT REGISTERED PUBLIC ACCOUNTING FIRM | | | 54 | |
| |
TRUSTEES AND OFFICERS | | | 55 | |
| |
ANNUAL RENEWAL OF INVESTMENT ADVISORY AND SUB-ADVISORY AGREEMENTS | | | 56 | |
Nothing contained herein is to be considered an offer, sale or solicitation of an offer to buy shares of any series of the Managers Family of Funds. Such offering is made only by Prospectus, which includes details as to offering price and other material information.
Letter to Shareholders
Dear Shareholder:
Our foremost goal at Managers Investment Group (“MIG”) is to structure and manage mutual funds that will help our shareholders and clients successfully reach their investment goals and objectives.
Each of our Funds is geared to provide you with exposure to a specific asset class or style of investing. We believe investors tend to use our Funds as part of their broader portfolio in order to tailor their asset allocation to meet their individual needs. Most of our Funds, like those detailed in this report, are therefore designed to be building blocks.
At MIG, we have overall responsibility for the investment management and administration of the Funds. As a “manager of managers,” we work with external investment managers that make the day-to-day investment decisions in the Funds (the “Portfolio Managers”). We devote considerable resources to our disciplined process of identifying and selecting Portfolio Managers for the Funds. As a manager of managers, MIG performs many activities to monitor the ongoing investment, compliance, and administrative aspects of all of the Funds, which we believe gives our shareholders added confidence in their investments.
Our parent company, Affiliated Managers Group (“AMG”) is a global asset management company with ownership interests in a diverse group of boutique investment management firms (its “Affiliates”). MIG has the unique opportunity to access the investment skills and acumen of some of AMG’s Affiliates. The set of our Funds managed by these proprietary firms also benefits from our activities to monitor the investment, compliance, and administrative aspects of the Funds.
Below is a brief overview of the securities markets and the performance results of the Funds. Following this letter, we also provide the Portfolio Managers’ discussion of their investment management approach, performance results, and market outlook.
Both global equities and bonds posted solid gains for the prior 12 months, once again, despite significant macroeconomic headwinds. Markets continued to follow a “risk on, risk off” pattern throughout the year with sharp turns driven by investor confidence, or lack thereof, in the ability of fiscal and monetary measures to spark sluggish growth higher. Despite the solid returns generated by equities, investors continued to flee these assets for the safety of fixed income assets even with yields hovering at record lows. Despite compelling valuations and equities continuing to reach new multi-year highs, investors confidence remains shaken after the great recession and they are putting a premium price on safety and the ability to return, as opposed to grow, capital.
Against this backdrop, for the one-year period ended October 31, 2012, the Managers AMG FQ U.S. Equity Fund (“U.S. Equity Fund”) returned 11.50% and the Managers AMG FQ Tax-Managed U.S. Equity Fund (“Tax-Managed Fund”) returned 12.77%, compared to 14.75% for the benchmark Russell 3000® Index. The Managers AMG FQ Global Alternatives Fund (“Global Alternatives Fund”) returned -1.40% for the one-year period ended October 31, 2012, compared to a return of 0.04% for its benchmark, the Citigroup 1-Month U.S. Treasury Bill. Finally, the Managers AMG FQ Global Essentials Fund (“Global Essentials Fund”) returned 8.75% for its Investor Class, compared with 7.44% for its benchmark, which consists of 60% of the return of MSCI World (hedged) Index and 40% of the return of the Citigroup World Government Bond (hedged) Index for this same one-year period. Performance stated above is for each Fund’s Class A Shares at Net Asset Value unless otherwise stated. Other share classes would have experienced different results.
1
Letter to Shareholders (continued)
| | | | | | | | | | | | | | | | | | | | | | | | |
Periods Ended 10/31/2012 | | Six Months | | | One Year | | | Three Years | | | Five Years | | | Ten Years | | | Inception Date | |
Managers AMG FQ Tax-Managed U.S. Equity Fund | | | | | | | | | | | | | | | | | | | | | | | | |
Class A (No Load) | | | 0.00 | % | | | 12.77 | % | | | 15.40 | % | | | (1.38 | )% | | | — | | | | 03/01/2006 | |
Class C (No Load) | | | (0.40 | )% | | | 11.92 | % | | | 14.54 | % | | | (2.11 | )% | | | — | | | | 03/01/2006 | |
Institutional Class | | | 0.07 | % | | | 13.00 | % | | | 15.69 | % | | | (1.22 | )% | | | 7.66 | % | | | 12/18/2000 | |
Russell 3000® Index | | | 1.78 | % | | | 14.75 | % | | | 13.58 | % | | | 0.59 | % | | | 7.47 | % | | | 12/18/2000 | † |
Managers AMG FQ U.S. Equity Fund | | | | | | | | | | | | | | | | | | | | | | | | |
Class A (No Load) | | | (0.39 | )% | | | 11.50 | % | | | 12.90 | % | | | (0.83 | )% | | | — | | | | 3/1/2006 | |
Class C (No Load) | | | (0.69 | )% | | | 10.67 | % | | | 12.09 | % | | | (1.55 | )% | | | — | | | | 3/1/2006 | |
Institutional Class | | | (0.26 | )% | | | 11.78 | % | | | 13.19 | % | | | (0.54 | )% | | | 7.33 | % | | | 8/14/1992 | |
Russell 3000® Index | | | 1.78 | % | | | 14.75 | % | | | 13.58 | % | | | 0.59 | % | | | 7.47 | % | | | 08/14/1992 | † |
Managers AMG FQ Global Alternatives Fund | | | | | | | | | | | | | | | | | | | | | | | | |
Class A (No Load) | | | 0.11 | % | | | (1.40 | )% | | | (2.72 | )% | | | (0.01 | )% | | | — | | | | 3/30/2006 | |
Class C (No Load) | | | (0.23 | )% | | | (2.00 | )% | | | (3.28 | )% | | | (0.66 | )% | | | — | | | | 3/30/2006 | |
Service Class | | | 0.22 | % | | | (1.18 | )% | | | — | | | | — | | | | — | | | | 1/1/2010 | |
Institutional Class | | | 0.32 | % | | | (1.07 | )% | | | — | | | | — | | | | — | | | | 1/1/2010 | |
Citigroup 1-Month U.S. Treasury Bill Index | | | 0.03 | % | | | 0.04 | % | | | 0.08 | % | | | 0.46 | % | | | — | | | | 3/30/2006 | † |
Managers AMG FQ Global Essentials Fund | | | | | | | | | | | | | | | | | | | | | | | | |
Investor Class | | | 2.77 | % | | | 8.75 | % | | | — | | | | — | | | | — | | | | 1/1/2010 | |
Service Class | | | 3.07 | % | | | 9.11 | % | | | — | | | | — | | | | — | | | | 1/1/2010 | |
Institutional Class | | | 3.14 | % | | | 9.29 | % | | | 10.06 | % | | | (0.43 | )% | | | 6.38 | % | | | 11/18/1988 | |
60% MSCI World (hedged) Index & 40% Citigroup World Government Bond (hedged) Index | | | 1.83 | % | | | 7.44 | % | | | 5.21 | % | | | (0.72 | )% | | | 4.39 | % | | | 11/18/1988 | † |
For the 12 months ended October 31, 2012, the Managers AMG FQ U.S. Equity Fund (Class A shares at NAV) returned 11.50%, compared with 14.75% for its benchmark, the Russell 3000® Index. For the 12 months ended October 31, 2011, the Managers AMG FQ Tax-Managed U.S. Equity Fund (Class A shares at NAV) returned 12.77%, compared with 14.75% for its benchmark, the Russell 3000® Index. The underperformance for the Managers AMG FQ U.S. Equity Fund was primarily driven by the Fund’s protection strategy which, as expected, detracted from performance as equity markets generally moved upward during this period. The underperformance for the Managers AMG FQ Tax-Managed U.S. Equity Fund was primarily driven by stock selection weakness with the consumer discretionary and health care sectors.
For the 12 months ended October 31, 2012, the Managers AMG FQ Global Alternatives Fund (Class A Shares at NAV) returned -1.40% while its benchmark, the Citigroup 1-Month Treasury Bill, returned 0.04%. During this period, the Managers AMG FQ Global Alternatives Fund’s disappointing performance was primarily driven by the asset class selection strategy, particularly during the second quarter of 2012, when the Fund’s long to global equities detracted value as markets fell sharply amid global recession fears. The Fund did, however, rally towards the end of the fiscal year driven by solid outperformance from all four of its strategies.
For the 12 months ended October 31, 2012, the Managers AMG FQ Global Essentials Fund (Investor Class Shares at NAV) returned 8.75% while the benchmark, which consists of 60% of the return of MSCI World (hedged) Index and 40% of the return of the Citigroup World Government Bond (hedged) Index, returned 7.44% during this period. The Managers AMG FQ Global Essentials Fund’s solid absolute performance throughout the year was driven by all three of the Fund’s primary exposures- equities, fixed income, and ‘hard assets’ (commodities and TIPS) as the diversification benefits of the assets within the Fund were evident throughout the year.
2
Letter to Shareholders (continued)
The following report covers the one-year period ended October 31, 2012. Should you have any questions about this report, or if you’d like to receive a prospectus and additional information, including fees and expenses for these or any of the other Funds our family, please feel free to contact us at 1-800-835-3879, or visit our Web site at www.managersinvest.com. As always, please read the prospectus carefully before you invest or send money.
You can rest assured that under all market conditions our team is focused on delivering excellent investment management services for your benefit.
We thank you for your continued confidence and investment in The Managers Funds.
Respectfully,

Keitha Kinne
Managing Partner
Managers Investment Group LLC
3
About Your Fund’s Expenses
As a shareholder of a Fund, you may incur two types of costs: (1) transaction costs, which may include sales charges (loads) on purchase payments; redemption fees; and exchange fees; and (2) ongoing costs, including management fees; distribution (12b-1) fees; and other Fund expenses. This example is intended to help you understand your ongoing costs (in dollars) of investing in the Fund and to compare these costs with the ongoing costs of investing in other mutual funds. The example is based on $1,000 invested at the beginning of the period and held for the entire period as indicated below.
Actual Expenses
The first line of the following table provides information about the actual account values and actual expenses. You may use the information in this line, together with the amount you invested, to estimate the expenses that you paid over the period. Simply divide your account value by $1,000 (for example, an $8,600 account value divided by $1,000 = 8.6), then multiply the result by the number in the first line under the heading entitled “Expenses Paid During Period” to estimate the expenses you paid on your account during this period.
Hypothetical Example for Comparison Purposes
The second line of the following table provides information about hypothetical account values and hypothetical expenses based on the Fund’s actual expense ratio and an assumed annual rate of return of 5% before expenses, which is not the Fund’s actual return. The hypothetical account values and expenses may not be used to estimate the actual ending account balance or expenses you paid for the period. You may use this information to compare the ongoing costs of investing in the Fund and other funds by comparing this 5% hypothetical example with the 5% hypothetical examples that appear in the shareholder reports of other funds.
Please note that the expenses shown in the table are meant to highlight your on going costs only and do not reflect any transactional costs, such as sales charges (loads), redemption fees, or exchange fees. Therefore, the second line of the table is useful in comparing ongoing costs only, and will not help you determine the relative total costs of owning different funds.
| | | | | | | | | | | | | | | | |
Six Months Ended October 31, 2012 | | Expense
Ratio
for the
Period | | | Beginning
Account
Value
5/01/2012 | | | Ending
Account
Value
10/31/2012 | | | Expenses
Paid
During
the
Period* | |
Managers AMG FQ Tax-Managed U.S. Equity Fund | | | | | | | | | | | | | | | | |
Class A Shares | | | | | | | | | | | | | | | | |
Based on Actual Fund Return | | | 1.24 | % | | $ | 1,000 | | | $ | 1,000 | | | $ | 6.23 | |
Hypothetical (5% return before expenses) | | | 1.24 | % | | $ | 1,000 | | | $ | 1,019 | | | $ | 6.29 | |
Class C Shares | | | | | | | | | | | | | | | | |
Based on Actual Fund Return | | | 1.99 | % | | $ | 1,000 | | | $ | 996 | | | $ | 9.98 | |
Hypothetical (5% return before expenses) | | | 1.99 | % | | $ | 1,000 | | | $ | 1,015 | | | $ | 10.08 | |
Institutional Class Shares | | | | | | | | | | | | | | | | |
Based on Actual Fund Return | | | 0.99 | % | | $ | 1,000 | | | $ | 1,001 | | | $ | 4.98 | |
Hypothetical (5% return before expenses) | | | 0.99 | % | | $ | 1,000 | | | $ | 1,020 | | | $ | 5.03 | |
Managers AMG FQ U.S. Equity Fund | | | | | | | | | | | | | | | | |
Class A Shares | | | | | | | | | | | | | | | | |
Based on Actual Fund Return | | | 1.04 | % | | $ | 1,000 | | | $ | 996 | | | $ | 5.22 | |
Hypothetical (5% return before expenses) | | | 1.04 | % | | $ | 1,000 | | | $ | 1,020 | | | $ | 5.28 | |
Class C Shares | | | | | | | | | | | | | | | | |
Based on Actual Fund Return | | | 1.79 | % | | $ | 1,000 | | | $ | 993 | | | $ | 8.97 | |
Hypothetical (5% return before expenses) | | | 1.79 | % | | $ | 1,000 | | | $ | 1,016 | | | $ | 9.07 | |
Institutional Class Shares | | | | | | | | | | | | | | | | |
Based on Actual Fund Return | | | 0.79 | % | | $ | 1,000 | | | $ | 997 | | | $ | 3.97 | |
Hypothetical (5% return before expenses) | | | 0.79 | % | | $ | 1,000 | | | $ | 1,021 | | | $ | 4.01 | |
Managers AMG FQ Global Alternatives Fund | | | | | | | | | | | | | | | | |
Class A Shares | | | | | | | | | | | | | | | | |
Based on Actual Fund Return | | | 1.91 | % | | $ | 1,000 | | | $ | 1,001 | | | $ | 9.61 | |
Hypothetical (5% return before expenses) | | | 1.91 | % | | $ | 1,000 | | | $ | 1,016 | | | $ | 9.68 | |
Class C Shares | | | | | | | | | | | | | | | | |
Based on Actual Fund Return | | | 2.46 | % | | $ | 1,000 | | | $ | 998 | | | $ | 12.35 | |
Hypothetical (5% return before expenses) | | | 2.46 | % | | $ | 1,000 | | | $ | 1,013 | | | $ | 12.45 | |
Service Class Shares | | | | | | | | | | | | | | | | |
Based on Actual Fund Return | | | 1.58 | % | | $ | 1,000 | | | $ | 1,002 | | | $ | 7.95 | |
Hypothetical (5% return before expenses) | | | 1.58 | % | | $ | 1,000 | | | $ | 1,017 | | | $ | 8.01 | |
Institutional Class Shares | | | | | | | | | | | | | | | | |
Based on Actual Fund Return | | | 1.46 | % | | $ | 1,000 | | | $ | 1,003 | | | $ | 7.35 | |
Hypothetical (5% return before expenses) | | | 1.46 | % | | $ | 1,000 | | | $ | 1,017 | | | $ | 7.40 | |
Managers AMG FQ Global Essentials Fund | | | | | | | | | | | | | | | | |
Investor Class Shares | | | | | | | | | | | | | | | | |
Based on Actual Fund Return | | | 1.41 | % | | $ | 1,000 | | | $ | 1,028 | | | $ | 7.19 | |
Hypothetical (5% return before expenses) | | | 1.41 | % | | $ | 1,000 | | | $ | 1,018 | | | $ | 7.15 | |
Service Class Shares | | | | | | | | | | | | | | | | |
Based on Actual Fund Return | | | 0.87 | % | | $ | 1,000 | | | $ | 1,031 | | | $ | 4.44 | |
Hypothetical (5% return before expenses) | | | 0.87 | % | | $ | 1,000 | | | $ | 1,021 | | | $ | 4.42 | |
Institutional Class Shares | | | | | | | | | | | | | | | | |
Based on Actual Fund Return | | | 0.90 | % | | $ | 1,000 | | | $ | 1,031 | | | $ | 4.59 | |
Hypothetical (5% return before expenses) | | | 0.90 | % | | $ | 1,000 | | | $ | 1,021 | | | $ | 4.57 | |
| |
* Expenses are equal to the Fund’s annualized expense ratio multiplied by the average account value over the period, multiplied by the number of days in the most recent fiscal half-year (184), then divided by 366. | |
4
Managers AMG FQ Tax-Managed U.S. Equity Fund
Investment Manager’s Comments
THE YEAR IN REVIEW
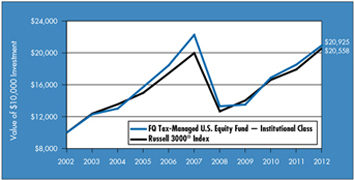
For the fiscal year ended October 31, 2012, the Managers AMG FQ Tax-Managed U.S. Equity Fund (Class A Shares at NAV) returned 12.77%, compared to 14.75% for its benchmark, the Russell 3000® Index. Please refer to the table on page 6 for returns for various classes of shares.
U.S. equities continued their multi-year rally over the prior fiscal year despite considerable investor concerns about the prospects for another recession particularly towards the end of the year as the so-called fiscal cliff quickly approached. Similar to the prior year, U.S. equities followed a “risk on, risk off” pattern throughout the year with sharp turns driven by investor confidence, or lack thereof, in the ability of fiscal and monetary measures to spark sluggish growth higher. Despite the solid returns generated by equities, investors continued to flee these assets for the safety of fixed income assets even with yields hovering at record lows. Despite compelling valuations and equities continuing to reach new multi-year highs, investors confidence remains shaken after the great recession and they are still putting a premium price on safety and the ability to return, as opposed to grow, capital. For the entire one-year period ended October 31, 2012, U.S. large-cap stocks performed broadly in line with their smaller-cap brethren with the Russell 1000® (large cap), Russell 2000® (small cap), Russell 3000® (all cap), and the Russell Microcap® Indices returning 15.0%, 14.8%, 14.8%, and 16.5%, respectively.
The Fund delivered positive absolute returns for the prior fiscal year but trailed the benchmark during this time. Stock selection yielded mixed results throughout the year with the biggest detractors holdings within the consumer discretionary and health care sectors. Holdings within the consumer staples and energy sectors did, however, add to the Fund’s absolute and relative performance. Meanwhile sector positioning relative to the benchmark was close to neutral throughout the year consistent with the Fund’s investment process and, therefore, failed to add or detract significant value. A modest overweight to holdings within the information technology sector did, however, detract from performance. Exposure to top-down factors offered mixed results relative to the benchmark throughout the year as well.
The Fund’s subadvisor, First Quadrant L.P. (“First Quadrant”) maintains a slight tilt towards value stocks as of the end of the fiscal year. The Fund had been favoring growth to a moderate degree earlier in the year but a reduction in market uncertainty during June, as measured by the VIX, a measure of the implied volatility of the S&P 500, contributed to the Fund adopting more of a value orientation. The Fund maintains relatively neutral exposure to the benchmark from a capitalization as of the end of the fiscal year after alternating between modest large and small earlier in the year. The largest industry overweight is to IT services and consumer finances, driven by high momentum and high return on invested capital for these industries. Meanwhile the Fund maintains a significant underweight to the Biotechnology sector as a result of poor accounting quality (high accruals/assets) and high long-term growth estimates for the sector. As a tax advantaged strategy, the Portfolio is managed to seek positive pre-tax and after-tax alpha. For this reason, First Quadrant employs tax-aware optimization which uses losses to offset gains as the Portfolio is repositioned. Currently most of the Portfolio is locked up in gains, however, the Fund continues to maintain a large tax loss carry-forward, all of which will expire in 2017.
CUMULATIVE TOTAL RETURN PERFORMANCE
Managers AMG FQ Tax-Managed U.S. Equity Fund’s cumulative total return is based on the daily change in net asset value (NAV), and assumes that all distributions were reinvested. This chart compares a hypothetical $10,000 investment made in the Institutional Class Shares of the Fund on October 31, 2002 with a $10,000 investment made in the Russell 3000® Index for the same time period. Performance for periods longer than one year is annualized. Figures include reinvestment of capital gains and dividends. The listed returns for the Fund are net of expenses and the returns for the indices exclude expenses. Total returns for the Fund would have been lower had certain expenses not been reduced.
5
Managers AMG FQ Tax-Managed U.S. Equity Fund
Investment Manager’s Comments (continued)
CUMULATIVE TOTAL RETURN PERFORMANCE (continued)
The table below shows the average annual total returns for the Managers AMG FQ Tax-Managed U.S. Equity Fund and Russell 3000® Index for the same time periods ended October 31, 2012.
| | | | | | | | | | | | | | | | | | | | |
| | | Average Annual Total Returns1 | |
| | | One Year | | | Five Years | | | Ten Years | | | Since
Inception | | | Inception Date | |
Managers AMG FQ Tax-Managed U.S. Equity Fund2,3,4 | | | | | | | | | | | | | | | | | | | | |
No Load Before Tax: | | | | | | | | | | | | | | | | | | | | |
Class A* | | | 12.77 | % | | | (1.38 | )% | | | — | | | | 2.78 | % | | | 03/01/06 | |
Class C* | | | 11.92 | % | | | (2.11 | )% | | | — | | | | 2.01 | % | | | 03/01/06 | |
Institutional Class | | | 13.00 | % | | | (1.22 | )% | | | 7.66 | % | | | 4.15 | % | | | 12/18/00 | |
Russell 3000® Index5 | | | 14.75 | % | | | 0.59 | % | | | 7.47 | % | | | 3.04 | % | | | 12/18/00 | † |
No Load After Tax on Distributions:6 | | | | | | | | | | | | | | | | | | | | |
Class A* | | | 12.77 | % | | | (1.43 | )% | | | — | | | | 2.74 | % | | | 03/01/06 | |
Class C* | | | 11.92 | % | | | (2.11 | )% | | | — | | | | 2.00 | % | | | 03/01/06 | |
Institutional Class | | | 12.96 | % | | | (1.32 | )% | | | 7.55 | % | | | 4.05 | % | | | 12/18/00 | |
No Load After Tax on Distribution & Sale of Shares:6 | | | | | | | | | | | | | | | | | | | | |
Class A* | | | 8.30 | % | | | (1.19 | )% | | | — | | | | 2.38 | % | | | 03/01/06 | |
Class C* | | | 7.75 | % | | | (1.78 | )% | | | — | | | | 1.72 | % | | | 03/01/06 | |
Institutional Class | | | 8.45 | % | | | (1.07 | )% | | | 6.73 | % | | | 3.59 | % | | | 12/18/00 | |
With Load Before Tax: | |
Class A* | | | 6.29 | % | | | (2.54 | )% | | | — | | | | 1.88 | % | | | 03/01/06 | |
Class C* | | | 10.92 | % | | | (2.11 | )% | | | — | | | | 2.01 | % | | | 03/01/06 | |
With Load After Tax on Distribution:6 | | | | | | | | | | | | | | | | | | | | |
Class A* | | | 6.29 | % | | | (2.59 | )% | | | — | | | | 1.84 | % | | | 03/01/06 | |
Class C* | | | 10.92 | % | | | (2.11 | )% | | | — | | | | 2.00 | % | | | 03/01/06 | |
With Load After Tax on Distribution & Sale of Shares:6 | | | | | | | | | | | | | | | | | | | | |
Class A* | | | 4.09 | % | | | (2.16 | )% | | | — | | | | 1.60 | % | | | 03/01/06 | |
Class C* | | | 7.10 | % | | | (1.78 | )% | | | — | | | | 1.72 | % | | | 03/01/06 | |
| | |
The performance data shown represents past performance. Past performance is not a guarantee of future results. Current performance may be lower or higher than the performance data quoted. The investment return and principal value of an investment in the Fund will fluctuate so that an investor’s shares, when redeemed, may be worth more or less than their original cost. For performance information through the most recent month end, please call (800) 835-3879 or visit our Web site at www.managersinvest.com. Performance differences among the share classes are due to differences in sales charge structures and class expenses. Returns shown reflect maximum sales charge of 5.75% on Class A, as well as the applicable contingent deferred sales charge (CDSC) on Class C shares. Class C shares held for less than one year are subject to a 1% CDSC. Investors should carefully consider the Fund’s investment objectives, risks, charges, and expenses before investing. For this and other information, please call (800) 835-3879 or visit www.managersinvest.com for a free prospectus. Read it carefully before investing or sending money. Funds are distributed by Managers Distributors, Inc., a member of FINRA. * Class A and Class C shares commenced operations on March 1, 2006. † Date reflects the inception date of the Fund’s Institutional Class shares, not the index. |
1 | | Total return equals income yield plus share price change and assumes reinvestment of all dividends and capital gain distributions. Returns are net of fees and may reflect offsets of Fund expenses as described in the Prospectus. No adjustment has been made for taxes payable by shareholders on their reinvested dividends and capital gain distributions. Returns for periods greater than one year are the average annual return. The listed returns on the Fund are net of expenses and based on the published NAV as of October 31, 2012. All returns are in U.S. dollars ($). |
2 | | From time to time, the Fund’s advisor has waived its fees and/or absorbed Fund expenses, which has resulted in higher returns. |
6
Managers AMG FQ Tax-Managed U.S. Equity Fund
Investment Manager’s Comments (continued)
CUMULATIVE TOTAL RETURN PERFORMANCE (continued)
| 3 | The Fund invests in large-capitalization companies that may underperform other stock funds (such as funds that focus on small and medium capitalization companies) when stocks of large-capitalization companies are out of favor. Although the Fund is managed to minimize taxable distributions, it may not be able to avoid taxable distributions. | |
| 4 | Class C shares convert to an equal dollar value of Class A shares at the end of the tenth year after purchase. | |
| 5 | The Russell 3000® Index is composed of the 3,000 largest U.S. companies as measured by market capitalization, and represents approximately 98% of the U.S. stock market. Unlike the Fund, the Russell 3000® Index is unmanaged, is not available for investment, and does not incur expenses. | |
| 6 | After-tax returns are calculated using the historical highest individual federal marginal income tax rates and do not reflect the impact of state and local taxes. Actual after-tax returns depend on an investor’s tax situation and may differ from those shown, and after-tax returns are not relevant to investors who hold their Fund shares through tax-deferred arrangements, such as 401(k) plans or individual retirement accounts. | |
Not FDIC insured, nor bank guaranteed. May lose value.
7
Managers AMG FQ Tax-Managed U.S. Equity Fund
Fund Snapshots
October 31, 2012
Portfolio Breakdown (unaudited)
| | | | | | | | |
Industry | | Managers AMG FQ
Tax-Managed
U.S. Equity Fund** | | | Russell 3000®
Index | |
Information Technology | | | 23.0 | % | | | 18.2 | % |
Financials | | | 13.5 | % | | | 16.5 | % |
Consumer Discretionary | | | 12.8 | % | | | 12.3 | % |
Health Care | | | 12.4 | % | | | 11.9 | % |
Energy | | | 12.0 | % | | | 10.1 | % |
Consumer Staples | | | 9.2 | % | | | 9.5 | % |
Industrials | | | 8.5 | % | | | 11.0 | % |
Materials | | | 4.0 | % | | | 4.0 | % |
Utilities | | | 2.0 | % | | | 3.7 | % |
Telecommunication Services | | | 1.9 | % | | | 2.8 | % |
Other Assets and Liabilities | | | 0.7 | % | | | 0.0 | % |
| ** | As a percentage of net assets |
Top Ten Holdings (unaudited)
| | | | |
Security Name | | % of
Net Assets | |
Apple, Inc.* | | | 4.1 | % |
Chevron Corp.* | | | 3.4 | |
International Business Machines Corp.* | | | 3.3 | |
Exxon Mobil Corp.* | | | 3.1 | |
Philip Morris International, Inc.* | | | 2.5 | |
DIRECTV, Class A* | | | 2.2 | |
Berkshire Hathaway, Inc., Class B* | | | 2.1 | |
Visa, Inc., Class A | | | 1.9 | |
Dillard’s, Inc., Class A | | | 1.8 | |
UnitedHealth Group, Inc. | | | 1.8 | |
| | | | |
Top Ten as a Group | | | 26.2 | % |
| | | | |
| * | Top Ten Holding at April 30, 2012 |
Any sectors, industries, or securities discussed should not be perceived as investment recommendations. Mention of a specific security should not be considered a recommendation to buy or solicitation to sell that security. Specific securities mentioned in this report may have been sold from the Fund’s portfolio of investments by the time you receive this report.
8
Managers AMG FQ Tax-Managed U.S. Equity Fund
Schedule of Portfolio Investments
October 31, 2012
| | | | | | | | |
| | | Shares | | | Value | |
| | | | | | | | |
Common Stocks - 99.3% | | | | | | | | |
Consumer Discretionary - 12.8% | | | | | | | | |
1-800-Flowers.com, Inc., Class A* | | | 7,700 | | | $ | 27,951 | |
Bed Bath & Beyond, Inc.* | | | 6,400 | | | | 369,152 | |
Chico’s FAS, Inc. | | | 6,500 | | | | 120,900 | |
Coinstar, Inc.*,1 | | | 4,500 | | | | 211,230 | |
Dillard’s, Inc., Class A | | | 10,100 | | | | 777,700 | |
DIRECTV* | | | 18,100 | | | | 925,091 | |
Discovery Communications, Inc., Class A* | | | 1,400 | | | | 82,628 | |
DISH Network Corp., Class A | | | 11,100 | | | | 395,493 | |
Harman International Industries, Inc. | | | 10,100 | | | | 423,493 | |
Liberty Global, Inc., Class A* | | | 8,300 | | | | 498,249 | |
LIN TV Corp., Class A* | | | 31,800 | | | | 178,398 | |
Macy’s, Inc. | | | 7,500 | | | | 285,525 | |
Nexstar Broadcasting Group, Inc., Class A* | | | 11,100 | | | | 120,657 | |
Ross Stores, Inc. | | | 6,900 | | | | 420,555 | |
Target Corp. | | | 2,000 | | | | 127,500 | |
TJX Cos., Inc. | | | 12,100 | | | | 503,723 | |
Total Consumer Discretionary | | | | | | | 5,468,245 | |
| | |
Consumer Staples - 9.2% | | | | | | | | |
Andersons, Inc., The | | | 3,900 | | | | 153,192 | |
Constellation Brands, Inc., Class A* | | | 9,000 | | | | 318,060 | |
CVS Caremark Corp. | | | 4,800 | | | | 222,720 | |
Kroger Co., The | | | 21,100 | | | | 532,142 | |
Philip Morris International, Inc. | | | 12,000 | | | | 1,062,720 | |
Procter & Gamble Co., The | | | 3,400 | | | | 235,416 | |
Smithfield Foods, Inc.* | | | 5,400 | | | | 110,538 | |
Susser Holdings Corp.* | | | 6,300 | | | | 226,422 | |
Tyson Foods, Inc., Class A | | | 10,200 | | | | 171,462 | |
Wal-Mart Stores, Inc. | | | 7,400 | | | | 555,148 | |
Whole Foods Market, Inc. | | | 3,600 | | | | 341,028 | |
Total Consumer Staples | | | | | | | 3,928,848 | |
| | |
Energy - 12.0% | | | | | | | | |
Apache Corp. | | | 3,500 | | | | 289,625 | |
Chevron Corp. | | | 13,200 | | | | 1,454,772 | |
ConocoPhillips | | | 11,000 | | | | 636,350 | |
CVR Energy, Inc.* | | | 11,700 | | | | 429,975 | |
Exxon Mobil Corp. | | | 14,800 | | | | 1,349,316 | |
Marathon Petroleum Corp. | | | 4,700 | | | | 258,171 | |
Occidental Petroleum Corp. | | | 4,000 | | | | 315,840 | |
Phillips 66 | | | 4,600 | | | | 216,936 | |
Tesoro Corp. | | | 4,900 | | | | 184,779 | |
Total Energy | | | | | | | 5,135,764 | |
| | | | | | | | |
| | | Shares | | | Value | |
| | | | | | | | |
Financials - 13.5% | | | | | | | | |
American Financial Group, Inc. | | | 1,800 | | | $ | 69,840 | |
American Safety Insurance Holdings, Ltd.* | | | 1,400 | | | | 23,604 | |
American Tower Corp. | | | 800 | | | | 60,232 | |
Arch Capital Group, Ltd.* | | | 13,200 | | | | 582,780 | |
Berkshire Hathaway, Inc., Class A* | | | 1 | | | | 129,505 | |
Berkshire Hathaway, Inc., Class B* | | | 10,287 | | | | 888,282 | |
CapitalSource, Inc. | | | 57,700 | | | | 456,407 | |
Chubb Corp., The | | | 2,200 | | | | 169,356 | |
Citigroup, Inc. | | | 3,600 | | | | 134,604 | |
Discover Financial Services | | | 10,500 | | | | 430,500 | |
FBL Financial Group, Inc., Class A | | | 2,600 | | | | 88,738 | |
FelCor Lodging Trust, Inc.* | | | 7,200 | | | | 31,680 | |
First Citizens BancShares, Inc., Class A | | | 1,400 | | | | 236,250 | |
Franklin Resources, Inc. | | | 600 | | | | 76,680 | |
JPMorgan Chase & Co. | | | 10,400 | | | | 433,472 | |
KeyCorp | | | 25,800 | | | | 217,236 | |
Pacific Capital Bancorp* | | | 800 | | | | 36,728 | |
PNC Financial Services Group, Inc. | | | 8,400 | | | | 488,796 | |
Sterling Financial Corp. | | | 16,500 | | | | 350,790 | |
SunTrust Banks, Inc. | | | 15,800 | | | | 429,760 | |
World Acceptance Corp.* | | | 6,500 | | | | 433,940 | |
Total Financials | | | | | | | 5,769,180 | |
| | |
Health Care - 12.4% | | | | | | | | |
Aetna, Inc. | | | 1,100 | | | | 48,070 | |
AmerisourceBergen Corp. | | | 4,400 | | | | 173,536 | |
Anika Therapeutics, Inc.* | | | 9,100 | | | | 102,011 | |
Atrion Corp. | | | 200 | | | | 40,648 | |
Biogen Idec, Inc.* | | | 5,400 | | | | 746,388 | |
CareFusion Corp.* | | | 16,700 | | | | 443,552 | |
Express Scripts Holding Co.* | | | 7,800 | | | | 480,012 | |
Humana, Inc. | | | 7,100 | | | | 527,317 | |
Johnson & Johnson | | | 3,200 | | | | 226,624 | |
McKesson Corp. | | | 5,200 | | | | 485,212 | |
Medicis Pharmaceutical Corp., Class A | | | 6,400 | | | | 277,824 | |
Pfizer, Inc. | | | 5,200 | | | | 129,324 | |
Sciclone Pharmaceuticals, Inc.* | | | 94,800 | | | | 522,348 | |
UnitedHealth Group, Inc. | | | 13,800 | | | | 772,800 | |
Warner Chilcott PLC, Class A | | | 28,600 | | | | 331,188 | |
Total Health Care | | | | | | | 5,306,854 | |
| | |
Industrials - 8.5% | | | | | | | | |
Alaska Air Group, Inc.* | | | 12,500 | | | | 478,000 | |
Amerco, Inc. | | | 800 | | | | 92,432 | |
Cummins, Inc. | | | 3,100 | | | | 290,098 | |
The accompanying notes are an integral part of these financial statements.
9
Managers AMG FQ Tax-Managed U.S. Equity Fund
Schedule of Portfolio Investments (continued)
| | | | | | | | |
| | | Shares | | | Value | |
| | | | | | | | |
Industrials - 8.5% (continued) | | | | | | | | |
Delta Air Lines, Inc.* | | | 44,100 | | | $ | 424,683 | |
FedEx Corp. | | | 5,700 | | | | 524,343 | |
General Electric Co. | | | 20,500 | | | | 431,730 | |
Kadant, Inc.* | | | 2,600 | | | | 63,154 | |
Parker Hannifin Corp. | | | 2,100 | | | | 165,186 | |
Sauer-Danfoss, Inc. | | | 2,800 | | | | 112,168 | |
Swift Transportation Co.*,1 | | | 34,200 | | | | 333,450 | |
Union Pacific Corp. | | | 3,800 | | | | 467,514 | |
United Technologies Corp. | | | 3,000 | | | | 234,480 | |
Total Industrials | | | | | | | 3,617,238 | |
| | |
Information
Technology - 23.0% | | | | | | | | |
Aeroflex Holding Corp.* | | | 5,600 | | | | 35,616 | |
AOL, Inc.* | | | 5,000 | | | | 171,650 | |
Apple, Inc. | | | 2,975 | | | | 1,770,422 | |
Avnet, Inc.* | | | 12,400 | | | | 355,260 | |
Brocade Communications Systems, Inc.* | | | 79,100 | | | | 419,230 | |
CSG Systems International, Inc.* | | | 6,400 | | | | 131,904 | |
Dell, Inc. | | | 24,800 | | | | 228,904 | |
EMC Corp.* | | | 18,100 | | | | 442,002 | |
Entegris, Inc.* | | | 8,900 | | | | 73,069 | |
Global Payments, Inc. | | | 3,200 | | | | 136,800 | |
Google, Inc., Class A* | | | 301 | | | | 204,611 | |
Intel Corp. | | | 25,700 | | | | 555,763 | |
International Business Machines Corp. | | | 7,200 | | | | 1,400,616 | |
LSI Corp.* | | | 25,000 | | | | 171,250 | |
Mastercard, Inc., Class A | | | 1,600 | | | | 737,488 | |
Microsoft Corp. | | | 22,700 | | | | 647,745 | |
Oracle Corp. | | | 20,200 | | | | 627,210 | |
PC Connection, Inc. | | | 5,900 | | | | 60,711 | |
Power-One, Inc.* | | | 73,800 | | | | 297,414 | |
Symmetricom, Inc.* | | | 3,200 | | | | 19,680 | |
SYNNEX Corp.* | | | 1,800 | | | | 58,302 | |
Visa, Inc., Class A | | | 5,800 | | | | 804,808 | |
Zebra Technologies Corp., Class A* | | | 13,000 | | | | 467,090 | |
Total Information Technology | | | | 9,817,545 | |
| | | | | | | | |
| | | Shares | | | Value | |
| | | | | | | | |
Materials - 4.0% | | | | | | | | |
AEP Industries, Inc.* | | | 2,000 | | | $ | 127,860 | |
CF Industries Holdings, Inc. | | | 2,400 | | | | 492,456 | |
Domtar Corp. | | | 2,100 | | | | 167,475 | |
Freeport-McMoRan Copper & Gold, Inc., | | | | | | | | |
Class B | | | 8,400 | | | | 326,592 | |
Graphic Packaging Holding Co.* | | | 33,400 | | | | 197,728 | |
KapStone Paper and Packaging Corp.* | | | 11,400 | | | | 250,458 | |
LSB Industries, Inc.* | | | 4,000 | | | | 161,080 | |
Total Materials | | | | | | | 1,723,649 | |
| | |
Telecommunication
Services - 1.9% | | | | | | | | |
AT&T, Inc. | | | 3,600 | | | | 124,524 | |
MetroPCS Communications, Inc.* | | | 40,900 | | | | 417,589 | |
United States Cellular Corp.* | | | 7,000 | | | | 258,930 | |
Total Telecommunication Services | | | | | | | 801,043 | |
| | |
Utilities - 2.0% | | | | | | | | |
AES Corp., The | | | 27,000 | | | | 282,150 | |
El Paso Electric Co. | | | 8,600 | | | | 292,314 | |
NRG Energy, Inc. | | | 3,400 | | | | 73,304 | |
Public Service Enterprise Group, Inc. | | | 7,200 | | | | 230,688 | |
Total Utilities | | | | | | | 878,456 | |
Total Common Stocks
(cost $33,218,456) | | | | | | | 42,446,822 | |
| |
Other Investment Companies - 1.9%2 | | | | | |
BNY Mellon Overnight Government Fund,
0.23%3 | | | 502,739 | | | | 502,739 | |
Dreyfus Cash Management Fund,
Institutional Class Shares, 0.07% | | | 306,543 | | | | 306,543 | |
Total Other Investment Companies
(cost $809,282) | | | | | | | 809,282 | |
Total Investments - 101.2%
(cost $34,027,738) | | | | | | | 43,256,104 | |
Other Assets, less Liabilities - (1.2)% | | | | (521,029 | ) |
Net Assets - 100.0% | | | | | | $ | 42,735,075 | |
The accompanying notes are an integral part of these financial statements.
10
Managers AMG FQ U.S. Equity Fund
Investment Manager’s Comments
THE YEAR IN REVIEW
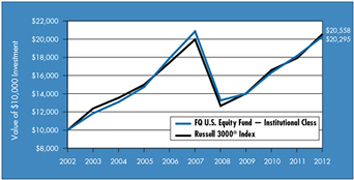
For the fiscal year ended October 31, 2012, the Managers AMG FQ U.S. Equity Fund (Class A Shares at NAV) returned 11.50%, compared to 14.75% for its benchmark, the Russell 3000® Index. Please refer to the table on page 12 for returns for various classes of shares.
U.S. equities continued their multi-year rally over the prior fiscal year despite considerable investor concerns about the prospects for another recession particularly towards the end of the year as the so-called fiscal cliff quickly approached. Similar to the prior year, U.S. equities followed a “risk on, risk off” pattern throughout the year with sharp turns driven by investor confidence, or lack thereof, in the ability of fiscal and monetary measures to spark sluggish growth higher. Despite the solid returns generated by equities, investors continued to flee these assets for the safety of fixed income assets even with yields hovering at record lows. Despite compelling valuations and equities continuing to reach new multi-year highs, investors’ confidence remains shaken after the great recession and investors are still putting a premium price on safety and the ability to return, as opposed to grow, capital. For the entire one-year period ended October 31, 2012, U.S. large-cap stocks performed broadly in line with their smaller-cap brethren with the Russell 1000® (large cap), Russell 2000® (small cap), Russell 3000® (all cap), and the Russell Microcap® Indices returning 15.0%, 14.8%, 14.8%, and 16.5%, respectively.
The Fund delivered positive absolute returns for the prior fiscal year but trailed the benchmark during this time. The biggest driver of the Fund’s underperformance for the year was the Fund’s protection strategy, an enhancement added to the Fund at the beginning of the fiscal year, which, as expected, detracted from performance as equity markets generally moved upward during this period. Performance from the equity holdings within the Fund were modest detractors to relative performance as well. This underperformance was primarily driven by stock selection weakness within the consumer discretionary sector although solid performance was generated by holdings within the energy and financials sectors. Meanwhile, sector positioning relative to the benchmark was close to neutral throughout the year consistent with the Fund’s investment
process and, therefore, failed to add or detract significant value. A modest overweight to holdings within the information technology sector did, however, detract from performance. Exposure to top-down factors offered mixed results relative to the benchmark throughout the year. Please note that the Fund switched to a quarterly dividend distribution during the year to better assist shareholders looking for a more frequent income stream from the Fund.
The Fund’s subadvisor, First Quadrant L.P. (“First Quadrant”) maintains a slight tilt towards value stocks as of the end of the fiscal year. The Fund had been favoring growth to a moderate degree earlier in the year but a reduction in market uncertainty during June, as measured by the VIX, a measure of the implied volatility of the S&P 500, contributed to the Fund adopting more of a value orientation. The Fund maintains a relatively neutral exposure to the benchmark from a capitalization perspective as of the end of the fiscal year after alternating between modest large and small earlier in the year. The largest industry overweight is to IT Services and consumer finances, driven by high momentum and high return on invested capital for these industries. The food products industry underweight is one of the largest as is the underweight to the Biotechnology sector as a result of poor accounting quality (high accruals/assets) and high long-term growth estimates for companies within this area of the market.
CUMULATIVE TOTAL RETURN PERFORMANCE
Managers AMG FQ U.S. Equity Fund’s cumulative total return is based on the daily change in net asset value (NAV), and assumes that all distributions were reinvested. This chart compares a hypothetical $10,000 investment made in the Institutional Class Shares of the Fund on October 31, 2002 with a $10,000 investment made in the Russell 3000® Index for the same time period. Performance for periods longer than one year is annualized. Figures include reinvestment of capital gains and dividends. The listed returns for the Fund are net of expenses and the returns for the indices exclude expenses. Total returns for the Fund would have been lower had certain expenses not been reduced.
11
Managers AMG FQ U.S. Equity Fund
Investment Manager’s Comments (continued)
CUMULATIVE TOTAL RETURN PERFORMANCE (continued)
The table below shows the average annual total returns for the Managers AMG FQ U.S. Equity Fund and Russell 3000® Index for the same time periods ended October 31, 2012.
| | | | | | | | | | | | | | | | | | | | |
| | | Average Annual Total Returns1 | |
| | | One
Year | | | Five
Years | | | Ten
Years | | | Since
Inception | | | Inception
Date | |
Managers AMG FQ U.S. Equity Fund2,3,4 | | | | | | | | | | | | | | | | | | | | |
No Load: | | | | | | | | | | | | | | | | | | | | |
Class A* | | | 11.50 | % | | | (0.83 | )% | | | — | | | | 3.11 | % | | | 03/01/06 | |
Class C* | | | 10.67 | % | | | (1.55 | )% | | | — | | | | 2.39 | % | | | 03/01/06 | |
Institutional Class | | | 11.78 | % | | | (0.54 | )% | | | 7.33 | % | | | 7.39 | % | | | 08/14/92 | |
Russell 3000® Index5,6 | | | 14.75 | % | | | 0.59 | % | | | 7.47 | % | | | 8.56 | % | | | 08/31/92 | † |
| | | | | |
With Load: | | | | | | | | | | | | | | | | | | | | |
Class A* | | | 5.09 | % | | | (1.99 | )% | | | — | | | | 2.20 | % | | | 03/01/06 | |
Class C* | | | 9.67 | % | | | (1.55 | )% | | | — | | | | 2.39 | % | | | 03/01/06 | |
The performance data shown represents past performance. Past performance is not a guarantee of future results. Current performance may be lower or higher than the performance data quoted. The investment return and principal value of an investment in the Fund will fluctuate so that an investor’s shares, when redeemed, may be worth more or less than their original cost. For performance information through the most recent month end, please call (800) 835-3879 or visit our Web site at www.managersinvest.com.
Performance differences among the share classes are due to differences in sales charge structures and class expenses. Returns shown reflect maximum sales charge of 5.75% on Class A, as well as the applicable contingent deferred sales charge (CDSC) on Class C shares. Class C shares held for less than one year are subject to a 1% CDSC.
Investors should carefully consider the Fund’s investment objectives, risks, charges and expenses before investing. For this and other information, please call (800) 835-3879 or visit www.managersinvest.com for a free prospectus. Read it carefully before investing or sending money. Funds are distributed by Managers Distributors, Inc., a member of FINRA.
| | |
* | | Class A and Class C shares commenced operations on March 1, 2006. |
† | | Date reflects the inception date of the Fund’s institutional Class shares, not the index. |
1 | | Total return equals income yield plus share price change and assumes reinvestment of all dividends and capital gain distributions. Returns are net of fees and may reflect offsets of Fund expenses as described in the Prospectus. No adjustment has been made for taxes payable by shareholders on their reinvested dividends and capital gain distributions. Returns for periods greater than one year are the average annual return. The listed returns on the Fund are net of expenses and based on the published NAV as of October 31, 2012. All returns are in U.S. dollars ($). |
2 | | From time to time, the Fund’s advisor has waived its fees and/or absorbed Fund expenses, which has resulted in higher returns. |
3 | | Class C shares convert to an equal dollar value of Class A shares at the end of the tenth year after purchase. |
4 | | The Fund invests in large-capitalization companies that may underperform other stock funds (such as funds that focus on small and medium capitalization companies) when stocks of large-capitalization companies are out of favor. Also, the Fund may invest in derivatives; the complexity and rapidly changing structure of derivatives markets may increase the possibility of market losses. |
5 | | The Russell 3000® Index is composed of the 3,000 largest U.S. companies as measured by market capitalization, and represents approximately 98% of the U.S. stock market. Unlike the Fund, the Russell 3000® Index is unmanaged, is not available for investment, and does not incur expenses. |
6 | | The date reflects the closest available index date to the Fund’s inception date. |
Not FDIC insured, nor bank guaranteed. May lose value. |
12
Managers AMG FQ U.S. Equity Fund
Fund Snapshots
October 31, 2012
Portfolio Breakdown (unaudited)
| | | | | | | | |
Industry | | Managers AMG FQ U.S. Equity
Fund** | | | Russell 3000®
Index | |
Information Technology | | | 21.0 | % | | | 18.2 | % |
Financials | | | 14.1 | % | | | 16.5 | % |
Health Care | | | 12.7 | % | | | 11.9 | % |
Consumer Discretionary | | | 11.4 | % | | | 12.3 | % |
Consumer Staples | | | 10.1 | % | | | 9.5 | % |
Industrials | | | 10.0 | % | | | 11.0 | % |
Energy | | | 9.4 | % | | | 10.1 | % |
Materials | | | 4.1 | % | | | 4.0 | % |
Telecommunication Services | | | 3.6 | % | | | 2.8 | % |
Utilities | | | 2.6 | % | | | 3.7 | % |
Other Assets and Liabilities | | | 1.0 | % | | | 0.0 | % |
| ** | As a percentage of net assets |
Top Ten Holdings (unaudited)
| | | | |
Security Name | | % of
Net Assets | |
Apple, Inc.* | | | 3.8 | % |
Exxon Mobil Corp.* | | | 3.3 | |
Microsoft Corp.* | | | 2.7 | |
Pfizer, Inc.* | | | 2.6 | |
Chevron Corp.* | | | 2.5 | |
Merck & Co., Inc. | | | 2.2 | |
International Business Machines Corp.* | | | 2.1 | |
Philip Morris International, Inc.* | | | 2.0 | |
Nu Skin Enterprises, Inc., Class A | | | 1.8 | |
Visa, Inc., Class A | | | 1.7 | |
| | | | |
Top Ten as a Group | | | 24.7 | % |
| | | | |
| * | Top Ten Holding at April 30, 2012 |
Any sectors, industries, or securities discussed should not be perceived as investment recommendations. Mention of a specific security should not be considered a recommendation to buy or solicitation to sell that security. Specific securities mentioned in this report may have been sold from the Fund’s portfolio of investments by the time you receive this report.
13
Managers AMG FQ U.S. Equity Fund
Schedule of Portfolio Investments
October 31, 2012
| | | | | | | | |
| | | Shares | | | Value | |
| | | | | | | | |
Common Stocks - 99.0% | | | | | | | | |
Consumer Discretionary - 11.4% | | | | | | | | |
Ameristar Casinos, Inc. | | | 28,500 | | | $ | 520,125 | |
Bed Bath & Beyond, Inc.* | | | 3,600 | | | | 207,648 | |
Belo Corp., Class A | | | 39,600 | | | | 296,208 | |
CBS Corp., Class B | | | 6,900 | | | | 223,560 | |
Chico’s FAS, Inc. | | | 10,800 | | | | 200,880 | |
Comcast Corp., Class A | | | 14,600 | | | | 547,646 | |
Dillard’s, Inc., Class A | | | 3,600 | | | | 277,200 | |
DIRECTV* | | | 8,700 | | | | 444,657 | |
Foot Locker, Inc. | | | 900 | | | | 30,150 | |
Gap, Inc., The | | | 12,800 | | | | 457,216 | |
Harman International Industries, Inc. | | | 4,300 | | | | 180,299 | |
Home Depot, Inc., The4 | | | 9,600 | | | | 589,248 | |
Liberty Interactive Corp., Class A* | | | 2,500 | | | | 50,000 | |
Marriott International Inc. | | | 1,200 | | | | 43,776 | |
News Corp., Class A | | | 22,900 | | | | 547,768 | |
Regal Entertainment Group, Class A1 | | | 1,700 | | | | 26,112 | |
TJX Cos., Inc. | | | 8,100 | | | | 337,203 | |
Town Sports International Holdings, Inc.* | | | 2,700 | | | | 34,020 | |
Viacom, Inc., Class B | | | 1,000 | | | | 51,270 | |
Walt Disney Co., The | | | 5,400 | | | | 264,978 | |
Wyndham Worldwide Corp. | | | 1,900 | | | | 95,760 | |
Total Consumer Discretionary | | | | | | | 5,425,724 | |
| | |
Consumer Staples - 10.1% | | | | | | | | |
Brown-Forman Corp., Class B | | | 5,050 | | | | 323,503 | |
Church & Dwight Co., Inc. | | | 600 | | | | 30,456 | |
Clorox Co., The | | | 5,700 | | | | 412,110 | |
Colgate-Palmolive Co. | | | 700 | | | | 73,472 | |
CVS Caremark Corp. | | | 3,300 | | | | 153,120 | |
Energizer Holdings, Inc. | | | 400 | | | | 29,188 | |
Ingredion, Inc. | | | 1,200 | | | | 73,752 | |
Kroger Co., The | | | 30,700 | | | | 774,254 | |
Nu Skin Enterprises, Inc., Class A1 | | | 17,900 | | | | 847,207 | |
Pantry, Inc., The* | | | 7,200 | | | | 95,508 | |
Philip Morris International, Inc.4 | | | 10,900 | | | | 965,304 | |
Procter & Gamble Co., The4 | | | 6,400 | | | | 443,136 | |
Safeway, Inc.1 | | | 2,600 | | | | 42,406 | |
USANA Health Sciences, Inc.* | | | 1,000 | | | | 43,140 | |
Walgreen Co. | | | 3,500 | | | | 123,305 | |
Wal-Mart Stores, Inc. | | | 400 | | | | 30,008 | |
Whole Foods Market, Inc. | | | 3,700 | | | | 350,501 | |
Total Consumer Staples | | | | | | | 4,810,370 | |
| | | | | | | | |
| | | Shares | | | Value | |
| | | | | | | | |
Energy - 9.4% | | | | | | | | |
Chevron Corp.4 | | | 10,800 | | | $ | 1,190,268 | |
ConocoPhillips4 | | | 7,800 | | | | 451,230 | |
Exxon Mobil Corp.4 | | | 17,300 | | | | 1,577,241 | |
Occidental Petroleum Corp.4 | | | 5,100 | | | | 402,696 | |
RPC, Inc.1 | | | 20,800 | | | | 238,368 | |
Tesoro Corp. | | | 4,800 | | | | 181,008 | |
Valero Energy Corp. | | | 13,100 | | | | 381,210 | |
Western Refining, Inc. | | | 1,900 | | | | 47,253 | |
Total Energy | | | | | | | 4,469,274 | |
| | |
Financials - 14.1% | | | | | | | | |
Aflac, Inc. | | | 11,900 | | | | 592,382 | |
AG Mortgage Investment Trust, Inc. | | | 1,800 | | | | 43,110 | |
Alexander’s, Inc. | | | 100 | | | | 44,396 | |
Allied World Assurance Co. Holdings AG | | | 700 | | | | 56,210 | |
Allstate Corp., The | | | 5,900 | | | | 235,882 | |
American Express Co.4 | | | 13,400 | | | | 749,998 | |
American International Group, Inc.* | | | 1,500 | | | | 52,395 | |
American Tower Corp. | | | 700 | | | | 52,703 | |
Banco Latinoamericano de Comercio Exterior SA | | | 1,100 | | | | 24,750 | |
Bank of America Corp. | | | 32,900 | | | | 306,628 | |
Berkshire Hathaway, Inc., Class B* | | | 3,000 | | | | 259,050 | |
Capstead Mortgage Corp. | | | 35,900 | | | | 442,288 | |
Citigroup, Inc. | | | 8,900 | | | | 332,771 | |
Discover Financial Services | | | 5,700 | | | | 233,700 | |
Dynex Capital, Inc. | | | 6,300 | | | | 62,496 | |
Franklin Resources, Inc. | | | 500 | | | | 63,900 | |
Goldman Sachs Group, Inc., The | | | 1,500 | | | | 183,585 | |
Hospitality Properties Trust | | | 7,600 | | | | 175,712 | |
JPMorgan Chase & Co. | | | 11,700 | | | | 487,656 | |
KeyCorp | | | 37,300 | | | | 314,066 | |
MetLife, Inc. | | | 800 | | | | 28,392 | |
Morgan Stanley | | | 4,500 | | | | 78,210 | |
Old National Bancorp | | | 24,400 | | | | 299,388 | |
Prudential Financial, Inc. | | | 600 | | | | 34,230 | |
Republic Bancorp, Inc., Class A | | | 6,200 | | | | 134,044 | |
Simon Property Group, Inc. | | | 1,600 | | | | 243,536 | |
Sterling Financial Corp. | | | 8,300 | | | | 176,458 | |
Torchmark Corp. | | | 1,700 | | | | 86,003 | |
Two Harbors Investment Corp. | | | 31,000 | | | | 369,830 | |
Virtus Investment Partners, Inc.* | | | 500 | | | | 48,000 | |
Wells Fargo & Co. | | | 15,100 | | | | 508,719 | |
Total Financials | | | | | | | 6,720,488 | |
The accompanying notes are an integral part of these financial statements.
14
Managers AMG FQ U.S. Equity Fund
Schedule of Portfolio Investments (continued)
| | | | | | | | |
| | | Shares | | | Value | |
| | | | | | | | |
Health Care - 12.7% | | | | | | | | |
Amgen, Inc. | | | 1,700 | | | $ | 147,127 | |
AMN Healthcare Services, Inc.* | | | 8,200 | | | | 81,344 | |
CareFusion Corp.* | | | 9,400 | | | | 249,664 | |
HealthSouth Corp.* | | | 4,200 | | | | 92,946 | |
Life Technologies Corp.* | | | 1,200 | | | | 58,692 | |
Magellan Health Services, Inc.* | | | 2,900 | | | | 145,435 | |
Medtronic, Inc. | | | 19,300 | | | | 802,494 | |
Merck & Co., Inc. | | | 22,400 | | | | 1,022,112 | |
Pfizer, Inc.4 | | | 50,000 | | | | 1,243,500 | |
PharMerica Corp.* | | | 16,900 | | | | 206,518 | |
Sciclone Pharmaceuticals, Inc.* | | | 38,500 | | | | 212,135 | |
Select Medical Holdings Corp.* | | | 6,000 | | | | 63,540 | |
Skilled Healthcare Group, Inc.,
Class A*,1 | | | 4,200 | | | | 32,634 | |
STERIS Corp. | | | 19,100 | | | | 680,151 | |
Thermo Fisher Scientific, Inc. | | | 900 | | | | 54,954 | |
UnitedHealth Group, Inc.4 | | | 9,800 | | | | 548,800 | |
Warner Chilcott PLC, Class A | | | 35,000 | | | | 405,300 | |
Total Health Care | | | | | | | 6,047,346 | |
| | |
Industrials - 10.0% | | | | | | | | |
Alaska Air Group, Inc.* | | | 6,800 | | | | 260,032 | |
Amerco, Inc. | | | 1,500 | | | | 173,310 | |
Copart, Inc.* | | | 2,000 | | | | 57,580 | |
Danaher Corp. | | | 3,200 | | | | 165,536 | |
Emerson Electric Co. | | | 1,100 | | | | 53,273 | |
EnerSys, Inc.* | | | 1,400 | | | | 48,272 | |
FedEx Corp. | | | 5,500 | | | | 505,945 | |
Forward Air Corp. | | | 1,400 | | | | 46,718 | |
General Electric Co. | | | 13,500 | | | | 284,310 | |
Hyster-Yale Materials Handling, Inc., Class B* | | | 600 | | | | 24,648 | |
Lincoln Electric Holdings, Inc. | | | 900 | | | | 39,033 | |
NACCO Industries, Inc., Class A | | | 600 | | | | 30,384 | |
Northrop Grumman Corp. | | | 6,200 | | | | 425,878 | |
Parker Hannifin Corp. | | | 2,800 | | | | 220,248 | |
Sauer-Danfoss, Inc. | | | 6,800 | | | | 272,408 | |
Southwest Airlines Co. | | | 31,600 | | | | 278,712 | |
Steelcase, Inc., Class A | | | 16,900 | | | | 169,169 | |
Swift Transportation Co.*,1 | | | 5,100 | | | | 49,725 | |
UniFirst Corp. | | | 7,500 | | | | 521,775 | |
Union Pacific Corp. | | | 6,500 | | | | 799,695 | |
United Parcel Service, Inc., Class B | | | 1,000 | | | | 73,250 | |
United Rentals, Inc.* | | | 1,200 | | | | 48,792 | |
United Technologies Corp.4 | | | 2,600 | | | | 203,216 | |
Total Industrials | | | | | | | 4,751,909 | |
| | | | | | | | |
| | | Shares | | | Value | |
| | | | | | | | |
Information Technology - 21.0% | | | | | | | | |
Actuate Corp.* | | | 8,200 | | | $ | 43,706 | |
AOL, Inc.* | | | 2,800 | | | | 96,124 | |
Apple, Inc.4 | | | 3,051 | | | | 1,815,650 | |
Brocade Communications Systems, Inc.* | | | 87,300 | | | | 462,690 | |
CA, Inc. | | | 1,200 | | | | 27,024 | |
Cisco Systems, Inc. | | | 33,500 | | | | 574,190 | |
CSG Systems International, Inc.* | | | 4,800 | | | | 98,928 | |
Diebold, Inc. | | | 1,360 | | | | 40,460 | |
First Solar, Inc.*,1 | | | 4,800 | | | | 116,688 | |
Google, Inc., Class A*,4 | | | 144 | | | | 97,887 | |
GSI Group, Inc.* | | | 16,650 | | | | 129,371 | |
Harris Corp. | | | 9,300 | | | | 425,754 | |
Hewlett-Packard Co. | | | 2,100 | | | | 29,085 | |
IAC/InterActiveCorp | | | 5,600 | | | | 270,760 | |
International Business Machines Corp.4 | | | 5,200 | | | | 1,011,556 | |
KLA-Tencor Corp. | | | 11,700 | | | | 544,284 | |
LSI Corp.* | | | 57,300 | | | | 392,505 | |
Mastercard, Inc., Class A | | | 340 | | | | 156,716 | |
Microsoft Corp.4 | | | 44,100 | | | | 1,258,393 | |
Multi-Fineline Electronix, Inc.* | | | 3,700 | | | | 78,218 | |
Oracle Corp.4 | | | 12,600 | | | | 391,230 | |
Power-One, Inc.* | | | 36,400 | | | | 146,692 | |
Total System Services, Inc. | | | 16,300 | | | | 366,587 | |
Visa, Inc., Class A4 | | | 5,800 | | | | 804,808 | |
Western Union Co., The | | | 8,200 | | | | 104,140 | |
Zebra Technologies Corp., Class A* | | | 12,700 | | | | 456,311 | |
Zygo Corp.* | | | 1,500 | | | | 27,930 | |
Total Information Technology | | | | | | | 9,967,687 | |
| | |
Materials - 4.1% | | | | | | | | |
AEP Industries, Inc.* | | | 1,000 | | | | 63,930 | |
CF Industries Holdings, Inc. | | | 3,300 | | | | 677,127 | |
Eastman Chemical Co. | | | 7,100 | | | | 420,604 | |
International Paper Co. | | | 4,500 | | | | 161,235 | |
LSB Industries, Inc.* | | | 1,200 | | | | 48,324 | |
LyondellBasell Industries N.V., Class A | | | 900 | | | | 48,051 | |
Monsanto Co. | | | 1,300 | | | | 111,891 | |
Mosaic Co., The | | | 400 | | | | 20,936 | |
Schweitzer-Mauduit International, Inc. | | | 9,000 | | | | 315,270 | |
Westlake Chemical Corp. | | | 800 | | | | 60,848 | |
Total Materials | | | | | | | 1,928,216 | |
| | |
Telecommunication
Services - 3.6% | | | | | | | | |
AT&T, Inc. | | | 16,100 | | | | 556,899 | |
Atlantic Tele-Network, Inc. | | | 3,000 | | | | 124,320 | |
MetroPCS Communications, Inc.* | | | 29,700 | | | | 303,237 | |
The accompanying notes are an integral part of these financial statements.
15
Managers AMG FQ U.S. Equity Fund
Schedule of Portfolio Investments (continued)
| | | | | | | | |
| | | Shares | | | Value | |
| | | | | | | | |
Telecommunication
Services - 3.6% (continued) | | | | | | | | |
Verizon Communications, Inc.4 | | | 16,100 | | | $ | 718,704 | |
Total Telecommunication Services | | | | | | | 1,703,160 | |
| | |
Utilities - 2.6% | | | | | | | | |
American Electric Power Co., Inc. | | | 15,100 | | | | 671,044 | |
DTE Energy Co. | | | 9,400 | | | | 583,740 | |
Total Utilities | | | | | | | 1,254,784 | |
Total Common Stocks
(cost $42,150,544) | | | | | | | 47,078,958 | |
| | |
| | | Number
of
Contracts | | | | |
Purchased Options - 0.1% | | | | | | | | |
S&P 500 Puts, 1250 Strike Price, Expiration 11/17/12 | | | 145 | | | | 10,875 | |
S&P 500 Puts, 1325 Strike Price, Expiration 11/17/12 | | | 100 | | | | 27,900 | |
Total Purchased Options
(cost $206,168) | | | | | | | 38,775 | |
| | | | | | | | |
| | | Shares | | | Value | |
| | | | | | | | |
Other Investment
Companies - 3.4%2 | | | | | | | | |
BNY Mellon Overnight Government Fund, 0.23%3 | | | 1,188,211 | | | $ | 1,188,211 | |
Dreyfus Cash Management Fund, Institutional Class Shares, 0.07% | | | 420,511 | | | | 420,511 | |
Total Other Investment Companies
(cost $1,608,722) | | | | | | | 1,608,722 | |
Total Investments - 102.5%
(cost $43,965,434) | | | | | | | 48,726,455 | |
Other Assets, less
Liabilities - (2.5)% | | | | | | | (1,191,955 | ) |
Net Assets - 100.0% | | | | | | $ | 47,534,500 | |
The accompanying notes are an integral part of these financial statements.
16
Managers AMG FQ Global Alternatives Fund
Investment Manager’s Comments
THE YEAR IN REVIEW
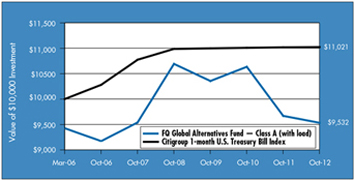
The Managers AMG FQ Global Alternatives Fund delivered negative returns for the past fiscal year ended October 31, 2012. The Fund (Class A shares at NAV) returned -1.40% while the benchmark, the Citigroup 1-Month Treasury Bill Index, returned 0.04% during this time. Please refer to the table on page 18 for the returns of the other share classes.
Global capital markets continued their multi-year rally over the prior fiscal year despite considerable investor concerns about the prospects for a global recession given political and fiscal events in the U.S. and Europe. For the entire one-year period ended October 31, 2012, U.S. large-cap stocks performed broadly in line with their smaller-cap brethren with the Russell 1000® (large cap), Russell 2000® (small cap), Russell 3000® (all cap), and the Russell Microcap® Indices returning 15.0%, 14.8%, 14.8%, and 16.5%, respectively. International developed-market stocks sharply underperformed their domestic counterparts as the MSCI EAFE Index returned 4.2% during this period. Meanwhile, REITs modestly underperformed domestic U.S. equities returning 14.1%. Fixed-income securities also enjoyed solid returns for the prior fiscal year as the Barclays U.S. Aggregate and the Barclays Global Aggregate Indexes returned 5.3% and 3.5%, respectively. Lower-quality securities posted results much stronger than their higher-quality counterparts, returning 13.6% as measured by the Barclays U.S. Corporate High Yield Index.
During this period, the Global Alternatives Fund’s disappointing performance was primarily driven by the asset class selection strategy, particularly during the second quarter of 2012, when the Fund’s long to global equities detracted value as markets fell sharply amid global recession fears. The Fund did, however, rally towards the end of the fiscal year driven by solid outperformance from all four of its strategies. In particular, the Fund’s stock country selection finished the year solidly with most of the strategy’s positions adding value led by the Fund’s short position to the Japanese equity market as this market underperformed. Meanwhile, the Fund’s bond country selection strategy delivered mixed results
for the year but recovered solidly from a difficult first month of the period when the strategy had sharply negative performance as a result of a long German Bund position. Finally, the currency strategy, the largest risk allocation within the Fund throughout the year, was a positive contributor to performance, particularly so during the last quarter. The strategy also added new exposures including a short to the Singapore Dollar and a long to the Norwegian Krone.
The tactical risk allocation in the Fund currently finds the most compelling opportunities within the currency and equity country selection strategies. Within the currency strategy, the three largest positions are long positions to the U.S. Dollar and the Euro and a short position to the Australian Dollar. Within the equity country selection strategy, opportunities continued to expand throughout the prior fiscal year with the largest positions shorts to the French and Italian equity markets and a long to the Canadian equity market. The bond country selection strategy is well diversified among its six positions with its largest current position to the Japanese bond market. Finally, within the asset class selection strategy, the Fund maintains a modest long position to global equities and a short position to global bonds.
CUMULATIVE TOTAL RETURN PERFORMANCE
Managers AMG FQ Global Alternatives Fund’s cumulative total return is based on the daily change in net asset value (NAV), and assumes that all distributions were reinvested. This chart compares a hypothetical $10,000 investment made in the Class A Shares (with load) of the Fund on March 30, 2006 (commencement of operations), to a $10,000 investment made in the 1-Month Treasury Index for the same time period. Figures include reinvestment of capital gains and dividends. The listed returns for the Fund are net of expenses and the returns for the index exclude expenses. The graph and table do not reflect the deduction of taxes that a shareholder would pay on a Fund distribution or redemption of shares. Total returns for the Fund would have been lower had certain expenses not been reduced.
17
Managers AMG FQ Global Alternatives Fund
Investment Manager’s Comments (continued)
CUMULATIVE TOTAL RETURN PERFORMANCE (continued)
The table below shows the average annual total returns for the Managers AMG FQ Global Alternatives Fund and Citigroup 1-month U.S. Treasury Bill Index for the same time periods ended October 31, 2012.
| | | | | | | | | | | | | | | | | | | | |
| | | Average Annual Total Returns1 | |
| | | One Year | | | Five Years | | | Ten Years | | | Since
Inception | | | Inception Date | |
Managers AMG FQ Global Alternative Fund2,3,4,5,6 | | | | | | | | | | | | | | | | | | | | |
No Load: | | | | | | | | | | | | | | | | | | | | |
Class A | | | (1.40 | )% | | | (0.01 | )% | | | — | | | | 0.17 | % | | | 03/30/06 | |
Class C | | | (2.00 | )% | | | (0.66 | )% | | | — | | | | (0.50 | )% | | | 03/30/06 | |
Service Class | | | (1.18 | )% | | | — | | | | — | | | | (2.61 | )% | | | 01/01/10 | |
Institutional Class | | | (1.07 | )% | | | — | | | | — | | | | (2.50 | )% | | | 01/01/10 | |
Citigroup 1-month U.S. Treasury Bill Index7 | | | 0.04 | % | | | 0.46 | % | | | — | | | | 1.49 | % | | | 03/31/06 | † |
| | | | | |
With Load: | | | | | | | | | | | | | | | | | | | | |
Class A | | | (7.09 | )% | | | (1.20 | )% | | | — | | | | (0.72 | )% | | | 03/30/06 | |
Class C | | | (2.98 | )% | | | (0.66 | )% | | | — | | | | (0.50 | )% | | | 03/30/06 | |
The performance data shown represents past performance. Past performance is not a guarantee of future results. Current performance may be lower or higher than the performance data quoted. The investment return and principal value of an investment in the Fund will fluctuate so that an investor’s shares, when redeemed, may be worth more or less than their original cost. For performance information through the most recent month end please call (800) 835-3879 or visit our Web site at www.managersinvest.com.
Performance differences among the share classes are due to differences in sales charge structures and class expenses. Returns shown reflect maximum sales charge of 4.25% on Class A, as well as the applicable contingent deferred sales charge (CDSC) on Class C shares. Class C shares held for less than one year are subject to a 1% CDSC.
Investors should carefully consider the Fund’s investment objectives, risks, charges and expenses before investing. For this and other information, please call (800) 835-3879 or visit ww.managersinvest.com for a free prospectus. Read it carefully before investing or sending money. Funds are distributed by Managers Distributors, Inc., a member of FINRA.
| | |
† | | Date reflects the inception date of the Fund’s Class A shares, not the index. |
| | |
1 Total return equals income yield plus share price change and assumes reinvestment of all dividends and capital gain distributions. Returns are net of fees and may reflect offsets of Fund expenses as described in the Prospectus. No adjustment has been made for taxes payable by shareholders on their reinvested dividends and capital gain distributions. Returns for periods greater than one year are the average annual returns. The listed returns on the Fund are net of expenses and based on the published NAV as of October 31, 2012. All returns are in U.S. dollars ($). 2 From time to time, the Fund’s advisor has waived its fees and/or absorbed Fund expenses, which has resulted in higher returns. 3 Class C shares convert to an equal dollar value of Class A shares at the end of the tenth year after purchase. 4 Changing interest rates may adversely affect the value of an investment. An increase in interest rates typically causes the value of bonds and other fixed-income securities to fall. |
5 | | The Fund may use derivative instruments for hedging purposes or as part of its investment strategy. There is a risk that a derivative intended as a hedge may not perform as expected. The main risk with derivatives is that some types can amplify a gain or loss, potentially earning or losing substantially more money than the actual cost of the derivative or that the counterparty may fail to honor its contract terms, causing a loss for the Fund. Use of these instruments may also involve certain costs and risks such as liquidity risk, interest rate risk, market risk, credit risk, management risk, and the risk that a fund could not close out a position when it would be most advantageous to do so. The Fund is subject to currency risk resulting from fluctuations in exchange rates that may affect the total loss or gain on a non-U.S. Dollar security when converted back to U.S. Dollars. |
6 | | Investments in foreign securities and currency instruments are subject to additional risks such as erratic market conditions, economic and political instability, and currency exchange rate fluctuations. |
7 | | Performance for the Citigroup 1-Month U.S. Treasury Bill Index reflects an inception date of March 31, 2006. The Citigroup 1-Month U.S. Treasury Bill Index is a market value-weighted index of public obligations of the U.S. Treasury with maturities of one month. Unlike the Fund, the Citigroup 1-month U.S. Treasury Bill Index is unmanaged, is not available for investment, and does not incur expenses. |
| Not FDIC insured, nor bank guaranteed. May lose value. |
18
Managers AMG FQ Global Alternatives Fund
Schedule of Portfolio Investments
October 31, 2012
| | | | | | | | |
| | | Shares | | | Value | |
Exchange Traded Funds - 22.4% | | | | | | | | |
SPDR S&P 500 ETF Trust (cost $55,991,739) | | | 510,618 | | | $ | 72,089,049 | |
| | |
| | | Principal Amount | | | | |
U.S. Government and Agency Obligations - 15.0% | | | | | | | | |
U.S. Treasury Bills, 0.069%, 11/15/125,6 | | $ | 1,000,000 | | | | 999,977 | |
U.S. Treasury Bills, 0.094%, 12/06/125,6 | | | 28,625,000 | | | | 28,622,367 | |
U.S. Treasury Bills, 0.104%, 12/20/125,6 | | | 18,480,000 | | | | 18,477,542 | |
Total U.S. Government and Agency Obligations (cost $48,098,707) | | | | | | | 48,099,886 | |
| | |
| | | Shares | | | | |
Other Investment Companies - 62.8%2 | | | | | | | | |
Dreyfus Cash Management Fund, Institutional Class Shares, 0.07% | | | 26,079,106 | | | | 26,079,106 | |
JPMorgan Liquid Assets Money Market Fund, Capital Shares, 0.14% | | | 175,812,552 | | | | 175,812,552 | |
Total Other Investment Companies
(cost $201,891,658) | | | | | | | 201,891,658 | |
Total Investments - 100.2% (cost $305,982,104) | | | | | | | 322,080,593 | |
Other Assets, less Liabilities - (0.2)% | | | | | | | (616,126 | ) |
Net Assets - 100.0% | | | | | | $ | 321,464,467 | |
The accompanying notes are an integral part of these financial statements.
19
Managers AMG FQ Global Essentials Fund
Investment Manager’s Comments
THE YEAR IN REVIEW
The Managers AMG FQ Global Essentials Fund delivered strong positive absolute and relative returns for the past fiscal year ended October 31, 2012. The Fund (Investor Class shares at NAV) returned 8.75%, while its benchmark, which consists of 60% of the return of MSCI World (hedged) Index and 40% of the return of the Citigroup World Government Bond (hedged) Index, returned 7.44% during this time.
Global capital markets continued their multi-year rally over the prior fiscal year despite considerable investor concerns about the prospects for a global recession given political and fiscal events in the U.S. and Europe. For the entire one-year period ended October 31, 2012, U.S. large-cap stocks performed broadly in line with their smaller-cap brethren with the Russell 1000® (large cap), Russell 2000® (small cap), Russell 3000® (all cap), and the Russell Microcap® Indices returning 15.0%, 14.8%, 14.8%, and 16.5%, respectively. International developed-market stocks sharply underperformed their domestic counterparts as the MSCI EAFE Index returned 4.2% during this period. Meanwhile, REITs modestly underperformed domestic U.S. equities returning 14.1%. Fixed-income securities also enjoyed solid returns for the prior fiscal year as the Barclays U.S. Aggregate and the Barclays Global Aggregate Indexes returned 5.3% and 3.5%, respectively. Lower-quality securities posted results much stronger than their higher-quality counterparts, returning 13.6% as measured by the Barclays U.S. Corporate High Yield Index.
The Fund’s solid absolute performance throughout the year was driven by all three of the Fund’s primary exposures- equities, fixed income, and ‘hard assets’ (commodities and TIPS). The diversification benefits of the assets within the Fund were evident throughout the year. For example, the Fund’s equity exposures
delivered solid performance during the start of the year amid global optimism about the potential clearing of the macroeconomic overhang. However, the Fund’s sovereign bond exposure performed the best during the second quarter as skittish investors sold off risk-based assets such as equities, high yield, and commodities. Meanwhile, the Fund’s commodity investments performed the best during the third quarter as prices for select commodities rallied sharply. First Quadrant, L.P., achieved a three year track record as the Subadvisor to the Fund on September 30, 2012.
The First Quadrant Market Risk Index, (one of FQ’s proprietary investment tools) is currently measuring a “Median Risk” environment as of the end of the fiscal year as, more recently, the Fund’s composite VIX measure dropped below its long-term median which potentially results in a more benign risk environment. This has led to a recent increase in exposure to both equities and commodities and decrease in exposure to sovereign debt within the Fund.
CUMULATIVE TOTAL RETURN PERFORMANCE
Managers AMG FQ Global Essentials Fund’s cumulative total return is based on the daily change in net asset value (NAV), and assumes that all distributions were reinvested. This chart compares a hypothetical $10,000 investment made in the Institutional Class Shares of the Fund on October 31, 2002, to a $10,000 investment made in the Hedged Index and the Unhedged Index for the same time period. Figures include reinvestment of capital gains and dividends. The listed returns for the Fund are net of expenses and the returns for the index exclude expenses. The graph and table do not reflect the deduction of taxes that a shareholder would pay on a Fund distribution or redemption of shares. Total returns for the Fund would have been lower had certain expenses not been reduced.
20
Managers AMG FQ Global Essentials Fund
Investment Manager’s Comments (continued)
CUMULATIVE TOTAL RETURN PERFORMANCE (continued)
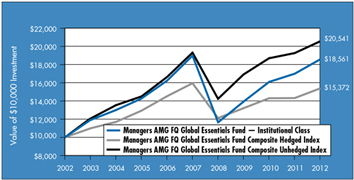
The table below shows the average annual total returns for the Managers AMG FQ Global Essentials Fund and Managers AMG FQ Global Essentials Fund Composite Hedged and Unhedged Indexes for the same time periods ended October 31, 2012.
| | | | | | | | | | | | | | | | | | | | |
| | | Average Annual Total Returns1 | |
| | | One Year | | | Five Years | | | Ten Years | | | Since Inception | | | Inception Date | |
Managers AMG FQ Global Essentials Fund2,3,4,5,6,7 | | | | | | | | | | | | | | | | | | | | |
Investor Class | | | 8.75 | % | | | — | | | | — | | | | 9.16 | % | | | 01/01/10 | |
Service Class | | | 9.11 | % | | | — | | | | — | | | | 9.51 | % | | | 01/01/10 | |
Institutional Class | | | 9.29 | % | | | (0.43 | )% | | | 6.38 | % | | | 6.41 | % | | | 11/18/88 | |
Managers AMG FQ Global | | | | | | | | | | | | | | | | | | | | |
Essentials Fund Composite | | | | | | | | | | | | | | | | | | | | |
Hedged Index8 | | | 7.44 | % | | | (0.72 | )% | | | 4.39 | % | | | 5.37 | % | | | 11/30/88 | † |
Managers AMG FQ Global | | | | | | | | | | | | | | | | | | | | |
Essentials Fund Composite | | | | | | | | | | | | | | | | | | | | |
Unhedged Index8 | | | 6.71 | % | | | 1.25 | % | | | 7.46 | % | | | 6.67 | % | | | 11/30/88 | † |
The performance data shown represents past performance. Past performance is not a guarantee of future results. Current performance may be lower or higher than the performance data quoted. The investment return and principal value of an investment in the Fund will fluctuate so that an investor’s shares, when redeemed, may be worth more or less than their original cost. For performance information through the most recent month end please call (800) 835-3879 or visit our Web site at www.managersinvest.com.
Performance differences among the share classes are due to the differences in sales charge structures and class expenses. Load performance: maximum sales charge on Class A shares is 5.75% and Class C shares held for less than one year are subject to a 1.0% contingent deferred sales charge (CDSC).
Investors should carefully consider the Fund’s investment objectives, risks, charges and expenses before investing. For this and other information, please call (800) 835-3879 or visit www.managersinvest.com for a free prospectus. Read it carefully before investing or sending money. Funds are distributed by Managers Distributors, Inc., a member of FINRA.
| | |
† | | Date reflects the inception date of the Fund’s Institutional Class shares, not the index. |
| | |
1 Total return equals income yield plus share price change and assumes reinvestment of all dividends and capital gain distributions. Returns are net of fees and may reflect offsets of Fund expenses as described in the Prospectus. No adjustment has been made for taxes payable by shareholders on their reinvested dividends and capital gain distributions. Returns for periods greater than one year are the average annual returns. The listed returns on the Fund are net of expenses and based on the published NAV as of October 31, 2012. All returns are in U.S. dollars ($). 2 From time to time, the Fund’s advisor has waived its fees and/or absorbed Fund expenses, which has resulted in higher returns. 3 Investments in foreign securities, even though publicly traded in the United States, may involve risks which are in addition to those inherent in domestic investments. 4 The Fund is subject to special risk considerations similar to those associated with the direct ownership of real estate. Real estate valuations may be subject to factors such as changing general and local economic, financial, competitive and environmental conditions. 5 Because the Fund invests in exchange traded funds (ETFs) which incur their own costs, investing in them could result in a higher cost to the investor. Additionally, the Fund will be indirectly exposed to all the risks of securities held by the ETFs. |
6 | | Obligations of certain government agencies are not backed by the full faith and credit of the U.S. Government. If one of these agencies defaulted on a loan, there is no guarantee that the U.S. Government will provide financial support. Additionally, debt securities of the U.S. Government may be affected by changing interest rates and subject to prepayment risk. |
7 | | The use of leverage in a Fund’s strategy can magnify relatively small market movements into relatively larger losses for the Fund. |
8 | | The Fund’s index is comprised of 60% MSCI World Index, 40% Citigroup World Government Bond Index and reflects an inception date of November 30, 1988. The MSCI World Index is a free float-adjusted market capitalization weighted index that is designed to measure the equity market performance of developed and emerging markets. The MSCI World Index consists of 24 developed country indices. The Citigroup World Government Bond Index is a market capitalization weighted index consisting of the government bond markets. Country eligibility is determined based on market capitalization and investability criteria. All issues have a remaining maturity of at least one year. Unlike the Fund, the Composite Index is unmanaged, is not available for investment, and does not incur fees. All MSCI data is provided ‘as is.’ The products described herein are not sponsored or endorsed and have not been reviewed or passed on by MSCI. In no event shall MSCI, its affiliates, or any MSCI data provider have any liability of any kind in connection with the MSCI data or the products described herein. Copying or redistributing the MSCI data is strictly prohibited. |
| Not FDIC insured, nor bank guaranteed. May lose value. |
21
Managers AMG FQ Global Essentials Fund
Schedule of Portfolio Investments
October 31, 2012
| | | | | | | | |
| | | Shares | | | Value | |
| | | | | | | | |
Exchange Traded Funds - 41.8% | | | | | | | | |
iShares Barclays TIPS Bond Fund | | | 211,834 | | | $ | 25,962,375 | |
iShares iBoxx $ High Yield Corporate Bond Fund | | | 104,435 | | | | 9,673,814 | |
Jefferies TR/J CRB Global Commodity Equity Index Fund | | | 42,223 | | | | 1,888,875 | |
Market Vectors RVE Hard Assets Producers | | | 52,744 | | | | 1,894,564 | |
Materials Select Sector SPDR Fund1 | | | 51,408 | | | | 1,850,174 | |
SPDR DB International Government Inflation-Protected Bond | | | 92,257 | | | | 5,730,082 | |
Vanguard REIT | | | 74,644 | | | | 4,805,581 | |
Total Exchange Traded Funds (cost $49,434,795) | | | | | | | 51,805,465 | |
| | |
Exchange Traded Notes - 11.7% | | | | | | | | |
Barclays, Inc., iPath Dow Jones-UBS Copper Subindex Total Return, 10/22/37 | | | 50,476 | | | | 2,246,182 | |
Barclays, Inc., iPath Dow Jones-UBS Grains Subindex Total Return, 10/22/37 | | | 20,608 | | | | 1,205,158 | |
Barclays, Inc., iPath Goldman Sachs Crude Oil Total Return Index, 08/07/36 | | | 54,692 | | | | 1,133,765 | |
Deutsche Bank AG, PowerShares DB Agriculture Double Long, 04/01/38 | | | 102,554 | | | | 1,313,717 | |
Deutsche Bank AG, PowerShares DB Gold Double Long, 02/15/38 | | | 66,621 | | | | 3,682,809 | |
Swedish Export Credit Corp., ELEMENTS Linked to the Rogers International Commodity Index - Total Return, 10/24/22 | | | 575,505 | | | | 4,909,058 | |
Total Exchange Traded Notes (cost $14,888,844) | | | | | | | 14,490,689 | |
| | |
| | | Principal
Amount | | | | |
U.S. Government and Agency Obligations - 7.3% | | | | | | | | |
U.S. Treasury Bills, 0.094%, 12/06/125,6 (cost $8,998,862) | | $ | 9,000,000 | | | | 8,999,190 | |
| | |
| | | Shares | | | | |
Other Investment Companies - 40.5%2 | | | | | | | | |
BNY Mellon Overnight Government Fund, 0.23%3 | | | 1,805,600 | | | | 1,805,600 | |
Dreyfus Cash Management Fund, Institutional Class Shares, 0.07% | | | 23,330,577 | | | | 23,330,577 | |
JPMorgan Liquid Assets Money Market Fund, Capital Shares, 0.14% | | | 25,115,101 | | | | 25,115,101 | |
Total Other Investment Companies (cost $50,251,278) | | | | | | | 50,251,278 | |
Total Investments - 101.3%
(cost $123,573,779) | | | | | | | 125,546,622 | |
Other Assets, less Liabilities - (1.3)% | | | | | | | (1,592,933 | ) |
Net Assets - 100.0% | | | | | | $ | 123,953,689 | |
The accompanying notes are an integral part of these financial statements.
22
Notes to Schedules of Portfolio Investments
The following footnotes and abbreviations should be read in conjunction with each of the Schedules of Portfolio Investments previously presented in this report.
At October 31, 2012, the approximate cost of investments for Federal income tax purposes and the gross aggregate unrealized appreciation and/or depreciation based on tax cost were as follows:
| | | | | | | | | | | | | | | | |
Fund | | Cost | | | Appreciation | | | Depreciation | | | Net | |
Managers AMG FQ Tax-Managed U.S. Equity Fund | | $ | 34,027,738 | | | $ | 10,272,170 | | | $ | (1,043,804 | ) | | $ | 9,228,366 | |
Managers AMG FQ U.S. Equity Fund | | | 44,069,372 | | | | 5,857,871 | | | | (1,200,788 | ) | | | 4,657,083 | |
Managers AMG FQ Global Alternatives Fund | | | 305,982,104 | | | | 16,098,489 | | | | — | | | | 16,098,489 | |
Managers AMG FQ Global Essentials Fund | | | 123,882,145 | | | | 2,680,227 | | | | (1,015,750 | ) | | | 1,664,477 | |
| | * | Non-income-producing security. |
| | 1 | Some or all of these securities were out on loan to various brokers as of October 31, 2012, amounting to: |
| | | | | | | | |
Fund | | Market Value | | | % of Net Assets | |
Managers AMG FQ Tax-Managed U.S. Equity Fund | | $ | 517,574 | | | | 1.2 | % |
Managers AMG FQ U.S. Equity Fund | | | 1,255,686 | | | | 2.6 | % |
Managers AMG FQ Global Essentials Fund | | | 1,758,264 | | | | 1.4 | % |
| | 2 | Yield shown for each investment company represents the October 31, 2012, seven-day average yield, which refers to the sum of the previous seven days’ dividends paid, expressed as an annual percentage. |
| | 3 | Collateral received from brokers for securities lending was invested in this short-term investment. |
| | 4 | Some or all of this security is held as collateral for options written. |
| | 5 | Indicates yield to maturity at October 31, 2012 |
| | 6 | Some or all of these securities were held as collateral for futures contracts as of October 31, 2012, amounting to: |
| | | | | | | | |
Fund | | Market Value | | | % of Net Assets | |
Managers AMG FQ Global Alternatives Fund | | $ | 48,099,886 | | | | 15.0 | % |
Managers AMG FQ Global Essentials Fund | | | 8,999,190 | | | | 7.3 | % |
The accompanying notes are an integral part of these financial statements.
23
Notes to Schedules of Portfolio Investments (continued)
As of October 31, 2012, the securities in Managers AMG FQ Tax-Managed U.S. Equity Fund were all Level 1 inputs. For a detailed break-out of the common stocks by major industry classification, please refer to the respective Schedule of Portfolio Investments.
The following tables summarize the inputs used to value the Funds’ net assets by the fair value hierarchy levels as of October 31, 2012: (See Note 1(a) in the Notes to Financial Statements.)
| | | | | | | | | | | | | | | | |
| | | Quoted Prices
in Active
Markets for
Identical
Investments
Level 1 | | | Significant
Other
Observable
Inputs
Level 2 | | | Significant
Unobservable
Inputs
Level 3 | | | Total | |
Managers AMG FQ U.S. Equity Fund | | | | | | | | | | | | | | | | |
Investments in Securities | | | | | | | | | | | | | | | | |
Common Stocks† | | $ | 47,054,310 | | | $ | 24,648 | | | | — | | | $ | 47,078,958 | |
Other Investment Companies | | | 1,608,722 | | | | — | | | | — | | | | 1,608,722 | |
| | | | | | | | | | | | | | | | |
Total Investments in Securities | | $ | 48,663,032 | | | $ | 24,648 | | | | — | | | $ | 48,687,680 | |
| | | | | | | | | | | | | | | | |
Financial Derivative Instruments-Assets†††† | | | | | | | | | | | | | | | | |
Equity Contracts | | $ | 38,775 | | | | — | | | | — | | | $ | 38,775 | |
| | | | | | | | | | | | | | | | |
Financial Derivative Instruments-Liabilities†††† | | | | | | | | | | | | | | | | |
Equity Contracts | | | (23,733 | ) | | | — | | | | — | | | | (23,733 | ) |
| | | | | | | | | | | | | | | | |
Total Financial Derivative Instruments | | $ | 15,042 | | | | — | | | | — | | | $ | 15,042 | |
| | | | | | | | | | | | | | | | |
| | | | |
| | | Quoted Prices
in Active
Markets for
Identical
Investments
Level 1 | | | Significant
Other
Observable
Inputs
Level 2 | | | Significant
Unobservable
Inputs
Level 3 | | | Total | |
Managers AMG FQ Global Alternatives Fund | | | | | | | | | | | | | | | | |
Investments in Securities | | | | | | | | | | | | | | | | |
Exchange Traded Funds†† | | $ | 72,089,049 | | | | — | | | | — | | | $ | 72,089,049 | |
U.S. Government and Agency Obligations††† | | | — | | | $ | 48,099,886 | | | | — | | | | 48,099,886 | |
| | | | | | | | | | | | | | | | |
Other Investment Companies | | | 201,891,658 | | | | — | | | | — | | | | 201,891,658 | |
| | | | | | | | | | | | | | | | |
Total Investments in Securities | | $ | 273,980,707 | | | $ | 48,099,886 | | | | — | | | $ | 322,080,593 | |
Financial Derivative Instruments-Assets†††† | | | | | | | | | | | | | | | | |
Foreign Exchange Contracts | | | — | | | $ | 12,830,178 | | | | — | | | $ | 12,830,178 | |
Equity Contracts | | $ | 3,715,721 | | | | — | | | | — | | | | 3,715,721 | |
Interest Rate Contracts | | | 114,389 | | | | 528,020 | | | | — | | | | 642,409 | |
| | | | | | | | | | | | | | | | |
| | | 3,830,110 | | | | 13,358,198 | | | | — | | | | 17,188,308 | |
| | | | | | | | | | | | | | | | |
Financial Derivative Instruments-Liabilities†††† | | | | | | | | | | | | | | | | |
Foreign Exchange Contracts | | | — | | | | (11,375,662 | ) | | | — | | | | (11,375,662 | ) |
Equity Contracts | | | (1,086,704 | ) | | | — | | | | — | | | | (1,086,704 | ) |
Interest Rate Contracts | | | (1,976,188 | ) | | | (1,328,307 | ) | | | — | | | | (3,304,495 | ) |
| | | | | | | | | | | | | | | | |
| | | (3,062,892 | ) | | | (12,703,969 | ) | | | — | | | | (15,766,861 | ) |
| | | | | | | | | | | | | | | | |
Total Financial Derivative Instruments | | $ | 767,218 | | | $ | 654,229 | | | | — | | | $ | 1,421,447 | |
| | | | | | | | | | | | | | | | |
The accompanying notes are an integral part of these financial statements.
24
Notes to Schedules of Portfolio Investments (continued)
| | | | | | | | | | | | | | | | |
| | | Quoted Prices in Active
Markets for Identical
Investments
Level 1 | | | Significant Other
Observable Inputs
Level 2 | | | Significant
Unobservable Inputs
Level 3 | | | Total | |
Managers AMG FQ Global Essentials Fund | | | | | | | | | | | | | | | | |
Investments in Securities | | | | | | | | | | | | | | | | |
Exchange Traded Funds†† | | $ | 51,805,465 | | | | — | | | | — | | | $ | 51,805,465 | |
Exchange Traded Notes†† | | | 14,490,689 | | | | — | | | | — | | | | 14,490,689 | |
U.S. Government and Agency Obligations††† | | | — | | | $ | 8,999,190 | | | | — | | | | 8,999,190 | |
Other Investment Companies | | | 50,251,278 | | | | — | | | | — | | | | 50,251,278 | |
| | | | | | | | | | | | | | | | |
Total Investments in Securities | | $ | 116,547,432 | | | $ | 8,999,190 | | | | — | | | $ | 125,546,622 | |
| | | | | | | | | | | | | | | | |
Financial Derivative Instruments-Assets†††† | | | | | | | | | | | | | | | | |
Equity Contracts | | $ | 135,318 | | | | — | | | | — | | | $ | 135,318 | |
Interest Rate Contracts | | | 181,556 | | | | — | | | | — | | | | 181,556 | |
| | | | | | | | | | | | | | | | |
| | | 316,874 | | | | — | | | | — | | | | 316,874 | |
| | | | | | | | | | | | | | | | |
Financial Derivative Instruments-Liabilities†††† | | | | | | | | | | | | | | | | |
Equity Contracts | | | (792,766 | ) | | | — | | | | — | | | | (792,766 | ) |
Interest Rate Contracts | | | (495,260 | ) | | | — | | | | — | | | | (495,260 | ) |
| | | | | | | | | | | | | | | | |
| | | (1,288,026 | ) | | | — | | | | — | | | | (1,288,026 | ) |
| | | | | | | | | | | | | | | | |
Total Financial Derivative Instruments | | $ | (971,152 | ) | | | — | | | | — | | | $ | (971,152 | ) |
| | | | | | | | | | | | | | | | |
| † | For a detailed break-out of the common stocks by major industry classification, please refer to the Schedule of Portfolio Investments. The only Level 2 security is classified in the Industrials industry. |
| †† | All exchange traded funds and exchange traded notes held in the Fund are level 1 securities. For a detailed breakout of these securities, please refer to the Schedule of Portfolio Investments. |
| ††† | All U.S. government and agency obligations held in the Fund are level 2 securities. For a detailed breakout of the U.S. government and agency obligations by major industry or agency classification, please refer to the Schedule of Portfolio Investments. |
| †††† | Derivative instruments, such as futures, options and forwards, are not reflected in the Schedule of Portfolio Investments. Futures and forwards are valued at the unrealized appreciation/depreciation of the instrument and options are shown at value. |
| | As of October 31, 2012, the Funds had no significant transfers between Level 1 and Level 2 from the beginning of the reporting period. |
The following schedule shows the fair value of derivative instruments at October 31, 2012:
| | | | | | | | | | | | | | |
| | | Asset Derivatives | | | Liability Derivatives | |
Fund | | Derivatives not accounted for as
hedging instruments | | Statement of Assets and Liabilities
Location | | Fair Value | | | Statement of Assets and Liabilities
Location | | Fair Value | |
Managers AMG FQ U.S. Equity Fund | | Equity contracts | | Options purchased | | $ | 38,775 | | | Options written | | $ | 21,150 | |
| | Equity contracts | | Variation margin receivable*,1 | | | — | | | Variation margin payable*,1 | | | 2,583 | |
| | | | | | | | | | | | | | |
| | | | Totals | | $ | 38,775 | | | | | $ | 23,733 | |
| | | | | | | | | | | | | | |
| | |
| | | Asset Derivatives | | | Liability Derivatives | |
Fund | | Derivatives not accounted for as
hedging instruments | | Statement of Assets and Liabilities
Location | | Fair Value | | | Statement of Assets and Liabilities
Location | | Fair Value | |
Managers AMG FQ Global Alternatives Fund | | Equity contracts | | Variation margin receivable*,1 | | $ | 3,715,721 | | | Variation margin payable*,1 | | $ | 1,086,704 | |
| | Interest rate contracts* | | Variation margin receivable*,1 | | | 642,409 | | | Variation margin payable*,1 | | | 3,304,495 | |
| | Foreign exchange contracts | | Unrealized appreciation of foreign currency contracts | | | 12,830,178 | | | Unrealized depreciation of foreign currency contracts | | | 11,375,662 | |
| | | | | | | | | | | | | | |
| | | | Totals | | $ | 17,188,308 | | | | | $ | 15,766,861 | |
| | | | | | | | | | | | | | |
The accompanying notes are an integral part of these financial statements.
25
Notes to Schedules of Portfolio Investments (continued)
| | | | | | | | | | | | | | |
| | | Asset Derivatives | | | Liability Derivatives | |
Fund | | Derivatives not accounted for as
hedging instruments | | Statement of Assets and Liabilities
Location | | Fair Value | | | Statement of Assets and Liabilities
Location | | Fair Value | |
Managers AMG FQ Global Essentials Fund | | Equity contracts | | Variation margin receivable*,1 | | $ | 135,318 | | | Variation margin payable*,1 | | $ | 792,766 | |
| | Interest rate contracts | | Variation margin receivable*,1 | | | 181,556 | | | Variation margin payable*,1 | | | 495,260 | |
| | | | | | | | | | | | | | |
| | | | Totals | | $ | 316,874 | | | | | $ | 1,288,026 | |
| | | | | | | | | | | | | | |
| * | Includes only the October 31, 2012 futures variation margin. Prior futures variation margin movements have been reflected in cash on the Statement of Assets and Liabilities upon receipt or payment. |
| 1 | Only current day’s variation margin is reported within the Statements of Assets and Liabilities. |
For the year ended October 31, 2012, the effect of derivative instruments on the Statement of Operations for the Funds and the amount of realized gain (loss) on derivatives recognized in income is as follows:
| | | | | | | | | | | | | | |
Fund | | Derivatives not accounted for as hedging
instruments | | Futures | | | Options | | | Total | |
Managers AMG FQ U.S. Equity Fund | | Equity contracts | | $ | 24,554 | | | $ | (958,905 | ) | | $ | (934,351 | ) |
| | | | | | | | | | | | | | |
| | | | |
Fund | | Derivatives not accounted for as hedging
instruments | | Futures | | | Forward Currency
Contracts | | | Total | |
Managers AMG FQ Global Alternatives Fund | | Equity contracts | | $ | (18,164,871 | ) | | | — | | | $ | (18,164,871 | ) |
| | Interest rate contracts | | | (53,526 | ) | | | — | | | | (53,526 | ) |
| | Foreign exchange contracts | | | — | | | $ | 21,457,596 | | | | 21,457,596 | |
| | | | | | | | | | | | | | |
| | Totals | | $ | (18,218,397 | ) | | $ | 21,457,596 | | | $ | 3,239,199 | |
| | | | | | | | | | | | | | |
| | | | |
Fund | | Derivatives not accounted for as hedging
instruments | | Futures | | | Forward Currency
Contracts | | | Total | |
Managers AMG FQ Global Essentials Fund | | Equity contracts | | $ | 2,886,269 | | | | — | | | $ | 2,886,269 | |
| | Interest rate contracts | | | 6,648,260 | | | | — | | | | 6,648,260 | |
| | | | | | | | | | | | | | |
| | Totals | | $ | 9,534,529 | | | | — | | | $ | 9,534,529 | |
| | | | | | | | | | | | | | |
The change in unrealized gain/(loss) on derivatives recognized in income is as follows:
| | | | | | | | | | | | | | |
Fund | | Derivatives not accounted for as hedging
instruments | | Futures | | | Options | | | Total | |
Managers AMG FQ U.S. Equity Fund | | Equity contracts | | $ | (6,310 | ) | | $ | 38,723 | | | $ | 32,413 | |
| | | | | | | | | | | | | | |
| | | | |
Fund | | Derivatives not accounted for as hedging
instruments | | Futures | | | Forward Currency
Contracts | | | Total | |
Managers AMG Global Alternatives Fund | | Equity contracts | | $ | 6,744,307 | | | | — | | | $ | 6,744,307 | |
| | Interest rate contracts | | | (12,977,954 | ) | | | — | | | | (12,977,954 | ) |
| | Foreign exchange contracts | | | — | | | $ | (8,451,541 | ) | | | (8,451,541 | ) |
| | | | | | | | | | | | | | |
| | Totals | | $ | (6,233,647 | ) | | $ | (8,451,541 | ) | | $ | (14,685,188 | ) |
| | | | | | | | | | | | | | |
The accompanying notes are an integral part of these financial statements.
26
Notes to Schedules of Portfolio Investments (continued)
| | | | | | | | | | | | | | | | |
Fund | | Derivatives not accounted for as hedging
instruments | | | Futures | | | Forward Currency
Contracts | | | Total | |
Managers AMG Global Essentials Fund | | | Equity contracts | | | $ | (1,698,594 | ) | | | — | | | $ | (1,698,594 | ) |
| | | Interest rate contracts | | | | 257,374 | | | | — | | | | 257,374 | |
| | | | | | | | | | | | | | | | |
| | | Totals | | | $ | (1,441,220 | ) | | | — | | | $ | (1,441,220 | ) |
| | | | | | | | | | | | | | | | |
At October 31, 2012, the Funds had the following open written options:
(See Note 8 in the Notes to Financial Statements.)
Managers AMG FQ U.S. Equity Fund
| | | | | | | | | | | | | | | | |
Description | | Exercise Price | | Expiration Date | | Number of
Contracts | | | Premium | | | Unrealized
Gain/(Loss) | |
S&P 500 Index (Call) | | 1,500 | | 11/17/12 | | | 145 | | | $ | 101,282 | | | $ | 94,033 | |
S&P 500 Index (Call) | | 1,510 | | 11/17/12 | | | 100 | | | | 15,850 | | | | 12,350 | |
S&P 500 Index (Put) | | 1,175 | | 11/17/12 | | | 145 | | | | 101,283 | | | | 98,382 | |
S&P 500 Index (Put) | | 1,250 | | 11/17/12 | | | 100 | | | | 8,850 | | | | 1,350 | |
| | | | | | | | | | | | | | | | |
| | | | | | | Total | | | $ | 227,265 | | | $ | 206,115 | |
| | | | | | | | | | | | | | | | |
Transactions in written put and call options and swaptions for the fiscal year ended October 31, 2012, were as follows:
(See Note 10 in the Notes to the Financial Statements.)
| | | | | | | | |
| | | Number of
Contracts | | | Amount of Premiums | |
Options outstanding at October 31, 2011 | | | — | | | | — | |
Options written | | | 3,980 | | | $ | 2,013,830 | |
Options exercised/expired/closed | | | (3,490 | ) | | | (1,786,565 | ) |
| | | | | | | | |
Options outstanding at October 31, 2012 | | | 490 | | | $ | 227,265 | |
| | | | | | | | |
All futures contracts are exchange traded unless otherwise noted. The counterparty for all OTC contracts is Morgan Stanley. (See Note 9 in the Notes to Financial Statements.) At October 31, 2012, the Funds had the following open futures contracts:
Managers AMG FQ U.S. Equity Fund - Futures Contracts
| | | | | | | | | | | | |
Type | | Number of
Contracts | | Position | | Expiration
Date | | | Unrealized
Loss | |
S&P 500 E-Mini Index | | 2 | | Long | | | 12/21/12 | | | $ | (2,583 | ) |
| | | | | | | | | | | | |
Managers AMG FQ Global Alternatives Fund - Futures Contracts
| | | | | | | | | | | | | | | | |
Type | | Currency | | Number of
Contracts | | Position | | Type | | Expiration
Date | | | Unrealized
Gain/(Loss) | |
Amsterdam Index | | EUR | | 264 | | Long | | Exchange | | | 11/16/12 | | | $ | (57,081 | ) |
Australia 10-Year Bond | | AUD | | 545 | | Short | | Exchange | | | 12/17/12 | | | | 114,389 | |
Australian SPI 200 | | AUD | | 19 | | Long | | Exchange | | | 12/20/12 | | | | 13,246 | |
The accompanying notes are an integral part of these financial statements.
27
Notes to Schedules of Portfolio Investments (continued)
| | | | | | | | | | | | | | | | | | | | |
Type | | Currency | | Number of
Contracts | | | Position | | Type | | | Expiration
Date | | | Unrealized
Gain/(Loss) | |
CAC40 Index | | EUR | | | 1,590 | | | Short | | | Exchange | | | | 11/16/12 | | | $ | 1,641,642 | |
Canadian 10-Year Bond | | CAD | | | 1,347 | | | Short | | | OTC | | | | 12/18/12 | | | | (1,328,307 | ) |
DAX Index | | EUR | | | 62 | | | Long | | | Exchange | | | | 12/21/12 | | | | (119,165 | ) |
Euro-Bund 10-Year | | EUR | | | 474 | | | Long | | | OTC | | | | 12/06/12 | | | | 167,426 | |
FTSE 100 Index | | GBP | | | 335 | | | Long | | | Exchange | | | | 12/21/12 | | | | (119,804 | ) |
FTSE/MIB Index | | EUR | | | 636 | | | Short | | | Exchange | | | | 12/21/12 | | | | 959,342 | |
Hang Seng Index | | HKD | | | 96 | | | Long | | | Exchange | | | | 11/29/12 | | | | (58,762 | ) |
IBEX 35 Index | | EUR | | | 7 | | | Long | | | Exchange | | | | 11/16/12 | | | | (7,430 | ) |
Japanese 10-Year Bond | | JPY | | | 1,444 | | | Short | | | Exchange | | | | 12/10/12 | | | | (879,427 | ) |
S&P 500 E-Mini Index | | USD | | | 397 | | | Short | | | Exchange | | | | 12/21/12 | | | | 808,574 | |
S&P/TSX 60 Index | | CAD | | | 365 | | | Long | | | Exchange | | | | 12/20/12 | | | | 292,917 | |
TOPIX Index | | JPY | | | 349 | | | Short | | | Exchange | | | | 12/13/12 | | | | (724,462 | ) |
U.K. 10-Year Gilt | | GBP | | | 1,098 | | | Long | | | Exchange | | | | 12/27/12 | | | | (1,096,761 | ) |
U.S. Treasury 10-Year Note | | USD | | | 1,544 | | | Long | | | OTC | | | | 12/19/12 | | | | 360,594 | |
| | | | | | | | | | | | | | | Total | | | $ | (33,069 | ) |
| | | | | | | | | | | | | | | | | | | | |
Managers AMG FQ Global Essentials Fund - Futures Contracts
| | | | | | | | | | | | | | | | |
Type | | Currency | | Number of
Contracts | | | Position | | Expiration
Date | | | Unrealized
Gain/(Loss) | |
Amsterdam Index | | EUR | | | 21 | | | Long | | | 11/16/12 | | | $ | (4,208 | ) |
Australia 10-Year Bond | | AUD | | | 162 | | | Long | | | 12/17/12 | | | | (43,339 | ) |
Australian SPI 200 | | AUD | | | 31 | | | Long | | | 12/20/12 | | | | 81,193 | |
CAC40 Index | | EUR | | | 37 | | | Long | |
| 11/16/12
to 12/21/12 |
| | | (29,693 | ) |
Canadian 10-Year Bond | | CAD | | | 156 | | | Long | | | 12/18/12 | | | | 151,855 | |
DAX Index | | EUR | | | 7 | | | Long | | | 12/21/12 | | | | (16,039 | ) |
E-Mini MSCI Index | | USD | | | 210 | | | Long | | | 12/21/12 | | | | (303,902 | ) |
Euro-Bund 10-Year | | EUR | | | 81 | | | Long | | | 12/06/12 | | | | 29,701 | |
FTSE 100 Index | | GBP | | | 17 | | | Long | | | 12/21/12 | | | | (8,006 | ) |
FTSE/MIB Index | | EUR | | | 16 | | | Long | | | 12/21/12 | | | | (48,998 | ) |
German 30-Year Bond | | EUR | | | 51 | | | Long | | | 12/06/12 | | | | (114,121 | ) |
Hang Seng Index | | HKD | | | 12 | | | Long | | | 11/29/12 | | | | (7,345 | ) |
IBEX 35 Index | | EUR | | | 15 | | | Long | | | 11/16/12 | | | | (10,392 | ) |
The accompanying notes are an integral part of these financial statements.
28
Notes to Schedules of Portfolio Investments (continued)
| | | | | | | | | | | | | | |
Type | | Currency | | Number of Contracts | | Position | | Expiration
Date | | | Unrealized
Gain/(Loss) | |
Russell 2000 Index | | USD | | 121 | | Long | | | 12/21/12 | | | $ | (316,071 | ) |
S&P 500 E-Mini Index | | USD | | 41 | | Long | | | 12/21/12 | | | | (48,112 | ) |
S&P/TSX 60 Index | | CAD | | 21 | | Long | | | 12/20/12 | | | | 1,711 | |
TOPIX Index | | JPY | | 26 | | Long | | | 12/13/12 | | | | 52,414 | |
U.K. 10-Year Gilt | | GBP | | 151 | | Long | | | 12/27/12 | | | | (282,438 | ) |
U.S. Treasury Long Bond | | USD | | 126 | | Long | | | 12/19/12 | | | | (55,362 | ) |
| | | | | | | | | Total | | | $ | (971,152 | ) |
| | | | | | | | | | | | | | |
At October 31, 2012, the Funds had the following foreign currency contracts (in U.S. Dollars):
(See Note 8 in the Notes to Financial Statements.)
Managers AMG FQ Global Alternatives Fund - Foreign Currency
| | | | | | | | | | | | | | | | | | |
Foreign Currency | | Position | | Settlement Date | | Counterparty | | Receivable
Amount | | | Payable
Amount | | | Unrealized
Gain/(Loss) | |
Australian Dollar | | Long | | 12/19/12 | | GS | | $ | 26,644,389 | | | $ | 26,513,251 | | | $ | 131,138 | |
Australian Dollar | | Long | | 12/19/12 | | GS | | | 9,856,032 | | | | 9,887,764 | | | | (31,732 | ) |
Australian Dollar | | Long | | 12/19/12 | | MS | | | 3,395,430 | | | | 3,381,434 | | | | 13,996 | |
British Pound | | Long | | 12/19/12 | | GS | | | 19,804,485 | | | | 19,682,957 | | | | 121,528 | |
British Pound | | Long | | 12/19/12 | | GS | | | 13,184,918 | | | | 13,263,960 | | | | (79,042 | ) |
British Pound | | Long | | 12/19/12 | | MS | | | 90,210,087 | | | | 88,940,522 | | | | 1,269,565 | |
Canadian Dollar | | Long | | 12/19/12 | | GS | | | 15,878,689 | | | | 16,281,707 | | | | (403,018 | ) |
Canadian Dollar | | Long | | 12/19/12 | | MS | | | 5,796,155 | | | | 5,884,523 | | | | (88,368 | ) |
Euro | | Long | | 12/19/12 | | GS | | | 230,788,354 | | | | 227,013,579 | | | | 3,774,775 | |
Euro | | Long | | 12/19/12 | | MS | | | 34,911,475 | | | | 33,893,198 | | | | 1,018,277 | |
Euro | | Long | | 12/19/12 | | MS | | | 14,254,955 | | | | 14,438,314 | | | | (183,359 | ) |
Japanese Yen | | Long | | 12/19/12 | | GS | | | 32,247,716 | | | | 32,937,452 | | | | (689,736 | ) |
Japanese Yen | | Long | | 12/19/12 | | MS | | | 2,570,261 | | | | 2,631,626 | | | | (61,365 | ) |
New Zealand Dollar | | Long | | 12/19/12 | | GS | | | 8,983,286 | | | | 9,001,207 | | | | (17,921 | ) |
New Zealand Dollar | | Long | | 12/19/12 | | MS | | | 16,357,165 | | | | 15,719,104 | | | | 638,061 | |
New Zealand Dollar | | Long | | 12/19/12 | | MS | | | 4,794,915 | | | | 4,827,704 | | | | (32,789 | ) |
Norwegian Krone | | Long | | 12/19/12 | | GS | | | 51,712,330 | | | | 50,750,345 | | | | 961,985 | |
Norwegian Krone | | Long | | 12/19/12 | | GS | | | 11,784,929 | | | | 11,806,560 | | | | (21,631 | ) |
Norwegian Krone | | Long | | 12/19/12 | | MS | | | 13,044,521 | | | | 12,906,976 | | | | 137,545 | |
Singapore Dollar | | Long | | 12/19/12 | | GS | | | 12,991,545 | | | | 12,965,992 | | | | 25,553 | |
The accompanying notes are an integral part of these financial statements.
29
Notes to Schedules of Portfolio Investments (continued)
| | | | | | | | | | | | | | | | | | | | |
Foreign Currency | | Position | | Settlement Date | | Counterparty | | | Receivable
Amount | | | Payable Amount | | | Unrealized
Gain/ (Loss) | |
Singapore Dollar | | Long | | 12/19/12 | | | MS | | | $ | 2,426,881 | | | $ | 2,408,832 | | | $ | 18,049 | |
Swedish Krona | | Long | | 12/19/12 | | | GS | | | | 2,788,218 | | | | 2,811,432 | | | | (23,214 | ) |
Swedish Krona | | Long | | 12/19/12 | | | MS | | | | 22,029,660 | | | | 21,713,721 | | | | 315,939 | |
Australian Dollar | | Short | | 12/19/12 | | | GS | | | | 58,479,671 | | | | 59,224,262 | | | | (744,591 | ) |
Australian Dollar | | Short | | 12/19/12 | | | GS | | | | 19,861,458 | | | | 19,746,752 | | | | 114,706 | |
Australian Dollar | | Short | | 12/19/12 | | | MS | | | | 105,792,792 | | | | 108,376,939 | | | | (2,584,147 | ) |
British Pound | | Short | | 12/19/12 | | | GS | | | | 43,647,765 | | | | 44,024,065 | | | | (376,300 | ) |
Canadian Dollar | | Short | | 12/19/12 | | | GS | | | | 94,988,741 | | | | 93,792,862 | | | | 1,195,879 | |
Canadian Dollar | | Short | | 12/19/12 | | | MS | | | | 16,212,880 | | | | 16,065,815 | | | | 147,065 | |
Euro | | Short | | 12/19/12 | | | GS | | | | 102,620,341 | | | | 103,707,502 | | | | (1,087,161 | ) |
Euro | | Short | | 12/19/12 | | | GS | | | | 14,580,021 | | | | 14,473,484 | | | | 106,537 | |
Euro | | Short | | 12/19/12 | | | MS | | | | 17,324,871 | | | | 17,427,063 | | | | (102,192 | ) |
Japanese Yen | | Short | | 12/19/12 | | | GS | | | | 92,071,188 | | | | 90,244,003 | | | | 1,827,185 | |
Japanese Yen | | Short | | 12/19/12 | | | MS | | | | 49,170,415 | | | | 48,393,673 | | | | 776,742 | |
New Zealand Dollar | | Short | | 12/19/12 | | | GS | | | | 72,848,809 | | | | 75,777,469 | | | | (2,928,660 | ) |
New Zealand Dollar | | Short | | 12/19/12 | | | GS | | | | 25,212,612 | | | | 25,042,084 | | | | 170,528 | |
Singapore Dollar | | Short | | 12/19/12 | | | GS | | | | 67,662,965 | | | | 69,163,949 | | | | (1,500,984 | ) |
Swedish Krona | | Short | | 12/19/12 | | | GS | | | | 28,053,384 | | | | 28,472,836 | | | | (419,452 | ) |
Swedish Krona | | Short | | 12/19/12 | | | GS | | | | 7,497,607 | | | | 7,432,482 | | | | 65,125 | |
| | | | | | | | | | | | | | | | | | | | |
| | | | | | | Total | | | $ | 1,462,481,916 | | | $ | 1,461,027,400 | | | $ | 1,454,516 | |
| | | | | | | | | | | | | | | | | | | | |
| | | | | | |
Currency and Counterparty Abbreviations: | | | | |
| | | |
MS: | | Morgan Stanley | | GS: | | Goldman Sachs Group, Inc. |
AUD: | | Australian Dollar | | HKD: | | Hong Kong Dollar |
CAD: | | Canadian Dollar | | JPY: | | Japanese Yen |
EUR: | | Euro | | USD: | | U.S. Dollar |
GBP: | | British Pound | | OTC: | | Over-the-Counter |
The accompanying notes are an integral part of these financial statements.
30
Statement of Assets and Liabilities
October 31, 2012
| | | | | | | | | | | | | | | | |
| | | Managers AMG FQ
Tax-Managed
U.S. Equity Fund | | | Managers AMG FQ
U.S.
Equity Fund | | | Managers AMG FQ
Global
Alternatives Fund | | | Managers AMG FQ
Global
Essentials Fund | |
Assets: | | | | | | | | | | | | | | | | |
Investments at value* (including securities on loan valued at $517,574, $1,255,686, $0, and $1,758,264, respectively) | | $ | 43,256,104 | | | $ | 48,726,455 | | | $ | 322,080,593 | | | $ | 125,546,622 | |
Cash collateral for futures | | | — | | | | 77,000 | | | | — | | | | — | |
Receivable for Fund shares sold | | | 34,304 | | | | 18,623 | | | | 679,221 | | | | 300,512 | |
Dividends, interest and other receivables | | | 22,650 | | | | 42,161 | | | | 23,960 | | | | 18,769 | |
Receivable for variation margin on futures contracts | | | — | | | | — | | | | 1,608,909 | | | | 322,869 | |
Receivable for investments sold | | | — | | | | — | | | | 1,567,824 | | | | 228,066 | |
Receivable from affiliate | | | — | | | | 4,540 | | | | 150,897 | | | | 15,953 | |
Unrealized appreciation on forward foreign currency contracts | | | — | | | | — | | | | 12,830,178 | | | | — | |
Prepaid expenses | | | 21,403 | | | | 18,053 | | | | 4,743 | | | | 24,854 | |
Total assets | | | 43,334,461 | | | | 48,886,832 | | | | 338,946,325 | | | | 126,457,645 | |
Liabilities: | | | | | | | | | | | | | | | | |
Payable upon return of securities loaned | | | 502,739 | | | | 1,188,211 | | | | — | | | | 1,805,600 | |
Payable for Fund shares repurchased | | | 12,414 | | | | 67,154 | | | | 957,387 | | | | 154,926 | |
Written options (premium received $227,265) | | | — | | | | 21,150 | | | | — | | | | — | |
Payable for variation margin on futures contracts | | | — | | | | 80 | | | | 2,705,340 | | | | 154,157 | |
Unrealized depreciation on forward foreign currency contracts | | | — | | | | — | | | | 11,375,662 | | | | — | |
Payable for investments purchased | | | — | | | | — | | | | 1,577,832 | | | | 227,293 | |
Payable to affiliate | | | 1,939 | | | | — | | | | — | | | | — | |
Accrued expenses: | | | | | | | | | | | | | | | | |
Investment management and advisory fees | | | 31,425 | | | | 14,389 | | | | 465,843 | | | | 63,949 | |
Shareholder servicing fees - Investor Class | | | — | | | | — | | | | — | | | | 2,909 | |
Shareholder servicing fees - Service Class | | | — | | | | — | | | | 40,436 | | | | 1,312 | |
Administrative fees | | | — | | | | 10,278 | | | | 68,506 | | | | 26,645 | |
Distribution fees - Class A | | | 652 | | | | 2,747 | | | | 50,545 | | | | — | |
Distribution fees - Class C | | | 2,442 | | | | 464 | | | | 13,534 | | | | — | |
Distribution fees - Investor Class | | | — | | | | — | | | | — | | | | 2,909 | |
Other | | | 47,775 | | | | 47,859 | | | | 226,773 | | | | 64,256 | |
Total liabilities | | | 599,386 | | | | 1,352,332 | | | | 17,481,858 | | | | 2,503,956 | |
Net Assets | | $ | 42,735,075 | | | $ | 47,534,500 | | | $ | 321,464,467 | | | $ | 123,953,689 | |
* Investments at cost | | $ | 34,027,738 | | | $ | 43,965,434 | | | $ | 305,982,104 | | | $ | 123,573,779 | |
The accompanying notes are an integral part of these financial statements.
31
Statement of Assets and Liabilities
October 31, 2012 (continued)
| | | | | | | | | | | | | | | | |
| | | Managers AMG FQ
Tax-Managed
U.S. Equity Fund | | | Managers AMG FQ
U.S.
Equity Fund | | | Managers AMG FQ
Global
Alternatives Fund | | | Managers AMG FQ
Global
Essentials Fund | |
Net Assets Represent: | | | | | | | | | | | | | | | | |
Paid-in capital | | $ | 57,283,184 | | | $ | 55,820,845 | | | $ | 303,891,726 | | | $ | 138,961,850 | |
Undistributed net investment income | | | 217,099 | | | | 31,560 | | | | 579,429 | | | | 3,945,371 | |
Accumulated net realized loss from investments and foreign currency transactions | | | (23,993,574 | ) | | | (13,282,458 | ) | | | (516,859 | ) | | | (19,957,467 | ) |
Net unrealized appreciation of investments and foreign currency translations | | | 9,228,366 | | | | 4,964,553 | | | | 17,510,171 | | | | 1,003,935 | |
Net Assets | | $ | 42,735,075 | | | $ | 47,534,500 | | | $ | 321,464,467 | | | $ | 123,953,689 | |
Class A Shares: | | | | | | | | | | | | | | | | |
Net Assets | | $ | 3,025,834 | | | $ | 12,763,776 | | | $ | 237,012,858 | | | | n/a | |
Shares outstanding | | | 196,840 | | | | 1,038,684 | | | | 25,855,912 | | | | n/a | |
Net asset value and redemption price per share | | $ | 15.37 | | | $ | 12.29 | | | $ | 9.17 | | | | n/a | |
Offering price per share based on a maximum sales charge of 5.75% (NAV per share/(100% - 5.75%) | | $ | 16.31 | | | $ | 13.04 | | | $ | 9.73 | | | | n/a | |
Class C Shares: | | | | | | | | | | | | | | | | |
Net Assets | | $ | 2,825,650 | | | $ | 539,889 | | | $ | 15,622,643 | | | | n/a | |
Shares outstanding | | | 190,473 | | | | 43,980 | | | | 1,767,549 | | | | n/a | |
Net asset value and redemption price per share | | $ | 14.83 | | | $ | 12.28 | | | $ | 8.84 | | | | n/a | |
Investor Shares: | | | | | | | | | | | | | | | | |
Net Assets | | | n/a | | | | n/a | | | | n/a | | | $ | 13,042,640 | |
Shares outstanding | | | n/a | | | | n/a | | | | n/a | | | | 976,073 | |
Net asset value and redemption price per share | | | n/a | | | | n/a | | | | n/a | | | $ | 13.36 | |
Service Shares: | | | | | | | | | | | | | | | | |
Net Assets | | | n/a | | | | n/a | | | $ | 44,587,159 | | | $ | 11,737,876 | |
Shares outstanding | | | n/a | | | | n/a | | | | 4,820,014 | | | | 873,408 | |
Net asset value and redemption price per share | | | n/a | | | | n/a | | | $ | 9.25 | | | $ | 13.44 | |
Institutional Class Shares: | | | | | | | | | | | | | | | | |
Net Assets | | $ | 36,883,591 | | | $ | 34,230,835 | | | $ | 24,241,807 | | | $ | 99,173,173 | |
Shares outstanding | | | 2,405,284 | | | | 2,774,417 | | | | 2,611,916 | | | | 7,363,887 | |
Net asset value and redemption price per share | | $ | 15.33 | | | $ | 12.34 | | | $ | 9.28 | | | $ | 13.47 | |
The accompanying notes are an integral part of these financial statements.
32
Statement of Operations
For the fiscal year ended October 31, 2012
| | | | | | | | | | | | | | | | |
| | | Managers AMG FQ
Tax-Managed
U.S. Equity Fund | | | Managers AMG FQ
U.S.
Equity Fund | | | Managers AMG FQ
Global
Alternatives Fund | | | Managers AMG FQ
Global
Essentials Fund | |
Investment Income: | | | | | | | | | | | | | | | | |
Dividend income | | $ | 651,062 | 1 | | $ | 1,350,792 | | | $ | 2,120,409 | | | $ | 1,247,236 | |
Interest income | | | — | | | | — | | | | 41,333 | | | | 9,755 | |
Securities lending fees | | | 26,838 | | | | 26,846 | | | | — | | | | 21,607 | |
Foreign withholding tax | | | — | | | | (21 | ) | | | — | | | | — | |
Total investment income | | | 677,900 | | | | 1,377,617 | | | | 2,161,742 | | | | 1,278,598 | |
| | | | |
Expenses: | | | | | | | | | | | | | | | | |
Investment management and advisory fees | | | 361,425 | | | | 167,202 | | | | 6,422,570 | | | | 681,674 | |
Administrative fees | | | — | | | | 119,430 | | | | 944,496 | | | | 284,032 | |
Distribution fees - Class A | | | 7,661 | | | | 31,480 | | | | 713,583 | | | | — | |
Distribution fees - Class C | | | 29,218 | | | | 5,417 | | | | 210,209 | | | | — | |
Distribution fees - Investor Class | | | — | | | | — | | | | — | | | | 32,895 | |
Shareholder Servicing fees - Class A | | | — | | | | — | | | | 570,867 | | | | — | |
Shareholder Servicing fees - Service Class | | | — | | | | — | | | | 72,350 | | | | 4,136 | |
Shareholder Servicing fees - Investor Class | | | — | | | | — | | | | — | | | | 32,895 | |
Registration fees | | | 37,689 | | | | 36,669 | | | | 115,372 | | | | 41,524 | |
Professional fees | | | 31,938 | | | | 36,552 | | | | 65,711 | | | | 43,204 | |
Transfer agent | | | 27,762 | | | | 28,021 | | | | 475,369 | | | | 36,793 | |
Custodian | | | 12,410 | | | | 19,833 | | | | 49,275 | | | | 19,780 | |
Reports to shareholders | | | 5,919 | | | | 13,811 | | | | 142,856 | | | | 12,061 | |
Trustees fees and expenses | | | 2,908 | | | | 2,922 | | | | 30,837 | | | | 7,340 | |
Interest expense on futures | | | — | | | | — | | | | 36,808 | | | | 232 | |
Miscellaneous | | | 2,789 | | | | 3,529 | | | | 22,625 | | | | 5,648 | |
Total expenses before offsets | | | 519,719 | | | | 464,866 | | | | 9,872,928 | | | | 1,202,214 | |
Fee waivers | | | — | | | | — | | | | (105,396 | ) | | | (15,051 | ) |
Expense reimbursements | | | (61,737 | ) | | | (50,382 | ) | | | (2,639,749 | ) | | | (49,509 | ) |
Expense reductions | | | (16 | ) | | | (18 | ) | | | (163 | ) | | | (40 | ) |
Net expenses | | | 457,966 | | | | 414,466 | | | | 7,127,620 | | | | 1,137,614 | |
| | | | |
Net investment income (loss) | | | 219,934 | | | | 963,151 | | | | (4,965,878 | ) | | | 140,984 | |
Net Realized and Unrealized Gain (Loss): | | | | | | | | | | | | | | | | |
Net realized gain (loss) on investments | | | 4,837,628 | | | | 1,327,518 | | | | 8,442,129 | | | | (76,187 | ) |
Net realized gain (loss) on futures contracts | | | — | | | | 24,554 | | | | (18,218,397 | ) | | | 9,534,529 | |
Net realized gain (loss) on foreign currency transactions | | | — | | | | — | | | | 21,355,182 | | | | (32,123 | ) |
Net realized gain on written options | | | — | | | | 481,815 | | | | — | | | | — | |
Net change in unrealized appreciation (depreciation) of investments | | | 109,819 | | | | 2,203,108 | | | | 1,282,181 | | | | 1,467,655 | |
Net change in unrealized appreciation (depreciation) of futures contracts | | | — | | | | (6,310 | ) | | | (6,233,647 | ) | | | (1,441,220 | ) |
Net change in unrealized appreciation (depreciation) on foreign currency translations | | | — | | | | — | | | | (8,521,659 | ) | | | (4,722 | ) |
Net change in unrealized appreciation (depreciation) on written options | | | — | | | | 206,115 | | | | — | | | | — | |
Net realized and unrealized gain (loss) | | | 4,947,447 | | | | 4,236,800 | | | | (1,894,211 | ) | | | 9,447,932 | |
| | | | |
Net increase (decrease) in net assets resulting from operations | | $ | 5,167,381 | | | $ | 5,199,951 | | | $ | (6,860,089 | ) | | $ | 9,588,916 | |
| 1 | Includes non-recurring dividends of $114,400. |
The accompanying notes are an integral part of these financial statements.
33
Statements of Changes in Net Assets
For the fiscal year ended October 31,
| | | | | | | | | | | | | | | | |
| | | Managers AMG FQ
Tax-Managed U.S. Equity Fund | | | Managers AMG FQ
U.S. Equity Fund | |
| | | 2012 | | | 2011 | | | 2012 | | | 2011 | |
Increase (Decrease) in Net Assets From Operations: | | | | | | | | | | | | | | | | |
Net investment income | | $ | 219,934 | | | $ | 43,027 | | | $ | 963,151 | | | $ | 507,605 | |
Net realized gain on investments, futures, foreign currency contracts and transactions | | | 4,837,628 | | | | 3,749,235 | | | | 1,833,887 | | | | 6,941,179 | |
Net change in unrealized appreciation (depreciation) of investments, futures, written options and foreign currency translations | | | 109,819 | | | | 825,388 | | | | 2,402,913 | | | | (1,622,919 | ) |
Net increase in net assets resulting from operations | | | 5,167,381 | | | | 4,617,650 | | | | 5,199,951 | | | | 5,825,865 | |
Distributions to Shareholders: | | | | | | | | | | | | | | | | |
From net investment income: | | | | | | | | | | | | | | | | |
Class A | | | — | | | | (3,644 | ) | | | (317,159 | ) | | | (159,399 | ) |
Class C | | | — | | | | — | | | | (5,029 | ) | | | (936 | ) |
Institutional Class | | | (35,481 | ) | | | (171,545 | ) | | | (1,034,913 | ) | | | (351,744 | ) |
Total distributions to shareholders | | | (35,481 | ) | | | (175,189 | ) | | | (1,357,101 | ) | | | (512,079 | ) |
Capital Share Transactions:1 | | | | | | | | | | | | | | | | |
Proceeds from sale of shares | | | 2,546,638 | | | | 3,331,036 | | | | 4,597,044 | | | | 4,445,104 | |
Reinvestment of dividends and distributions | | | 33,691 | | | | 165,795 | | | | 1,331,453 | | | | 505,527 | |
Cost of shares repurchased | | | (6,578,135 | ) | | | (12,969,547 | ) | | | (8,972,884 | ) | | | (15,334,816 | ) |
Net decrease from capital share transactions | | | (3,997,806 | ) | | | (9,472,716 | ) | | | (3,044,387 | ) | | | (10,384,185 | ) |
| | | | |
Total increase (decrease) in net assets | | | 1,134,094 | | | | (5,030,255 | ) | | | 798,463 | | | | (5,070,399 | ) |
Net Assets: | | | | | | | | | | | | | | | | |
Beginning of year | | | 41,600,981 | | | | 46,631,236 | | | | 46,736,037 | | | | 51,806,436 | |
End of year | | $ | 42,735,075 | | | $ | 41,600,981 | | | $ | 47,534,500 | | | $ | 46,736,037 | |
End of year undistributed net investment income | | $ | 217,099 | | | $ | 32,584 | | | $ | 31,560 | | | $ | 451,901 | |
| | | | | | | | | | | | | | | | |
Share Transactions:1 | | | | | | | | | | | | | | | | |
Sale of shares | | | 171,948 | | | | 247,826 | | | | 378,536 | | | | 398,572 | |
Reinvested shares from dividends and distributions | | | 2,456 | | | | 12,399 | | | | 112,221 | | | | 46,374 | |
Shares repurchased | | | (450,344 | ) | | | (946,051 | ) | | | (748,204 | ) | | | (1,346,991 | ) |
Net decrease in shares | | | (275,940 | ) | | | (685,826 | ) | | | (257,447 | ) | | | (902,045 | ) |
| 1 | See Note 1(g) of the Notes to Financial Statements. |
The accompanying notes are an integral part of these financial statements.
34
Statements of Changes in Net Assets
For the fiscal year ended October 31,
| | | | | | | | | | | | | | | | |
| | | Managers AMG FQ Global
Alternatives Fund | | | Managers AMG FQ Global
Essentials Fund | |
| | | 2012 | | | 2011 | | | 2012 | | | 2011 | |
Increase (Decrease) in Net Assets From Operations: | | | | | | | | | | | | | | | | |
Net investment income (loss) | | $ | (4,965,878 | ) | | $ | (8,770,804 | ) | | $ | 140,984 | | | $ | 567,999 | |
Net realized gain (loss) on investments, futures, foreign currency contracts and transactions | | | 11,578,914 | | | | (83,381,052 | ) | | | 9,426,219 | | | | 7,085,975 | |
Net change in unrealized appreciation (depreciation) of investments, futures and foreign currency translations | | | (13,473,125 | ) | | | 19,290,880 | | | | 21,713 | | | | (2,608,709 | ) |
Net increase (decrease) in net assets resulting from operations | | | (6,860,089 | ) | | | (72,860,976 | ) | | | 9,588,916 | | | | 5,045,265 | |
Distributions to Shareholders: | | | | | | | | | | | | | | | | |
From net investment income: | | | | | | | | | | | | | | | | |
Investor Class | | | — | | | | — | | | | (422,712 | ) | | | (4,527,841 | ) |
Service Class | | | — | | | | — | | | | (57,632 | ) | | | — | |
Institutional Class | | | — | | | | — | | | | (3,809,314 | ) | | | — | |
Total distributions to shareholders | | | — | | | | — | | | | (4,289,658 | ) | | | (4,527,841 | ) |
Capital Share Transactions:1 | | | | | | | | | | | | | | | | |
Proceeds from sale of shares | | | 128,408,150 | | | | 453,688,645 | | | | 43,488,077 | | | | 18,846,211 | |
Reinvestment of dividends and distributions | | | — | | | | — | | | | 4,219,919 | | | | 4,452,811 | |
Cost of shares repurchased | | | (265,268,656 | ) | | | (523,328,958 | ) | | | (24,915,523 | ) | | | (28,592,316 | ) |
Net increase (decrease) from capital share transactions | | | (136,860,506 | ) | | | (69,640,313 | ) | | | 22,792,473 | | | | (5,293,294 | ) |
| | | | |
Total increase (decrease) in net assets | | | (143,720,595 | ) | | | (142,501,289 | ) | | | 28,091,731 | | | | (4,775,870 | ) |
Net Assets: | | | | | | | | | | | | | | | | |
Beginning of year | | | 465,185,062 | | | | 607,686,351 | | | | 95,861,958 | | | | 100,637,828 | |
End of year | | $ | 321,464,467 | | | $ | 465,185,062 | | | $ | 123,953,689 | | | $ | 95,861,958 | |
End of year undistributed net investment income (loss) | | $ | 579,429 | | | $ | (9,891,166 | ) | | $ | 3,945,371 | | | $ | 4,289,071 | |
| | | | | | | | | | | | | | | | |
Share Transactions:1 | | | | | | | | | | | | | | | | |
Sale of shares | | | 14,062,184 | | | | 45,743,279 | | | | 3,328,608 | | | | 1,508,329 | |
Reinvested shares from dividends and distributions | | | — | | | | — | | | | 337,436 | | | | 371,134 | |
Shares repurchased | | | (29,059,516 | ) | | | (55,138,398 | ) | | | (1,898,445 | ) | | | (2,313,395 | ) |
Net increase (decrease) in shares | | | (14,997,332 | ) | | | (9,395,119 | ) | | | 1,767,599 | | | | (433,932 | ) |
| 1 | See Note 1(g) of the Notes to Financial Statements. |
The accompanying notes are an integral part of these financial statements.
35
Managers AMG FQ Tax-Managed U.S. Equity Fund
Financial Highlights
For a share outstanding throughout each fiscal year
| | | | | | | | | | | | | | | | | | | | |
| | | For the fiscal year ended October 31, | |
Class A | | 2012 | | | 2011 | | | 2010 | | | 2009 | | | 2008 | |
Net Asset Value, Beginning of Year | | $ | 13.63 | | | $ | 12.47 | | | $ | 10.01 | | | $ | 9.99 | | | $ | 16.75 | |
Income from Investment Operations: | | | | | | | | | | | | | | | | | | | | |
Net investment income (loss) | | | 0.05 | 3,11 | | | (0.01 | )3 | | | 0.02 | 3 | | | 0.09 | | | | 0.10 | |
Net realized and unrealized gain (loss) on investments | | | 1.69 | 3 | | | 1.18 | 3 | | | 2.44 | 3 | | | 0.04 | | | | (6.81 | ) |
Total from investment operations | | | 1.74 | | | | 1.17 | | | | 2.46 | | | | 0.13 | | | | (6.71 | ) |
Less Distributions to Shareholders from: | | | | | | | | | | | | | | | | | | | | |
Net investment income | | | — | | | | (0.01 | ) | | | — | | | | (0.11 | ) | | | (0.05 | ) |
Net Asset Value, End of Year | | $ | 15.37 | | | $ | 13.63 | | | $ | 12.47 | | | $ | 10.01 | | | $ | 9.99 | |
Total Return1 | | | 12.77 | % | | | 9.40 | % | | | 24.58 | % | | | 1.53 | % | | | (40.15 | )%4 |
Ratio of net expenses to average net assets | | | 1.24 | % | | | 1.24 | % | | | 1.24 | % | | | 1.24 | % | | | 1.24 | % |
Ratio of net investment income (loss) to average net assets1 | | | 0.35 | % | | | (0.07 | )% | | | 0.22 | % | | | 0.45 | % | | | 0.67 | % |
Portfolio turnover | | | 36 | % | | | 40 | % | | | 81 | % | | | 147 | % | | | 136 | % |
Net assets at end of year (000’s omitted) | | $ | 3,026 | | | $ | 3,049 | | | $ | 4,116 | | | $ | 7,175 | | | $ | 15,334 | |
| | | | | | | | | | | | | | | | | | | | |
Ratios absent expense offsets:2 | | | | | | | | | | | | | | | | | | | | |
Ratio of total expenses to average net assets | | | 1.39 | % | | | 1.36 | % | | | 1.44 | % | | | 1.43 | % | | | 1.28 | % |
Ratio of net investment income (loss) to average net assets | | | 0.20 | % | | | (0.19 | )% | | | 0.02 | % | | | 0.26 | % | | | 0.63 | % |
| | | | | | | | | | | | | | | | | | | | |
| |
| | | For the fiscal year ended October 31, | |
Class C | | 2012 | | | 2011 | | | 2010 | | | 2009 | | | 2008 | |
Net Asset Value, Beginning of Year | | $ | 13.25 | | | $ | 12.21 | | | $ | 9.87 | | | $ | 9.82 | | | $ | 16.53 | |
Income from Investment Operations: | | | | | | | | | | | | | | | | | | | | |
Net investment loss | | | (0.06 | )3,11 | | | (0.11 | )3 | | | (0.06 | )3 | | | (0.03 | ) | | | (0.02 | ) |
Net realized and unrealized gain (loss) on investments | | | 1.64 | 3 | | | 1.15 | 3 | | | 2.40 | 3 | | | 0.09 | | | | (6.69 | ) |
Total from investment operations | | | 1.58 | | | | 1.04 | | | | 2.34 | | | | 0.06 | | | | (6.71 | ) |
Less Distributions to Shareholders from: | | | | | | | | | | | | | | | | | | | | |
Net investment income | | | — | | | | — | | | | — | | | | (0.01 | ) | | | — | |
Net Asset Value, End of Year | | $ | 14.83 | | | $ | 13.25 | | | $ | 12.21 | | | $ | 9.87 | | | $ | 9.82 | |
Total Return1 | | | 11.92 | % | | | 8.52 | % | | | 23.71 | % | | | 0.66 | % | | | (40.56 | )% |
Ratio of net expenses to average net assets | | | 1.99 | % | | | 1.99 | % | | | 1.99 | % | | | 1.99 | % | | | 1.99 | % |
Ratio of net investment loss to average net assets1 | | | (0.40 | )% | | | (0.82 | )% | | | (0.53 | )% | | | (0.31 | )% | | | (0.09 | )% |
Portfolio turnover | | | 36 | % | | | 40 | % | | | 81 | % | | | 147 | % | | | 136 | % |
Net assets at end of year (000’s omitted) | | $ | 2,826 | | | $ | 2,811 | | | $ | 3,095 | | | $ | 4,513 | | | $ | 6,693 | |
| | | | | | | | | | | | | | | | | | | | |
Ratios absent expense offsets:2 | | | | | | | | | | | | | | | | | | | | |
Ratio of total expenses to average net assets | | | 2.14 | % | | | 2.11 | % | | | 2.19 | % | | | 2.18 | % | | | 2.03 | % |
Ratio of net investment loss to average net assets | | | (0.55 | )% | | | (0.94 | )% | | | (0.73 | )% | | | (0.50 | )% | | | (0.13 | )% |
| | | | | | | | | | | | | | | | | | | | |
36
Managers AMG FQ Tax-Managed U.S. Equity Fund
Financial Highlights
For a share outstanding throughout each fiscal year
| | | | | | | | | | | | | | | | | | | | |
| | | For the fiscal year ended October 31, | |
Institutional Class | | 2012 | | | 2011 | | | 2010 | | | 2009 | | | 2008 | |
Net Asset Value, Beginning of Year | | $ | 13.58 | | | $ | 12.43 | | | $ | 9.98 | | | $ | 9.99 | | | $ | 16.80 | |
Income from Investment Operations: | | | | | | | | | | | | | | | | | | | | |
Net investment income | | | 0.09 | 3,11 | | | 0.02 | 3 | | | 0.05 | 3 | | | 0.07 | | | | 0.13 | |
Net realized and unrealized gain (loss) on investments | | | 1.67 | 3 | | | 1.19 | 3 | | | 2.43 | 3 | | | 0.07 | | | | (6.87 | ) |
Total from investment operations | | | 1.76 | | | | 1.21 | | | | 2.48 | | | | 0.14 | | | | (6.74 | ) |
Less Distributions to Shareholders from: | | | | | | | | | | | | | | | | | | | | |
Net investment income | | | (0.01 | ) | | | (0.06 | ) | | | (0.03 | ) | | | (0.15 | ) | | | (0.07 | ) |
Net Asset Value, End of Year | | $ | 15.33 | | | $ | 13.58 | | | $ | 12.43 | | | $ | 9.98 | | | $ | 9.99 | |
Total Return1 | | | 13.00 | % | | | 9.70 | % | | | 24.92 | % | | | 1.65 | % | | | (40.26 | )% |
Ratio of net expenses to average net assets | | | 0.99 | % | | | 0.99 | % | | | 0.99 | % | | | 0.99 | % | | | 0.99 | % |
Ratio of net investment income to average net assets1 | | | 0.60 | % | | | 0.18 | % | | | 0.45 | % | | | 0.69 | % | | | 0.92 | % |
Portfolio turnover | | | 36 | % | | | 40 | % | | | 81 | % | | | 147 | % | | | 136 | % |
Net assets at end of year (000’s omitted) | �� | $ | 36,884 | | | $ | 35,741 | | | $ | 39,420 | | | $ | 39,366 | | | $ | 48,882 | |
| | | | | | | | | | | | | | | | | | | | |
Ratios absent expense offsets:2 | | | | | | | | | | | | | | | | | | | | |
Ratio of total expenses to average net assets | | | 1.14 | % | | | 1.11 | % | | | 1.19 | % | | | 1.18 | % | | | 1.03 | % |
Ratio of net investment income to average net assets | | | 0.45 | % | | | 0.06 | % | | | 0.25 | % | | | 0.50 | % | | | 0.88 | % |
| | | | | | | | | | | | | | | | | | | | |
37
Managers AMG FQ U.S. Equity Fund
Financial Highlights
For a share outstanding throughout each fiscal year
| | | | | | | | | | | | | | | | | | | | |
| | | For the fiscal year ended October 31, | |
Class A | | 2012 | | | 2011 | | | 2010 | | | 2009 | | | 2008 | |
Net Asset Value, Beginning of Year | | $ | 11.30 | | | $ | 10.29 | | | $ | 8.93 | | | $ | 8.63 | | | $ | 15.43 | |
Income from Investment Operations: | | | | | | | | | | | | | | | | | | | | |
Net investment income | | | 0.22 | 3 | | | 0.09 | 3 | | | 0.10 | | | | 0.11 | | | | 0.09 | |
Net realized and unrealized gain (loss) on investments | | | 1.07 | 3 | | | 1.01 | 3 | | | 1.37 | | | | 0.32 | | | | (5.14 | ) |
Total from investment operations | | | 1.29 | | | | 1.10 | | | | 1.47 | | | | 0.43 | | | | (5.05 | ) |
Less Distributions to Shareholders from: | | | | | | | | | | | | | | | | | | | | |
Net investment income | | | (0.30 | ) | | | (0.09 | ) | | | (0.11 | ) | | | (0.13 | ) | | | (0.14 | ) |
Net realized gain on investments | | | — | | | | — | | | | — | | | | — | | | | (1.61 | ) |
Total distributions to shareholders | | | (0.30 | ) | | | (0.09 | ) | | | (0.11 | ) | | | (0.13 | ) | | | (1.75 | ) |
Net Asset Value, End of Year | | $ | 12.29 | | | $ | 11.30 | | | $ | 10.29 | | | $ | 8.93 | | | $ | 8.63 | |
Total Return1 | | | 11.50 | % | | | 10.72 | % | | | 16.57 | % | | | 5.21 | % | | | (36.64 | )% |
Ratio of net expenses to average net assets | | | 1.04 | % | | | 1.04 | %5 | | | 1.04 | % | | | 1.04 | % | | | 1.04 | % |
Ratio of net investment income to average net assets1 | | | 1.84 | % | | | 0.83 | %5 | | | 0.98 | % | | | 1.35 | % | | | 1.07 | % |
Portfolio turnover | | | 132 | % | | | 138 | % | | | 117 | % | | | 151 | % | | | 227 | % |
Net assets at end of year (000’s omitted) | | $ | 12,764 | | | $ | 12,966 | | | $ | 18,755 | | | $ | 18,588 | | | $ | 22,966 | |
| | | | | | | | | | | | | | | | | | | | |
Ratios absent expense offsets:2 | | | | | | | | | | | | | | | | | | | | |
Ratio of total expenses to average net assets | | | 1.15 | % | | | 1.13 | % | | | 1.15 | % | | | 1.29 | % | | | 1.16 | % |
Ratio of net investment income to average net assets | | | 1.73 | % | | | 0.74 | % | | | 0.87 | % | | | 1.10 | % | | | 0.95 | % |
| | | | | | | | | | | | | | | | | | | | |
| |
| | | For the fiscal year ended October 31, | |
Class C | | 2012 | | | 2011 | | | 2010 | | | 2009 | | | 2008 | |
Net Asset Value, Beginning of Year | | $ | 11.20 | | | $ | 10.20 | | | $ | 8.83 | | | $ | 8.52 | | | $ | 15.27 | |
Income from Investment Operations: | | | | | | | | | | | | | | | | | | | | |
Net investment income | | | 0.13 | 3 | | | 0.01 | 3 | | | 0.07 | | | | 0.06 | | | | 0.04 | |
Net realized and unrealized gain (loss) on investments | | | 1.06 | 3 | | | 1.00 | 3 | | | 1.32 | | | | 0.31 | | | | (5.13 | ) |
Total from investment operations | | | 1.19 | | | | 1.01 | | | | 1.39 | | | | 0.37 | | | | (5.09 | ) |
Less Distributions to Shareholders from: | | | | | | | | | | | | | | | | | | | | |
Net investment income | | | (0.11 | ) | | | (0.01 | ) | | | (0.02 | ) | | | (0.06 | ) | | | (0.05 | ) |
Net realized gain on investments | | | — | | | | — | | | | — | | | | — | | | | (1.61 | ) |
Total distributions to shareholders | | | (0.11 | ) | | | (0.01 | ) | | | (0.02 | ) | | | (0.06 | ) | | | (1.66 | ) |
Net Asset Value, End of Year | | $ | 12.28 | | | $ | 11.20 | | | $ | 10.20 | | | $ | 8.83 | | | $ | 8.52 | |
Total Return1 | | | 10.67 | % | | | 9.94 | % | | | 15.75 | % | | | 4.42 | % | | | (37.12 | )% |
Ratio of net expenses to average net assets | | | 1.79 | % | | | 1.79 | %5 | | | 1.79 | % | | | 1.79 | % | | | 1.79 | % |
Ratio of net investment income to average net assets1 | | | 1.09 | % | | | 0.08 | %5 | | | 0.24 | % | | | 0.67 | % | | | 0.37 | % |
Portfolio turnover | | | 132 | % | | | 138 | % | | | 117 | % | | | 151 | % | | | 227 | % |
Net assets at end of year (000’s omitted) | | $ | 540 | | | $ | 520 | | | $ | 742 | | | $ | 840 | | | $ | 1,158 | |
| | | | | | | | | | | | | | | | | | | | |
Ratios absent expense offsets:2 | | | | | | | | | | | | | | | | | | | | |
Ratio of total expenses to average net assets | | | 1.90 | % | | | 1.88 | % | | | 1.90 | % | | | 2.04 | % | | | 1.91 | % |
Ratio of net investment income (loss) to average net assets | | | 0.98 | % | | | (0.01 | )% | | | 0.13 | % | | | 0.42 | % | | | 0.25 | % |
| | | | | | | | | | | | | | | | | | | | |
38
Managers AMG FQ U.S. Equity Fund
Financial Highlights
For a share outstanding throughout each fiscal year
| | | | | | | | | | | | | | | | | | | | |
| | | For the fiscal year ended October 31, | |
Institutional Class | | 2012 | | | 2011 | | | 2010 | | | 2009 | | | 2008 | |
Net Asset Value, Beginning of Year | | $ | 11.38 | | | $ | 10.35 | | | $ | 8.99 | | | $ | 8.68 | | | $ | 15.49 | |
Income from Investment Operations: | | | | | | | | | | | | | | | | | | | | |
Net investment income | | | 0.25 | 3 | | | 0.12 | 3 | | | 0.13 | | | | 0.14 | | | | 0.19 | |
Net realized and unrealized gain (loss) on investments | | | 1.07 | 3 | | | 1.03 | 3 | | | 1.37 | | | | 0.32 | | | | (5.23 | ) |
Total from investment operations | | | 1.32 | | | | 1.15 | | | | 1.50 | | | | 0.46 | | | | (5.04 | ) |
Less Distributions to Shareholders from: | | | | | | | | | | | | | | | | | | | | |
Net investment income | | | (0.36 | ) | | | (0.12 | ) | | | (0.14 | ) | | | (0.15 | ) | | | (0.16 | ) |
Net realized gain on investments | | | — | | | | — | | | | — | | | | — | | | | (1.61 | ) |
Total distributions to shareholders | | | (0.36 | ) | | | (0.12 | ) | | | (0.14 | ) | | | (0.15 | ) | | | (1.77 | ) |
Net Asset Value, End of Year | | $ | 12.34 | | | $ | 11.38 | | | $ | 10.35 | | | $ | 8.99 | | | $ | 8.68 | |
Total Return1 | | | 11.78 | % | | | 11.12 | % | | | 16.75 | % | | | 5.56 | % | | | (36.43 | )% |
Ratio of net expenses to average net assets | | | 0.79 | % | | | 0.79 | %5 | | | 0.79 | % | | | 0.79 | % | | | 0.79 | % |
Ratio of net investment income to average net assets1 | | | 2.09 | % | | | 1.08 | %5 | | | 1.22 | % | | | 1.58 | % | | | 1.36 | % |
Portfolio turnover | | | 132 | % | | | 138 | % | | | 117 | % | | | 151 | % | | | 227 | % |
Net assets at end of year (000’s omitted) | | $ | 34,231 | | | $ | 33,250 | | | $ | 32,309 | | | $ | 31,175 | | | $ | 35,135 | |
| | | | | | | | | | | | | | | | | | | | |
Ratios absent expense offsets:2 | | | | | | | | | | | | | | | | | | | | |
Ratio of total expenses to average net assets | | | 0.90 | % | | | 0.88 | % | | | 0.90 | % | | | 1.04 | % | | | 0.91 | % |
Ratio of net investment income to average net assets | | | 1.98 | % | | | 0.99 | % | | | 1.11 | % | | | 1.33 | % | | | 1.24 | % |
| | | | | | | | | | | | | | | | | | | | |
39
Managers AMG FQ Global Alternatives Fund
Financial Highlights
For a share outstanding throughout each fiscal period
| | | | | | | | | | | | | | | | | | | | |
| | | For the fiscal year ended October 31, | |
Class A | | 2012 | | | 2011 | | | 2010 | | | 2009 | | | 2008 | |
Net Asset Value, Beginning of Year | | $ | 9.30 | | | $ | 10.24 | | | $ | 9.96 | | | $ | 11.00 | | | $ | 9.94 | |
Income from Investment Operations: | | | | | | | | | | | | | | | | | | | | |
Net investment income (loss)3 | | | (0.12 | ) | | | (0.14 | ) | | | (0.14 | ) | | | (0.09 | ) | | | 0.04 | |
Net realized and unrealized gain (loss) on investments3 | | | (0.01 | ) | | | (0.80 | ) | | | 0.42 | | | | (0.27 | ) | | | 1.15 | |
Total from investment operations | | | (0.13 | ) | | | (0.94 | ) | | | 0.28 | | | | (0.36 | ) | | | 1.19 | |
Less Distributions to Shareholders from: | | | | | | | | | | | | | | | | | | | | |
Net investment income | | | — | | | | — | | | | — | | | | (0.68 | )6 | | | (0.03 | ) |
Net realized gain on investments | | | — | | | | — | | | | — | | | | — | | | | (0.10 | ) |
Total distributions to shareholders | | | — | | | | — | | | | — | | | | (0.68 | ) | | | (0.13 | ) |
Net Asset Value, End of Year | | $ | 9.17 | | | $ | 9.30 | | | $ | 10.24 | | | $ | 9.96 | | | $ | 11.00 | |
Total Return1 | | | (1.40 | )% | | | (9.18 | )%4 | | | 2.81 | %4 | | | (3.15 | )% | | | 12.17 | %4 |
Ratio of net expenses to average net assets | | | 1.92 | % | | | 1.92 | %7 | | | 1.91 | % | | | 2.00 | % | | | 2.26 | % |
Ratio of net investment income (loss) to average net assets1 | | | (1.35 | )% | | | (1.47 | )%7 | | | (1.39 | )% | | | (0.88 | )% | | | 0.36 | % |
Portfolio turnover | | | — | | | | 12 | % | | | 17 | % | | | 77 | % | | | 133 | % |
Net assets at end of year (000’s omitted) | | $ | 237,013 | | | $ | 362,659 | | | $ | 518,118 | | | $ | 206,153 | | | $ | 89,232 | |
| | | | | | | | | | | | | | | | | | | | |
Ratios absent expense offsets:2 | | | | | | | | | | | | | | | | | | | | |
Ratio of total expenses to average net assets | | | 2.65 | % | | | 2.58 | % | | | 2.55 | % | | | 2.44 | % | | | 2.45 | % |
Ratio of net investment income (loss) to average net assets | | | (2.08 | )% | | | (2.13 | )% | | | (2.03 | )% | | | (1.32 | )% | | | 0.17 | % |
| | | | | | | | | | | | | | | | | | | | |
| |
| | | For the fiscal year ended October 31, | |
Class C | | 2012 | | | 2011 | | | 2010 | | | 2009 | | | 2008 | |
Net Asset Value, Beginning of Year | | $ | 9.02 | | | $ | 9.98 | | | $ | 9.77 | | | $ | 10.81 | | | $ | 9.82 | |
Income from Investment Operations: | | | | | | | | | | | | | | | | | | | | |
Net investment loss3 | | | (0.17 | ) | | | (0.19 | ) | | | (0.20 | ) | | | (0.16 | ) | | | (0.04 | ) |
Net realized and unrealized gain (loss) on investments3 | | | (0.01 | ) | | | (0.77 | ) | | | 0.41 | | | | (0.26 | ) | | | 1.13 | |
Total from investment operations | | | (0.18 | ) | | | (0.96 | ) | | | 0.21 | | | | (0.42 | ) | | | 1.09 | |
Less Distributions to Shareholders from: | | | | | | | | | | | | | | | | | | | | |
Net investment income | | | — | | | | — | | | | — | | | | (0.62 | )6 | | | (0.01 | ) |
Net realized gain on investments | | | — | | | | — | | | | — | | | | — | | | | (0.09 | ) |
Total distributions to shareholders | | | — | | | | — | | | | — | | | | (0.62 | ) | | | (0.10 | ) |
Net Asset Value, End of Year | | $ | 8.84 | | | $ | 9.02 | | | $ | 9.98 | | | $ | 9.77 | | | $ | 10.81 | |
Total Return1 | | | (2.00 | )% | | | (9.62 | )% | | | 2.15 | % | | | (3.86 | )% | | | 11.31 | %4 |
Ratio of net expenses to average net assets | | | 2.47 | % | | | 2.48 | %7 | | | 2.51 | % | | | 2.75 | % | | | 3.02 | % |
Ratio of net investment loss to average net assets1 | | | (1.90 | )% | | | (2.03 | )%7 | | | (2.00 | )% | | | (1.68 | )% | | | (0.38 | )% |
Portfolio turnover | | | — | | | | 12 | % | | | 17 | % | | | 77 | % | | | 133 | % |
Net assets at end of year (000’s omitted) | | $ | 15,623 | | | $ | 27,611 | | | $ | 45,664 | | | $ | 30,067 | | | $ | 12,128 | |
| | | | | | | | | | | | | | | | | | | | |
Ratios absent expense offsets:2 | | | | | | | | | | | | | | | | | | | | |
Ratio of total expenses to average net assets | | | 3.20 | % | | | 3.14 | % | | | 3.14 | % | | | 3.19 | % | | | 3.21 | % |
Ratio of net investment loss to average net assets | | | (2.63 | )% | | | (2.69 | )% | | | (2.63 | )% | | | (2.12 | )% | | | (0.57 | )% |
| | | | | | | | | | | | | | | | | | | | |
40
Managers AMG FQ Global Alternatives Fund
Financial Highlights
For a share outstanding throughout each fiscal period
| | | | | | | | | | | | |
| | | For the fiscal year ended October 31, | | | For the fiscal
period ended
October 31, 2010# | |
Service Class | | 2012 | | | 2011 | | |
Net Asset Value, Beginning of Period | | $ | 9.36 | | | $ | 10.27 | | | $ | 9.97 | |
Income from Investment Operations: | | | | | | | | | | | | |
Net investment loss3 | | | (0.10 | ) | | | (0.11 | ) | | | (0.10 | ) |
Net realized and unrealized gain (loss) on investments3 | | | (0.01 | ) | | | (0.80 | ) | | | 0.40 | |
Total from investment operations | | | (0.11 | ) | | | (0.91 | ) | | | 0.30 | |
Net Asset Value, End of Period | | $ | 9.25 | | | $ | 9.36 | | | $ | 10.27 | |
Total Return1 | | | (1.18 | )% | | | (8.86 | )% | | | 3.01 | %9 |
Ratio of net expenses to average net assets | | | 1.62 | % | | | 1.63 | %7 | | | 1.70 | %10 |
Ratio of net investment loss to average net assets1 | | | (1.05 | )% | | | (1.18 | )%7 | | | (1.17 | )%10 |
Portfolio turnover | | | — | | | | 12 | % | | | 17 | %9 |
Net assets at end of period (000’s omitted) | | $ | 44,587 | | | $ | 43,870 | | | $ | 18,049 | |
| | | | | | | | | | | | |
Ratios absent expense offsets:2 | | | | | | | | | | | | |
Ratio of total expenses to average net assets | | | 2.35 | % | | | 2.29 | % | | | 2.36 | %10 |
Ratio of net investment loss to average net assets | | | (1.78 | )% | | | (1.84 | )% | | | (1.83 | )%10 |
| | | | | | | | | | | | |
| | |
| | | For the fiscal year ended October 31, | | | For the fiscal
period ended
October 31, 2010# | |
Institutional Class | | 2012 | | | 2011 | | |
Net Asset Value, Beginning of Period | | $ | 9.38 | | | $ | 10.28 | | | $ | 9.97 | |
Income from Investment Operations: | | | | | | | | | | | | |
Net investment loss3 | | | (0.08 | ) | | | (0.10 | ) | | | (0.08 | ) |
Net realized and unrealized gain (loss) on investments3 | | | (0.02 | ) | | | (0.80 | ) | | | 0.39 | |
Total from investment operations | | | (0.10 | ) | | | (0.90 | ) | | | 0.31 | |
Net Asset Value, End of Period | | $ | 9.28 | | | $ | 9.38 | | | $ | 10.28 | |
Total Return1 | | | (1.07 | )% | | | (8.75 | )%4 | | | 3.11 | %4,9 |
Ratio of net expenses to average net assets | | | 1.47 | % | | | 1.48 | %7 | | | 1.48 | %10 |
Ratio of net investment loss to average net assets1 | | | (0.90 | )% | | | (1.03 | )%7 | | | (0.95 | )%10 |
Portfolio turnover | | | — | | | | 12 | % | | | 17 | %9 |
Net assets at end of period (000’s omitted) | | $ | 24,242 | | | $ | 31,045 | | | $ | 25,856 | |
| | | | | | | | | | | | |
Ratios absent expense offsets:2 | | | | | | | | | | | | |
Ratio of total expenses to average net assets | | | 2.20 | % | | | 2.14 | % | | | 2.14 | %10 |
Ratio of net investment loss to average net assets | | | (1.63 | )% | | | (1.69 | )% | | | (1.61 | )%10 |
| | | | | | | | | | | | |
41
Managers AMG FQ Global Essentials Fund
Financial Highlights
For a share outstanding throughout each fiscal period
| | | | | | | | | | | | |
| | | For the fiscal year ended October 31, | | | For the fiscal
period ended
October 31, 2010* | |
Investor Class | | 2012 | | | 2011 | | |
Net Asset Value, Beginning of Period | | $ | 12.80 | | | $ | 12.73 | | | $ | 11.36 | |
Income from Investment Operations: | | | | | | | | | | | | |
Net investment income (loss)3 | | | (0.04 | ) | | | 0.01 | | | | (0.07 | ) |
Net realized and unrealized gain on investments3 | | | 1.11 | | | | 0.62 | | | | 1.44 | |
Total from investment operations | | | 1.07 | | | | 0.63 | | | | 1.37 | |
Less Distributions to Shareholders from: | | | | | | | | | | | | |
Net investment income | | | (0.51 | )8 | | | (0.56 | )8 | | | — | |
Net Asset Value, End of Period | | $ | 13.36 | | | $ | 12.80 | | | $ | 12.73 | |
Total Return1 | | | 8.67 | %4 | | | 5.23 | %4 | | | 12.06 | %4,9 |
Ratio of net expenses to average net assets | | | 1.44 | % | | | 1.47 | % | | | 1.46 | %10 |
Ratio of net investment income (loss) to average net assets1 | | | (0.32 | )% | | | 0.06 | % | | | (0.72 | )%10 |
Portfolio turnover | | | 43 | % | | | 80 | % | | | 127 | %9 |
Net assets at end of period (000’s omitted) | | $ | 13,043 | | | $ | 7,824 | | | $ | 6,517 | |
| | | | | | | | | | | | |
Ratios absent expense offsets:2 | | | | | | | | | | | | |
Ratio of total expenses to average net assets | | | 1.50 | % | | | 1.49 | % | | | 1.54 | %10 |
Ratio of net investment income (loss) to average net assets | | | (0.38 | )% | | | 0.04 | % | | | (0.80 | )%10 |
| | | | | | | | | | | | |
| | |
| | | For the fiscal year ended October 31, | | | For the fiscal
period ended
October 31, 2010* | |
Service Class | | 2012 | | | 2011 | | |
Net Asset Value, Beginning of Period | | $ | 12.86 | | | $ | 12.77 | | | $ | 11.36 | |
Income from Investment Operations: | | | | | | | | | | | | |
Net investment income (loss)3 | | | (0.02 | ) | | | 0.03 | | | | (0.04 | ) |
Net realized and unrealized gain on investments3 | | | 1.15 | | | | 0.62 | | | | 1.45 | |
Total from investment operations | | | 1.13 | | | | 0.65 | | | | 1.41 | |
Less Distributions to Shareholders from: | | | | | | | | | | | | |
Net investment income | | | (0.55 | )8 | | | (0.56 | )8 | | | — | |
Net Asset Value, End of Period | | $ | 13.44 | | | $ | 12.86 | | | $ | 12.77 | |
Total Return1 | | | 9.11 | % | | | 5.44 | % | | | 12.41 | %9 |
Ratio of net expenses to average net assets | | | 0.99 | % | | | 1.15 | % | | | 1.17 | %10 |
Ratio of net investment income (loss) to average net assets1 | | | (0.14 | )% | | | 0.24 | % | | | (0.43 | )%10 |
Portfolio turnover | | | 43 | % | | | 80 | % | | | 127 | %9 |
Net assets at end of period (000’s omitted) | | $ | 11,738 | | | $ | 1,103 | | | $ | 217 | |
| | | | | | | | | | | | |
Ratios absent expense offsets:2 | | | | | | | | | | | | |
Ratio of total expenses to average net assets | | | 1.08 | % | | | 1.17 | % | | | 1.25 | %10 |
Ratio of net investment income (loss) to average net assets | | | (0.23 | )% | | | 0.22 | % | | | (0.51 | )%10 |
| | | | | | | | | | | | |
42
Managers AMG FQ Global Essentials Fund
Financial Highlights
For a share outstanding throughout each fiscal period
| | | | | | | | | | | | | | | | | | | | |
| | | For the fiscal year ended October 31, | |
Institutional Class | | 2012 | | | 2011 | | | 2010** | | | 2009 | | | 2008 | |
Net Asset Value, Beginning of Year | | $ | 12.88 | | | $ | 12.77 | | | $ | 11.16 | | | $ | 9.82 | | | $ | 16.49 | |
Income from Investment Operations: | | | | | | | | | | | | | | | | | | | | |
Net investment income (loss)3 | | | 0.03 | | | | 0.08 | | | | (0.01 | ) | | | 0.47 | | | | 0.45 | |
Net realized and unrealized gain (loss) on investments3 | | | 1.12 | | | | 0.61 | | | | 1.72 | | | | 1.35 | | | | (6.65 | ) |
Total from investment operations | | | 1.15 | | | | 0.69 | | | | 1.71 | | | | 1.82 | | | | (6.20 | ) |
Less Distributions to Shareholders from: | | | | | | | | | | | | | | | | | | | | |
Net investment income | | | (0.56 | )8 | | | (0.58 | )8 | | | (0.10 | ) | | | (0.48 | ) | | | (0.47 | ) |
Net Asset Value, End of Year | | $ | 13.47 | | | $ | 12.88 | | | $ | 12.77 | | | $ | 11.16 | | | $ | 9.82 | |
Total Return1 | | | 9.29 | % | | | 5.70 | %4 | | | 15.41 | %4,10 | | | 19.67 | % | | | (38.66 | )% |
Ratio of net expenses to average net assets | | | 0.94 | % | | | 0.97 | % | | | 0.97 | % | | | 0.92 | % | | | 0.80 | % |
Ratio of net investment income (loss) to average net assets1 | | | 0.20 | % | | | 0.64 | % | | | (0.09 | )% | | | 4.82 | % | | | 3.18 | % |
Portfolio turnover | | | 43 | % | | | 80 | % | | | 127 | % | | | 213 | % | | | 143 | % |
Net assets at end of year (000’s omitted) | | $ | 99,173 | | | $ | 86,935 | | | $ | 93,903 | | | $ | 80,584 | | | $ | 78,339 | |
| | | | | | | | | | | | | | | | | | | | |
Ratios absent expense offsets:2 | | | | | | | | | | | | | | | | | | | | |
Ratio of total expenses to average net assets | | | 1.00 | % | | | 0.99 | % | | | 1.05 | % | | | 1.17 | % | | | 1.08 | % |
Ratio of net investment income (loss) to average net assets | | | 0.14 | % | | | 0.62 | % | | | (0.17 | )% | | | 4.57 | % | | | 2.90 | % |
| | | | | | | | | | | | | | | | | | | | |
Notes to Financial Highlights
The following footnotes should be read in conjunction with the Financial Highlights of the Fund previously presented in this report.
| # | Commencement of operations was on January 1, 2010. |
| * | Investor Class and Service Class shares commenced operations on January 1, 2010. |
| ** | Effective January 1, 2010, existing shares of Managers AMG FQ Global Essentials Fund were reclassified and redesignated as Institutional Class shares. |
| 1 | Total returns and net investment income would have been lower had certain expenses not been reduced. (See Note 1(c) of Notes to Financial Statements.) |
| 2 | Excludes the impact of expense reimbursements or fee waivers and expense reductions such as brokerage credits, but includes non-reimbursable expenses, if any, such as interest and taxes. (See Note 1(c) of Notes to Financial Statements.) |
| 3 | Per share numbers have been calculated using average shares. |
| 4 | The total return is based on the Financial Statement Net Asset Values as shown above. |
| 5 | Excludes tax expense for the fiscal year ended October 31, 2011, of 0.01%. |
| 6 | The per share net investment income distribution shown for Class A shares and Class C shares includes $0.67 and $0.61, respectively, of distributions from foreign currency gains. (See Note 1(d) of Notes to Financial Statements.) |
| 7 | Includes interest expense for the fiscal year ended October 31, 2011 of 0.01%. |
| 8 | The per share income distribution shown for the Institutional, Service, and Investor Class shares represents income derived primarily from foreign currency gains. (See Note 1)(d) of Notes to Financial Statements.) |
| 11 | Includes non-recurring dividends. Without this dividend, net investment income per class would have been $0.01, $(0.10), and $0.05 for Managers AMG FQ Tax-Managed U.S. Equity Fund’s Class A, Class C and Institutional Class Shares, respectively. |
43
Notes to Financial Statements
October 31, 2012
1. Summary of Significant Accounting Policies
Managers Trust I (the “Trust”) is an open-end management investment company, organized as a Massachusetts business trust, and registered under the Investment Company Act of 1940, as amended (the “1940 Act”). Currently, the Trust consists of a number of different funds, each having distinct investment management objectives, strategies, risks, and policies. Included in this report are: Managers AMG FQ Tax-Managed U.S. Equity Fund (“Tax-Managed”), Managers AMG FQ U.S. Equity Fund (“U.S. Equity”), Managers AMG FQ Global Alternatives Fund (“Global Alternatives”) and Managers AMG FQ Global Essentials Fund (“Global Essentials”), each a “Fund” and collectively the “Funds.”
Global Essentials offers three classes of shares, Investor, Service and Institutional, while Global Alternatives offers four classes of shares, Class A, Class C, Service and Institutional, each offering varying levels of shareholder servicing and or 12b-1 fees.
Each Fund except Global Essentials offers Class A and Class C shares. Sales of Class A shares may be subject to a front-end sales charge of up to 5.75%. Redemptions of Class A and Class C shares may be subject to a contingent-deferred sales charge (as a percentage of the original offering price or the net asset value at the time of sale, whichever is less). Each Fund offers Institutional Class shares, available with no sales charge, to certain institutional investors and qualifying individual investors. Each class represents an interest in the same assets of the Fund and the classes are identical except for class specific expenses related to shareholder activity. Each class has equal voting privileges except that each class has exclusive voting rights with respect to its services and/or distribution plan. Please refer to a current prospectus for additional information on each share class
The Funds’ financial statements are prepared in accordance with accounting principles generally accepted in the United States of America (“U.S. GAAP”), which require management to make estimates and assumptions that affect the reported amounts of assets and liabilities and disclosure of contingent assets and liabilities at the date of the financial statements and the reported amounts of income and expenses during the reporting periods. Actual results could differ from those estimates and such differences could be material. The following is a summary of significant accounting policies followed by the Funds in the preparation of their financial statements:
a. Valuation of Investments
Equity securities traded on a domestic or international securities exchange are valued at the last quoted sale price, or, lacking any sales, at the last quoted bid price. Over-the-counter securities are valued at the Nasdaq Official Closing Price, if one is available. Lacking any sales, over-the-counter securities are valued at the last quoted bid price. The Funds’ investments are generally valued based on market quotations provided by third-party pricing services approved by the Board of Trustees of the Funds (the “Board”).
Fixed-income securities are valued based on valuations furnished by independent pricing services that utilize matrix systems, which reflect such factors as security prices, yields, maturities, and ratings, and are supplemented by dealer and exchange quotations. Futures contracts for which market quotations are readily available are valued at the settlement price as of the close of the futures
exchange. Short-term investments having a remaining maturity of 60 days or less are valued at amortized cost, which approximates market value. Investments in other open-end regulated investment companies are valued at their end of day net asset value per share except iShares or other ETF’s, which are valued the same as equity securities. Investments in certain mortgage-backed and stripped mortgage-backed securities, preferred stocks, convertible securities, derivatives and other debt securities not traded on an organized securities market are valued on the basis of valuations provided by dealers or by a pricing service which uses information with respect to transactions in such securities and various relationships between such securities and yield to maturity in determining value.
Under certain circumstances, the value of certain Fund investments (including derivatives) may be based on an evaluation of fair value, pursuant to procedures established by and under the general supervision of the Board. The Pricing Committee is the committee formed by the Board to make fair value determinations for such investments. When determining the fair value of an investment, the Pricing Committee seeks to determine the price that each Fund might reasonably expect to receive from a current sale of that investment in an arm’s-length transaction. Fair value determinations shall be based upon consideration of all available facts and information, including, but not limited to (i) attributes specific to the investment; (ii) fundamental analytical data and press releases relating to the investment and its issuer; (iii) the value of comparable securities or relevant financial instruments, including derivative securities, traded on other markets or among dealers; and (iv) other factors, such as future cash flows, interest rates, yield curves, volatilities, credit risks and/or default rates. The Board will be presented with a quarterly report comparing fair values determined by the Pricing Committee against subsequent market valuations for those securities. The values assigned to fair value investments are based on available information and do not necessarily represent amounts that might ultimately be realized, since such amounts depend on future developments inherent in long-term investments. Further, because of the inherent uncertainty of valuation, those estimated values may differ significantly from the values that would have been used had a ready market for the investments existed, and the differences could be material. Each Fund may use the fair value of a portfolio investment to calculate its net asset value (“NAV”) when, for example, (1) market quotations are not readily available because a portfolio investment is not traded in a public market or the principal market in which the investment trades is closed, (2) trading in a portfolio investment is suspended and has not resumed before each Fund calculates its NAV, (3) a significant event affecting the value of a portfolio investment is determined to have occurred between the time of the market quotation provided for a portfolio investment and the time as of which each Fund calculates its NAV, (4) an investment’s price has remained unchanged over a period of time (often referred to as a “stale price”), or (5) Managers Investment Group LLC (the “Investment Manager”) determines that a market quotation is inaccurate. Portfolio investments that trade primarily on foreign markets are priced based upon the market quotation of such securities as of the close of their respective principal markets, as adjusted to reflect the Investment Manager’s determination of the impact of events occurring subsequent to the close of such markets but prior to the time as of which each Fund calculates its NAV.
Notes to Financial Statements (continued)
Under certain circumstances, the Investment Manager may adjust such prices based on its determination of the impact of events occurring subsequent to the close of such markets but prior to the time as of which each Fund calculates its NAV. The Funds may invest in securities that may be thinly traded. The Board has adopted procedures to adjust prices of thinly traded securities that are judged to be stale so that they reflect fair value. An investment valued on the basis of its fair value may be valued at a price higher or lower than available market quotations. An investment’s valuation may differ depending on the method used and the factors considered in determining value according to each Fund’s fair value procedures.
U.S. GAAP defines fair value as the price that a Fund would receive to sell an asset or pay to transfer a liability in an orderly transaction between market participants at the measurement date. U.S. GAAP also establishes a framework for measuring fair value, and a three level hierarchy for fair value measurements based upon the transparency of inputs to the valuation of an asset or liability. Inputs may be observable or unobservable and refer broadly to the assumptions that market participants would use in pricing the asset or liability. Observable inputs reflect the assumptions market participants would use in pricing the asset or liability based on market data obtained from sources independent of the Funds. Unobservable inputs reflect the Funds’ own assumptions about the assumptions that market participants would use in pricing the asset or liability developed based on the best information available in the circumstances. Each investment is assigned a level based upon the observability of the inputs which are significant to the overall valuation.
The three-tier hierarchy of inputs is summarized below:
Level 1 – inputs are quoted prices in active markets for identical investments (e.g., equity securities, open-end investment companies, futures contracts, option contracts)
Level 2 – other observable inputs (including, but not limited to: quoted prices for similar assets or liabilities in markets that are active, quoted prices for identical or similar assets or liabilities in markets that are not active, inputs other than quoted prices that are observable for the assets or liabilities (such as interest rates, yield curves, volatilities, prepayment speeds, loss severities, credit risks and default rates) or other market corroborated inputs) (e.g., debt securities, government securities, swap contracts, foreign currency exchange contracts, foreign securities utilizing international fair value pricing, broker-quoted securities, fair valued securities with observable inputs)
Level 3 – inputs are significant unobservable inputs (including the Fund’s own assumptions used to determine the fair value of investments) (e.g., fair valued securities with unobservable inputs)
Changes in inputs or methodologies used for valuing investments may result in a transfer in or out of levels within the fair value hierarchy. The inputs or methodologies used for valuing investments are not necessarily an indication of the risk associated with investing in those investments.
b. Security Transactions
Security transactions are accounted for as of trade date. Realized gains and losses on securities sold are determined on the basis of identified cost.
c. Investment Income and Expenses
Dividend income is recorded on the ex-dividend date. Dividend income on foreign securities is recorded net of any withholding tax. Interest income, which includes amortization of premium and accretion of discount on debt securities, as required, is accrued as earned. Non-cash dividends included in dividend income, if any, are reported at the fair value of the securities received. Other income and expenses are recorded on an accrual basis. Expenses that cannot be directly attributed to a fund are apportioned among the Funds in the Trust and in some cases other affiliated funds based upon their relative average net assets or number of shareholders. Investment income, realized and unrealized capital gains and losses, the common expenses of each Fund, and certain Fund level expense reductions, if any, are allocated on a pro rata basis to each class based on the relative net assets of each class to the total net assets of each Fund.
The Funds have a “balance credit” agreement with The Bank of New York Mellon (“BNYM”), the Funds’ custodian, whereby each Fund is credited with an interest factor equal to 0.75% below the effective 90-day T-Bill rate for account balances left uninvested overnight. If the T-Bill rate falls below 0.75%, no credits will be earned. These credits serve to reduce custody expenses that would otherwise be charged to each Fund. For the fiscal year ended October 31, 2012, custodian expense was not reduced.
Overdrafts will cause a reduction of any balance credits, computed at 2% above the effective Federal funds rate on the day of the overdraft. For the fiscal year ended October 31, 2012, overdraft fees for Tax-Managed, U.S. Equity and Global Alternatives, equaled $9, $24 and $4, respectively.
The Trust also has a balance credit arrangement with its Transfer Agent, BNY Mellon Investment Servicing (US) Inc., whereby earnings credits are used to offset banking charges and other out-of-pocket expenses. For the fiscal year ended October 31, 2012, the transfer agent for Tax-Managed, U.S. Equity, Global Alternatives and Global Essentials was reduced by $16, $18, $163 and $40, respectively.
The Investment Manager has agreed to waive a portion of its management fee in consideration of shareholder servicing fees that it has received from JPMorgan Distribution Services, Inc., with respect to short-term cash investments each Fund may have made in the JPMorgan Liquid Assets Money Market Fund, Capital Shares. For the fiscal year ended October 31, 2012, the management fee for Global Alternatives and Global Essentials was reduced by $105,396 and $15,051, respectively.
Total returns and net investment income for the Funds would have been lower had certain expenses not been offset. Total expenses before offsets exclude the impact of expense reimbursements or fee waivers and expense reductions such as brokerage recapture credits, but include non-reimbursable expenses, if any, such as interest and taxes.
d. Dividends and Distributions
Dividends resulting from net investment income, if any, normally will be declared and paid quarterly for U.S. Equity and annually for Tax-Managed, Global Alternatives and Global Essentials.
Distributions of capital gains, if any, will be made on an annual basis and when required for Federal excise tax purposes. Dividends
Notes to Financial Statements (continued)
and distributions are recorded on the ex-dividend date. Income and capital gain distributions are determined in accordance with Federal income tax regulations, which may differ from U.S. GAAP. These differences are primarily due to differing treatments for losses deferred due to wash sales, REITs, equalization accounting for tax
purposes, foreign currency, options, futures, and market discount transactions. Permanent book and tax basis differences, if any, relating to shareholder distributions will result in reclassifications to paid-in capital.
The tax character of distributions paid during the fiscal years ended October 31, 2012 and October 31, 2011 were as follows:
| | | | | | | | | | | | | | | | | | | | | | | | | | | | | | | | |
| | | Tax-Managed | | | U.S. Equity | | | Global Alternatives | | | Global Essentials | |
| | | 2012 | | | 2011 | | | 2012 | | | 2011 | | | 2012 | | | 2011 | | | 2012 | | | 2011 | |
Distributions paid from: | | | | | | | | | | | | | | | | | | | | | | | | | | | | | | | | |
Ordinary income | | $ | 35,481 | | | $ | 175,189 | | | $ | 1,357,101 | | | $ | 512,079 | | | $ | — | | | $ | — | | | $ | 4,289,658 | | | $ | 4,527,841 | |
Short-term capital gains | | | — | | | | — | | | | — | | | | — | | | | — | | | | — | | | | — | | | | — | |
Long-term capital gains | | | — | | | | — | | | | — | | | | — | | | | — | | | | — | | | | — | | | | — | |
Return of capital | | | — | | | | — | | | | — | | | | — | | | | — | | | | — | | | | — | | | | — | |
| | | | | | | | | | | | | | | | | | | | | | | | | | | | | | | | |
Totals | | $ | 35,481 | | | $ | 175,189 | | | $ | 1,357,101 | | | $ | 512,079 | | | $ | — | | | $ | — | | | $ | 4,289,658 | | | $ | 4,527,841 | |
| | | | | | | | | | | | | | | | | | | | | | | | | | | | | | | | |
As of October 31, 2012, the components of distributable earnings (excluding unrealized appreciation/depreciation) on a tax basis consisted of:
| | | | | | | | | | | | | | | | |
| | | Tax-Managed | | | U.S. Equity | | | Global Alternatives | | | Global Essentials | |
Capital loss carryforward | | $ | 23,993,574 | | | $ | 13,174,917 | | | $ | 924,849 | | | $ | 20,662,993 | |
Undistributed ordinary income | | | 217,099 | | | | 27,957 | | | | 3,491,328 | | | | 3,945,372 | |
Undistributed short-term capital gains | | | — | | | | — | | | | — | | | | — | |
Undistributed long-term capital gains | | | — | | | | — | | | | — | | | | — | |
Post-October loss deferral | | | — | | | | — | | | | — | | | | — | |
e. Federal Taxes
Each Fund intends to comply with the requirements under Subchapter M of the Internal Revenue Code of 1986, as amended, and to distribute substantially all of its taxable income and gains to its shareholders and to meet certain diversification and income requirements with respect to investment companies. Therefore, no provision for Federal income or excise tax is included in the accompanying financial statements.
Additionally, based on each Fund’s understanding of the tax rules and rates related to income, gains and transactions for the foreign jurisdictions in which it invests, each Fund will provide for foreign taxes, and where appropriate, deferred foreign taxes.
Management has analyzed the Fund’s tax positions taken on federal income tax returns as of October 31, 2012, and for all open tax years, and has concluded that no provision for federal income tax is required in the Funds’ financial statements. Additionally, the Funds are not aware of any tax position for which it is reasonably possible that the total amounts of unrecognized tax benefits will change materially in the next twelve months.
Under the Regulated Investment Company Modernization Act of 2010 (the “Act”), post-enactment capital losses may be carried forward for an unlimited time period. However, any new losses incurred will be required to be utilized prior to any loss carryovers incurred in pre-enactment taxable years, which generally expire eight years following the close of the taxable year in which they were incurred. As a result of this ordering rule, pre-enactment capital loss carryovers may be more likely to expire unused. Additionally, post-enactment capital losses that are carried forward retain their
tax character as either short-term or long-term capital losses rather than being considered all short-term as under previous law.
f. Capital Loss Carryovers and Deferrals
As of October 31, 2012, the following Funds had accumulated net realized capital loss carryovers from securities transactions for Federal income tax purposes as shown in the following chart. The amounts may be used to offset future realized capital gains, if any, through the expiration dates listed or in the case of post-enactment losses, for an unlimited time period.
| | | | | | | | | | | | |
Fund | | Capital Loss Carryover Amounts | | | Expires | |
| | Short-Term | | | Long-Term | | | October 31, | |
Tax-Managed | | | | | | | | | | | | |
(Pre-Enactment) | | $ | 22,952,492 | | | | — | | | | 2017 | |
(Pre-Enactment) | | | 1,041,082 | | | | — | | | | 2016 | |
| | | | | | | | | | | | |
| | $ | 23,993,574 | | | | — | | | | | |
| | | | | | | | | | | | |
U.S. Equity | | | | | | | | | | | | |
(Pre-Enactment) | | $ | 13,174,917 | | | | — | | | | 2017 | |
| | | | | | | | | | | | |
Global Alternatives | | | | | | | | | | | | |
(Post-Enactment) | | $ | 924,849 | | | | — | | | | Unlimited | |
| | | | | | | | | | | | |
Global Essentials | | | | | | | | | | | | |
(Pre-Enactment) | | $ | 19,442,096 | | | | — | | | | 2017 | |
(Pre-Enactment) | | | 1,220,897 | | | | — | | | | 2016 | |
| | | | | | | | | | | | |
| | $ | 20,662,993 | | | | — | | | | | |
| | | | | | | | | | | | |
46
Notes to Financial Statements (continued)
For the fiscal year ended October 31, 2012, the following Funds utilized capital loss carryovers in the amount of:
| | | | | | | | |
| | | Capital Loss Carryover Utilized | |
| | | Short-Term | | | Long-Term | |
Tax-Managed | | $ | 4,837,628 | | | | — | |
U.S. Equity | | | 1,801,439 | | | | — | |
Global Alternatives | | | — | | | | — | |
Global Essentials | | | 4,091,722 | | | | — | |
g. Capital Stock
The Trust’s Declaration of Trust authorizes for each series the issuance of an unlimited number of shares of beneficial interest, without par value. Each Fund records sales and repurchases of its capital stock on the trade date. The cost of securities contributed to the Funds in connection with the issuance of shares is based on the valuation of those securities in accordance with the Funds’ policy on investment valuation.
For the fiscal years ended October 31, 2012 and October 31, 2011, the capital stock transactions by class for the Tax-Managed, U.S. Equity, Global Alternative and Global Essentials were as follows:
| | | | | | | | | | | | | | | | | | | | | | | | | | | | | | | | |
| | | Tax-Managed | | | U.S. Equity | |
| | | October 31, 2012 | | | October 31, 2011 | | | October 31, 2012 | | | October 31, 2011 | |
| | | Shares | | | Amount | | | Shares | | | Amount | | | Shares | | | Amount | | | Shares | | | Amount | |
Class A: | | | | | | | | | | | | | | | | | | | | | | | | | | | | | | | | |
Proceeds from sale of shares | | | 21,148 | | | $ | 310,469 | | | | 9,926 | | | $ | 133,378 | | | | 190,613 | | | $ | 2,282,623 | | | | 194,449 | | | $ | 2,156,701 | |
Reinvestment of distributions | | | — | | | | — | | | | 205 | | | | 2,755 | | | | 26,473 | | | | 313,035 | | | | 14,495 | | | | 157,418 | |
Cost of shares repurchased | | | (48,036 | ) | | | (704,809 | ) | | | (116,450 | ) | | | (1,577,937 | ) | | | (325,419 | ) | | | (3,868,906 | ) | | | (885,421 | ) | | | (10,198,448 | ) |
| | | | | | | | | | | | | | | | | | | | | | | | | | | | | | | | |
Net decrease | | | (26,888 | ) | | $ | (394,340 | ) | | | (106,319 | ) | | $ | (1,441,804 | ) | | | (108,333 | ) | | $ | (1,273,248 | ) | | | (676,477 | ) | | $ | (7,884,329 | ) |
| | | | | | | | | | | | | | | | | | | | | | | | | | | | | | | | |
Class C: | | | | | | | | | | | | | | | | | | | | | | | | | | | | | | | | |
Proceeds from sale of shares | | | 13,176 | | | $ | 190,299 | | | | 27,555 | | | $ | 364,730 | | | | 3,243 | | | $ | 38,876 | | | | 7,247 | | | $ | 84,049 | |
Reinvestment of distributions | | | — | | | | — | | | | — | | | | — | | | | 393 | | | | 4,710 | | | | 69 | | | | 748 | |
Cost of shares repurchased | | | (34,820 | ) | | | (501,589 | ) | | | (68,969 | ) | | | (915,731 | ) | | | (6,088 | ) | | | (70,627 | ) | | | (33,680 | ) | | | (381,556 | ) |
| | | | | | | | | | | | | | | | | | | | | | | | | | | | | | | | |
Net decrease | | | (21,644 | ) | | $ | (311,290 | ) | | | (41,414 | ) | | $ | (551,001 | ) | | | (2,452 | ) | | $ | (27,041 | ) | | | (26,364 | ) | | $ | (296,759 | ) |
| | | | | | | | | | | | | | | | | | | | | | | | | | | | | | | | |
Institutional Class: | | | | | | | | | | | | | | | | | | | | | | | | | | | | | | | | |
Proceeds from sale of shares | | | 137,624 | | | $ | 2,045,870 | | | | 210,345 | | | $ | 2,832,928 | | | | 184,680 | | | $ | 2,275,545 | | | | 196,876 | | | $ | 2,204,354 | |
Reinvestment of distributions | | | 2,456 | | | | 33,691 | | | | 12,194 | | | | 163,040 | | | | 85,355 | | | | 1,013,708 | | | | 31,810 | | | | 347,361 | |
Cost of shares repurchased | | | (367,488 | ) | | | (5,371,737 | ) | | | (760,632 | ) | | | (10,475,879 | ) | | | (416,697 | ) | | | (5,033,351 | ) | | | (427,890 | ) | | | (4,754,812 | ) |
| | | | | | | | | | | | | | | | | | | | | | | | | | | | | | | | |
Net decrease | | | (227,408 | ) | | $ | (3,292,176 | ) | | | (538,093 | ) | | $ | (7,479,911 | ) | | | (146,662 | ) | | $ | (1,744,098 | ) | | | (199,204 | ) | | $ | (2,203,097 | ) |
| | | | | | | | | | | | | | | | | | | | | | | | | | | | | | | | |
47
Notes to Financial Statements (continued)
| | | | | | | | | | | | | | | | |
| | |
| | | Global Alternatives | |
| | | October 31, 2012 | | | October 31, 2011 | |
| | | Shares | | | Amount | | | Shares | | | Amount | |
Class A: | | | | | | | | | | | | | | | | |
Proceeds from sale of shares | | | 10,131,589 | | | $ | 92,330,176 | | | | 34,772,313 | | | $ | 344,907,661 | |
Reinvestment of distributions | | | — | | | | — | | | | — | | | | — | |
Cost of shares repurchased | | | (23,267,270 | ) | | | (212,509,753 | ) | | | (46,381,683 | ) | | | (441,562,835 | ) |
| | | | | | | | | | | | | | | | |
Net decrease | | | (13,135,681 | ) | | $ | (120,179,577 | ) | | | (11,609,370 | ) | | $ | (96,655,174 | ) |
| | | | | | | | | | | | | | | | |
Class C: | | | | | | | | | | | | | | | | |
Proceeds from sale of shares | | | 129,396 | | | $ | 1,140,044 | | | | 906,555 | | | $ | 8,852,200 | |
Reinvestment of distributions | | | — | | | | — | | | | — | | | | — | |
Cost of shares repurchased | | | (1,423,883 | ) | | | (12,575,682 | ) | | | (2,418,624 | ) | | | (22,468,584 | ) |
| | | | | | | | | | | | | | | | |
Net decrease | | | (1,294,487 | ) | | $ | (11,435,638 | ) | | | (1,512,069 | ) | | $ | (13,616,384 | ) |
| | | | | | | | | | | | | | | | |
Service Class: | | | | | | | | | | | | | | | | |
Proceeds from sale of shares | | | 2,639,431 | | | $ | 24,252,794 | | | | 5,119,566 | | | $ | 50,984,690 | |
Reinvestment of distributions | | | — | | | | — | | | | — | | | | — | |
Cost of shares repurchased | | | (2,507,087 | ) | | | (23,024,132 | ) | | | (2,188,777 | ) | | | (20,888,185 | ) |
| | | | | | | | | | | | | | | | |
Net increase | | | 132,344 | | | $ | 1,228,662 | | | | 2,930,789 | | | $ | 30,096,505 | |
| | | | | | | | | | | | | | | | |
Institutional Class: | | | | | | | | | | | | | | | | |
Proceeds from sale of shares | | | 1,161,768 | | | $ | 10,685,136 | | | | 4,944,845 | | | $ | 48,944,094 | |
Reinvestment of distributions | | | — | | | | — | | | | — | | | | — | |
Cost of shares repurchased | | | (1,861,276 | ) | | | (17,159,089 | ) | | | (4,149,314 | ) | | | (38,409,354 | ) |
| | | | | | | | | | | | | | | | |
Net increase (decrease) | | | (699,508 | ) | | $ | (6,473,953 | ) | | | 795,531 | | | $ | 10,534,740 | |
| | | | | | | | | | | | | | | | |
| |
| | | Global Essentials | |
| | | October 31, 2012 | | | October 31, 2011 | |
| | | Shares | | | Amount | | | Shares | | | Amount | |
Investor Class: | | | | | | | | | | | | | | | | |
Proceeds from sale of shares | | | 868,385 | | | $ | 11,244,318 | | | | 738,481 | | | $ | 9,210,561 | |
Reinvestment of distributions | | | 33,898 | | | | 422,712 | | | | 26,580 | | | | 318,163 | |
Cost of shares repurchased | | | (537,581 | ) | | | (7,033,497 | ) | | | (665,456 | ) | | | (8,191,276 | ) |
| | | | | | | | | | | | | | | | |
Net increase | | | 364,702 | | | $ | 4,633,533 | | | | 99,605 | | | $ | 1,337,448 | |
| | | | | | | | | | | | | | | | |
Service Class: | | | | | | | | | | | | | | | | |
Proceeds from sale of shares | | | 837,694 | | | $ | 11,034,532 | | | | 68,839 | | | $ | 863,691 | |
Reinvestment of distributions | | | 4,611 | | | | 57,632 | | | | 838 | | | | 10,058 | |
Cost of shares repurchased | | | (54,718 | ) | | | (716,094 | ) | | | (870 | ) | | | (10,696 | ) |
| | | | | | | | | | | | | | | | |
Net increase | | | 787,587 | | | $ | 10,376,070 | | | | 68,807 | | | $ | 863,053 | |
| | | | | | | | | | | | | | | | |
Institutional Class: | | | | | | | | | | | | | | | | |
Proceeds from sale of shares | | | 1,622,529 | | | $ | 21,209,227 | | | | 701,009 | | | $ | 8,771,959 | |
Reinvestment of distributions | | | 298,927 | | | | 3,739,575 | | | | 343,716 | | | | 4,124,590 | |
Cost of shares repurchased | | | (1,306,146 | ) | | | (17,165,932 | ) | | | (1,647,069 | ) | | | (20,390,344 | ) |
| | | | | | | | | | | | | | | | |
Net increase (decrease) | | | 615,310 | | | $ | 7,782,870 | | | | (602,344 | ) | | $ | (7,493,795 | ) |
| | | | | | | | | | | | | | | | |
At October 31, 2012, certain unaffiliated shareholders of record, specifically omnibus accounts, individually or collectively held greater than 10% of the outstanding shares of the following Funds: Tax-Managed – two collectively own 34%; U.S. Equity – one collectively owns 25%; Global Alternatives – one collectively owns 16% and Global Essentials – one collectively owns 12%. Transactions by these shareholders may have a material impact on the respective Funds.
h. Foreign Currency Translation
The books and records of the Funds are maintained in U.S. dollars. The value of investments, assets and liabilities denominated in currencies other than U.S. dollars are translated into U.S. dollars based upon current foreign exchange rates. Purchases and sales of foreign investments, income and expenses are converted into U.S. dollars based on currency exchange rates prevailing on the respective dates of such transactions. Net realized and unrealized gain (loss) on foreign currency transactions represent: (1) foreign exchange gains and losses from the sale and holdings of foreign currencies; (2) gains and losses between trade date and settlement
48
Notes to Financial Statements (continued)
date on investment securities transactions and forward foreign currency exchange contracts; and (3) gains and losses from the difference between amounts of interest and dividends recorded and the amounts actually received.
The Funds do not isolate the net realized and unrealized gain or loss resulting from changes in exchange rates from the fluctuations in market prices of securities held. Such fluctuations are included with the net realized and unrealized gain or loss on investments.
i. Foreign Securities
Certain Portfolios invest in securities of foreign entities and in instruments denominated in foreign currencies which involve risks not typically associated with investments in domestic securities. Non-domestic securities carry special risks, such as exposure to currency fluctuations, less developed or less efficient trading markets, political instability, a lack of company information, differing auditing and legal standards, and, potentially, less liquidity.
Realized gains in certain countries may be subject to foreign taxes at the Fund level, at rates ranging from approximately 10% to 15%. The Funds would pay such foreign taxes on net realized gains at the appropriate rate for each jurisdiction.
2. Agreements and Transactions with Affiliates
For each of the Funds, the Trust has entered into an Investment Management Agreement under which the Investment Manager, a subsidiary of Affiliated Managers Group, Inc. (“AMG”), serves as investment manager to the Funds and is responsible for the Funds’ overall administration and operations. The Investment Manager selects subadvisors for the Funds (subject to Board approval) and monitors the subadvisor’s investment performance, security holdings and investment strategies. The Funds’ investment portfolios are managed by First Quadrant, L.P. (“First Quadrant” or the “Subadvisor”), which serves pursuant to a subadvisory agreement between the Investment Manager and First Quadrant with respect to each of the Funds. AMG indirectly owns a majority interest in First Quadrant.
Tax-Managed is obligated by the Investment Management Agreement to pay a management fee to the Investment Manager at the annual rate of 0.85% of the average daily net assets of the Fund. Under the Investment Management Agreement with the Tax-Managed Fund, the Investment Manager provides a variety of administrative services to the Fund. The Investment Manager receives no additional compensation from the Fund for these services. Pursuant to a reimbursement agreement between the Investment Manager and First Quadrant, First Quadrant reimburses the Investment Manager for the costs the Investment Manager bears in providing such services to the Fund.
U.S. Equity, Global Alternatives and Global Essentials are obligated by the Investment Management Agreement to pay a management fee to the Investment Manager at the annual rate of 0.35%, 1.70% and 0.60%, respectively, of the average daily net assets of the applicable Fund. The Investment Manager, in turn, pays a portion of this fee to First Quadrant for its services as subadvisor.
The Investment Manager has contractually agreed, through at least March 1, 2013, to waive fees and pay or reimburse Fund expenses in order to limit total annual Fund operating expenses after fee
waiver and expense reimbursements (exclusive of taxes, interest (including interest incurred in connection with bank and custody overdrafts), shareholder servicing fees and distribution and service (12b-1) fees, brokerage commissions, and other transaction costs, acquired fund fees and expenses and extraordinary expenses) of Tax-Managed, U.S. Equity and Global Alternatives to 0.99%, 0.79% and 1.49%, respectively, of each Fund’s average daily net assets.
Effective July 1, 2012, Managers Investment Group LLC has contractually agreed until at least March 1, 2014, to limit the Global Essentials Fund’s total annual operating expenses (exclusive of taxes, interest (including interest incurred in connection with bank and custody overdrafts), shareholder servicing fees, distribution and service (12b-1) fees, brokerage commissions and other transaction costs, acquired fund fees and expenses, and extraordinary expenses) to 0.89% of average daily net assets. Immediately prior to July 1, 2012, the Fund had a contractual expense limitation of 0.99%.
Each Fund is obligated to repay the Investment Manager such amounts waived, paid or reimbursed in future years provided that the repayment occurs within thirty-six (36) months after the waiver or reimbursement and that such repayment would not cause the Fund’s total operating expenses in any such future year to exceed that Fund’s respective expense cap. For the fiscal year ended October 31, 2012, each Fund’s components of reimbursement are detailed in the following chart:
| | | | | | | | | | | | | | | | |
| | | Tax-
Managed | | | U.S.
Equity | | | Global
Alternatives | | | Global
Essentials | |
Reimbursement Available - 10/31/11 | | $ | 253,212 | | | $ | 196,154 | | | $ | 7,076,070 | | | $ | 78,389 | |
Additional Reimbursements | | | 61,737 | | | | 50,382 | | | | 2,639,749 | | | | 49,509 | |
Expired Reimbursements | | | (101,951 | ) | | | (92,834 | ) | | | (797,699 | ) | | | (4,809 | ) |
| | | | | | | | | | | | | | | | |
Reimbursement Available - 10/31/12 | | $ | 212,998 | | | $ | 153,702 | | | $ | 8,918,120 | | | $ | 123,089 | |
| | | | | | | | | | | | | | | | |
The aggregate annual retainer paid to each Independent Trustee of the Board is $80,000, plus $5,000 or $2,500 for each regular or special meeting attended, respectively. The Independent Chairman of the Trusts receives an additional payment of $20,000 per year. The Chairman of the Audit Committee receives an additional payment of $8,000 per year. The Trustees’ fees and expenses are allocated among all of the funds for which the Investment Manager serves as the advisor (the “Managers Funds”) based on the relative net assets of such funds. The “Trustees fees and expenses” shown in the financial statements represents the Funds’ allocated portion of the total fees and expenses paid by the Managers Funds.
The Funds are distributed by Managers Distributors, Inc. (the “Distributor” or “MDI”), a wholly-owned subsidiary of the Investment Manager. MDI serves as the distributor and underwriter for each Fund and is a registered broker-dealer and member of the Financial Industry Regulatory Authority, Inc. (“FINRA”). Shares of each Fund will be continuously offered and will be sold directly to prospective purchasers through brokers, dealers or other financial intermediaries who have executed selling agreements with MDI. Subject to the compensation arrangement discussed below, generally MDI bears all or a portion of the expenses of providing services
Notes to Financial Statements (continued)
pursuant to the distribution agreement, including the payment of the expenses relating to the distribution of prospectuses for sales purposes and any advertising or sales literature. Certain Trustees and Officers of the Funds are Officers and/or Directors of the Investment Manager, AMG and/or the Distributor.
The Trust adopted a distribution and service plan (the “Plan”) with respect to the Class A, Class C and Investor Class shares in accordance with the requirements of Rule 12b-1 under the 1940 Act and the requirements of the applicable rules of the FINRA regarding asset-based sales charges. Pursuant to the Plan, each Fund may compensate the Distributor for its expenditures in financing any activity primarily intended to result in the sale of each such class of the Fund’s shares and for maintenance and personal service provided to existing shareholders of that class. The Plan authorizes payments to the Distributor up to 0.25% annually of each Fund’s average daily net assets attributable to the Class A and Investor Class shares and 1.00% annually of each Fund’s average daily net assets attributable to Class C shares.
The Plan further provides for periodic payments by the Trust or MDI to brokers, dealers and other financial intermediaries for providing shareholder services and for promotional and other sales related costs. The portion of payments by the Class A, Class C, Investor or Service Class shares of a Fund for shareholder servicing may not exceed an annual rate of 0.25% of the average daily net asset value of the Fund’s shares of that class owned by clients of such broker, dealer or financial intermediary.
The Securities and Exchange Commission granted an exemptive order that permits the Funds to lend and borrow money for certain temporary purposes directly to and from other eligible Managers Funds. Participation in this interfund lending program is voluntary for both borrowing and lending Funds, and an interfund loan is only made if it benefits each participating fund. The Investment Manager administers the program according to procedures approved by the Board, and the Board monitors the operation of the program. An interfund loan must comply with certain conditions set out in the exemptive order, which are designed to assure fairness and protect all participating funds. For the fiscal year ended October 31, 2012, the following Funds either borrowed from or lent to other Managers Funds: Tax Managed borrowed $1,032,942 for 5 days paying interest of $125 and US Equity borrowed varying amounts not exceeding $752,561 for 7 days paying interest of $145. The interest paid is included in the Statement of Operations as miscellaneous expense. For the same period, Global Alternatives lent varying amounts not exceeding $17,705,779 for 17 days earning interest of $2,799 and Global Essentials lent varying amounts not exceeding $6,292,237 for 14 days earning interest of $1,174. The interest amounts can be found in the Statement of Operations in interest income. For the fiscal year ended October 31, 2012, the Funds had no loans outstanding.
3. Purchases and Sales of Securities
Purchases and sales of investment securities (excluding short-term securities and U.S. Government obligations) for the fiscal year ended October 31, 2012, were as follows:
| | | | | | | | | | | | | | | | |
| | | Long-Term Securities | | | U.S. Government
Obligations | |
Fund | | Purchases | | | Sales | | | Purchases | | | Sales | |
Tax-Managed | | $ | 15,068,052 | | | $ | 19,253,096 | | | | n/a | | | | n/a | |
U.S. Equity | | | 62,682,691 | | | | 66,140,064 | | | | n/a | | | | n/a | |
Global Alternatives | | | — | | | | 38,207,243 | | | $ | 115,652,273 | | | $ | 115,690,000 | |
Global Essentials | | | 45,449,960 | | | | 23,503,604 | | | | 17,992,493 | | | | 18,000,000 | |
4. Portfolio Securities Loaned
The Funds participate in a securities lending program offered by BNYM (the “Program”), providing for the lending of securities to qualified brokers. Securities lending income include earnings of such temporary cash investments, plus or minus any rebate to a borrower. These earnings (after any rebate) are then divided between BNYM, as a fee for its services under the program, and the Funds, according to agreed-upon rates. Collateral on all securities loaned is accepted in cash and/or government securities and is maintained at a minimum level of 102% (105% in the case of certain foreign securities) of the market value, plus interest, if applicable, of investments on loan. It is the Funds’ policy to obtain additional collateral from or return excess collateral to the borrower by the end of the next business day, following the valuation date of the securities loaned. Therefore, the value of the collateral held may be temporarily less than the value of the securities on loan. Lending securities entails a risk of loss to the Funds if and to the extent that the market value of the securities loaned were to increase and the borrower did not increase the collateral accordingly, and the borrower fails to return the securities. Under the terms of the Program, each Fund is indemnified for such losses by BNYM. Each Fund bears the risk of any deficiency in the amount of the collateral available for return to the borrower due to any loss on the collateral invested. Collateral received in the form of cash is invested temporarily in the BNY Mellon Overnight Government Fund, formerly the BNY Institutional Cash Reserves Fund (the “ICRF”), or other short-term investments as defined in the Securities Lending Agreement with BNYM.
5. Commitments and Contingencies
In the normal course of business, the Funds may enter into contracts and agreements that contain a variety of representations and warranties, which provide general indemnifications. The maximum exposure to the Funds under these arrangements is unknown, as this would involve future claims that may be made against a Fund that have not yet occurred. However, based on experience the Funds have not had prior claims or losses and expect the risks of material loss to be remote.
Notes to Financial Statements (continued)
6. Forward Commitments
Certain transactions, such as futures and forward transactions, dollar roll agreements, or purchases of when-issued or delayed delivery securities may have a similar effect on the Fund’s net asset value as if the Fund had created a degree of leverage in its portfolio. However, if a Fund enters into such a transaction, the Fund will
establish a segregated account with its custodian in which it will maintain cash, U.S. government securities or other liquid securities equal in value to its obligations in respect to such transaction. Securities and other assets held in the segregated account may not be sold while the transaction is outstanding, unless other suitable assets are substituted.
7. Derivative Instruments
The following disclosures contain information on how and why the Funds use derivative instruments, the credit risk and how derivative instruments affect the Fund’s financial position, results of operations and cash flows. The location and fair value amounts of these instruments on the Statement of Assets and Liabilities and the realized and changes in unrealized gains and losses on the Statement of Operations, each categorized by type of derivative contract, are included in a table in the Notes to the Schedules of Portfolio Investments. For the fiscal year ended October 31, 2012, the average quarterly balances of outstanding derivative financial instruments were as follows:
| | | | | | | | | | | | |
| | | FQ U.S.
Equity | | | FQ Global
Alternatives Fund | | | FQ Global
Essentials Fund | |
Financial futures contracts: | | | | | | | | | | | | |
Average number of contracts purchased | | | 2 | | | | 3,062 | | | | 1,135 | |
Average number of contracts sold | | | — | | | | 5,030 | | | | — | |
Average notional value of contracts purchased | | $ | 134,650 | | | $ | 458,597,034 | | | $ | 138,332,154 | |
Average notional value of contracts sold | | | — | | | $ | 547,226,748 | | | | — | |
Foreign currency exchange contracts: | | | | | | | | | | | | |
Average number of contracts - US dollars purchased/sold | | | — | | | | 96 | | | | — | |
Average US dollar amounts purchased/sold | | | — | | | $ | 1,845,260,437 | | | | — | |
Options: | | | | | | | | | | | | |
Average number of option contracts purchased | | | 158 | | | | — | | | | — | |
Average number of option contracts written | | | 346 | | | | — | | | | — | |
Average notional value of option contracts purchased | | $ | 32,585 | | | | — | | | | — | |
Average notional value of option contracts written | | $ | 198,660 | | | | — | | | | — | |
8. Forward Foreign Currency Contracts
During the fiscal year ended October 31, 2012, Global Alternatives invested in forward foreign currency contracts to facilitate transactions in foreign securities and to hedge against foreign currency exchange rate risk on its non-U.S. dollar denominated investment securities.
A forward foreign currency contract is an agreement between a fund and another party to buy or sell a currency at a set price at a future date. The market value of the contract will fluctuate with changes in currency exchange rates. The contract is marked-to-market daily, and the change in market value is recorded as an unrealized gain or loss. Gain or loss on the purchase or sale of contracts having the same settlement date, amount and counterparty is realized on the date of offset, otherwise gain or loss is realized on the settlement date.
Risks may arise upon entering into these contracts from the potential inability of counterparties to meet the terms of their contracts and from unanticipated movements in the value of a foreign currency relative to the U.S. dollar.
9. Futures Contracts
U.S. Equity entered into equity index futures contracts with the objective of maintaining exposure to equity stock markets while maintaining liquidity. Global Essentials and Global Alternatives entered into futures contracts, including futures contracts on global equity and fixed-income securities, interest rate futures contracts, foreign currency futures contracts and futures contracts on security indices (including broad-based security indices). The Funds purchased or sold futures contracts to achieve a desired level of investment, whether to accommodate portfolio turnover or cash flows
from capital shares transactions. There are certain risks associated with futures contracts. Prices may not move as expected or a Fund may not be able to close out the contract when it desires to do so, resulting in losses.
On entering into a futures contract, either cash or securities in an amount equal to a certain percentage of the contract value (initial margin) must be deposited with the futures broker. Subsequent payments (variation margin) are made or received each day. The variation margin payments equal the daily changes in the contract value and are recorded as unrealized gains or losses. For OTC futures, daily valuation margin is not required. The Funds recognize a realized gain or loss when the contract is closed or expires equal to the difference between the value of the contract at the time it was opened and the value at the time it was closed. Futures are valued at their quoted daily settlement prices. The aggregate principal amounts of the contracts are not recorded in the financial statements. Fluctuations in the value of the contracts are recorded in the Statement of Assets and Liabilities as an asset (liability) and in the Statement of Operations as unrealized appreciation (depreciation) until the contracts are closed, when they are recorded as realized gains (losses) on futures or forward currency contracts.
10. Options
For the fiscal year ended October 31, 2012, U.S. Equity entered into over-the-counter transactions involving interest rate caps and floors, or purchased and written (sold) options to enter into such contracts, in order to manage its exposure to credit, currency, equity, interest rate and inflation risk.
A written option contract is a contract in which the writer of the option grants the buyer of the option the right to purchase from (call
Notes to Financial Statements (continued)
option) or sell to (put option) the writer a designated instrument at a specified price within a specified period of time. Options written (sold) are recorded as liabilities. When an option expires, the premium (original option value) is realized as a gain if the option was written or as a loss if the option was purchased. When the exercise of an option results in a cash settlement, the difference between the premium and the settlement proceeds is recognized as realized gain or loss. When securities are acquired or delivered upon exercise of an option, the acquisition cost or sale proceeds are adjusted by the amount of the premium. When an option is closed, the difference between the premium and the cost to close the position is realized as a gain or loss.
11. Exchange Traded Notes
Global Essentials invests in Exchange Traded Notes (“ETNs”). ETNs are senior, unsecured, unsubordinated debt securities issued by a financial institution, listed on an exchange and traded in the secondary market. There are no periodic interest payments, and principal is not protected. The Fund could lose some or all of the amount invested. The price in the secondary market is determined by supply and demand, the current performance of the index, and the credit rating of the ETN issuer. At maturity, the issuer pays the Fund a return linked to the performance of the market index, such as a commodity index, to which the ETN is linked, minus the issuer’s fee. ETNs are subject to the risk of a breakdown in the futures markets that they use. As a means to obtain commodity exposure, the Fund invests in ETNs linked to commodity indices. The Fund may be exposed to a wide variety of commodity sectors, including, without limitation, agriculture, livestock, base/industrial metals, oil, energy and precious metals. Commodity prices, and the value of stocks of companies exposed to commodities, can be extremely volatile and are affected by a wide range of factors.
12. Market, Credit and Counterparty Risks
In the normal course of business, Global Alternatives and Global Essentials invests in securities and enter into transactions where risks exist due to market fluctuations and are exposed to credit risk with parties with whom it trades (issuers or counterparties). Market prices of investments held by the Funds may fall rapidly or unpredictably and will rise and fall due to changing economic, political, or market conditions or in response to events that affect particular industries or companies. The Fund may be exposed to credit or counterparty risk, or the risk that an institution or other entity with which the Fund has unsettled or open transactions will default or not perform under the contract. The Fund minimizes credit risk and counterparty risk by undertaking transactions with a large number of customers and counterparties on recognized and reputable exchanges. The Fund could lose money if the issuer or guarantor of a fixed income security, or the counterparty to a financial derivatives contract, repurchase agreement or a loan of portfolio securities, is unable or unwilling to make timely principal and/or interest payments, or to otherwise honor its obligations.
The Funds are subject to various Master Agreements, which govern the terms of certain transactions with select counterparties. These Master Agreements reduce the counterparty risk associated with relevant transactions by specifying credit protection mechanisms and providing standardization that improves legal certainty. Master Agreements can also help limit counterparty risk by specifying collateral posting arrangements at pre-arranged exposure levels.
Under the Master Agreements, collateral is routinely transferred if the total net exposure to certain transactions (net of existing collateral already in place) governed under the relevant master agreement with a counterparty in a given account exceeds a specified threshold, which typically ranges from zero to $250,000 depending on the counterparty and the type of Master Agreement.
International Swaps and Derivatives Association, Inc. Master Agreements (“ISDA Master Agreements”) govern OTC financial derivative transactions entered into by the Funds and those counterparties. The ISDA Master Agreements maintain provisions for general obligations, representations, agreements, collateral and events of default or termination. Certain ISDA Master Agreements allow counterparties to OTC derivatives to terminate derivative contracts prior to maturity in the event the Funds’ net assets decline by a stated percentage or the Funds fail to meet the terms of the ISDA Master Agreement, which requires accelerated settlement of all outstanding transactions under the applicable ISDA Master Agreement. Any election to early terminate could be material to the financial statements.
13. New Accounting Pronouncements
In December 2011, the Financial Account Standards Board (“FASB”) issued Accounting Standards Update (“ASU”) No. 2011- 11 “Disclosures about Offsetting Assets and Liabilities.” ASU 2011-11 requires disclosures to make financial statements that are prepared under U.S. GAAP more comparable to those prepared under International Financial Reporting Standards (“IFRS”). The new disclosure requirements mandate that entities disclose both gross and net information about instruments and transactions eligible for offset in the Statement of Assets and Liabilities as well as instruments and transactions subject to an agreement similar to a master netting arrangement. In addition, ASU 2011-11 requires disclosure of collateral received and posted in connection with master netting agreements or similar arrangements. New disclosures are required for annual reporting periods beginning on or after January 1, 2013, and interim periods within those annual periods. Management is evaluating the impact of ASU 2011-11 on the financial statements and disclosures.
14. Subsequent Events
Effective November 30, 2012, Class A Shares of the Funds will no longer be available for purchase, Class A Shares will no longer charge a front-end sales load and will be renamed to Investor Class Shares. After the close of business on November 30, 2012, the Funds will begin offering Investor Class Shares for purchase.
Class C Shares of the Funds will close to all new investors and will no longer be available for purchase by existing shareholders. At the close of business on November 30, 2012, all outstanding Class C Shares of the Funds will automatically convert to a number of full and/or fractional Investor Class Shares equal in value to the shareholder’s Class C Shares of each Fund.
The Funds have determined that no material events or transactions occurred through the issuance date of the Funds’ financial statements which require additional disclosure in or adjustment of the Funds’ financial statements.
Notes to Financial Statements (continued)
Tax Information (unaudited)
Each Fund hereby designates the maximum amount allowable of its net taxable income as qualified dividends as provided in the Jobs and Growth Tax Relief Reconciliation Act of 2003. The 2011/2012 Form 1099-DIV you receive for each Fund will show the tax status of all distributions paid to you during the calendar year.
Pursuant to section 852 of the Internal Revenue Code, Managers AMG FQ Tax-Managed, Managers AMG FQ U.S. Equity, Managers
AMG FQ Global Alternatives and Managers AMG FQ Global Essentials hereby designate $0, $0, $0 and $0, respectively, as a capital gain distribution with respect to the taxable fiscal year ended October 31, 2012, or if subsequently determined to be different, the net capital gains of such fiscal year.
53
Report of Independent Registered Public Accounting Firm
To the Board of Trustees of The Managers Trust I and the Shareholders of Managers AMG FQ Tax-Managed U.S. Equity Fund, Managers AMG FQ U.S. Equity Fund, Managers AMG FQ Global Alternatives Fund and Managers AMG Global Essentials Fund:
In our opinion, the accompanying statements of assets and liabilities, including the schedules of portfolio investments, and the related statements of operations and of changes in net assets and the financial highlights present fairly, in all material respects, the financial position of Managers AMG FQ Tax-Managed U.S. Equity Fund, Managers AMG FQ U.S. Equity Fund, Managers AMG FQ Global Alternatives Fund, and Managers AMG FQ Global Essentials Fund (the “Funds”) at October 31, 2012, and the results of each of their operations, the changes in each of their net assets and the financial highlights for each of the periods indicated, in conformity with accounting principles generally accepted in the United States of America. These financial statements and financial highlights (hereafter referred to as “financial statements”) are the responsibility of the Funds’ management. Our responsibility is to express an opinion on these financial statements based on our audits. We conducted our audits of these financial statements in accordance with the standards of the Public Company Accounting Oversight Board (United States). Those standards require that we plan and perform the audit to obtain reasonable assurance about whether the financial statements are free of material misstatement. An audit includes examining, on a test basis, evidence supporting the amounts and disclosures in the financial statements, assessing the accounting principles used and significant estimates made by management, and evaluating the overall financial statement presentation. We believe that our audits, which included confirmation of securities at October 31, 2012 by correspondence with the custodian, brokers and the application of alternative auditing procedures where securities purchased had not been received, provide a reasonable basis for our opinion.
PricewaterhouseCoopers LLP
Boston, Massachusetts
December 27, 2012
54
Trustees and Officers
The Trustees and Officers of the Trust, their business addresses, principal occupations for the past five years and dates of birth are listed below. The Trustees provide broad supervision over the affairs of the Trust and the Funds. The Trustees are experienced executives who meet periodically throughout the year to oversee the Funds’ activities, review contractual arrangements with companies that provide services to the Funds, and review the Funds’ performance. Unless otherwise noted, the address of each Trustee or Officer is the address of the Trust: 800 Connecticut Avenue, Norwalk, Connecticut 06854.
There is no stated term of office for Trustees. Trustees serve until their resignation, retirement or removal in accordance with the Trust’s organizational documents and policies adopted by the Board from time to time. The Chairman of the Trustees, President, Treasurer and Secretary of the Trust are elected by the Trustees annually. Other officers hold office at the pleasure of the Trustees.
Independent Trustees
The following Trustees are not “interested persons” of the Trust within the meaning of the 1940 Act:
| | |
Name, Date of Birth, Number of Funds Overseen in Fund Complex* | | Principal Occupation(s) During Past
5 Years and Other Directorships Held by
Trustee |
Jack W. Aber, 9/9/37 • Trustee since 2000 • Oversees 38 Funds in Fund Complex | | Professor of Finance, Boston University School of Management (1972-Present); Trustee of Appleton Growth Fund (1 portfolio); Trustee of Third Avenue Trust (5 portfolios); Trustee of Third Avenue Variable Trust (1 portfolio); Trustee of Aston Funds (26 portfolios). |
Bruce B. Bingham, 12/01/48 • Trustee since 2012 • Oversees 38 Funds in Fund Complex | | Partner, Hamilton Partners (real estate development firm)(1987-Present). |
William E. Chapman, II, 9/23/41 • Independent Chairman • Trustee since 2000 • Oversees 38 Funds in Fund Complex | | President and Owner, Longboat Retirement Planning Solutions (1998-Present); Hewitt Associates, LLC (part time) (provider of Retirement and Investment Education Seminars) (2002-2009); Trustee of Bowdoin College (2002-Present); Director of Harding, Loevner Funds, Inc. (6 portfolios); Trustee of Third Avenue Trust (5 portfolios); Trustee of Third Avenue Variable Trust (1 portfolio); Trustee of Aston Funds (26 portfolios). |
Edward J. Kaier, 9/23/45 • Trustee since 2000 • Oversees 38 Funds in Fund Complex | | Attorney at Law and Partner, Teeters Harvey Gilboy & Kaier LLP (2007-Present); Attorney at Law and Partner, Hepburn Willcox Hamilton & Putnam, LLP (1977-2007); Trustee of Third Avenue Trust (5 portfolios); Trustee of Third Avenue Variable Trust (1 portfolio); Trustee of Aston Funds (26 portfolios). |
Steven J. Paggioli, 4/3/50 • Trustee since 2000 • Oversees 38 Funds in Fund Complex | | Independent Consultant (2002-Present); Formerly Executive Vice President and Director, The Wadsworth Group (1986-2001); Executive Vice President, Secretary and Director, Investment Company Administration, LLC (1990-2001); Vice President, Secretary and Director, First Fund Distributors, Inc. (1991-2001); Trustee, Professionally Managed Portfolios (43 portfolios); Advisory Board Member, Sustainable Growth Advisors, LP; Independent Director, Chase Investment Counsel (2008 – Present); Trustee of Aston Funds (26 portfolios). |
Eric Rakowski, 6/5/58 • Trustee since 2000 • Oversees 38 Funds in Fund Complex | | Professor, University of California at Berkeley School of Law (1990-Present); Director of Harding, Loevner Funds, Inc. (6 portfolios); Trustee of Third Avenue Trust (5 portfolios); Trustee of Third Avenue Variable Trust (1 portfolio); Trustee of Aston Funds (26 portfolios). |
Thomas R. Schneeweis, 5/10/47 • Trustee since 2000 • Oversees 38 Funds in Fund Complex | | Professor of Finance, University of Massachusetts (1977-Present); Director, CISDM at the University of Massachusetts, (1996-Present); President, Alternative Investment Analytics, LLC, (formerly Schneeweis Partners, LLC) (2001-Present); Partner, S Capital Management, LLC (2007-Present); President, TRS Associates (1982-Present); Partner, White Bear Partners, LLC (2007-2010); Partner, Northampton Capital Management, LLC (2004-2010); Trustee of Aston Funds (26 portfolios). |
| * | The Fund Complex consists of Managers AMG Funds, The Managers Funds, Managers Trust I and Managers Trust II. |
Interested Trustees
Each Trustee in the following table is an “interested person” of the Trust within the meaning of the 1940 Act. Ms. Carsman is an interested person of the Trust within the meaning of the 1940 Act by virtue of her position with, and interest in securities of, AMG, and her former position as Chief Legal Officer of the Trust.
| | |
Name, Date of Birth, Number of Funds Overseen in Fund Complex* | | Principal Occupation(s) During Past
5 Years and Other Directorships Held by
Trustee |
Christine C. Carsman, 4/2/52 • Trustee since 2011 • Oversees 38 Funds in Fund Complex | | Deputy General Counsel, Affiliated Managers Group, Inc. (2011-Present); Senior Vice President and Chief Regulatory Counsel, Affiliated Managers Group, Inc. (2004-Present); Secretary and Chief Legal Officer, Managers AMG Funds, The Managers Funds, Managers Trust I and Managers Trust II (2004-2011); Senior Counsel, Vice President and Director of Operational Risk Management and Compliance, Wellington Management Company, LLP (1995-2004). |
Officers
| | |
Name, Date of Birth, Position(s) Held with Fund and Length of Time Served | | Principal Occupation(s) During Past 5 Years |
Keitha L. Kinne, 5/16/58 • President since 2012 • Chief Operating Officer since 2007 | | Managing Partner and Chief Operating Officer, Managers Investment Group LLC (2007-Present); Chief Operating Officer, The Managers Funds, Managers AMG Funds and Managers Trust II (2007-Present); Chief Investment Officer, Managers Investment Group LLC (2008-Present); President, Managers Distributors, Inc. (2012-Present); Managing Director, Legg Mason & Co., LLC (2006-2007); Managing Director, Citigroup Asset Management (2004-2006). |
Lewis Collins, 2/22/66 • Secretary since 2011 • Chief Legal Officer since 2011 | | Senior Vice President and Senior Counsel, Affiliated Managers Group, Inc. (2010-Present); Vice President and Senior Counsel, Affiliated Managers Group, Inc. (2006-2010); Senior Counsel, Affiliated Managers Group, Inc. (2002-2006); Attorney, Ropes & Gray LLP (1998-2002). |
Donald S. Rumery, 5/29/58 • Chief Financial Officer since 2007 • Treasurer since 2000 | | Senior Vice President, Managers Investment Group LLC (2005-Present); Treasurer and Chief Financial Officer, Managers Distributors, Inc. (2000-Present); Treasurer, The Managers Funds (1995-Present); Treasurer, Managers AMG Funds (1999-Present); Treasurer, Managers Trust II (2000-Present); Chief Financial Officer, The Managers Funds, Managers AMG Funds and Managers Trust II (2007-Present); Vice President, The Managers Funds LLC, (1994-2004). |
John J. Ferencz, 3/09/62 • Chief Compliance Officer since 2010 | | Vice President, Legal and Compliance, Managers Investment Group LLC (2010-Present); Senior Compliance Analyst, Mutual Funds and Regulatory, GE Asset Management Incorporated (2005-2010). |
Michael S. Ponder, 9/12/73 • Assistant Secretary since 2011 | | Senior Vice President and Counsel, Managers Investment Group LLC (2011-Present); Attorney, DeNovo Legal (2009-2010); Vice President, Credit Suisse (2007-2009); Associate, Willkie Farr & Gallagher LLP (2006-2007). |
55
Annual Renewal of Investment Advisory and Sub-Advisory Agreements
On June 21-22, 2012, the Board of Trustees, including a majority of the Trustees who are not “interested persons” of the Trust (the “Independent Trustees”), approved the Investment Management Agreement with the Investment Manager for each of the Managers AMG FQ U.S. Equity Fund, Managers AMG FQ Tax-Managed U.S. Equity Fund, Managers AMG FQ Global Alternatives Fund and Managers AMG FQ Global Essentials Fund (each a “Fund”) and the Subadvisory Agreement with respect to each Fund. The Independent Trustees were separately represented by independent counsel in connection with their consideration of the approval of these agreements. In considering the Investment Management and Subadvisory Agreements, the Trustees reviewed a variety of materials relating to each Fund, the Investment Manager and the Subadvisor, including comparative performance, fee and expense information for an appropriate peer group of similar mutual funds for each Fund (each a “Peer Group”), performance information for the relevant benchmark index for each Fund (each a “Fund Benchmark”) and, with respect to the Subadvisor, comparative performance information for an appropriate peer group of managed accounts, and, as to all other matters, other information provided to them on a periodic basis throughout the year, as well as information provided in connection with the meetings of June 21-22, 2012, regarding the nature, extent and quality of services provided by the Investment Manager and the Subadvisor under their respective agreements. Prior to voting, the Independent Trustees: (a) reviewed the foregoing information with their independent legal counsel and with management; (b) received materials from their independent legal counsel discussing the legal standards applicable to their consideration of the Investment Management and Subadvisory Agreements; and (c) met with their independent legal counsel in private sessions at which no representatives of management were present.
Nature, extent and quality of services.
In considering the nature, extent and quality of the services provided by the Investment Manager, the Trustees reviewed information relating to the Investment Manager’s operations and personnel. Among other things, the Investment Manager provided financial information, biographical information on its supervisory and professional staff and descriptions of its organizational and management structure. The Trustees also took into account information provided periodically throughout the previous year by the Investment Manager relating to the performance of its duties with respect to the Funds and the Trustees’ familiarity with the Investment Manager’s management through Board meetings, discussions and reports. In the course of their deliberations regarding the Investment Management Agreement, the Trustees evaluated, among other things: (a) the extent and quality of the Investment Manager’s oversight of the operation and management of the Funds; (b) the quality of the Investment Manager’s oversight of the performance by the Subadvisor of its portfolio management duties; (c) the Investment Manager’s ability to supervise the Funds’ other service providers; and (d) the Investment Manager’s compliance program. The Trustees also took into account the financial condition of the Investment Manager with respect to its ability to provide the services required under the Investment Management Agreement and the Investment Manager’s undertaking to maintain contractual expense limitations for the Funds. The Trustees also considered the Investment Manager’s risk management processes.
The Trustees also reviewed information relating to the Subadvisor’s financial condition, operations and personnel and the investment philosophy, strategies and techniques (its “Investment Strategy”) used in managing each Fund. Among other things, the Trustees reviewed biographical information on portfolio management and other professional staff, information regarding the Subadvisor’s organizational and management structure and the Subadvisor’s brokerage policies and practices. The Trustees considered specific information provided regarding the experience of the individuals at the Subadvisor with portfolio management responsibility for the Funds, including the information set forth in each Fund’s prospectus and statement of additional information. In the course of their deliberations, the Trustees evaluated, among other things: (a) the services rendered by the Subadvisor in the past; (b) the qualifications and experience of the Subadvisor’s personnel; and (c) the Subadvisor’s compliance program. The Trustees also took into account the financial condition of the Subadvisor with respect to its ability to provide the services required under each Subadvisory Agreement. The Trustees also considered the Subadvisor’s risk management processes.
Performance.
With respect to the Managers AMG FQ U.S. Equity Fund, among other information related to the Fund’s performance, the Trustees noted that the Fund’s performance for Institutional Class shares for the 1-year, 3-year, 5-year and 10-year periods ended March 31, 2012 was above, above, below and above, respectively, the median performance of the Peer Group and above, below, below and above, respectively, the performance of the Fund Benchmark, the Russell 3000® Index. The Trustees took into account management’s discussion of the Fund’s improved more recent performance, noting that the Fund performed in the top quintile relative to the Peer Group for the 1-year period. The Trustees concluded that the Fund’s overall performance has been satisfactory in light of all factors considered.
With respect to the Managers AMG FQ Tax-Managed U.S. Equity Fund, among other information related to the Fund’s performance, the Trustees noted that the Fund’s performance for Institutional Class shares for the 1-year, 3-year, 5-year and 10-year periods ended March 31, 2012 was above, above, below and above, respectively, the median performance of the Peer Group and above, above, below and above, respectively, the performance of the Fund Benchmark, the Russell 3000® Index. The Trustees also took into account management’s
56
Annual Renewal of Investment Advisory and Sub-Advisory Agreements (continued)
discussion of the Fund’s performance, including the Fund’s improved more recent performance. The Trustees concluded that the Fund’s overall performance has been satisfactory in light of all factors considered.
With respect to the Managers AMG FQ Global Alternatives Fund, among other information related to the Fund’s performance, the Trustees noted that the Fund’s performance for Class A shares for the 1-year, 3-year and 5-year periods ended March 31, 2012 was below, below and above, respectively, the median performance of the Peer Group and below the performance of the Fund Benchmark, the Citigroup 1-Month Treasury Bill Index. The Trustees took into account management’s discussion of the Fund’s performance. The Trustees also took into account the impact of the Fund’s strategy on performance over the last 12 months. The Trustees concluded that the Fund’s overall performance has been satisfactory in light of all factors considered.
With respect to the Managers AMG FQ Global Essentials Fund, among other information related to the Fund’s performance, the Trustees noted that the Fund’s performance for Institutional Class shares for the 1-year, 3-year, 5-year and 10-year periods ended March 31, 2012 was above, above, below and below, respectively, the median performance of the Peer Group and above the performance of the Fund Benchmark, a Composite Index (60% MSCI World Index and 40% Citigroup World Government Bond Index (Hedged)). The Trustees took into account management’s discussion of the Fund’s more recent performance, including the fact that the Fund had strong performance relative to the Fund Benchmark during the past year. The Trustees further noted that First Quadrant, L.P. has been the sole Subadvisor to the Fund since 2009, during which time the Subadvisor has performed in the top decile relative to the Peer Group. The Trustees concluded that the Fund’s overall performance has been satisfactory in light of all factors considered.
As noted above, the Board considered each Fund’s net performance during relevant time periods as compared to the Fund’s Peer Group and Fund Benchmark and considered the Subadvisor’s performance as compared to an appropriate peer group of managed accounts and also considered the gross performance of the Fund as compared to the Subadvisor’s relevant performance composite that utilizes the same investment strategy and approach and noted that the Board reviews on a quarterly basis detailed information about each Fund’s performance results and portfolio composition as well as the Subadvisor’s Investment Strategy. The Board noted the Investment Manager’s expertise and resources in monitoring the performance, investment style and risk-adjusted performance of the Subadvisor. The Board was mindful of the Investment Manager’s attention to monitoring the Subadvisor’s performance with respect to the Funds and its discussions with management regarding the factors that contributed to the performance of the Funds.
Advisory and Sub-Advisory Fees and Profitability.
In considering the reasonableness of the advisory fee payable to the Investment Manager and the subadvisory fee payable by the Investment Manager to the Subadvisor, the Trustees reviewed information provided by the Investment Manager setting forth all revenues and other benefits, both direct and indirect (including any so-called “fallout benefits” such as reputational value derived from the Investment Manager serving as Investment Manager to a Fund), received by the Investment Manager and its affiliates attributable to managing each Fund and all the mutual funds in the Managers Family of Funds, the cost of providing such services and the resulting profitability to the Investment Manager and its affiliates from these relationships. The Trustees noted that the Investment Manager and the Subadvisor are affiliated and that, in the case of the Managers AMG FQ Tax-Managed U.S. Equity Fund and the Managers AMG FQ U.S. Equity Fund, the Investment Manager pays the Subadvisor a subadvisory fee that is equal to the advisory fee that it receives from the Fund. The Trustees also noted management’s discussion of the current asset levels of the Funds, including the effect on assets attributable to the economic and market conditions since 2008, and considered the impact on profitability of the current asset levels and any future growth of assets of the Funds.
In considering the cost of services to be provided by the Investment Manager under the Investment Management Agreement and the profitability to the Investment Manager of its relationship with the Funds, the Trustees noted the current asset level of the Funds and the undertaking by the Investment Manager to maintain contractual expense limitations for the Funds. The Board also took into account management’s discussion of the current advisory fee structure. Based on the foregoing, the Trustees concluded that the profitability to the Investment Manager is reasonable and that the Investment Manager is not realizing material benefits from economies of scale that would warrant adjustments to the advisory fee at this time. Also with respect to economies of scale, the Trustees noted that as a Fund’s assets increase over time, the Fund may realize other economies of scale to the extent the increase in assets is proportionally greater than the increase in certain other expenses.
In considering the reasonableness of the subadvisory fees payable by the Investment Manager to the Subadvisor, the Trustees reviewed information provided by the Subadvisor regarding the cost of providing subadvisory services to each of the Funds and the resulting profitability to the Subadvisor from these relationships and noted that, because the Subadvisor is an affiliate of the Investment Manager, such profitability might be directly or indirectly shared by the Investment Manager.
In considering the cost of services to be provided by the Subadvisor under the Subadvisory Agreements and the profitability to the Subadvisor of its relationship with the Funds, the Trustees noted the current asset level of each Fund and the undertaking by the Investment Manager to
57
Annual Renewal of Investment Advisory and Sub-Advisory Agreements (continued)
maintain contractual expense limitations for the Funds. The Trustees also noted that the subadvisory fees are paid by the Investment Manager out of its advisory fee. As a consequence, the cost of services to be provided by the Subadvisor and the profitability to the Subadvisor of its relationship with each Fund were not material factors in the Trustees’ deliberations at this time. For similar reasons, the Trustees did not consider potential economies of scale in the management of the Funds by the Subadvisor to be a material factor in their considerations at this time.
With respect to the Managers AMG FQ U.S. Equity Fund, the Trustees noted that the Fund’s advisory fees (which include both the advisory and administration fee) and total expenses (net of applicable expense waivers/reimbursements) as of March 31, 2012 were both lower than the average for the Fund’s Peer Group. The Trustees took into account the fact that the Investment Manager has contractually agreed, through March 1, 2013, to limit the Fund’s net annual operating expenses (subject to certain excluded expenses) to 0.79%. The Trustees concluded that, in light of the nature, extent and quality of the services provided by the Investment Manager and the Subadvisor (which is an affiliate of the Investment Manager), the foregoing expense limitation and the considerations noted above with respect to the Subadvisor and the Investment Manager, the Fund’s advisory fees, including subadvisory fees, are reasonable. With respect to the Managers AMG FQ Tax-Managed U.S. Equity Fund, the Trustees noted that the Fund’s advisory fee and total expenses (net of applicable expense waivers/ reimbursements) as of March 31, 2012 were higher than and equal to, respectively, the average for the Fund’s Peer Group. The Trustees took into account the fact that the Investment Manager has contractually agreed, through March 1, 2013, to limit the Fund’s net annual operating expenses (subject to certain excluded expenses) to 0.99%. The Board also took into account management’s discussion of the Fund’s expenses and the current size of the Fund. The Board also considered the differences in the Fund’s investment strategy relative to its Peer Group. The Trustees concluded that, in light of the nature, extent and quality of the services provided by the Investment Manager and the Subadvisor (which is an affiliate of the Investment Manager), the foregoing expense limitation and the considerations noted above with respect to the Subadvisor and the Investment Manager, the Fund’s advisory fees, including subadvisory fees, are reasonable.
With respect to the Managers AMG FQ Global Alternatives Fund, the Trustees noted that the Fund’s advisory fees (which include both the advisory and administration fee) and total expenses (net of applicable expense waivers/reimbursements) as of March 31, 2012 were both higher than the average for the Fund’s Peer Group. The Trustees took into account the fact that the Investment Manager has contractually agreed, through at least March 1, 2013, to limit the Fund’s net annual operating expenses (subject to certain excluded expenses) to 1.49%. The Trustees took into account management’s discussion of the Fund’s expenses and distinct investment strategy. The Trustees concluded that, in light of the nature, extent and quality of the services to be provided by the Investment Manager and the Subadvisor (which is an affiliate of the Investment Manager), the foregoing expense limitation and the considerations noted above with respect to the Subadvisor and the Investment Manager, the Fund’s advisory fees, including subadvisory fees, are reasonable.
With respect to the Managers AMG FQ Global Essentials Fund, the Trustees noted that the Fund’s advisory fees (which include both the advisory and administration fee) and total expenses (net of applicable expense waivers/reimbursements) as of March 31, 2012 were both lower than the average for the Fund’s Peer Group. The Trustees took into account the fact that the Investment Manager has contractually agreed to lower the Fund’s contractual expense limitation from 0.99% to 0.89% of the Fund’s net annual operating expenses (subject to certain excluded expenses) effective July 1, 2012 through at least March 1, 2014. The Trustees concluded that, in light of the nature, extent and quality of the services provided by the Investment Manager and the Subadvisor (which is an affiliate of the Investment Manager), the foregoing expense limitation and the considerations noted above with respect to the Subadvisor and the Investment Manager, the Fund’s advisory fees, including subadvisory fees, are reasonable.
****
After consideration of the foregoing, the Trustees also reached the following conclusions (in addition to the conclusions discussed above) regarding the Investment Management and Subadvisory Agreements: (a) the Investment Manager has demonstrated that it possesses the resources and capability to perform its duties under the Investment Management Agreement; (b) the Subadvisor has the resources to perform its duties under the Subadvisory Agreements and is qualified to manage each Fund’s assets in accordance with its investment objectives and policies; and (c) the Investment Manager and Subadvisor maintain appropriate compliance programs.
Based on all of the above-mentioned factors and their related conclusions, with no single factor or conclusion being determinative and with each Trustee not necessarily attributing the same weight to each factor, the Trustees concluded that approval of the Investment Management Agreement and each Subadvisory Agreement would be in the best interests of the applicable Fund and its shareholders. Accordingly, on June 21-22, 2012, the Trustees, including a majority of the Independent Trustees, voted to approve the Investment Management Agreement and the Subadvisory Agreements (as applicable) for each Fund.
58
THIS PAGE INTENTIONALLY LEFT BLANK
Investment Manager and Administrator
Managers Investment Group LLC
800 Connecticut Avenue
Norwalk, CT 06854
(800) 835-3879
Distributor
Managers Distributors, Inc.
800 Connecticut Avenue
Norwalk, CT 06854
(800) 835-3879
Subadvisor
First Quadrant, L.P.
800 E. Colorado Boulevard, Suite 900
Pasadena, CA 91101
Custodian
The Bank of New York Mellon
2 Hanson Place
Brooklyn, NY 11217
Legal Counsel
Ropes & Gray LLP
Prudential Tower, 800 Boylston Street
Boston, MA 02199-3600
Transfer Agent
BNY Mellon Investment Servicing (US) Inc.
Attn: Managers
P.O. Box 9769
Providence, RI 02940
(800) 548-4539
For ManagersChoice™ Only
Managers
c/o BNY Mellon Investment Servicing (US) Inc.
P.O. Box 9847
Providence, Rhode Island 02940-8047
(800) 358-7668

MANAGERSAND MANAGERS AMG FUNDS
| | | | |
EQUITY FUNDS | | BALANCED FUNDS |
| CADENCE CAPITAL APPRECIATION | | REAL ESTATE SECURITIES | | CHICAGO EQUITY PARTNERS BALANCED |
| CADENCE MID-CAP | | Urdang Securities Management, Inc. | | Chicago Equity Partners, LLC |
| CADENCE EMERGING COMPANIES | | | | |
| Cadence Capital Management, LLC | | RENAISSANCE LARGE CAP GROWTH | | ALTERNATIVE FUNDS |
| | Renaissance Group LLC | | FQ GLOBAL ALTERNATIVES |
| ESSEX SMALL/MICRO CAP GROWTH | | | | FQ GLOBAL ESSENTIALS |
| Essex Investment Management Co., LLC | | SKYLINE SPECIAL EQUITIES | | First Quadrant, L.P. |
| | PORTFOLIO | | |
| FQ TAX-MANAGED U.S. EQUITY | | Skyline Asset Management, L.P. | | INCOME FUNDS |
| FQ U.S. EQUITY | | | | BOND (MANAGERS) |
| First Quadrant, L.P. | | SPECIAL EQUITY | | GLOBAL INCOME OPPORTUNITY |
| | Ranger Investment Management, L.P. | | Loomis, Sayles & Co., L.P. |
| FRONTIER SMALL CAP GROWTH | | Lord, Abbett & Co. LLC | | |
| Frontier Capital Management Company, LLC | | Smith Asset Management Group, L.P. | | BOND (MANAGERS PIMCO) |
| | Federated MDTA LLC | | Pacific Investment Management Co. LLC |
| GW&K SMALL CAP EQUITY | | | | |
| Gannett Welsh & Kotler, LLC | | SYSTEMATIC VALUE | | CALIFORNIA INTERMEDIATE TAX-FREE |
| | SYSTEMATIC MID CAP VALUE | | Miller Tabak Asset Management LLC |
| MICRO-CAP | | Systematic Financial Management, L.P. | | |
| Lord, Abbett & Co. LLC | | | | GW&K MUNICIPAL BOND |
| WEDGE Capital Management L.L.P. | | TIMESSQUARE MID CAP GROWTH | | GW&K FIXED INCOME FUND |
| Next Century Growth Investors LLC | | TIMESSQUARE SMALL CAP GROWTH | | GW&K MUNICIPAL ENHANCED YIELD |
| RBC Global Asset Management (U.S.) Inc. | | TSCM GROWTH EQUITY | | BOND |
| | TimesSquare Capital Management, LLC | | Gannett Welsh & Kotler, LLC |
| | | | |
| | TRILOGY GLOBAL EQUITY | | HIGH YIELD |
| | TRILOGY EMERGING MARKETS EQUITY | | J.P. Morgan Investment Management LLC |
| | TRILOGY INTERNATIONAL SMALL CAP | | |
| | Trilogy Global Advisors, L.P. | | INTERMEDIATE DURATION GOVERNMENT |
| | | | SHORT DURATION GOVERNMENT |
| | YACKTMAN FUND | | Smith Breeden Associates, Inc. |
| | YACKTMAN FOCUSED FUND | | |
| | Yacktman Asset Management L.P. | | |
| |
This report is prepared for the Fund’s shareholders. It is authorized for distribution to prospective investors only when preceded or accompanied by an effective prospectus. To receive a free copy of the prospectus or Statement of Additional Information, which includes additional information about Fund Trustees, please contact us by calling 800.835.3879. Distributed by Managers Distributors, Inc., member FINRA. A description of the policies and procedures each Fund uses to vote its proxies is available: (i) without charge, upon request, by calling 800.835.3879, or (ii) on the Securities and Exchange Commission’s (SEC) Web site at www.sec.gov. For information regarding each Fund’s proxy voting record for the 12-month period ended June 30, call 800.835.3879 or visit the SEC Web site at www.sec.gov. The Fund files its complete schedule of portfolio holdings with the SEC for the first and third quarters of each fiscal year on Form N-Q. The Funds’ Forms N-Q are available on the SEC’s Web site at www.sec.gov. A Fund’s Forms N-Q may be reviewed and copied at the SEC’s Public Reference Room in Washington, DC. Information on the operation of the Public Reference Room may be obtained by calling 800.SEC.0330. To review a complete list of the Fund’s portfolio holdings, or to view the most recent quarterly holdings report, semiannual report, or annual report, please visit www.managersinvest.com. | |  |

ANNUAL REPORT
Managers Funds
October 31, 2012
Managers Frontier Small Cap Growth Fund
Managers AMG TSCM Growth Equity Fund
Managers Micro-Cap Fund
Managers Real Estate Securities Fund
Managers California Intermediate Tax-Free Fund

AR022-1012
Managers Funds
Annual Report – October 31, 2012
| | | | |
| TABLE OF CONTENTS | | Page | |
| |
LETTER TO SHAREHOLDERS | | | 1 | |
| |
ABOUT YOUR FUND’S EXPENSES | | | 4 | |
| |
INVESTMENT MANAGER’S COMMENTS, FUND SNAPSHOTS, AND SCHEDULES OF PORTFOLIO INVESTMENTS | | | | |
| |
Managers Frontier Small Cap Growth Fund | | | 5 | |
| |
Managers AMG TSCM Growth Equity Fund | | | 11 | |
| |
Managers Micro-Cap Fund | | | 17 | |
| |
Managers Real Estate Securities Fund | | | 25 | |
| |
Managers California Intermediate Tax-Free Fund | | | 30 | |
| |
NOTES TO SCHEDULES OF PORTFOLIO INVESTMENTS | | | 39 | |
| |
FINANCIAL STATEMENTS | | | | |
| |
Statement of Assets and Liabilities | | | 41 | |
Balance sheets, net asset value (NAV) per share computations and cumulative undistributed amounts | | | | |
| |
Statement of Operations | | | 43 | |
Detail of sources of income, expenses, and realized and unrealized gains (losses) during the fiscal year | | | | |
| |
Statements of Changes in Net Assets | | | 44 | |
Detail of changes in assets for the past two fiscal years | | | | |
| |
FINANCIAL HIGHLIGHTS | | | 46 | |
Historical net asset values per share, distributions, total returns, income and expense ratios, turnover ratios and net assets | | | | |
| |
NOTES TO FINANCIAL STATEMENTS | | | 53 | |
Accounting and distribution policies, details of agreements and transactions with Fund management and affiliates, and descriptions of certain investment risks | | | | |
| |
REPORT OF INDEPENDENT REGISTERED PUBLIC ACCOUNTING FIRM | | | 62 | |
| |
TRUSTEES AND OFFICERS | | | 63 | |
| |
ANNUAL RENEWAL OF INVESTMENT ADVISORY AND SUBADVISORY AGREEMENTS | | | 64 | |
Nothing contained herein is to be considered an offer, sale or solicitation of an offer to buy shares of any series of the Managers Family of Funds. Such offering is made only by Prospectus, which includes details as to offering price and other material information.
Letter to Shareholders
Dear Shareholder:
Our foremost goal at Managers Investment Group (“MIG”) is to structure and manage mutual funds that will help our shareholders and clients successfully reach their investment goals and objectives.
Each of our Funds is geared to provide you with exposure to a specific asset class or style of investing. We believe investors tend to use our Funds as part of their broader portfolio in order to tailor their asset allocation to meet their individual needs. Most of our Funds, like those detailed in this report, are therefore designed to be building blocks.
At MIG, we have overall responsibility for the investment management and administration of the Funds. As a “manager of managers,” we work with external investment managers that make the day-to-day investment decisions in the Funds (the “Portfolio Managers”). In this role, we perform many activities to monitor the ongoing investment, compliance, and administrative aspects of all of the Funds, which we believe gives our shareholders added confidence in their investments.
Our parent company, Affiliated Managers Group (“AMG”) is a global asset management company with ownership interests in a diverse group of boutique investment management firms (its “Affiliates”). MIG has the unique opportunity to access the investment skills and acumen of some of AMG’s Affiliates. The set of our Funds managed by these proprietary firms also benefits from our activities to monitor the investment, compliance, and administrative aspects of the Funds.
Below is a brief overview of the securities markets and the performance results for the Funds. Following this letter, we also provide the Portfolio Managers’ discussion of their investment management approach, performance results, and market outlook.
Both global equities and bonds posted solid gains for the prior 12 months despite several significant macroeconomic headwinds that have threatened to pull the global economy into another recession. At the start of this period, sentiment improved as investors shrugged off the elevated risk of the European sovereign debt crisis and impending global economic slowdown and risk-based assets generally outperformed during this period. The mood changed, however, heading into the spring months as the spotlight returned to Euro Zone’s debt debacle and Greek elections, which skirted possible disaster when the pro-bailout party won the majority vote. For a short period, investors fled risk-based assets and sought the safety of U.S. Treasuries and other assets perceived as higher quality. This reversed somewhat during the quiet summer months and equity markets moved higher on modestly improving economic fundamentals and lower volatility. The Fed announced additional monetary easing during September which provided a tailwind for equities. Leading into the November elections, risk aversion began to creep back into the global markets amid pessimism that the U.S. debt problems, dubbed the “fiscal cliff,” would threaten to derail economic growth in 2013.
Against this backdrop, the Managers Frontier Small Cap Growth Fund, Managers Micro-Cap Fund, Managers Real Estate Securities Fund, Managers California Intermediate Tax-Free Fund and the Managers AMG TSCM Growth Equity Fund (each a “Fund” and collectively the “Funds”), posted positive absolute returns, as detailed below. Please note that some funds have multiple share classes, and for these funds the performance shown only reflects the share class indicated.
1
Letter to Shareholders (continued)
| | | | | | | | | | | | | | | | | | | | | | | | | | | | |
Periods Ended 10/31/2012 | | Six Months | | | One Year | | | Three Years | | | Five Years | | | Ten Years | | | Since Inception | | | Inception Date | |
Managers Frontier Small Cap Growth Fund | | | | | | | | | | | | | | | | | | | | | | | | | | | | |
Investor Class | | | (4.08 | )% | | | 5.08 | % | | | — | | | | — | | | | — | | | | 9.26 | % | | | 1/1/2010 | |
Service Class | | | (4.01 | )% | | | 5.29 | % | | | 12.13 | % | | | 1.15 | % | | | 9.46 | % | | | 5.87 | % | | | 9/24/1997 | |
Institutional Class | | | (3.89 | )% | | | 5.60 | % | | | — | | | | — | | | | — | | | | 9.73 | % | | | 1/1/2010 | |
Russell 2000® Growth Index | | | (0.80 | )% | | | 9.70 | % | | | 15.74 | % | | | 1.41 | % | | | 9.66 | % | | | 3.26 | % | | | | |
| | | | | | | | | | | | | | | | | | | | | | | | | | | | | |
Managers AMG TSCM Growth Equity Fund | | | | | | | | | | | | | | | | | | | | | | | | | | | | |
Investor Class | | | (0.31 | )% | | | 15.70 | % | | | — | | | | — | | | | — | | | | 11.39 | % | | | 7/30/2010 | |
Service Class | | | (0.16 | )% | | | 15.93 | % | | | — | | | | — | | | | — | | | | 11.88 | % | | | 7/30/2010 | |
Institutional Class | | | (0.08 | )% | | | 16.26 | % | | | — | | | | — | | | | — | | | | 11.86 | % | | | 7/30/2010 | |
Russell 3000® Growth Index | | | (0.96 | )% | | | 12.76 | % | | | 14.24 | % | | | 1.90 | % | | | 7.32 | % | | | 14.95 | % | | | | |
| | | | | | | | | | | | | | | | | | | | | | | | | | | | | |
Managers Micro-Cap Fund | | | | | | | | | | | | | | | | | | | | | | | | | | | | |
Service Class | | | (1.74 | )% | | | 11.55 | % | | | 15.20 | % | | | 0.57 | % | | | 8.87 | % | | | 12.32 | % | | | 6/30/1994 | |
Institutional Class | | | (1.48 | )% | | | 11.84 | % | | | — | | | | — | | | | — | | | | — | | | | 10/1/2011 | |
Russell Microcap® Index | | | 2.07 | % | | | 16.49 | % | | | 14.16 | % | | | (1.05 | )% | | | 8.63 | % | | | | | | | | |
| | | | | | | | | | | | | | | | | | | | | | | | | | | | | |
Managers Real Estate Securities Fund | | | (1.23 | )% | | | 13.43 | % | | | 22.09 | % | | | 3.28 | % | | | 12.84 | % | | | 8.64 | % | | | 12/31/1997 | |
Dow Jones U.S. Select REIT Index | | | (0.58 | )% | | | 14.09 | % | | | 22.03 | % | | | 1.19 | % | | | 11.79 | % | | | | | | | | |
S&P 500 Index | | | 2.16 | % | | | 15.21 | % | | | 13.21 | % | | | 0.36 | % | | | 6.91 | % | | | | | | | | |
| | | | | | | | | | | | | | | | | | | | | | | | | | | | | |
Managers California Intermediate Tax-Free Fund | | | 2.70 | % | | | 8.27 | % | | | 5.97 | % | | | 4.95 | % | | | 4.48 | % | | | 5.30 | % | | | 11/16/1990 | |
Barclays U.S. Municipal Bond: 5 Year Index | | | 1.82 | % | | | 5.42 | % | | | 5.11 | % | | | 5.65 | % | | | 4.48 | % | | | | | | | | |
| | | | | | | | | | | | | | | | | | | | | | | | | | | | | |
For the 12 months ended October 31, 2012, Managers Frontier Small Cap Growth Fund Service Class returned 5.3%, compared to 9.7% for the Russell 2000® Growth Index. As a result of Frontier’s bottom up investment approach, the Fund’s underperformance can be primarily attributed to weak stock selection. The Fund’s holdings in the information technology sector detracted the most. These stocks were particularly hurt by the slowdown in Europe, which is a large end market for many U.S. technology companies. Partially offsetting the weak performance from technology stocks was the Fund’s holdings in the financials and industrials sector, which performed the best relative to the benchmark.
For the 12 months ended October 31, 2012, Managers California Intermediate Tax-Free Fund returned 8.3%, compared to 5.4% for the Barclays Capital 5-Year Municipal Bond Index. The Fund’s outperformance can be primarily attributed to the Fund’s longer duration positioning relative to the Index as interest rates generally fell during the year. The Federal Reserve’s highly accommodative interest rate policy during the fiscal year was the main driver of performance as investors continued to pour money into the asset class looking for higher levels of overall income.
For the 12 months ended October 31, 2012, Managers AMG TSCM Growth Equity Fund Institutional Class returned 16.3%, while its benchmark, the Russell 3000® Growth Index, returned 12.8%. The primary driver of the Fund’s outperformance was strong stock selection. Specifically, the Funds stocks in the health care, technology, producer durables, consumer staples, and materials & processing were the best performers. Consumer discretionary and energy stocks lagged the benchmark. The Fund’s sector allocations also had a net positive effect, but it is important to note that the Fund’s sector weights are solely a function of TimesSquare’s bottom-up investment approach.
For the 12 months ended October 31, 2012, the Managers Real Estate Securities Fund returned 13.4%, while the benchmark, the Dow Jones U.S. Select REIT Index, returned 14.1%. Property fundamentals continued to steadily improve during the year, leading to another period of robust absolute returns from this asset class.
2
Letter to Shareholders (continued)
During this period, the Fund’s modest underperformance was primarily a result of stock selection within self-storage, regional mall and specialty sectors. This was mostly offset by stronger results from stocks in the hotel and office sectors which improved the Fund’s relative performance versus the benchmark.
For the 12 months ended October 31, 2012, the Managers Micro-Cap Fund (Service Class) returned 11.6% compared with 16.5% for its benchmark, the Russell Microcap® Index. Despite delivering solid absolute returns during the year, the Fund underperformed its benchmark. A majority of the underperformance was driven by the Fund’s relative sector selection which is primarily a fallout of the stock selection process for each of the Fund’s subadvisors. Most notably, the Fund’s significant underweight to the financials sector, one of the best performers of the last year, detracted from performance. In addition, the overweight to the underperforming information technology sector was also a detractor to performance. The Fund had mixed stock selection results throughout the year. While there was strength from the Fund’s information technology and energy holdings, these contributions were mitigated by holdings within the consumer discretionary and health care sectors.
The following report covers the one-year period ended October 31, 2012. Should you have any questions about this report, or if you’d like to receive a prospectus and additional information, including fees and expenses for these or any of the other Funds in our family, please feel free to contact us at 1-800-835-3879, or visit our Web site at www.managersinvest.com. As always, please read the prospectus carefully before you invest or send money.
You can rest assured that under all market conditions our team is focused on delivering excellent investment management services for your benefit.
We thank you for your continued confidence and investment in The Managers Funds.
Respectfully,

Keitha Kinne
Managing Partner
Managers Investment Group LLC
3
About Your Fund’s Expenses
As a shareholder of a Fund, you may incur two types of costs: (1) transaction costs, which may include sales charges (loads) on purchase payments; redemption fees; and exchange fees; and (2) ongoing costs, including management fees; distribution (12b-1) fees; and other Fund expenses. This example is intended to help you understand your ongoing costs (in dollars) of investing in the Fund and to compare these costs with the ongoing costs of investing in other mutual funds. The example is based on $1,000 invested at the beginning of the period and held for the entire period as indicated below.
Actual Expenses
The first line of the following table provides information about the actual account values and actual expenses. You may use the information in this line, together with the amount you invested, to estimate the expenses that you paid over the period. Simply divide your account value by $1,000 (for example, an $8,600 account value divided by $1,000 = 8.6), then multiply the result by the number in the first line under the heading entitled “Expenses Paid During Period” to estimate the expenses you paid on your account during this period.
Hypothetical Example for Comparison Purposes
The second line of the following table provides information about hypothetical account values and hypothetical expenses based on the Fund’s actual expense ratio and an assumed annual rate of return of 5% before expenses, which is not the Fund’s actual return. The hypothetical account values and expenses may not be used to estimate the actual ending account balance or expenses you paid for the period. You may use this information to compare the ongoing costs of investing in the Fund and other funds by comparing this 5% hypothetical example with the 5% hypothetical examples that appear in the shareholder reports of other funds.
Please note that the expenses shown in the table are meant to highlight your ongoing costs only and do not reflect any transactional costs, such as sales charges (loads), redemption fees, or exchange fees. Therefore, the second line of the table is useful in comparing ongoing costs only, and will not help you determine the relative total costs of owning different funds.
| | | | | | | | | | | | | | | | |
Six Months Ended October 31, 2012 | | Expense
Ratio for
the Period | | | Beginning
Account Value
05/01/2012 | | | Ending
Account Value
10/31/2012 | | | Expenses
Paid During
the Period* | |
Managers Frontier Small Cap Growth Fund | | | | | | | | | | | | | | | | |
Investor Class Shares | | | | | | | | | | | | | | | | |
Based on Actual Fund
Return | | | 1.55 | % | | $ | 1,000 | | | $ | 959 | | | $ | 7.63 | |
Hypothetical (5% return before
expenses) | | | 1.55 | % | | $ | 1,000 | | | $ | 1,017 | | | $ | 7.86 | |
Service Class Shares | | | | | | | | | | | | | | | | |
Based on Actual Fund
Return | | | 1.30 | % | | $ | 1,000 | | | $ | 960 | | | $ | 6.41 | |
Hypothetical (5% return before
expenses) | | | 1.30 | % | | $ | 1,000 | | | $ | 1,019 | | | $ | 6.60 | |
Institutional Class Shares | | | | | | | | | | | | | | | | |
Based on Actual Fund
Return | | | 1.05 | % | | $ | 1,000 | | | $ | 961 | | | $ | 5.18 | |
Hypothetical (5% return before
expenses) | | | 1.05 | % | | $ | 1,000 | | | $ | 1,020 | | | $ | 5.33 | |
Managers AMG TSCM
Growth Equity Fund | | | | | | | | | | | | | | | | |
Investor Class Shares | | | | | | | | | | | | | | | | |
Based on Actual Fund
Return | | | 1.19 | % | | $ | 1,000 | | | $ | 997 | | | $ | 5.99 | |
Hypothetical (5% return before
expenses) | | | 1.19 | % | | $ | 1,000 | | | $ | 1,019 | | | $ | 6.06 | |
Service Class Shares | | | | | | | | | | | | | | | | |
Based on Actual Fund
Return | | | 0.98 | % | | $ | 1,000 | | | $ | 998 | | | $ | 4.90 | |
Hypothetical (5% return before
expenses) | | | 0.98 | % | | $ | 1,000 | | | $ | 1,020 | | | $ | 4.96 | |
Institutional Class Shares | | | | | | | | | | | | | | | | |
Based on Actual Fund
Return | | | 0.79 | % | | $ | 1,000 | | | $ | 999 | | | $ | 3.98 | |
Hypothetical (5% return before
expenses) | | | 0.79 | % | | $ | 1,000 | | | $ | 1,021 | | | $ | 4.03 | |
Managers Micro-Cap Fund | | | | | | | | | | | | | | | | |
Service Class Shares | | | | | | | | | | | | | | | | |
Based on Actual Fund
Return | | | 1.43 | % | | $ | 1,000 | | | $ | 983 | | | $ | 7.14 | |
Hypothetical (5% return before
expenses) | | | 1.43 | % | | $ | 1,000 | | | $ | 1,018 | | | $ | 7.27 | |
Institutional Class Shares | | | | | | | | | | | | | | | | |
Based on Actual Fund
Return | | | 1.18 | % | | $ | 1,000 | | | $ | 985 | | | $ | 5.90 | |
Hypothetical (5% return before
expenses) | | | 1.18 | % | | $ | 1,000 | | | $ | 1,019 | | | $ | 6.00 | |
Managers Real Estate
Securities Fund | | | | | | | | | | | | | | | | |
Based on Actual Fund
Return | | | 1.24 | % | | $ | 1,000 | | | $ | 988 | | | $ | 6.21 | |
Hypothetical (5% return before
expenses) | | | 1.24 | % | | $ | 1,000 | | | $ | 1,019 | | | $ | 6.31 | |
Managers California
Intermediate Tax-Free
Fund | | | | | | | | | | | | | | | | |
Based on Actual Fund
Return | | | 0.55 | % | | $ | 1,000 | | | $ | 1,027 | | | $ | 2.80 | |
Hypothetical (5% return before
expenses) | | | 0.55 | % | | $ | 1,000 | | | $ | 1,022 | | | $ | 2.80 | |
| |
* Expenses are equal to the Fund’s annualized expense ratio multiplied by the average account value over the period, multiplied by the number of days in the most recent fiscal half-year (184), then divided by 366. | |
4
Managers Frontier Small Cap Growth Fund
Investment Manager’s Comments
THE PORTFOLIO MANAGER
Frontier Capital Management Co. LLC (“Frontier”) manages client assets in small-, small/mid-, mid- and large-cap U.S. equity strategies. The Managers Frontier Small Cap Growth Fund follows a small-cap growth discipline as Frontier implements its “GARP” investment approach to select attractive small-cap stocks.
Frontier believes:
| | • | | Fundamental research is the cornerstone to adding value |
| | • | | Stock prices ultimately are linked to sales and earnings growth |
| | • | | Growth must be purchased at a reasonable price |
| | • | | Research is a continuous process |
Frontier utilizes and draws support from its entire team of 19 investment professionals to identify opportunities and conduct fundamental research. Through fundamental bottom-up research, Frontier seeks long-term capital appreciation by investing in small-capitalization companies that it believes have above-average earnings growth potential and are available at reasonable valuations.
Frontier looks for companies it believes can generate long-term, sustainable earnings, managed by qualified professionals capable of executing a well-conceived strategic plan. Frontier seeks businesses that can generate superior rates of return on capital in excess of their cost of capital over a business cycle due to above-average secular growth prospects or a competitive advantage.
THE YEAR IN REVIEW
For the fiscal year ended October 31, 2012, the Managers Frontier Small Cap Growth Fund (Service Class Shares) (the “Fund”) returned 5.3%, underperforming the Russell 2000® Growth Index, which returned 9.7%.
U.S. equities finished the 12 months ending October 31, 2012 with positive returns across the market cap spectrum, but small caps underperformed relative to large caps. The small-cap Russell 2000® rose 12.1% versus the 15.0% gain of the large-cap Russell 1000®. From a style perspective, the Russell 2000® Growth, up 9.7%, underperformed the Russell 2000® Value Index, up 14.5%.
The fiscal year ended in October amidst election uncertainty, “Fiscal Cliff” concerns, ongoing weak international macroeconomic data, and new worries over corporate earnings. The trend of weak economic growth continued as GDP rose 2.0% in the third quarter, albeit an acceleration from the 1.3% pace of the second quarter. However, the details of the report are not as encouraging as the headline number. Uncertainty over the election and the Fiscal Cliff have made businesses reluctant to expand capital expenditures and hiring. Nonresidential fixed investment fell (1.3)% and exports slid (1.6)%, the first drop since the first quarter of 2009. Economic growth during the third quarter was driven by an unsustainable 9.6% increase in Federal Government outlays and a 2.0% increase in consumer spending. Once again, gains in real disposable personal income slowed during the quarter, and the personal saving rate fell. Housing remains a bright spot. Residential investment surged 14.4%, though construction levels remain far from the boom-era peak or even historical norms.
The Fund’s underperformance relative to the Russell 2000® Growth was primarily due to our sector results in consumer discretionary, health
care and energy. The largest detractor from our relative returns was consumer discretionary, a sector we were relatively even weight with the Index. Our portfolio returns in consumer discretionary, although positive 4.4%, lagged the benchmark return of 11.9%. Our largest detractors in the consumer discretionary sector were Meritor, down (54)%, QuinStreet, down (47)%, and K12, down (42)%. Collectively, these three investments detracted approximately 1.7% from the portfolio’s relative return. Within consumer discretionary, we did achieve positive substantial contribution from our investment in apparel retailer Chico’s FAS. The stock was up 53% and contributed 0.9% to the portfolio’s relative return.
The second largest detractor from our relative returns was health care, a sector we were underweight the Index. Although our return within this sector was 16.4%, it lagged the Index return of 17.4% within the sector. Our largest detractors within the health care sector were MAKO Surgical, down (61)%, and Dendreon, down (65)%. These two investments took away approximately 1.3% from the portfolio’s relative return. MAKO Surgical makes robots for hip and knee surgery. While quarterly machine placements can be lumpy, the number of procedures done with MAKO robots is increasing at very rapid rates and in line with our expectations. In the first quarter of 2012, MAKO reported weaker than expected machine placements and the stock sold off sharply. We used this weakness to further increase the size of the position. We believe that MAKO has the potential to become a very large company with a significant recurring revenue stream.
Within energy, a sector where we were overweight the Index, our (17.2)% return lagged the (10.6)% return of the Index. Our position in KiOR, down (60)%, was the largest detractor within the sector and detracted approximately 0.5% from the portfolio contribution to return. Kior has developed a break through chemical catalyst that converts biomass to oil in a matter of seconds. The company is in the process of building its first production facility and announced a slight increase in the building cost, which weighed on the stock. The company continues to expect first commercial production output in late 2014 and we remain optimistic on the company’s long term potential.
Partially offsetting the aforementioned detractors were positive contributions to return from the producer durables sector, a sector we were overweight. Top stocks included RSC Holdings, up 84%, A.O. Smith, up 66%, and Advisory Board, up 55%. Combined, these three producer durables stocks contributed approximately 2.1% of the portfolio return. Financial services, another sector we are overweight, was also a contributor to relative performance. Our 19.4% return within financial services was the highest sector return in the portfolio and also exceeded the 16.0% sector return of the benchmark. Our strongest financial stocks were our long-term holding in brokerage Raymond James, up 28%, and asset manager Waddell and Reed, up 24%.
We are disappointed with our relative performance over the last year. It has been a difficult period for our investment style that focuses on high quality growth companies trading at reasonable valuations. According to analysis by Furey Research Partners, low quality stocks, defined as the bottom quintile return on invested capital companies, has lead the Index since the October 2011 market low. These low quality stocks historically underperform over the long term. Further analysis showed that the five top contributing industries accounted for more than half of the 11.8% year-to-date return of the Russell 2000®. These top performing
Managers Frontier Small Cap Growth Fund
Investment Manager’s Comments (continued)
industries also possess among the lowest median return on invested capital within the Index. If we stick to our time tested process, we are confident we will outperform the benchmark over time. We are looking forward to delivering improved relative performance for our investors.
This commentary reflects the viewpoints of the portfolio manager, Frontier Capital Management, as of October 31, 2012 and is not intended as a forecast or guarantee of future results, and is subject to change without notice.
CUMULATIVE TOTAL RETURN PERFORMANCE
Managers Frontier Small Cap Growth Fund’s cumulative total return is based on the daily change in net asset value (NAV) and assumes that all
dividends and distributions were reinvested. This chart compares a hypothetical $10,000 investment made in Managers Frontier Small Cap Growth Fund’s Service Class on October 31, 2002, to a $10,000 investment made in the Russell 2000® Growth Index for the same time period. Performance for periods longer than one year is annualized. The graph and table do not reflect the deduction of taxes that a shareholder would pay on a Fund distribution or redemption of shares. The listed returns for the Fund are net of expenses and the returns for the index exclude expenses. Past performance is not indicative of future results. Total returns would have been lower had certain expenses not been reduced.
6
Managers Frontier Small Cap Growth Fund
Investment Manager’s Comments (continued)
CUMULATIVE TOTAL RETURN PERFORMANCE (continued)
The table below shows the average annual total returns for the Managers Frontier Small Cap Growth Fund and the Russell 2000® Growth Index for the same time periods ended October 31, 2012.
| | | | | | | | | | | | | | | | | | | | |
| | | Average Annual Total Returns1 | |
| | | One Year | | | Five Years | | | Ten Years | | | Since Inception | | | Inception Date | |
Managers Frontier Small Cap Equity Fund2,3,4 | | | | | | | | | | | | | | | | | | | | |
Investor Class5 | | | 5.08 | % | | | — | | | | — | | | | 9.26 | % | | | 01/01/10 | |
Service Class | | | 5.29 | % | | | 1.15 | % | | | 9.46 | % | | | 5.87 | % | | | 09/24/97 | |
Institutional Class5 | | | 5.60 | % | | | — | | | | — | | | | 9.73 | % | | | 01/01/10 | |
Russell 2000® Growth Index6 | | | 9.70 | % | | | 1.41 | % | | | 9.66 | % | | | 3.26 | % | | | 09/24/97 | † |
The performance data shown represents past performance. Past performance is not a guarantee of future results. Current performance may be lower or higher than the performance data quoted. The investment return and principal value of an investment in the Fund will fluctuate so that an investor’s shares, when redeemed, may be worth more or less than their original cost. For performance information through the most recent month end, please call (800) 835-3879 or visit our Web site at www.managersinvest.com.
Investors should carefully consider the Fund’s investment objectives, risks, charges and expenses before investing. For this and other information, please call (800) 835-3879 or visit our Web site at www.managersinvest.com for a free prospectus. Read it carefully before investing or sending money. Funds are distributed by Managers Distributors, Inc., member FINRA.
| † | Date reflects inception date of the Fund, not the index. |
|
1 Total return equals income yield plus share price change and assumes reinvestment of all dividends and capital gain distributions. Returns are net of fees and may reflect offsets of Fund expenses as described in the Prospectus. No adjustment has been made for taxes payable by shareholders on their reinvested dividends and capital gain distributions. Returns for periods greater than one year are the average annual return. The listed returns on the Fund are net of expenses and based on the published NAV as of October 31, 2012. All returns are in U.S. dollars ($). 2 From time to time, the Fund’s advisor has waived its fees and/or absorbed Fund expenses, which has resulted in higher returns. 3 The Fund is subject to risks associated with investments in small-capitalization companies, such as erratic earnings patterns, competitive conditions, limited earnings history, and a reliance on one or a limited number of products. 4 The Fund invests in growth stocks, which may be more sensitive to market movements because their prices tend to reflect future investor expectations rather than just current profits. Growth stocks may underperform value stocks during given time periods. 5 Commencement of operations for this class was January 1, 2010. 6 The Russell 2000® Growth Index measures the performance of the Russell 2,000 companies with higher price-to-book ratios and higher forecasted growth values. Unlike the Fund, the Russell 2000® Growth Index is unmanaged, is not available for investment, and does not incur expenses. The Russell 2000® Growth Index is a registered trademark of Russell Investments. Russell® is a trademark of Russell Investments. Not FDIC insured, nor bank guaranteed. May lose value. |
7
Managers Frontier Small Cap Growth Fund
Fund Snapshots
October 31, 2012
Portfolio Breakdown (unaudited)
| | | | | | | | |
Industry | | Managers
Frontier Small Cap
Growth Fund** | | | Russell 2000®
Growth Index | |
Industrials | | | 26.8 | % | | | 17.8 | % |
Health Care | | | 17.9 | % | | | 20.7 | % |
Information Technology | | | 16.7 | % | | | 21.9 | % |
Consumer Discretionary | | | 15.2 | % | | | 16.4 | % |
Financials | | | 12.2 | % | | | 7.0 | % |
Energy | | | 6.2 | % | | | 5.6 | % |
Telecommunication Services | | | 2.0 | % | | | 0.9 | % |
Materials | | | 0.6 | % | | | 4.6 | % |
Consumer Staples | | | 0.0 | % | | | 4.8 | % |
Utilities | | | 0.0 | % | | | 0.3 | % |
Other Assets and Liabilities | | | 2.4 | % | | | 0.0 | % |
| ** | As a percentage of net assets. |
Top Ten Holdings (unaudited)
| | | | |
Security Name | | % of
Net Assets | |
MasTec, Inc.* | | | 4.2 | % |
Raymond James Financial, Inc.* | | | 3.6 | |
MEDNAX, Inc.* | | | 3.3 | |
Chico’s FAS, Inc.* | | | 3.0 | |
WABCO Holdings, Inc.* | | | 2.3 | |
Watsco, Inc.* | | | 2.2 | |
World Fuel Services Corp.* | | | 2.1 | |
Waddell & Reed Financial, Inc., Class A | | | 1.9 | |
Tessera Technologies, Inc. | | | 1.8 | |
Belden, Inc. | | | 1.8 | |
Top Ten as a Group | | | 26.2 | % |
| | | | |
| * | Top Ten Holding at April 30, 2012 |
Any sectors, industries, or securities discussed should not be perceived as investment recommendations. Mention of a specific security should not be considered a recommendation to buy or solicitation to sell that security. Specific securities mentioned in this report may have been sold from the Fund’s portfolio of investments by the time you receive this report.
8
Managers Frontier Small Cap Growth Fund
Schedule of Portfolio Investments
October 31, 2012
| | | | | | | | |
| | | Shares | | | Value | |
| | | | | | | | |
Common Stocks - 97.6% | | | | | | | | |
Consumer
Discretionary - 15.2% | | | | | | | | |
Cheesecake Factory, Inc., The | | | 33,100 | | | $ | 1,094,286 | |
Chico’s FAS, Inc. | | | 139,200 | | | | 2,589,120 | |
Hanesbrands, Inc.* | | | 11,400 | | | | 381,558 | |
Harman International Industries, Inc. | | | 32,100 | | | | 1,345,953 | |
IMAX Corp.*,1 | | | 28,800 | | | | 650,592 | |
K12, Inc.* | | | 37,000 | | | | 757,390 | |
LKQ Corp.* | | | 26,800 | | | | 559,852 | |
Monro Muffler Brake, Inc.1 | | | 15,300 | | | | 518,976 | |
rue21, Inc.* | | | 25,600 | | | | 770,816 | |
Select Comfort Corp.* | | | 50,000 | | | | 1,391,500 | |
Tractor Supply Co. | | | 4,500 | | | | 433,080 | |
Vera Bradley, Inc.* | | | 15,000 | | | | 447,150 | |
WABCO Holdings, Inc.* | | | 33,400 | | | | 1,956,238 | |
WMS Industries, Inc.* | | | 17,500 | | | | 287,525 | |
Total Consumer Discretionary | | | | | | | 13,184,036 | |
| | |
Energy - 6.2% | | | | | | | | |
Bonanza Creek Energy, Inc.* | | | 11,400 | | | | 282,378 | |
Carrizo Oil & Gas, Inc.* | | | 41,100 | | | | 1,102,302 | |
Comstock Resources, Inc.* | | | 9,700 | | | | 166,064 | |
InterOil Corp.*,1 | | | 18,900 | | | | 1,218,672 | |
KiOR, Inc., Class A* | | | 54,700 | | | | 361,020 | |
Kodiak Oil & Gas Corp.* | | | 5,500 | | | | 50,820 | |
Magnum Hunter Resources Corp.* | | | 46,040 | | | | 175,873 | |
Rex Energy Corp.* | | | 16,800 | | | | 222,432 | |
World Fuel Services Corp. | | | 52,600 | | | | 1,825,220 | |
Total Energy | | | | | | | 5,404,781 | |
| | |
Financials - 12.2% | | | | | | | | |
Allied World Assurance Co. Holdings AG | | | 16,600 | | | | 1,332,980 | |
Fidelity National Financial, Inc., Class A | | | 14,000 | | | | 299,740 | |
Green Dot Corp., Class A* | | | 8,200 | | | | 83,558 | |
Jefferies Group, Inc. | | | 78,700 | | | | 1,120,688 | |
Jones Lang LaSalle, Inc. | | | 10,500 | | | | 816,270 | |
Raymond James Financial, Inc. | | | 81,200 | | | | 3,096,968 | |
Signature Bank* | | | 13,900 | | | | 990,236 | |
Waddell & Reed Financial, Inc., Class A | | | 48,400 | | | | 1,613,172 | |
WR Berkley Corp. | | | 32,800 | | | | 1,275,592 | |
Total Financials | | | | | | | 10,629,204 | |
| | |
Health Care - 17.9% | | | | | | | | |
Centene Corp.* | | | 19,400 | | | | 736,812 | |
CONMED Corp. | | | 24,700 | | | | 683,202 | |
Covance, Inc.* | | | 15,200 | | | | 740,392 | |
| | | | | | | | |
| | | Shares | | | Value | |
| | | | | | | | |
Cumberland Pharmaceuticals, Inc.* | | | 42,700 | | | $ | 250,649 | |
Dendreon Corp.* | | | 97,000 | | | | 368,600 | |
DexCom, Inc.* | | | 65,300 | | | | 855,430 | |
Fluidigm Corp.* | | | 15,600 | | | | 235,404 | |
Greenway Medical Technologies*,1 | | | 21,700 | | | | 360,003 | |
Health Management Associates, Inc., Class A* | | | 36,200 | | | | 264,260 | |
Illumina, Inc.*,1 | | | 11,700 | | | | 555,867 | |
Insulet Corp.* | | | 39,300 | | | | 833,553 | |
MAKO Surgical Corp.* | | | 71,210 | | | | 1,078,832 | |
Medidata Solutions, Inc.* | | | 18,800 | | | | 789,976 | |
MEDNAX, Inc.* | | | 41,100 | | | | 2,835,078 | |
Momenta Pharmaceuticals, Inc.* | | | 40,100 | | | | 508,468 | |
Myriad Genetics, Inc.* | | | 42,500 | | | | 1,112,225 | |
Onyx Pharmaceuticals, Inc.* | | | 14,200 | | | | 1,112,712 | |
PerkinElmer, Inc. | | | 12,100 | | | | 374,253 | |
Seattle Genetics, Inc.*,1 | | | 31,500 | | | | 792,540 | |
Sirona Dental Systems, Inc.* | | | 3,200 | | | | 183,232 | |
Unilife Corp.* | | | 95,100 | | | | 260,574 | |
United Therapeutics Corp.* | | | 13,100 | | | | 598,277 | |
Total Health Care | | | | | | | 15,530,339 | |
| | |
Industrials - 26.8% | | | | | | | | |
A. O. Smith Corp. | | | 21,100 | | | | 1,282,247 | |
Advisory Board Co., The* | | | 30,000 | | | | 1,425,000 | |
Ameresco, Inc., Class A* | | | 23,700 | | | | 262,122 | |
Belden, Inc. | | | 42,500 | | | | 1,521,500 | |
Carlisle Cos., Inc. | | | 20,400 | | | | 1,133,220 | |
CLARCOR, Inc. | | | 20,500 | | | | 927,420 | |
HUB Group, Inc., Class A* | | | 30,000 | | | | 930,300 | |
Insperity, Inc. | | | 36,500 | | | | 953,015 | |
Kaman Corp. | | | 28,900 | | | | 1,075,080 | |
Landstar System, Inc. | | | 17,700 | | | | 896,505 | |
MasTec, Inc.* | | | 162,200 | | | | 3,659,232 | |
Meritor, Inc.* | | | 108,100 | | | | 477,802 | |
Mine Safety Appliances Co. | | | 17,900 | | | | 690,940 | |
MRC Global, Inc.* | | | 34,900 | | | | 853,305 | |
Pall Corp. | | | 10,300 | | | | 648,488 | |
Quanta Services, Inc.* | | | 44,900 | | | | 1,164,257 | |
RPX Corp.* | | | 54,400 | | | | 572,832 | |
Team, Inc.* | | | 17,100 | | | | 560,538 | |
UTi Worldwide, Inc. | | | 13,200 | | | | 183,348 | |
Waste Connections, Inc. | | | 30,400 | | | | 998,032 | |
Watsco, Inc.1 | | | 27,800 | | | | 1,900,130 | |
The accompanying notes are an integral part of these financial statements.
9
Managers Frontier Small Cap Growth Fund
Schedule of Portfolio Investments (continued)
| | | | | | | | |
| | | Shares | | | Value | |
| | | | | | | | |
Industrials - 26.8% (continued) | | | | | | | | |
WESCO International, Inc.* | | | 18,800 | | | $ | 1,219,744 | |
Total Industrials | | | | | | | 23,335,057 | |
| | |
Information
Technology - 16.7% | | | | | | | | |
Advent Software, Inc.* | | | 12,500 | | | | 271,250 | |
Cadence Design Systems, Inc.* | | | 55,100 | | | | 697,566 | |
comScore, Inc.* | | | 41,084 | | | | 582,160 | |
Constant Contact, Inc.* | | | 29,700 | | | | 366,498 | |
Cymer, Inc.* | | | 8,700 | | | | 693,303 | |
Cypress Semiconductor Corp.* | | | 29,800 | | | | 295,318 | |
FactSet Research Systems, Inc.1 | | | 300 | | | | 27,165 | |
Fortinet, Inc.* | | | 17,000 | | | | 329,290 | |
GT Advanced Technologies, Inc.* | | | 64,700 | | | | 280,798 | |
Ingram Micro, Inc., Class A* | | | 53,500 | | | | 813,200 | |
Intevac, Inc.* | | | 35,900 | | | | 179,500 | |
IntraLinks Holdings, Inc.* | | | 24,300 | | | | 135,837 | |
Jabil Circuit, Inc. | | | 84,700 | | | | 1,468,698 | |
Jack Henry & Associates, Inc. | | | 29,400 | | | | 1,117,200 | |
LogMeln, Inc.* | | | 19,300 | | | | 476,324 | |
Microsemi Corp.* | | | 30,400 | | | | 583,680 | |
Monster Worldwide, Inc.* | | | 68,000 | | | | 422,960 | |
ON Semiconductor Corp.* | | | 51,100 | | | | 314,265 | |
QuinStreet, Inc.* | | | 91,900 | | | | 562,428 | |
Rogers Corp.* | | | 7,300 | | | | 287,693 | |
Synchronoss Technologies, Inc.* | | | 14,100 | | | | 288,909 | |
Tessera Technologies, Inc. | | | 107,720 | | | | 1,526,392 | |
Verint Systems, Inc.* | | | 8,800 | | | | 239,976 | |
| | | | | | | | |
| | | Shares | | | Value | |
| | | | | | | | |
Virtusa Corp.* | | | 52,300 | | | $ | 897,468 | |
Web.com Group, Inc.* | | | 44,890 | | | | 708,364 | |
WEX, Inc.* | | | 12,600 | | | | 929,628 | |
Total Information Technology | | | | | | | 14,495,870 | |
Materials - 0.6% | | | | | | | | |
Albemarle Corp. | | | 3,100 | | | | 170,841 | |
RTI International Metals, Inc.* | | | 13,900 | | | | 316,781 | |
Total Materials | | | | | | | 487,622 | |
Telecommunication
Services - 2.0% | | | | | | | | |
Cogent Communications Group, Inc. | | | 52,100 | | | | 1,131,091 | |
Premiere Global Services, Inc.* | | | 74,900 | | | | 636,650 | |
Total Telecommunication Services | | | | | | | 1,767,741 | |
Total Common Stocks
(cost $81,144,551) | | | | | | | 84,834,650 | |
Other Investment Companies - 8.5%2 | | | | | | | | |
BNY Mellon Overnight Government Fund, 0.23%3 | | | 4,957,159 | | | | 4,957,159 | |
Dreyfus Cash Management Fund, Institutional Class Shares, 0.07% | | | 2,415,074 | | | | 2,415,074 | |
Total Other Investment Companies
(cost $7,372,233) | | | | | | | 7,372,233 | |
Total Investments - 106.1%
(cost $88,516,784) | | | | | | | 92,206,883 | |
Other Assets, less
Liabilities - (6.1)% | | | | | | | (5,307,143 | ) |
Net Assets - 100.0% | | | | | | $ | 86,899,740 | |
The accompanying notes are an integral part of these financial statements.
10
Managers AMG TSCM Growth Equity Fund
Investment Manager’s Comments
The Managers AMG TSCM Growth Equity Fund (the “Fund”) seeks to achieve long-term capital appreciation by investing in the stocks of large-, mid- and small-capitalization companies.
The Portfolio Manager
TimesSquare Capital Management, LLC (“TimesSquare”), the Fund’s subadvisor, utilizes a bottom-up fundamental approach to all-cap investing. Led by co-managers Kenneth Duca, Tony Rosenthal, and Grant Babyak, the investment team at TimesSquare believes its proprietary fundamental research skills, which place a particular emphasis on the assessment of management quality and an in-depth understanding of superior business models, enable the team to build a diversified portfolio of large-cap, mid-cap and small-cap growth stocks designed to generate good risk-adjusted returns. When selecting growth stocks, Fund management utilizes a fundamental, bottom-up process to identify companies that demonstrate consistent and sustainable revenue and earnings growth, offer distinct and sustainable competitive advantages, have strong, experienced management teams, have stocks selling at reasonable valuations, and that Fund management believes have the potential to appreciate in price by 25 to 50% within the next 12 to 18 months.
The Period in Review
For the fiscal year ended October 31, 2012, the Managers AMG TSCM Growth Equity Fund (Institutional Class Shares) returned 16.26%, outperforming the Russell 3000® Growth Index, which returned 12.76%.
Looking back on 2011, by some measures it was a deceptively quiet year. U.S. equity markets were generally flat with large caps up slightly, midcaps down slightly, and small caps down. After three years of significant double-digit returns – both positive and negative – 2011’s returns for all size and style indices showed the smallest or next-to-smallest absolute change in ten years.
The U.S. equity market began 2012 with a strong start. A significant January effect that favored smaller, riskier, and commodity-oriented stocks was almost a complete reversal of the end of 2011. That carried out into February, began to fade in March, then ended the quarter with all major U.S. core equity market indices clustered together with returns in the 12% to 13% range. Across the economic landscape, unemployment has ticked down to 8.3% thanks to a healthier job market, and the University of Michigan reading of consumer sentiment rose to 76.2 – the highest level since February 2011. While gasoline prices rose, a mild winter saved consumers an estimated $30 billion on lower heating bills. Additionally, the U.S. economy grew at a 3% annual rate in the fourth quarter – the fastest rate of growth in a year and a half. The “risk-on” environment seemed back in style as the Federal Reserve made official its intention to keep interest rates near zero until late 2014. Another contributor to the rebound was the Fed’s release towards the end of the quarter of its Comprehensive Capital Analysis and Review (i.e., the bank stress test) that allowed most of the 19 major banks to reinstate or increase dividends and or stock repurchases.
In the second quarter, the U.S. stock markets gave back a portion of their gains from earlier in the year. Various measures of economic activity and sentiment also retreated this quarter. After recent highs, GDP slowed to an annual rate of 1.9% for the prior quarter, and the
Institute for Supply Management’s measure of manufacturing activity dropped below 50, indicative of economic contraction, for the first time in three years. Oil prices retreated sharply this quarter to close at $85 per barrel, and the yield on the U.S. Treasury 10-year note repeatedly reached all-time lows before recovering slightly to 1.64%. Likely it was no surprise then when the University of Michigan’s reading of consumer sentiment fell precipitously to 73.2 – its lowest level this year. Somewhat surprising were two significant events that occurred just as the quarter ended. The European Union agreed to directly stabilize troubled European banks with the soon-to-be created permanent rescue fund known as the European Stability Mechanism. Hopes that a European version of TARP would recapitalize the banking system gave a boost to its markets and those U.S. stocks with high degrees of European exposure. Second and more important on these shores was the Supreme Court ruling that upheld the Affordable Care Act (health care reform) and in particular its key element – the individual mandate that required people to purchase health insurance – that many had expected would be rejected.
In the third quarter, the U.S. stock markets more than recovered the ground ceded in the second quarter, and across the capitalization spectrum the major market indices showed robust double-digit gains for the year thus far. Underneath the stock market, however, were mixed measures of economic activity. With a final revision at the end of September, the nation’s GDP grew at a downward-revised 1.3% annual rate in the second quarter. Consumer spending increased, and retailers reported better-than-expected sales growth, though a significant portion of the higher spending was fueled by increased gasoline prices. Still, measures of consumer sentiment and confidence moved upward, as did manufacturing activity -returning to expansion territory after three months of contraction. Automotive sales climbed to 14.9 million vehicles on an annualized basis, which was the highest seasonally adjusted annual rate since March 2008. Unemployment finally nudged below 8%, ending the longest stretch above that level since World War II. With high unemployment levels in mind, the Federal Reserve launched a third round of quantitative easing, planning monthly purchases through year-end of $40 billion of mortgage-backed securities and $45 billion of long-term treasury bonds. The Fed emphasized that its actions would continue into 2013 “to support continued progress toward maximum employment and price stability.”
Towards the end of the period, “superstorm” Sandy roared through the Northeast. The stock markets closed for two of October’s last three trading days and ended with slight losses, though all major size and style indexes maintained their double-digit gains year to date. Hiring in the U.S. increased more than was forecasted for October as employers looked beyond slowing global growth and political gridlock. Measures of consumer confidence and sentiment rose, both in terms of views on the present situation as well as forward expectations. Factories stepped up their activities to support a rise in new orders as consumers continue to spend.
The portfolio outperformed the Russell 3000® Growth Index on a relative basis during the period. Stock selection had a net positive effect and drove our outperformance; in general, our investments in health care, technology, producer durables, consumer staples, and materials & processing outpaced their counterparts in the index,
Managers AMG TSCM Growth Equity Fund
Investment Manager’s Comments (continued)
while our holdings in consumer discretionary and energy lagged. Sector allocation also had a net positive effect although we continue to build our concentrated all cap growth portfolio from the bottom-up.
Within the consumer discretionary sector, eBay Inc. operates through two business segments: Marketplaces and Payments. The Marketplaces segment provides the infrastructure to enable global online commerce on a variety of platforms, including the eBay.com auction platform, secondary tickets marketplace (StubHub), online shopping comparison website (Shopping.com), and fixed price media marketplace (Half.com); the Payments segment includes online payment solutions PayPal and Bill Me Later. eBay stock was bid up by 52% as management issued a string of solid quarterly reports. Their PayPal unit has seen increased use by its consumers and a gain in market share. We expect the growth potential for PayPal to continue to increase with the proliferation of mobile devices. We will continue to monitor their progress in offline payments, as it will take some time for them to ramp volume; eBay has signed Home Depot along with a dozen other major retailers so far as well as established partnerships with VeriFone and Equinox, two of the top point-of-sale terminal providers. Virgin Media, Inc. supplies broadband internet, television, mobile telephony and fixed line telephone services to residential and commercial customers throughout the United Kingdom. Virgin’s shares rose 35% thanks to solid second quarter results with revenue and operating cash flow ahead of consensus estimates. Its cable business revenue improved due to a rise in average revenue per user. The company’s churn rate (customer turnover) also fell during the quarter. The bottom detractor to our returns for the period was Johnson Controls, Inc., which offers products and services to optimize energy and operational efficiencies of buildings, lead-acid automotive batteries and advanced batteries for hybrid and electric vehicles, and interior systems for automobiles. June quarter revenue and earnings came in lighter than expected. Power Solutions was the main area of weakness as its battery business was impacted by a weaker automotive aftermarket plus higher spent battery recycling costs. In recognition of continued softness in its global markets and expectations for a lower euro, Johnson Controls lowered fiscal fourth quarter guidance. Johnson Controls shares finished the period down (15%). We closed our position. Coach, Inc. designs and markets premium handbags, leather goods, and accessories. Coach shares were discounted by (13%); despite the company exceeding consensus estimates for revenue and earnings in the second quarter, some investors had higher expectations for their quarterly results. Coach’s same store sales grew at a solid pace, but that rate of growth slowed in part because management focused on improving margins and productivity in the recent quarter. Its shares were also pressured in the third quarter by the combination of a worse-than-expected quarter and weak fiscal year guidance. Coach suffered a deceleration in their business in June and cited concerns around the competitive/promotional environment. We don’t believe the brand or business model is broken, though the weaker macro is amplifying competitive threats. The Legacy launch should help Coach differentiate and provide a comparative store sales lift. NIKE, Inc. specializes in footwear, apparel, equipment, and accessory products for men, women, and children. We closed our position in the second quarter as NIKE reported a disappointing quarter and fiscal year end with earnings missing estimates, marking their biggest miss in
over a decade, a dramatic slowdown in growth in China, and continued gross margin pressure as management makes incremental investments in digital and manufacturing. NIKE shares fell by (8%).
Halliburton Co., in the energy sector provides products and services to the energy industry for the exploration and production of oil and natural gas, including consulting, drill bits, and subsea safety systems. Halliburton shares pulled back by -16%, and we closed our position in the second quarter. Despite reporting a decent quarter with a positive surprise on international operating margins, Halliburton still faced concerns over pressure pumping capacity in the U.S. due to natural gas prices.
In the health care sector, DaVita, Inc. provides dialysis services for patients suffering from chronic kidney failure. DaVita benefited in early 2012 from the latest dialysis Epogen utilization data, which remained consistent with expectations; this alleviated investor fears that Medicare may rebase the dialysis bundle reimbursement rate in 2013. DaVita later reported earnings ahead of consensus expectations as a result of lower costs, which have continued to decrease thanks to the continuing decline in Epogen usage as a result of lower FDA recommendations. Epogen, a drug used to combat anemia during dialysis, may have been overused in the past. Later in the second quarter, DaVita announced the acquisition of HealthCare Partners, a physician practice management network; some investors were concerned about potential execution risks, although we have seen DaVita management’s successful track record with such acquisitions in the past. This deal also cemented DaVita’s position as a leader in integrated care, a possible solution to rising healthcare costs. DaVita’s stock ended the period up a healthy 61%.
Turning to producer durables, WESCO International, Inc. is the largest industrial distributor of electrical components in North America for the MRO (maintenance, repair & operations) market with products ranging from wires, connectors, and conduit to lighting systems, motors, and power distribution equipment. Reporting strong growth that was both internally generated and from recent acquisitions, WESCO exceeded expectations for revenues and earnings with good operating margins, which boosted its stock price 35% during the period.
The top contributor for the period hailed from the technology sector: Apple, Inc. designs and markets personal computers, mobile communication and media devices, and portable digital music players and related software, services, peripherals, and third-party applications; their product lines include Mac, iPhone, iPad, and iPod. Apple shares soared by 48%, and we trimmed our position on strength. The company reported a blow-out quarter in the first quarter of 2012 with record highs for revenues and profits led by strong sales of the iPhone and iPad. Apple continued to gain momentum in China as China Telecom Corp will become the nation’s second wireless operator to offer Apple’s iPhone 4S, almost doubling the number of potential iPhone buyers in the world’s largest mobile-phone market. Apple later announced a quarterly dividend and a $10 billion stock buyback program over the next 3 years. The company is also well positioned with sustainable growth drivers such as its foray into the enterprise market, expansion into emerging markets, and new products like Apple TV in the pipeline. American Tower Corp., while classified as a REIT, operates as a
Managers AMG TSCM Growth Equity Fund
Investment Manager’s Comments (continued)
wireless and broadcast communications infrastructure company that leases antenna space on multi-tenant communications sites to wireless service providers, radio and television broadcast companies, wireless data providers, and tenants in various other industries. American Tower shares soared by 39% as the company reported strong results in the second quarter and raised 2012 guidance as a result of higher than expected tower acquisitions. The macro trends in wireless data growth continue to provide a positive environment for the tower companies. QUALCOMM, Inc. designs and manufactures digital wireless telecommunications products and services including CDMA-based (code division multiple access) integrated circuits. Qualcomm has seen particularly robust growth from its CDMA Technologies operation, which provides chipsets for networks and devices using CDMA, GSM, or 4G-LTE systems. The company reported strong results in Q1, driven by their Snapdragon 8960 chip ramping up well, smartphone penetration in China picking up, and positive guidance. Smartphone industry leaders Apple, Samsung, and Nokia are deploying Qualcomm’s hardware in their latest devices; notably, the recently launched Apple iPhone 5 supports faster 4G networks thanks to a chip supplied by Qualcomm. Its shares rose 15% and we trimmed the position on strength. Social networking service and website company Facebook Inc. dropped (44%) during the time we held it over the period. The company reported an in-line quarter during Q3, yet did not provide an outlook. We decided to liquidate our position based on decelerating usage metrics, slowing unit growth, declining margins, and lockup expirations. Informatica Corp., a leading provider of enterprise data integration and data quality software and services worldwide, fell (25%). Informatica’s second quarter results fell short of estimates as a result of internal sales execution issues.
Management acted swiftly to address their sales force deficiencies by installing a new head of worldwide sales, a new head of European
sales, and switched from a regional to a tiered sales structure. Companies are increasingly relying upon their corporate data to shape their operational and strategic decision making.
Following the November election, there is a status quo in terms of the President as well as majorities in both the House and Senate. It remains to be seen if the leadership can put partisan politics aside and avoid the looming “fiscal cliff.” While the ever-shifting macroeconomic environment may influence our discussions with corporate managements, our focus remains on finding those stable businesses with strong growth potential. As always, we remain dedicated to adding value to the assets you have entrusted to us.
This commentary reflects the viewpoints of the portfolio manager, TimesSquare Capital Management, LLC, as of October 31, 2012 and is not intended as a forecast or guarantee of future results, and is subject to change without notice.
CUMULATIVE TOTAL RETURN PERFORMANCE
Managers AMG TSCM Growth Equity Fund’s cumulative total return is based on the daily change in net asset value (NAV), and assumes that all dividends and distributions were reinvested. This chart compares a hypothetical $10,000 investment made in Managers AMG TSCM Growth Equity Fund’s Institutional Class on July 30, 2010 (commencement of operations) to a $10,000 investment made in the Russell 3000® Growth Index for the same time period. Performance for periods longer than one year is annualized. The graph and table do not reflect the deduction of taxes that a shareholder would pay on a Fund distribution or redemption of shares. The listed returns for the Fund are net of expenses and the returns for the index exclude expenses. Past performance is not indicative of future results. Total returns would have been lower had certain expenses not been reduced.
13
Managers AMG TSCM Growth Equity Fund
Investment Manager’s Comments (continued)
CUMULATIVE TOTAL RETURN PERFORMANCE (continued)
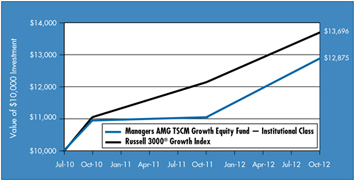
The table below shows the average annual total returns for the Managers AMG TSCM Growth Equity Fund and the Russell 3000® Growth Index for the same time periods ended October 31, 2012.
| | | | | | | | | | | | |
| | | Average Annual Total Returns1 | |
| | | One Year | | | Since Inception | | | Inception Date | |
Managers AMG TSCM Growth Equity Fund2,3,4,5,6 | | | | | | | | | | | | |
Investor Class | | | 15.70 | % | | | 11.39 | % | | | 07/30/10 | |
Service Class | | | 15.93 | % | | | 11.88 | % | | | 07/30/10 | |
Institutional Class | | | 16.26 | % | | | 11.86 | % | | | 07/30/10 | |
Russell 3000® Growth Index7 | | | 12.76 | % | | | 14.95 | % | | | 07/30/10 | † |
The performance data shown represents past performance. Past performance is not a guarantee of future results. Current performance may be lower or higher than the performance data quoted. The investment return and principal value of an investment in the Fund will fluctuate so that an investor’s shares, when redeemed, may be worth more or less than their original cost. For performance information through the most recent month end, please call (800) 835-3879 or visit our Web site at www.managersinvest.com.
Investors should carefully consider the Fund’s investment objectives, risks, charges and expenses before investing. For this and other information, please call (800) 835-3879 or visit our Web site at www.managersinvest.com for a free prospectus. Read it carefully before investing or sending money. Funds are distributed by Managers Distributors, Inc., member FINRA.
| | † | Date reflects inception date of the Fund, not the index. |
| | |
1 | | Total return equals income yield plus share price change and assumes reinvestment of all dividends and capital gain distributions. Returns are net of fees and may reflect offsets of Fund expenses as described in the Prospectus. No adjustment has been made for taxes payable by shareholders on their reinvested dividends and capital gain distributions. Returns for periods greater than one year are the average annual return. The listed returns on the Fund are net of expenses and based on the published NAV as of October 31, 2012. All returns are in U.S. dollars ($). |
2 | | The Fund invests in growth stocks, which may be more sensitive to market movements because their prices tend to reflect future investor expectations rather than just current profits. Growth stocks may underperform value stocks during given periods. |
3 | | The Fund invests in large-capitalization companies that may underperform other stock funds (such as funds that focus on small- and medium-capitalization companies) when stocks of large-capitalization companies are out of favor. The Fund is subject to risks associated with small- and mid-capitalization companies, such as erratic earnings patterns, competitive conditions, limited earnings history, and a reliance on one or a limited number of products. |
4 | | A greater percentage of the Fund’s holdings may be focused in a smaller number of securities which may place the Fund at greater risk than a more diversified fund. |
5 | | From time to time, the Fund’s advisor has waived its fees and/or absorbed Fund expenses, which has resulted in higher returns. |
6 | | Investing in public offerings (IPOs) is risky and the prices of stocks purchased in IPOs tend to fluctuate more widely than stocks of companies that have been publicly traded for a longer period of time. Stocks purchased in IPOs generally do not have a trading history, and information about the companies may be available for very limited periods. |
7 | | The Russell 3000® Growth Index measures the performance of those Russell 3000® companies with higher price-to-book ratios and higher forecasted growth values. Unlike the Fund, the above stated index is unmanaged, is not available for investment, and does not incur expenses. |
The Russell 3000® Growth Index is a registered trademark of Russell Investments. Russell® is a trademark of Russell Investments. Not FDIC insured, nor bank guaranteed. May lose value. |
14
Managers AMG TSCM Growth Equity Fund
Fund Snapshots
October 31, 2012
Portfolio Breakdown (unaudited)
| | | | | | | | |
Industry | | Managers AMG
TSCM Growth
Equity Fund** | | | Russell 3000®
Growth Index | |
Information Technology | | | 35.6 | % | | | 30.7 | % |
Industrials | | | 20.6 | % | | | 12.7 | % |
Health Care | | | 11.5 | % | | | 12.6 | % |
Financials | | | 9.9 | % | | | 4.7 | % |
Consumer Discretionary | | | 9.2 | % | | | 16.6 | % |
Consumer Staples | | | 7.6 | % | | | 12.3 | % |
Energy | | | 4.4 | % | | | 4.1 | % |
Materials | | | 0.0 | % | | | 3.9 | % |
Telecommunication Services | | | 0.0 | % | | | 2.2 | % |
Utilities | | | 0.0 | % | | | 0.2 | % |
Other Assets and Liabilities | | | 1.2 | % | | | 0.0 | % |
| ** | As a percentage of net assets. |
Top Ten Holdings (unaudited)
| | | | |
Security Name | | % of
Net Assets | |
Apple, Inc.* | | | 6.8 | % |
DaVita, Inc.* | | | 5.8 | |
Clean Harbors, Inc. | | | 3.8 | |
American Tower Corp.* | | | 3.7 | |
eBay, Inc.* | | | 3.6 | |
Nielsen Holdings N.V.* | | | 3.5 | |
Coach, Inc.* | | | 3.4 | |
Costco Wholesale Corp. | | | 3.2 | |
United Parcel Service, Inc., Class B* | | | 3.2 | |
NeuStar, Inc., Class A | | | 3.1 | |
| | | | |
Top Ten as a Group | | | 40.1 | % |
| | | | |
| * | Top Ten Holding at April 30, 2012 |
Any sectors, industries, or securities discussed should not be perceived as investment recommendations. Mention of a specific security should not be considered a recommendation to buy or solicitation to sell that security. Specific securities mentioned in this report may have been sold from the Fund’s portfolio of investments by the time you receive this report.
15
Managers AMG TSCM Growth Equity Fund
Schedule of Portfolio Investments
October 31, 2012
| | | | | | | | |
| | | Shares | | | Value | |
| | | | | | | | |
Common Stocks - 98.8% | | | | | | | | |
Consumer
Discretionary - 9.2% | | | | | | | | |
Coach, Inc. | | | 15,335 | | | $ | 859,527 | |
Starbucks Corp. | | | 15,410 | | | | 707,319 | |
Virgin Media, Inc. | | | 23,120 | | | | 756,949 | |
Total Consumer Discretionary | | | | | | | 2,323,795 | |
Consumer Staples - 7.6% | | | | | | | | |
Colgate-Palmolive Co. | | | 4,585 | | | | 481,242 | |
Costco Wholesale Corp. | | | 8,325 | | | | 819,430 | |
Natural Grocers By Vitamin Cottage, Inc.* | | | 30,360 | | | | 615,701 | |
Total Consumer Staples | | | | | | | 1,916,373 | |
Energy - 4.4% | | | | | | | | |
Anadarko Petroleum Corp. | | | 8,090 | | | | 556,673 | |
National Oilwell Varco, Inc. | | | 7,525 | | | | 554,592 | |
Total Energy | | | | | | | 1,111,265 | |
Financials - 9.9% | | | | | | | | |
American Tower Corp. | | | 12,335 | | | | 928,702 | |
Marsh & McLennan Cos., Inc. | | | 14,960 | | | | 509,089 | |
Montpelier Re Holdings, Ltd. | | | 32,865 | | | | 751,622 | |
NASDAQ OMX Group, Inc., The | | | 13,475 | | | | 320,840 | |
Total Financials | | | | | | | 2,510,253 | |
Health Care - 11.5% | | | | | | | | |
Celldex Therapeutics, Inc.* | | | 78,100 | | | | 430,331 | |
DaVita, Inc.* | | | 13,130 | | | | 1,477,388 | |
GlaxoSmithKline PLC, ADR | | | 14,380 | | | | 645,662 | |
Shire PLC, ADR | | | 4,455 | | | | 375,957 | |
Total Health Care | | | | | | | 2,929,338 | |
Industrials - 20.6% | | | | | | | | |
Albany International Corp., Class A | | | 14,930 | | | | 328,012 | |
AMETEK, Inc. | | | 12,120 | | | | 430,866 | |
Clean Harbors, Inc.* | | | 16,555 | | | | 965,984 | |
| | | | | | | | |
| | | Shares | | | Value | |
| | | | | | | | |
Corporate Executive Board Co., The | | | 11,820 | | | $ | 531,427 | |
Danaher Corp. | | | 12,195 | | | | 630,847 | |
Nielsen Holdings N.V.* | | | 30,690 | | | | 887,555 | |
United Parcel Service, Inc., Class B | | | 11,090 | | | | 812,342 | |
WESCO International, Inc.* | | | 9,995 | | | | 648,476 | |
Total Industrials | | | | | | | 5,235,509 | |
Information
Technology - 35.6% | | | | | | | | |
Alliance Data Systems Corp.* | | | 3,965 | | | | 567,193 | |
Altera Corp. | | | 21,590 | | | | 658,063 | |
Apple, Inc. | | | 2,897 | | | | 1,724,005 | |
ASML Holding N.V. | | | 14,040 | | | | 771,779 | |
Citrix Systems, Inc.* | | | 9,755 | | | | 602,957 | |
eBay, Inc.* | | | 18,890 | | | | 912,198 | |
Google, Inc., Class A* | | | 1,044 | | | | 709,680 | |
Informatica Corp.* | | | 9,835 | | | | 266,922 | |
Intuit, Inc. | | | 9,380 | | | | 557,360 | |
Mastercard, Inc., Class A | | | 1,099 | | | | 506,562 | |
NeuStar, Inc., Class A* | | | 21,610 | | | | 790,710 | |
QUALCOMM, Inc. | | | 8,725 | | | | 511,067 | |
Teradata Corp.* | | | 6,840 | | | | 467,240 | |
Total Information Technology | | | | | | | 9,045,736 | |
Total Common Stocks
(cost $21,893,197) | | | | | | | 25,072,269 | |
Other Investment
Companies - 2.2%2 | | | | | | | | |
Dreyfus Cash Management Fund, Institutional Class Shares,
0.07% (cost $555,553) | | | 555,553 | | | | 555,553 | |
Total Investments - 101.0%
(cost $22,448,750) | | | | | | | 25,627,822 | |
Other Assets, less
Liabilities - (1.0)% | | | | | | | (242,492 | ) |
Net Assets - 100.0% | | | | | | $ | 25,385,330 | |
The accompanying notes are an integral part of these financial statements.
16
Managers Micro-Cap Fund
Investment Manager’s Comments
The Managers Micro-Cap Fund primarily invests in the stocks of U.S. micro-capitalization companies. Normally the Fund will invest at least 80% of its net assets in U.S. micro-cap stocks. The Fund employs multiple portfolio managers who specialize in distinct investment approaches. This “intelligence diversification” not only serves to manage risk, but also seeks to incorporate into the Portfolio the breadth of the micro-cap market by focusing different analytical insights on micro-cap investing. The Fund’s team of subadvisors strives to achieve this performance and diversification while ensuring that the Fund operates within the framework of its investment objective and principal investment strategies. The Russell Microcap® Index is the benchmark for the Fund.
The Portfolio Managers
Lord, Abbett & Co., LLC (“Lord Abbett”)
The team focuses its stock selection effort on companies that have revenue growth of at least 15%, are experiencing year-to-year operating margin improvement, and are experiencing earnings growth that is driven by top-line growth rather than being driven by one-time events or simple cost-cutting measures. The focus is also on identifying companies with higher-quality balance sheets (often captured by finding companies with manageable debt-to-total-capital ratios) and that are already profitable. Once this process is completed, the focus for the team is on forecasting both revenue and earnings growth over the next several years. To achieve this goal, and to find companies that are expected to grow faster than their industry average, members of the team spend an extensive amount of time understanding the competitive advantages of a firm, the industry dynamics within which they operate, and the strength of management.
The sell discipline is enacted if there is a fundamental change in the business, a more attractive alternative is found, or if a holding reaches a 5% weight in the overall Portfolio. The Lord Abbett Portfolio typically holds between 75 and 100 stocks with no individual holding typically exceeding 5%. There is a risk constraint that prevents any individual industry from being greater than 25% of the total portfolio weight. The annual turnover of the Portfolio is expected to be relatively high although there is no explicit target as part of either the stock selection or the portfolio-construction process.
Next Century Growth Investors, LLC (“Next Century”)
The team requires historical revenue growth of at least 15% for a company before conducting further research. Other key factors considered initially by the team are strong historical revenue growth, low debt, and high ROE. Quantitative screening is done on a regular basis to see which stocks over the past year are experiencing significant growth. The next stage of this process involves intensive first-hand research to determine the growth prospects of a company with the team choosing a stock only when it has become convinced a company has an extraordinary opportunity to grow their business. The uniqueness of this process lies in the fact that the team seeks out these companies regardless of their short-term prospects and\or current valuation. The team is looking for “home runs” and companies that will grow to the point that they will eventually reach a small-market capitalization.
The sell discipline is enacted if there is a change in the original investment thesis or a fundamental change in business of the company. In addition, a holding will become a candidate for sale if it reaches an extreme valuation, becomes larger than 5% of the overall Portfolio or as it approaches $1 billion in market capitalization. Typically, companies are sold out of the micro-cap Portfolio because they have approached $1 billion in market capitalization.
The Next Century portion of the Portfolio is concentrated and typically has 40-60 holdings, which can create a high level of volatility. The only risk constraints are that sector weights can not exceed two times the Russell 2000® Growth sector weights, and no individual holding can be greater than 5% of the Portfolio.
RBC Global Asset Management (U.S.) Inc. (“RBC”)
The team uses an investment process that focuses on generating solid stock selection by identifying companies with strong, long-term, attractive business fundamentals that are selling at low valuations. In order to initially generate ideas, the team at RBC uses quantitative screens and industry research to concentrate stock selection on a narrower sub-universe of micro-cap companies. The team then focuses a majority of its time on conducting intensive “on-the-ground” fundamental research in order to uncover these opportunities. The focus is on identifying companies with long-term, solid business fundamentals and near-term profitability improvement potential. In terms of short-term factors, the team looks for companies that have shown institutional investor neglect or avoidance and sizeable insider ownership with the potential for both improving profit margins and accelerating earnings in the near future. In terms of long-term factors, the team looks for companies with proven products or services that are leading in market share within their respective industries while maintaining a sustainable competitive advantage and a solid balance sheet.
The resulting portfolio that is generated by this stock selection process tends to exhibit low turnover with company stocks generally held for several years. The Portfolio is well diversified with anywhere from 60 to 90 holdings with a maximum of 5% in any single holding.
WEDGE Capital Management L.L.P. (“WEDGE”)
The investment process is a combination of both quantitative and fundamental research insights. The quantitative portion of the investment process uses commonly found factors and characteristics that can be accessed via any number of commercial databases. The value-added portion of the process, therefore, uses a number of different factors across five major categories: valuation, earnings quality, operating efficiency, capital usage and momentum, whose efficacy has been verified via long-term regression analysis. This is referred to as the Fundamental Value model. The top results of this model are combined with the best resulting stocks from the Financial Quality model, which measures stocks across categories such as multiple earnings growth, profitability, leverage, and liquidity. The top stocks that appear in both models are eligible for fundamental research. The fundamental research portion of the investment process is exclusionary in nature and meant to eliminate stocks that are not strong in earnings forecasts, valuation metrics,
Managers Micro-Cap Fund
Investment Manager’s Comments (continued)
sector\industry outlook, or any factor that can not be easily captured quantitatively.
A stock is scrutinized for possible sale if it falls below the top four deciles in the Fundamental Value model. Stocks are sold when they become fairly valued, an upgrade opportunity develops, or the original investment thesis materially deteriorates. The portion of the Portfolio managed by WEDGE is confined to plus or minus 10% in any given sector, although sector positions tend to be much closer to the Index weight than this (it should be noted that these self-imposed sector weighting constraints are based on a proprietary liquidity analysis conducted on an ongoing basis by the micro-cap team and is NOT driven by the sector weightings of any micro-cap benchmark). The final Portfolio seeks to be a well-diversified, micro-cap Portfolio holding approximately 150 securities and consistently maintaining a value bias relative to the benchmark. The Portfolio tends to hold securities within the $40 million to $400 million market capitalization range, although it does not require a sale of a holding until it reaches $800 million in market capitalization.
THE YEAR IN REVIEW
Over the past year, equities within the U.S. posted solid gains despite ongoing macroeconomic headwinds that continue to threaten what has been, thus far, a somewhat muted recovery from the recent deep recession. While equities within the U.S. posted double-digit gains across the market capitalization spectrum, these gains were achieved in fitful spurts as the “risk on, risk off” environment continued to spook investors. Investors continue to remain skeptical of the sustainability of equity market returns with U.S. equity funds still sharply in net redemption by the end of the period. Investors tentatively entered the fourth quarter firmly focused upon the impact of the U.S. elections along with the fast approaching fiscal cliff and their potential impact on the ‘real’ economy and their consequences for risk-based assets such as U.S. equities as well. Against this backdrop, micro-cap equities delivered returns of 16.0%, as measured by the Russell Microcap® Index, which outpaced returns of their large-cap and small-cap brethren, which returned 14.3% and 14.1%, respectively, as measured by the Russell 1000® and Russell 2000® Indexes.
For the 12 months ended October 31, 2012, the Managers Micro-Cap Fund (Service Class) returned 11.55%, compared with 16.49%
for its benchmark, the Russell Microcap® Index. Despite delivering solid absolute returns during the year, the Fund underperformed its benchmark. A majority of the underperformance was driven by the Fund’s relative sector selection which is primarily a fallout of the stock selection process for each of the Fund’s subadvisors. Most notably, the Fund’s significant underweight to the financials sector, one of the best performers of the last year, detracted from performance. In addition, the overweight to the underperforming information technology sector was also a detractor to performance. The Fund had mixed stock selection results throughout the year. While there was strength from the Fund’s information technology and energy holdings, these contributions were mitigated by holdings within the consumer discretionary and health care sectors.
Looking Forward
The portfolio managers are cautiously optimistic about forward-looking prospects for micro-cap equities. The portfolio managers believe that each of their respective investment processes, focused on finding companies with solid secular growth prospects, have the potential to perform well when macroeconomic issues, such as the impending “fiscal cliff,” is resolved. The Fund generally remains positioned for ongoing economic recovery with overweights in economically sensitive consumer discretionary, industrials, and information technology sectors. The portfolio managers continue to avoid financials, despite a solid prior year for the sector, and maintain a large underweight (17%) to this sector relative to the benchmark.
CUMULATIVE TOTAL RETURN PERFORMANCE
Managers Micro-Cap Fund’s (Service) cumulative total return is based on the daily change in net asset value (NAV), and assumes that all distributions were reinvested. This chart compares a hypothetical $10,000 investment made in the Managers Micro-Cap Fund’s Service Class on October 31, 2002 to a $10,000 investment made in the Russell 2000® Growth Index for the same time period. The graph and table do not reflect the deduction of taxes that a shareholder would pay on a fund distribution or redemption of shares. Past performance is not indicative of future results.
18
Managers Micro-Cap Fund
Investment Manager’s Comments (continued)
CUMULATIVE TOTAL RETURN PERFORMANCE (continued)
The table below shows the average annual total returns for the Managers Micro-Cap Fund and the Russell Microcap® and 2000® indices for the same time periods ended October 31, 2012.
| | | | | | | | | | | | | | | | | | | | |
| | | Average Annual Total Returns1 | |
| | | One Year | | | Five Years | | | Ten Years | | | Since Inception | | | Inception Date | |
Managers Micro-Cap Fund2,3 | | | | | | | | | | | | | | | | | | | | |
Service Class | | | 11.55 | % | | | 0.57 | % | | | 8.87 | % | | | 12.32 | % | | | 06/30/94 | |
Institutional Class4 | | | 11.84 | % | | | — | | | | — | | | | — | | | | 10/01/11 | |
Russell Microcap® Index5 | | | 16.49 | % | | | (1.05 | )% | | | 8.63 | % | | | — | | | | 06/30/00 | |
Russell 2000® Index6 | | | 12.08 | % | | | 1.19 | % | | | 9.58 | % | | | 8.35 | % | | | 06/30/94 | † |
The performance data shown represents past performance. Past performance is not a guarantee of future results. Current performance may be lower or higher than the performance data quoted. The investment return and principal value of an investment in the Fund will fluctuate so that an investor’s shares, when redeemed, may be worth more or less than their original cost. For performance information through the most recent month end, please call (800) 835-3879 or visit our website at www.managersinvest.com.
Investors should carefully consider the Fund’s investment objectives, risks, charges and expenses before investing. For this and other information, please call (800) 835-3879 or visit our Web site at www.managersinvest.com for a free prospectus. Read it carefully before investing or sending money. Funds are distributed by Managers Distributors, Inc., member FINRA.
| | † | Date reflects inception date of the Fund, not the index. |
| | |
1 Total return equals income yield plus share price change and assumes reinvestment of all dividends and capital gain distributions. Returns are net of fees and may reflect offsets of Fund expenses as described in the Prospectus. No adjustment has been made for taxes payable by shareholders on their reinvested dividends and capital gain distributions. Returns for periods greater than one year are the average annual return. The listed returns on the Fund are net of expenses and based on the published NAV as of October 31, 2012. All returns are in U.S. dollars ($). 2 The Fund is subject to the special risks associated with investments in micro-cap companies, such as relatively short earnings histories, competitive conditions, less publicly available corporate information, and reliance on a limited number of products. 3 From time to time, the Fund’s advisor has waived its fees and/or absorbed Fund expenses, which has resulted in higher returns. 4 Commencement of operations for this class was October 1, 2011. 5 Performance in the Russell Microcap® Index reflects an inception date of June 30, 2000. The Russell Microcap® Index tracks the micro-cap segment of the U.S. equity market. It makes up less than 3% of the U.S. equity market and is represented by the smallest 1,000 securities in the small-cap Russell 2000® Index plus the next 1,000 securities. Unlike the Fund, the above stated index is unmanaged, is not available for investment, and does not incur expenses. |
6 | | The Russell 2000® Index is composed of the 2,000 smallest stocks in the Russell 3000® Index and is widely regarded in the industry as the premier measure of small-cap stock performance. Unlike the Fund, the stated index is unmanaged, is not available for investment, and does not incur expenses. |
| |
| The Russell Microcap® Index and the Russell 2000® Index are trademarks of Russell Investments. Russell® is a trademark of Russell Investments. |
| |
| Not FDIC insured, nor bank guaranteed. May lose value. |
19
Managers Micro-Cap Fund
Fund Snapshots
October 31, 2012
Portfolio Breakdown (unaudited)
| | | | | | | | | | | | |
Industry | | Managers
Micro-Cap Fund** | | | Russell
Microcap® Index | | | Russell
2000® Index | |
Information Technology | | | 20.5 | % | | | 14.5 | % | | | 16.7 | % |
Industrials | | | 19.0 | % | | | 13.0 | % | | | 15.4 | % |
Consumer Discretionary | | | 17.6 | % | | | 11.8 | % | | | 14.0 | % |
Health Care | | | 15.7 | % | | | 17.4 | % | | | 12.4 | % |
Financials | | | 11.7 | % | | | 28.7 | % | | | 22.3 | % |
Materials | | | 4.4 | % | | | 4.5 | % | | | 5.1 | % |
Energy | | | 3.5 | % | | | 4.3 | % | | | 6.0 | % |
Consumer Staples | | | 2.9 | % | | | 2.8 | % | | | 3.7 | % |
Telecommunication Services | | | 0.9 | % | | | 1.8 | % | | | 0.7 | % |
Utilities | | | 0.6 | % | | | 1.2 | % | | | 3.7 | % |
Other Assets and Liabilities | | | 3.2 | % | | | 0.0 | % | | | 0.0 | % |
| ** | As a percentage of net assets. |
Top Ten Holdings (unaudited)
| | | | |
Security Name | | %of
Net Assets | |
AZZ, Inc.* | | | 1.3 | % |
Steinway Musical Instruments, Inc.* | | | 1.2 | |
Universal Stainless & Alloy* | | | 1.1 | |
Columbus McKinnon Corp.* | | | 1.1 | |
Tyler Technologies, Inc.* | | | 1.0 | |
RG Barry Corp. | | | 1.0 | |
Imperva, Inc. | | | 1.0 | |
Eloqua, Inc. | | | 1.0 | |
US Physical Therapy, Inc. | | | 0.9 | |
Vocera Communications, Inc. | | | 0.9 | |
| | | | |
Top Ten as a Group | | | 10.5 | % |
| | | | |
| * | Top Ten Holding at April 30, 2012 |
Any sectors, industries, or securities discussed should not be perceived as investment recommendations. Mention of a specific security should not be considered a recommendation to buy or solicitation to sell that security. Specific securities mentioned in this report may have been sold from the Fund’s portfolio of investments by the time you receive this report.
20
Managers Micro-Cap Fund
Schedule of Portfolio Investments
October 31, 2012
| | | | | | | | |
| | | Shares | | | Value | |
| | | | | | | | |
Common Stocks - 96.8% | | | | | | | | |
Consumer
Discretionary - 17.6% | | | | | | | | |
Acquity Group, Ltd., ADR* | | | 33,675 | | | $ | 337,423 | |
Arctic Cat, Inc.* | | | 22,975 | | | | 833,304 | |
Big 5 Sporting Goods Corp. | | | 18,400 | | | | 164,312 | |
Black Diamond, Inc.* | | | 22,104 | | | | 209,988 | |
Blue Nile, Inc.* | | | 10,500 | | | | 396,585 | |
Books-A-Million, Inc.* | | | 21,600 | | | | 63,720 | |
Bridgepoint Education, Inc.*,1 | | | 17,100 | | | | 171,000 | |
Cache, Inc.* | | | 90,654 | | | | 249,298 | |
Caribou Coffee Co., Inc.* | | | 19,700 | | | | 235,809 | |
Carrols Restaurant Group, Inc.* | | | 14,800 | | | | 95,016 | |
Casual Male Retail Group, Inc.* | | | 337,120 | | | | 1,301,283 | |
Chuy’s Holdings, Inc.* | | | 38,382 | | | | 937,672 | |
Core-Mark Holding Co, Inc. | | | 5,533 | | | | 264,865 | |
Culp, Inc. | | | 8,100 | | | | 102,384 | |
Delta Apparel, Inc.* | | | 44,700 | | | | 676,758 | |
Destination Maternity Corp. | | | 12,085 | | | | 229,132 | |
Einstein Noah Restaurant Group, Inc. | | | 14,500 | | | | 223,735 | |
Famous Dave’s Of America, Inc.* | | | 7,425 | | | | 58,509 | |
Fiesta Restaurant Group, Inc.* | | | 10,500 | | | | 138,810 | |
Fred’s, Inc., Class A | | | 11,250 | | | | 152,438 | |
G-III Apparel Group, Ltd.* | | | 15,076 | | | | 557,209 | |
Gordmans Stores, Inc.* | | | 21,500 | | | | 323,790 | |
Grand Canyon Education, Inc.* | | | 47,433 | | | | 1,032,142 | |
Haverty Furniture Cos., Inc. | | | 12,650 | | | | 189,877 | |
Hibbett Sports, Inc.* | | | 6,699 | | | | 361,679 | |
Hooker Furniture Corp. | | | 14,285 | | | | 194,847 | |
Hovnanian Enterprises, Inc., Class A* | | | 75,243 | | | | 323,545 | |
Ignite Restaurant Group, Inc.* | | | 21,903 | | | | 251,008 | |
iRobot Corp.* | | | 12,497 | | | | 224,571 | |
Johnson Outdoors, Inc., Class A* | | | 3,825 | | | | 74,626 | |
LifeLock, Inc.* | | | 55,700 | | | | 403,825 | |
Lifetime Brands, Inc. | | | 6,900 | | | | 76,590 | |
Lithia Motors, Inc., Class A | | | 10,982 | | | | 375,584 | |
Lumber Liquidators Holdings, Inc.* | | | 14,415 | | | | 804,645 | |
M/I Homes, Inc.* | | | 33,052 | | | | 735,407 | |
Mac-Gray Corp. | | | 25,204 | | | | 327,652 | |
Marcus Corp. | | | 30,425 | | | | 331,632 | |
Modine Manufacturing Co.* | | | 22,700 | | | | 154,360 | |
Multimedia Games Holding Co, Inc.* | | | 10,450 | | | | 166,155 | |
Red Robin Gourmet Burgers, Inc.* | | | 19,300 | | | | 644,620 | |
Rentrak Corp.* | | | 13,086 | | | | 222,331 | |
| | | | | | | | |
| | | Shares | | | Value | |
| | | | | | | | |
RG Barry Corp. | | | 95,186 | | | $ | 1,450,635 | |
Rocky Brands, Inc.* | | | 6,325 | | | | 75,963 | |
rue21, Inc.* | | | 21,537 | | | | 648,479 | |
Saga Communications, Inc., Class A* | | | 2,000 | | | | 84,840 | |
Shutterstock, Inc.* | | | 27,600 | | | | 655,500 | |
Smith & Wesson Holding Corp.* | | | 36,100 | | | | 346,560 | |
SodaStream International, Ltd.* | | | 12,900 | | | | 461,175 | |
Standard Motor Products, Inc. | | | 18,450 | | | | 346,491 | |
Stein Mart, Inc.* | | | 20,600 | | | | 161,916 | |
Steinway Musical Instruments, Inc.* | | | 68,349 | | | | 1,649,945 | |
Tile Shop Holdings, Inc.* | | | 41,024 | | | | 589,925 | |
Tilly’s, Inc.* | | | 65,779 | | | | 1,061,673 | |
Tower International, Inc.* | | | 9,800 | | | | 69,384 | |
Town Sports International Holdings, Inc.* | | | 12,600 | | | | 158,760 | |
True Religion Apparel, Inc. | | | 20,100 | | | | 515,565 | |
Universal Electronics, Inc.* | | | 75,900 | | | | 1,302,444 | |
West Marine, Inc.* | | | 15,600 | | | | 161,304 | |
Zagg, Inc.* | | | 61,400 | | | | 440,852 | |
Total Consumer Discretionary | | | | | | | 24,799,547 | |
Consumer
Staples - 2.9% | | | | | | | | |
Annie’s, Inc.* | | | 30,586 | | | | 1,208,148 | |
Farmer Bros Co.* | | | 8,100 | | | | 78,813 | |
Nash Finch Co. | | | 26,200 | | | | 503,826 | |
Natural Grocers By Vitamin Cottage, Inc.* | | | 18,146 | | | | 368,001 | |
Omega Protein Corp.* | | | 26,125 | | | | 170,074 | |
Pantry, Inc., The* | | | 17,275 | | | | 229,153 | |
Schiff Nutrition International, Inc.* | | | 12,055 | | | | 407,941 | |
Smart Balance, Inc.* | | | 40,800 | | | | 485,520 | |
Spartan Stores, Inc. | | | 21,150 | | | | 303,714 | |
SunOpta, Inc.* | | | 54,200 | | | | 325,200 | |
Total Consumer Staples | | | | | | | 4,080,390 | |
Energy - 3.5% | | | | | | | | |
Bolt Technology Corp. | | | 6,000 | | | | 86,400 | |
GasLog, Ltd.* | | | 49,900 | | | | 575,846 | |
Geospace Technologies Corp.* | | | 19,205 | | | | 1,243,140 | |
Global Geophysical Services, Inc.* | | | 66,085 | | | | 305,313 | |
Gulf Island Fabrication, Inc. | | | 12,291 | | | | 291,665 | |
Gulfport Energy Corp.* | | | 34,900 | | | | 1,157,982 | |
Mitcham Industries, Inc.* | | | 15,200 | | | | 205,960 | |
Natural Gas Services Group, Inc.* | | | 12,450 | | | | 197,457 | |
Panhandle Oil And Gas, Inc., Class A | | | 5,350 | | | | 144,878 | |
RigNet, Inc.* | | | 30,915 | | | | 574,092 | |
TGC Industries, Inc.* | | | 13,035 | | | | 95,938 | |
Total Energy | | | | | | | 4,878,671 | |
The accompanying notes are an integral part of these financial statements.
21
Managers Micro-Cap Fund
Schedule of Portfolio Investments (continued)
| | | | | | | | |
| | | Shares | | | Value | |
| | | | | | | | |
Financials - 11.7% | | | | | | | | |
AMERISAFE, Inc.* | | | 45,375 | | | $ | 1,191,094 | |
Associated Estates Realty Corp. | | | 21,018 | | | | 315,060 | |
Bank of Marin Bancorp | | | 6,150 | | | | 229,580 | |
Boston Private Financial Holdings, Inc. | | | 26,300 | | | | 242,486 | |
Cardinal Financial Corp. | | | 18,650 | | | | 297,840 | |
CoBiz Financial, Inc. | | | 33,100 | | | | 236,003 | |
Community Trust Bancorp, Inc. | | | 9,261 | | | | 314,133 | |
Compass Diversified Holdings | | | 86,700 | | | | 1,248,480 | |
Eagle Bancorp, Inc.* | | | 4,700 | | | | 98,042 | |
eHealth, Inc.* | | | 57,069 | | | | 1,238,398 | |
Financial Institutions, Inc. | | | 10,075 | | | | 191,828 | |
First Merchants Corp. | | | 17,550 | | | | 258,160 | |
Flushing Financial Corp. | | | 20,850 | | | | 324,217 | |
Great Southern Bancorp, Inc. | | | 2,900 | | | | 82,273 | |
Heartland Financial USA, Inc. | | | 3,175 | | | | 91,123 | |
Hilltop Holdings, Inc.* | | | 26,200 | | | | 356,058 | |
Home BancShares, Inc. | | | 6,500 | | | | 225,160 | |
Home Loan Servicing Solutions, Ltd. | | | 50,906 | | | | 987,576 | |
Kite Realty Group Trust | | | 31,300 | | | | 171,211 | |
Lakeland Financial Corp. | | | 12,900 | | | | 344,301 | |
LaSalle Hotel Properties | | | 16,600 | | | | 397,404 | |
Marlin Business Services Corp. | | | 26,588 | | | | 600,623 | |
Meadowbrook Insurance Group, Inc. | | | 27,283 | | | | 153,330 | |
Mission West Properties, Inc. | | | 9,894 | | | | 81,922 | |
National Bankshares, Inc. | | | 7,700 | | | | 242,550 | |
National Interstate Corp. | | | 28,700 | | | | 744,765 | |
Netspend Holdings, Inc.* | | | 79,000 | | | | 846,090 | |
Northrim BanCorp, Inc. | | | 33,126 | | | | 746,329 | |
OceanFirst Financial Corp. | | | 12,550 | | | | 174,947 | |
Piper Jaffray Cos.* | | | 10,000 | | | | 268,500 | |
Ramco-Gershenson Properties Trust | | | 18,750 | | | | 243,000 | |
SeaBright Holdings, Inc. | | | 22,200 | | | | 243,534 | |
Southside Bancshares, Inc. | | | 11,742 | | | | 239,657 | |
SY Bancorp, Inc. | | | 14,090 | | | | 332,242 | |
Territorial Bancorp, Inc. | | | 7,525 | | | | 170,065 | |
United Financial Bancorp, Inc. | | | 11,700 | | | | 179,829 | |
Urstadt Biddle Properties, Inc., Class A | | | 9,000 | | | | 170,460 | |
ViewPoint Financial Group, Inc. | | | 20,548 | | | | 427,398 | |
Walker & Dunlop, Inc.* | | | 16,500 | | | | 274,065 | |
Washington Banking Co. | | | 32,300 | | | | 441,541 | |
Washington Trust Bancorp, Inc. | | | 9,675 | | | | 261,128 | |
West Bancorporation, Inc. | | | 6,925 | | | | 75,552 | |
Western Alliance Bancorp* | | | 65,472 | | | | 671,743 | |
Total Financials | | | | | | | 16,429,697 | |
| | | | | | | | |
| | | Shares | | | Value | |
| | | | | | | | |
Health Care - 15.7% | | | | | | | | |
ABIOMED, Inc.* | | | 22,545 | | | $ | 446,842 | |
Achillion Pharmaceuticals, Inc.* | | | 69,332 | | | | 654,494 | |
Aegerion Pharmaceuticals, Inc.* | | | 12,100 | | | | 272,008 | |
Affymax, Inc.* | | | 41,280 | | | | 940,771 | |
Albany Molecular Research, Inc.* | | | 27,100 | | | | 95,934 | |
AMN Healthcare Services, Inc.* | | | 30,600 | | | | 303,552 | |
Array BioPharma, Inc.* | | | 131,600 | | | | 544,824 | |
BioScrip, Inc.* | | | 95,400 | | | | 878,634 | |
Cantel Medical Corp. | | | 12,862 | | | | 334,541 | |
Celldex Therapeutics, Inc.* | | | 104,613 | | | | 576,418 | |
Conceptus, Inc.* | | | 32,194 | | | | 606,535 | |
Cross Country Healthcare, Inc.* | | | 37,800 | | | | 166,320 | |
Cutera, Inc.* | | | 28,848 | | | | 213,764 | |
Cynosure, Inc., Class A* | | | 20,720 | | | | 545,765 | |
DexCom, Inc.* | | | 52,835 | | | | 692,138 | |
Dynavax Technologies Corp.* | | | 103,198 | | | | 427,240 | |
Endologix, Inc.* | | | 38,252 | | | | 514,872 | |
Ensign Group, Inc., The | | | 5,475 | | | | 159,651 | |
Exactech, Inc.* | | | 37,500 | | | | 626,250 | |
Fluidigm Corp.* | | | 45,418 | | | | 685,358 | |
Genomic Health, Inc.* | | | 10,406 | | | | 325,187 | |
Greenway Medical Technologies* | | | 37,496 | | | | 622,059 | |
HealthStream, Inc.* | | | 47,245 | | | | 1,206,637 | |
Insulet Corp.* | | | 43,781 | | | | 928,595 | |
IPC The Hospitalist Co., Inc.* | | | 7,900 | | | | 272,471 | |
Meridian Bioscience, Inc. | | | 18,700 | | | | 369,325 | |
Metropolitan Health Networks, Inc.* | | | 26,650 | | | | 291,284 | |
MWI Veterinary Supply, Inc.* | | | 3,508 | | | | 368,410 | |
Natus Medical, Inc.* | | | 25,900 | | | | 292,670 | |
Novadaq Technologies, Inc.* | | | 50,300 | | | | 578,450 | |
OraSure Technologies, Inc.* | | | 49,512 | | | | 448,579 | |
Pacira Pharmaceuticals, Inc.* | | | 33,685 | | | | 534,918 | |
PharMerica Corp.* | | | 12,900 | | | | 157,638 | |
Pozen, Inc.* | | | 13,400 | | | | 80,266 | |
Puma Biotechnology, Inc.* | | | 12,397 | | | | 255,378 | |
Rigel Pharmaceuticals, Inc.* | | | 69,400 | | | | 618,354 | |
RTI Biologics, Inc.* | | | 36,800 | | | | 149,408 | |
Sarepta Therapeutics, Inc.* | | | 28,627 | | | | 610,041 | |
Spectranetics Corp.* | | | 15,690 | | | | 228,446 | |
SurModics, Inc.* | | | 29,060 | | | | 522,499 | |
Synergetics USA, Inc.* | | | 33,150 | | | | 145,197 | |
US Physical Therapy, Inc. | | | 49,576 | | | | 1,323,679 | |
Utah Medical Products, Inc. | | | 2,400 | | | | 81,648 | |
The accompanying notes are an integral part of these financial statements.
22
Managers Micro-Cap Fund
Schedule of Portfolio Investments (continued)
| | | | | | | | |
| | | Shares | | | Value | |
| | | | | | | | |
Health Care - 15.7% (continued) | | | | | | | | |
Vascular Solutions, Inc.* | | | 38,200 | | | $ | 575,674 | |
Vocera Communications, Inc.* | | | 48,549 | | | | 1,305,482 | |
Young Innovations, Inc. | | | 4,347 | | | | 148,450 | |
Total Health Care | | | | | | | 22,126,656 | |
Industrials - 19.0% | | | | | | | | |
Acacia Research Corp.* | | | 44,200 | | | | 1,147,874 | |
ACCO Brands Corp.* | | | 100,400 | | | | 726,896 | |
Aceto Corp. | | | 17,200 | | | | 172,344 | |
Air Transport Services Group, Inc.* | | | 132,800 | | | | 511,280 | |
Alamo Group, Inc. | | | 5,359 | | | | 179,527 | |
Allied Defense Group Inc, The*,4 | | | 38,600 | | | | 121,590 | |
Apogee Enterprises, Inc. | | | 8,320 | | | | 169,478 | |
Asta Funding, Inc. | | | 48,800 | | | | 457,744 | |
Astronics Corp.* | | | 17,045 | | | | 395,614 | |
Astronics Corp., Class B* | | | 2,557 | | | | 58,422 | |
AZZ, Inc. | | | 46,000 | | | | 1,814,240 | |
CAI International, Inc.* | | | 16,325 | | | | 361,762 | |
Capstone Turbine Corp.* | | | 200,806 | | | | 200,806 | |
Cascade Corp. | | | 6,475 | | | | 420,810 | |
Celadon Group, Inc. | | | 20,482 | | | | 350,242 | |
Chart Industries, Inc.* | | | 9,800 | | | | 693,742 | |
Columbus McKinnon Corp.* | | | 100,500 | | | | 1,504,485 | |
CRA International, Inc.* | | | 14,950 | | | | 250,263 | |
Ducommun, Inc.* | | | 27,600 | | | | 376,464 | |
DXP Enterprises, Inc.* | | | 9,900 | | | | 487,377 | |
Dynamic Materials Corp. | | | 18,238 | | | | 244,754 | |
Echo Global Logistics, Inc.* | | | 23,233 | | | | 390,547 | |
Encore Capital Group, Inc.* | | | 32,852 | | | | 952,708 | |
Ennis, Inc. | | | 44,350 | | | | 678,555 | |
Exponent, Inc.* | | | 6,430 | | | | 353,521 | |
Furmanite Corp.* | | | 48,900 | | | | 246,945 | |
G&K Services, Inc., Class A | | | 8,050 | | | | 259,612 | |
Gibraltar Industries, Inc.* | | | 13,475 | | | | 167,899 | |
GP Strategies Corp.* | | | 8,049 | | | | 154,943 | |
Graham Corp. | | | 30,634 | | | | 550,493 | |
Greenbrier Cos., Inc.* | | | 39,800 | | | | 692,918 | |
Heidrick & Struggles International, Inc. | | | 12,900 | | | | 152,736 | |
Heritage-Crystal Clean, Inc.* | | | 17,574 | | | | 311,060 | |
Hurco Cos., Inc.* | | | 22,821 | | | | 524,427 | |
InnerWorkings, Inc.* | | | 32,047 | | | | 462,118 | |
Interface, Inc. | | | 50,300 | | | | 719,793 | |
KEYW Holding Corp, The* | | | 44,600 | | | | 541,444 | |
Kimball International, Inc. | | | 7,400 | | | | 88,356 | |
LB Foster Co. | | | 9,650 | | | | 318,546 | |
| | | | | | | | |
| | | Shares | | | Value | |
| | | | | | | | |
LMI Aerospace, Inc.* | | | 8,400 | | | $ | 168,672 | |
Manitex International, Inc.* | | | 27,401 | | | | 193,999 | |
Marten Transport, Ltd. | | | 22,625 | | | | 418,562 | |
Met-Pro Corp. | | | 27,725 | | | | 251,743 | |
Michael Baker Corp.* | | | 13,000 | | | | 293,930 | |
Miller Industries, Inc. | | | 15,875 | | | | 243,681 | |
NN, Inc.* | | | 55,450 | | | | 459,126 | |
Old Dominion Freight Line, Inc.* | | | 9,225 | | | | 309,406 | |
Orion Marine Group, Inc.* | | | 20,200 | | | | 135,138 | |
Performant Financial Corp.* | | | 22,128 | | | | 218,403 | |
PGT, Inc.* | | | 157,400 | | | | 679,968 | |
Pike Electric Corp.* | | | 18,700 | | | | 170,357 | |
Proto Labs, Inc.* | | | 9,603 | | | | 333,224 | |
RBC Bearings, Inc.* | | | 12,139 | | | | 602,823 | |
Saia, Inc.* | | | 14,266 | | | | 322,412 | |
SeaCube Container Leasing, Ltd. | | | 20,900 | | | | 387,068 | |
Standard Parking Corp.* | | | 10,621 | | | | 242,690 | |
Sun Hydraulics Corp. | | | 31,150 | | | | 829,836 | |
Thermon Group Holdings, Inc.* | | | 17,207 | | | | 427,422 | |
Universal Truckload Services, Inc. | | | 11,475 | | | | 181,764 | |
US Ecology, Inc. | | | 16,571 | | | | 393,230 | |
Wabash National Corp.* | | | 35,425 | | | | 223,532 | |
WageWorks, Inc.* | | | 48,600 | | | | 942,354 | |
Total Industrials | | | | | | | 26,641,675 | |
Information Technology - 20.5% | | | | | | | | |
Actuate Corp.* | | | 46,438 | | | | 247,515 | |
Allot Communications, Ltd.* | | | 11,008 | | | | 257,147 | |
American Software Inc., Class A | | | 28,150 | | | | 230,549 | |
Anaren, Inc.* | | | 16,425 | | | | 296,143 | |
Angie’s List, Inc.* | | | 66,742 | | | | 763,528 | |
Aspen Technology, Inc.* | | | 20,900 | | | | 517,902 | |
Blucora, Inc.* | | | 15,775 | | | | 276,851 | |
Brightcove, Inc.* | | | 23,877 | | | | 301,328 | |
Cohu, Inc. | | | 18,025 | | | | 158,620 | |
Commtouch Software, Ltd.* | | | 44,000 | | | | 112,200 | |
Computer Task Group, Inc.* | | | 68,650 | | | | 1,280,322 | |
comScore, Inc.* | | | 25,100 | | | | 355,667 | |
Cornerstone OnDemand, Inc.* | | | 21,483 | | | | 601,309 | |
CTS Corp. | | | 33,300 | | | | 275,724 | |
Demandware, Inc.* | | | 27,697 | | | | 822,324 | |
Digi International, Inc.* | | | 17,283 | | | | 162,806 | |
E2open, Inc.* | | | 22,969 | | | | 401,957 | |
Ellie Mae, Inc.* | | | 26,042 | | | | 651,050 | |
Eloqua, Inc.* | | | 57,324 | | | | 1,337,369 | |
The accompanying notes are an integral part of these financial statements.
23
Managers Micro-Cap Fund
Schedule of Portfolio Investments (continued)
| | | | | | | | |
| | | Shares | | | Value | |
| | | | | | | | |
Information
Technology - 20.5% (continued) | | | | | | | | |
EPAM Systems, Inc.* | | | 43,544 | | | $ | 782,922 | |
ePlus, Inc.* | | | 2,200 | | | | 78,694 | |
ExlService Holdings, Inc.* | | | 21,441 | | | | 635,511 | |
FARO Technologies, Inc.* | | | 10,394 | | | | 417,839 | |
FleetMatics Group PLC* | | | 11,103 | | | | 240,824 | |
Globecomm Systems, Inc.* | | | 27,900 | | | | 302,715 | |
Glu Mobile, Inc.* | | | 131,500 | | | | 416,855 | |
GSI Group, Inc.* | | | 17,500 | | | | 135,975 | |
Hackett Group Inc, The* | | | 19,000 | | | | 73,910 | |
Imperva, Inc.* | | | 44,705 | | | | 1,409,549 | |
Interactive Intelligence Group, Inc.* | | | 38,900 | | | | 1,233,519 | |
IXYS Corp.* | | | 32,312 | | | | 307,610 | |
Lionbridge Technologies, Inc.* | | | 34,200 | | | | 108,414 | |
LivePerson, Inc.* | | | 52,103 | | | | 817,496 | |
LTX-Credence Corp.* | | | 26,200 | | | | 145,934 | |
Market Leader, Inc.* | | | 65,880 | | | | 447,984 | |
MaxLinear, Inc., Class A* | | | 28,400 | | | | 161,312 | |
Methode Electronics, Inc. | | | 36,268 | | | | 367,032 | |
Monolithic Power Systems, Inc.* | | | 20,631 | | | | 400,860 | |
Multi-Fineline Electronix, Inc.* | | | 3,775 | | | | 79,804 | |
NIC, Inc. | | | 48,700 | | | | 696,410 | |
PC Connection, Inc. | | | 13,946 | | | | 143,504 | |
PDF Solutions, Inc.* | | | 29,725 | | | | 393,559 | |
Pericom Semiconductor Corp.* | | | 9,900 | | | | 76,527 | |
Procera Networks, Inc.* | | | 23,934 | | | | 542,105 | |
Proofpoint, Inc.* | | | 43,800 | | | | 578,598 | |
Responsys, Inc.* | | | 36,247 | | | | 324,048 | |
Rubicon Technology, Inc.* | | | 31,000 | | | | 269,390 | |
Sierra Wireless, Inc.* | | | 43,311 | | | | 349,520 | |
SPS Commerce, Inc.* | | | 22,084 | | | | 800,545 | |
Stamps.com, Inc.* | | | 26,436 | | | | 727,519 | |
STEC, Inc.* | | | 21,600 | | | | 126,792 | |
Supertex, Inc.* | | | 9,000 | | | | 171,990 | |
Symmetricom, Inc.* | | | 25,742 | | | | 158,313 | |
Tangoe, Inc.* | | | 47,041 | | | | 607,770 | |
TechTarget, Inc.* | | | 16,200 | | | | 77,436 | |
Tessco Technologies, Inc. | | | 52,400 | | | | 1,089,920 | |
TNS, Inc.* | | | 32,300 | | | | 462,536 | |
Trulia, Inc.* | | | 17,912 | | | | 403,916 | |
Tyler Technologies, Inc.* | | | 30,700 | | | | 1,467,767 | |
Velti PLC* | | | 67,524 | | | | 492,925 | |
Virtusa Corp.* | | | 18,825 | | | | 323,037 | |
| | | | | | | | |
| | | Shares | | | Value | |
| | | | | | | | |
Vishay Precision Group, Inc.* | | | 12,450 | | | $ | 162,473 | |
Xyratex, Ltd.1 | | | 84,100 | | | | 695,507 | |
Total Information Technology | | | | | | | 28,757,177 | |
Materials - 4.4% | | | | | | | | |
American Vanguard Corp. | | | 20,465 | | | | 731,214 | |
Koppers Holdings, Inc. | | | 32,200 | | | | 1,149,540 | |
Landec Corp.* | | | 45,700 | | | | 494,474 | |
Materion Corp. | | | 15,325 | | | | 321,059 | |
Myers Industries, Inc. | | | 24,200 | | | | 358,886 | |
OMNOVA Solutions, Inc.* | | | 147,900 | | | | 1,159,536 | |
Penford Corp.* | | | 10,300 | | | | 79,310 | |
Spartech Corp.* | | | 31,350 | | | | 268,356 | |
UFP Technologies, Inc.* | | | 4,925 | | | | 81,755 | |
Universal Stainless & Alloy* | | | 45,000 | | | | 1,548,000 | |
Total Materials | | | | | | | 6,192,130 | |
Telecommunication
Services - 0.9% | | | | | | | | |
8x8, Inc.* | | | 33,118 | | | | 216,923 | |
HickoryTech Corp. | | | 6,128 | | | | 65,263 | |
IDT Corp., Class B | | | 15,900 | | | | 160,908 | |
Premiere Global Services, Inc.* | | | 34,600 | | | | 294,100 | |
Shenandoah Telecommunications Co. | | | 10,400 | | | | 163,488 | |
Towerstream Corp.* | | | 108,900 | | | | 383,328 | |
Total Telecommunication Services | | | | | | | 1,284,010 | |
Utilities - 0.6% | | | | | | | | |
Chesapeake Utilities Corp. | | | 6,975 | | | | 327,616 | |
Unitil Corp. | | | 21,000 | | | | 558,390 | |
Total Utilities | | | | | | | 886,006 | |
Total Common Stocks
(cost $112,636,753) | | | | | | | 136,075,959 | |
Exchange Traded Funds - 0.3% | | | | | | | | |
SPDR S&P Regional Banking ETF (cost $254,534) | | | 12,200 | | | | 340,868 | |
Other Investment Companies - 3.4%2 | | | | | | | | |
BNY Mellon Overnight Government Fund, 0.23%3 | | | 314,411 | | | | 314,411 | |
Dreyfus Cash Management Fund, Institutional Class Shares, 0.07% | | | 4,432,260 | | | | 4,432,260 | |
Total Other Investment Companies
(cost $4,746,671) | | | | | | | 4,746,671 | |
Total Investments - 100.5%
(cost $117,637,958) | | | | | | | 141,163,498 | |
Other Assets, less
Liabilities - (0.5)% | | | | | | | (639,999 | ) |
Net Assets - 100.0% | | | | | | $ | 140,523,499 | |
The accompanying notes are an integral part of these financial statements.
24
Managers Real Estate Securities Fund
Investment Manager’s Comments
Managers Real Estate Securities Fund seeks a combination of income and long-term capital appreciation by investing in stocks of companies that are principally engaged in owning and operating commercial real estate properties for the benefit of their investors including real estate investment trusts (REITs). Managers Investment Group LLC utilizes an independent subadvisor, Urdang Securities Management, Inc (“Urdang”), to manage the assets of this Portfolio.
The Portfolio Manager
Urdang Securities Management, Inc.
The investment team at Urdang believes real estate securities play an important role in a multi-asset class investment portfolio. Urdang’s strategy recognizes that real estate securities are not simply stocks or real estate. They are hybrid financial investments that must be valued on the basis of a number of meaningful factors, only one of which is the value of the firm’s property portfolio. To accurately assess the relative value of a REIT, Urdang takes into account critical business and market factors, such as: the company’s capitalization, its position within public capital markets and the quality of the management team.
Urdang believes that investment success is the result of the company’s ability to provide a consistently accurate answer to the question at the heart of its value-oriented investment strategy: which REITs do they believe will generate the highest risk-adjusted returns? Urdang believes that a diversified portfolio with a value orientation will result in strong risk-adjusted returns.
Urdang employs a value-oriented investment process with two distinct and complementary components: bottom-up real estate research and the company’s proprietary Relative Value Model (RVM) securities valuation process, which was designed to provide a uniform basis for evaluating the validity of a security’s trading price. Combining real estate research and the RVM process has been central to Urdang’s track record of delivering strong returns without incurring high levels of risk.
THE YEAR IN REVIEW
For the twelve months ending October 31, 2012, the Managers Real Estate Securities Fund returned 13.4%, compared with 14.1% for its benchmark, the Dow Jones U.S. Select REIT Index. During the same period the S&P 500 Index returned 15.2%.
The U.S. REIT market generally experienced positive total returns throughout the fiscal year as property fundamentals continued to steadily improve. Occupancy rates have recovered to their historical averages across most property sectors and geographic regions and rental rates are beginning to rise. Property fundamentals were strongest for apartments and self-storage where vacancy was lowest coming into the year as both sectors were among the first to recover from the global recession. Retail real estate fundamentals also saw a marked improvement albeit from a lower base.
All sectors of the REIT market finished the year with positive total returns, but there was a high degree of variability in returns across sectors during the year. For example, the two best performing property sectors – regional mall and shopping center – posted total returns of 25.6% and 22.4%, but the two worst performing sectors – hotel and specialty – generated total returns of only 5.1% and 5.7%.
Amidst this backdrop, the Fund underperformed the benchmark by 66 basis points for the fiscal year that ended October 31. The Fund’s underperformance was the result of stock selection and portfolio positioning. The largest driver of relative performance was weak stock selection in the self storage, regional mall and specialty sectors. This was partially offset by positive stock selection in the hotel and office sectors. The Fund benefited from an overweight to the triple net lease, apartment and industrial sectors and from an underweight to the office sector. An underweight to the retail sector presented a drag on relative performance during the year.
Outlook
U.S. REITs will not be immune to the widespread economic uncertainty currently afflicting the financial markets; however, the stability of their assets and the durability of their cash flows can offer a degree of steadiness to their return profile, particularly over long periods. We are confident that current REITs valuations offer long-term investors an opportunity to acquire quality stocks with strong assets at attractive valuations. Today’s share prices compare favorably to prices paid for real estate assets in the private market and relative to construction cost. A low-yield, low growth macro-economic environment could be good for REITs. Economic demand today is weak but is strong enough to absorb existing space without triggering new building. We believe REITs should continue to be advantaged by the low interest rate environment as they are capital intensive and as investors seek investment vehicles with high dividend yields. REITs offer the potential for a compelling, well-covered dividend yield and potential for dividend growth. The average REIT dividend yield represents a positive spread to the 10-year U.S. Treasury yield that is nearly double its long-run average.
25
Managers Real Estate Securities Fund
Investment Manager’s Comments (continued)
This commentary reflects the viewpoints of the portfolio manager, Urdang Securities Management, as of October 31, 2012 and is not intended as a forecast or guarantee of future results.
CUMULATIVE TOTAL RETURN PERFORMANCE
Managers Real Estate Securities Fund’s cumulative total return is based on the daily change in net asset value (NAV), and assumes that all dividends and distributions were reinvested. This chart compares a hypothetical $10,000 investment made in Managers Real Estate Securities Fund on October 31, 2002, to a $10,000
investment made in the Dow Jones U.S. Select REIT Index for the same time period. Performance for periods longer than one year is annualized. The graph and table do not reflect the deduction of taxes that a shareholder would pay on a Fund distribution or redemption of shares. The listed returns for the Fund are net of expenses and the returns for the index exclude expenses. Past performance is not indicative of future results. Total returns would have been lower had certain expenses not been reduced.
26
Managers Real Estate Securities Fund
Investment Manager’s Comments (continued)
CUMULATIVE TOTAL RETURN PERFORMANCE (continued)
The table below shows the average annual total returns for the Managers Real Estate Securities Fund and the S&P 500 and Dow Jones U.S. Select REIT indices for the same time periods ended October 31, 2012.
| | | | | | | | | | | | |
| | | Average Annual Total Returns1 | |
| | | One Year | | | Five Years | | | Ten Years | |
Managers Real Estate Fund2,3,4 | | | 13.43 | % | | | 3.28 | % | | | 12.84 | % |
Dow Jones U.S. Select Reit Index5 | | | 14.09 | % | | | 1.19 | % | | | 11.79 | % |
S&P 500 Index6 | | | 15.21 | % | | | 0.36 | % | | | 6.91 | % |
The performance data shown represents past performance. Past performance is not a guarantee of future results. Current performance may be lower or higher than the performance data quoted. The investment return and principal value of an investment in the Fund will fluctuate so that an investor’s shares, when redeemed, may be worth more or less than their original cost. For performance information through the most recent month end, please call (800) 835-3879 or visit our Web site at www.managersinvest.com.
Investors should carefully consider the Fund’s investment objectives, risks, charges and expenses before investing. For this and other information, please call (800) 835-3879 or visit our Web site at www.managersinvest.com for a free prospectus. Read it carefully before investing or sending money. Funds are distributed by Managers Distributors, Inc., member FINRA.
| | |
1 Total return equals income yield plus share price change and assumes reinvestment of all dividends and capital gain distributions. Returns are net of fees and may reflect offsets of Fund expenses as described in the Prospectus. No adjustment has been made for taxes payable by shareholders on their reinvested dividends and capital gain distributions. Returns for periods greater than one year are the average annual return. The listed returns on the Fund are net of expenses and based on the published NAV as of October 31, 2012. All returns are in U.S. dollars ($). 2 From time to time, the Fund’s advisor has waived its fees and/or absorbed Fund expenses, which has resulted in higher returns. 3 The Fund is subject to special risk considerations similar to those associated with the direct ownership of real estate. Real estate valuations may be subject to factors such as changing general and local economic, financial, competitive, and environmental conditions. 4 Companies that are in similar businesses may be similarly affected by particular economic or market events; to the extent the Fund has substantial holdings within a particular sector, the risks associated with that sector increase. 5 The Dow Jones U.S. Select REIT Index measures U.S. publicly traded Real Estate Investment Trusts. Unlike the Fund, the Dow Jones U.S. Select REIT Index is unmanaged, is not available for investment, and does not incur expenses. |
6 | | The S&P 500 Index is capitalization-weighted index of 500 stocks. The S&P 500 Index is designed to measure performance of the broad domestic economy through changes in the aggregate market value of 500 stocks representing all major industries. Unlike the Fund, the Index is unmanaged, is not available for investment, and does not incur expenses. |
|
| The S&P 500 Index is proprietary data of Standard & Poor’s, a division of McGraw-Hill Companies, Inc. All rights reserved. |
|
| Not FDIC insured, nor bank guaranteed. May lose value. |
27
Managers Real Estate Securities Fund
Fund Snapshots
October 31, 2012
Portfolio Breakdown (unaudited)
| | | | |
Industry | | Managers
Real Estate
Securities Fund** | |
REITs (Apartments) | | | 20.3 | % |
REITs (Regional Malls) | | | 16.9 | % |
REITs (Health Care) | | | 14.2 | % |
REITs (Office Properties) | | | 12.7 | % |
REITs (Diversified) | | | 8.3 | % |
REITs (Shopping Centers) | | | 6.6 | % |
REITs (Storage) | | | 5.7 | % |
REITs (Warehouse/Industrials) | | | 5.5 | % |
REITs (Hotels) | | | 5.3 | % |
REITs (Single Tenant) | | | 1.3 | % |
REITS (Manufactured Homes) | | | 0.4 | % |
Other Assets and Liabilities | | | 2.8 | % |
| ** | As a percentage of net assets. |
Top Ten Holdings (unaudited)
| | | | |
Security Name | | % of
Net Assets | |
Simon Property Group, Inc.* | | | 7.4 | % |
Public Storage* | | | 5.7 | |
Ventas, Inc.* | | | 5.0 | |
Equity Residential* | | | 4.7 | |
Prologis, Inc.* | | | 4.6 | |
Health Care REIT, Inc.* | | | 4.5 | |
HCP, Inc.* | | | 4.2 | |
Boston Properties, Inc.* | | | 4.2 | |
Macerich Co., The* | | | 3.9 | |
Vornado Realty Trust | | | 3.0 | |
| | | | |
Top Ten as a Group | | | 47.2 | % |
| | | | |
| |
* Top Ten Holding at April 30, 2012 | | | | |
Any sectors, industries, or securities discussed should not be perceived as investment recommendations. Mention of a specific security should not be considered a recommendation to buy or solicitation to sell that security. Specific securities mentioned in this report may have been sold from the Fund’s portfolio of investments by the time you receive this report.
28
Managers Real Estate Securities Fund
Schedule of Portfolio Investments
October 31, 2012
| | | | | | | | |
| | | Shares | | | Value | |
| | | | | | | | |
Common Stocks - 0.6% | | | | | | | | |
Orient-Express Hotels, Ltd., Class A (Hotels)
(cost $738,170)* | | | 89,125 | | | $ | 1,045,436 | |
REITs - 97.2% | | | | | | | | |
Apartments - 20.3% | | | | | | | | |
American Campus Communities, Inc. | | | 72,150 | | | | 3,269,117 | |
Apartment Investment & Management Co. | | | 44,420 | | | | 1,185,570 | |
AvalonBay Communities, Inc. | | | 31,050 | | | | 4,209,138 | |
BRE Properties, Inc. | | | 50,120 | | | | 2,423,302 | |
Camden Property Trust | | | 52,730 | | | | 3,460,670 | |
Colonial Properties Trust | | | 68,430 | | | | 1,480,141 | |
Equity Residential | | | 137,450 | | | | 7,891,004 | |
Essex Property Trust, Inc. | | | 27,930 | | | | 4,189,500 | |
Home Properties, Inc. | | | 19,500 | | | | 1,185,405 | |
UDR, Inc. | | | 204,330 | | | | 4,959,089 | |
Total Apartments | | | | | | | 34,252,936 | |
Diversified - 8.3% | | | | | | | | |
Digital Realty Trust, Inc. | | | 75,240 | | | | 4,621,993 | |
Duke Realty Corp. | | | 138,360 | | | | 2,003,453 | |
Lexington Realty Trust | | | 49,620 | | | | 470,894 | |
Liberty Property Trust | | | 55,490 | | | | 1,948,809 | |
Vornado Realty Trust | | | 61,830 | | | | 4,959,384 | |
Total Diversified | | | | | | | 14,004,533 | |
Health Care - 14.2% | | | | | | | | |
HCP, Inc. | | | 161,210 | | | | 7,141,603 | |
Health Care REIT, Inc. | | | 128,400 | | | | 7,630,812 | |
Senior Housing Properties Trust | | | 34,500 | | | | 758,310 | |
Ventas, Inc. | | | 132,100 | | | | 8,357,967 | |
Total Health Care | | | | | | | 23,888,692 | |
Hotels - 5.3% | | | | | | | | |
DiamondRock Hospitality Co. | | | 127,334 | | | | 1,079,792 | |
Host Hotels & Resorts, Inc. | | | 229,190 | | | | 3,314,087 | |
LaSalle Hotel Properties | | | 92,180 | | | | 2,206,789 | |
Pebblebrook Hotel Trust | | | 15,980 | | | | 339,096 | |
RLJ Lodging Trust | | | 83,800 | | | | 1,493,316 | |
Sunstone Hotel Investors, Inc.* | | | 53,990 | | | | 533,421 | |
Total Hotels | | | | | | | 8,966,501 | |
Manufactured Homes - 0.4% | | | | | | | | |
Equity Lifestyle Properties, Inc. | | | 9,086 | | | | 611,760 | |
Office Properties - 12.7% | | | | | | | | |
Alexandria Real Estate Equities, Inc. | | | 29,520 | | | | 2,079,094 | |
Boston Properties, Inc. | | | 67,100 | | | | 7,132,730 | |
Brandywine Realty Trust | | | 82,850 | | | | 961,060 | |
CommonWealth REIT | | | 54,440 | | | | 746,372 | |
| | | | | | | | |
| | | Shares | | | Value | |
| | | | | | | | |
Highwoods Properties, Inc. | | | 42,920 | | | $ | 1,384,170 | |
Hudson Pacific Properties, Inc. | | | 26,440 | | | | 501,567 | |
Kilroy Realty Corp. | | | 7,640 | | | | 339,292 | |
Mack-Cali Realty Corp. | | | 77,348 | | | | 2,010,275 | |
Piedmont Office Realty Trust, Inc. | | | 104,840 | | | | 1,866,152 | |
SL Green Realty Corp. | | | 58,330 | | | | 4,392,249 | |
Total Office Properties | | | | | | | 21,412,961 | |
Regional Malls - 16.9% | | | | | | | | |
CBL & Associates Properties, Inc. | | | 54,430 | | | | 1,217,599 | |
General Growth Properties, Inc. | | | 170,570 | | | | 3,353,406 | |
Macerich Co., The | | | 115,220 | | | | 6,567,540 | |
Simon Property Group, Inc. | | | 81,590 | | | | 12,418,814 | |
Tanger Factory Outlet Centers | | | 113,590 | | | | 3,574,677 | |
Taubman Centers, Inc. | | | 16,550 | | | | 1,300,003 | |
Total Regional Malls | | | | | | | 28,432,039 | |
Shopping Centers - 6.6% | | | | | | | | |
Acadia Realty Trust | | | 33,220 | | | | 853,090 | |
DDR Corp. | | | 204,650 | | | | 3,143,424 | |
Equity One, Inc. | | | 31,240 | | | | 652,916 | |
Excel Trust, Inc. | | | 58,020 | | | | 713,646 | |
Kimco Realty Corp. | | | 219,570 | | | | 4,286,006 | |
Regency Centers Corp. | | | 31,850 | | | | 1,529,437 | |
Total Shopping Centers | | | | | | | 11,178,519 | |
Single Tenant - 1.3% | | | | | | | | |
National Retail Properties, Inc. | | | 44,460 | | | | 1,408,493 | |
Spirit Realty Capital, Inc.* | | | 43,190 | | | | 705,725 | |
Total Single Tenant | | | | | | | 2,114,218 | |
Storage - 5.7% | | | | | | | | |
Public Storage | | | 69,200 | | | | 9,593,196 | |
Warehouse/Industrials - 5.5% | | | | | | | | |
First Industrial Realty Trust, Inc.* | | | 104,730 | | | | 1,398,146 | |
Prologis, Inc. | | | 227,590 | | | | 7,804,061 | |
Total Warehouse/Industrials | | | | | | | 9,202,207 | |
Total REITs
(cost $156,924,921) | | | | | | | 163,657,562 | |
Other Investment
Companies - 2.0%2 | | | | | | | | |
Dreyfus Cash Management Fund, Institutional Class Shares, 0.07%
(cost $3,294,099) | | | 3,294,099 | | | | 3,294,099 | |
Total Investments - 99.8%
(cost $160,957,190) | | | | | | | 167,997,097 | |
Other Assets, less
Liabilities - 0.2% | | | | | | | 371,263 | |
Net Assets - 100.0% | | | | | | $ | 168,368,360 | |
The accompanying notes are an integral part of these financial statements.
29
Managers California Intermediate Tax-Free Fund
Investment Manager’s Comments
The Managers California Intermediate Tax-Free Fund’s (the “Fund”) objective is to achieve income free from Federal income taxes and California state income taxes, including the Alternative Minimum Tax (“AMT”).
The Fund invests at least 80% of its total assets in intermediate-term California municipal bonds that are free from both Federal and California state income taxes, including the AMT. The Fund’s securities will have quality ratings comparable to the four highest rating categories of Moody’s or Standard & Poor’s. The dollar-weighted average maturity of these intermediate-term securities is normally three to 10 years. The Fund’s benchmark is the Barclays 5-Year Municipal Bond Index.
The Portfolio Manager
Miller Tabak Asset Management (“MTAM”), the subadvisor for the Fund, was founded in early 2008, and is a division of Miller Tabak + Co. LLC (“Miller Tabak”). Miller Tabak is a 29 year-old institutional trading firm that specializes in the discrete handling of stock purchases and sales, portfolio rebalancing, and listed options. MTAM focuses exclusively on managing municipal bond portfolios and is based in New York City.
Philosophy
The MTAM team focuses on purchasing municipal credits exhibiting improving credit characteristics while maintaining geographic and economic diversity as key elements in the portfolio-construction process. MTAM believes proactive total-return portfolio management offers greater potential rewards in an increasingly inefficient municipal bond market. Achieving reasonable and consistent growth of clients’ capital without taking elevated levels of principal risk is MTAM’s objective.
The California municipal bond market is a unique sector within the domestic fixed-income universe, consisting of over 6,000 issuers with distinct security structures and varying credit risks. MTAM seeks to exploit these nuances through a disciplined, risk-controlled, relative-value investment management process.
Process
| | • | | Active total-return portfolio management is MTAM’s central theme for achieving objectives that benefit the Fund |
| | • | | MTAM is committed to extensive, proprietary, and original research and analysis |
| | • | | MTAM follows a disciplined and well-defined investment process |
MTAM’s investment process can be divided into two distinct parts. The first part focuses on risk analysis. MTAM’s risk analysis has two components, interest-rate analysis and credit-risk analysis. MTAM strives to control interest-rate volatility by defining the appropriate ranges for duration and maturity based on the Fund’s predetermined liquidity requirements, the specific risk profile, and the given market environment.
The second component of MTAM’s risk analysis focuses on credit risk. MTAM applies rigorous standards for tax-exempt issuers, continually reviews financial statements, and closely monitors rating agency commentary and relative trading spreads in the secondary market.
Michael Pietronico, the Fund’s portfolio manager, has 16 years experience managing municipal bond portfolios, which gives him excellent knowledge of the key factors influencing the municipal bond market and an experienced eye to identify high-quality California municipal bonds.
The second major part of MTAM’s investment process assesses relative value. MTAM starts by creating expectations for the slope of the yield curve and yield spreads going forward. Once forecasts are finalized, MTAM assesses how its forecast and other potential outcomes may affect market prices. This ultimately helps MTAM identify what securities are most attractively valued and offer the best risk-adjusted return. MTAM also uses its market outlook to determine what sectors of the municipal market will add to and detract from performance and adjust weightings accordingly. Lastly, credit research at the security level is undertaken to analyze credit quality, yield, duration, structure, and call protection in order to assess a security’s potential contribution to the Fund.
Buy Discipline
There are three parts to MTAM’s buy discipline:
Supply Analysis
Macro View
Aggregate Municipal Supply
Secondary Market Supply
Dealer Inventories
Micro View
Supply/Demand Per State
Credit Analysis
Macro View
Major Economic Trends in Place
Micro View
Legal Structure of Securities
Service-Area Economic Performance
Project and System Operations
Individual Bond Structure Analysis
Prepayment Risk
Original Issue Discount
Reinvestment Risk
Municipal Bond Credit Research – Credit Review Process
1. Comprehensive bottom-up analysis of issuer, pledged security, and historical economic performance
2. Site visits and conference calls with key public officials
3. Comprehensive financial statement review with feasibility analysis
4. Negotiate with underwriters to strengthen key security covenants and secure optimal pricing
Managers California Intermediate Tax-Free Fund
Investment Manager’s Comments (continued)
5. Limits are implemented upon credit approval exposure
Credit Surveillance
| | • | | Database is maintained for holdings by issuer and Fund exposure |
| | • | | The relevant performance statistics are tracked on a monthly, quarterly, and annual basis to help capture meaningful trends, for example trading spreads |
| | • | | Outside resources are utilized; for example financial statement repositories, industry publications, internet search engines, and rating agencies |
Sell Discipline
An individual security may become a candidate for sale for any of the following reasons:
| | • | | The issuers investment fundamentals begin to deteriorate |
| | • | | To take advantage of more attractive yield opportunities |
| | • | | The individual security no longer appears to meet the portfolio’s investment objective(s) |
| | • | | To meet liquidity needs |
| | • | | To help shorten or lengthen the overall duration of the portfolio The Year in Review. |
For the 12 months ended October 31, 2012, the Managers California Intermediate Tax-Free Fund returned 8.27%. The Fund’s benchmark, the Barclays 5-Year Municipal Bond Index, returned 5.42% during the same time period.
For the 12 months ended October 31, 2012, the Managers California Intermediate Tax-Free Fund returned 8.27%. The Fund’s benchmark, the Barclays 5-Year Municipal Bond Index, returned 5.42% during the same time period.
Investors in tax-free municipal bonds once again enjoyed positive returns for the recent fiscal year. Despite a 40% year-over-year jump in municipal bond issuance, buyers continually outpaced sellers as holding cash remained unattractive to many investors. As has been the case for some time, those who chose to invest further out along the yield curve were rewarded with better overall returns. Lower quality municipals continued to outperform “AAA” rated issuers as investors became more comfortable reaching for extra yield in an environment where the Federal Reserve continues to inflict hardship on those who rely on income.
The Fund’s performance was driven by its longer than benchmark duration as municipal bond interest rates fell during the fiscal year ending October 31. 2012. The Fund’s performance benefitted from the
financially sound nature of many of the issuers we have invested in on behalf of the shareholders. The market has rewarded those issuers which are deemed to be on solid financial footing by bidding up the prices of their bonds, and the Fund has been positively influenced by this dynamic. Detracting from overall performance was the Fund’s underweighting in bonds maturing in 20 years or longer as interest rates declined strongly over this time period. The Federal Reserve’s highly accommodative interest rate policy during the fiscal year was the main driver of performance as investors continued to pour money into the asset class looking for higher levels of overall income.
Looking Forward
MTAM believes the California market should remain buoyant in terms of demand as the state income tax has once again been raised to help balance the budget. This combined with the approaching “fiscal cliff” should keep the overall level of income taxes moving up and as such this puts a premium on the tax-free bond asset class – with California debt even that much more attractive relative to the nation. This outlook bodes well for the Fund’s overall longer than benchmark duration as we see the interest rate outlook as quite benign given the headwinds the U.S. economy faces. We believe the portfolio is well positioned due to its healthy allocation to bonds rated in the “A” category as we see continued pressure on credit spreads to tighten further due to the Federal Reserve’s ultra easy monetary policy.
Past mismanagement of fiscal issues by many municipalities are in the process of being repaired, so as an asset class, we see tax-free bonds as clearly a place conservative investors should pay attention to. We are mindful of the growing potential for bankruptcies by California municipalities, so clients should expect MTAM to continue to remain quite conservative in the issuers we select for the Fund. The culture of our firm continues to be one where safeguarding your assets is of the highest importance. The global economy is challenged right now – we are working especially diligently to make sure the Portfolio is not.
The views expressed represent the opinions of Miller Tabak Asset Management as of October 31, 2012 and are not intended as a forecast or guarantee of future results, and are subject to change without notice.
CUMULATIVE TOTAL RETURN PERFORMANCE
Managers California Intermediate Tax-Free Fund’s cumulative total return is based on the daily change in net asset value (NAV), and assumes that all dividends and distributions were reinvested. This chart compares a hypothetical $10,000 investment made in Managers California Intermediate Tax-Free Fund on October 31, 2002, to a $10,000 investment made in the Barclays Capital U.S. Municipal Bond: 5 Year Index for the same time period. Performance for periods longer than one year is annualized. The graph and table do not reflect the deduction of taxes that a shareholder would pay on a Fund distribution or redemption of shares. The listed returns for the Fund are net of expenses and the returns for the index exclude expenses. Past performance is not indicative of future results. Total returns would have been lower had certain expenses not been reduced.
Managers California Intermediate Tax-Free Fund
Investment Manager’s Comments (continued)
CUMULATIVE TOTAL RETURN PERFORMANCE (continued)
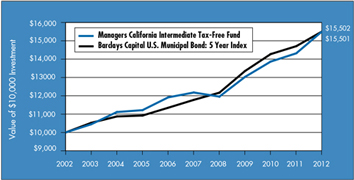
The table below shows the average annual total returns for the Managers California Intermediate Tax-Free Fund and the Barclays U.S. Municipal Bond: 5 Year Index for the same time periods ended October 31, 2012.
| | | | | | | | | | | | |
| | | Average Annual Total Returns1 | |
| | | One Year | | | Five Years | | | Ten Years | |
Managers California Intermediate Tax-Free Fund2,3,4,5,6,7,8 | | | 8.27 | % | | | 4.95 | % | | | 4.48 | % |
Barclays U.S. Municipal Bond: 5 Year Index9 | | | 5.42 | % | | | 5.65 | % | | | 4.48 | % |
The performance data shown represents past performance. Past performance is not a guarantee of future results. Current performance may be lower or higher than the performance data quoted. The investment return and principal value of an investment in the Fund will fluctuate so that an investor’s shares, when redeemed, may be worth more or less than their original cost. For performance information through the most recent month end, please call (800) 835-3879 or visit our Web site at www.managersinvest.com.
Investors should carefully consider the Fund’s investment objectives, risks, charges and expenses before investing. For this and other information, please call (800) 835-3879 or visit our Web site at www.managersinvest.com for a free prospectus. Read it carefully before investing or sending money. Funds are distributed by Managers Distributors, Inc., member FINRA.
| | |
1 | | Total return equals income yield plus share price change and assumes reinvestment of all dividends and capital gain distributions. Returns are net of fees and may reflect offsets of Fund expenses as described in the Prospectus. No adjustment has been made for taxes payable by shareholders on their reinvested dividends and capital gain distributions. Returns for periods greater than one year are the average annual return. The listed returns on the Fund are net of expenses and based on the published NAV as of October 31, 2012. All returns are in U.S. dollars ($). |
2 | | From time to time, the Fund’s advisor has waived its fees and/or absorbed Fund expenses, which has resulted in higher returns. |
3 | | The Fund is subject to risks associated with investments in debt securities, such as default risk and fluctuations in the perception of the debtors’ ability to pay their creditors. |
4 | | Changing interest rates may adversely affect the value of an investment. An increase in interest rates typically causes the value of bonds and other fixed-income securities to fall. |
5 | | The Fund is subject to risks associated from economic, political, geographic, and demographic conditions of California that could adversely affect the value of the Fund’s investment portfolio. |
6 | | Investment income may be subject to certain state and local taxes, and depending on your tax status, the federal alternative minimum tax. Capital gains are not exempt from federal income tax. |
7 | | Issuer of bonds may not be able to meet interest or principal payments when the bonds come due. |
8 | | Factors unique to the municipal bond market may negatively affect the value in municipal bonds. |
9 | | Barclays U.S. Municipal Bond: 5 Year Index provides a broad-based performance measure of the U.S. municipal bond market, consisting of securities with 4-6 year maturities. The Index tracks general obligation, revenue, insured, and prerefunded bonds with a minimum credit rating of Baa by Moody’s. Unlike the Fund, the Barclays U.S. Municipal Bond: 5 Year Index is unmanaged, is not available for investment, and does not incur expenses. |
Not FDIC insured, nor bank guaranteed. May lose value. |
32
Managers California Intermediate Tax-Free Fund
Fund Snapshots
October 31, 2012
Portfolio Breakdown (unaudited)
| | | | |
Rating | | Managers
California
Intermediate
Tax-Free Fund** | |
Aaa | | | 0.7 | % |
Aa | | | 53.5 | % |
A | | | 45.8 | % |
| ** | As a percentage of market value of fixed income securities. |
| Chart | does not include equity securities |
Top Ten Holdings (unaudited)
| | | | |
Security Name | | % of
Net Assets | |
Santa Ana, CA Unified School District, Election 2008,
Series A, 5.250%, 08/01/25* | | | 5.4 | % |
Los Angeles, CA Municipal Improvement Corp. Lease
Revenue, Police Headquarters Facility, Series A,
5.000%, 01/01/25 (FGIC Insured)* | | | 3.0 | |
San Bernardino, CA Community College District, Election
2008, Series A, 6.25%, 08/01/23* | | | 2.8 | |
Puerto Rico Sales Tax Financing Corp. Sales Tax
Revenue, Series A, 4.375%, 08/01/20* | | | 2.7 | |
Los Angeles, CA Municipal Improvement Lease Revenue,
Capital Equipment, Series A, 5.000%, 09/01/23* | | | 2.6 | |
Port of Oakland, CA Series B, 5.000%, 11/01/21
(National Insured)* | | | 2.5 | |
Val Verde, CA Unified School District General
Obligation, Election 2008, Series A, 5.500%,
08/01/24* | | | 2.5 | |
Fairfield-Suisun, CA Unified School District General
Obligation, Election 2002, 5.000%, 08/01/24
(National Insured)* | | | 2.2 | |
California State Public Works Board, Series A, 5.000%,
04/01/24* | | | 2.2 | |
Santa Clara County, CA East Side Union High School
District General Obligation, Series B, 5.100%,
02/01/22 (National Insured) | | | 2.1 | |
| | | | |
Top Ten as a Group | | | 28.0 | % |
| | | | |
| * | Top Ten Holding at April 30, 2012 |
Any sectors, industries, or securities discussed should not be perceived as investment recommendations. Mention of a specific security should not be considered a recommendation to buy or solicitation to sell that security. Specific securities mentioned in this report may have been sold from the Fund’s portfolio of investments by the time you receive this report.
33
Managers California Intermediate Tax-Free Fund
Schedule of Portfolio Investments
October 31, 2012
| | | | | | | | |
| | | Principal Amount | | | Value | |
| | | | | | | | |
Municipal Bonds - 97.0% | | | | | | | | |
Alvord, CA Unified School District General Obligation, Election 2007, Series A, 5.000%, 08/01/23 (AGM Insured) | | $ | 285,000 | | | $ | 324,823 | |
Alvord, CA Unified School District General Obligation, Series A, 5.900%, 02/01/17 (National Insured) | | | 110,000 | | | | 126,767 | |
Alvord, CA Unified School District General Obligation, Series A, 5.900%, 02/01/24 (National Insured) | | | 225,000 | | | | 276,455 | |
Bakersfield, CA City School District, Series A, 5.250%, 11/01/21 (AGM Insured) | | | 110,000 | | | | 121,538 | |
Bakersfield, CA Wastewater Revenue, Series A, 5.000%, 09/15/19 (AGM Insured) | | | 175,000 | | | | 203,877 | |
Bakersfield, CA Wastewater Revenue, Series A, 5.000%, 09/15/22 (AGM Insured) | | | 200,000 | | | | 227,558 | |
Barstow, CA Unified Unified School District General Obligation, Election 2001, Series B, 5.000%, 08/01/24 (National Insured) | | | 375,000 | | | | 388,695 | |
Bay Area, CA Toll Authority Toll Bridge Revenue, Series F, 5.000%, 04/01/17 | | | 20,000 | | | | 23,619 | |
Bay Area, CA Toll Authority Toll Bridge Revenue, Series F, 5.000%, 04/01/22 | | | 35,000 | | | | 40,260 | |
Benicia, CA Unified School District General Obligation, 4.000%, 08/01/19 | | | 100,000 | | | | 112,682 | |
Bonita, CA Unified School District, Election 2004, Series B, 5.000%, 08/01/16 (FGIC Insured) | | | 50,000 | | | | 56,749 | |
Butte-Glenn Counties, CA Community College District General Obligation, Series B, 5.000%, 08/01/23 (National Insured) | | | 325,000 | | | | 355,036 | |
California Resource Efficiency Financing Authority, Series A, 5.000%, 07/01/23 (AMBAC Insured) | | | 50,000 | | | | 51,572 | |
California State Department of Water Resources, Water System Revenue, Series A, 5.000%, 12/01/20 | | | 25,000 | | | | 30,376 | |
California State Educational Facilities Authority, Santa Clara University, 5.000%, 09/01/23 | | | 100,000 | | | | 124,478 | |
California State Public Works Board, Series A, 6.000%, 04/01/24 | | | 500,000 | | | | 609,590 | |
California State Public Works Board, Series B, 5.250%, 03/01/19 (AMBAC Insured) | | | 200,000 | | | | 200,652 | |
California State Public Works Board, Series C, 4.500%, 06/01/17 | | | 50,000 | | | | 58,191 | |
Carlsbad, CA Unified School District General Obligation, Election 2006, Series A, 5.000%, 08/01/21 (National Insured) | | | 20,000 | | | | 22,632 | |
Carlsbad, CA Unified School District General Obligation, Series B, 5.250%, 05/01/25 | | | 70,000 | | | | 81,967 | |
Centinela Valley Union High School District, Series A, 5.500%, 02/01/24 (National Insured) | | | 100,000 | | | | 119,371 | |
Central Marin, CA Sanitation Agency Revenue, 5.000%, 09/01/21 (National Insured) | | | 100,000 | | | | 109,745 | |
Central, CA Unified School District General Obligation, 5.000%, 07/01/21 (National Insured) | | | 75,000 | | | | 79,447 | |
Central, CA Unified School District General Obligation, 5.000%, 08/01/22 (Assured Guaranty) | | | 25,000 | | | | 28,937 | |
Central, CA Unified School District General Obligation, 5.000%, 07/01/23 (National Insured) | | | 25,000 | | | | 26,285 | |
Cerritos, CA Community College General Obligation, Election 2004, Series C, 5.250%, 08/01/25 | | | 15,000 | | | | 17,492 | |
Citrus, CA Community College District General Obligation, Election 2004, Series B, 5.000%, 06/01/22 (National Insured) | | | 20,000 | | | | 22,220 | |
City of Costa Mesa, CA COP, Police Facility Expansion Project, 4.300%, 10/01/26 (National Insured) | | | 25,000 | | | | 26,674 | |
City of El Paso De Robles, CA General Obligation, 5.000%, 08/01/23 (National Insured) | | | 125,000 | | | | 134,859 | |
City of El Paso De Robles, CA General Obligation, 5.000%, 08/01/25 (National Insured) | | | 250,000 | | | | 267,445 | |
City of El Paso De Robles, CA General Obligation, 5.000%, 08/01/27 (National Insured) | | | 20,000 | | | | 21,346 | |
Clovis, CA Unified School District General Obligation, Election 2004, Series B, 5.000%, 08/01/23 (National Insured) | | | 115,000 | | | | 134,144 | |
Clovis, CA Unified School District General Obligation, Election 2004, Series B, 5.000%, 08/01/25 (National Insured) | | | 65,000 | | | | 70,160 | |
Corona-Norca, CA Unified School District, Election 2006, Series A, 5.000%, 08/01/24 (AGM Insured) | | | 75,000 | | | | 84,076 | |
Corona-Norca, CA Unified School District, Election 2006, Series A, 5.000%, 08/01/25 (AGM Insured) | | | 50,000 | | | | 55,813 | |
Covina-Valley, CA Unified School District, Election 2006, Series A, 5.000%, 08/01/21 (National Insured) | | | 410,000 | | | | 432,907 | |
Desert Sands, CA Unified School District General Obligation, Election 2001, 5.000%, 08/01/16 | | | 50,000 | | | | 57,163 | |
Desert Sands, CA Unified School District General Obligation, Election 2001, 5.000%, 08/01/26 | | | 175,000 | | | | 198,950 | |
Desert Sands, CA Unified School District General Obligation, Election 2001, 5.000%, 08/01/27 | | | 245,000 | | | | 277,406 | |
The accompanying notes are an integral part of these financial statements.
34
Managers California Intermediate Tax-Free Fund
Schedule of Portfolio Investments (continued)
| | | | | | | | |
| | | Principal Amount | | | Value | |
| | | | | | | | |
Municipal Bonds - 97.0% (continued) | | | | | | | | |
Desert Sands, CA Unified School District General Obligation, Election 2001, 5.500%, 08/01/28 | | $ | 25,000 | | | $ | 28,827 | |
Desert Sands, CA Unified School District, Election 2001, 5.000%, 06/01/22 (AMBAC Insured) | | | 40,000 | | | | 44,600 | |
Eastern, CA Municipal Water District, Water & Sewer Revenue, Series A, 5.000%, 07/01/21 (National Insured) | | | 330,000 | | | | 369,927 | |
El Monte, CA City School District General Obligation, Election 2004, Series A, 4.250%, 05/01/15 (FGIC Insured) | | | 150,000 | | | | 162,223 | |
El Monte, CA Union High School District General Obligation, Election 2002, Series C, 5.000%, 06/01/21 (AGM Insured) | | | 40,000 | | | | 46,138 | |
Fairfield-Suisun, CA Unified School District General Obligation, Election 2002, 5.000%, 08/01/24 (National Insured) | | | 565,000 | | | | 611,019 | |
Fairfield-Suisun, CA Unified School District General Obligation, Election 2002, 5.250%, 08/01/23 (National Insured) | | | 240,000 | | | | 260,587 | |
Fairfield-Suisun, CA Unified School District, Election 2002, 5.250%, 08/01/16 (National Insured) | | | 70,000 | | | | 76,005 | |
Fresno County, CA Unified School District General Obligation, Series C, 5.900%, 08/01/22 (National Insured) | | | 25,000 | | | | 30,312 | |
Golden West, CA Schools Financing Authority General Obligation, 5.250%, 09/01/24 (National Insured) | | | 365,000 | | | | 467,174 | |
Grossmont, CA Union High School District General Obligation, 5.000%, 08/01/23 (National Insured) | | | 85,000 | | | | 95,590 | |
Grossmont-Cuyamaca, CA Community College District General Obligation, Series C, 5.000%, 08/01/24 (Assured Guaranty) | | | 50,000 | | | | 57,363 | |
Hemet, CA Unified School District General Obligation, Series A, 5.000%, 08/01/22 (AGM Insured) | | | 125,000 | | | | 135,850 | |
Imperial, CA Irrigation District Electric System Revenue, Series A, 5.250%, 11/01/24 | | | 100,000 | | | | 113,777 | |
Long Beach, CA Unified School District General Obligation Refunding, Series A, 5.000%, 08/01/25 | | | 30,000 | | | | 35,154 | |
Long Beach, CA Unified School District General Obligation, Series A, 5.500%, 08/01/26 | | | 85,000 | | | | 100,201 | |
Los Angeles County, CA Metropolitan Transportation Authority Sales Tax Revenue, Proposition C, Series E, 5.000%, 07/01/25 | | | 35,000 | | | | 40,917 | |
Los Angeles County, CA Public Works Financing Authority, 5.000%, 10/01/15 (National Insured) | | | 15,000 | | | | 16,889 | |
Los Angeles County, CA Public Works Financing Authority Revenue, Series A, 5.250%, 10/01/16 (AGM Insured) | | | 25,000 | | | | 29,407 | |
Los Angeles County, CA Sanitation Districts Financing Authority Capital Projects Revenue, 5.000%, 10/01/23 (FGIC Insured) | | | 80,000 | | | | 87,978 | |
Los Angeles, CA Harbor Department Revenue, Series A, 4.000%, 08/01/17 | | | 25,000 | | | | 28,839 | |
Los Angeles, CA Harbor Department Revenue, Series B, 5.000%, 08/01/20 (National Insured) | | | 275,000 | | | | 312,741 | |
Los Angeles, CA Municipal Improvement Corp. Lease Revenue, Police Headquarters Facility, Series A, 5.000%, 01/01/25 (FGIC Insured) | | | 780,000 | | | | 843,344 | |
Los Angeles, CA Municipal Improvement Corp. Lease Revenue, Real Property, Series B, 4.750%, 09/01/26 | | | 100,000 | | | | 107,729 | |
Los Angeles, CA Municipal Improvement Corp. Lease Revenue, Series A, 5.000%, 09/01/24 | | | 100,000 | | | | 110,889 | |
Los Angeles, CA Municipal Improvement Corp. Lease Revenue, Series C, 5.000%, 09/01/18 | | | 300,000 | | | | 349,224 | |
Los Angeles, CA Municipal Improvement Corp. Revenue, Prerefunded, Series B1, 5.000%, 08/01/21 (FGIC Insured) | | | 5,000 | | | | 5,407 | |
Los Angeles, CA Municipal Improvement Corp. Revenue, Unrefunded, Series B1, 5.000%, 08/01/21 (FGIC Insured) | | | 120,000 | | | | 127,308 | |
Los Angeles, CA Municipal Improvement Corp. Revenue, Unrefunded, Series B1, 5.000%, 08/01/23 (FGIC Insured) | | | 50,000 | | | | 52,673 | |
Los Angeles, CA Municipal Improvement Corp. Revenue, Unrefunded, Series B1, 5.000%, 08/01/26 (FGIC Insured) | | | 200,000 | | | | 209,566 | |
Los Angeles, CA Municipal Improvement Lease Revenue, Capital Equipment, Series A, 5.000%, 09/01/16 | | | 160,000 | | | | 180,659 | |
Los Angeles, CA Municipal Improvement Lease Revenue, Capital Equipment, Series A, 5.000%, 09/01/23 | | | 640,000 | | | | 712,589 | |
Los Angeles, CA Municipal Improvement Revenue, Capital Equipment, Series 2008 A, 5.000%, 09/01/25 | | | 50,000 | | | | 55,248 | |
Los Angeles, CA Unified School District General Obligation, Election 2004, Series G, 5.000%, 07/01/24 (AMBAC Insured) | | | 35,000 | | | | 39,635 | |
Madera, CA Unified School District General Obligation, 4.000%, 08/01/25 (AGM Insured) | | | 60,000 | | | | 64,664 | |
Monrovia, CA Unified School District General Obligation, Election 2006, Series B, 5.250%, 08/01/25 (FSA Insured) | | | 30,000 | | | | 34,247 | |
Montebello, CA Unified School District General Obligation, Election 2004, 4.200%, 08/01/22 (National Insured) | | | 100,000 | | | | 104,281 | |
Moreland, CA School District General Obligation, Series A, 5.000%, 08/01/15 (AMBAC Insured) | | | 50,000 | | | | 54,706 | |
The accompanying notes are an integral part of these financial statements.
35
Managers California Intermediate Tax-Free Fund
Schedule of Portfolio Investments (continued)
| | | | | | | | |
| | | Principal Amount | | | Value | |
| | | | | | | | |
Municipal Bonds - 97.0% (continued) | | | | | | | | |
Moreno Valley, CA Unified School District, 5.000%, 08/01/17 (National Insured) | | $ | 50,000 | | | $ | 57,016 | |
Moreno Valley, CA Unified School District General Obligation, 5.000%, 08/01/16 (National Insured) | | | 25,000 | | | | 28,053 | |
Orange County, CA Sanitation District COP, Series A, 5.000%, 02/01/22 | | | 135,000 | | | | 159,596 | |
Peralta, CA Community College District General Obligation, Election 2006, Series B, 5.250%, 08/01/22 (AGM Insured) | | | 45,000 | | | | 51,187 | |
Peralta, CA Community College District General Obligation, Series A, 5.000%, 08/01/24 (National Insured) | | | 50,000 | | | | 55,073 | |
Perris, CA Union High School District General Obligation, Election 2004, Series A, 5.000%, 09/01/26 (FGIC Insured) | | | 15,000 | | | | 15,785 | |
Placentia-Yorba Linda, CA Unified School District General Obligation, Election 2002, Series B, 5.500%, 08/01/27 (FGIC Insured) | | | 65,000 | | | | 70,857 | |
Port of Oakland, CA Revenue, Series B, 5.000%, 11/01/17 (National Insured) | | | 10,000 | | | | 11,803 | |
Port of Oakland, CA Revenue, Series B, 5.000%, 11/01/22 (National Insured) | | | 30,000 | | | | 33,245 | |
Port of Oakland, CA Revenue, Series B, 5.000%, 11/01/26 (National Insured) | | | 275,000 | | | | 299,909 | |
Port of Oakland, CA Revenue, Series C, 5.000%, 11/01/15 (National Insured) | | | 310,000 | | | | 347,693 | |
Port of Oakland, CA Revenue, Series C, 5.000%, 11/01/17 (National Insured) | | | 275,000 | | | | 324,580 | |
Port of Oakland, CA Series B, 5.000%, 11/01/16 (National Insured) | | | 255,000 | | | | 294,030 | |
Port of Oakland, CA Series B, 5.000%, 11/01/21 (National Insured) | | | 625,000 | | | | 696,612 | |
Port of Oakland, CA Series B, 5.000%, 11/01/24 (National Insured) | | | 75,000 | | | | 82,303 | |
Puerto Rico Sales Tax Financing Corp. Revenue, Prerefunded, Series 2009 A, 5.000%, 08/01/18 | | | 20,000 | | | | 24,829 | |
Puerto Rico Sales Tax Financing Corp. Revenue, Unrefunded Balance, Series 2009 A, 5.000%, 08/01/18 | | | 50,000 | | | | 57,421 | |
Puerto Rico Sales Tax Financing Corp. Sales Tax Revenue, Series A, 4.375%, 08/01/20 | | | 685,000 | | | | 750,054 | |
Rescue, CA Union School District General Obligation, 5.000%, 09/01/21 (National Insured) | | | 25,000 | | | | 30,742 | |
Rescue, CA Union School District General Obligation, 5.000%, 07/01/23 (National Insured) | | | 50,000 | | | | 61,418 | |
Riverside, CA Community College District, 5.000%, 08/01/24 (AGM Insured) | | | 35,000 | | | | 38,502 | |
Riverside, CA Unified School District General Obligation, Election 2001, Series B, 4.000%, 08/01/17 (National Insured) | | | 75,000 | | | | 81,217 | |
Rosemead, CA School District General Obligation, Election 2000, Series D, 5.250%, 08/01/24 (AGM Insured) | | | 150,000 | | | | 172,618 | |
Rosemead, CA School District General Obligation, Election 2000, Series D, 5.250%, 08/01/25 (AGM Insured) | | | 55,000 | | | | 62,569 | |
Rosemead, CA School District General Obligation, Election 2000, Series D, 5.250%, 08/01/26 (AGM Insured) | | | 145,000 | | | | 164,292 | |
Rosemead, CA School District General Obligation, Election 2000, Series D, 5.500%, 08/01/28 (AGM Insured) | | | 125,000 | | | | 143,030 | |
Roseville, CA Joint Union High School District General Obligation, Election 2004, Series A, 5.000%, 08/01/26 (FGIC Insured) | | | 120,000 | | | | 127,457 | |
Sacramento, CA City Financing Authority Revenue, 5.000%, 12/01/14 (National Insured) | | | 50,000 | | | | 54,016 | |
Sacramento, CA Municipal Utility District Electric Revenue, Series K, 5.250%, 07/01/24 (AMBAC Insured) | | | 145,000 | | | | 179,864 | |
Sacramento, CA Municipal Utility District Unrefunded Balance Revenue, Series R, 5.000%, 08/15/18 (National Insured) | | | 45,000 | | | | 46,580 | |
San Bernardino, CA Community College District General Obligation, Election 2008, Series A, 6.375%, 08/01/26 | | | 480,000 | | | | 587,467 | |
San Bernardino, CA Community College District General Obligation, Series C, 5.000%, 08/01/26 (AGM Insured) | | | 175,000 | | | | 195,426 | |
San Bernardino, CA Community College District, Election 2008, Series A, 6.250%, 08/01/23 | | | 620,000 | | | | 765,198 | |
San Diego, CA Public Facilities Financing Authority Sewer Revenue, Series B, 5.000%, 05/15/21 | | | 50,000 | | | | 60,947 | |
San Diego, CA Public Facilities Financing Authority Water Revenue, Series B, 5.000%, 08/01/20 | | | 30,000 | | | | 37,052 | |
San Diego, CA Unified Port District Revenue, Series B, 5.000%, 09/01/23 (National Insured) | | | 325,000 | | | | 341,455 | |
San Francisco, CA City & County Airports Commission Revenue, Second Series Issue 32F, 5.250%, 05/01/17 (FGIC Insured) | | | 465,000 | | | | 546,835 | |
San Francisco, CA City & County Airports Commission Revenue, Second Series, Issue 34F, 5.000%, 05/01/16 (Assured Guaranty) | | | 95,000 | | | | 107,978 | |
The accompanying notes are an integral part of these financial statements.
36
Managers California Intermediate Tax-Free Fund
Schedule of Portfolio Investments (continued)
| | | | | | | | |
| | | Principal Amount | | | Value | |
| | | | | | | | |
Municipal Bonds - 97.0% (continued) | | | | | | | | |
San Francisco, CA City and County General Obligation, Laguna Honda Hospital, Series R3, 5.000%, 06/15/23 | | $ | 50,000 | | | $ | 54,531 | |
San Francisco, CA City & County Unified School District General Obligation, Election 2003, Series C, 5.000%, 06/15/22 (National Insured) | | | 55,000 | | | | 62,783 | |
San Juan, CA Unified School District General Obligation, Election 2002, Series A, 5.000%, 08/01/16 (National Insured) | | | 150,000 | | | | 162,217 | |
Santa Ana, CA Unified School District General Obligation, Series A, 5.250%, 08/01/26 | | | 500,000 | | | | 570,480 | |
Santa Ana, CA Unified School District, Election 2008, Series A, 5.250%, 08/01/25 | | | 1,300,000 | | | | 1,487,733 | |
Santa Clara County, CA East Side Union High School District General Obligation, Election 2002, Series D, 5.000%, 08/01/19 (XLCA Insured) | | | 330,000 | | | | 346,952 | |
Santa Clara County, CA East Side Union High School District General Obligation, Election 2002, Series H, 5.000%, 08/01/19 (Assured Guaranty) | | | 100,000 | | | | 118,089 | |
Santa Clara County, CA East Side Union High School District General Obligation, Series A, 4.000%, 09/01/18 (AMBAC Insured) | | | 75,000 | | | | 82,259 | |
Santa Clara County, CA East Side Union High School District General Obligation, Series B, 5.100%, 02/01/16 (National Insured) | | | 250,000 | | | | 280,962 | |
Santa Clara County, CA East Side Union High School District General Obligation, Series B, 5.100%, 02/01/22 (National Insured) | | | 500,000 | | | | 593,025 | |
Santa Clara County, CA East Side Union High School District General Obligation, Series B, 5.250%, 02/01/24 (National Insured) | | | 40,000 | | | | 48,959 | |
Santa Clara County, CA Financing Authority Lease Revenue, Series A, 5.000%, 11/15/21 | | | 185,000 | | | | 214,772 | |
Santa Clara County, CA San Jose Unified School District General Obligation, Election 2002, Series C, 5.000%, 08/01/24 (FGIC Insured) | | | 200,000 | | | | 226,290 | |
Santa Rosa, CA High School District, Election of 2002, 5.000%, 08/01/19 (National Insured) | | | 100,000 | | | | 101,852 | |
Sierra Sands, CA Unified School District General Obligation, Series A, 5.000%, 11/01/22 (FGIC Insured) | | | 50,000 | | | | 54,085 | |
Sierra, CA Joint Community College District, School Facilities District No. 1, Election 2004, 5.000%, 08/01/24 (National Insured) | | | 100,000 | | | | 109,556 | |
Sierra, CA Joint Community College District, School Facilities District No. 1, Election 2004, 5.000%, 08/01/25 (National Insured) | | | 100,000 | | | | 108,861 | |
Solano County, CA Community College District, 4.000%, 08/01/15 (National Insured) | | | 25,000 | | | | 27,206 | |
Solano County, CA Community College District, 5.000%, 08/01/16 (National Insured) | | | 40,000 | | | | 44,600 | |
Sonoma County, CA Junior College District General Obligation, Series D, 5.000%, 08/01/16 | | | 15,000 | | | | 17,400 | |
South Western, CA Community College District General Obligation, 5.000%, 08/01/23 (National Insured) | | | 285,000 | | | | 320,351 | |
Southern California Public Power Authority Revenue, Southern Transmission Project, Series B, 5.750%, 07/01/24 | | | 75,000 | | | | 89,215 | |
State Center, CA Community College District General Obligation, Election 2002, Series A, 4.000%, 08/01/16 (AGM Insured) | | | 60,000 | | | | 67,105 | |
Sweetwater, CA Authority Water Revenue, 5.000%, 04/01/17 (AMBAC Insured) | | | 50,000 | | | | 55,183 | |
Tahoe-Truckee, CA Unified School District General Obligation, 5.500%, 08/01/19 (National Insured) | | | 75,000 | | | | 94,873 | |
Tracy, CA Joint Unified School District General Obligation, Election 2006, 5.000%, 08/01/25 (Assured Guaranty) | | | 100,000 | | | | 106,727 | |
Tustin, CA Unified School District No. 2002-1 General Obligation, Election 2002, Series B, 4.250%, 06/01/15 (AMBAC Insured) | | | 50,000 | | | | 54,263 | |
Vacaville, CA Unified School District General Obligation, Election 2001, 5.000%, 08/01/16 (National Insured) | | | 120,000 | | | | 131,226 | |
Vacaville, CA Unified School District General Obligation, Election 2001, 5.000%, 08/01/17 (National Insured) | | | 40,000 | | | | 43,427 | |
Vacaville, CA Unified School District General Obligation, Election 2001, 5.000%, 08/01/22 (National Insured) | | | 15,000 | | | | 16,156 | |
Vacaville, CA Unified School District General Obligation, Election 2001, 5.000%, 08/01/25 (AMBAC Insured) | | | 350,000 | | | | 375,816 | |
Vacaville, CA Unified School District General Obligation, Election 2001, 5.000%, 08/01/26 (AMBAC Insured) | | | 85,000 | | | | 91,024 | |
Val Verde, CA Unified School District General Obligation, Election 2008, Series A, 5.500%, 08/01/22 | | | 100,000 | | | | 114,104 | |
Val Verde, CA Unified School District General Obligation, Election 2008, Series A, 5.500%, 08/01/24 | | | 615,000 | | | | 694,433 | |
The accompanying notes are an integral part of these financial statements.
37
Managers California Intermediate Tax-Free Fund
Schedule of Portfolio Investments (continued)
| | | | | | | | |
| | | Principal Amount | | | Value | |
| | | | | | | | |
Municipal Bonds - 97.0% (continued) | | | | | | | | |
Wasco, CA Union High School District General Obligation, Election 2008, Series B, 4.000%, 08/01/25 (AGM Insured) | | $ | 35,000 | | | $ | 37,386 | |
West Contra Costa, CA Unified School District General Obligation, Election 2005, Series B, 6.000%, 08/01/21 | | | 75,000 | | | | 95,896 | |
Wiseburn, CA School District, Class A, 5.000%, 08/01/16 (National Insured) | | | 75,000 | | | | 82,998 | |
Yosemite, CA Community College District General Obligation, Prerefunded, Election 2004, Series A, 5.000%, 08/01/22 (FGIC Insured) | | | 420,000 | | | | 472,328 | |
Yosemite, CA Community College District General Obligation, Unrefunded, Election 2004, Series A, 5.000%, 08/01/22 (FGIC Insured) | | | 95,000 | | | | 105,212 | |
Yuba, CA Community College District General Obligation, Election 2006, Series A, 5.000%, 08/01/23 (AMBAC Insured) | | | 90,000 | | | | 100,206 | |
Yuba, CA Community College District General Obligation, Election 2006, Series A, 5.000%, 08/01/24 (AMBAC Insured) | | | 25,000 | | | | 27,729 | |
Total Municipal Bonds (cost $24,814,438) | | | | | | | 26,858,623 | |
| | |
| | | Shares | | | | |
Other Investment Companies - 2.0%2 | | | | | | | | |
BlackRock Liquidity Funds, California Money Fund - Institutional Class Shares, 0.04% (cost $560,188) | | | 560,188 | | | | 560,188 | |
Total Investments - 99.0% (cost $25,374,626)5 | | | | | | | 27,418,811 | |
Other Assets, less Liabilities - 1.0% | | | | | | | 274,447 | |
Net Assets - 100.0% | | | | | | $
| 27,693,258
|
|
The accompanying notes are an integral part of these financial statements.
38
Notes to Schedules of Portfolio Investments
The following footnotes and abbreviations should be read in conjunction with each of the Schedules of Portfolio Investments previously presented in this report.
At October 31, 2012, the approximate cost of investments for Federal income tax purposes and the gross aggregate unrealized appreciation and/or depreciation based on tax cost were as follows:
| | | | | | | | | | | | | | | | |
Fund | | Cost | | | Appreciation | | | Depreciation | | | Net | |
Managers Frontier Small Cap Growth Fund | | $ | 89,273,298 | | | $ | 11,788,534 | | | $ | (8,854,949 | ) | | $ | 2,933,585 | |
Managers AMG TSCM Growth Equity Fund | | | 22,502,638 | | | | 3,484,425 | | | | (359,241 | ) | | | 3,125,184 | |
Managers Micro-Cap Fund | | | 118,910,319 | | | | 28,328,994 | | | | (6,075,815 | ) | | | 22,253,179 | |
Managers Real Estate Securities Fund | | | 162,197,042 | | | | 8,116,566 | | | | (2,316,511 | ) | | | 5,800,055 | |
Managers California Intermediate Tax-Free Fund | | | 25,374,626 | | | | 2,048,518 | | | | (4,333 | ) | | | 2,044,185 | |
| | * | Non-income-producing security. |
| | 1 | Some or all of these shares were out on loan to various brokers as of October 31, 2012 amounting to: |
| | | | | | | | |
Fund | | Market Value | | | % of Net Assets | |
Managers Frontier Small Cap Growth Fund | | $ | 4,819,116 | | | | 5.6 | % |
Managers Micro-Cap Fund | | | 306,348 | | | | 0.2 | % |
| | 2 | Yield shown for each investment company represents the October 31, 2012, seven-day average yield, which refers to the sum of the previous seven days’ dividends paid, expressed as an annual percentage. |
| | 3 | Collateral received from brokers for securities lending was invested in the short-term investment. |
| | 4 | Illiquid Security: A security not readily convertible into cash such as a stock, bond or commodity that is not actively traded and would be difficult to sell in a current sale. The Funds may not invest more than 15% of their net assets in illiquid securities. All securities are valued by an independent pricing agent and are fair valued at Level 2. Illiquid securities market value at October 31, 2012 amounted to the following: |
| | | | | | | | |
Fund | | Market Value | | | % of Net Assets | |
Managers Micro-Cap Fund | | $ | 121,590 | | | | 0.1 | % |
| | 5 | At October 31, 2012, the concentration of the Fund’s investments by state or territory determined as a percentage of net assets was as follows: California 94.0% and Puerto Rico 3.0%. At October 31, 2012, 63.5% of the securities in the portfolio were backed by insurance of financial institutions and financial guaranty assurance agencies. Insurers with a concentration greater than 10% of net assets were as follows: National Insured 37.3% and FGIC 11.6%. |
As of October 31, 2012, the securities in Managers Frontier Small Cap Growth Fund, Managers AMG TSCM Growth Equity Fund and Managers Real Estate Securities Fund were all valued using Level 1 inputs. For a detailed break-out of the common stocks and REITs by major industry classification, please refer to the respective Schedule of Portfolio Investments previously presented in this report.
The following tables summarize the inputs used to value the Funds’ net assets by the fair value hierarchy levels as of October 31, 2012. (See Note 1(a) in the Notes to the Financial Statements.)
| | | | | | | | | | | | | | | | |
| | | Quoted Prices
in Active
Markets for
Identical Investments
Level 1 | | | Significant
Other
Observable
Inputs
Level 2 | | | Significant
Unobservable
Inputs
Level 3 | | | Total | |
Managers Micro-Cap Fund | | | | | | | | | | | | | | | | |
Investments in Securities | | | | | | | | | | | | | | | | |
Common Stocks† | | $ | 135,954,369 | | | $ | 121,590 | | | | — | | | $ | 136,075,959 | |
Exchange Traded Funds | | | 340,868 | | | | — | | | | — | | | | 340,868 | |
Other Investment Companies | | | 4,746,671 | | | | — | | | | — | | | | 4,746,671 | |
| | | | | | | | | | | | | | | | |
Total Investments in Securities | | $ | 141,041,908 | | | $ | 121,590 | | | | — | | | $ | 141,163,498 | |
| | | | | | | | | | | | | | | | |
The accompanying notes are an integral part of these financial statements.
39
Notes to Schedules of Portfolio Investments (continued)
| | | | | | | | | | | | | | | | |
| | | Quoted Prices
in Active
Markets for
Identical Investments
Level 1 | | | Significant
Other
Observable
Inputs
Level 2 | | | Significant
Unobservable
Inputs
Level 3 | | | Total | |
Managers California Intermediate Tax-Free Fund | | | | | | | | | | | | | | | | |
Investments in Securities | | | | | | | | | | | | | | | | |
Municipal Bonds†† | | | — | | | $ | 26,858,623 | | | | — | | | $ | 26,858,623 | |
Other Investment Companies | | $ | 560,188 | | | | — | | | | — | | | | 560,188 | |
| | | | | | | | | | | | | | | | |
Total Investments in Securities | | $ | 560,188 | | | $ | 26,858,623 | | | | — | | | $ | 27,418,811 | |
| | | | | | | | | | | | | | | | |
| | † | For a detailed break-out of the common stocks by major industry classification, please refer to the Schedule of Portfolio Investments. The only Level 2 security is classified in the Industrials industry. |
| | †† | All municipal bonds held in the Fund are Level 2 securities. For a detailed break-out of securities, please refer to the Schedule of Portfolio Investments. |
As of October 31, 2012, the Funds had no transfers between levels from the beginning of the reporting period.
Investments Definitions and Abbreviations:
ADR: ADR after the name of a holding stands for American Depositary Receipt, representing ownership of foreign securities on deposit with a domestic custodian bank. The value of the ADR securities is determined or significantly influenced by trading on exchanges not located in the United States or Canada. Sponsored ADRs are initiated by the underlying foreign company.
| | |
AMBAC: | | Ambac Assurance Corp. |
AGM: | | Assured Guaranty Municipal Corp. |
COP: | | Certificates of Participation |
ETF: | | Exchange Traded Fund |
FGIC: | | Financial Guaranty Insurance Company |
FSA: | | FSA Capital, Inc. |
National: | | National Public Finance Guarantee Corp. |
REIT: | | Real Estate Investment Trust |
XCLA: | | XL Capital Assurance, Inc. |
The accompanying notes are an integral part of these financial statements.
40
Statement of Assets and Liabilities
October 31, 2012
| | | | | | | | | | | | |
| | | Managers Frontier
Small Cap
Growth Fund | | | Managers AMG
TSCM Growth
Equity Fund | | | Managers
Micro-Cap Fund | |
Assets: | | | | | | | | | | | | |
Investments at value* (including securities on loan valued at $4,819,116, $0 and $306,348, respectively) | | $ | 92,206,883 | | | $ | 25,627,822 | | | $ | 141,163,498 | |
Receivable for investments sold | | | 175,828 | | | | 46,849 | | | | 262,080 | |
Receivable for Fund shares sold | | | 6,598 | | | | 17,590 | | | | 35,737 | |
Dividends, interest and other receivables | | | 27,425 | | | | 3,042 | | | | 29,736 | |
Receivable from affiliate | | | 8,638 | | | | 23,533 | | | | 28,825 | |
Prepaid expenses | | | 16,509 | | | | 21,930 | | | | 18,542 | |
Total assets | | | 92,441,881 | | | | 25,740,766 | | | | 141,538,418 | |
Liabilities: | | | | | | | | | | | | |
Payable upon return of securities loaned | | | 4,957,159 | | | | — | | | | 314,411 | |
Payable for Fund shares repurchased | | | 301,006 | | | | 73,152 | | | | 113,173 | |
Payable for investments purchased | | | 148,168 | | | | 219,585 | | | | 307,203 | |
Accrued expenses: | | | | | | | | | | | | |
Investment advisory and management fees | | | 74,536 | | | | 16,386 | | | | 120,932 | |
Administrative fees | | | — | | | | 5,462 | | | | 30,233 | |
Shareholder Servicing fees - Service Class | | | 2,715 | | | | — | | | | 23,838 | |
Shareholder Servicing fees - Investor Class | | | 101 | | | | 462 | | | | — | |
Distribution fees - Investor Class | | | 101 | | | | 771 | | | | — | |
Professional fees | | | 30,388 | | | | 21,281 | | | | 29,480 | |
Custodian | | | 18,771 | | | | 4,649 | | | | 41,146 | |
Other | | | 9,196 | | | | 13,688 | | | | 34,503 | |
Total liabilities | | | 5,542,141 | | | | 355,436 | | | | 1,014,919 | |
| | | |
Net Assets | | $ | 86,899,740 | | | $ | 25,385,330 | | | $ | 140,523,499 | |
| | | |
Net Assets Represent: | | | | | | | | | | | | |
Paid-in capital | | $ | 84,371,771 | | | $ | 22,883,484 | | | $ | 108,097,368 | |
Undistributed net investment income (loss) | | | (161,224 | ) | | | 19,347 | | | | (129,526 | ) |
Accumulated net realized gain (loss) from investments | | | (1,000,906 | ) | | | (696,573 | ) | | | 9,030,117 | |
Net unrealized appreciation of investments | | | 3,690,099 | | | | 3,179,072 | | | | 23,525,540 | |
Net Assets | | $ | 86,899,740 | | | $ | 25,385,330 | | | $ | 140,523,499 | |
Investor Class Shares: | | | | | | | | | | | | |
Net Assets | | $ | 474,363 | | | $ | 3,608,639 | | | | n/a | |
Shares outstanding | | | 25,222 | | | | 282,981 | | | | n/a | |
Net asset value, offering and redemption price per share | | $ | 18.81 | | | $ | 12.75 | | | | n/a | |
Service Class Shares: | | | | | | | | | | | | |
Net Assets | | $ | 12,664,011 | | | $ | 19,497,798 | | | $ | 110,732,174 | |
Shares outstanding | | | 669,348 | | | | 1,513,575 | | | | 2,971,770 | |
Net asset value, offering and redemption price per share | | $ | 18.92 | | | $ | 12.88 | | | $ | 37.26 | |
Institutional Class Shares: | | | | | | | | | | | | |
Net Assets | | $ | 73,761,366 | | | $ | 2,278,893 | | | $ | 29,791,325 | |
Shares outstanding | | | 3,873,956 | | | | 177,097 | | | | 797,196 | |
Net asset value, offering and redemption price per share | | $ | 19.04 | | | $ | 12.87 | | | $ | 37.37 | |
* Investments at cost | | $ | 88,516,784 | | | $ | 22,448,750 | | | $ | 117,637,958 | |
The accompanying notes are an integral part of these financial statements.
41
Statement of Assets and Liabilities
October 31, 2012 (continued)
| | | | | | | | |
| | | Managers
Real Estate
Securities Fund | | | Managers California
Intermediate
Tax-Free Fund | |
Assets: | | | | | | | | |
Investments at value* | | $ | 167,997,097 | | | $ | 27,418,811 | |
Receivable for investments sold | | | 468,158 | | | | — | |
Receivable for Fund shares sold | | | 1,422,208 | | | | 2,100 | |
Dividends, interest and other receivables | | | 68,811 | | | | 333,130 | |
Receivable from affiliate | | | 6,839 | | | | 8,116 | |
Prepaid expenses | | | 17,676 | | | | 2,014 | |
Total assets | | | 169,980,789 | | | | 27,764,171 | |
Liabilities: | | | | | | | | |
Payable for investments purchased | | | 946,134 | | | | — | |
Payable for Fund shares repurchased | | | 445,515 | | | | 365 | |
Accrued expenses: | | | | | | | | |
Investment advisory and management fees | | | 84,448 | | | | 9,262 | |
Administrative fees | | | 35,187 | | | | 5,859 | |
Shareholder servicing fees | | | 35,187 | | | | — | |
Professional fees | | | 41,837 | | | | 27,155 | |
Custodian | | | 12,795 | | | | 16,893 | |
Dividends payable to shareholders | | | — | | | | 7,900 | |
Other | | | 11,326 | | | | 3,479 | |
Total liabilities | | | 1,612,429 | | | | 70,913 | |
| | |
Net Assets | | $ | 168,368,360 | | | $ | 27,693,258 | |
| | |
Net Assets Represent: | | | | | | | | |
Paid-in capital | | $ | 158,458,612 | | | $ | 25,928,943 | |
Undistributed net investment income (loss) | | | 188,625 | | | | (1,576 | ) |
Accumulated net realized gain (loss) from investments | | | 2,681,216 | | | | (278,294 | ) |
Net unrealized appreciation of investments | | | 7,039,907 | | | | 2,044,185 | |
Net Assets | | $ | 168,368,360 | | | $ | 27,693,258 | |
Shares outstanding | | | 16,720,187 | | | | 2,483,853 | |
Net asset value, offering and redemption price per share | | $ | 10.07 | | | $ | 11.15 | |
* Investments at cost | | $ | 160,957,190 | | | $ | 25,374,626 | |
The accompanying notes are an integral part of these financial statements.
42
Statement of Operations
For the fiscal year ended October 31, 2012
| | | | | | | | | | | | | | | | | | | | |
| | | Managers Frontier
Small Cap
Growth Fund | | | Managers AMG
TSCM Growth
Equity Fund | | | Managers
Micro-Cap Fund | | | Managers
Real Estate
Securities Fund | | | Managers California
Intermediate
Tax-Free Fund | |
Investment Income: | | | | | | | | | | | | | | | | | | | | |
Dividend income | | $ | 671,861 | 1 | | $ | 256,746 | 2 | | $ | 1,129,534 | | | $ | 2,293,071 | | | $ | 83 | |
Securities lending income | | | 106,898 | | | | — | | | | 11,237 | | | | — | | | | — | |
Interest income | | | 54 | | | | — | | | | 362 | | | | 316 | | | | 1,121,746 | |
Foreign withholding tax | | | — | | | | (1,673 | ) | | | — | | | | — | | | | — | |
Total investment income | | | 778,813 | | | | 255,073 | | | | 1,141,133 | | | | 2,293,387 | | | | 1,121,829 | |
Expenses: | | | | | | | | | | | | | | | | | | | | |
Investment advisory and management fees | | | 914,088 | | | | 182,747 | | | | 1,447,924 | | | | 629,595 | | | | 108,012 | |
Administrative fees | | | — | | | | 60,916 | | | | 361,981 | | | | 262,332 | | | | 68,218 | |
Distribution fees - Investor Class | | | 1,291 | | | | 8,009 | | | | — | | | | — | | | | — | |
Shareholder Servicing fees - Service Class | | | 41,656 | | | | 36,072 | | | | 282,989 | | | | — | | | | — | |
Shareholder Servicing fees - Investor Class | | | 1,291 | | | | 4,805 | | | | — | | | | — | | | | — | |
Shareholder Servicing fees | | | — | | | | — | | | | — | | | | 262,332 | | | | — | |
Transfer agent | | | 18,891 | | | | 19,239 | | | | 61,529 | | | | 34,759 | | | | 4,399 | |
Professional fees | | | 38,771 | | | | 24,374 | | | | 37,641 | | | | 37,997 | | | | 27,712 | |
Registration fees | | | 36,485 | | | | 34,791 | | | | 40,983 | | | | 26,402 | | | | 5,049 | |
Custodian | | | 27,187 | | | | 6,264 | | | | 70,345 | | | | 22,887 | | | | 27,203 | |
Trustees fees and expenses | | | 3,951 | | | | 866 | | | | 7,396 | | | | 5,432 | | | | 1,423 | |
Miscellaneous | | | 10,027 | | | | 11,389 | | | | 40,213 | | | | 31,321 | | | | 4,707 | |
Total expenses before repayments and offsets | | | 1,093,638 | | | | 389,472 | | | | 2,351,001 | | | | 1,313,057 | | | | 246,723 | |
Expense repayments | | | — | | | | — | | | | — | | | | 25,148 | | | | — | |
Expense reimbursements | | | (89,364 | ) | | | (147,988 | ) | | | (358,192 | ) | | | (10,100 | ) | | | (96,633 | ) |
Expense reductions | | | (36 | ) | | | (5,664 | ) | | | (29,749 | ) | | | (4,601 | ) | | | (11 | ) |
Net expenses | | | 1,004,238 | | | | 235,820 | | | | 1,963,060 | | | | 1,323,504 | | | | 150,079 | |
| | | | | |
Net investment income (loss) | | | (225,425 | ) | | | 19,253 | | | | (821,927 | ) | | | 969,883 | | | | 971,750 | |
Net Realized and Unrealized Gain (Loss): | | | | | | | | | | | | | | | | | | | | |
Net realized gain (loss) on investments | | | (25,991 | ) | | | 234,312 | | | | 9,982,766 | | | | 4,286,642 | | | | 61,220 | |
Net change in unrealized appreciation of investments | | | 5,211,506 | | | | 3,287,379 | | | | 6,192,551 | | | | 3,518,401 | | | | 1,122,413 | |
Net realized and unrealized gain | | | 5,185,515 | | | | 3,521,691 | | | | 16,175,317 | | | | 7,805,043 | | | | 1,183,633 | |
Net increase in net assets resulting from operations | | $ | 4,960,090 | | | $ | 3,540,944 | | | $ | 15,353,390 | | | $ | 8,774,926 | | | $ | 2,155,383 | |
| 1 | Includes a non-recurring dividend of $ 156,236. |
| 2 | Includes a non-recurring dividend of $ 36,080. |
The accompanying notes are an integral part of these financial statements.
43
Statements of Changes in Net Assets
For the fiscal year ended October 31,
| | | | | | | | | | | | | | | | | | | | | | | | |
| | | Managers Frontier
Small Cap Growth Fund | | | Managers AMG TSCM Growth
Equity Fund | | | Managers
Micro-Cap Fund | |
| | | 2012 | | | 2011 | | | 2012 | | | 2011 | | | 2012 | | | 2011 | |
Increase (Decrease) in Net Assets From Operations: | | | | | | | | | | | | | | | | | | | | | | | | |
Net investment income (loss) | | $ | (225,425 | ) | | $ | (331,674 | ) | | $ | 19,253 | | | $ | (28,939 | ) | | $ | (821,927 | ) | | $ | (1,014,626 | ) |
Net realized gain (loss) on investments | | | (25,991 | ) | | | (716,902 | ) | | | 234,312 | | | | (929,573 | ) | | | 9,982,766 | | | | 27,071,407 | |
Net change in unrealized appreciation (depreciation) of investments | | | 5,211,506 | | | | (6,310,416 | ) | | | 3,287,379 | | | | (206,039 | ) | | | 6,192,551 | | | | (11,541,404 | ) |
Net increase (decrease) in net assets resulting from operations | | | 4,960,090 | | | | (7,358,992 | ) | | | 3,540,944 | | | | (1,164,551 | ) | | | 15,353,390 | | | | 14,515,377 | |
Distributions to Shareholders: | | | | | | | | | | | | | | | | | | | | | | | | |
From net investment income: | | | | | | | | | | | | | | | | | | | | | | | | |
Investor Class shares | | | — | | | | — | | | | — | | | | (21 | ) | | | — | | | | — | |
Service Class shares | | | — | | | | — | | | | | | | | | | | | | | | | | |
Institutional Class shares | | | — | | | | — | | | | — | | | | (766 | ) | | | — | | | | — | |
From net realized gain on investments: | | | | | | | | | | | | | | | | | | | | | | | | |
Investor Class shares | | | — | | | | — | | | | — | | | | — | | | | — | | | | — | |
Service Class shares | | | — | | | | (8,215,902 | ) | | | — | | | | — | | | | — | | | | — | |
Institutional Class shares | | | — | | | | (2,309,261 | ) | | | — | | | | — | | | | — | | | | — | |
Total distributions to shareholders | | | — | | | | — | | | | — | | | | (787 | ) | | | (10,525,163 | ) | | | — | |
Capital Share Transactions:1 | | | | | | | | | | | | | | | | | | | | | | | | |
Proceeds from sale of shares2 | | | 3,561,522 | | | | 81,140,798 | | | | 4,457,432 | | | | 31,374,366 | | | | 5,545,988 | | | | 31,916,363 | |
Reinvestment of dividends and distributions | | | — | | | | — | | | | — | | | | 787 | | | | 10,371,547 | | | | — | |
Cost of shares repurchased | | | (17,601,233 | ) | | | (8,248,962 | ) | | | (5,381,592 | ) | | | (8,528,660 | ) | | | (25,699,402 | ) | | | (36,524,195 | ) |
Net increase (decrease) from capital share transactions | | | (14,039,711 | ) | | | 72,891,836 | | | | (924,160 | ) | | | 22,846,493 | | | | (9,781,867 | ) | | | (4,607,832 | ) |
| | | | | | |
Total increase (decrease) in net assets | | | (9,079,621 | ) | | | 65,532,844 | | | | 2,616,784 | | | | 21,681,155 | | | | (4,953,640 | ) | | | 9,907,545 | |
Net Assets: | | | | | | | | | | | | | | | | | | | | | | | | |
Beginning of year | | | 95,979,361 | | | | 30,446,517 | | | | 22,768,546 | | | | 1,087,391 | | | | 145,477,139 | | | | 135,569,594 | |
End of year | | $ | 86,899,740 | | | $ | 95,979,361 | | | $ | 25,385,330 | | | $ | 22,768,546 | | | $ | 140,523,499 | | | $ | 145,477,139 | |
End of year undistributed net investment income (loss) | | $ | (161,224 | ) | | | — | | | $ | 19,347 | | | | — | | | $ | (129,526 | ) | | $ | 125,308 | |
| | | | | | | | | | | | | | | | | | | | | | | | |
Share Transactions:1 | | | | | | | | | | | | | | | | | | | | | | | | |
Sale of shares | | | 191,234 | | | | 3,956,983 | | | | 364,359 | | | | 2,661,437 | | | | 135,508 | | | | 1,003,651 | |
Reinvested shares from dividends and distributions | | | — | | | | — | | | | — | | | | 68 | | | | 306,740 | | | | — | |
Shares repurchased | | | (949,290 | ) | | | (450,640 | ) | | | (443,443 | ) | | | (708,136 | ) | | | (710,871 | ) | | | (1,022,125 | ) |
Net increase (decrease) in shares | | | (758,056 | ) | | | 3,506,343 | | | | (79,084 | ) | | | 1,953,369 | | | | (268,623 | ) | | | (18,474 | ) |
| 1 | See Note 1(g) of the Notes to Financial Statements. |
| 2 | For the year ended October 31, 2012, the proceeds from the sale of shares for Managers Micro-Cap include the receipt of market timing settlements of $647,713. |
The accompanying notes are an integral part of these financial statements.
44
Statements of Changes in Net Assets
For the fiscal year ended October 31,
| | | | | | | | | | | | | | | | |
| | | Managers Real Estate
Securities Fund | | | Managers California Intermediate
Tax-Free Fund | |
| | | 2012 | | | 2011 | | | 2012 | | | 2011 | |
Increase (Decrease) in Net Assets From Operations: | | | | | | | | | | | | | | | | |
Net investment income | | $ | 969,883 | | | $ | 287,029 | | | $ | 971,750 | | | $ | 1,014,096 | |
Net realized gain on investments | | | 4,286,642 | | | | 4,647,071 | | | | 61,220 | | | | 73,261 | |
Net change in unrealized appreciation
(depreciation) of investments | | | 3,518,401 | | | | (1,109,944 | ) | | | 1,122,413 | | | | (321,805 | ) |
Net increase in net assets resulting from operations | | | 8,774,926 | | | | 3,824,156 | | | | 2,155,383 | | | | 765,552 | |
Distributions to Shareholders: | | | | | | | | | | | | | | | | |
From net investment income: | | | (855,892 | ) | | | (266,975 | ) | | | (971,750 | ) | | | (1,014,096 | ) |
Capital Share Transactions: | | | | | | | | | | | | | | | | |
Proceeds from sale of shares | | | 131,112,035 | | | | 45,437,049 | | | | 1,402,727 | | | | 1,019,409 | |
Reinvestment of dividends and distributions | | | 731,421 | | | | 255,784 | | | | 440,362 | | | | 448,572 | |
Cost of shares repurchased | | | (26,962,627 | ) | | | (17,468,606 | ) | | | (2,195,616 | ) | | | (5,672,621 | ) |
Net increase (decrease) from capital share transactions | | | 104,880,829 | | | | 28,224,227 | | | | (352,527 | ) | | | (4,204,640 | ) |
| | | | |
Total increase (decrease) in net assets | | | 112,799,863 | | | | 31,781,408 | | | | 831,106 | | | | (4,453,184 | ) |
Net Assets: | | | | | | | | | | | | | | | | |
Beginning of year | | | 55,568,497 | | | | 23,787,089 | | | | 26,862,152 | | | | 31,315,336 | |
End of year | | $ | 168,368,360 | | | $ | 55,568,497 | | | $ | 27,693,258 | | | $ | 26,862,152 | |
End of year undistributed net investment income (loss) | | $ | 188,625 | | | $ | 64,575 | | | $ | (1,576 | ) | | $ | (1,576 | ) |
| | | | | | | | | | | | | | | | |
Share Transactions: | | | | | | | | | | | | | | | | |
Service Class: | | | | | | | | | | | | | | | | |
Sale of shares | | | 13,173,769 | | | | 5,269,490 | | | | 126,691 | | | | 96,667 | |
Reinvested shares from dividends and distributions | | | 74,151 | | | | 30,340 | | | | 39,930 | | | | 42,697 | |
Shares repurchased | | | (2,739,342 | ) | | | (2,019,458 | ) | | | (199,729 | ) | | | (543,402 | ) |
Net increase (decrease) in shares | | | 10,508,578 | | | | 3,280,372 | | | | (33,108 | ) | | | (404,038 | ) |
The accompanying notes are an integral part of these financial statements.
45
Managers Frontier Small Cap Growth Fund
Financial Highlights
For a share outstanding throughout each fiscal period
| | | | | | | | | | | | |
| | | | | | | | | For the fiscal
period ended
October 31, 2010* | |
| | | For the fiscal year ended October 31, | | |
Investor Class Shares | | 2012 | | | 2011 | | |
Net Asset Value, Beginning of Period | | $ | 17.90 | | | $ | 16.70 | | | $ | 14.64 | |
Income from Investment Operations: | | | | | | | | | | | | |
Net investment loss1 | | | (0.13 | )4 | | | (0.16 | ) | | | (0.11 | ) |
Net realized and unrealized gain on investments1 | | | 1.04 | | | | 1.36 | | | | 2.17 | |
Total from investment operations | | | 0.91 | | | | 1.20 | | | | 2.06 | |
Net Asset Value, End of Period | | $ | 18.81 | | | $ | 17.90 | | | $ | 16.70 | |
Total Return2 | | | 5.08 | % | | | 7.19 | % | | | 14.07 | %6 |
Ratio of net expenses to average net assets | | | 1.55 | % | | | 1.55 | % | | | 1.55 | %7 |
Ratio of net investment loss to average net assets2 | | | (0.70 | )% | | | (0.86 | )% | | | (0.91 | )%7 |
Portfolio turnover | | | 38 | % | | | 44 | % | | | 52 | %6 |
Net assets at end of period (000’s omitted) | | $ | 474 | | | $ | 563 | | | $ | 406 | |
| | | | | | | | | | | | |
Ratios absent expense offsets:3 | | | | | | | | | | | | |
Ratio of total expenses to average net assets | | | 1.65 | % | | | 1.72 | % | | | 1.94 | %7 |
Ratio of net investment loss to average net assets | | | (0.80 | )% | | | (1.03 | )% | | | (1.30 | )%7 |
| | | | | | | | | | | | |
| | | | | | | | | | | | | | | | | | | | |
| | | For the fiscal year ended October 31, | |
Service Class Shares | | 2012 | | | 2011 | | | 2010* | | | 2009 | | | 2008 | |
Net Asset Value, Beginning of Year | | $ | 17.96 | | | $ | 16.72 | | | $ | 13.42 | | | $ | 11.69 | | | $ | 17.87 | |
Income from Investment Operations: | | | | | | | | | | | | | | | | | | | | |
Net investment loss1 | | | (0.09 | )4 | | | (0.12 | ) | | | (0.12 | ) | | | (0.10 | ) | | | (0.12 | ) |
Net realized and unrealized gain (loss) on investments1 | | | 1.05 | | | | 1.36 | | | | 3.42 | | | | 1.83 | | | | (6.06 | ) |
Total from investment operations | | | 0.96 | | | | 1.24 | | | | 3.30 | | | | 1.73 | | | | (6.18 | ) |
Net Asset Value, End of Year | | $ | 18.92 | | | $ | 17.96 | | | $ | 16.72 | | | $ | 13.42 | | | $ | 11.69 | |
Total Return2 | | | 5.35 | %5 | | | 7.42 | %5 | | | 24.59 | % | | | 14.80 | % | | | (34.58 | )% |
Ratio of net expenses to average net assets | | | 1.30 | % | | | 1.30 | % | | | 1.37 | % | | | 1.46 | % | | | 1.41 | % |
Ratio of net investment loss to average net assets2 | | | (0.48 | )% | | | (0.63 | )% | | | (0.78 | )% | | | (0.90 | )% | | | (0.79 | )% |
Portfolio turnover | | | 38 | % | | | 44 | % | | | 52 | % | | | 136 | % | | | 59 | % |
Net assets at end of year (000’s omitted) | | $ | 12,664 | | | $ | 18,199 | | | $ | 18,290 | | | $ | 39,536 | | | $ | 51,057 | |
| | | | | | | | | | | | | | | | | | | | |
Ratios absent expense offsets:3 | | | | | | | | | | | | | | | | | | | | |
Ratio of total expenses to average net assets | | | 1.40 | % | | | 1.47 | % | | | 1.66 | % | | | 1.50 | % | | | 1.43 | % |
Ratio of net investment loss to average net assets | | | (0.58 | )% | | | (0.80 | )% | | | (1.07 | )% | | | (0.94 | )% | | | (0.80 | )% |
| | | | | | | | | | | | | | | | | | | | |
46
Managers Frontier Small Cap Growth Fund
Financial Highlights
For a share outstanding throughout each fiscal period
| | | | | | | | | | | | |
| | | | | | | | | For the fiscal
period ended
October 31, 2010* | |
| | | For the fiscal year ended October 31, | | |
Institutional Class Shares | | 2012 | | | 2011 | | |
Net Asset Value, Beginning of Period | | $ | 18.03 | | | $ | 16.74 | | | $ | 14.64 | |
Income from Investment Operations: | | | | | | | | | | | | |
Net investment loss1 | | | (0.04 | )4 | | | (0.08 | ) | | | (0.05 | ) |
Net realized and unrealized gain on investments1 | | | 1.05 | | | | 1.37 | | | | 2.15 | |
Total from investment operations | | | 1.01 | | | | 1.29 | | | | 2.10 | |
Net Asset Value, End of Period | | $ | 19.04 | | | $ | 18.03 | | | $ | 16.74 | |
Total Return2 | | | 5.60 | % | | | 7.71 | % | | | 14.34 | %6 |
Ratio of net expenses to average net assets | | | 1.05 | % | | | 1.05 | % | | | 1.05 | %7 |
Ratio of net investment loss to average net assets2 | | | (0.20 | )% | | | (0.41 | )% | | | (0.41 | )%7 |
Portfolio turnover | | | 38 | % | | | 44 | % | | | 52 | %6 |
Net assets at end of period (000’s omitted) | | $ | 73,762 | | | $ | 77,217 | | | $ | 11,750 | |
| | | | | | | | | | | | |
Ratios absent expense offsets:3 | | | | | | | | | | | | |
Ratio of total expenses to average net assets | | | 1.15 | % | | | 1.22 | % | | | 1.44 | %7 |
Ratio of net investment loss to average net assets | | | (0.30 | )% | | | (0.58 | )% | | | (0.80 | )%7 |
| | | | | | | | | | | | |
47
Managers AMG TSCM Growth Equity Fund
Financial Highlights
For a share outstanding throughout each fiscal period
| | | | | | | | | | | | |
| | | | | | | | | For the fiscal
period ended
October 31, 2010** | |
| | | For the fiscal year ended October 31, | | |
Investor Class Shares | | 2012 | | | 2011 | | |
Net Asset Value, Beginning of Period | | $ | 11.02 | | | $ | 10.93 | | | $ | 10.00 | |
Income from Investment Operations: | | | | | | | | | | | | |
Net investment loss1 | | | (0.02 | )4 | | | (0.10 | ) | | | (0.00 | )# |
Net realized and unrealized gain on investments1 | | | 1.75 | | | | 0.19 | | | | 0.93 | |
Total from investment operations | | | 1.73 | | | | 0.09 | | | | 0.93 | |
Less Distributions to Shareholders from: | | | | | | | | | | | | |
Net investment income | | | — | | | | (0.00 | )# | | | — | |
Net Asset Value, End of Period | | $ | 12.75 | | | $ | 11.02 | | | $ | 10.93 | |
Total Return2 | | | 15.70 | % | | | 0.84 | % | | | 9.30 | %6 |
Ratio of net expenses to average net assets | | | 1.17 | % | | | 1.11 | % | | | 1.17 | %7 |
Ratio of net investment loss to average net assets2 | | | (0.14 | )% | | | (0.86 | )% | | | (0.11 | )%7 |
Portfolio turnover | | | 87 | % | | | 102 | % | | | 50 | %6 |
Net assets at end of period (000’s omitted) | | $ | 3,608 | | | $ | 2,465 | | | $ | 14 | |
| | | | | | | | | | | | |
Ratios absent expense offsets:3 | | | | | | | | | | | | |
Ratio of total expenses to average net assets | | | 1.80 | % | | | 2.04 | % | | | 15.15 | %7 |
Ratio of net investment loss to average net assets | | | (0.77 | )% | | | (1.79 | )% | | | (14.09 | )%7 |
| | | | | | | | | | | | |
| | | |
| | | | | | | | | For the fiscal
period ended
October 31, 2010** | |
| | | For the fiscal year ended October 31, | | |
Service Class Shares | | 2012 | | | 2011 | | |
Net Asset Value, Beginning of Period | | $ | 11.10 | | | $ | 10.94 | | | $ | 10.00 | |
Income from Investment Operations: | | | | | | | | | | | | |
Net investment income (loss)1 | | | 0.01 | 4 | | | (0.02 | ) | | | 0.00 | # |
Net realized and unrealized gain on investments1 | | | 1.77 | | | | 0.18 | | | | 0.94 | |
Total from investment operations | | | 1.78 | | | | 0.16 | | | | 0.94 | |
Net Asset Value, End of Period | | $ | 12.88 | | | $ | 11.10 | | | $ | 10.94 | |
Total Return2 | | | 16.04 | %5 | | | 1.46 | %5 | | | 9.40 | %6 |
Ratio of net expenses to average net assets | | | 0.96 | % | | | 0.96 | % | | | 1.03 | %7 |
Ratio of net investment income (loss) to average net assets2 | | | 0.09 | % | | | (0.17 | )% | | | 0.00 | %#,7 |
Portfolio turnover | | | 87 | % | | | 102 | % | | | 50 | %6 |
Net assets at end of period (000’s omitted) | | $ | 19,498 | | | $ | 18,321 | | | $ | 11 | |
| | | | | | | | | | | | |
Ratios absent expense offsets:3 | | | | | | | | | | | | |
Ratio of total expenses to average net assets | | | 1.59 | % | | | 1.89 | % | | | 15.00 | %7 |
Ratio of net investment loss to average net assets | | | (0.54 | )% | | | (1.10 | )% | | | (13.97 | )%7 |
| | | | | | | | | | | | |
48
Managers AMG TSCM Growth Equity Fund
Financial Highlights
For a share outstanding throughout each fiscal period
| | | | | | | | | | | | |
| | | For the fiscal year ended October 31, | | | For the fiscal
period ended
October 31, 2010** | |
| | | |
Institutional Class Shares | | 2012 | | | 2011 | | |
Net Asset Value, Beginning of Period | | $ | 11.07 | | | $ | 10.94 | | | $ | 10.00 | |
Income from Investment Operations: | | | | | | | | | | | | |
Net investment income1 | | | 0.03 | 4 | | | 0.00 | # | | | 0.01 | |
Net realized and unrealized gain on investments1 | | | 1.77 | | | | 0.13 | | | | 0.93 | |
Total from investment operations | | | 1.80 | | | | 0.13 | | | | 0.94 | |
Less Distributions to Shareholders from: | | | | | | | | | | | | |
Net investment income | | | — | | | | (0.00 | )# | | | — | |
Net Asset Value, End of Period | | $ | 12.87 | | | $ | 11.07 | | | $ | 10.94 | |
Total Return2 | | | 16.26 | % | | | 1.23 | % | | | 9.40 | %6 |
Ratio of net expenses to average net assets | | | 0.77 | % | | | 0.71 | % | | | 0.79 | %7 |
Ratio of net investment income to average net assets2 | | | 0.26 | % | | | 0.03 | % | | | 0.27 | %7 |
Portfolio turnover | | | 87 | % | | | 102 | % | | | 50 | %6 |
Net assets at end of period (000’s omitted) | | $ | 2,279 | | | $ | 1,982 | | | $ | 1,063 | |
| | | | | | | | | | | | |
Ratios absent expense offsets:3 | | | | | | | | | | | | |
Ratio of total expenses to average net assets | | | 1.40 | % | | | 1.64 | % | | | 14.74 | %7 |
Ratio of net investment loss to average net assets | | | (0.37 | )% | | | (0.90 | )% | | | (13.68 | )%7 |
| | | | | | | | | | | | |
49
Managers Micro-Cap Fund
Financial Highlights
For a share outstanding throughout each fiscal period
| | | | | | | | | | | | | | | | | | | | |
| | | For the fiscal year ended October 31, | |
Service Class Shares† | | 2012 | | | 2011 | | | 2010 | | | 2009 | | | 2008 | |
Net Asset Value, Beginning of Year | | $ | 36.03 | | | $ | 33.42 | | | $ | 26.37 | | | $ | 25.41 | | | $ | 41.90 | |
Income from Investment Operations: | | | | | | | | | | | | | | | | | | | | |
Net investment loss1 | | | (0.23 | ) | | | (0.27 | ) | | | (0.25 | ) | | | (0.21 | ) | | | (0.31 | ) |
Net realized and unrealized gain (loss) on investments1 | | | 4.12 | | | | 2.88 | | | | 7.30 | | | | 2.73 | | | | (16.18 | ) |
Total from investment operations | | | 3.89 | | | | 2.61 | | | | 7.05 | | | | 2.52 | | | | (16.49 | ) |
Less Distributions to Shareholders from: | | | | | | | | | | | | | | | | | | | | |
Net realized gain on investments | | | (2.66 | ) | | | — | | | | — | | | | (1.56 | ) | | | — | |
Net Asset Value, End of Year | | $ | 37.26 | | | $ | 36.03 | | | $ | 33.42 | | | $ | 26.37 | | | $ | 25.41 | |
Total Return2 | | | 11.55 | %††† | | | 7.78 | % | | | 26.73 | %5 | | | 11.34 | %5 | | | (39.37 | )% |
Ratio of net expenses to average net assets | | | 1.41 | % | | | 1.41 | % | | | 1.50 | % | | | 1.53 | % | | | 1.54 | % |
Ratio of net investment loss to average net assets2 | | | (0.62 | )% | | | (0.73 | )% | | | (0.84 | )% | | | (0.90 | )% | | | (0.92 | )% |
Portfolio turnover | | | 64 | % | | | 85 | % | | | 93 | % | | | 82 | % | | | 193 | % |
Net assets at end of year (000’s omitted) | | $ | 110,732 | | | $ | 113,742 | | | $ | 135,570 | | | $ | 127,322 | | | $ | 132,424 | |
| | | | | | | | | | | | | | | | | | | | |
Ratios absent expense offsets:3 | | | | | | | | | | | | | | | | | | | | |
Ratio of total expenses to average net assets | | | 1.68 | % | | | 1.66 | % | | | 1.72 | % | | | 1.75 | % | | | 1.66 | % |
Ratio of net investment loss to average net assets | | | (0.89 | )% | | | (0.98 | )% | | | (1.06 | )% | | | (1.12 | )% | | | (1.04 | )% |
| | | | | | | | | | | | | | | | | | | | |
| | | | | | | | |
Institutional Class Shares†† | | For the fiscal
year ended
October 31, 2012 | | | For the fiscal period
October 1, 2011
through
October 31, 2011 | |
Net Asset Value, Beginning of Period | | $ | 36.03 | | | $ | 31.02 | |
Income from Investment Operations: | | | | | | | | |
Net investment loss1 | | | (0.13 | ) | | | (0.01 | ) |
Net realized and unrealized gain on investments1 | | | 4.13 | | | | 5.02 | |
Total from investment operations | | | 4.00 | | | | 5.01 | |
Less Distributions to Shareholders from: | | | | | | | | |
Net realized gain on investments | | | (2.66 | ) | | | — | |
Net Asset Value, End of Period | | $ | 37.37 | | | $ | 36.03 | |
Total Return2 | | | 11.84 | %††† | | | 16.18 | %6 |
Ratio of net expenses to average net assets | | | 1.16 | % | | | 1.17 | %7 |
Ratio of net investment loss to average net assets2 | | | (0.37 | )% | | | (0.42 | )%7 |
Portfolio turnover | | | 64 | % | | | 85 | %6 |
Net assets at end of period (000’s omitted) | | $ | 29,791 | | | $ | 31,735 | |
| | | | | | | | |
Ratios absent expense offsets:3 | | | | | | | | |
Ratio of total expenses to average net assets | | | 1.43 | % | | | 1.50 | %7 |
Ratio of net investment loss to average net assets | | | (0.64 | )% | | | (0.75 | )%7 |
| | | | | | | | |
50
Managers Real Estate Securities Fund
Financial Highlights
For a share outstanding throughout each fiscal period
| | | | | | | | | | | | | | | | | | | | |
| | | For the fiscal year ended October 31, | |
| | | 2012 | | | 2011 | | | 2010 | | | 2009 | | | 2008 | |
Net Asset Value, Beginning of Year | | $ | 8.95 | | | $ | 8.12 | | | $ | 5.68 | | | $ | 5.55 | | | $ | 12.57 | |
Income from Investment Operations: | | | | | | | | | | | | | | | | | | | | |
Net investment income1 | | | 0.09 | | | | 0.06 | | | | 0.08 | | | | 0.12 | | | | 0.13 | |
Net realized and unrealized gain (loss) on investments1 | | | 1.11 | | | | 0.83 | | | | 2.43 | | | | 0.16 | | | | (4.06 | ) |
Total from investment operations | | | 1.20 | | | | 0.89 | | | | 2.51 | | | | 0.28 | | | | (3.93 | ) |
Less Distributions to Shareholders from: | | | | | | | | | | | | | | | | | | | | |
Net investment income | | | (0.08 | ) | | | (0.06 | ) | | | (0.07 | ) | | | (0.15 | ) | | | (0.12 | ) |
Net realized gain on investments | | | — | | | | — | | | | — | | | | — | | | | (2.97 | ) |
Total distributions to shareholders | | | (0.08 | ) | | | (0.06 | ) | | | (0.07 | ) | | | (0.15 | ) | | | (3.09 | ) |
Net Asset Value, End of Year | | $ | 10.07 | | | $ | 8.95 | | | $ | 8.12 | | | $ | 5.68 | | | $ | 5.55 | |
Total Return2 | | | 13.43 | % | | | 11.06 | % | | | 44.47 | % | | | 5.77 | % | | | (38.95 | )% |
Ratio of net expenses to average net assets | | | 1.26 | % | | | 1.41 | % | | | 1.49 | % | | | 1.48 | % | | | 1.48 | % |
Ratio of net investment income to average net assets2 | | | 0.92 | % | | | 0.69 | % | | | 1.12 | % | | | 2.56 | % | | | 1.63 | % |
Portfolio turnover | | | 36 | % | | | 75 | % | | | 99 | % | | | 107 | % | | | 127 | % |
Net assets at end of year (000’s omitted) | | $ | 168,368 | | | $ | 55,568 | | | $ | 23,787 | | | $ | 14,526 | | | $ | 12,366 | |
| | | | | | | | | | | | | | | | | | | | |
Ratios absent expense offsets:3 | | | | | | | | | | | | | | | | | | | | |
Ratio of total expenses to average net assets | | | 1.28 | % | | | 1.48 | % | | | 1.79 | % | | | 2.47 | % | | | 1.80 | % |
Ratio of net investment income to average net assets | | | 0.91 | % | | | 0.62 | % | | | 0.82 | % | | | 1.57 | % | | | 1.31 | % |
| | | | | | | | | | | | | | | | | | | | |
51
Managers California Intermediate Tax-Free Fund
Financial Highlights
For a share outstanding throughout each fiscal period
| | | | | | | | | | | | | | | | | | | | |
| |
| | | For the fiscal year ended October 31, | |
| | | 2012 | | | 2011 | | | 2010 | | | 2009 | | | 2008 | |
Net Asset Value, Beginning of Year | | $ | 10.67 | | | $ | 10.72 | | | $ | 10.40 | | | $ | 9.84 | | | $ | 10.56 | |
Income from Investment Operations: | | | | | | | | | | | | | | | | | | | | |
Net investment income | | | 0.39 | 1 | | | 0.39 | | | | 0.34 | | | | 0.32 | | | | 0.38 | |
Net realized and unrealized gain (loss) on investments | | | 0.48 | 1 | | | (0.05 | ) | | | 0.32 | | | | 0.55 | | | | (0.56 | ) |
Total from investment operations | | | 0.87 | | | | 0.34 | | | | 0.66 | | | | 0.87 | | | | (0.18 | ) |
Less Distributions to Shareholders from: | | | | | | | | | | | | | | | | | | | | |
Net investment income | | | (0.39 | ) | | | (0.39 | ) | | | (0.34 | ) | | | (0.31 | ) | | | (0.38 | ) |
Net realized gain on investments | | | — | | | | — | | | | — | | | | — | | | | (0.16 | ) |
Total distributions to shareholders | | | (0.39 | ) | | | (0.39 | ) | | | (0.34 | ) | | | (0.31 | ) | | | (0.54 | ) |
Net Asset Value, End of Year | | $ | 11.15 | | | $ | 10.67 | | | $ | 10.72 | | | $ | 10.40 | | | $ | 9.84 | |
Total Return2 | | | 8.27 | % | | | 3.27 | % | | | 6.41 | % | | | 8.97 | % | | | (1.82 | )% |
Ratio of net expenses to average net assets | | | 0.55 | % | | | 0.55 | % | | | 0.55 | % | | | 0.55 | % | | | 0.55 | % |
Ratio of net investment income to average net assets2 | | | 3.56 | % | | | 3.69 | % | | | 3.20 | % | | | 3.08 | % | | | 3.71 | % |
Portfolio turnover | | | 5 | % | | | 8 | % | | | 64 | % | | | 152 | % | | | 33 | % |
Net assets at end of year (000’s omitted) | | $ | 27,693 | | | $ | 26,862 | | | $ | 31,315 | | | $ | 31,181 | | | $ | 32,955 | |
| | | | | | | | | | | | | | | | | | | | |
Ratios absent expense offsets:3 | | | | | | | | | | | | | | | | | | | | |
Ratio of total expenses to average net assets | | | 0.90 | % | | | 0.90 | % | | | 0.96 | % | | | 0.86 | % | | | 0.80 | % |
Ratio of net investment income to average net assets | | | 3.21 | % | | | 3.34 | % | | | 2.79 | % | | | 2.77 | % | | | 3.46 | % |
| | | | | | | | | | | | | | | | | | | | |
Notes to Financial Highlights
The following footnotes should be read in conjunction with the Financial Highlights of the Funds previously presented in this report.
| # | Rounds to less than $0.01 per share or 0.01%. |
| * | Effective January 1, 2010, existing shares of Managers Frontier Small Cap Growth Fund (formerly shares of Managers Small Cap Fund) were reclassified and redesignated as Service Class shares. Investor Class and Institutional Class shares commenced operations on January 1, 2010. |
| ** | Commenced operations on July 30, 2010. |
| † | Effective October 1, 2011, existing shares of Managers Micro-Cap Fund were reclassified and redesignated as Service Class shares. |
| †† | As of the close of business on September 30, 2011, Managers Institutional Micro-Cap Fund (“Institutional Micro-Cap”) merged into Managers Micro-Cap Fund. Each full and partial share of Institutional Micro-Cap was exchanged for shares in the new Institutional Class of Micro-Cap in an equivalent dollar amount. |
| ††† | Returns would have been lower if not for capital inflow resulting from fair funds settlements. (See Note 1(g) of Notes to Financial Statements. |
| 1 | Per share numbers have been calculated using average shares. |
| 2 | Total returns and net investment income (loss) would have been lower had certain expenses not been reduced. (See Note 1(c) of Notes to Financial Statements.) |
| 3 | Excludes the impact of expense reimbursement and expense reductions such as brokerage credits, but includes expense repayments and non-reimbursable expenses, if any, such as interest and taxes. (See Note 1(c) of Notes to Financial Statements.) |
| 4 | Includes a non-recurring dividend. Without this dividend, net investment income per share would have been $(0.16), $(0.12), and $(0.07) for Managers Frontier Small Cap Growth Equity’s Investor Class, Service Class, and Institutional Class shares, respectively, and $(0.03), $(0.01), and $0.02 for Managers AMG TSCM Growth Equity Fund’s Investor Class, Service Class, and Institutional Class shares, respectively. |
| 5 | The Total Return is based on the Financial Statement Net Asset Values as shown above. |
52
Notes to Financial Statements
October 31, 2012
1. Summary of Significant Accounting Policies
Managers Trust I (the “Trust”) is an open-end management investment company organized as a Massachusetts business trust and registered under the Investment Company Act of 1940, as amended (the “1940 Act”). Currently, the Trust consists of a number of different funds, each having distinct investment management objectives, strategies, risks and policies. Included in this report are the Managers Frontier Small Cap Growth Fund (“Small Cap”), Managers AMG TSCM Growth Equity Fund (“TSCM Growth Equity”), Managers Micro-Cap Fund (“Micro-Cap”), Managers Real Estate Securities Fund (“Real Estate Securities”), and Managers California Intermediate Tax-Free Fund (“California Intermediate Tax-Free”), each a “Fund” and collectively the “Funds.”
Small Cap and TSCM Growth Equity each offer three classes of shares: Investor Class, Service Class, and Institutional Class. Micro-Cap currently offers two classes of shares: Institutional Class and Service Class. Each class represents an interest in the same assets of the Fund and the classes are identical except for class specific expenses related to shareholder activity. Each class has equal voting privileges except that each class has exclusive voting rights with respect to its services and/or distribution plan. Please refer to a current prospectus for additional information on each share class.
The Funds’ financial statements are prepared in accordance with accounting principles generally accepted in the United States of America (“U.S. GAAP”), which require management to make estimates and assumptions that affect the reported amounts of assets and liabilities and disclosure of contingent assets and liabilities at the date of the financial statements and the reported amounts of income and expenses during the reporting periods. Actual results could differ from those estimates and such differences could be material. The following is a summary of significant accounting policies followed by the Funds in the preparation of their financial statements:
a. Valuation of Investments
Equity securities traded on a domestic or international securities exchange are valued at the last quoted sale price, or, lacking any sales, at the last quoted bid price. Over-the-counter securities are valued at the Nasdaq Official Closing Price, if one is available. Lacking any sales, over-the-counter securities are valued at the last quoted bid price. The Funds’ investments are generally valued based on market quotations provided by third-party pricing services approved by the Board of Trustees of the Funds (the “Board”).
Fixed-income securities are valued based on valuations furnished by independent pricing services that utilize matrix systems, which reflect such factors as security prices, yields, maturities, and ratings, and are supplemented by dealer and exchange quotations. Short-term investments having a remaining maturity of 60 days or less are generally valued at amortized cost, which approximates market value. Investments in other open-end regulated investment companies are valued at their end of day net asset value per share. Investments in certain mortgage-backed and stripped mortgage-backed securities, preferred stocks, convertible securities, derivatives and other debt securities not traded on an organized securities market are valued on the basis of valuations provided by dealers or by a pricing service which uses information with respect to transactions in such securities and various relationships between such securities and yield to maturity in determining value.
Under certain circumstances, the value of certain Fund investments (including derivatives) may be based on an evaluation of fair value, pursuant to procedures established by and under the general supervision of the Board. The Pricing Committee is the committee formed by the Board to make fair value determinations for such investments. When determining the fair value of an investment, the Pricing Committee seeks to determine the price that each Fund might reasonably expect to receive from a current sale of that investment in an arm’s-length transaction. Fair value determinations shall be based upon consideration of all available facts and information, including, but not limited to (i) attributes specific to the investment; (ii) fundamental analytical data and press releases relating to the investment and its issuer; (iii) the value of comparable securities or relevant financial instruments, including derivative securities, traded on other markets or among dealers; and (iv) other factors, such as future cash flows, interest rates, yield curves, volatilities, credit risks and/or default rates. The Board will be presented with a quarterly report comparing fair values determined by the Pricing Committee against subsequent market valuations for those securities. The values assigned to fair value investments are based on available information and do not necessarily represent amounts that might ultimately be realized, since such amounts depend on future developments inherent in long-term investments. Further, because of the inherent uncertainty of valuation, those estimated values may differ significantly from the values that would have been used had a ready market for the investments existed, and the differences could be material. Each Fund may use the fair value of a portfolio investment to calculate its net asset value (“NAV”) when, for example, (1) market quotations are not readily available because a portfolio investment is not traded in a public market or the principal market in which the investment trades is closed, (2) trading in a portfolio investment is suspended and has not resumed before the Fund calculates its NAV, (3) a significant event affecting the value of a portfolio investment is determined to have occurred between the time of the market quotation provided for a portfolio investment and the time as of which each Fund calculates its NAV, (4) an investment’s price has remained unchanged over a period of time (often referred to as a “stale price”), or (5) Managers Investment Group LLC (the “Investment Manager”) determines that a market quotation is inaccurate. Portfolio investments that trade primarily on foreign markets are priced based upon the market quotation of such securities as of the close of their respective principal markets, as adjusted to reflect the Investment Manager’s determination of the impact of events occurring subsequent to the close of such markets but prior to the time as of which each Fund calculates its NAV. Under certain circumstances, the Investment Manager may adjust such prices based on its determination of the impact of events occurring subsequent to the close of such markets but prior to the time as of which each Fund calculates its NAV. The Funds may invest in securities that may be thinly traded. The Board has adopted procedures to adjust prices of thinly traded securities that are judged to be stale so that they reflect fair value. An investment valued on the basis of its fair value may be valued at a price higher or lower than available market quotations. An investment’s valuation
Notes to Financial Statements (continued)
may differ depending on the method used and the factors considered in determining value according to fair value procedures.
U.S. GAAP defines fair value as the price that a Fund would receive to sell an asset or pay to transfer a liability in an orderly transaction between market participants at the measurement date. U.S. GAAP also establishes a framework for measuring fair value, and a three level hierarchy for fair value measurements based upon the transparency of inputs to the valuation of an asset or liability. Inputs may be observable or unobservable and refer broadly to the assumptions that market participants would use in pricing the asset or liability. Observable inputs reflect the assumptions market participants would use in pricing the asset or liability based on market data obtained from sources independent of the Funds. Unobservable inputs reflect the Funds’ own assumptions about the assumptions that market participants would use in pricing the asset or liability developed based on the best information available in the circumstances. Each investment is assigned a level based upon the observability of the inputs which are significant to the overall valuation.
The three-tier hierarchy of inputs is summarized below:
Level 1 – inputs are quoted prices in active markets for identical investments (e.g., equity securities, open-end investment companies)
Level 2 – other observable inputs (including, but not limited to: quoted prices for similar assets or liabilities in markets that are active, quoted prices for identical or similar assets or liabilities in markets that are not active, inputs other than quoted prices that are observable for the assets or liabilities (such as interest rates, yield curves, volatilities, prepayment speeds, loss severities, credit risks and default rates) or other market corroborated inputs) (e.g., debt securities, government securities, foreign securities utilizing international fair value pricing, broker-quoted securities, fair valued securities with observable inputs)
Level 3 – inputs are significant unobservable inputs (including the Fund’s own assumptions used to determine the fair value of investments) (e.g., fair valued securities with observable inputs)
Changes in inputs or methodologies used for valuing investments may result in a transfer in or out of levels within the fair value hierarchy. The inputs or methodologies used for valuing investments are not necessarily an indication of the risk associated with investing in those investments.
b. Security Transactions
Security transactions are accounted for as of trade date. Realized gains and losses on securities sold are determined on the basis of identified cost.
c. Investment Income and Expenses
Dividend income is recorded on the ex-dividend date. Dividend income on foreign securities is recorded net of any withholding tax. Interest income, which includes amortization of premium and accretion of discount on debt securities, is accrued as earned. Non-cash dividends included in dividend income, if any, are reported at the fair market value of the securities received. Distributions received in excess of income from return of capital including real estate investment trusts (REITs) are recorded as a reduction of the cost of the related investment and/or as a realized gain. If the Fund no longer owns the applicable securities, any distributions received in excess of income are recorded as an adjustment to realized gain. Other income and expenses are recorded on an accrual basis. Expenses that cannot be directly attributed to a Fund are apportioned among the Funds in the Trust and in some cases other affiliated funds based upon their relative average net assets or number of shareholders. For Small Cap, TSCM Growth Equity and Micro-Cap Funds, investment income, realized and unrealized capital gains and losses, the common expenses of the Funds, and certain Fund level expense reductions, if any, are allocated on a pro rata basis to each class based on the relative net assets of each class to the total net assets of each Fund.
The following Funds had certain portfolio trades directed to various brokers, under a brokerage recapture program, which paid a portion of such Fund’s expenses. For the fiscal year ended October 31, 2012, the amount by which the Funds’ expenses were reduced and the impact on the expense ratios if any, were as follows: TSCM Growth Equity - $5,655 or 0.02%, Micro-Cap - $29,693 or 0.02% and Real Estate Securities - $4,573 or 0.01%.
The Funds have a “balance credit” arrangement with The Bank of New York Mellon (“BNYM”), the Funds’ custodian, whereby each Fund is credited with an interest factor equal to 0.75% below the effective 90-day T-Bill rate for account balances left uninvested overnight. If the T-Bill rate falls below 0.75%, no credits will be earned. These credits serve to reduce custody expenses that would otherwise be charged to each Fund. For the fiscal year ended October 31, 2012, the custodian expense was not reduced.
Overdrafts will cause a reduction of any balance credits, computed at 2% above the Federal Funds rate on the day of the overdraft. For the fiscal year ended October 31, 2012, the overdraft fees for Real Estate Securities equaled $28.
The Trust also has a balance credit arrangement with its Transfer Agent, BNY Mellon Investment Servicing (US) Inc., whereby earnings credits are used to offset banking charges and other out-of-pocket expenses. For the fiscal year ended October 31, 2012, the transfer agent expense for Small Cap, TSCM Growth Equity, Micro-Cap, Real Estate Securities and California Intermediate Tax-Free was reduced by $36, $9, $56, $28 and $11, respectively.
Total returns and net investment income for the Funds would have been lower had certain expenses not been offset. Total expenses before offsets exclude the impact of expense reimbursements or fee waivers and expense reductions such as brokerage recapture credits, but include non-reimbursable expenses, if any, such as interest and taxes.
Notes to Financial Statements (continued)
d. Dividends and Distributions
Dividends resulting from net investment income, if any, normally will be declared and paid as follows:
Annually – Small Cap, Micro-Cap, and TSCM Growth Equity
Quarterly – Real Estate Securities
Declared daily, paid monthly – California Intermediate Tax-Free
Distributions of capital gains, if any, will be made on an annual basis and when required for Federal excise tax purposes. Dividends and distributions to shareholders are
recorded on the ex-dividend date. Income and capital gain distributions are determined in accordance with Federal income tax regulations, which may differ from U.S. GAAP. These differences are primarily due to differing treatments for losses deferred due to wash sales, REITs, equalization accounting for tax purposes, and market discount transactions. Permanent book and tax basis differences, if any, relating to shareholder distributions will result in reclassifications to paid-in capital.
The tax character of distributions paid during the fiscal years ended October 31, 2012 and October 31, 2011 were as follows:
| | | | | | | | | | | | | | | | | | | | | | | | |
| | | Small Cap | | | TSCM Growth Equity | | | Micro-Cap | |
| | | 2012 | | | 2011 | | | 2012 | | | 2011 | | | 2012 | | | 2011 | |
Distributions paid from: | | | | | | | | | | | | | | | | | | | | | | | | |
Ordinary income | | | — | | | | — | | | | — | | | $ | 787 | | | | — | | | | — | |
Short-term capital gains | | | — | | | | — | | | | — | | | | — | | | | — | | | | — | |
Long-term capital gains | | | — | | | | — | | | | — | | | | — | | | $ | 10,525,163 | | | | — | |
Return of capital | | | — | | | | — | | | | — | | | | — | | | | — | | | | — | |
| | | | | | | | | | | | | | | | | | | | | | | | |
| | | — | | | | — | | | | — | | | $ | 787 | | | $ | 10,525,163 | | | | — | |
| | | | | | | | | | | | | | | | | | | | | | | | |
| | | | | | | | | | | | | | | | |
| | | Real Estate Securities | | | California
Intermediate Tax-Free | |
| | | 2012 | | | 2011 | | | 2012 | | | 2011 | |
Distributions paid from: | | | | | | | | | | | | | | | | |
Ordinary income | | $ | 855,892 | | | $ | 266,975 | | | $ | 971,750 | | | $ | 1,014,096 | |
Short-term capital gains | | | — | | | | — | | | | — | | | | — | |
Long-term capital gains | | | — | | | | — | | | | — | | | | — | |
Return of capital | | | — | | | | — | | | | — | | | | — | |
| | | | | | | | | | | | | | | | |
| | $ | 855,892 | | | $ | 266,975 | | | $ | 971,750 | | | $ | 1,014,096 | |
| | | | | | | | | | | | | | | | |
As of October 31, 2012, the components of distributable earnings (excluding unrealized appreciation/depreciation) on a tax basis consisted of:
| | | | | | | | | | | | | | | | | | | | |
| | | Small Cap | | | TSCM Growth Equity | | | Micro-Cap | | | Real Estate
Securities | | | California
Intermediate
Tax-Free | |
Capital loss carryforward | | $ | 264,942 | | | $ | 643,689 | | | | — | | | | — | | | $ | 278,294 | |
Undistributed ordinary income | | | — | | | | 19,225 | | | $ | 12,949 | | | $ | 188,625 | | | | 6,324 | |
Undistributed short-term capital gains | | | — | | | | — | | | | — | | | | 1,389,862 | | | | — | |
Undistributed long-term capital gains | | | — | | | | — | | | | 10,641,583 | | | | 2,531,206 | | | | — | |
Post-October loss deferral | | | 161,224 | | | | — | | | | — | | | | — | | | | — | |
55
Notes to Financial Statements (continued)
e. Federal Taxes
Each Fund intends to comply with the requirements under Subchapter M of the Internal Revenue Code of 1986, as amended, and to distribute substantially all of its taxable income and gains to its shareholders and to meet certain diversification and income requirements with respect to investment companies. Therefore, no provision for Federal income or excise tax is included in the accompanying financial statements.
Additionally, based on each Fund’s understanding of the tax rules and rates related to income, gains and transactions for the foreign jurisdictions in which it invests, each Fund will provide for foreign taxes, and where appropriate, deferred foreign taxes.
Management has analyzed the Funds’ tax positions taken on Federal income tax returns as of October 31, 2012 and all open tax years and has concluded that no provision for federal income tax is required in the Funds’ financial statements. Additionally, the Funds are not aware of any tax position for which it is reasonably possible that the total amounts of unrecognized tax benefits will change materially in the next twelve months.
Under the Regulated Investment Company Modernization Act of 2010 (the “Act”), post-enactment capital losses may be carried forward for an unlimited time period. However, any new losses incurred will be required to be utilized prior to any loss carryovers incurred in pre-enactment taxable years, which generally expire eight years following the close of the taxable year in which they were incurred. As a result of this ordering rule, pre-enactment capital loss carryovers may be more likely to expire unused. Additionally, post-enactment capital losses that are carried forward retain their tax character as either short-term or long-term capital losses rather than being considered all short-term as under previous law.
f. Capital Loss Carryovers and Deferrals
As of October 31, 2012, the following Funds had accumulated net realized capital loss carryovers from securities transactions for Federal income tax purposes as shown in the following chart. The amounts may be used to offset future realized capital gains, if any, through the expiration dates listed or in the case of post-enactment losses, for an unlimited time period.
| | | | | | | | | | | | |
| | | Capital Loss Carryover Amounts | | | Expires
October 31, | |
Fund | | Short-Term | | | Long-Term | | |
Small Cap | | | | | | | | | | | | |
(Pre-Enactment) | | $ | 264,942 | | | | — | | | | 2019 | |
| | | | | | | | | | | | |
TSCM Growth Equity | | | | | | | | | | | | |
(Pre-Enactment) | | | 643,689 | | | | — | | | | 2019 | |
| | | | | | | | | | | | |
California Intermediate Tax-Free | | | | | | | | | | | | |
(Pre-Enactment) | | $ | 278,294 | | | | — | | | | 2016 | |
| | | | | | | | | | | | |
For the fiscal year ended October 31, 2012, the following Funds utilized capital loss carryovers in the amount of:
| | | | | | | | |
| | | Capital Loss Carryovers Utilized | |
| | | Short-Term | | | Long-Term | |
Small Cap | | $ | 233,887 | | | | — | |
TSCM Growth Equity | | | 181,191 | | | | — | |
Real Estate Securities | | | 336,459 | | | | — | |
California Intermediate
Tax-Free | | | 61,220 | | | | — | |
56
Notes to Financial Statements (continued)
g. Capital Stock
The Trust’s Declaration of Trust authorizes for each series the issuance of an unlimited number of shares of beneficial interest, without par value. Each Fund records sales and repurchases of its capital stock on the trade date. The cost of securities contributed to the Funds in connection with the issuance of shares is based on the valuation of those securities in accordance with the Funds’ policy on investment valuation.
For the fiscal years ended October 31, 2012 and October 31, 2011, the capital stock transactions by class for the Small Cap, TSCM Growth Equity and Micro-Cap were:
| | | | | | | | | | | | | | | | | | | | | | | | | | | | | | | | |
| | | Small Cap | | | TSCM Growth Equity | |
| | | 2012 | | | 2011 | | | 2012 | | | 2011 | |
| | | Shares | | | Amount | | | Shares | | | Amount | | | Shares | | | Amount | | | Shares | | | Amount | |
Investor Class Shares | | | | | | | | | | | | | | | | | | | | | | | | | | | | | | | | |
Proceeds from sale of shares | | | 52 | | | $ | 1,000 | | | | 28,393 | | | $ | 522,154 | | | | 66,027 | | | $ | 796,782 | | | | 225,474 | | | $ | 2,417,579 | |
Reinvestment of dividends and distributions | | | — | | | | — | | | | — | | | | — | | | | — | | | | — | | | | 2 | | | | 21 | |
Cost of shares repurchased | | | (6,303 | ) | | | (115,848 | ) | | | (21,255 | ) | | | (410,167 | ) | | | (6,791 | ) | | | (85,317 | ) | | | (3,001 | ) | | | (40,921 | ) |
| | | | | | | | | | | | | | | | | | | | | | | | | | | | | | | | |
Net increase (decrease) | | | (6,251 | ) | | $ | (114,848 | ) | | | 7,138 | | | $ | 111,987 | | | | 59,236 | | | $ | 711,465 | | | | 222,475 | | | $ | 2,376,679 | |
| | | | | | | | | | | | | | | | | | | | | | | | | | | | | | | | |
Service Class Shares | | | | | | | | | | | | | | | | | | | | | | | | | | | | | | | | |
Proceeds from sale of shares | | | 45,568 | | | $ | 876,060 | | | | 243,274 | | | $ | 4,730,889 | | | | 240,701 | | | $ | 2,940,331 | | | | 2,296,630 | | | $ | 27,315,713 | |
Reinvestment of dividends and distributions | | | — | | | | — | | | | — | | | | — | | | | — | | | | — | | | | — | | | | — | |
Cost of shares repurchased | | | (389,323 | ) | | | (7,195,772 | ) | | | (324,358 | ) | | | (5,860,165 | ) | | | (377,040 | ) | | | (4,564,994 | ) | | | (647,716 | ) | | | (7,852,985 | ) |
| | | | | | | | | | | | | | | | | | | | | | | | | | | | | | | | |
Net increase (decrease) | | | (343,755 | ) | | $ | (6,319,712 | ) | | | (81,084 | ) | | $ | (1,129,276 | ) | | | (136,339 | ) | | $ | (1,624,663 | ) | | | 1,648,914 | | | $ | 19,462,728 | |
| | | | | | | | | | | | | | | | | | | | | | | | | | | | | | | | |
Institutional Class Shares | | | | | | | | | | | | | | | | | | | | | | | | | | | | | | | | |
Proceeds from sale of shares | | | 145,614 | | | $ | 2,684,462 | | | | 3,685,316 | | | $ | 75,887,755 | | | | 57,631 | | | $ | 720,319 | | | | 139,333 | | | $ | 1,641,074 | |
Reinvestment of dividends and distributions | | | — | | | | — | | | | — | | | | — | | | | — | | | | — | | | | 66 | | | | 766 | |
Cost of shares repurchased | | | (553,664 | ) | | | (10,289,613 | ) | | | (105,027 | ) | | | (1,978,630 | ) | | | (59,612 | ) | | | (731,281 | ) | | | (57,419 | ) | | | (634,754 | ) |
| | | | | | | | | | | | | | | | | | | | | | | | | | | | | | | | |
Net increase (decrease) | | | (408,050 | ) | | $ | (7,605,151 | ) | | | 3,580,289 | | | $ | 73,909,125 | | | | (1,981 | ) | | $ | (10,962 | ) | | | 81,980 | | | $ | 1,007,086 | |
| | | | | | | | | | | | | | | | | | | | | | | | | | | | | | | | |
57
Notes to Financial Statements (continued)
| | | | | | | | | | | | | | | | |
| | | Micro-Cap | |
| | | 2012 | | | 2011 | |
| | | Shares | | | Amount | | | Shares | | | Amount | |
Service Class Shares | | | | | | | | | | | | | | | | |
Proceeds from sale of shares | | | 65,755 | | | $ | 2,901,959 | † | | | 115,169 | | | $ | 4,285,088 | |
Reinvestment of dividends and distributions | | | 238,842 | | | | 8,075,238 | | | | — | | | | — | |
Cost of shares repurchased | | | (489,724 | ) | | | (17,676,338 | ) | | | (1,014,335 | ) | | | (36,248,361 | ) |
| | | | | | | | | | | | | | | | |
Net decrease | | | (185,127 | ) | | $ | (6,699,141 | ) | | | (899,166 | ) | | $ | (31,963,273 | ) |
| | | | | | | | | | | | | | | | |
Institutional Class Shares* | | | | | | | | | | | | | | | | |
Proceeds from sale of shares | | | 69,753 | | | $ | 2,644,029 | † | | | 279,136 | | | $ | 8,729,132 | |
Reinvestment of dividends and distributions | | | 67,898 | | | | 2,296,309 | | | | — | | | | — | |
Shares issued in connection with merger | | | — | | | | — | | | | 609,346 | | | | 18,902,143 | |
Cost of shares repurchased | | | (221,147 | ) | | | (8,023,064 | ) | | | (7,790 | ) | | | (275,834 | ) |
| | | | | | | | | | | | | | | | |
Net increase (decrease) | | | (83,496 | ) | | $ | (3,082,726 | ) | | | 880,692 | | | $ | 27,355,441 | |
| | | | | | | | | | | | | | | | |
| | * | Commenced operations on October 1, 2011. |
| | † | Includes fair fund settlements of $503,960 and $143,752 for Service Class and Institutional Class, respectively. |
At October 31, 2012, certain unaffiliated shareholders of record, specifically omnibus accounts, individually or collectively held greater than 10% of the outstanding shares of the following Funds: Small Cap - three collectively own 70%; TSCM Growth Equity - two collectively own 89%; Micro-Cap-two collectively own 41%; Real Estate Securities - three collectively own 61%; California Intermediate Tax-Free-two collectively own 57%. Transactions by these shareholders may have a material impact on the respective Funds.
2. Agreements and Transactions with Affiliates
For each of the Funds, the Trust has entered into an Investment Management Agreement under which the Investment Manager, a subsidiary of Affiliated Managers Group, Inc. (“AMG”), serves as investment manager to the Funds and is responsible for the Funds’ overall administration and operations. The Investment Manager selects subadvisors for the Funds (subject to Board approval) and monitors the subadvisor’s investment performance, security holdings and investment strategies. Each Fund’s investment portfolio is managed by one or more portfolio managers who serve pursuant to a subadvisory agreement with the Investment Manager.
The Small Cap investment portfolio is managed by Frontier Capital Management Co., LLC (“Frontier”). AMG indirectly owns a majority interest in Frontier. The TSCM Growth Equity investment portfolio is managed by TimesSquare Capital Management, LLC
(“TimesSquare”). AMG indirectly owns a majority interest in TimesSquare.
Investment management fees are paid directly by the Funds to the Investment Manager based on average daily net assets. For the fiscal year ended October 31, 2012, the annual investment management fee rates, as a percentage of average daily net assets, were as follows:
| | | | |
| | | Investment
Management Fees | |
Small Cap | | | 1.00 | % |
TSCM Growth Equity | | | 0.75 | % |
Micro-Cap | | | 1.00 | % |
Real Estate Securities | | | 0.60 | % |
California Intermediate Tax-Free | | | | |
on first $25 million | | | 0.40 | % |
on next $25 million | | | 0.35 | % |
on next $50 million | | | 0.30 | % |
on next $50 million | | | 0.25 | % |
on balance over $150 million | | | 0.20 | % |
58
Notes to Financial Statements (continued)
The Investment Manager has contractually agreed, through at least March 1, 2013, to waive fees and pay or reimburse Fund expenses in order to limit total annual Fund operating expenses after fee waiver and expense reimbursements (exclusive of taxes, interest (including interest incurred in connection with bank and custody overdrafts), shareholder servicing fees, distribution and service (12b-1) fees, brokerage commissions, and other transaction costs, acquired fund fees and expenses and extraordinary expenses) of Small Cap, TSCM Growth Equity, Micro-Cap, and California Intermediate Tax-Free to 1.05%, 0.79%, 1.18%, and 0.55%, respectively, of each Fund’s average daily net assets.
Effective July 1, 2012, Managers Investment Group LLC has contractually agreed until at least March 1, 2014, to limit the Real Estate Securities Fund’s total annual operating expenses (exclusive of taxes, interest (including interest incurred in connection with bank and custody overdrafts), brokerage commissions and other transaction costs, acquired fund fees and expenses, and extraordinary expenses) to 1.24% of average daily net assets. Immediately prior to July 1, 2012, the Fund had a contractual expense limitation of 1.29%.
Each Fund is obligated to repay the Investment Manager such amounts waived, paid or reimbursed in future years provided that the repayment occurs within thirty-six (36) months after the waiver or reimbursement and that such repayment would not cause the Fund’s total operating expenses in any such future year to exceed each Fund’s expense cap. For the fiscal year ended October 31, 2012, each Fund’s components of reimbursement are detailed in the following chart:
| | | | | | | | | | | | |
| | | Small Cap | | | TSCM Growth
Equity | | | Micro-Cap | |
Reimbursement Available - 10/31/11 | | $ | 209,188 | | | $ | 195,964 | | | $ | 824,179 | |
Additional Reimbursements | | | 89,364 | | | | 147,988 | | | | 358,192 | |
Repayments | | | — | | | | — | | | | — | |
Expired Reimbursements | | | — | | | | — | | | | (231,266 | ) |
| | | | | | | | | | | | |
Reimbursement Available - 10/31/12 | | $ | 298,552 | | | $ | 343,952 | | | $ | 951,105 | |
| | | | | | | | | | | | |
| | | | | | | | |
| | | Real Estate
Securities | | | California
Intermediate
Tax-Free | |
Reimbursement Available - 10/31/11 | | $ | 180,755 | | | $ | 320,661 | |
Additional Reimbursements | | | 10,100 | | | | 96,633 | |
Repayments | | | (25,148 | ) | | | — | |
Expired Reimbursements | | | (73,545 | ) | | | (95,893 | ) |
| | | | | | | | |
Reimbursement Available - 10/31/12 | | $ | 92,162 | | | $ | 321,401 | |
| | | | | | | | |
Small Cap is obligated by its investment management contract to pay an annual management fee to the Investment Manager. The Investment Manager, in turn, pays all or a portion of this fee to Frontier. Under its Investment Manager Agreement with the Fund, the Investment Manager provides a variety of administrative services to the Fund. The Investment Manager receives
compensation from Frontier for its administrative services to the Fund pursuant to a separate agreement between the Investment Manager and Frontier. For each of the Funds other than Small Cap, the Trust has entered into an Administration and Shareholder Servicing Agreement under which the Investment Manager serves as the Fund’s administrator (the “Administrator”) and is responsible for all aspects of managing the Funds’ operations, including administration and shareholder services to each Fund, its shareholders, and certain institutions, such as bank trust departments, brokerdealers and registered investment advisers, that advise or act as an intermediary with the Funds’ shareholders. The Funds pays a fee to the Administrator at the rate of 0.25% per annum of each Fund’s average daily net assets for this service.
The aggregate annual retainer paid to each Independent Trustee of the Board is $80,000, plus $5,000 or $2,500 for each regular or special meeting attended, respectively. The Independent Chairman of the Trust receives an additional payment of $20,000 per year. The Chairman of the Audit Committee receives an additional payment of $8,000 per year. The Trustees’ fees and expenses are allocated among all of the funds for which the Investment Manager serves as the advisor (the “Managers Funds”) based on the relative net assets of such funds. The “Trustees fees and expenses” shown in the financial statements represents the Funds’ allocated portion of the total fees and expenses paid by the Managers Funds.
The Funds are distributed by Managers Distributors, Inc. (the “Distributor” or “MDI”), a wholly-owned subsidiary of the Investment Manager. MDI serves as the distributor and underwriter for each Fund and is a registered broker-dealer and member of the Financial Industry Regulatory Authority, Inc. (“FINRA”). Shares of each Fund will be continuously offered and will be sold directly to prospective purchasers through brokers, dealers or other financial intermediaries who have executed selling agreements with MDI. Subject to the compensation arrangement discussed below, generally MDI bears all or a portion of the expenses of providing services pursuant to the distribution agreement, including the payment of the expenses relating to the distribution of prospectuses for sales purposes and any advertising or sales literature. Certain Trustees and Officers of the Funds are Officers and/or Directors of the Investment Manager, AMG and/or the Distributor.
Small Cap and TSCM Growth Equity have adopted a distribution and service plan (the “Plan”) with respect to the Investor Class shares in accordance with the requirements of Rule 12b-1 under the 1940 Act and the requirements of the applicable rules of the FINRA regarding asset based sales charges. Pursuant to the Plan, each Fund may compensate the Distributor for its expenditures in financing any activity primarily intended to result in the sale of such class of the Fund’s shares and for maintenance and personal service provided to existing shareholders of that class. The Plan authorizes payments to the Distributor up to 0.25% annually of each Fund’s average daily net assets attributable to the Investor Class shares.
The Plan further provides for periodic payments by the Trust or MDI to brokers, dealers and other financial intermediaries for providing shareholder services and for promotional and other sales related costs. The portion of payments by the Investor Class and Service Class shares of a Fund for shareholder servicing may not exceed an annual rate of 0.25% of the average daily net asset value of the Fund’s shares of that class owned by its clients of such broker, dealer or financial intermediary.
Notes to Financial Statements (continued)
The Securities and Exchange Commission granted an exemptive order that permits the Funds to lend and borrow money for certain temporary purposes directly to and from other eligible Managers Funds. Participation in this interfund lending program is voluntary for both borrowing and lending funds, and an interfund loan is only made if it benefits each participating fund. The Investment Manager administers the program according to procedures approved by the Board, and the Board monitors the operation of the program. An interfund loan must comply with certain conditions set out in the exemptive order, which are designed to assure fairness and protect all participating funds. For the fiscal year ended October 31, 2012, the Small Cap Fund borrowed $2,271,746 for 3 days paying interest of $209. The interest paid is included in the Statement of Operations as miscellaneous expense. For the same period, Small Cap lent $1,076,447 for 1 day earning interest of $34, Micro-Cap Fund lent varying amounts not exceeding $1,846,890 for 5 days earning interest of $245 and Real Estate Securities Fund lent varying amounts not exceeding $1,680,287 for 7 days earning interest of $185. The interest earned is included in the Statement of Operations as interest income. For the fiscal year ended October 31, 2012, the Funds had no loans outstanding.
During the year ended October 31, 2012, the Micro-Cap Fund executed the following transaction at the closing price of the security and with no commissions under Rule 17a-7 procedures approved by the Board of Trustees:
March 29, 2012 - sold 2,100 shares of Dynamic Material Corp. at $20.915 to Lord Abbett Micro Cap Growth Fund.
3. Purchases and Sales of Securities
Purchases and sales of securities (excluding short-term securities and U.S. Government obligations) for the fiscal year ended October 31, 2012, were as follows:
| | | | | | | | |
| | | Long-Term Securities | |
Fund | | Purchases | | | Sales | |
Small Cap | | $ | 33,659,793 | | | $ | 46,033,357 | |
TSCM Growth Equity | | | 20,778,107 | | | | 21,218,703 | |
Micro-Cap | | | 90,161,721 | | | | 110,981,310 | |
Real Estate Securities | | | 141,675,845 | | | | 36,423,307 | |
California Intermediate Tax-Free | | | 1,271,667 | | | | 1,508,922 | |
The Funds had no purchases or sales of U.S. Government obligations during the fiscal year ended October 31, 2012.
4. Portfolio Securities Loaned
The Funds, other than Real Estate Securities participate in a securities lending program offered by BNYM (the “Program”), providing for the lending of securities to qualified brokers. Securities lending income includes earnings of such temporary cash investments, plus or minus any rebate to a borrower. These earnings (after any rebate) are then divided between BNYM, as a fee for its services under the program, and the Fund, according to agreed-upon rates. Collateral on all securities loaned is accepted in cash and/or government securities and is maintained at a minimum level of 102% (105% in the case of certain foreign securities) of the market value, plus interest, if applicable, of investments on loan. It is the Funds’ policy to obtain additional collateral from or return excess collateral to the borrower by the end of the next business day,
following the valuation date of the securities loaned. Therefore, the value of the collateral held may be temporarily less than the value of the securities on loan. Lending securities entails a risk of loss to the Funds if and to the extent that the market value of the securities loaned were to increase and the borrower did not increase the collateral accordingly, and the borrower fails to return the securities. Under the terms of the Program, the Fund is indemnified for such losses by BNYM. The Funds bear the risk of any deficiency in the amount of the collateral available for return to the borrower due to any loss on the collateral invested. Collateral received in the form of cash is invested temporarily in the BNY Mellon Overnight Government Fund, formerly the BNY Institutional Cash Reserves Fund (the “ICRF”), or other short-term investments as defined in the Securities Lending Agreement with BNYM. For the fiscal year ended October 31, 2012, Small Cap and Micro-Cap participated in the program.
5. Commitments and Contingencies
In the normal course of business, the Funds may enter into contracts and agreements that contain a variety of representations and warranties, which provide general indemnifications. The maximum exposure to the Funds under these arrangements is unknown, as this would involve future claims that may be made against a Fund that have not yet occurred. However, based on experience, the Funds have had no prior claims or losses and expect the risks of material loss to be remote.
6. New Accounting Pronouncements
In December 2011, the Financial Account Standards Board (“FASB”) issued Accounting Standards Update (“ASU”) No. 2011- 11 “Disclosures about Offsetting Assets and Liabilities.” ASU 2011-11 requires disclosures to make financial statements that are prepared under U.S. GAAP more comparable to those prepared under International Financial Reporting Standards (“IFRS”). The new disclosure requirements mandate that entities disclose both gross and net information about instruments and transactions eligible for offset in the Statements of Assets and Liabilities as well as instruments and transactions subject to an agreement similar to a master netting arrangement. In addition, ASU 2011-11 requires disclosure of collateral received and posted in connection with master netting agreements or similar arrangements. New disclosures are required for annual reporting periods beginning on or after January 1, 2013, and interim periods within those annual periods. Management is evaluating the impact of ASU 2011-11 on the Funds’ financial statements and disclosures.
7. Subsequent Events
The Funds have determined that no material events or transactions occurred through the issuance date of the Funds’ financial statements which require additional disclosure in or adjustment of the Funds’ financial statements.
Notes to Financial Statements (continued)
Tax Information (unaudited)
Each Fund hereby designates the maximum amount allowable of its net taxable income as qualified dividends as provided in the Jobs and Growth Tax Relief Reconciliation Act of 2003.
In accordance with federal tax law, each of the following Funds hereby make the following designations regarding its year ended October 31,2012:
California Intermediate Tax-Free
| | • | | All dividends paid from net investment income are “exempt-interest dividends” (not generally subject to regular federal income tax), except $21 that is being designated as an ordinary income distribution for reporting purposes. |
Pursuant to section 852 of the Internal Revenue Code, Managers Frontier Small Cap Growth Fund, Managers AMG TSCM Growth Equity Fund, Managers Micro-Cap Fund, Managers Real Estate Securities Fund and Managers California Intermediate Tax-Free Fund hereby designate as a capital gain distribution with respect to the taxable year ended October 31, 2012 $0, $0, $10,525,163, $2,531,206 and $0 respectively, or, if subsequently determined to be different, the net capital gains of such year.
The 2011/2012 Form 1099-DIV you receive for each Fund will show the tax status of all distributions paid to you during the respective calendar year.
61
Report of Independent Registered Public Accounting Firm
To the Board of Trustees of Managers Trust I and the Shareholders of Managers Frontier Small Cap Growth Fund, Managers AMG TSCM Growth Equity Fund, Managers Micro-Cap Fund, Managers Real Estate Securities Fund and Managers California Intermediate Tax-Free Fund:
In our opinion, the accompanying statements of assets and liabilities, including the schedules of portfolio investments, and the related statements of operations and of changes in net assets and the financial highlights present fairly, in all material respects, the financial position of Managers Frontier Small Cap Growth Fund, Managers AMG TSCM Growth Equity Fund, Managers Micro-Cap Fund, Managers Real Estate Securities Fund and Managers California Intermediate Tax-Free Fund (the “Funds”) at October 31, 2012, and the results of each of their operations, the changes in each of their net assets and the financial highlights for each of the periods indicated, in conformity with accounting principles generally accepted in the United States of America. These financial statements and financial highlights (hereafter referred to as “financial statements”) are the responsibility of the Funds’ management. Our responsibility is to express an opinion on these financial statements based on our audits. We conducted our audits of these financial statements in accordance with the standards of the Public Company Accounting Oversight Board (United States). Those standards require that we plan and perform the audit to obtain reasonable assurance about whether the financial statements are free of material misstatement. An audit includes examining, on a test basis, evidence supporting the amounts and disclosures in the financial statements, assessing the accounting principles used and significant estimates made by management, and evaluating the overall financial statement presentation. We believe that our audits, which included confirmation of securities at October 31, 2012 by correspondence with the custodian, brokers and the application of alternative auditing procedures where securities purchased had not been received, provide a reasonable basis for our opinion.
PricewaterhouseCoopers LLP
Boston, Massachusetts
December 27, 2012
62
Trustees and Officers
The Trustees and Officers of the Trust, their business addresses, principal occupations for the past five years and dates of birth are listed below. The Trustees provide broad supervision over the affairs of the Trust and the Funds. The Trustees are experienced executives who meet periodically throughout the year to oversee the Funds’ activities, review contractual arrangements with companies that provide services to the Funds, and review the Funds’ performance. Unless otherwise noted, the address of each Trustee or Officer is the address of the Trust: 800 Connecticut Avenue, Norwalk, Connecticut 06854.
There is no stated term of office for Trustees. Trustees serve until their resignation, retirement or removal in accordance with the Trust’s organizational documents and policies adopted by the Board from time to time. The Chairman of the Trustees, President, Treasurer and Secretary of the Trust are elected by the Trustees annually. Other officers hold office at the pleasure of the Trustees.
Independent Trustees
The following Trustees are not “interested persons” of the Trust within the meaning of the 1940 Act:
| | |
Name, Date of Birth, Number
of Funds Overseen in Fund
Complex* | | Principal Occupation(s) During Past 5
Years and Other Directorships Held
by Trustee |
Jack W. Aber, 9/9/37 • Trustee since 2000 • Oversees 38 Funds in Fund Complex | | Professor of Finance, Boston University School of Management (1972-Present); Trustee of Appleton Growth Fund (1 portfolio); Trustee of Third Avenue Trust
(5 portfolios); Trustee of Third Avenue Variable Trust
(1 portfolio); Trustee of Aston Funds (26 portfolios). |
Bruce B. Bingham, 12/01/48 • Trustee since 2012 • Oversees 38 Funds in Fund Complex | | Partner, Hamilton Partners (real estate development firm)(1987-Present). |
William E. Chapman, II, 9/23/41 • Independent Chairman • Trustee since 2000 • Oversees 38 Funds in Fund Complex | | President and Owner, Longboat Retirement Planning Solutions (1998-Present); Hewitt Associates, LLC (part time) (provider of Retirement and Investment Education Seminars) (2002-2009); Trustee of Bowdoin College (2002-Present); Director of Harding, Loevner Funds, Inc. (6 portfolios); Trustee of Third Avenue Trust (5 portfolios); Trustee of Third Avenue Variable Trust (1 portfolio); Trustee of Aston Funds (26 portfolios). |
Edward J. Kaier, 9/23/45 • Trustee since 2000 • Oversees 38 Funds in Fund Complex | | Attorney at Law and Partner, Teeters Harvey Gilboy & Kaier LLP (2007-Present); Attorney at Law and Partner, Hepburn Willcox Hamilton & Putnam, LLP (1977-2007); Trustee of Third Avenue Trust (5 portfolios); Trustee of Third Avenue Variable Trust (1 portfolio); Trustee of Aston Funds (26 portfolios). |
Steven J. Paggioli, 4/3/50 • Trustee since 2000 • Oversees 38 Funds in Fund Complex | | Independent Consultant (2002-Present); Formerly Executive Vice President and Director, The Wadsworth Group (1986-2001); Executive Vice President, Secretary and Director, Investment Company Administration, LLC (1990-2001); Vice President, Secretary and Director, First Fund Distributors, Inc. (1991-2001); Trustee, Professionally Managed Portfolios (43 portfolios); Advisory Board Member, Sustainable Growth Advisors, LP; Independent Director, Chase Investment Counsel (2008 – Present); Trustee of Aston Funds (26 portfolios). |
Eric Rakowski, 6/5/58 • Trustee since 2000 • Oversees 38 Funds in Fund Complex | | Professor, University of California at Berkeley School of Law (1990-Present); Director of Harding, Loevner Funds, Inc. (6 portfolios); Trustee of Third Avenue Trust (5 portfolios); Trustee of Third Avenue Variable Trust (1 portfolio); Trustee of Aston Funds (26 portfolios). |
Thomas R. Schneeweis, 5/10/47 • Trustee since 2000 • Oversees 38 Funds in Fund Complex | | Professor of Finance, University of Massachusetts (1977-Present); Director, CISDM at the University of Massachusetts, (1996-Present); President, Alternative Investment Analytics, LLC, (formerly Schneeweis Partners, LLC) (2001-Present); Partner, S Capital Management, LLC (2007-Present); President, TRS Associates (1982-Present); Partner, White Bear Partners, LLC (2007-2010); Partner, Northampton Capital Management, LLC (2004-2010); Trustee of Aston Funds (26 portfolios). |
| | |
* The Fund Complex consists of Managers AMG Funds, The Managers Funds, Managers Trust I and Managers Trust II. |
Interested Trustees
Each Trustee in the following table is an “interested person” of the Trust within the meaning of the 1940 Act. Ms. Carsman is an interested person of the Trust within the meaning of the 1940 Act by virtue of her position with, and interest in securities of, AMG, and her former position as Chief Legal Officer of the Trust.
| | |
Name, Date of Birth, Number
of Funds Overseen in Fund
Complex* | | Principal Occupation(s) During Past
5 Years and Other Directorships Held
by Trustee |
Christine C. Carsman, 4/2/52 • Trustee since 2011 • Oversees 38 Funds in Fund Complex | | Deputy General Counsel, Affiliated Managers Group, Inc. (2011-Present); Senior Vice President and Chief Regulatory Counsel, Affiliated Managers Group, Inc. (2004-Present); Secretary and Chief Legal Officer, Managers AMG Funds, The Managers Funds, Managers Trust I and Managers Trust II (2004-2011); Senior Counsel, Vice President and Director of Operational Risk Management and Compliance, Wellington Management Company, LLP (1995-2004). |
Officers
| | |
Name, Date of Birth,
Position(s) Held with Fund
and Length of Time Served | | Principal Occupation(s) During Past
5 Years |
Keitha L. Kinne, 5/16/58 • President since 2012 • Chief Operating Officer since 2007 | | Managing Partner and Chief Operating Officer, Managers Investment Group LLC (2007-Present); Chief Operating Officer, The Managers Funds, Managers AMG Funds and Managers Trust II (2007-Present); Chief Investment Officer, Managers Investment Group LLC (2008-Present); President, Managers Distributors, Inc. (2012-Present); Managing Director, Legg Mason & Co., LLC (2006-2007); Managing Director, Citigroup Asset Management (2004-2006). |
Lewis Collins, 2/22/66 • Secretary since 2011 • Chief Legal Officer since 2011 | | Senior Vice President and Senior Counsel, Affiliated Managers Group, Inc. (2010-Present); Vice President and Senior Counsel, Affiliated Managers Group, Inc. (2006-2010); Senior Counsel, Affiliated Managers Group, Inc. (2002-2006); Attorney, Ropes & Gray LLP (1998-2002). |
Donald S. Rumery, 5/29/58 • Chief Financial Officer since 2007 • Treasurer since 2000 | | Senior Vice President, Managers Investment Group LLC (2005-Present); Treasurer and Chief Financial Officer, Managers Distributors, Inc. (2000-Present); Treasurer, The Managers Funds (1995-Present); Treasurer, Managers AMG Funds (1999-Present); Treasurer, Managers Trust II (2000-Present); Chief Financial Officer, The Managers Funds, Managers AMG Funds and Managers Trust II (2007-Present); Vice President, The Managers Funds LLC, (1994-2004). |
John J. Ferencz, 3/09/62 • Chief Compliance Officer since 2010 | | Vice President, Legal and Compliance, Managers Investment Group LLC (2010-Present); Senior Compliance Analyst, Mutual Funds and Regulatory, GE Asset Management Incorporated (2005-2010). |
Michael S. Ponder, 9/12/73 • Assistant Secretary since 2011 | | Senior Vice President and Counsel, Managers Investment Group LLC (2011-Present); Attorney, DeNovo Legal (2009-2010); Vice President, Credit Suisse (2007-2009); Associate, Willkie Farr & Gallagher LLP (2006-2007). |
63
Annual Renewal of Investment Advisory and Subadvisory Agreements
On June 21-22, 2012, the Board of Trustees, including a majority of the Trustees who are not “interested persons” of the Trust (the “Independent Trustees”), approved the Investment Management Agreement with the Investment Manager for each of the Funds identified below and the Subadvisory Agreement for each of the Subadvisors. The Independent Trustees were separately represented by independent counsel in connection with their consideration of the approval of these agreements. In considering the Investment Management and Subadvisory Agreements, the Trustees reviewed a variety of materials relating to each Fund, the Investment Manager and each Subadvisor, including comparative performance, fee and expense information for an appropriate peer group of similar mutual funds (each a “Peer Group”), performance information for relevant benchmark indices (each a “Fund Benchmark”) and, with respect to each Subadvisor, comparative performance information for an appropriate peer group of managed accounts, and, as to all other matters, other information provided to them on a periodic basis throughout the year, as well as information provided in connection with the meetings of June 21-22, 2012, regarding the nature, extent and quality of services provided by the Investment Manager and the Subadvisors under their respective agreements. Prior to voting, the Independent Trustees: (a) reviewed the foregoing information with their independent legal counsel and with management; (b) received materials from their independent legal counsel discussing the legal standards applicable to their consideration of the Investment Management Agreement and the Subadvisory Agreements; and (c) met with their independent legal counsel in private sessions at which no representatives of management were present.
Nature, extent and quality of services.
In considering the nature, extent and quality of the services provided by the Investment Manager, the Trustees reviewed information relating to the Investment Manager’s operations and personnel. Among other things, the Investment Manager provided financial information, biographical information on its supervisory and professional staff and descriptions of its organizational and management structure. The Trustees also took into account information provided periodically throughout the previous year by the Investment Manager relating to the performance of its duties with respect to the Funds and the Trustees’ familiarity with the Investment Manager’s management through Board meetings, discussions and reports. In the course of their deliberations regarding the Investment Management Agreement, the Trustees evaluated, among other things: (a) the extent and quality of the Investment Manager’s oversight of the operation and management of the Funds; (b) the quality of the search, selection and monitoring services performed by the Investment Manager in overseeing the portfolio management responsibilities of the Subadvisors; (c) the Investment Manager’s ability to supervise the Funds’ other service providers; and (d) the Investment Manager’s compliance program. The Trustees also took into account the financial condition of the Investment Manager with respect to its ability to provide the services required under the Investment Management Agreement
and to maintain contractual expense limitations for the Funds. The Trustees also considered the Investment Manager’s risk management processes.
For each Fund, the Trustees also reviewed information relating to each Subadvisor’s operations and personnel and the investment philosophy, strategies and techniques (for each Subadvisor, its “Investment Strategy”) used in managing the Fund or the portion of the Fund for which the Subadvisor has portfolio management responsibility. Among other things, the Trustees reviewed biographical information on portfolio management and other professional staff, information regarding each Subadvisor’s organizational and management structure and each Subadvisor’s brokerage policies and practices. The Trustees considered specific information provided regarding the experience of the individual or individuals at each Subadvisor with portfolio management responsibility for a Fund or the portion of a Fund managed by the Subadvisor, including the information set forth in the Fund’s prospectus and statement of additional information. With respect to Managers Micro-Cap Fund, which is managed with multiple Subadvisors, the Trustees also noted information provided by the Investment Manager regarding the manner in which each Subadvisor’s Investment Strategy complements those utilized by the Fund’s other Subadvisors. In the course of their deliberations, the Trustees evaluated, among other things: (a) the services rendered by each Subadvisor in the past; (b) the qualifications and experience of the Subadvisor’s personnel; and (c) the Subadvisor’s compliance program. The Trustees also took into account the financial condition of each Subadvisor with respect to its ability to provide the services required under its Subadvisory Agreement. The Trustees also considered each Subadvisor’s risk management processes.
Performance.
As noted above, the Board considered each Fund’s net performance during relevant time periods as compared to each Fund’s Peer Group and Fund Benchmark and considered each Subadvisor’s performance as compared to an appropriate peer group of managed accounts and also considered the gross performance of the Fund or the portion of the Fund managed by each Subadvisor as compared to the Subadvisor’s relevant performance composite that utilizes the same investment strategy and approach and noted that the Board reviews on a quarterly basis detailed information about each Fund’s performance results, portfolio composition and Investment Strategies, including with respect to Managers Micro-Cap Fund, the portion of the Fund managed by each Subadvisor. The Board noted the Investment Manager’s expertise and resources in monitoring the performance, investment style and risk-adjusted performance of each Subadvisor. The Board also noted each Subadvisor’s performance record with respect to the Funds. The Board was mindful of the Investment Manager’s attention to monitoring each Subadvisor’s performance with respect to the Funds and its discussions with management regarding the factors that contributed to the performance of the Funds.
Annual Renewal of Investment Advisory and Subadvisory Agreements (continued)
Advisory Fees and Profitability.
In considering the reasonableness of the advisory fee charged by the Investment Manager for managing each Fund, the Trustees noted that the Investment Manager, and not the Fund, is responsible for paying the fees charged by the Fund’s Subadvisor(s) and, therefore, that the fees paid to the Investment Manager cover the cost of providing portfolio management services as well as the cost of providing search, selection and monitoring services in operating a “manager-of-managers” complex of mutual funds. The Trustees concluded that, in light of the additional high quality supervisory services provided by the Investment Manager and the fact that the subadvisory fees are paid out of the advisory fee, the advisory fee payable by each Fund to the Investment Manager can reasonably be expected to exceed the median advisory fee for the Peer Group, which consists of many funds that do not operate with a manager-of-managers structure. In this regard, the Trustees also noted that the Investment Manager has undertaken to maintain expense limitations for the Funds.
In considering the reasonableness of the advisory fee payable to the Investment Manager, the Trustees also reviewed information provided by the Investment Manager setting forth all revenues and other benefits, both direct and indirect (including any so-called “fallout benefits” such as reputational value derived from the Investment Manager serving as Investment Manager to a Fund), received by the Investment Manager and its affiliates attributable to managing each Fund and all the mutual funds in the Managers Family of Funds, the cost of providing such services and the resulting profitability to the Investment Manager and its affiliates from these relationships. The Trustees also noted the current and potential asset levels of each Fund and the willingness of the Investment Manager to waive fees and pay expenses for all the Funds from time to time as a means of limiting total expenses. The Trustees also considered management’s discussion of the current asset levels of the Funds, including the effect on assets attributable to the economic and market conditions since 2008, and considered the impact on profitability of the current asset levels and any future growth of assets of the Funds. The Board took into account management’s discussion of the current advisory fee structure. In this regard, the Trustees noted that, unlike a mutual fund that is managed by a single investment adviser, the Funds operate in a manager-of-managers structure. Based on the foregoing, the Trustees concluded that the profitability to the Investment Manager is reasonable and that the Investment Manager is not realizing material benefits from economies of scale that would warrant adjustments to the advisory fees for any Fund at this time. With respect to economies of scale, the Trustees also noted that as a Fund’s assets increase over time, the Fund may realize other economies of scale to the extent that the increase in assets is proportionally greater than the increase in certain other expenses.
Subadvisory Fees and Profitability.
In considering the reasonableness of the fee payable by the Investment Manager to each Subadvisor (other than Frontier Capital Management Company, LLC (“Frontier”) and TimesSquare
Capital Management, LLC (“TimesSquare”), which are affiliates of the Investment Manager), the Trustees relied on the ability of the Investment Manager to negotiate the terms of the Subadvisory Agreement at arm’s length as part of the manager-of-managers structure, noting that the Subadvisor (other than Frontier and TimesSquare) is not affiliated with the Investment Manager. In addition, the Trustees considered other potential benefits of the subadvisory relationship to a Subadvisor, including, among others, the indirect benefits that the Subadvisor may receive from the Subadvisor’s relationship with a Fund, including any so-called “fallout benefits” to the Subadvisor, such as reputational value derived from the Subadvisor serving as Subadvisor to the Fund. In addition, the Trustees noted that the subadvisory fees are paid by the Investment Manager out of its advisory fee. As a consequence, the cost of services to be provided by each unaffiliated Subadvisor and the profitability to the Subadvisor of its relationship with a Fund were not material factors in the Trustees’ deliberations. For similar reasons, the Trustees did not consider potential economies of scale in the management of a Fund or the portion of a Fund managed by each unaffiliated Subadvisor to be a material factor in their deliberations at this time.
In considering the reasonableness of the fees payable by the Investment Manager to each of Frontier and TimesSquare, the Trustees noted that each of Frontier and TimesSquare is an affiliate of the Investment Manager and reviewed information provided by each of Frontier and TimesSquare regarding the cost to Frontier and TimesSquare, respectively, of providing subadvisory services to a Fund and the resulting profitability from such relationship and noted that, because each of Frontier and TimesSquare is an affiliate of the Investment Manager, such profitability might be directly or indirectly shared by the Investment Manager.
The Trustees noted the current asset levels of the particular Fund managed by each of Frontier and TimesSquare and the undertaking by the Investment Manager to maintain an expense limitation for each Fund. The Trustees also noted that the subadvisory fees are paid by the Investment Manager out of its advisory fee. As a consequence, the cost of services to be provided by each of Frontier and TimesSquare and the profitability to each of Frontier and TimesSquare of its relationship with a Fund were not material factors in the Trustees’ deliberations at this time. For similar reasons, the Trustees did not consider potential economies of scale in the management of the Funds by each of Frontier and TimesSquare to be a material factor in their deliberations at this time.
In addition to the foregoing, the Trustees considered the specific factors and related conclusions set forth below with respect to each Fund.
Managers Micro-Cap Fund
Fund Performance.
Among other information relating to the Fund’s performance, the Trustees noted that the Fund’s performance for the 1-year, 3-year,
Annual Renewal of Investment Advisory and Subadvisory Agreements (continued)
5-year and 10-year periods ended March 31, 2012 was above, at, above and below, respectively, the median performance of the Peer Group and above, above, above and below, respectively, the performance of the Fund Benchmark, the Russell Microcap® Index. The Trustees noted the Fund’s more recent improved performance, including the fact that, for the 1-year period, the Fund delivered strong absolute and relative returns and was in the top quartile relative to the Peer Group. The Trustees also took into account management’s discussion of the Fund’s performance, noting that the Fund’s adoption of a multi-manager, multi-style approach four years ago has contributed positively to relative performance. The Trustees concluded that the Fund’s overall performance has been satisfactory.
Advisory Fees.
The Trustees noted that the Fund’s advisory fees (which include both the advisory and administration fee) and total expenses (net of applicable expense waivers/reimbursements) as of March 31, 2012 were both higher than the average for the Peer Group. The Trustees took into account the fact that the Investment Manager has contractually agreed, through March 1, 2013, to limit the Fund’s net annual operating expenses (subject to certain excluded expenses) to 1.18%. The Trustees took into account management’s discussion of the Fund’s expenses. The Trustees also noted that, effective October 1, 2011, the Fund was restructured into a multi-class Fund with a new lower expense cap applicable to all share classes. The Trustees concluded that, in light of the nature, extent and quality of the services provided by the Investment Manager and the Subadvisors, the foregoing expense limitation and the considerations noted above with respect to the Subadvisors and the Investment Manager, the Fund’s advisory fees, including subadvisory fees, are reasonable.
Managers California Intermediate Tax-Free Fund
Fund Performance.
Among other information relating to the Fund’s performance, the Trustees noted that the Fund’s performance for the 1-year, 3-year, 5-year and 10-year periods ended March 31, 2012 was below, below, below and above, respectively, the median performance of the Peer Group and above, above, below and below, respectively, the performance of the Fund Benchmark, the Barclays U.S. Municipal Bond: 5 Year Index. The Trustees took into account management’s discussion of the Fund’s performance, including the fact that the Fund outperformed the Fund Benchmark for the 1-and 3-year periods and ranks in the top third of the Peer Group for the 10-year period. The Trustees concluded that the Fund’s overall performance has been satisfactory.
Advisory Fees.
The Trustees noted that the Fund’s advisory fees (which include both the advisory and administration fee) and total expenses (net of applicable expense waivers/reimbursements) as of March 31, 2012 were higher and lower, respectively, than the average for the Peer Group. The Trustees took into account the fact that the Investment
Manager has contractually agreed, through March 1, 2013, to limit the Fund’s net annual operating expenses (subject to certain excluded expenses) to 0.55%. The Board also took into account management’s discussion of the Fund’s expenses and the current size of the Fund. The Board noted that the Fund’s advisory fee contains breakpoints. The Trustees concluded that, in light of the nature, extent and quality of the services provided by the Investment Manager and the Subadvisor, the foregoing expense limitation and the considerations noted above with respect to the Subadvisor and the Investment Manager, the Fund’s advisory fees, including subadvisory fees, are reasonable.
Managers Frontier Small Cap Growth Fund
Performance.
Among other information relating to the Fund’s performance, the Trustees noted that the Fund’s performance for Service Class shares for the 1-year, 3-year, 5-year and 10-year periods ended March 31, 2012 was below, below, above and below, respectively, the median performance of the Peer Group and below, below, above and below, respectively, the performance of the Fund Benchmark, the Russell 2000® Growth Index. The Trustees took into account management’s discussion of the Fund’s performance, including the fact that the Fund’s performance has been generally in-line with the Fund Benchmark’s performance over the longer-term and has ranked favorably compared to the Peer Group for the 5-year period. The Trustees concluded that the Fund’s overall performance has been satisfactory in light of all factors considered.
Advisory Fees.
The Trustees noted that the Fund’s advisory fee and total expenses (net of applicable expense waivers/reimbursements) as of March 31, 2012 were higher and lower, respectively, than the average for the Peer Group. The Trustees took into account the fact that the Investment Manager has contractually agreed, through March 1, 2013, to limit the Fund’s net annual operating expenses (subject to certain excluded expenses) to 1.05%. The Board also took into account management’s discussion of the Fund’s expenses and the current size of the Fund. The Trustees concluded that, in light of the nature, extent and quality of the services provided by the Investment Manager and the Subadvisor (which is an affiliate of the Investment Manager), the foregoing expense limitation and the considerations noted above with respect to the Subadvisor and the Investment Manager, the Fund’s advisory fees, including subadvisory fees, are reasonable.
Managers AMG TSCM Growth Equity Fund
Fund Performance.
Among other information relating to the Fund’s performance, the Trustees noted that the Fund’s performance (all share classes) for the 1-year period ended March 31, 2012 and the period from the Fund’s inception on July 30, 2010 through March 31, 2012 was below the median performance of the Peer Group and below the performance of the Fund Benchmark, the Russell 3000® Growth
Annual Renewal of Investment Advisory and Subadvisory Agreements (continued)
Index. The Trustees took into account management’s discussion of the Fund’s performance. The Trustees noted that the Fund hired a new Portfolio Manager in the third quarter of 2011 and that the Fund has experienced strong results and outperformed the Fund Benchmark in the first two full quarters since the new Portfolio Manager was appointed. The Trustees concluded that the Fund’s overall performance has been satisfactory in light of the Fund’s limited performance history.
Advisory Fees.
The Trustees noted that the Fund’s advisory fees (which include both the advisory and administration fee) and total expenses (net of applicable expense waivers/reimbursements) as of March 31, 2012 were higher and lower, respectively, than the average for the Peer Group. The Trustees took into account the fact that the Investment Manager has contractually agreed, through March 1, 2013, to limit the Fund’s net annual operating expenses (subject to certain excluded expenses) to 0.79%. The Board took into account management’s discussion of the Fund’s expenses and the current size of the Fund. The Trustees concluded that, in light of the nature, extent and quality of the services provided by the Investment Manager and the Subadvisor (which is an affiliate of the Investment Manager), the foregoing expense limitation and the considerations noted above with respect to the Subadvisor and the Investment Manager, the Fund’s advisory fees, including subadvisory fees, are reasonable.
Managers Real Estate Securities Fund
Fund Performance.
Among other information relating to the Fund’s performance, the Trustees noted that the Fund’s performance for the 1-year, 3-year, 5-year and 10-year periods ended March 31, 2012 was above the median performance of the Peer Group and below, below, above and above, respectively, the performance of the Fund Benchmark, the Dow Jones U.S. Select REIT Index. The Trustees took into account management’s discussion of the Fund’s performance, including the Fund’s strong performance compared to the Fund Benchmark and the Peer Group over the longer-term. The Trustees also noted that the Fund ranks in the top quintile of its Peer Group for the 3-year, 5-year and 10-year periods. The Trustees concluded that the Fund’s overall performance has been satisfactory in light of all factors considered.
Advisory Fees.
The Trustees noted that the Fund’s advisory fees (which include both the advisory and administration fee) and total expenses (net of
applicable expense waivers/reimbursements) as of March 31, 2012 were both higher than the average for the Peer Group. The Trustees took into account the fact that the Investment Manager has contractually agreed to lower the Fund’s contractual expense limitation from 1.29% to 1.24% of the Fund’s net annual operating expenses (subject to certain excluded expenses) effective July 1, 2012 through at least March 1, 2014 and noted that the Fund’s expense limitation had been previously reduced effective July 2011. The Trustees also took into account management’s discussion of the Fund’s expenses and competitiveness with comparably sized funds. The Trustees concluded that, in light of the nature, extent and quality of the services provided by the Investment Manager and the Subadvisor, the foregoing expense limitation and the considerations noted above with respect to the Subadvisor and the Investment Manager, the Fund’s advisory fees, including subadvisory fees, are reasonable.
* * * *
After consideration of the foregoing, the Trustees also reached the following conclusions (in addition to the conclusions discussed above) regarding the Investment Management Agreement and each Subadvisory Agreement: (a) the Investment Manager and each Subadvisor have demonstrated that they possess the capability and resources to perform the duties required of them under the Investment Management Agreement and the applicable Subadvisory Agreements; (b) each Subadvisor’s Investment Strategy is appropriate for pursuing the applicable Fund’s investment objectives; and (c) the Investment Manager and each Subadvisor maintain appropriate compliance programs.
Based on all of the above-mentioned factors and their related conclusions, with no single factor or conclusion being determinative and with each Trustee not necessarily attributing the same weight to each factor, the Trustees concluded that approval of the Investment Management Agreement and each Subadvisory Agreement would be in the best interests of the applicable Fund and its shareholders. Accordingly, on June 21-22, 2012, the Trustees, including a majority of the Independent Trustees, voted to approve the Investment Management Agreement and the Subadvisory Agreements (as applicable) for each Fund.
67
Investment Manager and Administrator
Managers Investment Group LLC
800 Connecticut Avenue
Norwalk, CT 06854
(800) 835-3879
Distributor
Managers Distributors, Inc.
800 Connecticut Avenue
Norwalk, CT 06854
(800) 835-3879
Custodian
The Bank of New York Mellon
2 Hanson Place
Brooklyn, NY 11217
Legal Counsel
Ropes & Gray LLP
Prudential Tower, 800 Boylston Street
Boston, MA 02199-3600
Transfer Agent
BNY Mellon Investment Servicing (US) Inc.
Attn: Managers
P.O. Box 9769
Providence, RI 02940
(800) 548-4539
For ManagersChoice™ Only
Managers
c/o BNY Mellon Investment Servicing (US) Inc.
P.O. Box 9847
Providence, Rhode Island 02940-8047
(800) 358-7668

MANAGERSAND MANAGERS AMG FUNDS
| | | | |
EQUITY FUNDS | | BALANCED FUNDS |
| | |
CADENCE CAPITAL APPRECIATION CADENCE MID-CAP CADENCE EMERGING COMPANIES Cadence Capital Management, LLC ESSEX SMALL/MICRO CAP GROWTH Essex Investment Management Co., LLC FQ TAX-MANAGED U.S. EQUITY FQ U.S. EQUITY First Quadrant, L.P. FRONTIER SMALL CAP GROWTH Frontier Capital Management Company, LLC GW&K SMALL CAP EQUITY Gannett Welsh & Kotler, LLC MICRO-CAP Lord, Abbett & Co. LLC WEDGE Capital Management L.L.P. Next Century Growth Investors LLC RBC Global Asset Management (U.S.) Inc. | | REAL ESTATE SECURITIES Urdang Securities Management, Inc. RENAISSANCE LARGE CAP GROWTH Renaissance Group LLC SKYLINE SPECIAL EQUITIES PORTFOLIO Skyline Asset Management, L.P. SPECIAL EQUITY Ranger Investment Management, L.P. Lord, Abbett & Co. LLC Smith Asset Management Group, L.P. Federated MDTA LLC SYSTEMATIC VALUE SYSTEMATIC MID CAP VALUE Systematic Financial Management, L.P. TIMESSQUARE MID CAP GROWTH TIMESSQUARE SMALL CAP GROWTH TSCM GROWTH EQUITY TimesSquare Capital Management, LLC | | CHICAGO EQUITY PARTNERS BALANCED Chicago Equity Partners, LLC |
| | | |
| | | ALTERNATIVE FUNDS |
| | | FQ GLOBAL ALTERNATIVES |
| | | FQ GLOBAL ESSENTIALS |
| | | First Quadrant, L.P. |
| | | |
| | | INCOME FUNDS |
| | | BOND (MANAGERS) |
| | | GLOBAL INCOME OPPORTUNITY |
| | | Loomis, Sayles & Co., L.P. |
| | | |
| | | BOND (MANAGERS PIMCO) |
| | | Pacific Investment Management Co. LLC |
| | | |
| | | CALIFORNIA INTERMEDIATE TAX-FREE |
| | | Miller Tabak Asset Management LLC |
| | | |
| | | GW&K FIXED INCOME FUND |
| | | GW&K MUNICIPAL BOND |
| | | GW&K MUNICIPAL ENHANCED YIELD |
| | | BOND |
| | | Gannett Welsh & Kotler, LLC |
| | TRILOGY GLOBAL EQUITY TRILOGY EMERGING MARKETS EQUITY TRILOGY INTERNATIONAL SMALL CAP Trilogy Global Advisors, L.P. YACKTMAN FUND YACKTMAN FOCUSED FUND Yacktman Asset Management L.P. | | HIGH YIELD J.P. Morgan Investment Management LLC INTERMEDIATE DURATION GOVERNMENT SHORT DURATION GOVERNMENT Smith Breeden Associates, Inc. |
| | | | |
This report is prepared for the Fund’s shareholders. It is authorized for distribution to prospective investors only when preceded or accompanied by an effective prospectus. To receive a free copy of the prospectus or Statement of Additional Information, which includes additional information about Fund Trustees, please contact us by calling 800.835.3879. Distributed by Managers Distributors, Inc., member FINRA. A description of the policies and procedures each Fund uses to vote its proxies is available: (i) without charge, upon request, by calling 800.835.3879, or (ii) on the Securities and Exchange Commission’s (SEC) Web site at www.sec.gov. For information regarding each Fund’s proxy voting record for the 12-month period ended June 30, call 800.835.3879 or visit the SEC Web site at www.sec.gov. The Fund files its complete schedule of portfolio holdings with the SEC for the first and third quarters of each fiscal year on Form N-Q. The Funds’ Forms N-Q are available on the SEC’s Web site at www.sec.gov. A Fund’s Forms N-Q may be reviewed and copied at the SEC’s Public Reference Room in Washington, DC. Information on the operation of the Public Reference Room may be obtained by calling 800.SEC.0330. To review a complete list of the Fund’s portfolio holdings, or to view the most recent quarterly holdings report, semiannual report, or annual report, please visit www.managersinvest.com. | |  |

ANNUAL REPORT
Managers Funds
October 31, 2012
Managers PIMCO Bond Fund

AR021-1012
Managers PIMCO Bond Fund
Annual Report – October 31, 2012
| | | | |
TABLE OF CONTENTS | | Page | |
| |
LETTER TO SHAREHOLDERS | | | 1 | |
| |
ABOUT YOUR FUND’S EXPENSES | | | 3 | |
| |
INVESTMENT MANAGER’S COMMENTS, FUND SNAPSHOTS, AND SCHEDULE OF PORTFOLIO INVESTMENTS | | | 4 | |
| |
NOTES TO SCHEDULE OF PORTFOLIO INVESTMENTS | | | 21 | |
| |
FINANCIAL STATEMENTS | | | | |
| |
Statement of Assets and Liabilities | | | 31 | |
Balance sheet, net asset value (NAV) per share computations and cumulative undistributed amounts | | | | |
| |
Statement of Operations | | | 32 | |
Detail of sources of income, expenses, and realized and unrealized gains (losses) during the fiscal year | | | | |
| |
Statements of Changes in Net Assets | | | 33 | |
Detail of changes in assets for the past two fiscal years | | | | |
| |
FINANCIAL HIGHLIGHTS | | | 34 | |
Historical net asset values per share, distributions, total returns, income and expense ratios, turnover ratios and net assets | | | | |
| |
NOTES TO FINANCIAL STATEMENTS | | | 35 | |
Accounting and distribution policies, details of agreements and transactions with Fund management and affiliates, and descriptions of certain investment risks | | | | |
| |
REPORT OF INDEPENDENT REGISTERED PUBLIC ACCOUNTING FIRM | | | 42 | |
| |
TRUSTEES AND OFFICERS | | | 43 | |
| |
ANNUAL RENEWAL OF INVESTMENT ADVISORY AGREEMENT | | | 44 | |
Nothing contained herein is to be considered an offer, sale or solicitation of an offer to buy shares of any series of the Managers Family of Funds. Such offering is made only by Prospectus, which includes details as to offering price and other material information.
Letter to Shareholders
Dear Shareholder:
Our foremost goal at Managers Investment Group (“MIG”) is to structure and manage mutual funds that will help our shareholders and clients successfully reach their investment goals and objectives.
Each of our Funds is geared towards providing you with exposure to a specific asset class or style of investing. We believe investors tend to use our Funds as part of their broader portfolio in order to tailor their asset allocation to meet their individual needs. Most of our Funds, like the one detailed in this report, are therefore designed to be building blocks.
At MIG, we have overall responsibility for the investment management and administration of the Funds. As a “manager of managers,” we work with external investment managers that make the day-to-day investment decisions in the Funds (the “Portfolio Managers”). We devote considerable resources to our disciplined process of identifying and selecting Portfolio Managers for the Funds. As a manager of managers, MIG performs many activities to monitor the ongoing investment, compliance and administrative aspects of all of the Funds, which we believe gives our shareholders added confidence in their investments.
Our parent company, Affiliated Managers Group (“AMG”) is a global asset management company with ownership interests in a diverse group of boutique investment management firms (its “Affiliates”). MIG has the unique opportunity to access the investment skills and acumen of some of AMG’s Affiliates. The set of our Funds managed by these proprietary firms also benefits from our activities to monitor the investment, compliance and administrative aspects of the Funds.
Below is a brief overview of the securities markets and the performance results for the Fund. Following this letter, we also provide the Portfolio Manager’s discussion of its investment management approach, performance results and market outlook.
Fixed income markets rose solidly during the prior 12 months as cautious investors continued to find comfort in the safety of bonds despite historically low yields. Similar to the prior year, investor enthusiasm ebbed and flowed every few months with risk appetite returning to the market by the end of this period in response to additional unconventional monetary policies. Spread sectors were the best performing area of fixed income markets for the year.
Against this backdrop, for the 12-month period ending October 31, 2012, the Managers PIMCO Bond Fund (the “Fund”) posted a return of 9.31%. This results in solid outperformance versus its benchmark, the Barclays U.S. Aggregate Bond Index®, which posted a return of 5.25% for that same period as detailed further below.
| | | | | | | | | | | | | | | | | | | | |
Periods Ended 10/31/12 | | One Year | | | Three Years | | | Five Years | | | Ten Years | | | Inception Date | |
Managers PIMCO Bond Fund | | | 9.31 | % | | | 7.02 | % | | | 8.00 | % | | | 6.52 | % | | | 4/30/1993 | |
Barclays U.S. Aggregate Bond Index® | | | 5.25 | % | | | 6.08 | % | | | 6.38 | % | | | 5.39 | % | | | | |
The Fund’s solid outperformance was steady throughout the year with outperformance in each of the last four quarters. One of the largest contributors to outperformance has been an overweight to agency mortgage-backed securities which outperformed like-duration Treasuries. A relatively modest exposure to non-agency mortgages contributed to returns as well. Curve positioning, which included an underweight to longer maturities as the yield curve steepened, was positive for performance as the U.S. yield curve steepened during the year. In addition, the Fund’s allocation to Build America Bonds performed well as investors continued to seek higher yielding assets. Within the Fund’s corporate holdings, an emphasis on the bonds of financial firms, which outperformed the broader market, contributed to returns.
Pacific Investment Management Company, LLC (“PIMCO”) expects the global economy to grow at a real rate of 1.5% to 2.0% over the year ahead. PIMCO also expects real growth will be moderated by efforts to resolve debt overhangs through fiscal restraint. Households and governments will seek to delever their balance sheets while the corporate sector remains reluctant to engage its own. Nominal growth could be bolstered by the continued resolve of central banks. The balance of these forces will determine if GDP growth has slowed to stall speed or if a coordinated global slowdown can be averted. Central banks’ actions to restore liquidity continue to drive financial asset valuations higher. PIMCO is alert to the possibility that asset class bubbles may be forming and
1
Letter to Shareholders (continued)
continues to implement risk reduction strategies. PIMCO retains broad defensive positioning and is focused on finding yield derived from high quality sources and active management.
The following report covers the one-year period ending October 31, 2012. Should you have any questions about this report, or if you’d like to receive a prospectus and additional information, including fees and expenses for these or any of the other Funds in our family, please feel free to contact us at 1-800-835-3879, or visit our website at www.managersinvest.com. As always, please read the prospectus carefully before you invest or send money.
You can rest assured that under all market conditions our team is focused on delivering excellent investment management services for your benefit.
We thank you for your continued confidence and investment in The Managers Funds.
Respectfully,

Keitha Kinne
Managing Partner
Managers Investment Group LLC
2
About Your Fund’s Expenses
|
As a shareholder of a Fund, you may incur two types of costs: (1) transaction costs, which may include sales charges (loads) on purchase payments; redemption fees; and exchange fees; and (2) ongoing costs, including management fees; distribution (12b-1) fees; and other Fund expenses. This example is intended to help you understand your ongoing costs (in dollars) of investing in the Fund and to compare these costs with the ongoing costs of investing in other mutual funds. The example is based on $1,000 invested at the beginning of the period and held for the entire period as indicated below. Actual Expenses The first line of the following table provides information about the actual account values and actual expenses. You may use the information in this line, together with the amount you invested, to estimate the expenses that you paid over the period. Simply divide your account value by $1,000 (for example, an $8,600 account value divided by $1,000 = 8.6), then multiply the result by the number in the first line under the heading entitled “Expenses Paid During Period” to estimate the expenses you paid on your account during this period. Hypothetical Example for Comparison Purposes The second line of the following table provides information about hypothetical account values and hypothetical expenses based on the Fund’s actual expense ratio and an assumed annual rate of return of 5% before expenses, which is not the Fund’s actual return. The hypothetical account values and expenses may not be used to estimate the actual ending account balance or expenses you paid for the period. You may use this information to compare the ongoing costs of investing in the Fund and other funds by comparing this 5% hypothetical example with the 5% hypothetical examples that appear in the shareholder reports of other funds. Please note that the expenses shown in the table are meant to highlight your ongoing costs only and do not reflect any transactional costs, such as sales charges (loads), redemption fees, or exchange fees. Therefore, the second line of the table is useful in comparing ongoing costs only, and will not help you determine the relative total costs of owning different funds. |
| | | | | | | | | | | | | | | | |
Six Months Ended October 31, 2012 | | Expense
Ratio for
the Period | | | Beginning
Account Value
05/01/12 | | | Ending
Account Value
10/31/12 | | | Expenses
Paid During
the Period* | |
Managers PIMCO Bond Fund | | | | | | | | | | | | | | | | |
Based on Actual Fund Return | | | 0.58 | % | | $ | 1,000 | | | $ | 1,044 | | | $ | 2.98 | |
Hypothetical (5% return before expenses) | | | 0.58 | % | | $ | 1,000 | | | $ | 1,022 | | | $ | 2.95 | |
* Expenses are equal to the Fund’s annualized expense ratio multiplied by the average account value over the period, multiplied by the number of days in the period (184), then divided by 366. | |
| |
| |
| |
| |
| |
| |
| |
| |
| |
| |
| |
| |
| |
| |
| |
| |
| |
| |
| |
| |
| |
| |
| |
| |
| |
| |
| |
| |
| |
| |
| |
| |
| |
| |
| |
| |
| |
| |
| |
| |
| |
3
Managers PIMCO Bond Fund
Investment Manager’s Comments
Managers PIMCO Bond Fund seeks to maximize total return consistent with the preservation of capital by investing in debt securities such as corporate, mortgage-backed, international, and government bonds. Normally, the Fund will invest at least 80% of its net assets in these types of bonds.
THE PORTFOLIO MANAGER
Pacific Investment Management Company, LLC
Pacific Investment Management Company, LLC (“PIMCO”), the subadvisor for the Managers PIMCO Bond Fund, was founded in 1971. PIMCO is one of the world’s leading fixed income managers with expertise and significant resources committed to virtually every sector of the global bond market.
Managers PIMCO Bond Fund is an actively managed, diversified bond fund that focuses on intermediate-term, investment-grade bonds. The universe for the Fund includes all sectors of the bond market: governments, corporate bonds, mortgages, asset-backed securities, money market instruments, and international bonds. The Fund seeks total return consistent with preservation of capital by employing PIMCO’s “Total Return” fixed income investment philosophy. This philosophy follows three key principles:
| | • | | Major shifts in portfolio strategy are driven by longer-term, or secular, trends as opposed to short-term interest rate fluctuations. |
| | • | | Consistent investment performance is achieved by avoiding extreme swings in maturity/duration of a portfolio. |
| | • | | Emphasis is placed on adding value through state-of-the-art tools such as futures, options, and volatility analysis. |
Economic analysis serves as the base for PIMCO’s portfolio strategy. Annually, PIMCO investment professionals conduct a three-day secular forum, where long-term economic and market forces are evaluated and portfolio strategies are set. Each quarter, the team meets to evaluate the current business cycle and develop shorter-term forecasts which are used to fine-tune the investment strategy. PIMCO’s fixed income research efforts focus on identifying relative value and understanding the risks inherent in different portfolio structures, strategies, and bond market sectors. Using proprietary analytics and bottom-up credit analysis, the portfolio managers select individual bonds based on recommendations from sector analysts who specialize in corporate, mortgage, high yield, government, and international bonds.
The ideal investment exhibits many of the following traits:
| | • | | It allows management to meet its overall portfolio positioning targets. Management typically invests in investment-grade securities but may invest up to 10% of the Portfolio in securities that are below investment grade. |
| | • | | The investment has been independently analyzed by PIMCO. PIMCO does not rely solely on the credit ratings assigned by outside credit agencies. |
| | • | | Fund management deems that the security provides value relative to other securities within the same sector. |
Portfolio management:
| | • | | Is committed to seeking value across all bond market sectors. |
| | • | | Actively manages duration exposure, yield-curve position, volatility, sector allocation, and security selection and takes only modest exposures in each of these areas relative to the market. |
| | • | | Normally hedges at least 75% of its foreign currency exposure. |
| | • | | Utilizes derivatives (futures, options, swap agreements) as substitutes for physical securities as a means of gaining more cost-effective exposure. |
The investment team may sell securities when:
| | • | | Securities individually no longer represent relative value. |
| | • | | Fund management makes a shift in its portfolio strategy (change in duration, yield curve positioning, sector strategy, etc.). |
THE YEAR IN REVIEW
Fixed income markets rose solidly during the prior 12 months as cautious investors continued to find comfort in the safety of bonds despite historically low yields. Similar to the prior year, investor enthusiasm ebbed and flowed every few months with risk appetite returning to the market by the end of this period in response to additional unconventional monetary policies. Spread sectors were the best performing area of fixed income markets for the year.
For the 12-month period ended October 31, 2012, the Managers PIMCO Bond Fund returned 9.31%, compared with 5.25% for its benchmark, the Barclays U.S. Aggregate Bond Index®. The Fund’s solid outperformance was steady throughout the year with outperformance in each of the last four quarters. One of the largest contributors to outperformance has been an overweight to agency mortgage-backed securities which outperformed like-duration Treasuries. A relatively modest exposure to non-agency mortgages contributed to returns as well. Curve positioning, which included an underweight to longer maturities as the yield curve steepened, was positive for performance as the U.S. yield curve steepened during the year. In addition, the Fund’s allocation to Build America Bonds performed well as investors continued to seek higher yielding assets. Within the Fund’s corporate holdings, an emphasis on the bonds of financial firms, which outperformed the broader market, contributed to returns.
LOOKING FORWARD
PIMCO expects the global economy to grow at a real rate of 1.5% to 2.0% over the year ahead. PIMCO also expects real growth will be moderated by efforts to resolve debt overhangs through fiscal restraint. Households and governments will seek to delever their balance sheets while the corporate sector remains reluctant to engage its own. Nominal growth could be bolstered by the continued resolve of central banks. The balance of these forces will determine if GDP growth has slowed to stall speed or if a coordinated global slowdown can be averted.
The negative effects of austerity measures implemented throughout the Euro Zone and the U.K. are reflected in the weak growth numbers within the region and strongly point to recessions already underway. Mixed economic data and the unending hope for further stimulus in the U.S. and other developed and emerging economies has allowed for cautious optimism and tempered market volatility which had increased during the second quarter of 2012. However, ongoing efforts by policymakers to offer short-term solutions are becoming increasingly ineffective. Financial markets’ heightened sensitivity to policy-related news reflects acknowledgment of the difficulties that lie ahead in resolving significant structural problems in many economies.
4
Managers PIMCO Bond Fund
Investment Manager’s Comments (continued)
| | • | | Key Decisions Support Euro Zone- Global markets continued to focus on Europe as the region faced several important tests in the third quarter. The German Constitutional Court approved the European Stability Mechanism (ESM), removing the last major obstacle towards implementing this important rescue fund. The European Central Bank (ECB) conditionally committed to a role as lender of last resort. Both actions boosted confidence and slowed the process of delevering. The question now becomes when Spain or another troubled sovereign will formally ask for assistance, fulfilling a key pre-requisite for the ECB to buy their bonds. However, bond purchases alone will not be enough to resolve the fundamental challenges facing the Euro Zone. PIMCO expects progress toward greater integration to be incremental, conditional, and punctuated with periods of volatility. |
| | • | | U.S. Economic Data Slips- PIMCO forecasts U.S. growth between 1.0% and 1.5% as persistent unemployment and softening manufacturing and consumption data prevent positive economic reports from establishing a trend. Brighter news is coming out of the housing sector where many indicators including strong demand, falling inventory, declining distressed sales, and improving affordability suggest a gradual bottoming of home prices. However, other major indicators are following a downward trajectory. Perhaps most tellingly, second quarter GDP was revised downward to 1.3% in late September. As the respective campaigns intensify ahead of November’s Presidential election, few expect any important issues to be resolved before then. No further clarity has surfaced on how either party intends to tackle the ‘fiscal cliff’ as tax stimuli and government spending worth approximately 4.5% of GDP expires in January 2013. PIMCO’s base-case is for a series of compromises and extensions which will total approximately 1.5% of GDP, regardless of electoral outcomes. |
| | • | | Slowdown Accelerates in Emerging Markets- The economic slowdown experienced by many emerging markets (EM) over the past year has accelerated. PIMCO anticipates EM growth to continue to outpace that of developed markets over the cyclical horizon, through at a significantly lower level than in recent years. EM economies continue to suffer from the knock-on effects of recession and slowdown in much of the developed world. |
| | • | | Longer Term Inflation Concerns Build- PIMCO anticipates global inflation of between 2%-2.5% over the cyclical horizon. On a secular basis, PIMCO expects the prolonged wave of ultra-dovish monetary policy to drive longer-term inflation higher. |
Central banks’ actions to restore liquidity continue to drive financial asset valuations higher. PIMCO is alert to the possibility that asset class bubbles may be forming and continues to implement risk reduction strategies. PIMCO retains broad defensive positioning and is focused on finding yield derived from high quality sources and active management.
| | • | | Interest Rate Strategies- PIMCO plans to maintain a neutral to underweight duration position. The Portfolio will emphasize high quality duration from countries that PIMCO views as having the cleanest balance sheets, such as the U.S., Canada, Australia, and Mexico. PIMCO remains concentrated in the 6-10 year portion of the yield curve where they see superior opportunities for roll-down and price appreciation compared to those available at the short-end, where potential rate rises and volatility are constrained by Fed intervention. PIMCO remains underweight the long end of the yield curve as longer maturities may not adequately compensate investors for sizeable longer-term inflation risk. |
| | • | | Mortgages- Agency mortgages remain an important source of high quality yield. These assets exhibit attractive risk-return dynamics relative to low-yielding cash and corporate credits. While recognizing that the new Fed program will likely continue to disrupt absolute valuation within the mortgage market over the cyclical horizon, PIMCO will continue to take advantage of relative value opportunities across mortgage coupons. PIMCO plans to hold non-Agency mortgages and commercial mortgage-backed securities (CMBS) that have senior positions in the capital structure and are another source of attractive yield. |
| | • | | Corporate Bonds- PIMCO sees increasing differentiation between credits in terms of default risk and continues to shift its exposure towards securities higher up in the capital structure. PIMCO remains cautious towards companies overly dependent on revenue from regions which are in the earlier stages of their deleveraging cycles, such as Europe. The resilient performance of the U.S. banking sector in the face of recent credit downgrades reinforces PIMCO’s conviction about the solid fundamental characteristics of certain financial credits. PIMCO does, however, continue to assess and refine their financials exposure both due to industry developments and from a valuation perspective given the outperformance of this sector in 2012. |
| | • | | Emerging Markets- PIMCO plans to retain exposure to corporate and quasi-sovereign bonds in select countries with strong initial conditions and high quality balance sheets such as Brazil and Mexico. PIMCO also plans to maintain exposure to rates in these countries which have relatively high nominal and real local interest rates and steep yield curves with the potential to capture roll-down. PIMCO continues to expect EM to outpace developed markets over the secular horizon. |
| | • | | Municipals and Treasury Inflation- Protected Securities (TIPS)- PIMCO continues to see value in high quality municipal bonds and retains their preference for essential service revenue bonds such as water and sewer, power, and airports. PIMCO expects to maintain its position in TIPS as the threat of higher longer-term inflation remains. |
5
Managers PIMCO Bond Fund
Investment Manager’s Comments (continued)
Cumulative Total Return Performance
The Fund’s cumulative total return is based on the daily change in net asset value (NAV), and assumes that all distributions were reinvested. The chart illustrates the performance of a hypothetical $10,000 investment made in the Managers PIMCO Bond Fund on October 31, 2002, to a $10,000 investment made in the Barclays U.S. Aggregate Bond Index® for the same time period. The graph and table do not reflect the deduction of taxes that a shareholder would pay on a Fund distribution or redemption of shares. The listed returns for the Fund are net of expenses and the returns for the index exclude expenses. Past performance is not indicative of future results. Total returns would have been lower had certain expenses not been reduced.
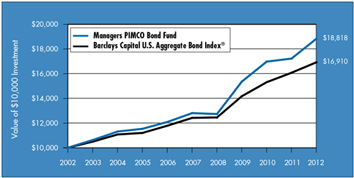
The table below shows the average annual total returns for the Managers PIMCO Bond Fund and the Barclays U.S. Aggregate Bond Index® for the same time periods ended October 31, 2012.
| | | | | | | | | | | | |
Average Annualized Total Returns1 | | One Year | | | Five Years | | | Ten Years | |
Managers PIMCO Bond Fund2,3,4,5,6,7,8 | | | 9.31 | % | | | 8.00 | % | | | 6.52 | % |
Barclays U.S. Aggregate Bond Index®9 | | | 5.25 | % | | | 6.38 | % | | | 5.39 | % |
The performance data shown represents past performance. Past performance is not a guarantee of future results. Current performance may be lower or higher than the performance data quoted. The investment return and principal value of an investment in the Fund will fluctuate so that an investor’s shares, when redeemed, may be worth more or less than their original cost. For performance information through the most recent month end, please call (800) 835-3879 or visit our Web site at www.managersinvest.com.
Investors should carefully consider the Fund’s investment objectives, risks, charges and expenses before investing. For this and other information, please call (800) 835-3879 or visit our Web site at www.managersinvest.com for a free prospectus. Read it carefully before investing or sending money. Distributed by Managers Distributors, Inc., member FINRA.
| 1 | Total return equals income yield plus share price change and assumes reinvestment of all dividends and capital gain distributions. Returns are net of fees and may reflect offsets of Fund expenses as described in the Prospectus. No adjustment has been made for taxes payable by shareholders on their reinvested dividends and capital gain distributions. Returns for periods greater than one year are annualized. The listed returns on the Fund are net of expenses and based on the published NAV as of October 31, 2012. All returns are in U.S. dollars($). |
|
2 Fund for which, from time to time, the Fund’s advisor has waived its fees and/or absorbed Fund expenses, which has resulted in higher returns. 3 Fixed income funds are subject to the risks associated with investments in debt securities, such as default risk and fluctuations in the perception of the debtor’s ability to pay its creditors. Changing interest rates may adversely affect the value of a fixed income investment. An increase in interest rates typically causes the value of bonds and other fixed-income securities to fall. 4 The Fund may use derivative instruments for hedging purposes or as part of its investment strategy. There is also a risk that a derivative intended as a hedge may not perform as expected. The main risk with derivatives is that some types can amplify a gain or loss, potentially earning or losing substantially more money than the actual cost of the derivative; or that the counterparty may fail to honor its contract terms, causing a loss for the Fund. Use of these instruments may involve certain costs and risks such as liquidity risk, interest rate risk, market risk, credit risk, management risk, and the risk that the Fund could not close out a position when it would be most advantageous to do so. 5 Investments in international securities are subject to certain risks of overseas investing including currency fluctuations and changes in political and economic conditions, which could result in significant market fluctuations. These risks are magnified in emerging markets. 6 High yield bonds (also known as “junk bonds”) are subject to additional risks such as the risk of default. 7 Many bonds have call provisions which allow the debtors to pay them back before maturity. This is especially true with mortgage securities, which can be paid back any time. Typically debtors prepay their debt when it is to their advantage (when interest rates drop making a new loan at current rates more attractive), and thus likely to the disadvantage of bondholders, who may have to reinvest prepayment proceeds in securities with lower yields. Prepayment risk will vary depending on the provisions of the security and current interest rates relative to the interest rate of the debt. 8 Market risk associated with equity securities may become more pronounced for the Fund. 9 The Barclays U.S. Aggregate Bond Index® is an index of the U.S. investment-grade fixed-rate bond market, including both government and corporate bonds. Unlike the Fund, the Barclays U.S. Aggregate Bond Index® is unmanaged, is not available for investment, and does not incur expenses. Not FDIC insured, nor bank guaranteed. May lose value. |
6
Managers PIMCO Bond Fund
Fund Snapshots
October 31, 2012
Portfolio Breakdown (unaudited)
| | | | | | | | |
Category | | Managers
PIMCO Bond Fund** | | | Barclays
U.S. Aggregate
Bond Index® | |
U.S. Government and Agency Obligations | | | 78.4 | % | | | 41.1 | % |
Corporate Bonds and Notes | | | 18.2 | % | | | 21.4 | % |
Foreign Government and Agency Obligations | | | 10.8 | % | | | 5.5 | % |
Municipal Bonds | | | 4.4 | % | | | 0.0 | % |
Mortgage-Backed Securities | | | 4.2 | % | | | 31.6 | % |
Asset-Backed Securities | | | 2.2 | % | | | 0.4 | % |
Municipal Closed-End Bond Funds | | | 0.5 | % | | | 0.0 | % |
Preferred Stocks | | | 0.3 | % | | | 0.0 | % |
Bank Loan Obligations | | | 0.1 | % | | | 0.0 | % |
Other Assets and Liabilities | | | (19.1 | )% | | | 0.0 | % |
| ** | As a percentage of net assets. |
| | | | | | | | |
Rating | | Managers PIMCO
Bond Fund*** | | | Barclays
U.S. Aggregate
Bond Index® | |
U.S. Treasury & Agency | | | 63.4 | % | | | 70.9 | % |
Aaa | | | 2.3 | % | | | 3.8 | % |
Aa | | | 7.3 | % | | | 3.5 | % |
A | | | 8.1 | % | | | 11.2 | % |
Baa | | | 10.4 | % | | | 10.6 | % |
Ba & lower | | | 8.5 | % | | | 0.0 | % |
| *** | As a percentage of market value of fixed income securities. Chart does not include equity securities. |
Top Ten Holdings (unaudited)
| | | | |
Security Name | | % of
Net Assets | |
FNMA, 4.000%, TBA* | | | 8.8 | % |
FNMA, 3.500%, TBA | | | 8.0 | |
TD Securities (USA) LLC, dated 10/31/12, due 11/01/12, 0.30%, total to be received $98,100,818, (collateralized by $100,175,275 U.S. Treasury Notes, 0.625%, 07/15/14) | | | 6.8 | |
TD Securities (USA) LLC, dated 10/31/12, due 11/05/12, 0.33%. total to be received $84,603,878, (collateralized by $86,379,421 U.S. Treasury Notes, 2.375% 10/31/14) | | | 5.9 | |
FNMA, 4.500%, TBA* | | | 5.2 | |
Citigroup Global Markets, Inc., dated 10/31/12, due 11/02/12, 0.35%, total to be received $61,101,188, (collateralized by $62,438,916 U.S. Treasury Notes, 1.00%, 08/31/19) | | | 4.2 | |
FNMA, 5.000%, TBA* | | | 4.1 | |
FNMA, 5.500%, TBA* | | | 3.3 | |
U.S. Treasury Notes, 0.500%, 07/31/17 | | | 2.1 | |
Spain Letras del Tesoro | | | 2.0 | |
Top Ten as a Group | | | 50.4 | % |
| | | | |
| * | Top Ten Holding at April 30, 2012 |
Any sectors, industries, or securities discussed should not be perceived as investment recommendations. Mention of a specific security should not be considered a recommendation to buy or solicitation to sell that security. Specific securities mentioned in this report may have been sold from the Fund’s portfolio of investments by the time you receive this report.
7
Managers PIMCO Bond Fund
Schedule of Portfolio Investments
October 31, 2012
| | | | | | | | |
| | | Principal Amount | | | Value | |
| | | | | | | | |
Asset-Backed Securities - 2.2% | | | | | | | | |
Amortizing Residential Collateral Trust, Series 2002-BC4, 0.791%, 07/25/32 (11/26/12)1 | | $ | 77,398 | | | $ | 64,846 | |
Bear Stearns Asset-Backed Securities, Inc., Series 2006-AQ1, Class 2A1, 0.291%, 10/25/36 (11/26/12)1 | | | 73,456 | | | | 69,933 | |
Countrywide Asset-Backed Certificates, Series 2007-2, Class 2A2, 0.311%, 08/25/37 (11/26/12)1 | | | 9,001,008 | | | | 8,823,485 | |
EFS Volunteer No. 2 LLC, Series 1, Class A1, 1.091%, 07/26/27 (11/26/12) (a)1 | | | 1,986,601 | | | | 2,010,085 | |
EMC Mortgage Loan Trust, Series 2001-A, Class A, 0.951%, 05/25/40 (11/26/12) (a)1 | | | 581,753 | | | | 522,327 | |
First NLC Trust, Series 2007-1, Class A1, 0.281%, 08/25/37 (11/26/12) (a)1 | | | 674,665 | | | | 282,234 | |
Fremont Home Loan Trust, Series 2006-E, Class 2A1, 0.271%, 01/25/37 (11/26/12)1 | | | 40,100 | | | | 17,617 | |
Long Beach Mortgage Loan Trust, Series 2004-4, Class 1A1, 0.771%, 10/25/34 (11/26/12)1 | | | 55,661 | | | | 48,152 | |
Morgan Stanley IXIS Real Estate Capital Trust, Series 2006-2, Class A1, 0.261%, 11/25/36 (11/26/12)1 | | | 11,656 | | | | 4,731 | |
Park Place Securities, Inc., Series 2005-WCW1, Class A1B, 0.471%, 09/25/35 (11/26/12)1 | | | 1,587,551 | | | | 1,539,029 | |
Securitized Asset Backed Receivables LLC, | | | | | | | | |
Series 2007-HE1, Class A2A, 0.271%, 12/25/36 (11/26/12)1 | | | 465,956 | | | | 119,094 | |
Series 2007-NC2, 0.251%, 01/25/37 (11/26/12)1 | | | 167,219 | | | | 150,487 | |
Small Business Administration Participation Certificates, | | | | | | | | |
Series 2003-20I, Class 1, 5.130%, 09/01/23 | | | 67,782 | | | | 75,428 | |
Series 2007-20K, Class 1, 5.510%, 11/01/27 | | | 3,267,355 | | | | 3,773,245 | |
Series 2008-10E, Class 1, 5.110%, 09/01/18 | | | 1,328,288 | | | | 1,433,516 | |
Series 2008-20I, Class 1, 5.600%, 09/01/28 | | | 6,661,498 | | | | 7,778,985 | |
Series 2009-20E, Class 1, 4.430%, 05/01/29 | | | 4,149,501 | | | | 4,613,533 | |
Structured Asset Securities Corp., Series 2002-HF1, 0.791%, 01/25/33 (11/26/12)1 | | | 47,968 | | | | 42,832 | |
Total Asset-Backed Securities (cost $29,964,805) | | | | | | | 31,369,559 | |
Bank Loan Obligations - 0.1% | | | | | | | | |
American Governmental Financial Services Funding Co., Term Loan, 0.277%, 05/18/17 (cost $1,194,000) | | | 1,200,000 | | | | 1,185,000 | |
Corporate Bonds and Notes - 18.2% | | | | | | | | |
Financials - 13.2% | | | | | | | | |
AK Transneft OJSC Via TransCapitalInvest, Ltd., 8.700%, 08/07/18 (a) | | | 600,000 | | | | 776,802 | |
Allstate Life Global Funding Trusts, MTN, 5.375%, 04/30/13 | | | 1,600,000 | | | | 1,639,485 | |
Ally Financial, Inc., | | | | | | | | |
3.638%, 02/11/14 (11/11/12)1 | | | 1,000,000 | | | | 1,029,150 | |
4.500%, 02/11/14 | | | 7,700,000 | | | | 7,950,250 | |
5.500%, 02/15/17 | | | 3,300,000 | | | | 3,495,301 | |
7.500%, 12/31/13 | | | 1,500,000 | | | | 1,595,625 | |
7.500%, 09/15/202 | | | 1,100,000 | | | | 1,300,750 | |
8.300%, 02/12/15 | | | 800,000 | | | | 898,200 | |
American International Group, Inc., | | | | | | | | |
5.050%, 10/01/15 | | | 400,000 | | | | 441,461 | |
6.250%, 03/15/37 | | | 800,000 | | | | 830,000 | |
8.250%, 08/15/18 | | | 4,500,000 | | | | 5,859,761 | |
MTN, 5.600%, 10/18/16 | | | 800,000 | | | | 917,762 | |
MTN, Series G, 5.850%, 01/16/18 | | | 400,000 | | | | 468,422 | |
ANZ National International, Ltd., 6.200%, 07/19/13 (a) | | | 1,800,000 | | | | 1,867,925 | |
Australia and New Zealand Banking Group, Ltd., 2.125%, 01/10/14 (a)3 | | | 2,400,000 | | | | 2,431,310 | |
Banco Santander Brasil SA, 4.500%, 04/06/15 (a) | | | 200,000 | | | | 207,500 | |
The accompanying notes are an integral part of these financial statements.
8
Managers PIMCO Bond Fund
Schedule of Portfolio Investments (continued)
| | | | | | | | | | | | |
| | | | | | Principal Amount | | | Value | |
| | | | | | | | | | | | |
Financials - 13.2% (continued) | | | | | | | | | | | | |
Bank of America Corp., | | | | | | | | | | | | |
4.500%, 04/01/15 | | | | | | $ | 10,000,000 | | | $ | 10,717,140 | |
6.000%, 09/01/17 | | | | | | | 2,115,000 | | | | 2,472,285 | |
6.000%, 10/15/36 | | | | | | | 900,000 | | | | 1,105,850 | |
6.500%, 08/01/16 | | | | | | | 2,800,000 | | | | 3,259,332 | |
Bank of China (Hong Kong), Ltd., 5.550%, 02/11/20 (a) | | | | | | | 400,000 | | | | 456,569 | |
Bank of Montreal, | | | | | | | | | | | | |
1.950%, 01/30/17 (a) | | | | | | | 600,000 | | | | 628,120 | |
2.850%, 06/09/15 (a) | | | | | | | 800,000 | | | | 848,053 | |
Bank of Nova Scotia, | | | | | | | | | | | | |
1.650%, 10/29/15 (a) | | | | | | | 900,000 | | | | 928,487 | |
1.950%, 01/30/17 (a) | | | | | | | 200,000 | | | | 209,421 | |
BBVA Bancomer SA, | | | | | | | | | | | | |
4.500%, 03/10/16 (a) | | | | | | | 500,000 | | | | 533,125 | |
6.500%, 03/10/21 (a) | | | | | | | 900,000 | | | | 1,031,625 | |
BPCE SA, 2.375%, 10/04/13 (a)3 | | | | | | | 400,000 | | | | 401,364 | |
Braskem Finance, Ltd., 5.750%, 04/15/21 (a) | | | | | | | 400,000 | | | | 442,000 | |
CIT Group, Inc., 5.250%, 04/01/14 (a) | | | | | | | 300,000 | | | | 312,750 | |
Citigroup, Inc., | | | | | | | | | | | | |
2.438%, 08/13/13 (11/13/12)1 | | | | | | | 1,100,000 | | | | 1,113,291 | |
5.500%, 10/15/14 | | | | | | | 5,800,000 | | | | 6,268,518 | |
5.850%, 07/02/13 | | | | | | | 100,000 | | | | 103,372 | |
6.125%, 08/25/36 | | | | | | | 4,200,000 | | | | 4,665,784 | |
EMTN, Class B, 3.625%, 11/30/174 | | | EUR | | | | 3,800,000 | | | | 4,600,885 | |
Commonwealth Bank of Australia, 0.763%, 07/12/13 (01/14/13) (a)1 | | | | | | | 7,500,000 | | | | 7,525,117 | |
Credit Suisse New York, 2.200%, 01/14/14 | | | | | | | 800,000 | | | | 813,349 | |
Dexia Credit Local SA, 0.793%, 04/29/14 (01/29/13) (a)1 | | | | | | | 4,100,000 | | | | 4,038,459 | |
Ford Motor Credit Co. LLC, | | | | | | | | | | | | |
5.875%, 08/02/21 | | | | | | | 300,000 | | | | 346,023 | |
7.000%, 04/15/15 | | | | | | | 1,400,000 | | | | 1,561,000 | |
8.700%, 10/01/14 | | | | | | | 1,000,000 | | | | 1,127,663 | |
General Electric Capital Corp., | | | | | | | | | | | | |
5.500%, 09/15/67 (a)4 | | | EUR | | | | 5,500,000 | | | | 7,089,576 | |
MTN, 5.875%, 01/14/38 | | | | | | | 2,300,000 | | | | 2,841,974 | |
Goldman Sachs Group, Inc., The, | | | | | | | | | | | | |
5.950%, 01/18/18 | | | | | | | 2,400,000 | | | | 2,797,675 | |
6.150%, 04/01/18 | | | | | | | 2,000,000 | | | | 2,344,822 | |
HSBC Bank PLC, 2.000%, 01/19/14 (a)3 | | | | | | | 800,000 | | | | 807,055 | |
HSBC Holdings PLC, | | | | | | | | | | | | |
6.500%, 05/02/36 | | | | | | | 800,000 | | | | 982,706 | |
6.500%, 09/15/37 | | | | | | | 900,000 | | | | 1,108,741 | |
The accompanying notes are an integral part of these financial statements.
9
Managers PIMCO Bond Fund
Schedule of Portfolio Investments (continued)
| | | | | | | | | | | | |
| | | | | | Principal Amount | | | Value | |
| | | | | | | | | | | | |
Financials - 13.2% (continued) | | | | | | | | | | | | |
International Lease Finance Corp., | | | | | | | | | | | | |
5.750%, 05/15/16 | | | | | | $ | 300,000 | | | $ | 318,266 | |
5.875%, 05/01/13 | | | | | | | 400,000 | | | | 410,500 | |
6.375%, 03/25/13 | | | | | | | 400,000 | | | | 408,500 | |
6.750%, 09/01/16 (a) | | | | | | | 800,000 | | | | 908,000 | |
MTN, 5.250%, 01/10/13 | | | | | | | 400,000 | | | | 404,500 | |
Intesa Sanpaolo S.p.A, 2.831%, 02/24/14 (11/26/12) (a)1,3 | | | | | | | 1,700,000 | | | | 1,676,868 | |
JPMorgan Chase & Co., | | | | | | | | | | | | |
6.000%, 01/15/18 | | | | | | | 1,500,000 | | | | 1,787,226 | |
EMTN, 0.475%, 09/26/13 (12/27/12)1 | | | EUR | | | | 200,000 | | | | 259,577 | |
JPMorgan Chase Bank, NA, | | | | | | | | | | | | |
0.729%, 06/13/16 (12/13/12)1 | | | | | | | 1,300,000 | | | | 1,259,487 | |
0.870%, 05/31/174 | | | EUR | | | | 900,000 | | | | 1,117,028 | |
LBG Capital No.1 PLC, | | | | | | | | | | | | |
8.500%, 12/29/494,5 | | | | | | | 400,000 | | | | 368,000 | |
Series 8, 7.869%, 08/25/20 (a)2,3 | | | GBP | | | | 2,300,000 | | | | 3,724,644 | |
Lloyds TSB Bank PLC, 0.660%, 10/29/492,5 | | | EUR | | | | 1,800,000 | | | | 1,873,445 | |
Merrill Lynch & Co., Inc., 6.400%, 08/28/17 | | | | | | | 3,400,000 | | | | 4,013,391 | |
MetLife, Inc., 6.400%, 12/15/36 | | | | | | | 800,000 | | | | 873,622 | |
Morgan Stanley, | | | | | | | | | | | | |
7.300%, 05/13/19 | | | | | | | 200,000 | | | | 240,984 | |
GMTN, 2.937%, 05/14/13 (11/14/12)1 | | | | | | | 1,200,000 | | | | 1,211,807 | |
MTN, 5.950%, 12/28/17 | | | | | | | 1,800,000 | | | | 2,045,002 | |
National Australia Bank, Ltd., 5.350%, 06/12/13 (a) | | | | | | | 1,500,000 | | | | 1,541,565 | |
Nationwide Building Society, 6.250%, 02/25/20 (a)2,3 | | | | | | | 1,800,000 | | | | 2,108,822 | |
Nordea Bank AB, 2.125%, 01/14/14 (a)3 | | | | | | | 400,000 | | | | 405,506 | |
Pacific LifeCorp, 6.000%, 02/10/20 (a) | | | | | | | 400,000 | | | | 443,562 | |
Principal Life Income Funding Trusts, | | | | | | | | | | | | |
MTN, 5.300%, 04/24/13 | | | | | | | 1,500,000 | | | | 1,534,887 | |
MTN, 5.550%, 04/27/15 | | | | | | | 2,300,000 | | | | 2,558,715 | |
Qatari Diar Finance “Q.S.C.”, 3.500%, 07/21/15 | | | | | | | 900,000 | | | | 955,350 | |
Resona Bank, Ltd., 5.850%, 09/15/49 (a)3,4,5 | | | | | | | 500,000 | | | | 540,571 | |
Royal Bank of Scotland Group PLC, The, | | | | | | | | | | | | |
4.875%, 08/25/14 (a) | | | | | | | 200,000 | | | | 212,438 | |
6.990%, 10/29/49 (a)3,4,5 | | | | | | | 2,600,000 | | | | 2,385,500 | |
Santander SA US Debt Unipersonal, 2.991%, 10/07/13 (a)3 | | | | | | | 3,700,000 | | | | 3,709,861 | |
SLM Corp., MTN, 6.250%, 01/25/16 | | | | | | | 300,000 | | | | 325,515 | |
Springleaf Finance Corp., 4.125%, 11/29/132 | | | EUR | | | | 3,900,000 | | | | 5,004,407 | |
State Bank of India, 4.500%, 07/27/15 (a) | | | | | | | 2,900,000 | | | | 3,047,248 | |
State Street Capital Trust IV, 1.389%, 06/15/37 (12/17/12)1 | | | | | | | 300,000 | | | | 231,248 | |
Stone Street Trust, 5.902%, 12/15/15 (a) | | | | | | | 2,800,000 | | | | 2,937,068 | |
Sumitomo Mitsui Banking Corp., 1.950%, 01/14/14 (a)3 | | | | | | | 1,000,000 | | | | 1,012,890 | |
Temasek Financial I, Ltd., 4.300%, 10/25/19 (a) | | | | | | | 900,000 | | | | 1,030,791 | |
The accompanying notes are an integral part of these financial statements.
10
Managers PIMCO Bond Fund
Schedule of Portfolio Investments (continued)
| | | | | | | | |
| | | Principal Amount | | | Value | |
| | | | | | | | |
Financials - 13.2% (continued) | | | | | | | | |
UBS AG, | | | | | | | | |
5.750%, 04/25/18 | | $ | 1,300,000 | | | $ | 1,535,964 | |
5.875%, 12/20/17 | | | 1,400,000 | | | | 1,658,472 | |
Series FRN, 1.313%, 01/28/14 (01/28/13)1 | | | 300,000 | | | | 300,807 | |
USB Capital, 3.500%, 10/29/494,5 | | | 300,000 | | | | 269,664 | |
Vnesheconombank Via VEB Finance PLC, 5.450%, 11/22/17 (a)2 | | | 400,000 | | | | 438,468 | |
Wachovia Corp., MTN, 0.503%, 08/01/13 (02/01/13)1 | | | 300,000 | | | | 300,232 | |
Wells Fargo & Co., Series K, 7.980%, 03/29/494,5 | | | 21,200,000 | | | | 25,148,500 | |
Westpac Banking Corp., 3.585%, 08/14/14 (a)3 | | | 3,800,000 | | | | 4,002,719 | |
Total Financials | | | | | | | 191,733,452 | |
Industrials - 4.5% | | | | | | | | |
Altria Group, Inc., 9.700%, 11/10/18 | | | 406,000 | | | | 579,753 | |
Amgen, Inc., | | | | | | | | |
3.625%, 05/15/22 | | | 800,000 | | | | 861,682 | |
6.150%, 06/01/18 | | | 4,900,000 | | | | 5,990,279 | |
AT&T, Inc., 6.300%, 01/15/38 | | | 1,200,000 | | | | 1,612,440 | |
Caterpillar, Inc., 0.605%, 05/21/13 (11/21/12)1 | | | 4,200,000 | | | | 4,207,825 | |
Comcast Corp., 6.450%, 03/15/37 | | | 600,000 | | | | 792,556 | |
Corp Nacional del Cobre de Chile, | | | | | | | | |
6.150%, 10/24/36 (a) | | | 300,000 | | | | 393,680 | |
7.500%, 01/15/19 (a) | | | 1,500,000 | | | | 1,956,768 | |
Gazprom OAO Via Gaz Capital SA, | | | | | | | | |
5.092%, 11/29/15 (a) | | | 200,000 | | | | 214,760 | |
6.212%, 11/22/16 (a) | | | 400,000 | | | | 446,688 | |
8.625%, 04/28/34 | | | 5,500,000 | | | | 7,913,950 | |
Gerdau Trade, Inc., 5.750%, 01/30/21 (a) | | | 400,000 | | | | 448,200 | |
Hewlett-Packard Co., 0.711%, 05/24/13 (11/26/12)1 | | | 4,900,000 | | | | 4,895,879 | |
International Business Machines Corp., 5.700%, 09/14/17 | | | 2,000,000 | | | | 2,440,402 | |
Noble Group, Ltd., 4.875%, 08/05/15 (a) | | | 1,000,000 | | | | 1,053,000 | |
Novatek OAO via Finance, Ltd., 5.326%, 02/03/16 (a) | | | 400,000 | | | | 431,568 | |
Odebrecht Drilling VIII/IX, Ltd., 6.350%, 06/30/21 (a)2 | | | 388,000 | | | | 449,110 | |
Peabody Energy Corp., 7.875%, 11/01/26 | | | 700,000 | | | | 752,500 | |
Petrobras International Finance Co., | | | | | | | | |
3.875%, 01/27/16 | | | 3,300,000 | | | | 3,522,206 | |
5.875%, 03/01/18 | | | 2,300,000 | | | | 2,659,467 | |
Petroleos Mexicanos, | | | | | | | | |
5.500%, 06/27/44 | | | 300,000 | | | | 327,750 | |
8.000%, 05/03/19 | | | 5,100,000 | | | | 6,706,500 | |
Qtel International Finance, Ltd., 4.750%, 02/16/21 (a) | | | 200,000 | | | | 225,800 | |
Ras Laffan Liquefied Natural Gas Co., Ltd., 5.298%, 09/30/20 (a) | | | 717,750 | | | | 812,852 | |
Rohm & Haas Co., 6.000%, 09/15/17 | | | 1,100,000 | | | | 1,317,490 | |
The accompanying notes are an integral part of these financial statements.
11
Managers PIMCO Bond Fund
Schedule of Portfolio Investments (continued)
| | | | | | | | | | | | |
| | | | | | Principal Amount | | | Value | |
| | | | | | | | | | | | |
Industrials - 4.5% (continued) | | | | | | | | | | | | |
Sydney Airport Finance Co., Proprietary Ltd., 5.125%, 02/22/21 (a) | | | | | | $ | 300,000 | | | $ | 333,449 | |
Tennessee Gas Pipeline Co., 7.000%, 10/15/28 | | | | | | | 6,145,000 | | | | 8,453,535 | |
Time Warner, Inc., 5.875%, 11/15/16 | | | | | | | 1,200,000 | | | | 1,421,496 | |
UAL 2009-1 Pass Through Trust, 10.400%, 11/01/16 | | | | | | | 364,022 | | | | 418,188 | |
UnitedHealth Group, Inc., 4.875%, 02/15/13 | | | | | | | 1,600,000 | | | | 1,619,030 | |
Vale Overseas, Ltd., | | | | | | | | | | | | |
6.250%, 01/23/17 | | | | | | | 500,000 | | | | 582,835 | |
6.875%, 11/21/36 | | | | | | | 500,000 | | | | 617,936 | |
Total Industrials | | | | | | | | | | | 64,459,574 | |
Utilities - 0.5% | | | | | | | | | | | | |
AES Corp., The, 7.375%, 07/01/21 | | | | | | | 200,000 | | | | 224,500 | |
Enel Finance International NV, 6.800%, 09/15/37 (a)3 | | | | | | | 1,800,000 | | | | 1,895,029 | |
ENN Energy Holdings, Ltd., 6.000%, 05/13/21 (a) | | | | | | | 200,000 | | | | 233,184 | |
Entergy Corp., 3.625%, 09/15/15 | | | | | | | 2,200,000 | | | | 2,323,757 | |
Majapahit Holding, B.V., 7.750%, 01/20/20 | | | | | | | 700,000 | | | | 883,750 | |
NRG Energy, Inc., 8.250%, 09/01/20 | | | | | | | 1,500,000 | | | | 1,661,250 | |
Tokyo Electric Power Co., Inc., The, | | | | | | | | | | | | |
1.500%, 05/30/14 | | | JPY | | | | 1,000,000 | | | | 12,276 | |
1.850%, 07/28/14 | | | JPY | | | | 7,000,000 | | | | 86,371 | |
Total Utilities | | | | | | | | | | | 7,320,117 | |
Total Corporate Bonds and Notes (cost $234,543,895) | | | | | | | | | | | 263,513,143 | |
Foreign Government and Agency Obligations - 10.8% | | | | | | | | | | | | |
Banco do Brasil SA, | | | | | | | | | | | | |
Bonds, 5.875%, 01/19/23 (a) | | | | | | | 200,000 | | | | 221,500 | |
Notes, Series YCD, 0.430%, 06/28/136 | | | | | | | 10,000,000 | | | | 9,971,420 | |
Banco Nacional de Desenvolvimento Economico e Social Notes, 4.125%, 09/15/17 (a) | | | EUR | | | | 400,000 | | | | 555,397 | |
Brazil Notas do Tesouro Nacional, Series F, | | | | | | | | | | | | |
Bonds, 10.000%, 01/01/21 | | | BRL | | | | 1,100 | | | | 5,897 | |
Notes, 10.000%, 01/01/14 | | | BRL | | | | 9,000 | | | | 46,979 | |
Notes, 10.000%, 01/01/17 | | | BRL | | | | 182,000 | | | | 973,313 | |
British Columbia Bonds, Province of, | | | | | | | | | | | | |
3.250%, 12/18/21 | | | CAD | | | | 200,000 | | | | 212,494 | |
4.300%, 06/18/42 | | | CAD | | | | 300,000 | | | | 355,672 | |
Canada Housing Trust Bonds, | | | | | | | | | | | | |
2.650%, 03/15/22 (a) | | | CAD | | | | 200,000 | | | | 207,211 | |
3.800%, 06/15/21 (a) | | | CAD | | | | 600,000 | | | | 678,728 | |
Export-Import Bank of Korea, The, | | | | | | | | | | | | |
Bonds, 4.000%, 01/29/21 | | | | | | | 400,000 | | | | 440,579 | |
Notes, 5.125%, 06/29/20 | | | | | | | 700,000 | | | | 823,470 | |
Notes, 8.125%, 01/21/14 | | | | | | | 1,000,000 | | | | 1,084,406 | |
The accompanying notes are an integral part of these financial statements.
12
Managers PIMCO Bond Fund
Schedule of Portfolio Investments (continued)
| | | | | | | | | | | | |
| | | | | | Principal Amount | | | Value | |
| | | | | | | | | | | | |
Foreign Government and Agency Obligations - 10.8% (continued) | | | | | | | | | | | | |
Italy Buoni Poliennali Del Tesoro, | | | | | | | | | | | | |
Bonds, 3.750%, 08/01/15 | | | EUR | | | $ | 300,000 | | | $ | 398,717 | |
Bonds, Series CPI, 2.100%, 09/15/21 | | | EUR | | | | 957,078 | | | | 1,131,729 | |
Notes, 2.250%, 11/01/13 | | | EUR | | | | 19,400,000 | | | | 25,284,497 | |
Notes, 2.500%, 03/01/15 | | | EUR | | | | 1,600,000 | | | | 2,071,543 | |
Notes, 3.000%, 04/01/14 | | | EUR | | | | 200,000 | | | | 262,609 | |
Notes, 3.500%, 06/01/14 | | | EUR | | | | 400,000 | | | | 529,275 | |
Notes, 4.250%, 07/01/14 | | | EUR | | | | 200,000 | | | | 267,824 | |
Notes, 4.500%, 07/15/15 | | | EUR | | | | 500,000 | | | | 676,483 | |
Italy Certificati di Credito del Tesoro, Notes, 1.641%, 09/30/136 | | | EUR | | | | 2,700,000 | | | | 3,450,598 | |
Korea Development Bank Notes, The, 4.375%, 08/10/15 | | | | | | | 3,500,000 | | | | 3,796,464 | |
Korea Finance Corp. Notes, 3.250%, 09/20/16 | | | | | | | 800,000 | | | | 848,297 | |
Korea Housing Finance Corp. Notes, 4.125%, 12/15/15 (a) | | | | | | | 500,000 | | | | 541,689 | |
Mexican Fixed Rate, | | | | | | | | | | | | |
Bonds, 10.000%, 12/05/24 | | | MXN | | | | 900,000 | | | | 95,118 | |
Notes, 6.000%, 06/18/15 | | | MXN | | | | 10,000,000 | | | | 783,143 | |
Notes, 7.750%, 12/14/17 | | | MXN | | | | 11,200,000 | | | | 956,158 | |
Ontario Bonds, Province of, | | | | | | | | | | | | |
4.000%, 06/02/21 | | | CAD | | | | 4,000,000 | | | | 4,445,237 | |
4.200%, 06/02/20 | | | CAD | | | | 2,500,000 | | | | 2,817,146 | |
4.300%, 03/08/17 | | | CAD | | | | 1,300,000 | | | | 1,438,766 | |
4.400%, 06/02/19 | | | CAD | | | | 1,400,000 | | | | 1,587,779 | |
4.700%, 06/02/37 | | | CAD | | | | 2,600,000 | | | | 3,140,410 | |
MTN, 4.600%, 06/02/39 | | | CAD | | | | 700,000 | | | | 841,815 | |
MTN, 5.500%, 06/02/18 | | | CAD | | | | 400,000 | | | | 472,362 | |
Ontario Notes, Province of, | | | | | | | | | | | | |
1.650%, 09/27/19 | | | | | | | 1,300,000 | | | | 1,302,633 | |
3.000%, 07/16/18 | | | | | | | 400,000 | | | | 437,616 | |
3.150%, 06/02/22 | | | CAD | | | | 3,800,000 | | | | 3,938,531 | |
4.200%, 03/08/18 | | | CAD | | | | 200,000 | | | | 222,825 | |
Panama Government Bonds, 7.250%, 03/15/15 | | | | | | | 200,000 | | | | 228,500 | |
Quebec Bonds, Province of, | | | | | | | | | | | | |
2.750%, 08/25/21 | | | | | | | 900,000 | �� | | | 942,313 | |
3.500%, 07/29/20 | | | | | | | 500,000 | | | | 557,702 | |
3.500%, 12/01/22 | | | CAD | | | | 7,900,000 | | | | 8,328,479 | |
4.250%, 12/01/21 | | | CAD | | | | 5,100,000 | | | | 5,722,315 | |
4.250%, 12/01/43 | | | CAD | | | | 1,200,000 | | | | 1,358,863 | |
4.500%, 12/01/16 | | | CAD | | | | 100,000 | | | | 110,947 | |
4.500%, 12/01/17 | | | CAD | | | | 100,000 | | | | 112,380 | |
MTN, 4.500%, 12/01/18 | | | CAD | | | | 500,000 | | | | 566,373 | |
Spain Government Bonds, | | | | | | | | | | | | |
3.150%, 01/31/16 | | | EUR | | | | 5,100,000 | | | | 6,504,629 | |
4.400%, 01/31/15 | | | EUR | | | | 900,000 | | | | 1,200,108 | |
Spain Government Notes, 4.250%, 10/31/16 | | | EUR | | | | 14,900,000 | | | | 19,444,817 | |
The accompanying notes are an integral part of these financial statements.
13
Managers PIMCO Bond Fund
Schedule of Portfolio Investments (continued)
| | | | | | | | | | | | |
| | | | | | Principal Amount | | | Value | |
| | | | | | | | | | | | |
Foreign Government and Agency Obligations - 10.8% (continued) | | | | | | | | | | | | |
Spain Letras del Tesoro, | | | | | | | | | | | | |
Notes, 2.319%, 09/20/136 | | | EUR | | | $ | 22,500,000 | | | $ | 28,570,468 | |
Notes, 2.743%, 04/16/146 | | | EUR | | | | 3,900,000 | | | | 4,853,739 | |
Total Foreign Government and Agency Obligations (cost $152,317,688) | | | | | | | | | | | 155,817,963 | |
Mortgage-Backed Securities - 4.2% | | | | | | | | | | | | |
American Home Mortgage Investment Trust, Series 2004-4, Class 4A, 2.641%, 02/25/45 (12/25/12)1 | | | | | | | 508,693 | | | | 491,673 | |
Arran Residential Mortgages Funding PLC, | | | | | | | | | | | | |
Series 2010-1A, Class A1B, 1.545%, 05/16/47 (11/16/12) (a)1 | | | EUR | | | | 138,738 | | | | 180,038 | |
Series 2010-1A, Class A2B, 1.745%, 05/16/47 (11/16/12) (a)1 | | | EUR | | | | 2,000,000 | | | | 2,643,550 | |
Bank of America Funding Corp., Series 2005-D, Class A1, 2.620%, 05/25/35 (12/25/12)1 | | | | | | | 673,559 | | | | 701,777 | |
Bear Stearns Adjustable Rate Mortgage Trust, | | | | | | | | | | | | |
Series 2000-2, Class A, 2.857%, 11/25/30 (12/25/12)1 | | | | | | | 16,547 | | | | 16,984 | |
Series 2002-11, Class 1A1, 4.591%, 02/25/33 (12/25/12)1 | | | | | | | 26,454 | | | | 26,768 | |
Series 2003-1, Class 6A1, 2.643%, 04/25/33 (12/25/12)1 | | | | | | | 246,696 | | | | 250,002 | |
Series 2005-2, Class A1, 2.570%, 03/25/35 (12/25/12)1 | | | | | | | 7,315,301 | | | | 7,405,019 | |
Series 2005-2, Class A2, 3.078%, 03/25/35 (12/25/12)1 | | | | | | | 4,144,310 | | | | 4,185,022 | |
Series 2005-5, Class A2, 2.320%, 08/25/35 (12/25/12)1 | | | | | | | 9,957,198 | | | | 9,750,556 | |
Series 2005-12, Class 13A, 5.378%, 02/25/36 (12/25/12)1 | | | | | | | 238,757 | | | | 229,703 | |
Bear Stearns Alt-A Trust, | | | | | | | | | | | | |
Series 2005-4, Class 23A1, 2.916%, 05/25/35 (12/25/12)1 | | | | | | | 1,287,550 | | | | 1,160,010 | |
Series 2005-7, Class 22A1, 3.007%, 09/25/35 (12/25/12)1 | | | | | | | 625,175 | | | | 506,573 | |
Bear Stearns Commercial Mortgage Securities, Series 2007-PW18, Class A4, 5.700%, 06/11/50 | | | | | | | 2,800,000 | | | | 3,352,796 | |
Citigroup Mortgage Loan Trust, Inc., | | | | | | | | | | | | |
Series 2005-6, Class A1, 2.230%, 09/25/35 (12/25/12)1 | | | | | | | 5,338,497 | | | | 5,309,792 | |
Series 2005-11, Class A2A, 2.570%, 10/25/35 (12/25/12)1 | | | | | | | 299,413 | | | | 277,248 | |
Countrywide Alternative Loan Trust, Series 2007-OA7, Class A1A, 0.391%, 05/25/47 (11/26/12)1 | | | | | | | 1,199,862 | | | | 824,636 | |
Countrywide Home Loans Mortgage Pass Through Trust, Series 2005-HYB9, Class 3A2A, 2.783%, 02/20/36 (12/20/12)1 | | | | | | | 349,895 | | | | 298,244 | |
European Loan Conduit, Series 25X, Class A, 0.495%, 05/15/19 (11/15/12)1 | | | EUR | | | | 101,213 | | | | 125,940 | |
Greenpoint Mortgage Funding Trust, | | | | | | | | | | | | |
Series 2006-AR6, Class A1A, 0.291%, 10/25/46 (11/26/12)1 | | | | | | | 487 | | | | 487 | |
Series 2006-AR8, Class 1A1A, 0.291%, 01/25/47 (11/26/12)1 | | | | | | | 28 | | | | 28 | |
GS Mortgage Securities Corp., Series 2007-EOP, Class A1, 1.103%, 03/06/20 (11/06/12) (a)1 | | | | | | | 1,473,949 | | | | 1,473,921 | |
GSR Mortgage Loan Trust, Series 2005-AR7, Class 6A1, 5.136%, 11/25/35 (12/25/12)1 | | | | | | | 963,577 | | | | 969,580 | |
Indymac Index Mortgage Loan Trust, Series 2005-AR31, Class 1A1, 2.517%, 01/25/36 (12/25/12)1 | | | | | | | 1,439,414 | | | | 1,042,030 | |
JPMorgan Chase Commercial Mortgage Securities Corp., | | | | | | | | | | | | |
Series 2006-LDP9, Class A3, 5.336%, 05/15/47 | | | | | | | 2,100,000 | | | | 2,423,575 | |
Series 2010-C2, Class A3, 4.070%, 11/15/43 (a) | | | | | | | 2,000,000 | | | | 2,267,893 | |
JPMorgan Mortgage Trust, Series 2005-A1, Class 6T1, 4.985%, 02/25/35 (12/25/12)1 | | | | | | | 340,699 | | | | 347,662 | |
Merrill Lynch Mortgage Investors, Inc., Series 2005-A10, Class A, 0.421%, 02/25/36 (11/25/12)1 | | | | | | | 766,179 | | | | 651,185 | |
MLCC Mortgage Investors, Inc., Series 2005-3, Class 4A, 0.461%, 11/25/35 (11/25/12)1 | | | | | | | 153,429 | | | | 140,586 | |
Morgan Stanley Capital I, Series 2007-IQ16, Class A4, 5.809%, 12/12/49 | | | | | | | 3,000,000 | | | | 3,592,329 | |
Opera Finance PLC, Series CSC3, Class A, 0.758%, 04/25/17 (01/25/13)1 | | | GBP | | | | 2,103,948 | | | | 3,293,414 | |
The accompanying notes are an integral part of these financial statements.
14
Managers PIMCO Bond Fund
Schedule of Portfolio Investments (continued)
| | | | | | | | |
| | | Principal Amount | | | Value | |
| | | | | | | | |
Mortgage-Backed Securities - 4.2% (continued) | | | | | | | | |
Prime Mortgage Trust, | | | | | | | | |
Series 2004-CL1, Class 1A2, 0.611%, 02/25/34 (11/25/12)1 | | $ | 130,999 | | | $ | 119,064 | |
Series 2004-CL1, Class 2A2, 0.611%, 02/25/19 (11/25/12)1 | | | 6,678 | | | | 6,546 | |
Structured Asset Mortgage Investments, Inc., | | | | | | | | |
Series 2002-AR3, Class A1, 0.872%, 09/19/32 (11/19/12)1 | | | 315,575 | | | | 302,081 | |
Series 2005-AR5, Class A2, 0.462%, 07/19/35 (11/19/12)1 | | | 824,521 | | | | 802,539 | |
Structured Asset Securities Corp., | | | | | | | | |
Series 2001-21A, Class 1A1, 2.603%, 01/25/32 (12/25/12)1 | | | 17,590 | | | | 14,801 | |
Series 2006-11, Class A1, 2.858%, 10/28/35 (12/28/12) (a)1 | | | 519,283 | | | | 471,052 | |
Wachovia Bank Commercial Mortgage Trust, | | | | | | | | |
Series 2006-WL7A, Class A1, 0.304%, 09/15/21 (11/15/12) (a)1 | | | 2,278,831 | | | | 2,215,053 | |
Series 2007-WHL8, 0.294%, 06/15/20 (11/15/12) (a)1 | | | 1,720,272 | | | | 1,655,396 | |
WaMu Mortgage Pass-Through Certificates, | | | | | | | | |
Series 2002-AR17, Class 1A, 1.354%, 11/25/42 (12/25/12)1 | | | 130,849 | | | | 122,024 | |
Series 2005-AR13, Class A1A1, 0.501%, 10/25/45 (11/25/12)1 | | | 275,059 | | | | 250,043 | |
Washington Mutual MSC Mortgage Pass-Through Certificates, Series 2002-AR1, 1.954%, 02/25/31 (12/25/12)1 | | | 3,272 | | | | 3,278 | |
Wells Fargo Mortgage Backed Securities Trust, Series 2006-AR2, Class 2A1, 2.629%, 03/25/364 | | | 1,413,548 | | | | 1,377,253 | |
Total Mortgage-Backed Securities (cost $60,251,476) | | | | | | | 61,278,151 | |
Municipal Bonds - 4.4% | | | | | | | | |
American Municipal Power, Inc., Combined Hydroelectric Projects Revenue, Taxable Build America, Series 2010 B, 8.084%, 02/15/50 | | | 1,000,000 | | | | 1,445,020 | |
Buckeye Tobacco Settlement Financing Authority, Tobacco Settlement Asset-Backed Bonds, Series 2007 A-2, 5.875%, 06/01/30 | | | 1,000,000 | | | | 868,110 | |
California Infrastructure & Economic Development Bank Revenue, UCSF Neurosciences Building 19A, Taxable Build America, Series 2010 B, 6.486%, 05/15/49 | | | 1,000,000 | | | | 1,230,760 | |
California State General Obligation, 5.650%, 04/01/394 | | | 1,200,000 | | | | 1,224,696 | |
California State General Obligation, 7.500%, 04/01/34 | | | 1,300,000 | | | | 1,753,440 | |
California State General Obligation, 7.550%, 04/01/39 | | | 1,300,000 | | | | 1,814,514 | |
California State General Obligation, 7.600%, 11/01/40 | | | 1,000,000 | | | | 1,412,790 | |
California State General Obligation, 7.950%, 03/01/36 | | | 1,100,000 | | | | 1,318,460 | |
California State University Systemwide Revenue, Series 2009 A, 5.250%, 11/01/38 | | | 500,000 | | | | 559,940 | |
California State University Systemwide Revenue, Taxable Build America, Series 2010 B, 6.434%, 11/01/30 | | | 700,000 | | | | 836,017 | |
Calleguas-Las Virgenes, CA Public Financing Authority Water Revenue, Calleguas Municipal Water District, Taxable Build America, Series 2010 B, 5.944%, 07/01/40 | | | 1,000,000 | | | | 1,246,600 | |
Chicago, IL Transit Authority Sales Tax Receipts Revenue, Series 2016, 5.250%, 12/01/36 | | | 2,200,000 | | | | 2,528,350 | |
Chicago, IL Transit Authority, Sales & Transfer Tax Receipts Revenue, Pension Funding, Series 2008 A, 6.300%, 12/01/21 | | | 100,000 | | | | 113,646 | |
Chicago, IL Transit Authority, Sales & Transfer Tax Receipts Revenue, Pension Funding, Series 2008 A, 6.899%, 12/01/40 | | | 1,600,000 | | | | 1,919,664 | |
Chicago, IL Transit Authority, Sales & Transfer Tax Receipts Revenue, Retiree Health Care, Series 2008 B, 6.300%, 12/01/21 | | | 200,000 | | | | 227,292 | |
Chicago, IL Transit Authority, Sales & Transfer Tax Receipts Revenue, Retiree Health Care, Series 2008 B, 6.899%, 12/01/40 | | | 1,700,000 | | | | 2,039,643 | |
Chicago, IL Transit Authority, Sales & Transfer Tax Receipts Revenue, Taxable Build America, Series 2010 B, 6.200%, 12/01/40 | | | 1,000,000 | | | | 1,133,680 | |
The accompanying notes are an integral part of these financial statements.
15
Managers PIMCO Bond Fund
Schedule of Portfolio Investments (continued)
| | | | | | | | |
| | | Principal Amount | | | Value | |
| | | | | | | | |
Municipal Bonds - 4.4% (continued) | | | | | | | | |
Clark County, NV Airport Revenue, Taxable Direct Payment Build America, Series C, 6.820%, 07/01/45 | | $ | 800,000 | | | $ | 1,136,472 | |
Illinois Municipal Electric Agency Power Supply System Revenue, Series C, 6.832%, 02/01/35 | | | 800,000 | | | | 961,792 | |
Irvine Ranch, CA District Joint Powers Agency Water Revenue, 2.388%, 03/15/14 | | | 2,800,000 | | | | 2,807,000 | |
Los Angeles County Public Works Financing Authority Revenue, Multiple Capital Projects I, Series 2010 B Taxable Build America, 7.488%, 08/01/33 | | | 200,000 | | | | 255,372 | |
Los Angeles County Public Works Financing Authority Revenue, Multiple Capital Projects I, Series 2010 B, Taxable Build America, 7.618%, 08/01/40 | | | 300,000 | | | | 399,117 | |
Los Angeles, CA Unified School District General Obligation, Series A-1, 4.500%, 07/01/22 (AGM Insured)7 | | | 3,600,000 | | | | 4,078,620 | |
Los Angeles, CA Unified School District General Obligation, Taxable Build America, Series 2010 RY, 6.758%, 07/01/34 | | | 4,000,000 | | | | 5,317,960 | |
Los Angeles, CA Wastewater System Revenue, Series 2010 A, 5.713%, 06/01/39 | | | 1,000,000 | | | | 1,175,290 | |
New Jersey State Turnpike Authority Revenue, Series 2010 A, 7.102%, 01/01/41 | | | 800,000 | | | | 1,153,480 | |
New York City Municipal Finance Authority Revenue, Water and Sewer System General Resolution, Taxable Bond America, Series 2010 GG, 5.724%, 06/15/42 | | | 5,000,000 | | | | 6,593,100 | |
New York City Municipal Finance Authority Revenue, Water and Sewer System Second General Resolution, Taxable Bond America, Series 2011 CC, 5.882%, 06/15/44 | | | 1,100,000 | | | | 1,504,096 | |
New York City Municipal Finance Authority Revenue, Water and Sewer System Second General Resolution, Taxable Bond America, Series 2011 CC, 6.282%, 06/15/42 | | | 1,100,000 | | | | 1,295,712 | |
New York Liberty Development Corp., Liberty Revenue, 4 World Trade Center Project, 5.750%, 11/15/51 | | | 1,100,000 | | | | 1,297,615 | |
New York Metropolitan Transportation Authority Transit Revenue, Series E, 5.000%, 11/15/42 | | | 2,700,000 | | | | 3,044,871 | |
New York State Dormitory Authority, 5.000%, 12/15/30 | | | 2,000,000 | | | | 2,418,380 | |
North Carolina Turnpike Authority State Annual Appropriation Revenue, Triangle Expressway System, Taxable Build America, Series 2009 B, 6.700%, 01/01/39 | | | 900,000 | | | | 1,047,366 | |
Public Power Generation Agency Revenue, Whelan Energy Center Unit 2, Taxable Build America, Series 2009 A, 7.242%, 01/01/41 | | | 1,200,000 | | | | 1,432,656 | |
San Francisco Bay Area Toll Authority Subordinate Toll Bridge Revenue, Series 2010 S-1, 7.043%, 04/01/50 | | | 900,000 | | | | 1,292,976 | |
Texas State Transportation Commission Mobility Fund, Series 2005 A, 4.750%, 04/01/35 | | | 700,000 | | | | 750,106 | |
Truckee Meadows Water Authority Revenue, Series 2005 A, 5.000%, 07/01/36 (NATL-RE)7 | | | 200,000 | | | | 211,546 | |
University of California General Revenue, Taxable Build America, Series 2009 R, 6.270%, 05/15/31 | | | 2,500,000 | | | | 2,894,650 | |
University of California Medical Center Regents Revenue, Series 2010 H, 6.548%, 05/15/48 | | | 300,000 | | | | 399,528 | |
University of California Medical Center Regents Revenue, Series 2010 H, 6.398%, 05/15/31 | | | 200,000 | | | | 246,874 | |
Total Municipal Bonds (cost $52,629,207) | | | | | | | 63,387,201 | |
| | |
| | | Shares | | | | |
Municipal Closed-End Bond Funds - 0.5% | | | | | | | | |
Dreyfus Municipal Income, Inc. | | | 37,500 | | | | 423,000 | |
DWS Municipal Income Trust2 | | | 55,000 | | | | 811,800 | |
Invesco Van Kampen Advantage Municipal Income Trust II | | | 61,796 | | | | 852,785 | |
Invesco Van Kampen Trust for Investment Grade Municipals2 | | | 55,000 | | | | 871,750 | |
MFS Municipal Income Trust2 | | | 53,800 | | | | 420,178 | |
Nuveen Performance Plus Municipal Fund2 | | | 55,000 | | | | 904,200 | |
Nuveen Premium Income Municipal Fund II | | | 55,000 | | | | 855,800 | |
Nuveen Premium Income Municipal Fund IV | | | 55,000 | | | | 796,400 | |
Nuveen Quality Income Municipal Fund2 | | | 55,000 | | | | 869,550 | |
Total Municipal Closed-End Bond Funds (cost $6,147,228) | | | | | | | 6,805,463 | |
The accompanying notes are an integral part of these financial statements.
16
Managers PIMCO Bond Fund
Schedule of Portfolio Investments (continued)
| | | | | | | | |
| | | Shares | | | Value | |
| | | | | | | | |
Preferred Stocks - 0.3% | | | | | | | | |
DG Funding Trust, 0.704% (Financials) (a)3 | | | | | | | | |
(cost $6,037,773) | | | 573 | | | $ | 4,203,621 | |
| | |
| | | Principal Amount | | | | |
U.S. Government and Agency Obligations - 78.4% | | | | | | | | |
Federal Home Loan Mortgage Corporation - 7.4% | | | | | | | | |
FHLMC, | | | | | | | | |
1.000%, 03/08/17 to 09/29/172 | | $ | 29,400,000 | | | | 29,714,208 | |
1.250%, 08/01/19 to 10/02/19 | | | 1,400,000 | | | | 1,401,095 | |
1.750%, 05/30/192 | | | 2,100,000 | | | | 2,173,975 | |
2.375%, 01/13/22 | | | 900,000 | | | | 945,169 | |
2.533%, 07/01/30(01/15/13)1 | | | 1,952 | | | | 2,032 | |
2.985%, 11/01/34(01/15/13)1 | | | 1,360,920 | | | | 1,466,563 | |
3.750%, 03/27/192 | | | 1,200,000 | | | | 1,394,282 | |
5.000%, 02/16/17 | | | 2,000,000 | | | | 2,366,012 | |
5.098%, 08/01/35(01/15/13)1 | | | 94,168 | | | | 101,541 | |
5.500%, 08/23/17 | | | 100,000 | | | | 122,163 | |
FHLMC Gold Pool, | | | | | | | | |
4.000%, TBA | | | 20,000,000 | | | | 21,341,406 | |
4.500%, 06/01/40 to 07/01/40 | | | 4,881,782 | | | | 5,253,294 | |
4.500%, TBA | | | 1,000,000 | | | | 1,071,875 | |
5.500%, 11/01/26 to 05/01/40 | | | 17,021,326 | | | | 18,547,115 | |
6.000%, 02/01/16 to 02/01/38 | | | 12,378,960 | | | | 13,626,130 | |
6.500%, 01/01/26 | | | 15,550 | | | | 18,067 | |
FHLMC REMICS, | | | | | | | | |
0.364%, 07/15/19 to 08/15/19 (11/15/12)1 | | | 2,318,914 | | | | 2,322,003 | |
0.514%, 05/15/36(11/15/12)1 | | | 928,517 | | | | 931,659 | |
0.714%, 09/15/30(11/15/12)1 | | | 30,563 | | | | 30,834 | |
6.500%, 08/15/31 | | | 3,932,940 | | | | 4,472,437 | |
7.000%, 11/15/20 | | | 14,780 | | | | 16,009 | |
7.500%, 08/15/30 | | | 209,764 | | | | 248,866 | |
FHLMC Structured Pass Through Securities, 1.348%, 02/25/45 (12/25/12)1 | | | 130,042 | | | | 126,359 | |
Total Federal Home Loan Mortgage Corporation | | | | | | | 107,693,094 | |
Federal National Mortgage Association - 53.2% | | | | | | | | |
FNMA, | | | | | | | | |
0.875%, 08/28/17 to 12/20/172 | | | 5,900,000 | | | | 5,923,552 | |
1.250%, 01/30/172 | | | 4,600,000 | | | | 4,716,918 | |
1.348%, 07/01/44(12/25/12)1 | | | 166,002 | | | | 169,052 | |
2.310%, 08/01/22 | | | 1,800,000 | | | | 1,851,019 | |
2.500%, TBA | | | 11,000,000 | | | | 11,515,625 | |
2.669%, 09/01/35(12/25/12)1 | | | 962,475 | | | | 1,033,138 | |
2.840%, 06/01/35(12/25/12)1 | | | 2,152,034 | | | | 2,307,302 | |
2.870%, 09/01/27 | | | 1,100,000 | | | | 1,109,249 | |
3.000%, 10/01/42 | | | 4,988,521 | | | | 5,238,016 | |
The accompanying notes are an integral part of these financial statements.
17
Managers PIMCO Bond Fund
Schedule of Portfolio Investments (continued)
| | | | | | | | |
| | | Principal Amount | | | Value | |
| | | | | | | | |
Federal National Mortgage Association - 53.2% (continued) | | | | | | | | |
FNMA, | | | | | | | | |
3.000%, TBA | | $ | 37,000,000 | | | $ | 38,908,752 | |
3.330%, 11/01/21 | | | 98,494 | | | | 108,052 | |
3.500%, 09/01/25 to 03/01/41 | | | 5,709,202 | | | | 6,082,015 | |
3.500%, TBA | | | 108,000,000 | | | | 115,070,620 | |
3.525%, 05/01/36(12/25/12)1 | | | 953,000 | | | | 984,391 | |
3.910%, 05/01/36(12/25/12)1 | | | 482,764 | | | | 514,789 | |
4.000%, 08/01/13 to 03/01/42 | | | 82,877,646 | | | | 88,982,740 | |
4.000%, TBA | | | 145,000,000 | | | | 155,214,996 | |
4.500%, 05/01/18 to 05/01/42 | | | 81,140,544 | | | | 87,789,055 | |
4.500%, TBA | | | 70,000,000 | | | | 75,534,375 | |
5.000%, 02/13/17 to 03/01/35 | | | 3,758,999 | | | | 4,265,717 | |
5.000%, TBA | | | 72,000,000 | | | | 78,558,768 | |
5.013%, 05/01/35(12/25/12)1 | | | 127,133 | | | | 136,931 | |
5.375%, 06/12/17 | | | 1,300,000 | | | | 1,571,395 | |
5.500%, 11/01/17 to 01/01/39 | | | 10,596,464 | | | | 11,692,861 | |
5.500%, TBA | | | 44,000,000 | | | | 48,248,759 | |
6.000%, 05/01/16 to 08/01/39 | | | 14,035,958 | | | | 15,570,607 | |
6.000%, TBA | | | 1,000,000 | | | | 1,108,438 | |
6.500%, 11/01/35 | | | 160,066 | | | | 189,938 | |
FNMA REMICS, | | | | | | | | |
0.271%, 12/25/36(11/25/12)1 | | | 320,169 | | | | 317,934 | |
0.521%, 04/25/37(11/25/12)1 | | | 717,984 | | | | 721,526 | |
0.661%, 09/25/35(11/25/12)1 | | | 1,411,685 | | | | 1,421,168 | |
2.693%, 05/25/35(12/25/12)1 | | | 165,570 | | | | 175,730 | |
5.000%, 04/25/33 | | | 1,281,317 | | | | 1,422,431 | |
7.200%, 05/25/23 | | | 432,118 | | | | 493,796 | |
FNMA Whole Loan, 6.202%, 12/25/424 | | | 242,479 | | | | 297,760 | |
Total Federal National Mortgage Association | | | | | | | 769,247,415 | |
Government National Mortgage Association - 0.2% | | | | | | | | |
GNMA, | | | | | | | | |
1.625%, 03/20/24 to 11/20/29 (12/20/12)1 | | | 292,342 | | | | 304,015 | |
2.000%, 04/20/21(12/20/12)1 | | | 5,660 | | | | 5,904 | |
6.500%, 06/20/28 | | | 537,755 | | | | 597,167 | |
6.750%, 10/16/404 | | | 2,246,615 | | | | 2,615,865 | |
Total Government National Mortgage Association | | | | | | | 3,522,951 | |
U.S. Government Obligations - 17.6% | | | | | | | | |
U.S. Treasury Bonds, | | | | | | | | |
1.750%, 05/15/22 | | | 4,300,000 | | | | 4,343,000 | |
3.000%, 05/15/428,9 | | | 2,100,000 | | | | 2,169,563 | |
U.S. Treasury Inflation Indexed Bonds, | | | | | | | | |
0.125%, 07/15/22 | | | 4,006,520 | | | | 4,391,523 | |
0.625%, 07/15/21 | | | 6,745,068 | | | | 7,724,155 | |
0.750%, 02/15/42 | | | 5,912,346 | | | | 6,605,663 | |
The accompanying notes are an integral part of these financial statements.
18
Managers PIMCO Bond Fund
Schedule of Portfolio Investments (continued)
| | | | | | | | | | |
| | | | | Principal Amount | | | Value | |
| | | | | | | | | | |
U.S. Government Obligations - 17.6% (continued) | | | | | | | | | | |
1.125%, 01/15/21 | | | | $ | 11,582,560 | | | $ | 13,711,759 | |
2.125%, 02/15/408,9 | | | | | 17,583,885 | | | | 26,221,969 | |
3.625%, 04/15/28 | | | | | 2,278,592 | | | | 3,666,754 | |
U.S. Treasury Inflation Linked Notes, 2.375%, 01/15/25 | | | | | 5,132,274 | | | | 7,030,014 | |
U.S. Treasury Inflation Protected Securities, | | | | | | | | | | |
1.750%, 01/15/28 | | | | | 659,688 | | | | 866,253 | |
2.000%, 01/15/26 | | | | | 8,819,952 | | | | 11,725,024 | |
2.375%, 01/15/27 | | | | | 13,363,506 | | | | 18,673,415 | |
2.500%, 01/15/29 | | | | | 3,647,656 | | | | 5,280,267 | |
3.875%, 04/15/29 | | | | | 1,961,596 | | | | 3,300,232 | |
U.S. Treasury Notes, | | | | | | | | | | |
0.250%, 09/15/15 to 10/15/15 | | | | | 11,000,000 | | | | 10,960,578 | |
0.500%, 07/31/17 | | | | | 31,100,000 | | | | 30,844,887 | |
0.750%, 06/30/17 to 10/31/178,9 | | | | | 16,600,000 | | | | 16,665,477 | |
0.875%, 07/31/19 | | | | | 5,700,000 | | | | 5,622,514 | |
1.000%, 08/31/19 to 09/30/19 | | | | | 11,600,000 | | | | 11,520,190 | |
1.125%, 05/31/19 | | | | | 2,100,000 | | | | 2,110,664 | |
1.250%, 10/31/15 to 10/31/19 | | | | | 29,100,000 | | | | 29,766,275 | |
1.625%, 08/15/22 | | | | | 21,700,000 | | | | 21,584,730 | |
2.125%, 12/31/15 | | | | | 8,900,000 | | | | 9,374,904 | |
3.375%, 11/15/19 | | | | | 300,000 | | | | 345,727 | |
Total U.S. Government Obligations | | | | | | | | | 254,505,537 | |
Total U.S. Government and Agency Obligations (cost $1,115,411,951) | | | | | | | | | 1,134,968,997 | |
Short-Term Investments - 32.1% | | | | | | | | | | |
Certificates of Deposit - 0.1% | | | | | | | | | | |
Itau Unibanco SA, 0.949%, 11/05/126 | | | | | 1,100,000 | | | | 1,099,857 | |
Commercial Paper - 5.7% | | | | | | | | | | |
Dominion Resources, 0.427%, 01/15/136 | | | | | 15,000,000 | | | | 14,986,668 | |
Duke Energy Corp., 0.404%, 01/22/136 | | | | | 17,000,000 | | | | 16,984,401 | |
Ford Motor Credit Co. LLC, 0.876%, 11/15/126 | | | | | 8,000,000 | | | | 7,997,120 | |
Ford Motor Credit Co. LLC, 0.868%, 11/16/126 | | | | | 13,500,000 | | | | 13,497,112 | |
Nissan Motor Acceptence Corp., 0.290%, 11/19/126 | | | | | 14,300,000 | | | | 14,297,834 | |
Northeast Utilities, 0.300%, 11/16/126 | | | | | 14,400,000 | | | | 14,398,099 | |
Total Commercial Paper | | | | | | | | | 82,161,234 | |
Japan Treasury Bills - 2.2% | | | | | | | | | | |
Japan Treasury Discount Bills, 0.000%, 11/05/126 | | JPY | | | 1,970,000,000 | | | | 24,677,440 | |
Japan Treasury Discount Bills, 0.121%, 11/19/126 | | JPY | | | 560,000,000 | | | | 7,014,647 | |
Total Japan Treasury Bills | | | | | | | | | 31,692,087 | |
The accompanying notes are an integral part of these financial statements.
19
Managers PIMCO Bond Fund
Schedule of Portfolio Investments (continued)
| | | | | | | | | | | | |
| | | | | | Principal Amount | | | Value | |
| | | | | | | | | | | | |
Mexico Treasury Bills - 2.8% | | | | | | | | | | | | |
Mexico Treasury Bills, 4.321%, 11/01/126 | | | MXN | | | $ | 1,772,000,000 | | | $ | 13,531,292 | |
Mexico Treasury Bills, 1.159%, 11/15/126 | | | MXN | | | | 2,144,980,000 | | | | 16,351,910 | |
Mexico Treasury Bills, 3.263%, 11/29/126 | | | MXN | | | | 548,000,000 | | | | 4,170,559 | |
Mexico Treasury Bills, 5.529%, 12/13/126 | | | MXN | | | | 509,300,000 | | | | 3,869,536 | |
Mexico Treasury Bills, 4.173%, 02/07/136 | | | MXN | | | | 412,000,000 | | | | 3,107,935 | |
Total Mexico Treasury Bills | | | | | | | | | | | 41,031,232 | |
Repurchase Agreements - 19.1% | | | | | | | | | | | | |
Barclays Capital Inc., dated 10/31/12, due 11/01/12, 0.30%, total to be received $4,900,041, (collateralized by $5,063,866 U.S. Treasury Notes, 3.00%, 05/15/42) | | | | | | | 4,900,000 | | | | 4,900,000 | |
Citigroup Global Markets, Inc., dated 10/31/12, due 11/02/12, 0.35%, total to be received $61,101,188, (collateralized by $62,438,916 U.S. Treasury Notes, 1.00%, 08/31/19) | | | | | | | 61,100,000 | | | | 61,100,000 | |
J.P. Morgan Securities LLC., dated 10/31/12, due 11/01/12, 0.30%, total to be received $13,200,110, (collateralized by $13,492,477 U.S. Treasury Notes, 0.625%, 02/28/13) | | | | | | | 13,200,000 | | | | 13,200,000 | |
RBS Securities Inc., dated 10/31/12, due 11/01/12, 0.25%, total to be received $15,000,104, (collateralized by $15,361,669 U.S. Treasury Notes, 3.375%, 11/15/19) | | | | | | | 15,000,000 | | | | 15,000,000 | |
TD Securities (USA) LLC, dated 10/31/12, due 11/01/12, 0.30%, total to be received $98,100,818, (collateralized by $100,175,275 U.S. Treasury Notes, 0.625%, 07/15/14) | | | | | | | 98,100,000 | | | | 98,100,000 | |
TD Securities (USA) LLC, dated 10/31/12, due 11/05/12, 0.33%, total to be received $84,603,878, (collateralized by $86,379,421 U.S. Treasury Notes, 2.375%, 10/31/14) | | | | | | | 84,600,000 | | | | 84,600,000 | |
Total Repurchase Agreements | | | | | | | | | | | 276,900,000 | |
U.S. Treasury Bills - 0.1% | | | | | | | | | | | | |
U.S. Treasury Bills, 0.109%, 01/31/136,9 | | | | | | | 30,000 | | | | 29,992 | |
U.S. Treasury Bills, 0.129%, 03/07/136,8 | | | | | | | 21,000 | | | | 20,991 | |
U.S. Treasury Bills, 0.129%, 03/14/136,9 | | | | | | | 1,020,000 | | | | 1,019,520 | |
U.S. Treasury Bills, 0.134%, 04/04/136,8 | | | | | | | 20,000 | | | | 19,989 | |
Total U.S. Treasury Bills | | | | | | | | | | | 1,090,492 | |
| | | |
| | | | | | Shares | | | | |
Other Investment Companies - 2.1%10 | | | | | | | | | | | | |
BNY Mellon Overnight Government Fund, 0.23%11 | | | | | | | 28,098,157 | | | | 28,098,157 | |
Dreyfus Cash Management Fund, Institutional Class Shares, 0.07% | | | | | | | 2,410,085 | | | | 2,410,085 | |
Total Other Investment Companies | | | | | | | | | | | 30,508,242 | |
Total Short-Term Investments (cost $464,505,490) | | | | | | | | | | | 464,483,144 | |
Total Investments - 151.2% (cost $2,123,003,513) | | | | | | | | | | | 2,187,012,242 | |
Other Assets, less Liabilities - (51.2)% | | | | | | | | | | | (740,340,999 | ) |
Net Assets - 100.0% | | | | | | | | | | $ | 1,446,671,243 | |
The accompanying notes are an integral part of these financial statements.
20
Notes to Schedule of Portfolio Investments
The following footnotes and abbreviations should be read in conjunction with the Schedule of Portfolio Investments previously presented in this report.
Based on the approximate cost of investments of $2,123,187,068 for federal income tax purposes at October 31, 2012, the aggregate gross unrealized appreciation and depreciation were $180,531,178 and $116,706,004, respectively, resulting in net unrealized appreciation of investments of $63,825,174.
| | (a) | Security exempt from registration under Rule 144A of the Securities Act of 1933. This security may be resold in transactions exempt from registration, normally to qualified buyers. At October 31, 2012, the value of these securities amounted to $89,685,562, or 6.2% of net assets. |
| | 1 | Floating Rate Security. The rate listed is as of October 31, 2012. Date in parentheses represents the security’s next coupon rate reset. |
| | 2 | Some or all of these securities, amounting to a market value of $27,218,109, or 1.9% of net assets, were out on loan to various brokers. |
| | 3 | Illiquid Security. A security not readily convertible into cash such as a stock, bond or commodity that is not actively traded and would be difficult to sell in a current sale. The Fund may not invest more than 15% of its net assets in illiquid securities. At October 31, 2012, the value of these securities amounted to $29,305,760, or 2.03% of net assets. |
| | 4 | Variable Rate Security. The rate listed is as of October 31, 2012, and is periodically reset subject to terms and conditions set forth in the debenture. |
| | 5 | Perpetuity Bond. The date shown is the final call date. |
| | 6 | Represents yield to maturity at October 31, 2012. |
| | 7 | Securities in the portfolio backed by insurance of financial institutions and financial guaranty assurance agencies amounted to $4,290,166, or 0.3% of net assets. |
| | 8 | Some or all of this security is held with brokers as collateral for futures contracts, amounting to a market value of $817,446, or less than 0.1% of net assets. |
| | 9 | Collateral segregated with brokers for swap contracts, amounting to a market value of $5,358,108, or 0.4% of net assets. |
| | 10 | Yield shown represents the October 31, 2012, seven-day average yield, which refers to the sum of the previous seven days’ dividends paid, expressed as an annual percentage. |
| | 11 | Collateral received from brokers for securities lending was invested in this short-term investment. |
Investments Definitions and Abbreviations:
| | |
| AGM: | | Assured Guaranty Municipal Corp. |
| EMTN: | | European Medium-Term Note |
| FHLMC: | | Federal Home Loan Mortgage Corp. |
| FNMA: | | Federal National Mortgage Corp. |
| GMTN: | | Global Medium-Term Note |
| GNMA: | | Government National Mortgage Association |
| MTN: | | Medium-Term Note |
| NATL-RE: | | National Public Finance Guarantee Corp. |
| TBA | | To Be Announced |
Currency Abbreviations have been used throughout the portfolio to indicate amounts shown in currencies other than the U.S. dollar (USD):
| | |
| BRL: | | Brazilian Real |
| CAD: | | Canadian Dollar |
| EUR: | | Euro |
| GBP: | | British Pound |
| JPY: | | Japanese Yen |
| MXN: | | Mexican Peso |
The accompanying notes are an integral part of these financial statements.
21
Notes to Schedule of Portfolio Investments (continued)
The following tables summarize the inputs used to value the Fund’s net assets by the above fair value hierarchy levels as of October 31, 2012: (See Note 1 (a) in the Notes to the Financial Statements.)
| | | | | | | | | | | | | | | | |
| | | Quoted Prices
in Active
Markets for Identical
Investments
Level 1 | | | Significant
Other
Observable
Inputs
Level 2 | | | Significant
Unobservable
Inputs
Level 3 | | | Total | |
Investments in Securities | | | | | | | | | | | | | | | | |
Asset-Backed Securities | | | — | | | $ | 31,369,559 | | | | — | | | $ | 31,369,559 | |
Bank Loan Obligations | | | — | | | | 1,185,000 | | | | — | | | | 1,185,000 | |
Corporate Bonds and Notes† | | | — | | | | 263,513,143 | | | | — | | | | 263,513,143 | |
Foreign Government and Agency Obligations | | | — | | | | 155,817,963 | | | | — | | | | 155,817,963 | |
Mortgage-Backed Securities | | | — | | | | 61,278,151 | | | | — | | | | 61,278,151 | |
Municipal Bonds | | | — | | | | 63,387,201 | | | | — | | | | 63,387,201 | |
Municipal Closed-End Bond Funds | | $ | 6,805,463 | | | | — | | | | — | | | | 6,805,463 | |
Preferred Stocks | | | — | | | | 4,203,621 | | | | — | | | | 4,203,621 | |
U.S. Government and Agency Obligations† | | | — | | | | 1,134,968,997 | | | | — | | | | 1,134,968,997 | |
Short-Term Investments | | | | | | | | | | | | | | | | |
Certificates of Deposit | | | — | | | | 1,099,857 | | | | — | | | | 1,099,857 | |
Commercial Paper | | | — | | | | 82,161,234 | | | | — | | | | 82,161,234 | |
Japan Treasury Bills | | | — | | | | 31,692,087 | | | | — | | | | 31,692,087 | |
Mexico Treasury Bills | | | — | | | | 41,031,232 | | | | — | | | | 41,031,232 | |
Repurchase Agreements | | | — | | | | 276,900,000 | | | | — | | | | 276,900,000 | |
U.S. Treasury Bills | | | — | | | | 1,090,492 | | | | — | | | | 1,090,492 | |
Other Investment Companies | | | 30,508,242 | | | | — | | | | — | | | | 30,508,242 | |
| | | | | | | | | | | | | | | | |
Total Investments in Securities | | $ | 37,313,705 | | | $ | 2,149,698,537 | | | | — | | | $ | 2,187,012,242 | |
| | | | | | | | | | | | | | | | |
TBA Sale Commitments | | | — | | | $ | (1,077,578 | ) | | | — | | | $ | (1,077,578 | ) |
| | | | | | | | | | | | | | | | |
Financial Derivative Instruments-Assets†† | | | | | | | | | | | | | | | | |
Credit Contracts | | | — | | | $ | 3,415,515 | | | | — | | | $ | 3,415,515 | |
Foreign Exchange Contracts | | | — | | | | 2,232,859 | | | | — | | | | 2,232,859 | |
Interest Rate Contracts | | $ | 449,473 | | | | 969,124 | | | | — | | | | 1,418,597 | |
| | | | | | | | | | | | | | | | |
| | | 449,473 | | | | 6,617,498 | | | | — | | | | 7,066,971 | |
| | | | | | | | | | | | | | | | |
Financial Derivative Instruments-Liabilities†† | | | | | | | | | | | | | | | | |
Credit Contracts | | | — | | | | (677,439 | ) | | | — | | | | (677,439 | ) |
Foreign Exchange Contracts | | | — | | | | (3,000,708 | ) | | | — | | | | (3,000,708 | ) |
Interest Rate Contracts | | | (26,874 | ) | | | (1,115,671 | ) | | | — | | | | (1,142,545 | ) |
| | | | | | | | | | | | | | | | |
| | | (26,874 | ) | | | (4,793,818 | ) | | | — | | | | (4,820,692 | ) |
| | | | | | | | | | | | | | | | |
Total Financial Derivative Instruments | | $ | 422,599 | | | $ | 1,823,680 | | | | — | | | $ | 2,246,279 | |
| | | | | | | | | | | | | | | | |
| † | All corporate bonds and notes and U.S. government and agency obligations held in the Fund are level 2 securities. For a detailed breakout of the corporate bonds and notes and U.S. government and agency obligations by major industry or agency classification, please refer to the Schedule of Portfolio Investments. |
| †† | Derivative instruments, such as futures, options, forwards and swap contracts, are not reflected in the Schedule of Portfolio Investments. Futures, forwards and swap contracts are valued at the unrealized appreciation/depreciation of the instrument and options are shown at value. |
As of October 31, 2012, the Fund had no transfers between levels from the beginning of the reporting period.
The accompanying notes are an integral part of these financial statements.
22
Notes to Schedule of Portfolio Investments (continued)
The following schedule is the fair value of derivative instruments at October 31, 2012:
| | | | | | | | | | | | |
| | | Asset Derivatives | | | Liability Derivatives | |
Derivatives not accounted for as hedging
instruments | | Statement of Assets and Liabilities
Location | | Fair Value | | | Statement of Assets and Liabilities
Location | | Fair Value | |
Credit contracts | | Unrealized appreciation on swaps | | $ | 3,415,515 | | | Unrealized depreciation on swaps | | $ | 677,439 | |
Interest rate contracts | | Unrealized appreciation on swaps | | | 248,706 | | | Unrealized depreciation on swaps | | | 1,101,497 | |
Interest rate contracts | | — | | | — | | | Options written | | | 245,129 | |
Interest rate contracts | | Variation margin receivable on
financial derivative instruments1 | | | 1,583,848 | | | Variation margin payable on financial derivative instruments1 | | | 849,008 | |
Foreign exchange contracts | | Unrealized appreciation on foreign currency contracts | | | 2,232,859 | | | Unrealized depreciation on foreign currency contracts | | | 3,000,708 | |
| | | | | | | | | | | | |
| | Total | | $ | 7,480,928 | | | | | $ | 5,873,781 | |
| | | | | | | | | | | | |
| 1 | Only current day’s variation margin is reported within the Statement of Assets and Liabilities. The variation margin is included in the open futures cumulative appreciation/ (depreciation) of $422,599 and open centrally cleared swaps cumulative appreciation/(depreciation) of $(1,540,579) as reported in the Notes to Schedule of Investments. |
For the year ended October 31, 2012, the effect of derivative instruments on the Statement of Operations and the amount of realized gain/(loss) on derivatives recognized in income were as follows:
| | | | | | | | | | | | | | | | | | | | |
Derivatives not accounted for as hedging instruments | | Futures | | | Forward Currency
Contracts | | | Options | | | Swaps | | | Total | |
Credit contracts | | | — | | | | — | | | | — | | | $ | (1,170,068 | ) | | $ | (1,170,068 | ) |
Foreign exchange contracts | | | — | | | $ | (3,871,033 | ) | | | — | | | | — | | | | (3,871,033 | ) |
Interest rate contracts | | $ | 4,581,639 | | | | — | | | $ | 5,866,619 | | | | 11,428,411 | | | | 21,876,669 | |
| | | | | | | | | | | | | | | | | | | | |
Total | | $ | 4,581,639 | | | $ | (3,871,033 | ) | | $ | 5,866,619 | | | $ | 10,258,343 | | | $ | 16,835,568 | |
| | | | | | | | | | | | | | | | | | | | |
The change in unrealized gain/(loss) on derivatives recognized in income were as follows:
| | | | | | | | | | | | | | | | | | | | |
Derivatives not accounted for as hedging instruments | | Futures | | | Forward Currency
Contracts | | | Options | | | Swaps | | | Total | |
Credit contracts | | | — | | | | — | | | $ | (28,368 | ) | | $ | 3,330,224 | | | $ | 3,301,856 | |
Equity contracts | | | — | | | | — | | | | 12,630 | | | | — | | | | 12,630 | |
Foreign exchange contracts | | | — | | | $ | 3,567,843 | | | | — | | | | — | | | | 3,567,843 | |
Interest rate contracts | | $ | (4,831,241 | ) | | | — | | | | (2,181,861 | ) | | | (7,087,724 | ) | | | (14,100,826 | ) |
| | | | | | | | | | | | | | | | | | | | |
Total | | $ | (4,831,241 | ) | | $ | 3,567,843 | | | $ | (2,197,599 | ) | | $ | (3,757,500 | ) | | $ | (7,218,497 | ) |
| | | | | | | | | | | | | | | | | | | | |
At October 31, 2012, the Fund had the following TBA sale commitments:
(See Note 1(k) in the Notes to the Financial Statements.)
| | | | | | |
Principal Amount | | Security | | Current Liability | |
$1,000,000 | | FNMA, 4.500%, 11/01/18 | | $ | 1,077,578 | |
The accompanying notes are an integral part of these financial statements.
23
Notes to Schedule of Portfolio Investments (continued)
At October 31, 2012, the Fund had the following futures contracts:
(See Note 9 in the Notes to the Financial Statements.)
| | | | | | | | | | | | | | |
Type | | Number of Contracts | | Position | | | Expiration Date | | | Unrealized Gain/(Loss) | |
3-Month Euribor | | 20 | | | Long | | | | 12/15/14 | | | $ | 4,091 | |
90-Day Eurodollar | | 1,346 | | | Long | | | | 03/16/15 to 09/19/16 | | | | 445,382 | |
Euro-Bund 10-Year | | 21 | | | Short | | | | 12/06/12 | | | | (26,874 | ) |
| | | | | | | | | | | | | | |
| | | | | | | | | Total | | | $ | 422,599 | |
| | | | | | | | | | | | | | |
At October 31, 2012, the Fund had the following swap contracts:
(See Note 10 in the Notes to the Financial Statements.)
| | | | | | | | | | | | | | | | | | | | | | | | | | |
Pay/Receive
Floating Rate | | Floating Rate Index | | Fixed Rate | | | Counterparty | | Maturity | | | Currency | | Notional Amount | | | Net Premiums
Paid/(Received) | | | Unrealized
Gain/(Loss) | |
| | Interest Rate Swaps | | | | | | | | | | | | | | | | | | | | | | | | |
Pay | | 28-Day MXN TIIE | | | 5.50 | % | | BRC | | | 09/13/17 | | | MXN | | | 33,000,000 | | | $ | (20,675 | ) | | $ | 29,434 | |
Pay | | 28-Day MXN TIIE | | | 5.50 | % | | MS | | | 09/13/17 | | | MXN | | | 11,000,000 | | | | (6,323 | ) | | | 9,243 | |
Pay | | 28-Day MXN TIIE | | | 5.50 | % | | MS | | | 09/02/22 | | | MXN | | | 100,000 | | | | (151 | ) | | | (100 | ) |
Pay | | 28-Day MXN TIIE | | | 5.60 | % | | BRC | | | 09/06/16 | | | MXN | | | 61,600,000 | | | | 22,678 | | | | 24,021 | |
Pay | | 28-Day MXN TIIE | | | 6.35 | % | | MS | | | 06/02/21 | | | MXN | | | 4,000,000 | | | | 826 | | | | 10,020 | |
Pay | | 3 Month USD LIBOR Rate† | | | 2.75 | % | | BRC | | | 06/20/42 | | | USD | | | 6,700,000 | | | | 183,338 | | | | (408,679 | ) |
Pay | | 3 Month USD LIBOR Rate† | | | 2.75 | % | | MS | | | 06/20/42 | | | USD | | | 10,100,000 | | | | 126,250 | | | | (616,068 | ) |
Receive | | 1-Year-OIS-USD-FEDERAL
FUNDS RATE | | | 1.00 | % | | GS | | | 10/15/17 | | | USD | | | 65,000,000 | | | | (33,475 | ) | | | (30,485 | ) |
Receive | | 1-Year-OIS-USD-FEDERAL
FUNDS RATE | | | 1.00 | % | | MS | | | 10/15/17 | | | USD | | | 31,400,000 | | | | (37,945 | ) | | | 7,047 | |
Receive | | 3 Month USD LIBOR Rate† | | | 1.50 | % | | UBS | | | 03/18/16 | | | USD | | | 24,100,000 | | | | (729 | ) | | | 168,941 | |
Receive | | 3 Month USD LIBOR Rate† | | | 2.50 | % | | GS | | | 02/19/42 | | | USD | | | 11,900,000 | | | | 342,720 | | | | (46,165 | ) |
| | | | | | | | | | | | | | | | | | | | | | | | | | |
| | | | | | | | | | | | | | | | | Total | | | $ | 576,514 | | | $ | (852,791 | ) |
| | | | | | | | | | | | | | | | | | | | | | | | | | |
| | | | | | | | | | | | | | | | | | | | | | | | |
Pay/Receive Reference Entity | | Reference Entity | | Fixed Rate | | | Counterparty | | Maturity | | Currency | | Notional Amount | | | Net Premiums
Paid/(Received) | | | Unrealized
Gain/(Loss) | |
| | Credit Default Swaps-Buy Protection | | | | | | | | | | | | | | | | | | | | | | |
Receive | | CDX.HY.17 5-Year Index† | | | 5.00 | % | | BNP | | 12/20/16 | | USD | | $ | 1,176,000 | | | $ | 36,858 | | | $ | (52,754 | ) |
Receive | | CDX.HY.17 5-Year Index† | | | 5.00 | % | | CITI | | 12/20/16 | | USD | | | 1,862,000 | | | | 30,257 | | | | (83,526 | ) |
Receive | | CDX.HY.17 5-Year Index† | | | 5.00 | % | | CS | | 12/20/16 | | USD | | | 1,748,000 | | | | 51,348 | | | | (78,412 | ) |
Receive | | CDX.HY.17 5-Year Index† | | | 5.00 | % | | MS | | 12/20/16 | | USD | | | 686,000 | | | | 13,720 | | | | (30,773 | ) |
Receive | | CDX.HY.18 5-Year Index† | | | 5.00 | % | | BNP | | 06/20/17 | | USD | | | 3,850,000 | | | | 162,781 | | | | (178,818 | ) |
Receive | | CDX.HY.18 5-Year Index† | | | 5.00 | % | | BOA | | 06/20/17 | | USD | | | 1,000,000 | | | | 31,250 | | | | (46,446 | ) |
Receive | | CDX.HY.18 5-Year Index† | | | 5.00 | % | | CS | | 06/20/17 | | USD | | | 2,600,000 | | | | 93,125 | | | | (120,760 | ) |
Receive | | CDX.HY.18 5-Year Index† | | | 5.00 | % | | DUB | | 06/20/17 | | USD | | | 14,500 | | | | 366 | | | | (673 | ) |
The accompanying notes are an integral part of these financial statements.
24
Notes to Schedule of Portfolio Investments (continued)
| | | | | | | | | | | | | | | | | | | | | | | | | | |
Pay/Receive Reference Entity | | Reference Entity | | Fixed Rate | | | Counterparty | | Maturity | | | Currency | | Notional Amount | | | Net Premiums
Paid/(Received) | | | Unrealized
Gain/(Loss) | |
Receive | | CDX.HY.18 5-Year Index† | | | 5.00 | % | | MS | | | 06/20/17 | | | USD | | $ | 1,000,000 | | | $ | 41,750 | | | $ | (46,446 | ) |
| | | | | | | | | | | | | | | | | | | | | | | | | | |
| | | | | | | | | | | | | | | | | Total | | | $ | 461,455 | | | $ | (638,608 | ) |
| | | | | | | | | | | | | | | | | | | | | | | | | | |
| | | | | | | | | | | | | | | | | | | | | | | | | | | | | | |
Pay/Receive
Reference Entity | | Reference Entity | | Fixed Rate | | | Counterparty | | Maturity | | | Rating | | Currency | | | Notional Amount | | | Net Premiums
Paid/(Received) | | | Unrealized
Gain/(Loss) | |
| | Credit Default Swaps-Sell Protection†† | | | | | | | | | | | | | | | | | | | | | | | | | | | | |
Pay | | Arcelormittal | | | 1.00 | % | | CS | | | 06/20/16 | | | BB+ | | | USD | | | $ | 500,000 | | | $ | (17,797 | ) | | | $(38,831 | ) |
Pay | | Australia Government | | | 1.00 | % | | MS | | | 09/20/17 | | | AAA | | | USD | | | | 1,600,000 | | | | 19,627 | | | | 23,767 | |
Pay | | Berkshire Hathaway Finance | | | 1.00 | % | | BRC | | | 06/20/17 | | | AA+ | | | USD | | | | 1,200,000 | | | | (28,482 | ) | | | 21,360 | |
Pay | | Berkshire Hathaway Finance | | | 1.00 | % | | CS | | | 06/20/17 | | | AA+ | | | USD | | | | 900,000 | | | | (20,602 | ) | | | 15,261 | |
Pay | | Brazil Federative Republic Bond | | | 1.00 | % | | BRC | | | 12/20/12 | | | BBB | | | USD | | | | 6,700,000 | | | | 1,261 | | | | 13,322 | |
Pay | | Brazil Federative Republic Bond | | | 1.00 | % | | CITI | | | 06/20/16 | | | BBB | | | USD | | | | 7,300,000 | | | | (15,583 | ) | | | 70,307 | |
Pay | | Brazil Federative Republic Bond | | | 1.00 | % | | CS | | | 06/20/15 | | | BBB | | | USD | | | | 2,200,000 | | | | (28,720 | ) | | | 51,628 | |
Pay | | Brazil Federative Republic Bond | | | 1.00 | % | | DUB | | | 06/20/16 | | | BBB | | | USD | | | | 1,400,000 | | | | (3,364 | ) | | | 13,859 | |
Pay | | Brazil Federative Republic Bond | | | 1.00 | % | | JPM | | | 09/20/15 | | | BBB | | | USD | | | | 1,400,000 | | | | (8,978 | ) | | | 23,159 | |
Pay | | Brazil Federative Republic Bond | | | 1.00 | % | | JPM | | | 09/20/16 | | | BBB | | | USD | | | | 500,000 | | | | (2,302 | ) | | | 5,465 | |
Pay | | Brazil Federative Republic Bond | | | 1.00 | % | | UBS | | | 09/20/15 | | | BBB | | | USD | | | | 1,000,000 | | | | (5,436 | ) | | | 15,566 | |
Pay | | Brazil Federative Republic Bond | | | 1.52 | % | | MS | | | 01/20/17 | | | BBB | | | USD | | | | 3,000,000 | | | | — | | | | 87,267 | |
Pay | | Brazil Federative Republic Bond | | | 1.95 | % | | MS | | | 08/20/16 | | | BBB | | | USD | | | | 3,500,000 | | | | — | | | | 158,120 | |
Pay | | CDX.EM.12 Index | | | 5.00 | % | | DUB | | | 12/20/14 | | | N/A | | | USD | | | | 1,000,000 | | | | 42,309 | | | | 25,657 | |
Pay | | CDX.EM.13 Index | | | 5.00 | % | | BRC | | | 06/20/15 | | | N/A | | | USD | | | | 2,700,000 | | | | 112,188 | | | | 122,755 | |
Pay | | CDX.EM.13 Index | | | 5.00 | % | | CS | | | 06/20/15 | | | N/A | | | USD | | | | 1,000,000 | | | | 60,198 | | | | 26,957 | |
Pay | | CDX.EM.13 Index | | | 5.00 | % | | DUB | | | 06/20/15 | | | N/A | | | USD | | | | 5,800,000 | | | | 376,933 | | | | 128,565 | |
Pay | | CDX.EM.13 Index | | | 5.00 | % | | JPM | | | 06/20/15 | | | N/A | | | USD | | | | 4,600,000 | | | | 286,904 | | | | 114,008 | |
Pay | | CDX.EM.14 Index | | | 5.00 | % | | BRC | | | 12/20/15 | | | N/A | | | USD | | | | 300,000 | | | | 14,300 | | | | 15,134 | |
Pay | | CDX.HY.18 10-Year Index | | | 1.00 | % | | CITI | | | 06/20/22 | | | N/A | | | USD | | | | 1,800,000 | | | | (134,116 | ) | | | 31,663 | |
Pay | | CDX.HY.18 5-Year Index | | | 1.00 | % | | MS | | | 06/20/17 | | | N/A | | | USD | | | | 1,800,000 | | | | (54,788 | ) | | | 19,599 | |
Pay | | China Government | | | 1.00 | % | | CITI | | | 06/20/16 | | | AA- | | | USD | | | | 1,900,000 | | | | 14,742 | | | | 27,844 | |
Pay | | China Government | | | 1.00 | % | | CITI | | | 09/20/17 | | | AA- | | | USD | | | | 200,000 | | | | (2,568 | ) | | | 6,225 | |
Pay | | China Government | | | 1.00 | % | | DUB | | | 06/20/16 | | | AA- | | | USD | | | | 500,000 | | | | 3,453 | | | | 7,754 | |
Pay | | China Government | | | 1.00 | % | | DUB | | | 09/20/16 | | | AA- | | | USD | | | | 400,000 | | | | 1,637 | | | | 7,273 | |
Pay | | China Government | | | 1.00 | % | | GS | | | 09/20/16 | | | AA- | | | USD | | | | 100,000 | | | | 405 | | | | 1,823 | |
Pay | | China Government | | | 1.00 | % | | JPM | | | 09/20/16 | | | AA- | | | USD | | | | 500,000 | | | | 1,983 | | | | 9,155 | |
The accompanying notes are an integral part of these financial statements.
25
Notes to Schedule of Portfolio Investments (continued)
| | | | | | | | | | | | | | | | | | | | | | | | | | | | |
Pay/Receive Reference Entity | | Reference Entity | | Fixed Rate | | | Counterparty | | Maturity | | Rating | | Currency | | | Notional Amount | | | Net Premiums
Paid/(Received) | | | Unrealized
Gain/(Loss) | |
Pay | | China Government | | | 1.00 | % | | JPM | | 09/20/16 | | AA- | | | USD | | | $ | 300,000 | | | $ | 1,099 | | | $ | 5,555 | |
Pay | | China Government | | | 1.00 | % | | JRC | | 06/20/16 | | AA- | | | USD | | | | 800,000 | | | | 6,221 | | | | 11,710 | |
Pay | | China Government | | | 1.00 | % | | MS | | 06/20/16 | | AA- | | | USD | | | | 10,300,000 | | | | (243,489 | ) | | | 474,349 | |
Pay | | China Government | | | 1.00 | % | | MS | | 09/20/16 | | AA- | | | USD | | | | 100,000 | | | | 405 | | | | 1,851 | |
Pay | | China Government | | | 1.00 | % | | MS | | 09/20/17 | | AA- | | | USD | | | | 200,000 | | | | (2,749 | ) | | | 6,406 | |
Pay | | China Government | | | 1.00 | % | | RBS | | 06/20/15 | | AA- | | | USD | | | | 1,900,000 | | | | 16,355 | | | | 22,797 | |
Pay | | China Government | | | 1.00 | % | | RBS | | 06/20/16 | | AA- | | | USD | | | | 700,000 | | | | 5,321 | | | | 10,369 | |
Pay | | Export-Import Bank of A.S. | | | 1.00 | % | | DUB | | 06/20/17 | | AA- | | | USD | | | | 300,000 | | | | (11,696 | ) | | | 13,449 | |
Pay | | French Republic Government | | | 0.25 | % | | BRC | | 09/20/16 | | AA+ | | | USD | | | | 200,000 | | | | (9,329 | ) | | | 8,152 | |
Pay | | French Republic Government | | | 0.25 | % | | GS | | 06/20/16 | | AA+ | | | USD | | | | 3,000,000 | | | | (55,246 | ) | | | 44,772 | |
Pay | | French Republic Government | | | 0.25 | % | | RBS | | 12/20/15 | | AA+ | | | USD | | | | 1,000,000 | | | | (12,024 | ) | | | 13,348 | |
Pay | | French Republic Government | | | 0.25 | % | | RBS | | 03/20/16 | | AA+ | | | USD | | | | 1,000,000 | | | | (22,135 | ) | | | 21,048 | |
Pay | | French Republic Government | | | 0.25 | % | | UBS | | 09/20/16 | | AA+ | | | USD | | | | 1,000,000 | | | | (37,685 | ) | | | 31,801 | |
Pay | | General Electric Capital Corp. | | | 1.00 | % | | DUB | | 03/20/16 | | AA+ | | | USD | | | | 300,000 | | | | (10,422 | ) | | | 11,099 | |
Pay | | General Electric Capital Corp. | | | 1.00 | % | | MS | | 06/20/16 | | AA+ | | | USD | | | | 700,000 | | | | (1,890 | ) | | | 2,084 | |
Pay | | Japan Government | | | 1.00 | % | | DUB | | 03/20/17 | | AA- | | | USD | | | | 4,100,000 | | | | (25,564 | ) | | | 97,962 | |
Pay | | Japan Government | | | 1.00 | % | | JPM | | 03/20/16 | | AA- | | | USD | | | | 1,000,000 | | | | 5,738 | | | | 14,340 | |
Pay | | Japan Government | | | 1.00 | % | | MS | | 03/20/17 | | AA- | | | USD | | | | 4,000,000 | | | | (23,287 | ) | | | 93,919 | |
Pay | | MetLife, Inc. | | | 1.00 | % | | JPM | | 03/20/16 | | A- | | | USD | | | | 6,400,000 | | | | (100,613 | ) | | | 6,830 | |
Pay | | Mexico Government | | | 1.00 | % | | BRC | | 03/20/15 | | BBB | | | USD | | | | 700,000 | | | | (7,319 | ) | | | 16,421 | |
Pay | | Mexico Government | | | 1.00 | % | | CITI | | 06/20/16 | | BBB | | | USD | | | | 9,800,000 | | | | (1,855 | ) | | | 112,017 | |
Pay | | Mexico Government | | | 1.00 | % | | CS | | 06/20/17 | | BBB | | | USD | | | | 300,000 | | | | (2,600 | ) | | | 4,172 | |
Pay | | Mexico Government | | | 1.00 | % | | DUB | | 03/20/15 | | BBB | | | USD | | | | 1,100,000 | | | | (11,737 | ) | | | 26,040 | |
Pay | | Mexico Government | | | 1.00 | % | | DUB | | 03/20/16 | | BBB | | | USD | | | | 2,400,000 | | | | (11,741 | ) | | | 40,793 | |
Pay | | Mexico Government | | | 1.00 | % | | GS | | 06/20/16 | | BBB | | | USD | | | | 8,400,000 | | | | (218,044 | ) | | | 312,469 | |
Pay | | Mexico Government | | | 1.00 | % | | GS | | 06/20/17 | | BBB | | | USD | | | | 500,000 | | | | (4,537 | ) | | | 7,158 | |
Pay | | Mexico Government | | | 1.00 | % | | JPM | | 09/20/17 | | BBB | | | USD | | | | 4,100,000 | | | | (53,370 | ) | | | 66,202 | |
Pay | | Mexico Government | | | 1.00 | % | | MS | | 09/20/16 | | BBB | | | USD | | | | 600,000 | | | | (2,102 | ) | | | 8,326 | |
Pay | | Mexico Government | | | 1.00 | % | | UBS | | 09/20/15 | | BBB | | | USD | | | | 1,000,000 | | | | (8,127 | ) | | | 21,143 | |
Pay | | Republic of Indonesia | | | 1.00 | % | | MS | | 09/20/16 | | BB+ | | | USD | | | | 2,700,000 | | | | (160,944 | ) | | | 174,544 | |
Pay | | Republic of Indonesia | | | 1.00 | % | | MS | | 06/20/21 | | BB+ | | | USD | | | | 1,000,000 | | | | (138,460 | ) | | | 77,714 | |
Pay | | Republic of Indonesia | | | 1.00 | % | | UBS | | 09/20/16 | | BB+ | | | USD | | | | 300,000 | | | | (3,581 | ) | | | 5,092 | |
The accompanying notes are an integral part of these financial statements.
26
Notes to Schedule of Portfolio Investments (continued)
| | | | | | | | | | | | | | | | | | | | | | | | | | |
Pay/Receive Reference Entity | | Reference Entity | | Fixed Rate | | | Counterparty | | Maturity | | Rating | | Currency | | Notional
Amount | | | Net Premiums
Paid/(Received) | | | Unrealized
Gain/(Loss) | |
Pay | | Republic of Korea | | | 1.00 | % | | DUB | | 06/20/16 | | A+ | | USD | | $ | 400,000 | | | $ | 137 | | | $ | 8,822 | |
Pay | | Republic of Korea | | | 1.00 | % | | DUB | | 06/20/16 | | A+ | | USD | | | 300,000 | | | | 154 | | | | 6,566 | |
Pay | | U.S. Treasury Notes | | | 0.25 | % | | UBS | | 09/20/15 | | AA+ | | EUR | | | 5,000,000 | | | | (40,735 | ) | | | 63,760 | |
Pay | | United Kingdom Gilt | | | 1.00 | % | | CITI | | 12/20/16 | | AAA | | USD | | | 6,500,000 | | | | 20,414 | | | | 212,253 | |
Pay | | United Kingdom Gilt | | | 1.00 | % | | DUB | | 03/20/16 | | AAA | | USD | | | 400,000 | | | | 5,103 | | | | 7,529 | |
Pay | | United Kingdom Gilt | | | 1.00 | % | | GS | | 12/20/16 | | AAA | | USD | | | 4,300,000 | | | | 10,120 | | | | 143,798 | |
Pay | | United Kingdom Gilt | | | 1.00 | % | | JPM | | 03/20/15 | | AAA | | USD | | | 400,000 | | | | 795 | | | | 8,770 | |
Pay | | United Kingdom Gilt | | | 1.00 | % | | JPM | | 03/20/15 | | AAA | | USD | | | 300,000 | | | | 663 | | | | 6,511 | |
Pay | | United Kingdom Gilt | | | 1.00 | % | | JPM | | 06/20/15 | | AAA | | USD | | | 3,900,000 | | | | 22,914 | | | | 78,578 | |
Pay | | United Kingdom Gilt | | | 1.00 | % | | JPM | | 12/20/15 | | AAA | | USD | | | 1,000,000 | | | | 14,047 | | | | 16,161 | |
Pay | | United Kingdom Gilt | | | 1.00 | % | | MS | | 06/20/16 | | AAA | | USD | | | 1,800,000 | | | | 22,533 | | | | 36,894 | |
Pay | | United Kingdom Gilt | | | 1.00 | % | | UBS | | 06/20/16 | | AAA | | USD | | | 900,000 | | | | 11,266 | | | | 18,448 | |
| | | | | | | | | | | | | | | | | | | | | | | | | | |
| | | | | | | | | | | | | | | | | Total | | | $ | (464,792 | ) | | $ | 3,376,684 | |
| | | | | | | | | | | | | | | | | | | | | | | | | | |
| † | This contract is a centrally cleared swap. |
| †† | If the Fund is a seller of protection and a credit event occurs, as defined under the terms of that particular swap agreement, the Fund will either (a) pay to the buyer of protection an amount equal to the notional amount of the swap and take delivery of the referenced obligation, or (b) pay a net settlement in the form of cash or securities equal to the notional amount of the swap less the recovery of the referenced obligation. |
At October 31, 2012, the Fund had the following written put and call options, swaptions and inflation floors:
(See Note 10 in the Notes to the Financial Statements.)
| | | | | | | | | | | | | | | | |
Pay/Receive
Floating Rate | | Description | | Counterparty | | Floating Rate Index | | Exercise
Rate | | Expiration
Date | | Notional
Amount | | Premium | | Unrealized
Gain/(Loss) |
| | Interest Rate Swaptions | | | | | | | | | | | | |
Receive | | 1-Year Interest Rate Swap (Put) | | RBS | | 3-Month USD-LIBOR | | 1.75% | | 11/19/12 | | $22,800,000 | | $86,070 | | $86,068 |
Receive | | 2-Year Interest Rate Swap (Put) | | CITI | | 3-Month USD-LIBOR | | 0.92% | | 11/14/12 | | 4,900,000 | | 22,050 | | 22,050 |
Receive | | 2-Year Interest Rate Swap (Put) | | DUB | | 3-Month USD-LIBOR | | 1.20% | | 07/11/13 | | 13,400,000 | | 94,574 | | 89,700 |
Receive | | 2-Year Interest Rate Swap (Put) | | MS | | 3-Month USD-LIBOR | | 0.92% | | 11/14/12 | | 34,300,000 | | 95,121 | | 95,118 |
Receive | | 5-Year Interest Rate Swap (Call) | | GS | | 3-Month USD-LIBOR | | 0.75% | | 03/18/13 | | 8,600,000 | | 13,892 | | (3,566) |
Receive | | 5-Year Interest Rate Swap (Call) | | MS | | 3-Month USD-LIBOR | | 0.75% | | 02/19/13 | | 9,700,000 | | 7,760 | | (10,608) |
Receive | | 5-Year Interest Rate Swap (Put) | | CS | | 3-Month USD-LIBOR | | 1.40% | | 03/18/13 | | 800,000 | | 15,440 | | 14,276 |
Receive | | 5-Year Interest Rate Swap (Put) | | DUB | | 3-Month USD-LIBOR | | 1.20% | | 03/18/13 | | 10,500,000 | | 38,588 | | 10,509 |
Receive | | 5-Year Interest Rate Swap (Put) | | DUB | | 3-Month USD-LIBOR | | 2.00% | | 03/18/13 | | 6,800,000 | | 63,854 | | 61,848 |
Receive | | 5-Year Interest Rate Swap (Put) | | MS | | 3-Month USD-LIBOR | | 1.20% | | 03/18/13 | | 18,900,000 | | 102,841 | | 52,301 |
Receive | | 5-Year Interest Rate Swap (Put) | | MS | | 3-Month USD-LIBOR | | 1.20% | | 02/19/13 | | 9,700,000 | | 26,675 | | 7,946 |
Receive | | 5-Year Interest Rate Swap (Put) | | MS | | 3-Month USD-LIBOR | | 1.40% | | 03/18/13 | | 4,000,000 | | 77,600 | | 71,778 |
The accompanying notes are an integral part of these financial statements.
27
Notes to Schedule of Portfolio Investments (continued)
| | | | | | | | | | | | | | | | | | | | | | | | | | |
Pay/Receive Floating Rate | | Description | | Counterparty | | Floating Rate Index | | Exercise
Rate | | | Expiration
Date | | | Notional
Amount | | | Premium | | | Unrealized
Gain/(Loss) | |
Receive | | 5-Year Interest Rate Swap (Put) | | RBS | | 3-Month USD-LIBOR | | | 1.75 | % | | | 05/30/13 | | | $ | 18,200,000 | | | $ | 134,185 | | | $ | 109,762 | |
Receive | | 5-Year Interest Rate Swap (Put) | | RBS | | 3-Month USD-LIBOR | | | 1.20 | % | | | 03/18/13 | | | | 7,100,000 | | | | 36,032 | | | | 17,046 | |
Receive | | 7-Year Interest Rate Swap (Call) | | DUB | | 3-Month USD-LIBOR | | | 1.15 | % | | | 11/19/12 | | | | 5,900,000 | | | | 9,440 | | | | 475 | |
Receive | | 7-Year Interest Rate Swap (Put) | | DUB | | 3-Month USD-LIBOR | | | 1.55 | % | | | 11/19/12 | | | | 5,900,000 | | | | 13,865 | | | | 11,855 | |
Receive | | 5-Year Interest Rate Swap (Call) | | CITI | | Euribor 6 Month | | | 0.90 | % | | | 01/21/13 | | | | 2,000,000 | | | | 8,727 | | | | 3,107 | |
Receive | | 5-Year Interest Rate Swap (Call) | | CS | | Euribor 6 Month | | | 0.90 | % | | | 01/21/13 | | | | 600,000 | | | | 2,556 | | | | 870 | |
Receive | | 5-Year Interest Rate Swap (Put) | | CITI | | Euribor 6 Month | | | 1.10 | % | | | 01/21/13 | | | | 2,000,000 | | | | 12,671 | | | | 4,243 | |
Receive | | 5-Year Interest Rate Swap (Put) | | CS | | Euribor 6 Month | | | 1.10 | % | | | 01/21/13 | | | | 600,000 | | | | 3,932 | | | | 1,403 | |
| | | | | | | | | | | | | | | | | | | | | | | | | | |
| | | | | | | | | | | | | | | | | Total | | | $ | 865,873 | | | $ | 646,181 | |
| | | | | | | | | | | | | | | | | | | | | | | | | | |
| | | | | | | | | | | | | | | | | | | | | | | | |
Description | | Counterparty | | | Strike Index | | | Expiration
Date | | | Notional
Amount | | | Premium | | | Unrealized
Gain/(Loss) | |
Inflation Floor Options | | | | | | | | | | | | | | | | | | | | | | | | |
Inflation Floor - OTC CPURNSA Index | | | DUB | | | $ | 216 | | | | 03/10/20 | | | $ | (11,400,000 | ) | | $ | 85,500 | | | $ | 60,063 | |
| | | | | | | | | | | | | | | | | | | | | | | | |
Transactions in written put and call options and swaptions for the fiscal year ended October 31, 2012, were as follows:
(See Note 10 in the Notes to the Financial Statements.)
| | | | | | | | | | | | |
| | | Number of
Contracts | | | Notional
Amount | | | Amount of
Premiums | |
Options and swaptions outstanding at October 31, 2011 | | | 137 | | | $ | 566,700,000 | | | $ | 4,638,296 | |
Options and swaptions written | | | 382 | | | | 556,900,000 | | | | 2,491,764 | |
Options and swaptions exercised/expired/closed | | | (519 | ) | | | (925,500,000 | ) | | | (6,178,687 | ) |
| | | | | | | | | | | | |
Options and swaptions outstanding at October 31, 2012 | | | — | | | $ | 198,100,000 | | | $ | 951,373 | |
| | | | | | | | | | | | |
At October 31, 2012, the Fund had the following forward foreign currency contracts (in U.S. Dollars):
(See Note 8 in the Notes to the Financial Statements.)
| | | | | | | | | | | | | | | | | | | | | | |
Foreign Currency | | Position | | | Settlement Date | | Counterparty | | | Receivable
Amount | | | Payable
Amount | | | Unrealized
Gain/(Loss) | |
Brazilian Real | | | Long | | | 02/04/13 | | | BRC | | | $ | 99,763 | | | $ | 100,000 | | | $ | (237 | ) |
Brazilian Real | | | Long | | | 12/04/12 to 02/04/13 | | | HSBC | | | | 5,154,161 | | | | 5,138,982 | | | | 15,179 | |
Brazilian Real | | | Long | | | 02/04/13 | | | HSBC | | | | 1,398,231 | | | | 1,400,000 | | | | (1,769 | ) |
Brazilian Real | | | Long | | | 12/04/12 | | | JPM | | | | 2,103,627 | | | | 2,100,000 | | | | 3,627 | |
Brazilian Real | | | Long | | | 12/04/12 | | | MS | | | | 1,909,980 | | | | 1,900,000 | | | | 9,980 | |
Brazilian Real | | | Long | | | 02/04/13 | | | MS | | | | 199,532 | | | | 200,000 | | | | (468 | ) |
Brazilian Real | | | Long | | | 12/04/12 | | | UBS | | | | 500,226 | | | | 500,000 | | | | 226 | |
The accompanying notes are an integral part of these financial statements.
28
Notes to Schedule of Portfolio Investments (continued)
| | | | | | | | | | | | | | | | | | |
Foreign Currency | | Position | | Settlement Date | | Counterparty | | Receivable
Amount | | | Payable
Amount | | | Unrealized
Gain/(Loss) | |
Brazilian Real | | Long | | 02/04/13 | | UBS | | $ | 798,964 | | | $ | 800,000 | | | $ | (1,036 | ) |
British Pound | | Long | | 12/12/12 | | RBC | | | 721,247 | | | | 716,018 | | | | 5,229 | |
Canadian Dollar | | Long | | 12/20/12 | | BRC | | | 251,041 | | | | 253,796 | | | | (2,755 | ) |
Canadian Dollar | | Long | | 12/20/12 | | CITI | | | 1,466,240 | | | | 1,498,157 | | | | (31,917 | ) |
Euro | | Long | | 12/17/12 | | BRC | | | 2,865,866 | | | | 2,854,237 | | | | 11,629 | |
Euro | | Long | | 12/17/12 | | CITI | | | 26,378,934 | | | | 26,256,532 | | | | 122,402 | |
Euro | | Long | | 12/17/12 | | CS | | | 2,057,977 | | | | 2,046,700 | | | | 11,277 | |
Euro | | Long | | 12/17/12 | | HSBC | | | 1,810,294 | | | | 1,796,080 | | | | 14,214 | |
Euro | | Long | | 12/17/12 | | RBS | | | 1,911,442 | | | | 1,911,749 | | | | (307 | ) |
Mexican Peso | | Long | | 12/03/12 | | BRC | | | 624,000 | | | | 629,350 | | | | (5,350 | ) |
Mexican Peso | | Long | | 12/03/12 | | CS | | | 8,361 | | | | 8,190 | | | | 171 | |
Mexican Peso | | Long | | 12/03/12 to 04/03/13 | | DUB | | | 242,397 | | | | 245,057 | | | | (2,660 | ) |
Mexican Peso | | Long | | 12/03/12 | | GS | | | 707,875 | | | | 700,000 | | | | 7,875 | |
Mexican Peso | | Long | | 04/03/13 | | HSBC | | | 773,411 | | | | 779,348 | | | | (5,937 | ) |
Mexican Peso | | Long | | 12/03/12 | | JPM | | | 592,644 | | | | 602,844 | | | | (10,200 | ) |
Mexican Peso | | Long | | 12/03/12 | | MS | | | 1,009,256 | | | | 1,000,000 | | | | 9,256 | |
Mexican Peso | | Long | | 12/03/12 | | UBS | | | 158,306 | | | | 155,442 | | | | 2,864 | |
Mexican Peso | | Long | | 12/03/12 | | UBS | | | 78,605 | | | | 79,667 | | | | (1,062 | ) |
Brazilian Real | | Short | | 12/04/12 | | HSBC | | | 4,474,529 | | | | 4,490,589 | | | | (16,060 | ) |
Brazilian Real | | Short | | 12/04/12 | | UBS | | | 714,666 | | | | 724,865 | | | | (10,199 | ) |
British Pound | | Short | | 12/12/12 | | CS | | | 6,829,810 | | | | 6,934,943 | | | | (105,133 | ) |
British Pound | | Short | | 12/12/12 | | JPM | | | 647,553 | | | | 645,411 | | | | 2,142 | |
Canadian Dollar | | Short | | 12/20/12 | | CITI | | | 21,311,339 | | | | 20,660,377 | | | | 650,962 | |
Canadian Dollar | | Short | | 12/20/12 | | DUB | | | 17,812,356 | | | | 17,397,844 | | | | 414,512 | |
Euro | | Short | | 12/17/12 | | BRC | | | 227,854 | | | | 229,529 | | | | (1,675 | ) |
Euro | | Short | | 12/17/12 to 04/01/14 | | CITI | | | 18,664,905 | | | | 18,691,185 | | | | (26,280 | ) |
Euro | | Short | | 06/02/14 | | CS | | | 507,200 | | | | 520,332 | | | | (13,132 | ) |
Euro | | Short | | 11/02/12 | | DUB | | | 1,783,884 | | | | 1,775,715 | | | | 8,169 | |
Euro | | Short | | 08/01/13 | | DUB | | | 19,899,784 | | | | 20,535,007 | | | | (635,223 | ) |
Euro | | Short | | 12/17/12 | | GS | | | 4,867,263 | | | | 4,868,082 | | | | (819 | ) |
Euro | | Short | | 12/17/12 | | HSBC | | | 28,263,645 | | | | 29,068,439 | | | | (804,794 | ) |
Euro | | Short | | 12/17/12 | | HSBC | | | 6,712,753 | | | | 6,647,253 | | | | 65,500 | |
The accompanying notes are an integral part of these financial statements.
29
Notes to Schedule of Portfolio Investments (continued)
| | | | | | | | | | | | | | | | | | | | |
Foreign Currency | | Position | | | Settlement Date | | Counterparty | | Receivable
Amount | | | Payable
Amount | | | Unrealized
Gain/(Loss) | |
Euro | | | Short | | | 12/17/12 | | JPM | | $ | 581,688 | | | $ | 583,547 | | | $ | (1,859 | ) |
Euro | | | Short | | | 12/17/12 | | MS | | | 270,306 | | | | 268,432 | | | | 1,874 | |
Euro | | | Short | | | 12/17/12 | | RBC | | | 8,148,123 | | | | 8,253,953 | | | | (105,830 | ) |
Euro | | | Short | | | 12/17/12 | | RBC | | | 1,792,954 | | | | 1,792,139 | | | | 815 | |
Euro | | | Short | | | 01/31/13 to 09/04/13 | | UBS | | | 9,675,775 | | | | 10,122,867 | | | | (447,092 | ) |
Euro | | | Short | | | 09/20/13 | | UBS | | | 26,545,914 | | | | 26,280,657 | | | | 265,257 | |
Japanese Yen | | | Short | | | 12/10/12 | | BRC | | | 5,928,022 | | | | 5,821,627 | | | | 106,395 | |
Japanese Yen | | | Short | | | 11/19/12 | | CITI | | | 7,078,796 | | | | 7,015,992 | | | | 62,804 | |
Japanese Yen | | | Short | | | 11/05/12 | | CS | | | 2,303,345 | | | | 2,254,883 | | | | 48,462 | |
Japanese Yen | | | Short | | | 11/05/12 | | JPM | | | 22,768,149 | | | | 22,423,561 | | | | 344,588 | |
Mexican Peso | | | Short | | | 02/07/13 | | CS | | | 3,104,586 | | | | 3,074,995 | | | | 29,591 | |
Mexican Peso | | | Short | | | 11/15/12 to 11/29/12 | | DUB | | | 8,316,665 | | | | 8,548,738 | | | | (232,073 | ) |
Mexican Peso | | | Short | | | 12/03/12 | | DUB | | | 85,422 | | | | 84,237 | | | | 1,185 | |
Mexican Peso | | | Short | | | 11/01/12 to 11/15/12 | | HSBC | | | 8,640,497 | | | | 8,876,178 | | | | (235,681 | ) |
Mexican Peso | | | Short | | | 12/03/12 | | HSBC | | | 789,456 | | | | 783,214 | | | | 6,242 | |
Mexican Peso | | | Short | | | 11/01/12 to 12/03/12 | | JPM | | | 5,109,925 | | | | 5,251,974 | | | | (142,049 | ) |
Mexican Peso | | | Short | | | 04/03/13 | | JPM | | | 590,097 | | | | 579,665 | | | | 10,432 | |
Mexican Peso | | | Short | | | 11/01/12 to 12/03/12 | | UBS | | | 6,123,983 | | | | 6,283,094 | | | | (159,111 | ) |
| | | | | | | | | | | | | | | | | | | | |
| | | | | | | | Total | | $ | 304,393,624 | | | $ | 305,161,473 | | | $ | (767,849 | ) |
| | | | | | | | | | | | | | | | | | | | |
| | | | | | |
| Counterparty Abbreviations: | | Currency Abbreviations: |
| | | |
| BNP: | | BNP Paribas SA | | EUR: | | Euro |
| BOA: | | Bank of America | | MXN: | | Mexican Peso |
| BRC: | | Barclays Bank PLC | | USD: | | U.S. Dollar |
| CITI: | | Citigroup, Inc. | | | | |
| CS: | | Credit Suisse | | Investment Abbreviations and Definitions: |
| DUB: | | Deutsche Bank AG | | | | |
| GS: | | Goldman Sachs & Co. | | CDX.EM: | | Credit Derivatives Index Emerging Markets |
| HSBC: | | HSBC Bank | | CDX.HY: | | Credit Derivatives Index High Yield |
| JPM: | | JPMorgan Chase & Co. | | CPURNSA: | | Consumer Price All Urban Non-Seasonally Adjusted Index |
| JRC: | | Johnson Rice & Co. | | EURIBOR: | | Euro Interbank Offered Rate |
| MS: | | Morgan Stanley | | FNMA: | | Federal National Mortgage Association |
| RBC: | | Royal Bank of Canada | | LIBOR: | | London Interbank Offered Rate |
| RBS: | | Royal Bank of Scotland Group PLC | | N/A: | | No composite rating is available for this index. |
| UBS: | | UBS Warburg LLC | | OIS: | | Overnight Index Swap |
| | | | OTC: | | Over-the-counter |
| | | | TBA: | | To be determined |
| | | | TIIE: | | Interbank Equilibrium Interest rate |
The accompanying notes are an integral part of these financial statements.
30
Statement of Assets and Liabilities
October 31, 2012
| | | | |
Assets: | | | | |
Investments at value* (including securities on loan valued at $27,218,109) | | $ | 1,910,112,242 | |
Repurchase Agreements at value** | | | 276,900,000 | |
Receivable for delayed delivery investments sold | | | 133,438,451 | |
Dividends, interest and other receivables | | | 6,884,842 | |
Receivable for investments sold | | | 5,697,010 | |
Receivable for Fund shares sold | | | 5,138,357 | |
Unrealized appreciation on swaps | | | 3,664,221 | |
Swap premiums paid | | | 2,239,462 | |
Unrealized appreciation on foreign currency contracts | | | 2,232,859 | |
Variation margin receivable on financial derivative instruments | | | 1,583,848 | |
Receivable from affiliate | | | 137,924 | |
Foreign currency*** | | | 65,760 | |
Prepaid expenses | | | 13,094 | |
Total assets | | | 2,348,108,070 | |
Liabilities: | | | | |
Payable for delayed delivery investments purchased | | | 679,003,338 | |
Payable for investments purchased | | | 177,188,243 | |
Payable upon return of securities loaned | | | 28,098,157 | |
Payable to brokers upon termination of futures, swaps and foreign currency contracts | | | 4,428,000 | |
Unrealized depreciation on foreign currency contracts | | | 3,000,708 | |
Payable for Fund shares repurchased | | | 2,681,560 | |
Unrealized depreciation on swaps | | | 1,778,936 | |
Swap premiums received | | | 1,666,286 | |
Payable for TBA sale commitments | | | 1,077,578 | |
Variation margin payable on financial derivative instruments | | | 849,008 | |
Dividends payable to shareholders | | | 256,841 | |
Options written (premiums received $951,373) | | | 245,129 | |
Accrued expenses: | | | | |
Investment advisory and management fees | | | 486,153 | |
Administrative fees | | | 243,077 | |
Other | | | 433,813 | |
Total liabilities | | | 901,436,827 | |
| |
Net Assets | | $ | 1,446,671,243 | |
Net Assets Represent: | | | | |
Paid-in capital | | $ | 1,354,449,923 | |
Undistributed net investment income | | | 6,556,657 | |
Accumulated net realized gain from investments, options, futures, swaps and foreign currency transactions | | | 19,462,386 | |
Net unrealized appreciation of investments, options, futures, swaps and foreign currency translations | | | 66,202,277 | |
Net Assets | | $ | 1,446,671,243 | |
Shares outstanding | | | 129,843,380 | |
Net asset value, offering and redemption price per share | | $ | 11.14 | |
* Investments at cost | | $ | 1,846,103,513 | |
** Repurchase agreements at cost | | $ | 276,900,000 | |
*** Foreign currency at cost | | $ | 66,052 | |
The accompanying notes are an integral part of these financial statements.
31
Statement of Operations
For the fiscal year ended October 31, 2012
| | | | |
Investment Income: | | | | |
Interest income | | $ | 36,288,541 | |
Dividend income | | | 573,385 | |
Securities lending income | | | 39,546 | |
Foreign withholding tax | | | (291 | ) |
Total investment income | | | 36,901,181 | |
Expenses: | | | | |
Investment advisory and management fees | | | 5,274,687 | |
Administrative fees | | | 2,637,343 | |
Custodian | | | 415,725 | |
Transfer agent | | | 348,683 | |
Professional fees | | | 189,019 | |
Reports to shareholders | | | 121,246 | |
Registration fees | | | 76,631 | |
Trustees fees and expenses | | | 73,521 | |
Insurance | | | 42,437 | |
Miscellaneous | | | 3,859 | |
Total expenses before offsets | | | 9,183,151 | |
Expense reimbursements | | | (1,534,145 | ) |
Expense reductions | | | (491 | ) |
Net expenses | | | 7,648,515 | |
| |
Net investment income | | | 29,252,666 | |
Net Realized and Unrealized Gain (Loss): | | | | |
Net realized gain on investments, purchased options, futures and swap transactions | | | 44,160,187 | |
Net realized gain on written options | | | 5,866,619 | |
Net realized loss on foreign currency transactions | | | (3,945,845 | ) |
Net change in unrealized appreciation (depreciation) of investments, options, futures, swaps and foreign currency translations | | | 41,685,035 | |
Net realized and unrealized gain | | | 87,765,996 | |
| |
Net increase in net assets resulting from operations | | $ | 117,018,662 | |
The accompanying notes are an integral part of these financial statements.
32
Statements of Changes in Net Assets
For the fiscal year ended October 31,
| | | | | | | | |
| | | 2012 | | | 2011 | |
Increase (Decrease) in Net Assets From Operations: | | | | | | | | |
Net investment income | | $ | 29,252,666 | | | $ | 31,691,893 | |
Net realized gain (loss) on investments, options, futures, swaps and foreign currency transactions | | | 46,080,961 | | | | (4,600,638 | ) |
Net change in unrealized appreciation (depreciation) of investments, options, futures, swaps and foreign currency translations | | | 41,685,035 | | | | (13,892,739 | ) |
Net increase in net assets resulting from operations | | | 117,018,662 | | | | 13,198,516 | |
Distributions to Shareholders: | | | | | | | | |
From net investment income | | | (42,635,875 | ) | | | (41,653,175 | ) |
From net realized gain on investments | | | — | | | | (58,243,682 | ) |
Total distributions to shareholders | | | (42,635,875 | ) | | | (99,896,857 | ) |
Capital Share Transactions: | | | | | | | | |
Proceeds from sale of shares | | | 391,140,790 | | | | 382,148,534 | |
Reinvestment of dividends | | | 36,842,985 | | | | 86,527,010 | |
Cost of shares repurchased | | | (294,836,464 | ) | | | (568,176,682 | ) |
Net increase (decrease) from capital share transactions | | | 133,147,311 | | | | (99,501,138 | ) |
| | |
Total increase (decrease) in net assets | | | 207,530,098 | | | | (186,199,479 | ) |
Net Assets: | | | | | | | | |
Beginning of year | | | 1,239,141,145 | | | | 1,425,340,624 | |
End of year | | $ | 1,446,671,243 | | | $ | 1,239,141,145 | |
End of year undistributed net investment income | | $ | 6,556,657 | | | $ | 11,914,617 | |
| | | | | | | | |
Share Transactions: | | | | | | | | |
Sale of shares | | | 36,127,870 | | | | 36,035,399 | |
Shares issued in connection with reinvestment of dividends and distributions | | | 3,434,473 | | | | 8,340,023 | |
Shares repurchased | | | (27,347,000 | ) | | | (53,544,469 | ) |
Net increase (decrease) in shares | | | 12,215,343 | | | | (9,169,047 | ) |
The accompanying notes are an integral part of these financial statements.
33
Managers PIMCO Bond Fund
Financial Highlights
For a share outstanding throughout each fiscal year
| | | | | | | | | | | | | | | | | | | | |
| | | For the fiscal year ended October 31, | |
| | | 2012 | | | 2011 | | | 2010 | | | 2009 | | | 2008 | |
Net Asset Value, Beginning of Year | | $ | 10.53 | | | $ | 11.24 | | | $ | 10.61 | | | $ | 9.85 | | | $ | 10.41 | |
Net investment income | | | 0.24 | 3 | | | 0.38 | | | | 0.35 | | | | 0.49 | | | | 0.57 | |
Net realized and unrealized gain (loss) on investments | | | 0.72 | 3 | | | (0.25 | ) | | | 0.73 | | | | 1.44 | | | | (0.61 | ) |
Total from investment operations | | | 0.96 | | | | 0.13 | | | | 1.08 | | | | 1.93 | | | | (0.04 | ) |
Less Distributions to Shareholders from: | | | | | | | | | | | | | | | | | | | | |
Net investment income | | | (0.35 | ) | | | (0.35 | ) | | | (0.32 | ) | | | (0.49 | ) | | | (0.52 | ) |
Net realized gain on investments | | | — | | | | (0.49 | ) | | | (0.13 | ) | | | (0.68 | ) | | | — | |
Total distributions to shareholders | | | (0.35 | ) | | | (0.84 | ) | | | (0.45 | ) | | | (1.17 | ) | | | (0.52 | ) |
Net Asset Value, End of Year | | $ | 11.14 | | | $ | 10.53 | | | $ | 11.24 | | | $ | 10.61 | | | $ | 9.85 | |
Total Return1 | | | 9.31 | % | | | 1.45 | % | | | 10.52 | % | | | 20.62 | % | | | (0.60 | )% |
Ratio of net expenses to average net assets | | | 0.58 | % | | | 0.58 | % | | | 0.58 | % | | | 0.58 | % | | | 0.58 | % |
Ratio of net investment income to average net assets1 | | | 2.22 | % | | | 2.54 | % | | | 2.38 | % | | | 3.78 | % | | | 4.47 | % |
Portfolio turnover | | | 375 | % | | | 495 | %4 | | | 359 | %4 | | | 531 | %4 | | | 431 | %4 |
| | | | | | | | | | | | | | | | | | | | |
Net assets at end of year (000’s omitted) | | $ | 1,446,671 | | | $ | 1,239,141 | | | $ | 1,425,341 | | | $ | 1,114,164 | | | $ | 1,036,504 | |
| | | | | | | | | | | | | | | | | | | | |
Ratios absent expense offsets:2 | | | | | | | | | | | | | | | | | | | | |
Ratio of total expenses to average net assets | | | 0.70 | % | | | 0.71 | % | | | 0.74 | % | | | 0.78 | % | | | 0.75 | % |
Ratio of net investment income to average net assets | | | 2.10 | % | | | 2.41 | % | | | 2.22 | % | | | 3.58 | % | | | 4.30 | % |
| | | | | | | | | | | | | | | | | | | | |
Notes to Financial Highlights
The following footnotes should be read in conjunction with the Financial Highlights of the Fund previously presented in this report.
| 1 | Total returns and net investment income would have been lower had certain expenses not been reduced. (See Note 1(c) of Notes to Financial Statements.) |
| 2 | Excludes the impact of expense reimbursements or fee waivers and expense reductions such as brokerage credits, but includes non-reimbursable expense, if any, such as interest and taxes. (See Note 1(c) of Notes to Financial Statements.) |
| 3 | Per share numbers have been calculated using average shares. |
| 4 | Turnover ratio includes TBA dollar roll transactions. Had the TBA transactions been excluded the turnover ratios for the fiscal years ended 2011, 2010, 2009 and 2008 would have been 411%, 286%, 365% and 292%, respectively. |
34
Notes to Financial Statements
October 31, 2012
1. Summary of Significant Accounting Policies
Managers Trust I (the “Trust”) is an open-end management investment company, organized as a Massachusetts business trust, and registered under the Investment Company Act of 1940, as amended (the “1940 Act”). Currently, the Trust consists of a number of different funds, each having distinct investment management objectives, strategies, risks, and policies. Included in this report is the Managers PIMCO Bond Fund (the “Fund”).
The Fund’s financial statements are prepared in accordance with accounting principles generally accepted in the United States of America (“U.S. GAAP”), which require management to make estimates and assumptions that affect the reported amounts of assets and liabilities and disclosure of contingent assets and liabilities at the date of the financial statements and the reported amounts of income and expenses during the reporting period. Actual results could differ from those estimates and such differences could be material. The following is a summary of significant accounting policies followed by the Fund in the preparation of its financial statements:
a. Valuation of Investments
Equity securities traded on a domestic or international securities exchange are valued at the last quoted sale price, or, lacking any sales, at the last quoted bid price. Over-the-counter securities are valued at the Nasdaq Official Closing Price, if one is available. Lacking any sales, over-the-counter securities are valued at the last quoted bid price. The Fund’s investments are generally valued based on market quotations provided by third-party pricing services approved by the Board of Trustees of the Fund (the “Board”).
Fixed-income securities are valued based on valuations furnished by independent pricing services that utilize matrix systems, which reflect such factors as security prices, yields, maturities, and ratings, and are supplemented by dealer and exchange quotations. Futures contracts for which market quotations are readily available are valued at the settlement price as of the close of the futures exchange. Short-term investments having a remaining maturity of 60 days or less are generally valued at amortized cost, which approximates market value. Investments in other open-end regulated investment companies are valued at their end of day net asset value per share. Investments in certain mortgage-backed and stripped mortgage-backed securities, preferred stocks, convertible securities, derivatives and other debt securities not traded on an organized securities market are valued on the basis of valuations provided by dealers or by a pricing service which uses information with respect to transactions in such securities and various relationships between such securities and yield to maturity in determining value. Securities (including derivatives) for which market quotations are not readily available are valued at fair value, as determined in good faith, and pursuant to procedures adopted by the Board. The values assigned to fair value investments are based on available information and do not necessarily represent amounts that might ultimately be realized, since such amounts depend on future developments inherent in long-term investments. Further, because of the inherent uncertainty of valuation, those estimated values may differ significantly from the values that would have been used had a ready market for the investments existed, and the differences could be material.
Under certain circumstances, the value of certain Fund investments (including derivatives) may be based on an evaluation of fair value, pursuant to procedures established by and under the general supervision of the Board. The Pricing Committee is the committee formed by the Board to make fair value determinations for such investments. When determining the fair value of an investment, the Pricing Committee seeks to determine the price that the Fund might reasonably expect to receive from a current sale of that investment in an arm’s-length transaction. Fair value determinations shall be based upon consideration of all available facts and information, including, but not limited to (i) attributes specific to the investment; (ii) fundamental analytical data and press releases relating to the investment and its issuer; (iii) the value of comparable securities or relevant financial instruments, including derivative securities, traded on other markets or among dealers; and (iv) other factors, such as future cash flows, interest rates, yield curves, volatilities, credit risks and/or default rates. The Board will be presented with a quarterly report comparing fair values determined by the Pricing Committee against subsequent market valuations for those securities. The values assigned to fair value investments are based on available information and do not necessarily represent amounts that might ultimately be realized, since such amounts depend on future developments inherent in long-term investments. Further, because of the inherent uncertainty of valuation, those estimated values may differ significantly from the values that would have been used had a ready market for the investments existed, and the differences could be material. The Fund may use the fair value of a portfolio investment to calculate its net asset value (“NAV”) when, for example, (1) market quotations are not readily available because a portfolio investment is not traded in a public market or the principal market in which the investment trades is closed, (2) trading in a portfolio investment is suspended and has not resumed before the Fund calculates its NAV, (3) a significant event affecting the value of a portfolio investment is determined to have occurred between the time of the market quotation provided for a portfolio investment and the time as of which the Fund calculates its NAV, (4) an investment’s price has remained unchanged over a period of time (often referred to as a “stale price”), or (5) Managers Investment Group LLC (the “Investment Manager”) determines that a market quotation is inaccurate. Portfolio investments that trade primarily on foreign markets are priced based upon the market quotation of such securities as of the close of their respective principal markets, as adjusted to reflect the Investment Manager’s determination of the impact of events occurring subsequent to the close of such markets but prior to the time as of which the Fund calculates its NAV. Under certain circumstances, the Investment Manager may adjust such prices based on its determination of the impact of events occurring subsequent to the close of such markets but prior to the time as of which the Fund calculates its NAV. The Funds may invest in securities that may be thinly traded. The Board has adopted procedures to adjust prices of thinly traded securities that are judged to be stale so that they reflect fair value. An investment valued on the basis of its fair value may be valued at a price higher or lower than available market quotations. An investment’s valuation may differ depending on the method used and the factors considered in determining value according to the Fund’s fair value procedures.
Notes to Financial Statements (continued)
U.S. GAAP defines fair value as the price that a Fund would receive to sell an asset or pay to transfer a liability in an orderly transaction between market participants at the measurement date. U.S. GAAP also establishes a framework for measuring fair value, and a three level hierarchy for fair value measurements based upon the transparency of inputs to the valuation of an asset or liability. Inputs may be observable or unobservable and refer broadly to the assumptions that market participants would use in pricing the asset or liability. Observable inputs reflect the assumptions market participants would use in pricing the asset or liability based on market data obtained from sources independent of the Fund. Unobservable inputs reflect the Fund’s own assumptions about the assumptions that market participants would use in pricing the asset or liability developed based on the best information available in the circumstances. Each investment is assigned a level based upon the observability of the inputs which are significant to the overall valuation.
The three-tier hierarchy of inputs is summarized below:
Level 1 – inputs are quoted prices in active markets for identical investments (e.g., equity securities, open-end investment companies, futures contracts, options contracts)
Level 2 – other observable inputs (including, but not limited to: quoted prices for similar assets or liabilities in markets that are active, quoted prices for identical or similar assets or liabilities in markets that are not active, inputs other than quoted prices that are observable for the assets or liabilities (such as interest rates, yield curves, volatilities, prepayment speeds, loss severities, credit risks and default rates) or other market corroborated inputs) (e.g., debt securities, government securities, swap contracts, foreign currency exchange contracts, foreign securities utilizing international fair value pricing, broker-quoted securities, fair valued securities with observable inputs)
Level 3 – inputs are significant unobservable inputs (including the Fund’s own assumptions used to determine the fair value of investments) (e.g., fair valued securities with unobservable inputs)
Changes in inputs or methodologies used for valuing investments may result in a transfer in or out of levels within the fair value hierarchy. The inputs or methodologies used for valuing investments are not necessarily an indication of the risk associated with investing in those investments.
b. Security Transactions
Security transactions are accounted for as of trade date. Realized gains and losses on securities sold are determined on the basis of identified cost.
c. Investment Income and Expenses
Dividend income is recorded on the ex-dividend date. Dividend income on foreign securities is recorded net of any withholding tax. Interest income, which includes amortization of premium and accretion of discount on debt securities, is accrued as earned. Non-cash dividends included in dividend income, if any, are reported at the fair market value of the securities received. Other income and expenses are recorded on an accrual basis. Expenses that cannot be directly attributed to a Fund are apportioned among the funds in the
Trust and in some cases other affiliated funds based upon their relative average net assets or number of shareholders.
The Fund has a “balance credit” agreement with The Bank of New York Mellon (“BNYM”), the Fund’s custodian, whereby the Fund is credited with an interest factor equal to 0.75% below the effective 90-day T-Bill rate for account balances left uninvested overnight. If the T-Bill rate falls below 0.75%, no credits will be earned. These credits serve to reduce custody expenses that otherwise would be charged to the Fund. For the fiscal year ended October 31, 2012, the Fund’s custodian expense was not reduced.
Overdrafts will cause a reduction of any balance credits, computed at 2% above the Federal Funds rate on the day of the overdraft. For the fiscal year ended October 31, 2012, the Fund did not have any overdraft fees.
The Fund also has a balance credit arrangement with its Transfer Agent, BNY Mellon Investment Servicing (US) Inc., whereby earnings credits are used to offset banking charges and other out-of-pocket expenses. For the fiscal year ended October 31, 2012, the transfer agent expense was reduced by $491.
Total returns and net investment income for the Fund would have been lower had certain expenses not been offset. Total expenses before offsets exclude the impact of expense reimbursements or fee waivers and expense offsets such as brokerage recapture credits, but include non-reimbursable expenses, if any, such as interest and taxes.
d. Dividends and Distributions
Dividends resulting from net investment income, if any, normally will be declared daily and paid monthly. Distributions of capital gains, if any, will be made on an annual basis and when required for Federal excise tax purposes. Dividends and distributions to shareholders are recorded on the ex-dividend date. Income and capital gain distributions are determined in accordance with Federal income tax regulations, which may differ from U.S. GAAP. These differences are primarily due to differing treatments for losses deferred due to wash sales, equalization accounting for tax purposes, foreign currency, options, futures and market discount transactions. Permanent book and tax basis differences, if any, relating to shareholder distributions will result in reclassifications to paid-in capital.
The tax character of distributions paid during the fiscal years ended October 31, 2012 and October 31, 2011 were as follows:
| | | | | | | | |
| Distributions paid from: | | 2012 | | | 2011 | |
Ordinary income | | $ | 42,635,875 | | | $ | 80,947,984 | |
Short-term capital gains | | | — | | | | — | |
Long-term capital gains | | | — | | | | 18,948,873 | |
| | | | | | | | |
Totals | | $ | 42,635,875 | | | $ | 99,896,857 | |
| | | | | | | | |
36
Notes to Financial Statements (continued)
As of October 31, 2012, the components of distributable earnings (excluding unrealized appreciation/depreciation) on a tax basis consisted of:
| | | | |
Capital loss carryforward | | | — | |
Undistributed ordinary income | | $ | 6,022,212 | |
Undistributed short-term capital gains | | | — | |
Undistributed long-term capital gains | | | 20,095,414 | |
Post-October loss deferral | | | — | |
e.Federal Taxes
The Fund intends to comply with the requirements under Subchapter M of the Internal Revenue Code of 1986, as amended, and to distribute substantially all of its taxable income and gains to its shareholders and to meet certain diversification and income requirements with respect to investment companies. Therefore, no provision for Federal income or excise tax is included in the accompanying financial statements.
Additionally, based on the Fund’s understanding of the tax rules and rates related to income, gains and transactions for the foreign jurisdictions in which it invests, the Fund will provide for foreign taxes, and where appropriate, deferred foreign taxes.
Management has analyzed the Fund’s tax positions taken on federal income tax returns as of October 31, 2012, and for all open tax years, and has concluded that no provision for federal income tax is required in the Fund’s financial statements. Additionally, the Fund is not aware of any tax position for which it is reasonably possible that the total amounts of unrecognized tax benefits will change materially in the next twelve months.
Under the Regulated Investment Company Modernization Act of 2010 (the “Act”), post-enactment capital losses may be carried forward for an unlimited time period. However, any new losses incurred will be required to be utilized prior to any loss carryovers incurred in pre-enactment taxable years, which generally expire eight years following the close of the taxable year in which they were incurred. As a result of this ordering rule, pre-enactment capital loss carryovers may be more likely to expire unused. Additionally, post-enactment capital losses that are carried forward retain their tax character as either short-term or long-term capital losses rather than being considered all short-term as under previous law.
f.Capital Loss Carryovers
As of October 31, 2012, the Fund had accumulated net realized capital loss carryovers from securities transactions for Federal income tax purposes as shown in the following chart. This amount may be used to offset future realized capital gains, if any, through the expiration date listed or in the case of post-enactment losses, for an unlimited time period.
| | | | | | | | | | | | |
| | | Capital Loss Carryover Amounts | | | | |
| | | Short-Term | | | Long-Term | | | Expires
October 31, | |
(Pre-Enactment) | | | — | | | | — | | | | — | |
| | | | | | | | | | | | |
For the fiscal year ended October 31, 2012, the Fund utilized capital loss carryovers in the amount of: $11,137,769.
g. Capital Stock
The Trust’s Declaration of Trust authorizes for each series the issuance of an unlimited number of shares of beneficial interest, without par value. The Fund records sales and repurchases of its capital stock on the trade date. The cost of securities contributed to the Fund in connection with the issuance of shares is based on the valuation of those securities in accordance with the Fund’s policy on investment valuation.
At October 31, 2012, certain unaffiliated shareholders of record, specifically omnibus accounts, individually or collectively held greater than 10% of the outstanding shares of the Fund as follows: two collectively own 43%. Transactions by these shareholders may have a material impact on the Fund.
h. Repurchase Agreements
The Fund may enter into repurchase agreements provided that the value of the underlying collateral, including accrued interest, will equal or exceed the value of the repurchase agreement during the term of the agreement. The underlying collateral for all repurchase agreements is held in safekeeping by the Fund’s custodian or at the Federal Reserve Bank. If the seller defaults and the value of the collateral declines, or if bankruptcy proceedings commence with respect to the seller of the security, realization of the collateral by the Fund may be delayed or limited. At October 31, 2012, the market value of repurchase agreements outstanding was $276,900,000.
i. Foreign Currency Translation
The books and records of the Fund are maintained in U.S. dollars. The values of investments, assets and liabilities denominated in currencies other than U.S. dollars are translated into U.S. dollars based upon current foreign exchange rates. Purchases and sales of foreign investments, income and expenses are converted into U.S. dollars based on currency exchange rates prevailing on the respective dates of such transactions. Net realized and unrealized gain (loss) on foreign currency transactions represent: (1) foreign exchange gains and losses from the sale and holdings of foreign currencies; (2) gains and losses between trade date and settlement date on investment securities transactions and forward foreign currency exchange contracts; and (3) gains and losses from the difference between amounts of interest and dividends recorded and the amounts actually received.
The Fund does not isolate the net realized and unrealized gain or loss resulting from changes in exchange rates from the fluctuations in market prices of securities held. Such fluctuations are included with the net realized and unrealized gain or loss on investments.
j. Foreign Securities
The Fund invests in securities of foreign entities and in instruments denominated in foreign currencies which involve risks not typically associated with investments in domestic securities. Non-domestic securities carry special risks, such as exposure to currency fluctuations, less developed or less efficient trading markets, political instability, a lack of company information, differing auditing and legal standards, and, potentially, less liquidity.
Realized gains in certain countries may be subject to foreign taxes at the Fund level, at rates ranging from approximately 10% to 15%.
Notes to Financial Statements (continued)
The Fund would pay such foreign taxes on net realized gains at the appropriate rate for each jurisdiction.
k.Securities Transacted on a When Issued Basis
The Fund may enter into To Be Announced (“TBA”) sale commitments to hedge its portfolio positions or to sell mortgage-backed securities it owns under delayed delivery arrangements. Proceeds of TBA sale commitments are not received until the contractual settlement date. During the time a TBA sale commitment is outstanding, equivalent deliverable securities, or an offsetting TBA purchase commitment deliverable on or before the sale commitment date, are held as “cover” for the transaction. Unsettled TBA sale commitments are valued at the current market value of the underlying securities according to the procedures described under “Valuation of Investments,” in note 1a above. Each contract is marked-to-market daily and the change in market value is recorded by the Fund as an unrealized gain or loss. If the TBA sale commitment is closed through the acquisition of an offsetting purchase commitment, the Fund realizes a gain or loss. If the Fund delivers securities under the commitment, the Fund realizes a gain or a loss from the sale of the securities based upon the unit price established at the date the Fund entered into the commitment.
2.Agreements and Transactions with Affiliates
The Trust has entered into an Investment Management Agreement under which the Investment Manager, a subsidiary of Affiliated Managers Group, Inc. (“AMG”), serves as investment manager to the Fund and is responsible for the Fund’s overall administration and operations. The Investment Manager selects subadvisors for the Fund (subject to Board approval) and monitors the subadvisor’s investment performance, security holdings and investment strategies. The Fund’s investment portfolio is managed by one or more portfolio managers who serve pursuant to a subadvisory agreement with the Investment Manager.
Investment management fees are paid directly by the Fund to the Investment Manager based on average daily net assets. The annual investment management fee rate, as a percentage of average daily net assets, for the fiscal year ended October 31, 2012, was 0.40%.
The Investment Manager has contractually agreed, through at least March 1, 2013, to waive fees and pay or reimburse Fund expenses in order to limit total annual Fund operating expenses after fee waiver and expense reimbursements (exclusive of taxes, interest (including interest incurred in connection with bank and custody overdrafts), brokerage commissions and other transaction costs, acquired fund fees and expenses, and extraordinary expenses) to 0.58% of the Fund’s average daily net assets.
The Fund is obligated to repay the Investment Manager such amounts waived, paid or reimbursed in future years provided that the repayment occurs within thirty-six (36) months after the waiver or reimbursement and that such repayment would not cause the Fund’s total operating expenses in any such future year to exceed the Fund’s expense cap.
For the fiscal year ended October 31, 2012, the Fund’s components of reimbursement available are detailed in the following chart:
| | | | |
Reimbursement Available - 10/31/11 | | $ | 4,742,234 | |
Additional Reimbursements | | | 1,534,145 | |
Repayments | | | — | |
Expired Reimbursements | | | (1,512,407 | ) |
| | | | |
Reimbursement Available - 10/31/12 | | $ | 4,763,972 | |
| | | | |
The Fund has entered into an Administration and Shareholder Servicing Agreement under which the Investment Manager serves as the Fund’s administrator (the “Administrator”) and is responsible for all aspects of managing the Fund’s operations, including administration and shareholder services to the Fund, its shareholders, and certain institutions, such as bank trust departments, broker-dealers and registered investment advisers, that advise or act as an intermediary with the Fund’s shareholders. The Fund pays a fee to the Administrator at the rate of 0.20% per annum of the Fund’s average daily net assets for this service.
The aggregate annual retainer paid to each Independent Trustee of the Board is $80,000, plus $5,000 or $2,500 for each regular or special meeting attended, respectively. The Independent Chairman of the Trust receives an additional payment of $20,000 per year. The Chairman of the Audit Committee receives an additional payment of $8,000 per year. The Trustees’ fees and expenses are allocated among all of the funds for which the Investment Manager serves as the advisor (the “Managers Funds”) based on the relative net assets of such funds. The “Trustees fees and expenses” shown in the financial statements represents the Fund’s allocated portion of the total fees and expenses paid by the Managers Funds.
The Fund is distributed by Managers Distributors, Inc. (the “Distributor” or “MDI”), a wholly-owned subsidiary of the Investment Manager. MDI serves as the distributor and underwriter for the Fund and is a registered broker-dealer and member of the Financial Industry Regulatory Authority, Inc. (“FINRA”). Shares of the Fund will be continuously offered and will be sold directly to prospective purchasers through brokers, dealers or other financial intermediaries who have executed selling agreements with MDI. Subject to the compensation arrangement discussed below, generally MDI bears all or a portion of the expenses of providing services pursuant to the distribution agreement, including the payment of the expenses relating to the distribution of prospectuses for sales purposes and any advertising or sales literature. Certain Trustees and Officers of the Fund are Officers and/or Directors of the Investment Manager, AMG and/or the Distributor.
The Securities and Exchange Commission granted an exemptive order that permits the Fund to lend and borrow money for certain temporary purposes directly to and from other eligible Managers Funds. Participation in this interfund lending program is voluntary for both borrowing and lending funds, and an interfund loan is only made if it benefits each participating fund. The Investment Manager administers the program according to procedures approved by the Board, and the Board monitors the operation of the program. An interfund loan must comply with certain conditions set out in the exemptive order, which are designed to assure fairness and protect
Notes to Financial Statements (continued)
all participating funds. For the fiscal year ended October 31, 2012, the Fund did not lend to or borrow from any other Managers Funds.
3.Purchases and Sales of Securities
Purchases and sales of securities (excluding short-term securities and U.S. Government obligations) for the fiscal year ended October 31, 2012, were $349,956,500 and $428,116,849, respectively. Purchases and sales of U.S. Government obligations for the fiscal year ended October 31, 2012, were $10,890,852,556 and $10,393,363,749, respectively.
4.Portfolio Securities Loaned
The Fund participates in a securities lending program offered by BNYM (the “Program”), providing for the lending of securities to qualified brokers. Securities lending income includes earnings of such temporary cash investments, plus or minus any rebate to a borrower. These earnings (after any rebate) are then divided between BNYM, as a fee for its services under the program, and the Fund, according to agreed-upon rates. Collateral on all securities loaned is accepted in cash and/or government securities and is maintained at a minimum level of 102% (105% in the case of certain foreign securities) of the market value, plus interest, if applicable, of investments on loan. It is the Fund’s policy to obtain additional collateral from or return excess collateral to the borrower by the end of the next business day, following the valuation date of the securities loaned. Therefore, the value of the collateral held may be temporarily less than the value of the securities on loan. Lending securities entails a risk of loss to the Fund if and to the extent that the market value of the securities loaned were to increase and the borrower did not increase the collateral accordingly, and the borrower fails to return the securities. Under the terms of the Program, the Fund is indemnified for such losses by BNYM. The Fund bears the risk of any deficiency in the amount of the collateral available for return to the borrower due to any loss on the collateral invested. Collateral received in the form of cash is invested temporarily in the BNY Mellon Overnight Government Fund, formerly the BNY Institutional Cash Reserves Fund (the “ICRF”), or other short-term investments as defined in the Securities Lending Agreement with BNYM.
5.Commitments and Contingencies
In the normal course of business, the Fund may enter into contracts and agreements that contain a variety of representations and warranties, which provide general indemnifications. The maximum exposure to the Fund under these arrangements is unknown, as this would involve future claims that may be made against the Fund that have not yet occurred. However, the Fund had no prior claims or losses and expects the risk of material loss to be remote.
6.Forward Commitments
Certain transactions, such as futures and forward transactions, dollar roll agreements, or purchases of when-issued or delayed delivery securities may have a similar effect on the Fund’s net asset value as if the Fund had created a degree of leverage in its portfolio. However, if the Fund enters into such a transaction, the Fund will establish a segregated account with its custodian in which it will maintain cash, U.S. government securities or other liquid securities equal in value to its obligations in respect to such transaction. Securities and other assets held in the segregated account may not
be sold while the transaction is outstanding, unless other suitable assets are substituted.
7.Derivative Instruments
The following disclosures contain information on how and why the Fund uses derivative instruments, the credit risk and how derivative instruments affect the Fund’s financial position, results of operations and cash flows. The location and fair value amounts of these instruments would be on the Statement of Assets and Liabilities and the realized and changes in unrealized gains and losses on the Statement of Operations, each categorized by type of derivative contract, are included in a table in the Schedule of Portfolio Investments. For the fiscal year ended October 31, 2012, the average quarterly balances of outstanding derivative financial instruments were as follows:
| | | | |
| | | For the fiscal year ended
October 31, 2012 | |
Financial futures contracts: | | | | |
Average number of contracts purchased | | | 2,152 | |
Average number of contracts sold | | | 6 | |
Average notional value of contracts purchased | | $ | 486,868,748 | |
Average notional value of contracts sold | | | $1,020,309 | |
Foreign currency exchange contracts: | | | | |
Average US dollar amounts purchased/sold | | $ | 353,388,157 | |
Options: | | | | |
Average number of option contracts written | | | 2,940,076 | |
Average notional value of swaption purchased | | | 6,920,000 | |
Average notional value of swaption written | | | 483,540,055 | |
Credit default swaps: | | | | |
Average notional value - buy protection | | | 11,585,200 | |
Average notional value - sell protection | | | 143,880,000 | |
Interest rate swaps: | | | | |
Average notional value - pays fixed rate | | | 174,400,000 | |
Average notional value - receives fixed rate | | | 72,380,000 | |
8.Forward Foreign Currency Contracts
During the fiscal year ended October 31, 2012, the Fund invested in forward foreign currency contracts to facilitate transactions in foreign securities and to hedge against foreign currency exchange rate risk on its non-U.S. dollar denominated investment securities.
A forward foreign currency contract is an agreement between a fund and another party to buy or sell a currency at a set price at a future date. The market value of the contract will fluctuate with changes in currency exchange rates. The contract is marked-to-market daily, and the change in market value is recorded as an unrealized gain or loss. Gain or loss on the purchase or sale of contracts having the same settlement date, amount and counterparty is realized on the date of offset, otherwise gain or loss is realized on the settlement date.
Risks may arise upon entering into these contracts from the potential inability of counterparties to meet the terms of their contracts and from unanticipated movements in the value of a foreign currency relative to the U.S. dollar.
Notes to Financial Statements (continued)
9. Futures Contracts
The Fund entered into futures contracts to achieve a desired level of investment, whether to accommodate portfolio turnover or cash flows from capital shares transactions. There are certain risks associated with futures contracts. Prices may not move as expected or the Fund may not be able to close out the contract when it desires to do so, resulting in losses.
On entering into a futures contract, either cash or securities in an amount equal to a certain percentage of the contract value (initial margin) must be deposited with the futures broker. Subsequent payments (variation margin) are made or received each day. The variation margin payments equal the daily changes in the contract value and are recorded as unrealized gains or losses. The Fund recognizes a realized gain or loss when the contract is closed or expires equal to the difference between the value of the contract at the time it was opened and the value at the time it was closed. Futures are valued at their quoted daily settlement prices. The aggregate principal amounts of the contracts are not recorded in the financial statements. Fluctuations in the value of the contracts are recorded in the Statement of Assets and Liabilities as an asset (liability) and in the Statement of Operations as unrealized appreciation (depreciation) until the contracts are closed, when they are recorded as realized gains (losses) on futures contracts.
| 10. | | Interest Rate Caps and Floors, Swap Contracts and Options |
The Fund entered into over-the-counter transactions involving interest rate caps and floors, swap contracts, or purchased and written (sold) options to enter into such contracts, in order to manage its exposure to credit, currency, equity, interest rate and inflation risk.
In interest rate caps and floor agreements, one party agrees to make payments only when interest rates exceed a specified rate or “cap” or fall below a specified rate or “floor,” usually in return for payment of a fee by the other party. Interest rate caps and floors entitle the purchaser, to the extent that a specified index exceeds or falls below a predetermined interest rate, to receive payments of interest on a notional principal amount from the party selling such interest rate caps or floors.
Swap contracts represent an agreement between counterparties to exchange cash flows based on the difference between two rates applied to a notional principal amount for a specified period. The most common type of interest rate swap involves the exchange of fixed-rate cash flows for variable-rate cash flows. Swaps ordinarily do not involve the exchange of principal between the parties. Purchased options on swap contracts (“swaptions”) give the holder the right, but not the obligation, to enter into a swap contract with the counterparty which has written the option on a date, at an interest rate, and with a notional amount as specified in the swaption agreement. If the counterparty to the swap transaction defaults, the Fund will be limited to contractual remedies pursuant to the agreements governing the transaction. There is no assurance that swap or swaption contract counterparties will be able to meet their obligations under the contracts or that, in the event of default, the Fund will succeed in pursuing contractual remedies. The Fund may thus assume the risk that payments owed to the Fund under a swap or swaption contract will be delayed, or not received at all. During the term of the swap agreement or swaption, unrealized gains
or losses are recorded as a result of “marking to market.” When the swap agreement or swaption is terminated, the Fund will record a realized gain or loss equal to the difference between the proceeds from (or cost of) the closing transaction and the Fund’s basis in the contract, if any. Accrued interest and interest paid are recognized as unrealized and realized gain (loss), respectively. In each of the contracts, the Fund pays a premium to the counterparty in return for the swaption. These swaptions may be exercised by entering into a swap contract with the counterparty only on the date specified in each contract. The Fund also sold credit protection through credit default swaps. Under the terms of the swaps, the seller of the credit protection receives a periodic payment amount (premium) from the buyer that is a fixed percentage amount applied to a notional principal amount. In return, the seller agrees to pay the buyer the notional amount and take delivery of a debt instrument of the reference issuer of the same notional par amount if the reference entity is subject to a credit event (such as bankruptcy, failure to pay, or obligation acceleration) during the term of the swap.
Centrally cleared swaps listed or traded on a multilateral or trade facility platform, such as a registered exchange, are valued at the daily settlement price determined by the respective exchange. For centrally cleared credit default swaps the clearing facility requires its members to provide actionable levels across complete term structures. Daily changes in valuation of centrally cleared swaps, if any, are recorded as a receivable or payable for the change in value as appropriate (“variation margin”) on the Statement of Assets and Liabilities.
A written option contract is a contract in which the writer of the option grants the buyer of the option the right to purchase from (call option) or sell to (put option) the writer a designated instrument at a specified price within a specified period of time. Options written (sold) are recorded as liabilities. When an option expires, the premium (original option value) is realized as a gain if the option was written or as a loss if the option was purchased. When the exercise of an option results in a cash settlement, the difference between the premium and the settlement proceeds is recognized as realized gain or loss. When securities are acquired or delivered upon exercise of an option, the acquisition cost or sale proceeds are adjusted by the amount of the premium. When an option is closed, the difference between the premium and the cost to close the position is realized as a gain or loss.
| 11. | | Risks Associated with Collateralized Mortgage Obligations (“CMOs”) |
The net asset value of the Fund may be sensitive to interest rate fluctuations because the Fund may hold several instruments, including CMOs and other derivatives, whose values can be significantly impacted by interest rate movements. CMOs are obligations collateralized by a portfolio of mortgages or mortgage-related securities. Payments of principal and interest on the mortgages are passed through to the holder of the CMOs on the same schedule as they are received, although certain classes of CMOs have priority over others with respect to the receipt of prepayments on the mortgages. Therefore, the investment in CMOs may be subject to a greater or lesser risk of prepayment than other types of mortgage-related securities. CMOs may have a fixed or variable rate of interest.
Notes to Financial Statements (continued)
12. Dollar Roll and Reverse Dollar Roll Agreements
The Fund entered into dollar rolls in which it sells debt securities for delivery currently and simultaneously contract to repurchase similar, but not identical, securities at the same price or a lower price on an agreed date. The Fund receives compensation as consideration for entering into the commitment to repurchase. The compensation is the difference between the current sale price and the forward price for the future purchase (often referred to as the “drop”) as well as by the interest earned on the cash proceeds of the initial sale. The Fund may also be compensated by the receipt of a commitment fee. As the holder, the counterparty receives all principal and interest payments, including prepayments, made with respect to the similar security sold. Dollar rolls may be renewed with a new sale and repurchase price with a cash settlement made at renewal without physical delivery of the securities subject to the contract.
Certain risks may arise upon entering into dollar rolls from the potential inability of counterparties to meet the terms of their commitments. Additionally, the value of such securities may change adversely before the Fund is able to repurchase them. There can be no assurance that the Fund’s use of the cash that it receives from a dollar roll will provide a return that exceeds its cost.
13. Market, Credit and Counterparty Risks
In the normal course of business, the Fund invests in securities and enter into transactions where risks exist due to market fluctuations and are exposed to credit risk with parties with whom it trades (issuers or counterparties). Market prices of investments held by the Fund may fall rapidly or unpredictably and will rise and fall due to changing economic, political, or market conditions or in response to events that affect particular industries or companies. The Fund may be exposed to credit or counterparty risk, or the risk that an institution or other entity with which the Fund has unsettled or open transactions will default or not perform under the contract. The Fund minimizes credit risk and counterparty risk by undertaking transactions with a large number of customers and counterparties on recognized and reputable exchanges. The Fund could lose money if the issuer or guarantor of a fixed income security, or the counterparty to a financial derivatives contract, repurchase agreement or a loan of portfolio securities, is unable or unwilling to make timely principal and/or interest payments, or to otherwise honor its obligations.
The Fund is subject to various Master Agreements, which govern the terms of certain transactions with select counterparties. These Master Agreements reduce the counterparty risk associated with relevant transactions by specifying credit protection mechanisms and providing standardization that improves legal certainty. Master Agreements can also help limit counterparty risk by specifying collateral posting arrangements at pre-arranged exposure levels. Under the Master Agreements, collateral is routinely transferred if the total net exposure to certain transactions (net of existing collateral already in place) governed under the relevant master agreement with a counterparty in a given account exceeds a
specified threshold, which typically ranges from zero to $250,000 depending on the counterparty and the type of Master Agreement.
International Swaps and Derivatives Association, Inc. Master Agreements (“ISDA Master Agreements”) govern OTC financial derivative transactions entered into by the Fund and those counterparties. The ISDA Master Agreements maintain provisions for general obligations, representations, agreements, collateral and events of default or termination. Certain ISDA Master Agreements allow counterparties to OTC derivatives to terminate derivative contracts prior to maturity in the event the Fund’s net assets decline by a stated percentage or the Fund fails to meet the terms of the ISDA Master Agreement, which requires accelerated settlement of all outstanding transactions under the applicable ISDA Master Agreement. Any election to early terminate could be material to the financial statements.
14. New Accounting Pronouncements
In December 2011, the Financial Account Standards Board (“FASB”) issued Accounting Standards Update (“ASU”) No. 2011- 11 “Disclosures about Offsetting Assets and Liabilities.” ASU 2011-11 requires disclosures to make financial statements that are prepared under U.S. GAAP more comparable to those prepared under International Financial Reporting Standards (“IFRS”). The new disclosure requirements mandate that entities disclose both gross and net information about instruments and transactions eligible for offset in the Statement of Assets and Liabilities as well as instruments and transactions subject to an agreement similar to a master netting arrangement. In addition, ASU 2011-11 requires disclosure of collateral received and posted in connection with master netting agreements or similar arrangements. New disclosures are required for annual reporting periods beginning on or after January 1, 2013, and interim periods within those annual periods. Management is evaluating the impact of ASU 2011-11 on the Fund’s financial statements and disclosures.
15. Subsequent Events
The Fund has determined that no material events or transactions occurred through the issuance of the Fund’s financial statements, which require additional disclosure in the Fund’s financial statements.
Tax Information (unaudited)
The Fund hereby designates the maximum amount allowable of its net taxable income as qualified dividends as provided in the Jobs and Growth Tax Relief Reconciliation act of 2003. The 2011 Form 1099-DIV you receive for the Fund will show the tax status of all distributions paid to you during the year.
Pursuant to section 852 of the Internal Revenue Code, Managers Pimco Bond Fund hereby designate $0, as a capital gain distribution with respect to the taxable fiscal year ended October 31, 2012, or if subsequently determined to be different, the net capital gains of such fiscal year.
41
Report of Independent Registered Public Accounting Firm
To the Board of Trustees of Managers Trust I and the Shareholders of Managers PIMCO Bond Fund:
In our opinion, the accompanying statement of assets and liabilities, including the schedule of portfolio investments, and the related statements of operations and of changes in net assets and the financial highlights present fairly, in all material respects, the financial position of Managers PIMCO Bond Fund (the “Fund”) at October 31, 2012, and the results of its operations, the changes in its net assets and the financial highlights for each of periods indicated, in conformity with accounting principles generally accepted in the United States of America. These financial statements and financial highlights (hereafter referred to as “financial statements”) are the responsibility of the Funds’ management. Our responsibility is to express an opinion on these financial statements based on our audits. We conducted our audits of these financial statements in accordance with the standards of the Public Company Accounting Oversight Board (United States). Those standards require that we plan and perform the audit to obtain reasonable assurance about whether the financial statements are free of material misstatement. An audit includes examining, on a test basis, evidence supporting the amounts and disclosures in the financial statements, assessing the accounting principles used and significant estimates made by management, and evaluating the overall financial statement presentation. We believe that our audits, which included confirmation of securities at October 31, 2012 by correspondence with the custodian, brokers and the application of alternative auditing procedures where securities purchased had not been received, provide a reasonable basis for our opinion.
PricewaterhouseCoopers LLP
Boston, Massachusetts
December 27, 2012
42
Trustees and Officers
The Trustees and Officers of the Trust, their business addresses, principal occupations for the past five years and dates of birth are listed below. The Trustees provide broad supervision over the affairs of the Trust and the Funds. The Trustees are experienced executives who meet periodically throughout the year to oversee the Funds’ activities, review contractual arrangements with companies that provide services to the Funds, and review the Funds’ performance. Unless otherwise noted, the address of each Trustee or Officer is the address of the Trust: 800 Connecticut Avenue, Norwalk, Connecticut 06854.
There is no stated term of office for Trustees. Trustees serve until their resignation, retirement or removal in accordance with the Trust’s organizational documents and policies adopted by the Board from time to time. The Chairman of the Trustees, President, Treasurer and Secretary of the Trust are elected by the Trustees annually. Other officers hold office at the pleasure of the Trustees.
Independent Trustees
The following Trustees are not “interested persons” of the Trust within the meaning of the 1940 Act:
| | |
Name, Date of Birth, Number of
Funds Overseen in Fund
Complex* | | Principal Occupation(s) During Past
5 Years and Other Directorships
Held by Trustee |
Jack W. Aber,
9/9/37 • Trustee since 2000 • Oversees 38 Funds in Fund Complex | | Professor of Finance, Boston University School of Management (1972-Present); Trustee of Appleton Growth Fund (1 portfolio); Trustee of Third Avenue Trust (5 portfolios); Trustee of Third Avenue Variable Trust (1 portfolio); Trustee of Aston Funds (26 portfolios). |
Bruce B. Bingham,
12/01/48 • Trustee since 2012 • Oversees 38 Funds in Fund Complex | | Partner, Hamilton Partners (real estate development firm)(1987-Present). |
William E. Chapman, II,
9/23/41 • Independent Chairman • Trustee since 2000 • Oversees 38 Funds in Fund Complex | | President and Owner, Longboat Retirement Planning Solutions (1998-Present); Hewitt Associates, LLC (part time) (provider of Retirement and Investment Education Seminars) (2002-2009); Trustee of Bowdoin College (2002-Present); Director of Harding, Loevner Funds, Inc. (6 portfolios); Trustee of Third Avenue Trust (5 portfolios); Trustee of Third Avenue Variable Trust (1 portfolio); Trustee of Aston Funds (26 portfolios). |
Edward J. Kaier,
9/23/45 • Trustee since 2000 • Oversees 38 Funds in Fund Complex | | Attorney at Law and Partner, Teeters Harvey Gilboy & Kaier LLP (2007-Present); Attorney at Law and Partner, Hepburn Willcox Hamilton & Putnam, LLP (1977-2007); Trustee of Third Avenue Trust (5 portfolios); Trustee of Third Avenue Variable Trust (1 portfolio); Trustee of Aston Funds (26 portfolios). |
Steven J. Paggioli,
4/3/50 • Trustee since 2000 • Oversees 38 Funds in Fund Complex | | Independent Consultant (2002-Present); Formerly Executive Vice President and Director, The Wadsworth Group (1986-2001); Executive Vice President, Secretary and Director, Investment Company Administration, LLC (1990-2001); Vice President, Secretary and Director, First Fund Distributors, Inc. (1991-2001); Trustee, Professionally Managed Portfolios (43 portfolios); Advisory Board Member, Sustainable Growth Advisors, LP; Independent Director, Chase Investment Counsel (2008 – Present); Trustee of Aston Funds (26 portfolios). |
Eric Rakowski,
6/5/58 • Trustee since 2000 • Oversees 38 Funds in Fund Complex | | Professor, University of California at Berkeley School of Law (1990-Present); Director of Harding, Loevner Funds, Inc. (6 portfolios); Trustee of Third Avenue Trust (5 portfolios); Trustee of Third Avenue Variable Trust (1 portfolio); Trustee of Aston Funds (26 portfolios). |
Thomas R. Schneeweis, 5/10/47 • Trustee since 2000 • Oversees 38 Funds in Fund Complex | | Professor of Finance, University of Massachusetts (1977-Present); Director, CISDM at the University of Massachusetts, (1996-Present); President, Alternative Investment Analytics, LLC, (formerly Schneeweis Partners, LLC) (2001-Present); Partner, S Capital Management, LLC (2007-Present); President, TRS Associates (1982-Present); Partner, White Bear Partners, LLC (2007-2010); Partner, Northampton Capital Management, LLC (2004-2010); Trustee of Aston Funds (26 portfolios). |
| * | The Fund Complex consists of Managers AMG Funds, The Managers Funds, Managers Trust I and Managers Trust II. |
Interested Trustees
Each Trustee in the following table is an “interested person” of the Trust within the meaning of the 1940 Act. Ms. Carsman is an interested person of the Trust within the meaning of the 1940 Act by virtue of her position with, and interest in securities of, AMG, and her former position as Chief Legal Officer of the Trust.
| | |
Name, Date of Birth, Number of
Funds Overseen in Fund
Complex* | | Principal Occupation(s) During Past
5 Years and Other Directorships
Held by Trustee |
Christine C. Carsman,
4/2/52 • Trustee since 2011 • Oversees 38 Funds in Fund Complex | | Deputy General Counsel, Affiliated Managers Group, Inc. (2011-Present); Senior Vice President and Chief Regulatory Counsel, Affiliated Managers Group, Inc. (2004-Present); Secretary and Chief Legal Officer, Managers AMG Funds, The Managers Funds, Managers Trust I and Managers Trust II (2004-2011); Senior Counsel, Vice President and Director of Operational Risk Management and Compliance, Wellington Management Company, LLP (1995-2004). |
| Officers | | |
Name, Date of Birth, Position(s)
Held with Fund and Length of
Time Served | | Principal Occupation(s) During Past
5 Years |
Keitha L. Kinne,
5/16/58 • President since 2012 • Chief Operating Officer since 2007 | | Managing Partner and Chief Operating Officer, Managers Investment Group LLC (2007-Present); Chief Operating Officer, The Managers Funds, Managers AMG Funds and Managers Trust II (2007-Present); Chief Investment Officer, Managers Investment Group LLC (2008-Present); President, Managers Distributors, Inc. (2012-Present); Managing Director, Legg Mason & Co., LLC (2006-2007); Managing Director, Citigroup Asset Management (2004-2006). |
Lewis Collins,
2/22/66 • Secretary since 2011 • Chief Legal Officer since 2011 | | Senior Vice President and Senior Counsel, Affiliated Managers Group, Inc. (2010-Present); Vice President and Senior Counsel, Affiliated Managers Group, Inc. (2006-2010); Senior Counsel, Affiliated Managers Group, Inc. (2002-2006); Attorney, Ropes & Gray LLP (1998-2002). |
Donald S. Rumery,
5/29/58 • Chief Financial Officer since 2007 • Treasurer since 2000 | | Senior Vice President, Managers Investment Group LLC (2005-Present); Treasurer and Chief Financial Officer, Managers Distributors, Inc. (2000-Present); Treasurer, The Managers Funds (1995-Present); Treasurer, Managers AMG Funds (1999-Present); Treasurer, Managers Trust II (2000-Present); Chief Financial Officer, The Managers Funds, Managers AMG Funds and Managers Trust II (2007-Present); Vice President, The Managers Funds LLC, (1994-2004). |
John J. Ferencz,
3/09/62 • Chief Compliance Officer since 2010 | | Vice President, Legal and Compliance, Managers Investment Group LLC (2010-Present); Senior Compliance Analyst, Mutual Funds and Regulatory, GE Asset Management Incorporated (2005-2010). |
Michael S. Ponder, 9/12/73 • Assistant Secretary since 2011 | | Senior Vice President and Counsel, Managers Investment Group LLC (2011-Present); Attorney, DeNovo Legal (2009-2010); Vice President, Credit Suisse (2007-2009); Associate, Willkie Farr & Gallagher LLP (2006-2007). |
43
Annual Renewal of Investment Advisory Agreement
On June 21-22, 2012, the Board of Trustees, including a majority of the Trustees who are not “interested persons” of the Trust (the “Independent Trustees”), approved the Investment Management Agreement with the Investment Manager for the Managers PIMCO Bond Fund (the “Fund”) and the Subadvisory Agreement for the Subadvisor of the Fund. The Independent Trustees were separately represented by independent counsel in connection with their consideration of the approval of these agreements. In considering the Investment Management and Subadvisory Agreements, the Trustees reviewed a variety of materials relating to the Fund, the Investment Manager and the Subadvisor, including comparative performance, fee and expense information for an appropriate peer group of similar mutual funds (the “Peer Group”), performance information for the relevant benchmark index (the “Fund Benchmark”) and, with respect to the Subadvisor, comparative performance information for an appropriate peer group of managed accounts, and, as to all other matters, other information provided to them on a periodic basis throughout the year, as well as information provided in connection with the meetings of June 21-22, 2012, regarding the nature, extent and quality of services provided by the Investment Manager and the Subadvisor under their respective agreements. Prior to voting, the Independent Trustees: (a) reviewed the foregoing information with their independent legal counsel and with management; (b) received materials from their independent legal counsel discussing the legal standards applicable to their consideration of the Investment Management Agreement and the Subadvisory Agreement; and (c) met with their independent legal counsel in private sessions at which no representatives of management were present.
Nature, extent, and quality of services.
In considering the nature, extent and quality of the services provided by the Investment Manager, the Trustees reviewed information relating to the Investment Manager’s operations and personnel. Among other things, the Investment Manager provided financial information, biographical information on its supervisory and professional staff and descriptions of its organizational and management structure. The Trustees also took into account information provided periodically throughout the previous year by the Investment Manager relating to the performance of its duties with respect to the Fund and the Trustees’ familiarity with the Investment Manager’s management through Board meetings, discussions and reports. In the course of their deliberations regarding the Investment Management Agreement, the Trustees evaluated, among other things: (a) the extent and quality of the Investment Manager’s oversight of the operation and management of the Fund; (b) the quality of the search, selection and monitoring services performed by the Investment Manager in overseeing the portfolio management responsibilities of the Subadvisor; (c) the Investment Manager’s ability to supervise the Fund’s other service providers; and (d) the Investment Manager’s compliance program. The Trustees also took into account the financial condition of the Investment Manager with respect to its ability to provide the services required under the Investment Management Agreement and to maintain a contractual expense limitation for the Fund. The Trustees also considered the Investment Manager’s risk management processes.
The Trustees also reviewed information relating to the Subadvisor’s operations and personnel and the investment philosophy, strategies and techniques (the “Investment Strategy”) used in managing the Fund. Among other things, the Trustees reviewed biographical information on portfolio management and other professional staff, information regarding the Subadvisor’s organizational and management structure and the Subadvisor’s brokerage policies and practices. The Trustees considered specific information provided regarding the experience of the individual or individuals at the Subadvisor with portfolio management responsibility for the Fund, including the information set forth in the Fund’s prospectus and statement of additional information. In the course of their deliberations, the Trustees evaluated, among other things: (a) the services rendered by the Subadvisor in the past; (b) the qualifications and experience of the Subadvisor’s personnel; and (c) the Subadvisor’s compliance program. The Trustees also took into account the financial condition of the Subadvisor with respect to its ability to provide the services required under the Subadvisory Agreement. The Trustees also considered the Subadvisor’s risk management processes.
Performance.
Among other information relating to the Fund���s performance, the Trustees noted that the Fund’s performance for the 1-year, 3-year, 5-year and 10-year periods ended March 31, 2012 was below, above, above and above, respectively, the median performance of the Peer Group and below, above, above and above, respectively, the performance of the Fund Benchmark, the Barclays U.S. Aggregate Bond Index®. The Board took into account management’s discussion of the Fund’s more recent performance. The Trustees also took into account the fact that the Fund ranked at or near the top decile of the Peer Group for the 5-year and 10-year periods. The Trustees concluded that the Fund’s overall performance has been satisfactory.
As noted above, the Board considered the Fund’s net performance during relevant time periods as compared to the Fund’s Peer Group and Fund Benchmark and considered the Subadvisor’s performance as compared to an appropriate peer group of managed accounts and also considered the gross performance of the Fund as compared to the Subadvisor’s relevant performance composite that utilizes the same investment strategy and approach and noted that the Board reviews on a quarterly basis detailed information about the Fund’s performance results, portfolio composition and Investment Strategies. The Board noted the Investment Manager’s expertise and resources in monitoring the performance, investment style and risk-adjusted performance of the Subadvisor. The Board was mindful of the Investment Manager’s attention to monitoring the Subadvisor’s performance with respect to the Fund and its discussions with management regarding the factors that contributed to the performance of the Fund.
44
Annual Renewal of Investment Advisory Agreement
Advisory and Subadvisory Fees and Profitability.
In considering the reasonableness of the advisory fee charged by the Investment Manager for managing the Fund, the Trustees noted that the Investment Manager, and not the Fund, is responsible for paying the fees charged by the Fund’s Subadvisor and, therefore, that the fees paid to the Investment Manager cover the cost of providing portfolio management services as well as the cost of providing search, selection and monitoring services in operating a “manager-of-managers” complex of mutual funds. The Trustees concluded that, in light of the additional high quality supervisory services provided by the Investment Manager and the fact that the subadvisory fees are paid out of the advisory fee, the advisory fee payable by the Fund to the Investment Manager can reasonably be expected to exceed the median advisory fee for the Peer Group, which consists of many funds that do not operate with a manager-of-managers structure. In this regard, the Trustees also noted that the Investment Manager has undertaken to maintain an expense limitation for the Fund.
In considering the reasonableness of the advisory fee payable to the Investment Manager, the Trustees also reviewed information provided by the Investment Manager setting forth all revenues and other benefits, both direct and indirect (including any so-called “fallout benefits” such as reputational value derived from the Investment Manager serving as Investment Manager to the Fund), received by the Investment Manager and its affiliates attributable to managing the Fund and all the mutual funds in the Managers Family of Funds, the cost of providing such services and the resulting profitability to the Investment Manager and its affiliates from these relationships. The Trustees also noted the current and potential asset levels of the Fund and the willingness of the Investment Manager to waive fees and pay expenses for the Fund from time to time as a means of limiting the total expenses of the Fund. The Trustees also considered management’s discussion of the current asset level of the Fund, including the effect on assets attributable to the economic and market conditions since 2008, and considered the impact on profitability of the current asset level and any future growth of assets of the Fund. The Board took into account management’s discussion of the current advisory fee structure. Based on the foregoing, the Trustees concluded that the profitability to the Investment Manager is reasonable and that the Investment Manager is not realizing material benefits from economies of scale that would warrant adjustments to the advisory fees for the Fund at this time. With respect to economies of scale, the Trustees also noted that as the Fund’s assets increase over time, the Fund may realize other economies of scale to the extent that the increase in assets is proportionally greater than the increase in certain other expenses.
In considering the reasonableness of the fee payable by the Investment Manager to the Subadvisor, the Trustees relied on the ability of the Investment Manager to negotiate the terms of the Subadvisory Agreement at arm’s length as part of the manager-of-managers structure, noting that the Subadvisor is not affiliated with the Investment Manager. In addition, the Trustees considered other potential benefits of the subadvisory relationship to the Subadvisor, including, among others, the indirect benefits that the Subadvisor may receive from the Subadvisor’s relationship with the Fund, including any so-called “fallout benefits” to the Subadvisor, such as reputational value derived from the Subadvisor serving as Subadvisor to the Fund, which bears the Subadvisor’s name. In addition, the Trustees noted that the subadvisory fees are paid by the Investment Manager out of its advisory fee. As a consequence, the cost of services to be provided by the Subadvisor and the profitability to the Subadvisor of its relationship with the Fund were not material factors in the Trustees’ deliberations. For similar reasons, the Trustees did not consider potential economies of scale in the management of the Fund by the Subadvisor to be a material factor in their deliberations at this time.
The Trustees noted that the Fund’s advisory fees (which include both the advisory and administration fee) and total expenses (net of applicable expense waivers/reimbursements) as of March 31, 2012 were higher and lower, respectively, than the average for the Peer Group. The Trustees took into account the fact that the Investment Manager has contractually agreed, through March 1, 2013, to limit the Fund’s net annual operating expenses (subject to certain excluded expenses) to 0.58%. The Trustees also took into account management discussion of the Fund’s expenses. The Trustees concluded that, in light of the nature, extent and quality of the services provided by the Investment Manager and the Subadvisor, the foregoing expense limitation and the considerations noted above with respect to the Subadvisor and the Investment Manager, the Fund’s advisory fees, including subadvisory fees, are reasonable.
****
After consideration of the foregoing, the Trustees also reached the following conclusions (in addition to the conclusions discussed above) regarding the Investment Management Agreement and the Subadvisory Agreement: (a) the Investment Manager and the Subadvisor have demonstrated that they possess the capability and resources to perform the duties required of them under the Investment Management Agreement and the Subadvisory Agreement; (b) the Subadvisor’s Investment Strategy is appropriate for pursuing the Fund’s investment objectives; and (c) the Investment Manager and the Subadvisor maintain appropriate compliance programs.
Based on all of the above-mentioned factors and related conclusions, with no single factor or conclusion being determinative and with each Trustee not necessarily attributing the same weight to each factor, the Trustees concluded that approval of the Investment Management Agreement and the Subadvisory Agreement would be in the best interests of the Fund and its shareholders. Accordingly, on June 21-22, 2012, the Trustees, including a majority of the Independent Trustees, voted to approve the Investment Management Agreement and the Subadvisory Agreement for the Fund.
45
Investment Manager and Administrator
Managers Investment Group LLC
800 Connecticut Ave.
Norwalk, CT 06854
(800) 835-3879
Distributor
Managers Distributors, Inc.
800 Connecticut Ave.
Norwalk, CT 06854
(800) 835-3879
Subadvisor
Pacific Investment Management Co. LLC (“PIMCO”)
840 Newport Center Drive
Newport Beach, CA 92660
Custodian
The Bank of New York Mellon
2 Hanson Place
Brooklyn, NY 11217
Legal Counsel
Ropes & Gray LLP
Prudential Tower, 800 Boylston Street
Boston, MA 02199-3600
Transfer Agent
BNY Mellon Investment Servicing (US) Inc.
Attn: Managers
P.O. Box 9769
Providence, RI 02940
(800) 548-4539
For ManagersChoice™ Only
Managers
c/o BNY Mellon Investment Servicing (US) Inc.
P.O. Box 9847
Providence, Rhode Island 02940-8047
(800) 358-7668

THIS PAGE INTENTIONALLY LEFT BLANK
THIS PAGE INTENTIONALLY LEFT BLANK
MANAGERSAND MANAGERS AMG FUNDS
| | | | |
EQUITY FUNDS | | BALANCED FUNDS |
| CADENCE CAPITAL APPRECIATION | | REAL ESTATE SECURITIES | | CHICAGO EQUITY PARTNERS BALANCED |
| CADENCE MID-CAP | | Urdang Securities Management, Inc. | | Chicago Equity Partners, LLC |
| CADENCE EMERGING COMPANIES | | | | |
Cadence Capital Management, LLC | | RENAISSANCE LARGE CAP GROWTH | | ALTERNATIVE FUNDS |
| | Renaissance Group LLC | | FQ GLOBAL ALTERNATIVES |
| ESSEX SMALL/MICRO CAP GROWTH | | | | FQ GLOBAL ESSENTIALS |
Essex Investment Management Co., LLC | | SKYLINE SPECIAL EQUITIES | | First Quadrant, L.P. |
| | PORTFOLIO | | |
FQ TAX-MANAGED U.S. EQUITY | | Skyline Asset Management, L.P. | | INCOME FUNDS |
FQ U.S. EQUITY | | | | BOND (MANAGERS) |
First Quadrant, L.P. | | SPECIAL EQUITY | | GLOBAL INCOME OPPORTUNITY |
| | Ranger Investment Management, L.P. | | Loomis, Sayles & Co., L.P. |
FRONTIER SMALL CAP GROWTH | | Lord, Abbett & Co. LLC | | |
Frontier Capital Management Company, LLC | | Smith Asset Management Group, L.P. | | BOND (MANAGERS PIMCO) |
| | Federated MDTA LLC | | Pacific Investment Management Co. LLC |
GW&K SMALL CAP EQUITY | | | | |
Gannett Welsh & Kotler, LLC | | SYSTEMATIC VALUE | | CALIFORNIA INTERMEDIATE TAX-FREE |
| | SYSTEMATIC MID CAP VALUE | | Miller Tabak Asset Management LLC |
MICRO-CAP | | Systematic Financial Management, L.P. | | |
Lord, Abbett & Co. LLC | | | | GW&K FIXED INCOME FUND |
WEDGE Capital Management L.L.P. | | TIMESSQUARE MID CAP GROWTH | | GW&K MUNICIPAL BOND |
Next Century Growth Investors LLC | | TIMESSQUARE SMALL CAP GROWTH | | GW&K MUNICIPAL ENHANCED YIELD |
RBC Global Asset Management (U.S.) Inc. | | TSCM GROWTH EQUITY | | Gannett Welsh & Kotler, LLC |
| | TimesSquare Capital Management, LLC | | |
| | | | HIGH YIELD |
| | TRILOGY GLOBAL EQUITY | | J.P. Morgan Investment Management LLC |
| | TRILOGY EMERGING MARKETS EQUITY | | |
| | TRILOGY INTERNATIONAL SMALL CAP | | INTERMEDIATE DURATION GOVERNMENT |
| | Trilogy Global Advisors, L.P. | | SHORT DURATION GOVERNMENT |
| | | | Smith Breeden Associates, Inc. |
| | YACKTMAN FUND | | |
| | YACKTMAN FOCUSED FUND | | |
| | Yacktman Asset Management L.P. | | |
This report is prepared for the Fund’s shareholders. It is authorized for distribution to prospective investors only when preceded or accompanied by an effective prospectus. To receive a free copy of the prospectus or Statement of Additional Information, which includes additional information about Fund Trustees, please contact us by calling 800.835.3879. Distributed by Managers Distributors, Inc., member FINRA. A description of the policies and procedures each Fund uses to vote its proxies is available: (i) without charge, upon request, by calling 800.835.3879, or (ii) on the Securities and Exchange Commission’s (SEC) Web site at www.sec.gov. For information regarding each Fund’s proxy voting record for the 12-month period ended June 30, call 800.835.3879 or visit the SEC Web site at www.sec.gov. The Fund files its complete schedule of portfolio holdings with the SEC for the first and third quarters of each fiscal year on Form N-Q. The Funds’ Forms N-Q are available on the SEC’s Web site at www.sec.gov. A Fund’s Forms N-Q may be reviewed and copied at the SEC’s Public Reference Room in Washington, DC. Information on the operation of the Public Reference Room may be obtained by calling 800.SEC.0330. To review a complete list of the Fund’s portfolio holdings, or to view the most recent quarterly holdings report, semiannual report, or annual report, please visit www.managersinvest.com. | |  |

Registrant has adopted a Code of Ethics. See attached Exhibit (a)(1).
| Item 3. | AUDIT COMMITTEE FINANCIAL EXPERT |
Registrant’s Board of Trustees has determined that independent Trustees Mr. Jack W. Aber and Mr. Steven J. Paggioli each qualify as the Audit Committee Financial Expert. Mr. Aber and Mr. Paggioli are “independent” as such term is defined in Form N-CSR.
| Item 4. | PRINCIPAL ACCOUNTANT FEES AND SERVICES |
The aggregate fees billed by PwC to the Fund for the Funds’ two most recent fiscal years for professional services rendered for audits of annual financial statements, or services that are normally provided in connection with statutory and regulatory filings or engagements (“Audit Fees”) were as follows:
| | | | | | | | |
| | | Fiscal 2012 | | | Fiscal 2011 | |
Managers AMG FQ Tax-Managed U.S. Equity Fund | | | 20,863 | | | | 20,863 | |
Managers AMG FQ U.S. Equity Fund | | | 20,735 | | | | 20,735 | |
Managers AMG FQ Global Alternatives Fund | | | 28,266 | | | | 28,266 | |
Managers AMG FQ Global Essentials Fund | | | 23,289 | | | | 23,289 | |
Managers Frontier Small Cap Growth Fund | | | 18,920 | | | | 18,920 | |
Managers Micro-Cap Fund | | | 20,248 | | | | 20,248 | |
Managers Institutional Micro-Cap Fund | | | — | | | | — | |
Managers Real Estate Securities Fund | | | 20,164 | | | | 20,164 | |
Managers PIMCO Bond Fund | | | 41,807 | | | | 41,807 | |
Managers CA Intermediate Tax-Free Fund | | | 19,893 | | | | 19,893 | |
Managers AMG TSCM Growth Equity Fund | | | 15,320 | | | | 15,320 | |
Audit-Related Fees
There were no fees billed by PwC to the Fund in its two recent fiscal years for services rendered for assurance and related services that are reasonably related to the performance of the audit or review of the Fund’s financial statements, but are not reported as Audit Fees (“Audit-Related Fees”).
For the Funds’ two most recent fiscal years, there were no Audit-Related Fees billed by PwC for engagements related directly to the operations and financial reporting of one or more Funds by a Fund Service Provider. A Fund Service Provider is (a) any investment adviser
to the Fund (not including any Subadvisor whose role is primarily portfolio management and is subcontracted with or overseen by another investment adviser) or (b) any entity that provides ongoing services to the Fund and is controlling, controlled by or under common control with a Fund investment adviser described in (a).
Tax Fees
The aggregate fees billed by PwC to the Funds for the two most recent fiscal years for professional services rendered for tax compliance, tax advice, and tax planning (“Tax Fees”) were as follows:
| | | | | | | | |
| | | Fiscal 2012 | | | Fiscal 2011 | |
Managers AMG FQ Tax-Managed U.S. Equity Fund | | | 6,830 | | | | 6,700 | |
Managers AMG FQ U.S. Equity Fund | | | 6,830 | | | | 6,700 | |
Managers AMG FQ Global Alternatives Fund | | | 6,830 | | | | 9,500 | |
Managers AMG FQ Global Essentials Fund | | | 6,830 | | | | 9,500 | |
Managers Frontier Small Cap Growth Fund | | | 6,830 | | | | 6,700 | |
Managers Micro-Cap Fund | | | 6,830 | | | | 6,700 | |
Managers Institutional Micro-Cap Fund | | | — | | | | 6,700 | |
Managers Real Estate Securities Fund | | | 8,930 | | | | 8,750 | |
Managers PIMCO Bond Fund | | | 10,710 | | | | 10,500 | |
Managers CA Intermediate Tax-Free Fund | | | 6,830 | | | | 6,700 | |
Managers AMG TSCM Growth Equity Fund | | | 5,610 | | | | 4,250 | |
Fund commenced operations on August 1, 2010
For the Funds’ two most recent fiscal years, Tax Fees billed by PwC for engagements by Fund Service Providers that related directly to the operations and financial reporting of the Funds were $0 for fiscal 2007 and $0 for fiscal 2006, respectively.
The services for which Tax Fees were charged comprise all services performed by professional staff in PwC’s tax division except those services related to the audit. Typically, this category would include fees for tax compliance, tax planning, and tax advice. Tax compliance, tax advice, and tax planning services include preparation of original and amended tax returns, claims for refund and tax payment-planning services, assistance with tax audits and appeals, tax advice related to mergers and acquisitions and requests for rulings or technical advice from taxing authorities.
All Other Fees
There were no other fees billed by PwC to the Funds for all other non-audit services (“Other Fees”) during the Funds’ two most recent fiscal years. During the same period, there were no Other Fees billed by PwC for engagements by Fund Service Providers that related directly to the operations and financial reporting of the Funds.
According to policies adopted by the Audit Committee, services provided by PwC to the Funds must be pre-approved by the Audit Committee. On an annual basis, the Audit Committee reviews and pre-approves various types of services that PwC may perform for the Funds without specific approval of each engagement, subject to specified budget limitations. As contemplated by the Sarbanes-Oxley Act of 2002 and related SEC rules, the Audit Committee also pre-approves non-audit services provided by PwC to any Fund Service Provider for any engagement that relates directly to the operations and financial reporting of the Funds. Any engagement that is not already pre-approved or that will exceed a pre-approved budget must be submitted to the Audit Committee for pre-approval. The Chairman of the Audit Committee is authorized on behalf of the Board of Trustees and the Audit Committee to approve the engagement of PwC to perform non-audit services subject to certain conditions, including notification to the Audit Committee of such pre-approval not later than the next meeting of the Audit Committee following the date of such pre-approval.
There were no other fees billed by PwC for non-audit services rendered to the Funds and to Fund Service Providers for the Funds’ two most recent fiscal years.
The Audit Committee has considered whether the provision of non-audit services by PwC to Fund Service Providers that were not required to be pre-approved by the Audit Committee is compatible with maintaining PwC’s independence in its audit of the Funds, taking into account representations from PwC, in accordance with Independence Standards Board Standard No. 1, regarding its independence from the Funds and its related entities.
The following table sets forth the non-audit services provided by PwC to the Funds and its service affiliates defined as the Funds’ investment advisor and any entity controlling, controlled by or under common control with Managers Investment Group LLC that provides ongoing services to the Funds (“Control Affiliates”) for the last two fiscal years.
| | | | | | | | | | | | | | | | | | | | | | | | |
| | | Audit-related fees A | | | Tax fees A | | | All other fees A | |
| | | 2011 | | | 2010 | | | 2011 | | | 2010 | | | 2011 | | | 2010 | |
Control Affiliates | | $ | 417,385 | | | $ | 424,730 | | | $ | 1,647,710 | | | $ | 747,820 | | | $ | 0 | | | $ | 0 | |
| A | Aggregate amounts may reflect rounding. |
| Item 5. | AUDIT COMMITTEE OF LISTED REGISTRANTS |
Not applicable.
| Item 6. | SCHEDULE OF INVESTMENTS |
The schedule of investments in unaffiliated issuers as of the close of the reporting period is included as part of the shareholder report contained in Item 1 hereof.
| Item 7. | DISCLOSURE OF PROXY VOTING POLICIES AND PROCEDURES FOR CLOSED-END MANAGEMENT INVESTMENT COMPANIES |
Not applicable.
| Item 8. | PORTFOLIO MANAGERS OF CLOSED-END MANAGEMENT INVESTMENT COMPANIES |
Not applicable.
| Item 9. | PURCHASES OF EQUITY SECURITIES BY CLOSED-END MANAGEMENT INVESTMENT COMPANIES AND AFFILIATED PURCHASERS |
Not applicable.
| Item 10. | SUBMISSION OF MATTERS TO A VOTE OF SECURITY HOLDERS |
Not applicable.
| Item 11. | CONTROLS AND PROCEDURES |
(a) The Registrant’s principal executive and principal financial officers have concluded, based on their evaluation of the registrant’s disclosure controls and procedures as of a date within 90 days of the filing of this report, that the Registrant’s disclosure controls and procedures are reasonably designed to ensure that information required to be disclosed by the Registrant on Form N-CSR is recorded, processed, summarized and reported within the required time periods and that information required to be disclosed by the registrant in the reports that it files or submits on Form N-CSR is accumulated and communicated to the Registrant’s management, including its principal executive and principal financial officers, as appropriate to allow timely decisions regarding required disclosure.
(b) There were no changes in the Registrant’s internal control over financial reporting during the Registrant’s fourth fiscal quarter of the period covered by this report that have materially affected, or are reasonably likely to affect, the internal control over financial reporting.
Item 12. EXHIBITS
| | |
| |
| (a)(1) | | Any Code of Ethics or amendments hereto. Filed herewith. |
| |
| (a)(2) | | Certifications pursuant to Rule 30a-2(a) under the Investment Company Act of 1940 – Filed herewith. |
| |
| (a)(3) | | Not applicable. |
| |
| (b) | | Certifications pursuant to Rule 30a-2(b) under the Investment Company Act of 1940 – Filed herewith. |
SIGNATURES
Pursuant to the requirements of the Securities Exchange Act of 1934 and the Investment Company Act of 1940, the registrant has duly caused this report to be signed on its behalf by the undersigned, thereunto duly authorized.
MANAGERS TRUST I
| | |
| |
| By: | | /s/ Keitha L. Kinne |
| | Keitha L. Kinne, Chief Operating Officer |
| |
| Date: | | January 7, 2013 |
Pursuant to the requirements of the Securities Exchange Act of 1934 and the Investment Company Act of 1940, this report has been signed below by the following persons on behalf of the registrant and in the capacities and on the dates indicated.
| | |
| By: | | /s/ Keitha L. Kinne |
| | Keitha L. Kinne, Chief Operating Officer |
| |
| Date: | | January 7, 2013 |
| | |
| By: | | /s/ Donald S. Rumery |
| | Donald S. Rumery, Chief Financial Officer |
| |
| Date: | | January 7, 2013 |