UNITED STATES
SECURITIES AND EXCHANGE COMMISSION
Washington, D.C. 20549
FORM N-CSR
CERTIFIED SHAREHOLDER REPORT OF
REGISTERED MANAGEMENT INVESTMENT COMPANIES
Investment Company Act file number: 811-06520
MANAGERS TRUST I
(Exact name of registrant as specified in charter)
800 Connecticut Avenue, Norwalk, Connecticut 06854
(Address of principal executive offices) (Zip code)
Managers Investment Group LLC
800 Connecticut Avenue, Norwalk, Connecticut 06854
(Name and address of agent for service)
Registrant’s telephone number, including area code: (203) 299-3500
Date of fiscal year end: OCTOBER 31
Date of reporting period: NOVEMBER 1, 2010 - OCTOBER 31, 2011
(Annual Shareholder Report)
Item 1. Reports to Shareholders
Managers AMG FQ Funds
FQ Tax-Managed U.S. Equity, FQ U.S. Equity, FQ Global Alternatives, FQ Global Essentials
Annual Report—October 31, 2011
| | | | |
TABLE OF CONTENTS | | Page | |
LETTER TO SHAREHOLDERS | | | 1 | |
| |
ABOUT YOUR FUND’S EXPENSES | | | 4 | |
| |
INVESTMENT MANAGER’S COMMENTS, FUND SNAPSHOTS, AND SCHEDULES OF PORTFOLIO INVESTMENTS | | | | |
| |
FQ Tax-Managed U.S. Equity Fund | | | 5 | |
| |
FQ U.S. Equity Fund | | | 10 | |
| |
FQ Global Alternatives Fund | | | 16 | |
| |
FQ Global Essentials Fund | | | 18 | |
| |
NOTES TO SCHEDULES OF PORTFOLIO INVESTMENTS | | | 20 | |
| |
FINANCIAL STATEMENTS: | | | | |
| |
Statements of Assets and Liabilities | | | 22 | |
FQ Tax-Managed U.S. Equity and FQ U.S. Equity | | | | |
Fund balance sheets, net asset value (NAV) per share computations and cumulative undistributed amounts | | | | |
| |
Statement of Net Assets | | | 23 | |
FQ Global Alternatives and FQ Global Essentials | | | | |
Portfolio of Investments, Fund balance sheet, net asset value (NAV) per share computations and cumulative undistributed amounts | | | | |
| |
Statements of Operations | | | 32 | |
Detail of sources of income, Fund expenses, and realized and unrealized gains (losses) during the fiscal year | | | | |
| |
Statements of Changes in Net Assets | | | 33 | |
Detail of changes in Fund assets for the past two fiscal years | | | | |
| |
FINANCIAL HIGHLIGHTS | | | 35 | |
Historical net asset values per share, distributions, total returns, expense ratios, turnover ratios and net assets | | | | |
| |
NOTES TO FINANCIAL STATEMENTS | | | 43 | |
Accounting and distribution policies, details of agreements and transactions with Fund management and affiliates, and descriptions of certain investment risks | | | | |
| |
REPORT OF INDEPENDENT REGISTERED PUBLIC ACCOUNTING FIRM | | | 53 | |
| |
TRUSTEES AND OFFICERS | | | 54 | |
| |
ANNUAL RENEWAL OF INVESTMENT ADVISORY AGREEMENTS | | | 55 | |
Nothing contained herein is to be considered an offer, sale or solicitation of an offer to buy shares of any series of the Managers Family of Funds. Such offering is made only by Prospectus, which includes details as to offering price and other material information.
Letter to Shareholders
Dear Shareholder:
Our foremost goal at Managers Investment Group (“MIG”) is to structure and manage mutual funds that will help our shareholders and clients successfully reach their investment goals and objectives.
Each of our Funds is geared to provide you with exposure to a specific asset class or style of investing. We believe investors tend to use our Funds as part of their broader portfolio in order to tailor their asset allocation to meet their individual needs. Most of our Funds, like those detailed in this report, are therefore designed to be building blocks.
At MIG, we have overall responsibility for the investment management and administration of the Funds. As a “manager of managers,” we work with external investment managers that make the day-to-day investment decisions in the Funds (the “Portfolio Managers”). We devote considerable resources to our disciplined process of identifying and selecting unaffiliated Portfolio Managers for the Funds. As a manager of managers, MIG performs many activities to monitor the ongoing investment, compliance, and administrative aspects of all of the Funds, which we believe gives our shareholders added confidence in their investments.
Our parent company, Affiliated Managers Group (“AMG”), is a global asset management company with ownership interests in a diverse group of boutique investment management firms (its “Affiliates”). MIG has the unique opportunity to access the investment skills and acumen of some of AMG’s Affiliates. The set of our Funds managed by these proprietary firms also benefits from our activities to monitor the investment, compliance, and administrative aspects of the Funds.
Below is a brief overview of the securities markets and the performance results of the Funds. Following this letter, we also provide the Portfolio Managers’ discussion of their investment management approach, performance results, and market outlook.
Both global equities and bonds posted solid gains for the prior 12 months despite several significant macroeconomic headwinds that have threatened to pull the global economy into another recession. At the start of this period, investors largely ignored significant events such as the Arab Spring and the devastating effects of the Japanese earthquake and its aftermath and risk based assets generally outperformed during this period. The mood changed, however, heading into the summer months as the stalemate in Washington around the U.S. debt ceiling along with increasing fears about European sovereign debt contagion created considerable angst amongst investors who quickly fled risk based assets and sought the safety of U.S. Treasuries and other assets perceived as higher quality. This reversed, somewhat, in October as risk aversion began to ease across global markets amid optimism that the European debt crisis could be contained.
Against this backdrop, for the one-year period ended October 31, 2011, the Managers AMG FQ U.S. Equity Fund (“U.S. Equity Fund”) returned 10.72% and the Managers AMG FQ Tax-Managed U.S. Equity Fund (“Tax-Managed Fund”) returned 9.40%, compared to 7.90% for the benchmark Russell 3000® Index. The Managers AMG FQ Global Alternatives Fund (“Global Alternatives Fund”) returned -9.09% for the one-year period ended October 31, 2011, compared to a return of 0.08% for its benchmark, the Citigroup 1-Month Treasury Bill Index. Finally, the Managers AMG FQ Global Essentials Fund (“Global Essentials Fund”) returned 5.06% for its Investor Class, compared with 0.12% for its benchmark, which consists of 60%
1
Letter to Shareholders (continued)
of the return of MSCI World (hedged) Index and 40% of the return of the Citigroup World Government Bond (hedged) Index for this same one-year period. Performance stated above is for each Fund’s Class A Shares at Net Asset Value unless otherwise stated. Other share classes would have experienced different results.
| | | | | | | | | | | | | | | | | | | | | | | | |
Periods Ended 10/31/11 | | 6 Months | | | 1 Year | | | 3 Years | | | 5 Years | | | 10 Years | | | Inception
Date | |
FQ Tax-Managed U.S. Equity, Institutional Class | | | (7.99 | )% | | | 9.70 | % | | | 11.69 | % | | | 0.09 | % | | | 4.87 | % | | | 12/18/2000 | |
Russell 3000® Index | | | (8.28 | )% | | | 7.90 | % | | | 12.28 | % | | | 0.55 | % | | | 4.37 | % | | | 12/18/2000 | |
FQ U.S. Equity, Institutional Class | | | (6.34 | )% | | | 11.12 | % | | | 11.05 | % | | | 0.29 | % | | | 4.23 | % | | | 8/14/1992 | |
Russell 3000® Index | | | (8.28 | )% | | | 7.90 | % | | | 12.28 | % | | | 0.55 | % | | | 4.37 | % | | | 8/14/1992 | |
FQ Global Alternatives, Class A (No Load) | | | (7.83 | )% | | | (9.09 | )% | | | (3.30 | )% | | | 1.06 | % | | | — | | | | 3/30/2006 | |
Citigroup 1-Month U.S. Treasury Bill Index1 | | | 0.02 | % | | | 0.08 | % | | | 0.10 | % | | | 1.40 | % | | | — | | | | 3/31/2006 | |
FQ Global Essentials Fund, Institutional Class | | | 0.78 | % | | | 5.62 | % | | | 13.44 | % | | | 0.93 | % | | | 4.35 | % | | | 11/18/1988 | |
60% MSCI World (hedged) Index & 40% Citigroup World Government Bond (hedged) Index | | | (5.04 | )% | | | 0.12 | % | | | 5.70 | % | | | (0.28 | )% | | | 2.59 | % | | | 11/18/1988 | |
Performance for all share classes and detailed Fund positioning reviews are included within this report.
For the 12 months ended October 31, 2011, the Managers AMG FQ U.S. Equity Fund (Class A shares at NAV) returned 10.72%, compared with 7.90% for its benchmark, the Russell 3000® Index. For the 12 months ended October 31, 2011, the Managers AMG FQ Tax-Managed U.S. Equity Fund (Class A shares at NAV) returned 9.40%, compared with 7.90% for its benchmark, the Russell 3000® Index. The outperformance for both of these Funds was driven by both its top-down tilts relative to the benchmark and solid bottom-up stock selection across a number of sectors. Sector and industry positioning, although generally only modestly different from the benchmark, also contributed to performance, led by each Fund’s underweight to the struggling financials sector.
The Fund’s subadvisor, First Quadrant L.P. (“First Quadrant”), remains cautious given the volatility currently in equity markets and has positioned both of these Funds accordingly. Sector deviations remain minor relative to the benchmark but include overweights to the more cyclically geared consumer discretionary and information technology sectors and underweights to the financials and industrials sectors. More recently, the Funds have preferred large-cap equities relative to small-cap equities as a result of the heightened volatility within the U.S. equity market. The Fund’s tactical value/growth model has preferred growth equities since the second quarter.
For the 12 months ended October 31, 2011, the Managers AMG FQ Global Alternatives Fund (Class A Shares at NAV) returned -9.09% while its benchmark, the Citigroup 1-Month Treasury Bill Index, returned 0.08%. During this period, the Global Alternatives Fund’s disappointing performance was primarily driven by select positions within its currency and bond country selection strategies. In particular, the Fund’s Swiss Franc short position struggled in August as the Swiss Franc appreciated sharply during the global flight to quality, although this position began adding value later in the third quarter.
The tactical risk allocation in the Fund currently finds the most compelling opportunity to be within the currency and bond country selection strategies. The Fund’s largest positions within the currency strategy include short positions to the Australian Dollar and Swiss Franc and a long position to the U.K. Pound. These positions have largely been in place throughout the course of the past year, and began to add value towards the end of this period, and still present opportunity for the Fund. Within the bond country selection strategy, the
2
Letter to Shareholders (continued)
largest current positions are longs to the German bund and the U.K. bond market and a short position to the Australian bond market. The asset class selection strategy, while not comprising a significant portion of the risk budget as of the end of this period, currently favors global equities relative to global bonds.
For the 12 months ended October 31, 2011, the Managers AMG FQ Global Essentials Fund (Investor Class Shares at NAV) returned 5.06% while the benchmark, which consists of 60% of the return of MSCI World (hedged) Index and 40% of the return of the Citigroup World Government Bond (hedged) Index, returned 0.12% during this period. The Fund’s strong relative performance versus its blended benchmark is attributable to not only solid protection during down markets but also to solid participation in up markets as well during the past fiscal year. The Fund’s equity exposures offered mixed results with positions in the U.S. contributing positively to performance while non-U.S. developed and emerging market equities detracted from returns. Meanwhile, the Fund’s sovereign debt positions added to performance during the fiscal year. Finally, the Fund’s commodity positions offered mixed results with the Fund’s gold exposure continuing to act as an excellent diversifier to the Fund’s other commodity positions.
The First Quadrant Market Risk Index (one of FQ’s proprietary investment tools) is currently measuring a “Very High Risk” environment as of the end of the fiscal year as, more recently, the VIX, a popular measure of the implied volatility of the S&P 500 Index, continues to remain high. This has led to a decrease in exposure to both equities and commodities and an increase in exposure to sovereign debt within the Fund.
The following report covers the one-year period ended October 31, 2011. Should you have any questions about this report, or if you’d like to receive a prospectus and additional information, including fees and expenses for these or any of the other Funds in our family, please feel free to contact us at 1-800-835-3879, or visit our Web site at www.managersinvest.com. As always, please read the prospectus carefully before you invest or send money.
You can rest assured that under all market conditions our team is focused on delivering excellent investment management services for your benefit.
We thank you for your continued confidence and investment in The Managers Funds.
Respectfully,

John H. Streur
Senior Managing Partner
Managers Investment Group LLC
3
|
| About Your Fund’s Expenses |
|
As a shareholder of a Fund, you may incur two types of costs: (1) transaction costs, which may include sales charges (loads) on purchase payments; redemption fees; and exchange fees; and (2) ongoing costs, including management fees; distribution (12b-1) fees; and other Fund expenses. This example is intended to help you understand your ongoing costs (in dollars) of investing in the Fund and to compare these costs with the ongoing costs of investing in other mutual funds. The example is based on $1,000 invested at the beginning of the period and held for the entire period as indicated below. Actual Expenses The first line of the following table provides information about the actual account values and actual expenses. You may use the information in this line, together with the amount you invested, to estimate the expenses that you paid over the period. Simply divide your account value by $1,000 (for example, an $8,600 account value divided by $1,000 = 8.6), then multiply the result by the number in the first line under the heading entitled “Expenses Paid During Period” to estimate the expenses you paid on your account during this period. Hypothetical Example for Comparison Purposes The second line of the following table provides information about hypothetical account values and hypothetical expenses based on the Fund’s actual expense ratio and an assumed annual rate of return of 5% before expenses, which is not the Fund’s actual return. The hypothetical account values and expenses may not be used to estimate the actual ending account balance or expenses you paid for the period. You may use this information to compare the ongoing costs of investing in the Fund and other funds by comparing this 5% hypothetical example with the 5% hypothetical examples that appear in the shareholder reports of other funds. Please note that the expenses shown in the table are meant to highlight your ongoing costs only and do not reflect any transactional costs, such as sales charges (loads), redemption fees, or exchange fees. Therefore, the second line of the table is useful in comparing ongoing costs only, and will not help you determine the relative total costs of owning different funds. |
| | | | | | | | | | | | | | | | |
Six Months Ended October 31, 2011 | | Expense
Ratio for
the Period | | | Beginning
Account Value
05/01/11 | | | Ending
Account Value
10/31/11 | | | Expenses
Paid During
the Period* | |
Managers AMG FQ Tax-Managed U.S. Equity Fund | | | | | |
Class A Shares | | | | | | | | | | | | | | | | |
Based on Actual Fund Return | | | 1.24 | % | | $ | 1,000 | | | $ | 1,094 | | | $ | 6.54 | |
Hypothetical (5% return before expenses) | | | 1.24 | % | | $ | 1,000 | | | $ | 1,019 | | | $ | 6.31 | |
Class C Shares | | | | | | | | | | | | | | | | |
Based on Actual Fund Return | | | 1.99 | % | | $ | 1,000 | | | $ | 1,085 | | | $ | 10.46 | |
Hypothetical (5% return before expenses) | | | 1.99 | % | | $ | 1,000 | | | $ | 1,015 | | | $ | 10.11 | |
Institutional Class Shares | | | | | | | | | | | | | | | | |
Based on Actual Fund Return | | | 0.99 | % | | $ | 1,000 | | | $ | 1,097 | | | $ | 5.23 | |
Hypothetical (5% return before expenses) | | | 0.99 | % | | $ | 1,000 | | | $ | 1,020 | | | $ | 5.04 | |
Managers AMG FQ U.S. Equity Fund | | | | | | | | | |
Class A Shares | | | | | | | | | | | | | | | | |
Based on Actual Fund Return | | | 1.04 | % | | $ | 1,000 | | | $ | 1,107 | | | $ | 5.52 | |
Hypothetical (5% return before expenses) | | | 1.04 | % | | $ | 1,000 | | | $ | 1,020 | | | $ | 5.30 | |
Class C Shares | | | | | | | | | | | | | | | | |
Based on Actual Fund Return | | | 1.79 | % | | $ | 1,000 | | | $ | 1,099 | | | $ | 9.47 | |
Hypothetical (5% return before expenses) | | | 1.79 | % | | $ | 1,000 | | | $ | 1,016 | | | $ | 9.10 | |
Institutional Class Shares | | | | | | | | | | | | | | | | |
Based on Actual Fund Return | | | 0.79 | % | | $ | 1,000 | | | $ | 1,111 | | | $ | 4.20 | |
Hypothetical (5% return before expenses) | | | 0.79 | % | | $ | 1,000 | | | $ | 1,021 | | | $ | 4.02 | |
Managers AMG FQ Global Alternatives Fund | | | | | | | | | |
Class A Shares | | | | | | | | | | | | | | | | |
Based on Actual Fund Return | | | 1.93 | % | | $ | 1,000 | | | $ | 909 | | | $ | 9.29 | |
Hypothetical (5% return before expenses) | | | 1.93 | % | | $ | 1,000 | | | $ | 1,015 | | | $ | 9.80 | |
Class C Shares | | | | | | | | | | | | | | | | |
Based on Actual Fund Return | | | 2.49 | % | | $ | 1,000 | | | $ | 904 | | | $ | 11.95 | |
Hypothetical (5% return before expenses) | | | 2.49 | % | | $ | 1,000 | | | $ | 1,013 | | | $ | 12.63 | |
Service Class Shares | | | | | | | | | | | | | | | | |
Based on Actual Fund Return | | | 1.64 | % | | $ | 1,000 | | | $ | 911 | | | $ | 7.90 | |
Hypothetical (5% return before expenses) | | | 1.64 | % | | $ | 1,000 | | | $ | 1,017 | | | $ | 8.34 | |
Institutional Class Shares | | | | | | | | | | | | | | | | |
Based on Actual Fund Return | | | 1.49 | % | | $ | 1,000 | | | $ | 913 | | | $ | 7.18 | |
Hypothetical (5% return before expenses) | | | 1.49 | % | | $ | 1,000 | | | $ | 1,017 | | | $ | 7.58 | |
Managers AMG FQ Global Essentials Fund | | | | | | | | | |
Investor Class Shares | | | | | | | | | | | | | | | | |
Based on Actual Fund Return | | | 1.49 | % | | $ | 1,000 | | | $ | 1,051 | | | $ | 7.70 | |
Hypothetical (5% return before expenses) | | | 1.49 | % | | $ | 1,000 | | | $ | 1,018 | | | $ | 7.58 | |
Service Class Shares | | | | | | | | | | | | | | | | |
Based on Actual Fund Return | | | 1.12 | % | | $ | 1,000 | | | $ | 1,054 | | | $ | 5.80 | |
Hypothetical (5% return before expenses) | | | 1.12 | % | | $ | 1,000 | | | $ | 1,020 | | | $ | 5.70 | |
Institutional Class Shares | | | | | | | | | | | | | | | | |
Based on Actual Fund Return | | | 0.99 | % | | $ | 1,000 | | | $ | 1,056 | | | $ | 5.13 | |
Hypothetical (5% return before expenses) | | | 0.99 | % | | $ | 1,000 | | | $ | 1,020 | | | $ | 5.04 | |
* Expenses are equal to the Fund’s annualized expense ratio multiplied by the average account value over the period, multiplied by the number of days in the most recent fiscal half-year (184), then divided by 365. | |
Managers AMG FQ Tax-Managed U.S. Equity Fund
Portfolio Manager’s Comments
For the fiscal year ended October 31, 2011, the Managers AMG FQ Tax-Managed U.S. Equity Fund (Class A Shares at NAV) returned 9.40%, compared to 7.90% for its benchmark, the Russell 3000® Index. Please refer to the table on page 6 for returns for various classes of shares.
Equities within the U.S. posted solid gains for the prior 12 months despite several significant macroeconomic headwinds that threatened to pull both the U.S. and global economies into another recession. At the start of this period, U.S. equity investors largely ignored significant events such as the devastating effects of the Japanese earthquake and its aftermath, and the resulting supply chain disruptions to several sectors. The mood changed, however, heading into the summer months as the stalemate in Washington around the U.S. debt ceiling debate along with increasing fears about European sovereign debt contagion created considerable angst amongst investors, who quickly fled equities for the safety of U.S. Treasuries and other assets perceived as higher quality. This reversed, somewhat, in October as risk aversion began to ease amid optimism that the European debt crisis could be contained. For the entire one-year period ended October 31, 2011, U.S. large-cap stocks outperformed their smaller-cap brethren with the Russell 1000® (large cap), Russell 2000® (small cap), Russell 3000® (all cap), and the Russell Microcap® Indexes returning 8.0%, 6.7%, 7.9%, and 2.1%, respectively.
The Fund delivered positive absolute and relative returns for the prior fiscal year. Relative to the benchmark, style tilts driven by top-down models added value while the Fund’s bottom-up models added value via solid stock selection throughout the course of the year as well. Until market turmoil began in earnest in August, the fiscal year was characterized by a number of factors favored by the Fund’s models contributing positively to performance. In August through September, higher quality factors added to value as investors sought safety. Throughout the year, stock selection was strongest for the Fund within the consumer discretionary, financials, and health care sectors. Meanwhile, sector positioning also contributed to the positive relative performance. The largest contributor was an underweight to the underperforming financials sector, which was the only sector to post a negative return for this period.
The Fund’s subadvisor, First Quadrant L.P. (“First Quadrant”), continues to remain cautiously optimistic about the outlook for U.S. equities. To minimize risk relative to the benchmark, the Fund maintains only modest sector deviations from the benchmark. Currently, the largest industry underweight is to food and beverages. This is driven by relative inefficiency in this industry as captured by the Fund’s Industry Rotation model. The largest overweight currently is to the specialty retail industry and is the result of both momentum and growth expectations for this industry. Within the financials sectors, the model has tilted away from banks and the asset management industry due to negative momentum and long-term growth expectations. The largest investment style tilts in the Portfolio are overweights to Earnings Yield and Momentum. All of these positions have, however, decreased in magnitude towards the end of the fiscal year. As a tax advantaged strategy, the Portfolio is managed to seek positive pre-tax and after-tax alpha. For this reason, First Quadrant employs tax-aware optimization which uses losses to offset gains as the Portfolio is repositioned. Currently most of the Portfolio is locked up in gains; however, the Fund continues to maintain a large tax loss carry-forward, all of which will expire by 2017.
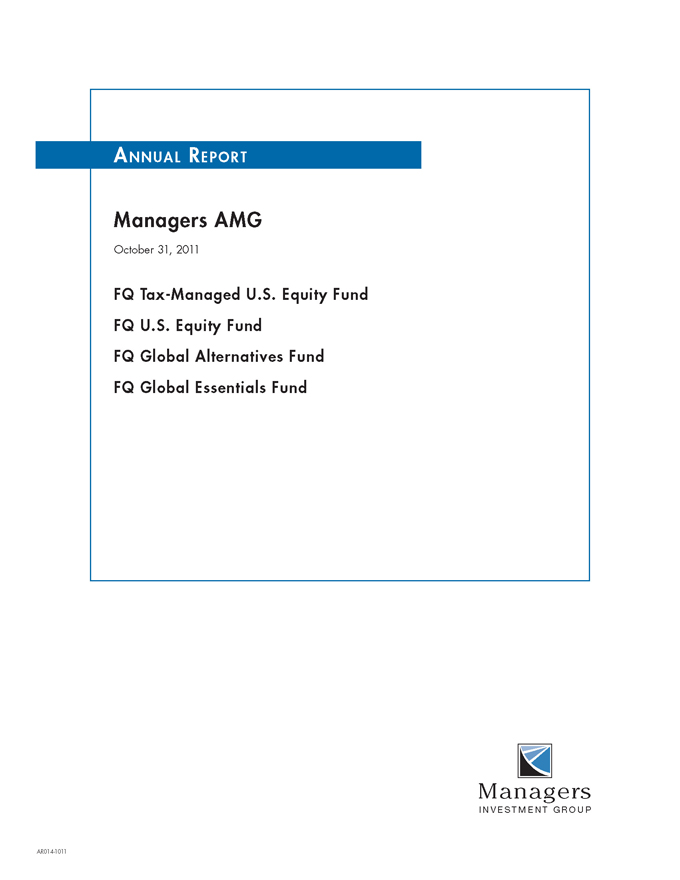
Cumulative Total Return Performance
Managers AMG FQ Tax-Managed U.S. Equity Fund’s cumulative total return is based on the daily change in net asset value (NAV), and assumes that all distributions were reinvested. The Russell 3000® Index is composed of the 3000 largest U.S. companies as measured by market capitalization, and represents about 98% of the U.S. stock market. Unlike the Fund, the Russell 3000® Index is unmanaged, is not available for investment, and does not incur expenses. The chart on page 6 illustrates the performance of a hypothetical $10,000 investment made in the Institutional Class Shares of the Fund on October 31, 2001 to a $10,000 investment made in the Russell 3000® Index for the same time periods. Performance for periods longer than one year is annualized. Figures include reinvestment of capital gains and dividends. The listed returns for the Fund are net of expenses and the returns for the indices exclude expenses. Total returns for the Fund would have been lower had certain expenses not been reduced.
5
|
Managers AMG FQ Tax-Managed U.S. Equity Fund Portfolio Manager’s Comments (continued) |
Cumulative Total Return Performance (continued)
The table below shows the average annual total returns for the Managers AMG FQ Tax-Managed U.S. Equity Fund since inception through October 31, 2011 and the Russell 3000® Index for the same time periods.
| | | | | | | | | | | | | | | | | | | | |
Average Annual Total Returns1 | | One
Year | | | Five
Years | | | Ten
Years | | | Since
Inception | | | Inception
Date | |
Managers AMG FQ Tax- Managed U.S. Equity Fund2,5,6 | | | | | | | | | | | | | | | | | | | | |
No Load Before Tax: | | | | | | | | | | | | | | | | | | | | |
Institutional Class | | | 9.70 | % | | | 0.09 | % | | | 4.87 | % | | | 3.37 | % | | | 12/18/00 | |
Class A* | | | 9.40 | % | | | (0.08 | )% | | | — | | | | 1.12 | % | | | 03/01/06 | |
Class C* | | | 8.52 | % | | | (0.82 | )% | | | — | | | | 0.35 | % | | | 03/01/06 | |
Russell 3000® Index4 | | | 7.90 | % | | | 0.55 | % | | | 4.37 | % | | | 2.10 | % | | | 12/18/00 | † |
No Load After Tax on Distributions3 | | | | | | | | | | | | | | | | | | | | |
Institutional Class | | | 9.63 | % | | | (0.01 | )% | | | 4.76 | % | | | 3.27 | % | | | 12/18/00 | |
Class A* | | | 9.39 | % | | | (0.13 | )% | | | — | | | | 1.07 | % | | | 03/01/06 | |
Class C* | | | 8.52 | % | | | (0.83 | )% | | | — | | | | 0.34 | % | | | 03/01/06 | |
No Load After Tax on Distributions & sale of shares3 | | | | | | | | | | | | | | | | | | | | |
Institutional Class | | | 6.39 | % | | | 0.05 | % | | | 4.21 | % | | | 2.89 | % | | | 12/18/00 | |
Class A* | | | 6.13 | % | | | (0.08 | )% | | | — | | | | 0.94 | % | | | 03/01/06 | |
Class C* | | | 5.54 | % | | | (0.70 | )% | | | — | | | | 0.30 | % | | | 03/01/06 | |
With Load Before Tax: | | | | | | | | | | | | | | | | | | | | |
Class A* | | | 3.12 | % | | | (1.26 | )% | | | — | | | | 0.07 | % | | | 03/01/06 | |
Class C* | | | 7.52 | % | | | (0.82 | )% | | | — | | | | 0.35 | % | | | 03/01/06 | |
With Load After Tax on Distributions3 | | | | | | | | | | | | | | | | | | | | |
Class A* | | | 3.10 | % | | | (1.31 | )% | | | — | | | | 0.02 | % | | | 03/01/06 | |
Class C* | | | 7.52 | % | | | (0.83 | )% | | | — | | | | 0.34 | % | | | 03/01/06 | |
With Load After Tax on Distributions & sale of shares3 | | | | | | | | | | | | | | | | | | | | |
Class A* | | | 2.04 | % | | | (1.08 | )% | | | — | | | | 0.05 | % | | | 03/01/06 | |
Class C* | | | 4.89 | % | | | (0.70 | )% | | | — | | | | 0.30 | % | | | 03/01/06 | |
| * | Class A and Class C shares commenced operations on March 1, 2006. |
The performance data shown represents past performance, which is not a guarantee of future results. Current performance may be lower or higher than the performance data quoted. The investment return and principal value of an investment in the Funds will fluctuate so that an investor’s shares, when redeemed, may be worth more or less than their original cost. For performance information through the most recent month end please call (800) 835-3879 or visit our website at www.managersinvest.com.
|
In choosing a Fund, investors should carefully consider the amount they plan to invest, their investment objectives, the Fund’s investment objectives, risks, charges and expenses before investing. For this and other information, please call (800) 835-3879 or visit www.managersinvest.com for a free prospectus. Read it carefully before investing or sending money. Distributed by Managers Distributors, Inc., member FINRA. † Date reflects the inception date of the Fund’s Institutional Class shares, not the index. 1 Total return equals income yield plus share price change and assumes reinvestment of all dividends and capital gain distributions. Returns are net of fees and may reflect offsets of Fund expenses as described in the Prospectus. No adjustment has been made for taxes payable by shareholders on their reinvested dividends and capital gain distributions. Returns for periods greater than one year are annualized. The listed returns on the Fund are net of expenses and based on the published NAV as of October 31, 2011. All returns are in U.S. dollars($). 2 From time to time, the Fund’s advisor has waived its fees and/or absorbed Fund expenses, which has resulted in higher returns. 3 After-tax returns are calculated using the historical highest individual federal marginal income tax rates and do not reflect the impact of state and local taxes. Actual after-tax returns depend on an investor’s tax situation and may differ from those shown, and after-tax returns are not relevant to investors who hold their Fund shares through tax-deferred arrangements, such as 401(K) plans or individual retirement accounts. 4 The Russell 3000® Index is a market-capitalization weighted index that measures the performance of the largest 3,000 U.S. companies representing approximately 98% of the investable U.S. equity market. The returns shown for the Index reflect no deduction for fees, expenses, or taxes. Unlike the Fund, the Russell 3000® Index is unmanaged, is not available for investment, and does not incur expenses. 5 The Fund invests in large-capitalization companies that may underperform other stock funds (such as funds that focus on small and medium capitalization companies) when stocks of large-capitalization companies are out of favor. Although the Fund is managed to minimize taxable distributions, it may not be able to avoid taxable distributions. 6 Class C shares convert to an equal dollar value of Class A shares at the end of the tenth year after purchase. The Russell 3000® Index is a trademark of Russell Investments. Russell® is a trademark of Russell Investments. Not FDIC insured, nor bank guaranteed. May lose value. |
|
Managers AMG FQ Tax-Managed U.S. Equity Fund Fund Snapshots October 31, 2011 |
Portfolio Breakdown
| | | | | | | | |
Industry | | Managers AMG
FQ Tax-Managed
U.S. Equity Fund** | | | Russell 3000®
Index | |
Information Technology | | | 25.1 | % | | | 18.9 | % |
| | |
Consumer Discretionary | | | 14.4 | % | | | 11.8 | % |
| | |
Financials | | | 12.5 | % | | | 15.1 | % |
| | |
Health Care | | | 12.4 | % | | | 11.6 | % |
| | |
Energy | | | 11.1 | % | | | 11.3 | % |
| | |
Consumer Staples | | | 9.0 | % | | | 9.5 | % |
| | |
Industrials | | | 7.5 | % | | | 11.2 | % |
| | |
Materials | | | 4.2 | % | | | 4.1 | % |
| | |
Utilities | | | 3.0 | % | | | 3.8 | % |
| | |
Telecommunication Services | | | 1.0 | % | | | 2.7 | % |
| | |
Other Assets and Liabilities | | | (0.2 | )% | | | 0.0 | % |
| ** | As a percentage of net assets |
Top Ten Holdings
| | | | |
Security Name | | Percentage
of Net Assets | |
Apple, Inc.* | | | 3.7 | % |
| |
International Business Machines Corp.* | | | 3.6 | |
| |
Chevron Corp.* | | | 3.5 | |
| |
Exxon Mobil Corp. | | | 2.3 | |
| |
DIRECTV, Class A* | | | 2.2 | |
| |
Philip Morris International, Inc. | | | 2.0 | |
| |
Berkshire Hathaway, Inc., Class B* | | | 1.9 | |
| |
Biogen Idec, Inc. | | | 1.9 | |
| |
Dillard’s, Inc., Class A* | | | 1.9 | |
| |
ConocoPhillips Co.* | | | 1.8 | |
| | | | |
Top Ten as a Group | | | 24.8 | % |
| | | | |
| * | Top Ten Holding at April 30, 2011 |
| | |
| | | Any sectors, industries, or securities discussed should not be perceived as investment recommendations. Mention of a specific security should not be considered a recommendation to buy or solicitation to sell that security. Specific securities mentioned in this report may have been sold from the Fund’s portfolio of investments by the time you receive this report. |
Managers AMG FQ Tax-Managed U.S. Equity Fund
Schedule of Portfolio Investments
October 31, 2011
| | | | | | | | |
| | | Shares | | | Value | |
Common Stocks - 100.2% | | | | | | | | |
Consumer Discretionary - 14.4% | | | | | | | | |
Apollo Group, Inc., Class A* | | | 5,400 | | | $ | 255,690 | |
Bed Bath & Beyond, Inc.* | | | 6,400 | | | | 395,776 | |
Capella Education Co.* | | | 1,200 | | | | 41,772 | |
Coinstar, Inc.* | | | 4,600 | 2 | | | 219,604 | |
Dillard’s, Inc., Class A | | | 15,000 | | | | 772,950 | |
DIRECTV, Class A* | | | 19,800 | | | | 900,108 | |
Discovery Communications, Inc., Class A* | | | 8,800 | | | | 382,448 | |
DISH Network Corp., Class A* | | | 9,400 | | | | 227,198 | |
Ford Motor Co.* | | | 35,400 | | | | 413,472 | |
ITT Educational Services, Inc.* | | | 3,600 | 2 | | | 223,056 | |
Knology, Inc.* | | | 37,400 | | | | 535,942 | |
Libbey, Inc.* | | | 3,800 | | | | 48,108 | |
Liberty Global, Inc., Class A* | | | 18,400 | | | | 739,312 | |
Nike, Inc. | | | 2,200 | | | | 211,970 | |
Scripps Networks Interactive, Inc., Class A | | | 2,200 | | | | 93,456 | |
Target Corp. | | | 2,000 | | | | 109,500 | |
TRW Automotive Holdings Corp.* | | | 9,800 | | | | 412,580 | |
Total Consumer Discretionary | | | | | | | 5,982,942 | |
Consumer Staples - 9.0% | | | | | | | | |
Brown-Forman Corp., Class B | | | 1,400 | | | | 104,622 | |
Coca-Cola Co., The | | | 1,000 | | | | 68,320 | |
CVS Caremark Corp. | | | 4,800 | | | | 174,240 | |
Estee Lauder Co., Class A | | | 3,000 | | | | 295,350 | |
Hansen Natural Corp.* | | | 1,800 | | | | 160,362 | |
Kroger Co., The | | | 14,600 | | | | 338,428 | |
Lorillard, Inc. | | | 400 | | | | 44,264 | |
Philip Morris International, Inc. | | | 12,000 | | | | 838,440 | |
Procter & Gamble Co., The | | | 4,600 | | | | 294,354 | |
Smithfield Foods, Inc.* | | | 10,600 | | | | 242,316 | |
Spartan Stores, Inc. | | | 7,400 | | | | 126,688 | |
Tyson Foods, Inc., Class A | | | 10,200 | | | | 196,860 | |
Village Super Market, Inc., Class A | | | 1,200 | | | | 34,032 | |
Wal-Mart Stores, Inc. | | | 7,400 | | | | 419,728 | |
Whole Foods Market, Inc. | | | 5,600 | | | | 403,872 | |
Total Consumer Staples | | | | | | | 3,741,876 | |
Energy - 11.1% | | | | | | | | |
Apache Corp. | | | 4,800 | | | | 478,224 | |
Chevron Corp. | | | 13,800 | | | | 1,449,690 | |
ConocoPhillips Co. | | | 11,000 | | | | 766,150 | |
Exxon Mobil Corp. | | | 12,200 | | | | 952,698 | |
Hess Corp. | | | 6,600 | | | | 412,896 | |
| | | | | | | | |
| | | Shares | | | Value | |
Marathon Petroleum Corp. | | | 4,700 | | | $ | 168,730 | |
Occidental Petroleum Corp. | | | 4,000 | | | | 371,760 | |
Total Energy | | | | | | | 4,600,148 | |
Financials - 12.5% | | | | | | | | |
American Financial Group, Inc. | | | 6,400 | | | | 229,312 | |
American Safety Insurance Holdings, Ltd.* | | | 10,600 | | | | 216,346 | |
Arch Capital Group, Ltd.* | | | 13,200 | | | | 474,804 | |
Bank of the Ozarks, Inc. | | | 19,200 | | | | 477,504 | |
Berkshire Hathaway, Inc., Class A* | | | 1 | | | | 116,950 | |
Berkshire Hathaway, Inc., Class B* | | | 10,287 | | | | 800,946 | |
Capital One Financial Corp. | | | 2,000 | | | | 91,320 | |
Chubb Corp., The | | | 2,200 | | | | 147,510 | |
Discover Financial Services | | | 2,000 | | | | 47,120 | |
FBL Financial Group, Inc., Class A | | | 6,800 | | | | 222,020 | |
First Cash Financial Services, Inc.* | | | 4,000 | | | | 166,000 | |
First Citizens BancShares, Inc., Class A | | | 1,000 | | | | 163,050 | |
Franklin Resources, Inc. | | | 600 | | | | 63,978 | |
Invesco Mortgage Capital, Inc. | | | 1,600 | | | | 25,248 | |
JPMorgan Chase & Co. | | | 10,400 | | | | 361,504 | |
KeyCorp | | | 25,800 | | | | 182,148 | |
Nara Bancorp, Inc.* | | | 26,000 | | | | 220,480 | |
PNC Financial Services Group, Inc., The | | | 8,400 | | | | 451,164 | |
SunTrust Banks, Inc. | | | 15,600 | | | | 307,788 | |
World Acceptance Corp.* | | | 6,800 | 2 | | | 460,020 | |
Total Financials | | | | | | | 5,225,212 | |
Health Care - 12.4% | | | | | | | | |
AmerisourceBergen Corp. | | | 8,600 | | | | 350,880 | |
Atrion Corp. | | | 200 | | | | 45,000 | |
Biogen Idec, Inc.* | | | 6,800 | | | | 791,248 | |
Express Scripts, Inc.* | | | 9,000 | | | | 411,570 | |
Gilead Sciences, Inc.* | | | 2,200 | | | | 91,652 | |
HealthSouth Corp.* | | | 7,000 | | | | 123,620 | |
Humana, Inc. | | | 7,800 | | | | 662,142 | |
Johnson & Johnson | | | 3,200 | | | | 206,048 | |
McKesson Corp. | | | 5,000 | | | | 407,750 | |
Medicis Pharmaceutical Corp., Class A | | | 6,400 | | | | 245,056 | |
Par Pharmaceutical Co., Inc.* | | | 10,800 | | | | 330,480 | |
Pfizer, Inc. | | | 5,200 | | | | 100,152 | |
PSS World Medical, Inc.* | | | 4,400 | | | | 97,900 | |
UnitedHealth Group, Inc. | | | 13,800 | | | | 662,262 | |
Varian Medical Systems, Inc.* | | | 3,000 | | | | 176,160 | |
Warner Chilcott, Ltd., Class A* | | | 18,200 | | | | 329,784 | |
WellPoint, Inc. | | | 1,600 | | | | 110,240 | |
Total Health Care | | | | | | | 5,141,944 | |
The accompanying notes are an integral part of these financial statements.
8
Managers AMG FQ Tax-Managed U.S. Equity Fund
Schedule of Portfolio Investments (continued)
| | | | | | | | |
| | | Shares | | | Value | |
Industrials - 7.5% | | | | | | | | |
Alaska Airgroup, Inc.* | | | 6,200 | | | $ | 412,486 | |
AMERCO* | | | 1,600 | | | | 121,136 | |
Cummins, Inc. | | | 3,800 | | | | 377,834 | |
DXP Enterprises, Inc.* | | | 5,400 | | | | 134,892 | |
FedEx Corp. | | | 3,600 | | | | 294,588 | |
General Electric Co. | | | 7,600 | | | | 126,996 | |
Kadant, Inc.* | | | 5,400 | | | | 116,910 | |
M&F Worldwide Corp.* | | | 9,400 | | | | 232,744 | |
Nordson Corp. | | | 1,000 | | | | 46,370 | |
Park-Ohio Holdings Corp.* | | | 3,200 | | | | 51,776 | |
Sauer-Danfoss, Inc.* | | | 8,200 | | | | 317,504 | |
TriMas Corp.* | | | 13,800 | | | | 268,962 | |
Union Pacific Corp. | | | 3,800 | | | | 378,366 | |
United Technologies Corp. | | | 3,000 | | | | 233,940 | |
Total Industrials | | | | | | | 3,114,504 | |
Information Technology - 25.1% | | | | | | | | |
Apple, Inc.* | | | 3,800 | | | | 1,538,163 | |
Dell, Inc.* | | | 24,800 | | | | 392,088 | |
Dolby Laboratories, Inc., Class A* | | | 10,600 | | | | 309,944 | |
EMC Corp.* | | | 4,600 | | | | 112,746 | |
Global Payments, Inc. | | | 7,400 | | | | 339,808 | |
Google, Inc.* | | | 1,200 | | | | 711,168 | |
Intel Corp. | | | 25,800 | | | | 633,132 | |
International Business Machines Corp. | | | 8,000 | | | | 1,477,040 | |
Intuit, Inc.* | | | 7,800 | | | | 418,626 | |
MasterCard, Inc., Class A | | | 1,600 | | | | 555,584 | |
Microsoft Corp. | | | 15,200 | | | | 404,776 | |
NCI, Inc., Class A* | | | 3,800 | | | | 51,870 | |
NeuStar, Inc., Class A* | | | 12,800 | | | | 406,912 | |
Newport Corp.* | | | 18,800 | | | | 260,380 | |
Oracle Corp. | | | 19,600 | | | | 642,292 | |
PC Connection, Inc.* | | | 13,600 | | | | 113,560 | |
Rudolph Technologies, Inc.* | | | 17,200 | | | | 126,764 | |
SAIC, Inc.* | | | 7,800 | | | | 96,954 | |
| | | | | | | | |
| | | Shares | | | Value | |
Texas Instruments, Inc. | | | 21,000 | | | $ | 645,330 | |
TIBCO Software, Inc.* | | | 20,600 | | | | 595,134 | |
Visa, Inc., Class A | | | 5,800 | | | | 540,908 | |
Vishay Intertechnology, Inc.* | | | 7,400 | | | | 79,550 | |
Total Information Technology | | | | | | | 10,452,729 | |
Materials - 4.2% | | | | | | | | |
CF Industries Holdings, Inc. | | | 2,200 | | | | 356,994 | |
Domtar Corp. | | | 5,000 | | | | 409,550 | |
Freeport McMoRan Copper & Gold, Inc., Class B | | | 15,200 | | | | 611,952 | |
Graphic Packaging Holding Co.* | | | 44,500 | | | | 196,690 | |
KapStone Paper and Packaging Corp.* | | | 11,400 | | | | 186,960 | |
Total Materials | | | | | | | 1,762,146 | |
Telecommunication
Services - 1.0% | | | | | | | | |
American Tower Corp., Class A* | | | 800 | | | | 44,080 | |
AT&T, Inc. | | | 6,800 | | | | 199,308 | |
U.S. Cellular Corp.* | | | 4,400 | | | | 175,428 | |
Total Telecommunication Services | | | | | | | 418,816 | |
Utilities - 3.0% | | | | | | | | |
AES Corp., The* | | | 7,000 | | | | 78,540 | |
El Paso Electric Co. | | | 16,600 | | | | 531,698 | |
NRG Energy, Inc.* | | | 6,000 | | | | 128,520 | |
Southwest Gas Corp. | | | 12,800 | | | | 505,344 | |
Total Utilities | | | | | | | 1,244,102 | |
Total Common Stocks
(cost $32,565,872) | | | | | | | 41,684,419 | |
Short-Term Investments - 2.2%1 | | | | | | | | |
BNY Mellon Overnight Government Fund, 0.10%3 | | | 820,542 | | | | 820,542 | |
Dreyfus Cash Management Fund, Institutional Class Shares, 0.05% | | | 99,081 | | | | 99,081 | |
Total Short-Term Investments
(cost $919,623) | | | | | | | 919,623 | |
Total Investments - 102.4%
(cost $33,485,495) | | | | | | | 42,604,042 | |
Other Assets, less Liabilities - (2.4)% | | | | | | | (1,003,061 | ) |
Net Assets - 100.0% | | | | | | $ | 41,600,981 | |
|
The accompanying notes are an integral part of these financial statements. 9 |
Managers AMG FQ U.S. Equity Fund
Portfolio Manager’s Comments
For the fiscal year ended October 31, 2011, the Managers AMG FQ U.S. Equity Fund (Class A Shares at NAV) returned 10.72%, compared to 7.90% for its benchmark, the Russell 3000® Index. Please refer to the table on page 11 for returns for various classes of shares.
Equities within the U.S. posted solid gains for the prior 12 months despite several significant macroeconomic headwinds that threatened to pull both the U.S. and global economies into another recession. At the start of this period, U.S. equity investors largely ignored significant events such as the devastating effects of the Japanese earthquake and its aftermath and the resulting supply chain disruptions to several sectors. The mood changed, however, heading into the summer months as the stalemate in Washington around the U.S. debt ceiling debate along with increasing fears about European sovereign debt contagion created considerable angst amongst investors who quickly fled equities for the safety of U.S. Treasuries and other assets perceived as higher quality. This reversed, somewhat, in October as risk aversion began to ease amid optimism that the European debt crisis could be contained. For the entire one-year period ended October 31, 2011, U.S. large-cap stocks outperformed their smaller-cap brethren with the Russell 1000® (large cap), Russell 2000® (small cap), Russell 3000® (all cap), and the Russell Microcap® Indexes returning 8.0%, 6.7%, 7.9%, and 2.1%, respectively.
The Fund delivered positive absolute and relative returns for the prior fiscal year. Relative to the benchmark, style tilts driven by top-down models added value while the Fund’s bottom-up models added value via solid stock selection throughout the course of the year as well. Until market turmoil began in earnest in August, the fiscal year was characterized by a number of factors favored by the Fund’s models contributing positively to performance. In August through September, higher-quality factors added to value as investors sought safety. Throughout the year, stock selection was strongest for the Fund within the financials and health care sectors. Meanwhile, sector positioning also contributed to the positive relative
performance. The largest contributor was an
underweight to the underperforming financials sector, which was the only sector to post a negative return for this period.
The Fund’s subadvisor, First Quadrant L.P. (“First Quadrant”), continues to remain cautiously optimistic about the outlook for U.S. equities. To minimize risk relative to the benchmark, the Fund maintains only modest sector deviations from the benchmark. Currently, the largest industry underweight is to food and beverages. This is driven by relative inefficiency in this industry as captured by the Fund’s Industry Rotation model. The largest overweight currently is to the specialty retail industry and is the result of both momentum and growth expectations for this industry. Within the financials sectors, the model has tilted away from banks and the asset management industry due to negative momentum and long-term growth expectations. The largest investment style tilts in the Portfolio are overweights to Earnings Yield and Momentum and an underweight to Size. All of these positions have, however, decreased in magnitude towards the end of the fiscal year.
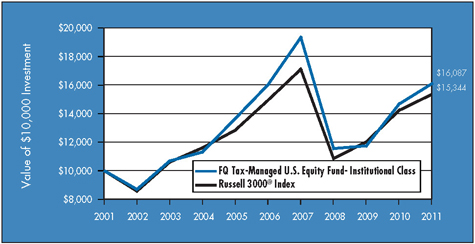
Cumulative Total Return Performance
Managers AMG FQ U.S. Equity Fund’s cumulative total return is based on the daily change in net asset value (NAV), and assumes that all distributions were reinvested. The Russell 3000® Index is composed of the 3000 largest U.S. companies as measured by market capitalization, and represents about 98% of the U.S. stock market. Unlike the Fund, the Russell 3000® Index is unmanaged, is not available for investment, and does not incur expenses. The chart on page 11 illustrates the performance of a hypothetical $10,000 investment made in the Institutional Class Shares of the Fund on October 31, 2001 to a $10,000 investment made in the Russell 3000® Index for the same time periods. Performance for periods longer than one year is annualized. Figures include reinvestment of capital gains and dividends. The listed returns for the Fund are net of expenses and the returns for the indices exclude expenses. Total returns for the Fund would have been lower had certain expenses not been reduced.
10
|
Managers AMG FQ U.S. Equity Fund Portfolio Manager’s Comments (continued) |
Cumulative Total Return Performance (continued)
The table below shows the average annual total returns for the Managers AMG FQ U.S. Equity Fund since inception through October 31, 2011, and the Russell 3000® Index for the same time periods.
| | | | | | | | | | | | | | | | | | | | |
Average Annual Total Returns1 | | One
Year | | | Five
Years | | | Ten
Years | | | Since
Inception | | | Inception
Date | |
Managers AMG FQ U.S.
Equity Fund2,4,5 | | | | | | | | | | | | | | | | | | | | |
No Load: | | | | | | | | | | | | | | | | | | | | |
Institutional Class | | | 11.12 | % | | | 0.29 | % | | | 4.23 | % | | | 7.17 | % | | | 08/14/92 | |
Class A* | | | 10.72 | % | | | 0.01 | % | | | — | | | | 1.70 | % | | | 03/01/06 | |
Class C* | | | 9.94 | % | | | (0.73 | )% | | | — | | | | 1.00 | % | | | 03/01/06 | |
Russell 3000® Index33 | | | 7.90 | % | | | 0.55 | % | | | 4.37 | % | | | 8.25 | % | | | 08/31/92 | |
| | | | | |
With Load: | | | | | | | | | | | | | | | | | | | | |
Class A* | | | 4.33 | % | | | (1.17 | )% | | | — | | | | 0.64 | % | | | 03/01/06 | |
Class C* | | | 8.94 | % | | | (0.73 | )% | | | — | | | | 1.00 | % | | | 03/01/06 | |
| * | Class A and Class C shares commenced operations on March 1, 2006. |
The performance data shown represents past performance, which is not a guarantee of future results. Current performance may be lower or higher than the performance data quoted. The investment return and principal value of an investment in the Funds will fluctuate so that an investor’s shares, when redeemed, may be worth more or less than their original cost. For performance information through the most recent month end please call (800) 835-3879 or visit our website at www.managersinvest.com.
The listed returns for the Fund are net of expenses and the returns of the Index exclude expenses. The “Since Inception” return for the Index is from the inception of the Fund’s Institutional Class shares. Performance differences among the share classes are due to the differences in sales charge structures and class expenses. Load performance: maximum sales charge on Class A shares is 5.75% and Class C shares held for less than one year are subject to a 1.0% contingent deferred sales charge (CDSC).
In choosing a Fund, investors should carefully consider the amount they plan to invest, their investment objectives, the Fund’s investment objectives, risks, charges and expenses before investing. For this and other information, please call (800) 835-3879 or visit www.managersinvest.com for a free prospectus. Read it carefully before investing or sending money. Distributed by Managers Distributors, Inc., member FINRA.
| 1 | Total return equals income yield plus share price change and assumes reinvestment of all dividends and capital gain distributions. Returns are net of fees and may reflect offsets of Fund expenses as described in the Prospectus. No adjustment has been made for taxes payable by shareholders on their reinvested dividends and capital gain distributions. Returns for periods greater than one year are annualized. The listed returns on the Fund are net of expenses and based on the published NAV as of October 31, 2011. All returns are in U.S. dollars($). |
|
2 From time to time, the Fund’s advisor has waived its fees and/or absorbed Fund expenses, which has resulted in higher returns. 3 Performance for the Russell 3000® Index reflects an inception date of August 31, 1992. The Russell 3000® Index is a market-capitalization weighted index that measures the performance of the largest 3,000 U.S. companies representing approximately 98% of the investable U.S. equity market. The returns shown for the Index reflect no deduction for fees, expenses, or taxes. Unlike the Fund, the Russell 3000® Index is unmanaged, is not available for investment, and does not incur expenses. 4 The Fund invests in large-capitalization companies that may underperform other stock funds (such as funds that focus on small and medium capitalization companies) when stocks of large-capitalization companies are out of favor. Also, the Fund may invest in derivatives; the complexity and rapidly changing structure of derivatives markets may increase the possibility of market losses. 5 Class C shares convert to an equal dollar value of Class A shares at the end of the tenth year after purchase. The Russell 3000® Index is a trademark of Russell Investments. Russell® is a trademark of Russell Investments. Not FDIC insured, nor bank guaranteed. May lose value. |
|
Managers AMG FQ U.S. Equity Fund Fund Snapshots October 31, 2011 |
Portfolio Breakdown
| | | | | | | | |
Industry | | Managers AMG
FQ U.S. Equity
Fund** | | | Russell 3000®
Index | |
Information Technology | | | 21.0 | % | | | 18.9 | % |
| | |
Financials | | | 14.8 | % | | | 15.1 | % |
| | |
Consumer Discretionary | | | 13.1 | % | | | 11.8 | % |
| | |
Health Care | | | 11.3 | % | | | 11.6 | % |
| | |
Energy | | | 10.8 | % | | | 11.3 | % |
| | |
Consumer Staples | | | 9.5 | % | | | 9.5 | % |
| | |
Industrials | | | 9.2 | % | | | 11.2 | % |
| | |
Materials | | | 3.9 | % | | | 4.1 | % |
| | |
Utilities | | | 3.4 | % | | | 3.8 | % |
| | |
Telecommunication Services | | | 2.2 | % | | | 2.7 | % |
| | |
Other Assets and Liabilities | | | 0.8 | % | | | 0.0 | % |
| ** | As a percentage of net assets |
Top Ten Holdings
| | | | |
Security Name | | Percentage
of Net Assets | |
Exxon Mobil Corp.* | | | 3.4 | % |
| |
Apple, Inc. | | | 3.3 | |
| |
International Business Machines Corp.* | | | 2.3 | |
| |
Chevron Corp.* | | | 2.2 | |
| |
Microsoft Corp.* | | | 2.1 | |
| |
AT&T, Inc.* | | | 2.0 | |
| |
Google, Inc. | | | 1.8 | |
| |
Intel Corp.* | | | 1.6 | |
| |
Philip Morris International, Inc.* | | | 1.6 | |
| |
ConocoPhillips Co.* | | | 1.4 | |
| | | | |
Top Ten as a Group | | | 21.7 | % |
| | | | |
| * | Top Ten Holding at April 30, 2011 |
|
Any sectors, industries, or securities discussed should not be perceived as investment recommendations. Mention of a specific security should not be considered a recommendation to buy or solicitation to sell that security. Specific securities mentioned in this report may have been sold from the Fund’s portfolio of investments by the time you receive this report. |
Managers AMG FQ U.S. Equity Fund
Schedule of Portfolio Investments
October 31, 2011
| | | | | | | | |
| | | Shares | | | Value | |
Common Stocks - 99.2% | | | | | | | | |
Consumer Discretionary - 13.1% | | | | | |
Aaron’s, Inc. | | | 5,000 | | | $ | 133,800 | |
Ameristar Casinos, Inc. | | | 15,400 | | | | 284,900 | |
Bed Bath & Beyond, Inc.* | | | 6,200 | | | | 383,408 | |
Best Buy Co., Inc. | | | 14,200 | | | | 372,466 | |
Capella Education Co.* | | | 4,600 | | | | 160,126 | |
Cato Corp., The, Class A | | | 1,800 | | | | 46,134 | |
CBS Corp., Class B | | | 9,800 | | | | 252,938 | |
Coach, Inc. | | | 800 | | | | 52,056 | |
Coinstar, Inc.* | | | 6,400 | 2 | | | 305,536 | |
DIRECTV, Class A* | | | 2,400 | | | | 109,104 | |
Discovery Communications, Inc., Class A* | | | 8,800 | | | | 382,448 | |
DISH Network Corp., Class A* | | | 12,800 | | | | 309,376 | |
DSW, Inc.* | | | 3,000 | | | | 157,020 | |
Expedia, Inc. | | | 7,400 | | | | 194,324 | |
Harman International Industries, Inc. | | | 1,600 | | | | 69,056 | |
Home Depot, Inc., The | | | 9,600 | | | | 343,680 | |
HSN, Inc. | | | 1,200 | | | | 42,804 | |
Hyatt Hotels Corp., Class A* | | | 1,800 | | | | 66,942 | |
International Game Technology | | | 12,400 | | | | 218,116 | |
McDonald’s Corp. | | | 800 | | | | 74,280 | |
News Corp., Inc., Class A | | | 26,200 | | | | 459,024 | |
Nike, Inc. | | | 4,800 | | | | 462,480 | |
NutriSystem, Inc. | | | 2,600 | | | | 32,136 | |
Papa John’s International, Inc.* | | | 1,600 | | | | 54,016 | |
PetSmart, Inc. | | | 3,200 | | | | 150,240 | |
Sally Beauty Holdings, Inc.* | | | 7,000 | | | | 134,330 | |
Scripps Networks Interactive, Inc., Class A | | | 8,200 | | | | 348,336 | |
Sotheby’s | | | 1,400 | | | | 49,308 | |
Town Sports International Holdings, Inc.* | | | 7,000 | | | | 60,760 | |
True Religion Apparel, Inc.* | | | 800 | | | | 27,136 | |
Weight Watchers International, Inc. | | | 3,800 | | | | 283,556 | |
Wynn Resorts, Ltd. | | | 800 | | | | 106,240 | |
Total Consumer
Discretionary | | | | | | | 6,126,076 | |
Consumer Staples - 9.5% | | | | | |
Brown-Forman Corp., Class B | | | 3,800 | | | | 283,974 | |
Central Garden & Pet Co., Class A* | | | 7,800 | | | | 68,562 | |
Church & Dwight Co., Inc. | | | 3,600 | | | | 159,048 | |
Coca-Cola Co., The | | | 2,200 | | | | 150,304 | |
ConAgra Foods, Inc. | | | 7,400 | | | | 187,442 | |
Costco Wholesale Corp. | | | 1,600 | | | | 133,200 | |
Estee Lauder Co., Class A | | | 2,600 | | | | 255,970 | |
| | | | | | | | |
| | | Shares | | | Value | |
Herbalife, Ltd. | | | 2,400 | | | $ | 149,664 | |
Kroger Co., The | | | 16,400 | | | | 380,152 | |
Lorillard, Inc. | | | 3,200 | | | | 354,112 | |
Philip Morris International, Inc. | | | 10,800 | | | | 754,596 | |
Procter & Gamble Co., The | | | 9,000 | | | | 575,910 | |
Revlon, Inc., Class A* | | | 4,400 | | | | 64,812 | |
Walgreen Co. | | | 12,600 | | | | 418,320 | |
Wal-Mart Stores, Inc. | | | 2,400 | | | | 136,128 | |
Whole Foods Market, Inc. | | | 5,200 | | | | 375,024 | |
Total Consumer Staples | | | | | | | 4,447,218 | |
Energy - 10.8% | | | | | | | | |
Chevron Corp. | | | 10,000 | | | | 1,050,500 | |
ConocoPhillips Co. | | | 9,400 | | | | 654,710 | |
Exxon Mobil Corp. | | | 20,600 | | | | 1,608,654 | |
Halliburton Co. | | | 2,200 | | | | 82,192 | |
Helix Energy Solutions Group, Inc.* | | | 6,000 | | | | 108,360 | |
Helmerich & Payne, Inc. | | | 6,600 | | | | 350,988 | |
Occidental Petroleum Corp. | | | 6,400 | | | | 594,816 | |
RPC, Inc. | | | 8,600 | 2 | | | 159,702 | |
VAALCO Energy, Inc.* | | | 13,000 | | | | 88,530 | |
Valero Energy Corp. | | | 13,400 | | | | 329,640 | |
Total Energy | | | | | | | 5,028,092 | |
Financials - 14.8% | | | | | | | | |
Aflac, Inc. | | | 9,200 | | | | 414,828 | |
American Express Co. | | | 10,400 | | | | 526,448 | |
Apartment Investment and Management Co. | | | 5,400 | | | | 133,218 | |
Bank of America Corp. | | | 33,800 | | | | 230,854 | |
Berkshire Hathaway, Inc.,
Class B* | | | 5,200 | | | | 404,872 | |
Calamos Asset Management, Inc., Class A | | | 4,200 | | | | 52,458 | |
CBOE Holdings, Inc. | | | 3,000 | | | | 78,390 | |
Chubb Corp., The | | | 6,000 | | | | 402,300 | |
Citigroup, Inc. | | | 9,800 | | | | 309,582 | |
Discover Financial Services | | | 14,800 | | | | 348,688 | |
Dynex Capital, Inc. | | | 21,000 | | | | 183,960 | |
FBL Financial Group, Inc., Class A | | | 1,800 | | | | 58,770 | |
Franklin Resources, Inc. | | | 3,800 | | | | 405,194 | |
Goldman Sachs Group, Inc. | | | 1,800 | | | | 197,190 | |
Hospitality Properties Trust | | | 7,600 | | | | 182,628 | |
JPMorgan Chase & Co. | | | 13,200 | | | | 458,832 | |
KeyCorp | | | 51,400 | | | | 362,884 | |
Moody’s Corp. | | | 6,600 | | | | 234,234 | |
Morgan Stanley | | | 5,200 | | | | 91,728 | |
Nara Bancorp, Inc.* | | | 6,200 | | | | 52,576 | |
|
The accompanying notes are an integral part of these financial statements. 13 |
Managers AMG FQ U.S. Equity Fund
Schedule of Portfolio Investments (continued)
| | | | | | | | |
| | | Shares | | | Value | |
Financials - 14.8% (continued) | | | | | | | | |
NASDAQ OMX Group, Inc., The* | | | 5,000 | | | $ | 125,250 | |
Newcastle Investment Corp. | | | 19,200 | | | | 88,128 | |
Principal Financial Group | | | 4,400 | | | | 113,432 | |
Public Storage, Inc. | | | 1,600 | | | | 206,480 | |
Rayonier, Inc. | | | 8,800 | | | | 367,224 | |
Republic Bancorp, Inc., Class A | | | 5,200 | | | | 105,768 | |
SunTrust Banks, Inc. | | | 10,400 | | | | 205,192 | |
Torchmark Corp. | | | 2,800 | | | | 114,604 | |
Two Harbors Investment Corp. | | | 2,600 | | | | 24,310 | |
Wells Fargo & Co. | | | 16,400 | | | | 424,924 | |
Total Financials | | | | | | | 6,904,946 | |
Health Care - 11.3% | | | | | | | | |
Aetna, Inc. | | | 2,800 | | | | 111,328 | |
AmerisourceBergen Corp. | | | 8,000 | | | | 326,400 | |
ArthroCare Corp.* | | | 5,200 | | | | 156,780 | |
Biogen Idec, Inc.* | | | 2,400 | | | | 279,264 | |
Bristol-Myers Squibb Co. | | | 15,800 | | | | 499,122 | |
Cantel Medical Corp. | | | 3,800 | | | | 104,880 | |
Celgene Corp.* | | | 1,000 | | | | 64,830 | |
Chemed Corp. | | | 1,400 | | | | 83,104 | |
Eli Lilly and Co. | | | 12,000 | | | | 445,920 | |
Express Scripts, Inc.* | | | 600 | | | | 27,438 | |
Forest Laboratories, Inc.* | | | 11,400 | | | | 356,820 | |
Gilead Sciences, Inc.* | | | 1,200 | | | | 49,992 | |
Johnson & Johnson | | | 4,800 | | | | 309,072 | |
McKesson Corp. | | | 4,400 | | | | 358,820 | |
Medicines Co., The* | | | 3,600 | | | | 67,392 | |
Medtronic, Inc. | | | 2,800 | | | | 97,272 | |
Orthofix International NV* | | | 2,200 | | | | 77,242 | |
Pfizer, Inc. | | | 13,200 | | | | 254,232 | |
Providence Service Corp.* | | | 4,200 | | | | 52,500 | |
Sirona Dental Systems, Inc.* | | | 2,000 | | | | 95,800 | |
UnitedHealth Group, Inc. | | | 10,600 | | | | 508,694 | |
Varian Medical Systems, Inc.* | | | 5,200 | | | | 305,344 | |
ViroPharma, Inc.* | | | 5,800 | | | | 117,392 | |
Warner Chilcott, Ltd.,
Class A* | | | 14,000 | | | | 253,680 | |
WellPoint, Inc. | | | 4,000 | | | | 275,600 | |
Total Health Care | | | | | | | 5,278,918 | |
Industrials - 9.2% | | | | | | | | |
3M Co. | | | 600 | | | | 47,412 | |
Alaska Airgroup, Inc.* | | | 5,000 | | | | 332,650 | |
AMERCO* | | | 4,200 | | | | 317,982 | |
| | | | | | | | |
| | | Shares | | | Value | |
Applied Industrial Technologies, Inc. | | | 10,600 | | | $ | 356,372 | |
Caterpillar, Inc. | | | 3,600 | | | | 340,056 | |
Chicago Bridge & Iron Co., N.V. | | | 2,800 | | | | 102,424 | |
CSX Corp. | | | 1,400 | | | | 31,094 | |
Cummins, Inc. | | | 4,200 | | | | 417,606 | |
GenCorp, Inc.* | | | 11,000 | | | | 53,460 | |
General Electric Co. | | | 16,000 | | | | 267,360 | |
Grainger (W.W.), Inc. | | | 2,200 | | | | 376,882 | |
HEICO Corp. | | | 5,400 | 2 | | | 307,908 | |
MSC Industrial Direct Co., Class A | | | 600 | | | | 40,806 | |
NACCO Industries, Inc., Class A | | | 1,400 | | | | 114,940 | |
Nordson Corp. | | | 4,000 | | | | 185,480 | |
Norfolk Southern Corp. | | | 600 | | | | 44,394 | |
Sauer-Danfoss, Inc.* | | | 7,400 | | | | 286,528 | |
Union Pacific Corp. | | | 5,000 | | | | 497,850 | |
United Parcel Service, Inc., Class B | | | 1,000 | | | | 70,240 | |
United Technologies Corp. | | | 1,200 | | | | 93,576 | |
Total Industrials | | | | | | | 4,285,020 | |
Information Technology - 21.0% | | | | | | | | |
Apple, Inc.* | | | 3,800 | | | | 1,538,164 | |
Applied Materials, Inc. | | | 27,200 | | | | 335,104 | |
Broadridge Financial Solutions, Inc. | | | 7,600 | | | | 169,100 | |
Dell, Inc.* | | | 21,000 | | | | 332,010 | |
Dolby Laboratories, Inc., Class A* | | | 10,400 | | | | 304,096 | |
Google, Inc.* | | | 1,400 | | | | 829,696 | |
Hewlett-Packard Co. | | | 17,200 | | | | 457,692 | |
Intel Corp. | | | 31,200 | | | | 765,648 | |
International Business Machines Corp. | | | 5,800 | | | | 1,070,854 | |
Intuit, Inc.* | | | 5,000 | | | | 268,350 | |
Kemet Corp.* | | | 7,800 | | | | 71,916 | |
KLA-Tencor Corp. | | | 2,700 | | | | 127,143 | |
Littelfuse, Inc. | | | 6,000 | | | | 293,760 | |
MasterCard, Inc., Class A | | | 1,200 | | | | 416,688 | |
Microsoft Corp. | | | 36,400 | | | | 969,332 | |
NeuStar, Inc., Class A* | | | 4,200 | | | | 133,518 | |
Newport Corp.* | | | 10,600 | | | | 146,810 | |
Oracle Corp. | | | 14,800 | | | | 484,996 | |
QUALCOMM, Inc. | | | 4,600 | | | | 237,360 | |
ValueClick, Inc.* | | | 7,200 | | | | 126,720 | |
Visa, Inc., Class A | | | 5,200 | | | | 484,952 | |
VMware, Inc. Class A* | | | 800 | | | | 78,200 | |
Western Digital Corp.* | | | 800 | | | | 21,312 | |
Western Union Co., The | | | 8,200 | | | | 143,254 | |
Total Information Technology | | | | | | | 9,806,675 | |
|
The accompanying notes are an integral part of these financial statements. 14 |
Managers AMG FQ U.S. Equity Fund
Schedule of Portfolio Investments (continued)
| | | | | | | | |
| | | Shares | | | Value | |
Materials - 3.9% | | | | | | | | |
Buckeye Technologies, Inc. | | | 1,000 | | | $ | 30,240 | |
CF Industries Holdings, Inc. | | | 2,200 | | | | 356,994 | |
Domtar Corp. | | | 4,400 | | | | 360,404 | |
Eastman Chemical Co. | | | 3,200 | | | | 125,728 | |
Freeport McMoRan Copper & Gold, Inc., Class B | | | 11,600 | | | | 467,016 | |
International Paper Co. | | | 11,400 | | | | 315,780 | |
LSB Industries, Inc.* | | | 2,000 | | | | 70,860 | |
Mosaic Co., The | | | 1,800 | | | | 105,408 | |
Total Materials | | | | | | | 1,832,430 | |
Telecommunication Services - 2.2% | | | | | | | | |
AT&T, Inc. | | | 31,400 | | | | 920,334 | |
NII Holdings, Inc., Class B* | | | 3,200 | | | | 75,296 | |
Telephone & Data Systems, Inc. | | | 2,000 | | | | 46,360 | |
Total Telecommunication Services | | | | | | | 1,041,990 | |
Utilities - 3.4% | | | | | | | | |
Alliant Energy Corp. | | | 2,000 | | | | 81,560 | |
American Electric Power Co., Inc. | | | 9,000 | | | | 353,520 | |
| | | | | | | | |
| | | Shares | | | Value | |
Entergy Corp. | | | 2,400 | | | $ | 166,008 | |
Exelon Corp. | | | 1,000 | | | | 44,390 | |
NiSource, Inc. | | | 15,600 | | | | 344,604 | |
Portland General Electric Co. | | | 3,400 | | | | 83,436 | |
Public Service Enterprise Group, Inc. | | | 11,400 | | | | 384,180 | |
Southwest Gas Corp. | | | 3,200 | | | | 126,336 | |
Total Utilities | | | | | | | 1,584,034 | |
Total Common Stocks
(cost $43,777,486) | | | | | | | 46,335,399 | |
Short-Term Investments - 1.8%1 | | | | | |
BNY Mellon Overnight Government Fund, 0.10%3 | | | 680,965 | | | | 680,965 | |
Dreyfus Cash Management Fund, Institutional Class Shares, 0.05% | | | 175,692 | | | | 175,692 | |
Total Short-Term Investments
(cost $856,657) | | | | | | | 856,657 | |
Total Investments - 101.0%
(cost $44,634,143) | | | | | | | 47,192,056 | |
Other Assets, less Liabilities - (1.0)% | | | | (456,019 | ) |
Net Assets - 100.0% | | | | | | $ | 46,736,037 | |
The accompanying notes are an integral part of these financial statements.
15
Managers AMG FQ Global Alternatives Fund
Portfolio Manager’s Comments
The Managers AMG FQ Global Alternatives Fund delivered negative returns for the past fiscal year ended October 31, 2011. The Fund (Class A shares at NAV) returned -9.09% while the benchmark, the Citigroup 1-Month Treasury Bill Index, returned 0.08% during this time period. Please refer to the table on page 17 for the returns of the other share classes.
Global capital markets continued to rally over the prior fiscal year although not without considerable volatility, particularly during the summer months as global sovereign debt concerns distressed markets worldwide. For the entire one-year period ended October 31, 2011, U.S. large-cap stocks outperformed their smaller-cap brethren with the Russell 1000® (large cap), Russell 2000® (small cap), Russell 3000® (all cap), and the Russell Microcap® Indices returning 8.0%, 6.7%, 7.9%, and 2.1%, respectively. International developed-market stocks underperformed their domestic counterparts by a wide margin primarily due to ongoing concerns about the sovereign debt market in continental Europe. The MSCI EAFE Index returned -4.1% during this period. Meanwhile, REITs outperformed most domestic U.S. equities, returning 11.7%. Fixed-income securities also enjoyed solid returns for the prior fiscal year as the Barclays Capital U.S. Aggregate and the Barclays Capital Global Aggregate ex-U.S. Indexes returned 5.0% and 4.1%, respectively. Lower-quality securities posted results in line with their higher-quality counterparts, returning 5.2% as measured by the Barclays Capital U.S. Corporate High Yield Index.
During this period, the Global Alternatives Fund’s disappointing performance was primarily driven by select positions within its currency and bond country selection strategies. In particular, performance was challenging in both December of 2010 and August of 2011 although both months were followed by positive performance in the following month largely driven by the same positions that were out of favor in the prior month. Within the currency strategy, the short Swiss Franc and long U.K. Pound Sterling positions had difficult performance at the end of 2010. Increased demand for commodities largely driven by China led to a sharp appreciation in the Australian Dollar in December although this was quickly reversed in the first several weeks of January. In July and August, a sharp appreciation in the Swiss Franc was detrimental to performance as the Fund had lengthened its short position to the currency due to a number of factors pointing to it becoming significantly overvalued in the months prior. A sharp reversal occurred in the
Swiss Franc as it depreciated quickly in the following weeks causing the short position to begin adding value within this strategy towards the end of the third quarter. The Fund’s stock country and asset class selection strategies did not present significant opportunities throughout the course of the year and their modestly positive performance was not enough to offset the negative performance, particularly within the currency strategy.
The tactical risk allocation in the Fund currently finds the most compelling opportunities within the currency and bond country selection strategies. Within the currency strategy, the three largest positions are short positions to the Australian Dollar and the Swiss Franc and a long position to the U.K. Pound Sterling. Each of these positions has been in place for the past year and continues to present considerable opportunity for returns. Within the bond country selection strategy, the largest position is a short to the Australian bond market. While the bond country selection strategy continues to present opportunity, towards the end of the fiscal year valuation measures did bring a contraction of exposures. Within the stock country selection strategy, the Fund maintains long positions to the Netherlands, the U.K., and the U.S. and short positions to the Australian and Japanese equity markets. Finally, within the asset class selection strategy, the Fund maintains a long position to global equities and a short position to global bonds.
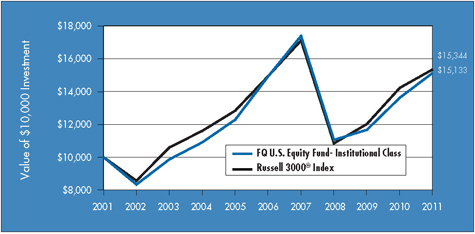
Cumulative Total Return Performance
Managers AMG FQ Global Alternatives Fund’s cumulative total return is based on the daily change in net asset value (NAV), and assumes that all distributions were reinvested. The Citigroup 1-Month U.S. Treasury Bill Index (“1-Month Treasury Index”) measures returns of 1-month treasury bills. Unlike the Fund, the 1-Month Treasury Index is unmanaged, is not available for investment, and does not incur expenses. The chart on page 17 illustrates the performance of a hypothetical $10,000 investment made in the Class A shares (with load) of the Fund on March 30, 2006 (commencement of operations), to a $10,000 investment made in the 1-Month Treasury Index for the same time period. Figures include reinvestment of capital gains and dividends. The listed returns for the Fund are net of expenses and the returns for the index exclude expenses. The graph and table do not reflect the deduction of taxes that a shareholder would pay on a Fund distribution or redemption of shares. Total returns for the Fund would have been lower had certain expenses not been reduced.
16
|
Managers AMG FQ Global Alternatives Fund Portfolio Manager’s Comments (continued) |
Cumulative Total Return Performance (continued)
The table below shows the average annualized total returns for the Managers AMG FQ Global Alternatives Fund and the Citigroup 1-Month U.S. Treasury Bill Index since inception through October 31, 2011.
| | | | | | | | | | | | | | | | |
Average Total Returns1 | | One
Year | | | Five
Years | | | Since
Inception | | | Inception
Date | |
Managers AMG FQ
Global Alternatives Fund*33,4,5,6,7 | | | | | | | | | | | | | | | | |
No Load: | | | | | | | | | | | | | | | | |
Class A | | | (9.09 | )% | | | 1.06 | % | | | 0.46 | % | | | 03/30/06 | |
Class C | | | (9.62 | )% | | | 0.37 | % | | | (0.23 | )% | | | 03/30/06 | |
Service Class | | | (8.86 | )% | | | — | | | | (3.39 | )% | | | 01/01/10 | |
Institutional Class | | | (8.67 | )% | | | — | | | | (3.28 | )% | | | 01/01/10 | |
Citigroup 1-Month U.S. Treasury Bill Index2 | | | 0.08 | % | | | 1.40 | % | | | 1.75 | % | | | 03/31/06 | |
With Load: | | | | | | | | | | | | | | | | |
Class A | | | (14.29 | )% | | | (0.12 | )% | | | (0.60 | )% | | | 03/30/06 | |
Class C | | | (10.52 | )% | | | 0.37 | % | | | (0.23 | )% | | | 03/30/06 | |
| * | Commencement of operations was March 30, 2006. |
The performance data shown represents past performance, which is not a guarantee of future results. Current performance may be lower or higher than the performance data quoted. The investment return and principal value of an investment in the Funds will fluctuate so that an investor’s shares, when redeemed, may be worth more or less than their original cost. For performance information through the most recent month end please call (800) 835-3879 or visit our website at www.managersinvest.com.
In choosing a Fund, investors should carefully consider the amount they plan to invest, their investment objectives, the Fund’s investment objectives, risks, charges and expenses before investing. For this and other information, please call (800) 835-3879 or visit www.managersinvest.com for a free prospectus. Read it carefully before investing or sending money. Distributed by Managers Distributors, Inc., member FINRA.
| 1 | Total return equals income yield plus share price change and assumes reinvestment of all dividends and capital gain distributions. Returns are net of fees and may reflect offsets of Fund expenses as described in the Prospectus. No adjustment has been made for taxes payable by shareholders on their reinvested dividends and capital gain distributions. Returns for periods greater than one year are annualized. The listed returns on the Fund are net of expenses and based on the published NAV as of October 31, 2011. All returns are in U.S. dollars($). |
|
2 Performance for the Citigroup 1-Month U.S. Treasury Bill Index reflects an inception date of March 31, 2006. The Citigroup 1-Month U.S. Treasury Bill Index is a market value-weighted index of public obligations of the U.S. Treasury with maturities of one month. Unlike the Fund, the Citigroup 1-Month U.S. Treasury Bill Index is unmanaged, is not available for investment, and does not incur expenses. 3 From time to time, the Fund’s advisor has waived its fees and/or absorbed Fund expenses, which has resulted in higher returns. 4 Changing interest rates may adversely affect the value of an investment. An increase in interest rates typically causes the value of bonds and other fixed-income securities to fall. 5 The Fund may use derivative instruments for hedging purposes or as part of its investment strategy. There is a risk that a derivative intended as a hedge may not perform as expected. The main risk with derivatives is that some types can amplify a gain or loss, potentially earning or losing substantially more money than the actual cost of the derivative or that the counterparty may fail to honor its contract terms, causing a loss for the Fund. Use of these instruments may also involve certain costs and risks such as liquidity risk, interest rate risk, market risk, credit risk, management risk, and the risk that a fund could not close out a position when it would be most advantageous to do so. The Fund is subject to currency risk resulting from fluctuations in exchange rates that may affect the total loss or gain on a non-U.S Dollar security when converted back to U.S Dollars. 6 Class C Shares convert to an equal dollar value of Class A Shares at the end of the tenth year after purchase. 7 Investments in foreign securities and currency instruments are subject to additional risks such as erratic market conditions, economic and political instability, and currency exchange rate fluctuations. Not FDIC insured, nor bank guaranteed. May lose value. |
Managers AMG FQ Global Essentials Fund
Portfolio Manager’s Comments
The Managers AMG FQ Global Essentials Fund delivered strong positive absolute and relative returns for the past fiscal year. The Fund (Investor Class shares at NAV) returned 5.06%, while its benchmark, which consists of 60% of the return of MSCI World (hedged) Index and 40% of the return of the Citigroup World Government Bond (hedged) Index, returned 0.12% during this time.
Global capital markets continued to rally over the prior fiscal year although not without considerable volatility, particularly during the summer months as global sovereign debt concerns distressed markets worldwide. For the entire one-year period ended October 31, 2011, U.S. large-cap stocks outperformed their smaller-cap brethren with the Russell 1000® (large cap), Russell 2000® (small cap), Russell 3000® (all cap), and the Russell Microcap® Indexes returning 8.0%, 6.7%, 7.9%, and 2.1%, respectively. International developed-market stocks underperformed their domestic counterparts by a wide margin primarily due to ongoing concerns about the sovereign debt market in continental Europe. The MSCI EAFE Index returned -4.1% during this period. Meanwhile, REITs outperformed most domestic U.S. equities, returning 11.7%. Fixed-income securities also enjoyed solid returns for the prior fiscal year as the Barclays Capital U.S. Aggregate and the Barclays Capital Global Aggregate ex-U.S. Indexes returned 5.0% and 4.1%, respectively. Lower-quality securities posted results in line with their higher quality counterparts, returning 5.2% as measured by the Barclays Capital U.S. Corporate High Yield Index.
The Fund’s strong relative performance versus its blended benchmark is attributable to not only solid protection during down markets but also to solid participation in up markets during the past fiscal year. The Fund’s equity exposures offered mixed results with positions in the U.S. contributing positively to performance, while non-U.S. developed and emerging market equities detracted from returns. Meanwhile, the Fund’s sovereign debt positions added to performance during the fiscal year. Finally, the Fund’s commodity positions offered mixed results with the Fund’s gold exposure continuing to act as an excellent diversifier to the Fund’s other commodity positions. During the year, the Fund began to use commodity exchange traded notes (ETNs) which are more directly related to the commodity
markets. In addition, the Fund added allocations to high yield bonds during the year which are also a good diversifier to the rest of the Portfolio.
The First Quadrant Market Risk Index, (one of FQ’s proprietary investment tools) is currently measuring a “Very High Risk” environment as of the end of the fiscal year as, more recently, the VIX, a popular measure of the implied volatility of the S&P 500 Index, continues to remain high. This has led to a decrease in exposure to both equities and commodities and an increase in exposure to sovereign debt within the Fund.
Cumulative Total Return Performance
Managers AMG FQ Global Essentials Fund’s cumulative total return is based on the daily change in net asset value (NAV), and assumes that all distributions were reinvested. Managers AMG FQ Global Essentials Fund Composite Hedged Index (“Hedged Index”) and the Managers AMG FQ Global Essentials Fund Composite Unhedged Index (“Unhedged Index”) are comprised of 60% MSCI World Index and 40% Citigroup World Government Bond Index. The MSCI World Index is a free float-adjusted market capitalization weighted index that is designed to measure the equity market performance of developed and emerging markets. The MSCI World Index consists of 24 developed country indices. Unlike the Fund, the Composite Index is unmanaged, is not available for investment, and does not incur fees. All MSCI data is provided ‘as is.’ The chart on page 21 illustrates the performance of a hypothetical $10,000 investment made in the Institutional Class shares of the Fund on October 31, 2001, to a $10,000 investment made in the Hedged Index and the Unhedged Index for the same time period. Figures include reinvestment of capital gains and dividends. The listed returns for the Fund are net of expenses and the returns for the index exclude expenses. The graph and table do not reflect the deduction of taxes that a shareholder would pay on a Fund distribution or redemption of shares. Total returns for the Fund would have been lower had certain expenses not been reduced.
18
|
Managers AMG FQ Global Essentials Fund Portfolio Manager’s Comments (continued) |
Cumulative Total Return Performance (continued)

The table below shows the average annualized total returns for the Managers AMG FQ Global Essentials Fund since inception through October 31, 2011, and the Managers AMG FQ Global Essentials Fund Composite Hedged and Unhedged Indexes from October 31, 2001 to October 31, 2011.
| | | | | | | | | | | | | | | | | | | | |
Average Annual Total Returns1 | | One
Year | | | Five
Years | | | Ten
Years | | | Since
Inception | | | Inception
Date | |
Managers AMG FQ Global Essentials Fund2,3,4,5 | | | | | | | | | | | | | | | | | | | | |
Investor Class | | | 5.06 | % | | | — | | | | — | | | | 9.38 | % | | | 01/01/10 | |
Service Class | | | 5.44 | % | | | — | | | | — | | | | 9.73 | % | | | 01/01/10 | |
Institutional Class | | | 5.62 | % | | | 0.93 | % | | | 4.35 | % | | | 6.29 | % | | | 11/18/88 | |
Managers AMG FQ Global Essentials Fund Composite Hedged Index6 | | | 0.12 | % | | | (0.28 | )% | | | 2.59 | % | | | | | | | | |
Managers AMG FQ Global Essentials Fund Composite Unhedged Index6 | | | 3.02 | % | | | 2.98 | % | | | 6.19 | % | | | | | | | | |
The performance data shown represents past performance, which is not a guarantee of future results. Current performance may be lower or higher than the performance data quoted. The investment return and principal value of an investment in the Funds will fluctuate so that an investor’s shares, when redeemed, may be worth more or less than their original cost. For performance information through the most recent month end please call (800) 835-3879 or visit our website at www.managersinvest.com.
In choosing a Fund, investors should carefully consider the amount they plan to invest, their investment objectives, the Fund’s investment objectives, risks, charges and expenses before investing. For this and other information, please call (800) 835-3879 or visit www.managersinvest.com for a free prospectus. Read it carefully before investing or sending money. Distributed by Managers Distributors, Inc., member FINRA.
| 1 | Total return equals income yield plus share price change and assumes reinvestment of all dividends and capital gain distributions. Returns are net of fees and may reflect offsets of Fund expenses as described in the Prospectus. No adjustment has been made for taxes payable by shareholders on their reinvested dividends and capital gain distributions. Returns for periods greater than one year are annualized. The listed returns on the Fund are net of expenses and based on the published NAV as of October 31, 2011. All returns are in U.S. dollars($). |
| 2 | Investments in foreign securities, even though publicly traded in the United States, may involve risks which are in addition to those inherent in domestic investments. The use of leverage in a Fund’s strategy can magnify relatively small market movements into relatively larger losses for the Fund. |
| 3 | The Fund is subject to special risk considerations similar to those associated with the direct ownership of real estate. Real estate valuations may be subject to factors such as changing general and local economic, financial, competitive and environmental conditions. |
|
4 Because the Fund invests in exchange-traded funds (ETFs) which incur their own costs, investing in them could result in a higher cost to the investor. Additionally, the Fund will be indirectly exposed to all the risks of securities held by the ETFs. 5 Obligations of certain government agencies are not backed by the full faith and credit of the U.S. Government. If one of these agencies defaulted on a loan, there is no guarantee that the U.S. Government will provide financial support. Additionally, debt securities of the U.S. Government may be affected by changing interest rates and subject to prepayment risk. 6 The Fund’s index is comprised of 60% MSCI World Index and 40% Citigroup World Government Bond Index. The MSCI World Index is a free float-adjusted market capitalization weighted index that is designed to measure the equity market performance of developed and emerging markets. The MSCI World Index consists of 24 developed country indices. The Citigroup World Government Bond Index is a market capitalization weighted index consisting of the government bond markets. Country eligibility is determined based on market capitalization and investability criteria. All issues have a remaining maturity of at least one year. Unlike the Fund, the Composite Index is unmanaged, is not available for investment, and does not incur fees. All MSCI data is provided ‘as is.’ The products described herein are not sponsored or endorsed and have not been reviewed or passed on by MSCI. In no event shall MSCI, its affiliates, or any MSCI data provider have any liability of any kind in connection with the MSCI data or the products described herein. Copying or redistributing the MSCI data is strictly prohibited. Not FDIC insured, nor bank guaranteed. May lose value. |
|
Managers AMG Funds Notes to Schedules of Portfolio Investments |
The following footnotes and abbreviations should be read in conjunction with each of the Schedules of Portfolio Investments previously presented in this report.
At October 31, 2011, the cost of securities for Federal income tax purposes and the gross aggregate unrealized appreciation and/or depreciation based on tax cost were approximately:
| | | | | | | | | | | | | | | | |
Fund | | Cost | | | Appreciation | | | Depreciation | | | Net | |
Managers AMG FQ Tax-Managed U.S. Equity | | $ | 33,485,495 | | | $ | 9,874,264 | | | ($ | 755,717 | ) | | $ | 9,118,547 | |
Managers AMG FQ U.S. Equity | | | 44,775,505 | | | | 3,995,012 | | | | (1,578,461 | ) | | | 2,416,551 | |
| * | Non-income-producing security. |
| 1 | Yield shown for each investment company below represents the October 31, 2011, seven-day average yield, which refers to the sum of the previous seven days’ dividends paid, expressed as an annual percentage. |
| 2 | Some or all of these shares were out on loan to various brokers as of October 31, 2011, amounting to: |
| | | | | | | | |
Fund | | Market Value | | | % of Net Assets | |
Managers AMG FQ Tax-Managed U.S. Equity | | $ | 775,116 | | | | 1.9 | % |
Managers AMG FQ U.S. Equity | | | 651,791 | | | | 1.4 | |
| 3 | Collateral received from brokers for securities lending was invested in this short-term investment. |
The following table summarizes the inputs used to value the Funds’ net assets by the fair value hierarchy levels as of October 31, 2011: (See Note 1(a) in the Notes to Financial Statements.) As of October 31, 2011, the securities in Managers AMG FQ Tax-Managed U.S. Equity were all Level 1 inputs.
| | | | | | | | | | | | | | | | |
| | | Quoted Prices in
Active Markets
for Identical
Investments Level 1 | | | Significant
Other Observable
Inputs Level 2 | | | Significant
Unobservable
Inputs Level 3 | | | Total | |
Managers AMG FQ U.S. Equity | | | | | | | | | | | | | | | | |
Investments in Securities | | | | | | | | | | | | | | | | |
Common Stocks† | | $ | 46,335,399 | | | | — | | | | — | | | $ | 46,335,399 | |
Short-Term Investments | | | 856,657 | | | | — | | | | — | | | | 856,657 | |
| | | | | | | | | | | | | | | | |
Total Investments in Securities | | $ | 47,192,056 | | | | — | | | | — | | | $ | 47,192,056 | |
| | | | | | | | | | | | | | | | |
Financial Derivative Instruments - Assets†† | | | | | | | | | | | | | | | | |
Equity Contracts | | $ | 3,727 | | | | — | | | | — | | | $ | 3,727 | |
| | | | | | | | | | | | | | | | |
| † | All common stocks held in the Fund are Level 1 securities. For a detailed break-out of the common stocks by major industry classification, please refer to the Schedule of Portfolio Investments. |
| †† | Derivative instruments, such as futures, forwards and swap contracts, are not reflected in the Schedules of Portfolio Investments, and are valued at the unrealized appreciation/depreciation of the instrument. |
As of October 31, 2011, the Funds had no significant transfers between Level 1 and Level 2 from the beginning of the reporting period.
20
Managers AMG Funds
Notes to Schedules of Portfolio Investments (continued)
All futures contracts are exchange traded unless otherwise noted. The open futures contracts as of October 31, 2011, were as follows:
(See Note 9 in the Notes to Financial Statements.)
| | | | | | | | | | | | |
Managers AMG FQ U.S. Equity | | | | | | | | | | |
Type | | Number of
Contracts | | | Position | | Expiration Date | | Unrealized
Gain | |
S&P 500 E-Mini Index | | | 2 | | | Long | | 12/16/11 | | $ | 3,727 | |
The following schedule shows the fair values of derivative instruments at October 31, 2011:
| | | | | | | | | | | | | | |
| | | | | Asset Derivatives | | | Liability Derivatives | |
Fund | | Derivatives not accounted for as hedging instruments | | Statement of Assets and
Liabilities Location | | Fair Value | | | Statement of Assets and
Liabilities Location | | Fair Value | |
Managers AMG FQ U.S. Equity | | Equity contracts | | Receivable for variation margin on futures | | | — | | | Payable for variation margin on futures | | $ | 3,160 | |
| | | | | | | | | | | | | | |
As of October 31, 2011, the effect of derivative instruments on the Statement of Operations for Managers AMG FQ U.S Equity and the amount of realized gain/(loss) on derivatives recognized in income was as follows:
| | | | | | | | | | | | | | |
Fund | | Derivatives not accounted for as hedging instruments | | Futures | | | Forward Currency
Contracts | | | Total | |
Managers AMG FQ U.S. Equity | | Equity contracts | | $ | 36,566 | | | | — | | | $ | 36,566 | |
| | | | | | | | | | | | | | |
The change in unrealized gain/(loss) on derivatives recognized in income was as follows:
| | | | | | | | | | | | | | |
Fund | | Derivatives not accounted for as hedging instruments | | Futures | | | Forward Currency
Contracts | | | Total | |
Managers AMG FQ U.S. Equity | | Equity contracts | | ($ | 15,995 | ) | | | — | | | ($ | 15,995 | ) |
| | | | | | | | | | | | | | |
21
Managers AMG Funds
Statements of Assets and Liabilities
October 31, 2011
| | | | | | | | |
| | | FQ Tax-Managed
U.S. Equity | | | FQ U.S.
Equity | |
Assets: | | | | | | | | |
Investments at value (including securities on loan valued at $775,116 and $651,791, respectively)* | | $ | 42,604,042 | | | $ | 47,192,056 | |
Cash collateral for futures | | | — | | | | 77,000 | |
Receivable for investments sold | | | — | | | | 2,222,484 | |
Receivable for Fund shares sold | | | 5,989 | | | | 20,057 | |
Dividends and other receivables | | | 26,466 | | | | 53,671 | |
Receivable from affiliate | | | 2,650 | | | | 2,119 | |
Prepaid expenses | | | 17,822 | | | | 14,799 | |
Total assets | | | 42,656,969 | | | | 49,582,186 | |
Liabilities: | | | | | | | | |
Payable upon return of securities loaned | | | 820,542 | | | | 680,964 | |
Payable for Fund shares repurchased | | | 156,101 | | | | 21,666 | |
Payable for investments purchased | | | — | | | | 2,064,021 | |
Payable for variation margin on futures | | | — | | | | 3,160 | |
Accrued expenses: | | | | | | | | |
Investment management and advisory fees | | | 28,916 | | | | 13,430 | |
Administrative fees | | | — | | | | 9,529 | |
Distribution fees Class A | | | 634 | | | | 2,653 | |
Distribution fees Class C | | | 2,293 | | | | 457 | |
Professional fees | | | 30,091 | | | | 29,895 | |
Custodian fees | | | 4,846 | | | | 5,201 | |
Other | | | 12,565 | | | | 15,173 | |
Total liabilities | | | 1,055,988 | | | | 2,846,149 | |
Net Assets | | $ | 41,600,981 | | | $ | 46,736,037 | |
Net Assets Represent: | | | | | | | | |
Paid-in capital | | $ | 61,281,052 | | | $ | 58,865,232 | |
Undistributed net investment income | | | 32,584 | | | | 451,901 | |
Accumulated net realized loss from investments and futures contracts | | | (28,831,202 | ) | | | (15,142,736 | ) |
Net unrealized appreciation of investments and futures contracts | | | 9,118,547 | | | | 2,561,640 | |
Net Assets | | $ | 41,600,981 | | | $ | 46,736,037 | |
Class A Shares - Net Assets | | $ | 3,049,311 | | | $ | 12,965,873 | |
Shares outstanding | | | 223,728 | | | | 1,147,017 | |
Net asset value, offering and redemption price per share | | $ | 13.63 | | | $ | 11.30 | |
Offering price per share based on a maximum sales charge of 5.75% (Net asset value per share/(100% - maximum sales charge)) | | $ | 14.46 | | | $ | 11.99 | |
Class C Shares - Net Assets | | $ | 2,811,056 | | | $ | 520,129 | |
Shares outstanding | | | 212,117 | | | | 46,432 | |
Net asset value, offering and redemption price per share | | $ | 13.25 | | | $ | 11.20 | |
Institutional Class Shares - Net Assets | | $ | 35,740,614 | | | $ | 33,250,035 | |
Shares outstanding | | | 2,632,692 | | | | 2,921,079 | |
Net asset value, offering and redemption price per share | | $ | 13.58 | | | $ | 11.38 | |
* Investments at cost | | $ | 33,485,495 | | | $ | 44,634,143 | |
The accompanying notes are an integral part of these financial statements.
22
Managers AMG FQ Global Alternatives Fund
Statement of Net Assets
October 31, 2011
| | | | | | | | |
| | | Principal Amount | | | Value | |
Assets: | | | | | | | | |
Investments in Securities - 100.0% | | | | | | | | |
U.S. Government Obligations - 10.4%1,2 | | | | | | | | |
U.S. Treasury Bills, 0.000%, 02/16/12 | | $ | 1,000,000 | | | $ | 999,851 | |
U.S. Treasury Bills, 0.023%, 03/08/12 | | | 28,625,000 | | | | 28,622,452 | |
U.S. Treasury Bills, 0.033%, 03/22/12 | | | 18,480,000 | | | | 18,477,450 | |
| | | | | | | | |
Total U.S. Government Obligations (cost $48,097,848) | | | | | | | 48,099,753 | |
| | |
| | | Shares | | | | |
| Exchange Traded Fund - 21.6% | | | | | | | | |
S&P 500 SPDR Trust Series I (cost $85,756,855) | | | 801,684 | | | | 100,571,258 | |
Short-Term Investments - 68.0%4 | | | | | | | | |
Dreyfus Cash Management Fund, Institutional Class Shares, 0.10%5,7 | | | 140,861,049 | | | | 140,861,049 | |
JPMorgan Liquid Assets Money Market Fund, Capital Shares, 0.11% | | | 175,496,602 | | | | 175,496,602 | |
| | | | | | | | |
Total Short-Term Investments (cost $316,357,651) | | | | | | | 316,357,651 | |
Total Investments in Securities (cost $450,212,354) | | | | | | | 465,028,662 | |
Unrealized appreciation on forward foreign currency contracts | | | | | | | 32,269,064 | |
Receivable for variation margin on futures contracts | | | | | | | 8,057,758 | |
Receivable for Fund shares sold | | | | | | | 1,576,674 | |
Receivable from affiliate | | | | | | | 269,765 | |
Prepaid expenses | | | | | | | 43,853 | |
Interest and other receivables | | | | | | | 11,904 | |
Total assets | | | | | | | 507,257,680 | |
Liabilities: | | | | | | | | |
Unrealized depreciation on forward foreign currency contracts | | | | | | | 22,363,007 | |
Payable for broker collateral on forward currency contracts | | | | | | | 7,400,000 | |
Payable for variation margin on futures contracts | | | | | | | 6,844,383 | |
Payable for Fund shares repurchased | | | | | | | 4,262,850 | |
Payable for foreign currency holdings | | | | | | | 14,891 | |
Accrued expenses: | | | | | | | | |
Investment management and advisory fees | | | | | | | 670,996 | |
Administrative fees | | | | | | | 99,991 | |
Distribution fees Class A | | | | | | | 77,322 | |
Distribution fees Class C | | | | | | | 24,340 | |
Transfer agent fees | | | | | | | 142,025 | |
Professional fees | | | | | | | 68,191 | |
Custodian fees | | | | | | | 18,026 | |
Other | | | | | | | 86,596 | |
Total liabilities | | | | | | | 42,072,618 | |
Net Assets | | | | | | $ | 465,185,062 | |
The accompanying notes are an integral part of these financial statements
23
|
Managers AMG FQ Global Alternatives Fund Statement of Net Assets (continued) |
| | | | |
| | | Value | |
Net Assets Represent: | | | | |
Paid-in capital | | $ | 441,032,834 | |
Undistributed net investment loss | | | (9,891,166 | ) |
Accumulated net realized gain from investments, futures and foreign currency transactions | | | 3,060,098 | |
Net unrealized appreciation of investments, futures and foreign currency translations | | | 30,983,296 | |
Net Assets | | $ | 465,185,062 | |
Class A Shares - Net Assets | | $ | 362,659,033 | |
Shares outstanding | | | 38,991,593 | |
Net asset value and redemption price per share | | $ | 9.30 | |
Offering price per share based on a maximum sales charge of 5.75%
(Net asset value per share/(100% - maximum sales charge)) | | $ | 9.87 | |
Class C Shares - Net Assets | | $ | 27,611,101 | |
Shares outstanding | | | 3,062,036 | |
Net asset value and redemption price per share | | $ | 9.02 | |
Service Shares - Net Assets | | $ | 43,869,675 | |
Shares outstanding | | | 4,687,670 | |
Net asset value and redemption price per share | | $ | 9.36 | |
Institutional Shares - Net Assets | | $ | 31,045,253 | |
Shares outstanding | | | 3,311,424 | |
Net asset value and redemption price per share | | $ | 9.38 | |
|
The accompanying notes are an integral part of these financial statements. 24 |
|
Managers AMG FQ Global Essentials Fund Statement of Net Assets October 31, 2011 |
| | | | | | | | |
| | | Principal Amount | | | Value | |
Assets: | | | | | | | | |
Investments in Securities - 105.3% | | | | | | | | |
U.S. Government Obligations - 9.4% | | | | | | | | |
U.S. Treasury Bills, 0.010%, 03/08/121,2 (cost $8,998,240) | | $ | 9,000,000 | | | $ | 8,999,280 | |
| | |
| Exchange Traded Funds - 34.7% | | Shares | | | | |
iShares Barclays TIPS Bond | | | 164,617 | | | | 19,176,234 | |
iShares IBOXX High Yield Corporate Bond3 | | | 33,373 | | | | 2,979,541 | |
Jefferies TR/J CRB Global Commodity Equity Index3 | | | 30,190 | | | | 1,375,456 | |
Market Vectors, Gold Miners | | | 16,449 | | | | 967,695 | |
Market Vectors, Hard Assets Producers3 | | | 39,199 | | | | 1,415,084 | |
SPDR DB International Government Inflation-Protected Bond3 | | | 75,584 | | | | 4,465,503 | |
Vanguard REIT3 | | | 49,792 | | | | 2,894,907 | |
| | | | | | | | |
Total Exchange Traded Funds (cost $32,291,489) | | | | | | | 33,274,420 | |
Exchange Traded Notes - 10.1% | | | | | | | | |
Barclays Capital, Inc., iPath Dow Jones-UBS Copper Total Return Sub-Index, 10/22/37 | | | 29,897 | | | | 1,402,169 | |
Barclays Capital, Inc., iPath Dow Jones-UBS Grains Total Return Sub-Index, 10/22/37 | | | 27,560 | | | | 1,252,602 | |
Barclays Capital, Inc., iPath S&P GSCI Crude Oil Total Return Index, 08/07/36 | | | 43,860 | | | | 1,029,833 | |
Deutsche Bank AG, PowerShares DB Gold Double Long, 02/15/38 | | | 38,337 | | | | 2,244,248 | |
Swedish Export Credit Corp., ELEMENTS Linked to the Rogers International Commodity Index - Total Return, 10/24/22 | | | 429,559 | | | | 3,754,346 | |
| | | | | | | | |
Total Exchange Traded Notes (cost $10,161,981) | | | | | | | 9,683,198 | |
Short-Term Investments - 51.1%4 | | | | | | | | |
BNY Mellon Overnight Government Fund, 0.05%6 | | | 5,712,625 | | | | 5,712,625 | |
Dreyfus Cash Management Fund, Institutional Class Shares, 0.10% | | | 18,203,073 | | | | 18,203,073 | |
JPMorgan Liquid Assets Money Market Fund, Capital Shares, 0.11% | | | 25,069,967 | | | | 25,069,967 | |
| | | | | | | | |
Total Short-Term Investments (cost $48,985,665) | | | | | | | 48,985,665 | |
| | | | | | | | |
Total Investments (cost $100,437,375) | | | | | | | 100,942,563 | |
Receivable for variation margin on futures contracts | | | | | | | 810,701 | |
Receivable for Fund shares sold | | | | | | | 561,622 | |
Receivable for investments sold | | | | | | | 122,193 | |
Interest and other receivables | | | | | | | 39,030 | |
Prepaid expenses | | | | | | | 16,469 | |
Receivable from affiliate | | | | | | | 4,625 | |
Foreign currency holdings | | | | | | | 199 | |
Total assets | | | | | | $ | 102,497,402 | |
|
The accompanying notes are an integral part of these financial statements. 25 |
|
Managers AMG FQ Global Essentials Fund Statement of Net Assets (continued) |
| | | | |
| | | Value | |
Liabilities: | | | | |
Payable upon return of securities loaned | | $ | 5,712,625 | |
Payable for variation margin on futures contracts | | | 712,031 | |
Payable for Fund shares repurchased | | | 84,116 | |
Accrued expenses: | | | | |
Investment management and advisory fees | | | 46,031 | |
Administrative fees | | | 19,712 | |
Distribution fees Investor Class | | | 1,598 | |
Professional fees | | | 36,315 | |
Custodian fees | | | 4,483 | |
Transfer agent fees | | | 12,602 | |
Other | | | 5,931 | |
Total liabilities | | | 6,635,444 | |
Net Assets | | $ | 95,861,958 | |
Net Assets Represent: | | | | |
Paid-in capital | | $ | 116,169,377 | |
Undistributed net investment income | | | 4,289,071 | |
Accumulated net realized loss from investments, futures and foreign currency transactions | | | (25,578,712 | ) |
Net unrealized appreciation of investments, futures and foreign currency translations | | | 982,222 | |
Net Assets | | $ | 95,861,958 | |
Investor Shares - Net Assets | | $ | 7,823,855 | |
Shares outstanding | | | 611,371 | |
Net asset value and redemption price per share | | $ | 12.80 | |
Service Shares - Net Assets | | $ | 1,103,538 | |
Shares outstanding | | | 85,821 | |
Net asset value and redemption price per share | | $ | 12.86 | |
Institutional Shares - Net Assets | | $ | 86,934,565 | |
Shares outstanding | | | 6,748,577 | |
Net asset value and redemption price per share | | $ | 12.88 | |
Managers AMG Funds
Notes to Statements of Net Assets
October 31, 2011
At October 31, 2011, the cost of securities for Federal income tax purposes and the gross aggregate unrealized appreciation and/or depreciation based on tax cost were approximately:
| | | | | | | | | | | | | | | | |
Fund | | Cost | | | Appreciation | | | Depreciation | | | Net | |
Managers AMG FQ Global Alternatives | | $ | 450,212,353 | | | $ | 14,817,454 | | | ($ | 1,145 | ) | | $ | 14,816,309 | |
Managers AMG FQ Global Essentials | | | 100,564,690 | | | | 1,441,128 | | | | (1,063,255 | ) | | | 377,873 | |
| * | Non-income-producing securities. |
| 1 | Securities held as collateral for futures contracts for Managers AMG FQ Global Alternatives and Managers AMG FQ Global Essentials, amounted to a market value of $48,099,753 or 10.4% of net assets and $8,999,280, or 9.4%, respectively. |
| 2 | Yield shown represents yield to maturity at October 31, 2011. |
| 3 | Some or all of these shares for Managers AMG FQ Global Essentials, amounting to a market value of $5,508,342, or 5.7% of net assets, were out on loan to various brokers. |
| 4 | Yield shown for each investment company listed below represents October 31, 2011, seven-day average yield, which refers to the sum of the previous seven days’ dividends paid, expressed as an annual percentage. |
|
The accompanying notes are an integral part of these financial statements. 26 |
|
Managers AMG Funds Notes to Statements of Net Assets October 31, 2011 |
| 5 | A portion of this investment is held in a segregated account as collateral for forward currency contracts for Managers AMG FQ Global Alternatives, amounting to a market value of $7,680,000, or 1.7% of net assets. |
| 6 | Collateral received from brokers for securities lending was invested in these short-term investments. |
| 7 | This investment is held in a segregated account as collateral owed to the broker for forward currency contracts for Managers AMG FQ Global Alternatives, amounting to a market value of $7,400,000, or 1.6% of net assets. |
The open forward foreign currency exchange contracts (in U.S. Dollars) at October 31, 2011, were as follows:
(See Note 8 in the Notes to Financial Statements.)
Managers AMG FQ Global Alternatives - Foreign Currency
| | | | | | | | | | | | | | | | | | | | | | | | |
Type | | Position | | | Settlement Date | | | Counterparty | | | Receivable Amount | | | Payable Amount | | | Unrealized Gain/(Loss) | |
Australian Dollar | | | Long | | | | 12/21/11 | | | | GS | | | $ | 99,629,086 | | | $ | 92,858,066 | | | $ | 6,771,020 | |
Canadian Dollar | | | Long | | | | 12/21/11 | | | | MS | | | | 21,742,574 | | | | 21,959,579 | | | | (217,005 | ) |
Canadian Dollar | | | Long | | | | 12/21/11 | | | | GS | | | | 107,257,029 | | | | 105,776,608 | | | | 1,480,421 | |
Euro | | | Long | | | | 12/21/11 | | | | GS | | | | 299,806,387 | | | | 296,789,089 | | | | 3,017,298 | |
Japanese Yen | | | Long | | | | 12/21/11 | | | | GS | | | | 27,020,829 | | | | 27,321,972 | | | | (301,143 | ) |
Japanese Yen | | | Long | | | | 12/21/11 | | | | MS | | | | 27,020,829 | | | | 27,330,111 | | | | (309,282 | ) |
New Zealand Dollar | | | Long | | | | 12/21/11 | | | | GS | | | | 124,462,178 | | | | 122,148,710 | | | | 2,313,468 | |
New Zealand Dollar | | | Long | | | | 12/21/11 | | | | MS | | | | 43,781,489 | | | | 44,990,183 | | | | (1,208,694 | ) |
Pound Sterling | | | Long | | | | 12/21/11 | | | | GS | | | | 238,052,111 | | | | 235,054,981 | | | | 2,997,130 | |
Pound Sterling | | | Long | | | | 12/21/11 | | | | MS | | | | 113,507,268 | | | | 113,010,234 | | | | 497,034 | |
Swedish Krona | | | Long | | | | 12/21/11 | | | | GS | | | | 103,360,225 | | | | 102,398,723 | | | | 961,502 | |
Swedish Krona | | | Long | | | | 12/21/11 | | | | MS | | | | 31,983,809 | | | | 32,581,430 | | | | (597,621 | ) |
Swiss Franc | | | Long | | | | 12/21/11 | | | | GS | | | | 87,683,134 | | | | 85,530,981 | | | | 2,152,153 | |
Swiss Franc | | | Long | | | | 12/21/11 | | | | MS | | | | 23,838,416 | | | | 24,069,251 | | | | (230,835 | ) |
Australian Dollar | | | Short | | | | 12/21/11 | | | | GS | | | | 145,898,791 | | | | 148,299,505 | | | | (2,400,714 | ) |
Australian Dollar | | | Short | | | | 12/21/11 | | | | MS | | | | 101,236,906 | | | | 100,774,179 | | | | 462,727 | |
Canadian Dollar | | | Short | | | | 12/21/11 | | | | GS | | | | 150,840,063 | | | | 154,504,852 | | | | (3,664,789 | ) |
Canadian Dollar | | | Short | | | | 12/21/11 | | | | MS | | | | 8,512,788 | | | | 8,456,132 | | | | 56,656 | |
Euro | | | Short | | | | 12/21/11 | | | | GS | | | | 119,463,348 | | | | 118,558,100 | | | | 905,248 | |
Euro | | | Short | | | | 12/21/11 | | | | MS | | | | 90,261,778 | | | | 89,468,686 | | | | 793,092 | |
Japanese Yen | | | Short | | | | 12/21/11 | | | | GS | | | | 137,821,943 | | | | 135,232,332 | | | | 2,589,611 | |
Japanese Yen | | | Short | | | | 12/21/11 | | | | MS | | | | 4,658,643 | | | | 4,617,138 | | | | 41,505 | |
New Zealand Dollar | | | Short | | | | 12/21/11 | | | | GS | | | | 112,983,475 | | | | 114,659,266 | | | | (1,675,791 | ) |
Pound Sterling | | | Short | | | | 12/21/11 | | | | GS | | | | 186,503,680 | | | | 191,181,028 | | | | (4,677,348 | ) |
Swedish Krona | | | Short | | | | 12/21/11 | | | | GS | | | | 68,134,966 | | | | 69,524,123 | | | | (1,389,157 | ) |
Swedish Krona | | | Short | | | | 12/21/11 | | | | MS | | | | 9,485,452 | | | | 9,373,947 | | | | 111,505 | |
Swiss Franc | | | Short | | | | 12/21/11 | | | | GS | | | | 213,451,085 | | | | 213,404,427 | | | | 46,658 | |
Swiss Franc | | | Short | | | | 12/21/11 | | | | MS | | | | 109,037,704 | | | | 107,656,296 | | | | 1,381,408 | |
| | | | | | | | | | | | | | | | | | | | | | | | |
| | | | | | | | | | | Totals | | | $ | 2,807,435,986 | | | $ | 2,797,529,929 | | | $ | 9,906,057 | |
| | | | | | | | | | | | | | | | | | | | | | | | |
|
The accompanying notes are an integral part of these financial statements. 27 |
|
Managers AMG Funds Notes to Statements of Net Assets (continued) |
All futures contracts are exchange traded unless otherwise noted. The counterparty for all OTC contracts is Morgan Stanley. (See Note 9 in the Notes to Financial Statements.) The Funds had the following open futures contracts as of October 31, 2011:
| | | | | | | | | | | | | | | | | | | | | | | | |
Managers AMG FQ Global Alternatives - Futures | |
| | | | | | |
Type | | Currency | | | Number of
Contracts | | | Position | | | Type | | | Expiration Date | | | Unrealized Gain/
(Loss) | |
Australian 10-Year Bond | | | AUD | | | | 2,976 | | | | Short | | | | Exchange | | | | 12/15/11 | | | $ | 11,100,938 | |
Australian SPI 200 | | | AUD | | | | 180 | | | | Short | | | | Exchange | | | | 12/15/11 | | | | (1,181,834 | ) |
Canadian 10-Year Bond | | | CAD | | | | 230 | | | | Long | | | | OTC | | | | 12/19/11 | | | | 204,444 | |
S&P/ TSX 60 Index | | | CAD | | | | 46 | | | | Long | | | | Exchange | | | | 12/15/11 | | | | 116,970 | |
Amsterdam Index | | | EUR | | | | 224 | | | | Long | | | | Exchange | | | | 11/18/11 | | | | 451,720 | |
CAC 40 Index | | | EUR | | | | 41 | | | | Long | | | | Exchange | | | | 11/18/11 | | | | (9,868 | ) |
DAX Index | | | EUR | | | | 63 | | | | Long | | | | Exchange | | | | 12/16/11 | | | | 637,588 | |
Euro-Bund 10-Year | | | EUR | | | | 1,014 | | | | Long | | | | OTC | | | | 12/08/11 | | | | (995,399 | ) |
FTSE/MIB Index | | | EUR | | | | 1 | | | | Long | | | | Exchange | | | | 12/16/11 | | | | 229 | |
FTSE 100 Index | | | GBP | | | | 181 | | | | Long | | | | Exchange | | | | 12/16/11 | | | | 438,393 | |
U.K. 10-Year Gilt | | | GBP | | | | 685 | | | | Long | | | | Exchange | | | | 12/28/11 | | | | 105,856 | |
Hang Seng Index | | | HKD | | | | 11 | | | | Long | | | | Exchange | | | | 11/29/11 | | | | 67,924 | |
Japanese 10-Year Bond | | | JPY | | | | 323 | | | | Short | | | | Exchange | | | | 12/08/11 | | | | 61,279 | |
TOPIX Index | | | JPY | | | | 237 | | | | Short | | | | Exchange | | | | 12/08/11 | | | | (751,463 | ) |
S&P 500 E-Mini Index | | | USD | | | | 1,374 | | | | Short | | | | Exchange | | | | 12/16/11 | | | | (3,884,949 | ) |
U.S. Treasury 10-Year Note | | | USD | | | | 177 | | | | Long | | | | OTC | | | | 12/20/11 | | | | (161,250 | ) |
| | | | | | | | | | | | | | | | | | | Total | | | $ | 6,200,578 | |
| | | | | | | | | | | | | | | | | | | | | | | | |
| | | | | | | | | | | | | | | | | | | | |
Managers AMG FQ Global Essentials - Futures | |
| | | | | |
Type | | Currency | | | Number of
Contracts | | | Position | | | Expiration Date | | | Unrealized Gain/
(Loss) | |
Australian 10-Year Bond | | | AUD | | | | 135 | | | | Long | | | | 12/15/11 | | | ($ | 507,093 | ) |
Australian SPI 200 | | | AUD | | | | 17 | | | | Long | | | | 12/15/11 | | | | 81,459 | |
Canadian Dollar 10-Year Bond | | | CAD | | | | 119 | | | | Long | | | | 12/19/11 | | | | 129,219 | |
S&P/ TSX 60 Index | | | CAD | | | | 11 | | | | Long | | | | 12/15/11 | | | | (52,616 | ) |
Amsterdam Index | | | EUR | | | | 10 | | | | Long | | | | 11/18/11 to 12/16/11 | | | | 21,537 | |
CAC40 10 Index | | | EUR | | | | 35 | | | | Long | | | | 11/18/11 to 12/16/11 | | | | 25,028 | |
DAX Index | | | EUR | | | | 4 | | | | Long | | | | 12/16/11 | | | | 148,836 | |
Euro-Bund 10-Year | | | EUR | | | | 44 | | | | Long | | | | 12/08/11 | | | | (82,024 | ) |
Euro-BUXL 30Y Bond | | | EUR | | | | 29 | | | | Long | | | | 12/08/11 | | | | (61,246 | ) |
FTSE/MIB Index | | | EUR | | | | 7 | | | | Long | | | | 12/16/11 | | | | 120,038 | |
IBEX 35 Index | | | EUR | | | | 6 | | | | Long | | | | 11/18/11 | | | | 6,416 | |
FTSE 100 Index | | | GBP | | | | 14 | | | | Long | | | | 12/16/11 | | | | 88,280 | |
U.K. 10-Year Gilt | | | GBP | | | | 85 | | | | Long | | | | 12/28/11 to 03/28/12 | | | | 75,212 | |
Hang Seng Index | | | HKD | | | | 6 | | | | Long | | | | 11/29/11 | | | | 37,050 | |
Japanese Yen 10-Year Bond | | | JPY | | | | 85 | | | | Long | | | | 12/08/11 | | | | (64,664 | ) |
TOPIX Index | | | JPY | | | | 13 | | | | Long | | | | 12/08/11 | | | | 18,010 | |
Mini MSCI Emerging Markets Index | | | USD | | | | 114 | | | | Long | | | | 12/16/11 | | | | 213,347 | |
Russell 2000 Mini Index | | | USD | | | | 73 | | | | Long | | | | 12/16/11 | | | | 286,439 | |
S&P 500 E-Mini Index | | | USD | | | | 24 | | | | Long | | | | 12/16/11 | | | | 47,322 | |
U.S. Dollar 10 Year Long Bond | | | USD | | | | 63 | | | | Long | | | | 12/20/11 | | | | 11,592 | |
U.S. Dollar Long Bond | | | USD | | | | 39 | | | | Long | | | | 12/20/11 | | | | (72,074 | ) |
| | | | | | | | | | | | | | | | | | | | |
| | | | | | | | | | | | | | | Total | | | $ | 470,068 | |
| | | | | | | | | | | | | | | | | | | | |
|
The accompanying notes are an integral part of these financial statements. 28 |
Managers AMG Funds
Notes to Statements of Net Assets (continued)
The following table summarizes the inputs used to value each Fund’s net assets by the fair value hierarchy levels as of October 31, 2011: (See Note 1(a) in the Notes to Financial Statements.)
| | | | | | | | | | | | | | | | |
| | | Quoted Prices in
Active Markets
for Identical
Investments Level 1 | | | Significant Other
Observable
Inputs Level 2 | | | Significant
Unobservable
Inputs Level 3 | | | Total | |
Managers AMG FQ Global Alternatives | | | | | | | | | | | | | |
Investments in Securities | | | | | | | | | | | | | |
US Government Obligations | | | — | | | $ | 48,099,753 | | | | — | | | $ | 48,099,753 | |
Exchange Traded Funds | | $ | 100,571,258 | | | | — | | | | — | | | | 100,571,258 | |
Short-Term Investments | | | 316,357,651 | | | | — | | | | — | | | | 316,357,651 | |
| | | | | | | | | | | | | | | | |
Total Investments in Securities | | $ | 416,928,909 | | | $ | 48,099,753 | | | | — | | | $ | 465,028,662 | |
| | | | | | | | | | | | | | | | |
Financial Derivative Instruments - Assets† | | | | | | | | | | | | | |
Foreign Exchange Contracts | | | — | | | $ | 32,269,064 | | | | — | | | $ | 32,269,064 | |
Equity Contracts | | $ | 1,712,824 | | | | — | | | | — | | | | 1,712,824 | |
Interest Rate Contracts | | | 11,268,073 | | | | 204,444 | | | | — | | | | 11,472,517 | |
| | | | | | | | | | | | | | | | |
| | | 12,980,897 | | | | 32,473,508 | | | | — | | | | 45,454,405 | |
Financial Derivative Instruments - Liabilities† | | | | | | | | | | | | | |
Foreign Exchange Contracts | | | — | | | | (22,363,007 | ) | | | — | | | | (22,363,007 | ) |
Equity Contracts | | | (5,828,114 | ) | | | — | | | | — | | | | (5,828,114 | ) |
Interest Rate Contracts | | | — | | | | (1,156,649 | ) | | | — | | | | (1,156,649 | ) |
| | | | | | | | | | | | | | | | |
| | | (5,828,114 | ) | | | (23,519,656 | ) | | | — | | | | (29,347,770 | ) |
| | | | | | | | | | | | | | | | |
Total Financial Derivative Instruments | | $ | 7,152,783 | | | $ | 8,953,852 | | | | — | | | $ | 16,106,635 | |
| | | | | | | | | | | | | | | | |
| | | | |
| | | Quoted Prices in
Active Markets
for Identical
Investments Level 1 | | | Significant Other
Observable
Inputs Level 2 | | | Significant
Unobservable
Inputs Level 3 | | | Total | |
Managers AMG FQ Global Essentials | | | | | | | | | | | | | |
Investments in Securities | | | | | | | | | | | | | |
US Government Obligations | | | — | | | $ | 8,999,280 | | | | — | | | $ | 8,999,280 | |
Exchange Traded Funds | | $ | 33,274,420 | | | | — | | | | — | | | | 33,274,420 | |
Exchange Traded Notes | | | 9,683,198 | | | | — | | | | — | | | | 9,683,198 | |
Short-Term Investments | | | 48,985,665 | | | | — | | | | — | | | | 48,985,665 | |
| | | | | | | | | | | | | | | | |
Total Investments in Securities | | $ | 91,943,283 | | | $ | 8,999,280 | | | | — | | | $ | 100,942,563 | |
| | | | | | | | | | | | | | | | |
Financial Derivative Instruments - Assets† | | | | | | | | | | | | | |
Equity Contracts | | $ | 1,093,762 | | | | — | | | | — | | | $ | 1,093,762 | |
Interest Rate Contracts | | | 216,023 | | | | — | | | | — | | | | 216,023 | |
| | | | | | | | | | | | | | | | |
| | | 1,309,785 | | | | — | | | | — | | | | 1,309,785 | |
Financial Derivative Instruments - Liabilities† | | | | | | | | | | | | | |
Equity Contracts | | | (52,616 | ) | | | — | | | | — | | | | (52,616 | ) |
Interest Rate Contracts | | | (787,101 | ) | | | — | | | | — | | | | (787,101 | ) |
| | | | | | | | | | | | | | | | |
| | | (839,717 | ) | | | — | | | | — | | | | (839,717 | ) |
| | | | | | | | | | | | | | | | |
Total Financial Derivative Instruments | | $ | 470,068 | | | | — | | | | — | | | $ | 470,068 | |
| | | | | | | | | | | | | | | | |
| † | Derivative instruments, such as futures, forwards and swap contracts, are valued at the unrealized appreciation/depreciation of the instrument. All OTC futures are valued as Level 2 securities. |
As of October 31, 2011, the Funds had no significant transfers between Level 1 and Level 2 from the beginning of the reporting period.
The accompanying notes are an integral part of these financial statements.
29
Managers AMG Funds
Notes to Statements of Net Assets (continued)
The following schedule shows the fair value of derivative instruments at October 31, 2011:
(See Notes 8 and 9 in the Notes to Financial Statements.)
| | | | | | | | | | | | | | |
| | | | | Asset Derivatives | | | Liability Derivatives | |
Fund | | Derivatives not accounted for as hedging instruments | | Statement of Assets and Liabilities Location | | Fair Value | | | Statement of Assets and Liabilities Location | | Fair Value | |
Managers AMG FQ Global Alternatives | | Equity contracts | | Receivable for variation margin on futures* | | $ | 3,069,537 | | | Payable for variation margin on futures* | | $ | 1,674,908 | |
| | Interest rate contracts | | Receivable for variation margin on futures* | | | 4,988,221 | | | Payable for variation margin on futures* | | | 5,169,475 | |
| | Foreign exchange contracts | | Unrealized appreciation of foreign currency contracts | | | 32,269,064 | | | Unrealized depreciation of foreign currency contracts | | | 22,363,007 | |
| | | | | | | | | | | | | | |
| | | | Totals | | $ | 40,326,822 | | | | | $ | 29,207,390 | |
| | | | | | | | | | | | | | |
| | | |
| | | | | Asset Derivatives | | | Liability Derivatives | |
Fund | | Derivatives not accounted for as hedging instruments | | Statement of Assets and
Liabilities Location | | Fair Value | | | Statement of Assets and
Liabilities Location | | Fair Value | |
Managers AMG FQ Global Essentials | | Equity contracts | | Receivable for variation margin on futures | | | — | | | Payable for variation margin on futures | | $ | 712,031 | |
| | Interest rate contracts | | Receivable for variation margin on futures | | $ | 810,701 | | | Payable for variation margin on futures | | | — | |
| | | | | | | | | | | | | | |
| | | | Totals | | $ | 810,701 | | | | | $ | 712,031 | |
| | | | | | | | | | | | | | |
| * | Includes only the current day’s variation margin for fixed futures. For non-fixed futures, the variation margin includes the unrealized appreciation/depreciation of the future. Prior variation margin movements have been reflected in cash on the Statement of Assets and Liabilities upon receipt or payment. |
For the fiscal year ended October 31, 2011, the effect of derivative instruments on the Statement of Operations for the Fund and the amount of realized gain/ (loss) on derivatives recognized in income was as follows:
| | | | | | | | | | | | | | |
Fund | | Derivatives not accounted for as hedging instruments | | Futures | | | Forward Currency
Contracts | | | Total | |
Managers AMG FQ
Global Alternatives | | Equity contracts | | ($ | 7,290,346 | ) | | | — | | | ($ | 7,290,346 | ) |
| | Interest rate contracts | | | (30,347,443 | ) | | | — | | | | (30,347,443 | ) |
| | Foreign exchange contracts | | | — | | | ($ | 63,925,263 | ) | | | (63,925,263 | ) |
| | | | | | | | | | | | | | |
| | Totals | | ($ | 37,637,789 | ) | | ($ | 63,925,263 | ) | | ($ | 101,563,052 | ) |
| | | | | | | | | | | | | | |
| | | | |
Fund | | Derivatives not accounted for as hedging instruments | | Futures | | | Forward Currency
Contracts | | | Total | |
Managers AMG FQ
Global Essentials | | Equity contracts | | ($ | 1,333,552 | ) | | | — | | | ($ | 1,333,552 | ) |
| | Interest rate contracts | | | 5,943,345 | | | | — | | | | 5,943,345 | |
| | | | | | | | | | | | | | |
| | Totals | | $ | 4,609,793 | | | | — | | | $ | 4,609,793 | |
| | | | | | | | | | | | | | |
The accompanying notes are an integral part of these financial statements.
30
Managers AMG Funds
Notes to Statements of Net Assets (continued)
The change in unrealized gain/(loss) on derivatives recognized in income was as follows:
| | | | | | | | | | | | | | |
Fund | | Derivatives not accounted for as hedging instruments | | Futures | | | Forward Currency
Contracts | | | Total | |
Managers AMG FQ
Global Alternatives | | Equity contracts | | ($ | 1,661,598 | ) | | | — | | | ($ | 1,661,598 | ) |
| | Interest rate contracts | | | 3,343,970 | | | | — | | | | 3,343,970 | |
| | Foreign exchange contracts | | | — | | | $ | 21,026,898 | | | | 21,026,898 | |
| | | | | | | | | | | | | | |
| | Totals | | $ | 1,682,372 | | | $ | 21,026,898 | | | $ | 22,709,270 | |
| | | | | | | | | | | | | | |
| | | | |
Fund | | Derivatives not accounted for as hedging instruments | | Futures | | | Forward Currency
Contracts | | | Total | |
Managers AMG FQ
Global Essentials | | Equity contracts | | ($ | 206,481 | ) | | | — | | | ($ | 206,481 | ) |
| | Interest rate contracts | | | (405,866 | ) | | | — | | | | (405,866 | ) |
| | | | | | | | | | | | | | |
| | Totals | | ($ | 612,347 | ) | | | — | | | ($ | 612,347 | ) |
| | | | | | | | | | | | | | |
| | | | |
| Currency and Counterparty Abbreviations: |
| | |
| MS: | | Morgan Stanley | | GS: Goldman Sachs Group, Inc. |
| AUD: | | Australian Dollar | | |
| CAD: | | Canadian Dollar | | |
| EUR: | | Euro | | |
| GBP: | | British Pound | | |
| HKD: | | Hong Kong Dollar | | |
| JPY: | | Japanese Yen | | |
| USD: | | U.S. Dollar | | |
| OTC: | | Over-the-counter | | |
The accompanying notes are an integral part of these financial statements.
31
Managers AMG Funds
Statements of Operations
For the fiscal year ended October 31, 2011
| | | | | | | | | | | | | | | | |
| | | FQ Tax-Managed
U.S. Equity | | | FQ U.S. Equity | | | FQ Global
Alternatives | | | FQ Global
Essentials | |
Investment Income: | | | | | | | | | | | | | | | | |
Dividend income | | $ | 543,678 | | | $ | 964,659 | | | $ | 2,905,443 | | | $ | 1,473,297 | |
Interest income | | | — | | | | — | | | | 7,240 | | | | 4,144 | |
Securities lending fees | | | 2,089 | | | | 7,282 | | | | — | | | | 56,714 | |
Total investment income | | | 545,767 | | | | 971,941 | | | | 2,912,683 | | | | 1,534,155 | |
Expenses: | | | | | | | | | | | | | | | | |
Investment management and advisory fees | | | 396,361 | | | | 182,304 | | | | 10,404,727 | | | | 573,012 | |
Administrative fees | | | — | | | | 130,217 | | | | 1,530,107 | | | | 238,755 | |
Distribution fees Class A | | | 9,216 | | | | 43,560 | | | | 1,233,107 | | | | — | |
Distribution fees Class C | | | 31,739 | | | | 6,491 | | | | 394,268 | | | | — | |
Distribution fees Investor Class | | | — | | | | — | | | | — | | | | 17,407 | |
Registration fees | | | 30,742 | | | | 40,369 | | | | 119,098 | | | | 45,367 | |
Transfer agent | | | 30,451 | | | | 37,983 | | | | 1,515,811 | | | | 49,555 | |
Professional fees | | | 29,402 | | | | 27,616 | | | | 127,549 | | | | 49,178 | |
Custodian | | | 15,674 | | | | 21,458 | | | | 84,443 | | | | 17,001 | |
Reports to shareholders | | | 8,046 | | | | 10,039 | | | | 182,369 | | | | 4,636 | |
Trustees fees and expenses | | | 2,183 | | | | 2,993 | | | | 35,123 | | | | 4,938 | |
Interest expense on futures | | | — | | | | — | | | | 62,878 | | | | — | |
Miscellaneous | | | 3,735 | | | | 6,822 | | | | 25,437 | | | | 6,219 | |
Total expenses before offsets | | | 557,549 | | | | 509,852 | | | | 15,714,917 | | | | 1,006,068 | |
Fee waivers | | | — | | | | — | | | | (123,724 | ) | | | (15,034 | ) |
Expense reimbursements | | | (54,758 | ) | | | (45,459 | ) | | | (3,907,032 | ) | | | (24,771 | ) |
Expense reductions | | | (51 | ) | | | (57 | ) | | | (674 | ) | | | (107 | ) |
Net expenses | | | 502,740 | | | | 464,336 | | | | 11,683,487 | | | | 966,156 | |
Net investment income (loss) | | | 43,027 | | | | 507,605 | | | | (8,770,804 | ) | | | 567,999 | |
Net Realized and Unrealized Gain (Loss): | | | | | | | | | | | | | | | | |
Net realized gain on investments | | | 3,749,235 | | | | 6,904,613 | | | | 10,027,853 | | | | 2,483,050 | |
Net realized gain (loss) on futures contracts | | | — | | | | 36,566 | | | | (37,637,789 | ) | | | 4,609,793 | |
Net realized loss on foreign currency transactions | | | — | | | | — | | | | (55,771,116 | ) | | | (6,868 | ) |
Net change in unrealized appreciation (depreciation) of investments | | | 825,388 | | | | (1,606,924 | ) | | | (3,420,081 | ) | | | (1,998,800 | ) |
Net change in unrealized appreciation (depreciation) of futures contracts | | | — | | | | (15,995 | ) | | | 1,682,372 | | | | (612,347 | ) |
Net change in unrealized appreciation of foreign currency translations | | | — | | | | — | | | | 21,028,589 | | | | 2,438 | |
Net realized and unrealized gain (loss) | | | 4,574,623 | | | | 5,318,260 | | | | (64,090,172 | ) | | | 4,477,266 | |
Net increase (decrease) in net assets resulting from operations | | $ | 4,617,650 | | | $ | 5,825,865 | | | ($ | 72,860,976 | ) | | $ | 5,045,265 | |
The accompanying notes are an integral part of these financial statements.
32
Managers AMG Funds
Statements of Changes in Net Assets
For the fiscal year ended October 31,
| | | | | | | | | | | | | | | | |
| | | FQ Tax-Managed U.S. Equity | | | FQ U.S. Equity | |
| | | 2011 | | | 2010 | | | 2011 | | | 2010 | |
Increase (Decrease) in Net Assets | | | | | | | | | | | | | | | | |
From Operations: | | | | | | | | | | | | | | | | |
Net investment income | | $ | 43,027 | | | $ | 171,175 | | | $ | 507,605 | | | $ | 572,810 | |
Net realized gain on investments, futures, foreign currency contracts and transactions | | | 3,749,235 | | | | 7,494,843 | | | | 6,941,179 | | | | 3,836,607 | |
Net change in unrealized appreciation (depreciation) of investments, futures, foreign currency contracts and translations | | | 825,388 | | | | 3,296,687 | | | | (1,622,919 | ) | | | 3,577,809 | |
Net increase in net assets resulting from operations | | | 4,617,650 | | | | 10,962,705 | | | | 5,825,865 | | | | 7,987,226 | |
Distributions to Shareholders: | | | | | | | | | | | | | | | | |
From net investment income | | | (175,189 | ) | | | (125,566 | ) | | | (512,079 | ) | | | (698,054 | ) |
From Capital Share Transactions: | | | | | | | | | | | | | | | | |
Proceeds from the sale of shares | | | 3,331,036 | | | | 1,660,764 | | | | 4,445,104 | | | | 2,704,195 | |
Reinvestment of dividends and distributions | | | 165,795 | | | | 119,516 | | | | 505,527 | | | | 689,807 | |
Cost of shares repurchased | | | (12,969,547 | ) | | | (17,040,665 | ) | | | (15,334,816 | ) | | | (9,479,336 | ) |
Net decrease from capital share transactions | | | (9,472,716 | ) | | | (15,260,385 | ) | | | (10,384,185 | ) | | | (6,085,334 | ) |
Total increase (decrease) in net assets | | | (5,030,255 | ) | | | (4,423,246 | ) | | | (5,070,399 | ) | | | 1,203,838 | |
Net Assets: | | | | | | | | | | | | | | | | |
Beginning of year | | | 46,631,236 | | | | 51,054,482 | | | | 51,806,436 | | | | 50,602,598 | |
End of year | | $ | 41,600,981 | | | $ | 46,631,236 | | | | 46,736,037 | | | $ | 51,806,436 | |
End of year undistributed net investment income | | $ | 32,584 | | | $ | 169,442 | | | $ | 451,901 | | | $ | 392,829 | |
| | | | | | | | | | | | | | | | |
Share Transactions: | | | | | | | | | | | | | | | | |
Sale of shares | | | 247,826 | | | | 149,431 | | | | 398,572 | | | | 278,383 | |
Reinvested shares | | | 12,399 | | | | 10,915 | | | | 46,374 | | | | 71,238 | |
Shares repurchased | | | (946,051 | ) | | | (1,522,307 | ) | | | (1,346,991 | ) | | | (977,820 | ) |
Net decrease in shares | | | (685,826 | ) | | | (1,361,961 | ) | | | (902,045 | ) | | | (628,199 | ) |
The accompanying notes are an integral part of these financial statements.
33
Managers AMG Funds
Statements of Changes in Net Assets
For the fiscal year ended October 31,
| | | | | | | | | | | | | | | | |
| | | FQ Global Alternatives | | | FQ Global Essentials | |
| | | 2011 | | | 2010 | | | 2011 | | | 2010 | |
Increase (Decrease) in Net Assets | | | | | | | | | | | | | | | | |
From Operations: | | | | | | | | | | | | | | | | |
Net investment income (loss) | | ($ | 8,770,804 | ) | | ($ | 5,442,931 | ) | | $ | 567,999 | | | ($ | 83,216 | ) |
Net realized gain (loss) on investments, futures and foreign currency transactions | | | (83,381,052 | ) | | | 5,720,597 | | | | 7,085,975 | | | | 7,129,015 | |
Net change in unrealized appreciation (depreciation) of investments, futures and foreign currency translations | | | 19,290,880 | | | | (117,342 | ) | | | (2,608,709 | ) | | | 4,753,670 | |
Net increase (decrease) in net assets resulting from operations | | | (72,860,976 | ) | | | 160,324 | | | | 5,045,265 | | | | 11,799,469 | |
Distributions to Shareholders: | | | | | | | | | | | | | | | | |
From net investment income | | | — | | | | — | | | | (4,527,841 | ) | | | (710,852 | ) |
From Capital Share Transactions: | | | | | | | | | | | | | | | | |
Proceeds from the sale of shares | | | 453,688,645 | | | | 545,893,571 | | | | 18,846,211 | | | | 20,931,826 | |
Reinvestment of dividends and distributions | | | — | | | | — | | | | 4,452,811 | | | | 692,638 | |
Cost of shares repurchased | | | (523,328,958 | ) | | | (174,587,779 | ) | | | (28,592,316 | ) | | | (12,659,681 | ) |
Net increase (decrease) from capital share transactions | | | (69,640,313 | ) | | | 371,305,792 | | | | (5,293,294 | ) | | | 8,964,783 | |
Total increase (decrease) in net assets | | | (142,501,289 | ) | | | 371,466,116 | | | | (4,775,870 | ) | | | 20,053,400 | |
Net Assets: | | | | | | | | | | | | | | | | |
Beginning of year | | | 607,686,351 | | | | 236,220,235 | | | | 100,637,828 | | | | 80,584,428 | |
End of year | | $ | 465,185,062 | | | $ | 607,686,351 | | | $ | 95,861,958 | | | $ | 100,637,828 | |
End of year undistributed net investment income (loss) | | ($ | 9,891,166 | ) | | $ | 11,104,586 | | | $ | 4,289,071 | | | $ | 4,529,377 | |
| | | | | | | | | | | | | | | | |
Share Transactions: | | | | | | | | | | | | | | | | |
Sale of shares | | | 45,743,279 | | | | 52,693,342 | | | | 1,508,329 | | | | 1,682,092 | |
Reinvested shares | | | — | | | | — | | | | 371,134 | | | | 60,763 | |
Shares repurchased | | | (55,138,398 | ) | | | (17,019,805 | ) | | | (2,313,395 | ) | | | (1,082,166 | ) |
Net increase (decrease) in shares | | | (9,395,119 | ) | | | 35,673,537 | | | | (433,932 | ) | | | 660,689 | |
The accompanying notes are an integral part of these financial statements.
34
|
Managers AMG FQ Tax-Managed U.S. Equity Fund Financial Highlights For a share outstanding throughout each fiscal year |
| | | | | | | | | | | | | | | | | | | | |
| | | For the fiscal year ended October 31, | |
Institutional Class Shares | | 2011 | | | 2010 | | | 2009 | | | 2008 | | | 2007 | |
Net Asset Value, Beginning of Year | | $ | 12.43 | | | $ | 9.98 | | | $ | 9.99 | | | $ | 16.80 | | | $ | 13.93 | |
Income from Investment Operations: | | | | | | | | | | | | | | | | | | | | |
Net investment income | | | 0.02 | 4 | | | 0.05 | 4 | | | 0.07 | | | | 0.13 | | | | 0.06 | |
Net realized and unrealized gain (loss) on investments | | | 1.19 | 4 | | | 2.43 | 4 | | | 0.07 | | | | (6.87 | ) | | | 2.82 | |
Total from investment operations | | | 1.21 | | | | 2.48 | | | | 0.14 | | | | (6.74 | ) | | | 2.88 | |
Less Distributions to Shareholders from: | | | | | | | | | | | | | | | | | | | | |
Net investment income | | | (0.06 | ) | | | (0.03 | ) | | | (0.15 | ) | | | (0.07 | ) | | | (0.01 | ) |
Net Asset Value, End of Year | | $ | 13.58 | | | $ | 12.43 | | | $ | 9.98 | | | $ | 9.99 | | | $ | 16.80 | |
Total Return1 | | | 9.70 | % | | | 24.92 | % | | | 1.65 | % | | | (40.26 | )% | | | 20.68 | % |
Ratio of net expenses to average net assets | | | 0.99 | % | | | 0.99 | % | | | 0.99 | % | | | 0.99 | % | | | 0.99 | % |
Ratio of net investment income to average net assets1 | | | 0.18 | % | | | 0.45 | % | | | 0.69 | % | | | 0.92 | % | | | 0.37 | % |
Portfolio turnover | | | 40 | % | | | 81 | % | | | 147 | % | | | 136 | % | | | 65 | % |
Net assets at end of year (000’s omitted) | | $ | 35,741 | | | $ | 39,420 | | | $ | 39,366 | | | $ | 48,882 | | | $ | 95,510 | |
| | | | | | | | | | | | | | | | | | | | |
Ratios absent expense offsets:2 | | | | | | | | | | | | | | | | | | | | |
Ratio of total expenses to average net assets | | | 1.11 | % | | | 1.19 | % | | | 1.18 | % | | | 1.03 | % | | | 1.07 | % |
Ratio of net investment income to average net assets | | | 0.06 | % | | | 0.25 | % | | | 0.50 | % | | | 0.88 | % | | | 0.29 | % |
| | | | | | | | | | | | | | | | | | | | |
| | | | | | | | | | | | | | | | | | | | |
| | | For the fiscal year ended October 31, | |
Class A Shares | | 2011 | | | 2010 | | | 2009 | | | 2008 | | | 2007 | |
Net Asset Value, Beginning of Year | | $ | 12.47 | | | $ | 10.01 | | | $ | 9.99 | | | $ | 16.75 | | | $ | 13.91 | |
Income from Investment Operations: | | | | | | | | | | | | | | | | | | | | |
Net investment income | | | (0.01 | )4 | | | 0.02 | 4 | | | 0.09 | | | | 0.10 | | | | 0.02 | |
Net realized and unrealized gain (loss) on investments | | | 1.18 | 4 | | | 2.44 | 4 | | | 0.04 | | | | (6.81 | ) | | | 2.82 | |
Total from investment operations | | | 1.17 | | | | 2.46 | | | | 0.13 | | | | (6.71 | ) | | | 2.84 | |
Less Distributions to Shareholders from: | | | | | | | | | | | | | | | | | | | | |
Net investment income | | | (0.01 | ) | | | — | | | | (0.11 | ) | | | (0.05 | ) | | | — | |
Net Asset Value, End of Year | | $ | 13.63 | | | $ | 12.47 | | | $ | 10.01 | | | $ | 9.99 | | | $ | 16.75 | |
Total Return1 | | | 9.40 | % | | | 24.58 | % | | | 1.53 | % | | | (40.15 | )%5 | | | 20.42 | % |
Ratio of net expenses to average net assets | | | 1.24 | % | | | 1.24 | % | | | 1.24 | % | | | 1.24 | % | | | 1.24 | % |
Ratio of net investment income (loss) to average net assets1 | | | (0.07 | %) | | | 0.22 | % | | | 0.45 | % | | | 0.67 | % | | | 0.30 | % |
Portfolio turnover | | | 40 | % | | | 81 | % | | | 147 | % | | | 136 | % | | | 65 | % |
Net assets at end of year (000’s omitted) | | $ | 3,049 | | | $ | 4,116 | | | $ | 7,175 | | | $ | 15,334 | | | $ | 23,803 | |
| | | | | | | | | | | | | | | | | | | | |
Ratios absent expense offsets:2 | | | | | | | | | | | | | | | | | | | | |
Ratio of total expenses to average net assets | | | 1.36 | % | | | 1.44 | % | | | 1.43 | % | | | 1.28 | % | | | 1.32 | % |
Ratio of net investment income (loss) to average net assets | | | (0.19 | %) | | | 0.02 | % | | | 0.26 | % | | | 0.63 | % | | | 0.22 | % |
| | | | | | | | | | | | | | | | | | | | |
|
Managers AMG FQ Tax-Managed U.S. Equity Fund Financial Highlights For a share outstanding throughout each fiscal year |
| | | | | | | | | | | | | | | | | | | | |
| | | For the fiscal year ended October 31, | |
Class C Shares | | 2011 | | | 2010 | | | 2009 | | | 2008 | | | 2007 | |
Net Asset Value, Beginning of Year | | $ | 12.21 | | | $ | 9.87 | | | $ | 9.82 | | | $ | 16.53 | | | $ | 13.83 | |
Income from Investment Operations: | | | | | | | | | | | | | | | | | | | | |
Net investment income (loss) | | | (0.11 | )4 | | | (0.06 | )4 | | | (0.03 | ) | | | (0.02 | ) | | | 0.00 | 3 |
Net realized and unrealized gain (loss) on investments | | | 1.15 | 4 | | | 2.40 | 4 | | | 0.09 | | | | (6.69 | ) | | | 2.70 | |
Total from investment operations | | | 1.04 | | | | 2.34 | | | | 0.06 | | | | (6.71 | ) | | | 2.70 | |
Less Distributions to Shareholders from: | | | | | | | | | | | | | | | | | | | | |
Net investment income | | | — | | | | — | | | | (0.01 | ) | | | — | | | | — | |
Net Asset Value, End of Year | | $ | 13.25 | | | $ | 12.21 | | | $ | 9.87 | | | $ | 9.82 | | | $ | 16.53 | |
Total Return1 | | | 8.52 | % | | | 23.71 | % | | | 0.66 | % | | | (40.56 | )% | | | 19.52 | %5 |
Ratio of net expenses to average net assets | | | 1.99 | % | | | 1.99 | % | | | 1.99 | % | | | 1.99 | % | | | 1.99 | % |
Ratio of net investment loss to average net assets1 | | | (0.82 | )% | | | (0.53 | )% | | | (0.31 | )% | | | (0.09 | )% | | | (0.36 | )% |
Portfolio turnover | | | 40 | % | | | 81 | % | | | 147 | % | | | 136 | % | | | 65 | % |
Net assets at end of year (000’s omitted) | | $ | 2,811 | | | $ | 3,095 | | | $ | 4,513 | | | $ | 6,693 | | | $ | 9,490 | |
| | | | | | | | | | | | | | | | | | | | |
Ratios absent expense offsets:2 | | | | | | | | | | | | | | | | | | | | |
Ratio of total expenses to average net assets | | | 2.11 | % | | | 2.19 | % | | | 2.18 | % | | | 2.03 | % | | | 2.07 | % |
Ratio of net investment loss to average net assets | | | (0.94 | )% | | | (0.73 | )% | | | (0.50 | )% | | | (0.13 | )% | | | (0.44 | )% |
| | | | | | | | | | | | | | | | | | | | |
| 1 | Total returns and net investment income would have been lower had certain expenses not been reduced. (See Note 1(c) of Notes to Financial Statements.) |
| 2 | Excludes the impact of expense reimbursements or fee waivers and expense reductions such as brokerage credits, but includes non-reimbursable expenses, if any, such as interest and taxes. (See Note 1(c) of Notes to Financial Statements.) |
| 3 | Rounds to less than $0.01. |
| 4 | Per share numbers have been calculated using average shares. |
| 5 | The Total Return is based on the Financial Statement Net Asset Values as shown above. |
|
Managers AMG FQ U.S. Equity Fund Financial Highlights For a share outstanding throughout each fiscal year |
| | | | | | | | | | | | | | | | | | | | |
| | | For the fiscal year ended October 31, | |
Institutional Class Shares | | 2011 | | | 2010 | | | 2009 | | | 2008 | | | 2007 | |
Net Asset Value, Beginning of Year | | $ | 10.35 | | | $ | 8.99 | | | $ | 8.68 | | | $ | 15.49 | | | $ | 14.90 | |
Income from Investment Operations: | | | | | | | | | | | | | | | | | | | | |
Net investment income | | | 0.12 | 3 | | | 0.13 | | | | 0.14 | | | | 0.19 | | | | 0.15 | |
Net realized and unrealized gain (loss) on investments | | | 1.03 | 3 | | | 1.37 | | | | 0.32 | | | | (5.23 | ) | | | 2.11 | |
Total from investment operations | | | 1.15 | | | | 1.50 | | | | 0.46 | | | | (5.04 | ) | | | 2.26 | |
Less Distributions to Shareholders from: | | | | | | | | | | | | | | | | | | | | |
Net investment income | | | (0.12 | ) | | | (0.14 | ) | | | (0.15 | ) | | | (0.16 | ) | | | (0.16 | ) |
Net realized gain on investments | | | — | | | | — | | | | — | | | | (1.61 | ) | | | (1.51 | ) |
Total distributions to shareholders | | | (0.12 | ) | | | (0.14 | ) | | | (0.15 | ) | | | (1.77 | ) | | | (1.67 | ) |
Net Asset Value, End of Year | | $ | 11.38 | | | $ | 10.35 | | | $ | 8.99 | | | $ | 8.68 | | | $ | 15.49 | |
Total Return1 | | | 11.12 | % | | | 16.75 | % | | | 5.56 | % | | | (36.43 | )% | | | 16.54 | % |
Ratio of net expenses to average net assets | | | 0.79 | %4 | | | 0.79 | % | | | 0.79 | % | | | 0.79 | % | | | 0.79 | % |
Ratio of net investment income to average net assets1 | | | 1.08 | %4 | | | 1.22 | % | | | 1.58 | % | | | 1.36 | % | | | 0.96 | % |
Portfolio turnover | | | 138 | % | | | 117 | % | | | 151 | % | | | 227 | % | | | 106 | % |
Net assets at end of year (000’s omitted) | | $ | 33,250 | | | $ | 32,309 | | | $ | 31,175 | | | $ | 35,135 | | | $ | 82,915 | |
| | | | | | | | | | | | | | | | | | | | |
Ratio absent expense offsets:2 | | | | | | | | | | | | | | | | | | | | |
Ratio of total expenses to average net assets | | | 0.88 | % | | | 0.90 | % | | | 1.04 | % | | | 0.91 | % | | | 0.83 | % |
Ratio of net investment income to average net assets | | | 0.99 | % | | | 1.11 | % | | | 1.33 | % | | | 1.24 | % | | | 0.92 | % |
| | | | | | | | | | | | | | | | | | | | |
| | | | | | | | | | | | | | | | | | | | |
| | | For the fiscal year ended October 31, | |
Class A Shares | | 2011 | | | 2010 | | | 2009 | | | 2008 | | | 2007 | |
Net Asset Value, Beginning of Year | | $ | 10.29 | | | $ | 8.93 | | | $ | 8.63 | | | $ | 15.43 | | | $ | 14.88 | |
Income from Investment Operations: | | | | | | | | | | | | | | | | | | | | |
Net investment income | | | 0.09 | 3 | | | 0.10 | | | | 0.11 | | | | 0.09 | | | | 0.17 | |
Net realized and unrealized gain (loss) on investments | | | 1.01 | 3 | | | 1.37 | | | | 0.32 | | | | (5.14 | ) | | | 2.05 | |
Total from investment operations | | | 1.10 | | | | 1.47 | | | | 0.43 | | | | (5.05 | ) | | | 2.22 | |
Less Distributions to Shareholders from: | | | | | | | | | | | | | | | | | | | | |
Net investment income | | | (0.09 | ) | | | (0.11 | ) | | | (0.13 | ) | | | (0.14 | ) | | | (0.16 | ) |
Net realized gain on investments | | | — | | | | — | | | | — | | | | (1.61 | ) | | | (1.51 | ) |
Total distributions to shareholders | | | (0.09 | ) | | | (0.11 | ) | | | (0.13 | ) | | | (1.75 | ) | | | (1.67 | ) |
Net Asset Value, End of Year | | $ | 11.30 | | | $ | 10.29 | | | $ | 8.93 | | | $ | 8.63 | | | $ | 15.43 | |
Total Return1 | | | 10.72 | % | | | 16.57 | % | | | 5.21 | % | | | (36.64 | )% | | | 16.28 | % |
Ratio of net expenses to average net assets | | | 1.04 | %4 | | | 1.04 | % | | | 1.04 | % | | | 1.04 | % | | | 1.04 | % |
Ratio of net investment income to average net assets1 | | | 0.83 | %4 | | | 0.98 | % | | | 1.35 | % | | | 1.07 | % | | | 0.56 | % |
Portfolio turnover | | | 138 | % | | | 117 | % | | | 151 | % | | | 227 | % | | | 106 | % |
Net assets at end of year (000’s omitted) | | $ | 12,966 | | | $ | 18,755 | | | $ | 18,588 | | | $ | 22,966 | | | $ | 21,773 | |
| | | | | | | | | | | | | | | | | | | | |
Ratio absent expense offsets:2 | | | | | | | | | | | | | | | | | | | | |
Ratio of total expenses to average net assets | | | 1.13 | % | | | 1.15 | % | | | 1.29 | % | | | 1.16 | % | | | 1.08 | % |
Ratio of net investment income to average net assets | | | 0.74 | % | | | 0.87 | % | | | 1.10 | % | | | 0.95 | % | | | 0.52 | % |
| | | | | | | | | | | | | | | | | | | | |
|
Managers AMG FQ U.S. Equity Fund Financial Highlights For a share outstanding throughout each fiscal year |
| | | | | | | | | | | | | | | | | | | | |
| | | For the fiscal year ended October 31, | |
Class C Shares | | 2011 | | | 2010 | | | 2009 | | | 2008 | | | 2007 | |
Net Asset Value, Beginning of Year | | $ | 10.20 | | | $ | 8.83 | | | $ | 8.52 | | | $ | 15.27 | | | $ | 14.85 | |
Income from Investment Operations: | | | | | | | | | | | | | | | | | | | | |
Net investment income | | | 0.01 | 3 | | | 0.07 | | | | 0.06 | | | | 0.04 | | | | 0.13 | |
Net realized and unrealized gain (loss) on investments | | | 1.00 | 3 | | | 1.32 | | | | 0.31 | | | | (5.13 | ) | | | 1.96 | |
Total from investment operations | | | 1.01 | | | | 1.39 | | | | 0.37 | | | | (5.09 | ) | | | 2.09 | |
Less Distributions to Shareholders from: | | | | | | | | | | | | | | | | | | | | |
Net investment income | | | (0.01 | ) | | | (0.02 | ) | | | (0.06 | ) | | | (0.05 | ) | | | (0.16 | ) |
Net realized gain on investments | | | — | | | | — | | | | — | | | | (1.61 | ) | | | (1.51 | ) |
Total distributions to shareholders | | | (0.01 | ) | | | (0.02 | ) | | | (0.06 | ) | | | (1.66 | ) | | | (1.67 | ) |
Net Asset Value, End of Year | | $ | 11.20 | | | $ | 10.20 | | | $ | 8.83 | | | $ | 8.52 | | | $ | 15.27 | |
Total Return1 | | | 9.94 | % | | | 15.75 | % | | | 4.42 | % | | | (37.12 | )% | | | 15.35 | % |
Ratio of net expenses to average net assets | | | 1.79 | %4 | | | 1.79 | % | | | 1.79 | % | | | 1.79 | % | | | 1.79 | % |
Ratio of net investment income (loss) to average net assets1 | | | 0.08 | %4 | | | 0.24 | % | | | 0.67 | % | | | 0.37 | % | | | (0.13 | )% |
Portfolio turnover | | | 138 | % | | | 117 | % | | | 151 | % | | | 227 | % | | | 106 | % |
Net assets at end of year (000’s omitted) | | $ | 520 | | | $ | 742 | | | $ | 840 | | | $ | 1,158 | | | $ | 2,326 | |
| | | | | | | | | | | | | | | | | | | | |
Ratio absent expense offsets:2 | | | | | | | | | | | | | | | | | | | | |
Ratio of total expenses to average net assets | | | 1.88 | % | | | 1.90 | % | | | 2.04 | % | | | 1.91 | % | | | 1.83 | % |
Ratio of net investment income (loss) to average net assets | | | (0.01 | )% | | | 0.13 | % | | | 0.42 | % | | | 0.25 | % | | | (0.17 | )% |
| | | | | | | | | | | | | | | | | | | | |
| 1 | Total returns and net investment income would have been lower had certain expenses not been reduced. (See Note 1(c) of Notes to Financial Statements.) |
| 2 | Excludes the impact of expense reimbursements or fee waivers and expense reductions such as brokerage credits, but includes non-reimbursable expenses, if any, such as interest and taxes. (See Note 1(c) of Notes to Financial Statements.) |
| 3 | Per share numbers have been calculated using average shares. |
| 4 | Excludes tax expense for the fiscal year ended October 31, 2011, of 0.01%. |
|
Managers AMG FQ Global Alternatives Fund Financial Highlights For a share outstanding throughout each fiscal year |
| | | | | | | | | | | | | | | | | | | | |
| | | For the fiscal year ended October 31, | |
Class A Shares | | 2011 | | | 2010 | | | 2009 | | | 2008 | | | 2007 | |
Net Asset Value, Beginning of Year | | $ | 10.24 | | | $ | 9.96 | | | $ | 11.00 | | | $ | 9.94 | | | $ | 9.73 | |
Income from Investment Operations: | | | | | | | | | | | | | | | | | | | | |
Net investment income (loss) | | | (0.14 | )3 | | | (0.14 | )3 | | | (0.09 | )3 | | | 0.04 | 3 | | | 0.18 | 3 |
Net realized and unrealized gain (loss) on investments | | | (0.80 | )3 | | | 0.42 | 3 | | | (0.27 | )3 | | | 1.15 | 3 | | | 0.22 | 3 |
Total from investment operations | | | (0.94 | ) | | | 0.28 | | | | (0.36 | ) | | | 1.19 | | | | 0.40 | |
Less Distributions to Shareholders from: | | | | | | | | | | | | | | | | | | | | |
Net investment income | | | — | | | | — | | | | (0.68 | )5 | | | (0.03 | ) | | | (0.19 | ) |
Net realized gain on investments | | | — | | | | — | | | | — | | | | (0.10 | ) | | | — | |
Total distributions to shareholders | | | — | | | | — | | | | (0.68 | ) | | | (0.13 | ) | | | (0.19 | ) |
Net Asset Value, End of Year | | $ | 9.30 | | | $ | 10.24 | | | $ | 9.96 | | | $ | 11.00 | | | $ | 9.94 | |
Total Return1 | | | (9.18 | )%4 | | | 2.81 | %4 | | | (3.15 | )% | | | 12.17 | %4 | | | 4.11 | %4 |
Ratio of net expenses to average net assets | | | 1.92 | %8 | | | 1.91 | % | | | 2.00 | % | | | 2.26 | % | | | 2.50 | % |
Ratio of net investment income (loss) to average net assets1 | | | (1.47 | )%8 | | | (1.39 | )% | | | (0.88 | )% | | | 0.36 | % | | | 1.72 | % |
Portfolio turnover | | | 12 | % | | | 17 | % | | | 77 | % | | | 133 | % | | | 104 | % |
Net assets at end of year (000’s omitted) | | $ | 362,659 | | | $ | 518,118 | | | $ | 206,153 | | | $ | 89,232 | | | $ | 37,716 | |
| | | | | | | | | | | | | | | | | | | | |
Ratios absent expense offsets:2 | | | | | | | | | | | | | | | | | | | | |
Ratio of total expenses to average net assets | | | 2.58 | % | | | 2.55 | % | | | 2.44 | % | | | 2.45 | % | | | 2.56 | % |
Ratio of net investment income (loss) to average net assets | | | (2.13 | )% | | | (2.03 | )% | | | (1.32 | )% | | | 0.17 | % | | | 1.66 | % |
| | | | | | | | | | | | | | | | | | | | |
| | | | | | | | | | | | | | | | | | | | |
| | | For the fiscal year ended October 31, | |
Class C Shares | | 2011 | | | 2010 | | | 2009 | | | 2008 | | | 2007 | |
Net Asset Value, Beginning of Year | | $ | 9.98 | | | $ | 9.77 | | | $ | 10.81 | | | $ | 9.82 | | | $ | 9.69 | |
Income from Investment Operations: | | | | | | | | | | | | | | | | | | | | |
Net investment income (loss) | | | (0.19 | )3 | | | (0.20 | )3 | | | (0.16 | )3 | | | (0.04 | )3 | | | 0.11 | 3 |
Net realized and unrealized gain (loss) on investments | | | (0.77 | )3 | | | 0.41 | 3 | | | (0.26 | )3 | | | 1.13 | 3 | | | 0.21 | 3 |
Total from investment operations | | | (0.96 | ) | | | 0.21 | | | | (0.42 | ) | | | 1.09 | | | | 0.32 | |
Less Distributions to Shareholders from: | | | | | | | | | | | | | | | | | | | | |
Net investment income | | | — | | | | — | | | | (0.62 | )5 | | | (0.01 | ) | | | (0.19 | ) |
Net realized gain on investments | | | — | | | | — | | | | — | | | | (0.09 | ) | | | — | |
Total distributions to shareholders | | | — | | | | — | | | | (0.62 | ) | | | (0.10 | ) | | | (0.19 | ) |
Net Asset Value, End of Year | | $ | 9.02 | | | $ | 9.98 | | | $ | 9.77 | | | $ | 10.81 | | | $ | 9.82 | |
Total Return1 | | | (9.62 | )% | | | 2.15 | % | | | (3.86 | )% | | | 11.31 | %4 | | | 3.30 | %4 |
Ratio of net expenses to average net assets | | | 2.48 | %8 | | | 2.51 | % | | | 2.75 | % | | | 3.02 | % | | | 3.25 | % |
Ratio of net investment income (loss) to average net assets1 | | | (2.03 | )%8 | | | (2.00 | )% | | | (1.68 | )% | | | (0.38 | )% | | | 1.03 | % |
Portfolio turnover | | | 12 | % | | | 17 | % | | | 77 | % | | | 133 | % | | | 104 | % |
Net assets at end of year (000’s omitted) | | $ | 27,611 | | | $ | 45,664 | | | $ | 30,067 | | | $ | 12,128 | | | $ | 7,464 | |
| | | | | | | | | | | | | | | | | | | | |
Expense Offsets:2 | | | | | | | | | | | | | | | | | | | | |
Ratio of total expenses to average net assets | | | 3.14 | % | | | 3.14 | % | | | 3.19 | % | | | 3.21 | % | | | 3.31 | % |
Ratio of net investment income (loss) to average net assets | | | (2.69 | )% | | | (2.63 | )% | | | (2.12 | )% | | | (0.57 | )% | | | 0.97 | % |
| | | | | | | | | | | | | | | | | | | | |
|
Managers AMG FQ Global Alternatives Fund Financial Highlights For a share outstanding throughout each fiscal period |
| | | | | | | | |
Service Class Shares | | For the fiscal year
ended October 31,
2011 | | | For the fiscal period
ended October 31,
2010** | |
Net Asset Value, Beginning of Period | | $ | 10.27 | | | $ | 9.97 | |
Income from Investment Operations: | | | | | | | | |
Net investment loss | | | (0.11 | )3 | | | (0.10 | )3 |
Net realized and unrealized gain (loss) on investments | | | (0.80 | )3 | | | 0.40 | 3 |
Total from investment operations | | | (0.91 | ) | | | 0.30 | |
Net Asset Value, End of Period | | $ | 9.36 | | | $ | 10.27 | |
Total Return1 | | | (8.86 | )% | | | 3.01 | %6 |
Ratio of net expenses to average net assets | | | 1.63 | %8 | | | 1.70 | %7 |
Ratio of net investment loss to average net assets1 | | | (1.18 | )%8 | | | (1.17 | )%7 |
Portfolio turnover | | | 12 | % | | | 17 | %6 |
Net assets at end of period (000’s omitted) | | $ | 43,870 | | | $ | 18,049 | |
| | | | | | | | |
Ratios absent expense offsets:2 | | | | | | | | |
Ratio of total expenses to average net assets | | | 2.29 | % | | | 2.36 | %7 |
Ratio of net investment loss to average net assets | | | (1.84 | )% | | | (1.83 | )%7 |
| | | | | | | | |
| | | | | | | | |
Institutional Class Shares | | For the fiscal year
ended October 31,
2011 | | | For the fiscal period
ended October 31,
2010** | |
Net Asset Value, Beginning of Period | | $ | 10.28 | | | $ | 9.97 | |
Income from Investment Operations: | | | | | | | | |
Net investment loss | | | (0.10 | )3 | | | (0.08 | )3 |
Net realized and unrealized gain (loss) on investments | | | (0.80 | )3 | | | 0.39 | 3 |
Total from investment operations | | | (0.90 | ) | | | 0.31 | |
Net Asset Value, End of Period | | $ | 9.38 | | | $ | 10.28 | |
Total Return1 | | | (8.75 | )%4 | | | 3.11 | %4,6 |
Ratio of net expenses to average net assets | | | 1.48 | %8 | | | 1.48 | %7 |
Ratio of net investment loss to average net assets1 | | | (1.03 | )%8 | | | (0.95 | )%7 |
Portfolio turnover | | | 12 | % | | | 17 | %6 |
Net assets at end of period (000’s omitted) | | $ | 31,045 | | | $ | 25,856 | |
| | | | | | | | |
Ratios absent expense offsets:2 | | | | | | | | |
Ratio of total expenses to average net assets | | | 2.14 | % | | | 2.14 | %7 |
Ratio of net investment loss to average net assets | | | (1.69 | )% | | | (1.61 | )%7 |
| | | | | | | | |
| | |
| | | ** Commencement of operations was on January 1, 2010. 1 Total returns and net investment income would have been lower had certain expenses not been reduced. (See Note 1(c) of Notes to Financial Statements.) 2 Excludes the impact of expense reimbursements/recoupments or fee waivers and expense reductions such as brokerage credits, but include non-reimbursable expenses, if any, such as interest and taxes. (See Note 1(c) of Notes to Financial Statements.) 3 Per share numbers have been calculated using average shares. 4 The Total Return is based on the Financial Statement Net Asset Values as shown above. 5 The per share net investment income distribution shown for Class A shares and Class C shares includes $0.67 and $0.61, respectively, of distributions from foreign currency gains. (See Note 1(d) of Notes to Financial Statements.) 6 Not annualized. 7 Annualized. 8 Includes interest expense for the fiscal year ended October 31, 2011 of 0.01%. |
Managers AMG FQ Global Essentials Fund
Financial Highlights
For a share outstanding throughout each fiscal year
| | | | | | | | | | | | | | | | | | | | |
| | | For the fiscal year ended October 31, | |
Institutional Class Shares | | 2011 | | | 2010* | | | 2009 | | | 2008 | | | 2007 | |
Net Asset Value, Beginning of Year | | $ | 12.77 | | | $ | 11.16 | | | $ | 9.82 | | | $ | 16.49 | | | $ | 14.24 | |
Income from Investment Operations: | | | | | | | | | | | | | | | | | | | | |
Net investment income (loss) | | | 0.08 | 3 | | | (0.01 | )3 | | | 0.47 | 3 | | | 0.45 | 3 | | | 0.08 | |
Net realized and unrealized gain (loss) on investments | | | 0.61 | 3 | | | 1.72 | 3 | | | 1.35 | 3 | | | (6.65 | )3 | | | 2.31 | |
Total from investment operations | | | 0.69 | | | | 1.71 | | | | 1.82 | | | | (6.20 | ) | | | 2.39 | |
Less Distributions to Shareholders from: | | | | | | | | | | | | | | | | | | | | |
Net investment income | | | (0.58 | )7 | | | (0.10 | ) | | | (0.48 | ) | | | (0.47 | ) | | | (0.14 | ) |
Net Asset Value, End of Year | | $ | 12.88 | | | $ | 12.77 | | | $ | 11.16 | | | $ | 9.82 | | | $ | 16.49 | |
Total Return1 | | | 5.70 | %4 | | | 15.41 | %4,6 | | | 19.67 | % | | | (38.66 | )% | | | 16.94 | % |
Ratio of net expenses to average net assets | | | 0.97 | % | | | 0.97 | % | | | 0.92 | % | | | 0.80 | % | | | 0.90 | % |
Ratio of net investment income (loss) to average net assets1 | | | 0.64 | % | | | (0.09 | )% | | | 4.82 | % | | | 3.18 | % | | | 0.52 | % |
Portfolio turnover | | | 80 | % | | | 127 | % | | | 213 | % | | | 143 | % | | | 123 | % |
Net assets at end of year (000’s omitted) | | $ | 86,935 | | | $ | 93,903 | | | $ | 80,584 | | | $ | 78,339 | | | $ | 175,105 | |
| | | | | | | | | | | | | | | | | | | | |
Ratios absent expense offsets:2 | | | | | | | | | | | | | | | | | | | | |
Ratio of total expenses to average net assets | | | 0.99 | % | | | 1.05 | % | | | 1.17 | % | | | 1.08 | % | | | 1.10 | % |
Ratio of net investment income (loss) to average net assets | | | 0.62 | % | | | (0.17 | )% | | | 4.57 | % | | | 2.90 | % | | | 0.32 | % |
| | | | | | | | | | | | | | | | | | | | |
41
|
Managers AMG FQ Global Essentials Fund Financial Highlights For a share outstanding throughout each fiscal period |
| | | | | | | | |
Service Class Shares | | For the fiscal year
ended October 31,
2011 | | | For the fiscal period
ended October 31,
2010** | |
Net Asset Value, Beginning of Period | | $ | 12.77 | | | $ | 11.36 | |
Income from Investment Operations: | | | | | | | | |
Net investment income (loss) | | | 0.03 | 3 | | | (0.04 | )3 |
Net realized and unrealized gain on investments | | | 0.62 | 3 | | | 1.45 | 3 |
Total from investment operations | | | 0.65 | | | | 1.41 | |
Less Distributions to Shareholders from: | | | | | | | | |
Net investment income | | | (0.56 | )7 | | | — | |
Net Asset Value, End of Period | | $ | 12.86 | | | $ | 12.77 | |
Total Return1 | | | 5.44 | % | | | 12.41 | %5 |
Ratio of net expenses to average net assets | | | 1.15 | % | | | 1.17 | %6 |
Ratio of net investment income (loss) to average net assets1 | | | 0.24 | % | | | (0.43 | )%6 |
Portfolio turnover | | | 80 | % | | | 127 | %5 |
Net assets at end of period (000’s omitted) | | $ | 1,103 | | | $ | 217 | |
| | | | | | | | |
Ratios absent expense offsets:2 | | | | | | | | |
Ratio of total expenses to average net assets | | | 1.17 | % | | | 1.25 | %6 |
Ratio of net investment income (loss) to average net assets | | | 0.22 | % | | | (0.51 | )%6 |
| | | | | | | | |
| | | | | | | | |
Investor Class Shares | | For the fiscal year
ended October 31,
2011 | | | For the fiscal period
ended October 31,
2010** | |
Net Asset Value, Beginning of Period | | $ | 12.73 | | | $ | 11.36 | |
Income from Investment Operations: | | | | | | | | |
Net investment income (loss) | | | 0.01 | 3 | | | (0.07 | )3 |
Net realized and unrealized gain on investments | | | 0.62 | 3 | | | 1.44 | 3 |
Total from investment operations | | | 0.63 | | | | 1.37 | |
Less Distributions to Shareholders from: | | | | | | | | |
Net investment income | | | (0.56 | )7 | | | — | |
Net Asset Value, End of Period | | $ | 12.80 | | | $ | 12.73 | |
Total Return1 | | | 5.23 | %4 | | | 12.06 | %4,5 |
Ratio of net expenses to average net assets | | | 1.47 | % | | | 1.46 | %6 |
Ratio of net investment income (loss) to average net assets1 | | | 0.06 | % | | | (0.72 | )%6 |
Portfolio turnover | | | 80 | % | | | 127 | %5 |
Net assets at end of period (000’s omitted) | | $ | 7,824 | | | $ | 6,517 | |
| | | | | | | | |
Ratios absent expense offsets:2 | | | | | | | | |
Ratio of total expenses to average net assets | | | 1.49 | % | | | 1.54 | %6 |
Ratio of net investment income (loss) to average net assets | | | 0.04 | % | | | (0.80 | )%6 |
| | | | | | | | |
| | |
| | | * Effective January 1, 2010, existing shares of Managers AMG FQ Global Essentials Fund were reclassified and redesignated as Institutional Class shares. ** Investor Class and Service Class shares commenced operations on January 1, 2010. 1 Total returns and net investment income would have been lower had certain expenses not been reduced. (See Note 1(c) of Notes to Financial Statements.) 2 Excludes the impact of expense reimbursements or fee waivers and expense reductions such as brokerage recapture credits, but includes non-reimbursable expenses, if any, such as interest and taxes. (See Note 1(c) of Notes to Financial Statements.) 3 Per share numbers have been calculated using average shares. 4 The Total Return is based on the Financial Statement Net Asset Values as shown above. 5 Not annualized. 6 Annualized. 7 The per share income distribution shown for the Institutional, Service, and Investor Class shares represents income derived from currency gains. (See Note 1(d) of Notes to Financial Statements.) |
Managers AMG Funds
Notes to Financial Statements
October 31, 2011
| 1. | Summary of Significant Accounting Policies |
Managers Trust I (the “Trust”) is an open-end management investment company, organized as a Massachusetts business trust, and registered under the Investment Company Act of 1940, as amended (the “1940 Act”). Currently, the Trust consists of a number of different funds, each having distinct investment management objectives, strategies, risks, and policies. Included in this report are: Managers AMG FQ Tax-Managed U.S. Equity Fund (“Tax-Managed”), Managers AMG FQ U.S. Equity Fund (“U.S. Equity”), Managers AMG FQ Global Alternatives Fund (“Global Alternatives”) and Managers AMG FQ Global Essentials Fund (“Global Essentials”) (formerly Managers Fremont Global Fund), each a “Fund” and collectively the “Funds.”
Effective January 1, 2010, Global Essentials and Global Alternatives added new classes of shares. Global Essentials offers three classes of shares, Institutional, Service and Investor, while Global Alternatives offers four classes of shares, Institutional, Service, Class A and Class C, each offering varying levels of shareholder servicing and /or 12b-1 fees. Legacy Global Essentials shareholders became shareholders in the Institutional Class and the Fund added a new Investor Class and Service Class. Global Alternatives added Institutional Class and Service Class shares to the existing A and C Class shares.
Each Fund except Global Essentials offers Class A and Class C shares. Sales of Class A shares may be subject to a front-end sales charge of up to 5.75%. Redemptions of Class A and Class C shares may be subject to a contingent-deferred sales charge (as a percentage of the original offering price or the net asset value at the time of sale, whichever is less). Each Fund offers Institutional Class shares, available with no sales charge, to certain institutional investors and qualifying individual investors. Each class represents an interest in the same assets of the Fund and the classes are identical except for class specific expenses related to shareholder activity. Each class has equal voting privileges except that each class has exclusive voting rights with respect to its services and/or distribution plan. Please refer to a current prospectus for additional information on each share class.
The Funds’ financial statements are prepared in accordance with accounting principles generally accepted in the United States of America (“U.S. GAAP”), which require management to make estimates and assumptions that affect the reported amounts of assets and liabilities and disclosure of contingent assets and liabilities at the date of the financial statements and the reported amounts of income and expenses during the reporting period. Actual results could differ from those estimates and such differences could be material. The following is a summary of significant accounting policies followed by the Funds in the preparation of their financial statements:
| a. | Valuation of Investments |
Equity securities traded on a domestic or international securities exchange are valued at the last quoted sale price, or, lacking any
sales, at the last quoted bid price. Over-the-counter securities are valued at the Nasdaq Official Closing Price, if one is available. Lacking any sales, over-the-counter securities are valued at the last quoted bid price. The Funds’ investments are generally valued based on market quotations provided by third-party pricing services approved by the Board of Trustees of the Funds (the “Board”). Under certain circumstances, the value of certain Fund investments may be based on an evaluation of fair value, pursuant to procedures established by and under the general supervision of the Board. Each Fund may use the fair value of a portfolio investment to calculate its NAV when, for example, (1) market quotations are not readily available because a portfolio investment is not traded in a public market or the principal market in which the investment trades is closed, (2) trading in a portfolio investment is suspended and has not resumed before the Fund calculates its NAV, (3) a significant event affecting the value of a portfolio investment is determined to have occurred between the time of the market quotation provided for a portfolio investment and the time as of which the Fund calculates its NAV, (4) an investment’s price has remained unchanged over a period of time (often referred to as a “stale price”), or (5) Managers Investment Group LLC (“the Investment Manager”) determines that a market quotation is inaccurate. Portfolio investments that trade primarily on foreign markets are priced based upon the market quotation of such securities as of the close of their respective principal markets, as adjusted to reflect the Investment Manager’s determination of the impact of events occurring subsequent to the close of such markets but prior to the time as of which the Funds calculate their NAV. In accordance with procedures approved by the Board, the Investment Manager relies upon recommendations of a third-party fair valuation service in adjusting the prices of such foreign portfolio investments. A Fund’s investments in derivative instruments traded in foreign markets (including futures contracts on equity and fixed-income securities and security indexes and options on futures contracts, securities and security indexes) are priced based on the market quotation of such instruments in their respective principal markets as of the close of regular business on the NYSE. Under certain circumstances, the Investment Manager may adjust such prices based on its determination of the impact of events occurring subsequent to the close of such markets but prior to the time as of which the Fund calculates its NAV. The Funds may invest in securities that may be thinly traded. The Board has adopted procedures to adjust prices of thinly traded securities that are judged to be stale so that they reflect fair value. An investment valued on the basis of its fair value may be valued at a price higher or lower than available market quotations. An investment’s valuation may differ depending on the method used and the factors considered in determining value according to the Fund’s fair value procedures.
Fixed-income securities are valued based on valuations furnished by independent pricing services that utilize matrix systems, which reflect such factors as security prices, yields, maturities, and ratings, and are supplemented by dealer and exchange quotations. Futures contracts for which market quotations are readily available
Managers AMG Funds
Notes to Financial Statements (continued)
are valued at the settlement price as of the close of the futures exchange. Short-term investments having a remaining maturity of 60 days or less are valued at amortized cost, which approximates market value. Investments in other open-end regulated investment companies are valued at their end of day net asset value per share except iShares or other ETF’s, which are valued the same as equity securities. Investments in certain mortgage-backed and stripped mortgage-backed securities, preferred stocks, convertible securities, derivatives and other debt securities not traded on an organized securities market are valued on the basis of valuations provided by dealers or by a pricing service which uses information with respect to transactions in such securities and various relationships between securities and yield to maturity in determining value. Securities (including derivatives) for which market quotations are not readily available are valued at fair value, as determined in good faith, and pursuant to procedures adopted by the Board. The values assigned to fair value investments are based on available information and do not necessarily represent amounts that might ultimately be realized, since such amounts depend on future developments inherent in long-term investments. Further, because of the inherent uncertainty of valuation, those estimated values may differ significantly from the values that would have been used had a ready market for the investments existed, and the differences could be material.
U.S. GAAP defines fair value as the price that a Fund would receive to sell an asset or pay to transfer a liability in an orderly transaction between market participants at the measurement date. U.S. GAAP also establishes a framework for measuring fair value, and a three-level hierarchy for fair value measurements based upon the transparency of inputs to the valuation of an asset or liability. Inputs may be observable or unobservable and refer broadly to the assumptions that market participants would use in pricing the asset or liability. Observable inputs reflect the assumptions market participants would use in pricing the asset or liability based on market data obtained from sources independent of the Funds. Unobservable inputs reflect the Funds’ own assumptions about the assumptions that market participants would use in pricing the asset or liability developed based on the best information available in the circumstances. Each investment is assigned a level based upon the observability of the inputs which are significant to the overall valuation.
The three-tier hierarchy of inputs is summarized below:
Level 1 – inputs are quoted prices in active markets for identical investments (e.g., equity securities, open-end investment companies, futures contracts, options contracts)
Level 2 – other observable inputs (including, but not limited to: quoted prices for similar assets or liabilities in markets that are active, quoted prices for identical or similar assets or liabilities in markets that are not active, inputs other than quoted prices that are observable for the assets or liabilities (such as interest rates, yield
curves, volatilities, prepayment speeds, loss severities, credit risks and default rates) or other market corroborated inputs) (e.g., debt securities, government securities, swap contracts, foreign currency exchange contracts, foreign securities utilizing international fair value pricing, broker-quoted securities, fair valued securities with observable inputs)
Level 3 – inputs are significant unobservable inputs (including the Fund’s own assumptions used to determine the fair value of investments) (e.g., fair valued securities with unobservable inputs) The inputs or methodologies used for valuing investments are not necessarily an indication of the risk associated with investing in those investments.
Security transactions are accounted for as of trade date. Realized gains and losses on securities sold are determined on the basis of identified cost.
| c. | Investment Income and Expenses |
Dividend income is recorded on the ex-dividend date, except certain dividends from foreign securities where the ex-dividend date may have passed. Dividends from foreign securities are recorded as soon as the Trust is informed of the ex-dividend date. Dividend income on foreign securities is recorded net of any withholding tax. Interest income, which includes amortization of premium and accretion of discount on debt securities, is accrued as earned. Non-cash dividends included in dividend income, if any, are reported at the fair market value of the securities received. Other income and expenses are recorded on an accrual basis. Expenses that cannot be directly attributed to a Fund are apportioned among the Funds in the Trust and in some cases other affiliated funds based upon their relative average net assets or number of shareholders. Investment income, realized and unrealized capital gains and losses, the common expenses of each Fund, and certain Fund level expense reductions, if any, are allocated on a pro rata basis to each class based on the relative net assets of each class to the total net assets of each Fund.
The Funds have a “balance credit” agreement with The Bank of New York Mellon (“BNYM”), the Funds’ custodian, whereby each Fund is credited with an interest factor equal to 0.75% below the effective 90-day T-Bill rate for account balances left uninvested overnight. If the T-Bill rate falls below 0.75%, no credits will be earned. These credits serve to reduce custody expenses that would otherwise be charged to each Fund. For the fiscal year ended October 31, 2011, the Funds had no balance credits.
Overdrafts will cause a reduction of any earnings credits, computed at 2% above the effective Federal funds rate on the day of the overdraft. For the fiscal year ended October 31, 2011, overdraft fees for Tax-Managed, U.S. Equity, Global Alternatives and Global Essentials equaled $60, $178, $70 and $0, respectively.
Managers AMG Funds
Notes to Financial Statements (continued)
The Trust also has a balance credit arrangement with its Transfer Agent, BNY Mellon Investment Servicing (US) Inc. (formerly PNC Global Investment Servicing (U.S.) Inc.), whereby earnings credits are used to offset banking charges and other out-of-pocket expenses. For the fiscal year ended October 31, 2011, the transfer agent expense was reduced as follows: Tax-Managed - $51, U.S. Equity - $57, Global Alternatives - $674, and Global Essentials - $107.
The Investment Manager has agreed to waive a portion of its management fee in consideration of shareholder servicing fees that it has received from JPMorgan Distribution Services, Inc., with respect to short-term cash investments each Fund may have made in the JPMorgan Liquid Assets Portfolio - Capital Share Class. For the fiscal year ended October 31, 2011, the management fee was reduced as follows: Global Alternatives - $123,724, or 0.02% annualized, and Global Essentials - $15,034, or 0.02% annualized.
Total returns and net investment income for the Funds would have been lower had certain expenses not been offset. Total expenses before offsets exclude the impact of expense reimbursements or
fee waivers and expense reductions such as brokerage recapture credits, but include non-reimbursable expenses, if any, such as interest and taxes.
| d. | Dividends and Distributions |
Dividends resulting from net investment income and distributions of capital gains, if any, normally will be declared and paid annually in December and when required for Federal excise tax purposes. Distributions are recorded on the ex-dividend date and are declared separately for each class. Income and capital gain distributions are determined in accordance with Federal income tax regulations, which may differ from U.S. GAAP. These differences are primarily due to differing treatments for losses deferred due to wash sales, REITs, equalization accounting for tax purposes, foreign currency, options, futures, and market discount transactions. Permanent book and tax basis differences, if any, relating to shareholder distributions will result in reclassifications to paid-in capital. The tax character of distributions paid during the fiscal years ended October 31, 2011 and 2010 were as follows:
| | | | | | | | | | | | | | | | | | | | | | | | | | | | | | | | |
| | | Tax-Managed Equity | | | U.S. Equity | | | Global Alternatives | | | Global Essentials | |
| | | 2011 | | | 2010 | | | 2011 | | | 2010 | | | 2011 | | | 2010 | | | 2011 | | | 2010 | |
Distributions paid from: | | | | | | | | | | | | | | | | | | | | | | | | | | | | | | | | |
Ordinary income | | $ | 175,189 | | | $ | 125,566 | | | $ | 512,079 | | | $ | 698,054 | | | | — | | | | — | | | $ | 4,527,841 | | | $ | 710,852 | |
Short-term capital gains | | | — | | | | — | | | | — | | | | — | | | | — | | | | — | | | | — | | | | — | |
Long-term capital gains | | | — | | | | — | | | | — | | | | — | | | | — | | | | — | | | | — | | | | — | |
| | | | | | | | | | | | | | | | | | | | | | | | | | | | | | | | |
Totals | | $ | 175,189 | | | $ | 125,566 | | | $ | 512,079 | | | $ | 698,054 | | | | — | | | | — | | | $ | 4,527,841 | | | $ | 710,852 | |
| | | | | | | | | | | | | | | | | | | | | | | | | | | | | | | | |
As of October 31, 2011, the components of distributable earnings (excluding unrealized appreciation/depreciation) on a tax basis consisted of:
| | | | | | | | | | | | | | | | |
| | | Tax-Managed Equity | | | U.S. Equity | | | Global Alternatives | | | Global Essentials | |
Capital loss carryforward | | $ | 28,831,202 | | | $ | 14,976,925 | | | | — | | | $ | 24,754,715 | |
Undistributed ordinary income | | | 32,584 | | | | 431,179 | | | | — | | | | 4,289,072 | |
Undistributed short-term capital gains | | | — | | | | — | | | | — | | | | — | |
Undistributed long-term capital gains | | | — | | | | — | | | | — | | | | — | |
45
Managers AMG Funds
Notes to Financial Statements (continued)
Each Fund intends to comply with the requirements under Subchapter M of the Internal Revenue Code of 1986, as amended, to distribute substantially all of its taxable income and gains to its shareholders and to meet certain diversification and income requirements with respect to investment companies. Therefore, no provision for Federal income or excise tax is included in the accompanying financial statements.
Additionally, based on each Fund’s understanding of the tax rules and rates related to income, gains and transactions for the foreign jurisdictions in which it invests, each Fund will provide for foreign taxes, and where appropriate, deferred foreign taxes.
Management has analyzed the Funds’ tax positions taken on federal income tax returns for all open tax years (tax years ended October 31, 2008-2011), and has concluded that no provision for federal income tax is required in the Funds’ financial statements. Additionally, the Funds are not aware of any tax position for which it is reasonably possible that the total amounts of unrecognized tax benefits will change materially in the next twelve months.
| f. | Capital Loss Carryovers and Deferrals |
As of October 31, 2011, the following Funds had accumulated net realized capital loss carryovers from securities transactions for Federal income tax purposes as shown in the following chart. These amounts may be used to offset realized capital gains, if any, through the expiration dates listed.
| | | | | | | | | | |
Fund | | | | Capital Loss
Carryover Amount | | | Expires
October 31, | |
Tax-Managed | | | | $ | 22,952,492 | | | | 2017 | |
| | | | | 5,878,710 | | | | 2016 | |
| | | | | | | | | | |
Total | | | | $ | 28,831,202 | | | | | |
| | | | | | | | | | |
U.S. Equity | | | | $ | 14,976,925 | | | | 2017 | |
| | | | | | | | | | |
Global Essentials | | | | $ | 19,442,096 | | | | 2017 | |
| | | | | 5,312,619 | | | | 2016 | |
| | | | | | | | | | |
Total | | | | $ | 24,754,715 | | | | | |
| | | | | | | | | | |
For the fiscal year ended October 31, 2011, Tax-Managed, U.S. Equity, Global Alternatives and Global Essentials utilized capital loss carryovers in the amounts of $3,749,235, $6,380,347, $2,888,951 and $15,464,145, respectively.
Under the recently enacted Regulated Investment Company Modernization Act of 2010 (the “Act”), the Funds will be permitted to carry forward capital losses incurred in taxable years beginning after December 22, 2010 for an unlimited period. However, any losses incurred during those taxable years will be required to be utilized prior to any losses incurred in pre-enactment taxable years, which generally expire eight years following the close of the taxable year in which they were incurred. Additionally, post-enactment capital losses that are carried forward will retain their tax character as either short-term or long-term capital losses rather than being considered all short-term as under previous law. The Funds’ first fiscal year subject to the Act will be the year ended October 31, 2012.
The Trust’s Declaration of Trust authorizes for each series the issuance of an unlimited number of shares of beneficial interest, without par value. Each Fund records sales and repurchases of its capital stock on the trade date. The cost of securities contributed to the Funds in connection with the issuance of shares is based on the valuation of those securities in accordance with the Funds’ policy on investment valuation. Dividends and distributions to shareholders are recorded on the ex-dividend date.
46
Managers AMG Funds
Notes to Financial Statements (continued)
The capital stock transactions by class for Tax-Managed, U.S. Equity, Global Alternatives and Global Essentials for the fiscal years ended October 31, 2011 and 2010 were as follows:
| | | | | | | | | | | | | | | | | | | | | | | | | | | | | | | | |
| | | Tax-Managed | | | U.S. Equity | |
| | | For the fiscal year
ended October 31,
2011 | | | For the fiscal year
ended October 31,
2010 | | | For the fiscal year
ended October 31,
2011 | | | For the fiscal year
ended October 31,
2010 | |
| | | Shares | | | Amount | | | Shares | | | Amount | | | Shares | | | Amount | | | Shares | | | Amount | |
Class A Shares | | | | | | | | | | | | | | | | | | | | | | | | | | | | | | | | |
Sale of shares | | | 9,926 | | | $ | 133,378 | | | | 12,369 | | | $ | 138,045 | | | | 194,449 | | | $ | 2,156,701 | | | | 188,045 | | | $ | 1,807,907 | |
Reinvestment of dividends and distributions | | | 205 | | | | 2,755 | | | | — | | | | — | | | | 14,495 | | | | 157,418 | | | | 23,764 | | | | 229,320 | |
Shares repurchased | | | (116,450 | ) | | | (1,577,937 | ) | | | (399,037 | ) | | | (4,489,541 | ) | | | (885,421 | ) | | | (10,198,448 | ) | | | (469,818 | ) | | | (4,558,863 | ) |
| | | | | | | | | | | | | | | | | | | | | | | | | | | | | | | | |
Net decrease | | | (106,319 | ) | | ($ | 1,441,804 | ) | | | (386,668 | ) | | ($ | 4,351,496 | ) | | | (676,477 | ) | | ($ | 7,884,329 | ) | | | (258,009 | ) | | ($ | 2,521,636 | ) |
| | | | | | | | | | | | | | | | | | | | | | | | | | | | | | | | |
Class C Shares | | | | | | | | | | | | | | | | | | | | | | | | | | | | | | | | |
Sale of shares | | | 27,555 | | | $ | 364,730 | | | | 18,251 | | | $ | 191,591 | | | | 7,247 | | | $ | 84,049 | | | | 10,980 | | | $ | 107,094 | |
Reinvestment of dividends and distributions | | | — | | | | — | | | | — | | | | — | | | | 69 | | | | 748 | | | | 113 | | | | 1,084 | |
Shares repurchased | | | (68,969 | ) | | | (915,731 | ) | | | (221,833 | ) | | | (2,391,286 | ) | | | (33,680 | ) | | | (381,556 | ) | | | (33,416 | ) | | | (316,874 | ) |
| | | | | | | | | | | | | | | | | | | | | | | | | | | | | | | | |
Net decrease | | | (41,414 | ) | | ($ | 551,001 | ) | | | (203,582 | ) | | ($ | 2,199,695 | ) | | | (26,364 | ) | | ($ | 296,759 | ) | | | (22,323 | ) | | ($ | 208,696 | ) |
| | | | | | | | | | | | | | | | | | | | | | | | | | | | | | | | |
Institutional Class | | | | | | | | | | | | | | | | | | | | | | | | | | | | | | | | |
Sale of shares | | | 210,345 | | | $ | 2,832,928 | | | | 118,811 | | | $ | 1,331,128 | | | | 196,876 | | | $ | 2,204,354 | | | | 79,358 | | | $ | 789,194 | |
Reinvestment of dividends and distributions | | | 12,194 | | | | 163,040 | | | | 10,915 | | | | 119,516 | | | | 31,810 | | | | 347,361 | | | | 47,361 | | | | 459,403 | |
Shares repurchased | | | (760,632 | ) | | | (10,475,879 | ) | | | (901,437 | ) | | | (10,159,838 | ) | | | (427,890 | ) | | | (4,754,812 | ) | | | (474,586 | ) | | | (4,603,599 | ) |
| | | | | | | | | | | | | | | | | | | | | | | | | | | | | | | | |
Net decrease | | | (538,093 | ) | | ($ | 7,479,911 | ) | | | (771,711 | ) | | ($ | 8,709,194 | ) | | | (199,204 | ) | | ($ | 2,203,097 | ) | | | (347,867 | ) | | ($ | 3,355,002 | ) |
| | | | | | | | | | | | | | | | | | | | | | | | | | | | | | | | |
47
Managers AMG Funds
Notes to Financial Statements (continued)
| | | | | | | | | | | | | | | | |
| | | Global Alternatives | |
| | | For the fiscal year ended
October 31, 2011 | | | For the fiscal year ended
October 31, 2010 | |
| | | Shares | | | Amount | | | Shares | | | Amount | |
Class A Shares | | | | | | | | | | | | | | | | |
Sale of shares | | | 34,772,313 | | | $ | 344,907,661 | | | | 45,126,281 | | | $ | 467,569,218 | |
Shares repurchased | | | (46,381,683 | ) | | | (441,562,835 | ) | | | (15,222,361 | ) | | | (156,389,321 | ) |
| | | | | | | | | | | | | | | | |
Net increase (decrease) | | | (11,609,370 | ) | | ($ | 96,655,174 | ) | | | 29,903,920 | | | $ | 311,179,897 | |
| | | | | | | | | | | | | | | | |
Class C Shares | | | | | | | | | | | | | | | | |
Sale of shares | | | 906,555 | | | $ | 8,852,200 | | | | 2,352,895 | | | $ | 23,868,322 | |
Shares repurchased | | | (2,418,624 | ) | | | (22,468,584 | ) | | | (856,052 | ) | | | (8,574,553 | ) |
| | | | | | | | | | | | | | | | |
Net increase (decrease) | | | (1,512,069 | ) | | ($ | 13,616,384 | ) | | | 1,496,843 | | | $ | 15,293,769 | |
| | | | | | | | | | | | | | | | |
Service Class Shares* | | | | | | | | | | | | | | | | |
Sale of shares | | | 5,119,566 | | | $ | 50,984,690 | | | | 2,008,466 | | | $ | 21,183,512 | |
Shares repurchased | | | (2,188,777 | ) | | | (20,888,185 | ) | | | (251,584 | ) | | | (2,613,904 | ) |
| | | | | | | | | | | | | | | | |
Net increase | | | 2,930,789 | | | $ | 30,096,505 | | | | 1,756,882 | | | $ | 18,569,608 | |
| | | | | | | | | | | | | | | | |
Institutional Class Shares* | | | | | | | | | | | | | | | | |
Sale of shares | | | 4,944,845 | | | $ | 48,944,094 | | | | 3,205,700 | | | $ | 33,272,519 | |
Shares repurchased | | | (4,149,314 | ) | | | (38,409,354 | ) | | | (689,808 | ) | | | (7,010,001 | ) |
| | | | | | | | | | | | | | | | |
Net increase | | | 795,531 | | | $ | 10,534,740 | | | | 2,515,892 | | | $ | 26,262,518 | |
| | | | | | | | | | | | | | | | |
| |
| | | Global Essentials | |
| | | For the fiscal year ended
October 31, 2011 | | | For the fiscal year ended
October 31, 2010 | |
| | | Shares | | | Amount | | | Shares | | | Amount | |
Investor Class Shares* | | | | | | | | | | | | | | | | |
Sale of shares | | | 738,481 | | | $ | 9,210,561 | | | | 518,437 | | | $ | 6,486,828 | |
Reinvestment of dividends and distributions | | | 26,580 | | | | 318,163 | | | | — | | | | — | |
Shares repurchased | | | (665,456 | ) | | | (8,191,276 | ) | | | (6,670 | ) | | | (80,131 | ) |
| | | | | | | | | | | | | | | | |
Net increase | | | 99,605 | | | $ | 1,337,448 | | | | 511,767 | | | $ | 6,406,697 | |
| | | | | | | | | | | | | | | | |
Service Class Shares* | | | | | | | | | | | | | | | | |
Sale of shares | | | 68,839 | | | $ | 863,691 | | | | 17,893 | | | $ | 219,726 | |
Reinvestment of dividends and distributions | | | 838 | | | | 10,058 | | | | — | | | | — | |
Shares repurchased | | | (870 | ) | | | (10,696 | ) | | | (880 | ) | | | (10,484 | ) |
| | | | | | | | | | | | | | | | |
Net increase | | | 68,807 | | | $ | 863,053 | | | | 17,013 | | | $ | 209,242 | |
| | | | | | | | | | | | | | | | |
Institutional Class Shares | | | | | | | | | | | | | | | | |
Sale of shares | | | 701,009 | | | $ | 8,771,959 | | | | 1,145,762 | | | $ | 14,225,272 | |
Reinvestment of dividends and distributions | | | 343,716 | | | | 4,124,590 | | | | 60,763 | | | | 692,638 | |
Shares repurchased | | | (1,647,069 | ) | | | (20,390,344 | ) | | | (1,074,616 | ) | | | (12,569,066 | ) |
| | | | | | | | | | | | | | | | |
Net increase (decrease) | | | (602,344 | ) | | ($ | 7,493,795 | ) | | | 131,909 | | | $ | 2,348,844 | |
| | | | | | | | | | | | | | | | |
| * | Investor and Service Class shares for Global Essentials commenced operations on January 1, 2010. Institutional and Service Class shares for Global Alternatives commenced operations on January 1, 2010. |
48
Managers AMG Funds
Notes to Financial Statements (continued)
At October 31, 2011, certain unaffiliated shareholders of record, specifically omnibus accounts, individually or collectively held greater than 10% of the outstanding shares of the following Funds: Tax-Managed – two collectively own 31% and Global Alternatives – three collectively own 38%. Transactions by these shareholders may have a material impact on the Funds.
| h. | Foreign Currency Translation |
The books and records of the Funds are maintained in U.S. dollars. The value of investments, assets and liabilities denominated in currencies other than U.S. dollars are translated into U.S. dollars based upon current foreign exchange rates. Purchases and sales of foreign investments, income and expenses are converted into U.S. dollars based on currency exchange rates prevailing on the respective dates of such transactions. Net realized and unrealized gain (loss) on foreign currency transactions represent: (1) foreign exchange gains and losses from the sale and holdings of foreign currencies; (2) gains and losses between trade date and settlement date on investment securities transactions and forward foreign currency exchange contracts; and (3) gains and losses from the difference between amounts of interest and dividends recorded and the amounts actually received.
The Funds do not isolate the net realized and unrealized gain or loss resulting from changes in exchange rates from the fluctuations in market prices of securities held. Such fluctuations are included with the net realized and unrealized gain or loss on investments.
Certain Portfolios invest in securities of foreign entities and in instruments denominated in foreign currencies which involve risks not typically associated with investments in domestic securities. Non-domestic securities carry special risks, such as exposure to currency fluctuations, less developed or less efficient trading markets, political instability, a lack of company information, differing auditing and legal standards, and, potentially, less liquidity.
Realized gains in certain countries may be subject to foreign taxes at the Fund level, at rates ranging from approximately 10% to 15%. The Fund would pay such foreign taxes on net realized gains at the appropriate rate for each jurisdiction.
| 2. | Agreements and Transactions with Affiliates |
The Trust has entered into an investment management agreements (each, an “Investment Management Agreement”) under which the Investment Manager, an independently managed subsidiary of Affiliated Managers Group, Inc. (“AMG”), serves as investment manager to the Funds and is responsible for the Funds’ overall administration. The Funds’ investment portfolios are managed by First Quadrant, L.P. (“First Quadrant” or the “Subadvisor”), which serves pursuant to a subadvisory agreement between the Investment Manager and First Quadrant with respect to each of the Funds. AMG indirectly owns a majority interest in First Quadrant.
Tax-Managed is obligated by the Investment Management Agreement to pay a management fee to the Investment Manager at the annual rate of 0.85% of the average daily net assets of the Fund. Under the Investment Management Agreement with the Tax-Managed
Fund, the Investment Manager provides a variety of administrative services to the Fund. The Investment Manager receives no additional compensation from the Fund for these services. Pursuant to a reimbursement agreement between the Investment Manager and First Quadrant, First Quadrant reimburses the Investment Manager for the costs the Investment Manager bears in providing such services to the Fund.
U.S. Equity, Global Alternatives and Global Essentials are obligated by the Investment Management Agreement to pay a management fee to the Investment Manager at the annual rate of 0.35%, 1.70% and 0.60%, respectively, of the average daily net assets of the applicable Fund. The Investment Manager, in turn, pays a portion of this fee to First Quadrant for its services as subadvisor.
The Investment Manager has contractually agreed, through at least March 1, 2012, to waive fees and pay or reimburse Fund expenses in order to limit total annual Fund operating expenses after fee waiver and expense reimbursements (exclusive of taxes, interest, shareholder servicing fees and distribution and service (12b-1) fees, brokerage commissions, acquired fund fees and expenses and extraordinary items) to the following amounts of the Funds’ average daily net assets:
| | | | | | | | | | | | | | | | | | | | |
Fund | | Class A | | | Class C | | | Investor | | | Service
Class | | | Institutional
Class | |
Tax-Managed | | | 1.24 | % | | | 1.99 | % | | | N/A | | | | N/A | | | | 0.99 | % |
U.S. Equity | | | 1.04 | % | | | 1.79 | % | | | N/A | | | | N/A | | | | 0.79 | % |
Global Alternatives | | | 1.99 | % | | | 2.49 | % | | | N/A | | | | 1.74 | % | | | 1.49 | % |
Global Essentials | | | N/A | | | | N/A | | | | 1.49 | % | | | 1.24 | % | | | 0.99 | % |
Each Fund is obligated to repay the Investment Manager such amounts waived, paid or reimbursed in future years provided that the repayment occurs within thirty-six (36) months after the waiver or reimbursement and that such repayment would not cause the Fund’s total operating expenses in any such future year to exceed that Fund’s respective expense cap. For the fiscal year ended October 31, 2011, each Fund’s components of reimbursement are detailed in the following charts:
| | | | | | | | |
| | | Tax-Managed | | | U.S Equity | |
Reimbursement Available -10/31/10 | | $ | 246,349 | | | $ | 150,695 | |
Additional Reimbursements | | | 54,758 | | | | 45,459 | |
Repayments | | | — | | | | — | |
Expired Reimbursements | | | (47,895 | ) | | | — | |
| | | | | | | | |
Reimbursement Available -10/31/11 | | $ | 253,212 | | | $ | 196,154 | |
| | | | | | | | |
| | |
| | | Global
Alternatives | | | Global Essentials | |
Reimbursement Available- 10/31/10 | | $ | 3,293,166 | | | $ | 53,618 | |
Additional Reimbursements | | | 3,907,032 | | | | 26,843 | |
Repayments | | | — | | | | (2,072 | ) |
Expired Reimbursements | | | (124,128 | ) | | | — | |
| | | | | | | | |
Reimbursement Available - 10/31/11 | | $ | 7,076,070 | | | $ | 78,389 | |
| | | | | | | | |
Managers AMG Funds
Notes to Financial Statements (continued)
Effective January 1, 2011, the aggregate annual retainer paid to each Independent Trustee of the Board is $80,000, plus $5,000 or $2,500 for each regular or special meeting attended, respectively. The Independent Chairman of the Trusts receives an additional payment of $20,000 per year. The Chairman of the Audit Committee receives an additional payment of $8,000 per year. (Prior to January 1, 2011, the aggregate annual retainer paid to each Independent Trustee of the Board was $65,000, plus $4,000 or $2,500 for each regular or special meeting attended, respectively. The Independent Chairman of the Trusts received an additional payment of $15,000 per year. The Chairman of the Audit Committee received an additional payment of $5,000 per year.) The Trustees’ fees and expenses are allocated among all of the funds for which the Investment Manager serves as the advisor (the “Managers Funds”) based on the relative net assets of such funds. The “Trustees fees and expenses” shown in the financial statements represents the Funds’ allocated portion of the total fees and expenses paid by the Managers Funds.
The Funds are distributed by Managers Distributors, Inc. (the “Distributor” or “MDI”), a wholly-owned subsidiary of the Investment Manager. MDI serves as the principal distributor and underwriter for each Fund and is a registered broker-dealer and member of the Financial Industry Regulatory Authority, Inc. (“FINRA”). Shares of each Fund will be continuously offered and will be sold directly to prospective purchasers through brokers, dealers or other financial intermediaries who have executed selling agreements with MDI. Subject to the compensation arrangement discussed below, generally MDI bears all or a portion of the expenses of providing services pursuant to the distribution agreement, including payment of the expenses relating to the distribution of Prospectuses for sales purposes and any advertising or sales literature. Certain Trustees and Officers of the Funds are Officers and/or Directors of the Investment Manager, AMG and/or the Distributor.
The Trust has adopted a distribution and service plan (the “Plan”) with respect to the Investor Class, Class A and Class C Shares in accordance with the requirements of Rule 12b-1 under the 1940 Act and the requirements of the applicable rules of FINRA regarding asset-based sales charges. Pursuant to the Plan, each Fund may compensate the Distributor for its expenditures in financing any activity primarily intended to result in the sale of each such class of the Fund’s shares and for maintenance and personal service provided to existing shareholders of that class. The Plan authorizes payments to the Distributor up to 0.25% annually of the Fund’s average daily net assets attributable to the Investor Class and Class A shares and 1.00% annually of the Fund’s average daily net assets attributable to Class C shares.
The Plan further provides for periodic payments by the Trust or MDI to brokers, dealers and other financial intermediaries for providing shareholder services and for promotional and other sales related costs. The portion of payments by Investor Class, Class A or Class C shares of a Fund for shareholder servicing may not exceed an annual rate of 0.25% of the average daily net asset value of the Fund’s shares of that class owned by clients of such broker, dealer or financial intermediary.
The Securities and Exchange Commission granted an exemptive order that permits the Funds to lend and borrow money for certain temporary purposes directly to and from other eligible Managers Funds. Participation in this interfund lending program is voluntary for both borrowing and lending funds, and an interfund loan is only made if it benefits each participating fund. The Investment Manager administers the program according to procedures approved by the Board, and the Board monitors the operation of the program. An interfund loan must comply with certain conditions set out in the exemptive order, which are designed to assure fairness and protect all participating Funds. For the fiscal year ended October 31, 2011, the following Funds either borrowed from or lent to other Managers Funds: Tax-Managed borrowed $2,837,591 for 1 day paying interest of $81; U.S. Equity $5,890,395 for 1 day paying interest of $169; Global Alternatives lent varying amounts up to $31,656,778 for 9 days earning interest of $7,240; Global Essentials lent varying amounts up to $4,835,591 for 11 days earning interest of $1,025. The interest amounts can be found in the Statement of Operations in interest income or miscellaneous expense.
| 3. | Purchases and Sales of Securities |
Purchases and sales of investment securities (excluding short-term securities and U.S. Government Obligations) for the fiscal year ended October 31, 2011, were as follows:
| | | | | | | | | | | | | | | | |
| | | Long- Term
Securities | | | U.S. Government
Obligations | |
Fund | | Purchases | | | Sales | | | Purchases | | | Sales | |
Tax-Managed | | $ | 18,581,384 | | | $ | 28,393,378 | | | | N/A | | | | N/A | |
U.S. Equity | | | 71,631,192 | | | | 82,337,709 | | | | N/A | | | | N/A | |
Global Alternatives | | | 14,329,239 | | | | 32,531,066 | | | $ | 179,280,884 | | | $ | 176,340,000 | |
Global Essentials | | | 38,001,568 | | | | 34,775,448 | | | | 44,989,463 | | | | 45,000,000 | |
50
Managers AMG Funds
Notes to Financial Statements (continued)
| 4. | Portfolio Securities Loaned |
For the fiscal year ended October 31, 2011, Tax-Managed, U.S. Equity, and Global Essentials participated in a securities lending program offered by BNYM (the “Program”), providing for the lending of securities to qualified brokers. Securities lending fees include earnings of such temporary cash investments, plus or minus any rebate to a borrower. These earnings (after any rebate) are then divided between BNYM, as a fee for its services under the program, and the Fund, according to agreed-upon rates. Collateral on all securities loaned is accepted in cash and/or government securities and is maintained at a minimum level of 102% (105% in the case of certain foreign securities) of the market value, plus interest, if applicable, of investments on loan. It is the Funds’ policy to obtain additional collateral from or return excess collateral to the borrower by the end of the next business day, following the valuation date of the securities loaned. Therefore, the value of the collateral held may be temporarily less than the value of the securities on loan. Lending securities entails a risk of loss to the Funds if and to the extent that the market value of the securities loaned were to increase and the borrower did not increase the collateral accordingly, and the borrower fails to return the securities. Under the terms of the Program, each Fund is indemnified for such losses by BNYM. Each Fund bears the risk of any deficiency in the amount of the collateral available for return to the borrower due to any loss on the collateral invested. Collateral received in the form of cash is invested temporarily in the BNY Overnight Government Fund, or other short-term investments as defined in the Securities Lending Agreement with BNYM.
Effective August 2, 2010, the Trust, on behalf of each applicable Fund, entered into an agreement with The Bank of New York Mellon and the Bank of New York Mellon Corporation (“BNYMC”) with respect to each Fund’s position in Series B of the BNY Institutional Cash Reserves Fund (the “ ICRF”), pursuant to which (i) BNYMC would support the value of certain defaulted securities issued by Lehman Brothers Holdings, Inc. (the “Lehman Securities”) and held by Series B of the ICRF, and (ii) once certain conditions were met, BNYMC would purchase the defaulted securities from each Fund. On October 17, 2011, after certifying that the Fund had met all necessary conditions, BNYMC purchased the Lehman Securities from each applicable Fund at a predetermined price, which represented a premium over the fair market value of the Lehman Securities at that date.
| 5. | Commitments and Contingencies |
In the normal course of business, the Funds may enter into contracts and agreements that contain a variety of representations and warranties, which provide general indemnifications. The maximum exposure to the Funds under these arrangements is unknown, as this would involve future claims that may be made against a Fund that have not yet occurred. However, the Funds have not had prior claims or losses and expects the risks of material loss to be remote.
Certain transactions, such as futures and forward transactions, dollar roll agreements, or purchases of when-issued or delayed delivery securities may have a similar effect on a Fund’s net asset value as if the Fund had created a degree of leverage in its portfolio. However, if a Fund enters into such a transaction, the Fund will establish a segregated account with its custodian in which it will maintain cash, U.S. government securities or other liquid securities equal in value to its obligations in respect to such transaction. Securities and other assets held in the segregated account may not be sold while the transaction is outstanding, unless other suitable assets are substituted.
The following disclosures contain information on how and why the Funds use derivative instruments, the credit risk and how derivative instruments affect the Funds’ financial position, results of operations and cash fiows. The location and fair value amounts of these instru- ments on the Statement of Assets and Liabilities and the realized and changes in unrealized gains and losses on the Statement of Operations, each categorized by type of derivative contract, are included in a table in the Notes to Schedules of Portfolio Investments. The derivative instruments outstanding as of year end as disclosed in the Statement of Assets and Liabilities and the realized and changes in unrealized gains and losses on derivative instruments during the period as disclosed in the Statement of Operations serve as indicators of the volume of deriva- tive activity for the Funds.
| 8. | Forward Foreign Currency Contracts |
During the fiscal year ended October 31, 2011, Global Alternatives invested in forward foreign currency exchange contracts to facilitate transactions in foreign securities and to hedge against foreign currency exchange rate risk on its non-U.S. dollar denominated investment securities.
A forward foreign currency exchange contract is an agreement between a Fund and another party to buy or sell a currency at a set price at a future date. The market value of the contract will fluctuate with changes in currency exchange rates. The contract is marked-to-market daily, and the change in market value is recorded as an unrealized gain or loss. Gain or loss on the purchase or sale of contracts having the same settlement date, amount and counterparty is realized on the date of offset, otherwise gain or loss is realized on the settlement date.
Risks may arise upon entering into these contracts from the potential inability of counterparties to meet the terms of their contracts and from unanticipated movements in the value of a foreign currency relative to the U.S. dollar.
Managers AMG Funds
Notes to Financial Statements (continued)
U.S. Equity entered into equity index futures contracts with the objective of maintaining exposure to equity stock markets while maintaining liquidity. Global Essentials and Global Alternatives entered into futures contracts, including futures contracts on global equity and fixed-income securities, interest rate futures contracts, foreign currency futures contracts and futures contracts on security indices (including broad-based security indices). The Funds purchased or sold futures contracts to achieve a desired level of investment, whether to accommodate portfolio turnover or cash flows from capital shares transactions. There are certain risks associated with futures contracts. Prices may not move as expected or a Fund may not be able to close out the contract when it desires to do so, resulting in losses.
On entering into a futures contract, either cash or securities in an amount equal to a certain percentage of the contract value (initial margin) must be deposited with the futures broker. Subsequent payments (variation margin) are made or received each day. The variation margin payments equal the daily changes in the contract value and are recorded as unrealized gains or losses. The Funds recognize a realized gain or loss when the contract is closed or expires equal to the difference between the value of the contract at the time it was opened and the value at the time it was closed. Futures are valued at their quoted daily settlement prices. The aggregate principal amounts of the contracts are not recorded in the financial statements. Fluctuations in the value of the contracts are recorded in the Statement of Assets and Liabilities as an asset (liability) and in the Statement of Operations as unrealized appreciation (depreciation) until the contracts are closed, when they are recorded as realized gains (losses) on futures or forward currency contracts.
Global Essentials invests in Exchange Traded Notes (“ETNs”). ETNs are senior, unsecured, unsubordinated debt securities issued by a financial institution, listed on an exchange and traded in the secondary market. There are no periodic interest payments, and principal is not protected. The Fund could lose some or all of theamount invested. The price in the secondary market is determined by supply and demand, the current performance of the index, and the credit rating of the ETN issuer. At maturity, the issuer pays the Fund a return linked to the performance of the market index, such as a commodity index, to which the ETN is linked, minus the issuer’s fee. ETNs are subject to the risk of a breakdown in the futures markets that they use. As a means to obtain commodity exposure, the Fund invests in ETNs linked to commodity indices. The Fund may be exposed to a wide variety of commodity sectors, including, without limitation, agriculture, livestock, base/industrial metals, oil, energy and precious metals. Commodity prices, and the value of stocks of companies exposed to commodities, can be extremely volatile and are affected by a wide range of factors.
| 11. | New Accounting Pronouncement |
In May 2011, the Financial Accounting Standards Board issued Accounting Standards Update (“ASU”) No. 2011-04 “Amendments to Achieve Common Fair Value Measurement and Disclosure Requirements in U.S. GAAP and IFRSs.” ASU No. 2011-04, requires common fair value measurement and disclosure requirements between U.S. GAAP and International Financial Reporting Standards. The new and revised disclosures are effective for interim and annual reporting periods beginning after December 15, 2011. At this time, management is evaluating the implications of ASU No. 2011-04 and its impact on the financial statements.
The Funds have determined that no material events or transactions occurred through the issuance date of the Funds’ financial statements which require additional disclosure in the Funds’ financial statements.
Tax Information (unaudited)
Each Fund hereby designates the maximum amount allowable of its net taxable income as qualified dividends as provided in the Jobs and Growth Tax Relief Reconciliation Act of 2003. The 2011 Form 1099-DIVs you receive for each Fund will show the tax status of all distributions paid to you during the respective calendar year.
Pursuant to section 852 of the Internal Revenue Code, Managers AMG FQ Tax-Managed U.S. Equity Fund, Managers AMG FQ U.S. Equity Fund, Managers AMG FQ Global Alternatives Fund and Managers AMG FQ Global Essentials Fund hereby designate as a capital gain distribution with respect to the taxable year ended October 31, 2011, $0, $0, $0, and $0, respectively, or, if subsequently determined to be different, the net capital gains of such year.
|
| Report of Independent Registered Public Accounting Firm |
To the Board of Trustees of Managers Trust I and the Shareholders of Managers AMG FQ Tax-Managed U.S. Equity Fund, Managers AMG FQ U.S. Equity Fund, Managers AMG FQ Global Alternatives Fund and Managers AMG FQ Global Essentials Fund:
In our opinion, the accompanying statements of assets and liabilities, including the schedules of portfolio investments, of Managers AMG FQ Tax-Managed U.S. Equity Fund and Managers AMG FQ U.S. Equity Fund, the statements of net assets of Managers AMG FQ Global Alternatives Fund and Managers AMG FQ Global Essentials Fund, and the related statements of operations and of changes in net assets and the financial highlights present fairly, in all material respects, the financial position of Managers AMG FQ Tax-Managed U.S. Equity Fund, Managers AMG FQ U.S. Equity Fund, Managers AMG FQ Global Alternatives Fund and Managers AMG FQ Global Essentials Fund (four of the series constituting Managers Trust I, hereafter referred to as the “Funds”) at October 31, 2011, the results of each of their operations for the year then ended, the changes in each of their net assets for each of the two years in the period then ended and the financial highlights for each of the periods indicated, in conformity with accounting principles generally accepted in the United States of America. These financial statements and financial highlights (hereafter referred to as “financial statements”) are the responsibility of the Funds’ management; our responsibility is to express an opinion on these financial statements based on our audits. We conducted our audits of these financial statements in accordance with the standards of the Public Company Accounting Oversight Board (United States). Those standards require that we plan and perform the audits to obtain reasonable assurance about whether the financial statements are free of material misstatement. An audit includes examining, on a test basis, evidence supporting the amounts and disclosures in the financial statements, assessing the accounting principles used and significant estimates made by management, and evaluating the overall financial statement presentation. We believe that our audits, which included confirmation of securities at October 31, 2011 by correspondence with the custodian and brokers, provide a reasonable basis for our opinion.
PricewaterhouseCoopers LLP
Philadelphia, Pennsylvania
December 27, 2011
Trustees and Officers
The Trustees and Officers of the Trust, their business addresses, principal occupations for the past five years and dates of birth are listed below. The Trustees provide broad supervision over the affairs of the Trust and the Funds. The Trustees are experienced executives who meet periodically throughout the year to oversee the Funds’ activities, review contractual arrangements with companies that provide services to the Funds, and review the Funds’ performance. Unless otherwise noted, the address of each Trustee or Officer is the address of the Trust: 800 Connecticut Avenue, Norwalk, Connecticut 06854.
There is no stated term of office for Trustees. Trustees serve until their resignation, retirement or removal in accordance with the Trust’s organizational documents and policies adopted by the Board from time to time. The Chairman of the Trustees, President, Treasurer and Secretary of the Trust are elected by the Trustees annually. Other officers hold office at the pleasure of the Trustees.
Independent Trustees
The following Trustees are not “interested persons” of the Trust within the meaning of the 1940 Act:
| | |
Name, Date of Birth, Number of Funds Overseen in Fund Complex* | | Principal Occupation(s) During Past 5 Years and Other Directorships
Held by Trustee |
Jack W. Aber, 9/9/37 • Trustee since 2000 • Oversees 38 Funds in Fund Complex | | Professor of Finance, Boston University School of Management (1972-Present); Trustee of Appleton Growth Fund (1 portfolio); Trustee of Third Avenue Trust (5 portfolios); Trustee of Third Avenue Variable Trust (13portfolio); Trustee of Aston Funds (26 portfolios). |
| |
William E. Chapman, II, 9/23/41 • Independent Chairman • Trustee since 2000 • Oversees 38 Funds in Fund Complex | | President and Owner, Longboat Retirement Planning Solutions (1998-Present); Hewitt Associates, LLC (part time) (provider of Retirement and Investment Education Seminars) (2002-2009); Trustee of Bowdoin College (2002-Present); Director of Harding, Loevner Funds, Inc. (6 portfolios); Trustee of Third Avenue Trust (5 portfolios); Trustee of Third Avenue Variable Trust (1 portfolio); Trustee of Aston Funds (26 portfolios). |
| |
Edward J. Kaier, 9/23/45 • Trustee since 2000 • Oversees 38 Funds in Fund Complex | | Attorney at Law and Partner, Teeters Harvey Gilboy & Kaier LLP (2007-Present); Attorney at Law and Partner, Hepburn Willcox Hamilton & Putnam, LLP (1977-2007); Trustee of Third Avenue Trust (5 portfolios); Trustee of Third Avenue Variable Trust (1 portfolio); Trustee of Aston Funds (26 portfolios). |
| |
Steven J. Paggioli, 4/3/50 • Trustee since 2000 • Oversees 38 Funds in Fund Complex | | Consultant (2001-Present); Formerly Executive Vice President and Director, The Wadsworth Group (1986- 2001); Executive Vice President, Secretary and Director, Investment Company Administration, LLC (1990-2001); Vice President, Secretary and Director, First Fund Distributors, Inc. (1991-2001); Trustee, Professionally Managed Portfolios (40 portfolios); Advisory Board Member, Sustainable Growth Advisors, LP; Independent Director, Chase Investment Counsel (2008 – Present); Trustee of Aston Funds (26 portfolios). |
| |
Eric Rakowski, 6/5/58 • Trustee since 2000 • Oversees 38 Funds in Fund Complex | | Professor, University of California at Berkeley School of Law (1990-Present); Director of Harding, Loevner Funds, Inc. (6 portfolios); Trustee of Third Avenue Trust (5 portfolios); Trustee of Third Avenue Variable Trust (1 portfolio); Trustee of Aston Funds (26 portfolios). |
| |
Thomas R. Schneeweis, 5/10/47 • Trustee since 2000 • Oversees 38 Funds in Fund Complex | | Professor of Finance, University of Massachusetts (1977-Present); Director, CISDM at the University of Massachusetts, (1996-Present); President, Alternative Investment Analytics, LLC, (formerly Schneeweis Partners, LLC) (2001-Present); Partner, S Capital Management, LLC (2007-Present); Partner, TRS Associates (1982-Present); Trustee of Aston Funds (26 portfolios). |
| * | The Fund Complex consists of Managers AMG Funds, The Managers Funds, Managers Trust I and Managers Trust II. |
Interested Trustees
Each Trustee in the following table is an “interested person” of the Trust within the meaning of the 1940 Act. Mr. Streur is an interested person of the Trust within the meaning of the 1940 Act by virtue of his positions with the Investment Manager and Managers Distributors, Inc. and because of his service as President of the Trust. Ms. Carsman is an interested person of the Trust within the meaning of the 1940 Act by virtue of her position with, and interest in securities of, AMG, and her former position as Chief Legal Officer of the Trust.
| | |
Name, Date of Birth, Number of Funds Overseen in Fund Complex* | | Principal Occupation(s) During Past 5 Years and Other
Directorships Held by Trustee |
John H. Streur, 2/6/60 • Trustee since 2008 • President since 2008 • Oversees 38 Funds in Fund Complex | | Senior Managing Partner, Managers Investment Group LLC (2006-Present); President, Managers Distributors, Inc. (2006-Present); Managing Partner, Managers Investment Group LLC (2005-2006); Chief Executive Officer, President and Chief Operating Officer, The Burridge Group LLC (1996-2004). |
| |
Christine C. Carsman, 4/2/52 • Trustee since 2011 • Oversees 38 Funds in Fund Complex | | Deputy General Counsel, Affiliated Managers Group, Inc. (2011-Present); Senior Vice President and Chief Regulatory Counsel, Affiliated Managers Group, Inc. (2004-Present); Secretary and Chief Legal Officer, Managers AMG Funds, The Managers Funds, Managers Trust I and Managers Trust II (2004-2011); Senior Counsel, Vice President and Director of Operational Risk Management and Compliance, Wellington Management Company, LLP (1995-2004) |
| |
Officers | | |
Name, Date of Birth, Position(s) Held with Fund and Length of Time Served | | Principal Occupation(s) During Past 5 Years |
Lewis Collins, 2/22/66 • Secretary since 2011 • Chief Legal Officer since 2011 | | Senior Counsel, Affiliated Managers Group, Inc. (2002-Present); Senior Vice President, Affiliated Managers Group, Inc. (2010-Present); Vice President, Affiliated Managers Group, Inc. (2006-2010); Director, Affiliated Managers Group, Inc. (2002-2006); Attorney, Ropes & Gray LLP (1998-2002) |
| |
Donald S. Rumery, 5/29/58 • Chief Financial Officer since 2007 • Treasurer since 2000 | | Senior Vice President, Managers Investment Group LLC (2005-Present); Treasurer and Chief Financial Officer, Managers Distributors, Inc. (2000-Present); Treasurer, The Managers Funds (1995-Present); Treasurer, Managers AMG Funds (1999-Present); Treasurer, Managers Trust II (2000-Present); Chief Financial Officer, The Managers Funds, Managers AMG Funds and Managers Trust II (2007-Present); Vice President, The Managers Funds LLC, (1994-2004). |
| |
Keitha L. Kinne, 5/16/58 • Chief Operating Officer since 2007 | | Managing Partner and Chief Operating Officer, Managers Investment Group LLC (2007-Present); Chief Operating Officer, The Managers Funds, Managers AMG Funds and Managers Trust II (2007-Present); Chief Investment Officer, Managers Investment Group LLC (2008-Present); Managing Director, Legg Mason & Co., LLC (2006-2007); Managing Director, Citigroup Asset Management (2004-2006). |
| |
John J. Ferencz, 3/09/62 • Chief Compliance Officer since 2010 | | Vice President, Legal and Compliance, Managers Investment Group LLC (2010-Present); Senior Compliance Analyst, Mutual Funds and Regulatory, GE Asset Management Incorporated (2005-2010). |
| |
Michael S. Ponder, 9/12/73 • Assistant Secretary since 2011 | | Senior Vice President and Counsel, Managers Investment Group LLC (2011-Present); Attorney, DeNovo Legal (2009-2010); Vice President, Credit Suisse (2007-2009); Associate, Willkie Farr & Gallagher LLP (2006-2007) |
54
Annual Renewal of Investment Advisory Agreements
On June 9-10, 2011, the Board of Trustees, including a majority of the Trustees who are not “interested persons” of the Trust (the “Independent Trustees”), approved the Investment Management Agreement with the Investment Manager for each of the Managers AMG FQ U.S. Equity Fund, Managers AMG FQ Tax-Managed U.S. Equity Fund, Managers AMG FQ Global Alternatives Fund and Managers AMG FQ Global Essentials Fund (each a “Fund”) and the Subadvisory Agreement with respect to each Fund. The Independent Trustees were separately represented by independent counsel in connection with their consideration of the approval of these agreements. In considering the Investment Management and Subadvisory Agreements, the Trustees reviewed a variety of materials relating to each Fund, the Investment Manager and the Subadvisor, including comparative performance, fee and expense information for an appropriate peer group of similar mutual funds for each Fund (each a “Peer Group”), performance information for the relevant benchmark index for each Fund (each a “Fund Benchmark”) and, with respect to the Subadvisor, comparative performance information for an appropriate peer group of managed accounts, and, as to all other matters, other information provided to them on a periodic basis throughout the year, as well as information provided in connection with the meetings of June 9-10, 2011, regarding the nature, extent and quality of services provided by the Investment Manager and the Subadvisor under their respective agreements. Prior to voting, the Independent Trustees: (a) reviewed the foregoing information with their independent legal counsel and with management; (b) received materials from their independent legal counsel discussing the legal standards applicable to their consideration of the Investment Management and Subadvisory Agreements; and (c) met with their independent legal counsel in private sessions at which no representatives of management were present.
Nature, extent and quality of services.
In considering the nature, extent and quality of the services provided by the Investment Manager, the Trustees reviewed information relating to the Investment Manager’s operations and personnel. Among other things, the Investment Manager provided financial information, biographical information on its supervisory and professional staff and descriptions of its organizational and management structure. The Trustees also took into account information provided periodically throughout the previous year by the Investment Manager relating to the performance of its duties with respect to the Funds and the Trustees’ familiarity with the Investment Manager’s management through Board meetings, discussions and reports. In the course of their deliberations regarding the Investment Management Agreement, the Trustees evaluated, among other things: (a) the extent and quality of the Investment Manager’s oversight of the operation and management of the Funds; (b) the quality of the Investment Manager’s oversight of the performance by the Subadvisor of its portfolio management duties; (c) the Investment Manager’s ability to supervise the Funds’ other service providers; and (d) the Investment Manager’s compliance programs. The Trustees also took into account the financial condition of the Investment Manager with respect to its ability to provide the services required under the Investment Management Agreement and the Investment Manager’s undertaking to maintain contractual expense limitations for the Funds. The Trustees also considered the Investment Manager’s risk management processes.
The Trustees also reviewed information relating to the Subadvisor’s financial condition, operations and personnel and the investment philosophy, strategies and techniques (its “Investment Strategy”) used in managing each Fund. Among other things, the Trustees reviewed biographical information on portfolio management and other professional staff, information regarding the Subadvisor’s organizational and management structure and the Subadvisor’s brokerage policies and practices. The Trustees considered specific information provided regarding the experience of the individuals at the Subadvisor with portfolio management responsibility for the Funds, including the information set forth in each Fund’s prospectus and statement of additional information. In the course of their deliberations, the Trustees evaluated, among other things: (a) the services rendered by the Subadvisor in the past; (b) the qualifications and experience of the Subadvisor’s personnel; and (c) the Subadvisor’s compliance programs. The Trustees also took into account the financial condition of the Subadvisor with respect to its ability to provide the services required under each Subadvisory Agreement. The Trustees also considered the Subadvisor’s risk management processes.
Performance.
With respect to the Managers AMG FQ U.S. Equity Fund, among other information related to the Fund’s performance, the Trustees noted that the Fund’s performance for Institutional Class shares for the 1-year, 3-year, 5-year and 10-year periods ended March 31, 2011 was above, below, above and above, respectively, the median performance of the Peer Group and above, below, below and below, respectively, the performance of the Fund Benchmark, the Russell 3000® Index. The Trustees took into account management’s discussion of the Fund’s improved more recent performance, noting the Fund’s strong performance in the first quarter of 2011 and that the Fund performed in the top quartile relative to the Peer Group for the 1-year period. The Trustees also noted a recent change to the portfolio management team. The Trustees concluded that the Fund’s overall performance has been satisfactory in light of all factors considered.
With respect to the Managers AMG FQ Tax-Managed U.S. Equity Fund, among other information related to the Fund’s performance, the Trustees noted that the Fund’s performance for Institutional Class shares for the 1-year, 3-year, 5-year and 10-year periods ended March 31, 2011 was above, above, below and above, respectively, the median performance of the Peer Group and above, below, below and above, respectively, the performance of the Fund Benchmark, the Russell 3000® Index. The Trustees also took into account management’s discussion of the Fund’s performance, including the Fund’s improved more recent performance, noting that the Fund performed in the top 5% relative to the Peer Group and has delivered strong returns on both an absolute and relative basis for the 1-year period, and the fact that the Fund’s strong performance over the last 12 months has enhanced the Fund’s 3-year performance record. The Trustees concluded that the Fund’s overall performance has been satisfactory in light of all factors considered.
With respect to the Managers AMG FQ Global Alternatives Fund, among other information related to the Fund’s performance, the Trustees noted that the Fund’s performance for Class A shares for
Annual Renewal of Investment Advisory Agreements (continued)
the 1-year, 3-year and 5-year periods ended March 31, 2011 was below, above and above, respectively, the median performance of the Peer Group and below, above and below, respectively, the performance of the Fund Benchmark, the Citigroup 1-Month T-Bill Index. The Trustees took into account management’s discussion of the Fund’s performance, including its performance over the longer-term. The Trustees also took into account the impact of the Fund’s strategy on performance over the last 12 months and noted the Fund’s recently improved performance. The Trustees concluded that the Fund’s performance has been satisfactory in light of all factors considered.
With respect to the Managers AMG FQ Global Essentials Fund, among other information related to the Fund’s performance, the Trustees noted that the Fund’s performance for Institutional Class shares for the 1-year, 3-year, 5-year and 10-year periods ended March 31, 2011 was below the median performance of the Peer Group and above, below, below and above, respectively, the performance of the Fund Benchmark, a Composite Index (60% MSCI World Index and 40% Citigroup World Government Bond Index (Hedged)). The Trustees took into account management’s discussion of the Fund’s more recent performance, including the fact that the Fund had strong performance relative to the Fund Benchmark during the past year. The Trustees further noted that in September 2009 the Fund transformed into a single subadvisor portfolio managed by the Subadvisor using a new investment strategy and that performance prior to that time reflects returns generated by the previous multi-manager structure. The Trustees also took into account management’s discussion of the Fund’s performance. The Trustees concluded that the Fund’s performance has been satisfactory in light of all factors considered.
As noted above, the Board considered each Fund’s net performance during relevant time periods as compared to the Fund’s Peer Group and Fund Benchmark and considered the Subadvisor’s performance as compared to an appropriate peer group of managed accounts and also considered the gross performance of the Fund as compared to the Subadvisor’s relevant performance composite that utilizes the same investment strategy and approach and noted that the Board reviews on a quarterly basis detailed information about each Fund’s performance results and portfolio composition as well as the Subadvisor’s Investment Strategy. The Board noted the Investment Manager’s expertise and resources in monitoring the performance, investment style and risk-adjusted performance of the Subadvisor. The Board was mindful of the Investment Manager’s attention to monitoring the Subadvisor’s performance with respect to the Funds and its discussions with management regarding the factors that contributed to the performance of the Funds.
Advisory and Subadvisory Fees and Profitability.
In considering the reasonableness of the advisory fee payable to the Investment Manager and the subadvisory fee payable by the Investment Manager to the Subadvisor, the Trustees reviewed information provided by the Investment Manager setting forth all revenues and other benefits, both direct and indirect (including any so-called
“fallout benefits” such as reputational value derived from the Investment Manager serving as Investment Manager to a Fund), received by the Investment Manager and its affiliates attributable to managing each Fund and all the mutual funds in the Managers Family of Funds, the cost of providing such services and the resulting profitability to the Investment Manager and its affiliates from these relationships. The Trustees noted that the Investment Manager and the Subadvisor are affiliated and that, in the case of the Managers AMG FQ Tax-Managed U.S. Equity Fund and the Managers AMG FQ U.S. Equity Fund, the Investment Manager pays the Subadvisor a subadvisory fee that is equal to the advisory fee that it receives from the Fund. The Trustees also noted management’s discussion of the current asset levels of the Funds, including the effect on assets attributable to the economic and market conditions since 2008, and considered the impact on profitability of the current asset levels and any future growth of assets of the Funds.
In considering the cost of services to be provided by the Investment Manager under the Investment Management Agreement and the profitability to the Investment Manager of its relationship with the Funds, the Trustees noted the current asset level of the Funds and the undertaking by the Investment Manager to maintain contractual expense limitations for the Funds. The Board also took into account management’s discussion of the current advisory fee structure. Based on the foregoing, the Trustees concluded that the profitability to the Investment Manager is reasonable and that the Investment Manager is not realizing material benefits from economies of scale that would warrant adjustments to the advisory fee at this time. Also with respect to economies of scale, the Trustees noted that as a Fund’s assets increase over time, the Fund may realize other economies of scale to the extent the increase in assets is proportionally greater than the increase in certain other expenses.
In considering the reasonableness of the subadvisory fees payable by the Investment Manager to the Subadvisor, the Trustees reviewed information provided by the Subadvisor regarding the cost of providing subadvisory services to each of the Funds and the resulting profitability to the Subadvisor from these relationships and noted that, because the Subadvisor is an affiliate of the Investment Manager, such profitability might be directly or indirectly shared by the Investment Manager.
In considering the cost of services to be provided by the Subadvisor under the Subadvisory Agreements and the profitability to the Subadvisor of its relationship with the Funds, the Trustees noted the current asset level of each Fund and the undertaking by the Investment Manager to maintain contractual expense limitations for the Funds. The Trustees also noted that the subadvisory fees are paid by the Investment Manager out of its advisory fee. As a consequence, the cost of services to be provided by the Subadvisor and the profitability to the Subadvisor of its relationship with each Fund were not material factors in the Trustees’ deliberations at this time. For similar reasons, the Trustees did not consider potential economies of scale in the management of the Funds by the Subadvisor to be a material factor in their considerations at this time.
Annual Renewal of Investment Advisory Agreements (continued)
With respect to the Managers AMG FQ U.S. Equity Fund, the Trustees noted that the Fund’s advisory fees (which include both the advisory and administration fee) and total expenses (net of applicable expense waivers/reimbursements) as of March 31, 2011 were both lower than the average for the Fund’s Peer Group. The Trustees took into account the fact that the Investment Manager has contractually agreed, through March 1, 2012, to limit the Fund’s net annual operating expenses (subject to certain excluded expenses) to 1.04%, 1.79% and 0.79% for Class A shares, Class C shares and Institutional Class shares, respectively. The Trustees concluded that, in light of the nature, extent and quality of the services provided by the Investment Manager and the Subadvisor, the foregoing expense limitation and the considerations noted above with respect to the Subadvisor and the Investment Manager, the Fund’s advisory fees, including subadvisory fees, are reasonable.
With respect to the Managers AMG FQ Tax-Managed U.S. Equity Fund, the Trustees noted that the Fund’s advisory fee and total expenses (net of applicable expense waivers/reimbursements) as of March 31, 2011 were higher and lower, respectively, than the average for the Fund’s Peer Group. The Trustees took into account the fact that the Investment Manager has contractually agreed, through March 1, 2012, to limit the Fund’s net annual operating expenses (subject to certain excluded expenses) to 1.24%, 1.99% and 0.99% for Class A shares, Class C shares and Institutional Class shares, respectively. The Board also took into account management’s discussion of the Fund’s expenses and the current size of the Fund. The Board also considered the differences in the Fund’s investment strategy relative to its Peer Group. The Trustees concluded that, in light of the nature, extent and quality of the services provided by the Investment Manager and the Subadvisor, the foregoing expense limitation and the considerations noted above with respect to the Subadvisor and the Investment Manager, the Fund’s advisory fees, including subadvisory fees, are reasonable.
With respect to the Managers AMG FQ Global Alternatives Fund, the Trustees noted that the Fund’s advisory fees (which include both the advisory and administration fee) and total expenses (net of applicable expense waivers/reimbursements) as of March 31, 2011 were both higher than the average for the Fund’s Peer Group. In this regard, the Trustees noted that because of the Investment Strategy of the Fund, the Peer Group contains a small group of funds, some of which pursue an investment strategy different from that of the Fund. The Trustees took into account the fact that the Investment Manager has contractually agreed, through at least March 1, 2012, to limit the Fund’s net annual operating expenses (subject to certain excluded expenses) to 1.49%. The Trustees took into account management’s discussion of the Fund’s expenses. The Trustees concluded that, in light of the nature, extent and quality of the services to be provided by the Investment Manager and the Subadvisor, the foregoing expense limitation and the considerations noted above with respect to the Subadvisor and the Investment Manager, the Fund’s advisory fees, including subadvisory fees, are reasonable.
With respect to the Managers AMG FQ Global Essentials Fund, the Trustees noted that the Fund’s advisory fees (which include both the advisory and administration fee) and total expenses (net of applicable expense waivers/reimbursements) as of March 31, 2011 were both lower than the average for the Fund’s Peer Group. The Trustees took into account the fact that the Investment Manager has contractually agreed, through March 1, 2012, to limit the Fund’s net annual operating expenses (subject to certain excluded expenses) to 0.99%. The Trustees concluded that, in light of the nature, extent and quality of the services provided by the Investment Manager and the Subadvisor, the foregoing expense limitation and the considerations noted above with respect to the Subadvisor and the Investment Manager, the Fund’s advisory fees, including subadvisory fees, are reasonable.
* * * *
After consideration of the foregoing, the Trustees also reached the following conclusions (in addition to the conclusions discussed above) regarding the Investment Management and Subadvisory Agreements: (a) the Investment Manager has demonstrated that it possesses the resources and capability to perform its duties under the Investment Management Agreement; (b) the Subadvisor has the resources to perform its duties under the Subadvisory Agreements and is qualified to manage each Fund’s assets in accordance with its investment objectives and policies; and (c) the Investment Manager and Subadvisor maintain appropriate compliance programs.
Based on all of the above-mentioned factors and their related conclusions, with no single factor or conclusion being determinative and with each Trustee not necessarily attributing the same weight to each factor, the Trustees concluded that approval of the Investment Management Agreement and each Subadvisory Agreement would be in the best interests of the applicable Fund and its shareholders. Accordingly, on June 9-10, 2011, the Trustees, including a majority of the Independent Trustees, voted to approve the Investment Management Agreement and the Subadvisory Agreements (as applicable) for each Fund.
THIS PAGE INTENTIONALLY LEFT BLANK
THIS PAGE INTENTIONALLY LEFT BLANK
Investment Manager and Administrator
Managers Investment Group
LLC 333 W. Wacker Drive
Suite 1200
Chicago, IL 60606
(800) 835-3879
Distributor
Managers Distributors, Inc.
333 W. Wacker Drive
Suite 1200
Chicago, IL 60606
(800) 835-3879
Subadvisor
First Quadrant, L.P.
800 E. Colorado Boulevard, Suite 900
Pasadena, CA 91101
Custodian
The Bank of New York Mellon
2 Hanson Place
Brooklyn, NY 11217
Legal Counsel
Ropes & Gray LLP
Prudential Tower, 800 Boylston Street
Boston, MA 02199-3600
Transfer Agent
BNY Mellon Investment Servicing (US) Inc.*
Attn: Managers
P.O. Box 9769
Providence, RI 02940
(800) 548-4539
For Managers Choice Only
Managers
c/o BNY Mellon Investment Servicing (US) Inc.*
P.O. Box 9847
Providence, RI 02940-8047
(800) 358-7668
| * | Formerly PNC Global Investment Servicing (U.S.) Inc. |

MANAGERSAND MANAGERS AMG FUNDS
| | | | | | |
EQUITY FUNDS | | | | BALANCED FUNDS |
CADENCE CAPITAL APPRECIATION CADENCE FOCUSED GROWTH CADENCE MID-CAP CADENCE EMERGING COMPANIES Cadence Capital Management, LLC CHICAGO EQUITY PARTNERS MID-CAP Chicago Equity Partners, LLC EMERGING MARKETS EQUITY Rexiter Capital Management Limited Schroder Investment Management North America Inc. ESSEX SMALL/MICRO CAP GROWTH Essex Investment Management Co., LLC FQ TAX-MANAGED U.S. EQUITY FQ U.S. EQUITY First Quadrant, L.P. FRONTIER SMALL CAP GROWTH Frontier Capital Management Company, LLC GW&K SMALL CAP EQUITY Gannett Welsh & Kotler, LLC MICRO-CAP Lord, Abbett & Co. LLC WEDGE Capital Management L.L.P. Next Century Growth Investors LLC RBC Global Asset Management (U.S.) Inc. | | INTERNATIONAL EQUITY AllianceBernstein L.P. Lazard Asset Management, LLC Martin Currie Inc. REAL ESTATE SECURITIES Urdang Securities Management, Inc. RENAISSANCE LARGE CAP GROWTH Renaissance Group LLC SKYLINE SPECIAL EQUITIES PORTFOLIO Skyline Asset Management, L.P. SPECIAL EQUITY Ranger Investment Management, L.P. Lord, Abbett & Co. LLC Smith Asset Management Group, L.P. Federated MDTA LLC SYSTEMATIC VALUE SYSTEMATIC MID CAP VALUE Systematic Financial Management, L.P. TIMESSQUARE MID CAP GROWTH TIMESSQUARE SMALL CAP GROWTH TSCM GROWTH EQUITY TimesSquare Capital Management, LLC TRILOGY GLOBAL EQUITY TRILOGY EMERGING MARKETS EQUITY TRILOGY INTERNATIONAL SMALL CAP Trilogy Global Advisors, L.P. | | | | CHICAGO EQUITY PARTNERS BALANCED Chicago Equity Partners, LLC ALTERNATIVE FUNDS FQ GLOBAL ALTERNATIVES FQ GLOBAL ESSENTIALS First Quadrant, L.P. INCOME FUNDS BOND (MANAGERS) FIXED INCOME GLOBAL BOND Loomis, Sayles & Co., L.P. BOND (MANAGERS PIMCO) Pacific Investment Management Co. LLC CALIFORNIA INTERMEDIATE TAX-FREE Miller Tabak Asset Management LLC GW&K MUNICIPAL BOND GW&K MUNICIPAL ENHANCED YIELD Gannett Welsh & Kotler, LLC HIGH YIELD J.P. Morgan Investment Management LLC INTERMEDIATE DURATION GOVERNMENT SHORT DURATION GOVERNMENT Smith Breeden Associates, Inc. |
| | |
This report is prepared for the Funds’ shareholders. It is authorized for distribution to prospective investors only when preceded or accompanied by an effective prospectus. To receive a free copy of the prospectus or Statement of Additional Information, which includes additional information about Fund Trustees, please contact us by calling 800.835.3879. Distributed by Managers Distributors, Inc., member FINRA. A description of the policies and procedures each Fund uses to vote its proxies is available: (i) without charge, upon request, by calling 800.835.3879, or (ii) on the Securities and Exchange Commission’s (SEC) Web site at www.sec.gov. For information regarding each Fund’s proxy voting record for the 12-month period ended June 30, call 800.835.3879 or visit the SEC Web site at www.sec.gov. The Funds file their complete schedule of portfolio holdings with the SEC for the first and third quarters of each fiscal year on Form N-Q. The Funds’ Forms N-Q are available on the SEC’s website at www.sec.gov. A Fund’s Forms N-Q may be reviewed and copied at the SEC’s Public Reference Room in Washington, DC. Information on the operation of the Public Reference Room may be obtained by calling 800.SEC.0330. To review a complete list of the Funds’ portfolio holdings, or to view the most recent quarterly holdings report, semiannual report, or annual report, please visit www.managersinvest.com. | |  |
www.managersinvest.com

Managers Funds
Annual Report — October 31, 2011
| | | | |
TABLE OF CONTENTS | | Page | |
| |
LETTER TO SHAREHOLDERS | | | 1 | |
| |
ABOUT YOUR FUND’S EXPENSES | | | 4 | |
| |
INVESTMENT MANAGERS’ COMMENTS, FUND SNAPSHOTS, AND SCHEDULES OF PORTFOLIO INVESTMENTS | | | | |
Managers Frontier Small Cap Growth Fund | | | 5 | |
Managers AMG TSCM Growth Equity Fund | | | 11 | |
Managers Micro-Cap Fund | | | 17 | |
Managers Real Estate Securities Fund | | | 26 | |
Managers California Intermediate Tax-Free Fund | | | 30 | |
| |
NOTES TO SCHEDULES OF PORTFOLIO INVESTMENTS | | | 39 | |
| |
FINANCIAL STATEMENTS: | | | | |
| |
Statements of Assets and Liabilities | | | 41 | |
Funds’ balance sheets, net asset value (NAV) per share computations and cumulative undistributed amounts | | | | |
| |
Statements of Operations | | | 43 | |
Detail of sources of income, Fund expenses, and realized and unrealized gains (losses) during the fiscal year | | | | |
| |
Statements of Changes in Net Assets | | | 44 | |
Detail of changes in Fund assets for the past two fiscal years | | | | |
| |
FINANCIAL HIGHLIGHTS | | | 46 | |
Historical net asset values per share, distributions, total returns, expense ratios, turnover ratios and net assets | | | | |
| |
NOTES TO FINANCIAL STATEMENTS | | | 53 | |
Accounting and distribution policies, details of agreements and transactions with Fund management and affiliates, and descriptions of certain investment risks | | | | |
| |
REPORT OF INDEPENDENT REGISTERED PUBLIC ACCOUNTING FIRM | | | 61 | |
| |
TRUSTEES AND OFFICERS | | | 62 | |
| |
ANNUAL RENEWAL OF INVESTMENT ADVISORY AGREEMENTS | | | 63 | |
Nothing contained herein is to be considered an offer, sale or solicitation of an offer to buy shares of any series of the Managers Family of Funds. Such offering is made only by Prospectus, which includes details as to offering price and other material information.
Letter to Shareholders
Dear Shareholder:
Our foremost goal at Managers Investment Group (“MIG”) is to structure and manage mutual funds that will help our shareholders and clients successfully reach their investment goals and objectives.
Each of our Funds is geared to provide you with exposure to a specific asset class or style of investing. We believe investors tend to use our Funds as part of their broader portfolio in order to tailor their asset allocation to meet their individual needs. Most of our Funds, like those detailed in this report, are therefore designed to be building blocks.
At MIG, we have overall responsibility for the investment management and administration of the Funds. As a “manager of managers,” we work with external investment managers that make the day-to-day investment decisions in the Funds (the “Portfolio Managers”). We devote considerable resources to our disciplined process of identifying and selecting unaffiliated Portfolio Managers for the Funds. As a manager of managers, MIG performs many activities to monitor the ongoing investment, compliance, and administrative aspects of all of the Funds, which we believe gives our shareholders added confidence in their investments.
Our parent company, Affiliated Managers Group (“AMG”), is a global asset management company with ownership interests in a diverse group of boutique investment management firms (its “Affiliates”). MIG has the unique opportunity to access the investment skills and acumen of some of AMG’s Affiliates. The set of our Funds managed by these proprietary firms also benefits from our activities to monitor the investment, compliance, and administrative aspects of the Funds.
Below is a brief overview of the securities markets and the performance results for the Funds. Following this letter, we also provide the Portfolio Managers’ discussion of their investment management approach, performance results, and market outlook.
Both global equities and bonds posted solid gains for the prior 12 months despite several significant macroeconomic headwinds that have threatened to pull the global economy into another recession. At the start of this period, investors largely ignored significant events such as the Arab Spring and the devastating effects of the Japanese earthquake and its aftermath and risk-based assets generally outperformed during this period. The mood changed, however, heading into the summer months as the stalemate in Washington around the U.S. debt ceiling along with increasing fears about European sovereign debt contagion created considerable angst amongst investors who quickly fled risk-based assets and sought the safety of U.S. Treasuries and other assets perceived as higher quality. This reversed, somewhat, in October as risk aversion began to ease across global markets amid optimism that the European debt crisis could be contained.
Against this backdrop, the Managers Frontier Small Cap Growth Fund, Managers AMG TSCM Growth Equity Fund, Managers Micro-Cap Fund, Managers Real Estate Securities Fund, and the Managers California Intermediate Tax-Free Fund (each a “Fund” and collectively the
1
Letter to Shareholders (continued)
“Funds”), generally posted solid absolute returns, as detailed below. Please note that some funds have multiple share classes, and for these funds the performance shown only reflects the share class indicated.
| | | | | | | | | | | | | | | | | | | | | | | | | | | | |
| Periods Ended 10/31/11 | | 6 Months | | | 1 Year | | | 3 Years | | | 5 Years | | | 10 Years | | | Since
Inception | | | Inception
Date | |
Managers Frontier Small Cap Growth Fund -Service Class | | | (15.36 | )% | | | 7.48 | % | | | 15.41 | % | | | 3.04 | % | | | 4.93 | % | | | 5.91 | % | | | 9/24/1997 | |
Russell 2000® Growth Index | | | (13.56 | )% | | | 9.84 | % | | | 16.31 | % | | | 2.68 | % | | | 6.04 | % | | | 2.82 | % | | | | |
Managers Frontier Small Cap Growth Fund -Investor Class | | | (15.53 | )% | | | 7.19 | % | | | — | | | | — | | | | — | | | | 11.61 | % | | | 1/1/2010 | |
Managers Frontier Small Cap Growth Fund -Institutional Class | | | (15.31 | )% | | | 7.71 | % | | | — | | | | — | | | | — | | | | 12.05 | % | | | 1/1/2010 | |
Russell 2000® Growth Index | | | (13.56 | )% | | | 9.84 | % | | | — | | | | — | | | | — | | | | 26.28 | % | | | | |
Managers AMG TSCM Growth Equity Fund -Investor Class | | | (12.95 | )% | | | 0.84 | % | | | — | | | | — | | | | — | | | | 8.06 | % | | | 7/30/2010 | |
Managers AMG TSCM Growth Equity Fund -Service Class | | | (12.93 | )% | | | 1.55 | % | | | — | | | | — | | | | — | | | | 8.75 | % | | | 7/30/2010 | |
Managers AMG TSCM Growth Equity Fund -Institutional Class | | | (12.83 | )% | | | 1.23 | % | | | — | | | | — | | | | — | | | | 8.47 | % | | | 7/30/2010 | |
Russell 3000® Growth Index | | | (6.67 | )% | | | 9.92 | % | | | — | | | | — | | | | — | | | | 16.76 | % | | | | |
Managers Micro-Cap Fund - Service Class | | | (13.08 | )% | | | 7.78 | % | | | 15.01 | % | | | 2.32 | % | | | 4.36 | % | | | 12.37 | % | | | 6/30/1994 | |
Russell Microcap® Index | | | (16.68 | )% | | | 2.11 | % | | | 10.29 | % | | | (3.07 | )% | | | 6.03 | % | | | — | | | | | |
Managers Micro-Cap Fund - Institutional Class | | | — | | | | — | | | | — | | | | — | | | | — | | | | 16.18 | % | | | 10/1/2011 | |
Russell Microcap® Index | | | — | | | | — | | | | — | | | | — | | | | — | | | | 13.34 | % | | | | |
Managers Real Estate Securities Fund | | | (4.43 | )% | | | 11.06 | % | | | 19.28 | % | | | 1.13 | % | | | 11.77 | % | | | 8.31 | % | | | 12/31/1997 | |
Dow Jones U.S. Select REIT Index | | | (3.79 | )% | | | 11.67 | % | | | 16.68 | % | | | (1.69 | )% | | | 10.98 | % | | | 8.52 | % | | | | |
Managers California Intermediate Tax-Free Fund | | | 4.00 | % | | | 3.27 | % | | | 6.19 | % | | | 3.75 | % | | | 4.03 | % | | | 5.16 | % | | | 11/16/1990 | |
Barclays Capital U.S. Municipal Bond: 5 Year Index | | | 2.76 | % | | | 3.04 | % | | | 6.51 | % | | | 5.32 | % | | | 4.53 | % | | | — | | | | | |
For the 12 months ended October 31, 2011, the Managers Frontier Small Cap Growth Fund Service Share Class returned 7.48%, compared to 9.84% for the Russell 2000® Growth Index. The Fund’s underperformance can be primarily attributed to its growth-at-a-reasonable-price investment approach and weak stock performance. Frontier has historically emphasized valuation when identifying attractive growth candidates. Over the last 12 months small-cap value stocks lagged growth stocks, so Frontier’s emphasis on valuation created a headwind. From a stock selection perspective, performance within the financials and health care sectors detracted the most.
For the 12 months ended October 31, 2011, the Managers AMG TSCM Growth Equity Fund Institutional Share Class returned 1.23%, while its benchmark, the Russell 3000® Growth Index returned 9.92%. The primary driver of the Fund’s underperformance was weak stock selection. Specifically, the Fund’s investments
2
Letter to Shareholders (continued)
in consumer discretionary, financials and industrials were the worst performers. An overweight to the industrials sector along with an underweight to consumer staples also negatively impacted results. It is important to note that the Fund’s sector weights are solely a function of TimesSquare’s bottom-up investment approach. Positive stock selection within materials and telecomm helped offset underperformance.
For the 12 months ended October 31, 2011, the Managers Micro-Cap Fund (Service Class) returned 7.78% compared with 2.11% for its benchmark, the Russell Microcap® Index. Performance continues to remain strong relative to the Index since the Fund was converted to a multi-manager, multi-style approach in early 2008. Solid outperformance for the Fund over the last year has been driven by all four of the Fund’s subadvisors. A majority of the outperformance was driven by solid stock selection across a number of sectors led by holdings within the consumer discretionary and financials sectors. On September 30, 2011 the Managers Micro-Cap Fund and the Managers Institutional Micro-Cap Fund merged and their investment capital was pooled into a single fund offering multiple share classes that we believe could be beneficial to shareholders of both Funds because it could produce economies of scale and other efficiencies.
For the 12 months ended October 31, 2011, the Managers Real Estate Securities Fund returned 11.06%, while the benchmark, the Dow Jones U.S. Select REIT Index, returned 11.67%. During this period, the Fund’s modest underperformance was primarily a result of stock selection within hotels, self-storage and specialty real estate stocks. Underperformance in these sectors was mostly offset with good stock selection in the residential and office sectors. A conservative positioning with an over allocation to sectors such as health care and net lease helped to buoy returns when the market turned sharply lower during the third quarter.
For the 12 months ended October 31, 2011, the Managers California Intermediate Tax-Free Fund returned 3.27%, compared to 3.04% for the Barclays Capital 5-Year Municipal Bond Index. The Fund’s outperformance can be primarily attributed to the Fund’s longer duration positioning relative to the Index. The Fund’s allocation to longer-dated maturities relative to the Index along with a bias towards general obligation bonds and essential purpose revenue bonds was also modestly beneficial. Conservative investors fleeing the riskier equity and commodity markets sought the relative safety of these higher-quality bonds.
The following report covers the one-year period ended October 31, 2011. Should you have any questions about this report, or if you’d like to receive a prospectus and additional information, including fees and expenses for these or any of the other Funds in our family, please feel free to contact us at 1-800-835-3879, or visit our Web site at www.managersinvest.com. As always, please read the prospectus carefully before you invest or send money.
You can rest assured that under all market conditions our team is focused on delivering excellent investment management services for your benefit.
We thank you for your continued confidence and investment in The Managers Funds.
Respectfully,
John H. Streur
Senior Managing Partner
Managers Investment Group LLC
3
|
| About Your Fund’s Expenses |
As a shareholder of a Fund, you may incur two types of costs: (1) transaction costs, which may include sales charges (loads) on purchase payments; redemption fees; and exchange fees; and (2) ongoing costs, including management fees; distribution (12b-l) fees; and other Fund expenses. This example is intended to help you understand your ongoing costs (in dollars) of investing in the Fund and to compare these costs with the ongoing costs of investing in other mutual funds. The example is based on $1,000 invested at the beginning of the period and held for the entire period as indicated below.
Actual Expenses
The first line of the following table provides information about the actual account values and actual expenses. You may use the information in this line, together with the amount you invested, to estimate the expenses that you paid over the period. Simply divide your account value by $1,000 (for example, an $8,600 account value divided by $1,000 = 8.6), then multiply the result by the number in the first line under the heading entitled “Expenses Paid During Period” to estimate the expenses you paid on your account during this period.
Hypothetical Example for Comparison Purposes
The second line of the following table provides information about hypothetical account values and hypothetical expenses based on the Fund’s actual expense ratio and an assumed annual rate of return of 5% before expenses, which is not the Fund’s actual return. The hypothetical account values and expenses may not be used to estimate the actual ending account balance or expenses you paid for the period. You may use this information to compare the ongoing costs of investing in the Fund and other funds by comparing this 5% hypothetical example with the 5% hypothetical examples that appear in the shareholder reports of other funds.
Please note that the expenses shown in the table are meant to highlight your ongoing costs only and do not reflect any transactional costs, such as sales charges (loads), redemption fees, or exchange fees. Therefore, the second line of the table is useful in comparing ongoing costs only, and will not help you determine the relative total costs of owning different funds.
| | | | | | | | | | | | | | | | |
Six Months Ended October 31, 2011 | | Expense
Ratio for
the Period | | | Beginning
Account Value
05/01/2011 | | | Ending
Account Value
10/31/2011 | | | Expenses Paid
During the
Period* | |
Managers Frontier Small Cap Growth Fund | | | | | | | | | | | | | | | | |
Investor Class | | | | | | | | | | | | | | | | |
Based on Actual Fund Return | | | 1.55 | % | | $ | 1,000 | | | $ | 845 | | | $ | 7.21 | |
Based on Hypothetical 5% Annual Return | | | 1.55 | % | | $ | 1,000 | | | $ | 1,017 | | | $ | 7.88 | |
Service Class | | | | | | | | | | | | | | | | |
Based on Actual Fund Return | | | 1.30 | % | | $ | 1,000 | | | $ | 846 | | | $ | 6.05 | |
Based on Hypothetical 5% Annual Return | | | 1.30 | % | | $ | 1,000 | | | $ | 1,019 | | | $ | 6.61 | |
Institutional Class | | | | | | | | | | | | | | | | |
Based on Actual Fund Return | | | 1.05 | % | | $ | 1,000 | | | $ | 847 | | | $ | 4.89 | |
Based on Hypothetical 5% Annual Return | | | 1.05 | % | | $ | 1,000 | | | $ | 1,020 | | | $ | 5.35 | |
Managers AMG TSCM Growth Equity Fund | | | | | | | | | | | | | | | | |
Investor Class | | | | | | | | | | | | | | | | |
Based on Actual Fund Return | | | 1.19 | % | | $ | 1,000 | | | $ | 871 | | | $ | 5.61 | |
Based on Hypothetical 5% Annual Return | | | 1.19 | % | | $ | 1,000 | | | $ | 1,019 | | | $ | 6.06 | |
Service Class | | | | | | | | | | | | | | | | |
Based on Actual Fund Return | | | 1.04 | % | | $ | 1,000 | | | $ | 871 | | | $ | 4.90 | |
Based on Hypothetical 5% Annual Return | | | 1.04 | % | | $ | 1,000 | | | $ | 1,020 | | | $ | 5.30 | |
Institutional Class | | | | | | | | | | | | | | | | |
Based on Actual Fund Return | | | 0.79 | % | | $ | 1,000 | | | $ | 872 | | | $ | 3.73 | |
Based on Hypothetical 5% Annual Return | | | 0.79 | % | | $ | 1,000 | | | $ | 1,021 | | | $ | 4.02 | |
Managers Micro-Cap Fund | | | | | | | | | | | | | | | | |
Service Class | | | | | | | | | | | | | | | | |
Based on Actual Fund Return | | | 1.43 | % | | $ | 1,000 | | | $ | 869 | | | $ | 6.74 | |
Based on Hypothetical 5% Annual Return | | | 1.43 | % | | $ | 1,000 | | | $ | 1,018 | | | $ | 7.27 | |
Institutional Class | | | | | | | | | | | | | | | | |
Based on Actual Fund Return1 | | | 1.18 | % | | $ | 1,000 | | | $ | 1,162 | | | $ | 1.08 | |
Based on Hypothetical 5% Annual Return | | | 1.18 | % | | $ | 1,000 | | | $ | 1,019 | | | $ | 6.01 | |
Managers Real Estate Securities Fund | | | | | | | | | | | | | | | | |
Based on Actual Fund Return | | | 1.35 | % | | $ | 1,000 | | | $ | 956 | | | $ | 6.65 | |
Based on Hypothetical 5% Annual Return | | | 1.35 | % | | $ | 1,000 | | | $ | 1,018 | | | $ | 6.87 | |
Managers California Intermediate Tax-Free Fund | | | | | | | | | | | | | | | | |
Based on Actual Fund Return | | | 0.55 | % | | $ | 1,000 | | | $ | 1,040 | | | $ | 2.83 | |
Based on Hypothetical 5% Annual Return | | | 0.55 | % | | $ | 1,000 | | | $ | 1,022 | | | $ | 2.80 | |
| * | Expenses are equal to the Fund’s annualized expense ratio multiplied by the average account value over the period, multiplied by the number of days in the most recent fiscal half-year (184), then divided by 365. |
| 1 | Commenced operations on October 1, 2011, and as such, the expenses are equal to the Fund’s annualized expense ratio multiplied by the average account value over the period, multiplied by the number of days in the most recent fiscal period (31), then divided by 365. |
Managers Frontier Small Cap Growth Fund
Portfolio Manager’s Comments
The Portfolio Manager
Frontier Capital Management Co. LLC (“Frontier”) manages client assets in small-, small/mid-, mid- and large-cap U.S. equity strategies. The Managers Frontier Small Cap Growth Fund follows a small-cap growth discipline as Frontier implements its “GARP” investment approach to select attractive small-cap stocks.
Frontier believes:
| | • | | Fundamental research is the cornerstone to adding value |
| | • | | Stock prices ultimately are linked to sales and earnings growth |
| | • | | Growth must be purchased at a reasonable price |
| | • | | Research is a continuous process |
Frontier utilizes and draws support from its entire team of 19 investment professionals to identify opportunities and conduct fundamental research. Through fundamental bottom-up research, Frontier seeks long-term capital appreciation by investing in small-capitalization companies that it believes have above-average earnings growth potential and are available at reasonable valuations.
Frontier looks for companies it believes can generate long-term, sustainable earnings, managed by qualified professionals capable of executing a well-conceived strategic plan. Frontier seeks businesses that can generate superior rates of return on capital in excess of their cost of capital over a business cycle due to above-average secular growth prospects or a competitive advantage.
The Year in Review
For the fiscal year ended October 31, 2011, the Managers Frontier Small Cap Growth Fund (Service Class Shares) (the “Fund”) returned 7.48%, underperforming the Russell 2000® Growth Index, which returned 9.84%.
U.S. equities finished the twelve months ending October 31 with positive returns across the market cap spectrum. Small caps slightly underperformed relative to large caps. The small cap Russell 2000® rose 6.7% versus the 8.0% gain of the large cap Russell 1000®. From a style perspective, the Russell 2000® Growth, up 9.8%, outperformed the 3.5% return of the Russell 2000® Value Index.
The fiscal year ended on a strong note in October. After a severe third quarter decline, stocks rallied sharply in October on optimism for plans to address the Eurozone financial crisis and on better than feared U.S. economic reports. While the headlines surrounding the Eurozone financial crisis seem to be driving the equity markets, economic data points continue to reflect modest expansion in the U.S. Real GDP grew at a 2.5% annual rate in the third quarter, finally eclipsing its pre-recession peak and accelerating from the 0.4% and 1.3% growth rates of the first and second quarter of the year. Consumer spending, which accounts for 70% of economic activity, rose at a 2.4% pace in the third quarter, well above the second quarter’s 0.7% rate despite plunging consumer confidence. Businesses appear more willing to invest, a good sign for future growth, as overall business investment rose at a robust 16.3% clip during the quarter. This is the fastest growth in more than a year and was driven by higher outlays for equipment and software. While the Institute for Supply Management’s manufacturing index dipped in October, signaling slower growth, the new orders component improved for the first time in four months. The services index came in slightly below economists’ consensus expectation, but as with the manufacturing index, the details in the components of the index were better than the headline, including a healthy gain in employment.
The Fund’s underperformance relative to the Russell 2000® Growth is primarily due to our sector results in financial services and health care. Within financial services, a sector where we are approximately equally weighted to the Index, our -2% return substantially lagged the 12% gain of the Index. Our underperformance was primarily driven by securities brokerage and services company Jefferies Group, Inc. Jefferies Group, Inc. was down 44% for the trailing one-year period and detracted approximately 0.9% from the Portfolio’s contribution to return. Increased regulation, higher capital requirements, market volatility, Eurozone financial contagion concerns and anemic trading volumes all impacted our position in Jefferies Group, Inc.. We continue to believe the company is conservatively managed and exceptionally well positioned to take market share over time. Our top performing stock in the sector was insurance holding company W.R. Berkley Corp., up 28%. The company benefitted from strong underwriting and more stable insurance rates.
5
Managers Frontier Small Cap Growth Fund
Portfolio Manager’s Comments (continued)
The second largest detractor from our relative returns was health care, a sector we are underweight. Our portfolio returns in health care, up 9%, lagged the benchmark return of 12%. Our largest detractor in the health care sector was DexCom, Inc., a medical device company that focuses on the design, development, and commercialization of continuous glucose monitoring systems, down 29%. While the company grew at a very rapid rate, the industry transition to continuous glucose monitoring has been slower than investor expectations. The second largest detractor in health care was United Therapeutics Corp., which declined 27% as a consequence of less than favorable results from the trial of its oral drug for pulmonary arterial hypertension. The top health care investment return for our Portfolio was Mako Surgical Corp., up 222%. Mako Surgical Corp.’s robotic products continue to be viewed as a potential huge winner in the field of hip and knee replacement. The company has been very successful in placing its products at U.S. hospitals and this should eventually lead to increasing sales of high margin hip and knee replacement products.
Partially offsetting the aforementioned detractors were positive contributions to return from technology stocks such as Ariba, Inc. up 69%, RightNow Technologies , Inc. up 65%, and Jabil Circuit, Inc. up 36%. Both Ariba, Inc. and RightNow Technologies, Inc. offer subscription based software services that lead to consistent growth businesses with high returns on invested capital. Combined, these three technology stocks contributed approximately 2.9% of the Portfolio’s return. Another strong contributor was discount retailer Dollar Tree, Inc.’s 56% gain, contributing 1.2% to the Portfolio. We have owned Dollar Tree for a decade and it has consistently gained market share in the value based retailing market. From a broad sector perspective, the Portfolio had the strongest overall stock selection from the materials and processing sector led by strong returns from Cabot Corp., up 41%, CLARCOR, Inc., up 23% and Watsco, Inc., up 14%. We continue to own strong operating companies within this sector and shy away from owning pure commodity oriented companies that are very dependent upon the price of the underlying commodity.
Despite the backdrop of domestic political gridlock, the Eurozone crisis, and stock market weakness, U.S. economic data is holding up at a level that reflects modest economic expansion. Notwithstanding all the negative headlines, corporate earnings reports have generally remained positive and are exceeding expectations. While our growth at reasonable price style was largely responsible for our slight under performance, we remain committed to this discipline and believe our Fund is well positioned to deliver strong investment results in the upcoming year.
This commentary reflects the viewpoints of the portfolio manager, Frontier Capital Management, as of October 31, 2011 and is not intended as a forecast or guarantee of future results, and is subject to change without notice.
Cumulative Total Return Performance
Managers Frontier Small Cap Growth Fund (formerly Managers Small Cap) cumulative total return is based on the daily change in net asset value (NAV), and assumes that all distributions were reinvested. The Russell 2000® Growth Index measures the performance of those Russell 2000® companies with higher price-to-book ratios and higher forecasted growth values. Unlike the Fund, the above stated index is unmanaged, is not available for investment, and does not incur expenses. This chart compares a hypothetical $10,000 investment made in the Managers Frontier Small Cap Growth Fund on October 31, 2001, to a $10,000 investment made in the Russell 2000® Growth Index for the same time period. Performance for periods longer than one year is annualized. The graph and table do not reflect the deduction of taxes that a shareholder would pay on a Fund distribution or redemption of shares. The listed returns for the Fund are net of expenses and the returns for the index exclude expenses. Total returns for the Fund would have been lower had certain expenses not been reduced.
6
|
Managers Frontier Small Cap Growth Fund Portfolio Manager’s Comments (continued) |
Cumulative Total Return Performance (continued)
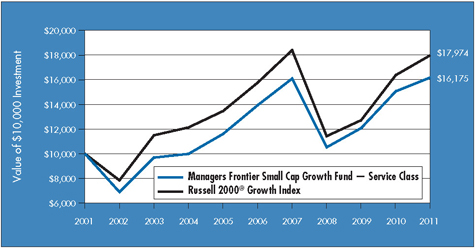
The table below shows the average annual total returns for the Managers Frontier Small Cap Growth Fund and the Russell 2000® Growth Index for the same periods ended October 31, 2011.
| | | | | | | | | | | | | | | | | | | | |
| Average Annualized Total Returns 1 | | One Year | | | Five Years | | | Ten Years | | | Since
Inception | | | Inception
Date | |
Managers Frontier Small Cap Growth Fund 2,3,4 | | | | | | | | | | | | | | | | | | | | |
Service Class | | | 7.48 | % | | | 3.04 | % | | | 4.93 | % | | | 5.91 | % | | | 9/24/97 | |
Investor Class 5 | | | 7.19 | % | | | — | | | | — | | | | 11.61 | % | | | 1/1/10 | |
Institutional Class5 | | | 7.71 | % | | | — | | | | — | | | | 12.05 | % | | | 1/1/10 | |
Russell 2000® Growth Index6 | | | 9.84 | % | | | 2.68 | % | | | 6.04 | % | | | 2.82 | % | | | 9/24/97 | † |
The performance data shown represents past performance, which is not a guarantee of future results. Current performance may be lower or higher than the performance data quoted. The investment return and principal value of an investment in the Fund will fluctuate so that an investor’s shares, when redeemed, may be worth more or less than their original cost. For performance information through the most recent month end, please call (800) 835-3879 or visit our Web site at www.managersinvest.com.
In choosing a Fund, investors should carefully consider the amount they plan to invest, their investment objectives, the Fund’s investment objectives, risks, charges and expenses before investing. For this and other information, please call (800) 835-3879 or visit www.managersinvest.com for a free prospectus. Read it carefully before investing or sending money. Distributed by Managers Distributors, Inc., member FINRA.
| † | Date reflects the inception date of the Fund, not the index. |
| 1 | Total return equals income yield plus share price change and assumes reinvestment of all dividends and capital gain distributions. Returns are net of fees and may reflect offsets of Fund expenses as described in the Prospectus. No adjustment has been made for taxes payable by shareholders on their reinvested dividends and capital gain distributions. Returns for periods greater than one year are annualized. The listed returns on the Fund are net of expenses and based on the published NAV as of October 31, 2011. All returns are in U.S. dollars($). |
| 2 | Fund for which, from time to time, the advisor has waived its fees and/or absorbed Fund expenses, which has resulted in higher returns. |
| 3 | The Fund is subject to risks associated with investments in small-capitalization companies, such as erratic earnings patterns, competitive conditions, limited earnings history, and a reliance on one or a limited number of products. |
| 4 | The Fund invests in growth stocks, which may be more sensitive to market movements because their prices tend to reflect future investor expectations rather than just current profits. Growth stocks may underperform value stocks during given periods. |
| 5 | Commencement of operations for this class was January 1, 2010. |
| 6 | The Russell 2000® Growth Index measures the performance of those Russell 2000® companies with higher price-to-book ratios and higher forecasted growth values. Unlike the Fund, the above stated index is unmanaged, is not available for investment, and does not incur expenses. |
The Russell 2000® Growth Index is a trademark of Russell Investments. Russell® is a trademark of Russell Investments.
Not FDIC insured, nor bank guaranteed. May lose value.
Managers Frontier Small Cap Growth Fund
Fund Snapshots
October 31, 2011
Portfolio Breakdown
| | | | | | | | |
Industry | | Managers Frontier Small
Cap Growth Fund** | | | Russell 2000®
Growth Index | |
Information Technology | | | 27.7 | % | | | 23.5 | % |
Industrials | | | 26.4 | % | | | 16.2 | % |
Consumer Discretionary | | | 13.5 | % | | | 14.8 | % |
Energy | | | 9.7 | % | | | 8.6 | % |
Health Care | | | 9.0 | % | | | 19.5 | % |
Financials | | | 6.9 | % | | | 7.8 | % |
Telecommunication Services | | | 1.7 | % | | | 1.1 | % |
Materials | | | 0.6 | % | | | 4.1 | % |
Consumer Staples | | | 0.4 | % | | | 4.3 | % |
Utilities | | | 0.0 | % | | | 0.1 | % |
Other Assets and Liabilities | | | 4.1 | % | | | 0.0 | % |
| ** | As a percentage of net assets |
Top Ten Holdings
| | | | |
Security Name | | Percentage
of Net Assets | |
Jabil Circuit, Inc.* | | | 3.6 | % |
Dollar Tree, Inc. | | | 3.1 | |
RF Micro Devices, Inc.* | | | 2.9 | |
ON Semiconductor Corp.* | | | 2.8 | |
Mednax, Inc.* | | | 2.8 | |
Raymond James Financial, Inc.* | | | 2.7 | |
MasTec, Inc.* | | | 2.7 | |
World Fuel Services Corp. | | | 2.1 | |
Ariba, Inc.* | | | 2.1 | |
Chico’s FAS, Inc.* | | | 1.9 | |
| | | | |
Top Ten as a Group | | | 26.7 | % |
| | | | |
| * | Top Ten Holding at April 30, 2011 |
Any sectors, industries, or securities discussed should not be perceived as investment recommendations. Mention of a specific security should not be considered a recommendation to buy or solicitation to sell that security. Specific securities mentioned in this report may have been sold from the Fund’s portfolio of investments by the time you receive this report.
Managers Frontier Small Cap Growth Fund
Schedule of Portfolio Investments
October 31, 2011
| | | | | | | | |
| | | Shares | | | Value | |
Common Stocks - 95.9% | | | | | | | | |
Consumer Discretionary - 13.5% | | | | | | | | |
Cheesecake Factory, Inc., The* | | | 34,900 | | | $ | 976,851 | |
Chico’s FAS, Inc. | | | 148,500 | | | | 1,835,460 | |
Dollar Tree, Inc.* | | | 37,350 | | | | 2,986,506 | |
Hanesbrands, Inc.* | | | 36,700 | | | | 967,779 | |
Harmon International Industries, Inc. | | | 16,700 | | | | 720,772 | |
hhgregg, Inc.* | | | 38,200 | | | | 487,050 | |
K12, Inc.* | | | 23,800 | | | | 834,190 | |
LKQ Corp.* | | | 60,600 | | | | 1,768,308 | |
Rue21, lnc.* | | | 16,200 | | | | 431,568 | |
Select Comfort Corp.* | | | 35,300 | | | | 733,181 | |
Tractor Supply Co. | | | 11,000 | | | | 780,340 | |
WMS Industries, Inc.* | | | 18,700 | | | | 409,717 | |
Total Consumer Discretionary | | | | | | | 12,931,722 | |
Consumer Staples - 0.4% | |
Nu Skin Enterprises, Inc., Class A | | | 6,700 | | | | 338,551 | |
Energy - 9.7% | | | | | | | | |
Abraxas Petroleum Corp.* | | | 74,600 | | | | 290,940 | |
Carrizo Oil & Gas, Inc.* | | | 67,100 | | | | 1,825,120 | |
Comstock Resources, Inc.* | | | 30,100 | | | | 549,024 | |
InterOilCorp.* | | | 9,000 | 2 | | | 427,590 | |
KiOR, Inc., Class A* | | | 42,500 | 2 | | | 702,525 | |
Magnum Hunter Resources Corp.* | | | 146,100 | | | | 657,450 | |
Northern Oil & Gas, Inc.* | | | 21,300 | | | | 514,821 | |
Oasis Petroleum, Inc.* | | | 12,700 | | | | 372,618 | |
Rex Energy Corp.* | | | 36,400 | | | | 563,472 | |
St. Mary Land & Exploration Co. | | | 15,600 | | | | 1,293,396 | |
World Fuel Services Corp. | | | 52,300 | | | | 2,084,155 | |
Total Energy | | | | | | | 9,281,111 | |
Financials - 6.9% | |
Green Dot Corp., Class A* | | | 8,700 | | | | 284,229 | |
Jefferies Group, Inc. | | | 78,800 | | | | 1,044,888 | |
Raymond James Financial, Inc. | | | 86,600 | | | | 2,630,042 | |
W.R. Berkley Corp. | | | 35,000 | | | | 1,218,350 | |
Waddell & Reed Financial, Inc. | | | 51,600 | | | | 1,430,868 | |
Total Financials | | | | | | | 6,608,377 | |
Health Care - 9.0% | | | | | | | | |
Accretive Health, Inc.* | | | 25,900 | 2 | | | 616,679 | |
Complete Genomics, Inc.* | | | 18,200 | | | | 103,740 | |
CONMED Corp.* | | | 43,500 | | | | 1,142,745 | |
| | | | | | | | |
| | | Shares | | | Value | |
Cumberland Pharmaceuticals, Inc.* | | | 45,500 | 2 | | $ | 262,080 | |
Dendreon Corp.* | | | 35,200 | 2 | | | 385,088 | |
DexCom, Inc.* | | | 67,000 | | | | 655,930 | |
HMS Holdings Corp.* | | | 12,500 | | | | 305,500 | |
Insulet Corp.* | | | 49,700 | 2 | | | 811,104 | |
MAKO Surgical Corp.* | | | 5,110 | 2 | | | 196,479 | |
Medidata Solutions, Inc.* | | | 21,000 | | | | 377,580 | |
Mednax, Inc.* | | | 40,300 | | | | 2,651,740 | |
Momenta Pharmaceutical, Inc.* | | | 32,200 | | | | 476,560 | |
United Therapeutics Corp.* | | | 15,100 | | | | 660,323 | |
Total Health Care | | | | | | | 8,645,548 | |
Industrials - 26.4% | |
A.O. Smith Corp. | | | 22,500 | | | | 836,100 | |
Advisory Board Co., The* | | | 17,100 | | | | 1,047,375 | |
Ameresco, Inc., Class A* | | | 25,300 | | | | 278,047 | |
Belden CDT, Inc. | | | 45,300 | | | | 1,462,284 | |
Carlisle Co., Inc. | | | 21,800 | | | | 909,496 | |
CLARCOR, Inc. | | | 21,900 | | | | 1,061,712 | |
Comfort Systems USA, Inc. | | | 17,700 | | | | 194,700 | |
Hub Group, Inc.* | | | 32,000 | | | | 1,000,320 | |
Insperity, Inc. | | | 25,500 | | | | 657,390 | |
Kaman Corp., Class A | | | 30,800 | | | | 1,024,100 | |
Landstar System, Inc. | | | 35,000 | | | | 1,562,050 | |
MasTec, Inc.* | | | 120,700 | | | | 2,609,534 | |
Meritor, Inc.* | | | 101,400 | | | | 965,328 | |
Mine Safety Appliances Co. | | | 30,500 | | | | 1,023,275 | |
Navistar International Corp.* | | | 21,900 | | | | 921,333 | |
Pall Corp. | | | 15,000 | | | | 767,550 | |
Quanta Services, Inc.* | | | 47,900 | | | | 1,000,631 | |
RSC Holdings, Inc.* | | | 81,200 | | | | 792,512 | |
Tetra Technologies, Inc.* | | | 32,800 | | | | 716,024 | |
UTI Worldwide, Inc. | | | 47,300 | | | | 691,053 | |
WABCO Holdings, Inc.* | | | 35,600 | | | | 1,787,476 | |
Waste Connections, Inc. | | | 38,100 | | | | 1,297,305 | |
Watsco, Inc. | | | 29,400 | | | | 1,812,804 | |
Wesco International, Inc.* | | | 20,100 | | | | 974,046 | |
Total Industrials | | | | | | | 25,392,445 | |
Information Technology - 27.7% | |
Ariba, Inc.* | | | 64,100 | | | | 2,030,688 | |
Brightpoint, Inc.* | | | 19,400 | | | | 196,910 | |
comScore, Inc.* | | | 37,884 | | | | 799,731 | |
The accompanying notes are an integral part of these financial statements.
9
Managers Frontier Small Cap Growth Fund
Schedule of Portfolio Investments (continued)
| | | | | | | | |
| | | Shares | | | Value | |
Information Technology - 27.7% (continued) | | | | | | | | |
Constant Contact, Inc.* | | | 22,600 | | | $ | 457,424 | |
Cymer, Inc.* | | | 24,500 | | | | 1,064,525 | |
DemandTec, Inc.* | | | 43,300 | | | | 327,348 | |
Equinix, Inc.* | | | 9,200 | | | | 883,292 | |
Factset Research Systems, Inc. | | | 300 | | | | 29,826 | |
Fairchild Semiconductor International, Inc.* | | | 4,000 | | | | 59,880 | |
Fortinet, Inc.* | | | 12,000 | | | | 276,720 | |
GT Advanced Technologies, Inc.* | | | 108,000 | 2 | | | 885,600 | |
Ingram Micro, Inc., Class A* | | | 45,600 | | | | 815,328 | |
Intevac, Inc.* | | | 38,300 | | | | 308,315 | |
IntraLinks Holdings, Inc.* | | | 67,100 | | | | 583,099 | |
Jabil Circuit, Inc. | | | 166,200 | | | | 3,417,073 | |
Monolithic Power Systems, Inc.* | | | 8,900 | | | | 110,894 | |
Monster Worldwide* | | | 72,500 | | | | 669,175 | |
ON Semiconductor Corp.* | | | 352,000 | | | | 2,664,640 | |
QuinStreet, Inc.* | | | 98,000 | | | | 1,126,020 | |
Radware, Ltd.* | | | 17,100 | | | | 452,124 | |
RF Micro Devices, Inc.* | | | 375,294 | | | | 2,754,658 | |
RightNow Technologies, Inc.* | | | 29,200 | | | | 1,255,892 | |
Rogers Corp.* | | | 7,800 | | | | 336,726 | |
Sanmina-SCI Corp.* | | | 75,200 | | | | 662,512 | |
Semtech Corp.* | | | 12,600 | | | | 307,692 | |
Tech Data Corp.* | | | 11,100 | | | | 545,898 | |
Tessera Technologies, Inc.* | | | 76,920 | | | | 1,059,188 | |
| | | | | | | | |
| | | Shares | | | Value | |
Veeco Instruments, Inc.* | | | 10,500 | 2 | | $ | 280,245 | |
VeriFone Holdings, Inc.* | | | 13,900 | | | | 586,719 | |
Verint Systems, Inc.* | | | 16,200 | | | | 482,760 | |
Virtusa Corp.* | | | 55,800 | | | | 908,982 | |
Web.com Group, Inc.* | | | 31,300 | | | | 302,358 | |
Total Information Technology | | | | | | | 26,642,242 | |
Materials - 0.6% | | | | | | | | |
Albemarle Corp. | | | 3,300 | | | | 175,857 | |
RTI International Metals, Inc.* | | | 14,800 | | | | 390,572 | |
Total Materials | | | | | | | 566,429 | |
Telecommunication Services - 1.7% | | | | | | | | |
Cogent Communications Group, Inc.* | | | 55,600 | | | | 892,380 | |
Premiere Global Services, Inc.* | | | 79,900 | | | | 723,894 | |
Total Telecommunication Services | | | | | | | 1,616,274 | |
Total Common Stocks
(cost $93,544, 106) | | | | | | | 92,022,699 | |
Short-Term Investments - 8.8%1 | | | | | | | | |
BNY Mellon Overnight Government Fund, 0.10% 3 | | | 4,313,047 | | | | 4,313,047 | |
Dreyfus Cash Management Fund, Institutional Class Shares, 0.05% | | | 4,163,543 | | | | 4,163,543 | |
Total Short-Term Investments (cost $8,476,590) | | | | | | | 8,476,590 | |
Total Investments - 104.7%
(cost $102,020,696) | | | | | | | 100,499,289 | |
Other Assets, less Liabilities - (4.7)% | | | | | | | (4,519,928 | ) |
Net Assets - 100.0% | | | | | | $ | 95,979,361 | |
The accompanying notes are an integral part of these financial statements.
10
Managers AMG TSCM Growth Equity Fund
Portfolio Manager’s Comments
The Managers AMG TSCM Growth Equity Fund (the “Fund”) seeks to achieve long-term capital appreciation by investing in the stocks of large-, mid- and small-capitalization companies.
The Portfolio Manager
TimesSquare Capital Management, LLC (“TimesSquare”), the Fund’s subadvisor, utilizes a bottom-up fundamental approach to all-cap investing. Led by co-managers Kenneth Duca, Tony Rosenthal, and Grant Babyak, the investment team at TimesSquare believes its proprietary fundamental research skills, which place a particular emphasis on the assessment of management quality and an in-depth understanding of superior business models, enable the team to build a diversified portfolio of large-cap, mid-cap and small-cap growth stocks designed to generate good risk-adjusted returns. When selecting growth stocks, Fund management utilizes a fundamental, bottom-up process to identify companies that demonstrate consistent and sustainable revenue and earnings growth, offer distinct and sustainable competitive advantages, have strong, experienced management teams, have stocks selling at reasonable valuations, and that Fund management believes have the potential to appreciate in price by 25% to 50% within the next 12 to 18 months.
The Period in Review
For the fiscal year ended October 31, 2011, the Managers AMG TSCM Growth Equity Fund (Institutional Class Shares) returned 1.23%, underperforming the Russell 3000® Growth Index, which returned 9.92%.
The U.S. equity markets closed 2010 with a second consecutive year of double-digit positive returns. Sweeping federal reforms to the health care and financial services sectors, as well as hearings and investigations into other segments of the economy, roiled those areas of the markets. Investors began to grapple with the implications of federal actions. Indicative of the equity markets’ sentiment was the top-seeded asset class in 2010: commodities. Mirroring investor worries for the equity markets, such as future inflation and stability among the major economies, there were record highs and returns for metals, agriculture, and energy.
In the first quarter of 2011, the world shook from geological and geopolitical instabilities. A 9.0 magnitude earthquake rocked northeastern Japan, followed by an even more destructive tsunami that caused massive damage, especially to an aging nuclear power plant in the region. Two continents away, regime change battles erupted in several countries, from northern Africa to the Middle East. Subsequent to both sets of events, there were notable impacts on the Japanese link in the global supply chain for certain technologies and on the price of oil. Outside of the two regions, however, the financial markets seemed to shrug off those headlines.
At the close of the second quarter of 2011, the Federal Reserve’s second round of quantitative easing (QE2) ended not with a bang but a whimper. No new monetary initiatives were planned, though the FOMC said it would “act as needed to best foster maximum employment and price stability.” Neither of those goals seemed within nearby reach as unemployment remained above 9% and inflation edged up to 3.6%, with the greatest increases coming from food and energy prices. The decision in late June by the U.S. and other nations of the International Energy Agency to release 60 million barrels of oil from strategic reserves - only the third time that reserves have been tapped in a coordinated manner - was made in an effort to offset supply disruptions in Libya and to help lower oil prices. Meanwhile, the Federal Government’s economic focus turned toward its mandated debt ceiling, which technically was reached mid-May. “Extraordinary measures” were used by the Treasury to manage the country’s finances, which prolonged the deadline until early August. By then, it was expected that some combination of tax increases and spending cuts would be agreed upon, breaking the deadlock on Capitol Hill and raising the debt ceiling. In a similar vein, Greece moved forward with its new austerity plan in hopes of extricating that country from its debt crisis. By doing so, other European Union members moved forward with additional aid, which calmed markets globally, especially the financial services sector where many large companies had significant Greek exposure.
The third quarter was marked by a historical credit rating downgrade for the U.S., the wrath of Hurricane Irene, and the implementation of “Operation Twist” by the Fed – all with the major stock indices tumbling by double digits across the market capitalization spectrum. Brinkmanship had continued in Congress over raising the debt ceiling prior to the August 2 deadline, which finally was accomplished at almost literally the 11th hour. With the difficulty in reaching agreement on a coherent fiscal policy, credit rating agencies placed the U.S. “under review” for a downgrade from its AAA status, the level it had held since 1941, only to follow through with the action during the first week of August. The Federal Reserve subsequently affirmed its stance of holding interest rates at “exceptionally low levels” (i.e., zero) for at least the next two years. European economies struggled under the pressure of their hefty sovereign debt levels and austerity measures. Additionally, economic news (GDP, manufacturing activity, and jobs data) took a decidedly negative turn, calling into question the strength of our own “recovery” now that QE2 had ended. U.S. stock market volatility, as measured by the VIX Index, spiked to its highest level in over a year. At the end of August, attention on market turbulence gave way to the thunderous effects of Hurricane Irene, which hit the East Coast and caused by some estimates upwards of $10 Billion of damage. President Obama announced new jobs initiatives to a joint congressional session. Federal Reserve Chairman Ben Bernanke ended speculation on the Fed’s next move by announcing “Operation Twist,” a plan through which the Fed would purchase $400 Billion of long-term treasury bonds and sell the same amount of short-term treasury bills.
11
Managers AMG TSCM Growth Equity Fund
Portfolio Manager’s Comments (continued)
Stock prices seemed to move based on macro events, technical trading dynamics, and headlines rather than the underlying business fundamentals. Smaller stocks have been hit harder than larger capitalization stocks, as the former are generally perceived as “riskier” assets, and investors were clearly de-risking their portfolios in the face of uncertainty. The third quarter ended with more questions than answers as investors contemplated the U.S. political gridlock, the Euro zone crisis, and stock market weakness.
In the month of October, the U.S. equity markets pulled an abrupt about-face and posted double-digit positive returns across all sizes and styles, breaking a five-month sequence of negative returns. Underlying that was a significant shift in market leadership as the commodity-oriented sectors, such as energy and materials & processing, outpaced the pack while less economically sensitive areas lagged, including consumer staples, health care, and utilities. Market volatility, as measured by the VIX Index, decreased significantly from its recent spike, though remained at higher levels than earlier in the year.
During this period, the return of the broad market underperformed the large-capitalization segment yet beat the mid and small caps with the Russell 3000® Index returning 7.90%, compared with the Russell 1000® Index return of 8.01%, the Russell Midcap® Index return of 7.85%, and the Russell 2000® Index return of 6.71%. In terms of style, growth stocks outperformed value stocks within each size segment; specific to the all cap space, the Russell 3000® Growth Index’s return of 9.92% handily beat the Russell 3000® Value Index return of 5.94%.
The portfolio underperformed the Russell 3000® Growth Index on a relative basis during the period. Stock selection had a net negative effect and drove our underperformance; in general, our investments in technology and materials & processing outpaced their counterparts in the index, while our holdings in consumer discretionary, financial services, producer durables, energy, health care, and consumer staples lagged. Sector allocation also had a net negative effect although we continue to build our concentrated all cap growth portfolio from the bottom-up.
Within the consumer discretionary sector, Coach, Inc. a specialty retailer of leather goods and accessories, ran up by 31%, prompted by a solid second quarter in which earnings surpassed Street estimates; we added to our position throughout the period. Coach, Inc. management is focused on China both from a cost and sales perspective. Currently, 75% of its products are sourced from Chinese factories. Management intends to reduce production out of China to approximately 50% over the next four years in recognition of growing wage pressure. Coach, Inc. is investigating additional store
locations throughout China in order to capitalize on this growing market opportunity. Nike, Inc. is engaged in the design and development of footwear, apparel, equipment and accessory products. Nike, Inc.’s fiscal fourth quarter results were above the consensus with revenue growth coming from North America, China and emerging markets. Their footwear segment continued to produce very strong results, and Nike, Inc. shares ran ahead by 19%. Nike, Inc. has gained market share among mid-tier stores and has been noted by many of those retailers as one of the few lines of growth. We initiated a position in Sotheby’s, an auctioneer of authenticated fine and decorative art, jewelry, and collectibles, in the second quarter. During the third quarter, the luxury segment of the sector gave back gains from earlier in the year. Recent art auctions produced mixed results as auction sales, while within the estimate range, have skewed to the low end. Sotheby’s shares were bid lower by -30%, though the supply of fine art, a key business consideration, has been strong leading into the Fall auction season; we added to our position.
Declining energy prices weighed on that sector and our Whiting Petroleum Corp. holding. An independent oil and gas exploration & production company, Whiting Petroleum Corp.’s business is primarily located in the Rocky Mountains, Mid-Continent and Gulf Coast regions. The company’s new area is Lewis & Clark, located in the Williston Basin of North Dakota. Following the descent of oil prices,Whiting Petroleum Corp. fell by -21%. In our view, the price actions significantly oversold the stock, ignoring Whiting Petroleum Corp.’s key acreage in the Bakken field, and we added to our position.
In financial services, Lazard, Ltd., Class A is a global leader in M&A and restructuring advisory work with an asset management business overseeing more than $100 Billion of client assets. Lazard, Ltd., Class A won several high profile M&A assignments last year, such as advising Continental on its merger with United, but Lazard, Ltd., Class A lagged later in the period due to concerns that a weaker macroeconomic environment could weigh on future M&A activity, which pushed down its price by -25%. We still believe Lazard, Ltd., Class A is well positioned to continue gaining market share from the larger investment banks, and it played prominent roles in several recent deals.
In the health care sector, Shire PLC is a specialty biopharmaceutical company focused on the research, development, manufacture and distribution of pharmaceutical products including treatments of Attention Deficit and Hyperactivity Disorder (ADHD) and gastrointestinal diseases. Strong sales of the company’s Adderall ADHD therapy enabled Shire PLC to surpass second quarter estimates, and their shares rose by 34%. Management also increased guidance for 2011. In May, Shire PLC had announced its plans to acquire Advanced BioHealing and the creation of a strategic platform based on tissue regeneration using
12
Managers AMG TSCM Growth Equity Fund
Portfolio Manager’s Comments (continued)
cell-based therapies. In the first quarter, we initiated a position in HCA Holdings, Inc. the largest private hospital operator in the U.S. In July, HCA Holdings, Inc. missed quarterly earnings estimates due to a sudden decrease in the percentage of surgical procedures among its Medicare patients, which represented a sudden shift from recent trends. HCA Holdings, Inc. was also buffeted by fears of reimbursement cuts, especially in its large Medicaid-dominated Florida market, and the company finished the period down by -22%.
We had mixed results in the producer durables sector. As the bottommost detractor for the period with its -45% decline, Manitowoc Company, a leading producer of industrial cranes and commercial foodservice equipment, reported a slight slowdown during the third quarter from some of its developing markets operations. Following a stronger-than-expected first half of the year, investors pushed Manitowoc’s price down, a pullback that we believed overly discounted the disappointing news and ignored the company’s solid backlog; however, we decided to move on to higher conviction names and closed our position in October. ManpowerGroup is the third largest staffing company in the world; their service offerings include temporary and flexible staffing solutions, which a number of companies have favored during times of uncertainty. Manpower’s first quarter results beat the consensus, and management’s second quarter earnings guidance was above expectations; however, weaker-than-expected macroeconomic recovery concerns caused the stock to fall. In the third quarter, Manpower reported another good quarter and provided solid guidance. The stock traded down by -30% on concerns regarding its European exposure, and we decided to sell our position in October. Danaher Corp. designs, manufactures, and markets professional (Environmental, Test & Measurement), medical (Life Sciences & Diagnostics and Dental), industrial, commercial, and consumer products including microscopes and disinfection technologies that ensure safe drinking water. Danaher Corp. reported solid third-quarter results in late 2010 that topped expectations, driven by higher core sales and better-than-expected gross margins, which came in above 50% for the first time in the company’s history. In the second quarter of 2011, Danaher Corp. beat earnings expectations and raised guidance; their shares rose by 12%. The company continues to have significant exposure to emerging markets which are growing at approximately double the rate of the rest of the company, and Danaher Corp. has $4 Billion of M&A capacity for new acquisitions.
The top contributor for the period hailed from the technology sector: with its 34% return, Apple, Inc. a leader in the design of personal computers, media devices, and wireless phones, reported better-than-expected earnings and was preparing to introduce new products later this year. Subsequent to the end of the third quarter, Apple, Inc.’s
co-founder, chairman, and until recently CEO, Steven Jobs, passed away. With the loss of Jobs, we are reevaluating our expectations for Apple, Inc. Teradata Corp. is a leader in enterprise data warehousing technologies and services. The company sells tightly coupled hardware, software and services enabling businesses to improve real-time decision making. Teradata Corp. management noted they are continuing to expand their sales territories and are offering a broader set of products to address a key growth opportunity in the analytics market. Shares of Teradata Corp. surged ahead by 52%, and we trimmed the position on strength. QUALCOMM, Inc. manufactures digital wireless telecommunications products and services based on its code division multiple access (CDMA) technology. QUALCOMM, Inc. continues to benefit from an increased penetration of smartphones from Apple, Inc. and those based on the Android operating system. In the first quarter, QUALCOMM, Inc. announced the acquisition of Atheros Communications, a producer of radio frequency semiconductors used in wireless networking equipment. QUALCOMM, Inc. believes this deal will open up significant growth synergies. QUALCOMM, Inc.’s shares gained 15%, and we added to our position. We decided to exit Juniper Networks in the third quarter, which had fallen by -34%. The designer, developer, and supplier of network infrastructure products and services reported disappointing revenues and earnings. Driven by the slower and uncertain technology spending environment, Juniper had also reduced forward guidance.
With an ever-changing investment landscape, one constant has been our investment approach. No matter what geopolitical or macroeconomic events challenge the markets, we believe that a bottom-up focus on superior business models led by top-flight management will be rewarded. As always, we appreciate the confidence you have placed in our investment team.
This commentary reflects the viewpoints of the portfolio manager, TimesSquare Capital Management, as of October 31, 2011 and is not intended as a forecast or guarantee of future results, and is subject to change without notice.
Cumulative Total Return Performance
Managers AMG TSCM Growth Equity Fund’s cumulative total return is based on the daily change in net asset value (NAV), and assumes that all distributions were reinvested. The Russell 3000® Growth Index measures the performance of those Russell 3000® Index companies with higher price-to-book ratios and higher forecasted growth values. Unlike the Fund, the Russell 3000® Growth Index is unmanaged, is not available for investment, and does not incur expenses. This chart compares a hypothetical $10,000 investment made in the Fund’s Institutional Class on July 30, 2010 (commence-
13
|
Managers AMG TSCM Growth Equity Fund Portfolio Manager’s Comments (continued) |
Cumulative Total Return Performance (continued)
ment of operations) to a $10,000 investment made in the Russell 3000® Growth Index for the same time period. The graph and table do not reflect the deduction of taxes that a shareholder would pay on a Fund distribution or redemption of shares. The listed returns for the Fund are net of expenses and the returns for the index exclude expenses. Total returns for the Fund would have been lower had certain expenses not been reduced.
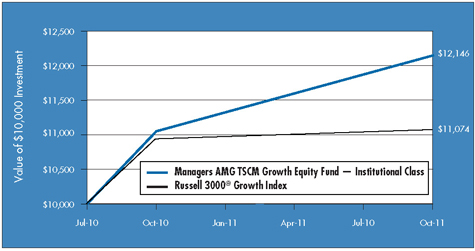
The table below shows the total return for the Managers AMG TSCM Growth Equity Fund and the Russell 3000® Growth Index since inception to October 31, 2011.
| | | | | | | | | | | | |
| Total Return1 | | One Year | | | Since Inception | | | Inception Date | |
Managers AMG TSCM Growth Equity Fund 2,3,4,5 | | | | | | | | | | | | |
Investor Class | | | 0.84 | % | | | 8.06 | % | | | 7/30/10 | |
Service Class | | | 1.55 | % | | | 8.75 | % | | | 7/30/10 | |
Institutional Class | | | 1.23 | % | | | 8.47 | % | | | 7/30/10 | |
Russell 3000® Growth Index6 | | | 9.92 | % | | | 16.76 | % | | | 7/30/10 | † |
The performance data shown represents past performance, which is not a guarantee of future results. Current performance may be lower or higher than the performance data quoted. The investment return and principal value of an investment in the Fund will fluctuate so that an investor’s shares, when redeemed, may be worth more or less than their original cost. For performance information through the most recent month end, please call (800) 835-3879 or visit our Web site at www.managersinvest.com.
In choosing a Fund, investors should carefully consider the amount they plan to invest, their investment objectives, the Fund’s investment objectives, risks, charges and expenses before investing. For this and other information, please call (800) 835-3879 or visit www.managersinvest.com for a free prospectus. Read it carefully before investing or sending money. Distributed by Managers Distributors, Inc., member FINRA.
| † | Date reflects the inception date of the Fund, not the index. |
| 1 | Total return equals income yield plus share price change and assumes reinvestment of all dividends and capital gain distributions. Returns are net of fees and may reflect offsets of Fund expenses as described in the Prospectus. No adjustment has been made for taxes payable by shareholders on their reinvested dividends and capital gain distributions. Returns for periods greater than one year are annualized. The listed returns on the Fund are net of expenses and based on the published NAV as of October 31, 2011. All returns are in U.S. dollars($). |
| 2 | The Fund invests in growth stocks, which may be more sensitive to market movements because their prices tend to reflect future investor expectations rather than just current profits. Growth stocks may underperform value stocks during given periods. |
| 3 | The Fund is subject to risks associated with investments in small-and mid-capitalization companies, such as erratic earnings patterns, competitive conditions, limited earnings history, and a reliance on one or a limited number of products. |
| 4 | A greater percentage of the Fund’s holdings may be focused in a smaller number of securities which may place the Fund at greater risk than a more diversified fund. |
| 5 | Fund for which, from time to time, the advisor has waived its fees and/or absorbed Fund expenses, which has resulted in higher returns. |
| 6 | The Russell 3000® Growth Index measures the performance of those Russell 3000® Index companies with higher price-to-book ratios and higher forecasted growth values. Unlike the Fund, the Russell 3000® Growth Index is unmanaged, is not available for investment, and does not incur expenses. |
The Russell 3000® Growth Index is a trademark of Russell Investments. Russell® is a trademark of Russell Investments.
Not FDIC insured, nor bank guaranteed. May lose value.
Managers AMG TSCM Growth Equity Fund
Fund Snapshots
October 31, 2011
Portfolio Breakdown
| | | | | | | | |
Industry | | Managers AMG TSCM
Growth Equity Fund** | | | Russell 3000®
Growth Index | |
Information Technology | | | 27.7 | % | | | 28.4 | % |
Consumer Discretionary | | | 18.5 | % | | | 14.4 | % |
Industrials | | | 16.1 | % | | | 12.8 | % |
Health Care | | | 14.5 | % | | | 11.3 | % |
Energy | | | 8.7 | % | | | 10.7 | % |
Financials | | | 5.0 | % | | | 4.2 | % |
Telecommunication Services | | | 3.5 | % | | | 1.1 | % |
Materials | | | 2.6 | % | | | 5.4 | % |
Consumer Staples | | | 0.0 | % | | | 11.6 | % |
Utilities | | | 0.0 | % | | | 0.1 | % |
Other Assets and Liabilities | | | 3.4 | % | | | 0.0 | % |
| ** | As a percentage of net assets |
Top Ten Holdings
| | | | |
Security Name | | Percentage
of Net Assets | |
QUALCOMM, Inc.* | | | 6.3 | % |
Apple, Inc.* | | | 6.3 | |
DaVita, Inc.* | | | 4.6 | |
United Parcel Service, Inc., Class B* | | | 4.0 | |
Coach, Inc.* | | | 3.9 | |
Broadcom Corporation | | | 3.8 | |
American Tower Corp., Class A* | | | 3.6 | |
Allergan Inc | | | 3.4 | |
Wesco International Inc | | | 3.1 | |
Halliburton Co * | | | 3.0 | |
| | | | |
Top Ten as a Group | | | 42.0 | % |
| | | | |
| * | Top Ten Holding at April 30, 2011 |
Any sectors, industries, or securities discussed should not be perceived as investment recommendations.
Mention of a specific security should not be considered a recommendation to buy or solicitation to sell that security. Specific securities mentioned in this report may have been sold from the Fund’s portfolio of investments by the time you receive this report.
Managers AMG TSCM Growth Equity Fund
Schedule of Portfolio Investments
October 31, 2011
| | | | | | | | |
| | | Shares | | | Value | |
Common Stocks - 96.6% | | | | | | | | |
Consumer Discretionary - 18.5% | | | | | | | | |
Amazon.com, Inc.* | | | 1,485 | | | $ | 317,062 | |
Coach, Inc. | | | 13,770 | | | | 896,014 | |
Johnson Controls, Inc. | | | 17,470 | | | | 575,287 | |
Luxottica Group S.p.A., Sponsored ADR | | | 11,700 | | | | 343,278 | |
Nike, Inc. | | | 6,605 | | | | 636,392 | |
Sotheby’s | | | 11,380 | | | | 400,804 | |
Virgin Media, Inc. | | | 19,300 | | | | 470,534 | |
Walt Disney Co., The | | | 16,180 | | | | 564,358 | |
Total Consumer Discretionary | | | | | | | 4,203,729 | |
Energy - 8.7% | | | | | | | | |
Anadarko Petroleum Corp. | | | 4,180 | | | | 328,130 | |
Denbury Resources, Inc.* | | | 26,960 | | | | 423,272 | |
Halliburton Co. | | | 18,160 | | | | 678,458 | |
Whiting Petroleum Corp.* | | | 11,820 | | | | 550,221 | |
Total Energy | | | | | | | 1,980,081 | |
Financials - 5.0% | | | | | | | | |
Lazard, Ltd., Class A | | | 15,360 | | | | 419,942 | |
Montpelier Re Holdings, Ltd. | | | 25,500 | | | | 446,250 | |
NASDAQ OMX Group, Inc., The* | | | 10,650 | | | | 266,782 | |
Total Financials | | | | | | | 1,132,974 | |
Health Care - 14.5% | | | | | | | | |
Allergan, Inc. | | | 9,120 | | | | 767,175 | |
Baxter International, Inc. | | | 6,190 | | | | 340,326 | |
DaVita, Inc.* | | | 14,970 | | | | 1 ,047,900 | |
HCA Holdings, Inc.* | | | 23,930 | | | | 561,158 | |
Shire PLC | | | 6,145 | | | | 579,474 | |
Total Health Care | | | | | | | 3,296,033 | |
Industrials - 16.1% | | | | | | | | |
Albany International Corp. | | | 19,910 | | | | 449,767 | |
| | | | | | | | |
| | | Shares | | | Value | |
Ametek, Inc. | | | 15,420 | | | $ | 609,398 | |
Clean Harbors, Inc.* | | | 5,360 | | | | 312,327 | |
Danaher Corp. | | | 9,330 | | | | 451,106 | |
Nielsen Holdings, N.V.* | | | 7,600 | | | | 223,060 | |
United Parcel Service, Inc., Class B | | | 12,900 | | | | 906,096 | |
Wesco International, Inc.* | | | 14,680 | | | | 711,393 | |
Total Industrials | | | | | | | 3,663,147 | |
Information Technology - 27.7% | | | | | | | | |
Apple, Inc.* | | | 3,550 | | | | 1,436,969 | |
Autodesk, Inc.* | | | 9,860 | | | | 341,156 | |
Broadcom Corp., Class A | | | 23,835 | | | | 860,205 | |
eBay, Inc.* | | | 18,440 | | | | 586,945 | |
Global Payments, Inc. | | | 8,770 | | | | 402,718 | |
Linear Technology Corp. | | | 14,920 | | | | 482,065 | |
NeuStar, Inc., Class A* | | | 12,300 | | | | 391,017 | |
QUALCOMM, Inc. | | | 28,005 | | | | 1,445,058 | |
Teradata Corp.* | | | 6,190 | | | | 369,295 | |
Total Information Technology | | | | | | | 6,315,428 | |
Materials - 2.6% | | | | | | | | |
Ecolab, Inc. | | | 10,960 | | | | 590,087 | |
Telecommunication Services - 3.5% | | | | | | | | |
American Tower Corp., Class A* | | | 14,695 | | | | 809,695 | |
Total Common Stocks
(cost $22,099,481) | | | | | | | 21,991,174 | |
Short-Term Investments - 4.9%1 | | | | | | | | |
Dreyfus Government Cash Management Fund, Institutional Class Shares, 0.05%, (cost $1,114,671) | | | 1,114,671 | | | | 1,114,671 | |
Total Investments - 101.5%
(cost $23,214,152) | | | | | | | 23,105,845 | |
Other Assets, less Liabilities - (1.5)% | | | | | | | (337,299 | ) |
Net Assets - 100.0% | | | | | | $ | 22,768,546 | |
The accompanying notes are an integral part of these financial statements.
16
Managers Micro-Cap Fund
Portfolio Manager’s Comments
The Managers Micro-Cap Fund primarily invests in the stocks of U.S. micro-capitalization companies. Normally the Fund will invest at least 80% of its net assets in U.S. micro-cap stocks. The Fund employs multiple portfolio managers who specialize in distinct investment approaches. This “intelligence diversification” not only serves to manage risk, but also seeks to incorporate into the Portfolio the breadth of the micro-cap market by focusing different analytical insights on micro-cap investing. The Fund’s team of subadvisors strives to achieve this performance and diversification while ensuring that the Fund operates within the framework of its investment objective and principal investment strategies. The Russell Microcap® Index is the benchmark for the Fund.
The Portfolio Managers
Lord, Abbett & Co., LLC (“Lord Abbett”)
The team focuses its stock selection effort by focusing on companies that have revenue growth of at least 15%, are experiencing year-to-year operating margin improvement, and are experiencing earnings growth that is driven by top-line growth rather than being driven by one-time events or simple cost-cutting measures. The focus is also on identifying companies with higher-quality balance sheets (often captured by finding companies with manageable debt-to-total-capital ratios) and that are already profitable. Once this process is completed, the focus for the team is on forecasting both revenue and earnings growth over the next several years. To achieve this goal, and to find companies that are expected to grow faster than their industry average, members of the team spend an extensive amount of time understanding the competitive advantages of a firm, the industry dynamics within which they operate, and the strength of management.
The sell discipline is enacted if there is a fundamental change in the business, a more attractive alternative is found, or if a holding reaches a 5% weight in the overall portfolio. The Lord Abbett Portfolio typically holds between 75 and 100 stocks with no individual holding typically exceeding 5%. There is a risk constraint that prevents any individual industry from being greater than 25% of the total portfolio weight. The annual turnover of the Portfolio is expected to be relatively high although there is no explicit target as part of either the stock selection or the portfolio-construction process.
Next Century Growth Investors, LLC (“Next Century”)
The team requires historical revenue growth of at least 15% for a company before conducting further research. Other key factors considered initially by the team are strong historical revenue growth, low debt, and high ROE. Quantitative screening is done on a regular basis to see which stocks over the past year are experiencing significant growth. The next stage of this process involves intensive first-hand research to determine the growth prospects of a company with the team choosing a stock only when it has become convinced
a company has an extraordinary opportunity to grow their business. The uniqueness of this process lies in the fact that the team seeks out these companies regardless of their short-term prospects and\or current valuation. The team is looking for “home runs” and companies that will grow to the point that they will eventually reach a small-market capitalization.
The sell discipline is enacted if there is a change in the original investment thesis or a fundamental change in business of the company. In addition, a holding will become a candidate for sale if it reaches an extreme valuation, becomes larger than 5% of the overall Portfolio or as it approaches $1 billion in market capitalization. Typically companies are sold out of the micro-cap portfolio because they have approached $1 billion in market capitalization.
The Next Century portion of the Portfolio is concentrated and typically has 40-60 holdings, which can create a high level of volatility. The only risk constraints are that sector weights can not exceed two times the Russell 2000® Growth sector weights, and no individual holding can be greater than 5% of the Portfolio.
RBC Global Asset Management (U.S.) Inc. (“RBC”)
The team uses an investment process that focuses on generating solid stock selection by identifying companies with strong, long-term, attractive business fundamentals that are selling at low valuations. In order to initially generate ideas, the team at RBC uses quantitative screens and industry research to concentrate stock selection on a narrower sub-universe of micro-cap companies. The team then focuses a majority of its time on conducting intensive “on-the-ground” fundamental research in order to uncover these opportunities. The focus is on identifying companies with long-term, solid business fundamentals and near-term profitability improvement potential. In terms of short-term factors, the team looks for companies that have shown institutional investor neglect or avoidance and sizeable insider ownership with the potential for both improving profit margins and accelerating earnings in the near future. In terms of long-term factors, the team looks for companies with proven products or services that are leading in market share within their respective industries while maintaining a sustainable competitive advantage and a solid balance sheet.
The resulting portfolio that is generated by this stock selection process tends to exhibit low turnover with company stocks generally held for several years. The Portfolio is well diversified with anywhere from 60 to 90 holdings with a maximum of 5% in any single holding.
WEDGE Capital Management L.L.P. (“WEDGE”)
The investment process is a combination of both quantitative and fundamental research insights. The quantitative portion of the investment process uses commonly found factors and characteristics that can be accessed via any number of commercial databases. The value-added portion of the process, therefore, uses a number
17
Managers Micro-Cap Fund
Portfolio Manager’s Comments (continued)
of different factors across five major categories: valuation, earnings quality, operating efficiency, capital usage and momentum, whose efficacy has been verified via long-term regression analysis. This is referred to as the Fundamental Value model. The top results of this model are combined with the best resulting stocks from the Financial Quality model, which measures stocks across categories such as multiple earnings growth, profitability, leverage, and liquidity. The top stocks that appear in both models are eligible for fundamental research. The fundamental research portion of the investment process is exclusionary in nature and meant to eliminate stocks that are not strong in earnings forecasts, valuation metrics, sector\industry outlook, or any factor that cannot be easily captured quantitatively.
A stock is scrutinized for possible sale if it falls below the top four deciles in the Fundamental Value model. Stocks are sold when they become fairly valued, an upgrade opportunity develops, or the original investment thesis materially deteriorates. The portion of the Portfolio managed by WEDGE is confined to plus or minus 10% in any given sector, although sector positions tend to be much closer to the Index weight than this (it should be noted that these self-imposed sector weighting constraints are based on a proprietary liquidity analysis conducted on an ongoing basis by the micro-cap team and is NOT driven by the sector weightings of any micro-cap benchmark). The final portfolio seeks to be a well-diversified, micro-cap portfolio holding approximately 150 securities and consistently maintaining a value bias relative to the benchmark. The Portfolio tends to hold securities within the $40 million to $400 million market capitalization range, although it does not require a sale of a holding until it reaches $800 million in market capitalization.
The Year in Review
Equities within the U.S. posted solid gains for the prior 12 months despite several significant macroeconomic headwinds that threatened to pull both the U.S. and global economies into another recession. At the start of this period, U.S. equity investors largely ignored significant events such as the devastating effects of the Japanese earthquake and its aftermath and the resulting supply chain disruptions to several sectors. The mood changed, however, heading into the summer months as the stalemate in Washington around the U.S. debt ceiling debate along with increasing fears about European sovereign debt contagion created considerable angst amongst investors who quickly fled equities for the safety of U.S. Treasuries and other assets perceived as higher quality. This reversed, somewhat, in October as risk aversion began to ease amid optimism that the European debt crisis could be contained. Against this backdrop, micro-cap equities delivered modest returns of 2.1%, as measured by the Russell Microcap® Index, which trailed returns of their large-cap and small-cap brethren, which returned 8.0% and 6.7%, respectively, as measured by the Russell 1000® and Russell 2000® Indexes.
For the 12 months ended October 31, 2011, the Managers Micro-Cap Fund (Service Class) returned 7.78%, compared with 2.11% for its benchmark, the Russell Microcap® Index. All four of the Fund’s subadvisors contributed to the solid outperformance generated by the Fund during this period. A majority of the outperformance was driven by solid stock selection across a number of sectors led by holdings within the consumer discretionary and financials sectors. Within the consumer discretionary sector, holdings returned 14% compared to -5% for benchmark holdings within the same sector. Sector selection, primarily a fallout of the stock selection process for each of the Fund’s subadvisors, was neither a contributor nor detractor to overall relative performance for the period despite significant deviations in positioning from the benchmark. On September 30, 2011 the Managers Micro-Cap Fund and the Managers Institutional Micro-Cap Fund merged and their investment capital was pooled into a single fund offering multiple share classes that we believe could be beneficial to shareholders of both Funds because it could produce economies of scale and other efficiencies.
Looking Forward
Despite recent market volatility, the portfolio managers are optimistic about the forward-looking prospects for the economy and for micro-cap equities. As a result, the Portfolio continues to be invested in more economically sensitive sectors. In fact, the Fund’s largest absolute weight and relative overweight are currently to more cyclically geared consumer discretionary, industrials, and information technology sectors. The portfolio managers continue to avoid the financials sector and maintain a large underweight (15%) to this sector relative to the benchmark. The portfolio managers for the Fund will continue to look to periods as we experienced in August and September as opportunities to add to high conviction holdings within each of their respective portfolios within the Fund.
Cumulative Total Return Performance
Managers Micro-Cap Fund (formerly Managers Fremont Micro-Cap Fund) cumulative total return is based on the daily change in net asset value (NAV), and assumes that all distributions were reinvested. The Russell Microcap® Index tracks the micro-cap segment of the U.S. equity market. It makes up less than 3% of the U.S. equity market and is represented by the smallest 1,000 securities in the small-cap Russell 2000® Index plus the next 1,000 securities. Unlike the Fund, the above stated index is unmanaged, is not available for investment, and does not incur expenses. This chart compares a hypothetical $10,000 investment made in the Managers Micro-Cap Fund on October 31, 2001, to a $10,000 investment made in the Russell Microcap® Index for the same time period. Performance for periods longer than one year is annualized. The graph and table do not reflect the deduction of taxes that a shareholder would pay on a Fund distribution or redemption of shares. The listed returns for the Fund are net of expenses and the returns for the index exclude expenses. Total returns for the Fund would have been lower had certain expenses not been reduced.
|
Managers Micro-Cap Fund Portfolio Manager’s Comments (continued) |
Cumulative Total Return Performance (continued)
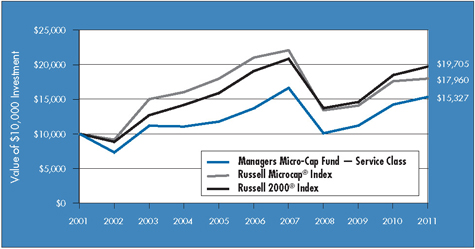
The table below shows the average annual total returns for the Managers Micro-Cap Fund since inception through October 31, 2011 and the Russell Microcap® Index and the Russell 2000® Index for the same time periods.
| | | | | | | | | | | | | | | | | | |
Average Annual Total Returns1 | | One
Year | | | Five
Years | | | Ten
Years | | | Since
Inception | | | Inception Date |
Managers Micro-Cap Fund2,3 | | | | | | | | | | | | | | | | | | |
Service Class4 | | | 7.78 | % | | | 2.32 | % | | | 4.36 | % | | | 12.37 | % | | 6/30/94 |
Institutional Class5,6 | | | — | | | | — | | | | — | | | | 16.18 | % | | 10/1/11 |
Russell 2000® Index7 | | | 6.71 | % | | | 0.68 | % | | | 7.02 | % | | | 8.14 | % | | 6/30/94† |
Russell Microcap® Index8 | | | 2.11 | % | | | (3.07 | )% | | | 6.03 | % | | | — | | | 6/30/00 |
The performance data shown represents past performance, which is not a guarantee of future results. Current performance may be lower or higher than the performance data quoted. The investment return and principal value of an investment in the Fund will fluctuate so that an investor’s shares, when redeemed, may be worth more or less than their original cost. For performance information through the most recent month end, please call (800) 835-3879 or visit our Web site at www.managersinvest.com.
In choosing a Fund, investors should carefully consider the amount they plan to invest, their investment objectives, the Fund’s investment objectives, risks, charges and expenses before investing. For this and other information, please call (800) 835-3879 or visit www.managersinvest.com for a free prospectus. Read it carefully before investing or sending money. Distributed by Managers Distributors, Inc., member FINRA.
| † | Date reflects the inception date of the Fund, not the index. |
| 1 | Total return equals income yield plus share price change and assumes reinvestment of all dividends and capital gain distributions. Returns are net of fees and may reflect offsets of Fund expenses as described in the Prospectus. No adjustment has been made for taxes payable by shareholders on their reinvested dividends and capital gain distributions. Returns for periods greater than one year are annualized. The listed returns on the Fund are net of expenses and based on the published NAV as of October 31, 2011. All returns are in U.S. dollars($). |
| 2 | The Fund is subject to the special risks associated with investments in micro-cap companies, such as relatively short earnings histories, competitive conditions, less publicly available corporate information, and reliance on a limited number of products. |
| 3 | Fund for which, from time to time, the advisor has waived its fees and/or absorbed Fund expenses, which has resulted in higher returns. |
|
4 Effective October 1, 2011, existing shares of Managers Micro-Cap Fund were reclassified and redesignated as Service Class shares. 5 As of the close of business on September 30, 2011, Managers Institutional Micro Cap Fund (“Institutional Micro Cap”) merged into Managers Micro Cap Fund. Each full and partial share of Institutional Micro Cap was exchanged for shares in the new Institutional Class of Micro Cap in an equivalent dollar amount. 6 Commencement of operations for this class was October 1, 2011. 7 The Russell 2000® Index is composed of the 2,000 smallest stocks in the Russell 3000® Index and is widely regarded in the industry as the premier measure of small-cap stock performance. Unlike the Fund, the stated index is unmanaged, is not available for investment, and does not incur expenses. 8 Performance for the Russell Microcap® Index reflects an inception date of June 30, 2000. The Russell Microcap® Index tracks the micro-cap segment of the U.S. equity market. It makes up less than 3% of the U.S. equity market and is represented by the smallest 1,000 securities in the small-cap Russell 2000® Index plus the next 1,000 securities. Unlike the Fund, the above stated index is unmanaged, is not available for investment, and does not incur expenses. The Russell Microcap® Index and the Russell 2000® Index are trademarks of Russell Investments. Russell® is a trademark of Russell Investments. Not FDIC insured, nor bank guaranteed. May lose value. |
|
Managers Micro-Cap Fund Fund Snapshots October 31, 2011 |
Portfolio Breakdown
| | | | | | | | | | | | |
| | | Managers | | | Russell | | | Russell 2000® | |
Industry | | Micro Cap Fund** | | | Microcap® Index | | | Index | |
Information Technology | | | 26.6 | % | | | 16.7 | % | | | 17.4 | % |
Industrials | | | 18.8 | % | | | 13.9 | % | | | 15.4 | % |
Consumer Discretionary | | | 16.7 | % | | | 12.8 | % | | | 13.3 | % |
Health Care | | | 11.9 | % | | | 17.1 | % | | | 12.5 | % |
Financials | | | 10.8 | % | | | 26.0 | % | | | 21.8 | % |
Energy | | | 4.7 | % | | | 4.8 | % | | | 6.9 | % |
Materials | | | 4.3 | % | | | 3.7 | % | | | 4.5 | % |
Consumer Staples | | | 1.7 | % | | | 2.4 | % | | | 3.6 | % |
Utilities | | | 0.6 | % | | | 1.4 | % | | | 3.7 | % |
Telecommunication Services | | | 0.3 | % | | | 1.2 | % | | | 0.9 | % |
Other Assets and Liabilities | | | 3.6 | % | | | 0.0 | % | | | 0.0 | % |
| ** | As a percentage of net assets |
Top Ten Holdings
| | | | |
| | | Percentage of Net | |
Security Name | | Assets | |
NIC, Inc.* | | | 1.3 | % |
FARO Technologies, Inc.* | | | 1.3 | |
Universal Stainless & Alloy Products, Inc.* | | | 1.2 | |
Acacia Research Corp.* | | | 1.2 | |
AZZ, Inc. | | | 1.2 | |
Steinway Musical Instruments, Inc. | | | 1.2 | |
Columbus McKinnon Corp.* | | | 1.1 | |
Body Central Corp.* | | | 1.1 | |
Tyler Technologies, Inc. | | | 1.1 | |
Maxwell Technologies, Inc. | | | 1.1 | |
| | | | |
Top Ten as a Group | | | 11.8 | % |
| | | | |
| * | Top Ten Holding at April 30, 2011 |
|
| Any sectors, industries, or securities discussed should not be perceived as investment recommendations. Mention of a specific security should not be considered a recommendation to buy or solicitation to sell that security. Specific securities mentioned in this report may have been sold from the Fund’s portfolio of investments by the time you receive this report. |
Managers Micro-Cap Fund
Schedule of Portfolio Investments
October 31, 2011
| | | | | | | | |
| | | Shares | | | Value | |
Common Stocks - 96.4% | | | | | | | | |
Consumer Discretionary - 16.7% | | | | | | | | |
Amerigon, Inc.* | | | 47,919 | | | $ | 735,077 | |
Arctic Cat, Inc.* | | | 17,775 | | | | 361,010 | |
Benihana, Inc.* | | | 125,414 | | | | 1,208,991 | |
BJ’s Restaurants, Inc.* | | | 6,197 | | | | 328,007 | |
Body Central Corp.* | | | 74,460 | | | | 1,563,660 | |
Books-A-Million, Inc. | | | 21,600 | | | | 47,952 | |
Bravo Brio Restaurant Group, Inc.* | | | 43,469 | | | | 844,603 | |
Cache, Inc.* | | | 44,854 | | | | 235,932 | |
Caribou Coffee Co., Inc.* | | | 70,045 | | | | 956,114 | |
Carrols Restaurant Group, Inc.* | | | 18,600 | | | | 173,724 | |
Casual Male Retail Group, Inc.* | | | 337,120 | | | | 1,399,048 | |
Core-Mark Holding Co., Inc.* | | | 4,733 | | | | 158,508 | |
Delta Apparel, Inc.* | | | 44,700 | | | | 805,047 | |
Destination Maternity Corp. | | | 14,585 | | | | 241,673 | |
Famous Dave’s of America, Inc.* | | | 8,325 | | | | 72,760 | |
Francesca’s Holding Corp.* | | | 2,300 | | | | 59,041 | |
Fred’s, Inc. | | | 14,650 | | | | 178,584 | |
Grand Canyon Education, Inc.* | | | 47,628 | | | | 776,813 | |
Haverty Furniture Co., Inc. | | | 14,450 | | | | 167,909 | |
Hibbett Sports, Inc.* | | | 11,073 | | | | 456,097 | |
Hooker Furniture Corp. | | | 17,385 | | | | 168,634 | |
iRobot Corp.* | | | 22,202 | | | | 751,760 | |
Johnson Outdoors, Inc., Class A* | | | 4,925 | | | | 91,556 | |
K12, Inc.* | | | 10,840 | | | | 379,942 | |
Kenneth Cole Productions, Inc.* | | | 28,835 | | | | 310,265 | |
Leapfrog Enterprises, Inc.* | | | 43,350 | | | | 161,696 | |
Lifetime Brands, Inc. | | | 8,700 | | | | 106,401 | |
Mac-Gray Corp. | | | 20,904 | | | | 290,148 | |
Maidenform Brands, Inc.* | | | 30,399 | | | | 747,207 | |
Marcus Corp., The | | | 14,025 | | | | 167,178 | |
McCormick & Schmick’s Seafood | | | | | | | | |
Restaurants, Inc.* | | | 31,699 | | | | 212,383 | |
Midas, Inc.* | | | 21,279 | | | | 194,064 | |
Morton’s Restaurant Group, Inc.* | | | 16,325 | | | | 79,666 | |
Movado Group, Inc. | | | 15,775 | | | | 263,916 | |
Multimedia Games, Inc.* | | | 27,850 | | | | 184,088 | |
Peet’s Coffee & Tea, Inc.* | | | 14,126 | | | | 900,109 | |
R.G. Barry Corp. | | | 95,186 | | | | 1,057,516 | |
Red Robin Gourmet Burgers, Inc.* | | | 8,400 | | |
| 210
,588 |
|
| | | | | | | | |
| | | Shares | | | Value | |
Rocky Brands, Inc.* | | | 6,825 | | | $ | 72,345 | |
Rue21, Inc.* | | | 9,190 | | | | 244,822 | |
Rush Enterprises, Inc., Class A* | | | 21,566 | | | | 416,224 | |
Saga Communications, Inc.* | | | 2,600 | | | | 97,500 | |
Select Comfort Corp.* | | | 34,469 | | | | 715,921 | |
Shuffle Master, Inc.* | | | 20,000 | | | | 212,200 | |
Standard Motor Products, Inc. | | | 21,950 | | | | 341,322 | |
Steinway Musical Instruments, Inc.* | | | 68,349 | | | | 1,722,396 | |
Summer Infant, Inc.* | | | 46,498 | | | | 363,614 | |
True Religion Apparel, Inc.* | | | 22,400 | | | | 759,808 | |
Universal Electronics, Inc.* | | | 78,900 | | | | 1,466,752 | |
West Marine, Inc.* | | | 19,100 | | | | 173,619 | |
Zumiez, Inc.* | | | 26,214 | | | | 596,368 | |
Total Consumer Discretionary | | | | | | | 24,230,558 | |
Consumer Staples - 1.7% | | | | | | | | |
Inter Parfums, Inc. | | | 45,316 | | | | 835,627 | |
Nash Finch Co. | | | 22,800 | | | | 600,096 | |
Omega Protein Corp.* | | | 16,725 | | | | 181,132 | |
Pantry, Inc., The* | | | 12,675 | | | | 179,224 | |
Smart Balance, Inc.* | | | 12,300 | | | | 80,565 | |
Spartan Stores, Inc. | | | 20,750 | | | | 355,240 | |
Susser Holdings Corp.* | | | 7,875 | | | | 172,935 | |
Total Consumer Staples | | | | | | | 2,404,819 | |
Energy - 4.7% | | | | | | | | |
Abraxas Petroleum Corp.* | | | 106,134 | | | | 413,922 | |
GeoResources, Inc.* | | | 49,792 | | | | 1,321,480 | |
Global Geophysical Services, Inc.* | | | 39,473 | | | | 376,572 | |
Gulf Island Fabrication, Inc. | | | 11,191 | | | | 311,669 | |
Gulfport Energy Corp.* | | | 36,500 | | | | 1,136,610 | |
Kodiak Oil & Gas Corp.* | | | 76,060 | | | | 525,575 | |
Magnum Hunter Resources Corp.* | | | 97,415 | | | | 438,368 | |
Natural Gas Services Group, Inc.* | | | 12,450 | | | | 171,312 | |
North American Energy Partners, Inc.* | | | 43,564 | | | | 306,255 | |
OYO Geospace Corp.* | | | 12,675 | | | | 996,002 | |
Panhandle Oil and Gas, Inc. | | | 5,750 | | | | 191,590 | |
Rex Energy Corp.* | | | 45,700 | | | | 707,436 | |
Total Energy | | | | | | | 6,896,791 | |
Financials - 10.8% | | | | | | | | |
Advance America Cash Advance | | | | | | | | |
Centers, Inc. | | | 28,325 | | | | 238,780 | |
Alliance Financial Corp. | | | 3,000 | | | | 92,370 | |
|
The accompanying notes are an integral part of these financial statements. 21 |
Managers Micro-Cap Fund
Schedule of Portfolio Investments (continued)
| | | | | | | | |
| | | Shares | | | Value | |
Financials - 10.8% (continued) | | | | | | | | |
Altisource Portfolio Solutions S.A.* | | | 17,918 | | | $ | 721,200 | |
Amerisafe, Inc.* | | | 43,375 | | | | 934,731 | |
Associated Estates Realty Corp. | | | 9,718 | | | | 165,012 | |
Asta Funding, Inc. | | | 54,800 | | | | 441,688 | |
Bancorp, Inc., The* | | | 30,786 | | | | 247,519 | |
Bank of Marin Bancorp | | | 6,850 | | | | 242,764 | |
Boston Private Financial Holdings, Inc. | | | 34,800 | | | | 263,784 | |
Calamos Asset Management, Inc., Class A | | | 13,350 | | | | 166,742 | |
Cardinal Financial Corp. | | | 23,850 | | | | 256,149 | |
CoBiz Financial, Inc. | | | 33,100 | | | | 175,430 | |
Cogdell Spencer, Inc. | | | 20,500 | | | | 82,820 | |
Community Trust Bancorp, Inc. | | | 13,561 | | | | 384,183 | |
Compass Diversified Holdings | | | 86,700 | | | | 1,132,302 | |
Crawford & Co., Class B | | | 24,300 | | | | 172,773 | |
CYS Investments, Inc. | | | 8,900 | | | | 112,852 | |
DFC Global Corp.* | | | 16,194 | | | | 354,972 | |
Encore Capital Group, Inc.* | | | 25,379 | | | | 687,517 | |
Financial Engines, Inc.* | | | 28,757 | | | | 653,071 | |
Financial Institutions, Inc. | | | 10,875 | | | | 178,132 | |
First Merchants Corp. | | | 21,750 | | | | 175,305 | |
First of Long Island Corp., The | | | 7,525 | | | | 192,264 | |
First PacTrust Bancorp, Inc. | | | 24,700 | | | | 310,726 | |
Flushing Financial Corp. | | | 27,850 | | | | 341,441 | |
German American Bancorp, Inc. | | | 5,050 | | | | 87,718 | |
Great Southern Bancorp, Inc. | | | 4,800 | | | | 95,472 | |
Heartland Financial USA, Inc. | | | 5,875 | | | | 91,826 | |
Home Bancshares, Inc. | | | 3,900 | | | | 91,455 | |
Imperial Holdings, Inc.* | | | 25,063 | | | | 56,392 | |
Independent Bank Corp. (MA) | | | 11,240 | | | | 291,341 | |
JMP Group, Inc. | | | 12,150 | | | | 90,153 | |
Kite Realty Group Trust | | | 39,000 | | | | 161,070 | |
Lakeland Financial Corp. | | | 15,300 | | | | 365,517 | |
LaSalle Hotel Properties | | | 18,600 | | | | 444,726 | |
MarketAxess Holdings, Inc. | | | 10,882 | | | | 318,081 | |
Meadowbrook Insurance Group, Inc. | | | 43,583 | | | | 451,520 | |
Mission West Properties, Inc. | | | 10,694 | | | | 83,199 | |
National Bankshares, Inc. | | | 9,400 | | | | 262,730 | |
National Interstate Corp. | | | 28,800 | | | | 766,080 | |
Northrim Bancorp, Inc. | | | 29,126 | | | | 551,938 | |
OceanFirst Financial Corp., Inc. | | | 14,950 | | | | 194,948 | |
Ramco-Gershenson Properties Trust | | | 29,750 | | | | 287,088 | |
| | | | | | | | |
| | | Shares | | | Value | |
S.Y. Bancorp, Inc. | | | 16,790 | | | $ | 345,538 | |
SeaBright Insurance Holdings, Inc. | | | 22,200 | | | | 159,396 | |
Southside Bancshares, Inc. | | | 12,283 | | | | 252,661 | |
Territorial Bancorp, Inc. | | | 8,225 | | | | 161,621 | |
United Financial Bancorp, Inc. | | | 10,900 | | | | 175,926 | |
Urstadt Biddle Properties, Inc., Class A | | | 10,500 | | | | 187,320 | |
Virginia Commerce Bancorp, Inc.* | | | 13,850 | | | | 88,086 | |
Walter Investment Management Corp. | | | 8,787 | | | | 222,838 | |
Washington Banking Co. | | | 32,300 | | | | 381,786 | |
Washington Trust Bancorp, Inc. | | | 11,975 | | | | 281,174 | |
West Bancorporation, Inc. | | | 9,625 | | | | 94,710 | |
Total Financials | | | | | | | 15,766,837 | |
Health Care - 11.9% | | | | | | | | |
Akorn, Inc.* | | | 130,808 | | | | 1,175,964 | |
Almost Family, Inc.* | | | 8,350 | | | | 155,644 | |
Amarin Corp. PLC, Sponsored ADR* | | | 29,360 | | | | 275,984 | |
AngioDynamics, Inc.* | | | 16,025 | | | | 246,945 | |
Assisted Living Concepts, Inc. | | | 12,300 | | | | 174,783 | |
Biolase Technology, Inc.* | | | 95,249 | | | | 346,706 | |
BioScrip, Inc.* | | | 95,400 | | | | 620,100 | |
Caliper Life Science, Inc.* | | | 7,625 | | | | 79,910 | |
Cantel Medical Corp. | | | 12,775 | | | | 352,590 | |
Computer Programs & Systems, Inc. | | | 7,025 | | | | 358,767 | |
CryoLife, Inc.* | | | 34,000 | | | | 156,740 | |
Derma Sciences, Inc.* | | | 25,553 | | | | 213,368 | |
DexCom, Inc.* | | | 31,951 | | | | 312,800 | |
Endologix, Inc.* | | | 94,471 | | | | 1,028,789 | |
Ensign Group, Inc.,The | | | 6,875 | | | | 156,475 | |
Epocrates, Inc.* | | | 22,279 | | | | 193,827 | |
Exactech, Inc.* | | | 37,500 | | | | 600,000 | |
Fluidigm Corp.* | | | 35,123 | | | | 490,317 | |
Genomic Health, Inc.* | | | 16,138 | | | | 345,353 | |
HealthStream, Inc.* | | | 23,121 | | | | 350,977 | |
Healthways, Inc.* | | | 27,600 | | | | 197,616 | |
Insulet Corp.* | | | 37,336 | | | | 609,324 | |
Ista Pharmaceuticals, Inc.* | | | 56,050 | | | | 232,047 | |
Kensey Nash Corp.* | | | 28,100 | | | | 755,328 | |
LHC Group, Inc.* | | | 4,600 | | | | 72,174 | |
MedQuist Holdings, Inc.* | | | 42,900 | | | | 366,795 | |
MEDTOX Scientific, Inc.* | | | 5,575 | | | | 81,618 | |
Merge Healthcare, Inc.* | | | 48,490 | | | | 320,034 | |
Meridian Bioscience, Inc. | | | 18,700 | 2 | | | 340,714 | |
|
The accompanying notes are an integral part of these financial statements. 22 |
Managers Micro-Cap Fund
Schedule of Portfolio Investments (continued)
| | | | | | | | |
| | | Shares | | | Value | |
Health Care - 11.9% (continued) | | | | | | | | |
Merit Medical Systems, Inc.* | | | 18,632 | | | $ | 250,041 | |
Metro Health Networks, Inc.* | | | 38,550 | | | | 251,346 | |
MWI Veterinary Supply, Inc.* | | | 4,217 | | | | 318,384 | |
NxStage Medical, Inc.* | | | 41,583 | | | | 955,993 | |
Optimer Pharmaceuticals, Inc.* | | | 30,700 | | | | 438,089 | |
OraSure Technologies, Inc.* | | | 50,144 | | | | 465,838 | |
Palomar Medical Technologies, Inc.* | | | 22,056 | | | | 187,697 | |
Sagent Pharmaceuticals, Inc.* | | | 20,535 | | | | 524,669 | |
Staar Surgical Co.* | | | 31,400 | | | | 282,600 | |
Symmetry Medical, Inc.* | | | 31,775 | | | | 288,835 | |
Synergetics USA, Inc.* | | | 28,450 | | | | 190,330 | |
Synovis Life Technologies, Inc.* | | | 29,052 | | | | 521,774 | |
Trans1, Inc.* | | | 125,400 | | | | 228,228 | |
Transcend Services, Inc.* | | | 16,994 | | | | 464,446 | |
U.S. Physical Therapy, Inc. | | | 55,976 | | | | 1,092,652 | |
Young Innovations, Inc. | | | 5,847 | | | | 168,101 | |
Zeltiq Aesthetics, Inc.* | | | 9,500 | | | | 135,375 | |
Total Health Care | | | | | | | 17,376,087 | |
Industrials - 18.8% | | | | | | | | |
Acacia Research Corp.* | | | 44,200 | | | | 1,760,929 | |
Acco Brands Corp.* | | | 94,400 | | | | 648,528 | |
Air Transport Services Group, Inc.* | | | 105,400 | | | | 583,916 | |
Alamo Group, Inc. | | | 7,459 | | | | 177,897 | |
Allied Defense Group, Inc., The* | | | 38,600 | | | | 121,590 | |
American Ecology Corp. | | | 19,971 | | | | 360,676 | |
Apogee Enterprises, Inc. | | | 18,220 | | | | 198,962 | |
Astronics Corp.* | | | 22,772 | | | | 692,269 | |
AZZ, Inc. | | | 39,200 | | | | 1,750,672 | |
CAI International, Inc.* | | | 23,625 | | | | 368,786 | |
Capstone Turbine Corp.* | | | 298,486 | | | | 325,350 | |
Cascade Corp. | | | 7,875 | | | | 339,412 | |
CBIZ, Inc.* | | | 50,795 | | | | 321,532 | |
Celadon Group, Inc.* | | | 29,682 | | | | 326,799 | |
Chart Industries, Inc.* | | | 21,360 | | | | 1,207,054 | |
Columbus McKinnon Corp.* | | | 108,600 | | | | 1,627,914 | |
Commercial Vehicle Group, Inc.* | | | 43,376 | | | | 478,437 | |
CRA International, Inc.* | | | 20,850 | | | | 402,822 | |
Ducommun, Inc. | | | 51,175 | | | | 730,267 | |
Dynamic Materials Corp. | | | 52,413 | | | | 1,137,362 | |
Electro Rent Corp. | | | 5,925 | | | | 95,215 | |
Ennis, Inc. | | | 47,350 | | | | 692,730 | |
| | | | | | | | |
| | | Shares | | | Value | |
Exponent, Inc.* | | | 7,630 | | | $ | 367,613 | |
Furmanite Corp.* | | | 74,262 | | | | 495,328 | |
G&K Services, Inc., Class A | | | 9,050 | | | | 274,758 | |
Gibraltar Industries, Inc.* | | | 17,775 | | | | 198,369 | |
GP Strategies Corp.* | | | 13,449 | | | | 158,967 | |
Graham Corp. | | | 31,773 | | | | 732,050 | |
Greenbrier Co., Inc.* | | | 50,091 | | | | 932,194 | |
Heritage-Crystal Clean, Inc.* | | | 22,059 | | | | 351,620 | |
Hurco Companies, Inc.* | | | 19,621 | | | | 512,501 | |
Interface, Inc., Class A | | | 59,900 | | | | 781,096 | |
KEYW Holding Corp., The* | | | 55,300 | | | | 464,520 | |
LB Foster Co., Class A | | | 24,650 | | | | 628,575 | |
Marten Transport, Ltd. | | | 24,825 | | | | 439,651 | |
Met-Pro Corp. | | | 24,425 | | | | 220,069 | |
Michael Baker Corp.* | | | 14,600 | | | | 300,468 | |
Miller Industries, Inc. | | | 13,475 | | | | 275,429 | |
Multi-Color Corp. | | | 6,925 | | | | 183,582 | |
MYR Group, Inc.* | | | 25,839 | | | | 498,434 | |
NN, Inc.* | | | 41,150 | | | | 363,766 | |
Old Dominion Freight Line, Inc.* | | | 7,450 | | | | 272,446 | |
Orion Marine Group, Inc.* | | | 28,200 | | | | 191,478 | |
PGT, Inc.* | | | 152,400 | | | | 222,504 | |
RBC Bearings, Inc.* | | | 15,344 | | | | 621,432 | |
Saia, Inc.* | | | 14,266 | | | | 190,451 | |
Standard Parking Corp.* | | | 16,221 | | | | 285,327 | |
Sun Hydraulics Corp. | | | 42,924 | | | | 1,234,494 | |
Thermon Group Holdings, Inc.* | | | 50,885 | | | | 808,054 | |
Titan International, Inc. | | | 19,966 | | | | 449,235 | |
Universal Truckload Services, Inc. | | | 10,575 | | | | 164,124 | |
Westport Innovations, Inc.* | | | 9,825 | | | | 297,206 | |
Zipcar, Inc.* | | | 6,895 | | | | 141,004 | |
Total Industrials | | | | | | | 27,405,864 | |
Information Technology - 26.6% | | | | | | | | |
Actuate Corp.* | | | 56,038 | | | | 364,247 | |
Allot Communications, Ltd.* | | | 30,953 | | | | 413,842 | |
American Software, Inc., Class A | | | 22,250 | | | | 173,995 | |
Amtech Systems, Inc.* | | | 22,450 | | | | 229,439 | |
Anaren Microwave, Inc.* | | | 16,525 | | | | 316,123 | |
Archipelago Learning, Ltd.* | | | 18,675 | | | | 190,298 | |
Aspen Technology, Inc.* | | | 34,100 | | | | 591,294 | |
BroadSoft, Inc.* | | | 11,074 | | | | 398,664 | |
Carbonite, Inc.* | | | 34,200 | | | | 431,604 | |
|
The accompanying notes are an integral part of these financial statements. 23 |
Managers Micro-Cap Fund
Schedule of Portfolio Investments (continued)
| | | | | | | | |
| | | Shares | | | Value | |
Information Technology - 26.6% (continued) | | | | | | | | |
Ceva, Inc.* | | | 7,361 | | | $ | 228,706 | |
Cohu, Inc. | | | 14,925 | | | | 165,518 | |
Computer Task Group, Inc.* | | | 70,150 | | | | 895,816 | |
comScore, Inc.* | | | 29,114 | | | | 614,597 | |
Constant Contact, Inc.* | | | 10,502 | | | | 212,560 | |
Convio, Inc.* | | | 50,687 | | | | 486,088 | |
Cornerstone OnDemand, Inc.* | | | 54,770 | | | | 789,236 | |
CTS Corp. | | | 35,500 | | | | 329,440 | |
Datalink Corp.* | | | 19,700 | | | | 186,756 | |
Dice Holdings, Inc.* | | | 40,509 | | | | 412,382 | |
Digi International, Inc.* | | | 26,083 | | | | 333,602 | |
DSP Group, Inc.* | | | 34,600 | | | | 213,828 | |
DTS, Inc.* | | | 16,273 | | | | 457,109 | |
Dynamics Research Corp.* | | | 24,325 | | | | 234,493 | |
Echo Global Logistics, Inc.* | | | 21,264 | | | | 328,316 | |
Ellie Mae, Inc.* | | | 80,312 | | | | 409,591 | |
ExlService Holdings, Inc.* | | | 20,962 | | | | 546,689 | |
FARO Technologies, Inc.* | | | 43,853 | | | | 1,832,178 | |
Globecomm Systems, Inc.* | | | 23,500 | | | | 319,365 | |
Hackett Group, Inc., The* | | | 21,500 | | | | 88,795 | |
InfoSpace, Inc.* | | | 25,375 | | | | 222,285 | |
Inphi Corp.* | | | 40,057 | | | | 442,229 | |
Interactive Intelligence Group, Inc.* | | | 38,900 | | | | 1,079,475 | |
IXYS Corp.* | | | 18,612 | | | | 254,426 | |
Jiayuan.Com International, Ltd., Sponsored ADR* | | | 27,000 | | | | 279,990 | |
Kenexa Corp.* | | | 27,170 | | | | 621,378 | |
KIT Digital, Inc.* | | | 20,824 | | | | 187,416 | |
Lionbridge Technologies, Inc.* | | | 112,200 | | | | 304,062 | |
Liquidity Services, Inc.* | | | 32,543 | | | | 1,059,600 | |
LivePerson, Inc.* | | | 96,126 | | | | 1,210,226 | |
LogMeIn, Inc.* | | | 8,224 | | | | 334,470 | |
Marchex, Inc. | | | 7,975 | | | | 70,898 | |
MaxLinear, Inc., Class A* | | | 25,774 | | | | 150,005 | |
Maxwell Technologies, Inc.* | | | 76,599 | | | | 1,529,682 | |
Methode Electronics, Inc. | | | 33,568 | | | | 311,847 | |
Mitek Systems, Inc.* | | | 51,300 | | | | 518,643 | |
Multi-Fineline Electronix, Inc.* | | | 3,775 | | | | 86,598 | |
NCI, Inc., Class A* | | | 15,275 | | | | 208,504 | |
NeoPhotonics Corp.* | | | 41,495 | | | | 217,019 | |
NetQin Mobile, Inc., Sponsored ADR* | | | 48,700 | | | | 263,467 | |
| | | | | | | | |
| | | Shares | | | Value | |
NIC, Inc. | | | 137,764 | | | $ | 1,902,521 | |
OCZ Technology Group, Inc.* | | | 43,996 | | | | 311,052 | |
Oplink Communications, Inc.* | | | 18,043 | | | | 292,657 | |
OPNET Technologies, Inc. | | | 15,935 | | | | 696,997 | |
PC Connection, Inc.* | | | 18,446 | | | | 154,024 | |
PROS Holdings, Inc.* | | | 14,306 | | | | 226,893 | |
Radisys Corp.* | | | 21,325 | | | | 124,964 | |
RDA Microelectronics, Inc., Sponsored ADR* | | | 67,756 | | | | 548,824 | |
Responsys, Inc.* | | | 46,165 | | | | 504,122 | |
RightNow Technologies, Inc.* | | | 5,947 | | | | 255,780 | |
Rogers Corp.* | | | 4,400 | | | | 189,948 | |
ServiceSource International, Inc.* | | | 37,962 | | | | 505,274 | |
ShoreTel, Inc.* | | | 62,155 | | | | 363,607 | |
Sierra Wireless, Inc.* | | | 45,311 | | | | 339,832 | |
Silicon Image, Inc.* | | | 42,435 | | | | 273,281 | |
Sourcefire, Inc.* | | | 38,818 | | | | 1,069,436 | |
SPS Commerce, Inc.* | | | 32,179 | | | | 629,421 | |
STEC, Inc.* | | | 21,600 | | | | 244,512 | |
Symmetricom, Inc.* | | | 29,242 | | | | 150,596 | |
Synchronoss Technologies, Inc.* | | | 9,779 | | | | 293,957 | |
Tangoe, Inc.* | | | 41,846 | | | | 562,829 | |
TESSCO Technologies, Inc. | | | 54,800 | | | | 762,816 | |
TNS, Inc.* | | | 17,800 | | | | 347,634 | |
Tyler Technologies, Inc.* | | | 49,300 | | | | 1,556,401 | |
Velti PLC* | | | 30,933 | | | | 260,456 | |
Virtusa Corp.* | | | 68,535 | | | | 1,116,435 | |
Vishay Precision Group, Inc.* | | | 10,650 | | | | 155,384 | |
Vocus, Inc.* | | | 50,123 | | | | 1,021,507 | |
Volterra Semiconductor Corp.* | | | 34,401 | | | | 815,304 | |
Xyratex, Ltd. | | | 106,300 | | | | 1,449,932 | |
Zillow, Inc.* | | | 100 | | | | 2,969 | |
Total Information Technology | | | | | | | 38,676,156 | |
Materials - 4.3% | | | | | | | | |
Flotek Industries, Inc.* | | | 59,389 | | | | 441,854 | |
Koppers Holdings, Inc. | | | 44,370 | | | | 1,468,204 | |
Landec Corp.* | | | 55,800 | | | | 346,518 | |
Materion Corp.* | | | 27,614 | | | | 730,114 | |
Myers Industries, Inc. | | | 35,100 | | | | 428,922 | |
Omnova Solutions, Inc.* | | | 116,800 | | | | 517,424 | |
Penford Corp.* | | | 14,100 | | | | 72,051 | |
Quaker Chemical Corp. | | | 4,950 | | | | 172,210 | |
|
The accompanying notes are an integral part of these financial statements. 24 |
Managers Micro-Cap Fund
Schedule of Portfolio Investments (continued)
| | | | | | | | |
| | | Shares | | | Value | |
Materials - 4.3% (continued) | | | | | | | | |
Spartech Corp.* | | | 37,350 | | | $ | 151,641 | |
UFP Technologies, Inc.* | | | 4,925 | | | | 74,269 | |
Universal Stainless & Alloy Products, Inc.* | | | 47,350 | | | | 1,782,728 | |
Total Materials | | | | | | | 6,185,935 | |
Telecommunication Services - 0.3% | | | | | | | | |
Premiere Global Services, Inc.* | | | 18,200 | | | | 164,892 | |
SureWest Communications | | | 29,025 | | | | 332,917 | |
Total Telecommunication Services | | | | | | | 497,809 | |
Utilities - 0.6% | | | | | | | | |
Chesapeake Utilities Corp. | | | 8,075 | | | | 342,299 | |
Unitil Corp. | | | 21,000 | | | | 560,070 | |
Total Utilities | | | | | | | 902,369 | |
Total Common Stocks
(cost $123,080,776) | | | | | | | 140,343,225 | |
| | | | | | | | |
| | | Shares | | | Value | |
Exchange Traded Fund - 0.5% | | | | | | | | |
SPDR KBW Regional Banking
(cost $647,336) | | | 30,600 | | | $ | 717,876 | |
Short-Term Investments - 2.5%1 | | | | | | | | |
BNY Mellon Overnight Government Fund, 0.10%3 | | | 125,400 | | | | 125,400 | |
Dreyfus Cash Management Fund, Institutional Class Shares, 0.05% | | �� | 3,460,879 | | | | 3,460,879 | |
Total Short-Term Investments
(cost $3,586,279) | | | | | | | 3,586,279 | |
Total Investments - 99.4%
(cost $127,314,391) | | | | | | | 144,647,380 | |
Other Assets, less Liabilities - 0.6% | | | | | | | 829,759 | |
Net Assets - 100.0% | | | | | | $ | 145,477,139 | |
|
The accompanying notes are an integral part of these financial statements. 25 |
Managers Real Estate Securities Fund
Portfolio Manager’s Comments
Managers Real Estate Securities Fund seeks a combination of income and long-term capital appreciation by investing in stocks of companies that are principally engaged in owning and operating commercial real estate properties for the benefit of their investors, including real estate investment trusts (REITs). Managers Investment Group LLC utilizes an independent subadvisor, Urdang Securities Management, Inc (“Urdang”), to manage the assets of this Portfolio.
The Portfolio Manager
Urdang Securities Management, Inc.
The investment team at Urdang believes real estate securities play an important role in a multi-asset class investment portfolio. Urdang’s strategy recognizes that real estate securities are not simply stocks, or real estate. They are hybrid financial investments that must be valued on the basis of a number of meaningful factors, only one of which is the value of the firm’s property portfolio. To accurately assess the relative value of a REIT, Urdang takes into account critical business and market factors, such as: the company’s capitalization, its position within public capital markets, and the quality of the management team.
Urdang believes that investment success is the result of the company’s ability to provide a consistently accurate answer to the question at the heart of its value-oriented investment strategy: Which REITs do they believe will generate the highest risk-adjusted returns? Urdang believes that a diversified portfolio with a value orientation will result in strong risk-adjusted returns.
Urdang employs a value-oriented investment process with two distinct and complementary components: bottom-up real estate research and the company’s proprietary Relative Value Model (RVM) securities valuation process, which was designed to provide a uniform basis for evaluating the validity of a security’s trading price. Combining real estate research and the RVM process has been central to Urdang’s track record of delivering strong returns without incurring high levels of risk.
The Year in Review
For the 12 months ended October 31, 2011, the Managers Real Estate Securities Fund returned 11.06%, compared with 11.67% for its benchmark, the Dow Jones U.S. Select REIT Index. During the same period the S&P 500 Index returned 8.09%.
Along with the broader equity markets, the U.S. REIT market generally experienced positive total returns through the first nine months of the fiscal year. Starting in July, however, the seeming inability of policy makers to find a solution to the European sovereign debt crisis along with unfavorable economic data from many parts of the world renewed fears about the sustainability of the global recovery and roiled world equity markets during the period. As a result, the markets turned down sharply in August and September before rebounding in October.
There was a high degree of variability in returns across sectors during the year. For example, the two best performing property sectors—self storage and regional malls—posted total returns of 33.2% and 26.9%, but the two worst performing sectors—hotels and specialty—generated total returns of negative 9.5% and negative 0.2%. Property fundamentals steadily improved for all property sectors throughout the year. In the first part of the year, real estate fundamentals rose the most for those sectors that are most sensitive to improvement in the macro economy such as apartments, self storage and hotels. But across the real estate spectrum vacancy rates and rental rates are up and concessions are down from the cyclical bottom.
Stock selection within the hotel, self-storage and specialty sectors caused the Fund to modestly underperform the benchmark during the year. Relative results were partially offset by positive stock selection in six out of ten sectors, the strongest including residential, office and shopping center stocks. Sector performance benefited most from the Fund’s conservative positioning in property types that are less sensitive to the economic cycle, most notably health care and net lease. An overweight to the apartment sector early in the year followed by an underweight in the middle of the year and then finally a return to overweight at the end of the year, resulted in meaningful positive sector selection alpha. The Fund’s underweight to self-storage was a modest detractor. U.S. REITs have not been immune to the widespread economic uncertainty afflicting the financial markets. However, we are confident that today’s REITs valuations offer long-term investors an opportunity to acquire quality stocks with strong assets at attractive valuations. Current REIT share prices compare favorably to prices paid for real estate assets in the private market and relative to construction cost. A low-yield, low growth macro-economic environment could be good for REITs. REITs should benefit from the search for yield by investors as they are income investment vehicles and REITs should benefit from low absolute interest rates as they are capital intensive. REITs offer a compelling dividend yield and even potential for dividend growth. The yield spread to the 10-year U.S. Treasury yield is nearly double its long-run average.
This commentary reflects the viewpoints of the portfolio manager, Urdang Securities Management, as of October 31, 2011 and is not intended as a forecast or guarantee of future results.
Cumulative Total Return Performance
The Fund’s cumulative total return is based on the daily change in net asset value (NAV), and assumes that all distributions were reinvested. The Dow Jones U.S. Select REIT Index measures U.S. publicly traded Real Estate Investment Trusts. Unlike the Fund, the Dow Jones U.S. Select REIT Index is unmanaged, is not available to investment, and does not incur expenses. The chart illustrates the performance of a hypothetical $10,000 investment made in the Managers Real Estate Securities Fund on October 31, 2001, to a $10,000 investment made in the Dow Jones U.S. Select REIT
|
Managers Real Estate Securities Fund Portfolio Manager’s Comments (continued) |
Cumulative Total Return Performance (continued)
Index for the same time period. Performance for periods longer than one year is annualized. The graph and table do not reflect the deduction of taxes that a shareholder would pay on a Fund distribution or redemption of shares. The listed returns for the Fund are net of expenses and the returns for the index exclude expenses. Total returns for the Fund would have been lower had certain expenses not been reduced.
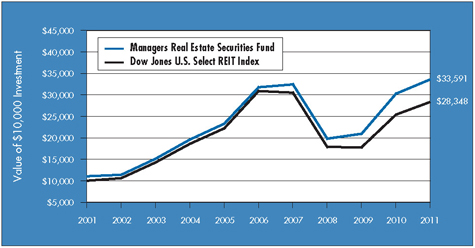
The table below shows the average annual total returns for the Managers Real Estate Securities Fund and the Dow Jones U.S. Select REIT Index for the one-year, five-year and ten-year periods ended October 31, 2011.
| | | | | | | | | | | | |
Average Annual Total Returns1 | | One Year | | | Five Years | | | Ten Years | |
Managers Real Estate Securities Fund2,3 | | | 11.06 | % | | | 1.13 | % | | | 11.77 | % |
Dow Jones U.S. Select REIT Index4 | | | 11.67 | % | | | (1.69 | )% | | | 10.98 | % |
The performance data shown represents past performance, which is not a guarantee of future results. Current performance may be lower or higher than the performance data quoted. The investment return and principal value of an investment in the Fund will fluctuate so that an investor’s shares, when redeemed, may be worth more or less than their original cost. For performance information through the most recent month end, please call (800) 835-3879 or visit our Web site at www.managersinvest.com.
In choosing a Fund, investors should carefully consider the amount they plan to invest, their investment objectives, the Fund’s investment objectives, risks, charges and expenses before investing. For this and other information, please call (800) 835-3879 or visit www.managersinvest.com for a free prospectus. Read it carefully before investing or sending money. Distributed by Managers Distributors, Inc., member FINRA.
| 1 | Total return equals income yield plus share price change and assumes reinvestment of all dividends and capital gain distributions. Returns are net of fees and may reflect offsets of Fund expenses as described in the Prospectus. No adjustment has been made for taxes payable by shareholders on their reinvested dividends and capital gain distributions. Returns for periods greater than one year are annualized. The listed returns on the Fund are net of expenses and based on the published NAV as of October 31, 2011. All returns are in U.S. dollars($). |
|
2 Fund for which, from time to time,
the advisor has waived fees or
reimbursed expenses, which may
have resulted in higher returns.
3 The Fund is subject to special risk
considerations similar to those
associated with the direct ownership
of real estate. Real estate valuations
may be subject to factors such as
changing general and local
economic, financial, competitive,
and environmental conditions.
4 The Dow Jones U.S. Select REIT
Index measures U.S. publicly traded
Real Estate Investment Trusts.
Unlike the Fund, the Dow Jones
U.S. Select REIT Index is
unmanaged, is not available to
investment, and does not incur
expenses. Not FDIC insured, nor bank guaranteed.
May lose value. |
|
Managers Real Estate Securities Fund Fund Snapshots October 31, 2011 |
Portfolio Breakdown
| | | | |
Industry | | Managers Real Estate
Securities Fund** | |
REITSs (Apartments) | | | 17.7 | % |
REITSs (Offce Property) | | | 14.9 | % |
REITSs (Regional Malls) | | | 14.8 | % |
REITSs (Health Care) | | | 13.4 | % |
REITSs (Diversified) | | | 10.0 | % |
REITSs (Shopping Centers) | | | 6.2 | % |
REITSs (Storage) | | | 5.5 | % |
REITSs (Hotels) | | | 5.1 | % |
REITSs (Warehouse/Industrials) | | | 4.9 | % |
REITSs (Single Tenant) | | | 1.8 | % |
REOCs (Hotels) | | | 0.7 | % |
Other Assets and Liabilities | | | 5.0 | % |
| ** | As a percentage of net assets |
Top Ten Holdings
| | | | |
Security Name | | Percentage
of Net Assets | |
Simon Property Group, Inc.* | | | 7.2 | % |
| |
Equity Residential* | | | 6.0 | |
| |
Ventas, Inc.* | | | 5.2 | |
| |
ProLogis, Inc.* | | | 4.9 | |
| |
Macerich Co., The* | | | 4.6 | |
| |
Public Storage, Inc.* | | | 4.6 | |
| |
Vornado Realty Trust* | | | 4.2 | |
| |
Health Care REIT, Inc.* | | | 4.2 | |
| |
Boston Properties, Inc.* | | | 3.6 | |
| |
HCP, Inc. | | | 3.3 | |
| | | | |
| |
Top Ten as a Group | | | 47.8 | % |
| | | | |
| * | Top Ten Holding at April 30, 2011 |
|
| Any sectors, industries, or securities discussed should not be perceived as investment recommendations. Mention of a specific security should not be considered a recommendation to buy or solicitation to sell that security. Specific securities mentioned in this report may have been sold from the Fund’s portfolio of investments by the time you receive this report. |
Managers Real Estate Securities Fund
Schedule of Portfolio Investments
October 31, 2011
| | | | | | | | |
| | | Shares | | | Value | |
REITs - 94.3% | | | | | | | | |
Apartments - 17.7% | | | | | | | | |
American Campus Communities, Inc. | | | 10,870 | | | $ | 423,169 | |
AvalonBay Communities, Inc. | | | 5,470 | | | | 731,284 | |
Camden Property Trust | | | 19,080 | | | | 1,157,011 | |
Colonial Properties Trust | | | 51,680 | | | | 1,048,070 | |
Equity Residential | | | 56,440 | | | | 3,311,899 | |
Essex Property Trust, Inc. | | | 9,500 | | | | 1,356,220 | |
Home Properties, Inc. | | | 14,330 | | | | 844,037 | |
UDR, Inc. | | | 39,030 | | | | 973,018 | |
Total Apartments | | | | | | | 9,844,708 | |
Diversified - 10.0% | | | | | | | | |
Digital Realty Trust, Inc. | | | 20,510 | | | | 1,278,389 | |
Duke Realty Corp. | | | 66,540 | | | | 817,111 | |
Liberty Property Trust | | | 34,160 | | | | 1,093,120 | |
Vornado Realty Trust | | | 28,410 | | | | 2,352,632 | |
Total Diversified | | | | | | | 5,541,252 | |
Health Care - 13.4% | | | | | | | | |
HCP, Inc. | | | 46,610 | | | | 1,857,408 | |
Health Care REIT, Inc. | | | 44,040 | | | | 2,320,468 | |
Senior Housing Properties Trust | | | 18,620 | | | | 417,833 | |
Ventas, Inc. | | | 51,640 | | | | 2,871,700 | |
Total Health Care | | | | | | | 7,467,409 | |
Hotels - 5.1% | | | | | | | | |
DiamondRock Hospitality Co. | | | 35,680 | | | | 322,904 | |
Host Hotels & Resorts, Inc. | | | 85,310 | | | | 1,217,374 | |
LaSalle Hotel Properties | | | 14,920 | | | | 356,737 | |
Pebblebrook Hotel Trust | | | 5,570 | | | | 105,997 | |
RLJ Lodging Trust | | | 26,400 | | | | 391,248 | |
Sunstone Hotel Investors, Inc.* | | | 61,460 | | | | 427,147 | |
Total Hotels | | | | | | | 2,821,407 | |
Office Properties - 14.9% | | | | | | | | |
Alexandria Real Estate Equities, Inc. | | | 23,700 | | | | 1,566,333 | |
Boston Properties, Inc. | | | 20,490 | | | | 2,028,305 | |
Brandywine Realty Trust | | | 55,260 | | | | 503,419 | |
CommonWealth REIT | | | 52,710 | | | | 1,019,938 | |
Douglas Emmett, Inc. | | | 19,480 | | | | 379,860 | |
Hudson Pacific Properties, Inc. | | | 31,450 | | | | 420,172 | |
Kilroy Realty Corp. | | | 11,480 | | | | 421,201 | |
| | | | | | | | |
| | | Shares | | | Value | |
Mack-Cali Realty Corp. | | | 23,410 | | | $ | 656,885 | |
SL Green Realty Corp. | | | 18,480 | | | | 1,274,935 | |
Total Office Properties | | | | | | | 8,271,048 | |
Regional Malls - 14.8% | | | | | | | | |
General Growth Properties, Inc. | | | 41,680 | | | | 612,696 | |
Macerich Co., The | | | 52,020 | | | | 2,588,515 | |
Simon Property Group, Inc. | | | 31,010 | | | | 3,982,925 | |
Tanger Factory Outlet Centers, Inc. | | | 17,970 | | | | 506,035 | |
Taubman Centers, Inc. | | | 8,630 | | | | 528,415 | |
Total Regional Malls | | | | | | | 8,218,586 | |
Shopping Centers - 6.2% | | | | | | | | |
Acadia Realty Trust | | | 14,040 | | | | 290,909 | |
Equity One, Inc. | | | 17,040 | | | | 292,236 | |
Excel Trust, Inc. | | | 18,860 | | | | 198,219 | |
Federal Realty Investment Trust | | | 5,520 | | | | 489,955 | |
Kimco Realty Corp. | | | 86,580 | | | | 1,512,553 | |
Regency Centers Corp. | | | 16,010 | | | | 655,770 | |
Total Shopping Centers | | | | | | | 3,439,642 | |
Single Tenant - 1.8% | | | | | | | | |
National Retail Properties, Inc. | | | 15,700 | | | | 427,825 | |
Realty Income Corp. | | | 17,220 | | | | 575,320 | |
Total Single Tenant | | | | | | | 1,003,145 | |
Storage - 5.5% | | | | | | | | |
CubeSmart | | | 52,790 | | | | 517,870 | |
Public Storage, Inc. | | | 19,910 | | | | 2,569,385 | |
Total Storage | | | | | | | 3,087,255 | |
Warehouse/Industrials - 4.9% | | | | | | | | |
ProLogis, Inc. | | | 90,840 | | | | 2,703,398 | |
Total REITs (cost $48,855,853) | | | | | | | 52,397,850 | |
REOCs - 0.7% | | | | | | | | |
Hotels & Motels - 0.7% | | | | | | | | |
Hyatt Hotels Corp., Class A* (cost $428,837) | | | 10,980 | | | | 408,346 | |
Short-Term Investments - 4.7%1 | | | | | | | | |
Dreyfus Cash Management Fund, Institutional Class Shares, 0.05%
(cost $2,572,904) | | | 2,572,904 | | | | 2,572,904 | |
Total Investments - 99.7%
(cost $51,857,594) | | | | | | | 55,379,100 | |
Other Assets, less Liabilities - 0.3% | | | | | | | 189,397 | |
Net Assets - 100.0% | | | | | | $ | 55,568,497 | |
The accompanying notes are an integral part of these financial statements.
29
Managers California Intermediate Tax-Free Fund
Portfolio Manager’s Comments (continued)
The Managers California Intermediate Tax-Free Fund’s (the “Fund”) objective is to achieve income free from Federal income taxes and California state income taxes, including the Alternative Minimum Tax (“AMT”).
The Fund invests at least 80% of its total assets in intermediate-term California municipal bonds that are free from both Federal and California state income taxes, including the AMT. The Fund’s securities will have quality ratings comparable to the four highest rating categories of Moody’s or Standard & Poor’s. The dollar-weighted average maturity of these intermediate-term securities is normally three to 10 years. The Fund’s benchmark is the Barclays Capital 5-Year Municipal Bond Index.
The Portfolio Manager
Miller Tabak Asset Management (“MTAM”), the subadvisor for the Fund, was founded in early 2008, and is a division of Miller Tabak + Co. LLC (“Miller Tabak”). Miller Tabak is a 28 year-old institutional trading firm that specializes in the discreet handling of stock purchases and sales, portfolio rebalancing, and listed options. MTAM focuses exclusively on managing municipal bond portfolios and is based in New York City.
Philosophy
The MTAM team focuses on purchasing municipal credits exhibiting improving credit characteristics while maintaining geographic and economic diversity as key elements in the portfolio-construction process. MTAM believes proactive total-return portfolio management offers greater potential rewards in an increasingly inefficient municipal bond market. Achieving reasonable and consistent growth of clients’ capital without taking elevated levels of principal risk is MTAM’s objective.
The California municipal bond market is a unique sector within the domestic fixed-income universe, consisting of over 6,000 issuers with distinct security structures and varying credit risks. MTAM seeks to exploit these nuances through a disciplined, risk-controlled, relative-value investment management process.
Process
| | • | | Active total-return portfolio management is MTAM’s central theme for achieving objectives that benefit the Fund |
| | • | | MTAM is committed to extensive, proprietary, and original research and analysis |
| | • | | MTAM follows a disciplined and well-defined investment process |
MTAM’s investment process can be divided into two distinct parts. The first part focuses on risk analysis. MTAM’s risk analysis has two components, interest-rate analysis and credit-risk analysis. MTAM strives to control interest-rate volatility by defining the appropriate ranges for duration and maturity based on the Fund’s predetermined liquidity requirements, the specific risk profile, and the given market environment.
The second component of MTAM’s risk analysis focuses on credit risk. MTAM applies rigorous standards for tax-exempt issuers, continually reviews financial statements, and closely monitors rating agency commentary and relative trading spreads in the secondary market. Michael Pietronico, the Fund’s portfolio manager, has 16 years managing municipal bond portfolios, which gives him excellent knowledge of the key factors influencing the municipal bond market and an experienced eye to identify high-quality California municipal bonds.
The second major part of MTAM’s investment process assesses relative value. MTAM starts by creating expectations for the slope of the yield curve and yield spreads going forward. Once forecasts are finalized, MTAM assesses how its forecast and other potential outcomes may affect market prices. This ultimately helps MTAM identify what securities are most attractively valued and offer the best risk-adjusted return. MTAM also uses its market outlook to determine what sectors of the municipal market will add to and detract from performance and adjust weightings accordingly. Lastly, credit research at the security level is undertaken to analyze credit quality, yield, duration, structure, and call protection in order to assess a security’s potential contribution to the Fund.
Buy Discipline
There are three parts to MTAM’s buy discipline:
Macro View
Aggregate Municipal Supply
Secondary Market Supply
Dealer Inventories
Micro View
Supply/Demand Per State
Macro View
Major Economic Trends in Place
Micro View
Legal Structure of Securities
Service-Area Economic Performance
Project and System Operations
| | • | | Individual Bond Structure Analysis |
Prepayment Risk
Original Issue Discount
Reinvestment Risk
Municipal Bond Credit Research – Credit Review Process
| 1. | Comprehensive bottom-up analysis of issuer, pledged security, and historical economic performance |
| 2. | Site visits and conference calls with key public officials |
| 3. | Comprehensive financial statement review with feasibility analysis |
| 4. | Negotiate with underwriters to strengthen key security covenants and secure optimal pricing |
| 5. | Limits are implemented upon credit approval exposure |
Managers California Intermediate Tax-Free Fund
Portfolio Manager’s Comments (continued)
Credit Surveillance
| | • | | Database is maintained for holdings by issuer and Fund exposure |
| | • | | The relevant performance statistics are tracked on a monthly, quarterly, and annual basis to help capture meaningful trends, for example trading spreads |
| | • | | Outside resources are utilized; for example financial statement repositories, industry publications, internet search engines, and rating agencies |
Sell Discipline
| | • | | An individual security may become a candidate for sale for any of the following reasons: |
| | • | | The issuer’s investment fundamentals begin to deteriorate |
| | • | | To take advantage of more attractive yield opportunities |
| | • | | The individual security no longer appears to meet the portfolio’s investment objective(s) |
| | • | | To meet liquidity needs |
| | • | | To help shorten or lengthen the overall duration of the portfolio |
The Year in Review
For the 12 months ended October 31, 2011, the Managers California Intermediate Tax-Free Fund returned 3.27%. The Fund’s benchmark, the Barclays Capital U.S. Municipal Bond: 5 Year Index, returned 3.04% during the same time period.
In the latter stages of 2010, the municipal bond market was rocked by very dire forecasts for potential defaults from many high profile analysts. One analyst in particular (a former bank analyst) predicted upwards of $100 Billion in potential municipal defaults. This negative backdrop along with the expiration of the Build America Bond Program kept downward pressure on municipal bond prices into the early part of 2011. This bearishness slowly moved to the sidelines as the market progressed in 2011 as it became apparent to many that municipalities were tightening their fiscal belts and were honoring their commitment to pay their bondholders in a very large way. This “belt tightening” by municipalities played a large role in the summer slowdown that occurred in the United States economy. A constant wave of public sector worker layoffs and service cuts put downward pressure on consumer spending. This resulted in a substantial drop in U.S. Treasury yields which clearly influenced the broader municipal market as tax-free yields moved lower in sympathy. A dramatic drop off in California exempt issuance for a period of time in 2011 helped buoy prices on a relative basis for bonds issued from the Golden State.
Nominal performance was assisted by having a longer duration during most of the last year relative to the Index. Relative performance was strong due to the very conservative nature of the Fund’s holdings as some competing funds likely experienced credit widening as the perception of the health of the economy changed
notably in the middle part of 2011. MTAM correctly anticipated that the Federal Reserve would refrain from tightening credit due to the embedded weakness in the housing sector and as such they sold shorter-dated bonds when redemption requests were made upon the Fund. Because longer-dated bonds tend to outperform when interest rates fall, this tactic assisted returns. MTAM remained allocated within the sectors of the market such as general obligation bonds and essential purpose revenue bonds which saw greater demand from conservative investors who were fleeing other riskier markets such as equities and commodities.
Looking Forward
MTAM believes the U.S. economy will grow from 0% to 3% as far as “the eye can see.” They view the likelihood of a recession as below 50% but capable of growing rapidly in chance should the crisis in Europe sovereign debt become more acute. MTAM believes that interest rates will remain in a fairly narrow range (50 basis points higher or lower in yield) from current market levels. MTAM believes this rather benign interest rate outlook could bode well for California municipals which yield considerably more than U.S. Treasuries; which are of course taxable. They believe that investors will remain “close to the shore” due to the many global uncertainties and as such the short and intermediate areas of the yield curve should remain rather well “anchored.” Because the Fund is positioned in the intermediate area of the yield curve, MTAM views it as perfectly aligned with their viewpoint that rates will remain in a range and that investors will position themselves defensively which should assist the valuation of the Fund over a longer period of time. The Fund has a healthy allocation to medium-quality issuers which, at this point, yield in their view significantly more than higher-quality issuers than is warranted given that U.S. growth remains positive. MTAM believes that interest rates globally will remain low for those issuers who are deemed to be financially fit. Given that California and its municipalities are required by law to balance their budgets annually, MTAM suspects that investors will continue to gravitate towards allocating greater amounts of tax-free debt to their portfolios.
The views expressed represent the opinions of Miller Tabak Asset Management as of October 31, 2011 and are not intended as a forecast or guarantee of future results, and are subject to change without notice.
Cumulative Total Return Performance
Managers California Intermediate Tax-Free Fund’s cumulative total return is based on the daily change in net asset value (NAV) and assumes that all distributions were reinvested. The Barclays Capital U.S. Municipal Bond: 5 Year Index is a rules-based, market-value-weighted index engineered for the long-term tax-exempt bond market. The index has four main sectors: general obligation bonds, revenue bonds, insured bonds (including all insured bonds with a Aaa/AAA rating), and prerefunded bonds. This index is the 5 Year (4-6) component of the Municipal Bond index. Unlike the Fund, the Barclays Capital U.S. Municipal Bond: 5 Year Index is unmanaged, is not available to investment, and does not incur expenses. This
|
Managers California Intermediate Tax-Free Fund Portfolio Manager’s Comments (continued) |
Cumulative Total Return Performance (continued)
chart compares a hypothetical $10,000 investment made in the Managers California Intermediate Tax-Free Fund on October 31, 2001 to a $10,000 investment made in the Barclays Capital U.S. Municipal Bond: 5 Year Index for the same time period. Performance for periods longer than one year is annualized. The graph and table do not reflect the deduction of taxes that a shareholder would pay on a Fund distribution or redemption of shares. The listed returns for the Fund are net of expenses and the returns for the index exclude expenses. Total returns for the Fund would have been lower had certain expenses not been reduced.
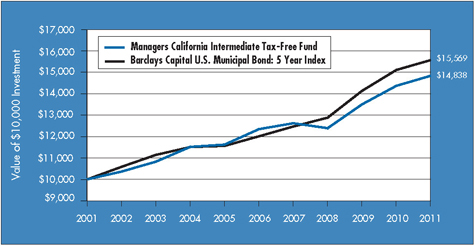
The table below shows the average annual total returns for the Managers California Intermediate Tax-Free Fund and the Barclays Capital U.S. Municipal Bond: 5 Year Index for the one-year, five-year and ten-year periods ended October 31, 2011.
| | | | | | | | | | | | |
Average Annual Total Returns1 | | One
Year | | | Five
Years | | | Ten
Years | |
Managers California Intermediate Tax-Free Fund2,3,4,5 | | | 3.27 | % | | | 3.75 | % | | | 4.03 | % |
Barclays Capital U.S. Municipal Bond: 5 Year Index6 | | | 3.04 | % | | | 5.32 | % | | | 4.53 | % |
The performance data shown represents past performance, which is not a guarantee of future results. Current performance may be lower or higher than the performance data quoted. The investment return and principal value of an investment in the Fund will fluctuate so that an investor’s shares, when redeemed, may be worth more or less than their original cost. For performance information through the most recent month end, please call (800) 835-3879 or visit our Web site at www.managersinvest.com.
In choosing a Fund, investors should carefully consider the amount they plan to invest, their investment objectives, the Fund’s investment objectives, risks, charges and expenses before investing. For this and other information, please call (800) 835-3879 or visit www.managersinvest.com for a free prospectus. Read it carefully before investing or sending money. Distributed by Managers Distributors, Inc., member FINRA.
| | 1 | Total return equals income yield plus share price change and assumes reinvestment of all dividends and capital gain distributions. Returns are net of fees and may reflect offsets of Fund expenses as described in the Prospectus. No adjustment has been made for taxes payable by shareholders on their reinvested dividends and capital gain distributions. Returns for periods greater than one year are annualized. The listed returns on the Fund are net of expenses and based on the published NAV as of October 31, 2011. All returns are in U.S. dollars($). |
| | 2 | Fund for which, from time to time, the advisor has waived fees or reimbursed expenses, which may have resulted in higher returns. |
|
3 The Fund is subject to the risks associated with investments in debt securities, such as default risk and fluctuations in the perception of the debtors’ ability to pay their creditors. 4 Changing interest rates may adversely affect the value of an investment. An increase in interest rates typically causes the value of bonds and other fixed-income securities to fall. 5 The Fund is subject to risks associated from economic, political, geographic, and demographic conditions of California that could adversely affect the value of the Fund’s investment portfolio. 6 Prior to October 31, 2008, the Index was known as the Lehman Brothers 5-Year Municipal Bond Index. Not FDIC insured, nor bank guaranteed. May lose value. |
|
Managers California Intermediate Tax-Free Fund Fund Snapshots October 31, 2011 |
Portfolio Breakdown
| | | | |
Portfolio Credit Quality | | Managers California
Intermediate Tax-Free Fund** | |
Aaa | | | 0.7 | % |
Aa | | | 52.4 | % |
A | | | 46.9 | % |
| ** | As a percentage of net assets |
Top Ten Holdings
| | | | |
Security Name | | Percentage
of Net Assets | |
Santa Ana, CA Unified School District, Election 2008, Series A, 5.250%, 08/01/25* | | | 5.2 | % |
Los Angeles, CA Municipal Improvement Corp. Lease Revenue, Police Headquarters | | | | |
Facility, Series A, 5.000%, 01/01/25 (National Insured)* | | | 2.9 | |
San Bernardino, CA Community College District, Election 2008, Series A, 6.250%, 08/01/23* | | | 2.7 | |
Puerto Rico Sales Tax Financing Corp. Sales Tax Revenue, Series A, 4.375%, 08/01/20* | | | 2.7 | |
Val Verde, CA Unified School District General Obligation, Election 2008, Series A, 5.500%, 08/01/24* | | | 2.5 | |
Los Angeles, CA Municipal Improvement Lease Revenue, Capital Equipment, Series A, 5.000%, 09/01/23* | | | 2.5 | |
Port of Oakland, CA Series B, 5.000%, 11/01/21 (National Insured)* | | | 2.5 | |
Fairfield-Suisun, CA Unified School District General Obligation, Election 2002, 5.000%, 08/01/24 (National Insured)* | | | 2.2 | |
California State Public Works Board, Series A, 6.000%, 04/01/24 | | | 2.1 | |
San Bernardino, CA Community College District General Obligation, Election 2008, Series A, 6.375%, 08/01/26* | | | 2.1 | |
| | | | |
Top Ten as a Group | | | 27.4 | % |
| | | | |
| * | Top Ten Holding at April 30, 2011 |
|
| Any sectors, industries, or securities discussed should not be perceived as investment recommendations. Mention of a specific security should not be considered a recommendation to buy or solicitation to sell that security. Specific securities mentioned in this report may have been sold from the Fund’s portfolio of investments by the time you receive this report. |
Managers California Intermediate Tax-Free Fund
Schedule of Portfolio Investments
October 31, 2011
| | | | | | | | |
| | | Principal Amount | | | Value | |
Municipal Bonds - 96.8% | | | | | | | | |
Alvord, CA Unified School District General Obligation, Series A, 5.900%, 02/01/17 (National Insured) | | $ | 110,000 | | | $ | 122,653 | |
Alvord, CA Unified School District General Obligation, Series A, 5.900%, 02/01/24 (National Insured) | | | 225,000 | | | | 251,237 | |
Bakersfield, CA City School District, Series A, 5.250%, 11/01/21 (AGM Insured) | | | 110,000 | | | | 119,489 | |
Bakersfield, CA Wastewater Revenue, Series A, 5.000%, 09/15/19 (AGM Insured) | | | 175,000 | | | | 194,290 | |
Bakersfield, CA Wastewater Revenue, Series A, 5.000%, 09/15/22 (AGM Insured) | | | 200,000 | | | | 215,668 | |
Barstow, CA Unified School District General Obligation, Election 2001, Series B, 5.000%, 08/01/24 (National Insured) | | | 375,000 | | | | 387,195 | |
Bay Area, CA Toll Authority, Series F, 5.000%, 04/01/17 | | | 20,000 | | | | 23,196 | |
Bonita, CA Unified School District, Election 2004, Series B, 5.000%, 08/01/16 (FGIC Insured) | | | 50,000 | | | | 56,732 | |
Butte-Glenn Counties, CA Community College District General Obligation, Series B, 5.000%, 08/01/23 (National Insured) | | | 325,000 | | | | 344,295 | |
California Resource Efficiency Financing Authority, Series A, 5.000%, 07/01/23 (AMBAC Insured) | | | 50,000 | | | | 50,616 | |
California State Department of Water Resources, Water System Revenue, Series A, 5.000%, 12/01/20 | | | 25,000 | | | | 28,703 | |
California State Public Works Board, Series C, 4.500%, 06/01/17 | | | 50,000 | | | | 56,566 | |
California State Public Works Board, Series B, 5.250%, 03/01/19 (AMBAC Insured) | | | 200,000 | | | | 201,826 | |
California State Public Works Board, Series A, 6.000%, 04/01/24 | | | 500,000 | | | | 564,940 | |
Carlsbad, CA Unified School District General Obligation, Election 2006, Series A, 5.000%, 08/01/21 (National Insured) | | | 20,000 | | | | 22,062 | |
Carlsbad, CA Unified School District General Obligation, Series B, 5.250%, 05/01/25 | | | 70,000 | | | | 77,480 | |
Central Marin, CA Sanitation Agency Revenue, 5.000%, 09/01/21 (National Insured) | | | 100,000 | | | | 108,688 | |
Cerritos, CA Community College General Obligation, Election 2004, Series C, 5.250%, 08/01/25 | | | 15,000 | | | | 16,648 | |
City of El Paso De Robles, CA General Obligation, 5.000%, 08/01/23 (National Insured) | | | 125,000 | | | | 133,944 | |
City of El Paso De Robles, CA General Obligation, 5.000%, 08/01/25 (National Insured) | | | 250,000 | | | | 263,627 | |
City of El Paso De Robles, CA General Obligation, 5.000%, 08/01/27 (National Insured) | | | 20,000 | | | | 20,880 | |
City of Escondido, CA General Obligation, Series A, 5.000%, 09/01/14 (National Insured) | | | 90,000 | | | | 98,845 | |
Clovis, CA Unified School District General Obligation, Series B, 5.000%, 08/01/23 (National Insured) | | | 115,000 | | | | 123,515 | |
Covina-Valley, CA Unified School District, Election 2006, Series A, 5.000%, 08/01/21 (National Insured) | | | 410,000 | | | | 434,875 | |
Corona-Norca, CA Unified School District, Election 2006, Series A, 5.000%, 08/01/25 (AGM Insured) | | | 50,000 | | | | 53,014 | |
Desert Sands, CA Unified School District General Obligation, 5.000%, 08/01/16 | | | 50,000 | | | | 56,950 | |
Desert Sands, CA Unified School District, Election 2001, 5.000%, 06/01/22 | | | 175,000 | | | | 187,918 | |
Desert Sands, CA Unified School District General Obligation, Election 2001, 5.000%, 08/01/26 | | | 25,000 | | | | 27,288 | |
Desert Sands, CA Unified School District General Obligation, 5.000%, 08/01/27 | | | 245,000 | | | | 261,883 | |
Desert Sands, CA Unified School District General Obligation, 5.500%, 08/01/28 (AMBAC Insured) | | | 40,000 | | | | 43,184 | |
Eastern, CA Municipal Water District, Water & Sewer Revenue, Series A, 5.000%, 07/01/21 (National Insured) | | | 330,000 | | | | 355,816 | |
El Monte, CA City School District General Obligation, Series A, 4.250%, 05/01/15 (FGIC Insured) | | | 300,000 | | | | 326,166 | |
El Monte, CA Union High School District General Obligation, Series C, 5.000%, 06/01/21 (AGM Insured) | | | 40,000 | | | | 43,792 | |
Fairfield-Suisun, CA Unified School District General Obligation, Election 2002, 5.000%, 08/01/24 (National Insured) | | | 565,000 | | | | 591,188 | |
Fairfield-Suisun, CA Unified School District General Obligation, 5.000%, 08/01/27 (National Insured) | | | 100,000 | | | | 104,513 | |
Fairfield-Suisun, CA Unified School District, Election 2002, 5.250%, 08/01/16 (National Insured) | | | 225,000 | | | | 245,119 | |
Fairfield-Suisun, CA Unified School District General Obligation, Election 2002, 5.250%, 08/01/23 (National Insured) | | | 240,000 | | | | 254,765 | |
Fresno County, CA Central Unified School District General Obligation, 5.000%, 07/01/21 (National Insured) | | | 75,000 | | | | 78,845 | |
|
The accompanying notes are an integral part of these financial statements. 34 |
Managers California Intermediate Tax-Free Fund
Schedule of Portfolio Investments (continued)
| | | | | | | | |
| | | Principal Amount | | | Value | |
Municipal Bonds - 96.8% (continued) | | | | | | | | |
Fresno County, CA Central Unified School District General Obligation, Series A, 5.000%, 08/01/22 (Assured Guaranty) | | $ | 25,000 | | | $ | 27,328 | |
Fresno County, CA Central Unified School District General Obligation, 5.000%, 07/01/23 (National Insured) | | | 25,000 | | | | 25,998 | |
Fresno County, CA Clovis Unified School District General Obligation, Election 2004, Series B, 5.000%, 08/01/25 (National Insured) 65,000 | | | 68,875 | | | | | |
Fresno County, CA Unified School District General Obligation, Series C, 5.900%, 08/01/22 (National Insured) | | | 25,000 | | | | 29,181 | |
Grossmont, CA Union High School District General Obligation, 5.000%, 08/01/23 (National Insured) | | | 85,000 | | | | 91,789 | |
Grossmont-Cuyamaca, CA Community College District General Obligation, Series C, 5.000%, 08/01/24 (Assured Guaranty) | | | 50,000 | | | | 55,004 | |
Hemet, CA Unified School District General Obligation, Series A, 5.000%, 08/01/22 (AGM Insured) | | | 125,000 | | | | 131,251 | |
Imperial, CA Irrigation District Electric System Revenue, Series A, 5.250%, 11/01/24 | | | 100,000 | | | | 110,122 | |
Long Beach, CA Unified School District General Obligation Refunding, Series A, 5.000%, 08/01/25 | | | 30,000 | | | | 33,894 | |
Long Beach, CA Unified School District General Obligation, Series A, 5.500%, 08/01/26 | | | 85,000 | | | | 96,873 | |
Los Angeles County, CA Citrus Community College District General Obligation, Election 2004, Series B, 5.000%, 06/01/22 (National Insured) | | | 20,000 | | | | 21,879 | |
Los Angeles County, CA Golden West Schools Financing Authority General Obligation, 5.250%, 09/01/24 (FGIC Insured) 365,000 | | | 438,507 | | | | | |
Los Angeles County, CA Metropolitan Transportation Authority Sales Tax Revenue, Proposition C, Series E, 5.000%, 07/01/25 | | | 35,000 | | | | 38,524 | |
Los Angeles County, CA Public Works Financing Authority Revenue, Series A, 5.250%, 10/01/16 (AGM Insured) | | | 25,000 | | | | 29,100 | |
Los Angeles County, CA Sanitation Districts Financing Authority Capital Projects Revenue, 5.000%, 10/01/23 (FGIC Insured) | | | 80,000 | | | | 83,397 | |
Los Angeles, CA County Public Works Financing Authority, 5.000%, 10/01/15 (National Insured) | | | 15,000 | | | | 17,091 | |
Los Angeles, CA Harbor Department Revenue, Series A, 4.000%, 08/01/17 | | | 25,000 | | | | 27,572 | |
Los Angeles, CA Harbor Department Revenue, Series B, 5.000%, 08/01/20 (National Insured) | | | 275,000 | | | | 301,205 | |
Los Angeles, CA Municipal Improvement Lease Revenue, Capital Equipment, Series A, 5.000%, 09/01/16 | | | 470,000 | | | | 522,884 | |
Los Angeles, CA Municipal Improvement Corp. Lease Revenue, Series C, 5.000%, 09/01/18 | | | 300,000 | | | | 332,097 | |
Los Angeles, CA Municipal Improvement Corp. Revenue, Series B1, 5.000%, 08/01/21 (FGIC Insured) | | | 125,000 | | | | 128,506 | |
Los Angeles, CA Municipal Improvement Corp. Revenue, Series B1, 5.000%, 08/01/23 (FGIC Insured) | | | 50,000 | | | | 51,062 | |
Los Angeles, CA Municipal Improvement Lease Revenue, Capital Equipment, Series A, 5.000%, 09/01/23 | | | 640,000 | | | | 665,843 | |
Los Angeles, CA Municipal Improvement Corp. Lease Revenue, Series A, 5.000%, 09/01/24 | | | 100,000 | | | | 103,679 | |
Los Angeles, CA Municipal Improvement Corp. Lease Revenue, Police Headquarters Facility, Series A, 5.000%, 01/01/25 (FGIC Insured) | | | 780,000 | | | | 791,279 | |
Los Angeles, CA Municipal Improvement Revenue, Capital Equipment, Series 2008 A, 5.000%, 09/01/25 | | | 50,000 | | | | 51,630 | |
Los Angeles, CA Municipal Improvement Corp. Lease Revenue, Series B1, 5.000%, 08/01/26 (FGIC Insured) | | | 200,000 | | | | 202,334 | |
Los Angeles, CA Unified School District General Obligation, Election 2004, Series G, 5.000%, 07/01/24 (AMBAC Insured) | | | 35,000 | | | | 37,848 | |
Monrovia, CA Unified School District General Obligation, Election 2006, Series B, 5.250%, 08/01/25 (FSA Insured) | | | 30,000 | | | | 32,662 | |
Montebello, CA Unified School District General Obligation, Election 2004, 4.200%, 08/01/22 (AGM Insured) | | | 100,000 | | | | 103,141 | |
Moreland, CA School District General Obligation, Series A, 5.000%, 08/01/15 (AMBAC Insured) | | | 50,000 | | | | 55,710 | |
Moreno Valley, CA Unified School District General Obligation, 5.000%, 08/01/16 (National Insured) | | | 25,000 | | | | 27,299 | |
Moreno Valley, CA Unified School District, 5.000%, 08/01/17 (National Insured) | | | 50,000 | | | | 54,768 | |
Orange County, CA Sanitation District COP, Series A, 5.000%, 02/01/22 | | | 135,000 | | | | 153,116 | |
|
The accompanying notes are an integral part of these financial statements. 35 |
Managers California Intermediate Tax-Free Fund
Schedule of Portfolio Investments (continued)
| | | | | | | | |
| | | Principal Amount | | | Value | |
Municipal Bonds - 96.8% (continued) | | | | | | | | |
Peralta, CA Community College District General Obligation, Series A, 5.000%, 08/01/24 (National Insured) | | $ | 50,000 | | | $ | 52,780 | |
Peralta, CA Community College District General Obligation, Election 2006, Series B, 5.250%, 08/01/22 (AGM Insured) | | | 45,000 | | | | 49,064 | |
Perris, CA Union High School District General Obligation, Election 2004, Series A, 5.000%, 09/01/26 (FGIC Insured) | | | 15,000 | | | | 15,537 | |
Placentia-Yorba Linda, CA Unified School District General Obligation, Election 2002, Series B, 5.500%, 08/01/27 (FGIC Insured) | | | 65,000 | | | | 67,609 | |
Port of Oakland, CA Revenue, Series B, 4.000%, 11/01/15 (National Insured) | | | 105,000 | | | | 112,106 | |
Port of Oakland, CA Revenue, Series C, 5.000%, 11/01/15 (National Insured) | | | 310,000 | | | | 342,767 | |
Port of Oakland, CA Series B, 5.000%, 11/01/16 (National Insured) | | | 255,000 | | | | 281,479 | |
Port of Oakland, CA Revenue, Series B, 5.000%, 11/01/17 (National Insured) | | | 10,000 | | | | 11,107 | |
Port Of Oakland, CA Revenue, Series C, 5.000%, 11/01/17 (National Insured) | | | 275,000 | | | | 305,448 | |
Port of Oakland, CA Series B, 5.000%, 11/01/21 (National Insured) | | | 625,000 | | | | 661,094 | |
Port of Oakland, CA Revenue, Series B, 5.000%, 11/01/22 (National Insured) | | | 30,000 | | | | 31,536 | |
Port of Oakland, CA Series B, 5.000%, 11/01/24 (National Insured) | | | 75,000 | | | | 77,708 | |
Port of Oakland, CA Revenue, Series B, 5.000%, 11/01/26 (National Insured) | | | 275,000 | | | | 281,572 | |
Puerto Rico Sales Tax Financing Corp. Sales Tax Revenue, Series A, 4.375%, 08/01/20 | | | 685,000 | | | | 713,112 | |
Puerto Rico Sales Tax Financing Corp. Sales Tax Revenue, Series A, 5.000%, 08/01/18 | | | 70,000 | | | | 78,488 | |
Rancho, CA Water District Financing Authority Revenue, Series 2008 A, 5.000%, 08/01/15 (AGM Insured) | | | 50,000 | | | | 55,998 | |
Rescue, CA Union School District General Obligation, 5.000%, 09/01/21 (National Insured) | | | 25,000 | | | | 28,905 | |
Rescue, CA Union School District General Obligation, 5.000%, 07/01/23 (National Insured) | | | 50,000 | | | | 57,386 | |
Riverside, CA Community College District, 5.000%, 08/01/24 (AGM Insured) | | | 35,000 | | | | 37,409 | |
Rosemead, CA School District General Obligation, Election 2000, Series B, 5.125%, 08/01/27 (FGIC Insured) | | | 25,000 | | | | 25,692 | |
Rosemead, CA School District General Obligation, Election 2000, Series D, 5.250%, 08/01/24 (AGM Insured) | | | 150,000 | | | | 166,696 | |
Rosemead, CA School District General Obligation, Election 2000, Series D, 5.250%, 08/01/25 (AGM Insured) | | | 55,000 | | | | 60,034 | |
Rosemead, CA School District General Obligation, Election 2000, Series D, 5.250%, 08/01/26 (AGM Insured) | | | 145,000 | | | | 157,161 | |
Rosemead, CA School District General Obligation, Election 2000, Series D, 5.500%, 08/01/28 (AGM Insured) | | | 125,000 | | | | 135,985 | |
Roseville, CA Joint Union High School District General Obligation, Election 2004, Series A, 5.000%, 08/01/26 (FGIC Insured) | | | 120,000 | | | | 123,839 | |
Sacramento, CA Municipal Utility District Prerefunded Revenue, Series R, 5.000%, 08/15/18 (National Insured) | | | 105,000 | | | | 113,476 | |
Sacramento, CA Municipal Utility District Unrefunded Balance Revenue, Series R, 5.000%, 08/15/18 (National Insured) | | | 45,000 | | | | 47,442 | |
Sacramento, CA Municipal Utility District Electric Revenue, Series K, 5.250%, 07/01/24 (AMBAC Insured) | | | 145,000 | | | | 163,914 | |
San Bernardino, CA Community College District General Obligation, Series C, 5.000%, 08/01/26 (AGM Insured) | | | 175,000 | | | | 182,945 | |
San Bernardino, CA Community College District, Election 2008, Series A, 6.250%, 08/01/23 | | | 620,000 | | | | 726,882 | |
San Bernardino, CA Community College District General Obligation, Election 2008, Series A, 6.375%, 08/01/26 | | | 480,000 | | | | 554,746 | |
San Diego County, CA Southwestern Community College District General Obligation, 5.000%, 08/01/23 (National Insured) | | | 285,000 | | | | 307,173 | |
San Diego, CA Public Facilities Financing Authority Water Revenue, Series B, 5.000%, 08/01/20 | | | 30,000 | | | | 34,997 | |
San Diego, CA Public Facilities Financing Authority Sewer Revenue, Series B, 5.000%, 05/15/21 | | | 50,000 | | | | 56,734 | |
San Diego, CA Unified Port District Revenue, Series B, 5.000%, 09/01/23 (National Insured) | | | 325,000 | | | | 338,890 | |
San Francisco, CA Bay Area Toll Authority Toll Bridge Revenue, Series F, 5.000%, 04/01/22 | | | 35,000 | | | | 38,310 | |
San Francisco, CA City & County Airports Commission Revenue, Second Series, Issue 34F, 5.000%, 05/01/16 (FGIC Insured) | | | 45,000 | | | | 50,652 | |
|
The accompanying notes are an integral part of these financial statements. 36 |
Managers California Intermediate Tax-Free Fund
Schedule of Portfolio Investments (continued)
| | | | | | | | |
| | | Principal Amount | | | Value | |
Municipal Bonds - 96.8% (continued) | | | | | | | | |
San Francisco, CA City & County Airports Commission Revenue, Second Series, Issue 34F, 5.000%, 05/01/16 (Assured Guaranty) | | $ | 50,000 | | | $ | 56,280 | |
San Francisco, CA City & County Airports Commission Revenue, Second Series, Issue 32F, 5.250%, 05/01/17 (FGIC Insured) | | | 465,000 | | | | 533,611 | |
San Francisco, CA City & County Unified School District General Obligation, Election 2003, Series C, 5.000%, 06/15/22 (National Insured) | | | 55,000 | | | | 59,486 | |
San Francisco, CA City and County General Obligation, Laguna Honda Hospital, Series R3, 5.000%, 06/15/23 | | | 50,000 | | | | 53,313 | |
San Juan, CA Unified School District General Obligation, Election 2002, 4.250%, 08/01/14 (FGIC Insured) | | | 240,000 | | | | 260,040 | |
San Juan, CA Unified School District General Obligation, Election 2002, Series A, 5.000%, 08/01/16 (National Insured) 150,000 | | | 163,383 | | | | | |
Santa Ana, CA Unified School District, Election 2008, Series A, 5.250%, 08/01/25 | | | 1,300,000 | | | | 1,404,715 | |
Santa Ana, CA Unified School District General Obligation, Series A, 5.250%, 08/01/26 | | | 500,000 | | | | 536,900 | |
Santa Clara County, CA East Side Union High School District General Obligation, Series A, 4.000%, 09/01/18 (AMBAC Insured) | | | 75,000 | | | | 76,799 | |
Santa Clara County, CA East Side Union High School District General Obligation, Election 2002, Series H, 5.000%, 08/01/19 (Assured Guaranty) | | | 100,000 | | | | 112,841 | |
Santa Clara County, CA East Side Union High School District General Obligation, Election 2002, Series D, 5.000%, 08/01/19 (XLCA Insured) 65,000 | | | 68,379 | | | | | |
Santa Clara County, CA East Side Union High School District General Obligation, Election 2002, Series D, 5.000%, 08/01/19 (XCLA Insured) | | | 265,000 | | | | 278,775 | |
Santa Clara County, CA East Side Union High School District General Obligation, Series B, 5.100%, 02/01/16 (National Insured) | | | 250,000 | | | | 271,700 | |
Santa Clara County, CA East Side Union High School District General Obligation, Series B, 5.100%, 02/01/22 (National Insured) | | | 500,000 | | | | 535,830 | |
Santa Clara County, CA East Side Union High School District General Obligation, Series B, 5.250%, 02/01/24 (National Insured) | | | 40,000 | | | | 42,488 | |
Santa Clara County, CA Financing Authority Lease Revenue, Series A, 5.000%, 11/15/21 | | | 185,000 | | | | 206,068 | |
Santa Clara County, CA San Jose Unified School District General Obligation, Election 2002, Series C, 5.000%, 08/01/24 (FGIC Insured) | | | 200,000 | | | | 216,544 | |
Santa Clara County, CA Franklin-McKinley CA School District General Obligation, 5.000%, 07/01/15 (AGM Insured) | | | 40,000 | | | | 43,933 | |
Santa Rosa, CA High School District, Election of 2002, 5.000%, 08/01/19 (National Insured) | | | 100,000 | | | | 102,974 | |
Sierra Sands, CA Unified School District General Obligation, Series A, 5.000%, 11/01/22 (FGIC Insured) | | | 50,000 | | | | 53,268 | |
Sierra, CA Joint Community College District, School Facilities District No. 1, Election 2004, 5.000%, 08/01/24 (National Insured) | | | 100,000 | | | | 106,987 | |
Sierra, CA Joint Community College District, School Facilities District No. 1, Election 2004, 5.000%, 08/01/25 (National Insured) | | | 100,000 | | | | 105,765 | |
Solano County, CA Community College District, 4.000%, 08/01/15 (National Insured) | | | 25,000 | | | | 27,134 | |
Solano County, CA Community College District, 5.000%, 08/01/16 (National Insured) | | | 40,000 | | | | 44,445 | |
Sonoma County, CA Junior College District General Obligation, Series D, 5.000%, 08/01/16 | | | 15,000 | | | | 17,269 | |
Southern California Public Power Authority Revenue, Southern Transmission Project, Series B, 5.750%, 07/01/24 | | | 75,000 | | | | 86,826 | |
State of California, 5.000%, 04/01/14 | | | 15,000 | | | | 16,343 | |
Sweetwater, CA Authority Water Revenue, 5.000%, 04/01/17 (AMBAC Insured) | | | 50,000 | | | | 54,956 | |
Tahoe-Truckee, CA Unified School District General Obligation, 5.500%, 08/01/19 (National Insured) | | | 75,000 | | | | 89,353 | |
Tracy, CA Joint Unified School District General Obligation, Election 2006, 5.000%, 08/01/25 (Assured Guaranty) | | | 100,000 | | | | 104,408 | |
|
The accompanying notes are an integral part of these financial statements. 37 |
Managers California Intermediate Tax-Free Fund
Schedule of Portfolio Investments (continued)
| | | | | | | | |
| | | Principal Amount | | | Value | |
Municipal Bonds - 96.8% (continued) | | | | | | | | |
Tustin, CA Unified School District No. 2002-1 General Obligation, Election 2002, Series B, 4.250%, 06/01/15 (AMBAC Insured) | | $ | 50,000 | | | $ | 54,992 | |
Vacaville, CA Unified School District, Election 2001, 5.000%, 08/01/16 (National Insured) | | | 120,000 | | | | 131,964 | |
Vacaville, CA Unified School District General Obligation, Election 2001, 5.000%, 08/01/17 (National Insured) | | | 40,000 | | | | 43,597 | |
Vacaville, CA Unified School District General Obligation, Election 2001, 5.000%, 08/01/22 (National Insured) | | | 15,000 | | | | 15,912 | |
Vacaville, CA Unified School District General Obligation, Election 2001, 5.000%, 08/01/25 (AMBAC Insured) | | | 130,000 | | | | 136,130 | |
Vacaville, CA Unified School District General Obligation, Election 2001, 5.000%, 08/01/25 (National Insured) | | | 220,000 | | | | 226,257 | |
Vacaville, CA Unified School District General Obligation, Election 2001, 5.000%, 08/01/26 (National Insured) | | | 55,000 | | | | 57,222 | |
Vacaville, CA Unified School District General Obligation, Election 2001, 5.000%, 08/01/26 (AMBAC Insured) | | | 30,000 | | | | 31,243 | |
Val Verde, CA Unified School District General Obligation, Election 2008, Series A, 5.500%, 08/01/22 | | | 100,000 | | | | 111,535 | |
Val Verde, CA Unified School District General Obligation, Election 2008, Series A, 5.500%, 08/01/24 | | | 615,000 | | | | 675,116 | |
Wiseburn, CA School District, Class A, 5.000%, 08/01/16 (National Insured) | | | 75,000 | | | | 84,201 | |
Yosemite, CA Community College District General Obligation, Election 2004, Series A, 5.000%, 08/01/22 (FGIC Insured) | | | 515,000 | | | | 551,014 | |
Yuba, CA Community College District General Obligation, Election 2006, Series A, 5.000%, 08/01/23 (AMBAC Insured) | | | 90,000 | | | | 96,144 | |
Yuba, CA Community College District General Obligation, Election 2006, Series A, 5.000%, 08/01/24 (AMBAC Insured) | | | 25,000 | | | | 26,520 | |
Total Municipal Bonds (cost $25,087,420) | | | | | | | 26,009,192 | |
| Short-Term Investments - 2.2%1 | | Shares | | | | |
BlackRock Liquidity Funds, Institutional Class Shares - California Money Fund, 0.01% (cost $579,688) | | | 579,688 | | | | 579,688 | |
Total Investments - 99.0% (cost $25,667,108)4 | | | | | | | 26,588,880 | |
Other Assets, less Liabilities - 1.0% | | | | | | | 273,272 | |
Net Assets - 100.0% | | | | | | $ | 26,862,152 | |
|
| The accompanying notes are an integral part of these financial statements. |
38
Notes to Schedules of Portfolio Investments
The following footnotes and abbreviations are to be read in conjunction with the Schedules of Portfolio Investments previously presented in the report.
At October 31, 2011, the approximate cost of securities for Federal income tax purposes and the gross aggregate unrealized appreciation and/or depreciation based on tax cost were:
| | | | | | | | | | | | | | | | |
Fund | | Cost | | | Appreciation | | | Depreciation | | | Net | |
Managers Frontier Small Cap Growth | | $ | 102,496,782 | | | $ | 8,347,006 | | | ($ | 10,344,499 | ) | | ($ | 1,997,493 | ) |
Managers AMG TSCM Growth Equity | | | 23,320,155 | | | | 973,431 | | | | (1,187,741 | ) | | | (214,310 | ) |
Managers Micro-Cap | | | 128,115,160 | | | | 25,309,053 | | | | (8,776,833 | ) | | | 16,532,220 | |
Managers Real Estate Securities | | | 53,126,561 | | | | 3,453,902 | | | | (1,201,363 | ) | | | 2,252,539 | |
Managers California Intermediate Tax-Free | | | 25,667,108 | | | | 930,315 | | | | (8,543 | ) | | | 921,772 | |
| * | Non-income-producing security. |
| 1 | Yield shown for each investment company represents the October 31, 2011, seven-day average yield, which refers to the sum of the previous seven days’ dividends paid, expressed as an annual percentage. |
| 2 | Some or all of these shares were out on loan to various brokers as of October 31, 2011, amounting to: |
| | | | | | | | |
Fund | | Market Value | | | % of Net Assets | |
Managers Frontier Small Cap Growth | | $ | 3,914,865 | | | | 4.1 | % |
Managers Micro-Cap | | | 120,252 | | | | 0.1 | % |
| 3 | Collateral received from brokers for securities lending was invested in this short-term investment. |
| 4 | At October 31, 2011, the concentration of the Fund’s investments by state or territory determined as a percentage of net assets was as follows: California 93.9% and Puerto Rico 2.9%. At October 31, 2011, 64.3% of the securities in the portfolio were backed by insurance of financial institutions and financial guaranty assurance agencies. Insurers with a concentration greater than 10% of net assets were as follows: National Insured 36.3% and FGIC 14.8%. |
As of October 31, 2011, the securities in Small Cap, TSCM Growth Equity and Real Estate were all Level 1 inputs. For a detailed break-out of the common stocks by major industry classification, please refer to the respective Schedule of Portfolio Investments.
The following tables summarize the inputs used to value the Funds’ net assets by the fair value hierarchy levels as of October 31, 2011. (See Note 1(a) in the Notes to Financial Statements)
| | | | | | | | | | | | | | | | |
| | | Quoted Prices in
Active Markets
for Identical
Investments Level 1 | | | Significant
Other Observable
Inputs Level 2 | | | Significant
Unobservable
Inputs Level 3 | | | Total | |
Managers Micro-Cap | |
Investments in Securities | |
Common Stocks† | | $ | 140,221,635 | | | $ | 121,590 | | | | — | | | $ | 140,343,225 | |
Exchange Traded Funds | | | 717,876 | | | | — | | | | — | | | | 717,876 | |
Short-Term Investments | | | 3,586,279 | | | | — | | | | — | | | | 3,586,279 | |
| | | | | | | | | | | | | | | | |
Total Investments in Securities | | $ | 144,525,790 | | | $ | 121,590 | | | | — | | | $ | 144,647,380 | |
| | | | | | | | | | | | | | | | |
| | | | |
| | | Quoted Prices in
Active Markets
for Identical
Investments Level 1 | | | Significant
Other Observable
Inputs Level 2 | | | Significant
Unobservable
Inputs Level 3 | | | Total | |
Managers California Intermediate Tax-Free | | | | | | | | | | | | | |
Investments in Securities | | | | | | | | | | | | | | | | |
Municipal Bonds†† | | | — | | | $ | 26,009,192 | | | | — | | | $ | 26,009,192 | |
Short-Term Investments | | $ | 579,688 | | | | — | | | | — | | | | 579,688 | |
| | | | | | | | | | | | | | | | |
Total Investments in Securities | | $ | 579,688 | | | $ | 26,009,192 | | | | — | | | $ | 26,588,880 | |
| | | | | | | | | | | | | | | | |
| † | For a detailed break-out of the common stocks by major industry classification, please refer to the Schedule of Portfolio Investments. |
| †† | All municipal bonds held in the Fund are Level 2 securities. For a detailed break-out of securities, please refer to the Schedule of Portfolio Investments. |
39
Notes to Schedules of Portfolio Investments (continued)
As of October 31, 2011, the Funds had no significant transfers between Level 1 and Level 2 from the beginning of the reporting period.
Investment Definitions and Abbreviations:
| | |
| ADR: | | ADR after the name of a holding stands for American Depositary Receipt, representing ownership of foreign securities on deposit with a domestic custodian bank. The value of the ADR security is determined or significantly influenced by trading on exchanges not located in the United States or Canada. Sponsored ADRs are initiated by the underlying foreign company. |
| AMBAC: | | American Municipal Bond Assurance Corp. |
| AGM: | | Assured Guaranty Municipal Corp. |
| CIFG: | | CIFG, NA |
| ETF: | | Exchange Traded Fund |
| FGIC: | | Financial Guaranty Insurance Corp. |
| FSA: | | FSA Capital, Inc |
| National: | | National Public Finance Guarantee Corp. |
| REIT: | | Real Estate Investment Trust |
| REOC: | | Real Estate Operating Company |
| XLCA: | | XL Capital Assurance, Inc. |
Statements of Assets and Liabilities
October 31, 2011
| | | | | | | | | | | | |
| | | Managers
Frontier Small
Cap Growth
Fund | | | Managers
AMG TSCM
Growth
Equity Fund | | | Managers
Micro-Cap
Fund | |
Assets: | | | | | | | | | | | | |
Investments at value* (including securities on loan valued at $3,914,865, $0, and $120,252, respectively) | | $ | 100,499,289 | | | $ | 23,105,845 | | | $ | 144,647,380 | |
Receivable for investments sold | | | 347,805 | | | | 60,546 | | | | 1,662,120 | |
Receivable for Fund shares sold | | | 6,745 | | | | 31,360 | | | | 148,824 | |
Dividends, interest and other receivables | | | 39,658 | | | | 57 | | | | 35,902 | |
Receivable from affiliate | | | 4,346 | | | | 15,746 | | | | 36,820 | |
Prepaid expenses | | | 14,414 | | | | 18,915 | | | | 11,877 | |
Total assets | | | 100,912,257 | | | | 23,232,469 | | | | 146,542,923 | |
Liabilities: | | | | | | | | | | | | |
Payable upon return of securities loaned | | | 4,313,047 | | | | — | | | | 125,400 | |
Payable for investments purchased | | | 487,480 | | | | 376,450 | | | | 527,393 | |
Payable for Fund shares repurchased | | | 34 | | | | 28,995 | | | | 156,670 | |
Accrued expenses: | | | | | | | | | | | | |
Investment management and advisory fees | | | 76,823 | | | | 15,746 | | | | 116,385 | |
Administrative fees | | | — | | | | 1,664 | | | | 29,096 | |
Distribution fees - Investor Class | | | 113 | | | | 254 | | | | N/A | |
Other | | | 55,399 | | | | 40,814 | | | | 110,840 | |
Total liabilities | | | 4,932,896 | | | | 463,923 | | | | 1,065,784 | |
Net Assets | | $ | 95,979,361 | | | $ | 22,768,546 | | | $ | 145,477,139 | |
Net Assets Represent: | | | | | | | | | | | | |
Paid-in capital | | $ | 98,475,683 | | | $ | 23,807,738 | | | $ | 118,419,993 | |
Undistributed net investment income | | | — | | | | — | | | | 125,308 | |
Accumulated net realized gain (loss) from investments | | | (974,915 | ) | | | (930,885 | ) | | | 9,598,849 | |
Net unrealized appreciation (depreciation) of investments | | | (1,521,407 | ) | | | (108,307 | ) | | | 17,332,989 | |
Net Assets | | $ | 95,979,361 | | | $ | 22,768,546 | | | $ | 145,477,139 | |
Investor Class Shares - Net Assets | | $ | 563,423 | | | $ | 2,464,609 | | | | N/A | |
Shares outstanding | | | 31,473 | | | | 223,745 | | | | N/A | |
Net asset value, offering and redemption price per share | | $ | 17.90 | | | $ | 11.02 | | | | N/A | |
Service Class Shares - Net Assets | | $ | 18,199,357 | | | $ | 18,321,464 | | | $ | 113,742,096 | |
Shares outstanding | | | 1,013,103 | | | | 1,649,914 | | | | 3,156,897 | |
Net asset value, offering and redemption price per share | | $ | 17.96 | | | $ | 11.10 | | | $ | 36.03 | |
Institutional Class Shares - Net Assets | | $ | 77,216,581 | | | $ | 1,982,473 | | | $ | 31,735,043 | |
Shares outstanding | | | 4,282,006 | | | | 179,078 | | | | 880,692 | |
Net asset value, offering and redemption price per share | | $ | 18.03 | | | $ | 11.07 | | | $ | 36.03 | |
* Investments at cost | | $ | 102,020,696 | | | $ | 23,214,152 | | | $ | 127,314,391 | |
The accompanying notes are an integral part of these financial statements.
41
Statements of Assets and Liabilities
October 31, 2011
| | | | | | | | |
| | | Managers
Real Estate
Securities
Fund | | | Managers
California
Intermediate
Tax-Free
Fund | |
Assets: | | | | | | | | |
Investments at value* | | $ | 55,379,100 | | | $ | 26,588,880 | |
Receivable for investments sold | | | 297,077 | | | | — | |
Receivable for Fund shares sold | | | 742,527 | | | | 100 | |
Dividends, interest and other receivables | | | 45,682 | | | | 337,246 | |
Receivable from affiliate | | | 9,160 | | | | 2,654 | |
Prepaid expenses | | | 13,168 | | | | 2,436 | |
Total assets | | | 56,486,714 | | | | 26,931,316 | |
Liabilities: | | | | | | | | |
Payable for investments purchased | | | 634,678 | | | | — | |
Payable for Fund shares repurchased | | | 172,837 | | | | 351 | |
Dividends payable to shareholders | | | — | | | | 13,358 | |
Accrued expenses: | | | | | | | | |
Investment management and advisory fees | | | 24,861 | | | | 9,021 | |
Administrative fees | | | 10,359 | | | | 5,686 | |
Other | | | 75,482 | | | | 40,748 | |
Total liabilities | | | 918,217 | | | | 69,164 | |
Net Assets | | $ | 55,568,497 | | | $ | 26,862,152 | |
Net Assets Represent: | | | | | | | | |
Paid-in capital | | $ | 53,583,570 | | | $ | 26,281,470 | |
Undistributed net investment income (loss) | | | 64,575 | | | | (1,576 | ) |
Accumulated net realized loss from investments | | | (1,601,154 | ) | | | (339,514 | ) |
Net unrealized appreciation of investments | | | 3,521,506 | | | | 921,772 | |
Net Assets | | $ | 55,568,497 | | | $ | 26,862,152 | |
Shares outstanding | | | 6,211,609 | | | | 2,516,961 | |
Net asset value, offering and redemption price per share | | $ | 8.95 | | | $ | 10.67 | |
* Investments at cost | | $ | 51,857,594 | | | $ | 25,667,108 | |
The accompanying notes are an integral part of these financial statements.
42
Statements of Operations
For the fiscal year ended October 31, 2011
| | | | | | | | | | | | | | | | | | | | |
| | | Managers
Frontier Small
Cap Growth
Fund | | | Managers
AMG TSCM
Growth
Equity Fund | | | Managers
Micro-Cap
Fund | | | Managers
Real Estate
Securities
Fund | | | Managers
California
Intermediate
Tax-Free
Fund | |
Investment Income: | | | | | | | | | | | | | | | | | | | | |
Dividend income | | $ | 383,845 | | | $ | 144,695 | | | $ | 951,056 | | | $ | 869,172 | | | | — | |
Interest income | | | 190 | | | | 15 | | | | 293 | | | | — | | | $ | 1,165,151 | |
Foreign withholding tax | | | (56 | ) | | | (625 | ) | | | — | | | | — | | | | — | |
Securities lending fees | | | 61,208 | | | | — | | | | 800 | | | | — | | | | — | |
Total investment income | | | 445,187 | | | | 144,085 | | | | 952,149 | | | | 869,172 | | | | 1,165,151 | |
Expenses: | | | | | | | | | | | | | | | | | | | | |
Investment management and advisory fees | | | 690,272 | | | | 139,123 | | | | 1,400,690 | | | | 310,209 | | | | 108,621 | |
Administrative fees | | | — | | | | 46,374 | | | | 350,173 | | | | 103,256 | | | | 68,658 | |
Distribution Fees - Investor Class | | | 1,662 | | | | 374 | | | | N/A | | | | N/A | | | | N/A | |
Transfer agent | | | 69,847 | | | | 56,690 | | | | 408,199 | | | | 62,425 | | | | 4,472 | |
Registration fees | | | 46,475 | | | | 45,646 | | | | 22,943 | | | | 22,064 | | | | 2,982 | |
Custodian | | | 32,741 | | | | 12,234 | | | | 65,353 | | | | 19,364 | | | | 28,330 | |
Professional fees | | | 30,094 | | | | 23,802 | | | | 35,902 | | | | 48,547 | | | | 27,615 | |
Reports to shareholders | | | 10,741 | | | | 17,477 | | | | 22,208 | | | | 19,081 | | | | 2,884 | |
Trustees fees and expenses | | | 6,974 | | | | 1,822 | | | | 11,331 | | | | 2,998 | | | | 2,008 | |
Miscellaneous | | | 4,791 | | | | 2,072 | | | | 6,453 | | | | 1,685 | | | | 1,756 | |
Total expenses before offsets | | | 893,597 | | | | 345,614 | | | | 2,323,252 | | | | 589,629 | | | | 247,326 | |
Expense reimbursements | | | (116,507 | ) | | | (157,601 | ) | | | (326,044 | ) | | | (27,489 | ) | | | (96,240 | ) |
Expense repayments | | | — | | | | — | | | | — | | | | 23,121 | | | | — | |
Expense reductions | | | (229 | ) | | | (14,989 | ) | | | (30,433 | ) | | | (3,118 | ) | | | (31 | ) |
Net expenses | | | 776,861 | | | | 173,024 | | | | 1,966,775 | | | | 582,143 | | | | 151,055 | |
Net investment income (loss) | | | (331,674 | ) | | | (28,939 | ) | | | (1,014,626 | ) | | | 287,029 | | | | 1,014,096 | |
Net Realized and Unrealized Gain (Loss): | | | | | | | | | | | | | | | | | | | | |
Net realized gain (loss) on investments | | | (716,902 | ) | | | (929,573 | ) | | | 27,071,407 | | | | 4,647,071 | | | | 73,261 | |
Net change in unrealized depreciation of investments | | | (6,310,416 | ) | | | (206,039 | ) | | | (11,541,404 | ) | | | (1,109,944 | ) | | | (321,805 | ) |
Net realized and unrealized gain (loss) | | | (7,027,318 | ) | | | (1,135,612 | ) | | | 15,530,003 | | | | 3,537,127 | | | | (248,544 | ) |
Net increase (decrease) in net assets resulting from operations | | ($ | 7,358,992 | ) | | ($ | 1,164,551 | ) | | $ | 14,515,377 | | | $ | 3,824,156 | | | $ | 765,552 | |
The accompanying notes are an integral part of these financial statements.
43
Statements of Changes in Net Assets
For the fiscal year ended October 31,
| | | | | | | | | | | | | | | | | | | | | | | | |
| | | Managers Frontier Small Cap
Growth Fund | | | Managers AMG TSCM
Growth Equity Fund | | | Managers Micro-Cap Fund | |
| | | 2011 | | | 2010 | | | 2011 | | | 2010* | | | 2011 | | | 2010 | |
Increase (Decrease) in Net Assets From Operations: | | | | | | | | | | | | | | | | | | | | | | | | |
Net investment income (loss) | | ($ | 331,674 | ) | | ($ | 214,092 | ) | | ($ | 28,939 | ) | | $ | 728 | | | ($ | 1,014,626 | ) | | ($ | 1,104,839 | ) |
Net realized gain (loss) on investments | | | (716,902 | ) | | | 1,807,400 | | | | (929,573 | ) | | | (1,312 | ) | | | 27,071,407 | | | | 8,053,879 | |
Net change in unrealized appreciation (depreciation) of investments | | | (6,310,416 | ) | | | 5,623,078 | | | | (206,039 | ) | | | 97,732 | | | | (11,541,404 | ) | | | 24,521,471 | |
Net increase (decrease) in net assets resulting from operations | | | (7,358,992 | ) | | | 7,216,386 | | | | (1,164,551 | ) | | | 97,148 | | | | 14,515,377 | | | | 31,470,511 | |
Distributions to Shareholders: | | | | | | | | | | | | | | | | | | | | | | | | |
From net investment income | | | — | | | | — | | | | (787 | ) | | | — | | | | — | | | | — | |
From Capital Share Transactions: | | | | | | | | | | | | | | | | | | | | | | | | |
Proceeds from sale of shares | | | 81,140,798 | | | | 12,220,563 | | | | 31,374,366 | | | | 1,090,343 | | | | 31,916,363 | | | | 3,601,646 | |
Reinvestment of dividends and distributions | | | — | | | | — | | | | 787 | | | | — | | | | — | | | | — | |
Cost of shares repurchased | | | (8,248,962 | ) | | | (28,526,838 | ) | | | (8,528,660 | ) | | | (100,100 | ) | | | (36,524,195 | ) | | | (26,824,668 | ) |
Net increase (decrease) from capital share transactions | | | 72,891,836 | | | | (16,306,275 | ) | | | 22,846,493 | | | | 990,243 | | | | (4,607,832 | ) | | | (23,223,022 | ) |
Total increase (decrease) in net assets | | | 65,532,844 | | | | (9,089,889 | ) | | | 21,681,155 | | | | 1,087,391 | | | | 9,907,545 | | | | 8,247,489 | |
Net Assets: | | | | | | | | | | | | | | | | | | | | | | | | |
Beginning of year | | | 30,446,517 | | | | 39,536,406 | | | | 1,087,391 | | | | — | | | | 135,569,594 | | | | 127,322,105 | |
End of year | | $ | 95,979,361 | | | $ | 30,446,517 | | | $ | 22,768,546 | | | $ | 1,087,391 | | | $ | 145,477,139 | | | $ | 135,569,594 | |
End of year undistributed net investment income | | | — | | | | — | | | | — | | | $ | 728 | | | $ | 125,308 | | | $ | 1,568 | |
| | | | | | | | | | | | | | | | | | | | | | | | |
Share Transactions: | | | | | | | | | | | | | | | | | | | | | | | | |
Sale of shares | | | 3,956,983 | 1 | | | 820,435 | | | | 2,661,505 | 1 | | | 108,700 | | | | 1,003,651 | | | | 120,296 | |
Shares repurchased | | | (450,640 | )1 | | | (1,945,580 | ) | | | (708,136 | )1 | | | (9,332 | ) | | | (1,022,125 | ) | | | (893,039 | ) |
Net increase (decrease) in shares | | | 3,506,343 | 1 | | | (1,125,145 | ) | | | 1,953,369 | 1 | | | 99,368 | | | | (18,474 | ) | | | (772,743 | ) |
| * | Commenced operations on July 30, 2010. |
| 1 | See note 1(g) of the Notes to Financial Statements. |
The accompanying notes are an integral part of these financial statements.
44
Statements of Changes in Net Assets
For the fiscal year ended October 31,
| | | | | | | | | | | | | | | | |
| | | Managers Real Estate Securities
Fund | | | Managers California
Intermediate Tax-Free Fund | |
| | | 2011 | | | 2010 | | | 2011 | | | 2010 | |
Increase (Decrease) in Net Assets From Operations: | | | | | | | | | | | | | | | | |
Net investment income | | $ | 287,029 | | | $ | 210,405 | | | $ | 1,014,096 | | | $ | 991,901 | |
Net realized gain on investments | | | 4,647,071 | | | | 3,547,200 | | | | 73,261 | | | | 35,518 | |
Net change in unrealized appreciation (depreciation) of investments | | | (1,109,944 | ) | | | 2,882,384 | | | | (321,805 | ) | | | 897,302 | |
Net increase in net assets resulting from operations | | | 3,824,156 | | | | 6,639,989 | | | | 765,552 | | | | 1,924,721 | |
Distributions to Shareholders: | | | | | | | | | | | | | | | | |
From net investment income | | | (266,975 | ) | | | (195,055 | ) | | | (1,014,096 | ) | | | (991,896 | ) |
From Capital Share Transactions: | | | | | | | | | | | | | | | | |
Proceeds from sale of shares | | | 45,437,049 | | | | 9,003,122 | | | | 1,019,409 | | | | 3,180,468 | |
Reinvestment of dividends and distributions | | | 255,784 | | | | 191,341 | | | | 448,572 | | | | 525,318 | |
Cost of shares repurchased | | | (17,468,606 | ) | | | (6,378,675 | ) | | | (5,672,621 | ) | | | (4,504,131 | ) |
Net increase (decrease) from capital share transactions | | | 28,224,227 | | | | 2,815,788 | | | | (4,204,640 | ) | | | (798,345 | ) |
Total increase (decrease) in net assets | | | 31,781,408 | | | | 9,260,722 | | | | (4,453,184 | ) | | | 134,480 | |
Net Assets: | | | | | | | | | | | | | | | | |
Beginning of year | | | 23,787,089 | | | | 14,526,367 | | | | 31,315,336 | | | | 31,180,856 | |
End of year | | | 55,568,497 | | | $ | 23,787,089 | | | $ | 26,862,152 | | | $ | 31,315,336 | |
End of year undistributed net investment income (loss) | | $ | 64,575 | | | $ | 89,485 | | | ($ | 1,576 | ) | | ($ | 1,576 | ) |
| | | | | | | | | | | | | | | | |
Share Transactions: | | | | | | | | | | | | | | | | |
Sale of shares | | | 5,269,490 | | | | 1,248,965 | | | | 96,667 | | | | 300,261 | |
Reinvestment of dividends and distributions | | | 30,340 | | | | 27,361 | | | | 42,697 | | | | 49,707 | |
Shares repurchased | | | (2,019,458 | ) | | | (901,249 | ) | | | (543,402 | ) | | | (425,846 | ) |
Net increase (decrease) in shares | | | 3,280,372 | | | | 375,077 | | | | (404,038 | ) | | | (75,878 | ) |
The accompanying notes are an integral part of these financial statements.
45
Financial Highlights
For a share outstanding throughout each fiscal year
| | | | | | | | | | | | | | | | | | | | |
| | | For the fiscal year ended October 31, | |
Managers Frontier Small Cap Growth Fund - Service Class | | 2011 | | | 2010* | | | 2009 | | | 2008 | | | 2007 | |
Net Asset Value, Beginning of Year | | | | | | | | | | | | | | | | | | | | |
Income from Investment Operations: | | $ | 16.72 | | | $ | 13.42 | | | $ | 11.69 | | | $ | 17.87 | | | $ | 15.47 | |
Net investment loss | | | (0.12 | )3 | | | (0.12 | )3 | | | (0.10 | )3 | | | (0.12 | )3 | | | (0.11 | )3 |
Net realized and unrealized gain (loss) on investments | | | 1.36 | 3 | | | 3.42 | 3 | | | 1.83 | 3 | | | (6.06 | )3 | | | 2.51 | 3 |
Total from investment operations | | | 1.24 | | | | 3.30 | | | | 1.73 | | | | (6.18 | ) | | | 2.40 | |
Net Asset Value, End of Year | | $ | 17.96 | | | $ | 16.72 | | | $ | 13.42 | | | $ | 11.69 | | | $ | 17.87 | |
Total Return1 | | | 7.42 | %4 | | | 24.59 | % | | | 14.80 | % | | | (34.58 | )% | | | 15.51 | % |
Ratio of net expenses to average net assets | | | 1.30 | % | | | 1.37 | % | | | 1.46 | % | | | 1.41 | % | | | 1.39 | % |
Ratio of net investment loss to average net assets1 | | | (0.63 | )% | | | (0.78 | )% | | | (0.90 | )% | | | (0.79 | )% | | | (0.68 | )% |
Portfolio turnover | | | 44 | % | | | 52 | % | | | 136 | % | | | 59 | % | | | 49 | % |
Net assets at end of Year (000’s omitted) | | $ | 18,199 | | | $ | 18,290 | | | $ | 39,536 | | | $ | 51,057 | | | $ | 87,015 | |
| | | | | | | | | | | | | | | | | | | | |
Ratios absent expense offsets: 2 | | | | | | | | | | | | | | | | | | | | |
Ratio of total expenses to average net assets | | | 1.47 | % | | | 1.66 | % | | | 1.50 | % | | | 1.43 | % | | | 1.41 | % |
Ratio of net investment loss to average net assets | | | (0.80 | )% | | | (1.07 | )% | | | (0.94 | )% | | | (0.80 | )% | | | (0.70 | )% |
| | | | | | | | | | | | | | | | | | | | |
Financial Highlights
For a share outstanding throughout each fiscal year
| | | | | | | | |
Managers Frontier Small Cap Growth Fund Investor Class Shares | | For the
fiscal year
ended
October 31,
2011 | | | For the
fiscal period
ended
October 31,
2010* | |
Net Asset Value, Beginning of Period | | $ | 16.70 | | | $ | 14.64 | |
Income from Investment Operations: | | | | | | | | |
Net investment loss | | | (0.16 | )3 | | | (0.11 | )3 |
Net realized and unrealized gain on investments | | | 1.36 | 3 | | | 2.17 | 3 |
Total from investment operations | | | 1.20 | | | | 2.06 | |
Net Asset Value, End of Period | | $ | 17.90 | | | $ | 16.70 | |
Total Return1 | | | 7.19 | % | | | 14.07 | %5 |
Ratio of net expenses to average net assets | | | 1.55 | % | | | 1.55 | %6 |
Ratio of net investment loss to average net assets1 | | | (0.86 | )% | | | (0.91 | )%6 |
Portfolio turnover | | | 44 | % | | | 52 | %5 |
Net assets at end of period (000’s omitted) | | $ | 563 | | | $ | 406 | |
| | | | | | | | |
Ratios absent expense offsets: 2 | | | | | | | | |
Ratio of total expenses to average net assets | | | 1.72 | % | | | 1.94 | %6 |
Ratio of net investment loss to average net assets | | | (1.03 | )% | | | (1.30 | )%6 |
| | | | | | | | |
| | | | | | | | |
Managers Frontier Small Cap Growth Fund Institutional Class Shares | | For the
fiscal year
ended
October 31,
2011 | | | For the
fiscal period
ended
October 31,
2010* | |
Net Asset Value, Beginning of Period | | $ | 16.74 | | | $ | 14.64 | |
Income from Investment Operations: | | | | | | | | |
Net investment loss | | | (0.08 | )3 | | | (0.05 | )3 |
Net realized and unrealized gain on investments | | | 1.37 | 3 | | | 2.15 | 3 |
Total from investment operations | | | 1.29 | | | | 2.10 | |
Net Asset Value, End of Period | | $ | 18.03 | | | $ | 16.74 | |
Total Return1 | | | 7.71 | % | | | 14.34 | %5 |
Ratio of net expenses to average net assets | | | 1.05 | % | | | 1.05 | %6 |
Ratio of net investment loss to average net assets1 | | | (0.41 | )% | | | (0.41 | )%6 |
Portfolio turnover | | | 44 | % | | | 52 | %5 |
Net assets at end of period (000’s omitted) | | $ | 77,217 | | | $ | 11,750 | |
| | | | | | | | |
Ratios absent expense offsets: 2 | | | | | | | | |
Ratio of total expenses to average net assets | | | 1.22 | % | | | 1.44 | %6 |
Ratio of net investment loss to average net assets | | | (0.58 | )% | | | (0.80 | )%6 |
| | | | | | | | |
Financial Highlights
For a share outstanding throughout each fiscal year
| | | | | | | | |
Managers AMG TSCM Growth Equity Fund - Investor Class | | For the
fiscal year
ended
October 31,
2011 | | | For the
fiscal period
ended
October 31,
2010 ** | |
Net Asset Value, Beginning of Period | | $ | 10.93 | | | $ | 10.00 | |
Income from Investment Operations: | | | | | | | | |
Net investment income (loss) | | | (0.10 | )3 | | | (0.00 | )#,3 |
Net realized and unrealized gain on investments | | | 0.19 | 3 | | | 0.93 | 3 |
Total from investment operations | | | 0.09 | | | | 0.93 | |
Less Distributions to Shareholders from: | | | | | | | | |
Net investment income | | | (0.00 | )# | | | — | |
Net Asset Value, End of Period | | $ | 11.02 | | | $ | 10.93 | |
Total Return1 | | | 0.84 | % | | | 9.30 | %5 |
Ratio of net expenses to average net assets | | | 1.11 | % | | | 1.17 | %6 |
Ratio of net investment loss to average net assets1 | | | (0.86 | )% | | | (0.11 | )%6 |
Portfolio turnover | | | 102 | % | | | 50 | %5 |
Net assets at end of period (000’s omitted) | | $ | 2,465 | | | $ | 14 | |
| | | | | | | | |
Ratios absent expense offsets:2 | | | | | | | | |
Ratio of total expenses to average net assets | | | 2.04 | % | | | 15.15 | %6 |
Ratio of net investment loss to average net assets | | | (1.79 | )% | | | (14.09 | )%6 |
| | | | | | | | |
| | | | | | | | |
Managers AMG TSCM Growth Equity Fund - Service Class | | For the
fiscal year
ended
October 31,
2011 | | | For the
fiscal period
ended
October 31,
2010 ** | |
Net Asset Value, Beginning of Period | | $ | 10.94 | | | $ | 10.00 | |
Income from Investment Operations: | | | | | | | | |
Net investment income (loss) | | | (0.02 | )3 | | | 0.00 | #,3 |
Net realized and unrealized gain on investments | | | 0.18 | 3 | | | 0.94 | 3 |
Total from investment operations | | | 0.16 | | | | 0.94 | |
Net Asset Value, End of Period | | $ | 11.10 | | | $ | 10.94 | |
Total Return1 | | | 1.46 | %4 | | | 9.40 | %5 |
Ratio of net expenses to average net assets | | | 0.96 | % | | | 1.03 | %6 |
Ratio of net investment income (loss) to average net assets1 | | | (0.17 | )% | | | 0.00 | %#,6 |
Portfolio turnover | | | 102 | % | | | 50 | %5 |
Net assets at end of period (000’s omitted) | | $ | 18,321 | | | $ | 11 | |
| | | | | | | | |
Ratios absent expense offsets:2 | | | | | | | | |
Ratio of total expenses to average net assets | | | 1.89 | % | | | 15.00 | %6 |
Ratio of net investment loss to average net assets | | | (1.10 | )% | | | (13.97 | )%6 |
| | | | | | | | |
Financial Highlights
For a share outstanding throughout each fiscal year
| | | | | | | | |
Managers AMG TSCM Growth Equity Fund - Institutional Class | | For the
fiscal year
ended
October 31,
2011 | | | For the
fiscal period
ended
October 31,
2010 ** | |
Net Asset Value, Beginning of Period | | $ | 10.94 | | | $ | 10.00 | |
Income from Investment Operations: | | | | | | | | |
Net investment income | | | 0.00 | #,3 | | | 0.01 | 3 |
Net realized and unrealized gain on investments | | | 0.13 | 3 | | | 0.93 | 3 |
Total from investment operations | | | 0.13 | | | | 0.94 | |
Less Distributions to Shareholders from: | | | | | | | | |
Net investment income | | | (0.00 | )# | | | — | |
Net Asset Value, End of Period | | $ | 11.07 | | | $ | 10.94 | |
Total Return1 | | | 1.23 | % | | | 9.40 | %5 |
Ratio of net expenses to average net assets | | | 0.71 | % | | | 0.79 | %6 |
Ratio of net investment income to average net assets1 | | | 0.03 | % | | | 0.27 | %6 |
Portfolio turnover | | | 102 | % | | | 50 | %5 |
Net assets at end of period (000’s omitted) | | $ | 1,982 | | | $ | 1,063 | |
| | | | | | | | |
Ratios absent expense offsets:2 | | | | | | | | |
Ratio of total expenses to average net assets | | | 1.64 | % | | | 14.74 | %6 |
Ratio of net investment loss to average net assets | | | (0.90 | )% | | | (13.68 | )%6 |
| | | | | | | | |
Financial Highlights
For a share outstanding throughout each fiscal year
| | | | | | | | | | | | | | | | | | | | |
| | | For the fiscal year ended October 31, | |
Managers Micro-Cap Fund - Service Class Shares† | | 2011 | | | 2010 | | | 2009 | | | 2008 | | | 2007 | |
Net Asset Value, Beginning of Year | | $ | 33.42 | | | $ | 26.37 | | | $ | 25.41 | | | $ | 41.90 | | | $ | 34.48 | |
Income from Investment Operations: | | | | | | | | | | | | | | | | | | | | |
Net investment loss | | | (0.27 | )3 | | | (0.25 | )3 | | | (0.21 | )3 | | | (0.31 | )3 | | | (0.37 | )3 |
Net realized and unrealized gain (loss) on investments | | | 2.88 | 3 | | | 7.30 | 3 | | | 2.73 | 3 | | | (16.18 | )3 | | | 7.79 | 3 |
Total from investment operations | | | 2.61 | | | | 7.05 | | | | 2.52 | | | | (16.49 | ) | | | 7.42 | |
Less Distribution to Shareholders from: | | | | | | | | | | | | | | | | | | | | |
Net realized gain on investments | | | — | | | | — | | | | (1.56 | ) | | | — | | | | — | |
Net Asset Value End of Year | | $ | 36.03 | | | $ | 33.42 | | | $ | 26.37 | | | $ | 25.41 | | | $ | 41.90 | |
Total Return 1 | | | 7.78 | % | | | 26.73 | %4 | | | 11.34 | %4 | | | (39.37 | )% | | | 21.52 | %4 |
Ratio of net expenses to average net assets | | | 1.41 | % | | | 1.50 | % | | | 1.53 | % | | | 1.54 | % | | | 1.53 | % |
Ratio of net investment loss to average net assets 1 | | | (0.73 | )% | | | (0.84 | )% | | | (0.90 | )% | | | (0.92 | )% | | | (1.01 | )% |
Portfolio turnover | | | 85 | % | | | 93 | % | | | 82 | % | | | 193 | % | | | 76 | % |
Net assets at end of year (000’s omitted) | | $ | 113,742 | | | $ | 135,570 | | | $ | 127,322 | | | $ | 132,424 | | | $ | 271,934 | |
| | | | | | | | | | | | | | | | | | | | |
Ratios absent expense offsets: 2 | | | | | | | | | | | | | | | | | | | | |
Ratio of total expenses to average net assets | | | 1.66 | % | | | 1.72 | % | | | 1.75 | % | | | 1.66 | % | | | 1.53 | % |
Ratio of net investment loss to average net assets | | | (0.98 | )% | | | (1.06 | )% | | | (1.12 | )% | | | (1.04 | )% | | | (1.01 | )% |
| | | | | | | | | | | | | | | | | | | | |
| | | | |
| | | For the fiscal period | |
| | | October 1, 2011, through | |
Managers Micro Cap Fund - Institutional Class Shares†† | | October 31, 2011 | |
Net Asset Value, Beginning of Period | | $ | 31.02 | |
Income from Investment Operations: | | | | |
Net investment loss | | | (0.01 | )3 |
Net realized and unrealized gain on investments | | | 5.02 | 3 |
Total from investment operations | | | 5.01 | |
Net Asset Value, End of Period | | $ | 36.03 | |
Total Return1 | | | 16.18 | %5 |
Ratio of net expenses to average net assets | | | 1.17 | %6 |
Ratio of net investment loss to average net assets1 | | | (0.42 | )%6 |
Portfolio turnover | | | 85 | %5 |
Net assets at end of period (000’s omitted) | | $ | 31,735 | |
| | | | |
Ratios absent expense offsets: 2 | | | | |
Ratio of total expenses to average net assets | | | 1.50 | %6 |
Ratio of net investment loss to average net assets | | | (0.75 | )%6 |
| | | | |
50
Financial Highlights
For a share outstanding throughout each fiscal year
| | | | | | | | | | | | | | | | | | | | |
| | | For the fiscal year ended October 31, | |
Managers Real Estate Securities Fund | | 2011 | | | 2010 | | | 2009 | | | 2008 | | | 2007 | |
Net Asset Value, Beginning of Year | | $ | 8.12 | | | $ | 5.68 | | | $ | 5.55 | | | $ | 12.57 | | | $ | 14.74 | |
Income from Investment Operations: | | | | | | | | | | | | | | | | | | | | |
Net investment income | | | 0.06 | 3 | | | 0.08 | 3 | | | 0.12 | 3 | | | 0.13 | 3 | | | 0.06 | |
Net realized and unrealized gain (loss) on investments | | | 0.83 | 3 | | | 2.43 | 3 | | | 0.16 | 3 | | | (4.06 | )3 | | | 0.22 | |
Total from investment operations | | | 0.89 | | | | 2.51 | | | | 0.28 | | | | (3.93 | ) | | | 0.28 | |
Less Distributions to Shareholders from: | | | | | | | | | | | | | | | | | | | | |
Net investment income | | | (0.06 | ) | | | (0.07 | ) | | | (0.15 | ) | | | (0.12 | ) | | | (0.10 | ) |
Net realized gain on investments | | | — | | | | — | | | | — | | | | (2.97 | ) | | | (2.35 | ) |
Total distributions to shareholders | | | (0.06 | ) | | | (0.07 | ) | | | (0.15 | ) | | | (3.09 | ) | | | (2.45 | ) |
Net Asset Value, End of Year | | $ | 8.95 | | | $ | 8.12 | | | $ | 5.68 | | | $ | 5.55 | | | $ | 12.57 | |
Total Return 1 | | | 11.06 | % | | | 44.47 | % | | | 5.77 | % | | | (38.95 | )% | | | 2.10 | % |
Ratio of net expenses to average net assets | | | 1.41 | % | | | 1.49 | % | | | 1.48 | % | | | 1.48 | % | | | 1.40 | % |
Ratio of net investment income to average net assets 1 | | | 0.69 | % | | | 1.12 | % | | | 2.56 | % | | | 1.63 | % | | | 0.82 | % |
Portfolio turnover | | | 75 | % | | | 99 | % | | | 107 | % | | | 127 | % | | | 126 | % |
Net assets at end of year (000’s omitted) | | $ | 55,568 | | | $ | 23,787 | | | $ | 14,526 | | | $ | 12,366 | | | $ | 26,561 | |
| | | | | | | | | | | | | | | | | | | | |
Ratios absent expense offsets: 2 | | | | | | | | | | | | | | | | | | | | |
Ratio of total expenses to average net assets | | | 1.48 | % | | | 1.79 | % | | | 2.47 | % | | | 1.80 | % | | | 1.41 | % |
Ratio of net investment income to average net assets | | | 0.62 | % | | | 0.82 | % | | | 1.57 | % | | | 1.31 | % | | | 0.83 | % |
| | | | | | | | | | | | | | | | | | | | |
51
Financial Highlights
For a share outstanding throughout each fiscal year
| | | | | | | | | | | | | | | | | | | | |
| | | For the fiscal year ended October 31, | |
Managers California Intermediate Tax-Free Fund | | 2011 | | | 2010 | | | 2009 | | | 2008 | | | 2007 | |
Net Asset Value, Beginning of Year | | $ | 10.72 | | | $ | 10.40 | | | $ | 9.84 | | | $ | 10.56 | | | $ | 10.75 | |
Income from Investment Operations: | | | | | | | | | | | | | | | | | | | | |
Net investment income | | | 0.39 | | | | 0.34 | | | | 0.32 | | | | 0.38 | | | | 0.40 | |
Net realized and unrealized gain (loss) on investments | | | (0.05 | ) | | | 0.32 | | | | 0.55 | | | | (0.56 | ) | | | (0.16 | ) |
Total from investment operations | | | 0.34 | | | | 0.66 | | | | 0.87 | | | | (0.18 | ) | | | 0.24 | |
Less Distributions to Shareholders from: | | | | | | | | | | | | | | | | | | | | |
Net investment income | | | (0.39 | ) | | | (0.34 | ) | | | (0.31 | ) | | | (0.38 | ) | | | (0.40 | ) |
Net realized gain on investments | | | — | | | | — | | | | — | | | | (0.16 | ) | | | (0.03 | ) |
Total distributions to shareholders | | | (0.39 | ) | | | (0.34 | ) | | | (0.31 | ) | | | (0.54 | ) | | | (0.43 | ) |
Net Asset Value, End of Year | | $ | 10.67 | | | $ | 10.72 | | | $ | 10.40 | | | $ | 9.84 | | | $ | 10.56 | |
Total Return 1 | | | 3.27 | % | | | 6.41 | % | | | 8.97 | % | | | (1.82 | )% | | | 2.23 | % |
Ratio of net expenses to average net assets | | | 0.55 | % | | | 0.55 | % | | | 0.55 | % | | | 0.55 | % | | | 0.56 | % |
Ratio of net investment income to average net assets 1 | | | 3.69 | % | | | 3.20 | % | | | 3.08 | % | | | 3.71 | % | | | 3.75 | % |
Portfolio turnover | | | 8 | % | | | 64 | % | | | 152 | % | | | 33 | % | | | 35 | % |
Net assets at end of year (000’s omitted) | | $ | 26,862 | | | $ | 31,315 | | | $ | 31,181 | | | $ | 32,955 | | | $ | 35,982 | |
| | | | | | | | | | | | | | | | | | | | |
Ratios absent expense offsets: 2 | | | | | | | | | | | | | | | | | | | | |
Ratio of total expenses to average net assets | | | 0.90 | % | | | 0.96 | % | | | 0.86 | % | | | 0.80 | % | | | 0.82 | % |
Ratio of net investment income to average net assets | | | 3.34 | % | | | 2.79 | % | | | 2.77 | % | | | 3.46 | % | | | 3.49 | % |
| | | | | | | | | | | | | | | | | | | | |
Notes to Financial Highlights
The following footnotes are to be read in conjunction with the Financial Highlights previously presented in the report.
| # | Rounds to less than $0.01 per share or 0.01%. |
| * | Effective January 1, 2010, existing shares of Managers Frontier Small Cap Growth Fund (formerly shares of Managers Small Cap Fund) were reclassified and redesignated as Service Class shares. Investor Class and Institutional Class shares commenced operations on January 1, 2010. |
| ** | Commenced operations on July 30, 2010. |
| † | Effective October 1, 2011, existing shares of Managers Micro-Cap Fund were reclassified and redesignated as Service Class shares. |
| †† | As of the close of business on September 30, 2011, Managers Institutional Micro Cap Fund (“Institutional Micro Cap”) merged into Managers Micro Cap Fund. Each full and partial share of Institutional Micro Cap was exchanged for shares in the new Institutional Class of Micro Cap in an equivalent dollar amount. |
| 1 | Total returns and net investment income would have been lower had certain expenses not been reduced. (See Note 1(c) of Notes to Financial Statements.) |
| 2 | Excludes the impact of expense reimbursements or fee waivers and expense reductions such as brokerage credits, but includes expense repayments and non-reimbursable expenses, if any, such as interest and taxes. (See Note 1(c) of Notes to Financial Statements.) |
| 3 | Per share numbers have been calculated using average shares. |
| 4 | The Total Return is based on the Financial Statement Net Asset Values as shown above. |
52
Notes to Financial Statements
October 31, 2011
| 1. | Summary of Significant Accounting Policies |
Managers Trust I (the “Trust”) is an open-end management investment company organized as a Massachusetts business trust and registered under the Investment Company Act of 1940, as amended (the “1940 Act”). Currently, the Trust consists of a number of investment series. Included in this report are: Managers Frontier Small Cap Growth Fund (“Small Cap”) (formerly Managers Small Cap Fund), Managers Micro-Cap Fund (“Micro-Cap”) (formerly Managers Fremont Micro-Cap Fund), Managers Real Estate Securities Fund (“Real Estate Securities”), Managers California Intermediate Tax-Free Fund (“California Intermediate Tax-Free”), and Managers AMG TSCM Growth Equity Fund (“TSCM Growth Equity”), each a “Fund” and collectively the “Funds.” TSCM Growth Equity commenced operations on July 30, 2010.
As of the close of business on September 30, 2011, Managers Institutional Micro-Cap Fund (“Institutional Micro Cap”) merged into Micro Cap, an open-end investment company, pursuant to a plan of reorganization approved by the Board of Trustees at a meeting held on June 23, 2011. In connection with the merger, the Board of Trustees also approved the transformation of Micro-Cap from a single-class fund into a multi-class fund. Each full and partial share of Institutional Micro Cap was exchanged for shares in the new Institutional Class of Micro Cap in an equivalent dollar amount. All shares in Micro Cap were redesignated as Service Class shares and shareholders with balances of $100,000 or more were moved into the Institutional Class shares. The purpose of the transition was to combine two funds managed by the same advisors with identical investment objectives and strategies. The merger was accomplished by a tax-free exchange of 1,944,165 shares of Institutional Micro Cap valued at $18,902,143, for 609,346 shares valued at $18,902,143 of Micro-Cap’s Institutional Class shares at the close of business on September 30, 2011. The investment portfolio of Institutional Micro-Cap, with a fair value of $18,912,553 and a cost of $18,659,352 at the close of business on September 30, 2011, was the principal asset received by Micro-Cap. For financial reporting purposes, assets received and shares issued by Micro-Cap were recorded at fair value; however, the cost basis of the investments received from Institutional Micro-Cap was carried forward to align ongoing reporting of Micro-Cap’s realized and unrealized gains and losses with amount distributable to shareholders for tax purposes. Immediately prior to the merger, the net assets of Micro-Cap were $107,638,895.
Effective January 1, 2010, Small Cap added new classes of shares. Small Cap offers three classes of shares, Institutional, Service and Investor, each offering varying levels of shareholder servicing and / or 12b-1 fees. Legacy Small Cap shareholders became shareholders in the Institutional Class and Service Class.
Small Cap and TSCM Growth Equity each offer three classes of shares: Investor Class, Service Class, and Institutional Class. Micro-Cap currently offers two classes of shares: Institutional Class and Service Class. Each class represents an interest in the same assets of the Fund and the classes are identical except for class specific expenses related to shareholder activity. Each class has equal voting privileges except that each class has exclusive voting rights with respect to its services and/or distribution plan. Please refer to a current prospectus for additional information on each share class.
The Funds’ financial statements are prepared in accordance with accounting principles generally accepted in the United States of America (“U.S. GAAP”), which require management to make estimates and assumptions that affect the reported amounts of assets and liabilities and disclosure of contingent assets and liabilities at the date of the financial statements and the reported amounts of income and expenses during the reporting periods. Actual results could differ from those estimates and such differences may be material. The following is a summary of significant accounting policies followed by the Funds in the preparation of their financial statements:
| a. | Valuation of Investments |
Equity securities traded on a domestic or international securities exchange are valued at the last quoted sale price, or, lacking any sales, at the last quoted bid price. Over-the-counter securities are valued at the Nasdaq Official Closing Price, if one is available. Lacking any sales, over-the-counter securities are valued at the last quoted bid price. The Funds’ investments are generally valued based on market quotations provided by third-party pricing services approved by the Board of Trustees of the Funds (the “Board”). Under certain circumstances, the value of certain investments may be based on an evaluation of fair value, pursuant to procedures established by and under the general supervision of the Board. Each Fund may use the fair value of a portfolio investment to calculate its net asset value (“NAV”) when, for example, (1) market quotations are not readily available because a portfolio investment is not traded in a public market or the principal market in which the investment trades is closed, (2) trading in a portfolio investment is suspended and has not resumed before the Fund calculates its NAV, (3) a significant event affecting the value of a portfolio investment is determined to have occurred between the time of the market quotation provided for a portfolio investment and the time as of which the Fund calculates its NAV, (4) an investment’s price has remained unchanged over a period of time (often referred to as a “stale price”), or (5) Managers Investment Group LLC (the “Investment Manager”) determines that a market quotation is inaccurate. Portfolio investments that trade primarily on foreign markets are priced based upon the market quotation of such securities as of the close of their respective principal markets, as adjusted to reflect the Investment Manager’s determination of the impact of events occurring subsequent to the close of such markets but prior to the time as of which the Funds calculate its NAV. In accordance with procedures approved by the Board, the Investment Manager relies upon recommendations of a third-party fair valuation service in adjusting the prices of such foreign portfolio investments. The Funds may invest in securities that may be thinly traded. The Board has adopted procedures to adjust prices when thinly traded securities are judged to be stale so that they reflect fair value. An investment valued on the basis of its fair value may be valued higher or lower than available market quotations. An investment’s valuation may differ depending on the method used and the factors considered in determining value according to the Fund’s fair value procedures.
Fixed-income securities are valued based on valuations furnished by independent pricing services that utilize matrix systems, which reflect such factors as security prices, yields, maturities, and ratings, and are supplemented by dealer and exchange quotations. Futures contracts for which market quotations are readily available are
|
| Notes to Financial Statements (continued) |
valued at the settlement price as of the close of the futures exchange. Short-term investments having a remaining maturity of 60 days or less are valued at amortized cost, which approximates market value. Investments in other open-end regulated investment companies are valued at their end of day net asset value per share. Investments in certain mortgage-backed and stripped mortgage-backed securities, preferred stocks, convertible securities, derivatives and other debt securities not traded on an organized securities market are valued on the basis of valuations provided by dealers or by a pricing service which uses information with respect to transactions in such securities and various relationships between securities and yield to maturity in determining value. Securities (including derivatives) for which market quotations are not readily available are valued at fair value, as determined in good faith, and pursuant to procedures adopted by the Board. The values assigned to fair value investments are based on available information and do not necessarily represent amounts that might ultimately be realized, since such amounts depend on future developments inherent in long-term investments. Further, because of the inherent uncertainty of valuation, those estimated values may differ significantly from the values that would have been used had a ready market for the investments existed, and the differences could be material.
U.S. GAAP defines fair value as the price that a Fund would receive to sell an asset or pay to transfer a liability in an orderly transaction between market participants at the measurement date. U.S. GAAP also establishes a framework for measuring fair value, and a three-level hierarchy for fair value measurements based upon the transparency of inputs to the valuation of an asset or liability. Inputs may be observable or unobservable and refer broadly to the assumptions that market participants would use in pricing the asset or liability. Observable inputs reflect the assumptions market participants would use in pricing the asset or liability based on market data obtained from sources independent of the Funds. Unobservable inputs reflect the Funds’ own assumptions about the assumptions that market participants would use in pricing the asset or liability developed based on the best information available in the circumstances. Each investment is assigned a level based upon the observability of the inputs which are significant to the overall valuation.
The three-tier hierarchy of inputs is summarized below:
Level 1 - inputs are quoted prices in active markets for identical investments (e.g., equity securities, open-end investment companies)
Level 2 - other observable inputs (including, but not limited to: quoted prices for similar assets or liabilities in markets that are active, quoted prices for identical or similar assets or liabilities in markets that are not active, inputs other than quoted prices that are observable for the assets or liabilities (such as interest rates, yield curves, volatilities, prepayment speeds, loss severities, credit risks and default rates) or other market corroborated inputs) (e.g., debt securities, government securities, swap contracts, foreign currency exchange contracts, foreign securities utilizing international fair value pricing, broker-quoted securities, fair valued securities with observable inputs)
Level 3 - inputs are significant unobservable inputs (including the Fund’s own assumptions used to determine the fair value of investments) (e.g., fair valued securities with unobservable inputs)
The inputs or methodologies used for valuing investments are not necessarily an indication of the risk associated with investing in those investments.
Security transactions are accounted for as of the trade date. Realized gains and losses on securities sold are determined on the basis of identified cost.
| c. | Investment Income and Expenses |
Dividend income is recorded on the ex-dividend date except certain dividends from foreign securities where the ex-dividend date may have passed. Dividends from foreign securities are recorded as soon as the Trust is informed of the ex-dividend date. Dividend income on foreign securities is recorded net of any withholding tax. Interest income, which includes amortization of premium and accretion of discount on debt securities, as required, is accrued as earned. Non-cash dividends included in dividend income, if any, are reported at the fair value of the securities received. Other income and expenses are recorded on an accrual basis. Expenses that cannot be directly attributed to a fund are apportioned among the Funds in the Trust and in some cases other affiliated funds based upon their relative average net assets or number of shareholders. For Small Cap, TSCM Growth Equity and Micro-Cap Funds, investment income, realized and unrealized capital gains and losses, the common expenses of the Funds, and certain Fund level expense reductions, if any, are allocated on a pro rata basis to each class based on the relative net assets of each class to the total net assets of each Fund.
The following Funds had certain portfolio trades directed to various brokers, under a brokerage recapture program, which paid a portion of the Fund’s expenses. For the fiscal year ended October 31, 2011, under these arrangements the amount by which the Funds’ expenses were reduced and the impact on the expense ratios were as follows: Small Cap - $137 or 0.00%, Micro-Cap - $30,278 or 0.02%, Real Estate Securities - $3,068 or 0.01%, and TSCM Growth Equity - $14,966 or 0.08%.
The Funds have a “balance credit” arrangement with The Bank of New York Mellon (“BNYM”), the Funds’ custodian, whereby each Fund is credited with an interest factor equal to 0.75% below the effective 90-day T-Bill rate for account balances left uninvested overnight. If the T-Bill rate falls below 0.75%, no credits will be earned. These credits serve to reduce custody expenses that would otherwise be charged to each Fund. For the fiscal year ended October 31, 2011, the custodian expense was not reduced for any of the Funds.
Overdrafts will cause a reduction of any earnings credits, computed at 2% above the effective Federal Funds rate on the day of the over-draft. For the fiscal year ended October 31, 2011, the overdraft fees were as follows: Small Cap - $4, and Micro-Cap - $292.
The Trust also has a balance credit arrangement with its Transfer Agent, BNY Mellon Investment Servicing (US) Inc. (formerly PNC Global Investment Servicing (U.S.) Inc.), whereby earnings credits are used to offset banking charges and other out-of-pocket expenses. For the fiscal year ended October 31, 2011, the transfer agent expense was reduced as follows: Small Cap - $92, TSCM Growth Equity - $23, Micro-Cap - $155, Real Estate Securities - $50 and California Intermediate Tax-Free - $31.
Notes to Financial Statements (continued)
Total returns and net investment income for the Funds would have been lower had certain expenses not been offset. Total expenses before offsets exclude the impact of expense reimbursements or fee waivers and expense reductions such as brokerage recapture credits, but include non-reimbursable expenses, if any, such as interest and taxes.
| d. | Dividends and Distributions |
Dividends resulting from net investment income, if any, normally will be declared and paid as follows:
Annually - Small Cap, TSCM Growth Equity, and Micro-Cap
Quarterly - Real Estate Securities
Declared daily, paid monthly - California Intermediate Tax-Free
Distributions of capital gains, if any, will be made on an annual basis and when required for Federal excise tax purposes. Income and capital gain distributions are determined in accordance with Federal income tax regulations, which may differ from U.S. GAAP. These differences are primarily due to differing treatments for losses deferred due to wash sales, REITs, equalization accounting for tax purposes, and market discount transactions. Permanent book and tax basis differences, if any, relating to shareholder distributions will result in reclassifications to paid-in capital. The tax character of distributions paid during the fiscal years ended October 31, 2011 and October 31, 2010 were as follows:
| | | | | | | | | | | | | | | | | | | | | | | | |
| | | Small Cap | | | TSCM Growth Equity* | | | Micro-Cap | |
| | | 2011 | | | 2010 | | | 2011 | | | 2010 | | | 2011 | | | 2010 | |
Distributions paid from: | | | | | | | | | | | | | | | | | | | | | | | | |
Ordinary income | | | — | | | | — | | | $ | 787 | | | | — | | | | — | | | | — | |
Short-term capital gains | | | — | | | | — | | | | — | | | | — | | | | — | | | | — | |
Long-term capital gains | | | — | | | | — | | | | — | | | | — | | | | — | | | | — | |
| | | | | | | | | | | | | | | | | | | | | | | | |
Totals | | | — | | | | — | | | $ | 787 | | | | — | | | | — | | | | — | |
| | | | | | | | | | | | | | | | | | | | | | | | |
| | | | | | | | | | | | | | | | |
| | | Real Estate Securities | | | California
Intermediate Tax-Free | |
| | | 2011 | | | 2010 | | | 2011 | | | 2010 | |
Distributions paid from: | | | | | | | | | | | | | | | | |
Ordinary income | | $ | 266,975 | | | $ | 195,055 | | | $ | 1,014,096 | | | $ | 991,896 | |
Short-term capital gains | | | — | | | | — | | | | — | | | | — | |
Long-term capital gains | | | — | | | | — | | | | — | | | | — | |
| | | | | | | | | | | | | | | | |
Totals | | $ | 266,975 | | | $ | 195,055 | | | $ | 1,014,096 | | | $ | 991,896 | |
| | | | | | | | | | | | | | | | |
| * | Commenced operations on July 30, 2010. |
As of October 31, 2011, the components of distributable earnings (excluding unrealized appreciation/depreciation) on a tax basis consisted of:
| | | | | | | | | | | | | | | | | | | | |
| | | Small Cap | | | TSCM Growth Equity | | | Micro-Cap | | | Real Estate
Securities | | | California
Intermediate
Tax-Free | |
Capital loss carryforward | | $ | 498,829 | | | $ | 824,880 | | | | — | | | $ | 332,187 | | | $ | 339,514 | |
Undistributed ordinary income | | | — | | | | — | | | | — | | | | 64,575 | | | | 11,782 | |
Undistributed short-term capital gains | | | — | | | | — | | | | — | | | | — | | | | — | |
Undistributed long-term capital gains | | | — | | | | — | | | $ | 10,524,926 | | | | — | | | | — | |
Each Fund intends to comply with the requirements under Subchapter M of the Internal Revenue Code of 1986, as amended, to distribute substantially all of their taxable income and gains to their shareholders and to meet certain diversification and income requirements with respect to investment companies. Therefore, no provision for Federal income or excise tax is included in the accompanying financial statements.
Additionally, based on each Fund’s understanding of the tax rules and rates related to income, gains and transactions for the foreign jurisdictions in which it invests, each Fund will provide for foreign taxes, and where appropriate, deferred foreign taxes.
Management has analyzed the Funds’ tax positions taken on federal income tax returns for all open tax years (tax years ended October 31,
Notes to Financial Statements (continued)
2008-2011), and has concluded that no provision for federal income tax is required in the Funds’ financial statements. The Funds are not aware of any tax position for which it is reasonably possible that the total amounts of unrecognized tax benefits will change materially in the next twelve months.
| f. | Capital Loss Carryovers and Deferrals |
As of October 31, 2011, the following Funds had accumulated net realized capital loss carryovers from securities transactions for Federal income tax purposes as shown in the following chart. These amounts may be used to offset realized capital gains, if any, through the expiration dates listed.
| | | | | | | | |
Fund | | Capital Loss
Carryover Amount | | | Expires
October 31, | |
Small Cap | | $ | 498,829 | | | | 2019 | |
| | | | | | | | |
TSCM Growth Equity | | $ | 471 | | | | 2018 | |
| | | 824,409 | | | | 2019 | |
| | | | | | | | |
Total | | $ | 824,880 | | | | | |
| | | | | | | | |
Real Estate Securities | | $ | 332,187 | | | | 2017 | |
| | | | | | | | |
California Intermediate Tax-Free | | $ | 339,514 | | | | 2016 | |
| | | | | | | | |
For the fiscal year ended October 31, 2011, Micro-Cap, Real Estate Securities, and California Intermediate Tax-Free utilized capital loss carryovers in the amounts of $15,812,269, $4,173,487, and $73,261, respectively.
Under the recently enacted Regulated Investment Company Modernization Act of 2010 (the “Act”), the Funds will be permitted to carry forward capital losses incurred in taxable years beginning after December 22, 2010 for an unlimited period. However, any losses incurred during those taxable years will be required to be utilized prior to any losses incurred in pre-enactment taxable years, which generally expire eight years following the close of the taxable year in which they were incurred. Additionally, post-enactment capital losses that are carried forward will retain their tax character as either short-term or long-term capital losses rather than being considered all short-term as under previous law. The Funds’ first fiscal year subject to the Act will be the fiscal year ended October 31, 2012.
The Trust’s Declaration of Trust authorizes for each series the issuance of an unlimited number of shares of beneficial interest, without par value. Each Fund records sales and repurchases of its capital stock on the trade date. The cost of securities contributed to the Funds in connection with the issuance of shares is based on the valuation of those securities in accordance with the Funds’ policy on investment valuation. Dividends and distributions to shareholders are recorded on the ex-dividend date.
For the fiscal years ended October 31, 2011 and 2010, the capital stock transactions by class for Small Cap, TSCM Growth Equity and Micro-Cap were as follows:
| | | | | | | | | | | | | | | | |
| | | Small Cap | |
| | | 2011 | | | 2010 | |
| | | Shares | | | Amount | | | Shares | | | Amount | |
Investor Class* | | | | | | | | | | | | | | | | |
Proceeds from sale of shares | | | 28,393 | | | $ | 522,154 | | | | 25,018 | | | $ | 375,533 | |
Cost of shares repurchased | | | (21,255 | ) | | | (410,167 | ) | | | (683 | ) | | | (11,557 | ) |
| | | | | | | | | | | | | | | | |
Net increase - Investor Class | | | 7,138 | | | $ | 111,987 | | | | 24,335 | | | $ | 363,976 | |
| | | | | | | | | | | | | | | | |
Service Class | | | | | | | | | | | | | | | | |
Proceeds from sale of shares | | | 243,274 | | | $ | 4,730,889 | | | | 74,867 | | | $ | 1,124,823 | |
Cost of shares repurchased | | | (324,358 | ) | | | (5,860,165 | ) | | | (1,926,064 | ) | | | (28,232,180 | ) |
| | | | | | | | | | | | | | | | |
Net decrease - Service Class | | | (81,084 | ) | | ($ | 1,129,276 | ) | | | (1,851,197 | ) | | ($ | 27,107,357 | ) |
| | | | | | | | | | | | | | | | |
Institutional Class* | | | | | | | | | | | | | | | | |
Proceeds from sale of shares | | | 3,685,316 | | | $ | 75,887,755 | | | | 720,550 | | | $ | 10,720,207 | |
Cost of shares repurchased | | | (105,027 | ) | | | (1,978,630 | ) | | | (18,833 | ) | | | (283,101 | ) |
| | | | | | | | | | | | | | | | |
Net increase - Institutional Class | | | 3,580,289 | | | $ | 73,909,125 | | | | 701,717 | | | $ | 10,437,106 | |
| | | | | | | | | | | | | | | | |
56
Notes to Financial Statements (continued)
| | | | | | | | | | | | | | | | |
| | | TSCM Growth Equity ** | |
| | | 2011 | | | 2010 | |
| | | Shares | | | Amount | | | Shares | | | Amount | |
Investor Class | | | | | | | | | | | | | | | | |
Proceeds from sale of shares | | | 225,474 | | | $ | 2,417,579 | | | | 1,270 | | | $ | 12,963 | |
Reinvestment of dividends and distributions | | | 2 | | | | 21 | | | | — | | | | — | |
Cost of shares repurchased | | | (3,001 | ) | | | (40,921 | ) | | | — | | | | — | |
| | | | | | | | | | | | | | | | |
Net increase - Investor Class | | | 222,475 | | | $ | 2,376,679 | | | | 1,270 | | | $ | 12,963 | |
| | | | | | | | | | | | | | | | |
Service Class | | | | | | | | | | | | | | | | |
Proceeds from sale of shares | | | 2,296,630 | | | $ | 27,315,713 | | | | 1,000 | | | $ | 10,000 | |
Cost of shares repurchased | | | (647,716 | ) | | | (7,852,985 | ) | | | — | | | | — | |
| | | | | | | | | | | | | | | | |
Net increase - Service Class | | | 1,648,914 | | | $ | 19,462,728 | | | | 1,000 | | | $ | 10,000 | |
| | | | | | | | | | | | | | | | |
Institutional Class | | | | | | | | | | | | | | | | |
Proceeds from sale of shares | | | 139,333 | | | $ | 1,641,074 | | | | 106,430 | | | $ | 1,067,380 | |
Reinvestment of dividends and distributions | | | 66 | | | | 766 | | | | — | | | | — | |
Cost of shares repurchased | | | (57,419 | ) | | | (634,754 | ) | | | (9,332 | ) | | | (100,100 | ) |
| | | | | | | | | | | | | | | | |
Net increase - Institutional Class | | | 81,980 | | | $ | 1,007,086 | | | | 97,098 | | | $ | 967,280 | |
| | | | | | | | | | | | | | | | |
| | | | | | | | |
| | | Managers Micro-Cap | |
| | | 2011 | |
| | | Shares | | | Amount | |
Service Class | | | | | | | | |
Proceeds from sale of shares | | | 115,169 | | | $ | 4,285,088 | |
Cost of shares repurchased | | | (1,014,335 | ) | | | (36,248,361 | ) |
| | | | | | | | |
Net decrease - Investor Class | | | (899,166 | ) | | ($ | 31,963,273 | ) |
| | | | | | | | |
Institutional Class *** | | | | | | | | |
Proceeds from sale of shares | | | 279,136 | | | | 8,729,132 | |
Shares issued in connection with merger | | | 609,346 | | | | 18,902,143 | |
Cost of shares repurchased | | | (7,790 | ) | | | (275,834 | ) |
| | | | | | | | |
Net increase - Institutional Class | | | 880,692 | | | $ | 27,355,441 | |
| | | | | | | | |
| * | Commenced operations on January 1, 2010. |
| ** | Commenced operations on July 30, 2010. |
| *** | Commenced operations on October 1, 2011. |
At October 31, 2011, certain unaffiliated shareholders of record, specifically omnibus accounts, individually or collectively held greater than 10% of the outstanding shares of the following Funds: Small Cap - three collectively own 55%; TSCM Growth Equity - two collectively own 90%; Micro-Cap - two collectively own 42%; Real Estate Securities - two collectively own 49%; California Intermediate Tax-Free - two collectively own 58%. Transactions by these shareholders may have a material impact on their respective Fund.
| 2. | Agreements and Transactions with Affiliates |
The Trust has entered into investment management agreements (each, an “Investment Management Agreement”) under which Managers Investment Group LLC (the “Investment Manager”), an independently managed subsidiary of Affiliated Managers Group, Inc. (“AMG”), provides or oversees investment management services to the Funds. The Investment Manager selects subadvisors for each Fund (subject to Board approval) and monitors the subadvisors’ investment programs and results. Each Fund’s investment portfolio is managed by portfolio managers who serve pursuant to subadvisory agreements with the Investment Manager.
57
Notes to Financial Statements (continued)
The Small Cap investment portfolio is managed by Frontier Capital Management Co., LLC (“Frontier”). AMG indirectly owns a majority interest in Frontier. The TSCM Growth Equity investment portfolio is managed by TimesSquare Capital Management, LLC (“TimesSquare”). AMG indirectly owns a majority interest in TimesSquare.
Investment management fees are paid directly by each Fund to the Investment Manager based on average daily net assets. The annual investment management fee rates, as a percentage of average daily net assets were as follows:
| | | | |
Fund | | Investment
Management Fee | |
Small Cap | | | 1.00 | % |
TSCM Growth Equity | | | 0.75 | % |
Micro-Cap | | | 1.00 | % |
Real Estate Securities | | | 0.60 | %1 |
California Intermediate Tax-Free | | | | |
on first $25 million | | | 0.40 | % |
on next $25 million | | | 0.35 | % |
on next $50 million | | | 0.30 | % |
on next $50 million | | | 0.25 | % |
on balance over $150 million | | | 0.20 | % |
| 1 | Prior to July 1, 2011, Real Estate’s investment management fee was 0.85%. |
Small Cap is obligated by its investment management contract to pay an annual management fee to the Investment Manager. The Investment Manager, in turn, pays all or a portion of this fee to Frontier. Under its Investment Manager Agreement with the Fund, the Investment Manager provides a variety of administrative services to the Fund. Effective as of January 1, 2010, the Investment Manager receives compensation from Frontier for its administrative services to the Fund pursuant to a separate agreement between the Investment Manager and Frontier.
For each of the Funds other than Small Cap, the Trust has entered into an Administration and Shareholder Servicing Agreement under which the Investment Manager serves as each Fund’s administrator (the “Administrator”) and is responsible for all aspects of managing the Funds’ operations, including administration and shareholder services to each Fund, its shareholders, and certain institutions, such as bank trust departments, broker-dealers and registered investment advisers, that advise or act as an intermediary with the Funds’ shareholders. For its services, the Administrator is paid a fee at a rate of 0.25% of average net assets per annum. Effective January 1, 2010, Small Cap terminated its Administration agreement.
At a meeting held on September 10-11, 2009, the Trust’s Board of Trustees approved a contractual expense limitation with respect to Small Cap. Effective January 1, 2010, the Investment Manager has contractually agreed, through at least March 1, 2012, to waive fees and pay or reimburse Fund expenses in order to limit total annual Fund operating expenses after fee waiver and expense reimbursements (exclusive of taxes, interest (including interest incurred in connection with bank and custody overdrafts), brokerage commissions and other transaction costs, acquired fund fees and expenses and extraordinary items) to 1.05% of the Fund’s average daily net assets.
The Investment Manager has contractually agreed, through at least March 1, 2012, to waive fees and pay or reimburse Fund expenses of TSCM Growth Equity in order to limit total annual Fund operating expenses after fee waiver and expense reimbursements (exclusive of taxes, interest (including interest incurred in connection with bank and custody overdrafts), brokerage commissions and other transaction costs, acquired fund fees and expenses and extraordinary items) to 0.79% of the Fund’s average daily net assets.
Effective October 1, 2011, the Investment Manager contractually agreed, through at least March 1, 2013, to waive fees and pay or reimburse Fund expenses of Micro-Cap in order to limit total annual Fund operating expenses after fee waiver and expense reimbursements (exclusive of taxes, interest (including interest incurred in connection with bank and custody overdrafts), brokerage commissions and other transaction costs, acquired fund fees and expenses and extraordinary items) to 1.18% of the Fund’s average daily net assets. Immediately prior to October 1, 2011, Micro-Cap had a contractual expense limitation of 1.43%.
Effective July 1, 2011, the Investment Manager contractually agreed, through at least March 1, 2013, to waive fees and pay or reimburse Fund expenses of Real Estate Securities in order to limit total annual Fund operating expenses after fee waiver and expense reimbursements (exclusive of taxes, interest (including interest incurred in connection with bank and custody overdrafts), brokerage commissions and other transaction costs, acquired fund fees and expenses and extraordinary items) to 1.29% of the Fund’s average daily net assets. Immediately prior to July 1, 2011, Real Estate had a contractual expense limitation of 1.50%.
The Investment Manager has contractually agreed, through at least March 1, 2012, to waive fees and pay or reimburse Fund expenses of California Intermediate Tax-Free in order to limit total annual Fund operating expenses after fee waiver and expense reimbursements (exclusive of taxes, interest (including interest incurred in connection with bank and custody overdrafts), brokerage commissions and other transaction costs, acquired fund fees and expenses and extraordinary items) to 0.55% of the Fund’s average daily net assets.
Notes to Financial Statements (continued)
Each of Small Cap, TSCM Growth Equity, Micro-Cap, Real Estate Securities, and California Intermediate Tax-Free is obligated to repay the Investment Manager such amounts waived, paid or reimbursed in future years provided that the repayment occurs within thirty-six (36) months after the waiver or reimbursement and that such repayment would not cause the Fund’s expenses in any such year to exceed the previously stated expense limitation percentages of that Fund’s average daily net assets. For the fiscal year ended October 31, 2011, each Fund’s components of reimbursement are detailed in the following chart:
| | | | | | | | | | | | |
| | | Small Cap | | | TSCM Growth
Equity | | | Micro-Cap | |
Reimbursement Available - 10/31/10 | | $ | 92,681 | | | $ | 38,363 | | | $ | 713,884 | |
Additional Reimbursements | | | 116,507 | | | | 157,601 | | | | 326,044 | |
Repayments | | | — | | | | — | | | | — | |
Expired Reimbursements | | | — | | | | — | | | | (215,749 | ) |
| | | | | | | | | | | | |
Reimbursement Available - 10/31/11 | | $ | 209,188 | | | $ | 195,964 | | | $ | 824,179 | |
| | | | | | | | | | | | |
| | | | | | | | |
| | | | | | California | |
| | | Real Estate | | | Intermediate | |
| | | Securities | | | Tax-Free | |
Reimbursement Available - 10/31/10 | | $ | 203,001 | | | $ | 319,403 | |
Additional Reimbursements | | | 27,489 | | | | 96,240 | |
Repayments | | | (23,121 | ) | | | — | |
Expired Reimbursements | | | (26,614 | ) | | | (94,982 | ) |
| | | | | | | | |
Reimbursement Available - 10/31/11 | | $ | 180,755 | | | $ | 320,661 | |
| | | | | | | | |
Effective January 1, 2011, the aggregate annual retainer paid to each Independent Trustee is $80,000, plus $5,000 or $2,500 for each regular or special meeting attended, respectively. The Independent Chairman of the Trusts receives an additional payment of $20,000 per year. The Chairman of the Audit Committee receives an additional payment of $8,000 per year. (Prior to January 1, 2011, the aggregate annual retainer paid to each Independent Trustee was $65,000, plus $4,000 or $2,500 for each regular or special meeting attended, respectively. The Independent Chairman of the Trusts received an additional payment of $15,000 per year. The Chairman of the Audit Committee received an additional payment of $5,000 per year.) The Trustees’ fees and expenses are allocated among all of the Funds for which the Investment Manager serves as the advisor (the “Managers Funds”) based on the relative net assets of such Funds. The “Trustees fees and expenses” shown in the financial statements represents the Funds’ allocated portion of the total fees and expenses paid by the Managers Funds.
The Funds are distributed by Managers Distributors, Inc. (“MDI”), a wholly-owned subsidiary of the Investment Manager. MDI serves as the principal distributor and underwriter for each Fund and is a registered broker-dealer and member of the Financial Industry Regulatory Authority, Inc. (“FINRA”). Shares of each Fund will be continuously offered and will be sold directly to prospective purchases, through brokers, dealers or other financial intermediaries who have executed selling agreements with MDI. Subject to the compensation arrangement discussed below, generally MDI bears all or a portion of the expenses of providing services pursuant to the distribution agreement, including payment of the expenses relating to the distribution of Prospectuses for sales purposes and any advertising or sales literature. Certain Trustees and Officers of the Funds are Officers and/or Directors of the Investment Manager, AMG and/ or the distributor.
Small Cap and TSCM Growth Equity have adopted a distribution and service plan (the “plan”) with respect to the Investor Class shares of each Fund, in accordance with the requirements of Rule 12b-1 under the 1940 Act and the requirements of the applicable rules of the FINRA regarding asset-based sales charges. Pursuant to the Plan, each Fund may compensate MDI for its expenditures in financing any activity primarily intended to result in the sale of such class of the Fund’s shares and for maintenance and personal service provided to existing shareholders of that class. The Plan authorizes payments to MDI up to 0.25% annually of the Fund’s average daily net assets attributable to the Investor Class shares. The Plan further provides for periodic payments by the Trust or MDI to brokers, dealers and other financial intermediaries for providing shareholder services and for promotional and other sales related costs. The portion of payments by the Investor Class shares of a Fund for shareholder servicing may not exceed an annual rate of 0.25% of the average daily net asset value of the Fund’s shares of that class owned by its clients of such broker, dealer or financial intermediary.
The Securities and Exchange Commission granted an exemptive order that permits the Funds to lend and borrow money for certain temporary purposes directly to and from other eligible Managers Funds. Participation in this interfund lending program is voluntary for both borrowing and lending Funds, and an interfund loan is only made if it benefits each participating Fund. The Investment Manager administers the program according to procedures approved by the Board, and the Board monitors the operation of the program. An interfund loan must comply with certain conditions set out in the exemptive order, which are designed to assure fairness and protect all participating Funds. For the fiscal year ended October 31, 2011, the following Funds either borrowed from or lent to other Managers Funds: Small Cap borrowed $627,674 for 1 day paying interest of $20; TSCM Growth Equity borrowed $4,285,890 for 1 day paying interest of $123; Small Cap lent varying amounts up to $1,469,074 for 5 days earning interest of $190; Micro-Cap lent varying amounts up to $3,785,928 for 5 days earning interest of $293. The interest amounts can be found in the Statement of Operations in interest income or as miscellaneous expense.
Notes to Financial Statements (continued)
| 3. | Purchases and Sales of Securities |
Purchases and sales of investment securities (excluding short-term securities and U.S. Government obligations) for the fiscal year ended October 31, 2011, were as follows:
| | | | | | | | |
Fund | | Purchases | | | Sales | |
Small Cap | | $ | 98,048,006 | | | $ | 28,920,467 | |
TSCM Growth Equity | | | 41,248,060 | | | | 19,196,471 | |
Micro-Cap | | | 115,006,697 | | | | 119,947,110 | |
Real Estate Securities | | | 57,166,901 | | | | 30,420,938 | |
California Intermdiate Tax-Free | | | 2,080,864 | | | | 6,151,206 | |
The Funds had no purchases or sales of U.S. Government obligations for the fiscal year ended October 31, 2011.
| 4. | Portfolio Securities Loaned |
The Funds may participate in a securities lending program offered by BNYM (the “Program”), providing for the lending of securities to qualified brokers. Securities lending fees include earnings of such temporary cash investments, plus or minus any rebate to a borrower. These earnings (after any rebate) are then divided between BNYM, as a fee for its services under the program, and the Fund, according to agreed-upon rates. Collateral on all securities loaned is accepted in cash and/or government securities and is maintained at a minimum level of 102% (105% in the case of certain foreign securities) of the market value, plus interest, if applicable, of investments on loan. It is the Funds’ policy to obtain additional collateral from or return excess collateral to the borrower by the end of the next business day, following the valuation date of the securities loaned. Therefore, the value of the collateral held may be temporarily less than the value of the securities on loan. Lending securities entails a risk of loss to the Funds if and to the extent that the market value of the securities loaned were to increase and the borrower did not increase the collateral accordingly, and the borrower fails to return the securities. Under the terms of the Program, the Fund is indemnified for such losses by BNYM. The Funds bear the risk of any deficiency in the amount of the collateral available for return to the borrower due to any loss on the collateral invested. Collateral received in the form of cash is invested temporarily in the BNY Mellon Overnight Government Fund, or other short-term investments as defined in the Securities Lending Agreement with BNYM. For the fiscal year ended October 31, 2011, Small Cap and Micro-Cap participated in the securities lending program.
Effective August 2, 2010, the Trust, on behalf of each applicable Fund, entered into an agreement with The Bank of New York Mellon and the Bank of New York Mellon Corporation (“BNYMC”) with respect to each Fund’s position in Series B of the BNY Institutional Cash Reserves Fund (the “ICRF”), pursuant to which (i) BNYMC would support the value of certain defaulted securities issued by Lehman Brothers Holdings, Inc. ( the “Lehman Securities”) and held by Series B of the ICRF, and (ii) once certain conditions were met, BNYMC would purchase the defaulted securities from each Fund. On October 17, 2011, after certifying that the Fund had met all necessary conditions, BNYMC purchased the Lehman Securities from the Fund at a predetermined price, which represented a premium over the fair market value of the Lehman Securities at that date.
| 5. | Commitments and Contingencies |
In the normal course of business, the Funds may enter into contracts and agreements that contain a variety of representations and warranties, which provide general indemnifications. The maximum exposure to the Funds under these arrangements is unknown, as this would involve future claims that may be made against the Funds that have not yet occurred. However, the Funds have not had prior claims or losses and expects the risks of material loss to be remote.
| 6. | New Accounting Pronouncement |
In May 2011, the Financial Accounting Standards Board issued Accounting Standards Update (“ASU”) No. 2011-04 “Amendments to Achieve Common Fair Value Measurement and Disclosure Requirements in U.S. GAAP and IFRSs.” ASU No. 2011-04 requires common fair value measurement and disclosure requirements between U.S. GAAP and International Financial Reporting Standards. The new and revised disclosures are effective for interim and annual reporting periods beginning after December 15, 2011. At this time, management is evaluating the implications of ASU No. 2011-04 and its impact on the financial statements.
The Funds have determined that no material events or transactions occurred through the issuance date of the Funds’ financial statements, which require additional disclosure in or adjustment of the Funds’ financial statements.
Tax Information (unaudited)
Each Fund hereby designates the maximum amount allowable of its net taxable income as qualified dividends as provided in the Jobs and Growth Tax Relief Reconciliation Act of 2003.
In accordance with federal tax law, each of the following Funds hereby make the following designations regarding its year ended October 31, 2011:
California Intermediate Tax-Free
| | • | | All the dividends paid from net investment income are “exempt-interest dividends” (not generally subject to regular federal income tax), except $264 that is being designated as an ordinary income distribution for reporting purposes. |
Pursuant to section 852 of the Internal Revenue Code, Managers Frontier Small Cap Growth Fund, Managers AMG TSCM Growth Equity Fund, Managers Micro-Cap Fund, Managers Real Estate Securities Fund and Managers California Intermediate Tax-Free Fund hereby designate as a capital gain distribution with respect to the taxable year ended October 31, 2011, $0, $0, $10,524,926, $0 and $0, respectively, or, if subsequently determined to be different, the net capital gains of such year.
The 2011 Form 1099-DIVs you receive for each Fund will show the tax status of all distributions paid to you during the respective calendar year.
Report of Independent Registered Public Accounting Firm
To the Board of Trustees of Managers Trust I and the Shareholders of Managers Frontier Small Cap Growth Fund, Managers TSCM Growth Equity Fund, Managers Micro-Cap Fund, Managers Real Estate Securities Fund and Managers California Intermediate Tax-Free Fund (collectively, five of the series constituting Managers Trust I, hereafter referred to as the “Funds”):
In our opinion, the accompanying statements of assets and liabilities, including the schedules of portfolio investments, and the related statements of operations and of changes in net assets and the financial highlights present fairly, in all material respects, the financial position of Managers Frontier Small Cap Growth Fund, Managers Micro-Cap Fund, Managers Real Estate Securities Fund, Managers TSCM Growth Equity Fund and Managers California Intermediate Tax-Free Fund at October 31, 2011, the results of each of their operations for the year then ended, the changes in each of their net assets for each of the periods then ended and the financial highlights for each of the periods indicated, in conformity with accounting principles generally accepted in the United States of America. These financial statements and financial highlights (hereafter referred to as “financial statements”) are the responsibility of the Funds’ management; our responsibility is to express an opinion on these financial statements based on our audits. We conducted our audits of these financial statements in accordance with the standards of the Public Company Accounting Oversight Board (United States). Those standards require that we plan and perform the audits to obtain reasonable assurance about whether the financial statements are free of material misstatement. An audit includes examining, on a test basis, evidence supporting the amounts and disclosures in the financial statements, assessing the accounting principles used and significant estimates made by management, and evaluating the overall financial statement presentation. We believe that our audits, which included confirmation of securities at October 31, 2011 by correspondence with the custodian and brokers, provide a reasonable basis for our opinion.
PricewaterhouseCoopers LLP
Philadelphia, Pennsylvania
December 27, 2011
Trustees and Officers
The Trustees and Officers of the Trust, their business addresses, principal occupations for the past five years and dates of birth are listed below. The Trustees provide broad supervision over the affairs of the Trust and the Funds. The Trustees are experienced executives who meet periodically throughout the year to oversee the Funds’ activities, review contractual arrangements with companies that provide services to the Funds, and review the Funds’ performance. Unless otherwise noted, the address of each Trustee or Officer is the address of the Trust: 800 Connecticut Avenue, Norwalk, Connecticut 06854.
There is no stated term of office for Trustees. Trustees serve until their resignation, retirement or removal in accordance with the Trust’s organizational documents and policies adopted by the Board from time to time. The Chairman of the Trustees, President, Treasurer and Secretary of the Trust are elected by the Trustees annually. Other officers hold office at the pleasure of the Trustees.
Independent Trustees
The following Trustees are not “interested persons” of the Trust within the meaning of the 1940 Act:
| | |
Name, Date of Birth, Number
of Funds Overseen in Fund
Complex* | | Principal Occupation(s) During Past 5
Years and Other Directorships Held by
Trustee |
| |
Jack W. Aber, 9/9/37 • Trustee since 2000 • Oversees 38 Funds in Fund Complex | | Professor of Finance, Boston University School of Management (1972-Present); Trustee of Appleton Growth Fund (1 portfolio); Trustee of Third Avenue Trust (5 portfolios); Trustee of Third Avenue Variable Trust (1 portfolio); Trustee of Aston Funds (26 portfolios). |
| |
William E. Chapman, II, 9/23/41 • Independent Chairman • Trustee since 2000 • Oversees 38 Funds in Fund Complex | | President and Owner, Longboat Retirement Planning Solutions (1998-Present); Hewitt Associates, LLC (part time) (provider of Retirement and Investment Education Seminars) (2002-2009); Trustee of Bowdoin College (2002-Present); Director of Harding, Loevner Funds, Inc. (6 portfolios); Trustee of Third Avenue Trust (5 portfolios); Trustee of Third Avenue Variable Trust (1 portfolio); Trustee of Aston Funds (26 portfolios). |
| |
Edward J. Kaier, 9/23/45 • Trustee since 2000 • Oversees 38 Funds in Fund Complex | | Attorney at Law and Partner, Teeters Harvey Gilboy & Kaier LLP (2007-Present); Attorney at Law and Partner, Hepburn Willcox Hamilton & Putnam, LLP (1977-2007); Trustee of Third Avenue Trust (5 portfolios); Trustee of Third Avenue Variable Trust (1 portfolio); Trustee of Aston Funds (26 portfolios). |
| |
Steven J. Paggioli, 4/3/50 • Trustee since 2000 • Oversees 38 Funds in Fund Complex | | Consultant (2001-Present); Formerly Executive Vice President and Director, The Wadsworth Group (1986-2001); Executive Vice President, Secretary and Director, Investment Company Administration, LLC (1990-2001); Vice President, Secretary and Director, First Fund Distributors, Inc. (1991-2001); Trustee, Professionally Managed Portfolios (40 portfolios); Advisory Board Member, Sustainable Growth Advisors, LP; Independent Director, Chase Investment Counsel (2008 – Present); Trustee of Aston Funds (26 portfolios). |
| |
Eric Rakowski, 6/5/58 • Trustee since 2000 • Oversees 38 Funds in Fund Complex | | Professor, University of California at Berkeley School of Law (1990-Present); Director of Harding, Loevner Funds, Inc. (6 portfolios); Trustee of Third Avenue Trust (5 portfolios); Trustee of Third Avenue Variable Trust (1 portfolio); Trustee of Aston Funds (26 portfolios). |
| |
Thomas R. Schneeweis, 5/10/47 • Trustee since 2000 • Oversees 38 Funds in Fund Complex | | Professor of Finance, University of Massachusetts (1977-Present); Director, CISDM at the University of Massachusetts, (1996-Present); President, Alternative Investment Analytics, LLC, (formerly Schneeweis Partners, LLC) (2001-Present); Partner, S Capital Management, LLC (2007-Present); Partner, TRS Associates (1982-Present); Trustee of Aston Funds (26 portfolios). |
| * | The Fund Complex consists of Managers AMG Funds, The Managers Funds, Managers Trust I and Managers Trust II. |
Interested Trustees
Each Trustee in the following table is an “interested person” of the Trust within the meaning of the 1940 Act. Mr. Streur is an interested person of the Trust within the meaning of the 1940 Act by virtue of his positions with the Investment Manager and Managers Distributors, Inc. and because of his service as President of the Trust. Ms. Carsman is an interested person of the Trust within the meaning of the 1940 Act by virtue of her position with, and interest in securities of, AMG, and her former position as Chief Legal Officer of the Trust.
| | |
Name, Date of Birth, Number
of Funds Overseen in Fund
Complex* | | Principal Occupation(s) During Past 5
Years and Other Directorships Held by
Trustee |
| |
John H. Streur, 2/6/60 • Trustee since 2008 • President since 2008 • Oversees 38 Funds in Fund Complex | | Senior Managing Partner, Managers Investment Group LLC (2006-Present); President, Managers Distributors, Inc. (2006-Present); Managing Partner, Managers Investment Group LLC (2005-2006); Chief Executive Officer, President and Chief Operating Officer, The Burridge Group LLC (1996-2004). |
| |
Christine C. Carsman, 4/2/52 • Trustee since 2011 • Oversees 38 Funds in Fund Complex | | Deputy General Counsel, Affiliated Managers Group, Inc. (2011-Present); Senior Vice President and Chief Regulatory Counsel, Affiliated Managers Group, Inc. (2004-Present); Secretary and Chief Legal Officer, Managers AMG Funds, The Managers Funds, Managers Trust I and Managers Trust II (2004-2011); Senior Counsel, Vice President and Director of Operational Risk Management and Compliance, Wellington Management Company, LLP (1995-2004) |
Officers
| | |
Name, Date of Birth,
Position(s) Held with Fund
and Length of Time Served | | Principal Occupation(s) During Past 5
Years |
| |
Lewis Collins, 2/22/66 • Secretary since 2011 • Chief Legal Officer since 2011 | | Senior Counsel, Affiliated Managers Group, Inc. (2002-Present); Senior Vice President, Affiliated Managers Group, Inc. (2010-Present); Vice President, Affiliated Managers Group, Inc. (2006-2010); Director, Affiliated Managers Group, Inc. (2002-2006); Attorney, Ropes & Gray LLP (1998-2002) |
| |
Donald S. Rumery, 5/29/58 • Chief Financial Officer since 2007 • Treasurer since 2000 | | Senior Vice President, Managers Investment Group LLC (2005-Present); Treasurer and Chief Financial Officer, Managers Distributors, Inc. (2000-Present); Treasurer, The Managers Funds (1995-Present); Treasurer, Managers AMG Funds (1999-Present); Treasurer, Managers Trust II (2000-Present); Chief Financial Officer, The Managers Funds, Managers AMG Funds and Managers Trust II (2007-Present); Vice President, The Managers Funds LLC, (1994-2004). |
| |
Keitha L. Kinne, 5/16/58 • Chief Operating Officer since 2007 | | Managing Partner and Chief Operating Officer, Managers Investment Group LLC (2007-Present); Chief Operating Officer, The Managers Funds, Managers AMG Funds and Managers Trust II (2007-Present); Chief Investment Officer, Managers Investment Group LLC (2008-Present); Managing Director, Legg Mason & Co., LLC (2006-2007); Managing Director, Citigroup Asset Management (2004-2006). |
| |
John J. Ferencz, 3/09/62 • Chief Compliance Officer since 2010 | | Vice President, Legal and Compliance, Managers Investment Group LLC (2010-Present); Senior Compliance Analyst, Mutual Funds and Regulatory, GE Asset Management Incorporated (2005-2010). |
| |
Michael S. Ponder, 9/12/73 • Assistant Secretary since 2011 | | Senior Vice President and Counsel, Managers Investment Group LLC (2011-Present); Attorney, DeNovo Legal (2009- 2010); Vice President, Credit Suisse (2007-2009); Associate, Willkie Farr & Gallagher LLP (2006-2007) |
Annual Renewal of Investment Advisory Agreements
On June 9-10, 2011, the Board of Trustees, including a majority of the Trustees who are not “interested persons” of the Trust (the “Independent Trustees”), approved the Investment Management Agreement with the Investment Manager for each of the Funds identified below and the Subadvisory Agreement for each of the Subadvisors. The Independent Trustees were separately represented by independent counsel in connection with their consideration of the approval of these agreements. In considering the Investment Management and Subadvisory Agreements, the Trustees reviewed a variety of materials relating to each Fund, the Investment Manager and each Subadvisor, including comparative performance, fee and expense information for an appropriate peer group of similar mutual funds (each a “Peer Group”), performance information for relevant benchmark indices (each a “Fund Benchmark”) and, with respect to each Subadvisor, comparative performance information for an appropriate peer group of managed accounts, and, as to all other matters, other information provided to them on a periodic basis throughout the year, as well as information provided in connection with the meetings of June 9-10, 2011, regarding the nature, extent and quality of services provided by the Investment Manager and the Subadvisors under their respective agreements. Prior to voting, the Independent Trustees: (a) reviewed the foregoing information with their independent legal counsel and with management; (b) received materials from their independent legal counsel discussing the legal standards applicable to their consideration of the Investment Management Agreement and the Subadvisory Agreements; and (c) met with their independent legal counsel in private sessions at which no representatives of management were present.
Nature, extent and quality of services.
In considering the nature, extent and quality of the services provided by the Investment Manager, the Trustees reviewed information relating to the Investment Manager’s operations and personnel. Among other things, the Investment Manager provided financial information, biographical information on its supervisory and professional staff and descriptions of its organizational and management structure. The Trustees also took into account information provided periodically throughout the previous year by the Investment Manager relating to the performance of its duties with respect to the Funds and the Trustees’ familiarity with the Investment Manager’s management through Board meetings, discussions and reports. In the course of their deliberations regarding the Investment Management Agreement, the Trustees evaluated, among other things: (a) the extent and quality of the Investment Manager’s oversight of the operation and management of the Funds; (b) the quality of the search, selection and monitoring services performed by the Investment Manager in overseeing the portfolio management responsibilities of the Subadvisors; (c) the Investment Manager’s ability to supervise the Funds’ other service providers; and (d) the Investment Manager’s compliance programs. The Trustees also took into account the financial condition of the Investment Manager with respect to its ability to provide the services required under the
Investment Management Agreement and to maintain contractual expense limitations for the Funds. The Trustees also considered the Investment Manager’s risk management processes.
For each Fund, the Trustees also reviewed information relating to each Subadvisor’s operations and personnel and the investment philosophy, strategies and techniques (for each Subadvisor, its “Investment Strategy”) used in managing the Fund or the portion of the Fund for which the Subadvisor has portfolio management responsibility. Among other things, the Trustees reviewed biographical information on portfolio management and other professional staff, information regarding each Subadvisor’s organizational and management structure and each Subadvisor’s brokerage policies and practices. The Trustees considered specific information provided regarding the experience of the individual or individuals at each Subadvisor with portfolio management responsibility for a Fund or the portion of a Fund managed by the Subadvisor, including the information set forth in the Fund’s prospectus and statement of additional information. With respect to those Funds managed with multiple Subadvisors, the Trustees also noted information provided by the Investment Manager regarding the manner in which each Subadvisor’s Investment Strategy complements those utilized by the Fund’s other Subadvisors. In the course of their deliberations, the Trustees evaluated, among other things: (a) the services rendered by each Subadvisor in the past; (b) the qualifications and experience of the Subadvisor’s personnel; and (c) the Subadvisor’s compliance programs. The Trustees also took into account the financial condition of each Subadvisor with respect to its ability to provide the services required under its Subadvisory Agreement. The Trustees also considered each Subadvisor’s risk management processes.
Performance.
As noted above, the Board considered each Fund’s net performance during relevant time periods as compared to each Fund’s Peer Group and Fund Benchmark and considered each Subadvisor’s performance as compared to an appropriate peer group of managed accounts and also considered the gross performance of the Fund or the portion of the Fund managed by each Subadvisor as compared to the Subadvisor’s relevant performance composite that utilizes the same investment strategy and approach and noted that the Board reviews on a quarterly basis detailed information about each Fund’s performance results, portfolio composition and Investment Strategies, including with respect to each Fund with multiple Subadvisors, the portion of the Fund managed by each Subadvisor. The Board noted the Investment Manager’s expertise and resources in monitoring the performance, investment style and risk-adjusted performance of each Subadvisor. The Board also noted each Subadvisor’s performance record with respect to the Funds. The Board was mindful of the Investment Manager’s attention to monitoring each Subadvisor’s performance with respect to the Funds and its discussions with management regarding the factors that contributed to the performance of the Funds.
Annual Renewal of Investment Advisory Agreements (continued)
Advisory Fees and Profitability.
In considering the reasonableness of the advisory fee charged by the Investment Manager for managing each Fund, the Trustees noted that the Investment Manager, and not the Fund, is responsible for paying the fees charged by the Fund’s Subadvisor(s) and, therefore, that the fees paid to the Investment Manager cover the cost of providing portfolio management services as well as the cost of providing search, selection and monitoring services in operating a “manager-of-managers” complex of mutual funds. The Trustees concluded that, in light of the additional high quality supervisory services provided by the Investment Manager and the fact that the subadvisory fees are paid out of the advisory fee, the advisory fee payable by each Fund to the Investment Manager can reasonably be expected to exceed the median advisory fee for the Peer Group, which consists of many funds that do not operate with a manager-of-managers structure. In this regard, the Trustees also noted that the Investment Manager has undertaken to maintain expense limitations for the Funds.
In considering the reasonableness of the advisory fee payable to the Investment Manager, the Trustees also reviewed information provided by the Investment Manager setting forth all revenues and other benefits, both direct and indirect (including any so-called “fallout benefits” such as reputational value derived from the Investment Manager serving as Investment Manager to a Fund), received by the Investment Manager and its affiliates attributable to managing each Fund and all the mutual funds in the Managers Family of Funds, the cost of providing such services and the resulting profitability to the Investment Manager and its affiliates from these relationships. The Trustees also noted the current and potential asset levels of each Fund and the willingness of the Investment Manager to waive fees and pay expenses for all the Funds from time to time as a means of limiting total expenses. The Trustees also considered management’s discussion of the current asset levels of the Funds, including the effect on assets attributable to the economic and market conditions since 2008, and considered the impact on profitability of the current asset levels and any future growth of assets of the Funds. The Board took into account management’s discussion of the current advisory fee structure. In this regard, the Trustees noted that, unlike a mutual fund that is managed by a single investment adviser, the Funds operate in a manager-of-managers structure. The Trustees also noted that the subadvisory fees are paid by the Investment Manager out of its advisory fee. Based on the foregoing, the Trustees concluded that the profitability to the Investment Manager is reasonable and that the Investment Manager is not realizing material benefits from economies of scale that would warrant adjustments to the advisory fees for any Fund at this time. With respect to economies of scale, the Trustees also noted that as a Fund’s assets increase over time, the Fund may realize other economies of scale to the extent that the increase in assets is proportionally greater than the increase in certain other expenses.
Subadvisory Fees and Profitability.
In considering the reasonableness of the fee payable by the Investment Manager to each Subadvisor (other than Frontier Capital Management Company, LLC (“Frontier”) and TimesSquare Capital Management, LLC (“TimesSquare”), which are affiliates of the Investment Manager), the Trustees relied on the ability of the Investment Manager to negotiate the terms of the Subadvisory Agreement at arm’s length as part of the manager-of-managers structure, noting that the Subadvisor (other than Frontier and TimesSquare) is not affiliated with the Investment Manager. In addition, the Trustees considered other potential benefits of the subadvisory relationship to a Subadvisor, including, among others, the indirect benefits that the Subadvisor may receive from the Subadvisor’s relationship with a Fund, including any so-called “fallout benefits” to the Subadvisor, such as reputational value derived from the Subadvisor serving as Subadvisor to the Fund. In addition, the Trustees noted that the subadvisory fees are paid by the Investment Manager out of its advisory fee. Accordingly, the cost of services to be provided by each unaffiliated Subadvisor and the profitability to the Subadvisor of its relationship with a Fund were not material factors in the Trustees’ deliberations. For similar reasons, and based on the current size of a Fund or the portion of a Fund managed by each unaffiliated Sub-advisor, the Trustees concluded that any economies of scale being realized by each unaffiliated Subadvisor was not a material factor in the Trustees’ deliberations at this time.
In considering the reasonableness of the fees payable by the Investment Manager to each of Frontier and TimesSquare, the Trustees noted that each of Frontier and TimesSquare is an affiliate of the Investment Manager and reviewed information provided by each of Frontier and TimesSquare regarding the cost to Frontier and TimesSquare, respectively, of providing subadvisory services to a Fund and the resulting profitability from such relationship and noted that, because each of Frontier and TimesSquare is an affiliate of the Investment Manager, such profitability might be directly or indirectly shared by the Investment Manager.
The Trustees noted the current asset levels of the particular Fund managed by each of Frontier and TimesSquare and the undertaking by the Investment Manager to maintain an expense limitation for each Fund. The Trustees also noted that the subadvisory fees are paid by the Investment Manager out of its advisory fee. Accordingly, the cost of services to be provided by each of Frontier and TimesSquare and the profitability to each of Frontier and TimesSquare of its relationship with a Fund were not material factors in the Trustees’ deliberations at this time. For similar reasons, and based on the current size of the particular Fund managed by each of Frontier and TimesSquare, the Trustees concluded that the effect of any economies of scale being realized by Frontier and TimesSquare was not a material factor in the Trustees’ deliberations at this time.
In addition to the foregoing, the Trustees considered the specific factors and related conclusions set forth below with respect to each Fund.
Annual Renewal of Investment Advisory Agreements (continued)
MANAGERS MICRO-CAP FUND
Fund Performance.
Among other information relating to the Fund’s performance, the Trustees noted that the Fund’s performance for the 1-year, 3-year, 5-year and 10-year periods ended March 31, 2011 was above, above, above and below, respectively, the median performance of the Peer Group and above, above, above and below, respectively, the performance of the Fund Benchmark, the Russell Microcap® Index. The Trustees noted the Fund’s more recent improved performance, and the fact that the Fund was in the top quartile relative to the Peer Group over the past year. The Trustees also took into account management’s discussion of the Fund’s performance, noting that the Fund’s adoption of a multi-manager, multi-style approach three years ago and the replacement of a Subadvisor in 2009 has contributed positively to relative performance. The Trustees concluded that the Fund’s overall performance has been satisfactory.
Advisory Fees.
The Trustees noted that the Fund’s advisory fees (which include both the advisory and administration fee) and total expenses (net of applicable expense waivers/reimbursements) as of March 31, 2011 were both higher than the average for the Peer Group. The Trustees took into account the fact that the Investment Manager has contractually agreed to lower the Fund’s contractual expense limitation from 1.43% to 1.18% of the Fund’s net annual operating expenses (subject to certain excluded expenses) effective October 1, 2011 through at least March 1, 2013. The Trustees also took into account management’s discussion of the Fund’s expenses and its potential plans with respect to the Fund. The Trustees concluded that, in light of the nature, extent and quality of the services provided by the Investment Manager and the Subadvisors, the foregoing expense limitation and the considerations noted above with respect to the Subadvisors and the Investment Manager, the Fund’s advisory fees, including subadvisory fees, are reasonable.
MANAGERS CALIFORNIA INTERMEDIATE TAX-FREE FUND
Fund Performance.
Among other information relating to the Fund’s performance, the Trustees noted that the Fund’s performance for the 1-year, 3-year, 5-year and 10-year periods ended March 31, 2011 was above the median performance of the Peer Group and below the performance of the Fund Benchmark, the Barclays Capital 5-Year Municipal Bond Index®. The Trustees took into account management’s discussion of the Fund’s performance, including the fact that the Fund was in the top quintile of the Peer Group for the 1-year and 10-year periods. The Trustees also noted the Fund’s more recent improved performance. The Trustees also took into account management’s discussion of the impact of current market conditions in California and the Fund’s holdings on Fund performance. The Trustees also considered the differences between the Fund’s and the Fund Benchmark’s holdings. The Trustees concluded that the Fund’s overall performance has been satisfactory.
Advisory Fees.
The Trustees noted that the Fund’s advisory fees (which include both the advisory and administration fee) and total expenses (net of applicable expense waivers/reimbursements) as of March 31, 2011 were higher and lower, respectively, than the average for the Peer Group. The Trustees took into account the fact that the Investment Manager has contractually agreed, through March 1, 2012, to limit the Fund’s net annual operating expenses (subject to certain excluded expenses) to 0.55%. The Board also took into account management’s discussion of the Fund’s expenses and the current size of the Fund. The Board noted that the Fund’s advisory fee contains breakpoints. The Trustees concluded that, in light of the nature, extent and quality of the services provided by the Investment Manager and the Subadvisor, the foregoing expense limitation and the considerations noted above with respect to the Subadvisor and the Investment Manager, the Fund’s advisory fees, including subad-visory fees, are reasonable.
MANAGERS FRONTIER SMALL CAP GROWTH FUND
Performance.
Among other information relating to the Fund’s performance, the Trustees noted that the Fund’s performance for Service Class shares for the 1-year, 3-year, 5-year and 10-year periods ended March 31, 2011 was above, above, above and below, respectively, the median performance of the Peer Group and above, above, above and below, respectively, the performance of the Fund Benchmark, the Russell 2000® Growth Index. The Trustees noted the Fund’s shorter-term performance, including the fact that the Fund outperformed the benchmark and ranked in the 35th percentile of the Peer Group over the last 12 months. The Trustees also took into account management’s discussion of the Fund’s performance, noting that the performance record for the 10-year period was negatively affected by the performance of the Fund’s previous Subadvisor. The Trustees concluded that the Fund’s performance has been satisfactory.
The Trustees noted that the Fund’s advisory fee and total expenses (net of applicable expense waivers/reimbursements) as of March 31, 2011 were higher and lower, respectively, than the average for the Peer Group. The Trustees took into account the fact that the Investment Manager has contractually agreed, through March 1, 2012, to limit the Fund’s net annual operating expenses (subject to certain excluded expenses) to 1.05%. The Board also took into account management’s discussion of the Fund’s expenses and the current size of the Fund. The Trustees concluded that, in light of the nature, extent and quality of the services provided by the Investment Manager and the Subadvisor, the foregoing expense limitation and the considerations noted above with respect to the Subadvisor and the Investment Manager, the Fund’s advisory fees, including subadvi-sory fees, are reasonable.
Annual Renewal of Investment Advisory Agreements (continued)
MANAGERS AMG TSCM GROWTH EQUITY FUND
Fund Performance.
Among other information relating to the Fund’s performance, the Trustees noted that the Fund’s performance (all share classes) for the period from the Fund’s inception on July 30, 2010 through March 31, 2011 was above the median performance of the Peer Group and below the performance of the Fund Benchmark, the Rus-sell 3000® Growth Index. The Trustees took into account management’s discussion of the Fund’s performance, including the fact that the Fund was in the second quartile relative to the Peer Group and only modestly underperformed the Fund Benchmark for the period from the Fund’s inception on July 30, 2010 through March 31, 2011. The Trustees concluded that the Fund’s overall performance has been satisfactory in light of the Fund’s limited performance history.
Advisory Fees.
The Trustees noted that the Fund’s advisory fees (which include both the advisory and administration fee) and total expenses (net of applicable expense waivers/reimbursements) as of March 31, 2011 were higher and lower, respectively, than the average for the Peer Group. The Trustees took into account the fact that the Investment Manager has contractually agreed, through March 1, 2012, to limit the Fund’s net annual operating expenses (subject to certain excluded expenses) to 0.79%. The Board took into account management’s discussion of the Fund’s expenses and the current size of the Fund. The Trustees concluded that, in light of the nature, extent and quality of the services provided by the Investment Manager and the Subadvisor, the foregoing expense limitation and the considerations noted above with respect to the Subadvisor and the Investment Manager, the Fund’s advisory fees, including subadvisory fees, are reasonable.
* * * *
After consideration of the foregoing, the Trustees also reached the following conclusions (in addition to the conclusions discussed above) regarding the Investment Management Agreement and each Subadvisory Agreement: (a) the Investment Manager and each Subadvisor have demonstrated that they possess the capability and resources to perform the duties required of them under the
Investment Management Agreement and the applicable Subadvisory Agreements; (b) each Subadvisor’s Investment Strategy is appropriate for pursuing the applicable Fund’s investment objectives; and (c) the Investment Manager and each Subadvisor maintain appropriate compliance programs.
Based on all of the above-mentioned factors and their related conclusions, with no single factor or conclusion being determinative and with each Trustee not necessarily attributing the same weight to each factor, the Trustees concluded that approval of the Investment Management Agreement and each Subadvisory Agreement would be in the best interests of the applicable Fund and its shareholders. Accordingly, on June 9-10, 2011, the Trustees, including a majority of the Independent Trustees, voted to approve the Investment Management Agreement and the Subadvisory Agreements (as applicable) for each Fund.
THIS PAGE INTENTIONALLY LEFT BLANK
Investment Manager and Administrator
Managers Investment Group LLC
333 W. Wacker Drive
Suite 1200
Chicago, IL 60606
(800) 835-3879
Distributor
Managers Distributors, Inc.
333 W. Wacker Drive
Suite 1200
Chicago, IL 60606
(800) 835-3879
Custodian
The Bank of New York Mellon
2 Hanson Place
Brooklyn, NY 11217
Legal Counsel
Ropes & Gray LLP
Prudential Tower, 800 Boylston Street
Boston, MA 02199-3600
Transfer Agent
BNY Mellon Investment Servicing (US) Inc.*
Attn: Managers
P.O. Box 9769
Providence, RI 02940
(800) 548-4539
For Managers Choice Only
Managers
c/o BNY Mellon Investment Servicing (US) Inc.*
P.O. Box 9847
Providence, RI 02940-8047
(800) 358-7668
| * | Formerly PNC Global Investment Servicing (U.S.) Inc. |

MANAGERSAND MANAGERS AMG FUNDS
| | |
EQUITY FUNDS |
CADENCE CAPITAL APPRECIATION CADENCE FOCUSED GROWTH CADENCE MID-CAP CADENCE EMERGING COMPANIES Cadence Capital Management, LLC CHICAGO EQUITY PARTNERS MID-CAP Chicago Equity Partners, LLC EMERGING MARKETS EQUITY Rexiter Capital Management Limited Schroder Investment Management North America Inc. ESSEX SMALL/MICRO CAP GROWTH Essex Investment Management Co., LLC FQ TAX-MANAGED U.S. EQUITY FQ U.S. EQUITY First Quadrant, L.P. FRONTIER SMALL CAP GROWTH Frontier Capital Management Company, LLC GW&K SMALL CAP EQUITY Gannett Welsh & Kotler, LLC MICRO-CAP Lord, Abbett & Co. LLC WEDGE Capital Management L.L.P. Next Century Growth Investors LLC RBC Global Asset Management (U.S.) Inc. | | INTERNATIONAL EQUITY AllianceBernstein L.P. Lazard Asset Management, LLC Martin Currie Inc. REAL ESTATE SECURITIES Urdang Securities Management, Inc. RENAISSANCE LARGE CAP GROWTH Renaissance Group LLC SKYLINE SPECIAL EQUITIES PORTFOLIO Skyline Asset Management, L.P. SPECIAL EQUITY Ranger Investment Management, L.P. Lord, Abbett & Co. LLC Smith Asset Management Group, L.P. Federated MDTA LLC SYSTEMATIC VALUE SYSTEMATIC MID CAP VALUE Systematic Financial Management, L.P. TIMESSQUARE MID CAP GROWTH TIMESSQUARE SMALL CAP GROWTH TSCM GROWTH EQUITY TimesSquare Capital Management, LLC TRILOGY GLOBAL EQUITY TRILOGY EMERGING MARKETS EQUITY TRILOGY INTERNATIONAL SMALL CAP Trilogy Global Advisors, L.P. |
|
This report is prepared for the Funds’ shareholders. It is authorized for distribution to prospective investors only when preceded or accompanied by an effective prospectus. To receive a free copy of the prospectus or Statement of Additional Information, which includes additional information about Fund Trustees, please contact us by calling 800.835.3879. Distributed by Managers Distributors, Inc., member FINRA. A description of the policies and procedures each Fund uses to vote its proxies is available: (i) without charge, upon request, by calling 800.835.3879, or (ii) on the Securities and Exchange Commission’s (SEC) Web site at www.sec.gov. For information regarding each Fund’s proxy voting record for the 12-month period ended June 30, call 800.835.3879 or visit the SEC Web site at www.sec.gov. The Funds file their complete schedule of portfolio holdings with the SEC for the first and third quarters of each fiscal year on Form N-Q. The Funds’ Forms N-Q are available on the SEC’s website at www.sec.gov. A Fund’s Forms N-Q may be reviewed and copied at the SEC’s Public Reference Room in Washington, DC. Information on the operation of the Public Reference Room may be obtained by calling 800.SEC.0330. To review a complete list of the Funds’ portfolio holdings, or to view the most recent quarterly holdings report, semiannual report, or annual report, please visit www.managersinvest.com. |
www.managersinvest.com

BALANCED FUNDS
CHICAGO EQUITY PARTNERS BALANCED
Chicago Equity Partners, LLC
ALTERNATIVE FUNDS
FQ GLOBAL ALTERNATIVES
FQ GLOBAL ESSENTIALS
First Quadrant, L.P.
INCOME FUNDS
BOND (MANAGERS)
FIXED INCOME
GLOBAL BOND
Loomis, Sayles & Co., L.P.
BOND (MANAGERS PIMCO)
Pacific Investment Management Co. LLC
CALIFORNIA INTERMEDIATE TAX-FREE
Miller Tabak Asset Management LLC
GW&K MUNICIPAL BOND
GW&K MUNICIPAL ENHANCED YIELD
Gannett Welsh & Kotler, LLC
HIGH YIELD
J.P. Morgan Investment Management LLC
INTERMEDIATE DURATION GOVERNMENT
SHORT DURATION GOVERNMENT
Smith Breeden Associates, Inc.

Managers PIMCO Bond Fund
Annual Report — October 31, 2011
| | | | |
TABLE OF CONTENTS | | Page | |
| |
LETTER TO SHAREHOLDERS | | | 1 | |
| |
ABOUT YOUR FUND’S EXPENSES | | | 3 | |
| |
PORTFOLIO MANAGER COMMENTS | | | 4 | |
| |
FUND SNAPSHOT | | | 7 | |
Summary of portfolio credit and top ten holdings at October 31, 2011 | | | | |
| |
SCHEDULE OF PORTFOLIO INVESTMENTS | | | 8 | |
| |
FINANCIAL STATEMENTS: | | | | |
| |
Statement of Assets and Liabilities | | | 34 | |
Fund balance sheet, net asset value (NAV) per share computation and cumulative undistributed amounts | | | | |
| |
Statement of Operations | | | 35 | |
Detail of sources of income, Fund expenses, and realized and unrealized gains (losses) during the fiscal year | | | | |
| |
Statement of Changes in Net Assets | | | 36 | |
Detail of changes in Fund assets for the past two fiscal years | | | | |
| |
FINANCIAL HIGHLIGHTS | | | 37 | |
Historical net asset values per share, distributions, total returns, expense ratios, turnover ratios and net assets | | | | |
| |
NOTES TO FINANCIAL STATEMENTS | | | 38 | |
Accounting and distribution policies, details of agreements and transactions with Fund management and affiliates, and descriptions of certain investment risks | | | | |
| |
REPORT OF INDEPENDENT REGISTERED PUBLIC ACCOUNTING FIRM | | | 45 | |
| |
TRUSTEES AND OFFICERS | | | 46 | |
| |
ANNUAL RENEWAL OF INVESTMENT ADVISORY AGREEMENT | | | 47 | |
Nothing contained herein is to be considered an offer, sale or solicitation of an offer to buy shares of any series of the Managers Family of Funds. Such offering is made only by Prospectus, which includes details as to offering price and other material information.
Letter to Shareholders
Dear Shareholder:
Our foremost goal at Managers Investment Group (“MIG”) is to structure and manage mutual funds that will help our shareholders and clients successfully reach their investment goals and objectives.
Each of our Funds is geared to provide you with exposure to a specific asset class or style of investing. We believe investors tend to use our Funds as part of their broader portfolio in order to tailor their asset allocation to meet their individual needs. Most of our Funds, like the one detailed in this report, are therefore designed to be building blocks.
At MIG, we have overall responsibility for the investment management and administration of the Funds. As a “manager of managers,” we work with external investment managers that make the day-to-day investment decisions in the Funds (the “Portfolio Managers”). We devote considerable resources to our disciplined process of identifying and selecting unaffiliated Portfolio Managers for the Funds. As a manager of managers, MIG performs many activities to monitor the ongoing investment, compliance, and administrative aspects of all of the Funds, which we believe gives our shareholders added confidence in their investments.
Our parent company, Affiliated Managers Group (“AMG”), is a global asset management company with ownership interests in a diverse group of boutique investment management firms (its “Affiliates”). MIG has the unique opportunity to access the investment skills and acumen of some of AMG’s Affiliates. The set of our Funds managed by these proprietary firms also benefits from our activities to monitor the investment, compliance, and administrative aspects of the Funds.
Below is a brief overview of the securities markets and the performance results for the Fund. Following this letter, we also provide the Portfolio Manager’s discussion of its investment management approach, performance results, and market outlook.
Fixed income markets generally rose during this turbulent 12-month period. However, at the start of this period, towards the end of 2010, fixed income markets struggled amid signs of economic strength related to the impact of global fiscal and economic stimulus that led to rising interest rates. The beginning of 2011, however, began a period of turmoil as unexpected events such as the Arab Spring and the Japanese earthquake and its aftermath weighed on investors’ minds, generally boosting fixed income returns. Bonds also generally gained during the second quarter of 2011 helped by a decline in Treasury yields amid slower U.S. growth and concern about the sovereign debt crisis in the Eurozone. The summer months were highlighted by bond gains as a sharp decline in Treasury yields amid a flight to safety boosted demand for Treasuries. This reversed, somewhat, in October as risk aversion began to ease across global markets amid optimism that the European debt crisis could be contained.
Against this backdrop, for the 12-month period ended October 31, 2011, the Managers PIMCO Bond Fund (the “Fund”) posted a return of 1.45%. This resulted in underperformance versus its benchmark, the Barclays Capital U.S. Aggregate Bond Index®, which posted a return of 5.00% for that same period as detailed further below.
| | | | | | | | | | | | | | | | | | | | | | | | |
Periods Ended 10/31/11 | | 6 Months | | | 1 Year | | | 3 Years | | | 5 Years | | | 10 Years | | | Inception Date | |
Managers PIMCO Bond Fund | | | 0.72 | % | | | 1.45 | % | | | 10.59 | % | | | 7.33 | % | | | 6.13 | % | | | 4/30/1993 | |
Barclays Capital U.S. Aggregate Bond Index® | | | 4.98 | % | | | 5.00 | % | | | 8.87 | % | | | 6.41 | % | | | 5.46 | % | | | | |
1
Letter to Shareholders (continued)
The Fund’s underperformance was primarily concentrated in the third quarter of 2011 when several strategies within the Portfolio struggled as risk aversion entered global capital markets. During this time, the Fund’s exposure to riskier areas of fixed income markets, which included an overweight to the bonds of financial companies along with an emerging market overweight and exposure to a select basket of emerging market currencies, detracted from performance. These same positions did, however, add relative value in October as risk aversion eased although not enough to fully recover the losses versus the benchmark from the prior several months.
Looking ahead, we anticipate the Fund will be positioned defensively to mitigate risks of default and permanent losses amid heightened recession risk while continuing to look for sources of high-quality yield. In addition, the Fund will target above-index duration in anticipation of continued interest rate volatility as global economies slow with this volatility diversified across non-U.S. markets such as Germany, Canada, Australia, Brazil, and Mexico. We also anticipate the Fund will concentrate on the 7-15 year portion of yield curves which offer solid potential for price appreciation given the suppression of yields on shorter maturities.
The following report covers the one-year period that ended October 31, 2011. Should you have any questions about this report, or if you’d like to receive a prospectus and additional information, including fees and expenses for these or any of the other Funds in our family, please feel free to contact us at 1-800-835-3879, or visit our Web site at www.managersinvest.com. As always, please read the prospectus carefully before you invest or send money.
You can rest assured that under all market conditions our team is focused on delivering excellent investment management services for your benefit.
We thank you for your continued confidence and investment in The Managers Funds.
|
| Respectfully, |
|
|
|
| John H. Streur |
| Senior Managing Partner |
| Managers Investment Group LLC |
2
About Your Fund’s Expenses
As a shareholder of a Fund, you may incur two types of costs: (1) transaction costs, which may include sales charges (loads) on purchase payments; redemption fees; and exchange fees; and (2) ongoing costs, including management fees; distribution (12b-1) fees; and other Fund expenses. This example is intended to help you understand your ongoing costs (in dollars) of investing in the Fund and to compare these costs with the ongoing costs of investing in other mutual funds. The example is based on $1,000 invested at the beginning of the period and held for the entire period as indicated below.
Actual Expenses
The first line of the following table provides information about the actual account values and actual expenses. You may use the information in this line, together with the amount you invested, to estimate the expenses that you paid over the period. Simply divide your account value by $1,000 (for example, an $8,600 account value divided by $1,000 = 8.6), then multiply the result by the number in the first line under the heading entitled “Expenses Paid During Period” to estimate the expenses you paid on your account during this period.
Hypothetical Example for Comparison Purposes
The second line of the following table provides information about hypothetical account values and hypothetical expenses based on the Fund’s actual expense ratio and an assumed annual rate of return of 5% before expenses, which is not the Fund’s actual return. The hypothetical account values and expenses may not be used to estimate the actual ending account balance or expenses you paid for the period. You may use this information to compare the ongoing costs of investing in the Fund and other funds by comparing this 5% hypothetical example with the 5% hypothetical examples that appear in the shareholder reports of other funds.
Please note that the expenses shown in the table are meant to highlight your ongoing costs only and do not reflect any transactional costs, such as sales charges (loads), redemption fees, or exchange fees. Therefore, the second line of the table is useful in comparing ongoing costs only, and will not help you determine the relative total costs of owning different funds.
| | | Account Value | | | | Account Value | | | | Account Value | | | | Account Value | |
Six Months Ended October 31, 2011 | | Expense
Ratio for
the Period | | | Beginning
Account Value
05/01/11 | | | Ending
Account Value
10/31/11 | | | Expenses
Paid During
the Period* | |
Managers PIMCO Bond Fund | | | | | | | | | | | | | | | | |
Based on Actual Fund Return | | | 0.58 | % | | $ | 1,000 | | | $ | 1,007 | | | $ | 2.93 | |
Hypothetical (5% return before expenses) | | | 0.58 | % | | $ | 1,000 | | | $ | 1,022 | | | $ | 2.96 | |
| * | Expenses are equal to the Fund’s annualized expense ratio multiplied by the average account value over the period, multiplied by the number of days in the period (184), then divided by 365. |
3
Managers PIMCO Bond Fund
Portfolio Manager’s Comments
Managers PIMCO Bond Fund seeks to maximize total return consistent with the preservation of capital by investing in debt securities such as corporate, mortgage-backed, international, and government bonds. Normally, the Fund will invest at least 80% of its net assets in these types of bonds.
THE PORTFOLIO MANAGER
Pacific Investment Management Company, LLC
Pacific Investment Management Company, LLC (“PIMCO”), the subadvisor for the Managers PIMCO Bond Fund, was founded in 1971. PIMCO is one of the world’s leading fixed-income managers with expertise and significant resources committed to virtually every sector of the global bond market.
Managers PIMCO Bond Fund is an actively managed, diversified bond fund that focuses on intermediate-term, investment-grade bonds. The universe for the Fund includes all sectors of the bond market: governments, corporate bonds, mortgages, asset-backed securities, money market instruments, and international bonds. The Fund seeks total return consistent with preservation of capital by employing PIMCO’s “Total Return” fixed-income investment philosophy. This philosophy follows three key principles:
| | • | | Major shifts in portfolio strategy are driven by longer term, or secular, trends as opposed to short-term interest rate fluctuations. |
| | • | | Consistent investment performance is achieved by avoiding extreme swings in maturity/duration of a portfolio. |
| | • | | Emphasis is placed on adding value through state-of-the-art tools such as futures, options, and volatility analysis. |
Economic analysis serves as the base for PIMCO’s portfolio strategy. Annually, PIMCO investment professionals conduct a three-day secular forum, where long-term economic and market forces are evaluated and portfolio strategies are set. Each quarter, the team meets to evaluate the current business cycle and develop shorter term forecasts which are used to fine-tune the investment strategy. PIMCO’s fixed-income research efforts focus on identifying relative value and understanding the risks inherent in different portfolio structures, strategies, and bond market sectors. Using proprietary analytics and bottom-up credit analysis, the portfolio managers select individual bonds based on recommendations from sector analysts (who specialize in corporate, mortgage, high yield, government, and international bonds).
The ideal investment exhibits many of the following traits:
| | • | | It allows management to meet its overall portfolio positioning targets. Management typically invests in investment-grade securities but may invest up to 10% of the portfolio in securities that are below investment grade. |
| | • | | The investment has been independently analyzed by PIMCO. PIMCO does not rely solely on the credit ratings assigned by outside credit agencies. |
| | • | | Fund management deems that the security provides value relative to other securities within the same sector. |
Portfolio management:
| | • | | Is committed to seeking value across all bond market sectors. |
| | • | | Actively manages duration exposure, yield-curve position, volatility, sector allocation, and security selection and takes only modest exposures in each of these areas relative to the market. |
| | • | | Normally hedges at least 75% of its foreign currency exposure. |
| | • | | Utilizes derivatives (futures, options, swap agreements) as substitutes for physical securities as a means of gaining more cost-effective exposure. |
The investment team may sell securities when:
| | • | | Securities individually no longer represent relative value. |
| | • | | Fund management makes a shift in its portfolio strategy (change in duration, yield curve positioning, sector strategy, etc.). |
THE YEAR IN REVIEW
Fixed income markets generally rose during this turbulent 12 month period. However, at the start of this period, towards the end of 2010, fixed income markets struggled amid signs of economic strength related to the impact of global fiscal and economic stimulus that led to rising interest rates. The beginning of 2011, however, began a period of turmoil as unexpected events such as the Arab Spring and the Japanese earthquake and its aftermath weighed on investors’ minds, generally boosting fixed income returns. Bonds also generally gained during the second quarter of 2011 helped by a decline in Treasury yields amid slower U.S. growth and concern about the sovereign debt crisis in the Eurozone. The summer months were highlighted by bond gains as a sharp decline in Treasury yields amid a flight to safety boosted demand for Treasuries. This reversed, somewhat, in October as risk aversion began to ease across global markets amid optimism that the European debt crisis could be contained.
For the 12-month period ended October 31, 2011, the Managers PIMCO Bond Fund returned 1.45%, compared with 5.00% for its benchmark, the Barclays Capital U.S. Aggregate Bond Index®. Towards the end of 2010, the Fund outperformed due to its overweight to both agency and non-agency mortgages as these securities tended to outperform Treasuries. The Fund also outperformed in the first quarter of 2011 as the Portfolio’s focus on shorter maturities along with an overweight to financial company bonds and emerging market debt contributed to performance. The Fund did lag in the second quarter of 2011, however, as an underweight to U.S. duration detracted from returns as interest rates fell. A majority of the Fund’s underperformance for this one year period was, however, primarily concentrated in the third quarter of 2011 when several strategies within the Portfolio struggled as risk aversion entered global capital markets. During this time, the Fund’s exposure to riskier areas of fixed income markets, which included an overweight to the bonds of financial companies along with an emerging market overweight and exposure to a select basket of emerging market currencies, detracted from performance. Many of these same positions did, however, add relative value in October as risk aversion eased although not enough to fully recover the losses versus the benchmark from the prior several months.
LOOKING FORWARD
PIMCO expects the global economy to slow to a 1.0% to 1.5% real growth rate over the next year, with developed market growth flattening out and emerging market growth tracking lower to 4.5% to 5%. Developed market growth should continue to be challenged by consumer deleveraging and an accelerated push towards government contraction. In the U.S., this means reduced spending at federal, state, and local levels. In Europe, it means more austerity in peripheral and, to a lesser extent, core countries. In emerging markets, policymakers’ ability to counterbalance the developed world slowdown will likely be limited.
4
Managers PIMCO Bond Fund
Portfolio Manager’s Comments (continued)
| | • | | Base Case Unstable- PIMCO’s base case for growth is, however, inherently unstable, driven by policy uncertainty and the decision of politicians. In the U.S., this summer’s debt ceiling debacle eroded confidence among investors and non-investing citizens alike. In the coming months, Washington’s disagreements will continue. PIMCO expects that monetary policy in the U.S. will be the most impactful policy over the cyclical horizon, a period in which PIMCO forecasts zero percent real growth in the U.S. |
| | • | | Eurozone Weakness- PIMCO expects real GDP contraction of 0.5% to 1.0% in Europe, a recession driven by weak fundamentals, austerity measures, and concern about potential defaults by Greece and other peripheral nations. PIMCO expects Greece and Portugal to default, restructure, and possibly even exit the Eurozone over the cyclical horizon. The future path for an export oriented economy like Ireland’s will be dependent on global growth. Left tail risks are centered on Italy and Spain. In PIMCO’s base case, Italy and Spain should be ring-fenced from contagion with Germany taking the lead, supported by the U.S. and Asia. |
| | • | | Emerging Market Growth to Track Lower- PIMCO believes that emerging economies will likely continue to outpace developed ones over the cyclical horizon, but will experience slower growth than in recent years. PIMCO also believes that emerging market growth will likely slow as policymakers struggle to control inflation, asset price bubbles, and credit expansion. Even so, capital formation in emerging economies has progressed, with many emerging market countries shifting towards a consumption-based growth model. This trend could help rebalance the global economy over the long run. |
| | • | | Global Inflation to Moderate- PIMCO believes that global inflation will likely slow to 2.0% to 2.5% as both developed world and emerging market inflation decelerates. PIMCO expects that weaker global growth will lead to lower energy prices and wider output gaps in developed markets. While PIMCO expects increased monetization of government debt and the subsequent appreciation of store of value commodities like gold, PIMCO does not expect these trends to materially affect inflation in the near-term. |
PIMCO expects to position the Fund defensively in order to mitigate risks of default and permanent losses arising from heightened recession risk, especially in Europe. PIMCO will continue to look for sources of high quality yield and expect to recover any recent underperformance as wider risk premiums in fixed income markets normalize over time. The following is a summary of strategies PIMCO expects to pursue:
| | • | | Interest Rate Strategies- PIMCO intends to overweight duration in anticipation of continued interest rate volatility as global economies slow. PIMCO’s focus will be on high-quality sources of duration in the U.S. but also Germany, Canada, Australia, Brazil, and Mexico. PIMCO will concentrate on the 7-15 year portion of yield curves, which they expect to offer the best opportunities for price appreciation given the suppression of yields on shorter maturities. |
| | • | | Mortgages- PIMCO anticipates that agency mortgages will remain an important source of high quality yield. This sector appears to be more attractive now than at any point in the last 18 months. PIMCO will continue to take advantage of relative value opportunities across mortgage coupons. PIMCO will hold non-Agency mortgages and commercial mortgage-backed securities (CMBS) that have senior positions in the capital structure and are another source of attractive yield. |
| | • | | Corporate Bonds- PIMCO will trim exposures in this sector overall, looking to shift toward emerging market sovereign and corporate credits, U.S. municipals, and Agency and non-Agency mortgages. PIMCO will also look to move up in the capital structure where possible. PIMCO will focus reductions on positions that pose the risk of permanent loss, such as their modest holdings of European banks and financials. PIMCO anticipates remaining positive on the financial sector as a whole, however, and expects that holdings of non-European global banks have the potential to recover from recent underperformance. These credits would likely perform well in the event that the global economy grows faster than PIMCO’s expectations over the next year. The fundamentals for U.S. financials in particular look relatively strong, as they have recapitalized and written down many of their housing-related losses. |
With regard to high yield corporates, PIMCO expects to generally avoid this sector. Government stimulus has helped high yield credits avoid defaults, but with policy options now more constrained, high yield could be more vulnerable if the economy weakens. As an alternative, PIMCO is looking to add exposure to bank loans, which are attractively valued and occupy senior positions in capital structures that could make them more resilient in a weak economy.
| | • | | Emerging Markets (EM)- PIMCO will look to maintain exposure to select corporate and quasi-sovereign bonds in high quality countries such as Brazil, Mexico, and Russia. PIMCO will also seek to take exposure to relatively high nominal and real local interest rates in Brazil and Mexico. |
| | • | | Currency- In light of heightened market volatility and slower global growth, PIMCO expects to reduce currency exposure to commodity-intensive economies such as Australia, Brazil, and Canada. PIMCO will look to focus their exposures on China and satellite emerging Asian currencies where currency appreciation is likely to be an important tool for containing inflation and building out the consumer sector. At the same time, PIMCO expects to make greater use of the euro as a funding currency, which offers the potential for gains should the euro continue to weaken. |
| | • | | Municipals and TIPS- PIMCO is maintaining positions in high quality municipal bonds, focusing on essential service revenue bonds such as water and sewer, power, and airports. PIMCO will look to holding positions on the longer end of the steep TIPS yield curve to take advantage of their positive real yields. |
5
Managers PIMCO Bond Fund
Portfolio Manager’s Comments (continued)
Cumulative Total Return Performance
The Fund’s cumulative total return is based on the daily change in net asset value (NAV), and assumes that all distributions were reinvested. The Barclays Capital U.S. Aggregate Bond Index® is an index of the U.S. investment grade fixed-rate bond market, including both government and corporate bonds. Unlike the Fund, the Barclays Capital U.S. Aggregate Bond Index® is unmanaged, is not available to investment, and does not incur expenses. The chart illustrates the performance of a hypothetical $10,000 investment made in the Managers PIMCO Bond Fund on October 31, 2001, to a $10,000 investment made in the Barclays Capital U.S. Aggregate Bond Index® for the same time period. The graph and table do not reflect the deduction of taxes that a shareholder would pay on a Fund distribution or redemption of shares. The listed returns for the Fund are net of expenses and the returns for the index exclude expenses. Total returns for the Fund would have been lower had certain expenses not been reduced.
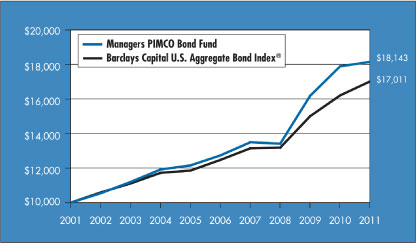
The table below shows the average annual total returns for the Managers PIMCO Bond Fund and the Barclays Capital U.S. Aggregate Bond Index® from October 31, 2001 through October 31, 2011.
| | | | | | | | | | | | |
Average Annualized Total Returns1 | | One Year | | | Five Years | | | Ten Years | |
Managers PIMCO Bond Fund 2,3,4,5,6,7,8 | | | 1.45 | % | | | 7.33 | % | | | 6.13 | % |
| | | |
Barclays Capital U.S. Aggregate Bond Index® 9 | | | 5.00 | % | | | 6.41 | % | | | 5.46 | % |
The performance data shown represents past performance. Past performance is not a guarantee of future results. Current performance may be lower or higher than the performance data quoted. The investment return and principal value of an investment in the Fund will fluctuate so that an investor’s shares, when redeemed, may be worth more or less than their original cost. For performance information through the most recent month end, please call (800) 835-3879 or visit our Web site at www.managersinvest.com.
In choosing a Fund, investors should carefully consider the amount they plan to invest, their investment objectives, the Fund’s investment objectives, risks, charges and expenses before investing. For this and other information, please call (800) 835-3879 or visit our Web site at www.managersinvest.com for a free prospectus. Read it carefully before investing or sending money. Distributed by Managers Distributors, Inc., member FINRA.
| 1 | Total return equals income yield plus share price change and assumes reinvestment of all dividends and capital gain distributions. Returns are net of fees and may reflect offsets of Fund expenses as described in the Prospectus. No adjustment has been made for taxes payable by shareholders on their reinvested dividends and capital gain distributions. Returns for periods greater than one year are annualized. The listed returns on the Fund are net of expenses and based on the published NAV as of October 31, 2011. All returns are in U.S. dollars($). |
| 2 | Fund for which, from time to time, the Fund’s advisor has waived its fees and/or absorbed Fund expenses, which has resulted in higher returns. |
| 3 | Fixed income funds are subject to the risks associated with investments in debt securities, such as default risk and fluctuations in debtors’ perceived ability to pay its creditors. Changing interest rates may adversely affect the value of a fixed income investment. An increase in interest rates typically causes the value of bonds and other fixed-income securities to fall. |
| 4 | The Fund may use derivative instruments for hedging purposes or as part of its investment strategy. There is also a risk that a derivative intended as a hedge may not perform as expected. The main risk with derivatives is that some types can amplify a gain or loss, potentially earning or losing substantially more money than the actual cost of the derivative; or that the counterparty may fail to honor its contract terms, causing a loss for the Fund. Use of these instruments may involve certain costs and risks such as liquidity risk, interest rate risk, market risk, credit risk, management risk, and the risk that the Fund could not close out a position when it would be most advantageous to do so. |
| 5 | Investments in international securities are subject to certain risks of overseas investing including currency fluctuations and changes in political and economic conditions, which could result in significant market fluctuations. These risks are magnified in emerging markets. |
| 6 | High yield bonds (also known as “junk bonds”) are subject to additional risks such as the risk of default. |
| 7 | Many bonds have call provisions which allow the debtors to pay them back before maturity. This is especially true with mortgage securities, which can be paid back any time. Typically debtors prepay their debt when it is to their advantage (when interest rates drop making a new loan at current rates more attractive), and thus likely to the disadvantage of bondholders, who may have to reinvest prepayment proceeds in securities with lower yields. Prepayment risk will vary depending on the provisions of the security and current interest rates relative to the interest rate of the debt. |
| 8 | Market risk associated with equity securities may become more pronounced for the Fund. |
| 9 | The Barclays Capital U.S. Aggregate Bond Index® is an index of the U.S. investment-grade fixed-rate bond market, including both government and corporate bonds. Unlike the Fund, the Barclays Capital U.S. Aggregate Bond Index® is unmanaged, is not available for investment, and does not incur expenses. |
Not FDIC insured, nor bank guaranteed. May lose value.
6
Managers PIMCO Bond Fund
Fund Snapshot
October 31, 2011
Portfolio Breakdown
| | | Aggregate Bond Index | | | | Aggregate Bond Index | |
Rating | | Managers
PIMCO Bond Fund** | | | Barclays Capital U.S.
Aggregate Bond Index® | |
U.S. Treasury & Agency | | | 40.6 | % | | | 72.5 | % |
Aaa | | | 15.0 | % | | | 4.0 | % |
Aa | | | 16.0 | % | | | 4.3 | % |
A | | | 21.3 | % | | | 10.5 | % |
Baa | | | 3.9 | % | | | 8.7 | % |
Ba & lower | | | 3.2 | % | | | 0.0 | % |
| |
| ** As a percentage of net assets | | | | | |
Top Ten Holdings
| | | | |
Security Name | | Percentage of
Net Assets | |
FNMA, 4.500%, TBA* | | | 10.0 | % |
| |
Japan Treasury Bills, Series 214, 0.130%, 11/14/11 | | | 7.2 | |
| |
Repurchase Agreements with TD Securities (USA) LLC, dated 10/31/11, due 11/02/11, 0.10%, total to be received $73,200,203, (collateralized by $74,855,691 U.S. Treasury Notes, 1.375%, 09/15/12) | | | 5.9 | |
| |
U.S. Treasury Notes, 1.500%, 08/31/18 | | | 5.1 | |
| |
Japan Treasury Bills, Series 232, 0.104%, 01/30/12 | | | 5.1 | |
| |
Repurchase Agreement with Morgan Stanley & Co., LLC, dated 10/28/11, due 11/01/11, 0.09%, total to be received $44,300,111, (collateralized by $45,780,953 U.S. Treasury Notes, 2.625%, 08/15/20) | | | 3.6 | |
| |
U.S. Treasury Inflation Indexed Bonds, 2.125%, 02/15/40 | | | 2.7 | |
| |
U.S. Treasury Notes, 1.375%, 09/30/18 | | | 2.2 | |
| |
Kells Funding LLC, 0.270%, 11/01/11 | | | 2.2 | |
| |
FNMA, 5.000%, TBA | | | 2.2 | |
| | | | |
| |
Top Ten as a Group | | | 46.2 | % |
| | | | |
| * | Top Ten Holding at April 30, 2011 |
Any sectors, industries, or securities discussed should not be perceived as investment recommendations. Mention of a specific security should not be considered a recommendation to buy or solicitation to sell that security. Specific securities mentioned in this report may have been sold from the Fund’s portfolio of investments by the time you receive this report.
7
Managers PIMCO Bond Fund
Schedule of Portfolio Investments
October 31, 2011
| | | Principal Amount | | | | Principal Amount | | | | Principal Amount | |
| | | | | | Principal Amount | | | Value | |
Asset-Backed Securities - 2.2% | | | | | | | | | | | | |
Amortizing Residential Collateral Trust, 0.825%, 07/25/32 (11/25/11)1 | | | | | | $ | 77,398 | | | $ | 65,888 | |
Bear Stearns Asset-Backed Securities, Inc., 0.325%, 10/25/36 (11/25/11)1 | | | | | | | 140,470 | | | | 135,327 | |
Citibank Omni Master Trust, Series 2009-A8, Class A8, 2.343%, 05/16/16 (11/15/11) (a)1 | | | | | | | 4,900,000 | | | | 4,944,770 | |
EMC Mortgage Loan Trust, Class A, Series 2001-A, Class A, 0.615%, 05/25/40 (11/25/11) (a)1 | | | | | | | 732,235 | | | | 615,197 | |
First NLC Trust, Series 2007-1, Class A1, 0.315%, 08/25/37 (11/25/11) (a)1 | | | | | | | 741,016 | | | | 247,435 | |
Fremont Home Loan Trust, Series 2006-E, Class 2A1, 0.305%, 01/25/37 (11/25/11)1 | | | | | | | 83,116 | | | | 79,319 | |
Long Beach Mortgage Loan Trust, Series 2004-4, Class 1A1, 0.805%, 10/25/34 (11/25/11)1 | | | | | | | 55,661 | | | | 41,060 | |
Morgan Stanley IXIS Real Estate Capital Trust, Series 2006-2, Class A1, 0.295%, 11/25/36 (11/25/11)1 | | | | | | | 12,251 | | | | 3,603 | |
Park Place Securities, Inc., Series 2005-WCW1, Class A1B, 0.505%, 09/25/35 (11/25/11)1 | | | | | | | 1,587,551 | | | | 1,384,687 | |
Securitized Asset Backed Receivables LLC Trust, 0.285%, 12/25/361 | | | | | | | 319,403 | | | | 306,239 | |
Securitized Asset Backed Receivables LLC Trust, Series 2007-HE1, Class A2A, 0.305%, 12/25/36 (11/25/11)1 | | | | | | | 486,217 | | | | 138,793 | |
Structured Asset Securities Corp., 0.825%, 01/25/33 (11/25/11)1 | | | | | | | 55,355 | | | | 48,507 | |
U.S. Small Business Administration Participation Certificates, Series 2003-20I, Class 1, 5.130%, 09/01/23 | | | | | | | 86,281 | | | | 94,330 | |
U.S. Small Business Administration Participation Certificates, Series 2007-20K, Class 1, 5.510%, 11/01/27 | | | | | | | 3,671,691 | | | | 4,078,200 | |
U.S. Small Business Administration Participation Certificates, Series 2008-10E, Class 1, 5.110%, 09/01/18 | | | | | | | 2,120,566 | | | | 2,296,914 | |
U.S. Small Business Administration Participation Certificates, Series 2008-20I, Class 1, 5.600%, 09/01/28 | | | | | | | 7,449,483 | | | | 8,376,806 | |
U.S. Small Business Administration Participation Certificates, Series 2009-20E, Class 1, 4.430%, 05/01/29 | | | | | | | 4,575,390 | | | | 4,973,646 | |
Total Asset-Backed Securities (cost $ 27,158,221) | | | | | | | | | | | 27,830,721 | |
| | | |
Bank Loan Obligations—0.1% | | | | | | | | | | | | |
| | | |
American Governmental Financial Services Funding Co., Term Loan, 5.500%, 05/18/17 (cost $1,194,000) | | | | | | | 1,200,000 | | | | 1,105,250 | |
| | | |
Corporate Bonds and Notes—31.8% | | | | | | | | | | | | |
| | | |
Financials—23.4% | | | | | | | | | | | | |
Allstate Life Global Funding Trusts, 5.375%, 04/30/13 | | | | | | | 1,600,000 | | | | 1,702,965 | |
Ally Financial, Inc., 3.644%, 02/11/14 (11/11/11)1 | | | | | | | 1,000,000 | | | | 931,658 | |
Ally Financial, Inc., 7.500%, 09/15/20 | | | | | | | 1,100,000 | | | | 1,115,125 | |
Ally Financial, Inc., 8.300%, 02/12/15 | | | | | | | 800,000 | | | | 842,000 | |
American Express Bank FSB, Series 2007, 0.376%, 05/29/12 (11/29/11)1 | | | | | | | 2,100,000 | | | | 2,093,017 | |
American Express Bank FSB, Series 2007, 0.398%, 06/12/12 (11/14/11)1 | | | | | | | 1,750,000 | | | | 1,744,031 | |
American Express Co., 7.000%, 03/19/18 | | | | | | | 1,000,000 | | | | 1,190,277 | |
American General Finance Corp., 4.125%, 11/29/13 | | | EUR | | | | 3,900,000 | | | | 4,500,191 | |
American International Group, Inc., 5.050%, 10/01/15 | | | | | | | 400,000 | | | | 398,980 | |
American International Group, Inc., 5.600%, 10/18/16 | | | | | | | 800,000 | | | | 807,311 | |
American International Group, Inc., 6.250%, 03/15/37 | | | | | | | 800,000 | | | | 666,000 | |
American International Group, Inc., 8.250%, 08/15/18 | | | | | | | 4,500,000 | | | | 5,076,837 | |
American International Group, Inc., MTN, Series G, 5.850%, 01/16/18 | | | | | | | 400,000 | | | | 403,578 | |
ANZ National International, Ltd., 6.200%, 07/19/13 (a) | | | | | | | 1,800,000 | | | | 1,926,893 | |
Australia and New Zealand Banking Group, Ltd., 2.125%, 01/10/14 (a) | | | | | | | 2,400,000 | | | | 2,421,953 | |
Banco Santander Brasil SA, 4.500%, 04/06/15 (a) | | | | | | | 200,000 | | | | 198,000 | |
Banco Santander Chile SA, 1.659%, 04/20/12 (01/20/12) (a)1 | | | | | | | 2,200,000 | | | | 2,201,507 | |
Bank of America Corp., 4.500%, 04/01/15 | | | | | | | 10,000,000 | | | | 9,879,970 | |
Bank of America Corp., 6.000%, 10/15/36 | | | | | | | 900,000 | | | | 868,853 | |
Bank of America Corp., 6.500%, 08/01/16 | | | | | | | 2,800,000 | | | | 2,917,009 | |
Bank of China (Hong Kong), Ltd., 5.550%, 02/11/20 (a) | | | | | | | 400,000 | | | | 409,792 | |
The accompanying notes are an integral part of these financial statements.
8
Managers PIMCO Bond Fund
Schedule of Portfolio Investments (continued)
| | | Principal Amount | | | | Principal Amount | | | | Principal Amount | |
| | | | | | Principal Amount | | | Value | |
Financials—23.4% (continued) | | | | | | | | | | | | |
Bank of Montreal, 1.300%, 10/31/14 (a)2 | | | | | | $ | 600,000 | | | $ | 601,898 | |
Bank of Montreal, 2.850%, 06/09/15 (a) | | | | | | | 800,000 | | | | 837,464 | |
Bank of Nova Scotia, 1.650%, 10/29/15 (a) | | | | | | | 900,000 | | | | 901,039 | |
Bank of Nova Scotia, Series YCD, 0.691%, 08/09/12 (11/09/11)1 | | | | | | | 1,200,000 | | | | 1,202,092 | |
Barclays Bank PLC, 2.375%, 01/13/14 | | | | | | | 1,000,000 | | | | 988,015 | |
Barclays Bank PLC, 5.450%, 09/12/12 | | | | | | | 17,300,000 | | | | 17,790,887 | |
BBVA Bancomer SA, 4.500%, 03/10/16 (a) | | | | | | | 500,000 | | | | 503,750 | |
BBVA Bancomer SA, 6.500%, 03/10/21 (a) | | | | | | | 900,000 | | | | 904,500 | |
Braskem Finance, Ltd., 5.750%, 04/15/21 (a) | | | | | | | 400,000 | | | | 404,000 | |
C10 Capital SPV, Ltd., 6.722%, 12/31/49 (a)3,4 | | | | | | | 1,500,000 | | | | 810,000 | |
CIT Group, Inc., 5.250%, 04/01/14 (a) | | | | | | | 300,000 | | | | 300,000 | |
CIT Group, Inc., 7.000%, 05/01/15 | | | | | | | 289,765 | | | | 290,127 | |
CIT Group, Inc., 7.000%, 05/01/16 | | | | | | | 482,942 | | | | 484,149 | |
CIT Group, Inc., 7.000%, 05/01/17 | | | | | | | 676,120 | | | | 676,965 | |
Citigroup Capital XXI, 8.300%, 12/21/574 | | | | | | | 1,200,000 | | | | 1,215,000 | |
Citigroup, Inc., 2.444%, 08/13/13 (11/14/11)1 | | | | | | | 1,100,000 | | | | 1,093,862 | |
Citigroup, Inc., 5.300%, 10/17/12 | | | | | | | 200,000 | | | | 205,454 | |
Citigroup, Inc., 5.500%, 08/27/12 | | | | | | | 500,000 | | | | 513,624 | |
Citigroup, Inc., 5.500%, 10/15/14 | | | | | | | 5,800,000 | | | | 6,182,348 | |
Citigroup, Inc., 5.625%, 08/27/12 | | | | | | | 1,300,000 | | | | 1,325,744 | |
Citigroup, Inc., 5.850%, 07/02/13 | | | | | | | 100,000 | | | | 104,687 | |
Citigroup, Inc., 6.000%, 08/15/17 | | | | | | | 4,200,000 | | | | 4,576,421 | |
Citigroup, Inc., 6.125%, 05/15/18 | | | | | | | 800,000 | | | | 887,663 | |
Citigroup, Inc., 6.125%, 08/25/36 | | | | | | | 4,200,000 | | | | 4,104,811 | |
Citigroup, Inc., 8.125%, 07/15/39 | | | | | | | 600,000 | | | | 827,354 | |
Citigroup, Inc., 8.500%, 05/22/19 | | | | | | | 100,000 | | | | 123,921 | |
Citigroup, Inc., EMTN, Class B, 3.625%, 11/30/174 | | | EUR | | | | 3,800,000 | | | | 4,460,412 | |
Commonwealth Bank of Australia, 0.814%, 07/12/13 (01/12/12) (a)1 | | | | | | | 7,500,000 | | | | 7,501,192 | |
Credit Suisse New York, 2.200%, 01/14/14 | | | | | | | 800,000 | | | | 799,016 | |
Danske Bank A/S, 2.500%, 05/10/12 (a) | | | | | | | 1,200,000 | | | | 1,211,987 | |
Deutsche Bank AG London, 6.000%, 09/01/17 | | | | | | | 4,900,000 | | | | 5,563,970 | |
Dexia Credit Local SA, 0.908%, 04/29/14 (01/30/12) (a)1 | | | | | | | 4,100,000 | | | | 3,694,391 | |
Ford Motor Credit Company LLC, 3.148%, 01/13/12 (01/13/12)1,5 | | | | | | | 2,200,000 | | | | 2,206,050 | |
Ford Motor Credit Company LLC, 5.875%, 08/02/21 | | | | | | | 300,000 | | | | 320,269 | |
Ford Motor Credit Company LLC, 7.000%, 04/15/15 | | | | | | | 1,400,000 | | | | 1,529,500 | |
Ford Motor Credit Company LLC, 8.700%, 10/01/14 | | | | | | | 1,000,000 | | | | 1,121,136 | |
Fortis Bank Nederland Holding N.V., 3.000%, 04/17/12 | | | EUR | | | | 200,000 | | | | 279,417 | |
General Electric Capital Corp., 5.500%, 09/15/67 (a)4 | | | EUR | | | | 5,500,000 | | | | 6,544,901 | |
General Electric Capital Corp., 5.875%, 01/14/38 | | | | | | | 2,300,000 | | | | 2,477,047 | |
GMAC, Inc., 7.500%, 12/31/13 | | | | | | | 1,500,000 | | | | 1,548,750 | |
Goldman Sachs Group, Inc., 5.950%, 01/18/18 | | | | | | | 4,800,000 | | | | 5,053,464 | |
Goldman Sachs Group, Inc., 6.150%, 04/01/18 | | | | | | | 2,000,000 | | | | 2,138,290 | |
Goldman Sachs Group, Inc., 6.250%, 09/01/17 | | | | | | | 3,200,000 | | | | 3,464,438 | |
Groupe BPCE SA, 2.375%, 10/04/13 (a) | | | | | | | 400,000 | | | | 394,687 | |
The accompanying notes are an integral part of these financial statements.
9
Managers PIMCO Bond Fund
Schedule of Portfolio Investments (continued)
| | | Principal Amount | | | | Principal Amount | | | | Principal Amount | |
| | | | | | Principal Amount | | | Value | |
Financials—23.4% (continued) | | | | | | | | | | | | |
HSBC Bank PLC, 2.000%, 01/19/14 (a)5 | | | | | | $ | 800,000 | | | $ | 801,508 | |
HSBC Holdings PLC, 6.500%, 05/02/36 | | | | | | | 800,000 | | | | 853,567 | |
HSBC Holdings PLC, 6.500%, 09/15/37 | | | | | | | 900,000 | | | | 954,241 | |
ING Bank NV, 1.169%, 03/30/12 (12/30/11) (a)1 | | | | | | | 10,800,000 | | | | 10,792,613 | |
International Lease Finance Corp., 5.750%, 05/15/16 | | | | | | | 300,000 | | | | 283,321 | |
International Lease Finance Corp., 5.875%, 05/01/13 | | | | | | | 400,000 | | | | 400,000 | |
International Lease Finance Corp., 6.375%, 03/25/13 | | | | | | | 400,000 | | | | 403,000 | |
International Lease Finance Corp., 6.750%, 09/01/16 (a) | | | | | | | 800,000 | | | | 827,000 | |
International Lease Finance Corp., MTN, 5.250%, 01/10/13 | | | | | | | 400,000 | | | | 398,000 | |
International Lease Finance Corp., MTN, 5.400%, 02/15/12 | | | | | | | 1,500,000 | | | | 1,503,750 | |
Intesa Sanpaolo SpA, 2.708%, 02/24/14 (11/25/11) (a)1 | | | | | | | 1,700,000 | | | | 1,552,532 | |
JPMorgan Chase & Co., 3.150%, 07/05/16 | | | | | | | 5,800,000 | | | | 5,816,112 | |
JPMorgan Chase & Co., 6.000%, 01/15/18 | | | | | | | 1,600,000 | | | | 1,792,709 | |
JPMorgan Chase & Co., EMTN, 1.786%, 09/26/13 (12/28/11)1 | | | EUR | | | | 200,000 | | | | 271,861 | |
JPMorgan Chase Bank, NA, 0.668%, 06/13/16 (12/13/11)1 | | | | | | | 1,300,000 | | | | 1,179,858 | |
JPMorgan Chase Bank, NA, 5.375%, 09/28/16 | | | GBP | | | | 4,500,000 | | | | 7,561,763 | |
JPMorgan Chase Capital, 6.550%, 09/29/36 | | | | | | | 400,000 | | | | 412,787 | |
KfW, 2.000%, 09/07/16 | | | EUR | | | | 1,800,000 | | | | 2,522,356 | |
LBG Capital No.1 PLC, Series 8, 7.869%, 08/25/203,4,5 | | | GBP | | | | 2,300,000 | | | | 3,106,459 | |
LeasePlan Corp. NV, 3.125%, 02/10/12 | | | EUR | | | | 1,300,000 | | | | 1,811,695 | |
Lehman Brothers Holdings, Inc., 0.000%, 10/22/08*2,6 | | | | | | | 3,900,000 | | | | 979,875 | |
Lehman Brothers Holdings, Inc., 0.000%, 12/23/08*2,6 | | | | | | | 200,000 | | | | 50,250 | |
Lehman Brothers Holdings, Inc., 0.000%, 04/03/09*2,6 | | | | | | | 4,700,000 | | | | 1,180,875 | |
Lehman Brothers Holdings, Inc., 0.000%, 11/16/09*2,6 | | | | | | | 1,200,000 | | | | 301,500 | |
Lehman Brothers Holdings, Inc., 0.000%, 05/25/10*2,6 | | | | | | | 1,000,000 | | | | 251,250 | |
Lehman Brothers Holdings, Inc., 0.000%, 07/18/11*2,6 | | | | | | | 1,700,000 | | | | 427,125 | |
Lehman Brothers Holdings, Inc., 0.000%, 01/24/13*2,6 | | | | | | | 2,000,000 | | | | 522,500 | |
Lehman Brothers Holdings, Inc., 0.000%, 05/02/18*2,6 | | | | | | | 600,000 | | | | 157,500 | |
Lloyds Banking Group Capital No. 1 PLC, 8.500%, 12/29/49 (a)3,4 | | | | | | | 400,000 | | | | 274,000 | |
Lloyds TSB Bank PLC, 6.350%, 10/29/493,4 | | | EUR | | | | 1,800,000 | | | | 1,743,462 | |
Merrill Lynch & Co., Inc., 6.400%, 08/28/17 | | | | | | | 3,400,000 | | | | 3,451,456 | |
Merrill Lynch & Co., Inc., EMTN, 1.052%, 02/21/12 (11/21/11)1 | | | GBP | | | | 3,000,000 | | | | 4,774,709 | |
MetLife, Inc., 6.400%, 12/15/36 | | | | | | | 800,000 | | | | 789,870 | |
Morgan Stanley, 5.950%, 12/28/17 | | | | | | | 1,800,000 | | | | 1,817,811 | |
Morgan Stanley, 6.250%, 08/28/17 | | | | | | | 1,000,000 | | | | 1,040,101 | |
Morgan Stanley, 7.300%, 05/13/19 | | | | | | | 200,000 | | | | 214,933 | |
Morgan Stanley, GMTN, 2.944%, 05/14/13 (11/14/11)1 | | | | | | | 1,200,000 | | | | 1,187,147 | |
MUFG Capital Finance, Ltd., 6.299%, 07/29/493,4 | | | GBP | | | | 400,000 | | | | 620,649 | |
National Australia Bank, Ltd., 5.350%, 06/12/13 (a) | | | | | | | 1,500,000 | | | | 1,588,024 | |
Nationwide Building Society, 6.250%, 02/25/20 (a) | | | | | | | 1,800,000 | | | | 1,873,087 | |
Nordea Bank AB, 2.125%, 01/14/14 (a) | | | | | | | 400,000 | | | | 399,849 | |
Pacific LifeCorp, 6.000%, 02/10/20 (a) | | | | | | | 400,000 | | | | 436,689 | |
Principal Life Income Funding Trust, 5.300%, 04/24/13 | | | | | | | 1,500,000 | | | | 1,591,077 | |
Principal Life Income Funding Trust, 5.550%, 04/27/15 | | | | | | | 2,300,000 | | | | 2,476,939 | |
The accompanying notes are an integral part of these financial statements.
10
Managers PIMCO Bond Fund
Schedule of Portfolio Investments (continued)
| | | Principal Amount | | | | Principal Amount | | | | Principal Amount | |
| | | | | | Principal Amount | | | Value | |
Financials—23.4% (continued) | | | | | | | | | | | | |
Qatari Diar Finance “Q.S.C.”, 3.500%, 07/21/15 | | | | | | $ | 900,000 | | | $ | 940,500 | |
Resona Bank Ltd., 5.850%, 04/15/49 (a)3,4 | | | | | | | 500,000 | | | | 502,970 | |
Royal Bank of Scotland Group PLC, 2.625%, 05/11/12 (a) | | | | | | | 2,500,000 | | | | 2,527,612 | |
Royal Bank of Scotland Group PLC, 3.950%, 09/21/15 | | | | | | | 900,000 | | | | 888,020 | |
Royal Bank of Scotland Group PLC, 4.875%, 08/25/14 (a) | | | | | | | 200,000 | | | | 204,107 | |
Royal Bank of Scotland Group PLC, 6.990%, 10/29/49 (a)3 | | | | | | | 2,600,000 | | | | 1,833,000 | |
Santander SA US Debt Unipersonal, 1.169%, 03/30/12 (12/30/11) (a)1 | | | | | | | 8,100,000 | | | | 8,084,156 | |
Santander SA US Debt Unipersonal, 2.991%, 10/07/13 (a) | | | | | | | 3,700,000 | | | | 3,582,225 | |
Santander UK PLC, EMTN, 1.806%, 10/10/17 (01/10/12)1 | | | EUR | | | | 4,100,000 | | | | 4,726,074 | |
SLM Corp., EMTN, Series 21, 3.125%, 09/17/12 | | | EUR | | | | 1,100,000 | | | | 1,503,169 | |
SLM Corp., MTN, 6.250%, 01/25/16 | | | | | | | 300,000 | | | | 300,275 | |
State Bank of India, 4.500%, 07/27/15 (a) | | | | | | | 2,900,000 | | | | 2,949,665 | |
State Street Capital, 1.347%, 06/15/37 (12/15/11)1 | | | | | | | 300,000 | | | | 211,448 | |
State Street Capital Trust III, 5.337%, 03/15/423,4 | | | | | | | 2,000,000 | | | | 2,004,600 | |
Stone Street Trust, 5.902%, 12/15/15 (a) | | | | | | | 2,800,000 | | | | 2,663,161 | |
Sumitomo Mitsui Banking Corp., 1.950%, 01/14/14 (a) | | | | | | | 1,000,000 | | | | 1,012,026 | |
Swedbank AB, 3.625%, 12/02/11 | | | EUR | | | | 200,000 | | | | 277,176 | |
Temasek Financial I, Ltd., 4.300%, 10/25/19 (a) | | | | | | | 900,000 | | | | 975,357 | |
TransCapitalInvest, Ltd., 8.700%, 08/07/18 (a) | | | | | | | 600,000 | | | | 735,750 | |
UBS AG, 5.750%, 04/25/18 | | | | | | | 1,300,000 | | | | 1,376,943 | |
UBS AG, 5.875%, 12/20/17 | | | | | | | 1,400,000 | | | | 1,534,618 | |
UBS AG, MTN, 1.403%, 02/23/12 (11/23/11)1 | | | | | | | 4,400,000 | | | | 4,411,273 | |
UBS AG/Stamford CT, Series FRN, 1.425%, 01/28/14 (01/30/12)1 | | | | | | | 300,000 | | | | 293,887 | |
USB Capital, 3.500%, 03/29/493,4 | | | | | | | 300,000 | | | | 218,589 | |
Vnesheconombank, 5.450%, 11/22/17 (a)5 | | | | | | | 400,000 | | | | 407,000 | |
Wachovia Corp., 5.750%, 02/01/18 | | | | | | | 4,400,000 | | | | 5,003,592 | |
Wachovia Corp., MTN, 0.619%, 08/01/13 (02/01/12)1 | | | | | | | 300,000 | | | | 297,228 | |
Wells Fargo & Co., Series K, 7.980%, 02/28/493,4,5 | | | | | | | 21,200,000 | | | | 22,790,000 | |
Westpac Banking Corp., 3.585%, 08/14/14 (a) | | | | | | | 5,400,000 | | | | 5,767,643 | |
Total Financials | | | | | | | | | | | 289,878,513 | |
Industrials—7.9% | | | | | | | | | | | | |
Altria Group, Inc., 9.700%, 11/10/18 | | | | | | | 1,200,000 | | | | 1,615,009 | |
Amgen, Inc., 6.150%, 06/01/18 | | | | | | | 4,900,000 | | | | 5,948,664 | |
AstraZeneca PLC, 5.900%, 09/15/17 | | | | | | | 800,000 | | | | 971,631 | |
AT&T, Inc., 4.950%, 01/15/13 | | | | | | | 1,700,000 | | | | 1,783,291 | |
AT&T, Inc., 5.500%, 02/01/18 | | | | | | | 1,700,000 | | | | 1,977,074 | |
AT&T, Inc., 6.300%, 01/15/38 | | | | | | | 1,200,000 | | | | 1,447,108 | |
Caterpillar, Inc., 0.468%, 05/21/13 (11/21/11)1,5 | | | | | | | 4,200,000 | | | | 4,202,087 | |
Codelco, Inc., 6.150%, 10/24/36 (a)5 | | | | | | | 300,000 | | | | 358,540 | |
Comcast Corp., 5.875%, 02/15/18 | | | | | | | 600,000 | | | | 698,086 | |
Comcast Corp., 6.450%, 03/15/37 | | | | | | | 600,000 | | | | 719,737 | |
Corp Nacional del Cobre de Chile, 7.500%, 01/15/19 (a) | | | | | | | 1,500,000 | | | | 1,897,782 | |
Corporacion Geo S.A.B. de C.V., 8.875%, 09/25/14 (a) | | | | | | | 3,000,000 | | | | 3,000,000 | |
GAZ Capital, 6.212%, 11/22/16 (a) | | | | | | | 400,000 | | | | 433,000 | |
The accompanying notes are an integral part of these financial statements.
11
Managers PIMCO Bond Fund
Schedule of Portfolio Investments (continued)
| | | Principal Amount | | | | Principal Amount | | | | Principal Amount | |
| | | | | | Principal Amount | | | Value | |
Industrials—7.9% (continued) | | | | | | | | | | | | |
GAZ Capital, 8.625%, 04/28/34 | | | | | | $ | 5,500,000 | | | $ | 6,875,000 | |
Gerdau SA, 5.750%, 01/30/21 (a) | | | | | | | 400,000 | | | | 399,000 | |
Hewlett-Packard Co., 0.588%, 05/24/13 (11/25/11)1 | | | | | | | 4,900,000 | | | | 4,858,468 | |
IBM Corp., 5.700%, 09/14/17 | | | | | | | 9,000,000 | | | | 10,925,262 | |
NGPL Pipeco LLC, 6.514%, 12/15/12 (a) | | | | | | | 1,800,000 | | | | 1,872,173 | |
Noble Group, 4.875%, 08/05/15 (a) | | | | | | | 1,000,000 | | | | 992,500 | |
Novatek Finance, Ltd., 5.326%, 02/03/16 (a) | | | | | | | 400,000 | | | | 415,000 | |
Odebrecht Drilling VIII/IX, Ltd., 6.350%, 06/30/21 (a) | | | | | | | 400,000 | | | | 422,000 | |
Peabody Energy Corp., 7.875%, 11/01/26 | | | | | | | 700,000 | | | | 775,250 | |
Petrobras International Finance Corp., 3.875%, 01/27/16 | | | | | | | 3,300,000 | | | | 3,409,893 | |
Petrobras International Finance Corp., 5.875%, 03/01/18 | | | | | | | 2,300,000 | | | | 2,484,000 | |
Petroleos Mexicanos, 8.000%, 05/03/19 | | | | | | | 5,100,000 | | | | 6,413,250 | |
Philip Morris International, Inc., 5.650%, 05/16/18 | | | | | | | 1,000,000 | | | | 1,188,850 | |
Qtel International Finance, Ltd., 4.750%, 02/16/21 (a) | | | | | | | 200,000 | | | | 204,500 | |
Ras Laffan Liquefied Natural Gas Co., Ltd., 5.298%, 09/30/20 (a) | | | | | | | 793,080 | | | | 860,492 | |
Rohm & Haas Holdings, 6.000%, 09/15/17 | | | | | | | 1,100,000 | | | | 1,251,842 | |
Sydney Airport Finance Co., Proprietary Ltd., 5.125%, 02/22/21 (a) | | | | | | | 300,000 | | | | 306,096 | |
Tennessee Gas Pipeline Co., 7.000%, 10/15/28 | | | | | | | 6,145,000 | | | | 7,086,574 | |
Time Warner, Inc., 5.875%, 11/15/16 | | | | | | | 1,200,000 | | | | 1,391,341 | |
TNK-BP Finance SA, 6.125%, 03/20/12 (a) | | | | | | | 400,000 | | | | 406,040 | |
Total Capital SA, 4.450%, 06/24/20 | | | | | | | 500,000 | | | | 562,103 | |
Transocean, Inc., Series B, 1.500%, 12/15/37 7 | | | | | | | 6,800,000 | | | | 6,817,000 | |
United Airlines, Inc., 10.400%, 11/01/16 | | | | | | | 454,560 | | | | 502,289 | |
UnitedHealth Group, Inc., 4.875%, 02/15/13 | | | | | | | 1,600,000 | | | | 1,674,907 | |
Vale Overseas, Ltd., 6.250%, 01/23/17 | | | | | | | 500,000 | | | | 561,875 | |
Vale Overseas, Ltd., 6.875%, 11/21/36 | | | | | | | 500,000 | | | | 573,150 | |
Verizon Wireless Capital LLC, 5.250%, 02/01/12 | | | | | | | 9,300,000 | | | | 9,402,560 | |
Total Industrials | | | | | | | | | | | 97,683,424 | |
| | | |
Utilities—0.5% | | | | | | | | | | | | |
AES Corp., The, 7.375%, 07/01/21 (a)5 | | | | | | | 200,000 | | | | 215,000 | |
Enel Finance International NV, 6.800%, 09/15/37 (a) | | | | | | | 1,800,000 | | | | 1,735,013 | |
ENN Energy Holdings, Ltd., 6.000%, 05/13/21 (a) | | | | | | | 200,000 | | | | 212,581 | |
Entergy Corp., 3.625%, 09/15/15 | | | | | | | 2,200,000 | | | | 2,222,902 | |
Majapahit Holding, B.V., 7.750%, 01/20/20 | | | | | | | 700,000 | | | | 816,375 | |
NRG Energy, Inc., 8.250%, 09/01/20 | | | | | | | 1,500,000 | | | | 1,560,000 | |
Tokyo Electric Power Co., 1.500%, 05/30/14 | | | JPY | | | | 1,000,000 | | | | 10,148 | |
Tokyo Electric Power Co., 1.850%, 07/28/14 | | | JPY | | | | 7,000,000 | | | | 70,459 | |
Total Utilities | | | | | | | | | | | 6,842,478 | |
Total Corporate Bonds and Notes (cost $388,671,753) | | | | | | | | | | | 394,404,415 | |
Foreign Government and Agency Obligations—4.2% | | | | | | | | | | | | |
Banco Nacional de Desenvolvimento Economico e Social Notes, 4.125%, 09/15/17 (a) | | | EUR | | | | 400,000 | | | | 541,071 | |
Brazil Notas do Tesouro Nacional Notes, Series F, 10.000%, 01/01/13 | | | BRL | | | | 4,000 | | | | 23,964 | |
Brazil Notas do Tesouro Nacional Notes, Series F, 10.000%, 01/01/14 | | | BRL | | | | 4,000 | | | | 23,722 | |
The accompanying notes are an integral part of these financial statements.
12
Managers PIMCO Bond Fund
Schedule of Portfolio Investments (continued)
| | | Principal Amount | | | | Principal Amount | | | | Principal Amount | |
| | | | | | Principal Amount | | | Value | |
Brazil Notas do Tesouro Nacional Notes, Series F, 10.000%, 01/01/17 | | | BRL | | | | 165,400 | | | $ | 941,648 | |
British Columbia Bonds, Province of, 4.300%, 06/18/42 | | | CAD | | | | 300,000 | | | | 326,989 | |
Canada Government Bonds, 3.250%, 06/01/21 | | | CAD | | | | 2,500,000 | | | | 2,706,922 | |
Canada Government Bonds, 3.750%, 06/01/19 | | | CAD | | | | 600,000 | | | | 673,619 | |
Canada Government Bonds, 4.250%, 06/01/18 | | | CAD | | | | 200,000 | | | | 230,375 | |
Canada Government Bonds, 4.500%, 06/01/15 | | | CAD | | | | 100,000 | | | | 111,375 | |
Canada Government Notes, 2.750%, 09/01/16 | | | CAD | | | | 2,800,000 | | | | 2,964,755 | |
Canada Government Notes, 3.000%, 12/01/15 | | | CAD | | | | 800,000 | | | | 852,450 | |
Canada Housing Trust Bonds, 3.350%, 12/15/20 (a) | | | CAD | | | | 2,600,000 | | | | 2,737,962 | |
Canada Housing Trust Bonds, 3.800%, 06/15/21 (a) | | | CAD | | | | 1,600,000 | | | | 1,739,301 | |
Canada Housing Trust Notes, 2.750%, 12/15/15 (a) | | | CAD | | | | 1,300,000 | | | | 1,359,552 | |
Export-Import Bank of China Notes, The, 4.875%, 07/21/15 (a) | | | | | | $ | 300,000 | | | | 320,478 | |
Export-Import Bank of Korea Bonds, The, 4.000%, 01/29/21 | | | | | | | 400,000 | | | | 390,679 | |
Export-Import Bank of Korea Notes, The, 5.125%, 06/29/20 | | | | | | | 700,000 | | | | 745,090 | |
Export-Import Bank of Korea Notes, The, 8.125%, 01/21/14 | | | | | | | 1,000,000 | | | | 1,116,051 | |
Italy Treasury Bonds, Series CPI, 2.100%, 09/15/21 | | | EUR | | | | 2,799,846 | | | | 3,049,442 | |
Italy Treasury Notes, Series CPI, 2.100%, 09/15/16 | | | EUR | | | | 307,398 | | | | 378,609 | |
Korea Development Bank Notes, The, 4.375%, 08/10/15 | | | | | | | 3,500,000 | | | | 3,648,148 | |
Korea Finance Corp. Notes, 3.250%, 09/20/16 | | | | | | | 800,000 | | | | 789,440 | |
Korea Housing Finance Corp. Notes, 4.125%, 12/15/15 (a) | | | | | | | 500,000 | | | | 519,021 | |
Mexican Notes, 6.000%, 06/18/15 | | | MXN | | | | 10,000,000 | | | | 781,252 | |
Mexico Government International Bonds, 6.050%, 01/11/40 | | | | | | | 800,000 | | | | 942,000 | |
Ontario Bonds, Province of, 4.000%, 06/02/21 | | | CAD | | | | 3,900,000 | | | | 4,169,078 | |
Ontario Bonds, Province of, 4.200%, 06/02/20 | | | CAD | | | | 2,300,000 | | | | 2,510,006 | |
Ontario Bonds, Province of, 4.300%, 03/08/17 | | | CAD | | | | 1,300,000 | | | | 1,443,584 | |
Ontario Bonds, Province of, 4.400%, 06/02/19 | | | CAD | | | | 1,400,000 | | | | 1,555,176 | |
Ontario Bonds, Province of, 4.700%, 06/02/37 | | | CAD | | | | 2,600,000 | | | | 2,950,240 | |
Ontario Bonds, Province of, MTN, 4.600%, 06/02/39 | | | CAD | | | | 700,000 | | | | 788,045 | |
Ontario Bonds, Province of, MTN, 5.500%, 06/02/18 | | | CAD | | | | 400,000 | | | | 471,721 | |
Ontario Notes, Province of, 1.375%, 01/27/14 | | | | | | | 1,400,000 | | | | 1,416,159 | |
Ontario Notes, Province of, 3.000%, 07/16/18 | | | | | | | 400,000 | | | | 414,643 | |
Ontario Notes, Province of, 4.200%, 03/08/18 | | | CAD | | | | 200,000 | | | | 220,834 | |
Panama Government Bonds, 7.250%, 03/15/15 | | | | | | | 200,000 | | | | 232,000 | |
Quebec Bonds, Province of, 4.250%, 12/01/21 | | | CAD | | | | 2,600,000 | | | | 2,811,130 | |
Quebec Bonds, Province of, 4.500%, 12/01/16 | | | CAD | | | | 100,000 | | | | 111,828 | |
Quebec Bonds, Province of, 4.500%, 12/01/17 | | | CAD | | | | 100,000 | | | | 111,921 | |
Quebec Bonds, Province of, MTN, 4.500%, 12/01/18 | | | CAD | | | | 500,000 | | | | 558,570 | |
Russian Government Notes, 3.625%, 04/29/15 | | | | | | | 200,000 | | | | 204,000 | |
Societe Financement de L’Economie Francaise Bonds, 0.603%, 07/16/12 (01/17/12) (a)1 | | | | | | | 1,000,000 | | | | 1,002,650 | |
Spain Government Bonds, 4.650%, 07/30/25 | | | EUR | | | | 1,000,000 | | | | 1,212,052 | |
United Kingdom Gilt Bonds, 4.250%, 09/07/39 | | | GBP | | | | 200,000 | | | | 371,331 | |
United Kingdom Gilt Bonds, 4.250%, 12/07/40 | | | GBP | | | | 400,000 | | | | 743,837 | |
United Kingdom Gilt Bonds, 4.250%, 12/07/46 | | | GBP | | | | 100,000 | | | | 189,032 | |
Total Foreign Government and Agency Obligations (cost $50,446,932) | | | | | | | | | | | 51,401,752 | |
The accompanying notes are an integral part of these financial statements.
13
Managers PIMCO Bond Fund
Schedule of Portfolio Investments (continued)
| | | Principal Amount | | | | Principal Amount | | | | Principal Amount | |
| | | | | | Principal Amount | | | Value | |
Mortgage-Backed Securities — 5.6% | | | | | | | | | | | | |
American Home Mortgage Investment Trust, Series 2004-4, Class 4A, 2.245%, 02/25/45 (11/25/11)1 | | | | | | $ | 572,703 | | | $ | 459,156 | |
Arran Residential Mortgages Funding PLC, Series 2010-1A, Class A1B, 2.735%, 05/16/47 (11/16/11) (a)1 | | | EUR | | | | 798,066 | | | | 1,103,510 | |
Arran Residential Mortgages Funding PLC, Series 2010-1A, Class A2B, 2.935%, 05/16/47 (11/16/11) (a)1 | | | EUR | | | | 2,000,000 | | | | 2,759,247 | |
Banc of America Funding Corp., Series 2005-D, Class A1, 2.712%, 05/25/35 (11/25/11) | | | | | | | 804,611 | | | | 803,103 | |
Bear Stearns Adjustable Rate Mortgage Trust, Series 2000-2, Class A, 3.079%, 11/25/304 | | | | | | | 17,589 | | | | 16,800 | |
Bear Stearns Adjustable Rate Mortgage Trust, Series 2002-11, Class 1A1, 5.680%, 02/25/334 | | | | | | | 42,887 | | | | 40,827 | |
Bear Stearns Adjustable Rate Mortgage Trust, Series 2003-1, Class 6A1, 2.730%, 04/25/334 | | | | | | | 301,217 | | | | 263,873 | |
Bear Stearns Adjustable Rate Mortgage Trust, Series 2005-12, Class 13A, 5.397%, 02/25/364 | | | | | | | 284,912 | | | | 243,421 | |
Bear Stearns Adjustable Rate Mortgage Trust, Series 2005-2, Class A1, 2.710%, 03/25/35 (11/25/11)1 | | | | | | | 8,880,333 | | | | 8,276,062 | |
Bear Stearns Adjustable Rate Mortgage Trust, Series 2005-2, Class A2, 2.731%, 03/25/35 (11/25/11)1 | | | | | | | 5,239,977 | | | | 4,959,919 | |
Bear Stearns Adjustable Rate Mortgage Trust, Series 2005-5, Class A2, 2.250%, 08/25/35 (11/25/11)1 | | | | | | | 11,408,743 | | | | 10,519,551 | |
Bear Stearns Alt-A Trust, Series 2005-4, Class 23A1, 2.588%, 05/25/354 | | | | | | | 1,359,015 | | | | 997,123 | |
Bear Stearns Alt-A Trust, Series 2005-7, Class 22A1, 2.772%, 09/25/354 | | | | | | | 674,561 | | | | 450,345 | |
Bear Stearns Commercial Mortgage Securities, Series 2007-PW18, Class A4, 5.700%, 06/11/50 | | | | | | | 2,800,000 | | | | 3,030,978 | |
Citigroup Mortgage Loan Trust, Inc., Series 2005-11, Class A2A, 2.580%, 10/25/35 (11/25/11)1 | | | | | | | 348,474 | | | | 278,170 | |
Citigroup Mortgage Loan Trust, Inc., Series 2005-6, Class A1, 2.370%, 08/25/35 (11/25/11)1 | | | | | | | 6,307,832 | | | | 5,759,031 | |
Countrywide Alternative Loan Trust, Series 2007-OA7, Class A1A, 0.425%, 05/25/47 (11/25/11)1 | | | | | | | 1,321,368 | | | | 701,388 | |
Countrywide Home Loans, Inc., Series 2005-HYB9, Class 3A2A, 2.595%, 02/20/36 (11/20/11)1 | | | | | | | 400,523 | | | | 294,471 | |
European Loan Conduit, Series 25X, Class A, 1.685%, 05/15/19 (11/15/11)1 | | | EUR | | | | 120,344 | | | | 138,212 | |
Greenpoint Mortgage Funding Trust, Series 2006-AR6, Class A1A, 0.325%, 10/25/46 (11/25/11)1 | | | | | | | 205,423 | | | | 189,936 | |
Greenpoint Mortgage Funding Trust, Series 2006-AR8, Class 1A1A, 0.325%, 01/25/47 (11/25/11)1 | | | | | | | 176,702 | | | | 166,968 | |
GS Mortgage Securities Corp., Series 2007-EOP, Class A1, 1.142%, 03/06/20 (11/07/11) (a)1 | | | | | | | 2,073,733 | | | | 2,056,167 | |
GSR Mortgage Loan Trust, Series 2005-AR7, Class 6A1, 5.150%, 11/25/354 | | | | | | | 1,230,625 | | | | 1,129,475 | |
IndyMac Index Mortgage Loan Trust, Series 2005-AR31, Class 1A1, 2.419%, 01/25/364 | | | | | | | 1,522,127 | | | | 841,748 | |
JPMorgan Chase Commercial Mortgage Securities Corp., Series 2006-LDP9, Class A3, 5.336%, 05/15/47 | | | | | | | 2,100,000 | | | | 2,223,188 | |
JPMorgan Chase Commercial Mortgage Securities Corp., Series 2010-C2, Class A3, 4.070%, 11/15/43 (a) | | | | | | | 2,000,000 | | | | 1,986,339 | |
JPMorgan Mortgage Trust, Series 2005-A1, Class 6T1, 5.018%, 02/25/35 (11/25/11)1 | | | | | | | 576,548 | | | | 554,317 | |
Merrill Lynch Mortgage Investors, Inc., Series 2005-A10, Class A, 0.455%, 02/25/36 (11/25/11)1 | | | | | | | 839,756 | | | | 554,734 | |
MLCC Mortgage Investors, Inc., Series 2005-3, Class 4A, 0.495%, 11/25/35 (11/25/11)1 | | | | | | | 182,897 | | | | 150,608 | |
Morgan Stanley Capital I, Series 2007-IQ16, Class A4, 5.809%, 12/12/49 | | | | | | | 3,000,000 | | | | 3,287,724 | |
Opera Finance PLC, Series CSC3, Class A, 1.215%, 04/25/17 (01/25/12)1 | | | GBP | | | | 3,779,580 | | | | 5,411,934 | |
Prime Mortgage Trust, Series 2004-CL1, Class 1A2, 0.645%, 02/25/34 (11/25/11)1 | | | | | | | 161,525 | | | | 150,102 | |
Prime Mortgage Trust, Series 2004-CL1, Class 2A2, 0.645%, 02/25/19 (11/25/11)1 | | | | | | | 15,997 | | | | 15,618 | |
Structured Asset Mortgage Investments, Inc., Series 2005-AR5, Class A2, 0.494%, 07/19/35 (11/19/11)1 | | | | | | | 907,121 | | | | 721,978 | |
Structured Asset Mortgage Investments, Inc., Series 2002-AR3, Class A1, 0.904%, 09/19/32 (11/19/11)1 | | | | | | | 359,969 | | | | 298,575 | |
Structured Asset Securities Corp., Series 2001-21A, Class 1A1, 2.273%, 01/25/32 (11/25/11)1 | | | | | | �� | 18,349 | | | | 15,139 | |
Structured Asset Securities Corp., Series 2006-11, Class A1, 2.650%, 10/25/35 (a)4 | | | | | | | 686,442 | | | | 540,537 | |
Thornburg Mortgage Securities Trust, Series 2006-6, Class A1, 0.355%, 11/25/46 (11/25/11)1 | | | | | | | 762,436 | | | | 760,782 | |
Wachovia Bank Commercial Mortgage Trust, Series 2006-WL7A, Class A1, 0.333%, 09/15/21 (11/15/11) (a)1 | | | | | | | 3,453,723 | | | | 3,256,650 | |
Wachovia Bank Commercial Mortgage Trust, Series 2007-WHL8, Class A1, 0.323%, 09/15/21 (11/15/11) (a)1 | | | | | | | 2,101,705 | | | | 1,877,393 | |
Washington Mutual Mortgage Pass-Through, Series 2002-AR1, Class 2A2, 2.018%, 02/25/31 (11/25/11)1 | | | | | | | 3,426 | | | | 3,075 | |
Washington Mutual Mortgage Pass-Through, Series 2002-AR17, Class 1A, 1.430%, 11/25/42 (11/25/11)1 | | | | | | | 143,969 | | | | 116,036 | |
Washington Mutual Mortgage Pass-Through, Series 2005-AR13, Class A1A1, 0.535%, 10/25/45 (11/25/11)1 | | | | | | | 304,063 | | | | 230,435 | |
The accompanying notes are an integral part of these financial statements.
14
Managers PIMCO Bond Fund
Schedule of Portfolio Investments (continued)
| | | | | | | | |
| | | Principal
Amount | | | Value | |
Mortgage-Backed Securities—5.6% (continued) | | | | | | | | |
Wells Fargo Mortgage Backed Securities Trust, Series 2006-AR2, Class 2A1, 2.718%, 03/25/364 | | $ | 1,592,093 | | | $ | 1,295,799 | |
Total Mortgage-Backed Securities (cost $ 73,792,791) | | | | | | | 68,930,444 | |
Municipal Bonds—4.1% | | | | | | | | |
American Municipal Power, Inc., Combined Hydroelectric Projects Revenue, Taxable Build America, Series 2010 B, 8.084%, 02/15/50 | | | 1,000,000 | | | | 1,346,290 | |
Buckeye Tobacco Settlement Financing Authority, Tobacco Settlement Asset-Backed Bonds, Series 2007 A-2, 5.875%, 06/01/30 | | | 1,000,000 | | | | 756,120 | |
California Infrastructure & Economic Development Bank Revenue, UCSF Neurosciences Building 19A, Taxable Build America, Series 2010 B, 6.486%, 05/15/49 | | | 1,000,000 | | | | 1,144,690 | |
California State General Obligation, 5.650%, 04/01/39 | | | 1,200,000 | | | | 1,269,960 | |
California State General Obligation, 7.500%, 04/01/34 | | | 1,300,000 | | | | 1,558,492 | |
California State General Obligation, 7.550%, 04/01/39 | | | 1,300,000 | | | | 1,585,506 | |
California State General Obligation, 7.600%, 11/01/40 | | | 1,000,000 | | | | 1,229,880 | |
California State General Obligation, 7.950%, 03/01/36 | | | 1,100,000 | | | | 1,240,382 | |
California State University Systemwide Revenue, Series 2009 A, 5.250%, 11/01/38 | | | 500,000 | | | | 521,370 | |
California State University Systemwide Revenue, Taxable Build America, Series 2010 B, 6.434%, 11/01/30 | | | 700,000 | | | | 782,257 | |
Calleguas-Las Virgenes, CA Public Financing Authority Water Revenue, Calleguas Municipal Water District, Taxable Build America, Series 2010 B, 5.944%, 07/01/40 | | | 1,000,000 | | | | 1,118,740 | |
Chicago, IL Transit Authority Sales Tax Receipts Revenue, Series 2016, 5.250%, 12/01/36 | | | 2,200,000 | | | | 2,278,276 | |
Chicago, IL Transit Authority, Sales & Transfer Tax Receipts Revenue, Pension Funding, Series 2008 A, 6.300%, 12/01/21 | | | 100,000 | | | | 109,450 | |
Chicago, IL Transit Authority, Sales & Transfer Tax Receipts Revenue, Pension Funding, Series 2008 A, 6.899%, 12/01/40 | | | 1,600,000 | | | | 1,856,688 | |
Chicago, IL Transit Authority, Sales & Transfer Tax Receipts Revenue, Retiree Health Care, Series 2008 B, 6.300%, 12/01/21 | | | 200,000 | | | | 218,900 | |
Chicago, IL Transit Authority, Sales & Transfer Tax Receipts Revenue, Retiree Health Care, Series 2008 B, 6.899%, 12/01/40 | | | 1,700,000 | | | | 1,972,731 | |
Chicago, IL Transit Authority, Sales & Transfer Tax Receipts Revenue, Taxable Build America, Series 2010 B, 6.200%, 12/01/40 | | | 1,000,000 | | | | 1,074,640 | |
Clark County, NV Airport Revenue, Taxable Direct Payment Build America, Series C, 6.820%, 07/01/45 | | | 800,000 | | | | 963,192 | |
Illinois Municipal Electric Agency Power Supply System Revenue, Series C, 6.832%, 02/01/35 | | | 800,000 | | | | 852,888 | |
Illinois State General Obligation, 4.071%, 01/01/14 | | | 1,200,000 | | | | 1,235,292 | |
Illinois State General Obligation, Taxable Build America, Series 2010-3, 6.725%, 04/01/35 | | | 400,000 | | | | 419,520 | |
Los Angeles County Public Works Financing Authority Revenue, Multiple Capital Projects I, Series 2010 B Taxable Build America, 7.488%, 08/01/33 | | | 200,000 | | | | 241,554 | |
Los Angeles County Public Works Financing Authority Revenue, Multiple Capital Projects I, Series 2010 B, Taxable Build America, 7.618%, 08/01/40 | | | 300,000 | | | | 362,046 | |
Los Angeles, CA Unified School District General Obligation, Series A-1, 4.500%, 07/01/22 (AGM Insured)8 | | | 3,600,000 | | | | 3,781,404 | |
Los Angeles, CA Unified School District General Obligation, Taxable Build America, Series 2010 RY, 6.758%, 07/01/34 | | | 4,000,000 | | | | 4,895,120 | |
Los Angeles, CA Wastewater System Revenue, Series 2010 A, 5.713%, 06/01/39 | | | 1,000,000 | | | | 1,118,390 | |
New Jersey State Turnpike Authority Revenue, Series 2010 A, 7.102%, 01/01/41 | | | 800,000 | | | | 1,050,880 | |
New York City Municipal Finance Authority Revenue, Water and Sewer System General Resolution, Taxable Bond America, Series 2010 GG, 5.724%, 06/15/42 | | | 5,000,000 | | | | 5,899,400 | |
New York City Municipal Finance Authority Revenue, Water and Sewer System Second General Resolution, Taxable Bond America, Series 2011 CC, 5.882%, 06/15/44 | | | 1,100,000 | | | | 1,323,047 | |
The accompanying notes are an integral part of these financial statements.
15
Managers PIMCO Bond Fund
Schedule of Portfolio Investments (continued)
| | | Principal Amount | | | | Principal Amount | |
| | | Principal Amount | | | Value | |
Municipal Bonds—4.1% (continued) | | | | | | | | |
New York City Municipal Finance Authority Revenue, Water and Sewer System Second General Resolution, Taxable Bond America, Series 2011 CC, 6.282%, 06/15/42 | | $ | 1,100,000 | | | $ | 1,227,765 | |
North Carolina Turnpike Authority State Annual Appropriation Revenue, Triangle Expressway System, Taxable Build America, Series 2009 B, 6.700%, 01/01/39 | | | 900,000 | | | | 1,014,714 | |
Public Power Generation Agency Revenue, Whelan Energy Center Unit 2, Taxable Build America, | | | | | | | | |
Series 2009 A, 7.242%, 01/01/41 | | | 1,200,000 | | | | 1,351,548 | |
San Francisco Bay Area Toll Authority Subordinate Toll Bridge Revenue, Series 2010 S-1, 7.043%, 04/01/50 | | | 900,000 | | | | 1,153,341 | |
Texas State Transportation Commission Mobility Fund, Series 2005 A, 4.750%, 04/01/35 | | | 700,000 | | | | 716,114 | |
Truckee Meadows Water Authority Revenue, Series 2005 A, 5.000%, 07/01/36 (NATL-RE)8 | | | 200,000 | | | | 202,320 | |
University of California General Revenue, Taxable Build America, Series 2009 R, 6.270%, 05/15/31 | | | 2,500,000 | | | | 2,711,900 | |
University of California Medical Center Regents Revenue, Series 2010 H, 6.548%, 05/15/48 | | | 300,000 | | | | 349,872 | |
University of California Medical Center Regents Revenue, Series 2010 H, 6.398%, 05/15/31 | | | 200,000 | | | | 227,918 | |
Total Municipal Bonds (cost $ 44,852,906) | | | | | | | 51,162,597 | |
Municipal Closed-End Bond Funds—0.5% | | | | | | | | |
Dreyfus Municipal Income, Inc. | | | 37,500 | | | | 356,625 | |
DWS Municipal Income Trust5 | | | 55,000 | | | | 695,200 | |
Invesco Van Kampen Advantage Municipal Income Trust II | | | 61,796 | | | | 743,406 | |
Invesco Van Kampen Trust for Investment Grade Municipals 5 | | | 55,000 | | | | 786,500 | |
MFS Municipal Income Trust5 | | | 53,800 | | | | 370,144 | |
Nuveen Performance Plus Municipal Fund | | | 55,000 | | | | 789,800 | |
Nuveen Premium Income Municipal Fund II | | | 55,000 | | | | 784,850 | |
Nuveen Premium Income Municipal Fund IV5 | | | 55,000 | | | | 701,800 | |
Nuveen Quality Income Municipal Fund5 | | | 55,000 | | | | 765,600 | |
Total Municipal Closed-End Bond Funds (cost $ 6,147,228) | | | | | | | 5,993,925 | |
| | | Principal Amount | | | | Principal Amount | |
| | | Shares | | | | |
Preferred Stocks—0.8% | | | | | | | | |
Bank of America Corp., Series L, 7.250%. Exercise Price $50.00, Expiration Date 12/31/49 (Financials)7 | | | 7,000 | | | | 5,992,000 | |
DG Funding Trust, 0.999%, 12/30/2011 (Financials) (a)1,2 | | | 573 | | | | 4,311,593 | |
Total Preferred Stocks (cost $ 12,745,273) | | | | | | | 10,303,593 | |
| | | Principal Amount | | | | Principal Amount | |
| | | Principal Amount | | | | |
U.S. Government and Agency Obligations—51.2% | | | | | | | | |
Federal Home Loan Mortgage Corporation—7.7% | | | | | | | | |
FHLMC, 0.393%, 07/15/19 to 08/15/191 | | $ | 3,351,757 | | | | 3,346,161 | |
FHLMC, 0.543%, 05/15/361 | | | 1,072,802 | | | | 1,073,351 | |
FHLMC, 0.743%, 09/15/301 | | | 36,407 | | | | 36,413 | |
FHLMC, 2.000%, 08/25/16 | | | 1,200,000 | | | | 1,243,250 | |
FHLMC, 2.500%, 05/27/16 | | | 1,200,000 | | | | 1,272,050 | |
FHLMC, 2.615%, 07/01/301 | | | 2,378 | | | | 2,440 | |
FHLMC, 2.699%, 11/01/341 | | | 1,581,632 | | | | 1,678,833 | |
FHLMC, 4.000%, TBA | | | 20,000,000 | | | | 20,750,000 | |
FHLMC, 4.500%, 07/01/40 | | | 267,364 | | | | 284,246 | |
FHLMC, 4.500%, TBA | | | 7,000,000 | | | | 7,382,812 | |
FHLMC, 4.875%, 06/13/18 | | | 1,000,000 | | | | 1,189,961 | |
The accompanying notes are an integral part of these financial statements.
16
Managers PIMCO Bond Fund
Schedule of Portfolio Investments (continued)
| | | Principal Amount | | | | Principal Amount | |
| | | Principal Amount | | | Value | |
Federal Home Loan Mortgage Corporation—7.7% (continued) | | | | | | | | |
FHLMC, 5.082%, 08/01/351 | | $ | 129,460 | | | $ | 138,158 | |
FHLMC, 5.500%, 05/01/35 to 03/01/39 | | | 2,833,075 | | | | 3,083,303 | |
FHLMC, 6.000%, 02/01/38 | | | 208,852 | | | | 228,567 | |
FHLMC, 6.500%, 01/01/26 to 08/15/31 | | | 5,031,696 | | | | 5,391,799 | |
FHLMC, 7.000%, 11/15/20 | | | 16,519 | | | | 17,903 | |
FHLMC, 7.500%, 08/15/30 | | | 249,754 | | | | 289,413 | |
FHLMC Gold Pool, 5.500%, 04/01/37 to 05/01/40 | | | 23,824,113 | | | | 25,784,175 | |
FHLMC Gold Pool, 6.000%, 02/01/16 to 11/01/37 | | | 19,993,461 | | | | 21,879,477 | |
FHLMC Structured Pass Through Securities, 1.443%, 02/25/451 | | | 144,687 | | | | 136,682 | |
Total Federal Home Loan Mortgage Corporation | | | | | | | 95,208,994 | |
| | |
Federal National Mortgage Association—29.6% | | | | | | | | |
FNMA, 0.305%, 12/25/361 | | | 408,830 | | | | 406,784 | |
FNMA, 0.555%, 04/25/371 | | | 899,874 | | | | 897,972 | |
FNMA, 0.695%, 09/25/351 | | | 1,694,148 | | | | 1,698,588 | |
FNMA, 1.431%, 07/01/441 | | | 193,850 | | | | 194,732 | |
FNMA, 2.318%, 09/01/351 | | | 1,212,271 | | | | 1,275,360 | |
FNMA, 2.376%, 05/25/351 | | | 186,997 | | | | 193,424 | |
FNMA, 2.590%, 06/01/351 | | | 2,688,411 | | | | 2,835,643 | |
FNMA, 3.330%, 11/21/21 | | | 100,000 | | | | 101,250 | |
FNMA, 3.500%, 11/01/25 to 04/01/41 | | | 37,435,840 | | | | 38,124,604 | |
FNMA, 3.662%, 05/01/361 | | | 1,132,733 | | | | 1,144,009 | |
FNMA, 3.995%, 05/01/361 | | | 604,001 | | | | 642,368 | |
FNMA, 4.000%, 04/01/24 to 09/01/41 | | | 35,859,632 | | | | 37,369,877 | |
FNMA, 4.000%, TBA | | | 14,100,000 | | | | 14,659,594 | |
FNMA, 4.500%, 01/01/23 to 06/01/41 | | | 58,503,432 | | | | 62,037,947 | |
FNMA, 4.500%, TBA | | | 116,900,000 | | | | 123,640,021 | |
FNMA, 5.000%, 04/25/33 to 03/01/35 | | | 4,858,739 | | | | 5,291,144 | |
FNMA, 5.000%, TBA | | | 25,000,000 | | | | 26,894,537 | |
FNMA, 5.032%, 05/01/351 | | | 174,915 | | | | 186,389 | |
FNMA, 5.500%, 12/01/16 to 09/01/38 | | | 6,863,536 | | | | 7,478,856 | |
FNMA, 5.500%, TBA | | | 5,300,000 | | | | 5,749,673 | |
FNMA, 6.000%, 05/01/17 to 01/01/39 | | | 24,312,948 | | | | 26,726,382 | |
FNMA, 6.000%, TBA | | | 6,900,000 | | | | 7,561,970 | |
FNMA, 6.500%, 11/01/35 | | | 253,856 | | | | 283,708 | |
FNMA, 7.200%, 05/25/23 | | | 511,497 | | | | 575,524 | |
FNMA Whole Loan, 6.313%, 12/25/424 | | | 267,964 | | | | 320,504 | |
Total Federal National Mortgage Association | | | | | | | 366,290,860 | |
| | |
Government National Mortgage Association—0.5% | | | | | | | | |
GNMA, 1.625%, 08/20/251 | | | 20,671 | | | | 21,422 | |
GNMA, 2.125%, 11/20/26 to 11/20/291 | | | 277,438 | | | | 287,922 | |
GNMA, 2.375%, 04/20/21 to 03/20/241 | | | 36,357 | | | | 37,643 | |
GNMA, 3.500%, 11/15/40 to 11/20/40 | | | 1,849,531 | | | | 1,920,155 | |
GNMA, 6.500%, 06/20/28 | | | 642,694 | | | | 709,288 | |
The accompanying notes are an integral part of these financial statements.
17
Managers PIMCO Bond Fund
Schedule of Portfolio Investments (continued)
| | | Principal Amount | | | | Principal Amount | |
| | | Principal Amount | | | Value | |
Government National Mortgage Association—0.5% (continued) | | | | | | | | |
GNMA, 6.750%, 10/16/404 | | $ | 3,291,005 | | | $ | 3,780,962 | |
Total Government National Mortgage Association | | | | | | | 6,757,392 | |
U.S. Government Obligations—13.4% | | | | | | | | |
U.S. Treasury Inflation Indexed Bonds, 0.625%, 07/15/21 | | | 1,507,590 | | | | 1,588,244 | |
U.S. Treasury Inflation Indexed Bonds, 1.125%, 01/15/21 | | | 11,390,830 | | | | 12,534,367 | |
U.S. Treasury Inflation Indexed Bonds, 2.125%, 02/15/409,10 | | | 25,677,225 | | | | 33,769,557 | |
U.S. Treasury Inflation Protected Securities, 1.750%, 01/15/28 | | | 648,768 | | | | 767,219 | |
U.S. Treasury Inflation Protected Securities, 2.000%, 01/15/2610 | | | 8,673,956 | | | | 10,500,231 | |
U.S. Treasury Inflation Protected Securities, 2.375%, 01/15/25 to 01/15/2710 | | | 5,964,108 | | | | 7,525,576 | |
U.S. Treasury Inflation Protected Securities, 2.500%, 01/15/2910 | | | 4,220,320 | | | | 5,532,578 | |
U.S. Treasury Inflation Protected Securities, 3.875%, 04/15/29 | | | 2,204,704 | | | | 3,386,805 | |
U.S. Treasury Notes, 1.375%, 09/30/189,10 | | | 27,600,000 | | | | 27,207,556 | |
U.S. Treasury Notes, 1.500%, 08/31/189 | | | 63,600,000 | | | | 63,321,750 | |
U.S. Treasury Notes, 3.375%, 11/15/19 | | | 500,000 | | | | 558,633 | |
Total U.S. Government Obligations | | | | | | | 166,692,516 | |
Total U.S. Government and Agency Obligations (cost $ 623,246,717) | | | | | | | 634,949,762 | |
| | | Principal Amount | | | | Principal Amount | |
| | | Notional Amount | | | | |
Purchased Swaptions—0.0%# | | | | | | | | |
1-Year Interest Rate Swap (Call), Counterparty RBS, Receive Floating 3-Month USD-LIBOR, Exercise Rate 1.250%, Expiration 04/30/12 (cost $ 68,270) | | | 17,300,000 | | | | 124,324 | |
| | Principal Amount | | | Principal Amount | | | | Principal Amount | |
| | | | | Principal Amount | | | | |
Short-Term Investments—27.2% | | | | | | | | | | |
Certificates of Deposit—0.1% | | | | | | | | | | |
Itau Unibanco SA, 1.430%, 12/05/1111 | | | | | 1,100,000 | | | | 1,098,812 | |
Commercial Paper—3.1% | | | | | | | | | | |
Kells Funding LLC, 0.270%, 11/01/1111 | | | | | 27,100,000 | | | | 27,100,000 | |
Kells Funding LLC, 0.270%, 11/02/1111 | | | | | 11,300,000 | | | | 11,299,887 | |
Total Commercial Paper | | | | | | | | | 38,399,887 | |
Japan Treasury Bills—13.3% | | | | | | | | | | |
Japan Treasury Bills, Series 212, 0.141%, 11/07/1111 | | JPY | | | 1,060,000,000 | | | | 13,558,346 | |
Japan Treasury Bills, Series 214, 0.130%, 11/14/1111 | | JPY | | | 6,930,000,000 | | | | 88,639,203 | |
Japan Treasury Bills, Series 232, 0.104%, 01/30/1211 | | JPY | | | 4,940,000,000 | | | | 63,171,656 | |
Total Japan Treasury Bills | | | | | | | | | 165,369,205 | |
Repurchase Agreements—9.5% | | | | | | | | | | |
Morgan Stanley & Co., LLC, dated 10/28/11, due 11/01/11, 0.09%, total to be received $44,300,111, (collateralized by $45,780,953 U.S. Treasury Notes, 2.625%, 08/15/20) | | | | | 44,300,000 | | | | 44,300,000 | |
TD Securities (USA) LLC, dated 10/31/11, due 11/02/11, 0.10%, total to be received $73,200,203, (collateralized by $74,855,691 U.S. Treasury Notes, 1.375%, 09/15/12) | | | | | 73,200,000 | | | | 73,200,000 | |
Total Repurchase Agreements | | | | | | | | | 117,500,000 | |
The accompanying notes are an integral part of these financial statements.
18
Managers PIMCO Bond Fund
Schedule of Portfolio Investments (continued)
| | | Principal Amount | | | | Principal Amount | |
| | | Principal Amount | | | Value | |
U.S. Treasury Bills—0.1% | | | | | | | | |
U.S. Treasury Bills, 0.003%, 01/19/129,11 | | $ | 300,000 | | | $ | 299,992 | |
U.S. Treasury Bills, 0.023%, 03/08/129,11 | | | 10,000 | | | | 9,999 | |
U.S. Treasury Bills, 0.038%, 04/05/129,11 | | | 260,000 | | | | 259,958 | |
Total U.S. Treasury Bills | | | | | | | 569,949 | |
| | | Principal Amount | | | | Principal Amount | |
| | | Shares | | | | |
Other Investment Companies—1.1% | | | | | | | | |
BNY Mellon Overnight Government Fund, 0.100%12,13 | | | 10,422,607 | | | | 10,422,607 | |
Dreyfus Cash Management Fund, Institutional Class Shares, 0.056%10,13 | | | 3,374,096 | | | | 3,374,096 | |
Total Other Investment Companies | | | | | | | 13,796,703 | |
Total Short-Term Investments (cost $339,460,198) | | | | | | | 336,734,556 | |
Total Investments—127.7% (cost $1,567,784,289) | | | | | | | 1,582,941,339 | |
Other Assets, less Liabilities—(27.7)% | | | | | | | (343,800,194 | ) |
Net Assets—100.0% | | | | | | $ | 1,239,141,145 | |
The accompanying notes are an integral part of these financial statements.
19
Managers PIMCO Bond Fund
Notes to Schedule of Portfolio Investments
The following footnotes and abbreviations should be read in conjunction with the Schedule of Portfolio Investments previously presented in this report.
Note: Based on the cost of investments of $1,569,438,782 for Federal income tax purposes at October 31, 2011, the aggregate gross unrealized appreciation and depreciation were $45,094,494 and $31,591,937, respectively, resulting in net unrealized appreciation of investments of $13,502,557.
| * | Non-income-producing security. |
| # | Rounds to less than 0.1%. |
| (a) | Security exempt from registration under Rule 144A of the Securities Act of 1933. This security may be resold in transactions exempt from registration, normally to qualified buyers. At October 31, 2011, the value of these securities amounted to $126,932,518, or 10.2% of net assets. |
| 1 | Floating Rate Security. The rate listed is as of October 31, 2011. Date in parentheses represents the security’s next coupon rate reset. |
| 2 | Illiquid Security. A security not readily convertible into cash such as a stock, bond or commodity that is not actively traded and would be difficult to sell in a current sale. The Fund may not invest more than 15% of its net assets in illiquid securities. |
| 3 | Perpetuity Bond. The date shown is the final call date. |
| 4 | Variable Rate Security. The rate listed is as of October 31, 2011, and is periodically reset subject to terms and conditions set forth in the debenture. |
| 5 | Some or all of these securities, amounting to a market value of $10,275,716, or 0.8% of net assets, were out on loan to various brokers. |
| 6 | Security is in default. Issuer has failed to make a timely payment of either principal or interest or has failed to comply with some provision of the bond indenture. |
| 7 | Convertible Security. A corporate bond or preferred stock, usually a junior debenture, that can be converted, at the option of the holder, for a specific number of shares of the company’s preferred stock or common stock. Convertible Bonds and Convertible Preferred Stocks at October 31, 2011, amounted to $6,817,000, or 0.6% of net assets, and $5,992,000, or 0.5% of net assets, respectively. |
| 8 | Securities in the portfolio backed by insurance of financial institutions and financial guaranty assurance agencies amounted to $3,983,724, or 0.3% of net assets. |
| 9 | Collateral segregated with brokers for swap contracts, amounting to a market value of $3,809,872, or 0.3% of net assets. |
| 10 | Some or all of this security is held as collateral for futures contracts, amounting to a market value of $2,852,169, or 0.2% of net assets. |
| 11 | Represents yield to maturity at October 31, 2011. |
| 12 | Collateral received from brokers for securities lending was invested in this short-term investment. |
| 13 | Yield shown represents the October 31, 2011, seven-day average yield, which refers to the sum of the previous seven days’ dividends paid, expressed as an annual percentage. |
Investments Definitions and Abbreviations:
| | |
| AGM: | | Assured Guaranty Municipal Corp. |
| EMTN: | | European Medium Term Note |
| FHLMC: | | Federal Home Loan Mortgage Corp. |
| FNMA: | | Federal National Mortgage Corp. |
| GMTN: | | Global Medium Term Note |
| GNMA: | | Government National Mortgage Association |
| LIBOR: | | London Interbank Offered Rate |
| MTN: | | Medium Term Note |
| NATL-RE: | | National Public Finance Guarantee Corp. |
| RBS: | | Royal Bank of Scotland |
| TBA: | | To Be Announced |
Currency Abbreviations have been used throughout the portfolio to indicate amounts shown in currencies other than the U.S. dollar (USD):
| | |
| BRL: | | Brazilian Real |
| CAD: | | Canadian Dollar |
| EUR: | | Euro |
| GBP: | | British Pound |
| JPY: | | Japanese Yen |
| MXN: | | Mexican Peso |
The accompanying notes are an integral part of these financial statements.
20
Managers PIMCO Bond Fund
Notes to Schedule of Portfolio Investments (continued)
The following tables summarize the inputs used to value the Fund’s net assets by the above fair value hierarchy levels as of October 31, 2011: (See Note 1 (a) in the Notes to the Financial Statements.)
| | | | | | | | | | | | | | | | |
| | | Quoted Prices in
Active Markets
for Identical
Investments Level 1 | | | Significant Other
Observable Inputs
Level 2 | | | Significant
Unobservable
Inputs Level 3 | | | Total | |
Managers PIMCO Bond Fund | | | | | | | | | | | | | | | | |
Investments in Securities | | | | | | | | | | | | | | | | |
Asset-Backed Securities | | | — | | | $ | 27,830,721 | | | | — | | | $ | 27,830,721 | |
Bank Loan Obligations | | | — | | | | 1,105,250 | | | | — | | | | 1,105,250 | |
Corporate Bonds and Notes† | | | — | | | | 394,404,415 | | | | — | | | | 394,404,415 | |
Foreign Government and Agency Obligations | | | — | | | | 51,401,752 | | | | — | | | | 51,401,752 | |
Mortgage-Backed Securities | | | — | | | | 68,930,444 | | | | — | | | | 68,930,444 | |
Municipal Bonds | | | — | | | | 51,162,597 | | | | — | | | | 51,162,597 | |
Municipal Closed-End Bond Funds | | $ | 5,993,925 | | | | — | | | | — | | | | 5,993,925 | |
Preferred Stocks | | | — | | | | 10,303,593 | | | | — | | | | 10,303,593 | |
U.S. Government and Agency Obligations† | | | — | | | | 634,949,762 | | | | — | | | | 634,949,762 | |
Purchased Swaptions | | | — | | | | 124,324 | | | | — | | | | 124,324 | |
Short-Term Investments | | | | | | | | | | | | | | | | |
Certificates of Deposit | | | — | | | | 1,098,812 | | | | — | | | | 1,098,812 | |
Commercial Paper | | | — | | | | 38,399,887 | | | | — | | | | 38,399,887 | |
Japan Treasury Bills | | | — | | | | 165,369,205 | | | | — | | | | 165,369,205 | |
Repurchase Agreements | | | — | | | | 117,500,000 | | | | — | | | | 117,500,000 | |
U.S. Treasury Bills | | | — | | | | 569,949 | | | | — | | | | 569,949 | |
Other Investment Companies | | | 13,796,703 | | | | — | | | | — | | | | 13,796,703 | |
| | | | | | | | | | | | | | | | |
Total Investments in Securities | | $ | 19,790,628 | | | $ | 1,563,150,711 | | | | — | | | $ | 1,582,941,339 | |
| | | | | | | | | | | | | | | | |
TBA Sale Commitments | | | — | | | ($ | 37,531,181 | ) | | | — | | | ($ | 37,531,181 | ) |
| | | | | | | | | | | | | | | | |
Financial Derivative Instruments-Assets†† | | | | | | | | | | | | | | | | |
Credit Contracts | | | — | | | $ | 1,242,221 | | | | — | | | $ | 1,242,221 | |
Foreign Exchange Contracts | | | — | | | | 3,268,285 | | | | — | | | | 3,268,285 | |
Interest Rate Contracts | | $ | 5,381,850 | | | | 9,476,910 | | | | — | | | | 14,858,760 | |
| | | | | | | | | | | | | | | | |
| | | 5,381,850 | | | | 13,987,416 | | | | — | | | | 19,369,266 | |
| | | | | | | | | | | | | | | | |
Financial Derivative Instruments-Liabilities†† | | | | | | | | | | | | | | | | |
Credit Contracts | | | — | | | | (1,806,001 | ) | | | — | | | | (1,806,001 | ) |
Equity Contracts | | | — | | | | (12,630 | ) | | | — | | | | (12,630 | ) |
Foreign Exchange Contracts | | | — | | | | (7,603,977 | ) | | | — | | | | (7,603,977 | ) |
Interest Rate Contracts | | | (32,677 | ) | | | (449,204 | ) | | | — | | | | (481,881 | ) |
| | | | | | | | | | | | | | | | |
| | | (32,677 | ) | | | (9,871,812 | ) | | | — | | | | (9,904,489 | ) |
| | | | | | | | | | | | | | | | |
Total Financial Derivative Instruments | | $ | 5,349,173 | | | $ | 4,115,604 | | | | — | | | $ | 9,464,777 | |
| | | | | | | | | | | | | | | | |
| † | All corporate bonds and notes and U.S. government and agency obligations held in the Fund are level 2 securities. For a detailed breakout of the corporate bonds and notes and U.S. government and agency obligations by major industry or agency classification, please refer to the Schedule of Portfolio Investments. |
| †† | Derivative instruments, such as futures, options, forwards and swap contracts, are not reflected in the Schedule of Portfolio Investments. Futures, forwards and swap contracts are valued at the unrealized appreciation/depreciation of the instrument and options are shown at value. |
As of October 31, 2011, the Fund had no significant transfers between Level 1 and Level 2 from the beginning of the reporting period.
The accompanying notes are an integral part of these financial statements.
21
Managers PIMCO Bond Fund
Notes to Schedule of Portfolio Investments (continued)
The following schedule is the fair value of derivative instruments at October 31, 2011:
| | | | | | | | | | | | |
Derivatives not accounted for as hedging instruments | | Asset Derivatives | | | Liability Derivatives | |
| | Statement of Assets and Liabilities Location | | Fair Value | | | Statement of Assets and Liabilities Location | | Fair Value | |
Credit contracts | | Unrealized appreciation on swaps | | $ | 1,213,853 | | | Unrealized depreciation on
swaps | | $ | 1,806,001 | |
Credit contracts | | — | | | — | | | Options written | | | 6,004 | |
Equity contracts | | — | | | — | | | Options written | | | 172,658 | |
Interest rate contracts | | Investments, at value (purchased
swaptions) | | | 124,324 | | | — | | | — | |
Interest rate contracts | | Unrealized appreciation on
swaps | | | 6,603,096 | | | Unrealized depreciation on
swaps | | | 368,163 | |
Interest rate contracts | | — | | | — | | | Options written | | | 1,555,791 | |
Interest rate contracts | | Variation margin receivable* | | | 953,518 | | | Variation margin payable* | | | 5,950 | |
Foreign exchange contracts | | Unrealized appreciation on
foreign currency contracts | | | 3,268,285 | | | Unrealized depreciation on
foreign currency contracts | | | 7,603,977 | |
| | | | | | | | | | | | |
Totals | | | | $ | 12,163,076 | | | | | $ | 11,518,544 | |
| | | | | | | | | | | | |
| * | Includes only the October 31, 2011 futures variation margin. Prior futures variation margin movements have been reflected in cash on the Statement of Assets and Liabilities upon receipt or payment. |
For the year ended October 31, 2011, the effect of derivative instruments on the Statement of Operations and the amount of realized gain/(loss) on derivatives recognized in income were as follows:
| | | | | | | | | | | | | | | | | | | | |
Derivatives not accounted for as hedging instruments | | Futures | | | Forward Currency
Contracts | | | Options | | | Swaps | | | Total | |
| | | | | |
Credit contracts | | | — | | | | — | | | | — | | | $ | 520,362 | | | $ | 520,362 | |
Foreign exchange contracts | | | — | | | ($ | 7,771,032 | ) | | | — | | | | — | | | | (7,771,032 | ) |
Interest rate contracts | | $ | 5,303,466 | | | | — | | | ($ | 1,975,093 | ) | | | (16,980,788 | ) | | | (13,652,415 | ) |
| | | | | | | | | | | | | | | | | | | | |
Totals | | $ | 5,303,466 | | | ($ | 7,771,032 | ) | | ($ | 1,975,093 | ) | | ($ | 16,460,426 | ) | | ($ | 20,903,085 | ) |
| | | | | | | | | | | | | | | | | | | | |
The change in unrealized gain/(loss) on derivatives recognized in income were as follows:
| | | $5,303,466 | | | | $5,303,466 | | | | $5,303,466 | | | | $5,303,466 | | | | $5,303,466 | |
Derivatives not accounted for as hedging instruments | | Futures | | | Forward Currency
Contracts | | | Options | | | Swaps | | | Total | |
| | | | | |
Credit contracts | | | — | | | | — | | | $ | 28,368 | | | ($ | 2,354,470 | ) | | ($ | 2,326,102 | ) |
Equity contracts | | | — | | | | — | | | | (12,630 | ) | | | — | | | | (12,630 | ) |
Foreign exchange contracts | | | — | | | ($ | 2,195,136 | ) | | | — | | | | — | | | | (2,195,136 | ) |
Interest rate contracts | | $ | 4,236,387 | | | | — | | | | 399,677 | | | | 4,681,857 | | | | 9,317,921 | |
| | | | | | | | | | | | | | | | | | | | |
Totals | | $ | 4,236,387 | | | ($ | 2,195,136 | ) | | $ | 415,415 | | | $ | 2,327,387 | | | $ | 4,784,053 | |
| | | | | | | | | | | | | | | | | | | | |
At October 31, 2011, the Fund had the following TBA sale commitments:
(See Note 1 (k) in the Notes to the Financial Statements.)
| | | | | | |
Principal Amount | | Security | | Current Liability | |
$36,000,000 | | FNMA, 3.500%, 11/01/40 | | $ | 36,596,250 | |
900,000 | | GNMA, 3.500%, 09/21/41 | | | 934,931 | |
| | | | | | |
Total | | | | $ | 37,531,181 | |
| | | | | | |
The accompanying notes are an integral part of these financial statements.
22
Managers PIMCO Bond Fund
Notes to Schedule of Portfolio Investments (continued)
At October 31, 2011, the Fund had the following futures contracts:
(See Note 9 in the Notes to the Financial Statements.)
| | | | | | | | | | | | | | |
Type | | Number of Contracts | | | Position | | | Expiration Date | | Unrealized Gain/(Loss) | |
90-Day Eurodollar | | | 5,169 | | | | Long | | | 12/19/11 to 03/17/14 | | $ | 5,196,601 | |
U.S. Treasury 5-Year Note | | | 212 | | | | Long | | | 12/30/11 | | | 89,916 | |
U.S. Treasury 10-Year Note | | | 99 | | | | Long | | | 12/20/11 | | | (32,677 | ) |
| | | | | | | | | | | | | | |
Total | | | | | | | | | | | | $ | 5,253,840 | |
| | | | | | | | | | | | | | |
At October 31, 2011, the Fund had the following swap contracts:
(See Note 10 in the Notes to the Financial Statements.)
| | | | | | | | | | | | | | | | | | | | | | | | | | |
Pay/Receive
Floating Rate | | Floating Rate Index | | Fixed Rate | | | Counterparty | | Maturity | | | Currency | | Notional
Amount | | | Net Premiums
Paid/(Received) | | | Unrealized
Gain/(Loss) | |
| | | | | | | | |
| | Interest Rate Swaps | | | | | | | | | | | | | | | | | | | | | | | | |
| Pay | | 1-Year BRL-CDI | | | 10.61 | % | | HSBC | | | 01/02/12 | | | BRL | | | 1,400,000 | | | | — | | | $ | 6,170 | |
| Pay | | 1-Year BRL-CDI | | | 11.67 | % | | MSC | | | 01/02/14 | | | BRL | | | 900,000 | | | $ | 702 | | | | 7,836 | |
| Pay | | 1-Year BRL-CDI | | | 11.76 | % | | CS | | | 01/02/12 | | | BRL | | | 1,700,000 | | | | 305 | | | | 18,500 | |
| Pay | | 1-Year BRL-CDI | | | 11.85 | % | | UBS | | | 01/02/13 | | | BRL | | | 9,100,000 | | | | — | | | | 76,383 | |
| Pay | | 1-Year BRL-CDI | | | 11.95 | % | | RBS | | | 01/02/13 | | | BRL | | | 5,800,000 | | | | 2,854 | | | | 70,801 | |
| Pay | | 1-Year BRL-CDI | | | 11.98 | % | | MLC | | | 01/02/12 | | | BRL | | | 5,800,000 | | | | — | | | | 132,097 | |
| Pay | | 1-Year BRL-CDI | | | 12.07 | % | | JPM | | | 01/02/13 | | | BRL | | | 13,700,000 | | | | 13,005 | | | | 193,882 | |
| Pay | | 1-Year BRL-CDI | | | 12.07 | % | | UBS | | | 01/02/13 | | | BRL | | | 4,900,000 | | | | 4,535 | | | | 92,023 | |
| Pay | | 1-Year BRL-CDI | | | 12.17 | % | | JPM | | | 01/02/13 | | | BRL | | | 38,200,000 | | | | 60,105 | | | | 749,217 | |
| Pay | | 1-Year BRL-CDI | | | 12.25 | % | | UBS | | | 01/02/14 | | | BRL | | | 7,000,000 | | | | 10,237 | | | | 165,169 | |
| Pay | | 1-Year BRL-CDI | | | 12.46 | % | | BRC | | | 01/02/13 | | | BRL | | | 2,400,000 | | | | 984 | | | | 29,199 | |
| Pay | | 1-Year BRL-CDI | | | 12.48 | % | | CS | | | 01/02/13 | | | BRL | | | 64,200,000 | | | | 50,268 | | | | 1,273,183 | |
| Pay | | 1-Year BRL-CDI | | | 12.50 | % | | MSC | | | 01/02/13 | | | BRL | | | 5,000,000 | | | | 3,184 | | | | 61,476 | |
| Pay | | 1-Year BRL-CDI | | | 12.55 | % | | RBS | | | 01/02/13 | | | BRL | | | 3,700,000 | | | | 7,250 | | | | 75,223 | |
| Pay | | 1-Year BRL-CDI | | | 14.76 | % | | HSBC | | | 01/02/12 | | | BRL | | | 300,000 | | | | 267 | | | | 19,183 | |
| Pay | | 28-Day MXN TIIE | | | 5.60 | % | | BRC | | | 09/06/16 | | | MXN | | | 61,600,000 | | | | 28,739 | | | | 1,372 | |
| Pay | | 28-Day MXN TIIE | | | 6.35 | % | | MSC | | | 06/02/21 | | | MXN | | | 4,000,000 | | | | 914 | | | | (1,619 | ) |
| Pay | | 6-Month AUD-BBR-BBSW | | | 5.00 | % | | CITI | | | 06/15/17 | | | AUD | | | 700,000 | | | | 5,101 | | | | 1,590 | |
| Pay | | 6-Month AUD-BBR-BBSW | | | 5.00 | % | | DUB | | | 06/15/17 | | | AUD | | | 400,000 | | | | 3,047 | | | | 777 | |
| Pay | | 6-Month AUD-BBR-BBSW | | | 5.00 | % | | RBS | | | 12/15/17 | | | AUD | | | 700,000 | | | | 5,396 | | | | 1,295 | |
| Pay | | 6-Month EUR-EURIBOR-
Reuters | | | 2.50 | % | | BRC | | | 03/21/22 | | | EUR | | | 3,100,000 | | | | 587 | | | | (53,930 | ) |
| Pay | | 6-Month EUR-EURIBOR-
Reuters | | | 3.00 | % | | BRC | | | 09/21/21 | | | EUR | | | 3,600,000 | | | | 32,953 | | | | 172,865 | |
The accompanying notes are an integral part of these financial statements.
23
Managers PIMCO Bond Fund
Notes to Schedule of Portfolio Investments (continued)
| | | | | | | | | | | | | | | | | | | | | | | | | | |
Pay/Receive
Floating Rate | | Floating Rate Index | | Fixed Rate | | | Counterparty | | Maturity | | | Currency | | Notional
Amount | | | Net Premiums
Paid/(Received) | | | Unrealized
Gain/
(Loss) | |
| Pay | | 6-Month EUR-EURIBOR-Reuters | | | 3.00 | % | | DUB | | | 09/21/21 | | | EUR | | | 1,300,000 | | | $ | 20,193 | | | $ | 54,070 | |
| Pay | | 6-Month EUR-EURIBOR-Reuters | | | 3.00 | % | | DUB | | | 03/21/22 | | | EUR | | | 5,200,000 | | | | 85,761 | | | | 140,518 | |
| Pay | | 6-Month EUR-EURIBOR-Reuters | | | 3.00 | % | | MSC | | | 03/21/22 | | | EUR | | | 5,200,000 | | | | 119,006 | | | | 107,273 | |
| Pay | | 6-Month EUR-EURIBOR-Reuters | | | 3.50 | % | | DUB | | | 09/21/21 | | | EUR | | | 1,100,000 | | | | 12,713 | | | | 117,810 | |
| Pay | | 6-Month EUR-EURIBOR-Reuters | | | 3.65 | % | | CITI | | | 09/21/21 | | | EUR | | | 1,400,000 | | | | 1,632 | | | | 190,403 | |
| Pay | | 6-Month EUR-EURIBOR-Reuters | | | 3.65 | % | | MSC | | | 09/21/21 | | | EUR | | | 3,700,000 | | | | 17,219 | | | | 490,301 | |
| Pay | | 6-Month GBP-LIBOR-BBA | | | 3.00 | % | | BRC | | | 03/21/22 | | | GBP | | | 17,200,000 | | | | 21,460 | | | | 437,146 | |
| Receive | | 1-Year BRL-CDI | | | 10.46 | % | | MSC | | | 01/02/13 | | | BRL | | | 700,000 | | | | (158 | ) | | | 171 | |
| Receive | | 1-Year BRL-CDI | | | 10.58 | % | | UBS | | | 01/02/12 | | | BRL | | | 1,300,000 | | | | 2,658 | | | | (14,209 | ) |
| Receive | | 1-Year BRL-CDI | | | 10.58 | % | | MSC | | | 01/02/14 | | | BRL | | | 24,000,000 | | | | (50,434 | ) | | | 29,912 | |
| Receive | | 1-Year BRL-CDI | | | 10.77 | % | | UBS | | | 01/02/14 | | | BRL | | | 4,300,000 | | | | (5,048 | ) | | | 9,696 | |
| Receive | | 1-Year BRL-CDI | | | 12.20 | % | | JPM | | | 01/02/14 | | | BRL | | | 8,100,000 | | | | (577 | ) | | | 194,990 | |
| Receive | | 1-Year BRL-CDI | | | 12.54 | % | | BRC | | | 01/02/12 | | | BRL | | | 3,400,000 | | | | (5 | ) | | | 111,304 | |
| Receive | | 1-Year BRL-CDI | | | 12.54 | % | | MLC | | | 01/02/12 | | | BRL | | | 7,300,000 | | | | (354 | ) | | | 239,320 | |
| Receive | | 1-Year BRL-CDI | | | 12.54 | % | | MSC | | | 01/02/14 | | | BRL | | | 4,000,000 | | | | (2,451 | ) | | | 74,247 | |
| Receive | | 1-Year-OIS-USD-FEDERAL FUNDS RATE | | | 0.50 | % | | GS | | | 09/19/14 | | | USD | | | 3,600,000 | | | | (14,186 | ) | | | 26,735 | |
| Receive | | 1-Year-OIS-USD-FEDERAL FUNDS RATE | | | 0.50 | % | | MSC | | | 09/19/13 | | | USD | | | 17,600,000 | | | | (19,701 | ) | | | 82,299 | |
| Receive | | 6-Month EUR-EURIBOR-Reuters | | | 2.50 | % | | BRC | | | 09/21/18 | | | EUR | | | 1,100,000 | | | | (17,905 | ) | | | 44,562 | |
| Receive | | 6-Month EUR-EURIBOR-Reuters | | | 2.50 | % | | CITI | | | 03/21/12 | | | EUR | | | 4,700,000 | | | | (1,636 | ) | | | (79,240 | ) |
| Receive | | 6-Month EUR-EURIBOR-Reuters | | | 2.50 | % | | GS | | | 03/21/22 | | | EUR | | | 6,200,000 | | | | (6,608 | ) | | | (100,079 | ) |
| Receive | | 6-Month EUR-EURIBOR-Reuters | | | 2.50 | % | | UBS | | | 03/21/22 | | | EUR | | | 7,000,000 | | | | (1,367 | ) | | | (119,086 | ) |
| Receive | | 6-Month EUR-EURIBOR-Reuters | | | 3.50 | % | | GS | | | 09/21/21 | | | EUR | | | 8,000,000 | | | | (82,182 | ) | | | 1,031,826 | |
| Receive | | 6-Month EUR-EURIBOR-Reuters | | | 3.50 | % | | MSC | | | 09/21/21 | | | EUR | | | 600,000 | | | | (1,252 | ) | | | 72,272 | |
| | | | | | | | | | | | | | | | | | | | | | | | | | |
| Totals | | | | | | | | | | | | | | | | | | | | $ | 307,211 | | | $ | 6,234,933 | |
| | | | | | | | | | | | | | | | | | | | | | | | | | |
| | | | | | | | | | | | | | | | | | | | | | | | | | | | | | | | |
Pay/Receive Floating Rate | | Reference Entity | | Fixed Rate | | | Counterparty | | Maturity | | | Rating≠≠ | | | Currency | | | Notional Amount | | | Net Premiums
Paid/(Received) | | | Unrealized
Gain/(Loss) | |
| | Credit Default Swaps-Sell Protection≠ | | | | | | | | | | | | | | | | | | | | | | | | | | | | | | |
| Pay | | CDX.EM.12 Index | | | 5.00 | % | | DUB | | | 12/20/14 | | | | N/A | | | | USD | | | $ | 1,000,000 | | | $ | 62,187 | | | $ | 19,108 | |
| Pay | | CDX.EM.13 Index | | | 5.00 | % | | BRC | | | 06/20/15 | | | | N/A | | | | USD | | | | 2,700,000 | | | | 154,915 | | | | 104,252 | |
| Pay | | CDX.EM.13 Index | | | 5.00 | % | | CS | | | 06/20/15 | | | | N/A | | | | USD | | | | 1,000,000 | | | | 83,125 | | | | 13,002 | |
| Pay | | CDX.EM.13 Index | | | 5.00 | % | | DUB | | | 06/20/15 | | | | N/A | | | | USD | | | | 5,800,000 | | | | 520,489 | | | | 37,044 | |
The accompanying notes are an integral part of these financial statements.
24
Managers PIMCO Bond Fund
Notes to Schedule of Portfolio Investments (continued)
| | | | | | | | | | | | | | | | | | | | | | | | | | | | | | |
Pay/Receive Floating Rate | | Reference Entity | | Fixed Rate | | | Counterparty | | Maturity | | | Rating≠≠ | | Currency | | | Notional Amount | | | Net Premiums
Paid/(Received) | | | Unrealized
Gain/(Loss) | |
| Pay | | CDX.EM.13 Index | | | 5.00 | % | | JPM | | | 06/20/15 | | | N/A | | | USD | | | $ | 4,600,000 | | | $ | 396,172 | | | $ | 46,010 | |
| Pay | | CDX.EM.14 Index | | | 5.00 | % | | BRC | | | 12/20/15 | | | N/A | | | USD | | | | 800,000 | | | | 50,333 | | | | 32,311 | |
| Pay | | CDX.EM.14 Index | | | 5.00 | % | | DUB | | | 12/20/15 | | | N/A | | | USD | | | | 3,900,000 | | | | 401,375 | | | | 1,514 | |
| Pay | | CDX.EM.14 Index | | | 5.00 | % | | JPM | | | 12/20/15 | | | N/A | | | USD | | | | 5,700,000 | | | | 635,655 | | | | (46,817 | ) |
| Pay | | CDX.EM.14 Index | | | 5.00 | % | | UBS | | | 12/20/15 | | | N/A | | | USD | | | | 300,000 | | | | 32,987 | | | | (1,995 | ) |
| Pay | | CDX.EM.15 Index | | | 5.00 | % | | BRC | | | 06/20/16 | | | N/A | | | USD | | | | 600,000 | | | | 61,353 | | | | 4,020 | |
| Pay | | CDX.EM.15 Index | | | 5.00 | % | | DUB | | | 06/20/16 | | | N/A | | | USD | | | | 1,000,000 | | | | 119,605 | | | | (10,651 | ) |
| Pay | | China Government | | | 1.00 | % | | CITI | | | 06/20/16 | | | AA- | | | USD | | | | 1,900,000 | | | | 18,808 | | | | (33,646 | ) |
| Pay | | China Government | | | 1.00 | % | | DUB | | | 06/20/16 | | | AA- | | | USD | | | | 400,000 | | | | 2,060 | | | | (6,129 | ) |
| Pay | | China Government | | | 1.00 | % | | DUB | | | 09/20/16 | | | AA- | | | USD | | | | 500,000 | | | | 4,406 | | | | (8,311 | ) |
| Pay | | China Government | | | 1.00 | % | | GS | | | 09/20/16 | | | AA- | | | USD | | | | 100,000 | | | | 510 | | | | (1,527 | ) |
| Pay | | China Government | | | 1.00 | % | | JPM | | | 09/20/16 | | | AA- | | | USD | | | | 500,000 | | | | 2,495 | | | | (7,581 | ) |
| Pay | | China Government | | | 1.00 | % | | JPM | | | 09/20/16 | | | AA- | | | USD | | | | 400,000 | | | | 1,892 | | | | (5,961 | ) |
| Pay | | China Government | | | 1.00 | % | | JPM | | | 06/20/16 | | | AA- | | | USD | | | | 800,000 | | | | 7,937 | | | | (14,185 | ) |
| Pay | | China Government | | | 1.00 | % | | RBS | | | 06/20/15 | | | AA- | | | USD | | | | 1,900,000 | | | | 22,583 | | | | (22,668 | ) |
| Pay | | China Government | | | 1.00 | % | | RBS | | | 06/20/16 | | | AA- | | | USD | | | | 700,000 | | | | 6,789 | | | | (12,256 | ) |
| Pay | | Japan Government | | | 1.00 | % | | JPM | | | 03/20/16 | | | AA- | | | USD | | | | 1,000,000 | | | | 7,438 | | | | (1,940 | ) |
| Pay | | Republic of Korea | | | 1.00 | % | | DUB | | | 06/20/16 | | | A | | | USD | | | | 400,000 | | | | 174 | | | | (5,393 | ) |
| Pay | | Republic of Korea | | | 1.00 | % | | DUB | | | 06/20/16 | | | A | | | USD | | | | 300,000 | | | | 196 | | | | (4,110 | ) |
| Pay | | United Kingdom Gilt | | | 1.00 | % | | CITI | | | 12/20/16 | | | AAA | | | USD | | | | 6,500,000 | | | | 25,362 | | | | 37,040 | |
| Pay | | United Kingdom Gilt | | | 1.00 | % | | DUB | | | 03/20/16 | | | AAA | | | USD | | | | 400,000 | | | | 6,616 | | | | (1,291 | ) |
| Pay | | United Kingdom Gilt | | | 1.00 | % | | GS | | | 12/20/16 | | | AAA | | | USD | | | | 4,300,000 | | | | 12,573 | | | | 28,708 | |
| Pay | | United Kingdom Gilt | | | 1.00 | % | | JPM | | | 03/20/15 | | | AAA | | | USD | | | | 300,000 | | | | 942 | | | | 3,936 | |
| Pay | | United Kingdom Gilt | | | 1.00 | % | | JPM | | | 03/20/15 | | | AAA | | | USD | | | | 400,000 | | | | 1,130 | | | | 5,374 | |
| Pay | | United Kingdom Gilt | | | 1.00 | % | | JPM | | | 06/20/15 | | | AAA | | | USD | | | | 3,900,000 | | | | 31,640 | | | | 29,603 | |
| Pay | | United Kingdom Gilt | | | 1.00 | %�� | | JPM | | | 12/20/15 | | | AAA | | | USD | | | | 1,000,000 | | | | 18,540 | | | | (3,930 | ) |
| Pay | | United Kingdom Gilt | | | 1.00 | % | | MSC | | | 06/20/16 | | | AAA | | | USD | | | | 1,800,000 | | | | 28,748 | | | | (7,016 | ) |
| Pay | | United Kingdom Gilt | | | 1.00 | % | | UBS | | | 06/20/16 | | | AAA | | | USD | | | | 900,000 | | | | 14,374 | | | | (3,508 | ) |
| Receive | | Ally Financial, Inc. | | | 5.00 | % | | DUB | | | 12/20/16 | | | B+ | | | USD | | | | 3,300,000 | | | | (87,925 | ) | | | 17,878 | |
| Receive | | Arcelormittal | | | 1.00 | % | | CS | | | 06/20/16 | | | BBB- | | | USD | | | | 500,000 | | | | (22,705 | ) | | | (48,944 | ) |
| Receive | | Brazil Federative Republic Bond | | | 1.00 | % | | CITI | | | 06/20/16 | | | BBB- | | | USD | | | | 7,300,000 | | | | (19,882 | ) | | | (70,254 | ) |
The accompanying notes are an integral part of these financial statements.
25
Managers PIMCO Bond Fund
Notes to Schedule of Portfolio Investments (continued)
| | | | | | | | | | | | | | | | | | | | | | | | | | | | |
Pay/Receive Floating Rate | | Reference Entity | | Fixed Rate | | | Counterparty | | Maturity | | | Rating≠≠ | | Currency | | Notional Amount | | | Net Premiums
Paid/(Received) | | | Unrealized
Gain/
(Loss) | |
| Receive | | Brazil Federative Republic Bond | | | 1.00 | % | | CS | | | 06/20/15 | | | BBB- | | USD | | $ | 2,200,000 | | | ($ | 39,658 | ) | | $ | 32,723 | |
| Receive | | Brazil Federative Republic Bond | | | 1.00 | % | | DUB | | | 06/20/16 | | | BBB- | | USD | | | 1,400,000 | | | | (4,292 | ) | | | (12,994 | ) |
| Receive | | Brazil Federative Republic Bond | | | 1.00 | % | | JPM | | | 09/20/15 | | | BBB- | | USD | | | 1,400,000 | | | | (12,099 | ) | | | 5,074 | |
| Receive | | Brazil Federative Republic Bond | | | 1.00 | % | | JPM | | | 09/20/16 | | | BBB- | | USD | | | 500,000 | | | | (2,896 | ) | | | (4,632 | ) |
| Receive | | Brazil Federative Republic Bond | | | 1.00 | % | | UBS | | | 09/20/15 | | | BBB- | | USD | | | 1,000,000 | | | | (7,325 | ) | | | 2,307 | |
| Receive | | Brazil Federative Republic Bond | | | 1.52 | % | | MSC | | | 01/20/17 | | | BBB- | | USD | | | 3,000,000 | | | | — | | | | 31,391 | |
| Receive | | Brazil Federative Republic Bond | | | 1.95 | % | | MSC | | | 08/20/16 | | | BBB- | | USD | | | 3,500,000 | | | | — | | | | 113,035 | |
| Receive | | China Government | | | 1.00 | % | | MSC | | | 06/20/16 | | | AA- | | USD | | | 10,300,000 | | | | (310,646 | ) | | | 230,208 | |
| Receive | | French Republic Government | | | 0.25 | % | | BRC | | | 09/20/16 | | | AAA | | USD | | | 200,000 | | | | (11,736 | ) | | | (1,701 | ) |
| Receive | | French Republic Government | | | 0.25 | % | | GS | | | 06/20/16 | | | AAA | | USD | | | 3,000,000 | | | | (70,483 | ) | | | (117,237 | ) |
| Receive | | French Republic Government | | | 0.25 | % | | RBS | | | 12/20/15 | | | AAA | | USD | | | 1,000,000 | | | | (15,871 | ) | | | (37,297 | ) |
| Receive | | French Republic Government | | | 0.25 | % | | RBS | | | 03/20/16 | | | AAA | | USD | | | 1,000,000 | | | | (28,695 | ) | | | (29,197 | ) |
| Receive | | French Republic Government | | | 0.25 | % | | UBS | | | 09/20/16 | | | AAA | | USD | | | 1,000,000 | | | | (47,405 | ) | | | (19,779 | ) |
| Receive | | General Electric Capital Corp. | | | 1.00 | % | | DUB | | | 03/20/16 | | | AA+ | | USD | | | 300,000 | | | | (13,511 | ) | | | (1,429 | ) |
| Receive | | General Electric Capital Corp. | | | 1.00 | % | | MSC | | | 06/20/16 | | | AA+ | | USD | | | 700,000 | | | | (2,412 | ) | | | (34,759 | ) |
| Receive | | Italian Republic Government | | | 1.00 | % | | DUB | | | 06/20/16 | | | A | | USD | | | 900,000 | | | | (20,864 | ) | | | (97,782 | ) |
| Receive | | Italian Republic Government | | | 1.00 | % | | GS | | | 06/20/16 | | | A | | USD | | | 1,000,000 | | | | (17,493 | ) | | | (114,335 | ) |
| Receive | | Italian Republic Government | | | 1.00 | % | | RBS | | | 03/20/16 | | | A | | USD | | | 5,000,000 | | | | (164,247 | ) | | | (463,450 | ) |
| Receive | | MetLife, Inc. | | | 1.00 | % | | JPM | | | 03/20/16 | | | A- | | USD | | | 6,400,000 | | | | (130,431 | ) | | | (296,749 | ) |
| Receive | | Mexico Government | | | 1.00 | % | | BRC | | | 03/20/15 | | | BBB | | USD | | | 700,000 | | | | (10,401 | ) | | | 10,092 | |
| Receive | | Mexico Government | | | 1.00 | % | | CITI | | | 06/20/16 | | | BBB | | USD | | | 9,800,000 | | | | (2,367 | ) | | | (111,252 | ) |
| Receive | | Mexico Government | | | 1.00 | % | | DUB | | | 03/20/15 | | | BBB | | USD | | | 1,100,000 | | | | (16,680 | ) | | | 16,194 | |
| Receive | | Mexico Government | | | 1.00 | % | | DUB | | | 03/20/16 | | | BBB | | USD | | | 2,400,000 | | | | (15,221 | ) | | | (6,537 | ) |
| Receive | | Mexico Government | | | 1.00 | % | | GS | | | 06/20/16 | | | BBB | | USD | | | 8,400,000 | | | | (278,182 | ) | | | 180,795 | |
| Receive | | Mexico Government | | | 1.00 | % | | MSC | | | 09/20/16 | | | BBB | | USD | | | 600,000 | | | | (2,644 | ) | | | (5,824 | ) |
| Receive | | Mexico Government | | | 1.00 | % | | UBS | | | 09/20/15 | | | BBB | | USD | | | 1,000,000 | | | | (10,951 | ) | | | 6,451 | |
| Receive | | Republic of Indonesia | | | 1.00 | % | | MSC | | | 09/20/16 | | | BB+ | | USD | | | 2,700,000 | | | | (202,456 | ) | | | 105,138 | |
| Receive | | Republic of Indonesia | | | 1.00 | % | | MSC | | | 06/20/21 | | | BB+ | | USD | | | 1,000,000 | | | | (154,532 | ) | | | 61,756 | |
| Receive | | Republic of Indonesia | | | 1.00 | % | | UBS | | | 09/20/16 | | | BB+ | | USD | | | 300,000 | | | | (4,505 | ) | | | (6,308 | ) |
| Receive | | Republic of Kazakhstan | | | 1.00 | % | | DUB | | | 03/20/16 | | | BBB | | USD | | | 1,000,000 | | | | (25,842 | ) | | | (22,030 | ) |
| Receive | | Spain Government | | | 1.00 | % | | CITI | | | 06/20/16 | | | AA- | | USD | | | 2,000,000 | | | | (124,628 | ) | | | (63,905 | ) |
The accompanying notes are an integral part of these financial statements.
26
Managers PIMCO Bond Fund
Notes to Schedule of Portfolio Investments (continued)
| | | | | | | | | | | | | | | | | | | | | | | | | | | | |
Pay/Receive Floating Rate | | Reference Entity | | Fixed Rate | | | Counterparty | | Maturity | | | Rating≠≠ | | Currency | | Notional
Amount | | | Net Premiums
Paid/(Received) | | | Unrealized
Gain/(Loss) | |
| Receive | | Spain Government | | | 1.00 | % | | GS | | | 06/20/16 | | | AA- | | USD | | $ | 1,000,000 | | | ($ | 53,575 | ) | | ($ | 40,691 | ) |
| Receive | | U.S. Treasury Notes | | | 0.25 | % | | UBS | | | 09/20/15 | | | AA+ | | EUR | | | 5,000,000 | | | | (55,524 | ) | | | 38,889 | |
| | | | | | | | | | | | | | | | | | | | | | | | | | | | |
| | | | | | | | | | | | | | | | | | | Totals | | | $ | 745,325 | | | ($ | 592,148 | ) |
| | | | | | | | | | | | | | | | | | | | | | | | | | | | |
| ≠ | If the Fund is a seller of protection and a credit event occurs, as defined under the terms of that particular swap agreement, the Fund will either (a) pay to the buyer of protection an amount equal to the notional amount of the swap and take delivery of the referenced obligation, or (b) pay a net settlement in the form of cash or securities equal to the notional amount of the swap less the recovery of the referenced obligation. |
| ≠≠ | The period end reference entity ratings are included in the equivalent S&P “unaudited” rating category. The reference entity rating represents the likelihood of a potential credit event on the reference entity which would result in a related payment by the Fund. |
At October 31, 2011, the Fund had the following written put and call options, swaptions and inflation floors:
(See Note 10 in the Notes to the Financial Statements.)
| | | | | | | | | | | | | | | | | | | | | | | | | | |
Pay/Receive Floating rate | | Description | | Counterparty | | Floating Rate Index | | Exercise
Rate | | | Expiration
date | | | Notional
Amount | | | Premium | | | Unrealized
Gain/
(Loss) | |
Interest Rate Swaptions | | | | | | | | | | | | | | | | | | | | | | | | |
| Receive | | 1-Year Interest Rate Swap (Put) | | RBS | | 3-Month USD-LIBOR | | | 1.750 | % | | | 11/19/12 | | | $ | 22,800,000 | | | $ | 86,070 | | | $ | 72,370 | |
| Receive | | 1-Year Interest Rate Swap (Put) | | DUB | | 3-Month USD-LIBOR | | | 1.750 | % | | | 07/11/13 | | | | 89,900,000 | | | | 422,136 | | | | 263,475 | |
| Receive | | 1-Year Interest Rate Swap (Put) | | RBS | | 3-Month USD-LIBOR | | | 2.000 | % | | | 04/30/12 | | | | 34,600,000 | | | | 69,200 | | | | 63,632 | |
| Receive | | 2-Year Interest Rate Swap (Put) | | DUB | | 3-Month USD-LIBOR | | | 1.200 | % | | | 07/11/13 | | | | 13,400,000 | | | | 94,574 | | | | (10,476 | ) |
| Receive | | 2-Year Interest Rate Swap (Put) | | RBS | | 3-Month USD-LIBOR | | | 2.250 | % | | | 09/24/12 | | | | 74,000,000 | | | | 577,731 | | | | 521,960 | |
| Receive | | 3-Year Interest Rate Swap (Put) | | DUB | | 3-Month USD-LIBOR | | | 1.000 | % | | | 08/13/12 | | | | 4,900,000 | | | | 50,348 | | | | 13,618 | |
| Receive | | 3-Year Interest Rate Swap (Put) | | DUB | | 3-Month USD-LIBOR | | | 2.750 | % | | | 06/18/12 | | | | 17,300,000 | | | | 179,584 | | | | 172,183 | |
| Receive | | 3-Year Interest Rate Swap (Put) | | RBS | | 3-Month USD-LIBOR | | | 2.750 | % | | | 06/18/12 | | | | 14,600,000 | | | | 143,080 | | | | 136,834 | |
| Receive | | 3-Year Interest Rate Swap (Put) | | DUB | | 3-Month USD-LIBOR | | | 3.000 | % | | | 06/18/12 | | | | 14,000,000 | | | | 152,410 | | | | 148,136 | |
| Receive | | 3-Year Interest Rate Swap (Put) | | JPM | | 3-Month USD-LIBOR | | | 3.000 | % | | | 06/18/12 | | | | 37,200,000 | | | | 376,477 | | | | 365,120 | |
| Receive | | 3-Year Interest Rate Swap (Put) | | RBS | | 3-Month USD-LIBOR | | | 3.000 | % | | | 06/18/12 | | | | 45,100,000 | | | | 415,009 | | | | 401,239 | |
| Receive | | 5-Year Interest Rate Swap (Put) | | CITI | | 3-Month USD-LIBOR | | | 1.700 | % | | | 08/13/12 | | | | 28,300,000 | | | | 488,175 | | | | 44,175 | |
| Receive | | 5-Year Interest Rate Swap (Put) | | DUB | | 3-Month USD-LIBOR | | | 1.700 | % | | | 08/13/12 | | | | 16,700,000 | | | | 233,170 | | | | (28,837 | ) |
| Receive | | 5-Year Interest Rate Swap (Put) | | RBS | | 3-Month USD-LIBOR | | | 1.700 | % | | | 08/13/12 | | | | 23,000,000 | | | | 319,120 | | | | (41,728 | ) |
| Receive | | 5-Year Interest Rate Swap (Put) | | RBS | | 3-Month USD-LIBOR | | | 3.250 | % | | | 07/16/12 | | | | 3,700,000 | | | | 92,907 | | | | 87,239 | |
| Receive | | 10-Year Interest Rate Swap
(Put) | | DUB | | 3-Month USD-LIBOR | | | 10.000 | % | | | 07/10/12 | | | | 78,800,000 | | | | 547,660 | | | | 547,652 | |
| | | | | | | | | | | | | | | | | | | | | | | | | | |
| Totals | | | | | | | | | | | | | | | | | | | | $ | 4,247,651 | | | $ | 2,756,592 | |
| | | | | | | | | | | | | | | | | | | | | | | | | | |
The accompanying notes are an integral part of these financial statements.
27
Managers PIMCO Bond Fund
Notes to Schedule of Portfolio Investments (continued)
| | | | | | | | | | | | | | | | | | | | | | | | | | |
Pay/Receive Floating rate | | Description | | Counterparty | | Floating Rate Index | | Exercise
Rate | | | Expiration
date | | | Notional
Amount | | | Premium | | | Unrealized
Gain/(Loss) | |
Credit Default Swaptions | | | | | | | | | | | | | | | | | | | | | | | | |
| Receive | | 5-Year Credit Default Swap (Call) | | MSC | | CDX.EM.16 Index | | | 0.800 | % | | | 12/21/11 | | | $ | 8,600,000 | | | $ | 10,090 | | | $ | 8,978 | |
| Receive | | 5-Year Credit Default Swap (Call) | | DUB | | CDX.EM.16 Index | | | 0.820 | % | | | 12/21/11 | | | | 3,900,000 | | | | 5,362 | | | | 4,691 | |
| Receive | | 5-Year Credit Default Swap (Call) | | CS | | CDX.EM.16 Index | | | 0.820 | % | | | 12/21/11 | | | | 4,100,000 | | | | 5,740 | | | | 5,034 | |
| Receive | | 5-Year Credit Default Swap (Call) | | JPM | | CDX.EM.16 Index | | | 0.840 | % | | | 12/21/11 | | | | 3,900,000 | | | | 4,875 | | | | 3,994 | |
| Receive | | 5-Year Credit Default Swap (Call) | | MSC | | CDX.EM.16 Index | | | 1.000 | % | | | 12/21/11 | | | | 900,000 | | | | 1,925 | | | | 792 | |
| Receive | | 5-Year Credit Default Swap (Call) | | MSC | | CDX.EM.16 Index | | | 1.500 | % | | | 12/21/11 | | | | 900,000 | | | | 6,380 | | | | 4,879 | |
| | | | | | | | | | | | | | | | | | | | | | | | | | |
| | | | | | | | | | | | | | | | | Totals | | | $ | 34,372 | | | $ | 28,368 | |
| | | | | | | | | | | | | | | | | | | | | | | | | | |
| | | | | | | | | | | | | | | | | | | | | | | | |
Description | | Counterparty | | | Strike
Index | | | Expiration
date | | | Notional
Amount | | | Premium | | | Unrealized
Gain/(Loss) | |
Inflation Floor | | | | | | | | | | | | | | | | | | | | | | | | |
Inflation Floor—OTC CPURNSA Index | | | DUB | | | $ | 215.949 | | | | 03/10/20 | | | $ | 11,400,000 | | | $ | 85,500 | | | $ | 36,181 | |
| | | | | | | | | | | | | | | | | | | | | | | | |
| | | | | | | | | | | | | | | | | | | | | | | | |
Description | | Counterparty | | | Exercise
Price | | | Expiration
date | | | Notional
Amount | | | Premium | | | Unrealized
Gain/(Loss) | |
Swaption Straddle Options | | | | | | | | | | | | | | | | | | | | | | | | |
2-Year OTC Option on 2-Year Swap Straddle vs. Forward Volatility Agreement | | | MLC | | | | TBD | | | | 11/14/12 | | | $ | 14,700,000 | | | $ | 160,028 | | | ($ | 12,630 | ) |
| | | | | | | | | | | | | | | | | | | | | | | | |
| | | | | | | | | | | | | | | | | | | | |
Description | | Exercise
Price | | | Expiration
date | | | Number of
Contracts | | | Premium | | | Unrealized
Gain/(Loss) | |
Options on Exchange-Traded Futures | | | | | | | | | | | | | | | | | | | | |
1-Year Euro-Dollar Mid-Curve Futures (Put) | | $ | 99.00 | | | | 03/19/12 | | | | 137 | | | $ | 110,745 | | | $ | 95,332 | |
| | | | | | | | | | | | | | | | | | | | |
Transactions in written put and call options and swaptions for the fiscal year ended October 31, 2011, were as follows:
(See Note 10 in the Notes to the Financial Statements.)
| | | | | | | | | | | | | | | | |
| | | | | | Number of
Contracts | | | Notional Amount | | | Amount of
Premiums | |
Options and swaptions outstanding at October 31, 2010 | | | | | | | 422 | | | $ | 516,400,000 | | | $ | 4,352,542 | |
Options and swaptions written | | | | | | | 1,112 | | | | 528,200,000 | | | | 3,199,051 | |
Options and swaptions exercised/expired/closed | | | | | | | (1,397 | ) | | | (477,900,000 | ) | | | (2,913,297 | ) |
| | | | | | | | | | | | | | | | |
Options and swaptions outstanding at October 31, 2011 | | | Totals | | | | 137 | | | $ | 566,700,000 | | | $ | 4,638,296 | |
| | | | | | | | | | | | | | | | |
The accompanying notes are an integral part of these financial statements.
28
Managers PIMCO Bond Fund
Notes to Schedule of Portfolio Investments (continued)
At October 31, 2011, the Fund had the following forward foreign currency contracts (in U.S. Dollars):
(See Note 8 in the Notes to the Financial Statements.)
| | | | | | | | | | | | | | | | | | | | |
Foreign Currency | | Position | | | Settlement Date | | Counterparty | | Receivable
Amount | | | Payable
Amount | | | Unrealized
Gain/ (Loss) | |
Brazilian Real | | | Long | | | 11/03/11 | | BRC | | $ | 19,624,584 | | | $ | 20,402,411 | | | | ($777,827 | ) |
Brazilian Real | | | Long | | | 11/03/11 | | JPM | | | 1,955,412 | | | | 1,925,387 | | | | 30,025 | |
Brazilian Real | | | Long | | | 01/04/12 | | MSC | | | 16,869,523 | | | | 16,536,850 | | | | 332,673 | |
British Pound | | | Long | | | 12/08/11 | | GS | | | 525,579 | | | | 507,023 | | | | 18,556 | |
Canadian Dollar | | | Long | | | 11/17/11 | | CITI | | | 646,853 | | | | 649,105 | | | | (2,252 | ) |
Chinese Yuan Renminbi | | | Long | | | 11/15/11 | | CITI | | | 4,437,689 | | | | 4,362,755 | | | | 74,934 | |
Chinese Yuan Renminbi | | | Long | | | 06/01/12 | | CITI | | | 497,494 | | | | 500,000 | | | | (2,506 | ) |
Chinese Yuan Renminbi | | | Long | | | 11/15/11 to 06/01/12 | | JPM | | | 9,681,281 | | | | 9,593,880 | | | | 87,401 | |
Chinese Yuan Renminbi | | | Long | | | 06/01/12 | | JPM | | | 1,589,698 | | | | 1,600,000 | | | | (10,302 | ) |
Chinese Yuan Renminbi | | | Long | | | 06/01/12 | | BRC | | | 1,109,119 | | | | 1,100,000 | | | | 9,119 | |
Chinese Yuan Renminbi | | | Long | | | 06/01/12 | | MSC | | | 1,809,100 | | | | 1,800,000 | | | | 9,100 | |
Euro | | | Long | | | 01/17/12 | | BRC | | | 9,451,210 | | | | 9,453,629 | | | | (2,419 | ) |
Euro | | | Long | | | 01/17/12 | | DUB | | | 12,623,741 | | | | 12,717,129 | | | | (93,388 | ) |
Euro | | | Long | | | 01/17/12 | | RBC | | | 226,807 | | | | 225,611 | | | | 1,196 | |
Euro | | | Long | | | 01/17/12 | | UBS | | | 1,117,439 | | | | 1,117,634 | | | | (195 | ) |
Indian Rupee | | | Long | | | 11/18/11 to 07/12/12 | | JPM | | | 4,868,218 | | | | 5,232,434 | | | | (364,216 | ) |
Indonesian Rupiah | | | Long | | | 01/31/12 | | CITI | | | 1,224,770 | | | | 1,206,933 | | | | 17,837 | |
Malaysian Ringgit | | | Long | | | 11/10/11 | | CITI | | | 2,560,997 | | | | 2,557,496 | | | | 3,501 | |
Malaysian Ringgit | | | Long | | | 04/23/12 | | JPM | | | 2,547,908 | | | | 2,592,069 | | | | (44,161 | ) |
Mexican Peso | | | Long | | | 11/18/11 | | CITI | | | 12,536,987 | | | | 14,182,706 | | | | (1,645,719 | ) |
Mexican Peso | | | Long | | | 11/18/11 | | DUB | | | 108,430 | | | | 123,097 | | | | (14,667 | ) |
Mexican Peso | | | Long | | | 11/18/11 | | UBS | | | 16,103 | | | | 16,190 | | | | (87 | ) |
Philippine Peso | | | Long | | | 11/15/11 | | DUB | | | 309,668 | | | | 300,000 | | | | 9,668 | |
Philippine Peso | | | Long | | | 11/15/11 | | GS | | | 205,836 | | | | 200,000 | | | | 5,836 | |
Philippine Peso | | | Long | | | 11/15/11 | | JPM | | | 224,090 | | | | 212,889 | | | | 11,201 | |
Philippine Peso | | | Long | | | 11/15/11 | | JRC | | | 517,965 | | | | 500,000 | | | | 17,965 | |
Philippine Peso | | | Long | | | 11/15/11 to 03/15/12 | | CITI | | | 5,263,414 | | | | 5,159,363 | | | | 104,051 | |
Philippine Peso | | | Long | | | 03/15/12 | | MSC | | | 1,009,657 | | | | 994,236 | | | | 15,421 | |
Singapore Dollar | | | Long | | | 12/09/11 | | CITI | | | 5,076,095 | | | | 5,283,252 | | | | (207,157 | ) |
Singapore Dollar | | | Long | | | 12/09/11 | | CITI | | | 505,105 | | | | 502,921 | | | | 2,184 | |
The accompanying notes are an integral part of these financial statements.
29
Managers PIMCO Bond Fund
Notes to Schedule of Portfolio Investments (continued)
| | | | | | | | | | | | | | | | | | | | |
Foreign Currency | | Position | | | Settlement Date | | Counterparty | | Receivable
Amount | | | Payable
Amount | | | Unrealized
Gain/ (Loss) | |
Singapore Dollar | | | Long | | | 12/09/11 | | RBS | | $ | 1,354,796 | | | $ | 1,406,586 | | | | ($51,790 | ) |
Singapore Dollar | | | Long | | | 12/09/11 | | UBS | | | 1,036,021 | | | | 1,073,756 | | | | (37,735 | ) |
South African Rand | | | Long | | | 01/26/12 | | JPM | | | 283,632 | | | | 312,593 | | | | (28,961 | ) |
South Korean Won | | | Long | | | 11/14/11 | | JPM | | | 12,273,422 | | | | 12,779,907 | | | | (506,485 | ) |
Taiwan Dollar | | | Long | | | 01/11/12 | | CITI | | | 792,288 | | | | 824,888 | | | | (32,600 | ) |
Brazilian Real | | | Short | | | 11/03/11 | | BRC | | | 2,000,000 | | | | 2,024,240 | | | | (24,240 | ) |
Brazilian Real | | | Short | | | 11/03/11 | | MSC | | | 18,543,089 | | | | 18,939,067 | | | | (395,978 | ) |
Brazilian Real | | | Short | | | 11/03/11 to 01/04/12 | | UBS | | | 1,900,000 | | | | 1,963,068 | | | | (63,068 | ) |
Brazilian Real | | | Short | | | 01/04/12 | | JPM | | | 1,900,985 | | | | 1,927,774 | | | | (26,789 | ) |
British Pound | | | Short | | | 12/08/11 | | BRC | | | 26,301,195 | | | | 26,484,667 | | | | (183,472 | ) |
British Pound | | | Short | | | 12/08/11 | | CITI | | | 1,273,088 | | | | 1,298,678 | | | | (25,590 | ) |
Canadian Dollar | | | Short | | | 11/17/11 | | BNY | | | 4,120,567 | | | | 4,277,253 | | | | (156,686 | ) |
Canadian Dollar | | | Short | | | 11/17/11 | | BRC | | | 2,357,959 | | | | 2,452,025 | | | | (94,066 | ) |
Canadian Dollar | | | Short | | | 11/17/11 | | CITI | | | 2,179,144 | | | | 2,267,496 | | | | (88,352 | ) |
Canadian Dollar | | | Short | | | 11/17/11 | | DUB | | | 1,101,909 | | | | 1,120,209 | | | | (18,300 | ) |
Canadian Dollar | | | Short | | | 11/17/11 | | DUB | | | 2,882,830 | | | | 2,872,228 | | | | 10,602 | |
Canadian Dollar | | | Short | | | 11/17/11 | | GS | | | 21,265 | | | | 22,063 | | | | (798 | ) |
Canadian Dollar | | | Short | | | 11/17/11 | | GS | | | 593,662 | | | | 592,698 | | | | 964 | |
Canadian Dollar | | | Short | | | 11/17/11 | | JPM | | | 1,004,332 | | | | 1,020,925 | | | | (16,593 | ) |
Canadian Dollar | | | Short | | | 11/17/11 | | MSC | | | 99,177 | | | | 101,290 | | | | (2,113 | ) |
Canadian Dollar | | | Short | | | 11/17/11 | | RBC | | | 2,491,427 | | | | 2,473,085 | | | | 18,342 | |
Canadian Dollar | | | Short | | | 11/17/11 | | RBC | | | 1,109,336 | | | | 1,136,255 | | | | (26,919 | ) |
Euro | | | Short | | | 01/17/12 | | JPM | | | 77,648,320 | | | | 78,978,594 | | | | (1,330,274 | ) |
Indian Rupee | | | Short | | | 11/18/11 | | BRC | | | 100,000 | | | | 98,290 | | | | 1,710 | |
Indian Rupee | | | Short | | | 11/18/11 | | CITI | | | 1,300,000 | | | | 1,294,807 | | | | 5,193 | |
Indian Rupee | | | Short | | | 11/18/11 | | CITI | | | 200,000 | | | | 201,617 | | | | (1,617 | ) |
Indian Rupee | | | Short | | | 11/18/11 | | JPM | | | 1,300,000 | | | | 1,318,244 | | | | (18,244 | ) |
Indonesian Rupiah | | | Short | | | 07/02/12 | | GS | | | 1,176,840 | | | | 1,204,730 | | | | (27,890 | ) |
Japanese Yen | | | Short | | | 11/07/11 to 01/13/12 | | CITI | | | 13,731,490 | | | | 13,561,449 | | | | 170,041 | |
Japanese Yen | | | Short | | | 11/14/11 | | BRC | | | 44,917,602 | | | | 44,344,791 | | | | 572,811 | |
Japanese Yen | | | Short | | | 11/14/11 to 01/30/12 | | DUB | | | 60,736,545 | | | | 59,921,227 | | | | 815,318 | |
The accompanying notes are an integral part of these financial statements.
30
Managers PIMCO Bond Fund
Notes to Schedule of Portfolio Investments (continued)
| | | | | | | | | | | | | | | | | | | | |
Foreign Currency | | Position | | | Settlement Date | | Counterparty | | Receivable
Amount | | | Payable
Amount | | | Unrealized
Gain/(Loss) | |
Japanese Yen | | | Short | | | 01/30/12 | | GS | | $ | 13,557,830 | | | $ | 13,302,541 | | | $ | 255,289 | |
Japanese Yen | | | Short | | | 01/30/12 | | JPM | | | 15,893,141 | | | | 15,602,025 | | | | 291,116 | |
Japanese Yen | | | Short | | | 01/30/12 | | CITI | | | 15,893,555 | | | | 15,602,024 | | | | 291,531 | |
Japanese Yen | | | Short | | | 01/30/12 | | UBS | | | 3,254,502 | | | | 3,192,699 | | | | 61,803 | |
Malaysian Ringgit | | | Short | | | 11/10/11 | | BNY | | | 200,000 | | | | 208,222 | | | | (8,222 | ) |
Malaysian Ringgit | | | Short | | | 11/10/11 | | BRC | | | 900,000 | | | | 925,924 | | | | (25,924 | ) |
Malaysian Ringgit | | | Short | | | 11/10/11 | | JPM | | | 100,000 | | | | 101,082 | | | | (1,082 | ) |
Malaysian Ringgit | | | Short | | | 11/10/11 to 04/23/12 | | CITI | | | 3,803,678 | | | | 3,873,677 | | | | (69,999 | ) |
Mexican Peso | | | Short | | | 11/18/11 | | BNY | | | 3,400,000 | | | | 3,443,332 | | | | (43,332 | ) |
Mexican Peso | | | Short | | | 11/18/11 | | BRC | | | 100,000 | | | | 99,655 | | | | 345 | |
Mexican Peso | | | Short | | | 11/18/11 | | BRC | | | 701,837 | | | | 709,088 | | | | (7,251 | ) |
Mexican Peso | | | Short | | | 11/18/11 | | CITI | | | 100,000 | | | | 99,658 | | | | 342 | |
Mexican Peso | | | Short | | | 11/18/11 | | CITI | | | 900,000 | | | | 909,077 | | | | (9,077 | ) |
Mexican Peso | | | Short | | | 11/18/11 | | JPM | | | 919,195 | | | | 932,128 | | | | (12,933 | ) |
Mexican Peso | | | Short | | | 11/18/11 | | MSC | | | 1,600,000 | | | | 1,624,443 | | | | (24,443 | ) |
Mexican Peso | | | Short | | | 11/18/11 | | UBS | | | 3,700,000 | | | | 3,748,153 | | | | (48,153 | ) |
Mexican Peso | | | Short | | | 11/18/11 to 03/15/12 | | UBS | | | 1,500,000 | | | | 1,489,966 | | | | 10,034 | |
Philippine Peso | | | Short | | | 11/15/11 | | BNY | | | 1,100,000 | | | | 1,124,108 | | | | (24,108 | ) |
Philippine Peso | | | Short | | | 11/15/11 to 03/15/12 | | CITI | | | 3,212,567 | | | | 3,306,152 | | | | (93,585 | ) |
Philippine Peso | | | Short | | | 11/15/11 to 03/15/12 | | JPM | | | 2,200,000 | | | | 2,264,355 | | | | (64,355 | ) |
Singapore Dollar | | | Short | | | 12/09/11 | | BNY | | | 900,000 | | | | 928,872 | | | | (28,872 | ) |
Singapore Dollar | | | Short | | | 12/09/11 | | CITI | | | 500,000 | | | | 503,876 | | | | (3,876 | ) |
Singapore Dollar | | | Short | | | 12/09/11 | | CITI | | | 1,100,000 | | | | 1,095,554 | | | | 4,446 | |
Singapore Dollar | | | Short | | | 12/09/11 | | CS | | | 700,000 | | | | 694,672 | | | | 5,328 | |
Singapore Dollar | | | Short | | | 12/09/11 | | GS | | | 300,000 | | | | 297,633 | | | | 2,367 | |
Singapore Dollar | | | Short | | | 12/09/11 | | GS | | | 800,000 | | | | 828,091 | | | | (28,091 | ) |
Singapore Dollar | | | Short | | | 12/09/11 | | JPM | | | 1,500,000 | | | | 1,565,435 | | | | (65,435 | ) |
South African Rand | | | Short | | | 01/26/12 | | BRC | | | 34,634 | | | | 34,821 | | | | (187 | ) |
South African Rand | | | Short | | | 01/26/12 | | JPM | | | 136,806 | | | | 136,846 | | | | (40 | ) |
South African Rand | | | Short | | | 01/26/12 | | JPM | | | 112,000 | | | | 111,965 | | | | 35 | |
South Korean Won | | | Short | | | 11/14/11 | | BNY | | | 900,000 | | | | 960,279 | | | | (60,279 | ) |
The accompanying notes are an integral part of these financial statements.
31
Managers PIMCO Bond Fund
Notes to Schedule of Portfolio Investments (continued)
| | | | | | | | | | | | | | | | | | | | | | |
Foreign Currency | | Position | | | Settlement Date | | | Counterparty | | Receivable
Amount | | | Payable Amount | | | Unrealized
Gain/ (Loss) | |
South Korean Won | | | Short | | | | 11/14/11 | | | BRC | | $ | 821,225 | | | $ | 837,388 | | | | ($16,163 | ) |
South Korean Won | | | Short | | | | 11/14/11 | | | CITI | | | 100,000 | | | | 104,799 | | | | (4,799 | ) |
South Korean Won | | | Short | | | | 11/14/11 | | | CS | | | 3,348,819 | | | | 3,622,611 | | | | (273,792 | ) |
South Korean Won | | | Short | | | | 11/14/11 | | | DUB | | | 600,000 | | | | 621,869 | | | | (21,869 | ) |
South Korean Won | | | Short | | | | 11/14/11 | | | JPM | | | 4,200,000 | | | | 4,485,156 | | | | (285,156 | ) |
South Korean Won | | | Short | | | | 11/14/11 | | | MSC | | | 100,000 | | | | 100,035 | | | | (35 | ) |
South Korean Won | | | Short | | | | 11/14/11 | | | UBS | | | 1,500,000 | | | | 1,541,286 | | | | (41,286 | ) |
Taiwan Dollar | | | Short | | | | 01/11/12 | | | BRC | | | 274,111 | | | | 280,992 | | | | (6,881 | ) |
Taiwan Dollar | | | Short | | | | 01/11/12 | | | MSC | | | 500,000 | | | | 511,296 | | | | (11,296 | ) |
| | | | | | | | | | | | | | | | | | | | | | |
Totals | | | | | | | | | | | | $ | 497,335,593 | | | $ | 501,671,285 | | | ($ | 4,335,692 | ) |
| | | | | | | | | | | | | | | | | | | | | | |
The accompanying notes are an integral part of these financial statements.
32
Managers PIMCO Bond Fund
Notes to Schedule of Portfolio Investments (continued)
Counterparty Abbreviations:
| | |
| BNY: | | The Bank of New York Mellon |
| BRC: | | Barclays Bank PLC |
| CITI: | | Citigroup, Inc. |
| CS: | | Credit Suisse |
| DUB: | | Deutsche Bank AG |
| GS: | | Goldman Sachs & Co. |
| HSBC: | | HSBC Bank |
| JPM: | | JPMorgan Chase & Co. |
| JRC: | | Johnson Rice & Co. |
| MLC: | | Merrill Lynch & Co., Inc. |
| MSC: | | Morgan Stanley |
| RBC: | | Royal Bank of Canada |
| RBS: | | Royal Bank of Scotland Group PLC |
| UBS: | | UBS Warburg LLC |
Currency Abbreviations:
| | |
| AUD: | | Australian Dollar |
| BRL: | | Brazilian Real |
| EUR: | | Euro |
| GBP: | | British Pound |
| MXN: | | Mexican Peso |
| USD: | | U.S. Dollar |
Investment Abbreviations and Definitions:
| | |
| BBA: | | British Bankers Association |
| BBR: | | Bankers Buying Rate |
| BBSW: | | Bank Bill Swap Reference Rate |
| CDI: | | Brazil Interbank Deposit Rate |
| CDX.EM: | | Credit Derivatives Index Emerging Markets |
| CPURNSA: | | Consumer Price All Urban Non-Seasonally Adjusted Index |
| EURIBOR: | | Euro Interbank Offered Rate |
| FNMA: | | Federal National Mortgage Association |
| LIBOR: | | London Interbank Offered Rate |
| N/A: | | No composite rating is available for this index. |
| OIS: | | Overnight Index Swap |
| OTC: | | Over-the-counter |
| TBD: | | To be determined |
| TIIE: | | Interbank Equilibrium Interest rate |
The accompanying notes are an integral part of these financial statements.
33
Managers PIMCO Bond Fund
Statement of Assets and Liabilities
October 31, 2011
| | | | |
Assets: | | | | |
Investments at value* (including securities on loan valued at $ 10,275,716) | | $ | 1,582,941,339 | |
Receivable for delayed delivery investments sold | | | 56,553,318 | |
Receivable for investments sold | | | 7,909,536 | |
Unrealized appreciation on swaps | | | 7,816,949 | |
Dividends, interest and other receivables | | | 7,728,959 | |
Swap premiums paid | | | 3,293,230 | |
Unrealized appreciation on foreign currency contracts | | | 3,268,285 | |
Receivable for Fund shares sold | | | 3,120,815 | |
Variation margin receivable | | | 953,518 | |
Receivable from affiliate | | | 123,450 | |
Prepaid expenses | | | 19,705 | |
Total assets | | | 1,673,729,104 | |
Liabilities: | | | | |
Foreign currency payable | | | 5,716,887 | |
Payable for delayed delivery investments purchased | | | 355,768,618 | |
Payable for TBA sale commitments | | | 37,531,181 | |
Payable upon return of securities loaned | | | 10,422,607 | |
Unrealized depreciation on foreign currency contracts | | | 7,603,977 | |
Payable to brokers upon termination of futures, swaps and foreign currency contracts | | | 5,160,000 | |
Payable for fund shares repurchased | | | 2,550,302 | |
Payable for investments purchased | | | 2,265,846 | |
Swap premiums received | | | 2,240,694 | |
Unrealized depreciation on swaps | | | 2,174,164 | |
Options written (premiums received $ 4,638,296) | | | 1,734,453 | |
Dividends payable to shareholders | | | 444,611 | |
Variation margin payable | | | 5,950 | |
Accrued expenses: | | | | |
Investment advisory and management fees | | | 414,550 | |
Administrative fees | | | 207,275 | |
Other | | | 346,844 | |
Total liabilities | | | 434,587,959 | |
| |
Net Assets | | $ | 1,239,141,145 | |
Shares outstanding | | | 117,628,037 | |
Net asset value, offering and redemption price per share | | $ | 10.53 | |
Net Assets Represent: | | | | |
Paid-in capital | | $ | 1,221,340,239 | |
Undistributed net investment income | | | 11,914,617 | |
Accumulated net realized loss from investments, options, futures, swaps and foreign currency transactions | | | (18,630,953 | ) |
Net unrealized appreciation of investments, options, futures, swaps and foreign currency translations | | | 24,517,242 | |
Net Assets | | $ | 1,239,141,145 | |
* Investments at cost | | $ | 1,567,784,289 | |
The accompanying notes are an integral part of these financial statements.
34
Managers PIMCO Bond Fund
Statement of Operations
For the fiscal year ended October 31, 2011
| | | | |
Investment Income: | | | | |
Interest income | | $ | 37,915,023 | |
Dividend income | | | 971,972 | |
Securities lending fees | | | 55,105 | |
Total investment income | | | 38,942,100 | |
| |
Expenses: | | | | |
Investment advisory and management fees | | | 4,993,137 | |
Administrative fees | | | 2,496,569 | |
Transfer agent | | | 403,652 | |
Custodian | | | 388,778 | |
Professional fees | | | 200,299 | |
Registration fees | | | 108,165 | |
Reports to shareholders | | | 108,046 | |
Trustees fees and expenses | | | 82,468 | |
Insurance | | | 44,816 | |
Miscellaneous | | | 12,420 | |
Total expenses before offsets | | | 8,838,350 | |
Expense reimbursements | | | (1,586,733 | ) |
Expense reductions | | | (1,410 | ) |
Net expenses | | | 7,250,207 | |
| |
Net investment income | | | 31,691,893 | |
| |
Net Realized and Unrealized Gain (Loss): | | | | |
Net realized gain on investments, options, futures and swap transactions | | | 1,109,754 | |
Net realized loss on foreign currency transactions | | | (5,710,392 | ) |
Net change in unrealized depreciation of investments, options, futures, swaps and foreign currency transactions | | | (13,892,739 | ) |
Net realized and unrealized loss | | | (18,493,377 | ) |
| |
Net increase in net assets resulting from operations | | $ | 13,198,516 | |
The accompanying notes are an integral part of these financial statements.
35
Managers PIMCO Bond Fund
Statement of Changes in Net Assets
For the fiscal year ended October 31,
| | | | | | | | |
| | | 2011 | | | 2010 | |
Increase (Decrease) in Net Assets From Operations: | | | | | | | | |
Net investment income | | $ | 31,691,893 | | | $ | 30,337,116 | |
Net realized gain (loss) on investments, options, futures, swaps and foreign currency transactions | | | (4,600,638 | ) | | | 72,332,270 | |
Net change in unrealized appreciation (depreciation) of investments, options, futures,swaps and foreign currency translations | | | (13,892,739 | ) | | | 27,514,704 | |
Net increase in net assets resulting from operations | | | 13,198,516 | | | | 130,184,090 | |
| | |
Distributions to Shareholders: | | | | | | | | |
From net investment income | | | (41,653,175 | ) | | | (37,655,274 | ) |
From net realized gain on investments | | | (58,243,682 | ) | | | (14,261,392 | ) |
Total distributions to shareholders | | | (99,896,857 | ) | | | (51,916,666 | ) |
| | |
From Capital Share Transactions: | | | | | | | | |
Proceeds from sale of shares | | | 382,148,534 | | | | 522,015,610 | |
Reinvestment of dividends | | | 86,527,010 | | | | 44,372,952 | |
Cost of shares repurchased | | | (568,176,682 | ) | | | (333,479,229 | ) |
Net increase (decrease) from capital share transactions | | | (99,501,138 | ) | | | 232,909,333 | |
| | |
Total increase (decrease) in net assets | | | (186,199,479 | ) | | | 311,176,757 | |
| | |
Net Assets: | | | | | | | | |
Beginning of year | | | 1,425,340,624 | | | | 1,114,163,867 | |
End of year | | $ | 1,239,141,145 | | | $ | 1,425,340,624 | |
End of year undistributed net investment income | | $ | 11,914,617 | | | $ | 8,639,343 | |
| | | | | | | | |
| | |
Share Transactions: | | | | | | | | |
Sale of shares | | | 36,035,399 | | | | 48,516,222 | |
Shares issued in connection with reinvestment of dividends and distributions | | | 8,340,023 | | | | 4,170,494 | |
Shares repurchased | | | (53,544,469 | ) | | | (30,911,673 | ) |
Net increase (decrease) in shares | | | (9,169,047 | ) | | | 21,775,043 | |
The accompanying notes are an integral part of these financial statements.
36
Managers PIMCO Bond Fund
Financial Highlights
For a share outstanding throughout each fiscal year
| | | | | | | | | | | | | | | | | | | | |
| | | For the fiscal year ended October 31, | |
| | 2011 | | | 2010 | | | 2009 | | | 2008 | | | 2007 | |
Net Asset Value, Beginning of Year | | $ | 11.24 | | | $ | 10.61 | | | $ | 9.85 | | | $ | 10.41 | | | $ | 10.31 | |
| | | | | |
Income from Investment Operations: | | | | | | | | | | | | | | | | | | | | |
Net investment income | | | 0.38 | | | | 0.35 | | | | 0.49 | | | | 0.57 | | | | 0.47 | |
Net realized and unrealized gain (loss) on investments | | | (0.25 | ) | | | 0.73 | | | | 1.44 | | | | (0.61 | ) | | | 0.13 | |
Total from investment operations | | | 0.13 | | | | 1.08 | | | | 1.93 | | | | (0.04 | ) | | | 0.60 | |
| | | | | |
Less Distributions to Shareholders from: | | | | | | | | | | | | | | | | | | | | |
Net investment income | | | (0.35 | ) | | | (0.32 | ) | | | (0.49 | ) | | | (0.52 | ) | | | (0.50 | ) |
Net realized gain on investments | | | (0.49 | ) | | | (0.13 | ) | | | (0.68 | ) | | | — | | | | — | |
Total distributions to shareholders | | | (0.84 | ) | | | (0.45 | ) | | | (1.17 | ) | | | (0.52 | ) | | | (0.50 | ) |
| | | | | |
Net Asset Value, End of Year | | $ | 10.53 | | | $ | 11.24 | | | $ | 10.61 | | | $ | 9.85 | | | $ | 10.41 | |
Total Return1 | | | 1.45 | % | | | 10.52 | % | | | 20.62 | % | | | (0.60 | %) | | | 5.96 | % |
Ratio of net expenses to average net assets | | | 0.58 | % | | | 0.58 | % | | | 0.58 | % | | | 0.58 | % | | | 0.60 | % |
Ratio of net investment income to average net assets1 | | | 2.54 | % | | | 2.38 | % | | | 3.78 | % | | | 4.47 | % | | | 4.86 | % |
Portfolio turnover | | | 495 | % | | | 359 | % | | | 531 | % | | | 431 | % | | | 249 | % |
Net assets at end of year (000’s omitted) | | $ | 1,239,141 | | | $ | 1,425,341 | | | $ | 1,114,164 | | | $ | 1,036,504 | | | $ | 1,207,072 | |
| | | | | | | | | | | | | | | | | | | | |
Ratios absent expense offsets:2 | | | | | | | | | | | | | | | | | | | | |
Ratio of total expenses to average net assets | | | 0.71 | % | | | 0.74 | % | | | 0.78 | % | | | 0.75 | % | | | 0.77 | % |
Ratio of net investment income to average net assets | | | 2.41 | % | | | 2.22 | % | | | 3.58 | % | | | 4.30 | % | | | 4.69 | % |
| | | | | | | | | | | | | | | | | | | | |
| 1 | Total returns and net investment income would have been lower had certain expenses not been reduced. (See Note 1(c) of Notes to Financial Statements.) |
| 2 | Excludes the impact of expense reimbursements or fee waivers and expense reductions such as brokerage credits, but includes non-reimbursable expenses, if any, such as interest and taxes. (See Note 1(c) of Notes to Financial Statements.) |
37
Managers PIMCO Bond Fund
Notes to Financial Statements
October 31, 2011
1. Summary of Significant Accounting Policies
Managers Trust I (the “Trust”) is an open-end management investment company organized as a Massachusetts business trust and registered under the Investment Company Act of 1940, as amended (the “1940 Act”). Currently, the Trust consists of a number of different funds, each having distinct investment management objectives, strategies, risks, and policies. Included in this report is the Managers PIMCO Bond Fund (the “Fund”).
The Fund’s financial statements are prepared in accordance with accounting principles generally accepted in the United States of America (“U.S. GAAP”), which require management to make estimates and assumptions that affect the reported amounts of assets and liabilities and disclosure of contingent assets and liabilities at the date of the financial statements and the reported amounts of income and expenses during the reporting period. Actual results could differ from those estimates and such differences could be material. The following is a summary of significant accounting policies followed by the Fund in the preparation of its financial statements:
a. Valuation of Investments
Equity securities traded on a domestic or international securities exchange are valued at the last quoted sale price, or, lacking any sales, at the last quoted bid price. Over-the-counter securities are valued at the Nasdaq Official Closing Price, if one is available. Lacking any sales, over-the-counter securities are valued at the last quoted bid price. The Fund’s investments are generally valued based on market quotations provided by third-party pricing services approved by the Board of Trustees of the Fund (the “Board”). Under certain circumstances, the value of certain Fund investments may be based on an evaluation of fair value, pursuant to procedures established by and under the general supervision of the Board. The Fund may use the fair value of a portfolio investment to calculate its NAV when, for example, (1) market quotations are not readily available because a portfolio investment is not traded in a public market or the principal market in which the investment trades is closed, (2) trading in a portfolio investment is suspended and has not resumed before the Fund calculates its NAV, (3) a significant event affecting the value of a portfolio investment is determined to have occurred between the time of the market quotation provided for a portfolio investment and the time as of which the Fund calculates its NAV, (4) an investment’s price has remained unchanged over a period of time (often referred to as a “stale price”), or (5) Managers Investment Group LLC (“the Investment Manager”) determines that a market quotation is inaccurate. Portfolio investments that trade primarily on foreign markets are priced based upon the market quotation of such securities as of the close of their respective principal markets, as adjusted to reflect the Investment Manager’s determination of the impact of events occurring subsequent to the close of such markets but prior to the time as of which the Fund calculates its NAV. In accordance with procedures approved by the Board, the Investment Manager relies upon recommendations of a third-party fair valuation service in adjusting the prices of such foreign portfolio investments. A Fund’s investment in derivative instruments traded in foreign markets (including futures contracts on equity and fixed-income securities and security indexes and options on futures contracts, securities and security indexes) are priced based on the market quotation of such instruments in their respective principal markets as of the close of regular business on the New York Stock Exchange. Under certain circumstances, the Investment Manager may adjust such prices based on its determination of the impact of events occurring subsequent to the close of such markets but prior to the time as of which the Fund calculates its NAV. The Fund may invest in securities that may be thinly traded. The Board has adopted procedures to adjust prices of thinly traded securities that are judged to be stale so that they reflect fair value. An investment valued on the basis of its fair value may be valued at a price higher or lower than available market quotations. An investment’s valuation may differ depending on the method used and the factors considered in determining value according to the Fund’s fair value procedures.
Fixed-income securities are valued based on valuations furnished by independent pricing services that utilize matrix systems, which reflect such factors as security prices, yields, maturities, and ratings, and are supplemented by dealer and exchange quotations. Futures contracts for which market quotations are readily available are valued at the settlement price as of the close of the futures exchange. Short-term investments having a remaining maturity of 60 days or less are valued at amortized cost, which approximates market value. Investments in other open-end regulated investment companies are valued at their end of day net asset value per share except iShares or other ETF’s, which are valued the same as equity securities. investments in certain mortgage-backed and stripped mortgage-backed securities, preferred stocks, convertible securities, derivatives and other debt securities not traded on an organized securities market are valued on the basis of valuations provided by dealers or by a pricing service which uses information with respect to transactions in such securities and various relationships between securities and yield to maturity in determining value. Securities (including derivatives) for which market quotations are not readily available are valued at fair value, as determined in good faith, and pursuant to procedures adopted by the Board. The values assigned to fair value investments are based on available information and do not necessarily represent amounts that might ultimately be realized, since such amounts depend on future developments inherent in long-term investments. Further, because of the inherent uncertainty of valuation, those estimated values may differ significantly from the values that would have been used had a ready market for the investments existed, and the differences could be material.
38
Managers PIMCO Bond Fund
Notes to Financial Statements (continued)
U.S. GAAP defines fair value as the price that a Fund would receive to sell an asset or pay to transfer a liability in an orderly transaction between market participants at the measurement date. U.S. GAAP also establishes a framework for measuring fair value, and a three-level hierarchy for fair value measurements based upon the transparency of inputs to the valuation of an asset or liability. Inputs may be observable or unobservable and refer broadly to the assumptions that market participants would use in pricing the asset or liability. Observable inputs reflect the assumptions market participants would use in pricing the asset or liability based on market data obtained from sources independent of the Fund. Unobservable inputs reflect the Fund’s own assumptions about the assumptions that market participants would use in pricing the asset or liability developed based on the best information available in the circumstances. Each investment is assigned a level based upon the observability of the inputs which are significant to the overall valuation.
The three-tier hierarchy of inputs is summarized below:
Level 1 – inputs are quoted prices in active markets for identical investments (e.g., equity securities, open-end investment companies, futures contracts, options contracts)
Level 2 – other observable inputs (including, but not limited to: quoted prices for similar assets or liabilities in markets that are active, quoted prices for identical or similar assets or liabilities in markets that are not active, inputs other than quoted prices that are observable for the assets or liabilities (such as interest rates, yield curves, volatilities, prepayment speeds, loss severities, credit risks and default rates) or other market corroborated inputs) (e.g., debt securities, government securities, swap contracts, foreign currency exchange contracts, foreign securities utilizing international fair value pricing, broker-quoted securities, fair valued securities with observable inputs)
Level 3 – inputs are significant unobservable inputs (including the Fund’s own assumptions used to determine the fair value of investments) (e.g., fair valued securities with unobservable inputs)
The inputs or methodologies used for valuing investments are not necessarily an indication of the risk associated with investing in those investments.
b. Security Transactions
Security transactions are accounted for as of trade date. Realized gains and losses on securities sold are determined on the basis of identified cost.
c. Investment Income and Expenses
Dividend income is recorded on the ex-dividend date, except certain dividends from foreign securities where the ex-dividend date may have passed. Dividends from foreign securities are recorded as soon as the Trust is informed of the ex-dividend date. Dividend income on foreign securities is recorded net of any withholding tax. Interest income, which includes amortization of premium and accretion of discount on debt securities, is accrued as earned. Non-cash dividends included in dividend income, if any, are reported at the fair market value of the securities received. Other income and expenses are recorded on an accrual basis. Expenses that cannot be directly attributed to a Fund are apportioned among the Funds in the Trust and in some cases other affiliated funds based upon their relative average net assets or number of shareholders.
The Fund has a “balance credit” agreement with The Bank of New York Mellon (“BNYM”), the Fund’s custodian, whereby the Fund is credited with an interest factor equal to 0.75% below the effective 90-day T-Bill rate for account balances left uninvested overnight. If the T-Bill rate falls below 0.75%, no credits will be earned. These credits serve to reduce custody expenses that otherwise would be charged to the Fund. For the fiscal year ended October 31, 2011, the Fund had no balance credits.
Overdrafts will cause a reduction of any earnings credits, computed at 2% above the Federal funds rate on the day of the overdraft. For the fiscal year ended October 31, 2011, overdraft fees equaled $11,977.
The Fund also has a balance credit arrangement with its Transfer Agent, BNY Mellon Investment Servicing (US) Inc., whereby earnings credits are used to offset banking charges and other out-of-pocket expenses. For the fiscal year ended October 31, 2011, the transfer agent expense was reduced by $1,410.
Total returns and net investment income for the Fund would have been lower had certain expenses not been offset. Total expenses before offsets exclude the impact of expense reimbursements or fee waivers and expense offsets such as brokerage recapture credits, but include non-reimbursable expenses, if any, such as interest and taxes.
d. Dividends and Distributions
Dividends resulting from net investment income, if any, normally will be declared daily and paid monthly. Distributions of capital gains, if any, will be made on an annual basis and when required for Federal excise tax purposes. Income and capital gain distributions are determined in accordance with Federal income tax regulations, which may differ from U.S. GAAP. These differences are primarily due to differing treatments for losses deferred due to wash sales, equalization accounting for tax purposes, foreign currency, options, futures and market discount transactions. Permanent book and tax basis differences, if any, relating to shareholder distributions will result in reclassifications to paid-in capital. The tax character of distributions paid during the fiscal years ended October 31, 2011 and 2010 were as follows:
| | | | | | | | |
| Distributions paid from: | | 2011 | | | 2010 | |
Ordinary income | | $ | 80,947,984 | | | $ | 37,655,274 | |
Short-term capital gains | | | — | | | | 14,261,392 | |
Long-term capital gains | | | 18,948,873 | | | | — | |
| | | | | | | | |
Totals | | $ | 99,896,857 | | | $ | 51,916,666 | |
| | | | | | | | |
39
Managers PIMCO Bond Fund
Notes to Financial Statements (continued)
As of October 31, 2011, the components of distributable earnings (excluding unrealized appreciation/depreciation) on a tax basis consisted of:
| | | | |
Capital loss carryforward | | $ | 11,627,287 | |
Undistributed ordinary income | | | 9,034,087 | |
Undistributed short-term capital gains | | | — | |
Undistributed long-term capital gains | | | — | |
Post-October loss deferral | | | — | |
e. Federal Taxes
The Fund intends to comply with the requirements under Subchapter M of the Internal Revenue Code of 1986, as amended, to distribute substantially all of its taxable income and gains to its shareholders and to meet certain diversification and income requirements with respect to investment companies. Therefore, no provision for Federal income or excise tax is included in the accompanying financial statements.
Additionally, based on the Fund’s understanding of the tax rules and rates related to income, gains and transactions for the foreign jurisdictions in which it invests, the Fund will provide for foreign taxes, and where appropriate, deferred foreign taxes.
Management has analyzed the Fund’s tax positions taken on federal income tax returns for all open tax years (tax years ended October 31, 2008-2011), and has concluded that no provision for federal income tax is required in the Fund’s financial statements. Additionally, the Fund is not aware of any tax position for which it is reasonably possible that the total amounts of unrecognized tax benefits will change materially in the next twelve months.
f. Capital Loss Carryover and Deferrals
Under the recently enacted Regulated Investment Company Modernization Act of 2010 (the “Act”), the Fund will be permitted to carry forward capital losses incurred in taxable years beginning after December 22, 2010 for an unlimited period. However, any losses incurred during those taxable years will be required to be utilized prior to any losses incurred in pre-enactment taxable years, which generally expire eight years following the close of the taxable year in which they were incurred. Additionally, post-enactment capital losses that are carried forward will retain their tax character as either short-term or long-term capital losses rather than being considered all short-term as under previous law. The Fund’s first fiscal year subject to the Act will be the fiscal year ended October 31, 2012.
As of October 31, 2011, the Fund had accumulated net realized capital loss carryovers from security transactions for Federal income tax purposes as shown in the following chart. These amounts may be used to offset realized capital gains, if any, through the expiration date listed.
| | | | | | | | |
| | | Short-Term Loss Carryover Amount | | | Expires
October 31, | |
| | $ | 11,627,287 | | | | 2019 | |
For the year ended October 31, 2011, the Fund did not utilize any capital loss carryovers.
g. Capital Stock
The Trust’s Declaration of Trust authorizes for each series the issuance of an unlimited number of shares of beneficial interest, without par value. The Fund records sales and repurchases of its capital stock on the trade date. The cost of securities contributed to the Fund in connection with the issuance of shares is based on the valuation of those securities in accordance with the Fund’s policy on investment valuation. Dividends and distributions to shareholders are recorded on the ex-dividend date.
At October 31, 2011, certain unaffiliated shareholders of record, specifically omnibus accounts, individually or collectively held greater than 10% of the outstanding shares of the Fund as follows: two collectively own 44%. Transactions by these shareholders may have a material impact on the Fund.
h. Repurchase Agreements
The Fund may enter into repurchase agreements provided that the value of the underlying collateral, including accrued interest, will equal or exceed the value of the repurchase agreement during the term of the agreement. The underlying collateral for all repurchase agreements is held in safekeeping by the Fund’s custodian or at the Federal Reserve Bank. If the seller defaults and the value of the collateral declines, or if bankruptcy proceedings commence with respect to the seller of the security, realization of the collateral by the Fund may be delayed or limited. At October 31, 2011, the market value of repurchase agreements outstanding was $117,500,000.
i. Foreign Currency Translation
The books and records of the Fund are maintained in U.S. dollars. The values of investments, assets and liabilities denominated in currencies other than U.S. dollars are translated into U.S. dollars based upon current foreign exchange rates. Purchases and sales of foreign investments, income and expenses are converted into U.S. dollars based on currency exchange rates prevailing on the respective dates of such transactions. Net realized and unrealized gain (loss) on foreign currency transactions represent: (1) foreign exchange gains and losses from the sale and holdings of foreign currencies; (2) gains and losses between trade date and settlement date on investment securities transactions and forward foreign currency exchange contracts; and (3) gains and losses from the difference between amounts of interest and dividends recorded and the amounts actually received.
The Fund does not isolate the net realized and unrealized gain or loss resulting from changes in exchange rates from the fluctuations in market prices of securities held. Such fluctuations are included with the net realized and unrealized gain or loss on investments.
j. Foreign Securities
The Fund invests in securities of foreign entities and in instruments denominated in foreign currencies which involve risks not typically associated with investments in domestic securities. Non-domestic securities carry special risks, such as exposure to currency fluctuations, less developed or less efficient trading markets, political instability, a lack of company information, differing auditing and legal standards, and, potentially, less liquidity.
Realized gains in certain countries may be subject to foreign taxes at the Fund level, at rates ranging from approximately 10% to 15%.
40
Managers PIMCO Bond Fund
Notes to Financial Statements (continued)
The Fund would pay such foreign taxes at the appropriate rate for each jurisdiction.
k. Securities Transacted on a When Issued Basis
The Fund may enter into To Be Announced (“TBA”) sale commitments to hedge its portfolio positions or to sell mortgage-backed securities it owns under delayed delivery arrangements. Proceeds of TBA sale commitments are not received until the contractual settlement date. During the time a TBA sale commitment is outstanding, equivalent deliverable securities, or an offsetting TBA purchase commitment deliverable on or before the sale commitment date, are held as “cover” for the transaction. Unsettled TBA sale commitments are valued at the current market value of the underlying securities according to the procedures described under “Valuation of Investments,” in footnote 1a above. Each contract is marked-to-market daily and the change in market value is recorded by the Fund as an unrealized gain or loss. If the TBA sale commitment is closed through the acquisition of an offsetting purchase commitment, the Fund realizes a gain or loss. If the Fund delivers securities under the commitment, the Fund realizes a gain or a loss from the sale of the securities based upon the unit price established at the date the commitment was entered into.
2. Agreements and Transactions with Affiliates
The Trust has entered into an Investment Management Agreement under which the Investment Manager, an independently managed subsidiary of Affiliated Managers Group, Inc. (“AMG”), serves as investment manager to the Fund and is responsible for the Fund’s overall administration. The Investment Manager selects subadvisors for the Fund (subject to Board approval) and monitors the subadvisor’s investment programs and results. The Fund’s investment portfolio is managed by a portfolio manager who serves pursuant to a subadvisory agreement with the Investment Manager.
Investment management fees are paid directly by the Fund to the Investment Manager based on average net assets. The annual investment management fee rates, as a percentage of average daily net assets, for the fiscal year ended October 31, 2011, was 0.40%.
The Trust has entered into an Administration and Shareholder Servicing Agreement under which the Investment Manager serves as the Fund’s administrator (the “Administrator”) and is responsible for all aspects of managing the Fund’s operations, including administration and shareholder services to the Fund, its shareholders, and certain institutions, such as bank trust departments, broker-dealers and registered investment advisers, that advise or act as an intermediary with the Fund’s shareholders. The Fund pays a fee to the Administrator at the rate of 0.20% per annum of the Fund’s average daily net assets for this service. Prior to July 1, 2010, the Administrator was paid a fee of 0.25% per annum.
The Investment Manager has contractually agreed, through at least March 1, 2012, to waive fees and pay or reimburse Fund expenses in order to limit total annual Fund operating expenses after fee waiver and expense reimbursements (exclusive of taxes, interest, shareholder servicing fees and distribution and service (12b-1) fees, brokerage commissions, acquired fund fees and expenses and extraordinary items) to 0.58% of the Fund’s average daily net assets.
The Fund is obligated to repay the Investment Manager such amounts waived, paid or reimbursed in future years provided that the repayment occurs within thirty-six (36) months after the waiver or reimbursement and that such repayment would not cause the Fund’s total operating expenses in any such future year to exceed the Fund’s respective expense cap. For the fiscal year ended October 31, 2011, the Fund’s components of reimbursement available are detailed in the following chart:
| | | | |
| | | Managers PIMCO
Bond Fund | |
Reimbursement Available—10/31/10 | | $ | 4,361,097 | |
Additional Reimbursements | | | 1,586,733 | |
Repayments | | | — | |
Expired Reimbursements | | | (1,205,596 | ) |
| | | | |
Reimbursement Available—10/31/11 | | $ | 4,742,234 | |
| | | | |
Effective January 1, 2011, the aggregate annual retainer paid to each Independent Trustee of the Board is $80,000, plus $5,000 or $2,500 for each regular or special meeting attended, respectively. The Independent Chairman of the Trust receives an additional payment of $20,000 per year. The Chairman of the Audit Committee receives an additional payment of $8,000 per year. Prior to January 1, 2011, the aggregate annual retainer paid to each Independent Trustee of the Board was $65,000, plus $4,000 or $2,500 for each regular or special meeting attended, respectively. The Independent Chairman of the Trusts received an additional payment of $15,000 per year. The Chairman of the Audit Committee received an additional payment of $5,000 per year. The Trustees’ fees and expenses are allocated among all of the funds for which the Investment Manager serves as the advisor (the “Managers Funds”) based on the relative net assets of such funds. The “Trustees fees and expenses” shown in the financial statements represents the Fund’s allocated portion of the total fees and expenses paid by the Managers Funds.
The Fund is distributed by Managers Distributors, Inc. (the “Distributor” or “MDI”), a wholly-owned subsidiary of the Investment Manager. MDI serves as the distributor and underwriter for the Fund and is a registered broker-dealer and member of the Financial Industry Regulatory Authority, Inc. (“FINRA”). Shares of the Fund will be continuously offered and will be sold directly to prospective purchasers through brokers, dealers or other financial intermediaries who have executed selling
agreements with MDI. Subject to the compensation arrangement discussed below, generally MDI bears all or a portion of the expenses of providing services pursuant to the distribution agreement, including the payment of the expenses relating to the distribution of prospectuses for sales purposes and any advertising or sales literature. Certain Trustees and Officers of the Fund are Officers and/or Directors of the Investment Manager, AMG and/or the Distributor.
The Securities and Exchange Commission granted an exemptive order that permits the Fund to lend and borrow money for certain temporary purposes directly to and from other eligible Managers Funds. Participation in this interfund lending program is voluntary for both borrowing and lending funds, and an interfund loan is only made if it benefits each participating fund. The Investment Manager administers the program according to procedures approved by the Board, and the Board monitors the operation of the program. An interfund loan must comply with certain conditions set out in the exemptive order, which are designed to assure fairness and protect
41
Managers PIMCO Bond Fund
Notes to Financial Statements (continued)
all participating funds. For the fiscal year ended October 31, 2011, the Fund borrowed from other Managers Funds varying amounts up to $58,756,875, for 4 days paying interest of $7,218. The interest amounts are included in the Statement of Operations as miscellaneous expense. For the same period, the Fund did not lend to any other Managers Funds.
3. Purchases and Sales of Securities
Purchases and sales of securities (excluding short-term securities and U.S. Government obligations) for the fiscal year ended October 31, 2011, were $300,838,455 and $202,187,597, respectively. Purchases and sales of U.S. Government obligations for the fiscal year ended October 31, 2011, were $6,270,757,762 and $6,737,511,024, respectively.
4. Portfolio Securities Loaned
The Fund participated in a securities lending program offered by BNYM (the “Program”), providing for the lending of securities to qualified brokers. Securities lending fees include earnings of such temporary cash investments, plus or minus any rebate to a borrower. These earnings (after any rebate) are then divided between BNYM, as a fee for its services under the program, and the Fund, according to agreed-upon rates. Collateral on all securities loaned is accepted in cash and/or government securities and is maintained at a minimum level of 102% (105% in the case of certain foreign securities) of the market value, plus interest, if applicable, of investments on loan. It is the Fund’s policy to obtain additional collateral from or return excess collateral to the borrower by the end of the next business day, following the valuation date of the securities loaned. Therefore, the value of the collateral held may be temporarily less than the value of the securities on loan. Lending securities entails a risk of loss to the Fund if and to the extent that the market value of the securities loaned were to increase and the borrower did not increase the collateral accordingly, and the borrower fails to return the securities. Under the terms of the Program, the Fund is indemnified for such losses by BNYM. The Fund bears the risk of any deficiency in the amount of the collateral available for return to the borrower due to any loss on the collateral invested. Collateral received in the form of cash is invested temporarily in the BNY Mellon Overnight Government Fund, formerly the BNY Institutional Cash Reserves Fund (the “ICRF”), or other short-term investments as defined in the Securities Lending Agreement with BNYM.
Effective August 2, 2010, the Trust, on behalf of the Fund, entered into an agreement with BNYM and the Bank of New York Mellon Corporation (“BNYMC”) with respect to the Fund’s position in ICRF, pursuant to which (i) BNYMC would support the value of certain defaulted securities issued by Lehman Brothers Holdings, Inc. (the “Lehman Securities”) and held by Series B of the ICRF, and (ii) once certain conditions were met, BNYMC would purchase the defaulted securities from the Fund. On October 17, 2011, after certifying that the Fund had met all necessary conditions, BNYMC purchased the Lehman Securities from the Fund at a predetermined price, which represented a premium over the fair market value of the Lehman Securities at that date.
5. Commitments and Contingencies
In the normal course of business, the Fund may enter into contracts and agreements that contain a variety of representations and warran-ties, which provide general indemnifications. The maximum exposure to the Fund under these arrangements is unknown, as this would involve future claims that may be made against the Fund that have not yet occurred. However, the Fund has not had prior claims or losses and expects the risk of material loss to be remote.
6. Forward Commitments
Certain transactions, such as futures and forward transactions, dollar roll agreements, or purchases of when-issued or delayed delivery securities may have a similar effect on the Fund’s net asset value as if the Fund had created a degree of leverage in its portfolio. However, if the Fund enters into such a transaction, the Fund will establish a segregated account with its custodian in which it will maintain cash, U.S. government securities or other liquid securities equal in value to its obligations in respect to such transaction. Securities and other assets held in the segregated account may not be sold while the transaction is outstanding, unless other suitable assets are substituted.
7. Derivative Instruments
The following disclosures contain information on how and why the Fund uses derivative instruments, the credit risk and how derivative instruments affect the Fund’s financial position, results of operations and cash flows. The location and fair value amounts of these instruments on the Statement of Assets and Liabilities and the realized and changes in unrealized gains and losses on the Statement of Operations, each categorized by type of derivative contract, are included in a table in the Schedule of Portfolio Investments. The derivative instruments outstanding as of the fiscal year end as disclosed in the Statement of Assets and Liabilities and the realized and unrealized changes in gains and losses on derivative instruments during the fiscal year as disclosed in the Statement of Operations serve as indicators of the volume of derivative activity for the Fund.
8. Forward Foreign Currency Contracts
During the fiscal year ended October 31, 2011, the Fund invested in forward foreign currency contracts to facilitate transactions in foreign securities and to hedge against foreign currency exchange rate risk on its non-U.S. dollar denominated investment securities.
A forward foreign currency contract is an agreement between a fund and another party to buy or sell a currency at a set price at a future date. The market value of the contract will fluctuate with changes in currency exchange rates. The contract is marked-to-market daily, and the change in market value is recorded as an unrealized gain or loss. Gain or loss on the purchase or sale of contracts having the same settlement date, amount and counterparty is realized on the date of offset, otherwise gain or loss is realized on the settlement date.
Risks may arise upon entering into these contracts from the potential inability of counterparties to meet the terms of their contracts and from unanticipated movements in the value of a foreign currency relative to the U.S. dollar.
9. Futures Contracts
The Fund entered into futures contracts to achieve a desired level of investment, whether to accommodate portfolio turnover or cash flows from capital shares transactions. There are certain risks associated
42
Managers PIMCO Bond Fund
Notes to Financial Statements (continued)
with futures contracts. Prices may not move as expected or the Fund may not be able to close out the contract when it desires to do so, resulting in losses.
On entering into a futures contract, either cash or securities in an amount equal to a certain percentage of the contract value (initial margin) must be deposited with the futures broker. Subsequent payments (variation margin) are made or received each day. The variation margin payments equal the daily changes in the contract value and are recorded as unrealized gains or losses. The Fund recognizes a realized gain or loss when the contract is closed or expires equal to the difference between the value of the contract at the time it was opened and the value at the time it was closed. Futures are valued at their quoted daily settlement prices. The aggregate principal amounts of the contracts are not recorded in the financial statements. Fluctuations in the value of the contracts are recorded in the Statement of Assets and Liabilities as an asset (liability) and in the Statement of Operations as unrealized appreciation (depreciation) until the contracts are closed, when they are recorded as realized gains (losses) on futures contracts.
| 10. | Interest Rate Caps and Floors, Swap Contracts and Options |
The Fund entered into over-the-counter transactions involving interest rate caps and floors, swap contracts, or purchased and written (sold) options to enter into such contracts, in order to manage its exposure to credit, currency, equity, interest rate and inflation risk.
In interest rate caps and floor agreements, one party agrees to make payments only when interest rates exceed a specified rate or “cap” or fall below a specified rate or “floor,” usually in return for payment of a fee by the other party. Interest rate caps and floors entitle the purchaser, to the extent that a specified index exceeds or falls below a predetermined interest rate, to receive payments of interest on a notional principal amount from the party selling such interest rate caps or floors.
Swap contracts represent an agreement between counterparties to exchange cash flows based on the difference between two rates applied to a notional principal amount for a specified period. The most common type of interest rate swap involves the exchange of fixed-rate cash flows for variable-rate cash flows. Swaps ordinarily do not involve the exchange of principal between the parties. Purchased options on swap contracts (“swaptions”) give the holder the right, but not the obligation, to enter into a swap contract with the counterparty which has written the option on a date, at an interest rate, and with a notional amount as specified in the swaption agreement. If the counterparty to the swap transaction defaults, the Fund will be limited to contractual remedies pursuant to the agreements governing the transaction. There is no assurance that swap or swaption contract counterparties will be able to meet their obligations under the contracts or that, in the event of default, the Fund will succeed in pursuing contractual remedies. The Fund may thus assume the risk that payments owed to the Fund under a swap or swaption contract will be delayed, or not received at all. During the term of the swap agreement or swaption, unrealized gains or losses are recorded as a result of “marking to market.” When the swap agreement or swaption is terminated, the Fund will record a realized gain or loss equal to the difference between the proceeds from (or cost of) the closing transaction and the Fund’s basis in the contract, if any. Accrued interest and interest paid are recognized as unrealized and realized gain (loss), respectively. In each of the contracts, the Fund pays a premium to the counterparty in return for the swaption. These swaptions may be exercised by entering into a swap contract with the counterparty only on the date specified in each contract. The Fund also sold credit protection through credit default swaps. Under the terms of the swaps, the seller of the credit protection receives a periodic payment amount (premium) from the buyer that is a fixed percentage amount applied to a notional principal amount. In return, the seller agrees to pay the buyer the notional amount and take delivery of a debt instrument of the reference issuer of the same notional par amount if the reference entity is subject to a credit event (such as bankruptcy, failure to pay, or obligation acceleration) during the term of the swap.
A written option contract is a contract in which the writer of the option grants the buyer of the option the right to purchase from (call option) or sell to (put option) the writer a designated instrument at a specified price within a specified period of time. Options written (sold) are recorded as liabilities. When an option expires, the premium (original option value) is realized as a gain if the option was written or as a loss if the option was purchased. When the exercise of an option results in a cash settlement, the difference between the premium and the settlement proceeds is recognized as realized gain or loss. When securities are acquired or delivered upon exercise of an option, the acquisition cost or sale proceeds are adjusted by the amount of the premium. When an option is closed, the difference between the premium and the cost to close the position is realized as a gain or loss.
| 11. | Risks Associated with Collateralized Mortgage Obligations (“CMOs”) |
The net asset value of the Fund may be sensitive to interest rate fluctuations because the Fund may hold several instruments, including CMOs and other derivatives, whose values can be significantly impacted by interest rate movements. CMOs are obligations collateralized by a portfolio of mortgages or mortgage related securities. Payments of principal and interest on the mortgage are passed through to the holder of the CMOs on the same schedule as they are received, although certain classes of CMOs have priority over others with respect to the receipt of prepayments on the mortgages.
Therefore, the investment in CMOs may be subject to a greater or lesser risk of prepayment than other types of mortgage-related securities. CMOs may have a fixed or variable rate of interest.
| 12. | Dollar Roll Transactions |
The Fund entered into dollar rolls in which it sells debt securities for delivery currently and simultaneously contracts to repurchase similar, but not identical, securities at the same price or a lower price on an agreed date. The Fund receives compensation as consideration for entering into the commitment to repurchase. The compensation is the difference between the current sale price and the repurchase price (often referred to as the “drop”) as well as the interest earned on the cash proceeds of the initial sale. The Fund may also be compensated by the receipt of a commitment fee. As the holder, the counterparty receives all principal and interest payments, including prepayments, made with respect to the similar security. Dollar rolls may be renewed with a new sale and repurchase price with a cash settlement made at renewal without physical delivery of the securities subject to the contract.
43
Managers PIMCO Bond Fund
Notes to Financial Statements (continued)
Certain risks may arise upon entering into dollar rolls from the potential inability of counterparties to meet the terms of their commitments. Additionally, the value of such securities may change adversely before the Fund is able to repurchase them. There can be no assurance that the Fund’s use of the cash that it receives from a dollar roll will provide a return that exceeds its costs.
| 13. | New Accounting Pronouncements |
In April 2011, the Financial Accounting Standards Board (“FASB”) issued Accounting Standards Update (“ASU”) No. 2011-03 “Reconsideration of Effective Control for Repurchase Agreements.” ASU No. 2011-03 changes the assessment of effective control for repurchase agreements including dollar roll transactions. The new and revised accounting and disclosures are effective for interim and annual reporting periods beginning after December 15, 2011. At this time, management is evaluating the implications of ASU No.2011-03 and its impact on the financial statements.
In May 2011, the FASB issued ASU No. 2011-04 “Amendments to Achieve Common Fair Value Measurement and Disclosure Requirements in U.S. GAAP and IFRSs.” ASU No. 2011-04 requires common fair value measurement and disclosure requirements between U.S. GAAP and International Financial Reporting Standards. The new and revised disclosures are effective for interim and annual reporting periods beginning after December 15, 2011. At this time, management is evaluating the implications of ASU No. 2011-04 and its impact on the financial statements.
The Fund has determined that no additional material events or transactions occurred through the issuance of the Fund’s financial statements, which require additional disclosure in the Fund’s financial statements.
Tax Information (unaudited)
The Fund hereby designates the maximum amount allowable of its net taxable income as qualified dividends as provided in the Jobs and Growth Tax Relief Reconciliation Act of 2003. The 2011 Form 1099-DIV you receive for the Fund will show the tax status of all distributions paid to you during the year.
Pursuant to section 852 of the Internal Revenue Code, Managers PIMCO Bond Fund hereby designates $0, as a capital gain distribution with respect to the taxable year ended October 31, 2011, or if subsequently determined to be different, the net capital gains of such year.
44
Report of Independent Registered Public Accounting Firm
To the Board of Trustees of Managers Trust I and the Shareholders of Managers PIMCO Bond Fund:
In our opinion, the accompanying statement of assets and liabilities, including the schedule of portfolio investments, and the related statements of operations and of changes in net assets and the financial highlights present fairly, in all material respects, the financial position of Managers PIMCO Bond Fund (one of the series constituting Managers Trust I, hereafter referred to as the “Fund”) at October 31, 2011, the results of its operations for the year then ended, the changes in its net assets for each of two years in the period then ended and the financial highlights for the each of the five years in the period then ended, in conformity with accounting principles generally accepted in the United States of America. These financial statements and financial highlights (hereafter referred to as “financial statements”) are the responsibility of the Fund’s management; our responsibility is to express an opinion on these financial statements based on our audits. We conducted our audits of these financial statements in accordance with the standards of the Public Company Accounting Oversight Board (United States). Those standards require that we plan and perform the audits to obtain reasonable assurance about whether the financial statements are free of material misstatement. An audit includes examining, on a test basis, evidence supporting the amounts and disclosures in the financial statements, assessing the accounting principles used and significant estimates made by management, and evaluating the overall financial statement presentation. We believe that our audits, which included confirmation of securities at October 31, 2011 by correspondence with the custodian and brokers, provide a reasonable basis for our opinion.
PricewaterhouseCoopers LLP
Philadelphia, Pennsylvania
December 27, 2011
45
Trustees and Officers
The Trustees and Officers of the Trust, their business addresses, principal occupations for the past five years and dates of birth are listed below. The Trustees provide broad supervision over the affairs of the Trust and the Funds. The Trustees are experienced executives who meet periodically throughout the year to oversee the Fund’s activities, review contractual arrangements with companies that provide services to the Fund, and review the Fund’s performance. Unless otherwise noted, the address of each Trustee or Officer is the address of the Trust: 800 Connecticut Avenue, Norwalk, Connecticut 06854.
There is no stated term of office for Trustees. Trustees serve until their resignation, retirement or removal in accordance with the Trust’s organizational documents and policies adopted by the Board from time to time. The Chairman of the Trustees, President, Treasurer and Secretary of the Trust are elected by the Trustees annually. Other officers hold office at the pleasure of the Trustees.
Independent Trustees
The following Trustees are not “interested persons” of the Trust within the meaning of the 1940 Act:
| | |
Name, Date of Birth, Number of Funds Overseen in Fund Complex* | | Principal Occupation(s) During Past 5 Years and Other Directorships Held by Trustee |
| |
Jack W. Aber, 9/9/37 • Trustee since 2000 • Oversees 38 Funds in Fund Complex | | Professor of Finance, Boston University School of Management (1972-Present); Trustee of Appleton Growth Fund (1 portfolio); Trustee of Third Avenue Trust (5 portfolios); Trustee of Third Avenue Variable Trust (1 portfolio); Trustee of Aston Funds (26 portfolios). |
| |
William E. Chapman, II, 9/23/41 • Independent Chairman • Trustee since 2000 • Oversees 38 Funds in Fund Complex | | President and Owner, Longboat Retirement Planning Solutions (1998-Present); Hewitt Associates, LLC (part time) (provider of Retirement and Investment Education Seminars) (2002-2009); Trustee of Bowdoin College (2002-Present); Director of Harding, Loevner Funds, Inc. (6 portfolios); Trustee of Third Avenue Trust (5 portfolios); Trustee of Third Avenue Variable Trust (1 portfolio); Trustee of Aston Funds (26 portfolios). |
| |
Edward J. Kaier, 9/23/45 • Trustee since 2000 • Oversees 38 Funds in Fund Complex | | Attorney at Law and Partner, Teeters Harvey Gilboy & Kaier LLP (2007-Present); Attorney at Law and Partner, Hepburn Willcox Hamilton & Putnam, LLP (1977-2007); Trustee of Third Avenue Trust (5 portfolios); Trustee of Third Avenue Variable Trust (1 portfolio); Trustee of Aston Funds (26 portfolios). |
| |
Steven J. Paggioli, 4/3/50 • Trustee since 2000 • Oversees 38 Funds in Fund Complex | | Consultant (2001-Present); Formerly Executive Vice President and Director, The Wadsworth Group (1986-2001); Executive Vice President, Secretary and Director, Investment Company Administration, LLC (1990-2001); Vice President, Secretary and Director, First Fund Distributors, Inc. (1991-2001); Trustee, Professionally Managed Portfolios (40 portfolios); Advisory Board Member, Sustainable Growth Advisors, LP; Independent Director, Chase Investment Counsel (2008 – Present); Trustee of Aston Funds (26 portfolios). |
| |
Eric Rakowski, 6/5/58 • Trustee since 2000 • Oversees 38 Funds in Fund Complex | | Professor, University of California at Berkeley School of Law (1990-Present); Director of Harding, Loevner Funds, Inc. (6 portfolios); Trustee of Third Avenue Trust (5 portfolios); Trustee of Third Avenue Variable Trust (1 portfolio); Trustee of Aston Funds (26 portfolios). |
| |
Thomas R. Schneeweis, 5/10/47 • Trustee since 2000 • Oversees 38 Funds in Fund Complex | | Professor of Finance, University of Massachusetts (1977-Present); Director, CISDM at the University of Massachusetts, (1996-Present); President, Alternative Investment Analytics, LLC, (formerly Schneeweis Partners, LLC) (2001-Present); Partner, S Capital Management, LLC (2007-Present); Partner, TRS Associates (1982-Present); Trustee of Aston Funds (26 portfolios). |
| * | The Fund Complex consists of Managers AMG Funds, The Managers Funds, Managers Trust I and Managers Trust II. |
Interested Trustees
Each Trustee in the following table is an “interested person” of the Trust within the meaning of the 1940 Act. Mr. Streur is an interested person of the Trust within the meaning of the 1940 Act by virtue of his positions with the Investment Manager and Managers Distributors, Inc. and because of his service as President of the Trust. Ms. Carsman is an interested person of the Trust within the meaning of the 1940 Act by virtue of her position with, and interest in securities of, AMG, and her former position as Chief Legal Officer of the Trust.
| | |
Name, Date of Birth, Number of Funds Overseen in Fund Complex* | | Principal Occupation(s) During Past 5 Years and Other Directorships Held by Trustee |
| |
John H. Streur, 2/6/60 • Trustee since 2008 • President since 2008 • Oversees 38 Funds in Fund Complex | | Senior Managing Partner, Managers Investment Group LLC (2006-Present); President, Managers Distributors, Inc. (2006-Present); Managing Partner, Managers Investment Group LLC (2005-2006); Chief Executive Officer, President and Chief Operating Officer, The Burridge Group LLC (1996-2004). |
| |
Christine C. Carsman, 4/2/52 • Trustee since 2011 • Oversees 38 Funds in Fund Complex | | Deputy General Counsel, Affiliated Managers Group, Inc. (2011-Present); Senior Vice President and Chief Regulatory Counsel, Affiliated Managers Group, Inc. (2004-Present); Secretary and Chief Legal officer, Managers AMG Funds, The Managers Funds, Managers Trust I and Managers Trust II (2004-2011); Senior Counsel, Vice President and Director of Operational Risk Management and Compliance, Wellington Management Company, LLP (1995-2004). |
Officers
| | |
Name, Date of Birth, Position(s) Held with Fund and Length of Time Served | | Principal Occupation(s) During Past 5 Years |
| |
Lewis Collins, 2/22/66 • Secretary since 2011 • Chief Legal Officer since 2011 | | Senior Counsel, Affiliated Managers Group, Inc. (2002-Present); Senior Vice President, Affiliated Managers Group, Inc. (2010-Present); Vice President, Affiliated Managers Group, Inc. (2006-2010); Director, Affiliated Managers Group, Inc. (2002-2006); Attorney, Ropes & Gray LLP (1998-2002). |
| |
Donald S. Rumery, 5/29/58 • Chief Financial Officer since 2007 • Treasurer since 2000 | | Senior Vice President, Managers Investment Group LLC (2005-Present); Treasurer and Chief Financial Officer, Managers Distributors, Inc. (2000-Present); Treasurer, The Managers Funds (1995-Present); Treasurer, Managers AMG Funds (1999-Present); Treasurer, Managers Trust II (2000-Present); Chief Financial Officer, The Manager Funds, Managers AMG Funds and Managers Trust II (2007-Present); Vice President, The Managers Funds LLC, (1994-2004). |
| |
Keitha L. Kinne, 5/16/58 • Chief Operating Officer since 2007 | | Managing Partner and Chief Operating Officer, Managers Investment Group LLC (2007-Present); Chief Operating Officer, The Managers Funds, Managers AMG Funds and Managers Trust II (2007-Present); Chief Investment Officer, Managers Investment Group LLC (2008-Present); Managing Director, Legg Mason & Co., LLC (2006-2007); Managing Director, Citigroup Asset Management (2004-2006). |
| |
John J. Ferencz, 3/09/62 • Chief Compliance Officer since 2010 | | Vice President, Legal and Compliance, Managers Investment Group LLC (2010-Present); Senior Compliance Analyst, Mutual Funds and Regulatory, GE Asset Management Incorporated (2005-2010). |
| |
Michael S. Ponder, 9/12/73 • Assistant Secretary since 2011 | | Senior Vice President and Counsel, Managers Investment Group LLC (2011-Present); Attorney, DeNovo Legal (2009-2010); Vice President, Credit Suisse (2007-2009); Associate, Willkie Farr & Gallagher LLP (2006-2007). |
46
Annual Renewal of Investment Advisory Agreements
On June 9-10, 2011, the Board of Trustees, including a majority of the Trustees who are not “interested persons” of the Trust (the “Independent Trustees”), approved the Investment Management Agreement with the Investment Manager for the Managers PIMCO Bond Fund (the “Fund”) and the Subadvisory Agreement for the Subadvisor of the Fund. The Independent Trustees were separately represented by independent counsel in connection with their consideration of the approval of these agreements. In considering the Investment Management and Subadvisory Agreements, the Trustees reviewed a variety of materials relating to the Fund, the Investment Manager and the Subadvisor, including comparative performance, fee and expense information for an appropriate peer group of similar mutual funds (the “Peer Group”), performance information for the relevant benchmark index (the “Fund Benchmark”) and, with respect to the Subadvisor, comparative performance information for an appropriate peer group of managed accounts, and, as to all other matters, other information provided to them on a periodic basis throughout the year, as well as information provided in connection with the meetings of June 9-10, 2011, regarding the nature, extent and quality of services provided by the Investment Manager and the Subadvisor under their respective agreements. Prior to voting, the Independent Trustees: (a) reviewed the foregoing information with their independent legal counsel and with management; (b) received materials from their independent legal counsel discussing the legal standards applicable to their consideration of the Investment Management Agreement and the Subadvisory Agreement; and (c) met with their independent legal counsel in private sessions at which no representatives of management were present.
Nature, extent, and quality of services
In considering the nature, extent and quality of the services provided by the Investment Manager, the Trustees reviewed information relating to the Investment Manager’s operations and personnel. Among other things, the Investment Manager provided financial information, biographical information on its supervisory and professional staff and descriptions of its organizational and management structure. The Trustees also took into account information provided periodically throughout the previous year by the Investment Manager relating to the performance of its duties with respect to the Fund and the Trustees’ familiarity with the Investment Manager’s management through Board meetings, discussions and reports. In the course of their deliberations regarding the Investment Management Agreement, the Trustees evaluated, among other things: (a) the extent and quality of the Investment Manager’s oversight of the operation and management of the Fund; (b) the quality of the search, selection and monitoring services performed by the Investment Manager in overseeing the portfolio management responsibilities of the Subadvisor; (c) the Investment Manager’s ability to supervise the Fund’s other service providers; and (d) the Investment Manager’s compliance programs. The Trustees also took into account the financial condition of the Investment Manager with respect to its ability to provide the services required under the Investment Management Agreement and to maintain a contractual expense limitation for the Fund. The Trustees also considered the Investment Manager’s risk management processes.
The Trustees also reviewed information relating to the Subadvisor’s operations and personnel and the investment philosophy, strategies and techniques (the “Investment Strategy”) used in managing the Fund. Among other things, the Trustees reviewed biographical information on portfolio management and other professional staff, information regarding the Subadvisor’s organizational and management structure and the Subadvisor’s brokerage policies and practices. The Trustees considered specific information provided regarding the experience of the individual or individuals at the Subadvisor with portfolio management responsibility for the Fund, including the information set forth in the Fund’s prospectus and statement of additional information. In the course of their deliberations, the Trustees evaluated, among other things: (a) the services rendered by the Subadvisor in the past; (b) the qualifications and experience of the Subadvisor’s personnel; and (c) the Subadvisor’s compliance programs. The Trustees also took into account the financial condition of the Subadvisor with respect to its ability to provide the services required under the Subadvisory Agreement. The Trustees also considered the Subadvisor’s risk management processes.
Performance
Among other information relating to the Fund’s performance, the Trustees noted that the Fund’s performance for the 1-year, 3-year, 5-year and 10-year periods ended March 31, 2011 was above the median performance of the Peer Group and above the performance of the Fund Benchmark, the Barclays Capital U.S. Aggregate Bond Index®. The Board also took into account management’s discussion of the Fund’s performance. The Trustees concluded that the Fund’s performance has been satisfactory.
As noted above, the Board considered the Fund’s net performance during relevant time periods as compared to the Fund’s Peer Group and Fund Benchmark and considered the Subadvisor’s performance as compared to an appropriate peer group of managed accounts and also considered the gross performance of the Fund as compared to the Subadvisor’s relevant performance composite that utilizes the same investment strategy and approach and noted that the Board reviews on a quarterly basis detailed information about the Fund’s performance results, portfolio composition and Investment Strategies. The Board noted the Investment Manager’s expertise and resources in monitoring the performance, investment style and risk-adjusted performance of the Subadvisor. The Board was mindful of the Investment Manager’s attention to monitoring the Subadvisor’s performance with respect to the Fund and its discussions with management regarding the factors that contributed to the performance of the Fund.
Advisory and Subadvisory Fees and Profitability
In considering the reasonableness of the advisory fee charged by the Investment Manager for managing the Fund, the Trustees noted that the Investment Manager, and not the Fund, is responsible for paying the fees charged by the Fund’s Subadvisor and, therefore, that the fees paid to the Investment Manager cover the cost of providing portfolio management services as well as the cost of providing
47
Annual Renewal of Investment Advisory Agreements (continued)
search, selection and monitoring services in operating a “manager-of-managers” complex of mutual funds. The Trustees concluded that, in light of the additional high quality supervisory services provided by the Investment Manager and the fact that the subadvisory fees are paid out of the advisory fee, the advisory fee payable by the Fund to the Investment Manager can reasonably be expected to exceed the median advisory fee for the Peer Group, which consists of many funds that do not operate with a manager-of-managers structure. In this regard, the Trustees also noted that the Investment Manager has undertaken to maintain an expense limitation for the Fund.
In considering the reasonableness of the advisory fee payable to the Investment Manager, the Trustees also reviewed information provided by the Investment Manager setting forth all revenues and other benefits, both direct and indirect (including any so-called “fallout benefits” such as reputational value derived from the Investment Manager serving as Investment Manager to the Fund), received by the Investment Manager and its affiliates attributable to managing the Fund and all the mutual funds in the Managers Family of Funds, the cost of providing such services and the resulting profitability to the Investment Manager and its affiliates from these relationships. The Trustees also noted the current and potential asset levels of the Fund and the willingness of the Investment Manager to waive fees and pay expenses for the Fund from time to time as a means of limiting the total expenses of the Fund. The Trustees also considered management’s discussion of the current asset level of the Fund, including the effect on assets attributable to the economic and market conditions since 2008, and considered the impact on profitability of the current asset level and any future growth of assets of the Fund. The Board took into account management’s discussion of the current advisory fee structure. The Trustees also noted that the subadvisory fees are paid by the Investment Manager out of its advisory fee. Based on the foregoing, the Trustees concluded that the profitability to the Investment Manager is reasonable and that the Investment Manager is not realizing material benefits from economies of scale that would warrant adjustments to the advisory fees for the Fund at this time. With respect to economies of scale, the Trustees also noted that as the Fund’s assets increase over time, the Fund may realize other economies of scale to the extent that the increase in assets is proportionally greater than the increase in certain other expenses.
In considering the reasonableness of the fee payable by the Investment Manager to the Subadvisor, the Trustees relied on the ability of the Investment Manager to negotiate the terms of the Subadvisory Agreement at arm’s length as part of the manager-of-managers structure, noting that the Subadvisor is not affiliated with the Investment Manager. In addition, the Trustees considered other potential benefits of the subadvisory relationship to the Subadvisor, including, among others, the indirect benefits that the Subadvisor may receive from the Subadvisor’s relationship with the Fund, including any so-called “fallout benefits” to the Subadvisor, such as reputational value derived from the Subadvisor serving as Subadvisor to the Fund, which bears the Subadvisor’s name. In addition, the Trustees noted that the subadvisory fees are paid by the Investment Manager out of its advisory fee. Accordingly, the cost of services to be provided by the Subadvisor and the profitability to the Subadvisor of its relationship with the Fund were not material factors in the Trustees’ deliberations. For similar reasons, and based on the current size of the Fund, the Trustees concluded that any economies of scale being realized by the Subadvisor was not a material factor in the Trustees’ deliberations at this time.
The Trustees noted that the Fund’s advisory fees (which include both the advisory and administration fee) and total expenses (net of applicable expense waivers/reimbursements) as of March 31, 2011 were higher and lower, respectively, than the average for the Peer Group. The Trustees took into account the fact that the Investment Manager has contractually agreed, through March 1, 2012, to limit the Fund’s net annual operating expenses (subject to certain excluded expenses) to 0.58%. The Trustees also took into account management discussion of the Fund’s expenses. The Trustees concluded that, in light of the nature, extent and quality of the services provided by the Investment Manager and the Subadvisor, the Fund’s performance, the foregoing expense limitation and the considerations noted above with respect to the Subadvisor and the Investment Manager, the Fund’s advisory fees, including subadvisory fees, are reasonable.
* * * *
After consideration of the foregoing, the Trustees also reached the following conclusions (in addition to the conclusions discussed above) regarding the Investment Management Agreement and the Subadvisory Agreement: (a) the Investment Manager and the Subadvisor have demonstrated that they possess the capability and resources to perform the duties required of them under the Investment Management Agreement and the Subadvisory Agreement; (b) the Subadvisor’s Investment Strategy is appropriate for pursuing the Fund’s investment objectives; and (c) the Investment Manager and the Subadvisor maintain appropriate compliance programs.
Based on all of the above-mentioned factors and related conclusions, with no single factor or conclusion being determinative and with each Trustee not necessarily attributing the same weight to each factor, the Trustees concluded that approval of the Investment Management Agreement and the Subadvisory Agreement would be in the best interests of the Fund and its shareholders. Accordingly, on June 9-10, 2011, the Trustees, including a majority of the Independent Trustees, voted to approve the Investment Management Agreement and the Subadvisory Agreement for the Fund.
48
THIS PAGE INTENTIONALLY LEFT BLANK
THIS PAGE INTENTIONALLY LEFT BLANK
THIS PAGE INTENTIONALLY LEFT BLANK
Investment Manager and Administrator
Managers Investment Group LLC
333 W. Wacker Drive
Suite 1200
Chicago, IL 60606
(800) 835-3879
Distributor
Managers Distributors, Inc.
333 W. Wacker Drive
Suite 1200
Chicago, IL 60606
(800) 835-3879
Custodian
The Bank of New York Mellon
2 Hanson Place
Brooklyn, New York 11217
Legal Counsel
Ropes & Gray LLP
Prudential Tower, 800 Boylston Street
Boston, Massachusetts 02199-3600
Transfer Agent
BNY Mellon Investment Servicing (US) Inc.
Attn: Managers
P.O. Box 9769
Providence, Rhode Island 02940
(800) 548-4539
For Managers Choice Only
Managers
c/o BNY Mellon Investment Servicing (US) Inc.*
P.O. Box 9847
Providence, Rhode Island 02940-8047
(800) 358-7668
| * | formerly PNC Global Investment Servicing (U.S.) Inc. |
MANAGERSAND MANAGERS AMG FUNDS
| | | | |
EQUITY FUNDS | | BALANCED FUNDS |
| CADENCE CAPITAL APPRECIATION | | INTERNATIONAL EQUITY | | CHICAGO EQUITY PARTNERS BALANCED |
| CADENCE FOCUSED GROWTH | | AllianceBernstein L.P. | | Chicago Equity Partners, LLC |
CADENCE MID-CAP | | Lazard Asset Management, LLC | | |
CADENCE EMERGING COMPANIES | | Martin Currie Inc. | | ALTERNATIVE FUNDS |
Cadence Capital Management, LLC | | | | |
| | REAL ESTATE SECURITIES | | FQ GLOBAL LTERNATIVES |
CHICAGO EQUITY PARTNERS MID -CAP | | Urdang Securities Management, Inc. | | FQ GLOBAL ESSENTIALS |
Chicago Equity Partners, LLC | | | | First Quadrant, L.P. |
| | RENAISSANCE LARGE CAP GROWTH | | |
EMERGING MARKETS EQUITY | | Renaissance Group LLC | | INCOME FUNDS |
xiter Capital Management Limited | | | | |
| | SKYLINE SPECIAL EQUITIES | | BOND (MANAGERS) |
Schroder Investment Management North America Inc. | | | | |
| | PORTFOLIO | | FIXED INCOME |
| | Skyline Asset Management, L.P. | | GLOBAL BOND |
ESSES SMALL/MICRO CAP G ROWTH | | | | Loomis, Sayles & Co., L.P. |
Essex Investment Management Co., LLC | | SPECIAL EQUITY | | |
| | Ranger Investment Management, L.P. | | BOND (MANAGERS PIMCO) |
FQ TAX-MANAGED U.S. EQUITY | | Lord, Abbett & Co. LLC | | Pacific Investment Management Co. LLC |
FQ U.S. EQUITY | | Smith Asset Management Group, L.P. | | |
First Quadrant, L.P. | | Federated MDTA LLC | | CALIFORNIA INTERMEDIATE TAX-FREE |
| | | | Miller Tabak Asset Management LLC |
FRONTIER SMALL CAP GROWTH | | SYSTEMATIC VALUE | | |
Frontier Capital Management Company, LLC | | SYSTEMATIC MID CAP VALUE | | GW&K MUNICIPAL BOND |
| | Systematic Financial Management, L.P. | | GW&K MUNICIPAL ENHANCED YIELD |
GW&K SMALL CAP EQUITY | | | | Gannett Welsh & Kotler, LLC |
Gannett Welsh & Kotler, LLC | | TIMESSQUARE MID CAP GROWTH | | |
| | TIMESSQUARE SMALL CAP GROWTH | | HIGH YIELD |
MICRO-CAP | | TSCM GROWTH EQUITY | | J.P. Morgan Investment Management LLC |
Lord, Abbett & Co. LLC | | TimesSquare Capital Management, LLC | | |
WEDGE Capital Management L.L.P. | | | | INTERMEDIATE DURATION GOVERNMENT |
Next Century Growth Investors LLC | | TRILOGY GLOBAL EQUITY | | SHORT DURATION GOVERNMENT |
RBC Global Asset Management (U.S.) Inc. | | TRILOGY EMERGING MARKETS EQUITY | | Smith Breeden Associates, Inc. |
| | TRILOGY INTERNATIONAL SMALL CAP | | |
| | Trilogy Global Advisors, L.P. | | |
This report is prepared for the Fund’s shareholders. It is authorized for distribution to prospective investors only when preceded or accompanied by an effective prospectus. To receive a free copy of the prospectus or Statement of Additional Information, which includes additional information about Fund Trustees, please contact us by calling 800.835.3879. Distributed by Managers Distributors, Inc., member FINRA.
A description of the policies and procedures each Fund uses to vote its proxies is available: (i) without charge, upon request, by calling 800.835.3879, or (ii) on the Securities and Exchange Commission’s (SEC) Web site at www. sec.gov. For information regarding each Fund’s proxy voting record for the 12-month period ended June 30, call 800.835.3879 or visit the SEC Web site at www.sec.gov.
The Fund files its complete schedule of portfolio holdings with the SEC for the first and third quarters of each fiscal year on Form N-Q. The Funds’ Forms N-Q are available on the SEC’s Web site at www.sec.gov. A Fund’s Forms N-Q may be reviewed and copied at the SEC’s Public Reference Room in Washington, DC. Information on the operation of the Public Reference Room may be obtained by calling 800.SEC.0330. To review a complete list of the Fund’s portfolio holdings, or to view the most recent quarterly holdings report, semiannual report, or annual report, please visit www.managersinvest.com.

Item 2. CODE OF ETHICS
Registrant has adopted a Code of Ethics. See attached Exhibit (a)(1).
Item 3. AUDIT COMMITTEE FINANCIAL EXPERT
Registrant’s Board of Trustees has determined that independent Trustees Mr. Jack W. Aber and Mr. Steven J. Paggioli each qualify as the Audit Committee Financial Expert. Mr. Aber and Mr. Paggioli are “independent” as such term is defined in Form N-CSR.
Item 4. PRINCIPAL ACCOUNTANT FEES AND SERVICES
The aggregate fees billed by PwC to the Fund for the Funds’ two most recent fiscal years for professional services rendered for audits of annual financial statements, or services that are normally provided in connection with statutory and regulatory filings or engagements (“Audit Fees”) were as follows:
| | | | | | | | |
| | | Fiscal 2011 | | | Fiscal 2010 | |
Managers AMG FQ Tax-Managed U.S. Equity Fund | | | 20,863 | | | | 20,454 | |
Managers AMG FQ U.S. Equity Fund | | | 20,735 | | | | 20,328 | |
Managers AMG FQ Global Alternatives Fund | | | 28,266 | | | | 27,712 | |
Managers AMG FQ Global Essentials Fund | | | 23,289 | | | | 22,832 | |
Managers Frontier Small Cap Growth Fund | | | 18,920 | | | | 18,549 | |
Managers Micro-Cap Fund | | | 20,248 | | | | 18,851 | |
Managers Institutional Micro-Cap Fund | | | — | | | | 18,931 | |
Managers Real Estate Securities Fund | | | 20,164 | | | | 19,769 | |
Managers PIMCO Bond Fund | | | 41,807 | | | | 40,987 | |
Managers CA Intermediate Tax-Free Fund | | | 19,893 | | | | 19,503 | |
Managers AMG TSCM Growth Equity Fund | | | 15,320 | | | | 12,000 | |
Audit-Related Fees
There were no fees billed by PwC to the Fund in its two recent fiscal years for services rendered for assurance and related services that are reasonably related to the performance of the audit or review of the Fund’s financial statements, but are not reported as Audit Fees (“Audit-Related Fees”).
For the Funds’ two most recent fiscal years, there were no Audit-Related Fees billed by PwC for engagements related directly to the operations and financial reporting of one or more Funds by a Fund Service Provider. A Fund Service Provider is (a) any investment adviser to the Fund (not including any Subadvisor whose role is primarily
portfolio management and is subcontracted with or overseen by another investment adviser) or (b) any entity that provides ongoing services to the Fund and is controlling, controlled by or under common control with a Fund investment adviser described in (a).
Tax Fees
The aggregate fees billed by PwC to the Funds for the two most recent fiscal years for professional services rendered for tax compliance, tax advice, and tax planning (“Tax Fees”) were as follows:
| | | | | | | | |
| | | Fiscal 2011 | | | Fiscal 2010 | |
Managers AMG FQ Tax-Managed U.S. Equity Fund | | | 6,700 | | | | 6,900 | |
Managers AMG FQ U.S. Equity Fund | | | 6,700 | | | | 6,900 | |
Managers AMG FQ Global Alternatives Fund | | | 9,500 | | | | 11,200 | |
Managers AMG FQ Global Essentials Fund | | | 9,500 | | | | 9,600 | |
Managers Frontier Small Cap Growth Fund | | | 6,700 | | | | 6,650 | |
Managers Micro-Cap Fund | | | 6,700 | | | | 6,500 | |
Managers Institutional Micro-Cap Fund | | | 6,700 | | | | 5,800 | |
Managers Real Estate Securities Fund | | | 8,750 | | | | 10,100 | |
Managers PIMCO Bond Fund | | | 10,500 | | | | 11,200 | |
Managers CA Intermediate Tax-Free Fund | | | 6,700 | | | | 8,500 | |
Managers AMG TSCM Growth Equity Fund | | | 4,250 | | | | 5,300 | |
Fund commenced operations on August 1, 2010
For the Funds’ two most recent fiscal years, Tax Fees billed by PwC for engagements by Fund Service Providers that related directly to the operations and financial reporting of the Funds were $0 for fiscal 2007 and $0 for fiscal 2006, respectively.
The services for which Tax Fees were charged comprise all services performed by professional staff in PwC’s tax division except those services related to the audit. Typically, this category would include fees for tax compliance, tax planning, and tax advice. Tax compliance, tax advice, and tax planning services include preparation of original and amended tax returns, claims for refund and tax payment-planning services, assistance with tax audits and appeals, tax advice related to mergers and acquisitions and requests for rulings or technical advice from taxing authorities.
All Other Fees
There were no other fees billed by PwC to the Funds for all other non-audit services (“Other Fees”) during the Funds’ two most recent fiscal years. During the same period, there were no Other Fees billed by PwC for engagements by Fund Service Providers that related directly to the operations and financial reporting of the Funds.
According to policies adopted by the Audit Committee, services provided by PwC to the Funds must be pre-approved by the Audit Committee. On an annual basis, the Audit Committee reviews and pre-approves various types of services that PwC may perform for the Funds without specific approval of each engagement, subject to specified budget limitations. As contemplated by the Sarbanes-Oxley Act of 2002 and related SEC rules, the Audit Committee also pre-approves non-audit services provided by PwC to any Fund Service Provider for any engagement that relates directly to the operations and financial reporting of the Funds. Any engagement that is not already pre-approved or that will exceed a pre-approved budget must be submitted to the Audit Committee for pre-approval. The Chairman of the Audit Committee is authorized on behalf of the Board of Trustees and the Audit Committee to approve the engagement of PwC to perform non-audit services subject to certain conditions, including notification to the Audit Committee of such pre-approval not later than the next meeting of the Audit Committee following the date of such pre-approval.
There were no other fees billed by PwC for non-audit services rendered to the Funds and to Fund Service Providers for the Funds’ two most recent fiscal years.
The Audit Committee has considered whether the provision of non-audit services by PwC to Fund Service Providers that were not required to be pre-approved by the Audit Committee is compatible with maintaining PwC’s independence in its audit of the Funds, taking into account representations from PwC, in accordance with Independence Standards Board Standard No. 1, regarding its independence from the Funds and its related entities.
The following table sets forth the non-audit services provided by PwC to the Funds and its service affiliates defined as the Funds’ investment advisor and any entity controlling, controlled by or under common control with Managers Investment Group LLC that provides ongoing services to the Funds (“Control Affiliates”) for the last two fiscal years.
| | | | | | | | | | | | | | | | | | | | | | | | |
| | | Audit-related fees A | | | Tax fees A | | | All other fees A | |
| | | 2010 | | | 2009 | | | 2010 | | | 2009 | | | 2010 | | | 2009 | |
Control Affiliates | | $ | 424,730 | | | $ | 580,765 | | | $ | 747,820 | | | $ | 479,175 | | | $ | 0 | | | $ | 0 | |
| A | Aggregate amounts may reflect rounding. |
Item 5. AUDIT COMMITTEE OF LISTED REGISTRANTS
Not applicable.
Item 6. SCHEDULE OF INVESTMENTS
The schedule of investments in unaffiliated issuers as of the close of the reporting period is included as part of the shareholder report contained in Item 1 hereof.
Item 7. DISCLOSURE OF PROXY VOTING POLICIES AND PROCEDURES FOR CLOSED-END MANAGEMENT INVESTMENT COMPANIES
Not applicable.
Item 8. PORTFOLIO MANAGERS OF CLOSED-END MANAGEMENT INVESTMENT COMPANIES
Not applicable.
Item 9. PURCHASES OF EQUITY SECURITIES BY CLOSED-END MANAGEMENT INVESTMENT COMPANIES AND AFFILIATED PURCHASERS
Not applicable.
Item 10. SUBMISSION OF MATTERS TO A VOTE OF SECURITY HOLDERS
Not applicable.
Item 11. CONTROLS AND PROCEDURES
(a) The Registrant’s principal executive and principal financial officers have concluded, based on their evaluation of the registrant’s disclosure controls and procedures as of a date within 90 days of the filing of this report, that the Registrant’s disclosure controls and procedures are reasonably designed to ensure that information required to be disclosed by the Registrant on Form N-CSR is recorded, processed, summarized and reported within the required time periods and that information required to be disclosed by the registrant in the reports that it files or submits on Form N-CSR is accumulated and communicated to the Registrant’s management, including its principal executive and principal financial officers, as appropriate to allow timely decisions regarding required disclosure.
(b) There were no changes in the Registrant’s internal control over financial reporting during the Registrant’s fourth fiscal quarter of the period covered by this report that have materially affected, or are reasonably likely to affect, the internal control over financial reporting.
Item 12. EXHIBITS
| | |
| (a)(1) | | Any Code of Ethics or amendments hereto. Filed herewith. |
| |
| (a)(2) | | Certifications pursuant to Rule 30a-2(a) under the Investment Company Act of 1940 - Filed herewith. |
| |
| (a)(3) | | Not applicable. |
| |
| (b) | | Certifications pursuant to Rule 30a-2(b) under the Investment Company Act of 1940 - Filed herewith. |
SIGNATURES
Pursuant to the requirements of the Securities Exchange Act of 1934 and the Investment Company Act of 1940, the registrant has duly caused this report to be signed on its behalf by the undersigned, thereunto duly authorized.
MANAGERS TRUST I
| | |
| By: | | /s/ Keitha L. Kinne |
| | Keitha L. Kinne, Chief Operating Officer |
| |
| Date: | | January 9, 2012 |
Pursuant to the requirements of the Securities Exchange Act of 1934 and the Investment Company Act of 1940, this report has been signed below by the following persons on behalf of the registrant and in the capacities and on the dates indicated.
| | |
| By: | | /s/ Keitha L. Kinne |
| | Keitha L. Kinne, Chief Operating Officer |
| |
| Date: | | January 9, 2012 |
| |
| By: | | /s/ Donald S. Rumery |
| | Donald S. Rumery, Chief Financial Officer |
| |
| Date: | | January 9, 2012 |