UNITED STATES
SECURITIES AND EXCHANGE COMMISSION
Washington, D.C. 20549
FORM N-CSR
CERTIFIED SHAREHOLDER REPORT OF
REGISTERED MANAGEMENT INVESTMENT COMPANIES
Investment Company Act file number: 811-06520
MANAGERS TRUST I
(Exact name of registrant as specified in charter)
| | |
| 800 Connecticut Avenue, Norwalk, Connecticut | | 06854 |
| (Address of principal executive offices) | | (Zip code) |
Managers Investment Group LLC
800 Connecticut Avenue, Norwalk, Connecticut 06854
(Name and address of agent for service)
Registrant’s telephone number, including area code: (203) 299-3500
Date of fiscal year end: OCTOBER 31
Date of reporting period: NOVEMBER 1, 2009 – OCTOBER 31, 2010
(Annual Shareholder Report)
| Item 1. | Reports to Shareholders |
ANNUAL REPORT
Managers AMG
October 31, 2010
FQ Tax-Managed U.S. Equity Fund
FQ U.S. Equity Fund
FQ Global Alternatives Fund
FQ Global Essentials Fund

Managers AMG FQ Funds
FQ Tax-Managed U.S. Equity, FQ U.S. Equity, FQ Global Alternatives, FQ Global Essentials
Annual Report—October 31, 2010
| | | | |
TABLE OF CONTENTS | | Page | |
| |
LETTER TO SHAREHOLDERS | | | 1 | |
| |
ABOUT YOUR FUND’S EXPENSES | | | 4 | |
| |
| INVESTMENT MANAGER’S COMMENTS, FUND SNAPSHOTS, AND SCHEDULES OF PORTFOLIO INVESTMENTS | | | | |
| |
FQ Tax-Managed U.S. Equity Fund | | | 5 | |
| |
FQ U.S. Equity Fund | | | 11 | |
| |
FQ Global Alternatives Fund | | | 18 | |
| |
FQ Global Essentials Fund | | | 20 | |
| |
FINANCIAL STATEMENTS: | | | | |
| |
Statements of Assets and Liabilities | | | 22 | |
| |
FQ Tax-Managed U.S. Equity and FQ U.S. Equity | | | | |
| |
Fund balance sheets, net asset value (NAV) per share computations and cumulative undistributed amounts | | | | |
| |
Statement of Net Assets | | | 23 | |
| |
FQ Global Alternatives and FQ Global Essentials | | | | |
| |
Portfolio of Investments, Fund balance sheet, net asset value (NAV) per share computations and cumulative undistributed amounts | | | | |
| |
Statements of Operations | | | 32 | |
| |
Detail of sources of income, Fund expenses, and realized and unrealized gains (losses) during the fiscal year | | | | |
| |
Statements of Changes in Net Assets | | | 33 | |
| |
Detail of changes in Fund assets for the past two fiscal years | | | | |
| |
FINANCIAL HIGHLIGHTS | | | 35 | |
| |
Historical net asset values per share, distributions, total returns, expense ratios, turnover ratios and net assets | | | | |
| |
NOTES TO FINANCIAL STATEMENTS | | | 42 | |
| |
Accounting and distribution policies, details of agreements and transactions with Fund management and affiliates, and descriptions of certain investment risks | | | | |
| |
REPORT OF INDEPENDENT REGISTERED PUBLIC ACCOUNTING FIRM | | | 50 | |
| |
TRUSTEES AND OFFICERS | | | 51 | |
| |
ANNUAL RENEWAL OF INVESTMENT ADVISORY AGREEMENTS | | | 52 | |
Nothing contained herein is to be considered an offer, sale or solicitation of an offer to buy shares of any series of the Managers Family of Funds. Such offering is made only by Prospectus, which includes details as to offering price and other material information.
Letter to Shareholders
Dear Shareholders:
Our foremost goal at Managers Investment Group (“MIG”) is to structure and manage mutual funds that will help our shareholders and clients successfully reach their investment goals and objectives.
Each of our Funds is geared to provide you with exposure to a specific asset class or style of investing. We believe investors tend to use our Funds as part of their broader portfolio in order to tailor their asset allocation to meet their individual needs. Most of our Funds, like those detailed in this report, are therefore designed to be building blocks.
At MIG, we have overall responsibility for the investment management and administration of the Funds. As a “manager of managers,” we work with external investment managers that make the day-to-day investment decisions in the Funds (the “Portfolio Managers”). We devote considerable resources to our disciplined process of identifying and selecting unaffiliated Portfolio Managers for the Funds. As a manager of managers, MIG performs many activities to monitor the ongoing investment, compliance, and administrative aspects of all of the Funds, which we believe gives our shareholders added confidence in their investments.
Our parent company, Affiliated Managers Group (“AMG”) is a global asset management company with ownership interests in a diverse group of boutique investment management firms (its “Affiliates”). MIG has the unique opportunity to access the investment skills and acumen of some of AMG’s Affiliates. The set of our Funds managed by these proprietary firms also benefits from our activities to monitor the investment, compliance, and administrative aspects of the Funds.
Below is a brief overview of the securities markets and the performance results of the Funds. Following this letter, we also provide the Portfolio Managers’ discussion of their investment management approach, performance results, and market outlook.
In anticipation of an enduring economic recovery, stocks and bonds posted strong gains over the past twelve months, especially in the U.S.; even after accounting for the weak results experienced during the second quarter when concerns over sovereign debt and the potential collapse of the Euro weighed heavily on the minds of investors. More specifically, riskier assets such as small-cap stocks and high yield bonds were among the performance leaders. After the brief setback during the second quarter, markets resumed their upward paths in the third quarter despite signs that economic growth had slowed, especially in the developed nations. Throughout the third quarter, investor optimism grew in anticipation of the next round of quantitative easing, also known as QE2. Then in mid-October during a speech in Boston, Federal Reserve Chairman, Ben Bernanke, provided a rather clear signal that the Fed is ready to engage in another round of quantitative easing in order to spur the U.S. economy. The Fed’s plan, while criticized by some well-known market participants, has apparently contributed to renewed strength in risk-based assets. Only time will tell as to whether this plan will achieve the Fed’s objectives.
Against this backdrop, for the one-year period ended October 31, 2010, the Managers AMG FQ U.S. Equity Fund (“U.S. Equity Fund”) returned 16.75% and the Managers AMG FQ Tax-Managed U.S. Equity Fund (“Tax-Managed Fund”) returned 24.92%, compared to 18.34% for the benchmark Russell 3000® Index. The Managers AMG FQ Global Alternatives Fund (“Global Alternatives Fund”) returned 2.71% compared to a return of 0.11% for its benchmark, the Citigroup 1-Month U.S. Treasury Bill Index, for the one-year period that ended October 31, 2010. Finally, the Managers AMG FQ Global Essentials
1
Letter to Shareholders (continued)
Fund (“Global Essentials Fund”) returned 15.50%, compared with 8.25% for its benchmark, which consists of 60% of the return of MSCI World (hedged) Index and 40% of the return of the Citigroup World Government Bond (hedged) Index for this same one-year period. Performance stated above is for each Fund’s Institutional Class except for Global Alternatives Fund which is Class A at Net Asset Value. Other share classes would have experienced different results.
| | | | | | | | | | | | | | | | | | | | | | | | |
Periods Ended 10/31/10 | | 6 Months | | | 1 Year | | | 3 Years | | | 5 Years | | | 10 Years | | | Inception
Date | |
FQ Tax-Managed U.S. Equity, Institutional Class | | | 2.90 | % | | | 24.92 | % | | | (8.80 | )% | | | 1.45 | % | | | — | | | | 12/18/2000 | |
Russell 3000® Index | | | 0.60 | % | | | 18.34 | % | | | (5.96 | )% | | | 2.08 | % | | | 0.62 | % | | | 12/18/2000 | |
FQ U.S. Equity, Institutional Class | | | 1.47 | % | | | 16.75 | % | | | (7.81 | )% | | | 2.09 | % | | | 0.07 | % | | | 8/14/1992 | |
Russell 3000® Index | | | 0.60 | % | | | 18.34 | % | | | (5.96 | )% | | | 2.08 | % | | | 0.62 | % | | | 8/14/1992 | |
FQ Global Alternatives, Class A (No Load) | | | 0.59 | % | | | 2.71 | % | | | 3.69 | % | | | — | | | | — | | | | 3/30/2006 | |
Citigroup 1-Month U.S. Treasury Bill Index1 | | | 0.08 | % | | | 0.11 | % | | | 0.72 | % | | | — | | | | — | | | | 3/31/2006 | |
FQ Global Essentials Fund, Institutional Class | | | 7.67 | % | | | 15.50 | % | | | (5.35 | )% | | | 2.42 | % | | | 1.77 | % | | | 11/18/1988 | |
60% MSCI World Index (hedged) & 40% Citigroup World Government Bond Index (hedged) | | | 1.07 | % | | | 8.25 | % | | | (3.58 | )% | | | 2.03 | % | | | 1.24 | % | | | 11/18/1988 | |
Performance for all share classes and detailed Fund positioning reviews are included within this report.
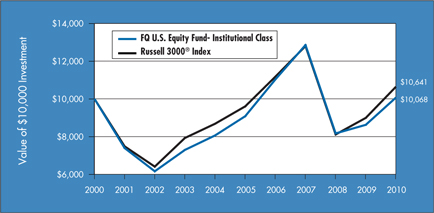
For the 12 months ended October 31, 2010, the Managers AMG FQ U.S. Equity Fund (Institutional Class) returned 16.75%, compared with 18.34% for its benchmark, the Russell 3000® Index. For the 12 months ended October 31, 2010, the Managers AMG FQ Tax-Managed U.S. Equity Fund (Institutional Class) returned 24.92%, compared with 18.34% for its benchmark, the Russell 3000® Index. While the U.S. Equity Fund failed to keep pace with its benchmark, the Tax-Managed Fund managed strong outperformance for the year. Stock selection was the primary driver of performance in both portfolios, with the U.S. Equity Fund underperforming primarily due to weakness within the information technology sector. The Tax-Managed Fund, however, experienced solid stock selection across a number of sectors including the consumer discretionary, financials, health care, and materials sectors. In addition, relative sector positioning added value despite maintaining a near neutral weighting versus the benchmark across a majority of sectors throughout the course of the past year. In particular, the Fund added value through its overweight to the recovering consumer discretionary sector, which boasted the strongest sector returns during this period.
The Fund’s subadvisor, First Quadrant L.P. (“First Quadrant”) has become somewhat more optimistic about the global economy in recent months as economic data has not been as gloomy as feared, the Federal Reserve has initiated a second round of quantitative easing, and earnings have pleasantly surprised. However, some of this has already been reflected in the market. From a sector standpoint, the Fund remains fairly neutral to the benchmark although the portfolio has begun to take more active positions from a risk factor standpoint. For example, the Fund has increasingly favored more volatile stocks and this was beneficial towards the latter portion of the fiscal year when the U.S. equity market rallied. In addition, the Fund has increased its preference for equities with good valuations, especially with respect to earnings. That said, some of these top-down factor tilts have been reined in recently including the Fund’s tilt towards small-cap equities which look much more fairly valued versus their larger-capitalization counterparts after an extended period of outperformance.
For the 12 months ended October 31, 2010, the Managers AMG FQ Global Alternatives Fund (Class A Shares at NAV) returned 2.71% while its benchmark, the Citigroup 1-Month U. S. Treasury Bill Index, returned 0.11%. During this period, the Global Alternatives Fund delivered positive performance while continuing to exhibit low correlation relative to broader markets. Within the Fund, solid performance was primarily driven by success within the bond country selection and currency selection strategies. The asset class selection strategy, along with the stock country selection strategy, offered mixed results throughout the last year.
2
Letter to Shareholders (continued)
The tactical risk allocation in the Fund currently finds the most compelling opportunity within the asset class selection strategy where it maintains a long position in global equities and a corresponding short position in global fixed income. This is driven by several factors within this particular strategy, including the more benign risk environment we recently entered into which should be more conducive to solid performance from equities. The currency selection strategy continues to have a significant weight within the Fund with its largest long positions to the U.K. Pound and U.S. Dollar and short positions to the Australian and Canadian Dollars. In the bond country selection strategy, the largest positions currently are a long to the U.S. bond market and shorts to the Australian and Canadian bond markets. Finally, the stock country selection strategy has the smallest risk allocation currently of the four strategies with its current largest active positions both on the short side (shorts to the Australian and Canadian equity markets).
For the 12 months ended October 31, 2010, the Managers AMG FQ Global Essentials Fund (Institutional Class) returned 15.50% while the benchmark, which consists of 60% of the return of MSCI World (hedged) Index and 40% of the return of the Citigroup World Government Bond (hedged) Index, returned 8.25% during this period. Strong absolute performance by the Fund over the past year was driven by investments within all three major asset classes in the portfolio, which include equities, fixed income, and hard assets (commodities and TIPS). The Fund also outperformed a 60\40 balanced benchmark significantly over the last year. This was primarily driven by strong performance within the equity and commodity portion of the Fund as well as by the risk-balanced nature of investments within the portfolio as opposed to using a market capitalization weighting scheme. For example, within equities, the Fund boasted strong performance relative to a 60\40 balanced benchmark because of increased exposure to U.S. small caps and REITs which continued to outperform U.S. large-cap securities. The portfolio also marginally benefited from “regime switching” over the last fiscal year which is the tactical reallocation of assets in the Fund based upon the prevailing risk environment that is driven by First Quadrant’s proprietary Market Risk Index.
The First Quadrant Market Risk Index, (one of FQ’s proprietary investment tools) is currently measuring a “Median Risk” environment as of the end of the fiscal year as, more recently, the VIX, a popular measure of the implied volatility of the S&P 500 Index, has dropped and credit spreads have also come in below their trigger levels. This has led to a recent increase in exposure to both equities and commodities and a decrease in exposure to the sovereign debt portion of the Fund.
The following report covers the one-year period that ended October 31, 2010. Should you have any questions about this report, or if you’d like to receive a prospectus and additional information, including fees and expenses for these or any of the other Funds in our family, please feel free to contact us at 1-800-835-3879, or visit our Web site at www.managersinvest.com. As always, please read the prospectus carefully before you invest or send money.
If you are curious about how you can better diversify your investment program, visit the Knowledge Center on our Web site and view our articles in the investment strategies section. You can rest assured that under all market conditions our team is focused on delivering excellent investment management services for your benefit.
We thank you for your continued confidence and investment in The Managers Funds.
|
| Respectfully, |
|
 |
| John H. Streur |
| Senior Managing Partner |
| Managers Investment Group LLC |
3
About Your Fund’s Expenses
As a shareholder of a Fund, you may incur two types of costs: (1) transaction costs, which may include sales charges (loads) on purchase payments; redemption fees; and exchange fees; and (2) ongoing costs, including management fees; distribution (12b-1) fees; and other Fund expenses. This example is intended to help you understand your ongoing costs (in dollars) of investing in the Fund and to compare these costs with the ongoing costs of investing in other mutual funds. The example is based on $1,000 invested at the beginning of the period and held for the entire period as indicated below.
Actual Expenses
The first line of the following table provides information about the actual account values and actual expenses. You may use the information in this line, together with the amount you invested, to estimate the expenses that you paid over the period. Simply divide your account value by $1,000 (for example, an $8,600 account value divided by $1,000 = 8.6), then multiply the result by the number in the first line under the heading entitled “Expenses Paid During Period” to estimate the expenses you paid on your account during this period.
Hypothetical Example for Comparison Purposes
The second line of the following table provides information about hypothetical account values and hypothetical expenses based on the Fund’s actual expense ratio and an assumed annual rate of return of 5% before expenses, which is not the Fund’s actual return. The hypothetical account values and expenses may not be used to estimate the actual ending account balance or expenses you paid for the period. You may use this information to compare the ongoing costs of investing in the Fund and other funds by comparing this 5% hypothetical example with the 5% hypothetical examples that appear in the shareholder reports of other funds.
Please note that the expenses shown in the table are meant to highlight your ongoing costs only and do not reflect any transactional costs, such as sales charges (loads), redemption fees, or exchange fees. Therefore, the second line of the table is useful in comparing ongoing costs only, and will not help you determine the relative total costs of owning different funds.
| | | | | | | | | | | | | | | | |
Six Months Ended October 31, 2010 | | Expense
Ratio for
the Period | | | Beginning
Account Value
05/01/10 | | | Ending
Account Value
10/31/10 | | | Expenses
Paid During
the Period* | |
FQ Tax-Managed U.S. Equity Fund | | | | | | | | | | | | | | | | |
Class A Shares | | | | | | | | | | | | | | | | |
Based on Actual Fund Return | | | 1.24 | % | | $ | 1,000 | | | $ | 1,028 | | | $ | 6.34 | |
Hypothetical (5% return before expenses) | | | 1.24 | % | | $ | 1,000 | | | $ | 1,019 | | | $ | 6.31 | |
Class C Shares | | | | | | | | | | | | | | | | |
Based on Actual Fund Return | | | 1.99 | % | | $ | 1,000 | | | $ | 1,024 | | | $ | 10.15 | |
Hypothetical (5% return before expenses) | | | 1.99 | % | | $ | 1,000 | | | $ | 1,015 | | | $ | 10.11 | |
Institutional Class Shares | | | | | | | | | | | | | | | | |
Based on Actual Fund Return | | | 0.99 | % | | $ | 1,000 | | | $ | 1,029 | | | $ | 5.06 | |
Hypothetical (5% return before expenses) | | | 0.99 | % | | $ | 1,000 | | | $ | 1,020 | | | $ | 5.04 | |
FQ U.S. Equity Fund | | | | | | | | | | | | | | | | |
Class A Shares | | | | | | | | | | | | | | | | |
Based on Actual Fund Return | | | 1.04 | % | | $ | 1,000 | | | $ | 1,015 | | | $ | 5.28 | |
Hypothetical (5% return before expenses) | | | 1.04 | % | | $ | 1,000 | | | $ | 1,020 | | | $ | 5.30 | |
Class C Shares | | | | | | | | | | | | | | | | |
Based on Actual Fund Return | | | 1.79 | % | | $ | 1,000 | | | $ | 1,011 | | | $ | 9.07 | |
Hypothetical (5% return before expenses) | | | 1.79 | % | | $ | 1,000 | | | $ | 1,016 | | | $ | 9.10 | |
Institutional Class Shares | | | | | | | | | | | | | | | | |
Based on Actual Fund Return | | | 0.79 | % | | $ | 1,000 | | | $ | 1,015 | | | $ | 4.01 | |
Hypothetical (5% return before expenses) | | | 0.79 | % | | $ | 1,000 | | | $ | 1,021 | | | $ | 4.02 | |
FQ Global Alternatives Fund | | | | | | | | | | | | | | | | |
Class A Shares | | | | | | | | | | | | | | | | |
Based on Actual Fund Return | | | 1.92 | % | | $ | 1,000 | | | $ | 1,006 | | | $ | 9.71 | |
Hypothetical (5% return before expenses) | | | 1.92 | % | | $ | 1,000 | | | $ | 1,016 | | | $ | 9.76 | |
Class C Shares | | | | | | | | | | | | | | | | |
Based on Actual Fund Return | | | 2.49 | % | | $ | 1,000 | | | $ | 1,004 | | | $ | 12.58 | |
Hypothetical (5% return before expenses) | | | 2.49 | % | | $ | 1,000 | | | $ | 1,013 | | | $ | 12.63 | |
Service Class Shares | | | | | | | | | | | | | | | | |
Based on Actual Fund Return | | | 1.71 | % | | $ | 1,000 | | | $ | 1,008 | | | $ | 8.65 | |
Hypothetical (5% return before expenses) | | | 1.71 | % | | $ | 1,000 | | | $ | 1,017 | | | $ | 8.69 | |
Institutional Class Shares | | | | | | | | | | | | | | | | |
Based on Actual Fund Return | | | 1.49 | % | | $ | 1,000 | | | $ | 1,009 | | | $ | 7.55 | |
Hypothetical (5% return before expenses) | | | 1.49 | % | | $ | 1,000 | | | $ | 1,017 | | | $ | 7.58 | |
FQ Global Essentials Fund | | | | | | | | | | | | | | | | |
Investor Class Shares | | | | | | | | | | | | | | | | |
Based on Actual Fund Return | | | 1.49 | % | | $ | 1,000 | | | $ | 1,076 | | | $ | 7.80 | |
Hypothetical (5% return before expenses) | | | 1.49 | % | | $ | 1,000 | | | $ | 1,018 | | | $ | 7.58 | |
Service Class Shares | | | | | | | | | | | | | | | | |
Based on Actual Fund Return | | | 1.24 | % | | $ | 1,000 | | | $ | 1,074 | | | $ | 6.48 | |
Hypothetical (5% return before expenses) | | | 1.24 | % | | $ | 1,000 | | | $ | 1,019 | | | $ | 6.31 | |
Institutional Class Shares | | | | | | | | | | | | | | | | |
Based on Actual Fund Return | | | 0.99 | % | | $ | 1,000 | | | $ | 1,077 | | | $ | 5.18 | |
Hypothetical (5% return before expenses) | | | 0.99 | % | | $ | 1,000 | | | $ | 1,020 | | | $ | 5.04 | |
| * | Expenses are equal to the Fund’s annualized expense ratio multiplied by the average account value over the period, multiplied by the number of days in the most recent fiscal half-year (184), then divided by 365. |
4
Managers AMG FQ Tax-Managed U.S. Equity Fund
Portfolio Manager’s Comments
For the fiscal year ended October 31, 2010, the Managers AMG FQ Tax-Managed U.S. Equity Fund (Institutional Class) returned 24.92% compared to 18.34% for its benchmark, the Russell 3000® Index. Please refer to the table on page 6 for returns for various classes of shares.
The past twelve months saw a continuation of the market rally that began back in March 2009, although certainly with more stops and starts than witnessed at the beginning of the rally. The lower- quality nature of the equity rally leveled off during the fourth quarter of 2010, although high-quality stocks have yet to significantly outpace their lower-quality counterparts and the market has continued to be driven by headline and macroeconomic news as opposed to underlying fundamentals of individual companies. The early portion of the year was characterized by the relative strength of the U.S. Dollar (and its subsequent consequences for companies in the U.S. with different levels of exposure to the strength of the Dollar) as global investors found the reserve status of the Dollar particularly comforting in the wake of a weakening Euro amid the concern of potential default risk for several sovereign nations in continental Europe. The second quarter of 2010 was marked by renewed fears of financial contagion and slowing economic growth. The third quarter of 2010 was a perfect microcosm of the skittishness of the market and investors over the course of the past year. In July, solid earnings from a number of bell weather companies led to strong market results. August featured a renewed round of lukewarm economic data that led to a market pullback and increased risk aversion amongst investors. September and October, on the other hand, saw a sharp market bounce back and increased risk taking among investors who still have considerable cash waiting to be invested but are still hesitant among reentering equity markets.
The Fund delivered solid positive absolute and relative returns for the fiscal year. Relative to the benchmark, the Fund experienced solid stock selection across a number of sectors including the consumer discretionary, financials, health care, and materials sectors. In addition, relative sector positioning added value despite maintaining a near neutral weighting versus the benchmark across a majority of sectors throughout the course of the past year. In particular, the Fund added value via its overweight to the recovering consumer discretionary sector, which boasted the strongest sector returns during this period. In addition, the Fund was a beneficiary of its modest underweight to the energy sector which, despite having positive returns, was the worst performing sector during the past fiscal year.
The Fund’s subadvisor, First Quadrant L.P. (“First Quadrant”), has become somewhat more optimistic about the global economy in recent months as economic data has not been as gloomy as feared, the Federal Reserve has initiated a second round of quantitative easing, and earnings have pleasantly surprised. However, some of this has already been reflected in the market. From a sector standpoint, the Fund remains fairly neutral to the benchmark although the portfolio has begun to take more active positions from a risk factor standpoint. For example, the Fund has increasingly favored more volatile stocks and that was beneficial towards the latter portion of the fiscal year when the U.S. equity market rallied. In addition, the Fund has increased its preference for equities with good valuations, especially with respect to earnings. That said, some of these top-down factor tilts have been reined in recently including the Fund’s tilt towards small-cap equities, which look much more fairly valued versus their larger-capitalization counterparts after an extended period of outperformance.
Cumulative Total Return Performance
Managers AMG FQ Tax-Managed U.S. Equity Fund’s cumulative total return is based on the daily change in net asset value (NAV), and assumes that all distributions were reinvested. The Russell 3000® Index is composed of the 3000 largest U.S. companies as measured by market capitalization, and represents about 98% of the U.S. stock market. Unlike the Fund, the Russell 3000® Index is unmanaged, is not available for investment, and does not incur expenses. The chart on page 6 illustrates the performance of a hypothetical $10,000 investment made in the Institutional Class Shares of the Fund on December 18, 2000 (commencement of operations) to a $10,000 investment made in the Russell 3000® Index for the same time periods. Performance for periods longer than one year is annualized. Figures include reinvestment of capital gains and dividends. The listed returns for the Fund are net of expenses and the returns for the indices exclude expenses. Total returns for the Fund would have been lower had certain expenses not been reduced.
5
Managers AMG FQ Tax-Managed U.S. Equity Fund
Portfolio Manager’s Comments (continued)
Cumulative Total Return Performance

The table below shows the average annual total returns for the Managers AMG FQ Tax-Managed U.S. Equity Fund since inception and the Russell 3000® Index from December 18, 2000 to October 31, 2010.
| | | | | | | | | | | | | | | | |
Average Annual Total Returns1 | | One Year | | | Five Years | | | Since Inception | | | Inception Date | |
Managers AMG FQ Tax- Managed U.S. Equity Fund2,5,6 | | | | | | | | | | | | | | | | |
No Load Before Tax: | | | | | | | | | | | | | | | | |
Institutional Class | | | 24.92 | % | | | 1.45 | % | | | 2.75 | % | | | 12/18/00 | |
Class A* | | | 24.58 | % | | | — | | | | (0.57 | )% | | | 03/01/06 | |
Class C* | | | 23.71 | % | | | — | | | | (1.32 | )% | | | 03/01/06 | |
Russell 3000® Index4 | | | 18.34 | % | | | 2.08 | % | | | 1.45 | % | | | 12/18/00 | |
No Load After Tax on Distributions3 | | | | | | | | | | | | | | | | |
Institutional Class | | | 24.87 | % | | | 1.36 | % | | | 2.65 | % | | | 12/18/00 | |
Class A* | | | 24.58 | % | | | — | | | | (0.63 | )% | | | 03/01/06 | |
Class C* | | | 23.71 | % | | | — | | | | (1.32 | )% | | | 03/01/06 | |
No Load After Tax on Distributions & sale of shares3 | | | | | | | | | | | | | | | | |
Institutional Class | | | 16.26 | % | | | 1.22 | % | | | 2.34 | % | | | 12/18/00 | |
Class A* | | | 15.97 | % | | | — | | | | (0.50 | )% | | | 03/01/06 | |
Class C* | | | 15.41 | % | | | — | | | | (1.12 | )% | | | 03/01/06 | |
With Load Before Tax: | | | | | | | | | | | | | | | | |
Class A* | | | 17.42 | % | | | — | | | | (1.82 | )% | | | 03/01/06 | |
Class C* | | | 22.71 | % | | | — | | | | (1.32 | )% | | | 03/01/06 | |
With Load After Tax on Distributions3 | | | | | | | | | | | | | | | | |
Class A* | | | 17.42 | % | | | — | | | | (1.87 | )% | | | 03/01/06 | |
Class C* | | | 22.71 | % | | | — | | | | (1.32 | )% | | | 03/01/06 | |
With Load After Tax on Distributions & sale of shares3 | | | | | | | | | | | | | | | | |
Class A* | | | 11.32 | % | | | — | | | | (1.55 | )% | | | 03/01/06 | |
Class C* | | | 14.76 | % | | | — | | | | (1.12 | )% | | | 03/01/06 | |
| * | Class A and Class C shares commenced operations on March 1, 2006. |
The performance data shown represents past performance, which is not a guarantee of future results. Current performance may be lower or higher than the performance data quoted. The investment return and principal value of an investment in the Funds will fluctuate so that an investor’s shares, when redeemed, may be worth more or less than their original cost. For performance information through the most recent month end please call (800) 835-3879 or visit our website at www.managersinvest.com.
In choosing a Fund, investors should carefully consider the amount they plan to invest, their investment objectives, the Fund’s investment objectives, risks, charges and expenses before investing. For this and other information, please call (800) 835-3879 or visit www.managersinvest.com for a free prospectus. Read it carefully before investing or sending money. Distributed by Managers Distributors, Inc., member FINRA.
| 1 | Total return equals income yield plus share price change and assumes reinvestment of all dividends and capital gain distributions. Returns are net of fees and may reflect offsets of Fund expenses as described in the Prospectus. No adjustment has been made for taxes payable by shareholders on their reinvested dividends and capital gain distributions. Returns for periods greater than one year are annualized. The listed returns on the Fund are net of expenses and based on the published NAV as of October 31, 2010. All returns are in U.S. dollars($). |
| 2 | From time to time, the Fund’s advisor has waived its fees and/or absorbed Fund expenses, which has resulted in higher returns. |
| 3 | After-tax returns are calculated using the historical highest individual federal marginal income tax rates and do not reflect the impact of state and local taxes. Actual after-tax returns depend on an investor’s tax situation and may differ from those shown, and after-tax returns are not relevant to investors who hold their Fund shares through tax-deferred arrangements, such as 401(K) plans or individual retirement accounts. |
| 4 | The Russell 3000® Index is a market-capitalization weighted index that measures the performance of the largest 3,000 U.S. companies representing approximately 98% of the investable U.S. equity market. The returns shown for the Index reflect no deduction for fees, expenses, or taxes. Unlike the Fund, the Russell 3000® Index is unmanaged, is not available for investment, and does not incur expenses. |
| 5 | The Fund invests in large-capitalization companies that may underperform other stock funds (such as funds that focus on small and medium capitalization companies) when stocks of large-capitalization companies are out of favor. Although the Fund is managed to minimize taxable distributions, it may not be able to avoid taxable distributions. |
| 6 | Class C shares convert to an equal dollar value of Class A shares at the end of the tenth year after purchase. |
The Russell 3000® Index is a trademark of Russell Investments. Russell® is a trademark of Russell Investments.
Not FDIC insured, nor bank guaranteed. May lose value.
6
Managers AMG FQ Tax-Managed U.S. Equity Fund
Fund Snapshots
October 31, 2010
Portfolio Breakdown
| | | | | | | | |
Industry | | FQ Tax-Managed
U.S. Equity Fund** | | | Russell 3000®
Index | |
Information Technology | | | 21.8 | % | | | 18.9 | % |
Financials | | | 16.4 | % | | | 16.0 | % |
Consumer Discretionary | | | 13.7 | % | | | 11.5 | % |
Health Care | | | 12.3 | % | | | 11.6 | % |
Industrials | | | 8.6 | % | | | 11.4 | % |
Energy | | | 8.6 | % | | | 10.4 | % |
Consumer Staples | | | 7.6 | % | | | 9.5 | % |
Materials | | | 6.4 | % | | | 4.2 | % |
Utilities | | | 2.9 | % | | | 3.6 | % |
Telecommunication Services | | | 1.7 | % | | | 2.9 | % |
Other Assets and Liabilities | | | 0.0 | % | | | 0.0 | % |
| ** | As a percentage of net assets |
Top Ten Holdings
| | | | |
Security Name | | Percentage
of Net Assets | |
International Business Machines Corp.* | | | 3.3 | % |
Chevron Corp.* | | | 2.7 | |
Apple, Inc.* | | | 2.5 | |
JPMorgan Chase & Co.* | | | 2.2 | |
DIRECTV, Class A* | | | 1.9 | |
Hewlett-Packard Co.* | | | 1.8 | |
Dillard’s, Inc., Class A* | | | 1.8 | |
Berkshire Hathaway, Inc., Class B | | | 1.8 | |
Google, Inc. | | | 1.7 | |
Micron Technology, Inc. | | | 1.7 | |
| | | | |
Top Ten as a Group | | | 21.4 | % |
| | | | |
| * | Top Ten Holding at April 30, 2010 |
Any sectors, industries, or securities discussed should not be perceived as investment recommendations. Mention of a specific security should not be considered a recommendation to buy or solicitation to sell that security. Specific securities mentioned in this report may have been sold from the Fund’s portfolio of investments by the time you receive this report.
7
Managers AMG FQ Tax-Managed U.S. Equity Fund
Schedule of Portfolio Investments
October 31, 2010
| | | | | | | | |
| | | Shares | | | Value | |
Common Stocks - 100.0% | | | | | | | | |
Consumer Discretionary - 13.7% | | | | | | | | |
Destination Maternity Corp.* | | | 8,600 | | | $ | 314,158 | |
Dillard’s, Inc., Class A | | | 32,700 | 2 | | | 834,177 | |
DIRECTV, Class A* | | | 20,700 | | | | 899,622 | |
Discovery Communications, Inc., Class C* | | | 4,800 | | | | 186,528 | |
Domino’s Pizza, Inc.* | | | 41,000 | | | | 608,440 | |
Ford Motor Co.* | | | 35,400 | | | | 500,202 | |
Knology, Inc.* | | | 40,000 | | | | 582,000 | |
Lear Corp.* | | | 4,200 | | | | 371,280 | |
Liberty Global, Inc., Class A* | | | 18,400 | 2 | | | 695,336 | |
Mediacom Communications Corp.* | | | 24,400 | | | | 168,360 | |
Rent-A-Center, Inc. | | | 13,600 | | | | 341,904 | |
Target Corp. | | | 2,000 | | | | 103,880 | |
TRW Automotive Holdings Corp.* | | | 9,800 | | | | 447,762 | |
Yum! Brands, Inc. | | | 7,000 | | | | 346,920 | |
Total Consumer Discretionary | | | | | | | 6,400,569 | |
Consumer Staples - 7.6% | | | | | | | | |
Alliance One International, Inc.* | | | 15,800 | | | | 69,836 | |
Andersons, Inc., The | | | 1,000 | | | | 39,370 | |
Central Garden & Pet Co., Class A* | | | 34,400 | | | | 359,480 | |
Coca-Cola Co., The | | | 800 | | | | 49,056 | |
Constellation Brands, Inc., Class A* | | | 18,800 | 2 | | | 370,924 | |
CVS Caremark Corp. | | | 4,400 | | | | 132,528 | |
Del Monte Foods Co. | | | 11,000 | | | | 157,740 | |
Dr Pepper Snapple Group, Inc. | | | 7,800 | | | | 285,090 | |
Energizer Holdings, Inc.* | | | 4,800 | | | | 358,944 | |
John B. Sanfilippo & Son, Inc.* | | | 8,600 | | | | 115,412 | |
Prestige Brands Holdings, Inc.* | | | 8,000 | | | | 86,000 | |
Procter & Gamble Co., The | | | 4,800 | | | | 305,136 | |
Ralcorp Holdings, Inc.* | | | 5,800 | | | | 359,948 | |
Revlon, Inc., Class A* | | | 9,400 | | | | 107,348 | |
Tyson Foods, Inc., Class A | | | 25,600 | 2 | | | 398,080 | |
Wal-Mart Stores, Inc. | | | 6,000 | | | | 325,020 | |
Total Consumer Staples | | | | | | | 3,519,912 | |
Energy - 8.6% | | | | | | | | |
Apache Corp. | | | 5,000 | | | | 505,100 | |
Chevron Corp. | | | 15,000 | | | | 1,239,150 | |
ConocoPhillips Co. | | | 11,000 | | | | 653,400 | |
Exxon Mobil Corp. | | | 5,600 | | | | 372,232 | |
Hess Corp. | | | 6,600 | | | | 415,998 | |
Occidental Petroleum Corp. | | | 3,600 | | | | 283,068 | |
Oil States International, Inc.* | | | 3,800 | | | | 194,256 | |
Seacor Holdings, Inc.* | | | 3,800 | | | | 360,050 | |
Total Energy | | | | | | | 4,023,254 | |
Financials - 16.4% | | | | | | | | |
American Financial Group, Inc. | | | 6,400 | | | | 195,712 | |
American Safety Insurance Holdings, Ltd.* | | | 8,000 | | | | 148,560 | |
Aon Corp. | | | 3,600 | | | | 143,100 | |
Arch Capital Group, Ltd.* | | | 4,400 | | | | 380,116 | |
Bank of New York Mellon Corp. | | | 6,700 | 2 | | | 167,902 | |
Bank of the Ozarks, Inc. | | | 11,000 | | | | 418,110 | |
Berkshire Hathaway, Inc.* | | | 1 | | | | 119,300 | |
Berkshire Hathaway, Inc., Class B* | | | 10,287 | | | | 818,434 | |
Cardtronics, Inc.* | | | 2,800 | | | | 47,460 | |
Chubb Corp., The | | | 1,600 | 2 | | | 92,832 | |
Everest Re Group, Ltd. | | | 5,100 | | | | 429,828 | |
FBL Financial Group, Inc., Class A | | | 6,800 | | | | 177,888 | |
Financial Institutions, Inc. | | | 1,600 | | | | 28,880 | |
First Cash Financial Services, Inc.* | | | 5,200 | | | | 151,164 | |
First Citizens BancShares, Inc., Class A | | | 1,800 | | | | 336,204 | |
Goldman Sachs Group, Inc. | | | 2,000 | | | | 321,900 | |
JPMorgan Chase & Co. | | | 27,500 | | | | 1,034,825 | |
KeyCorp | | | 25,800 | | | | 211,302 | |
Loews Corp. | | | 4,000 | | | | 157,920 | |
Morgan Stanley Co. | | | 4,800 | | | | 119,376 | |
National Bankshares, Inc. | | | 1,000 | | | | 26,150 | |
Nelnet, Inc. | | | 9,200 | | | | 206,724 | |
Platinum Underwriter Holdings, Ltd. | | | 3,600 | | | | 154,980 | |
PNC Financial Services Group, Inc., The | | | 8,400 | | | | 452,760 | |
Prudential Financial, Inc. | | | 2,800 | | | | 147,224 | |
Resource Capital Corp. | | | 29,400 | | | | 186,102 | |
SunTrust Banks, Inc. | | | 15,600 | | | | 390,312 | |
Travelers Companies, Inc., The | | | 5,600 | | | | 309,120 | |
World Acceptance Corp.* | | | 6,800 | | | | 293,420 | |
Total Financials | | | | | | | 7,667,605 | |
Health Care - 12.3% | | | | | | | | |
Allergan, Inc. | | | 1,000 | | | | 72,410 | |
Amgen, Inc.* | | | 2,000 | | | | 114,380 | |
Atrion Corp. | | | 400 | | | | 65,152 | |
Biogen Idec, Inc.* | | | 6,800 | 2 | | | 426,428 | |
Celgene Corp.* | | | 5,800 | | | | 360,006 | |
The accompanying notes are an integral part of these financial statements.
8
Managers AMG FQ Tax-Managed U.S. Equity Fund
Schedule of Portfolio Investments (continued)
| | | | | | | | |
| | | Shares | | | Value | |
Health Care - 12.3% (continued) | | | | | | | | |
DaVita, Inc.* | | | 3,800 | | | $ | 272,650 | |
Express Scripts, Inc.* | | | 9,000 | | | | 436,680 | |
Gentiva Health Services, Inc.* | | | 5,200 | | | | 121,056 | |
HealthSouth Corp.* | | | 7,000 | | | | 126,630 | |
Humana, Inc.* | | | 7,800 | | | | 454,662 | |
Invacare Corp. | | | 13,400 | | | | 361,800 | |
Johnson & Johnson | | | 4,400 | | | | 280,148 | |
Kensey Nash Corp.* | | | 9,200 | | | | 248,032 | |
Medicis Pharmaceutical Corp., Class A | | | 6,400 | | | | 190,400 | |
Orthofix International NV* | | | 3,200 | | | | 89,632 | |
Par Pharmaceutical Co., Inc.* | | | 11,000 | | | | 357,610 | |
Pfizer, Inc. | | | 7,200 | | | | 125,280 | |
Providence Service Corp.* | | | 17,800 | | | | 292,454 | |
PSS World Medical, Inc.* | | | 12,200 | | | | 288,286 | |
Sirona Dental Systems, Inc.* | | | 5,200 | | | | 195,780 | |
Sun Healthcare Group, Inc.* | | | 12,800 | | | | 121,728 | |
Symmetry Medical, Inc.* | | | 50,000 | | | | 442,500 | |
UnitedHealth Group, Inc. | | | 8,200 | | | | 295,610 | |
Total Health Care | | | | | | | 5,739,314 | |
Industrials - 8.6% | | | | | | | | |
Alaska Airgroup, Inc.* | | | 6,600 | | | | 348,480 | |
AMERCO* | | | 4,400 | | | | 362,208 | |
Blount International, Inc.* | | | 9,800 | 2 | | | 147,000 | |
Delta Air Lines, Inc.* | | | 8,800 | | | | 122,232 | |
Esterline Technologies Corp.* | | | 1,600 | | | | 96,704 | |
FedEx Corp. | | | 4,700 | | | | 412,284 | |
Gencorp, Inc.* | | | 24,800 | | | | 120,776 | |
Hawaiian Holdings, Inc.* | | | 28,800 | | | | 210,816 | |
Kadant, Inc.* | | | 5,400 | | | | 106,164 | |
KBR, Inc. | | | 11,800 | | | | 299,720 | |
M&F Worldwide Corp.* | | | 15,000 | | | | 403,200 | |
Park-Ohio Holdings Corp.* | | | 16,800 | | | | 266,952 | |
Sauer-Danfoss, Inc.* | | | 3,000 | | | | 66,330 | |
Timken Co. | | | 8,600 | | | | 356,212 | |
TriMas Corp.* | | | 21,800 | | | | 345,094 | |
United Continental Holdings, Inc.* | | | 4,400 | | | | 127,776 | |
United Technologies Corp. | | | 3,000 | | | | 224,310 | |
Total Industrials | | | | | | | 4,016,258 | |
Information Technology - 21.8% | | | | | | | | |
Apple, Inc.* | | | 3,900 | | | | 1,173,393 | |
Cisco Systems, Inc.* | | | 3,500 | | | | 79,905 | |
Convergys Corp.* | | | 10,400 | | | | 117,728 | |
CoreLogic, Inc. | | | 15,500 | | | | 272,335 | |
CPI International, Inc.* | | | 8,200 | 2 | | | 115,784 | |
EMC Corp.* | | | 2,800 | | | | 58,828 | |
Google, Inc.* | | | 1,300 | | | | 796,887 | |
Harris Corp. | | | 8,200 | 2 | | | 370,558 | |
Hewlett-Packard Co. | | | 20,200 | | | | 849,612 | |
Intel Corp. | | | 29,000 | | | | 582,030 | |
International Business Machines Corp. | | | 10,600 | | | | 1,522,160 | |
Lam Research Corp.* | | | 8,400 | | | | 384,636 | |
Lexmark International, Inc., Class A* | | | 8,400 | | | | 319,452 | |
Micron Technology, Inc.* | | | 95,200 | 2 | | | 787,304 | |
Microsoft Corp. | | | 17,600 | | | | 468,864 | |
MIPS Technologies, Inc.* | | | 34,400 | | | | 505,680 | |
NCI, Inc., Class A* | | | 14,000 | | | | 260,960 | |
Newport Corp.* | | | 7,600 | | | | 110,428 | |
Texas Instruments, Inc. | | | 21,000 | 2 | | | 620,970 | |
TIBCO Software, Inc.* | | | 20,600 | | | | 395,932 | |
Vishay Intertechnology, Inc.* | | | 34,000 | | | | 384,200 | |
Total Information Technology | | | | | | | 10,177,646 | |
Materials - 6.4% | | | | | | | | |
Crown Holdings, Inc.* | | | 7,000 | | | | 225,330 | |
Domtar Corp. | | | 5,200 | | | | 412,672 | |
Freeport-McMoRan Copper & Gold, Inc., Class B | | | 7,600 | | | | 719,568 | |
Graphic Packaging Holding Co.* | | | 46,700 | | | | 170,922 | |
KapStone Paper and Packaging Corp.* | | | 12,200 | | | | 156,160 | |
Newmont Mining, Ltd. | | | 7,600 | | �� | | 462,612 | |
Walter Industries, Inc. | | | 2,800 | 2 | | | 246,288 | |
W.R. Grace & Co.* | | | 18,200 | | | | 583,492 | |
Total Materials | | | | | | | 2,977,044 | |
Telecommunication Services - 1.7% | | | | | | | | |
American Tower Corp., Class A* | | | 6,200 | 2 | | | 319,982 | |
AT&T, Inc. | | | 8,600 | | | | 245,100 | |
U.S. Cellular Corp.* | | | 4,600 | | | | 213,716 | |
Total Telecommunication Services | | | | | | | 778,798 | |
The accompanying notes are an integral part of these financial statements.
9
Managers AMG FQ Tax-Managed U.S. Equity Fund
Schedule of Portfolio Investments (continued)
| | | | | | | | |
| | | Shares | | | Value | |
Utilities - 2.9% | | | | | | | | |
Constellation Energy Group, Inc. | | | 7,800 | | | $ | 235,872 | |
El Paso Electric Co.* | | | 24,200 | | | | 595,320 | |
Southwest Gas Corp. | | | 15,400 | | | | 535,304 | |
Total Utilities | | | | | | | 1,366,496 | |
Total Common Stocks
(cost $38,308,112) | | | | | | | 46,666,896 | |
Short-Term Investments - 4.6%1 | | | | | | | | |
BNY Institutional Cash Reserves Fund, Series B*3,4 | | | 320,520 | | | | 254,895 | |
BNY Mellon Overnight Government Fund, 0.21%3 | | | 1,545,000 | | | | 1,545,000 | |
Dreyfus Cash Management Fund, Institutional Class Shares, 0.16% | | | 332,066 | | | | 332,066 | |
Total Short-Term Investments
(cost $2,197,586) | | | | | | | 2,131,961 | |
Total Investments - 104.6%
(cost $40,505,698) | | | | | | | 48,798,857 | |
Other Assets, less Liabilities - (4.6)% | | | | | | | (2,167,621 | ) |
Net Assets - 100.0% | | | | | | $ | 46,631,236 | |
Note: Based on the approximate cost of investments of $40,505,698 for Federal income tax purposes at October 31, 2010, the aggregate gross unrealized appreciation and depreciation were $8,730,045 and $436,886, respectively, resulting in net unrealized appreciation of investments of $8,293,159.
| * | Non-income-producing securities. |
| 1 | Yield shown for each investment company below represents the October 31, 2010, seven-day average yield, which refers to the sum of the previous seven days’ dividends paid, expressed as an annual percentage. |
| 2 | Some or all of these shares, amounting to a market value of $1,696,112, or 3.6% of net assets, were out on loan to various brokers. |
| 3 | Collateral received from brokers for securities lending was invested in these short-term investments. |
| 4 | On September 12, 2008, The Bank of New York Mellon established a separate sleeve of the BNY Institutional Cash Reserves Fund (Series B) to hold certain Lehman Brothers floating rate notes. The Fund’s position in Series B is being fair valued daily. (See Note 4 in the Notes to Financial Statements.) |
The following table summarizes the inputs used to value the Fund’s net assets by the fair value hierarchy levels as of October 31, 2010:
(See Note 1(a) in the Notes to Financial Statements.)
| | | | | | | | | | | | | | | | |
| | | Quoted Prices
in Active
Markets for
Identical
Investments
Level 1 | | | Significant
Other
Observable
Inputs
Level 2 | | | Significant
Unobservable
Inputs
Level 3 | | | Total | |
Tax-Managed | | | | | | | | | | | | | | | | |
Investments in Securities | | | | | | | | | | | | | | | | |
Common Stocks† | | $ | 46,666,896 | | | | — | | | | — | | | $ | 46,666,896 | |
Short-Term Investments | | | 1,877,066 | | | $ | 254,895 | | | | — | | | | 2,131,961 | |
| | | | | | | | | | | | | | | | |
Total Investments in Securities | | $ | 48,543,962 | | | $ | 254,895 | | | | — | | | $ | 48,798,857 | |
| | | | | | | | | | | | | | | | |
| † | All common stocks held in the Fund are Level 1 securities. For a detailed break-out of the common stocks by major industry classification, please refer to the Schedule of Portfolio Investments. |
As of October 31, 2010, the Fund had no significant transfers between Level 1 and Level 2 from the beginning of the reporting period.
The accompanying notes are an integral part of these financial statements.
10
Managers AMG FQ U.S. Equity Fund
Portfolio Manager’s Comments
For the fiscal year ended October 31, 2010, the Managers AMG FQ U.S. Equity Fund (Institutional Class) returned 16.75% compared to 18.34% for its benchmark, the Russell 3000® Index. Please refer to the table on page 12 for returns for various classes of shares.
The past twelve months saw a continuation of the market rally that began back in March 2009, although certainly with more stops and starts than witnessed at the beginning of the rally. The lower-quality nature of the equity rally leveled off during the fourth quarter of 2010, although high-quality stocks have yet to significantly outpace their lower-quality counterparts and the market has continued to be driven by headline and macroeconomic news as opposed to underlying fundamentals of individual companies. The early portion of the year was characterized by the relative strength of the U.S. Dollar (and its subsequent consequences for companies in the U.S.. with different levels of exposure to the strength of the Dollar) as global investors found the reserve status of the Dollar particularly comforting in the wake of a weakening Euro amid the concern of potential default risk for several sovereign nations in continental Europe. The second quarter of 2010 was marked by renewed fears of financial contagion and slowing economic growth. The third quarter of 2010 was a perfect microcosm of the skittishness of the market and investors over the course of the past year. In July, solid earnings from a number of bell weather companies led to strong market results. August featured a renewed round of lukewarm economic data that led to a market pullback and increased risk aversion amongst investors. September and October, on the other hand, saw a sharp market bounce back and increased risk taking among investors who still have considerable cash waiting to be invested but are still hesitant about reentering equity markets.
The Fund delivered positive absolute returns for the fiscal year but failed to keep pace with its benchmark. Relative to the benchmark, the Fund experienced negative stock selection within several sectors although primarily concentrated within information technology. Relative sector positioning did not add or detract significant value, mainly due to the mostly neutral benchmark sector and style positioning the Fund maintained throughout the year.
The Fund’s subadvisor, First Quadrant L.P. (“First Quadrant”), has become somewhat more optimistic about the global economy in recent months as economic data has not been as gloomy as feared, the Federal Reserve has initiated a second round of quantitative easing, and earnings have pleasantly surprised. However, some of this has already been reflected in the market. From a sector standpoint, the Fund remains fairly neutral to the benchmark, although the portfolio has begun to take more active positions from a risk factor standpoint. For example, the Fund has increasingly favored more volatile stocks, and that was beneficial towards the latter portion of the fiscal year when the U.S. equity market rallied. In addition, the Fund has increased its preference for equities with good valuations, especially with respect to earnings. That said, some of these top-down factor tilts have been reined in recently, including the Fund’s tilt towards small-cap equities which look much more fairly valued versus their larger-capitalization counterparts after an extended period of out performance.
Cumulative Total Return Performance
Managers AMG FQ U.S. Equity Fund’s cumulative total return is based on the daily change in net asset value (NAV), and assumes that all distributions were reinvested. The Russell 3000® Index is composed of the 3000 largest U.S. companies as measured by market capitalization, and represents about 98% of the U.S. stock market. Unlike the Fund, the Russell 3000® Index is unmanaged, is not available for investment, and does not incur expenses. The chart on page 12 illustrates the performance of a hypothetical $10,000 investment made in the Institutional Class Shares of the Fund on October 31, 2000 to a $10,000 investment made in the Russell 3000® Index for the same time periods. Performance for periods longer than one year is annualized. Figures include reinvestment of capital gains and dividends. The listed returns for the Fund are net of expenses and the returns for the indices exclude expenses. Total returns for the Fund would have been lower had certain expenses not been reduced.
11
Managers AMG FQ U.S. Equity Fund
Portfolio Manager’s Comments (continued)
Cumulative Total Return Performance
The table below shows the average annual total returns for the Managers AMG FQ U.S. Equity Fund since inception and the Russell 3000® Index from October 31, 2000 to October 31, 2010.
| | | | | | | | | | | | | | | | | | | | |
Average Annual Total Returns1 | | One Year | | | Five Years | | | Ten Years | | | Since Inception | | | Inception Date | |
Managers AMG FQ U.S. Equity Fund2,4,5 | | | | | | | | | | | | | | | | | | | | |
No Load: | | | | | | | | | | | | | | | | | | | | |
Institutional Class | | | 16.75 | % | | | 2.09 | % | | | 0.07 | % | | | 6.96 | % | | | 08/14/92 | |
Class A* | | | 16.57 | % | | | — | | | | — | | | | (0.14 | )% | | | 03/01/06 | |
Class C* | | | 15.75 | % | | | — | | | | — | | | | (0.82 | )% | | | 03/01/06 | |
Russell 3000® Index3 | | | 18.34 | % | | | 2.08 | % | | | 0.62 | % | | | 8.14 | % | | | 08/14/92 | |
With Load: | | | | | | | | | | | | | | | | | | | | |
Class A* | | | 9.93 | % | | | — | | | | — | | | | (1.40 | )% | | | 03/01/06 | |
Class C* | | | 14.75 | % | | | — | | | | — | | | | (0.82 | )% | | | 03/01/06 | |
| * | Class A and Class C shares commenced operations on March 1, 2006. |
The performance data shown represents past performance, which is not a guarantee of future results. Current performance may be lower or higher than the performance data quoted. The investment return and principal value of an investment in the Funds will fluctuate so that an investor’s shares, when redeemed, may be worth more or less than their original cost. For performance information through the most recent month end please call (800) 835-3879 or visit our website at www.managersinvest.com.
In choosing a Fund, investors should carefully consider the amount they plan to invest, their investment objectives, the Fund’s investment objectives, risks, charges and expenses before investing. For this and other information, please call (800) 835-3879 or visit www.managersinvest.com for a free prospectus. Read it carefully before investing or sending money. Distributed by Managers Distributors, Inc., member FINRA.
| 1 | Total return equals income yield plus share price change and assumes reinvestment of all dividends and capital gain distributions. Returns are net of fees and may reflect offsets of Fund expenses as described in the Prospectus. No adjustment has been made for taxes payable by shareholders on their reinvested dividends and capital gain distributions. Returns for periods greater than one year are annualized. The listed returns on the Fund are net of expenses and based on the published NAV as of October 31, 2010. All returns are in U.S. dollars($). |
| 2 | From time to time, the Fund’s advisor has waived its fees and/or absorbed Fund expenses, which has resulted in higher returns. |
| 3 | The Russell 3000® Index is a market-capitalization weighted index that measures the performance of the largest 3,000 U.S. companies representing approximately 98% of the investable U.S. equity market. The returns shown for the Index reflect no deduction for fees, expenses, or taxes. Unlike the Fund, the Russell 3000® Index is unmanaged, is not available for investment, and does not incur expenses. |
| 4 | The Fund invests in large-capitalization companies that may underperform other stock funds (such as funds that focus on small and medium capitalization companies) when stocks of large-capitalization companies are out of favor. |
| 5 | Class C shares convert to an equal dollar value of Class A shares at the end of the tenth year after purchase. |
The Russell 3000® Index is a trademark of Russell Investments. Russell® is a trademark of Russell Investments.
Not FDIC insured, nor bank guaranteed. May lose value.
12
Managers AMG FQ U.S. Equity Fund
Fund Snapshots
October 31, 2010
Portfolio Breakdown
| | | | | | | | |
Industry | | FQ U.S. Equity
Fund** | | | Russell 3000®
Index | |
Information Technology | | | 21.6 | % | | | 18.9 | % |
Financials | | | 16.3 | % | | | 16.0 | % |
Consumer Discretionary | | | 11.3 | % | | | 11.5 | % |
Health Care | | | 11.0 | % | | | 11.6 | % |
Energy | | | 9.6 | % | | | 10.4 | % |
Consumer Staples | | | 9.2 | % | | | 9.5 | % |
Industrials | | | 8.6 | % | | | 11.4 | % |
Materials | | | 5.1 | % | | | 4.2 | % |
Utilities | | | 3.5 | % | | | 3.6 | % |
Telecommunication Services | | | 3.4 | % | | | 2.9 | % |
Other Assets and Liabilities | | | 0.4 | % | | | 0.0 | % |
| ** | As a percentage of net assets |
Top Ten Holdings
| | | | |
Security Name | | Percentage
of Net Assets | |
Exxon Mobil Corp.* | | | 2.3 | % |
Chevron Corp.* | | | 1.9 | |
JPMorgan Chase & Co.* | | | 1.8 | |
Microsoft Corp.* | | | 1.5 | |
Intel Corp.* | | | 1.5 | |
Google, Inc.* | | | 1.4 | |
Philip Morris International, Inc. | | | 1.4 | |
Apple, Inc. | | | 1.4 | |
ConocoPhillips Co.* | | | 1.4 | |
AT&T, Inc. | | | 1.4 | |
| | | | |
Top Ten as a Group | | | 16.0 | % |
| | | | |
| * | Top Ten Holding at April 30, 2010 |
Any sectors, industries, or securities discussed should not be perceived as investment recommendations. Mention of a specific security should not be considered a recommendation to buy or solicitation to sell that security. Specific securities mentioned in this report may have been sold from the Fund’s portfolio of investments by the time you receive this report.
13
Managers AMG FQ U.S. Equity Fund
Schedule of Portfolio Investments
October 31, 2010
| | | | | | | | |
| | | Shares | | | Value | |
Common Stocks - 99.6% | | | | | | | | |
Consumer Discretionary - 11.3% | | | | | | | | |
Advance Auto Parts, Inc. | | | 4,400 | | | $ | 285,912 | |
Autoliv, Inc. | | | 5,400 | 2 | | | 385,020 | |
Big 5 Sporting Goods Corp. | | | 4,400 | 2 | | | 59,488 | |
Brinker International, Inc. | | | 5,800 | | | | 107,532 | |
Comcast Corp., Class A | | | 30,200 | | | | 621,516 | |
Cracker Barrel Old Country Store, Inc. | | | 3,200 | | | | 172,448 | |
Dillard’s, Inc., Class A | | | 5,800 | | | | 147,958 | |
DIRECTV, Class A* | | | 12,400 | | | | 538,904 | |
Dollar Tree, Inc.* | | | 3,200 | | | | 164,192 | |
DSW, Inc.* | | | 1,200 | | | | 39,924 | |
H&R Block, Inc. | | | 20,800 | | | | 245,232 | |
Home Depot, Inc., The | | | 1,600 | | | | 49,408 | |
Lear Corp.* | | | 3,000 | | | | 265,200 | |
Libbey, Inc.* | | | 10,400 | | | | 138,216 | |
Macy’s, Inc. | | | 15,400 | | | | 364,056 | |
News Corp., Inc., Class A | | | 31,000 | | | | 448,260 | |
Oxford Industries, Inc. | | | 3,000 | | | | 69,090 | |
Pre-Paid Legal Services, Inc.* | | | 600 | | | | 36,108 | |
Ross Stores, Inc. | | | 2,800 | | | | 165,172 | |
Signet Jewelers, Ltd.* | | | 10,200 | | | | 358,836 | |
Target Corp. | | | 6,800 | | | | 353,192 | |
Time Warner Cable, Inc. | | | 2,000 | | | | 115,740 | |
TRW Automotive Holdings Corp.* | | | 8,400 | | | | 383,796 | |
Valassis Communications, Inc.* | | | 4,000 | | | | 132,000 | |
Wyndham Worldwide Corp. | | | 7,600 | | | | 218,500 | |
Total Consumer Discretionary | | | | | | | 5,865,700 | |
Consumer Staples - 9.2% | | | | | | | | |
Andersons, Inc., The | | | 7,600 | | | | 299,212 | |
Central Garden & Pet Co., Class A* | | | 17,800 | | | | 186,010 | |
Coca-Cola Co., The | | | 6,800 | | | | 416,976 | |
Coca-Cola Enterprises, Inc. | | | 7,200 | | | | 172,872 | |
Dr Pepper Snapple Group, Inc. | | | 10,000 | | | | 365,500 | |
Energizer Holdings, Inc.* | | | 4,400 | | | | 329,032 | |
Herbalife, Ltd. | | | 5,200 | | | | 332,072 | |
Nu Skin Enterprises, Inc., Class A | | | 10,600 | | | | 324,360 | |
PepsiCo, Inc. | | | 1,000 | | | | 65,300 | |
Philip Morris International, Inc. | | | 12,400 | | | | 725,400 | |
Procter & Gamble Co., The | | | 6,400 | | | | 406,848 | |
Revlon, Inc., Class A* | | | 4,600 | | | | 52,532 | |
Sanderson Farms, Inc. | | | 2,200 | | | | 92,356 | |
Tyson Foods, Inc., Class A | | | 21,000 | | | | 326,550 | |
USANA Health Sciences, Inc.* | | | 2,000 | | | | 87,840 | |
Wal-Mart Stores, Inc. | | | 10,600 | | | | 574,202 | |
Total Consumer Staples | | | | | | | 4,757,062 | |
Energy - 9.6% | | | | | | | | |
Apache Corp. | | | 1,200 | | | | 121,224 | |
Chevron Corp. | | | 12,200 | | | | 1,007,842 | |
Cimarex Energy Co. | | | 3,200 | | | | 245,600 | |
ConocoPhillips Co. | | | 12,000 | | | | 712,800 | |
Dresser-Rand Group, Inc.* | | | 5,000 | 2 | | | 171,100 | |
Exxon Mobil Corp. | | | 18,200 | | | | 1,209,754 | |
Hess Corp. | | | 5,200 | | | | 327,756 | |
Marathon Oil Corp. | | | 9,000 | | | | 320,130 | |
Occidental Petroleum Corp. | | | 6,800 | | | | 534,684 | |
Sunoco, Inc. | | | 8,400 | | | | 314,748 | |
Total Energy | | | | | | | 4,965,638 | |
Financials - 16.3% | | | | | | | | |
Advance America, Cash Advance Centers, Inc. | | | 15,600 | | | | 77,844 | |
Aflac, Inc. | | | 7,800 | | | | 435,942 | |
American Express Co. | | | 11,800 | | | | 489,228 | |
American Financial Group, Inc. | | | 11,000 | | | | 336,380 | |
Arch Capital Group, Ltd.* | | | 600 | | | | 51,834 | |
Assurant, Inc. | | | 6,800 | | | | 268,872 | |
Bank of America Corp. | | | 18,800 | | | | 215,072 | |
Bank of the Ozarks, Inc. | | | 1,200 | | | | 45,612 | |
Berkshire Hathaway, Inc., Class B* | | | 8,000 | | | | 636,480 | |
Cardtronics, Inc.* | | | 18,800 | | | | 318,660 | |
Chubb Corp., The | | | 6,400 | | | | 371,328 | |
FBL Financial Group, Inc., Class A | | | 1,800 | | | | 47,088 | |
First Financial Bancorp | | | 3,800 | | | | 63,992 | |
Franklin Resources, Inc. | | | 1,800 | | | | 206,460 | |
Getty Realty Corp. | | | 2,800 | | | | 79,828 | |
JPMorgan Chase & Co. | | | 24,200 | | | | 910,646 | |
KeyCorp | | | 40,800 | | | | 334,152 | |
Loews Corp. | | | 9,600 | | | | 379,008 | |
M&T Bank Corp. | | | 3,400 | | | | 254,150 | |
Metlife, Inc. | | | 8,800 | | | | 354,904 | |
Morgan Stanley Co. | | | 17,200 | | | | 427,764 | |
NASDAQ OMX Group, Inc., The* | | | 7,400 | | | | 155,548 | |
PNC Financial Services Group, Inc., The | | | 7,600 | | | | 409,640 | |
Rayonier, Inc. | | | 5,600 | | | | 292,320 | |
Reinsurance Group of America, Inc. | | | 1,800 | | | | 90,126 | |
Republic Bancorp, Inc., Class A | | | 2,400 | | | | 49,056 | |
Travelers Companies, Inc., The | | | 5,800 | | | | 320,160 | |
The accompanying notes are an integral part of these financial statements.
14
Managers AMG FQ U.S. Equity Fund
Schedule of Portfolio Investments (continued)
| | | | | | | | |
| | | Shares | | | Value | |
Financials - 16.3% (continued) | | | | | | | | |
U.S. Bancorp | | | 6,400 | | | $ | 154,752 | |
Vornado Realty Trust | | | 4,400 | | | | 384,516 | |
Wells Fargo & Co. | | | 8,000 | | | | 208,640 | |
World Acceptance Corp.* | | | 1,800 | | | | 77,670 | |
Total Financials | | | | | | | 8,447,672 | |
Health Care - 11.0% | | | | | | | | |
AMERIGROUP Corp.* | | | 2,600 | | | | 108,498 | |
Biogen Idec, Inc.* | | | 6,000 | | | | 376,260 | |
Bristol-Myers Squibb Co. | | | 19,600 | | | | 527,240 | |
Bruker Corp.* | | | 10,200 | | | | 152,898 | |
Cantel Medical Corp. | | | 3,600 | | | | 66,672 | |
Cardinal Health, Inc. | | | 10,400 | | | | 360,776 | |
Celgene Corp.* | | | 4,800 | | | | 297,936 | |
Cyberonics, Inc.* | | | 10,000 | | | | 275,100 | |
Eli Lilly and Co. | | | 12,000 | | | | 422,400 | |
Express Scripts, Inc.,* | | | 8,000 | | | | 388,160 | |
Hi-Tech Pharmacal Co., Inc.* | | | 1,800 | 2 | | | 38,934 | |
Humana, Inc.* | | | 6,200 | | | | 361,398 | |
Impax Laboratories, Inc.* | | | 17,600 | | | | 331,584 | |
Johnson & Johnson | | | 6,600 | | | | 420,222 | |
Kensey Nash Corp.* | | | 1,400 | | | | 37,744 | |
Merck & Co., Inc. | | | 4,000 | | | | 145,120 | |
Orthofix International NV* | | | 3,200 | | | | 89,632 | |
Pfizer, Inc. | | | 12,800 | | | | 222,720 | |
Providence Service Corp.* | | | 4,600 | | | | 75,578 | |
Sirona Dental Systems, Inc.* | | | 9,400 | | | | 353,910 | |
Symmetry Medical, Inc.* | | | 14,400 | | | | 127,440 | |
UnitedHealth Group, Inc. | | | 14,800 | | | | 533,540 | |
Total Health Care | | | | | | | 5,713,762 | |
Industrials - 8.6% | | | | | | | | |
A.O. Smith Corp. | | | 4,400 | | | | 246,532 | |
Alaska Airgroup, Inc.* | | | 6,400 | | | | 337,920 | |
Applied Industrial Technologies, Inc. | | | 10,600 | | | | 322,346 | |
Atlas Air Worldwide Holdings, Inc.* | | | 4,400 | 2 | | | 229,944 | |
Blount International, Inc.* | | | 5,200 | | | | 78,000 | |
CBIZ, Inc.* | | | 8,800 | | | | 52,096 | |
Ceradyne, Inc.* | | | 2,600 | | | | 61,906 | |
Crane Co. | | | 8,200 | | | | 313,732 | |
CSX Corp. | | | 3,400 | 2 | | | 208,930 | |
FedEx Corp. | | | 400 | | | | 35,088 | |
Gencorp, Inc.* | | | 27,800 | | | | 135,386 | |
General Electric Co. | | | 22,600 | | | | 362,052 | |
Graham Corp. | | | 2,400 | 2 | | | 40,728 | |
HEICO Corp. | | | 3,400 | | | | 169,252 | |
Joy Global, Inc. | | | 2,200 | | | | 156,090 | |
M&F Worldwide Corp.* | | | 8,400 | | | | 225,792 | |
NACCO Industries, Inc., Class A | | | 1,400 | | | | 138,964 | |
Northrop Grumman Corp. | | | 2,000 | | | | 126,420 | |
Powell Industries, Inc.* | | | 2,600 | | | | 80,236 | |
Sauer-Danfoss, Inc.* | | | 2,600 | | | | 57,486 | |
Thomas & Betts Corp.* | | | 600 | | | | 26,130 | |
Timken Co. | | | 7,800 | | | | 323,076 | |
TriMas Corp.* | | | 8,200 | | | | 129,806 | |
Union Pacific Corp. | | | 2,000 | 2 | | | 175,360 | |
US Airways Group, Inc.* | | | 33,400 | | | | 393,786 | |
Total Industrials | | | | | | | 4,427,058 | |
Information Technology - 21.6% | | | | | | | | |
Acxiom Corp.* | | | 7,000 | | | | 122,850 | |
Amdocs, Ltd.* | | | 11,600 | | | | 355,888 | |
Analog Devices, Inc. | | | 2,400 | | | | 80,808 | |
Apple, Inc.* | | | 2,400 | | | | 722,088 | |
Broadridge Financial Solutions, Inc. | | | 15,200 | | | | 334,400 | |
Cisco Systems, Inc.* | | | 10,200 | | | | 232,866 | |
Corning, Inc. | | | 23,000 | | | | 420,440 | |
CSG Systems International, Inc.* | | | 8,400 | | | | 163,296 | |
Dolby Laboratories, Inc., Class A* | | | 2,000 | | | | 123,360 | |
DST Systems, Inc. | | | 4,600 | | | | 199,042 | |
Google, Inc.* | | | 1,200 | | | | 735,588 | |
Harris Corp. | | | 7,000 | | | | 316,330 | |
Hewlett-Packard Co. | | | 13,800 | | | | 580,428 | |
Intel Corp. | | | 38,400 | | | | 770,688 | |
InterDigital, Inc.* | | | 9,000 | | | | 302,130 | |
International Business Machines Corp. | | | 3,000 | | | | 430,800 | |
Intuit, Inc.* | | | 4,800 | | | | 230,400 | |
Lam Research Corp.* | | | 7,600 | | | | 348,004 | |
Lexmark International, Inc., Class A* | | | 8,400 | | | | 319,452 | |
Littelfuse, Inc.* | | | 2,400 | | | | 101,832 | |
Marvell Technology Group, Ltd.* | | | 20,600 | | | | 397,786 | |
Micrel, Inc. | | | 9,200 | | | | 109,572 | |
Microsoft Corp. | | | 29,800 | | | | 793,872 | |
MIPS Technologies, Inc.* | | | 35,000 | | | | 514,500 | |
Netscout Systems, Inc.* | | | 4,000 | | | | 93,880 | |
Oracle Corp. | | | 2,600 | | | | 76,440 | |
OSI Systems, Inc.* | | | 2,600 | | | | 93,600 | |
Plantronics, Inc. | | | 5,000 | | | | 179,400 | |
Power-One, Inc.* | | | 29,800 | 2 | | | 310,218 | |
SanDisk Corp.* | | | 6,400 | 2 | | | 240,512 | |
The accompanying notes are an integral part of these financial statements.
15
Managers AMG FQ U.S. Equity Fund
Schedule of Portfolio Investments (continued)
| | | | | | | | |
| | | Shares | | | Value | |
Information Technology - 21.6% (continued) | | | | | | | | |
Seagate Technology* | | | 14,400 | | | $ | 210,960 | |
Texas Instruments, Inc. | | | 2,600 | | | | 76,882 | |
VeriFone Holdings, Inc.* | | | 10,200 | | | | 345,066 | |
Visa, Inc., Class A | | | 6,000 | | | | 469,020 | |
Vishay Intertechnology, Inc.* | | | 35,400 | | | | 400,020 | |
Total Information Technology | | | | | | | 11,202,418 | |
Materials - 5.1% | | | | | | | | |
Celanese Corp., Class A | | | 9,400 | | | | 335,110 | |
Domtar Corp. | | | 4,800 | | | | 380,928 | |
Freeport McMoRan Copper & Gold, Inc.,
Class B | | | 5,800 | | | | 549,144 | |
KapStone Paper and Packaging Corp.* | | | 7,600 | | | | 97,280 | |
Lubrizol Corp. | | | 3,600 | 2 | | | 368,964 | |
Neenah Paper, Inc. | | | 1,600 | | | | 24,560 | |
Newmont Mining, Ltd. | | | 4,400 | | | | 267,828 | |
Omnova Solutions, Inc.* | | | 11,600 | | | | 92,568 | |
PolyOne Corp.* | | | 10,000 | | | | 129,200 | |
Stepan Co. | | | 2,600 | | | | 175,344 | |
Walter Industries, Inc. | | | 2,600 | | | | 228,696 | |
Total Materials | | | | | | | 2,649,622 | |
Telecommunication Services - 3.4% | | | | | | | | |
AT&T, Inc. | | | 25,000 | | | | 712,500 | |
IDT Corp., Class B* | | | 2,800 | | | | 41,104 | |
Telephone & Data Systems, Inc. | | | 10,200 | | | | 355,266 | |
Verizon Communications, Inc. | | | 20,200 | | | | 655,894 | |
Total Telecommunication Services | | | | | | | 1,764,764 | |
Utilities - 3.5% | | | | | | | | |
Cleco Corp. | | | 1,600 | 2 | | | 50,032 | |
CMS Energy Corp. | | | 8,200 | | | | 150,716 | |
Constellation Energy Group, Inc. | | | 9,400 | | | | 284,256 | |
DTE Energy Co. | | | 3,200 | | | | 149,632 | |
Energen Corp. | | | 7,400 | | | | 330,336 | |
Entergy Corp. | | | 2,200 | 2 | | | 163,966 | |
Pepco Holdings, Inc. | | | 9,200 | 2 | | | 177,192 | |
Southwest Gas Corp. | | | 8,400 | | | | 291,984 | |
UGI Corp. | | | 3,600 | 2 | | | 108,324 | |
UniSource Energy Corp. | | | 2,400 | | | | 84,168 | |
Total Utilities | | | | | | | 1,790,606 | |
Total Common Stocks
(cost $47,378,291) | | | | | | | 51,584,302 | |
Short-Term Investments - 2.3%1 | | | | | | | | |
BNY Institutional Cash Reserves Fund, Series B*3,4 | | | 201,100 | | | | 159,926 | |
BNY Mellon Overnight Government Fund, 0.21%3 | | | 810,000 | | | | 810,000 | |
Dreyfus Cash Management Fund, Institutional Class Shares, 0.16% | | | 234,283 | | | | 234,283 | |
Total Short-Term Investments
(cost $1,245,383) | | | | | | | 1,204,209 | |
Total Investments - 101.9%
(cost $48,623,674) | | | | | | | 52,788,511 | |
Other Assets, less Liabilities - (1.9)% | | | | | | | (982,075 | ) |
Net Assets - 100.0% | | | | | | $ | 51,806,436 | |
Note: Based on the approximate cost of investments of $49,327,394 for Federal income tax purposes at October 31, 2010, the aggregate gross unrealized appreciation and depreciation were $5,780,437 and $2,319,320, respectively, resulting in net unrealized appreciation of investments of $3,461,117.
| * | Non-income-producing securities. |
| 1 | Yield shown for each investment company below represents the October 31, 2010, seven-day average yield, which refers to the sum of the previous seven days’ dividends paid, expressed as an annual percentage. |
| 2 | Some or all of these shares, amounting to a market value of $958,234, or 1.8% of net assets, were out on loan to various brokers. |
| 3 | Collateral received from brokers for securities lending was invested in these short-term investments. |
| 4 | On September 12, 2008, The Bank of New York Mellon established a separate sleeve of the BNY Institutional Cash Reserves Fund (Series B) to hold certain Lehman Brothers floating rate notes. The Fund’s position in Series B is being fair valued daily. (See Note 4 in the Notes to Financial Statements.) |
The accompanying notes are an integral part of these financial statements.
16
Managers AMG FQ U.S. Equity Fund
Notes to Schedules of Portfolio Investments
The Fund had the following open futures contracts as of October 31, 2010:
(See Note 9 in the Notes to Financial Statements.)
U.S. Equity
| | | | | | | | | | | | | | | | |
Type | | Number of
Contracts | | | Position | | | Expiration Date | | | Unrealized
Gain | |
S&P 500 E-Mini Index | | | 5 | | | | Long | | | | 12/17/2010 | | | $ | 19,722 | |
The following table summarizes the inputs used to value the Fund’s net assets by the fair value hierarchy levels as of October 31, 2010: (See Note 1(a) in the Notes to Financial Statements.)
| | | | | | | | | | | | | | | | |
| | | Quoted Prices
in Active
Markets for
Identical
Investments
Level 1 | | | Significant
Other
Observable
Inputs
Level 2 | | | Significant
Unobservable
Inputs
Level 3 | | | Total | |
U.S. Equity | | | | | | | | | | | | | | | | |
Investments in Securities | | | | | | | | | | | | | | | | |
Common Stocks† | | $ | 51,584,302 | | | | — | | | | — | | | $ | 51,584,302 | |
Short-Term Investments | | | 1,044,283 | | | $ | 159,926 | | | | — | | | | 1,204,209 | |
| | | | | | | | | | | | | | | | |
Total Investments in Securities | | $ | 52,628,585 | | | $ | 159,926 | | | | — | | | $ | 52,788,511 | |
| | | | | | | | | | | | | | | | |
Derivatives†† | | | | | | | | | | | | | | | | |
Equity Contracts | | $ | 19,722 | | | | — | | | | — | | | $ | 19,722 | |
| | | | | | | | | | | | | | | | |
| † | All common stocks held in the Funds are Level 1 securities. For a detailed break-out of the common stocks by major industry classification, please refer to the Schedule of Portfolio Investments. |
| †† | Derivative instruments, such as futures, forwards and swap contracts, are not reflected in the Schedule of Portfolio Investments, and are valued at the unrealized appreciation/depreciation of the instrument. |
As of October 31, 2010, the Funds had no significant transfers between Level 1 and Level 2 from the beginning of the reporting period.
The following schedule shows the fair value of derivative instruments at October 31, 2010:
(See Note 9 in the Notes to Financial Statements.)
| | | | | | | | | | | | | | |
| | | | | Asset Derivatives | | | Liability Derivatives | |
Fund | | Derivatives not accounted for as
hedging instruments | | Statement of Assets and Liabilities Location | | Fair Value | | | Statement of Assets and
Liabilities Location | | Fair Value | |
U.S. Equity | | Equity contracts | | Receivable for variation margin on futures | | $ | 100 | | | Payable for variation margin on futures | | | — | |
| | | | | | | | | | | | | | |
For the fiscal year ended October 31, 2010, the effect of derivative instruments on the Statement of Operations for the Fund and the amount of realized gain/(loss) on derivatives recognized in income was as follows:
| | | | | | | | | | | | | | |
Fund | | Derivatives not accounted for as hedging instruments | | Futures | | | Forward Currency
Contracts | | | Total | |
U.S. Equity | | Equity contracts | | $ | 18,308 | | | | — | | | $ | 18,308 | |
| | | | | | | | | | | | | | |
The change in unrealized gain/(loss) on derivatives recognized in income was as follows:
| | | | | | | | | | | | | | |
Fund | | Derivatives not accounted for as hedging instruments | | Futures | | | Forward Currency
Contracts | | | Total | |
U.S. Equity | | Equity contracts | | $ | 22,938 | | | | — | | | $ | 22,938 | |
| | | | | | | | | | | | | | |
The accompanying notes are an integral part of these financial statements.
17
Managers AMG FQ Global Alternatives Fund
Portfolio Manager’s Comments
The Managers AMG FQ Global Alternatives Fund delivered modestly positive returns for the past fiscal year ended October 31, 2010. The Fund (Class A Shares at NAV) returned 2.71% while the benchmark, the Citigroup 1-Month U.S. Treasury Bill Index, returned 0.11% during this time. Please refer to the table on page 19 for returns of various share classes.
Global capital markets continued to rally over the prior fiscal year as the economic recovery from the credit crisis gained steam despite a host of macroeconomic concerns that raised issues about the sustainability of such a recovery. For the entire one-year period, U.S. large-cap stocks underperformed their smaller-cap brethren with the Russell 1000® (large cap), Russell 2000® (small cap), Russell 3000® (all cap), and the Russell Microcap® Indexes returning 17.7%, 26.6%, 18.3%, and 25.1%, respectively. International developed-market stocks underperformed their domestic counterparts by a wide margin due to ongoing concerns about the sovereign debt market in continental Europe and generally muted secular growth expectations for Pan Europe. The MSCI EAFE Index returned 8.4% during this period. Meanwhile, REITs outperformed domestic U.S. equities by a substantial margin returning 42.6%. Fixed-income securities also enjoyed solid returns for the prior fiscal year as the Barclays Capital U.S. Aggregate and the Barclays Capital Global Aggregate ex-U.S. Indexes returned 8.0% and 6.9%, respectively. Similar to the prior fiscal year, lower-quality securities posted particularly strong results, returning 19.4% as measured by the Barclays Capital U.S. Corporate High Yield Index.
During this period, the Fund delivered positive performance while continuing to perform in a low-correlation manner relative to broader markets. Within the Fund, solid performance was primarily driven by success within the bond country selection and currency selection strategies. The asset class selection strategy, along with the stock country selection strategy, offered mixed results throughout the last fiscal year. In the bond country selection strategy, the outperformance was generated in the first half of the fiscal year and was driven by a majority of the positions within this strategy. Within the currency strategy, most of the value-added was concentrated in the first quarter of 2010, with successful positions including a long to the U.S. Dollar and a short to the Euro during a period when global risk aversion increased amid the sovereign debt crisis in Europe, which led to a sharp dollar rally. The asset class selection strategy delivered mostly neutral to negative results until the last two months of the fiscal year, when a long to global equities (and short to global fixed income) yielded solid positive returns as equity markets rallied sharply from a late summer swoon. The stock country selection strategy delivered mostly neutral results throughout the course of the year and generally had the smallest risk budget of the four strategies as developed equity markets on a cross-country basis were reasonably fairly valued throughout the course of the past year resulting in little significant opportunity to add value in this particular strategy.
The tactical risk allocation in the Fund currently finds the most compelling opportunity within the asset class selection strategy where it maintains a long to global equities and a corresponding short position to global fixed income. This is driven by several factors within this particular strategy, including the more benign risk environment we recently entered into which should be more conducive to solid performance from equities. The currency selection strategy continues to have a significant weight within the Fund with its largest long positions to the U.K. Pound and U.S. Dollar and short positions to the Australian and Canadian Dollars. In the bond country selection strategy, the largest positions currently are a long to the U.S. bond market and shorts to the Australian and Canadian bond markets. Finally, the stock country selection strategy has the smallest risk allocation currently of the four strategies with its current largest active positions both on the short side (shorts to the Australian and Canadian equity markets). A large majority of the positions within the Fund are established via highly liquid derivative contracts. The equity and bond country selection strategy utilize exchange traded futures contracts while the Fund’s currency strategy uses OTC forward contracts.
Cumulative Total Return Performance
Managers AMG FQ Global Alternatives Fund’s cumulative total return is based on the daily change in net asset value (NAV), and assumes that all distributions were reinvested. The Citigroup 1-Month U.S. Treasury Bill Index (“1-Month Treasury Index”) measures returns of 1-month treasury bills. Unlike the Fund, the 1-Month Treasury Index is unmanaged, is not available for investment, and does not incur expenses. The chart on page 19 illustrates the performance of a hypothetical $10,000 investment made in the Class A shares (with load) of the Fund on March 30, 2006 (commencement of operations), to a $10,000 investment made in the 1-Month Treasury Index for the same time period. Figures include reinvestment of capital gains and dividends. The listed returns for the Fund are net of expenses and the returns for the index exclude expenses. The graph and table do not reflect the deduction of taxes that a shareholder would pay on a Fund distribution or redemption of shares. Total returns for the Fund would have been lower had certain expenses not been reduced.
18
Managers AMG FQ Global Alternatives Fund
Portfolio Manager’s Comments (continued)
Cumulative Total Return Performance
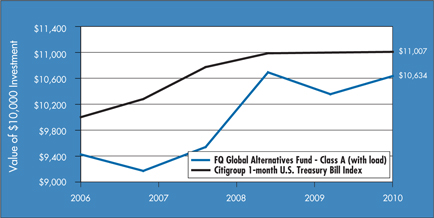
The table below shows the average annualized total returns for the Managers AMG FQ Global Alternatives Fund and the Citigroup 1-Month U.S. Treasury Bill Index since inception through October 31, 2010.
| | | | | | | | | | | | |
Average Total Returns1 | | One Year | | | Since
Inception | | | Inception
Date | |
Managers AMG FQ Global Alternatives Fund*3,4,5,6,7 | | | | | | | | | | | | |
No Load: | | | | | | | | | | | | |
Class A | | | 2.71 | % | | | 2.67 | % | | | 3/30/06 | |
Class C | | | 2.15 | % | | | 1.94 | % | | | 3/30/06 | |
Service Class | | | — | | | | 3.01 | % | | | 1/01/10 | |
Institutional Class | | | — | | | | 3.01 | % | | | 1/01/10 | |
Citigroup 1-Month U.S. Treasury Bill Index2 | | | 0.11 | % | | | 2.12 | % | | | 3/31/06 | |
With Load: | | | | | | | | | | | | |
Class A | | | (3.22 | )% | | | 1.35 | % | | | 3/30/06 | |
Class C | | | 1.15 | % | | | 1.94 | % | | | 3/30/06 | |
| * | Commencement of operations was March 30, 2006. |
The performance data shown represents past performance, which is not a guarantee of future results. Current performance may be lower or higher than the performance data quoted. The investment return and principal value of an investment in the Funds will fluctuate so that an investor’s shares, when redeemed, may be worth more or less than their original cost. For performance information through the most recent month end please call (800) 835-3879 or visit our website at www.managersinvest.com.
In choosing a Fund, investors should carefully consider the amount they plan to invest, their investment objectives, the Fund’s investment objectives, risks, charges and expenses before investing. For this and other information, please call (800) 835-3879 or visit www.managersinvest.com for a free prospectus. Read it carefully before investing or sending money. Distributed by Managers Distributors, Inc., member FINRA.
| 1 | Total return equals income yield plus share price change and assumes reinvestment of all dividends and capital gain distributions. Returns are net of fees and may reflect offsets of Fund expenses as described in the Prospectus. No adjustment has been made for taxes payable by shareholders on their reinvested dividends and capital gain distributions. Returns for periods greater than one year are annualized. The listed returns on the Fund are net of expenses and based on the published NAV as of October 31, 2010. All returns are in U.S. dollars($). |
| 2 | Performance for the Citigroup 1-Month U.S. Treasury Bill Index reflects an inception date of March 31, 2006. The Citigroup 1-Month Treasury Bill Index is a market value-weighted index of public obligations of the U.S. Treasury with maturities of one month. Unlike the Fund, the Citigroup 1-Month T-Bill Index is unmanaged, is not available for investment, and does not incur expenses. |
| 3 | From time to time, the Fund’s advisor has waived its fees and/or absorbed Fund expenses, which has resulted in higher returns. |
| 4 | Changing interest rates may adversely affect the value of an investment. An increase in interest rates typically causes the value of bonds and other fixed-income securities to fall. |
| 5 | The Fund may use derivative instruments for hedging purposes or as part of its investment strategy. There is a risk that a derivative intended as a hedge may not perform as expected. The main risk with derivatives is that some types can amplify a gain or loss, potentially earning or losing substantially more money than the actual cost of the derivative or that the counterparty may fail to honor its contract terms, causing a loss for the Fund. Use of these instruments may also involve certain costs and risks such as liquidity risk, interest rate risk, market risk, credit risk, management risk, and the risk that a fund could not close out a position when it would be most advantageous to do so. The Fund is subject to currency risk resulting from fluctuations in exchange rates that may affect the total loss or gain on a non-U.S Dollar security when converted back to U.S Dollars. Changing interest rates may adversely affect the value of an investment. |
| 6 | Investments in foreign securities and currency instruments are subject to additional risks such as erratic market conditions, economic and political instability, and currency exchange rate fluctuations. |
| 7 | Class C Shares convert to an equal dollar value of Class A Shares at the end of the tenth year after purchase. |
Not FDIC insured, nor bank guaranteed. May lose value.
19
Managers AMG FQ Global Essentials Fund
Portfolio Manager’s Comments
The Managers AMG FQ Global Essentials Fund delivered strong positive absolute and relative returns for the fiscal year ended October 31, 2010. The Fund (Institutional Class) returned 15.50% while its benchmark, which consists of 60% of the return of MSCI World (hedged) Index and 40% of the return of the Citigroup World Government Bond (hedged) Index, returned 8.25% during this time.
Global capital markets continued to rally over the prior fiscal year as the economic recovery from the credit crisis gained steam despite a host of macroeconomic concerns that raised issues about the sustainability of such a recovery. For the entire one-year period, U.S. large-cap stocks underperformed their smaller-cap brethren with the Russell 1000® (large cap), Russell 2000® (small cap), Russell 3000® (all cap), and the Russell Microcap® Indexes returning 17.7%, 26.6%, 18.3%, and 25.1%, respectively. International developed market stocks underperformed their domestic counterparts by a wide margin due to ongoing concerns about the sovereign debt market in continental Europe and generally muted secular growth expectations for Pan Europe. The MSCI EAFE Index returned 8.4% during this period. Meanwhile, REITs outperformed domestic US equities by a substantial margin returning 42.6%. Fixed income securities also enjoyed solid returns for the prior fiscal year as the Barclays Capital US Aggregate Bond and the Bar-clays Capital Global Aggregate ex-US Indexes returned 8.0% and 6.9%, respectively. Similar to the prior fiscal year, lower-quality securities posted particularly strong results returning 19.4% as measured by the Barclays Capital US Corporate High Yield Index.
Strong absolute performance by the Fund over the past year was driven by investments within all three major asset classes in the portfolio which include equities, fixed income, and hard assets (commodities and TIPS). The Fund also outperformed a 60\40 balanced benchmark significantly over the last year. This was primarily driven by strong performance within the equity and commodity portion of the Fund as well as by the risk balanced nature of investments within the portfolio as opposed to using a market capitalization weighting scheme. For example, within equities, the Fund boasted strong performance relative to a 60\40 balanced benchmark because of increased exposure to U.S. small caps and REITs which continued to outperform U.S. large cap securities. The portfolio also marginally benefited from “regime switching” over the last fiscal year which is the tactical reallocation of assets in the Fund based upon the prevailing risk environment that is driven by First Quadrant L.P.’s (“First Quadrant”) proprietary Market Risk Index.
The First Quadrant Market Risk Index is currently measuring a “Median Risk” environment as of the end of the fiscal year as, more recently, the VIX, a popular measure of the implied volatility of the S&P 500 Index, has dropped and credit spreads have also come in below their trigger levels. This has led to a recent increase in exposure to both equities and commodities and a decrease in exposure to the sovereign debt portion of the Fund.
Cumulative Total Return Performance
Managers AMG FQ Global Essentials Fund’s cumulative total return is based on the daily change in net asset value (NAV), and assumes that all distributions were reinvested. The Managers Global Essentials Fund Composite Hedged Index (“Hedged Index”) and the Managers Global Essentials Fund Composite Unhedged Index (“Unhedged Index”) are comprised of 60% MSCI World Index and 40% Citigroup World Government Bond Index. The MSCI World Index is a free float-adjusted market capitalization weighted index that is designed to measure the equity market performance of developed and emerging markets. The MSCI World Index consists of 24 developed country indices. Unlike the Fund, the Composite Index is unmanaged, is not available for investment, and does not incur fees. All MSCI data is provided ‘as is.’ The chart on page 21 illustrates the performance of a hypothetical $10,000 investment made in the Institutional Class shares of the Fund on October 31, 2000, to a $10,000 investment made in the Hedged Index and the Unhedged Index for the same time period. Figures include reinvestment of capital gains and dividends. The listed returns for the Fund are net of expenses and the returns for the index exclude expenses. The graph and table do not reflect the deduction of taxes that a shareholder would pay on a Fund distribution or redemption of shares. Total returns for the Fund would have been lower had certain expenses not been reduced.
20
Managers AMG FQ Global Essentials Fund
Portfolio Manager’s Comments (continued)
Cumulative Total Return Performance
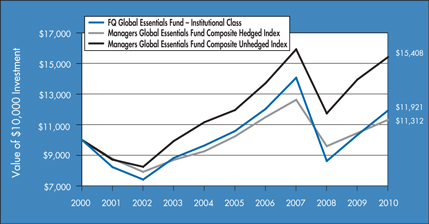
The table below shows the average annualized total returns for the Managers AMG FQ Global Essentials Fund and the Managers Global Essentials Fund Composite Hedged Index from October 31, 2000 to October 31, 2010.
| | | | | | | | | | | | | | | | | | | | |
Average Annual Total Returns1 | | One Year | | | Five Years | | | Ten Years | | | Since
Inception | | | Inception Date | |
Managers AMG FQ Global Essentials Fund2,3,4,5 | | | | | | | | | | | | | | | | | | | | |
Investor Class | | | — | | | | — | | | | — | | | | 12.15 | % | | | 1/01/2010 | |
Service Class | | | — | | | | — | | | | — | | | | 12.41 | % | | | 1/01/2010 | |
Institutional Class | | | 15.50 | % | | | 2.42 | % | | | 1.77 | % | | | 6.32 | % | | | 11/18/1988 | |
Managers Global Essentials Fund Composite | | | | | | | | | | | | | | | | | | | | |
Hedged Index6 | | | 8.25 | % | | | 2.03 | % | | | 1.24 | % | | | 5.53 | % | | | 11/30/1988 | |
Managers Global Essentials Fund Composite | | | | | | | | | | | | | | | | | | | | |
Unhedged Index6 | | | 10.53 | % | | | 5.22 | % | | | 4.42 | % | | | 6.85 | % | | | 11/30/1988 | |
The performance data shown represents past performance, which is not a guarantee of future results. Current performance may be lower or higher than the performance data quoted. The investment return and principal value of an investment in the Funds will fluctuate so that an investor’s shares, when redeemed, may be worth more or less than their original cost. For performance information through the most recent month end please call (800) 835-3879 or visit our website at www.managersinvest.com.
In choosing a Fund, investors should carefully consider the amount they plan to invest, their investment objectives, the Fund’s investment objectives, risks, charges and expenses before investing. For this and other information, please call (800) 835-3879 or visit www.managersinvest.com for a free prospectus. Read it carefully before investing or sending money. Distributed by Managers Distributors, Inc., member FINRA.
| 1 | Total return equals income yield plus share price change and assumes reinvestment of all dividends and capital gain distributions. Returns are net of fees and may reflect offsets of Fund expenses as described in the Prospectus. No adjustment has been made for taxes payable by shareholders on their reinvested dividends and capital gain distributions. Returns for periods greater than one year are annualized. The listed returns on the Fund are net of expenses and based on the published NAV as of October 31, 2010. All returns are in U.S. dollars($). |
| 2 | Investments in foreign securities, even though publicly traded in the United States, may involve risks which are in addition to those inherent in domestic investments. The use of leverage in a Fund’s strategy can magnify relatively small market movements into relatively larger losses for the Fund. |
| 3 | The Fund is subject to special risk considerations similar to those associated with the direct ownership of real estate. Real estate valuations may be subject to factors such as changing general and local economic, financial, competitive and environmental conditions. |
| 4 | Because the Fund invests in exchange-traded funds (ETFs) which incur their own costs, investing in them could result in a higher cost to the investor. Additionally, the Fund will be indirectly exposed to all the risks of securities held by the ETFs. |
| 5 | Obligations of certain government agencies are not backed by the full faith and credit of the U.S. Government. If one of these agencies defaulted on a loan, there is no guarantee that the U.S. Government will provide financial support. Additionally, debt securities of the U.S. Government may be affected by changing interest rates and subject to prepayment risk. |
| 6 | The Fund’s index is comprised of 60% MSCI World Index and 40% Citigroup World Government Bond Index. The MSCI World Index is a free float-adjusted market capitalization weighted index that is designed to measure the equity market performance of developed and emerging markets. The MSCI World Index consists of 24 developed country indices. The Citigroup World Government Bond Index is a market capitalization weighted index consisting of the government bond markets. Country eligibility is determined based on market capitalization and investability criteria. All issues have a remaining maturity of at least one year. Unlike the Fund, the Composite Index is unmanaged, is not available for investment, and does not incur fees. All MSCI data is provided ‘as is’. The products described herein are not sponsored or endorsed and have not been reviewed or passed on by MSCI. In no event shall MSCI, its affiliates, or any MSCI data provider have any liability of any kind in connection with the MSCI data or the products described herein. Copying or redistributing the MSCI data is strictly prohibited. |
Not FDIC insured, nor bank guaranteed. May lose value.
21
Managers AMG FQ Funds
Statements of Assets and Liabilities
October 31, 2010
| | | | | | | | |
| | | FQ Tax-Managed
U.S. Equity | | | FQ U.S.
Equity | |
Assets: | | | | | | | | |
Investments at value (including securities on loan valued at $1,696,112 and $958,234, respectively)* | | $ | 48,798,857 | | | $ | 52,788,511 | |
Cash collateral for futures | | | — | | | | 77,000 | |
Receivable for investments sold | | | 3,278,333 | | | | — | |
Receivable for Fund shares sold | | | 942 | | | | 4,800 | |
Dividends and other receivables | | | 27,942 | | | | 47,336 | |
Receivable from affiliate | | | 2,324 | | | | 559 | |
Receivable for variation margin on futures contracts | | | — | | | | 100 | |
Prepaid expenses | | | 3,339 | | | | 15,925 | |
Total assets | | | 52,111,737 | | | | 52,934,231 | |
Liabilities: | | | | | | | | |
Payable upon return of securities loaned | | | 1,865,520 | | | | 1,011,100 | |
Payable for Fund shares repurchased | | | 341,204 | | | | 26,617 | |
Payable for investments purchased | | | 3,178,812 | | | | — | |
Accrued expenses: | | | | | | | | |
Investment management and advisory fees | | | 33,349 | | | | 15,207 | |
Administrative fees | | | — | | | | 10,862 | |
Distribution fees Class A | | | 924 | | | | 3,925 | |
Distribution fees Class C | | | 2,583 | | | | 620 | |
Professional fees | | | 33,920 | | | | 36,098 | |
Custodian fees | | | 7,601 | | | | 6,740 | |
Other | | | 16,588 | | | | 16,626 | |
Total liabilities | | | 5,480,501 | | | | 1,127,795 | |
Net Assets | | $ | 46,631,236 | | | $ | 51,806,436 | |
Net Assets Represent: | | | | | | | | |
Paid-in capital | | $ | 70,749,072 | | | $ | 69,252,953 | |
Undistributed net investment income | | | 169,442 | | | | 392,829 | |
Accumulated net realized loss from investments and futures contracts | | | (32,580,437 | ) | | | (22,023,905 | ) |
Net unrealized appreciation of investments and futures contracts | | | 8,293,159 | | | | 4,184,559 | |
Net Assets | | $ | 46,631,236 | | | $ | 51,806,436 | |
Class A Shares - Net Assets | | $ | 4,116,495 | | | $ | 18,755,383 | |
Shares outstanding | | | 330,047 | | | | 1,823,495 | |
Net asset value, offering and redemption price per share | | $ | 12.47 | | | $ | 10.29 | |
Offering price per share based on a maximum sales charge of 5.75% (Net asset value per share/(100% - maximum sales charge)) | | $ | 13.23 | | | $ | 10.91 | |
Class C Shares - Net Assets | | $ | 3,095,157 | | | $ | 742,296 | |
Shares outstanding | | | 253,531 | | | | 72,796 | |
Net asset value, offering and redemption price per share | | $ | 12.21 | | | $ | 10.20 | |
Institutional Class Shares - Net Assets | | $ | 39,419,584 | | | $ | 32,308,757 | |
Shares outstanding | | | 3,170,785 | | | | 3,120,282 | |
Net asset value, offering and redemption price per share | | $ | 12.43 | | | $ | 10.35 | |
* Investments at cost | | $ | 40,505,698 | | | $ | 48,623,674 | |
The accompanying notes are an integral part of these financial statements.
22
Managers AMG FQ Global Alternatives Fund
Statement of Net Assets
October 31, 2010
| | | | | | | | |
| | | Principal Amount | | | Value | |
Assets: | | | | | | | | |
Investments in Securities - 96.3% | | | | | | | | |
U.S. Government Obligations - 7.4%1,2 | | | | | | | | |
U.S. Treasury Bills, 0.089%, 11/15/10 | | $ | 6,000,000 | | | $ | 5,999,682 | |
U.S. Treasury Bills, 0.090%, 12/16/10 | | | 1,000,000 | | | | 999,831 | |
U.S. Treasury Bills, 0.107%, 11/26/10 | | | 11,225,000 | | | | 11,223,990 | |
U.S. Treasury Bills, 0.112%, 12/09/10 | | | 1,000,000 | | | | 999,873 | |
U.S. Treasury Bills, 0.131%, 12/23/10 | | | 2,000,000 | | | | 1,999,566 | |
U.S. Treasury Bills, 0.133%, 11/04/10 | | | 5,400,000 | | | | 5,399,946 | |
U.S. Treasury Bills, 0.136%, 12/30/10 | | | 18,480,000 | | | | 18,475,768 | |
| | | | | | | | |
Total U.S. Government Obligations
(cost $45,097,561) | | | | | | | 45,098,656 | |
| | |
| | | Shares | | | | |
Exchange Traded Fund - 18.4% | | | | | | | | |
S&P 500 SPDR Trust Series I
(cost $93,930,828) | | | 946,310 | | | | 112,166,124 | |
Short-Term Investments - 70.5%3 | | | | | | | | |
Dreyfus Cash Management Fund, Institutional Class Shares, 0.16%4 | | | 227,998,220 | | | | 227,998,220 | |
JPMorgan Liquid Assets Money Market Fund, Capital Shares, 0.14% | | | 200,224,070 | | | | 200,224,070 | |
| | | | | | | | |
Total Short-Term Investments
(cost $428,222,290) | | | | | | | 428,222,290 | |
Total Investments in Securities
(cost $567,250,679) | | | | | | | 585,487,070 | |
Receivable for foreign currency contracts | | | | | | | 16,379 | |
Unrealized appreciation on forward foreign currency contracts | | | | | | | 58,622,850 | |
Receivable for Fund shares sold | | | | | | | 37,570,664 | |
Receivable for variation margin on futures contracts | | | | | | | 10,792,992 | |
Receivable from affiliate | | | | | | | 336,117 | |
Interest and other receivables | | | | | | | 50,730 | |
Prepaid expenses | | | | | | | 49,373 | |
Total assets | | | | | | | 692,926,175 | |
Liabilities: | | | | | | | | |
Payable for Fund shares repurchased | | | | | | | 1,249,441 | |
Unrealized depreciation on forward foreign currency contracts | | | | | | | 69,743,691 | |
Payable for variation margin on futures contracts | | | | | | | 12,882,546 | |
Accrued expenses: | | | | | | | | |
Investment management and advisory fees | | | | | | | 803,134 | |
Administrative fees | | | | | | | 119,608 | |
Distribution fees Class A | | | | | | | 101,160 | |
Distribution fees Class C | | | | | | | 38,010 | |
Professional fees | | | | | | | 65,274 | |
Transfer agent fees | | | | | | | 34,718 | |
Custodian fees | | | | | | | 17,453 | |
Other | | | | | | | 184,789 | |
Total liabilities | | | | | | | 85,239,824 | |
Net Assets | | | | | | $ | 607,686,351 | |
The accompanying notes are an integral part of these financial statements.
23
Managers AMG FQ Global Alternatives Fund
Statement of Net Assets (continued)
| | | | |
| | | Value | |
Net Assets Represent: | | | | |
Paid-in capital | | $ | 596,845,625 | |
Undistributed net investment income | | | 11,104,586 | |
Accumulated net realized loss from investments, futures and foreign currency transactions | | | (11,956,276 | ) |
Net unrealized appreciation of investments, futures and foreign currency translations | | | 11,692,416 | |
Net Assets | | $ | 607,686,351 | |
Class A Shares - Net Assets | | $ | 518,117,989 | |
Shares outstanding | | | 50,600,964 | |
Net asset value and redemption price per share | | $ | 10.24 | |
Offering price per share based on a maximum sales charge of 5.75%
(Net asset value per share/(100% - maximum sales charge)) | | $ | 10.86 | |
Class C Shares - Net Assets | | $ | 45,663,636 | |
Shares outstanding | | | 4,574,104 | |
Net asset value and redemption price per share | | $ | 9.98 | |
Service Shares - Net Assets | | $ | 18,048,915 | |
Shares outstanding | | | 1,756,882 | |
Net asset value and redemption price per share | | $ | 10.27 | |
Institutional Shares - Net Assets | | $ | 25,855,811 | |
Shares outstanding | | | 2,515,892 | |
Net asset value and redemption price per share | | $ | 10.28 | |
The accompanying notes are an integral part of these financial statements.
24
Managers AMG FQ Global Alternatives Fund
Notes to Statement of Net Assets
Note: Based on the approximate cost of investments of $567,250,679 for Federal income tax purposes at October 31, 2010, the aggregate gross unrealized appreciation and depreciation were $18,236,391 and $0, respectively, resulting in net unrealized appreciation of investments of $18,236,391.
| 1 | Securities held as collateral for futures contracts, amounting to a market value of $45,098,656, or 7.4% of net assets. |
| 2 | Yield shown represents yield to maturity at October 31, 2010. |
| 3 | Yield shown for each investment company listed below represents October 31, 2010, seven-day average yield, which refers to the sum of the previous seven days’ dividends paid, expressed as an annual percentage. |
| 4 | A portion of this investment is held in a segregated account as collateral for forward currency contracts, amounting to a market value of $22,000,000, or 3.6% of net assets. |
The open forward foreign currency exchange contracts (in U.S. Dollars) at October 31, 2010, were as follows:
(See Note 8 in the Notes to Financial Statements.)
Global Alternatives - Foreign Currency
| | | | | | | | | | | | | | | | | | | | | | | | |
Type | | Position | | | Settlement Date | | | Counterparty | | | Receivable Amount | | | Payable Amount | | | Unrealized
Gain/(Loss) | |
Australian Dollar | | | Short | | | | 12/15/2010 | | | | GS | | | $ | 200,849,471 | | | $ | 211,120,263 | | | ($ | 10,270,792 | ) |
Australian Dollar | | | Short | | | | 12/15/2010 | | | | MS | | | | 201,157,585 | | | | 211,120,263 | | | | (9,962,678 | ) |
Canadian Dollar | | | Short | | | | 12/15/2010 | | | | GS | | | | 167,387,291 | | | | 170,790,545 | | | | (3,403,254 | ) |
Canadian Dollar | | | Short | | | | 12/15/2010 | | | | MS | | | | 167,741,844 | | | | 170,790,545 | | | | (3,048,701 | ) |
Euro | | | Short | | | | 12/15/2010 | | | | GS | | | | 128,165,712 | | | | 134,919,655 | | | | (6,753,943 | ) |
Euro | | | Short | | | | 12/15/2010 | | | | MS | | | | 128,261,898 | | | | 134,919,655 | | | | (6,657,757 | ) |
Japanese Yen | | | Short | | | | 12/15/2010 | | | | GS | | | | 167,169,498 | | | | 172,232,919 | | | | (5,063,421 | ) |
Japanese Yen | | | Short | | | | 12/15/2010 | | | | MS | | | | 167,217,932 | | | | 172,232,919 | | | | (5,014,987 | ) |
New Zealand Dollar | | | Short | | | | 12/15/2010 | | | | GS | | | | 97,417,238 | | | | 101,404,663 | | | | (3,987,425 | ) |
New Zealand Dollar | | | Short | | | | 12/15/2010 | | | | MS | | | | 97,404,799 | | | | 101,404,663 | | | | (3,999,864 | ) |
Pound Sterling | | | Short | | | | 12/15/2010 | | | | GS | | | | 53,787,649 | | | | 54,952,516 | | | | (1,164,867 | ) |
Pound Sterling | | | Short | | | | 12/15/2010 | | | | MS | | | | 53,789,119 | | | | 54,952,516 | | | | (1,163,397 | ) |
Swedish Krona | | | Short | | | | 12/15/2010 | | | | GS | | | | 52,663,320 | | | | 53,978,374 | | | | (1,315,054 | ) |
Swedish Krona | | | Short | | | | 12/15/2010 | | | | MS | | | | 52,681,327 | | | | 53,978,374 | | | | (1,297,047 | ) |
Swiss Franc | | | Short | | | | 12/15/2010 | | | | GS | | | | 127,100,952 | | | | 128,095,287 | | | | (994,335 | ) |
Swiss Franc | | | Short | | | | 12/15/2010 | | | | MS | | | | 126,854,256 | | | | 128,095,287 | | | | (1,241,031 | ) |
Australian Dollar | | | Long | | | | 12/15/2010 | | | | GS | | | | 102,169,632 | | | | 98,989,638 | | | | 3,179,994 | |
Australian Dollar | | | Long | | | | 12/15/2010 | | | | MS | | | | 102,169,632 | | | | 99,018,483 | | | | 3,151,149 | |
Canadian Dollar | | | Long | | | | 12/15/2010 | | | | GS | | | | 57,198,538 | | | | 57,096,244 | | | | 102,294 | |
Canadian Dollar | | | Long | | | | 12/15/2010 | | | | MS | | | | 57,198,537 | | | | 57,100,114 | | | | 98,423 | |
Euro | | | Long | | | | 12/15/2010 | | | | GS | | | | 149,937,185 | | | | 144,676,169 | | | | 5,261,016 | |
Euro | | | Long | | | | 12/15/2010 | | | | MS | | | | 149,937,185 | | | | 144,600,082 | | | | 5,337,103 | |
Japanese Yen | | | Long | | | | 12/15/2010 | | | | GS | | | | 90,180,104 | | | | 86,466,741 | | | | 3,713,363 | |
Japanese Yen | | | Long | | | | 12/15/2010 | | | | MS | | | | 90,180,104 | | | | 86,028,138 | | | | 4,151,966 | |
New Zealand Dollar | | | Long | | | | 12/15/2010 | | | | GS | | | | 59,416,840 | | | | 57,718,178 | | | | 1,698,662 | |
New Zealand Dollar | | | Long | | | | 12/15/2010 | | | | MS | | | | 59,416,840 | | | | 57,686,185 | | | | 1,730,655 | |
Pound Sterling | | | Long | | | | 12/15/2010 | | | | GS | | | | 187,133,901 | | | | 180,955,773 | | | | 6,178,128 | |
Pound Sterling | | | Long | | | | 12/15/2010 | | | | MS | | | | 187,133,901 | | | | 180,894,696 | | | | 6,239,205 | |
Swedish Krona | | | Long | | | | 12/15/2010 | | | | GS | | | | 150,251,155 | | | | 144,792,141 | | | | 5,459,014 | |
Swedish Krona | | | Long | | | | 12/15/2010 | | | | MS | | | | 150,251,155 | | | | 144,735,934 | | | | 5,515,221 | |
Swiss Franc | | | Long | | | | 12/15/2010 | | | | GS | | | | 93,355,659 | | | | 91,970,796 | | | | 1,384,863 | |
Swiss Franc | | | Long | | | | 12/15/2010 | | | | MS | | | | 105,543,056 | | | | 104,526,400 | | | | 1,016,656 | |
| | | | | | | | | | | | | | | | | | | | | | | | |
Totals | | | | | | | | | | | | | | $ | 3,781,123,315 | | | $ | 3,792,244,156 | | | ($ | 11,120,841 | ) |
| | | | | | | | | | | | | | | | | | | | | | | | |
The accompanying notes are an integral part of these financial statements.
25
Managers AMG FQ Global Alternatives Fund
Notes to Statement of Net Assets (continued)
All futures contracts are exchange traded unless otherwise noted. The counterparty for all OTC contracts is Morgan Stanley. (See Note 9 in the Notes to Financial Statements.) The Fund had the following open futures contracts as of October 31, 2010:
Global Alternatives - Futures
| | | | | | | | | | | | | | | | | | | | | | |
Type | | Currency | | Number of
Contracts | | | Position | | | Type | | | Expiration Date | | | Unrealized
Gain/(Loss) | |
Australian 10-Year Bond | | AUD | | | 3,928 | | | | Short | | | | Exchange | | | | 12/15/2010 | | | $ | 1,727,755 | |
Australian SPI 200 | | AUD | | | 97 | | | | Short | | | | Exchange | | | | 12/16/2010 | | | | 26,079 | |
Canadian 10-Year Bond | | CAD | | | 4,127 | | | | Short | | | | OTC | | | | 12/20/2010 | | | | (2,683,452 | ) |
S&P/TSE 60 Index | | CAD | | | 40 | | | | Short | | | | Exchange | | | | 12/16/2010 | | | | (176,354 | ) |
Amsterdam Index | | EUR | | | 195 | | | | Long | | | | Exchange | | | | 11/19/2010 | | | | (89,435 | ) |
CAC40 10 Index | | EUR | | | 517 | | | | Long | | | | Exchange | | | | 11/19/2010 | | | | 130,859 | |
DAX Index | | EUR | | | 103 | | | | Long | | | | Exchange | | | | 12/17/2010 | | | | 1,296,289 | |
Euro-Bund 10-Year | | EUR | | | 2,021 | | | | Long | | | | OTC | | | | 12/8/2010 | | | | (1,624,099 | ) |
FTSE/MIB Index | | EUR | | | 226 | | | | Long | | | | Exchange | | | | 12/17/2010 | | | | 1,050,246 | |
IBEX 35 Index | | EUR | | | 265 | | | | Long | | | | Exchange | | | | 11/19/2010 | | | | 722,414 | |
FTSE 100 Index | | GBP | | | 360 | | | | Long | | | | Exchange | | | | 12/17/2010 | | | | 569,723 | |
U.K. 10-Year Gilt | | GBP | | | 1,216 | | | | Short | | | | Exchange | | | | 12/29/2010 | | | | 1,604,365 | |
U.K. 10-Year Gilt | | GBP | | | 1,374 | | | | Short | | | | OTC | | | | 12/29/2010 | | | | 3,477,135 | |
Hang Seng Index | | HKD | | | 112 | | | | Short | | | | Exchange | | | | 11/29/2010 | | | | 247,674 | |
Japanese 10-Year Bond | | JPY | | | 2,014 | | | | Long | | | | Exchange | | | | 12/8/2010 | | | | 3,888,365 | |
TOPIX Index | | JPY | | | 237 | | | | Long | | | | Exchange | | | | 12/9/2010 | | | | (507,804 | ) |
S&P 500 Index | | USD | | | 1,382 | | | | Short | | | | Exchange | | | | 12/17/2010 | | | | (5,723,382 | ) |
U.S. Treasury 10-Year Note | | USD | | | 4,056 | | | | Long | | | | OTC | | | | 12/21/2010 | | | | 581,828 | |
| | | | | | | | | | | | | | | | | | | | | | |
Total | | | | | | | | | | | | | | | | | | | | $ | 4,518,206 | |
| | | | | | | | | | | | | | | | | | | | | | |
The following table summarizes the inputs used to value the Fund’s net assets by the fair value hierarchy levels as of October 31, 2010:
(See Note 1(a) in the Notes to Financial Statements.)
| | | | | | | | | | | | | | | | |
| | | Quoted Prices
in Active
Markets for
Identical
Investments
Level 1 | | | Significant
Other
Observable
Inputs
Level 2 | | | Significant
Unobservable
Inputs
Level 3 | | | Total | |
Global Alternatives | | | | | | | | | | | | | | | | |
Investments in Securities | | | | | | | | | | | | | | | | |
US Government Obligations | | | — | | | $ | 45,098,656 | | | | — | | | $ | 45,098,656 | |
Exchange Traded Funds | | $ | 112,166,124 | | | | — | | | | — | | | | 112,166,124 | |
Short-Term Investments | | | 428,222,290 | | | | — | | | | — | | | | 428,222,290 | |
| | | | | | | | | | | | | | | | |
Total Investments in Securities | | $ | 540,388,414 | | | $ | 45,098,656 | | | | — | | | $ | 585,487,070 | |
| | | | | | | | | | | | | | | | |
Derivatives†† | | | | | | | | | | | | | | | | |
Foreign Exchange Contracts | | | — | | | | ($11,120,841 | ) | | | — | | | | ($11,120,841 | ) |
Equity Contracts | | | ($2,453,692 | ) | | | — | | | | — | | | | (2,453,692 | ) |
Interest Rate Contracts | | | 7,220,485 | | | | (248,587 | ) | | | — | | | | 6,971,898 | |
| | | | | | | | | | | | | | | | |
Total Derivatives | | $ | 4,766,793 | | | | ($11,369,428 | ) | | | — | | | | ($6,602,635 | ) |
| | | | | | | | | | | | | | | | |
| †† | Derivative instruments, such as futures, forwards and swap contracts, are valued at the unrealized appreciation/depreciation of the instrument. All OTC futures are valued as Level 2 securities. |
As of October 31, 2010, the Fund had no significant transfers between Level 1 and Level 2 from the beginning of the reporting period.
The accompanying notes are an integral part of these financial statements.
26
Managers AMG FQ Global Alternatives Fund
Notes to Statement of Net Assets (continued)
The following schedule shows the fair value of derivative instruments at October 31, 2010:
(See Note 8 and 9 in the Notes to Financial Statements.)
| | | | | | | | | | | | | | |
| | | | | Asset Derivatives | | | Liability Derivatives | |
Fund | | Derivatives not accounted
for as hedging instruments | | Statement of Assets and
Liabilities Location | | Fair Value | | | Statement of Assets and
Liabilities Location | | Fair Value | |
Global Alternatives | | Equity contracts | | Receivable for variation margin on futures* | | $ | 464,638 | | | Payable for variation margin on futures* | | $ | 544,786 | |
| | Interest rate contracts | | Receivable for variation margin on futures* | | | 10,328,354 | | | Payable for variation margin on futures* | | | 12,337,760 | |
| | Foreign exchange contracts | | Unrealized appreciation of foreign currency contracts | | | 58,622,850 | | | Unrealized depreciation of foreign currency contracts | | | 69,743,691 | |
| | | | | | | | | | | | | | |
| | | | Totals | | $ | 69,415,842 | | | | | $ | 82,626,237 | |
| | | | | | | | | | | | | | |
| * | Includes only the current day’s variation margin for fixed futures. For non-fixed futures, the variation margin includes the unrealized appreciation/depreciation of the future. Prior variation margin movements have been reflected in cash on the Statement of Assets and Liabilities upon receipt or payment. |
For the fiscal year ended October 31, 2010, the effect of derivative instruments on the Statement of Operations for the Fund and the amount of realized gain/ (loss) on derivatives recognized in income was as follows:
| | | | | | | | | | | | | | |
Fund | | Derivatives not accounted for as
hedging instruments | | Futures | | | Forward Currency
Contracts | | | Total | |
Global Alternatives | | Equity contracts | | | ($9,327,019 | ) | | | — | | | | ($9,327,019 | ) |
| | Interest rate contracts | | | (4,646,323 | ) | | | — | | | | (4,646,323 | ) |
| | Foreign exchange contracts | | | — | | | $ | 16,260,526 | | | | 16,260,526 | |
| | | | | | | | | | | | | | |
| | Totals | | ($ | 13,973,342 | ) | | $ | 16,260,526 | | | $ | 2,287,184 | |
| | | | | | | | | | | | | | |
The change in unrealized gain/(loss) on derivatives recognized in income was as follows:
| | | | | | | | | | | | | | |
Fund | | Derivatives not accounted for as
hedging instruments | | Futures | | | Forward Currency
Contracts | | | Total | |
Global Alternatives | | Equity contracts | | ($ | 3,449,752 | ) | | | — | | | | ($3,449,752 | ) |
| | Interest rate contracts | | | 4,924,590 | | | | — | | | | 4,924,590 | |
| | Foreign exchange contracts | | | — | | | | ($12,751,938 | ) | | | (12,751,938 | ) |
| | | | | | | | | | | | | | |
| | Totals | | $ | 1,474,838 | | | | ($12,751,938 | ) | | | ($11,277,100 | ) |
| | | | | | | | | | | | | | |
Currency and Counterparty Abbreviations:
| | |
| MS: | | Morgan Stanley |
| AUD: | | Australian Dollar |
| CAD: | | Canadian Dollar |
| EUR: | | Euro |
| GBP: | | British Pound |
| HKD: | | Hong Kong Dollar |
| JPY: | | Japanese Yen |
| USD: | | U.S. Dollar |
| OTC: | | Over-the-counter |
| GS: | | Goldman Sachs Group, Inc. |
The accompanying notes are an integral part of these financial statements.
27
Managers AMG FQ Global Essentials Fund
Statement of Net Assets
October 31, 2010
| | | | | | | | |
| | | Principal Amount | | | Value | |
Assets: | | | | | | | | |
Investments in Securities - 100.7% | | | | | | | | |
U.S. Government Obligations - 9.0% | | | | | | | | |
U.S. Treasury Bills, 0.136%, 11/04/101,2 (cost $8,999,902) | | $ | 9,000,000 | | | $ | 8,999,919 | |
| | |
| | | Shares | | | | |
Exchange Traded Funds - 38.9% | | | | | | | | |
iShares Barclays TIPS Bond | | | 172,871 | | | | 19,295,861 | |
Jefferies TR/J CRB Global Commodity Equity Index3 | | | 81,602 | | | | 3,712,075 | |
Market Vectors, Gold Miners | | | 68,332 | | | | 3,912,007 | |
Market Vectors, Hard Assets Producers | | | 103,011 | | | | 3,703,245 | |
SPDR DB International Government Inflation-Protected Bond3 | | | 78,842 | | | | 4,717,905 | |
Vanguard REIT | | | 70,114 | | | | 3,824,719 | |
| | | | | | | | |
Total Exchange Traded Funds
(cost $36,640,613) | | | | | | | 39,165,812 | |
Short-Term Investments - 52.8%4 | | | | | | | | |
BNY Institutional Cash Reserves Fund, Series B*5, 6 | | | 103,687 | | | | 82,457 | |
BNY Mellon Overnight Government Fund, 0.21%5 | | | 590,000 | | | | 590,000 | |
Dreyfus Cash Management Fund, Institutional Class Shares, 0.16% | | | 27,440,379 | | | | 27,440,380 | |
JPMorgan Liquid Assets Money Market Fund, Capital Shares, 0.14% | | | 25,036,747 | | | | 25,036,747 | |
| | | | | | | | |
Total Short-Term Investments
(cost $53,170,813) | | | | | | | 53,149,584 | |
Total Investments
(cost $98,811,328) | | | | | | | 101,315,315 | |
Receivable for Fund shares sold | | | | | | | 14,207 | |
Interest and other receivables | | | | | | | 44,332 | |
Receivable for variation margin on futures contracts | | | | | | | 422,036 | |
Prepaid expenses | | | | | | | 20,474 | |
Total assets | | | | | | | 101,816,364 | |
Liabilities: | | | | | | | | |
Payable to custodian | | | | | | | 2,008 | |
Payable to affiliate | | | | | | | 4,320 | |
Payable upon return of securities loaned | | | | | | | 693,687 | |
Payable for Fund shares repurchased | | | | | | | 227,639 | |
Payable for variation margin on futures contracts | | | | | | | 110,736 | |
Accrued expenses: | | | | | | | | |
Investment management and advisory fees | | | | | | | 47,742 | |
Administrative fees | | | | | | | 20,424 | |
Distribution fees Investor Class | | | | | | | 998 | |
Professional fees | | | | | | | 41,277 | |
Transfer agent fees | | | | | | | 9,614 | |
Custodian fees | | | | | | | 6,710 | |
Other | | | | | | | 13,381 | |
Total liabilities | | | | | | | 1,178,536 | |
Net Assets | | | | | | $ | 100,637,828 | |
The accompanying notes are an integral part of these financial statements.
28
Managers AMG FQ Global Essentials Fund
Statement of Net Assets (continued)
| | | | |
| | | Value | |
Net Assets Represent: | | | | |
Paid-in capital | | $ | 157,639,503 | |
Undistributed net investment income | | | 4,529,377 | |
Accumulated net realized loss from investments, futures and foreign currency transactions | | | (65,121,983 | ) |
Net unrealized appreciation of investments, futures and foreign currency translations | | | 3,590,931 | |
Net Assets | | $ | 100,637,828 | |
Investor Shares - Net Assets | | $ | 6,517,317 | |
Shares outstanding | | | 511,767 | |
Net asset value and redemption price per share | | $ | 12.73 | |
Service Shares - Net Assets | | $ | 217,196 | |
Shares outstanding | | | 17,013 | |
Net asset value and redemption price per share | | $ | 12.77 | |
Institutional Shares - Net Assets | | $ | 93,903,315 | |
Shares outstanding | | | 7,350,921 | |
Net asset value and redemption price per share | | $ | 12.77 | |
The accompanying notes are an integral part of these financial statements.
29
Managers AMG FQ Global Essentials Fund
Notes to Statement of Net Assets
Note: Based on the approximate cost of investments of $98,983,042 for Federal income tax purposes at October 31, 2010, the aggregate gross unrealized appreciation and depreciation were $2,353,502 and $21,229, respectively, resulting in net unrealized appreciation of investments of $2,332,273.
| * | Non-income-producing securities. |
| 1 | Security held as collateral for futures contracts, amounting to a market value of $8,999,919, or 8.9% of net assets. |
| 2 | Yield shown represents yield to maturity at October 31, 2010. |
| 3 | Some or all of these shares, amounting to a market value of $683,053, or 0.7% of net assets, were out on loan to various brokers. |
| 4 | Yield shown for each investment company listed represents October 31, 2010, seven-day average yield, which refers to the sum of the previous seven days’ dividends paid, expressed as an annual percentage. |
| 5 | Collateral received from brokers for securities lending was invested in these short-term investments. |
| 6 | On September 12, 2008, The Bank of New York Mellon established a separate sleeve of the BNY Institutional Cash Reserves Fund (Series B) to hold certain Lehman Brothers floating rate notes. The Fund’s position in Series B is being fair valued daily. (See Note 4 in the Notes to Financial Statements.) |
The Fund had the following open futures contracts as of October 31, 2010:
(See Note 9 in the Notes to Financial Statements.)
Global Essentials - Futures
| | | | | | | | | | | | | | | | | | | | |
Type | | Currency | | | Number of
Contracts | | | Position | | | Expiration Date | | | Unrealized
Gain/(Loss) | |
Australian 10-Year Bond | | | AUD | | | | 161 | | | | Long | | | | 12/15/2010 | | |
| ($
211,177 |
) |
Australian SPI 200 | | | AUD | | | | 15 | | | | Long | | | | 12/16/2010 | | | | (4,059 | ) |
Canadian Dollar 10 Year Bond | | | CAD | | | | 136 | | | | Long | | | | 12/20/2010 | | | | 72,251 | |
S&P/ TSE 60 Index | | | CAD | | | | 13 | | | | Long | | | | 12/16/2010 | | | | 53,048 | |
Amsterdam Index | | | EUR | | | | 18 | | | | Long | | | | 11/19/2010 | | | | (14,150 | ) |
CAC40 10 Index | | | EUR | | | | 33 | | | | Long | | | | 11/19/2010 | | | | 19,197 | |
DAX Index | | | EUR | | | | 8 | | | | Long | | | | 12/17/2010 | | | | 98,182 | |
Euro-Bund 10-Year | | | EUR | | | | 93 | | | | Long | | | | 12/8/2010 | | | | (263,405 | ) |
FTSE/MIB Index | | | EUR | | | | 12 | | | | Long | | | | 12/17/2010 | | | | 55,850 | |
IBEX 35 Index | | | EUR | | | | 12 | | | | Long | | | | 11/19/2010 | | | | 18,947 | |
FTSE 100 Index | | | GBP | | | | 19 | | | | Long | | | | 12/17/2010 | | | | 35,313 | |
U.K. 10-Year Gilt | | | GBP | | | | 86 | | | | Long | | | | 12/29/2010 | | | | (93,649 | ) |
Hang Seng Index | | | HKD | | | | 12 | | | | Long | | | | 11/29/2010 | | | | (35,811 | ) |
Japanese Yen 10 Year Bond | | | JPY | | | | 91 | | | | Long | | | | 12/8/2010 | | | | 193,260 | |
TOPIX Index | | | JPY | | | | 17 | | | | Long | | | | 12/9/2010 | | | | (26,763 | ) |
E-Mini MSCI Index | | | USD | | | | 143 | | | | Long | | | | 12/17/2010 | | | | 466,577 | |
Russell 2000 Index | | | USD | | | | 109 | | | | Long | | | | 12/17/2010 | | | | 481,698 | |
S&P 500 Index | | | USD | | | | 31 | | | | Long | | | | 12/17/2010 | | | | 99,598 | |
U.S. Dollar Long Bond | | | USD | | | | 133 | | | | Long | | | | 12/21/2010 | | | | 137,508 | |
| | | | | | | | | | | | | | | | | | | | |
Total | | | | | | | | | | | | | | | | | | $ | 1,082,415 | |
| | | | | | | | | | | | | | | | | | | | |
The accompanying notes are an integral part of these financial statements.
30
Managers AMG FQ Global Essentials Fund
Notes to Statement of Net Assets (continued)
The following table summarizes the inputs used to value the Fund’s net assets by the fair value hierarchy levels as of October 31, 2010. (See Note 1(a) in the Notes to Financial Statements.)
| | | | | | | | | | | | | | | | |
| | | Quoted Prices
in Active
Markets for
Identical
Investments
Level 1 | | | Significant
Other
Observable
Inputs
Level 2 | | | Significant
Unobservable
Inputs
Level 3 | | | Total | |
Global Essentials | | | | | | | | | | | | | | | | |
Investments in Securities | | | | | | | | | | | | | | | | |
US Government Obligations | | | — | | | $ | 8,999,919 | | | | — | | | $ | 8,999,919 | |
Exchange Traded Funds | | $ | 39,165,812 | | | | — | | | | — | | | | 39,165,812 | |
Short-Term Investments | | | 53,067,127 | | | | 82,457 | | | | — | | | | 53,149,584 | |
| | | | | | | | | | | | | | | | |
Total Investments in Securities | | $ | 92,232,939 | | | $ | 9,082,376 | | | | — | | | $ | 101,315,315 | |
| | | | | | | | | | | | | | | | |
Derivatives†† | | | | | | | | | | | | | | | | |
Equity Contracts | | $ | 1,247,627 | | | | — | | | | — | | | $ | 1,247,627 | |
Interest Rate Contracts | | | (165,212 | ) | | | — | | | | — | | | | (165,212 | ) |
| | | | | | | | | | | | | | | | |
Total Derivatives | | $ | 1,082,415 | | | | — | | | | — | | | $ | 1,082,415 | |
| | | | | | | | | | | | | | | | |
| †† | Derivative instruments, such as futures, forwards and swap contracts are valued at the unrealized appreciation/depreciation of the instrument. |
As of October 31, 2010, the Fund had no significant transfers between Level 1 and Level 2 from the beginning of the reporting period.
The following schedule is the fair values of derivative instruments at October 31, 2010:
(See Note 9 in the Notes to Financial Statements.)
| | | | | | | | | | | | | | |
| | | | | Asset Derivatives | | | Liability Derivatives | |
Fund | | Derivatives not accounted for as
hedging instruments | | Statement of Assets and
Liabilities Location | | Fair Value | | | Statement of Assets and
Liabilities Location | | Fair Value | |
Global Essentials | | Equity contracts | | Receivable for variation margin on futures | | $ | 111,169 | | | Payable for variation margin on futures | | $ | 53,373 | |
| | Interest rate contracts | | Receivable for variation margin on futures | | | 310,867 | | | Payable for variation margin on futures | | | 57,363 | |
| | | | | | | | | | | | | | |
| | | | Totals | | $ | 422,036 | | | | | $ | 110,736 | |
| | | | | | | | | | | | | | |
For the fiscal year ended October 31, 2010, the effect of derivative instruments on the Statement of Operations for the Fund and the amount of realized gain/ (loss) on derivatives recognized in income were as follows:
| | | | | | | | | | | | | | |
Fund | | Derivatives not accounted for as hedging instruments | | Futures | | | Forward Currency
Contracts | | | Total | |
Global Essentials | | Equity contracts | | $ | 917,223 | | | | — | | | $ | 917,223 | |
| | Interest rate contracts | | | 6,042,910 | | | | — | | | | 6,042,910 | |
| | | | | | | | | | | | | | |
| | Totals | | $ | 6,960,133 | | | | — | | | $ | 6,960,133 | |
| | | | | | | | | | | | | | |
The change in unrealized gain/(loss) on derivatives recognized in income were as follows:
| | | | | | | | | | | | | | |
Fund | | Derivatives not accounted for as hedging instruments | | Futures | | | Forward Currency
Contracts | | | Total | |
Global Essentials | | Equity contracts | | $ | 2,245,786 | | | | — | | | $ | 2,245,786 | |
| | Interest rate contracts | | | 96,443 | | | | — | | | | 96,443 | |
| | | | | | | | | | | | | | |
| | Totals | | $ | 2,342,229 | | | | — | | | $ | 2,342,229 | |
| | | | | | | | | | | | | | |
Currency Abbreviations:
| | |
| |
AUD: | | Australian Dollar |
CAD: | | Canadian Dollar |
EUR: | | Euro |
GBP: | | British Pound |
HKD: | | Hong Kong Dollar |
JPY: | | Japanese Yen |
USD: | | U.S. Dollar |
The accompanying notes are an integral part of these financial statements.
31
Managers AMG FQ Funds
Statements of Operations
For the fiscal year ended October 31, 2010
| | | | | | | | | | | | | | | | |
| | | FQ Tax-Managed
U.S. Equity | | | FQ U.S. Equity | | | FQ Global
Alternatives | | | FQ Global
Essentials | |
Investment Income: | | | | | | | | | | | | | | | | |
Dividend income | | $ | 676,790 | | | $ | 1,027,284 | | | $ | 1,984,574 | | | $ | 632,903 | |
Interest income | | | — | | | | — | | | | 1,525 | | | | 80,786 | |
Securities lending fees | | | 20,661 | | | | 2,779 | | | | — | | | | 13,233 | |
Foreign withholding tax | | | — | | | | (236 | ) | | | — | | | | — | |
Total investment income | | | 697,451 | | | | 1,029,827 | | | | 1,986,099 | | | | 726,922 | |
Expenses: | | | | | | | | | | | | | | | | |
Investment management and advisory fees | | | 410,197 | | | | 178,479 | | | | 6,482,972 | | | | 496,880 | |
Administrative fees | | | — | | | | 127,485 | | | | 953,378 | | | | 207,033 | |
Distribution fees Class A | | | 14,227 | | | | 46,798 | | | | 823,470 | | | | 1,865 | |
Distribution fees Class C | | | 34,167 | | | | 7,114 | | | | 358,397 | | | | — | |
Registration fees | | | 48,580 | | | | 39,980 | | | | 80,148 | | | | 39,360 | |
Transfer agent | | | 36,517 | | | | 41,193 | | | | 831,108 | | | | 34,966 | |
Professional fees | | | 35,929 | | | | 37,613 | | | | 116,528 | | | | 50,564 | |
Custodian | �� | | 20,232 | | | | 16,390 | | | | 49,512 | | | | 6,617 | |
Reports to shareholders | | | 13,618 | | | | 11,806 | | | | 117,593 | | | | 20,163 | |
Trustees fees and expenses | | | 4,530 | | | | 3,746 | | | | 33,227 | | | | 6,822 | |
Interest expense on futures | | | — | | | | — | | | | 21,997 | | | | 852 | |
Miscellaneous | | | 4,865 | | | | 4,363 | | | | 16,412 | | | | 8,322 | |
Total expenses before offsets | | | 622,862 | | | | 514,967 | | | | 9,884,742 | | | | 873,444 | |
Expense recoupments | | | — | | | | — | | | | — | | | | 4,440 | |
Fee waivers | | | — | | | | — | | | | (83,700 | ) | | | (14,352 | ) |
Expense reimbursements | | | (96,502 | ) | | | (57,861 | ) | | | (2,371,339 | ) | | | (53,249 | ) |
Expense reductions | | | (84 | ) | | | (89 | ) | | | (673 | ) | | | (145 | ) |
Net expenses | | | 526,276 | | | | 457,017 | | | | 7,429,030 | | | | 810,138 | |
Net investment income (loss) | | | 171,175 | | | | 572,810 | | | | (5,442,931 | ) | | | (83,216 | ) |
Net Realized and Unrealized Gain (Loss): | | | | | | | | | | | | | | | | |
Net realized gain on investments | | | 7,494,843 | | | | 3,818,299 | | | | 1,223,029 | | | | 191,935 | |
Net realized gain (loss) on futures contracts | | | — | | | | 18,308 | | | | (13,973,342 | ) | | | 6,960,133 | |
Net realized gain (loss) on foreign currency transactions | | | — | | | | — | | | | 18,470,910 | | | | (23,053 | ) |
Net change in unrealized appreciation of investments | | | 3,296,687 | | | | 3,554,871 | | | | 11,057,902 | | | | 2,416,113 | |
Net change in unrealized appreciation of futures contracts | | | — | | | | 22,938 | | | | 1,474,838 | | | | 2,342,229 | |
Net change in unrealized depreciation of foreign currency translations | | | — | | | | — | | | | (12,650,082 | ) | | | (4,672 | ) |
Net realized and unrealized gain | | | 10,791,530 | | | | 7,414,416 | | | | 5,603,255 | | | | 11,882,685 | |
Net Increase in Net Assets Resulting from Operations | | $ | 10,962,705 | | | $ | 7,987,226 | | | $ | 160,324 | | | $ | 11,799,469 | |
The accompanying notes are an integral part of these financial statements.
32
Managers AMG FQ Funds
Statements of Changes in Net Assets
For the fiscal year ended October 31,
| | | | | | | | | | | | | | | | |
| | | FQ Tax-Managed U.S. Equity | | | FQ U.S. Equity | |
| | | 2010 | | | 2009 | | | 2010 | | | 2009 | |
Increase (Decrease) in Net Assets | | | | | | | | | | | | | | | | |
From Operations: | | | | | | | | | | | | | | | | |
Net investment income | | $ | 171,175 | | | $ | 294,214 | | | $ | 572,810 | | | $ | 736,869 | |
Net realized gain (loss) on investments, futures, foreign currency contracts and transactions | | | 7,494,843 | | | | (22,958,298 | ) | | | 3,836,607 | | | | (15,744,818 | ) |
Net change in unrealized appreciation of investments, futures, foreign currency contracts and translations | | | 3,296,687 | | | | 21,787,050 | | | | 3,577,809 | | | | 16,655,080 | |
Net increase (decrease) in net assets resulting from operations | | | 10,962,705 | | | | (877,034 | ) | | | 7,987,226 | | | | 1,647,131 | |
Distributions to Shareholders: | | | | | | | | | | | | | | | | |
From net investment income | | | (125,566 | ) | | | (842,465 | ) | | | (698,054 | ) | | | (912,255 | ) |
From Capital Share Transactions: | | | | | | | | | | | | | | | | |
Proceeds from the sale of shares | | | 1,660,764 | | | | 7,327,541 | | | | 2,704,195 | | | | 5,551,496 | |
Reinvestment of dividends and distributions | | | 119,516 | | | | 744,847 | | | | 689,807 | | | | 890,957 | |
Cost of shares repurchased | | | (17,040,665 | ) | | | (26,207,210 | ) | | | (9,479,336 | ) | | | (15,833,671 | ) |
Net decrease from capital share transactions | | | (15,260,385 | ) | | | (18,134,822 | ) | | | (6,085,334 | ) | | | (9,391,218 | ) |
Total increase (decrease) in net assets | | | (4,423,246 | ) | | | (19,854,321 | ) | | | 1,203,838 | | | | (8,656,342 | ) |
Net Assets: | | | | | | | | | | | | | | | | |
Beginning of year | | | 51,054,482 | | | | 70,908,803 | | | | 50,602,598 | | | | 59,258,940 | |
End of year | | $ | 46,631,236 | | | $ | 51,054,482 | | | $ | 51,806,436 | | | $ | 50,602,598 | |
End of year undistributed net investment income | | $ | 169,442 | | | $ | 123,985 | | | $ | 392,829 | | | $ | 502,886 | |
| | | | | | | | | | | | | | | | |
Share Transactions: | | | | | | | | | | | | | | | | |
Sale of shares | | | 149,431 | | | | 845,794 | | | | 278,383 | | | | 723,380 | |
Reinvested shares | | | 10,915 | | | | 85,675 | | | | 71,238 | | | | 116,028 | |
Shares repurchased | | | (1,522,307 | ) | | | (2,927,306 | ) | | | (977,820 | ) | | | (2,040,442 | ) |
Net decrease in shares | | | (1,361,961 | ) | | | (1,995,837 | ) | | | (628,199 | ) | | | (1,201,034 | ) |
The accompanying notes are an integral part of these financial statements.
33
Managers AMG FQ Funds
Statements of Changes in Net Assets
For the fiscal year ended October 31,
| | | | | | | | | | | | | | | | |
| | | FQ Global Alternatives | | | FQ Global Essentials | |
| | | 2010 | | | 2009 | | | 2010 | | | 2009 | |
Increase (Decrease) in Net Assets | | | | | | | | | | | | | | | | |
From Operations: | | | | | | | | | | | | | | | | |
Net investment income (loss) | | | ($5,442,931 | ) | | | ($1,866,470 | ) | | | ($83,216 | ) | | $ | 3,451,048 | |
Net realized gain (loss) on investments, futures and foreign currency transactions | | | 5,720,597 | | | | (13,596,224 | ) | | | 7,129,015 | | | | (15,937,043 | ) |
Net change in unrealized appreciation (depreciation) of investments, futures and foreign currency translations | | | (117,342 | ) | | | 11,522,684 | | | | 4,753,670 | | | | 24,499,293 | |
Net increase (decrease) in net assets resulting from operations | | | 160,324 | | | | (3,940,010 | ) | | | 11,799,469 | | | | 12,013,298 | |
Distributions to Shareholders: | | | | | | | | | | | | | | | | |
From net investment income | | | — | | | | (11,141,269 | ) | | | (710,852 | ) | | | (3,637,680 | ) |
From Capital Share Transactions: | | | | | | | | | | | | | | | | |
Proceeds from the sale of shares1 | | | 545,893,571 | | | | 281,611,581 | | | | 20,931,826 | | | | 5,118,790 | |
Reinvestment of dividends and distributions | | | — | | | | 7,669,693 | | | | 692,638 | | | | 3,606,451 | |
Cost of shares repurchased | | | (174,587,779 | ) | | | (139,340,041 | ) | | | (12,659,681 | ) | | | (14,854,983 | ) |
Net increase (decrease) from capital share transactions | | | 371,305,792 | | | | 149,941,233 | | | | 8,964,783 | | | | (6,129,742 | ) |
Total increase in net assets | | | 371,466,116 | | | | 134,859,954 | | | | 20,053,400 | | | | 2,245,876 | |
Net Assets: | | | | | | | | | | | | | | | | |
Beginning of year | | | 236,220,235 | | | | 101,360,281 | | | | 80,584,428 | | | | 78,338,552 | |
End of year | | $ | 607,686,351 | | | $ | 236,220,235 | | | $ | 100,637,828 | | | $ | 80,584,428 | |
End of year undistributed net investment income (loss) | | $ | 11,104,586 | | | | ($1,589,131 | ) | | $ | 4,529,377 | | | $ | 710,456 | |
| | | | | | | | | | | | | | | | |
Share Transactions: | | | | | | | | | | | | | | | | |
Sale of shares | | | 52,693,342 | | | | 28,043,294 | | | | 1,682,092 | | | | 465,056 | |
Reinvested shares | | | — | | | | 771,498 | | | | 60,763 | | | | 398,063 | |
Shares repurchased | | | (17,019,805 | ) | | | (14,277,061 | ) | | | (1,082,166 | ) | | | (1,621,368 | ) |
Net increase (decrease) in shares | | | 35,673,537 | | | | 14,537,731 | | | | 660,689 | | | | (758,249 | ) |
| 1 | For the fiscal year ended October 31, 2010, the proceeds from the sale of shares for FQ Global Essentials includes the receipt of a market timing settlement of $29,156. |
The accompanying notes are an integral part of these financial statements.
34
Managers AMG FQ Tax-Managed U.S. Equity Fund
Financial Highlights
For a share outstanding throughout each fiscal year
| | | | | | | | | | | | | | | | | | | | |
| | | For the fiscal year ended October 31, | |
Institutional Class Shares | | 2010 | | | 2009 | | | 2008 | | | 2007 | | | 2006 | |
Net Asset Value, Beginning of Year | | $ | 9.98 | | | $ | 9.99 | | | $ | 16.80 | | | $ | 13.93 | | | $ | 11.89 | |
Income from Investment Operations: | | | | | | | | | | | | | | | | | | | | |
Net investment income | | | 0.05 | 3 | | | 0.07 | | | | 0.13 | | | | 0.06 | | | | 0.03 | |
Net realized and unrealized gain (loss) on investments | | | 2.43 | 3 | | | 0.07 | | | | (6.87 | ) | | | 2.82 | | | | 2.03 | |
Total from investment operations | | | 2.48 | | | | 0.14 | | | | (6.74 | ) | | | 2.88 | | | | 2.06 | |
Less Distributions to Shareholders from: | | | | | | | | | | | | | | | | | | | | |
Net investment income | | | (0.03 | ) | | | (0.15 | ) | | | (0.07 | ) | | | (0.01 | ) | | | (0.02 | ) |
Net Asset Value, End of Year | | $ | 12.43 | | | $ | 9.98 | | | $ | 9.99 | | | $ | 16.80 | | | $ | 13.93 | |
Total Return1 | | | 24.92 | % | | | 1.65 | % | | | (40.26 | )% | | | 20.68 | % | | | 17.37 | % |
Ratio of net expenses to average net assets | | | 0.99 | % | | | 0.99 | % | | | 0.99 | % | | | 0.99 | % | | | 0.99 | % |
Ratio of net investment income to average net assets1 | | | 0.45 | % | | | 0.69 | % | | | 0.92 | % | | | 0.37 | % | | | 0.23 | % |
Portfolio turnover | | | 81 | % | | | 147 | % | | | 136 | % | | | 65 | % | | | 98 | % |
Net assets at end of year (000’s omitted) | | $ | 39,420 | | | $ | 39,366 | | | $ | 48,882 | | | $ | 95,510 | | | $ | 82,975 | |
| | | | | | | | | | | | | | | | | | | | |
Ratios absent expense offsets:2 | | | | | | | | | | | | | | | | | | | | |
Ratio of total expenses to average net assets | | | 1.19 | % | | | 1.18 | % | | | 1.03 | % | | | 1.07 | % | | | 1.11 | % |
Ratio of net investment income to average net assets | | | 0.25 | % | | | 0.50 | % | | | 0.88 | % | | | 0.29 | % | | | 0.12 | % |
| | | | | | | | | | | | | | | | | | | | |
| 1 | Total returns and net investment income would have been lower had certain expenses not been reduced. (See Note 1(c) of Notes to Financial Statements.) |
| 2 | Excludes the impact of expense reimbursements, fee waivers and expense reductions such as brokerage credits, but include non-reimbursable expenses, if any, such as interest and taxes. (See Note 1(c) of Notes to Financial Statements.) |
| 3 | Per share numbers have been calculated using average shares. |
35
Managers AMG FQ Tax-Managed U.S. Equity Fund
Financial Highlights
For a share outstanding throughout each fiscal period
| | | | | | | | | | | | | | | | | | | | |
| | | For the fiscal year ended October 31, | | | For the fiscal period
ended October 31,
2006 * | |
Class A Shares | | 2010 | | | 2009 | | | 2008 | | | 2007 | | |
Net Asset Value, Beginning of Period | | $ | 10.01 | | | $ | 9.99 | | | $ | 16.75 | | | $ | 13.91 | | | $ | 13.01 | |
Income from Investment Operations: | | | | | | | | | | | | | | | | | | | | |
Net investment income | | | 0.02 | 7 | | | 0.09 | | | | 0.10 | | | | 0.02 | | | | 0.00 | 5 |
Net realized and unrealized gain (loss) on investments | | | 2.44 | 7 | | | 0.04 | | | | (6.81 | ) | | | 2.82 | | | | 0.90 | |
Total from investment operations | | | 2.46 | | | | 0.13 | | | | (6.71 | ) | | | 2.84 | | | | 0.90 | |
Less Distributions to Shareholders from: | | | | | | | | | | | | | | | | | | | | |
Net investment income | | | — | | | | (0.11 | ) | | | (0.05 | ) | | | — | | | | — | |
Net Asset Value, End of Period | | $ | 12.47 | | | $ | 10.01 | | | $ | 9.99 | | | $ | 16.75 | | | $ | 13.91 | |
Total Return1 | | | 24.58 | % | | | 1.53 | % | | | (40.15 | )%6 | | | 20.42 | % | | | 6.92 | %3 |
Ratio of net expenses to average net assets | | | 1.24 | % | | | 1.24 | % | | | 1.24 | % | | | 1.24 | % | | | 1.24 | %4 |
Ratio of net investment income (loss) to average net assets1 | | | 0.22 | % | | | 0.45 | % | | | 0.67 | % | | | 0.30 | % | | | (0.11 | )%4 |
Portfolio turnover | | | 81 | % | | | 147 | % | | | 136 | % | | | 65 | % | | | 98 | %3 |
Net assets at end of period (000’s omitted) | | $ | 4,116 | | | $ | 7,175 | | | $ | 15,334 | | | $ | 23,803 | | | $ | 574 | |
| | | | | | | | | | | | | | | | | | | | |
Ratios absent expense offsets:2 | | | | | | | | | | | | | | | | | | | | |
Ratio of total expenses to average net assets | | | 1.44 | % | | | 1.43 | % | | | 1.28 | % | | | 1.32 | % | | | 1.40 | %4 |
Ratio of net investment income (loss) to average net assets | | | 0.02 | % | | | 0.26 | % | | | 0.63 | % | | | 0.22 | % | | | (0.27 | )%4 |
| | | | | | | | | | | | | | | | | | | | |
| | | | | | | | | | | | | | | | | | | | |
| | | For the fiscal year ended October 31, | | | For the fiscal period
ended October 31,
2006 * | |
Class C Shares | | 2010 | | | 2009 | | | 2008 | | | 2007 | | |
Net Asset Value, Beginning of Period | | $ | 9.87 | | | $ | 9.82 | | | $ | 16.53 | | | $ | 13.83 | | | $ | 13.01 | |
Income from Investment Operations: | | | | | | | | | | | | | | | | | | | | |
Net investment income (loss) | | | (0.06 | )7 | | | (0.03 | ) | | | (0.02 | ) | | | 0.00 | 5 | | | (0.03 | ) |
Net realized and unrealized gain (loss) on investments | | | 2.40 | 7 | | | 0.09 | | | | (6.69 | ) | | | 2.70 | | | | 0.85 | |
Total from investment operations | | | 2.34 | | | | 0.06 | | | | (6.71 | ) | | | 2.70 | | | | 0.82 | |
Less Distributions to Shareholders from: | | | | | | | | | | | | | | | | | | | | |
Net investment income | | | — | | | | (0.01 | ) | | | — | | | | — | | | | — | |
Net Asset Value, End of Period | | $ | 12.21 | | | $ | 9.87 | | | $ | 9.82 | | | $ | 16.53 | | | $ | 13.83 | |
Total Return1 | | | 23.71 | % | | | 0.66 | % | | | (40.56 | )% | | | 19.52 | %6 | | | 6.30 | %3 |
Ratio of net expenses to average net assets | | | 1.99 | % | | | 1.99 | % | | | 1.99 | % | | | 1.99 | % | | | 1.99 | %4 |
Ratio of net investment loss to average net assets1 | | | (0.53 | )% | | | (0.31 | )% | | | (0.09 | )% | | | (0.36 | )% | | | (0.91 | )%4 |
Portfolio turnover | | | 81 | % | | | 147 | % | | | 136 | % | | | 65 | % | | | 98 | %3 |
Net assets at end of period (000’s omitted) | | $ | 3,095 | | | $ | 4,513 | | | $ | 6,693 | | | $ | 9,490 | | | $ | 941 | |
| | | | | | | | | | | | | | | | | | | | |
Ratios absent expense offsets:2 | | | | | | | | | | | | | | | | | | | | |
Ratio of total expenses to average net assets | | | 2.19 | % | | | 2.18 | % | | | 2.03 | % | | | 2.07 | % | | | 2.15 | %4 |
Ratio of net investment loss to average net assets | | | (0.73 | )% | | | (0.50 | )% | | | (0.13 | )% | | | (0.44 | )% | | | (1.06 | )%4 |
| | | | | | | | | | | | | | | | | | | | |
| * | Class A and Class C shares commenced operations on March 1, 2006. (See Notes to Financial Statements.) |
| 1 | Total returns and net investment income would have been lower had certain expenses not been reduced. (See Note 1(c) of Notes to Financial Statements.) |
| 2 | Excludes the impact of expense reimbursements or fee waivers and expense reductions such as brokerage credits, but includes non-reimbursable expenses, if any, such as interest and taxes. (See Note 1(c) of Notes to Financial Statements.) |
| 5 | Rounds to less than $0.01. |
| 6 | The Total Return is based on the Financial Statement Net Asset Value as shown above. |
| 7 | Per share numbers have been calculated using average shares. |
36
Managers AMG FQ U.S. Equity Fund
Financial Highlights
For a share outstanding throughout each fiscal year
| | | | | | | | | | | | | | | | | | | | |
| | | For the fiscal year ended October 31, | |
Institutional Class Shares | | 2010 | | | 2009 | | | 2008 | | | 2007 | | | 2006 | |
Net Asset Value, Beginning of Period | | $ | 8.99 | | | $ | 8.68 | | | $ | 15.49 | | | $ | 14.90 | | | $ | 12.93 | |
Income from Investment Operations: | | | | | | | | | | | | | | | | | | | | |
Net investment income | | | 0.13 | | | | 0.14 | | | | 0.19 | | | | 0.15 | | | | 0.17 | |
Net realized and unrealized gain (loss) on investments | | | 1.37 | | | | 0.32 | | | | (5.23 | ) | | | 2.11 | | | | 2.49 | |
Total from investment operations | | | 1.50 | | | | 0.46 | | | | (5.04 | ) | | | 2.26 | | | | 2.66 | |
Less Distributions to Shareholders from: | | | | | | | | | | | | | | | | | | | | |
Net investment income | | | (0.14 | ) | | | (0.15 | ) | | | (0.16 | ) | | | (0.16 | ) | | | (0.18 | ) |
Net realized gain on investments | | | — | | | | — | | | | (1.61 | ) | | | (1.51 | ) | | | (0.51 | ) |
Total distributions to shareholders | | | (0.14 | ) | | | (0.15 | ) | | | (1.77 | ) | | | (1.67 | ) | | | (0.69 | ) |
Net Asset Value, End of Period | | $ | 10.35 | | | $ | 8.99 | | | $ | 8.68 | | | $ | 15.49 | | | $ | 14.90 | |
Total Return1 | | | 16.75 | % | | | 5.56 | % | | | (36.43 | )% | | | 16.54 | % | | | 21.44 | % |
Ratio of net expenses to average net assets | | | 0.79 | % | | | 0.79 | % | | | 0.79 | % | | | 0.79 | % | | | 0.79 | % |
Ratio of net investment income to average net assets1 | | | 1.22 | % | | | 1.58 | % | | | 1.36 | % | | | 0.96 | % | | | 1.23 | % |
Portfolio turnover | | | 117 | % | | | 151 | % | | | 227 | % | | | 106 | % | | | 89 | % |
Net assets at end of period (000’s omitted) | | $ | 32,309 | | | $ | 31,175 | | | $ | 35,135 | | | $ | 82,915 | | | $ | 78,068 | |
| | | | | | | | | | | | | | | | | | | | |
Ratio absent expense offsets:2 | | | | | | | | | | | | | | | | | | | | |
Ratio of total expenses to average net assets | | | 0.90 | % | | | 1.04 | % | | | 0.91 | % | | | 0.83 | % | | | 0.82 | % |
Ratio of net investment income to average net assets | | | 1.11 | % | | | 1.33 | % | | | 1.24 | % | | | 0.92 | % | | | 1.19 | % |
| | | | | | | | | | | | | | | | | | | | |
| 1 | Total returns and net investment income would have been lower had certain expenses not been reduced. (See Note 1(c) of Notes to Financial Statements.) |
| 2 | Excludes the impact of expense reimbursements, fee waivers and expense reductions such as brokerage credits, but include non-reimbursable expenses, if any, such as interest and taxes. (See Note 1(c) of Notes to Financial Statements.) |
| 3 | Per share numbers have been calculated using average shares. |
37
Managers AMG FQ U.S. Equity Fund
Financial Highlights
For a share outstanding throughout each fiscal period
| | | | | | | | | | | | | | | | | | | | |
| | | For the fiscal year ended October 31, | | | For the fiscal period
ended October 31,
2006 * | |
Class A Shares | | 2010 | | | 2009 | | | 2008 | | | 2007 | | |
Net Asset Value, Beginning of Period | | $ | 8.93 | | | $ | 8.63 | | | $ | 15.43 | | | $ | 14.88 | | | $ | 13.53 | |
Income from Investment Operations: | | | | | | | | | | | | | | | | | | | | |
Net investment income | | | 0.10 | | | | 0.11 | | | | 0.09 | | | | 0.17 | | | | 0.01 | |
Net realized and unrealized gain (loss) on investments | | | 1.37 | | | | 0.32 | | | | (5.14 | ) | | | 2.05 | | | | 1.34 | |
Total from investment operations | | | 1.47 | | | | 0.43 | | | | (5.05 | ) | | | 2.22 | | | | 1.35 | |
Less Distributions to Shareholders from: | | | | | | | | | | | | | | | | | | | | |
Net investment income | | | (0.11 | ) | | | (0.13 | ) | | | (0.14 | ) | | | (0.16 | ) | | | — | |
Net realized gain on investments | | | — | | | | — | | | | (1.61 | ) | | | (1.51 | ) | | | — | |
Total distributions to shareholders | | | (0.11 | ) | | | (0.13 | ) | | | (1.75 | ) | | | (1.67 | ) | | | — | |
Net Asset Value, End of Period | | $ | 10.29 | | | $ | 8.93 | | | $ | 8.63 | | | $ | 15.43 | | | $ | 14.88 | |
Total Return1 | | | 16.57 | % | | | 5.21 | % | | | (36.64 | )% | | | 16.28 | % | | | 9.98 | %4 |
Ratio of net expenses to average net assets | | | 1.04 | % | | | 1.04 | % | | | 1.04 | % | | | 1.04 | % | | | 1.04 | %5 |
Ratio of net investment income to average net assets1 | | | 0.98 | % | | | 1.35 | % | | | 1.07 | % | | | 0.56 | % | | | 0.63 | %5 |
Portfolio turnover | | | 117 | % | | | 151 | % | | | 227 | % | | | 106 | % | | | 89 | %4 |
Net assets at end of period (000’s omitted) | | $ | 18,755 | | | $ | 18,588 | | | $ | 22,966 | | | $ | 21,773 | | | $ | 371 | |
| | | | | | | | | | | | | | | | | | | | |
Ratio absent expense offsets:2 | | | | | | | | | | | | | | | | | | | | |
Ratio of total expenses to average net assets | | | 1.15 | % | | | 1.29 | % | | | 1.16 | % | | | 1.08 | % | | | 1.13 | %5 |
Ratio of net investment income to average net assets | | | 0.87 | % | | | 1.10 | % | | | 0.95 | % | | | 0.52 | % | | | 0.54 | %5 |
| | | | | | | | | | | | | | | | | | | | |
| | | | | | | | | | | | | | | | | | | | |
| | | For the fiscal year ended October 31, | | | For the fiscal period
ended October 31,
2006 * | |
Class C Shares | | 2010 | | | 2009 | | | 2008 | | | 2007 | | |
Net Asset Value, Beginning of Period | | $ | 8.83 | | | $ | 8.52 | | | $ | 15.27 | | | $ | 14.85 | | | $ | 13.53 | |
Income from Investment Operations: | | | | | | | | | | | | | | | | | | | | |
Net investment income | | | 0.07 | | | | 0.06 | | | | 0.04 | | | | 0.13 | | | | 0.00 | 3 |
Net realized and unrealized gain (loss) on investments | | | 1.32 | | | | 0.31 | | | | (5.13 | ) | | | 1.96 | | | | 1.32 | |
Total from investment operations | | | 1.39 | | | | 0.37 | | | | (5.09 | ) | | | 2.09 | | | | 1.32 | |
Less Distributions to Shareholders from: | | | | | | | | | | | | | | | | | | | | |
Net investment income | | | (0.02 | ) | | | (0.06 | ) | | | (0.05 | ) | | | (0.16 | ) | | | — | |
Net realized gain on investments | | | — | | | | — | | | | (1.61 | ) | | | (1.51 | ) | | | — | |
Total distributions to shareholders | | | (0.02 | ) | | | (0.06 | ) | | | (1.66 | ) | | | (1.67 | ) | | | — | |
Net Asset Value, End of Period | | $ | 10.20 | | | $ | 8.83 | | | $ | 8.52 | | | $ | 15.27 | | | $ | 14.85 | |
Total Return1 | | | 15.75 | % | | | 4.42 | % | | | (37.12 | )% | | | 15.35 | % | | | 9.76 | %4 |
Ratio of net expenses to average net assets | | | 1.79 | % | | | 1.79 | % | | | 1.79 | % | | | 1.79 | % | | | 1.79 | %5 |
Ratio of net investment income (loss) to average net assets1 | | | 0.24 | % | | | 0.67 | % | | | 0.37 | % | | | (0.13 | )% | | | 0.16 | %5 |
Portfolio turnover | | | 117 | % | | | 151 | % | | | 227 | % | | | 106 | % | | | 89 | %4 |
Net assets at end of period (000’s omitted) | | $ | 742 | | | $ | 840 | | | $ | 1,158 | | | $ | 2,326 | | | $ | 97 | |
| | | | | | | | | | | | | | | | | | | | |
Ratio absent expense offsets:2 | | | | | | | | | | | | | | | | | | | | |
Ratio of total expenses to average net assets | | | 1.90 | % | | | 2.04 | % | | | 1.91 | % | | | 1.83 | % | | | 1.88 | %5 |
Ratio of net investment income (loss) to average net assets | | | 0.13 | % | | | 0.42 | % | | | 0.25 | % | | | (0.17 | )% | | | (0.07 | )%5 |
| | | | | | | | | | | | | | | | | | | | |
| * | Class A and Class C shares commenced operations on March 1, 2006. (See Notes to Financial Statements.) |
| 1 | Total returns and net investment income would have been lower had certain expenses not been reduced. (See Note 1(c) of Notes to Financial Statements.) |
| 2 | Excludes the impact of expense reimbursements or fee waivers and expense reductions such as brokerage credits, but includes non-reimbursable expenses, if any, such as interest and taxes. (See Note 1(c) of Notes to Financial Statements.) |
| 3 | Rounds to less than $0.01. |
38
Managers AMG FQ Global Alternatives Fund
Financial Highlights
For a share outstanding throughout each fiscal period
| | | | | | | | | | | | | | | | | | | | |
| | | For the fiscal year ended October 31, | | | For the fiscal period
ended October 31,
2006 * | |
Class A Shares | | 2010 | | | 2009 | | | 2008 | | | 2007 | | |
Net Asset Value, Beginning of Period | | $ | 9.96 | | | $ | 11.00 | | | $ | 9.94 | | | $ | 9.73 | | | $ | 10.00 | |
Income from Investment Operations: | | | | | | | | | | | | | | | | | | | | |
Net investment income (loss) | | | (0.14 | )6 | | | (0.09 | )6 | | | 0.04 | 6 | | | 0.18 | 6 | | | 0.16 | |
Net realized and unrealized gain (loss) on investments | | | 0.42 | 6 | | | (0.27 | )6 | | | 1.15 | 6 | | | 0.22 | 6 | | | (0.43 | ) |
Total from investment operations | | | 0.28 | | | | (0.36 | ) | | | 1.19 | | | | 0.40 | | | | (0.27 | ) |
Less Distributions to Shareholders from: | | | | | | | | | | | | | | | | | | | | |
Net investment income | | | — | | | | (0.68 | )7 | | | (0.03 | ) | | | (0.19 | ) | | | — | |
Net realized gain on investments | | | — | | | | — | | | | (0.10 | ) | | | — | | | | — | |
Total distributions to shareholders | | | — | | | | (0.68 | ) | | | (0.13 | ) | | | (0.19 | ) | | | — | |
Net Asset Value, End of Period | | $ | 10.24 | | | $ | 9.96 | | | $ | 11.00 | | | $ | 9.94 | | | $ | 9.73 | |
Total Return1 | | | 2.81 | %5 | | | (3.15 | )% | | | 12.17 | %5 | | | 4.11 | %5 | | | (2.70 | )%3 |
Ratio of net expenses to average net assets | | | 1.91 | % | | | 2.00 | % | | | 2.26 | % | | | 2.50 | % | | | 2.50 | %4 |
Ratio of net investment income (loss) to average net assets1 | | | (1.39 | )% | | | (0.88 | )% | | | 0.36 | % | | | 1.72 | % | | | 1.38 | %4 |
Portfolio turnover | | | 17 | % | | | 77 | % | | | 133 | % | | | 104 | % | | | 48 | %3 |
Net assets at end of period (000’s omitted) | | $ | 518,118 | | | $ | 206,153 | | | $ | 89,232 | | | $ | 37,716 | | | $ | 20,661 | |
| | | | | | | | | | | | | | | | | | | | |
Ratios absent expense offsets:2 | | | | | | | | | | | | | | | | | | | | |
Ratio of total expenses to average net assets | | | 2.55 | % | | | 2.44 | % | | | 2.45 | % | | | 2.56 | % | | | 3.20 | %4 |
Ratio of net investment income (loss) to average net assets | | | (2.03 | )% | | | (1.32 | )% | | | 0.17 | % | | | 1.66 | % | | | 0.68 | %4 |
| | | | | | | | | | | | | | | | | | | | |
| | |
| | | For the fiscal year ended October 31, | | | For the fiscal period
ended October 31,
2006 * | |
Class C Shares | | 2010 | | | 2009 | | | 2008 | | | 2007 | | |
Net Asset Value, Beginning of Period | | $ | 9.77 | | | $ | 10.81 | | | $ | 9.82 | | | $ | 9.69 | | | $ | 10.00 | |
Income from Investment Operations: | | | | | | | | | | | | | | | | | | | | |
Net investment income (loss) | | | (0.20 | )6 | | | (0.16 | )6 | | | (0.04 | )6 | | | 0.11 | 6 | | | 0.02 | |
Net realized and unrealized gain (loss) on investments | | | 0.41 | 6 | | | (0.26 | )6 | | | 1.13 | 6 | | | 0.21 | 6 | | | (0.33 | ) |
Total from investment operations | | | 0.21 | | | | (0.42 | ) | | | 1.09 | | | | 0.32 | | | | (0.31 | ) |
Less Distributions to Shareholders from: | | | | | | | | | | | | | | | | | | | | |
Net investment income | | | — | | | | (0.62 | )7 | | | (0.01 | ) | | | (0.19 | ) | | | — | |
Net realized gain on investments | | | — | | | | — | | | | (0.09 | ) | | | — | | | | — | |
Total distributions to shareholders | | | — | | | | (0.62 | ) | | | (0.10 | ) | | | (0.19 | ) | | | — | |
Net Asset Value, End of Period | | $ | 9.98 | | | $ | 9.77 | | | $ | 10.81 | | | $ | 9.82 | | | $ | 9.69 | |
Total Return1 | | | 2.15 | % | | | (3.86 | )% | | | 11.31 | %5 | | | 3.30 | %5 | | | (3.10 | )%3 |
Ratio of net expenses to average net assets3 | | | 2.51 | % | | | 2.75 | % | | | 3.02 | % | | | 3.25 | % | | | 3.25 | %4 |
Ratio of net investment income (loss) to average net assets1 | | | (2.00 | )% | | | (1.68 | )% | | | (0.38 | )% | | | 1.03 | % | | | 1.03 | %4 |
Portfolio turnover | | | 17 | % | | | 77 | % | | | 133 | % | | | 104 | % | | | 48 | %3 |
Net assets at end of period (000’s omitted) | | $ | 45,664 | | | $ | 30,067 | | | $ | 12,128 | | | $ | 7,464 | | | $ | 695 | |
| | | | | | | | | | | | | | | | | | | | |
Expense Offsets:2 | | | | | | | | | | | | | | | | | | | | |
Ratio of total expenses to average net assets | | | 3.14 | % | | | 3.19 | % | | | 3.21 | % | | | 3.31 | % | | | 3.52 | %4 |
Ratio of net investment income (loss) to average net assets | | | (2.63 | )% | | | (2.12 | )% | | | (0.57 | )% | | | 0.97 | % | | | 0.76 | %4 |
| | | | | | | | | | | | | | | | | | | | |
| * | Commencement of operations was on March 30, 2006. |
| 1 | Total returns and net investment income would have been lower had certain expenses not been reduced. (See Note 1(c) of Notes to Financial Statements.) |
| 2 | Excludes the impact of expense reimbursements/ recoupments or fee waivers and expense reductions such as brokerage credits, but include non-reimbursable expenses, if any, such as interest and taxes. (See Note 1(c) of Notes to Financial Statements.) |
| 5 | The Total Return is based on the Financial Statement Net Asset Values as shown above. |
| 6 | Per share numbers have been calculated using average shares. |
| 7 | The per share net investment income distribution shown for Class A shares and Class C shares includes $0.67 and $0.61, respectively, of distributions from foreign currency gains. (See Note 1(d) of Notes to Financial Statements.) |
39
Managers AMG FQ Global Alternatives Fund
Financial Highlights
For a share outstanding throughout each fiscal period
| | | | |
Service Class Shares | | For the
fiscal year ended
October 31, 2010* | |
Net Asset Value, Beginning of Period | | $ | 9.97 | |
Income from Investment Operations: | | | | |
Net investment loss | | | (0.10 | )3 |
Net realized and unrealized gain on investments | | | 0.40 | 3 |
Total from investment operations | | | 0.30 | |
Less Distributions to Shareholders from: | | | | |
Net investment income | | | — | |
Net Asset Value, End of Period | | $ | 10.27 | |
Total Return1 | | | 3.01 | %4 |
Ratio of net expenses to average net assets3 | | | 1.70 | %5 |
Ratio of net investment loss to average net assets1 | | | (1.17 | )%5 |
Portfolio turnover | | | 17 | %4 |
Net assets at end of period (000’s omitted) | | $ | 18,049 | |
| | | | |
Ratios absent expense offsets:2 | | | | |
Ratio of total expenses to average net assets | | | 2.36 | %5 |
Ratio of net investment loss to average net assets | | | (1.83 | )%5 |
| | | | |
| |
Institutional Class Shares | | For the
fiscal year ended
October 31, 2010* | |
Net Asset Value, Beginning of Period | | $ | 9.97 | |
Income from Investment Operations: | | | | |
Net investment loss | | | (0.08 | )3 |
Net realized and unrealized gain on investments | | | 0.39 | 3 |
Total from investment operations | | | 0.31 | |
Less Distributions to Shareholders from: | | | | |
Net investment income | | | — | |
Net Asset Value, End of Period | | $ | 10.28 | |
Total Return1 | | | 3.11 | %4,6 |
Ratio of net expenses to average net assets3 | | | 1.48 | %5 |
Ratio of net investment loss to average net assets1 | | | (0.95 | )%5 |
Portfolio turnover | | | 17 | %4 |
Net assets at end of period (000’s omitted) | | $ | 25,856 | |
| | | | |
Ratios absent expense offsets:2 | | | | |
Ratio of total expenses to average net assets | | | 2.14 | %5 |
Ratio of net investment loss to average net assets | | | (1.61 | )%5 |
| | | | |
| * | Commencement of operations was on January 1, 2010. |
| 1 | Total returns and net investment income would have been lower had certain expenses not been reduced. (See Note 1(c) of Notes to Financial Statements.) |
| 2 | Excludes the impact of expense reimbursements/recoupments or fee waivers and expense reductions such as brokerage credits, but include non-reimbursable expenses, if any, such as interest and taxes. (See Note 1(c) of Notes to Financial Statements.) |
| 3 | Per share numbers have been calculated using average shares. |
| 6 | The Total Return is based on the Financial Statement Net Asset Values as shown above. |
40
Managers AMG FQ Global Essentials Fund
Financial Highlights
For a share outstanding throughout each fiscal period
| | | | | | | | | | |
| | | For the fiscal year ended October 31, |
Institutional Class Shares* | | 2010 | | 2009 | | 2008 | | 2007 | | 2006 |
Net Asset Value, Beginning of Year | | $11.16 | | $9.82 | | $16.49 | | $14.24 | | $13.19 |
Income from Investment Operations: | | | | | | | | | | |
Net investment income (loss) | | (0.01)3 | | 0.473 | | 0.453 | | 0.08 | | 0.27 |
Net realized and unrealized gain (loss) on investments | | 1.723 | | 1.353 | | (6.65)3 | | 2.31 | | 1.48 |
Total from investment operations | | 1.71 | | 1.82 | | (6.20) | | 2.39 | | 1.75 |
Less Distributions to Shareholders from: | | | | | | | | | | |
Net investment income | | (0.10) | | (0.48) | | (0.47) | | (0.14) | | (0.70) |
Net Asset Value, End of Year | | $12.77 | | $11.16 | | $9.82 | | $16.49 | | $14.24 |
Total Return1 | | 15.41%5,7 | | 19.67% | | (38.66)% | | 16.94% | | 13.67% |
Ratio of net expenses to average net assets | | 0.97% | | 0.92% | | 0.80% | | 0.90% | | 1.11% |
Ratio of net investment income (loss) to average net assets1 | | (0.09)% | | 4.82% | | 3.18% | | 0.52% | | 1.68% |
Portfolio turnover | | 127% | | 213% | | 143% | | 123% | | 60% |
Net assets at end of year (000’s omitted) | | $93,903 | | $80,584 | | $78,339 | | $175,105 | | $182,387 |
| | | | | | | | | | |
Ratios absent expense offsets:2 | | | | | | | | | | |
Ratio of total expenses to average net assets | | 1.05% | | 1.17% | | 1.08% | | 1.10% | | 1.13% |
Ratio of net investment income (loss) to average net assets | | (0.17)% | | 4.57% | | 2.90% | | 0.32% | | 1.67% |
| | | | | | | | | | |
| | | | |
Service Class Shares* | | For the
fiscal year ended
October 31, 2010 | |
Net Asset Value, Beginning of Period | | $ | 11.36 | |
Income from Investment Operations: | | | | |
Net investment loss | | | (0.04 | )3 |
Net realized and unrealized gain on investments | | | 1.45 | 3 |
Total from investment operations | | | 1.41 | |
Less Distributions to Shareholders from: | | | | |
Net investment income | | | — | |
Net Asset Value, End of Period | | $ | 12.77 | |
Total Return1 | | | 12.41 | %6 |
Ratio of net expenses to average net assets | | | 1.17 | %7 |
Ratio of net investment loss to average net assets1 | | | (0.43 | )%7 |
Portfolio turnover | | | 127 | %6 |
Net assets at end of period (000’s omitted) | | $ | 217 | |
| | | | |
Ratios absent expense offsets:2 | | | | |
Ratio of total expenses to average net assets | | | 1.25 | %7 |
Ratio of net investment loss to average net assets | | | (0.51 | )%7 |
| | | | |
| |
Investor Class Shares* | | For the
fiscal year ended
October 31, 2010 | |
Net Asset Value, Beginning of Period | | $ | 11.36 | |
Income from Investment Operations: | | | | |
Net investment loss | | | (0.07 | )3 |
Net realized and unrealized gain on investments | | | 1.44 | 3 |
Total from investment operations | | | 1.37 | |
Less Distributions to Shareholders from: | | | | |
Net investment income | | | — | |
Net Asset Value, End of Period | | $ | 12.73 | |
Total Return1 | | | 12.06 | %5,6 |
Ratio of net expenses to average net assets | | | 1.46 | %7 |
Ratio of net investment loss to average net assets1 | | | (0.72 | )%7 |
Portfolio turnover | | | 127 | %6 |
Net assets at end of period (000’s omitted) | | $ | 6,517 | |
| | | | |
Ratios absent expense offsets:2 | | | | |
Ratio of total expenses to average net assets | | | 1.54 | %7 |
Ratio of net investment loss to average net assets | | | (0.80 | )%7 |
| | | | |
| * | Effective January 1, 2010, existing shares of Managers AMG FQ Global Essentials were reclassified and redesignated as Institutional Class shares. Investor Class and Service Class shares commenced operations on January 1, 2010. |
| 1 | Total returns and net investment income would have been lower had certain expenses not been reduced. (See Note 1(c) of Notes to Financial Statements.) |
| 2 | Excludes the impact of expense reimbursements or fee waivers and expense reductions such as brokerage recapture credits, but includes non-reimbursable expenses, if any, such as interest and taxes. (See Note 1(c) of Notes to Financial Statements.) |
| 3 | Per share numbers have been calculated using average shares. |
| 4 | Rounds to less than $0.01. |
| 5 | The Total Return is based on the Financial Statement Net Asset Values as shown above. |
41
Managers AMG FQ Funds
Notes to Financial Statements
October 31, 2010
| 1. | Summary of Significant Accounting Policies |
Managers Trust I (the “Trust”) is an open-end management investment company, organized as a Massachusetts business trust, and registered under the Investment Company Act of 1940, as amended (the “1940 Act”). Currently, the Trust is comprised of a number of different funds, each having distinct investment management objectives, strategies, risks, and policies. Included in this report are: Managers AMG FQ Tax-Managed U.S. Equity Fund (“Tax-Managed”), Managers AMG FQ U.S. Equity Fund (“U.S. Equity”), Managers AMG FQ Global Alternatives Fund (“Global Alternatives”) and Managers AMG FQ Global Essentials Fund (“Global Essentials”) (formerly Managers Fremont Global Fund), collectively the “Funds.”
Effective January 1, 2010, Global Essentials and Global Alternatives added new classes of shares. Global Essentials offers three classes of shares, Institutional, Service and Investor, while Global Alternatives offers four classes of shares, Institutional, Service, Class A and Class C, each offering varying levels of shareholder servicing and /or 12b-1 fees. Legacy Global Essentials shareholders became shareholders in the Institutional Class and the Fund added a new Investor Class and Service Class. Global Alternatives added Institutional Class and Service Class shares to the existing A and Class shares.
Each Fund except Global Essentials offers Class A and Class C shares. Sales of Class A shares may be subject to a front-end sales charge of up to 5.75%. Redemptions of Class A and Class C shares may be subject to a contingent-deferred sales charge (as a percentage of the original offering price or the net asset value at the time of sale, whichever is less). Each Fund offers Institutional Class shares, available with no sales charge, to certain institutional investors and qualifying individual investors. Each class represents an interest in the same assets of the Fund and the classes are identical except for class specific expenses related to shareholder activity. Each class has equal voting privileges except that each class has exclusive voting rights with respect to its services and/or distribution plan. Please refer to a current prospectus for additional information on each share class.
The Funds’ financial statements are prepared in accordance with accounting principles generally accepted in the United States of America, which require management to make estimates and assumptions that affect the reported amounts of assets and liabilities and disclosure of contingent assets and liabilities at the date of the financial statements and the reported amounts of income and expenses during the reporting period. Actual results could differ from those estimates and such differences could be material. The following is a summary of significant accounting policies followed by the Funds in the preparation of their financial statements:
| a. | Valuation of Investments |
Equity securities traded on a domestic or international securities exchange are valued at the last quoted sale price, or, lacking any sales, at the last quoted bid price. Over-the-counter securities are valued at the Nasdaq Official Closing Price, if one is available. Lacking any sales, over-the-counter securities are valued at the last quoted bid price. The Funds’ investments are generally valued based on market quotations provided by third-party pricing services approved by the Board of Trustees of the Funds. Under certain circumstances, the value of certain Fund investments may be based on an evaluation of fair value, pursuant to procedures established by and under the general supervision of the Board of Trustees of the Trust. Each Fund may use the fair value of a portfolio security to calculate its NAV when, for example, (1) market quotations are not readily available because a portfolio security is not traded in a public market or the principal market in which the security trades is closed, (2) trading in a portfolio security is suspended and has not resumed before the Fund calculates its NAV, (3) a significant event affecting the value of a portfolio security is determined to have occurred between the time of the market quotation provided for a portfolio security and the time as of which the Fund calculates its NAV, (4) a security’s price has remained unchanged over a period of time (often referred to as a “stale price”), or (5) Managers Investment Group LLC (“the Investment Manager”) determines that a market quotation is inaccurate. Portfolio investments that trade primarily on foreign markets are priced based upon the market quotation of such securities as of the close of their respective principal markets, as adjusted to reflect the Investment Manager’s determination of the impact of events occurring subsequent to the close of such markets but prior to the time as of which the Funds calculate their NAV. In accordance with procedures approved by the Board of Trustees, the Investment Manager relies upon recommendations of a third-party fair valuation service in adjusting the prices of such foreign portfolio investments. The Funds may invest in securities that may be thinly traded. The Board of Trustees has adopted procedures to adjust prices of thinly traded securities that are judged to be stale so that they reflect fair value. An investment valued on the basis of its fair value may be valued at a price higher or lower than available market quotations. An investment’s valuation may differ depending on the method used and the factors considered in determining value according to the Fund’s fair value procedures.
Fixed-income securities are valued based on valuations furnished by independent pricing services that utilize matrix systems, which reflect such factors as security prices, yields, maturities, and ratings, and are supplemented by dealer and exchange quotations. Futures contracts for which market quotations are readily available are valued at the settlement price as of the close of the futures exchange. Short-term investments having a remaining maturity of 60 days or less are valued at amortized cost, which approximates market value. Investments in other open-end regulated investment companies are valued at their end of day net asset value per share except iShares or other ETF’s, which are valued the same as equity securities. Investments in certain mortgage-backed and stripped mortgage-backed securities, preferred stocks, convertible securities, derivatives and other debt securities not traded on an organized securities market are valued on the basis of valuations provided by dealers or by a pricing service which uses information with respect to transactions in such securities and various relationships between securities and yield to maturity in determining value. Securities (including derivatives) for which market quotations are not readily available are valued at fair value, as determined in good faith,
42
Managers AMG FQ Funds
Notes to Financial Statements (continued)
and pursuant to procedures adopted by the Board of Trustees of the Trust. The values assigned to fair value investments are based on available information and do not necessarily represent amounts that might ultimately be realized, since such amounts depend on future developments inherent in long-term investments. Further, because of the inherent uncertainty of valuation, those estimated values may differ significantly from the values that would have been used had a ready market for the investments existed, and the differences could be material.
Generally Accepted Accounting Principles (GAAP) define fair value as the price that a Fund would receive to sell an asset or pay to transfer a liability in an orderly transaction between market participants at the measurement date. GAAP also establishes a framework for measuring fair value, and a three-level hierarchy for fair value measurements based upon the transparency of inputs to the valuation of an asset or liability. Inputs may be observable or unobservable and refer broadly to the assumptions that market participants would use in pricing the asset or liability. Observable inputs reflect the assumptions market participants would use in pricing the asset or liability based on market data obtained from sources independent of the Funds. Unobservable inputs reflect the Funds’ own assumptions about the assumptions that market participants would use in pricing the asset or liability developed based on the best information available in the circumstances. Each investment is assigned a level based upon the observability of the inputs which are significant to the overall valuation.
The three-tier hierarchy of inputs is summarized below:
Level 1 – quoted prices in active markets for identical investments
Level 2 – other significant observable inputs (including quoted prices for similar investments, interest rates, prepayment speeds, credit risk)
Level 3 – significant unobservable inputs (including the Funds’ own assumptions in determining the fair value of investments)
The inputs or methodologies used for valuing investments are not necessarily an indication of the risk associated with investing in those investments.
Security transactions are accounted for as of trade date. Realized gains and losses on securities sold are determined on the basis of identified cost.
| c. | Investment Income and Expenses |
Dividend income is recorded on the ex-dividend date, except certain dividends from foreign securities where the ex-dividend date may have passed. These dividends are recorded as soon as the Trust is informed of the ex-dividend date. Dividend income on foreign securities is recorded net of any withholding tax. Interest income, which includes amortization of premium and accretion of discount on debt securities, is accrued as earned. Non-cash dividends included in dividend income, if any, are reported at the fair market value of the securities received. Other income and expenses are recorded on an accrual basis. Expenses that cannot be directly attributed to a Fund are apportioned among the Funds in the Trust and in some cases other affiliated funds based upon their relative average net assets or number of shareholders. Investment income, realized and unrealized capital gains and losses, the common expenses of each Fund, and certain Fund level expense reductions, if any, are allocated on a pro rata basis to each class based on the relative net assets of each class to the total net assets of each Fund.
The Funds have a “balance credit” agreement with The Bank of New York Mellon (“BNYM”), the Funds’ custodian, whereby each Fund is credited with an interest factor equal to 0.75% below the effective 90-day T-Bill rate for account balances left uninvested overnight. If the T-Bill rate falls below 0.75%, no credits will be earned. These credits serve to reduce custody expenses that would otherwise be charged to each Fund. For the fiscal year ended October 31, 2010, there were no balance credits to reduce the custodian expense.
Overdrafts will cause a reduction of any earnings credits, computed at 2% above the effective Federal funds rate on the day of the overdraft. For the fiscal year ended October 31, 2010, overdraft fees for Tax-Managed, U.S. Equity, Global Alternatives and Global Essentials equaled $89, $58, $1 and $0, respectively.
The Trust also has a balance credit arrangement with its Transfer Agent, BNY Mellon Investment Servicing (US) Inc. (formerly PNC Global Investment Servicing (U.S.) Inc.), whereby earnings credits are used to offset banking charges and other out-of-pocket expenses. For the fiscal year ended October 31, 2010, the transfer agent expense was reduced as follows: Tax-Managed - $84, U.S. Equity - $89, Global Alternatives - $673, and Global Essentials - $145.
The Investment Manager has agreed to waive a portion of its management fee in consideration of shareholder servicing fees that it has received from JPMorgan Distribution Services, Inc., with respect to short-term cash investments each Fund may have made in the JPMorgan Liquid Assets Portfolio - - Capital Share Class. For the fiscal year ended October 31, 2010, the management fee was reduced as follows: Tax-Managed - $0, U.S. Equity -$0, Global Alternatives - $83,700 or 0.02% and Global Essentials - $14,352 or 0.02%.
Total returns and net investment income for the Funds would have been lower had certain expenses not been offset. Total expenses before offsets exclude the impact of expense reimbursements or fee waivers and expense reductions such as brokerage recapture credits, but include non-reimbursable expenses, if any, such as interest and taxes.
| d. | Dividends and Distributions |
Dividends resulting from net investment income and distributions of capital gains, if any, normally will be declared and paid annually in December and when required for Federal excise tax purposes. Distributions are recorded on the ex-dividend date and are declared separately for each class. Income and capital gain distributions are determined in accordance with Federal income tax regulations, which may differ from GAAP. These differences are primarily due to differing treatments for losses deferred due to wash sales, REITs, equalization accounting for tax purposes, foreign currency, options, futures, and market discount transactions. Permanent book and tax
43
Managers AMG FQ Funds
Notes to Financial Statements (continued)
basis differences, if any, relating to shareholder distributions will result in reclassifications to paid-in capital. The tax character of distributions paid during the fiscal years ended October 31, 2010 and 2009 were as follows:
| | | | | | | | | | | | | | | | | | | | | | | | | | | | | | | | |
| | | Tax-Managed Equity | | | U.S. Equity | | | Global Alternatives | | | Global Essentials | |
| | | 2010 | | | 2009 | | | 2010 | | | 2009 | | | 2010 | | | 2009 | | | 2010 | | | 2009 | |
Distributions paid from: | | | | | | | | | | | | | | | | | | | | | | | | | | | | | | | | |
Ordinary income | | $ | 125,566 | | | $ | 842,465 | | | $ | 698,054 | | | $ | 912,255 | | | | — | | | $ | 11,141,269 | | | $ | 710,852 | | | $ | 3,637,680 | |
Short-term capital gains | | | — | | | | — | | | | — | | | | — | | | | — | | | | — | | | | — | | | | — | |
Long-term capital gains | | | — | | | | — | | | | — | | | | — | | | | — | | | | — | | | | — | | | | — | |
| | | | | | | | | | | | | | | | | | | | | | | | | | | | | | | | |
Totals | | $ | 125,566 | | | $ | 842,465 | | | $ | 698,054 | | | $ | 912,255 | | | | — | | | $ | 11,141,269 | | | $ | 710,852 | | | $ | 3,637,680 | |
| | | | | | | | | | | | | | | | | | | | | | | | | | | | | | | | |
As of October 31, 2010, the components of distributable earnings (excluding unrealized appreciation/depreciation) on a tax basis consisted of:
| | | | | | | | | | | | | | | | |
| | | Tax-Managed
Equity | | | U.S. Equity | | | Global
Alternatives | | | Global
Essentials | |
Capital loss carryforward | | $ | 32,580,437 | | | $ | 21,298,821 | | | $ | 15,464,145 | | | $ | 63,821,025 | |
Undistributed ordinary income | | | 169,442 | | | | 391,187 | | | | — | | | | 4,529,377 | |
Undistributed short-term capital gains | | | — | | | | — | | | | — | | | | — | |
Undistributed long-term capital gains | | | — | | | | — | | | | — | | | | — | |
Each Fund intends to comply with the requirements under Subchapter M of the Internal Revenue Code of 1986, as amended, to distribute substantially all of its taxable income and gains to its shareholders and to meet certain diversification and income requirements with respect to investment companies. Therefore, no provision for Federal income or excise tax is included in the accompanying financial statements.
Additionally, based on each Fund’s understanding of the tax rules and rates related to income, gains and transactions for the foreign jurisdictions in which it invests, each Fund will provide for foreign taxes, and where appropriate, deferred foreign taxes.
Management has analyzed the Funds’ tax positions taken on federal income tax returns for all open tax years (tax years ended October 31, 2007-2010), and has concluded that no provision for federal income tax is required in the Funds’ financial statements. Additionally, the Funds are not aware of any tax position for which it is reasonably possible that the total amounts of unrecognized tax benefits will change materially in the next twelve months.
| f. | Capital Loss Carryovers |
As of October 31, 2010, the following Funds had accumulated net realized capital loss carryovers from securities transactions for Federal income tax purposes as shown in the following chart. These amounts may be used to offset realized capital gains, if any, through the expiration dates listed.
| | | | | | | | |
Fund | | Capital Loss
Carryover Amount | | | Expires
October 31, | |
Tax-Managed | | $ | 22,952,492 | | | | 2017 | |
| | | 9,627,945 | | | | 2016 | |
| | | | | | | | |
Total | | $ | 32,580,437 | | | | | |
| | | | | | | | |
U.S. Equity | | $ | 16,764,187 | | | | 2017 | |
| | | 4,534,634 | | | | 2016 | |
| | | | | | | | |
Total | | $ | 21,298,821 | | | | | |
| | | | | | | | |
Global Alternatives | | $ | 6,992,099 | | | | 2018 | |
| | | 8,295,120 | | | | 2017 | |
| | | 176,926 | | | | 2016 | |
| | | | | | | | |
Total | | $ | 15,464,145 | | | | | |
| | | | | | | | |
Global Essentials | | $ | 19,442,096 | | | | 2017 | |
| | | 5,312,619 | | | | 2016 | |
| | | 39,066,310 | | | | 2011 | |
| | | | | | | | |
Total | | $ | 63,821,025 | | | | | |
| | | | | | | | |
For the fiscal year ended October 31, 2010, Tax-Managed, U.S. Equity, Global Alternatives and Global Essentials utilized capital loss carryovers in the amounts of $7,494,853, $3,145,637, $0 and $4,202,200, respectively.
The Trust’s Declaration of Trust authorizes for each series the issuance of an unlimited number of shares of beneficial interest, without par value. Each Fund records sales and repurchases of its capital stock on the trade date. The cost of securities contributed to the Funds in connection with the issuance of shares is based on the valuation of those securities in accordance with the Funds’ policy on investment valuation. Dividends and distributions to shareholders are recorded on the ex-dividend date.
44
Managers AMG FQ Funds
Notes to Financial Statements (continued)
The capital stock transactions by class for Tax-Managed, U.S. Equity, Global Alternatives and Global Essentials for the fiscal years ended October 31, 2010 and 2009 were as follows:
| | | | | | | | | | | | | | | | | | | | | | | | | | | | | | | | |
| | | Tax-Managed | | | U.S. Equity | |
| | | For the fiscal year ended
October 31, 2010 | | | For the fiscal year ended
October 31, 2009 | | | For the fiscal year ended
October 31, 2010 | | | For the fiscal year ended
October 31, 2009 | |
| | | Shares | | | Amount | | | Shares | | | Amount | | | Shares | | | Amount | | | Shares | | | Amount | |
Class A Shares | | | | | | | | | | | | | | | | | | | | | | | | | | | | | | | | |
Sale of shares | | | 12,369 | | | $ | 138,045 | | | | 395,887 | | | $ | 3,454,064 | | | | 188,045 | | | $ | 1,807,907 | | | | 585,836 | | | $ | 4,439,785 | |
Reinvestment of dividends and distributions | | | — | | | | — | | | | 8,544 | | | | 74,589 | | | | 23,764 | | | | 229,320 | | | | 41,408 | | | | 317,181 | |
Shares repurchased | | | (399,037 | ) | | | (4,489,541 | ) | | | (1,223,343 | ) | | | (11,130,161 | ) | | | (469,818 | ) | | | (4,558,863 | ) | | | (1,208,396 | ) | | | (9,460,890 | ) |
| | | | | | | | | | | | | | | | | | | | | | | | | | | | | | | | |
Net
decrease | | | (386,668 | ) | | | ($4,351,496 | ) | | | (818,912 | ) | | | ($7,601,508 | ) | | | (258,009 | ) | | | ($2,521,636 | ) | | | (581,152 | ) | | | ($4,703,924 | ) |
| | | | | | | | | | | | | | | | | | | | | | | | | | | | | | | | |
Class C Shares | | | | | | | | | | | | | | | | | | | | | | | | | | | | | | | | |
Sale of shares | | | 18,251 | | | $ | 191,591 | | | | 84,469 | | | $ | 726,778 | | | | 10,980 | | | $ | 107,094 | | | | 71,446 | | | $ | 571,849 | |
Reinvestment of dividends and distributions | | | — | | | | — | | | | 482 | | | | 4,176 | | | | 113 | | | | 1,084 | | | | 766 | | | | 5,838 | |
Shares repurchased | | | (221,833 | ) | | | (2,391,286 | ) | | | (309,608 | ) | | | (2,785,487 | ) | | | (33,416 | ) | | | (316,874 | ) | | | (113,020 | ) | | | (857,531 | ) |
| | | | | | | | | | | | | | | | | | | | | | | | | | | | | | | | |
Net
decrease | | | (203,582 | ) | | | ($2,199,695 | ) | | | (224,657 | ) | | | ($2,054,533 | ) | | | (22,323 | ) | | | ($208,696 | ) | | | (40,808 | ) | | | ($279,844 | ) |
| | | | | | | | | | | | | | | | | | | | | | | | | | | | | | | | |
Institutional Class | | | | | | | | | | | | | | | | | | | | | | | | | | | | | | | | |
Sale of shares | | | 118,811 | | | $ | 1,331,128 | | | | 365,438 | | | $ | 3,146,699 | | | | 79,358 | | | $ | 789,194 | | | | 66,098 | | | $ | 539,862 | |
Reinvestment of dividends and distributions | | | 10,915 | | | | 119,516 | | | | 76,649 | | | | 666,082 | | | | 47,361 | | | | 459,403 | | | | 73,854 | | | | 567,938 | |
Shares repurchased | | | (901,437 | ) | | | (10,159,838 | ) | | | (1,394,355 | ) | | | (12,291,562 | ) | | | (474,586 | ) | | | (4,603,599 | ) | | | (719,026 | ) | | | (5,515,250 | ) |
| | | | | | | | | | | | | | | | | | | | | | | | | | | | | | | | |
Net
decrease | | | (771,711 | ) | | | ($8,709,194 | ) | | | (952,268 | ) | | | ($8,478,781 | ) | | | (347,867 | ) | | | ($3,355,002 | ) | | | (579,074 | ) | | | ($4,407,450 | ) |
| | | | | | | | | | | | | | | | | | | | | | | | | | | | | | | | |
| | | | | | | | | | | | | | | | |
| | | Global Alternatives | |
| | | For the fiscal year ended
October 31, 2010 | | | For the fiscal year ended
October 31, 2009 | |
| | | Shares | | | Amount | | | Shares | | | Amount | |
Class A Shares | | | | | | | | | | | | | | | | |
Sale of shares | | | 45,126,281 | | | $ | 467,569,218 | | | | 25,672,311 | | | $ | 258,404,171 | |
Reinvestment of dividends and distributions | | | — | | | | — | | | | 719,845 | | | | 7,162,463 | |
Shares repurchased | | | (15,222,361 | ) | | | (156,389,321 | ) | | | (13,809,688 | ) | | | (134,816,815 | ) |
| | | | | | | | | | | | | | | | |
Net increase | | | 29,903,920 | | | $ | 311,179,897 | | | | 12,582,468 | | | $ | 130,749,819 | |
| | | | | | | | | | | | | | | | |
Class C Shares | | | | | | | | | | | | | | | | |
Sale of shares | | | 2,352,895 | | | $ | 23,868,322 | | | | 2,370,983 | | | $ | 23,207,410 | |
Reinvestment of dividends and distributions | | | — | | | | — | | | | 51,653 | | | | 507,230 | |
Shares repurchased | | | (856,052 | ) | | | (8,574,553 | ) | | | (467,373 | ) | | | (4,523,226 | ) |
| | | | | | | | | | | | | | | | |
Net increase | | | 1,496,843 | | | $ | 15,293,769 | | | | 1,955,263 | | | $ | 19,191,414 | |
| | | | | | | | | | | | | | | | |
Service Class Shares* | | | | | | | | | | | | | | | | |
Sale of shares | | | 2,008,466 | | | $ | 21,183,512 | | | | N/A | | | | N/A | |
Reinvestment of dividends and distributions | | | — | | | | — | | | | | | | | | |
Shares repurchased | | | (251,584 | ) | | | (2,613,904 | ) | | | N/A | | | | N/A | |
| | | | | | | | | | | | | | | | |
Net increase | | | 1,756,882 | | | $ | 18,569,608 | | | | N/A | | | | N/A | |
| | | | | | | | | | | | | | | | |
Institutional Class Shares* | | | | | | | | | | | | | | | | |
Sale of shares | | | 3,205,700 | | | $ | 33,272,519 | | | | N/A | | | | N/A | |
Reinvestment of dividends and distributions | | | — | | | | — | | | | | | | | | |
Shares repurchased | | | (689,808 | ) | | | (7,010,001 | ) | | | N/A | | | | N/A | |
| | | | | | | | | | | | | | | | |
Net increase | | | 2,515,892 | | | $ | 26,262,518 | | | | N/A | | | | N/A | |
| | | | | | | | | | | | | | | | |
45
Managers AMG FQ Funds
Notes to Financial Statements (continued)
| | | | | | | | | | | | | | | | |
| | | Global Essentials | |
| | | For the fiscal year ended
October 31, 2010 | | | For the fiscal year ended
October 31, 2009 | |
| | | Shares | | | Amount | | | Shares | | | Amount | |
Investor Class Shares* | | | | | | | | | | | | | | | | |
Sale of shares | | | 518,437 | | | $ | 6,486,828 | | | | N/A | | | | N/A | |
Reinvestment of dividends and distributions | | | — | | | | — | | | | | | | | | |
Shares repurchased | | | (6,670 | ) | | | (80,131 | ) | | | N/A | | | | N/A | |
| | | | | | | | | | | | | | | | |
Net increase | | | 511,767 | | | $ | 6,406,697 | | | | N/A | | | | N/A | |
| | | | | | | | | | | | | | | | |
Service Class Shares* | | | | | | | | | | | | | | | | |
Sale of shares | | | 17,893 | | | $ | 219,726 | | | | N/A | | | | N/A | |
Reinvestment of dividends and distributions | | | — | | | | — | | | | | | | | | |
Shares repurchased | | | (880 | ) | | | (10,484 | ) | | | N/A | | | | N/A | |
| | | | | | | | | | | | | | | | |
Net increase | | | 17,013 | | | $ | 209,242 | | | | N/A | | | | N/A | |
| | | | | | | | | | | | | | | | |
Institutional Class Shares | | | | | | | | | | | | | | | | |
Sale of shares | | | 1,145,762 | | | $ | 14,225,272 | | | | 465,056 | | | $ | 5,118,790 | |
Reinvestment of dividends and distributions | | | 60,763 | | | | 692,638 | | | | 398,063 | | | | 3,606,451 | |
Shares repurchased | | | (1,074,616 | ) | | | (12,569,066 | ) | | | (1,621,367 | ) | | | (14,854,983 | ) |
| | | | | | | | | | | | | | | | |
Net increase (decrease) | | | 131,909 | | | $ | 2,348,844 | | | | (758,248 | ) | | | ($6,129,742 | ) |
| | | | | | | | | | | | | | | | |
| * | Investor and Service Class shares for Global Essentials commenced operations on January 1, 2010. Institutional and Service Class shares for Global Alternatives commenced operations on January 1, 2010. |
At October 31, 2010, certain unaffiliated shareholders of record, specifically omnibus accounts, individually or collectively held greater than 10% of the outstanding shares of the following Funds: Tax-Managed – two collectively own 29% and Global Alternatives – two collectively own 27%. Transactions by these shareholders may have a material impact on the Funds.
| h. | Foreign Currency Translation |
The books and records of the Funds are maintained in U.S. dollars. The value of investments, assets and liabilities denominated in currencies other than U.S. dollars are translated into U.S. dollars based upon current foreign exchange rates. Purchases and sales of foreign investments, income and expenses are converted into U.S. dollars based on currency exchange rates prevailing on the respective dates of such transactions. Net realized and unrealized gain (loss) on foreign currency transactions represent: (1) foreign exchange gains and losses from the sale and holdings of foreign currencies; (2) gains and losses between trade date and settlement date on investment securities transactions and forward foreign currency exchange contracts; and (3) gains and losses from the difference between amounts of interest and dividends recorded and the amounts actually received.
The Funds do not isolate the net realized and unrealized gain or loss resulting from changes in exchange rates from the fluctuations in market prices of securities held. Such fluctuations are included with the net realized and unrealized gain or loss on investments.
| 2. | Agreements and Transactions with Affiliates |
The Trust has entered into an Investment Management Agreement under which the Investment Manager, an independently managed subsidiary of Affiliated Managers Group, Inc. (“AMG”), serves as investment manager to the Funds and is responsible for the Funds’ overall administration. The Funds’ investment portfolios are managed by First Quadrant, L.P. (“First Quadrant” or the “Subadvisor”), which serves pursuant to a Subadvisory Agreement between the Investment Manager and First Quadrant with respect to each of the Funds. AMG indirectly owns a majority interest in First Quadrant.
Tax-Managed is obligated by the Investment Management Agreement to pay an annual management fee to the Investment Manager of 0.85% of the average daily net assets of the Fund. Under the Investment Management Agreement with the Fund, the Investment Manager provides a variety of administrative services to the Fund. The Investment Manager receives no additional compensation from the Fund for these services. Pursuant to a Reimbursement Agreement between the Investment Manager and First Quadrant, First Quadrant reimburses the Investment Manager for the costs the Investment Manager bears in providing such services to the Fund.
U.S. Equity, Global Alternatives and Global Essentials are obligated by the Investment Management Agreement to pay an annual management fee to the Investment Manager of 0.35%, 1.70% and 0.60%, respectively, of the average daily net assets of the Fund. The Investment Manager, in turn, pays a portion of this fee to First Quadrant for its services as subadvisor.
46
Managers AMG FQ Funds
Notes to Financial Statements (continued)
The Investment Manager has contractually agreed, through at least March 1, 2011, to waive fees and pay or reimburse Fund expenses in order to limit total annual Fund operating expenses after fee waiver and expense reimbursements (exclusive of taxes, interest, shareholder servicing fees, distribution and service (12b-1) fees, brokerage commissions, acquired fund fees and expenses and extraordinary items) to the following amounts of the Funds’ average daily net assets:
| | | | | | | | | | | | | | | | | | | | |
Fund | | Class A | | | Class C | | | Investor | | | Service
Class | | | Institutional
Class | |
Tax-Managed | | | 1.24 | % | | | 1.99 | % | | | N/A | | | | N/A | | | | 0.99 | % |
U.S. Equity | | | 1.04 | % | | | 1.79 | % | | | N/A | | | | N/A | | | | 0.79 | % |
Global Alternatives | | | 1.99 | % | | | 2.49 | % | | | N/A | | | | 1.74 | % | | | 1.49 | % |
Global Essentials | | | N/A | | | | N/A | | | | 1.49 | % | | | 1.24 | % | | | 0.99 | % |
Effective January 1, 2010, Global Alternatives contractual expense limitation was lowered from 1.74% to 1.49% . The Investment Manager has contractually agreed, through at least March 1, 2011, to waive fees and pay or reimburse Fund expenses in order to limit total annual Fund operating expenses after fee waiver and expense reimbursements (exclusive of taxes, interest, shareholder servicing fees, distribution and service (12b-1) fees, brokerage commissions, acquired fund fees and expenses and extraordinary items) to 1.49% of the Fund’s average daily net assets. For the fiscal year ended October 31, 2010, each Fund’s components of reimbursement are detailed in the following chart:
| | | | | | | | |
| | | Tax-Managed | | | U.S Equity | |
Reimbursement Available - 10/31/09 | | $ | 232,124 | | | $ | 92,834 | |
Additional Reimbursements | | | 96,502 | | | | 57,861 | |
Repayments | | | — | | | | — | |
Expired Reimbursements | | | (82,277 | ) | | | — | |
| | | | | | | | |
Reimbursement Available - 10/31/10 | | $ | 246,349 | | | $ | 150,695 | |
| | | | | | | | |
| | |
| | | Global
Alternatives | | | Global
Essentials | |
Reimbursement Available - 10/31/09 | | $ | 858,632 | | | $ | 4,809 | |
Additional Reimbursements | | | 2,371,339 | | | | 53,249 | |
Repayments | | | — | | | | (4,440 | ) |
Expired Reimbursements | | | (63,195 | ) | | | — | |
| | | | | | | | �� |
Reimbursement Available - 10/31/10 | | $ | 3,166,776 | | | $ | 53,618 | |
| | | | | | | | |
The aggregate annual retainer paid to each Independent Trustee is $65,000, plus $4,000 or $2,500 for each regular or special meeting attended, respectively. The Trustees’ fees and expenses are allocated amongst all of the Funds for which the Investment Manager serves as the advisor (the “Managers Funds”) based on the relative net assets of such Funds. The Independent Chairman of the Trusts receives an additional payment of $15,000 per year. The Chairman of the Audit
Committee receives an additional payment of $5,000 per year. The “Trustee fees and expenses” shown in the financial statements represents each Fund’s allocated portion of the total fees and expenses paid by the Managers Funds.
The Funds are distributed by Managers Distributors, Inc. (the “Distributor” or “MDI”), a wholly-owned subsidiary of the Investment Manager. MDI serves as the principal underwriter for each Fund and is a registered broker-dealer and member of the Financial Industry Regulatory Authority, Inc. (“FINRA”). Shares of each Fund will be continuously offered and will be sold by brokers, dealers or other financial intermediaries who have executed selling agreements with MDI. MDI bears all the expenses of providing services pursuant to the Underwriting Agreement, including payment of the expenses relating to the distribution of Prospectuses for sales purposes and any advertising or sales literature. Certain Trustees and Officers of the Funds are Officers and/or Directors of the Investment Manager, AMG and/or Distributor.
The Funds have adopted a distribution and service plan (the “Plan”) with respect to the Investor Class, Class A and Class C shares of each Fund, in accordance with the requirements of Rule 12b-1 under the 1940 Act and the requirements of the applicable rules of FINRA regarding asset-based sales charges. Pursuant to the Plan, the Funds may compensate the Distributor for its expenditures in financing any activity primarily intended to result in the sale of each such class of the Fund’s shares and for maintenance and personal service provided to existing shareholders of that class. The Plan authorizes payments to the Distributor up to 0.25% annually of the Fund’s average daily net assets attributable to the Investor Class and Class A shares and 1.00% annually of the Fund’s average daily net assets attributable to Class C shares. The Plan further provides for periodic payments by MDI to brokers, dealers and other financial intermediaries for providing shareholder services and for promotional and other sales related costs. The portion of payments by Investor Class, Service Class, Class A or Class C shares for shareholder servicing may not exceed an annual rate of 0.25% of the average daily net asset value of the Fund’s shares of that class owned by clients of such broker, dealer or financial intermediary.
On June 23, 2009, the Securities and Exchange Commission granted an exemptive order that permits the Funds to lend and borrow money for certain temporary purposes directly to and from other eligible Funds in the Managers Family of Funds (the “Fund Family”). Participation in this interfund lending program is voluntary for both borrowing and lending Funds, and an interfund loan is only made if it benefits each participating Fund. The Investment Manager administers the program according to procedures approved by the Funds’ Board of Trustees (the “Board”), and the Board monitors the operation of the program. An interfund loan must comply with certain conditions set out in the exemptive order, which are designed to assure fairness and protect all participating Funds. For the fiscal year ended October 31, 2010, the following Funds either borrowed
47
Managers AMG FQ Funds
Notes to Financial Statements (continued)
from or lent to other Funds in the Fund Family: Tax-Managed borrowed varying amounts up to $632,958 for 5 days paying interest of $34; U.S. Equity borrowed $1,018,303 for 8 days paying interest of $194; Global Alternatives lent varying amounts up to $9,822,549 for 18 days earning interest of $1,525; Global Essentials lent varying amounts up to $2,179,160 for 10 days earning interest of $397.
The interest amounts can be found in the Statement of Operations in interest income or as miscellaneous expense.
| 3. | Purchases and Sales of Securities |
Purchases and sales of investment securities (excluding short-term securities and U.S. Government Obligations) for the fiscal year ended October 31, 2010, were as follows:
| | | | | | | | | | | | | | | | |
| | | Long-Term Securities | | | U.S. Government Obligations | |
Fund | | Purchases | | | Sales | | | Purchases | | | Sales | |
Tax-Managed | | $ | 38,692,028 | | | $ | 53,559,936 | | | | N/A | | | | N/A | |
U.S. Equity | | | 58,686,145 | | | | 64,526,624 | | | | N/A | | | | N/A | |
Global Alternatives | | | 65,876,867 | | | | 12,399,548 | | | $ | 113,827,111 | | | $ | 86,475,000 | |
Global Essentials | | | 42,906,073 | | | | 12,523,088 | | | | 36,285,402 | | | | 53,741,756 | |
| 4. | Portfolio Securities Loaned |
For the fiscal year ended October 31, 2010, Tax-Managed, U.S. Equity, and Global Essentials participated in a securities lending program offered by BNYM, providing for the lending of securities to qualified brokers. Securities lending fees include earnings of such temporary cash investments, plus or minus any rebate to a borrower. These earnings (after any rebate) are then divided between BNYM, as a fee for its services under the program, and the Fund, according to agreed-upon rates. Collateral on all securities loaned is accepted in cash and/or government securities and is maintained at a minimum level of 102% (105% in the case of certain foreign securities) of the market value, plus interest, if applicable, of investments on loan. It is the Funds’ policy to obtain additional collateral from or return excess collateral to the borrower by the end of the next business day, following the valuation date of the securities loaned. Therefore, the value of the collateral held may be temporarily less than the value of the securities on loan. Lending securities entails a risk of loss to the Funds if and to the extent that the market value of the securities loaned were to increase and the borrower did not increase the collateral accordingly, and the borrower fails to return the securities. The Funds bear the risk of any deficiency in the amount of the collateral available for return to the borrower due to any loss on the collateral invested. Collateral received in the form of cash is invested temporarily in the BNY Mellon Overnight Government Fund, formerly the BNY Institutional Cash Reserves Fund (the “ICRF”), or other short-term investments as defined in the Securities Lending Agreement with BNYM.
Effective August 2, 2010, the Trust, on behalf of each applicable Fund, entered into an agreement with The Bank of New York Mellon and the Bank of New York Mellon Corporation (“BNYMC”) with respect to each Fund’s position in the ICRF, pursuant to which (i) BNYMC will support the value of certain defaulted securities issued by Lehman Brothers Holdings, Inc. and held by ICRF, and (ii) if certain conditions are met, BNYMC will purchase the defaulted securities from each Fund in September 2011. Each applicable Fund is fair valuing its position in the ICRF daily. Tax-Managed’s and U.S. Equity’s position in the separate sleeve of the ICRF is included in the Schedule of Portfolio Investments and Global Essentials’ position is included in the Statement of Assets and Liabilities. The unrealized loss on such investment is included in Net Unrealized Depreciation on the Statement of Assets and Liabilities and Statement of Operations.
| 5. | Commitments and Contingencies |
In the normal course of business, the Funds may enter into contracts and agreements that contain a variety of representations and warranties, which provide general indemnifications. The maximum exposure to the Funds under these arrangements is unknown, as this would involve future claims that may be made against a Fund that have not yet occurred. However, based on experience, the Funds expect the risks of loss to be remote.
Certain transactions, such as futures and forward transactions, dollar roll agreements, or purchases of when-issued or delayed delivery securities may have a similar effect on a Fund’s net asset value as if the Fund had created a degree of leverage in its portfolio. However, if a Fund enters into such a transaction, the Fund will establish a segregated account with its custodian in which it will maintain cash, U.S. government securities or other liquid securities equal in value to its obligations in respect to such transaction. Securities and other assets held in the segregated account may not be sold while the transaction is outstanding, unless other suitable assets are substituted.
The following disclosures contain information on how and why the Fund uses derivative instruments and how derivative instruments affect the Fund’s financial position, results of operations and cash flows. The location and fair value amounts of these instruments on the Statement of Assets and Liabilities and the realized and changes in unrealized gains and losses on the Statement of Operations, each categorized by type of derivative contract, are included in a table in the Notes to Schedule of Portfolio Investments and Statement of Net Assets. The derivative instruments outstanding as of the fiscal year end as disclosed in the Statement of Assets and Liabilities and the realized and changes in unrealized gains and losses on derivative instruments during the period as disclosed in the Statement of Operations serve as indicators of the volume of derivative activity for the Fund.
48
Managers AMG FQ Funds
Notes to Financial Statements (continued)
| 8. | Forward Foreign Currency Contracts |
During the fiscal year ended October 31, 2010, Global Alternatives invested in forward foreign currency exchange contracts to facilitate transactions in foreign securities and to hedge against foreign currency exchange rate risk on its non-U.S. dollar denominated investment securities.
A forward foreign currency exchange contract is an agreement between a Fund and another party to buy or sell a currency at a set price at a future date. The market value of the contract will fluctuate with changes in currency exchange rates. The contract is marked-to-market daily, and the change in market value is recorded as an unrealized gain or loss. Gain or loss on the purchase or sale of contracts having the same settlement date, amount and counterparty is realized on the date of offset, otherwise gain or loss is realized on the settlement date.
Risks may arise upon entering into these contracts from the potential inability of counterparties to meet the terms of their contracts and from unanticipated movements in the value of a foreign currency relative to the U.S. dollar.
U.S. Equity uses Equity Index futures contracts with the objective of maintaining exposure to equity stock markets while maintaining liquidity. Global Essentials and Global Alternatives used futures contracts, including futures contracts on global equity and fixed-income securities, interest rate futures contracts, foreign currency futures contracts and futures contracts on security indices (including broad-based security indices), for any purpose. The Funds purchased or sold futures contracts to achieve a desired level of investment, whether to accommodate portfolio turnover or cash flows from capital shares transactions. There are certain risks associated with futures contracts. Prices may not move as expected or a Fund may not be able to close out the contract when it desires to do so, resulting in losses.
On entering into a futures contract, either cash or securities in an amount equal to a certain percentage of the contract value (initial margin) must be deposited with the futures broker. Subsequent payments (variation margin) are made or received each day. The variation margin payments equal the daily changes in the contract value and are recorded as unrealized gains or losses. The Funds recognize a realized gain or loss when the contract is closed or expires equal to the difference between the value of the contract at the time it was opened and the value at the time it was closed. Futures are valued at their quoted daily settlement prices. The aggregate principal amounts of the contracts are not recorded in the financial statements. Fluctuations in the value of the contracts are recorded in the Statement of Assets and Liabilities as an asset (liability) and in the Statement of Operations as unrealized appreciation (depreciation) until the con-tracts are closed, when they are recorded as realized gains (losses) on futures or forward currency contracts.
The Funds have determined that no material events or transactions occurred through the issuance date of the Funds’ financial statements which require additional disclosure in the Funds’ financial statements.
Tax Information (unaudited)
Each Fund hereby designates the maximum amount allowable of its net taxable income as qualified dividends as provided in the Jobs and Growth Tax Relief Reconciliation Act of 2003. The 2010 Form 1099-DIVs you receive for each Fund will show the tax status of all distributions paid to you during the respective calendar year.
Pursuant to section 852 of the Internal Revenue Code, Tax-Managed, U.S. Equity, Global Alternatives and Global Essentials hereby designate as a capital gain distribution with respect to the taxable year ended October 31, 2010, $0, $0, $0, and $0, respectively, or, if subsequently determined to be different, the net capital gains of such year.
49
Report of Independent Registered Public Accounting Firm
To the Board of Trustees of Managers Trust I and the Shareholders of Managers AMG FQ Tax-Managed U.S. Equity Fund, Managers AMG FQ U.S. Equity Fund, Managers AMG FQ Global Alternatives Fund and Managers AMG FQ Global Essentials Fund:
In our opinion, the accompanying statements of assets and liabilities, including the schedules of portfolio investments, of Managers AMG FQ Tax-Managed U.S. Equity Fund and Managers AMG FQ U.S. Equity Fund, the statements of net assets of Managers AMG FQ Global Alternatives Fund and Managers AMG FQ Global Essentials Fund, and the related statements of operations and of changes in net assets and financial highlights present fairly, in all material respects, the financial position of Managers AMG FQ Tax-Managed U.S. Equity Fund, Managers AMG FQ U.S. Equity Fund, Managers AMG FQ Global Alternatives Fund and Managers AMG FQ Global Essentials Fund (four of the series constituting Managers Trust I, hereafter referred to as the “Funds”) at October 31, 2010, the results of each of their operations for the year then ended, the changes in each of their net assets for each of the two years in the period then ended and the financial highlights for each of the periods indicated, in conformity with accounting principles generally accepted in the United States of America. These financial statements and financial highlights (hereafter referred to as “financial statements”) are the responsibility of the Funds’ management; our responsibility is to express an opinion on these financial statements based on our audits. We conducted our audits of these financial statements in accordance with the standards of the Public Company Accounting Oversight Board (United States). Those standards require that we plan and perform the audit to obtain reasonable assurance about whether the financial statements are free of material misstatement. An audit includes examining, on a test basis, evidence supporting the amounts and disclosures in the financial statements, assessing the accounting principles used and significant estimates made by management, and evaluating the overall financial statement presentation. We believe that our audits, which included confirmation of securities at October 31, 2010 by correspondence with the custodian and brokers, provide a reasonable basis for our opinion.
PricewaterhouseCoopers LLP
Philadelphia, Pennsylvania
December 22, 2010
50
Trustees and Officers
The Trustees and Officers of the Trust, their business addresses, principal occupations for the past five years and dates of birth are listed below. The Trustees provide broad supervision over the affairs of the Trust and the Funds. The Trustees are experienced executives who meet periodically throughout the year to oversee the Funds’ activities, review contractual arrangements with companies that provide services to the Funds, and review the Funds’ performance. Unless otherwise noted, the address of each Trustee or Officer is the address of the Trust: 800 Connecticut Avenue, Norwalk, Connecticut 06854.
There is no stated term of office for Trustees. Trustees serve until their resignation, retirement or removal in accordance with the Trust’s organizational documents and policies adopted by the Board from time to time. The Chairman of the Trustees, President, Treasurer and Secretary of the Trust are elected by the Trustees annually. Other officers hold office at the pleasure of the Trustees.
Independent Trustees
The following Trustees are not “interested persons” of the Trust within the meaning of the 1940 Act:
| | |
Name, Date of Birth, Number of Funds Overseen in Fund Complex* | | Principal Occupation(s) During Past 5 Years and Other Directorships Held by Trustee |
Jack W. Aber, 9/9/37 • Trustee since 2000 • Oversees 38 Funds in Fund Complex | | Professor of Finance, Boston University School of Management (1972-Present); Trustee of Appleton Growth Fund (1 portfolio); Trustee of Third Avenue Trust (5 portfolios); Trustee of Third Avenue Variable Trust (1 portfolio); Trustee of Aston Funds (24 portfolios). |
| |
William E. Chapman, II, 9/23/41 • Independent Chairman • Trustee since 2000 • Oversees 38 Funds in Fund Complex | | President and Owner, Longboat Retirement Planning Solutions (1998-Present); Hewitt Associates, LLC (part time) (provider of Retirement and Investment Education Seminars) (resigned Nov. 2009); Trustee of Bowdoin College (2002-Present); Director of Harding, Loevner Funds, Inc. (6 portfolios); Trustee of Third Avenue Trust (5 portfolios); Trustee of Third Avenue Variable Trust (1 portfolio); Trustee of Aston Funds (24 portfolios). |
| |
Edward J. Kaier, 9/23/45 • Trustee since 2000 • Oversees 38 Funds in Fund Complex | | Attorney at Law and Partner, Teeters Harvey Gilboy & Kaier LLP (2007-Present); Attorney at Law and Partner, Hepburn Willcox Hamilton & Putnam, LLP (1977-2007); Trustee of Third Avenue Trust (5 portfolios); Trustee of Third Avenue Variable Trust (1 portfolio); Trustee of Aston Funds (24 portfolios). |
| |
Steven J. Paggioli, 4/3/50 • Trustee since 2000 • Oversees 38 Funds in Fund Complex | | Consultant (2001-Present); Formerly Executive Vice President and Director, The Wadsworth Group (1986- 2001); Executive Vice President, Secretary and Director, Investment Company Administration, LLC (1990-2001); Vice President, Secretary and Director, First Fund Distributors, Inc. (1991-2001); Trustee, Professionally Managed Portfolios (40 portfolios); Advisory Board Member, Sustainable Growth Advisors, LP; Independent Director, Chase Investment Counsel (2008 – Present); Trustee of Aston Funds (24 portfolios). |
| |
Eric Rakowski, 6/5/58 • Trustee since 2000 • Oversees 38 Funds in Fund Complex | | Professor, University of California at Berkeley School of Law (1990-Present); Director of Harding, Loevner Funds, Inc. (6 portfolios); Trustee of Third Avenue Trust (5 portfolios); Trustee of Third Avenue Variable Trust (1 portfolio); Trustee of Aston Funds (24 portfolios). |
| |
Thomas R. Schneeweis, 5/10/47 • Trustee since 2000 • Oversees 38 Funds in Fund Complex | | Professor of Finance, University of Massachusetts (1977-Present); Director, CISDM at the University of Massachusetts, (1996-Present); President, Alternative Investment Analytics, LLC, (formerly Schneeweis Partners, LLC) (2001-Present); Partner, White Bear Partners, LLC (2007-Present); Partner, Schneeweis Capital Management, LLC (2007-Present); Partner, Schneeweis Associates, LLC (2007-Present); Partner, Northampton Capital Management, LLC (2004-Present); Partner, TRS Associates (2007-Present); Trustee of Aston Funds (24 portfolios). |
Interested Trustees
The following Trustees are “interested persons” of the Trust within the meaning of the 1940 Act. Mr. Dalton is an interested person by virtue of his positions with, and interest in securities of, Affiliated Managers Group, Inc. and his position with Managers Distributors, Inc. Mr. Streur is an interested person by virtue of his positions with Managers Investment Group LLC.
| | |
Name, Date of Birth, Number of Funds Overseen in Fund Complex* | | Principal Occupation(s) During Past 5 Years and Other Directorships Held by Trustee |
Nathaniel Dalton, 9/29/66 • Trustee since 2008 • Oversees 38 Funds in Fund Complex | | Executive Vice President and Chief Operating Officer, Affiliated Managers Group, Inc., (2006-Present); Executive Vice President, Affiliated Managers Group, Inc., (2002 -2006); Executive Vice President and General Counsel, Affiliated Managers Group, Inc. (2001-2002); Senior Vice President and General Counsel, Affiliated Managers Group, Inc. (1996-2001). Director, Managers Distributors, Inc. (2000-Present). |
| |
John H. Streur, 2/6/60 • Trustee since 2008 • President since 2008 • Oversees 38 Funds in Fund Complex | | Senior Managing Partner, Managers Investment Group LLC (2006-Present); President, Managers Distributors, Inc. (2006-Present); Managing Partner, Managers Investment Group LLC (2005-2006); Chief Executive Officer, President and Chief Operating Officer, The Burridge Group LLC (1996-2004). |
| |
Officers | | |
| |
Name, Date of Birth, Position(s) Held with Fund and Length of Time Served | | Principal Occupation(s) During Past 5 Years |
Christine C. Carsman, 4/2/52 • Secretary since 2004 | | Senior Vice President and Chief Regulatory Counsel, Affiliated Managers Group, Inc. (2004-Present); Secretary, The Managers Funds, Managers AMG Funds and Managers Trust II (2004-Present); Senior Counsel, Vice President and Director of Operational Risk Management and Compliance, Wellington Management Company, LLP (1995-2004); Deputy General Counsel, The Boston Company, Inc. (1993-1995); Associate General Counsel, The Boston Company Advisors, Inc. (1991-1993); Associate, Sullivan & Worcester LLP (1987-1991). |
| |
Donald S. Rumery, 5/29/58 • Chief Financial Officer since 2007 • Treasurer since 2000 | | Senior Vice President, Managers Investment Group LLC (2005-Present); Director, Finance and Planning, The Managers Funds LLC, (1994-2004); Treasurer and Chief Financial Officer, Managers Distributors, Inc. (2000-Present); Treasurer, The Managers Funds (1995-Present); Treasurer, Managers AMG Funds (1999-Present); Treasurer, Managers Trust II (2000-Present); Secretary, Managers Trust I and Managers Trust II (2000-2004) and Secretary, The Managers Funds (1997-2004); Chief Financial Officer, The Managers Funds, Managers AMG Funds and Managers Trust II (2007-Present). |
| |
Keitha L. Kinne, 5/16/58 • Chief Operating Officer since 2007 | | Managing Partner and Chief Operating Officer, Managers Investment Group LLC (2007-Present); Chief Operating Officer, The Managers Funds, Managers AMG Funds and Managers Trust II (2007-Present); Chief Investment Officer, Managers Investment Group LLC (2008-Present); Managing Director, Legg Mason & Co., LLC (2006-2007); Managing Director, Citigroup Asset Management (2004- 2006); Senior Vice President, Prudential Investments (1999-2004). |
| |
David Kurzweil, 6/22/74 • Assistant Secretary since 2008 | | Senior Vice President and Associate Counsel, Managers Investment Group LLC (2008-Present); Assistant Secretary, The Managers Funds, Managers Trust II, and Managers AMG Funds (2008-Present); Counsel and Senior Vice President, Lazard Asset Management LLC (2003-2008). |
| * | The Fund Complex consists of Managers AMG Funds, The Managers Funds, Managers Trust I and Managers Trust II. |
51
Annual Renewal of Investment Advisory Agreements
On June 10-11, 2010, the Board of Trustees, including a majority of the Trustees who are not “interested persons” of the Trust (the “Independent Trustees”), approved the Investment Management Agreement with the Investment Manager for each of the Managers AMG FQ U.S. Equity Fund, Managers AMG FQ Tax-Managed U.S. Equity Fund, Managers AMG FQ Global Alternatives Fund and Managers AMG FQ Global Essentials Fund (formerly Managers Fremont Global Fund) (each a “Fund”) and the Subadvisory Agreement with respect to each Fund. The Independent Trustees were separately represented by independent counsel in connection with their consideration of the approval of these agreements. In considering the Investment Management and Subadvisory Agreements, the Trustees reviewed a variety of materials relating to each Fund, the Investment Manager and the Subadvisor, including comparative performance, fee and expense information for an appropriate peer group of similar mutual funds for each Fund (each a “Peer Group”), performance information for the relevant benchmark index for each Fund (each a “Fund Benchmark”) and, with respect to the Subadvisor, comparative performance information for an appropriate peer group of managed accounts, and, as to all other matters, other information provided to them on a periodic basis throughout the year, as well as information provided in connection with the meetings of June 10-11, 2010, regarding the nature, extent and quality of services provided by the Investment Manager and the Subadvisor under their respective agreements. Prior to voting, the Independent Trustees: (a) reviewed the foregoing information with their independent legal counsel and with management; (b) received materials from their independent legal counsel discussing the legal standards applicable to their consideration of the Investment Management and Subadvisory Agreements; and (c) met with their independent legal counsel in private sessions at which no representatives of management were present.
Nature, extent and quality of services
In considering the nature, extent and quality of the services provided by the Investment Manager, the Trustees reviewed information relating to the Investment Manager’s operations and personnel. Among other things, the Investment Manager provided financial information, biographical information on its supervisory and professional staff and descriptions of its organizational and management structure. The Trustees also took into account information provided periodically throughout the previous year by the Investment Manager relating to the performance of its duties with respect to the Funds and the Trustees’ familiarity with the Investment Manager’s management through Board meetings, discussions and reports. In the course of their deliberations regarding the Investment Management Agreement, the Trustees evaluated, among other things: (a) the extent and quality of the Investment Manager’s oversight of the operation and management of the Funds; (b) the quality of the Investment Manager’s oversight of the performance by the Subadvisor of its portfolio management duties; (c) the Investment Manager’s ability to supervise the Funds’ other service providers; and (d) the Investment Manager’s compliance programs. The Trustees also took into account the financial condition of the Investment Manager with respect to its ability to provide the services required under the Investment Management Agreement and the Investment Manager’s undertaking to maintain contractual expense limitations for the Funds.
The Trustees also reviewed information relating to the Subadvisor’s financial condition, operations and personnel and the investment philosophy, strategies and techniques (its “Investment Strategy”) used in managing each Fund. Among other things, the Trustees reviewed biographical information on portfolio management and other professional staff, information regarding the Subadvisor’s organizational and management structure and the Subadvisor’s brokerage policies and practices. The Trustees considered specific information provided regarding the experience of the individuals at the Subadvisor with portfolio management responsibility for the Funds, including the information set forth in each Fund’s prospectus and statement of additional information. In the course of their deliberations, the Trustees evaluated, among other things: (a) the services rendered by the Subadvisor in the past; (b) the qualifications and experience of the Subadvisor’s personnel; and (c) the Sub-advisor’s compliance programs. The Trustees also took into account the financial condition of the Subadvisor with respect to its ability to provide the services required under each Subadvisory Agreement.
Performance.
With respect to the Managers AMG FQ U.S. Equity Fund, among other information related to the Fund’s performance, the Trustees noted that the Fund’s performance for Institutional Class shares for the 1-year, 3-year, 5-year and 10-year periods ended March 31, 2010 was below, below, above and below, respectively, the median performance of the Peer Group and below, below, above and below, respectively, the performance of the Fund Benchmark, the Russell 3000 Index. The Trustees took into account management’s discussion of the Fund’s performance, including the impact of current market conditions on the Fund’s investment style and noted that the the Fund’s longer-term performance has been negatively affected by the past year’s performance. The Trustees also noted that the Institutional Class shares performed in the top quartile relative to the Peer Group for the 5-year period. The Trustees concluded that the Fund’s performance has been satisfactory in light of all factors considered.
With respect to the Managers AMG FQ Tax-Managed U.S. Equity Fund, among other information related to the Fund’s performance, the Trustees noted that the Fund’s performance for Institutional Class shares for the 1-year, 3-year and 5-year periods ended March 31, 2010 and for the period from the Fund’s inception on December 18, 2000 through March 31, 2010 was below, below, above and above, respectively, the median performance of the Peer Group and below, below, below and above, respectively, the performance of the Fund Benchmark, the Russell 3000 Index. The Trustees took into account the impact of current market conditions on the Fund’s investment style and noted that the Fund’s longer-term performance has been negatively affected by the past year’s performance. The Trustees also took into account management’s discussion of the Fund’s performance, including the fact that the Fund’s Institutional Class shares outperformed the Peer Group over the 5-year period and since the Fund’s inception. The Trustees concluded that the Fund’s performance has been satisfactory in light of all factors considered.
52
Annual Renewal of Investment Advisory Agreements (continued)
With respect to the Managers AMG FQ Global Alternatives Fund, among other information related to the Fund’s performance, the Trustees noted that the Fund’s performance for Class A shares for the 1-year and 3-year periods ended March 31, 2010 and for the period from the Fund’s inception on March 30, 2006 through March 31, 2010 was below, above and above, respectively, the median performance of the Peer Group and above the performance of the Fund Benchmark, the Citigroup 1-Month T-Bill Index, for each period. The Trustees took into account management’s discussion of the Fund’s performance, including the fact that the Fund performed well compared to the Fund Benchmark during the last year, with the Class A shares outperforming the Fund Benchmark by more than five percent and also noted the Fund’s more recent performance against the Peer Group. The Trustees concluded that the Fund’s performance was satisfactory.
With respect to the Managers AMG FQ Global Essentials Fund, among other information related to the Fund’s performance, the Trustees noted that the Fund’s performance for Institutional Class shares for the 1-year, 3-year, 5-year and 10-year periods ended March 31, 2010 was above, below, below and below, respectively, the median performance of the Peer Group and above, below, below and below, respectively, the performance of the Fund Benchmark, a Composite Index (60% MSCI World Index and 40% Citigroup World Government Bond Index (Hedged)). The Trustees took into account management’s discussion of the Fund’s more recent performance, including the fact that the Fund outperformed the Fund Benchmark and Peer Group during the past year. The Trustees further noted that the Fund was recently transformed to a single subadvisor portfolio managed by the Subadvisor using a new investment strategy, which improved the Fund’s performance relative to the Peer Group over the past year, placing the Fund in the second quartile for the 1-year period. The Trustees concluded that the Fund’s performance has been satisfactory in light of all factors considered and that the Manager has taken appropriate steps to address the Fund’s performance.
As noted above, the Board considered each Fund’s performance during relevant time periods as compared to the Fund’s Peer Group and considered the Subadvisor’s performance as compared to an appropriate peer group of managed accounts and also considered the gross performance of the Fund as compared to the Subadvisor’s relevant performance composite that utilizes the same investment strategy and approach and noted that the Board reviews on a quarterly basis detailed information about each Fund’s performance results and portfolio composition as well as the Subadvisor’s Investment Strategy. The Board noted the Investment Manager’s expertise and resources in monitoring the performance, investment style and risk-adjusted performance of the Subadvisor. The Board was mindful of the Investment Manager’s attention to monitoring the Subadvisor’s performance with respect to the Funds and its discussions with management regarding the factors that contributed to the performance of the Funds.
Advisory and Subadvisory Fees and Profitability.
In considering the reasonableness of the advisory fee payable to the Investment Manager and the subadvisory fee payable by the Investment Manager to the Subadvisor, the Trustees reviewed information provided by the Investment Manager setting forth all revenues and other benefits, both direct and indirect, received by the Investment Manager and its affiliates attributable to managing each Fund and all the mutual funds in the Managers Family of Funds, the cost of providing such services and the resulting profitability to the Investment Manager and its affiliates from these relationships. With respect to the Managers AMG FQ Global Essentials Fund, the Trustees considered the fact that prior to September 28, 2009, the date on which the Fund implemented a new investment strategy, the Investment Manager had allocated a portion of the Fund’s assets to another fund in the Managers Family of Funds and received direct and indirect benefits from that arrangement. The Trustees noted that the Investment Manager and the Subadvisor are affiliated and that, in the case of the Managers AMG FQ Tax-Managed U.S. Equity Fund and the Managers AMG FQ U.S. Equity Fund, the Investment Manager pays the Subadvisor a subadvisory fee that is equal to the advisory fee that it receives from the Fund. The Trustees also noted management’s discussion of the current asset levels of the Funds, including the effect on assets attributable to the economic and market conditions over the past eighteen months, and considered the impact on profitability of the current asset levels and any future growth of assets of the Funds.
In considering the cost of services to be provided by the Investment Manager under the Investment Management Agreement and the profitability to the Investment Manager of its relationship with the Funds, the Trustees noted the current asset level of the Funds and the undertaking by the Investment Manager to maintain contractual expense limitations for the Funds. The Board also took into account management’s discussion of the current advisory fee structure. Based on the foregoing, the Trustees concluded that the profitability to the Investment Manager is reasonable and that the Investment Manager is not realizing material benefits from economies of scale that would warrant adjustments to the advisory fee at this time. Also with respect to economies of scale, the Trustees noted that as a Fund’s assets increase over time, the Fund may realize other economies of scale to the extent the increase in assets is proportionally greater than the increase in certain other expenses.
In considering the reasonableness of the subadvisory fees payable by the Investment Manager to the Subadvisor, the Trustees reviewed information provided by the Subadvisor regarding the cost of providing subadvisory services to each of the Funds and the resulting profitability to the Subadvisor from these relationships. In considering the cost of services to be provided by the Subadvisor under the Subadvisory Agreements and the profitability to the Subadvisor of its relationship with the Funds, the Trustees noted the current asset
53
Annual Renewal of Investment Advisory Agreements (continued)
level of each Fund and the undertaking by the Investment Manager to maintain contractual expense limitations for the Funds. As a consequence, the cost of services to be provided by the Subadvisor and the profitability to the Subadvisor of its relationship with each Fund were not material factors in the Trustees’ deliberations. For similar reasons, the Trustees did not consider potential economies of scale in the management of the Funds by the Subadvisor to be a material factor in their considerations at this time.
With respect to the Managers AMG FQ U.S. Equity Fund, the Trustees noted that the Fund’s advisory fee and total expenses (net of applicable expense waivers/reimbursements) as of March 31, 2010 were both lower than the average for the Fund’s Peer Group. The Trustees took into account the fact that the Investment Manager has contractually agreed, through March 1, 2011, to limit the Fund’s net annual operating expenses to 1.04%, 1.79% and 0.79% for Class A shares, Class C shares and Institutional Class shares, respectively. The Trustees concluded that, in light of the nature, extent and quality of the services provided by the Investment Manager and the Subadvisor, the foregoing expense limitation and the considerations noted above with respect to the Subadvisor and the Investment Manager, the Fund’s advisory fees are reasonable.
With respect to the Managers AMG FQ Tax-Managed U.S. Equity Fund, the Trustees noted that the Fund’s advisory fee and total expenses (net of applicable expense waivers/reimbursements) as of March 31, 2010 were higher and lower, respectively, than the average for the Fund’s Peer Group. The Trustees took into account the fact that the Investment Manager has contractually agreed, through March 1, 2011, to limit the Fund’s net annual operating expenses to 1.24%, 1.99% and 0.99% for Class A shares, Class C shares and Institutional Class shares, respectively. The Board also took into account the current size of the Fund. The Trustees concluded that, in light of the nature, extent and quality of the services provided by the Investment Manager and the Subadvisor, the foregoing expense limitation and the considerations noted above with respect to the Subadvisor and the Investment Manager, the Fund’s advisory fees are reasonable.
With respect to the Managers AMG FQ Global Alternatives Fund, the Trustees noted that the Fund’s advisory fee and total expenses (net of applicable expense waivers/reimbursements) as of March 31, 2010 were both higher than the average for the Fund’s Peer Group. In this regard, the Trustees noted that because of the Investment Strategy of the Fund, the Peer Group contains a small group of funds, some of which pursue an investment strategy considerably different from that of the Fund. The Trustees took into account the fact that the Investment Manager has contractually agreed, through at least March 1, 2011, to limit the Fund’s net annual operating expenses to 1.49%. The Trustees concluded that, in light of the nature, extent and quality of the services to be provided by the Investment Manager and the Subadvisor, the Fund’s performance, the foregoing expense limitation and the considerations noted above with respect to the Subadvisor and the Investment Manager, the Fund’s advisory fees are reasonable.
With respect to the Managers AMG FQ Global Essentials Fund, the Trustees noted that the Fund’s advisory fee and total expenses (net of applicable expense waivers/reimbursements) as of March 31, 2010 were both lower than the average for the Fund’s Peer Group. The Trustees took into account the fact that the Investment Manager has contractually agreed, through March 1, 2011, to limit the Fund’s net annual operating expenses to 0.99%. The Trustees concluded that, in light of the nature, extent and quality of the services provided by the Investment Manager and the Subadvisor, the foregoing expense limitation and the considerations noted above with respect to the Subadvisor and the Investment Manager, the Fund’s advisory fees are reasonable.
* * * *
After consideration of the foregoing, the Trustees also reached the following conclusions regarding the Investment Management and Subadvisory Agreements in addition to the conclusions discussed above: (a) the Investment Manager has demonstrated that it possesses the resources and capability to perform its duties under the Investment Management Agreement; (b) the Subadvisor has the resources to perform its duties under the Subadvisory Agreements and is qualified to manage each Fund’s assets in accordance with its investment objectives and policies; and (c) the Investment Manager and Subadvisor maintain appropriate compliance programs.
Based on all of the above-mentioned factors and their related conclusions, with no single factor or conclusion being determinative and with each Trustee not necessarily attributing the same weight to each factor, the Trustees concluded that approval of the Investment Management Agreement and each Subadvisory Agreement (as applicable) would be in the best interests of each Fund and its shareholders. Accordingly, on June 10-11, 2010, the Trustees, including a majority of the Independent Trustees, voted to approve the Investment Management and Subadvisory Agreements (as applicable) for each Fund.
54
THIS PAGE INTENTIONALLY LEFT BLANK
Investment Manager and Administrator
Managers Investment Group LLC
333 W. Wacker Drive
Suite 1200
Chicago, IL 60606
(800) 835-3879
Distributor
Managers Distributors, Inc.
333 W. Wacker Drive
Suite 1200
Chicago, IL 60606
(800) 835-3879
Subadvisor
First Quadrant, L.P.
800 E. Colorado Boulevard, Suite 900
Pasadena, CA 91101
Custodian
The Bank of New York Mellon
2 Hanson Place
Brooklyn, New York 11217
Legal Counsel
Ropes & Gray LLP
Prudential Tower, 800 Boylston Street
Boston, Massachusetts 02199-3600
Transfer Agent
BNY Mellon Investment Servicing (US) Inc.*
Attn: Managers
P.O. Box 9769
Providence, Rhode Island 02940
(800) 548-4539
For Managers Choice Only
Managers
c/o BNY Mellon Investment Servicing (US) Inc.*
P.O. Box 9847
Providence, Rhode Island 02940-8047
(800) 358-7668
| * | Formerly PNC Global Investment Servicing (U.S.) Inc. |

MANAGERSAND MANAGERS AMG FUNDS
| | | | |
EQUITY FUNDS | | BALANCED FUNDS |
| CADENCE CAPITAL APPRECIATION | | INTERNATIONAL EQUITY | | CHICAGO EQUITY PARTNERS BALANCED |
| CADENCE FOCUSED GROWTH | | AllianceBernstein L.P. | | Chicago Equity Partners, LLC |
| CADENCE MID-CAP | | Lazard Asset Management, LLC | | |
| CADENCE EMERGING COMPANIES | | Martin Currie Inc. | | |
| Cadence Capital Management, LLC | | | | ALTERNATIVE FUNDS |
| | REAL ESTATE SECURITIES | | FQ GLOBAL ALTERNATIVES |
| CHICAGO EQUITY PARTNERS MID-CAP | | Urdang Securities Management, Inc. | | FQ GLOBAL ESSENTIALS |
| Chicago Equity Partners, LLC | | | | First Quadrant, L.P. |
| | RENAISSANCE LARGE CAP GROWTH | | |
| EMERGING MARKETS EQUITY | | Renaissance Group LLC | | INCOME FUNDS |
| Rexiter Capital Management Limited | | | | BOND (MANAGERS) |
| Schroder Investment Management North America Inc. | | SKYLINE SPECIAL EQUITIES PORTFOLIO | | FIXED INCOME |
| | Skyline Asset Management, L.P. | | GLOBAL BOND |
| ESSEX GROWTH | | | | Loomis, Sayles & Co., L.P. |
| ESSEX LARGE CAP GROWTH | | | | |
| ESSEX SMALL/MICRO CAP GROWTH | | SPECIAL EQUITY | | BOND (MANAGERS PIMCO) |
| Essex Investment Management Co., LLC | | Ranger Investment Management, L.P. | | Pacific Investment Management Co. LLC |
| | Lord, Abbett & Co. LLC | | |
| FQ TAX-MANAGED U.S. EQUITY | | Smith Asset Management Group, L.P. | | CALIFORNIA INTERMEDIATE TAX-FREE |
| FQ U.S. EQUITY | | Federated MDTA LLC | | Miller Tabak Asset Management LLC |
| First Quadrant, L.P. | | | | |
| | SYSTEMATIC VALUE | | GW&K MUNICIPAL BOND |
| FRONTIER SMALL CAP GROWTH | | SYSTEMATIC MID CAP VALUE | | GW&K MUNICIPAL ENHANCED YIELD |
| Frontier Capital Management Company, LLC | | Systematic Financial Management, L.P. | | Gannett Welsh & Kotler, LLC |
| | |
| GW&K SMALL CAP EQUITY | | TIMESSQUARE MID CAP GROWTH | | HIGH YIELD |
| Gannett Welsh & Kotler, LLC | | TIMESSQUARE SMALL CAP GROWTH | | J.P. Morgan Investment Management LLC |
| | TSCM GROWTH EQUITY | | |
| INSTITUTIONAL MICRO-CAP | | TimesSquare Capital Management, LLC | | INTERMEDIATE DURATION GOVERNMENT |
| MICRO-CAP | | | | SHORT DURATION GOVERNMENT |
| Lord, Abbett & Co. LLC | | | | Smith Breeden Associates, Inc. |
| WEDGE Capital Management L.L.P. | | | | |
| Next Century Growth Investors LLC | | | | |
| RBC Global Asset Management (U.S.) Inc. | | | | |
This report is prepared for the Funds’ shareholders. It is authorized for distribution to prospective investors only when preceded or accompanied by an effective prospectus. To receive a free copy of the prospectus or Statement of Additional Information, which includes additional information about Fund Trustees, please contact us by calling 800.835.3879. Distributed by Managers Distributors, Inc., member FINRA.
A description of the policies and procedures each Fund uses to vote its proxies is available: (i) without charge, upon request, by calling 800.835.3879, or (ii) on the Securities and Exchange Commission’s (SEC) Web site at www.sec.gov. For information regarding each Fund’s proxy voting record for the 12-month period ended June 30, call 800.835.3879 or visit the SEC Web site at www.sec.gov.
The Funds file their complete schedule of portfolio holdings with the SEC for the first and third quarters of each fiscal year on Form N-Q. The Funds’ Forms N-Q are available on the SEC’s website at www.sec.gov. A Fund’s Forms N-Q may be reviewed and copied at the SEC’s Public Reference Room in Washington, DC. Information on the operation of the Public Reference Room may be obtained by calling 800.SEC.0330. To review a complete list of the Funds’ portfolio holdings, or to view the most recent quarterly holdings report, semiannual report, or annual report, please visit www.managersinvest.com.

www.managersinvest.com

ANNUAL REPORT
Managers Funds
October 31, 2010
Managers PIMCO Bond Fund
(formerly Managers Fremont Bond Fund)
Managers PIMCO Bond Fund
Annual Report — October 31, 2010
TABLE OF CONTENTS
| | | | |
| | | Page | |
LETTER TO SHAREHOLDERS | | | 1 | |
| |
ABOUT YOUR FUND’S EXPENSES | | | 3 | |
| |
PORTFOLIO MANAGER COMMENTS | | | 4 | |
| |
FUND SNAPSHOT | | | | |
| |
Summary of portfolio credit quality and top ten holdings at October 31, 2010 | | | 7 | |
| |
SCHEDULE OF PORTFOLIO INVESTMENTS | | | 8 | |
| |
FINANCIAL STATEMENTS: | | | | |
| |
Statement of Assets and Liabilities | | | 28 | |
| |
Fund balance sheet, net asset value (NAV) per share computation and cumulative undistributed amount | | | | |
| |
Statement of Operations | | | | |
| |
Detail of sources of income, Fund expenses, and realized and unrealized gains (losses) during the fiscal year | | | 29 | |
| |
Statement of Changes in Net Assets | | | | |
| |
Detail of changes in Fund assets for the past two fiscal years | | | 30 | |
| |
FINANCIAL HIGHLIGHTS | | | | |
| |
Historical net asset values per share, distributions, total returns, expense ratios, turnover ratios and net assets | | | 31 | |
| |
NOTES TO FINANCIAL STATEMENTS | | | | |
| |
Accounting and distribution policies, details of agreements and transactions with Fund management and affiliates, and descriptions of certain investment risks | | | 32 | |
| |
REPORT OF INDEPENDENT REGISTERED PUBLIC ACCOUNTING FIRM | | | 38 | |
| |
TRUSTEES AND OFFICERS | | | 39 | |
| |
ANNUAL RENEWAL OF INVESTMENT ADVISORY AGREEMENT | | | 40 | |
Nothing contained herein is to be considered an offer, sale or solicitation of an offer to buy shares of any series of the Managers Family of Funds. Such offering is made only by Prospectus, which includes details as to offering price and other material information.
Letter to Shareholders
Dear Shareholder:
Our foremost goal at Managers Investment Group (“MIG”) is to structure and manage mutual funds that will help our shareholders and clients successfully reach their investment goals and objectives.
Each of our Funds is geared to provide you with exposure to a specific asset class or style of investing. We believe investors tend to use our Funds as part of their broader portfolio in order to tailor their asset allocation to meet their individual needs. Most of our Funds, like the one detailed in this report, are therefore designed to be building blocks.
At MIG, we have overall responsibility for the investment management and administration of the Funds. As a “manager of managers,” we work with external investment managers that make the day-to-day investment decisions in the Funds (the “Portfolio Managers”). We devote considerable resources to our disciplined process of identifying and selecting unaffiliated Portfolio Managers for the Funds. As a manager of managers, MIG performs many activities to monitor the ongoing investment, compliance, and administrative aspects of all of the Funds, which we believe gives our shareholders added confidence in their investments.
Our parent company, Affiliated Managers Group (“AMG”) is a global asset management company with ownership interests in a diverse group of boutique investment management firms (its “Affiliates”). MIG has the unique opportunity to access the investment skills and acumen of some of AMG’s Affiliates. The set of our Funds managed by these proprietary firms also benefits from our activities to monitor the investment, compliance, and administrative aspects of the Funds.
Below is a brief overview of the securities markets and the performance results for the Fund. Following this letter, we also provide the Portfolio Manager’s discussion of its investment management approach, performance results, and market outlook.
In anticipation of an enduring economic recovery, stocks and bonds posted strong gains over the past twelve months, especially in the U.S. – even after accounting for the weak results experienced during the second quarter when concerns over sovereign debt and the potential collapse of the Euro weighed heavily on the minds of investors. More specifically, riskier assets such as small-cap stocks and high yield bonds were among the performance leaders. After the brief setback during the second quarter, markets resumed their upward paths in the third quarter despite signs that economic growth had slowed, especially in the developed nations. Throughout the third quarter, investor optimism grew in anticipation of the next round of quantitative easing, also known as QE2. Then in mid-October during a speech in Boston, Federal Reserve Chairman Ben Bernanke provided a rather clear signal that the Fed was ready to engage in another round of quantitative easing in order to spur the U.S. economy. The Fed’s plan, while criticized by some well-known market participants, has apparently contributed to renewed strength in risk-based assets. Only time will tell as to whether this plan will achieve the Fed’s objectives.
Against this backdrop, for the one-year period that ended October 31, 2010, the Managers PIMCO Bond Fund (the “Fund”) posted a strong absolute return of 10.52%. This compares favorably on a relative basis as its benchmark, the Barclays Capital U.S. Aggregate Bond Index, posted a return of 8.01% for that same period as detailed further below.
| | | | | | | | | | | | | | | | | | | | | | | | |
Periods Ended 10/31/10 | | 6 Months | | | 1 Year | | | 3 Years | | | 5 Years | | | 10 Years | | | Inception
Date | |
Managers PIMCO Bond Fund | | | 6.17 | % | | | 10.52 | % | | | 9.84 | % | | | 8.02 | % | | | 7.55 | % | | | 4/30/1993 | |
Barclays Capital U.S. Aggregate Bond Index® | | | 5.33 | % | | | 8.01 | % | | | 7.23 | % | | | 6.45 | % | | | 6.38 | % | | | | |
1
Letter to Shareholders (continued)
The Fund’s strong absolute and relative returns for the period are attributable to a number of different strategies. In the latter portion of the fiscal year, the Fund benefited from a duration overweight relative to the benchmark which was successful as rates fell. In addition, the Fund added value via its exposure to high-quality mortgage-backed securities (although the agency MBS exposure in the Fund generally lessened throughout the year as government programs supporting mortgage-backed securities rolled off in early 2010). With corporates, the overweight to bonds of financial companies added mixed results although it began to add value towards the end of the fiscal year as these issues outperformed the broader corporate market. Modest exposure throughout the year to high-quality, emerging-market credits (and their underlying currencies) in Mexico, Brazil, and South Korea also added value. Finally, a focus on short- to intermediate-maturity bonds and a steepening yield curve was generally beneficial to performance throughout the fiscal year.
Looking ahead, we anticipate the Fund will target above-index duration, emphasizing the relatively steep intermediate part of the yield curve. The Fund will look to diversify interest rate exposure to fiscally sound countries. In addition, the Fund will look to set its overall target for agency mortgage exposure near the Index and continue to take advantage of relative value opportunities across mortgage coupons. Within corporates, the Fund will seek compelling risk-adjusted yields where credit profiles are consistent with PIMCO’s New Normal thesis. Finally, the Fund will seek taxable, longer-maturity municipal bonds, such as Build American Bonds, in order to diversify credit risk.
The following report covers the one year period that ended October 31, 2010. Should you have any questions about this report, or if you’d like to receive a prospectus and additional information, including fees and expenses for these or any of the other Funds in our family, please feel free to contact us at 1-800-835-3879, or visit our Web site at www.managersinvest.com. As always, please read the prospectus carefully before you invest or send money.
If you are curious about how you can better diversify your investment program, visit the Knowledge Center on our Web site and view our articles in the investment strategies section. You can rest assured that under all market conditions our team is focused on delivering excellent investment management services for your benefit.
We thank you for your continued confidence and investment in The Managers Funds.
Respectfully,
|
|
| John H. Streur |
Senior Managing Partner Managers Investment Group LLC |
2
About Your Fund’s Expenses
As a shareholder of a Fund, you may incur two types of costs: (1) transaction costs, which may include sales charges (loads) on purchase payments; redemption fees; and exchange fees; and (2) ongoing costs, including management fees; distribution (12b-1) fees; and other Fund expenses. This example is intended to help you understand your ongoing costs (in dollars) of investing in the Fund and to compare these costs with the ongoing costs of investing in other mutual funds. The example is based on $1,000 invested at the beginning of the period and held for the entire period as indicated below.
Actual Expenses
The first line of the following table provides information about the actual account values and actual expenses. You may use the information in this line, together with the amount you invested, to estimate the expenses that you paid over the period. Simply divide your account value by $1,000 (for example, an $8,600 account value divided by $1,000 = 8.6), then multiply the result by the number in the first line under the heading entitled “Expenses Paid During Period” to estimate the expenses you paid on your account during this period.
Hypothetical Example for Comparison Purposes
The second line of the following table provides information about hypothetical account values and hypothetical expenses based on the Fund’s actual expense ratio and an assumed annual rate of return of 5% before expenses, which is not the Fund’s actual return. The hypothetical account values and expenses may not be used to estimate the actual ending account balance or expenses you paid for the period. You may use this information to compare the ongoing costs of investing in the Fund and other funds by comparing this 5% hypothetical example with the 5% hypothetical examples that appear in the shareholder reports of other funds.
Please note that the expenses shown in the table are meant to highlight your ongoing costs only and do not reflect any transactional costs, such as sales charges (loads), redemption fees, or exchange fees. Therefore, the second line of the table is useful in comparing ongoing costs only, and will not help you determine the relative total costs of owning different funds.
| | | | | | | | | | | | | | | | |
Six Months Ended October 31, 2010 | | Expense
Ratio for
the Period | | | Beginning
Account Value
05/01/10 | | | Ending
Account Value
10/31/10 | | | Expenses Paid
During the
Period* | |
Managers PIMCO Bond Fund | | | | | | | | | | | | | | | | |
Based on Actual Fund Return | | | 0.58 | % | | $ | 1,000 | | | $ | 1,062 | | | $ | 3.01 | |
Hypothetical (5% return before expenses) | | | 0.58 | % | | $ | 1,000 | | | $ | 1,022 | | | $ | 2.96 | |
| * | Expenses are equal to the Fund’s annualized expense ratio multiplied by the average account value over the period, multiplied by the number of days in the most recent fiscal half-year (184), then divided by 365. |
3
Managers PIMCO Bond Fund
Portfolio Manager’s Comments
Managers PIMCO Bond Fund seeks to maximize total return consistent with the preservation of capital by investing in debt securities such as corporate, mortgage-backed, international, and government bonds. Normally, the Fund will invest at least 80% of its net assets in these types of bonds.
The Portfolio Manager
Pacific Investment Management Company, LLC
Pacific Investment Management Company, LLC (“PIMCO”), the subadvisor for the Managers PIMCO Bond Fund, was founded in 1971. PIMCO is one of the world’s leading fixed-income managers with expertise and significant resources committed to virtually every sector of the global bond market.
Managers PIMCO Bond Fund is an actively managed, diversified bond fund that focuses on intermediate-term, investment-grade bonds. The universe for the Fund includes all sectors of the bond market: governments, corporate bonds, mortgages, asset-backed securities, money market instruments, and international bonds. The Fund seeks total return consistent with preservation of capital by employing PIMCO’s “Total Return” fixed-income investment philosophy. This philosophy follows three key principles:
| | • | | Major shifts in portfolio strategy are driven by longer term, or secular, trends as opposed to short-term interest rate fluctuations. |
| | • | | Consistent investment performance is achieved by avoiding extreme swings in maturity/duration of a portfolio. |
| | • | | Emphasis is placed on adding value through state-of-the-art tools such as futures, options, and volatility analysis. |
Economic analysis serves as the base for PIMCO’s portfolio strategy. Annually, PIMCO investment professionals conduct a three-day secular forum, where long-term economic and market forces are evaluated and portfolio strategies are set. Each quarter, the team meets to evaluate the current business cycle and develop shorter term forecasts which are used to fine-tune the investment strategy. PIMCO’s fixed-income research efforts focus on identifying relative value and understanding the risks inherent in different portfolio structures, strategies, and bond market sectors. Using proprietary analytics and bottom-up credit analysis, the portfolio managers select individual bonds based on recommendations from sector analysts (who specialize in corporate, mortgage, high yield, government, and international bonds).
The ideal investment exhibits many of the following traits:
| | • | | It allows management to meet its overall portfolio positioning targets. Management typically invests in investment-grade securities but may invest up to 10% of the portfolio in securities that are below investment grade. |
| | • | | The investment has been independently analyzed by PIMCO. PIMCO does not rely solely on the credit ratings assigned by outside credit agencies. |
| | • | | Fund management deems that the security provides value relative to other securities within the same sector. |
Portfolio management:
| | • | | Is committed to seeking value across all bond market sectors. |
| | • | | Actively manages duration exposure, yield-curve position, volatility, sector allocation, and security selection and takes only modest exposures in each of these areas relative to the market. |
| | • | | Normally hedges at least 75% of its foreign currency exposure. |
| | • | | Utilizes derivatives (futures, options, swap agreements) as substitutes for physical securities as a means of gaining more cost-effective exposure. |
The investment team may sell securities when:
| | • | | Securities individually no longer represent relative value. |
| | • | | Fund management makes a shift in its portfolio strategy (change in duration, yield curve positioning, sector strategy, etc.). |
The Year in Review
The U.S. bond market continued to stabilize over the 12 months ended October 31, 2010, due to both prior and ongoing initiatives including the Federal Reserve’s purchase of mortgage and Treasury securities, the Fed’s commitment to hold short-term rates near zero, and government support for consumer finance markets. However, despite substantial levels of fiscal and monetary stimulus by policymakers, unemployment within the U.S. continued to remain stubbornly high. In addition, although housing prices have begun to recover, indicators of future activity have remained unpromising. Ongoing debate remains on whether a deflationary or an inflationary environment awaits us but, at least during this period, the relative weakness in the economy has kept core inflation below the Fed’s long-run preference range.
For the 12 month period ending October 31, 2010, the Managers PIMCO Bond Fund returned 10.5%, compared with 8.0% for its benchmark, the Barclays Capital U.S. Aggregate Bond Index. The Fund’s strong absolute and relative returns for the period are attributable to a number of different strategies. In the latter portion of the fiscal year, the Fund benefited from a duration overweight relative to the benchmark which was successful as rates fell. Duration can be adjusted and managed within the Fund by using derivative contracts such as interest rate futures, where appropriate. In addition, the Fund added value via its exposure to high-quality mortgage-backed securities (although the agency MBS exposure in the Fund generally lessened throughout the year as government programs supporting mortgage-backed securities rolled off in early 2010). With corporates, the overweight to bonds of financial companies added mixed results, although it began to add value towards the end of the fiscal year as these issues outperformed the broader corporate market. Modest exposure throughout the year to high-quality, emerging market credits (and their underlying currencies) in Mexico, Brazil, and South Korea also added value. The Fund currently maintains a portion of this exposure by virtue of writing (i.e., “selling protection”) on credit default swaps, which is a form of a derivative contract that pays a yield and is used to manage the credit exposure of some of these emerging market exposures without actually buying the securities themselves. Finally, a focus on short- to intermediate-maturity bonds and a steepening yield curve was generally beneficial to performance throughout the fiscal year. This curve positioning is managed in the portfolio through exposure to both interest rate swaps and money market derivatives.
4
Managers PIMCO Bond Fund
Portfolio Manager’s Comments (continued)
Looking Forward
PIMCO’s cyclical forecast is consistent with their “New Normal” longer term outlook. PIMCO believes that the most likely outcome will be slow growth well below that of previous, Old Normal recoveries in developed economies alongside faster growth in developing countries. The world is fraught with unusual uncertainty, a wider range of potential outcomes, and higher probabilities of extreme events. While developed economies could snap back at faster rates than PIMCO anticipates, they believe that the probability of a more robust recovery is relatively low. In fact, the risks to PIMCO’s base case forecast are tilted toward the down side, meaning a deflationary scenario and a contraction in growth in the developed world that affects emerging economies as well. Key elements of PIMCO’s outlook include headwinds to growth in the U.S. The U.S. will continue to grind its way out of a balance sheet-induced recession brought on by bubbles of consumer and financial sector leverage. The biggest headwinds to growth will remain household sector deleveraging and reluctance of non-financial businesses to hire and invest despite substantial cash balances and sturdy balance sheets.
| | • | | Old Normal Policies Fall Short — Policies such as fiscal stimulus and quantitative easing by the Federal Reserve that might have boosted aggregate demand in previous recessions will have only a limited effect. There is little political will to continue debt-financed fiscal stimulus even if it were seen as effective. In this environment, it is hard for PIMCO to see how the U.S. economy can muster more than 1.5% to 2% annualized real growth, or see any uptick in inflation from current low levels over the next year. It is also difficult to envision much, if any, upward pressure on already low U.S. interest rates over a cyclical time frame. |
| | • | | Little Help from Other Developed Economies — The outlook for Europe and the U.K. is clouded by the fiscal austerity they are pursuing. The impact is likely to be especially severe in heavily indebted peripheral Eurozone countries. In general, it is expected that the Eurozone will experience weak growth and disinflation, with the outcome likely to be similar in the U.K. though disinflationary pressures there will be more muted. Japan may be the weakest economy in the developed world given its shrinking working age population and consumers’ tepid response to fiscal stimulus and monetary easing. |
| | • | | Emerging Markets to Drive Growth in Multi-Speed World — The main drivers of global growth will continue to be emerging economies, with China at the core but also including major players elsewhere in Asia and Latin America. The immense build out of infrastructure will remain the key variable for China’s growth. Inflation is likely to be higher in China and other emerging economies than in the developed world, though to date China has been able to limit overheating and asset price bubbles. A cautionary note is emerging economies’ trade and financial linkages with the developed world, which will remain strong enough to make the emerging block vulnerable to a deflation/depression scenario in the developed world. |
Investors face a changed landscape as the prospect of continued low yields across a cyclical time frame makes generating outperformance more challenging. Against this backdrop PIMCO will focus on strategies that offer relatively high real yields and high-quality “spread” or income in excess of that available from low Treasury yields. PIMCO’s planned investment strategies include:
| | • | | Interest Rate Strategies — PIMCO will target longer-than-index duration with the overweight concentrated on the relatively steep intermediate portion of the yield curve. This approach offers the potential to enhance returns via the effects of “roll down,” or the maturing of fixed-income securities along the steeper part of the curve. PIMCO may also look to diversify interest rate exposure to fiscally sound countries such as Canada, where rates have moved higher but we believe are unlikely to see further upward pressure. |
| | • | | Focus on Security Selection in the Mortgage Sector — PIMCO has generally been reducing its underweight to Agency mortgages over the past quarter. Mortgages can be a source of high quality yield for portfolios but also present refinancing risks. PIMCO’s overall target for mortgage exposure will, therefore, be neutral to the index. PIMCO will continue to take advantage of relative value opportunities across mortgage coupons. PIMCO will also hold non-Agency mortgages and commercial mortgage-backed securities (CMBS) that have senior positions in the capital structure and are another source of attractive yields. |
| | • | | Corporate Bonds — PIMCO will look to add value in a number of corporate sectors that offer compelling risk adjusted yields and where credit profiles are consistent with their New Normal thesis. These may include: senior bonds of banks, where credit quality should ultimately be strengthened by reregulation and higher capital requirements; bonds of noncyclical, defensive, and asset-rich companies in the pipeline and cable sectors, which should outperform bonds of more highly leveraged and recession-sensitive companies; secured bonds of airlines, which are expected to benefit from stronger cash flows and deleveraging; and, lastly, corporate and quasi-sovereign bonds in more rapidly growing emerging markets, especially in infrastructure-related sectors such as transportation, energy, and metals and mining. |
| | • | | Emerging Markets and Currency — As previously mentioned, PIMCO plans to emphasize corporate and quasi-sovereign bonds in high-quality countries such as Brazil, Mexico, and Russia, which should benefit from relatively strong growth in their economies and from their sound credit fundamentals. PIMCO will also take exposure to local interest rates in Brazil, where yields remain relatively high. PIMCO will take modest currency exposure, focused mainly on the Chinese Renminbi and a basket of other Asian currencies. These currencies have the potential to gain versus the U.S. Dollar due to productivity differentials with the developed world. They should also benefit if China’s currency continues to depreciate. |
| | • | | Municipals and TIPS — In the municipal sector PIMCO will continue to favor longer maturity taxable issues, especially Build America Bonds (BABs). Valuations remain attractive for BABs, which are a useful means of diversifying credit risk. PIMCO will take modest exposure to TIPS as their valuations compared to nominal bonds are relatively attractive after adjusting for TIPS’ lower expected volatility. |
5
Managers PIMCO Bond Fund
Portfolio Manager’s Comments (continued)
Cumulative Total Return Performance
The Fund’s cumulative total return is based on the daily change in net asset value (NAV), and assumes that all distributions were reinvested. The Barclays Capital U.S. Aggregate Bond Index® is an index of the U.S. investment grade fixed-rate bond market, including both government and corporate bonds. Unlike the Fund, the Barclays Capital U.S. Aggregate Bond Index® is unmanaged, is not available to investment, and does not incur expenses. The chart illustrates the performance of a hypothetical $10,000 investment made in the Managers PIMCO Bond Fund on October 31, 2000, to a $10,000 investment made in the Barclays Capital U.S. Aggregate Bond Index® for the same time period. The graph and table do not reflect the deduction of taxes that a shareholder would pay on a Fund distribution or redemption of shares. The listed returns for the Fund are net of expenses and the returns for the index exclude expenses. Total returns for the Fund would have been lower had certain expenses not been reduced.
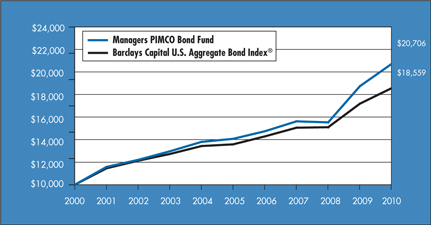
The table below shows the average annual total returns for the Managers PIMCO Bond Fund and the Barclays Capital U.S. Aggregate Bond Index® from October 31, 2000 through October 31, 2010.
| | | | | | | | | | | | |
Average Annualized Total Returns1 | | One Year | | | Five Years | | | Ten Years | |
Managers PIMCO Bond Fund2,3,4,5,6,7 | | | 10.52 | % | | | 8.02 | % | | | 7.55 | % |
Barclays Capital U.S. Aggregate Bond Index®8 | | | 8.01 | % | | | 6.45 | % | | | 6.38 | % |
The performance data shown represents past performance. Past performance is not a guarantee of future results. Current performance may be lower or higher than the performance data quoted. The investment return and principal value of an investment in the Fund will fluctuate so that an investor’s shares, when redeemed, may be worth more or less than their original cost. For performance information through the most recent month end, please call (800) 835-3879 or visit our Web site at www.managersinvest.com.
In choosing a Fund, investors should carefully consider the amount they plan to invest, their investment objectives, the Fund’s investment objectives, risks, charges and expenses before investing. For this and other information, please call (800) 835-3879 or visit www.managersinvest.com for a free prospectus. Read it carefully before investing or sending money. Distributed by Managers Distributors, Inc., member FINRA.
| 1 | Total return equals income yield plus share price change and assumes reinvestment of all dividends and capital gain distributions. Returns are net of fees and may reflect offsets of Fund expenses as described in the Prospectus. No adjustment has been made for taxes payable by shareholders on their reinvested dividends and capital gain distributions. Returns for periods greater than one year are the average annual return. The listed returns on the Fund are net of expenses and based on the published NAV as of October 31, 2010. All returns are in U.S. dollars($). |
| 2 | Fund for which, from time to time, the advisor has waived its fees and/or absorbed Fund expenses, which has resulted in higher returns. |
| 3 | The Fund is subject to the risks associated with investments in debt securities, such as default risk and fluctuations in the perception of the debtors’ ability to pay their creditors. Changing interest rates may adversely affect the value of an investment. An increase in interest rates typically causes the value of bonds and other fixed-income securities to fall. |
| 4 | The Fund may use derivative instruments for hedging purposes or as part of its investment strategy. There is a risk that a derivative intended as a hedge may not perform as expected. The main risk with derivatives is that some types can amplify a gain or loss, potentially earning or losing substantially more money than the actual cost of the derivative; or that the counterparty may fail to honor its contract terms, causing a loss for the Fund. Use of these instruments may also involve certain costs and risks such as liquidity risk, interest rate risk, market risk, credit risk, management risk, and the risk that a fund could not close out a position when it would be most advantageous to do so. |
| 5 | Investments in international securities are subject to certain risks of overseas investing including currency fluctuations and changes in political and economic conditions, which could result in significant market fluctuations. These risks are magnified in emerging markets. |
| 6 | High yield bonds (also known as “junk bonds”) are subject to additional risks such as the risk of default. |
| 7 | Many bonds have call provisions which allow the debtors to pay them back before maturity. This is especially true with mortgage securities, which can be paid back any time. Typically debtors prepay their debt when it is to their advantage (when interest rates drop making a new loan at current rates more attractive), and thus likely to the disadvantage of bondholders, who may have to reinvest prepayment proceeds in securities with lower yields. Prepayment risk will vary depending on the provisions of the security and current interest rates relative to the interest rate of the debt. |
| 8 | The Barclays Capital U.S. Aggregate Bond Index is an index of the U.S. investment-grade fixed-rate bond market, including both government and corporate bonds. Unlike the Fund, the Barclays Capital U.S. Aggregate Bond Index is unmanaged, is not available for investment, and does not incur expenses. |
Not FDIC insured, nor bank guaranteed. May lose value.
6
Managers PIMCO Bond Fund
Fund Snapshot
October 31, 2010
Portfolio Breakdown
| | | | | | | | |
Rating | | Managers
PIMCO Bond Fund** | | | Barclays Capital U.S.
Aggregate Bond Index® | |
U.S. Treasury & Agency | | | 63.0 | % | | | 73.4 | % |
Aaa | | | 12.3 | % | | | 4.5 | % |
Aa | | | 8.7 | % | | | 4.3 | % |
A | | | 9.0 | % | | | 9.8 | % |
Baa | | | 3.0 | % | | | 8.0 | % |
Ba & lower | | | 4.0 | % | | | 0.0 | % |
| ** | As a percentage of net assets |
Top Ten Holdings
| | | | |
Security Name | | Percentage
of Net Assets | |
U.S. Treasury Notes, 0.500%, 10/15/13 | | | 9.8 | % |
FNMA, 4.500%, TBA | | | 8.3 | |
FNMA, 4.000%, TBA | | | 4.5 | |
TD Securities LLC, dated 10/28/10, due 11/01/10, 0.23%, total to be received $39,600,759 (secured by $40,750,154 U.S. Treasury Bonds, 6.125%, 11/15/27) | | | 2.8 | |
U.S. Treasury Notes, 2.500%, 06/30/17 | | | 2.7 | |
FNMA, 5.000%, 11/13/33 | | | 2.5 | |
U.S. Treasury Notes, 1.875%, 09/30/17 | | | 2.5 | |
FNMA, 0.750%, 12/18/13 | | | 2.5 | |
U.S. Treasury Notes, 0.750%, 09/15/13 | | | 2.3 | |
FHLMC 5.500%, TBA* | | | 2.3 | |
| | | | |
Top Ten as a Group | | | 40.2 | % |
| | | | |
| * | Top Ten Holding at April 30, 2010 |
Any sectors, industries, or securities discussed should not be perceived as investment recommendations. Mention of a specific security should not be considered a recommendation to buy or solicitation to sell that security. Specific securities mentioned in this report may have been sold from the Fund’s portfolio of investments by the time you receive this report.
7
Managers PIMCO Bond Fund
Schedule of Portfolio Investments
October 31, 2010
| | | | | | | | |
| | | Principal Amount | | | Value | |
Corporate Bonds - 30.6% | | | | | | | | |
Financials - 23.5% | | | | | | | | |
Allstate Life Global Funding Trusts, 5.375%, 04/30/13 | | $ | 1,600,000 | | | $ | 1,771,595 | |
Ally Financial, Inc., 7.500%, 09/15/20 (a) | | | 1,100,000 | | | | 1,193,500 | |
American Express Co., 7.000%, 03/19/18 | | | 1,000,000 | | | | 1,202,931 | |
American Express Travel Related Services Co., Inc., Series EMTN, 0.454%, 06/01/11, (12/01/10)4 | | | 900,000 | | | | 893,948 | |
American General Finance Corp., 4.125%, 11/29/13 | | EUR | 3,900,000 | | | | 4,659,059 | |
American General Finance Corp., Series MTN, 0.649%, 08/17/11, (11/17/10)4 | | | 10,900,000 | | | | 10,325,952 | |
American General Finance Corp., Term Loan, 7.250%, 04/21/15 | | | 1,200,000 | | | | 1,213,219 | |
American International Group, Inc., 5.050%, 10/01/15 | | | 400,000 | | | | 420,600 | |
American International Group, Inc., 8.250%, 08/15/18 | | | 4,500,000 | | | | 5,394,375 | |
American International Group, Inc., Series MTN, Series G, 5.850%, 01/16/18 | | | 400,000 | | | | 425,000 | |
ANZ National International, Ltd., 6.200%, 07/19/13 (a) | | | 1,800,000 | | | | 2,013,773 | |
Australia and New Zealand Banking Group, Ltd., 3.200%, 12/15/11 (a) | | | 19,000,000 | 2 | | | 19,567,663 | |
Banco Santander Chile, 1.539%, 04/20/12, (01/20/11) (a)4 | | | 2,200,000 | | | | 2,200,167 | |
Bank of America Corp., 4.500%, 04/01/15 | | | 10,000,000 | | | | 10,424,050 | |
Bank of America Corp., 6.000%, 10/15/36 | | | 900,000 | | | | 862,906 | |
Bank of America Corp., 6.500%, 08/01/16 | | | 2,800,000 | | | | 3,126,012 | |
Bank of China (Hong Kong), Ltd., 5.550%, 02/11/20 (a) | | | 400,000 | 2 | | | 423,774 | |
Bank of Montreal, 2.850%, 06/09/15 (a) | | | 800,000 | | | | 846,470 | |
Bank of Nova Scotia, The, 1.650%, 10/29/15 (a) | | | 900,000 | | | | 898,643 | |
Barclays Bank PLC, 5.450%, 09/12/12 | | | 17,300,000 | | | | 18,756,608 | |
Bear Stearns Companies, Inc., The, 6.950%, 08/10/12 | | | 5,800,000 | | | | 6,401,321 | |
C10 Capital SPV, Ltd., 6.722%, 12/31/49 (a)5,6 | | | 1,500,000 | | | | 1,048,376 | |
CIT Group, Inc., 7.000%, 05/01/13 | | | 493,177 | | | | 501,808 | |
CIT Group, Inc., 7.000%, 05/01/14 | | | 989,765 | 2 | | | 999,663 | |
CIT Group, Inc., 7.000%, 05/01/15 | | | 289,765 | | | | 290,852 | |
CIT Group, Inc., 7.000%, 05/01/16 | | | 482,942 | | | | 483,546 | |
CIT Group, Inc., 7.000%, 05/01/17 | | | 676,120 | | | | 676,120 | |
CIT Group, Inc., Term Loan 3-DD, 6.250%, 08/11/15 | | | 497,352 | | | | 506,625 | |
Citigroup Capital XXI, 8.300%, 12/21/575 | | | 1,200,000 | | | | 1,261,500 | |
Citigroup, Inc., 2.384%, 08/13/13, (11/15/10)4 | | | 1,100,000 | | | | 1,109,825 | |
Citigroup, Inc., 5.300%, 10/17/12 | | | 200,000 | | | | 213,295 | |
Citigroup, Inc., 5.500%, 08/27/12 | | | 500,000 | | | | 534,734 | |
Citigroup, Inc., 5.500%, 10/15/14 | | | 5,800,000 | | | | 6,347,955 | |
Citigroup, Inc., 5.625%, 08/27/12 | | | 1,300,000 | | | | 1,375,631 | |
Citigroup, Inc., 5.850%, 07/02/13 | | | 100,000 | | | | 108,733 | |
Citigroup, Inc., 6.000%, 08/15/17 | | | 4,200,000 | | | | 4,636,951 | |
Citigroup, Inc., 6.125%, 05/15/18 | | | 800,000 | | | | 893,458 | |
Citigroup, Inc., 6.125%, 08/25/36 | | | 4,200,000 | | | | 4,072,589 | |
Citigroup, Inc., 8.125%, 07/15/39 | | | 600,000 | | | | 757,272 | |
The accompanying notes are an integral part of these financial statements.
8
Managers PIMCO Bond Fund
Schedule of Portfolio Investments (continued)
| | | | | | | | |
| | | Principal Amount | | | Value | |
Financials - 23.5% (continued) | | | | | | | | |
Citigroup, Inc., 8.500%, 05/22/19 | | $ | 100,000 | | | $ | 125,768 | |
Citigroup, Inc., Series EMTN, Class B, 3.625%, 11/30/175 | | EUR | 3,800,000 | | | | 5,099,412 | |
Commonwealth Bank of Australia, 0.709%, 07/12/13, (01/12/11) (a)4 | | | 7,500,000 | | | | 7,545,300 | |
Danske Bank A/S, 2.500%, 05/10/12 (a) | | | 1,200,000 | | | | 1,229,106 | |
Deutsche Bank AG London, 6.000%, 09/01/17 | | | 5,000,000 | | | | 5,839,960 | |
Dexia Credit Local, 0.768%, 04/26/14, (01/31/11) (a)4 | | | 4,100,000 | | | | 4,087,663 | |
Ford Motor Credit Company LLC, 3.039%, 01/13/12, (01 /13/11)4 | | | 2,200,000 | | | | 2,222,110 | |
Ford Motor Credit Company LLC, 7.250%, 10/25/11 | | | 200,000 | | | | 209,994 | |
Ford Motor Credit Company LLC, 7.375%, 02/01/11 | | | 300,000 | | | | 304,229 | |
Ford Motor Credit Company LLC, 7.800%, 06/01/12 | | | 2,200,000 | | | | 2,372,082 | |
Ford Motor Credit Company LLC, 8.625%, 11/01/10 | | | 700,000 | | | | 700,000 | |
Ford Motor Credit Company LLC, 8.700%, 10/01/14 | | | 500,000 | | | | 575,784 | |
Fortis Bank Nederland Holding N.V., 3.000%, 04/17/12 | | EUR | 200,000 | | | | 285,075 | |
General Electric, 0.490%, 01/08/16, (01/10/11)4 | | | 700,000 | | | | 657,864 | |
General Electric Capital Corp., 5.500%, 09/15/67 (a)5 | | EUR | 5,500,000 | | | | 6,889,449 | |
General Electric Capital Corp., 5.875%, 01/14/38 | | | 2,300,000 | | | | 2,347,053 | |
GMAC, Inc., 7.250%, 03/02/11 | | | 4,475,000 | | | | 4,558,906 | |
GMAC, Inc., 7.500%, 12/31/13 | | | 1,500,000 | | | | 1,620,000 | |
GMAC, Inc., 8.300%, 02/12/15 (a) | | | 800,000 | | | | 874,000 | |
GMAC LLC, 6.000%, 12/15/11 | | | 400,000 | 2 | | | 408,202 | |
GMAC LLC, 6.875%, 09/15/11 | | | 600,000 | | | | 617,210 | |
Goldman Sachs Group, Inc., 5.950%, 01/18/18 | | | 4,800,000 | | | | 5,342,098 | |
Goldman Sachs Group, Inc., 6.150%, 04/01/18 | | | 2,000,000 | | | | 2,242,878 | |
Goldman Sachs Group, Inc., 6.250%, 09/01/17 | | | 3,200,000 | | | | 3,621,178 | |
Groupe BPCE SA, 2.375%, 10/04/13 (a) | | | 400,000 | | | | 403,560 | |
HSBC Holdings PLC, 6.500%, 05/02/36 | | | 800,000 | | | | 857,354 | |
HSBC Holdings PLC, 6.500%, 09/15/37 | | | 900,000 | | | | 969,216 | |
ING Bank NV, 1.089%, 03/30/12, (12/30/10) (a)4 | | | 10,800,000 | | | | 10,768,550 | |
International Lease Finance Corp., 1.274%, 08/15/11, (11/15/10)4 | | EUR | 3,900,000 | | | | 5,304,763 | |
International Lease Finance Corp., 5.875%, 05/01/13 | | | 400,000 | | | | 409,500 | |
International Lease Finance Corp., 6.375%, 03/25/13 | | | 400,000 | | | | 414,000 | |
International Lease Finance Corp., 6.750%, 09/01/16 (a) | | | 800,000 | | | | 876,000 | |
International Lease Finance Corp., Series MTN, 5.250%, 01/10/13 | | | 400,000 | 2 | | | 405,500 | |
International Lease Finance Corp., Series MTN, 5.400%, 02/15/12 | | | 1,500,000 | | | | 1,533,750 | |
International Lease Finance Corp., Series MTN, 5.450%, 03/24/11 | | | 2,500,000 | | | | 2,525,000 | |
JPMorgan Chase & Co., 6.000%, 01/15/18 | | | 1,600,000 | | | | 1,829,091 | |
JPMorgan Chase & Co., Series EMTN, 1.128%, 09/26/13, (12/29/10)4 | | EUR | 200,000 | | | | 271,670 | |
JPMorgan Chase Bank, NA, 0.623%, 06/13/16, (12/13/10)4 | | | 1,300,000 | | | | 1,224,684 | |
JPMorgan Chase Bank, NA, 6.000%, 10/01/17 | | | 4,500,000 | | | | 5,128,623 | |
JPMorgan Chase Capital, 6.550%, 09/29/36 | | | 400,000 | | | | 389,183 | |
Korea Development Bank, The, 4.375%, 08/10/15 | | | 3,500,000 | | | | 3,772,454 | |
The accompanying notes are an integral part of these financial statements.
9
Managers PIMCO Bond Fund
Schedule of Portfolio Investments (continued)
| | | | | | | | |
| | | Principal Amount | | | Value | |
Financials - 23.5% (continued) | | | | | | | | |
LeasePlan Corp. N.V., 3.125%, 02/10/12 | | $ | 1,300,000 | | | $ | 1,849,691 | |
Lehman Brothers Holdings, Inc., 0.000%, 10/22/08*8,9 | | EUR | 3,900,000 | | | | 848,250 | |
Lehman Brothers Holdings, Inc., 0.000%, 12/23/08*8,9 | | | 200,000 | | | | 43,500 | |
Lehman Brothers Holdings, Inc., 0.000%, 04/03/09*8,9 | | | 4,700,000 | | | | 1,022,250 | |
Lehman Brothers Holdings, Inc., 0.000%, 11/16/09*8,9 | | | 1,200,000 | | | | 261,000 | |
Lehman Brothers Holdings, Inc., 0.000%, 05/25/10*8,9 | | | 1,000,000 | | | | 217,500 | |
Lehman Brothers Holdings, Inc., 0.000%, 07/18/11*8,9 | | | 1,700,000 | | | | 369,750 | |
Lehman Brothers Holdings, Inc., 0.000%, 01/24/13*8,9 | | | 2,000,000 | | | | 457,500 | |
Lehman Brothers Holdings, Inc., 0.000%, 05/02/18*8,9 | | | 600,000 | | | | 140,250 | |
Lloyds Banking Group Capital No. 1 PLC, 8.500%, 12/29/49 (a)5,6 | | | 400,000 | | | | 376,000 | |
Lloyds TSB Bank PLC, 6.350%, 10/29/495,6 | | EUR | 1,800,000 | | | | 2,354,939 | |
Merrill Lynch & Co., Inc., 6.400%, 08/28/17 | | | 3,400,000 | | | | 3,709,529 | |
MetLife Global Funding, 0.689%, 07/13/11, (01/13/11) (a)4 | | | 7,000,000 | | | | 7,011,634 | |
Metlife, Inc., 6.400%, 12/15/36 | | | 800,000 | | | | 788,000 | |
Morgan Stanley, 5.950%, 12/28/17 | | | 1,800,000 | | | | 1,951,214 | |
Morgan Stanley, 6.250%, 08/28/17 | | | 1,000,000 | | | | 1,104,627 | |
Morgan Stanley, Series GMTN, 2.876%, 05/14/13, (11/15/10)4 | | | 1,400,000 | | | | 1,434,600 | |
MUFG Capital Finance, Ltd., 6.299%, 07/29/495,6 | | GBP | 400,000 | | | | 613,191 | |
National Australia Bank, Ltd., 5.350%, 6/12/13 (a) | | | 1,500,000 | | | | 1,648,048 | |
Nationwide Building Society, 6.250%, 02/25/20 (a) | | | 1,800,000 | | | | 1,981,337 | |
Pacific LifeCorp, 6.000%, 02/10/20 (a) | | | 400,000 | | | | 429,645 | |
Petroleum Export Ltd., 5.265%, 06/15/11 (a) | | | 80,852 | | | | 80,733 | |
Principal Life Income Funding Trust, 5.300%, 04/24/13 | | | 1,500,000 | 2 | | | 1,647,798 | |
Principal Life Income Funding Trust, 5.550%, 04/27/15 | | | 2,300,000 | | | | 2,548,977 | |
Qatari Diar Finance Q.S.C., 3.500%, 07/21/15 | | | 900,000 | | | | 918,450 | |
Resona Bank Ltd., 5.850%, 04/15/49 (a)5,6 | | | 500,000 | | | | 497,212 | |
Royal Bank of Scotland Group PLC, 0.784%, 04/08/11, (11/15/10) (a)4 | | | 3,700,000 | | | | 3,702,235 | |
Royal Bank of Scotland Group PLC, 1.450%, 10/20/11 (a) | | | 4,200,000 | | | | 4,236,490 | |
Royal Bank of Scotland Group PLC, 2.625%, 05/11/12 (a) | | | 2,500,000 | | | | 2,553,078 | |
Royal Bank of Scotland Group PLC, 3.000%, 12/09/11 (a) | | | 4,000,000 | | | | 4,104,052 | |
Royal Bank of Scotland Group PLC, 3.950%, 09/21/15 | | | 900,000 | | | | 928,335 | |
Royal Bank of Scotland Group PLC, 4.875%, 08/25/14 (a) | | | 200,000 | | | | 214,244 | |
Royal Bank of Scotland Group PLC, 6.990%, 10/29/49 (a)6 | | | 2,600,000 | | | | 2,148,250 | |
Santander SA US Debt Unipersonal, 1.089%, 03/30/12, (12/30/10) (a)4 | | | 8,100,000 | | | | 7,996,684 | |
Santander SA US Debt Unipersonal, 2.991%, 10/07/13 (a) | | | 3,700,000 | | | | 3,724,897 | |
SLM Corp., 0.492%, 03/15/11, (12/15/10)4 | | | 4,500,000 | | | | 4,466,074 | |
SLM Corp., EMTN, Series 21, 3.125%, 09/17/12 | | EUR | 1,100,000 | | | | 1,478,125 | |
State Bank of India, 4.500%, 07/27/15 (a) | | | 2,900,000 | 2 | | | 3,031,190 | |
State Street Capital, 1.292%, 06/15/37, (12/15/10)4 | | | 300,000 | | | | 222,796 | |
State Street Capital Trust III, 8.250%, 03/15/425,6 | | | 2,000,000 | | | | 2,037,700 | |
Swedbank AB, 3.625%, 12/02/11 | | EUR | 200,000 | | | | 284,585 | |
The accompanying notes are an integral part of these financial statements.
10
Managers PIMCO Bond Fund
Schedule of Portfolio Investments (continued)
| | | | | | | | |
| | | Principal Amount | | | Value | |
Financials - 23.5% (continued) | | | | | | | | |
Temasek Financial I, Ltd., 4.300%, 10/25/19 (a) | | $ | 900,000 | | | $ | 977,157 | |
TNK- BP Finance SA, 6.125%, 03/20/12 (a) | | | 400,000 | | | | 419,000 | |
TransCapitalInvest, Ltd., 8.700%, 08/07/18 (a) | | | 600,000 | | | | 755,435 | |
UBSAG, 5.750%, 04/25/18 | | | 1,300,000 | | | | 1,476,831 | |
UBS AG, 5.875%, 12/20/17 | | | 1,400,000 | | | | 1,607,116 | |
UBS AG, Series MTN, 1.439%, 02/23/12, (11/23/10)4 | | | 1,700,000 | | | | 1,714,069 | |
USB Capital IX, 6.189%, 03/29/495,6 | | | 300,000 | | | | 238,500 | |
Wachovia Corp., 0.419%, 10/15/11, (01/18/11)4 | | | 3,500,000 | | | | 3,503,392 | |
Wachovia Corp., 5.750%, 02/01/18 | | | 4,400,000 | | | | 5,000,301 | |
Wachovia Corp., Series MTN, 0.477%, 08/01/13, (02/01/11)4 | | | 300,000 | | | | 295,340 | |
Wells Fargo & Co., Series K, 7.980%, 02/28/495,6 | | | 21,200,000 | | | | 22,366,000 | |
Westpac Banking Corp., 3.585%, 08/14/14 (a) | | | 5,400,000 | | | | 5,816,972 | |
Total Financials | | | | | | | 335,303,191 | |
Industrials - 6.3% | | | | | | | | |
Altria Group, Inc., 4.125%, 09/11/15 | | | 1,200,000 | | | | 1,297,357 | |
Amgen, Inc., 6.150%, 06/01/18 | | | 4,900,000 | | | | 5,955,534 | |
AstraZeneca PLC, 5.900%, 09/15/17 | | | 800,000 | | | | 958,946 | |
AstraZeneca PLC, 6.450%, 09/15/37 | | | 700,000 | | | | 857,205 | |
AT&T, Inc., 4.950%, 01/15/13 | | | 1,700,000 | | | | 1,847,364 | |
AT&T, Inc., 5.500%, 02/01/18 | | | 1,700,000 | | | | 1,982,144 | |
AT&T, Inc., 6.300%, 01/15/38 | | | 1,200,000 | | | | 1,325,095 | |
Chesapeake Energy Corp., 2.250%, 12/15/3814 | | | 400,000 | | | | 306,500 | |
Codelco, Inc., 6.150%, 10/24/36 (a) | | | 300,000 | | | | 343,310 | |
Comcast Corp., 5.875%, 02/15/18 | | | 600,000 | | | | 694,263 | |
Comcast Corp., 6.450%, 03/15/37 | | | 600,000 | | | | 661,657 | |
Corp Nacional del Cobre de Chile, 7.500%, 01/15/19 (a) | | | 1,500,000 | | | | 1,898,170 | |
Corporacion Geo S.A.B. de C.V., 8.875%, 09/25/14 (a) | | | 3,000,000 | | | | 3,401,250 | |
GAZ Capital, 6.212%, 11/22/16 (a) | | | 400,000 | | | | 426,500 | |
GAZ Capital, 8.625%, 04/28/34 | | | 5,500,000 | | | | 6,847,500 | |
Gerdau, S.A., 5.750%, 01/30/21 (a) | | | 400,000 | 2 | | | 414,458 | |
IBM Corp., 5.700%, 09/14/17 | | | 9,000,000 | | | | 10,766,889 | |
NGPL Pipeco LLC, 6.514%, 12/15/12 (a) | | | 1,800,000 | | | | 1,943,033 | |
Noble Group, 4.875%, 08/15/15 (a) | | | 1,000,000 | | | | 1,059,075 | |
Peabody Energy Corp., 7.875%, 11/01/26 | | | 700,000 | | | | 794,500 | |
Petrobras International Finance Co., 5.875%, 03/01/18 | | | 2,300,000 | | | | 2,583,857 | |
Petroleos Mexicanos, 8.000%, 05/03/19 | | | 5,100,000 | | | | 6,579,510 | |
Philip Morris International, Inc., 5.650%, 05/16/18 | | | 1,000,000 | | | | 1,183,022 | |
Qtel International Finance, Ltd., 4.750%, 02/16/21 (a) | | | 200,000 | | | | 198,797 | |
Qwest Capital Funding, Inc., 7.250%, 02/15/11 | | | 1,813,000 | | | | 1,842,461 | |
Ras Laffan Liquefied Natural Gas Co., Ltd., 5.298%, 09/30/20 (a) | | | 865,170 | | | | 940,535 | |
Rohm & Haas Holdings, 6.000%, 09/15/17 | | | 1,100,000 | | | | 1,232,084 | |
The accompanying notes are an integral part of these financial statements.
11
Managers PIMCO Bond Fund
Schedule of Portfolio Investments (continued)
| | | | | | | | |
| | | Principal Amount | | | Value | |
Industrials - 6.3% (continued) | | | | | | | | |
Shell International Finance, B.V., 5.500%, 03/25/40 | | $ | 600,000 | | | $ | 663,539 | |
Sonat, Inc., 7.625%, 07/15/11 | | | 1,300,000 | | | | 1,354,239 | |
Sydney Airport Finance Co., Proprietary Ltd., 5.125%, 02/22/21 (a) | | | 300,000 | | | | 304,684 | |
Tennessee Gas Pipeline Co., 7.000%, 10/15/28 | | | 6,145,000 | | | | 6,601,690 | |
Time Warner, Inc., 5.875%, 11/15/16 | | | 1,200,000 | | | | 1,409,561 | |
Total Capital SA, 4.450%, 06/24/20 | | | 500,000 | | | | 547,613 | |
Transocean, Inc., Series B, 1.500%, 12/15/3714 | | | 6,800,000 | 2 | | | 6,698,000 | |
United Airlines, Inc., 10.400%, 11/01/16 | | | 487,262 | | | | 550,606 | |
UnitedHealth Group, Inc., 4.875%, 02/15/13 | | | 1,600,000 | | | | 1,721,069 | |
Vale Overseas, Ltd., 6.250%, 01/23/17 | | | 500,000 | | | | 579,194 | |
Vale Overseas, Ltd., 6.875%, 11/01/36 | | | 500,000 | | | | 571,013 | |
Verizon Wireless Capital LLC, 5.250%, 02/01/12 | | | 9,300,000 | | | | 9,839,707 | |
Total Industrials | | | | | | | 89,181,931 | |
Utilities - 0.8% | | | | | | | | |
Enel Finance International SA, 6.800%, 09/15/37 (a) | | | 5,800,000 | | | | 6,539,534 | |
Entergy Corp., 3.625%, 09/15/15 | | | 2,200,000 | | | | 2,249,045 | |
Majapahit Holding, B.V., 7.750%, 01/20/20 | | | 700,000 | | | | 861,000 | |
NRG Energy, Inc., 8.250%, 09/01/20 (a) | | | 1,500,000 | | | | 1,597,500 | |
Total Utilities | | | | | | | 11,247,079 | |
Total Corporate Bonds
(cost $416,147,340) | | | | | | | 435,732,201 | |
Foreign Government and Agency Obligations - 1.6% | | | | | | | | |
Banco Nacional de Desenvolvimento Economico e Social, 4.125%, 09/15/17 (a) | | EUR | 400,000 | | | | 563,120 | |
Brazil Notas do Tesouro Nacional, Series F, 10.000%, 01/01/12 | | BRL | 6,400 | 15 | | | 38,289 | |
Brazil Notas do Tesouro Nacional, Series F, 10.000%, 01/01/17 | | BRL | 150,000 | 15 | | | 842,449 | |
Canada Government, 2.000%, 12/01/14 | | CAD | 4,000,000 | | | | 3,955,211 | |
Canada Government, 2.500%, 09/01/13 | | CAD | 3,200,000 | | | | 3,220,237 | |
Canada Government, 4.500%, 06/01/15 | | CAD | 400,000 | | | | 437,447 | |
Canada Housing Trust, 3.350%, 12/15/20 | | CAD | 2,500,000 | | | | 2,491,323 | |
Export-Import Bank of China, 4.875%, 07/21/15 (a) | | | 300,000 | | | | 334,873 | |
Export-Import Bank of Korea, 4.000%, 01/29/21 | | | 400,000 | | | | 393,246 | |
Export-Import Bank of Korea, 5.125%, 06/29/20 | | | 700,000 | | | | 759,955 | |
Export-Import Bank of Korea, 8.125%, 01/21/14 | | | 1,000,000 | | | | 1,177,444 | |
Korea Finance Corp., 3.250%, 09/20/16 | | | 800,000 | | | | 799,896 | |
Korea Housing Finance, 4.125%, 12/15/15 (a) | | | 500,000 | | | | 528,382 | |
Ontario Province, 4.200%, 06/02/20 | | CAD | 1,600,000 | | | | 1,655,927 | |
Ontario Province, 4.700%, 06/02/37 | | CAD | 2,600,000 | | | | 2,733,301 | |
Ontario Province, Series MTN, 4.600%, 06/02/39 | | CAD | 700,000 | | | | 729,218 | |
Panama Government, 7.250%, 03/15/15 | | | 200,000 | | | | 243,000 | |
Societe Financement de l’Economie Francaise, 0.489%, 07/16/12, (01/18/11) (a)4 | | | 1,000,000 | | | | 1,002,940 | |
United Mexican States, 6.050%, 01/11/40 | | | 800,000 | | | | 924,000 | |
Total Foreign Government and Agency Obligations
(cost $21,702,983) | | | | | | | 22,830,258 | |
The accompanying notes are an integral part of these financial statements.
12
Managers PIMCO Bond Fund
Schedule of Portfolio Investments (continued)
| | | | | | | | |
| | | Principal Amount | | | Value | |
U.S. Government and Agency Obligations - 76.2% | | | | | | | | |
Federal Home Loan Mortgage Corporation - 7.6% | | | | | | | | |
FHLMC, 0.406%, 07/15/19 to 08/15/19, (11/15/10)4 | | $ | 4,748,100 | | | $ | 4,740,853 | |
FHLMC, 0.515%, 11/26/12 | | | 800,000 | | | | 801,642 | |
FHLMC, 0.556%, 05/15/36, (11/15/10)4 | | | 1,226,406 | | | | 1,229,457 | |
FHLMC, 0.756%, 09/15/30, (11/15/10)4 | | | 42,452 | | | | 42,458 | |
FHLMC, 0.875%, 10/28/13 | | | 1,900,000 | | | | 1,914,070 | |
FHLMC, 2.500%, 01/07/14 to 04/23/14 | | | 2,700,000 | | | | 2,859,343 | |
FHLMC, 2.813%, 07/01/30, (07/01/11)4 | | | 2,750 | | | | 2,893 | |
FHLMC, 3.128%, 11/01/34, (06/01/11)4 | | | 1,957,439 | | | | 2,053,880 | |
FHLMC, 3.500%, 05/29/13 | | | 900,000 | | | | 968,551 | |
FHLMC, 4.375%, 07/17/15 | | | 1,800,000 | | | | 2,055,200 | |
FHLMC, 4.500%, 01/15/13 to 09/01/40 | | | 11,213,091 | | | | 12,058,457 | |
FHLMC, 4.875%, 11/15/13 | | | 300,000 | | | | 338,737 | |
FHLMC, 4.991%, 08/01/35, (08/01/15)4 | | | 199,228 | | | | 211,436 | |
FHLMC, 5.000%, 02/16/17 to 04/18/17 | | | 2,000,000 | | | | 2,367,561 | |
FHLMC, 5.250%, 04/18/16 | | | 500,000 | | | | 596,111 | |
FHLMC, 5.500%, 07/18/16 to 08/01/37 | | | 2,329,688 | | | | 2,586,288 | |
FHLMC, 5.500%, TBA | | | 30,000,000 | | | | 32,142,180 | |
FHLMC, 6.000%, 02/01/16 to 09/01/16 | | | 101,041 | | | | 109,647 | |
FHLMC, 6.500%, 01/01/26 to 08/15/31 | | | 6,838,055 | | | | 7,398,398 | |
FHLMC, 7.000%, 11/15/20 | | | 21,184 | | | | 23,038 | |
FHLMC, 7.500%, 08/15/30 | | | 285,915 | | | | 323,161 | |
FHLMC Gold Pool, 5.500%, 07/01/38 | | | 1,163,687 | | | | 1,249,612 | |
FHLMC Gold Pool, 6.000%, 05/01/16 to 02/01/38 | | | 29,156,522 | | | | 31,641,882 | |
FHLMC Structured Pass Through Securities, 1.570%, 02/25/45, (12/01/10)4 | | | 162,010 | | | | 164,268 | |
Total Federal Home Loan Mortgage Corporation | | | | | | | 107,879,123 | |
Federal National Mortgage Association - 31.5% | | | | | | | | |
FNMA, 0.316%, 12/25/36, (11/25/10)4 | | | 521,685 | | | | 515,510 | |
FNMA, 0.500%, 10/30/12 | | | 2,200,000 | | | | 2,199,736 | |
FNMA, 0.566%, 04/25/37, (11/25/10)4 | | | 1,093,439 | | | | 1,093,068 | |
FNMA, 0.706%, 09/25/35, (11/25/10)4 | | | 1,959,843 | | | | 1,960,583 | |
FNMA, 0.750%, 12/18/13 | | | 35,200,000 | | | | 35,282,192 | |
FNMA, 1.000%, 09/23/13 | | | 1,700,000 | | | | 1,719,120 | |
FNMA, 1.125%, 09/30/13 | | | 9,400,000 | | | | 9,539,364 | |
FNMA, 1.570%, 07/01/44, (11/01/10)4 | | | 229,776 | | | | 231,120 | |
FNMA, 1.625%, 10/26/15 | | | 6,800,000 | | | | 6,873,018 | |
FNMA, 1.750%, 02/22/13 | | | 300,000 | | | | 308,820 | |
FNMA, 2.500%, 05/15/14 | | | 300,000 | | | | 317,314 | |
FNMA, 2.684%, 06/01/35, (06/01/11)4 | | | 3,368,875 | | | | 3,528,757 | |
FNMA, 2.698%, 05/25/35, (11/25/10)4 | | | 217,829 | | | | 234,021 | |
FNMA, 2.750%, 02/05/14 to 03/13/14 | | | 1,300,000 | | | | 1,386,430 | |
FNMA, 2.761%, 09/01/35, (07/01/11)4 | | | 1,613,834 | | | | 1,694,043 | |
The accompanying notes are an integral part of these financial statements.
13
Managers PIMCO Bond Fund
Schedule of Portfolio Investments (continued)
| | | | | | | | |
| | | Principal Amount | | | Value | |
Federal National Mortgage Association - 31.5% (continued) | | | | | | | | |
FNMA, 3.000%, 09/16/14 | | $ | 900,000 | | | $ | 970,016 | |
FNMA, 3.500%, 07/01/11 | | | 109,726 | | | | 112,094 | |
FNMA, 3.907%, 05/01/36, (11/01/10)4 | | | 1,325,180 | | | | 1,331,144 | |
FNMA, 4.000%, 03/01/40 to 10/01/40 | | | 3,983,344 | | | | 4,111,303 | |
FNMA, 4.000%, TBA | | | 61,600,000 | | | | 63,525,000 | |
FNMA, 4.111%, 05/01/36, (11/01/10)4 | | | 737,320 | | | | 751,322 | |
FNMA, 4.125%, 04/15/14 | | | 6,200,000 | | | | 6,907,761 | |
FNMA, 4.375%, 10/15/15 | | | 300,000 | | | | 342,914 | |
FNMA, 4.500%, 02/01/39 to 09/01/40 | | | 5,670,713 | | | | 5,962,814 | |
FNMA, 4.500%, TBA | | | 153,000,000 | | | | 160,574,590 | |
FNMA, 4.625%, 10/15/13 | | | 3,100,000 | | | | 3,464,182 | |
FNMA, 4.875%, 12/15/16 | | | 300,000 | | | | 353,020 | |
FNMA, 5.000%, 03/15/16 to 03/01/35 | | | 40,946,859 | | | | 43,963,888 | |
FNMA, 5.015%, 05/01/35, (05/01/15)4 | | | 225,524 | | | | 240,671 | |
FNMA, 5.375%, 06/12/17 | | | 900,000 | | | | 1,087,390 | |
FNMA, 5.500%, 02/01/17 to 10/01/38 | | | 32,084,439 | | | | 34,530,768 | |
FNMA, 6.000%, 03/01 /17 to 08/01/39 | | | 43,848,342 | | | | 47,721,172 | |
FNMA, 6.500%, 07/01/36 to 10/01/37 | | | 5,632,273 | | | | 6,224,688 | |
FNMA, 7.200%, 05/25/23 | | | 613,885 | | | | 708,172 | |
FNMA Whole Loan, 6.500%, 12/25/42 | | | 291,961 | | | | 334,443 | |
Total Federal National Mortgage Association | | | | | | | 450,100,448 | |
Government National Mortgage Association - 0.7% | | | | | | | | |
GNMA, 3.125%, 11/20/24 to 11/20/29, (01/01/11)4 | | | 312,837 | | | | 322,925 | |
GNMA, 3.375%, 04/20/21 to 03/20/24, (04/01/11)4 | | | 42,224 | | | | 43,663 | |
GNMA, 3.625%, 08/20/25, (10/01/11)4 | | | 23,738 | | | | 24,550 | |
GNMA, 6.000%, TBA | | | 2,000,000 | | | | 2,195,000 | |
GNMA, 6.500%, 06/20/28 | | | 770,939 | | | | 817,007 | |
GNMA, 6.750%, 10/16/405 | | | 5,649,938 | | | | 6,431,407 | |
Total Government National Mortgage Association | | | | | | | 9,834,552 | |
United States Treasury Securities - 36.4% | | | | | | | | |
U.S. Treasury Inflation Linked Bonds, 1.250%, 07/15/20 | | | 600,546 | | | | 645,727 | |
U.S. Treasury Inflation Linked Bonds, 1.750%, 01/15/28 | | | 625,164 | | | | 693,199 | |
U.S. Treasury Inflation Linked Bonds, 2.000%, 01/15/26 | | | 4,179,202 | | | | 4,787,472 | |
U.S. Treasury Inflation Linked Bonds, 2.375%, 01/15/25 to 04/15/29 | | | 8,063,161 | | | | 9,653,317 | |
U.S. Treasury Inflation Linked Bonds, 2.500%, 01/15/29 | | | 5,083,450 | | | | 6,269,719 | |
U.S. Treasury Inflation Linked Bonds, 3.625%, 04/15/28 | | | 134,959 | | | | 188,025 | |
U.S. Treasury Inflation Linked Bonds, 3.875%, 04/15/29 | | | 2,257,277 | | | | 3,275,345 | |
U.S. Treasury Notes, 0.500%, 10/15/137 | | | 139,800,000 | 2 | | | 139,810,904 | |
U.S. Treasury Notes, 0.750%, 08/15/137,13 | | | 31,400,000 | | | | 31,660,022 | |
U.S. Treasury Notes, 0.750%, 09/15/13 | | | 33,100,000 | 2 | | | 33,366,356 | |
U.S. Treasury Notes, 1.000%, 07/15/13 | | | 14,900,000 | | | | 15,123,440 | |
U.S. Treasury Notes, 1.125%, 06/15/13 | | | 2,000,000 | | | | 2,036,094 | |
The accompanying notes are an integral part of these financial statements.
14
Managers PIMCO Bond Fund
Schedule of Portfolio Investments (continued)
| | | | | | | | |
| | | Principal Amount | | | Value | |
United States Treasury Securities - 36.4% (continued) | | | | | | | | |
U.S. Treasury Notes, 1.250%, 10/31/15 | | $ | 6,800,000 | | | $ | 6,824,439 | |
U.S. Treasury Notes, 1.750%, 07/31/15 | | | 3,400,000 | | | | 3,501,752 | |
U.S. Treasury Notes, 1.875%, 06/30/1513 | | | 18,700,000 | | | | 19,380,792 | |
U.S. Treasury Notes, 1.875%, 08/31/17 | | | 5,500,000 | | | | 5,507,733 | |
U.S. Treasury Notes, 1.875%, 09/30/177,13 | | | 36,000,000 | | | | 35,994,383 | |
U.S. Treasury Notes, 2.125%, 11/30/14 to 05/31/15 | | | 29,200,000 | | | | 30,612,106 | |
U.S. Treasury Notes, 2.375%, 07/31/17 | | | 22,600,000 | | | | 23,380,401 | |
U.S. Treasury Notes, 2.500%, 04/30/15 | | | 22,400,000 | | | | 23,868,252 | |
U.S. Treasury Notes, 2.500%, 06/30/177,13 | | | 36,200,000 | | | | 37,789,397 | |
U.S. Treasury Notes, 2.750%, 11/30/16 to 05/31/17 | | | 43,200,000 | | | | 45,997,198 | |
U.S. Treasury Notes, 3.000%, 02/28/17 | | | 6,700,000 | | | | 7,227,625 | |
U.S. Treasury Notes, 3.125%, 10/31 /16 to 04/30/17 | | | 11,000,000 | | | | 11,939,845 | |
U.S. Treasury Notes, 3.250%, 12/31/16 | | | 14,500,000 | | | | 15,876,369 | |
U.S. Treasury Notes, 9.875%, 11/15/15 | | | 2,400,000 | | | | 3,423,564 | |
Total United States Treasury Securities | | | | | | | 518,833,476 | |
Total U.S. Government and Agency Obligations
(cost $1,071,618,084) | | | | | | | 1,086,647,599 | |
Asset-Backed Securities - 2.0% | | | | | | | | |
Ally Autos Receivable Trust, Series 2009-A, Class A2, 1.320%, 03/15/12 (a) | | | 635,810 | | | | 637,455 | |
Amortizing Residential Collateral Trust, 0.836%, 07/25/32, (11/26/10)4 | | | 77,398 | | | | 70,717 | |
Bear Stearns Asset Backed Securities, Inc., 0.336%, 10/25/36, (11/26/10)4 | | | 242,175 | | | | 226,467 | |
Countrywide Asset-Backed Certificates, 0.306%, 05/25/37, (11/26/10)4 | | | 97,483 | | | | 96,507 | |
EMC Mortgage Loan Trust, Class A, 0.626%, 05/25/40, (11/26/10) (a)4 | | | 905,508 | | | | 728,920 | |
First Franklin Mortgage Loan Asset Backed Certificates, Series 2006-FF15, Class A3, 0.306%, 11/25/36, (11/26/10)4 | | | 295,244 | | | | 292,257 | |
First NLC Trust, 0.326%, 08/25/37, (11/26/10) (a)4 | | | 927,739 | | | | 659,764 | |
Fremont Home Loan Trust, 0.316%, 01/25/37, (11/26/10)4 | | | 234,752 | | | | 212,041 | |
HSI Asset Securitization Corp. Trust, 0.306%, 12/25/36, (11/26/10)4 | | | 103,485 | | | | 101,453 | |
Long Beach Mortgage Loan Trust, 0.536%, 10/25/34, (11/26/10)4 | | | 55,661 | | | | 47,384 | |
Morgan Stanley ABS Capital I, 0.296%, 10/25/36, (11/26/10)4 | | | 46,365 | | | | 46,276 | |
Morgan Stanley IXIS Real Estate Capital Trust, Series 2006-2, Class 1, 0.306%, 11/25/36, (11/26/10)4 | | | 31,989 | | | | 31,819 | |
Park Place Securities, Inc., Series 2005-WCW1, Class A1 B, 0.516%, 09/25/35, (11 /26/10)4 | | | 1,587,551 | | | | 1,450,982 | |
Securitized Asset Backed Receivables LLC Trust, Series 2007-NC2, Class A2A, 0.296%, 01/25/37, (11/26/10)4 | | | 474,248 | | | | 451,083 | |
Securitized Asset Backed Receivables LLC Trust, 0.316%, 12/25/36, (11 /26/10)4 | | | 499,833 | | | | 195,855 | |
Structured Asset Securities Corp., 0.306%, 10/25/36, (11/26/10)4 | | | 165,398 | | | | 164,445 | |
Structured Asset Securities Corp., 0.546%, 01/25/33, (11/26/10)4 | | | 60,277 | | | | 54,909 | |
U.S. Small Business Administration Participation Certificates, Series 2009-20E, Class 1, 4.430%, 05/01/29 | | | 5,086,167 | | | | 5,561,345 | |
U.S. Small Business Administration Participation Certificates, Series 2008-10E, Class 1, 5.110%, 09/01/18 | | | 3,036,600 | | | | 3,332,495 | |
U.S. Small Business Administration Participation Certificates, Series 2003-20I, Class 1,5.130%, 09/01/23 | | | 98,211 | | | | 107,068 | |
The accompanying notes are an integral part of these financial statements.
15
Managers PIMCO Bond Fund
Schedule of Portfolio Investments (continued)
| | | | | | | | |
| | | Principal Amount | | | Value | |
Asset-Backed Securities - 2.0% (continued) | | | | | | | | |
U.S. Small Business Administration Participation Certificates, Series 2007-20K, Class 1, 5.510%, 11/01/27 | | $ | 4,286,093 | | | $ | 4,822,942 | |
U.S. Small Business Administration Participation Certificates, Series 2008-20I, 5.600%, 09/01/28 | | | 8,388,314 | | | | 9,435,676 | |
U.S. Small Business Administration Surety Bonds, 6.344%, 08/01/11 | | | 103,548 | | | | 107,113 | |
Total Asset-Backed Securities
(cost $27,438,340) | | | | | | | 28,834,973 | |
Mortgage-Backed Securities - 5.3% | | | | | | | | |
American Home Mortgage Investment Trust, 2.503%, 02/25/45, (12/01/10)4 | | | 634,239 | | | | 556,045 | |
Arran Residential Mortgages Funding PLC, Series 2010 1 A, Class A2B, 0.359%, 04/12/56, (01/12/11) (a)4 | | EUR | 2,000,000 | | | | 2,784,312 | |
Arran Residential Mortgages Funding PLC, Series 2010 1A, Class A1B, 2.203%, 05/16/47, (02/16/11) (a)4 | | EUR | 1,000,000 | | | | 1,392,020 | |
Bank of America Funding Corp., 2.886%, 05/25/355 | | | 966,137 | | | | 945,588 | |
Bear Stearns Adjustable Rate Mortgage Trust, 2.962%, 04/25/335 | | | 378,863 | | | | 374,939 | |
Bear Stearns Adjustable Rate Mortgage Trust, 3.590%, 11 /25/305 | | | 22,177 | | | | 22,349 | |
Bear Stearns Adjustable Rate Mortgage Trust, 5.662%, 02/25/335 | | | 67,753 | | | | 68,187 | |
Bear Stearns Adjustable Rate Mortgage Trust, Series 2005-5, Class A2, 2.400%, 08/25/35, (12/01/10)4 | | | 13,665,625 | | | | 12,957,220 | |
Bear Stearns Adjustable Rate Mortgage Trust, Series 2005-2, Class A1, 2.760%, 03/25/35, (12/01/10)4 | | | 10,646,252 | | | | 10,168,369 | |
Bear Stearns Adjustable Rate Mortgage Trust, Series 2005-2, Class A2, 2.934%, 03/25/35, (12/25/10)4 | | | 6,539,208 | | | | 6,280,229 | |
Bear Stearns Adjustable Rate Mortgage Trust, Series 2005-12, Class 13A1, 5.382%, 02/25/365 | | | 347,520 | | | | 307,579 | |
Bear Stearns Alt-A Trust, 2.879%, 05/25/355 | | | 1,468,725 | | | | 1,145,999 | |
Bear Stearns Alt-A Trust, Series 2005-7, Class 22A1, 2.990%, 09/25/355 | | | 724,892 | | | | 555,718 | |
Bear Stearns Commercial Mortgage Securities, Series 2007-PW18, Class A4, 5.700%, 06/13/50 | | | 2,800,000 | | | | 3,008,202 | |
Bear Stearns Mortgage Funding Trust, 0.326%, 02/25/37, (11/26/10)4 | | | 93,689 | | | | 93,450 | |
Citigroup Mortgage Loan Trust, Inc., Series 2005-6, Class A1, 2.510%, 08/25/35, (10/25/11)4 | | | 7,350,822 | | | | 6,928,948 | |
Citigroup Mortgage Loan Trust, Inc., Series 2005-11, Class 2A1, 2.670%, 12/25/35, (12/01/10)4 | | | 397,783 | | | | 383,921 | |
Countrywide Alternative Loan Trust, 0.436%, 05/25/47, (11/26/10)4 | | | 1,438,208 | | | | 786,848 | |
Countrywide Home Loans, Inc., 2.608%, 02/20/36, (09/20/11)4 | | | 444,244 | | | | 351,451 | |
Greenpoint Mortgage Funding Trust, 0.336%, 10/25/46, (11/26/10)4 | | | 522,525 | | | | 475,485 | |
Greenpoint Mortgage Funding Trust, 0.336%, 01/25/47, (11/26/10)4 | | | 593,349 | | | | 557,437 | |
GS Mortgage Securities Corp., 0.347%, 03/06/20, (11/08/10) (a)4 | | | 2,208,339 | | | | 2,146,414 | |
GSR Mortgage Loan Trust, Series 2005-AR7, Class 6A1, 5.196%, 11/25/355 | | | 1,585,783 | | | | 1,556,678 | |
IndyMac Index Mortgage Loan Trust, Series 2005-AR31, Class 1A1, 2.687%, 01/25/365 | | | 1,699,776 | | | | 1,063,570 | |
JPMorgan Chase Commercial Mortgage Securities Corp., Series 2010-C2, Class A3, 4.070%, 11/15/43 (a) | | | 2,000,000 | | | | 2,003,892 | |
JPMorgan Chase Commercial Mortgage Securities Corp., 2006-LDP9, Class A3, 5.336%, 05/15/47 | | | 2,100,000 | | | | 2,213,462 | |
JPMorgan Mortgage Trust, Series 2005-A1, Class 6T1, 5.017%, 02/25/355 | | | 881,233 | | | | 900,440 | |
Merrill Lynch Mortgage Investors, Inc., Series 2005-A10, Class A, 0.466%, 02/25/36, (11/25/10)4 | | | 882,856 | | | | 671,267 | |
MLCC Mortgage Investors, Inc., Series 2005-3, Class 4A, 0.506%, 11/25/35, (11/25/10)4 | | | 212,628 | | | | 179,435 | |
Morgan Stanley Capital I, Series 2007-IQ16, Class A4, 5.809%, 12/12/49 | | | 3,000,000 | | | | 3,154,723 | |
Prime Mortgage Trust, 0.656%, 02/25/19, (11/25/10)4 | | | 26,719 | | | | 25,864 | |
Prime Mortgage Trust, 0.656%, 02/25/34, (11/25/10)4 | | | 210,016 | | | | 190,630 | |
Structured Asset Mortgage Investments, Inc., 0.916%, 09/19/32, (11/19/10)4 | | | 393,073 | | | | 345,840 | |
Structured Asset Mortgage Investments, Inc., Series 2005-AR5, Class A2, 0.506%, 07/19/35,(11/19/10)4 | | | 942,011 | | | | 813,523 | |
The accompanying notes are an integral part of these financial statements.
16
Managers PIMCO Bond Fund
Schedule of Portfolio Investments (continued)
| | | | | | | | |
| | | Principal Amount | | | Value | |
Mortgage-Backed Securities - 5.3% (continued) | | | | | | | | |
Structured Asset Securities Corp., 2.336%, 01/25/325 | | $ | 23,108 | | | $ | 20,595 | |
Structured Asset Securities Corp., 2.843%, 10/25/35 (a)5 | | | 804,937 | | | | 649,085 | |
Thornburg Mortgage Securities Trust, 0.366%, 11/25/46, (11/26/10)4 | | | 955,442 | | | | 931,344 | |
Wachovia Bank Commercial Mortgage Trust, 0.336%, 06/15/20, (11/15/10) (a)4 | | | 2,538,079 | | | | 2,240,157 | |
Wachovia Bank Commercial Mortgage Trust, Series 2006-WL7A, Class A1, 0.346%, 09/15/21, (11/15/10) (a)4 | | | 4,344,645 | | | | 4,028,925 | |
Washington Mutual Mortgage Pass-Through, 1.553%, 11/25/42, (12/01/10)4 | | | 166,109 | | | | 145,706 | |
Washington Mutual Mortgage Pass-Through, Series 2005-AR13, Class A1 A1, 0.546%, 10/25/45,(11/25/10)4 | | | 335,528 | | | | 273,584 | |
Washington Mutual MSC Mortgage Pass-Through, 2.204%, 02/25/315 | | | 3,574 | | | | 3,329 | |
Wells Fargo Mortgage Backed Securities Trust, Series 2006-AR2, Class 2A1, 4.339%, 03/25/365 | | | 1,847,749 | | | | 1,644,357 | |
Total Mortgage-Backed Securities
(cost $78,976,022) | | | | | | | 75,347,116 | |
Municipal Bonds - 2.7% | | | | | | | | |
Buckeye Tobacco Settlement Financing Authority, Tobacco Settlement Asset-Backed Bonds, Series 2007 A-2, 5.875%, 06/01/30 | | | 1,000,000 | | | | 839,910 | |
California Infrastructure & Economic Development Bank Revenue, UCSF Neurosciences Building 19A, Taxable Build America, Series 2010 B, 6.486%, 05/15/49 | | | 1,000,000 | | | | 1,056,400 | |
California State General Obligation, 5.650%, 04/01/39 | | | 1,200,000 | | | | 1,293,444 | |
California State General Obligation, 7.500%, 04/01/34 | | | 1,300,000 | | | | 1,357,291 | |
California State General Obligation, 7.550%, 04/01/39 | | | 1,300,000 | | | | 1,359,462 | |
California State General Obligation, 7.950%, 03/01/36 | | | 1,100,000 | | | | 1,154,417 | |
California State University Systemwide Revenue, Series 2009 A, 5.250%, 11/01/38 | | | 500,000 | | | | 526,590 | |
California State University Systemwide Revenue, Taxable Build America, Series 2010 B, 6.434%, 11/01/30 | | | 700,000 | | | | 745,437 | |
Calleguas-Las Virgenes, CA Public Financing Authority Water Revenue, Calleguas Municipal Water District, Taxable Build America, Series 2010 B, 5.944%, 07/01/40 | | | 1,000,000 | | | | 1,033,930 | |
Chicago, IL Transit Authority, Sales & Transfer Tax Receipts Revenue, Taxable Build America, Series 2010 B, 6.200%, 12/01/40 | | | 1,000,000 | | | | 963,510 | |
Chicago, IL Transit Authority, Sales & Transfer Tax Receipts Revenue, Pension Funding, Series 2008 A, 6.300%, 12/01/21 | | | 100,000 | | | | 111,636 | |
Chicago, IL Transit Authority, Sales & Transfer Tax Receipts Revenue, Retiree Health Care, Series 2008 B, 6.300%, 12/01/21 | | | 200,000 | | | | 223,272 | |
Chicago, IL Transit Authority, Sales & Transfer Tax Receipts Revenue, Pension Funding, Series 2008 A, 6.899%, 12/01/40 | | | 1,600,000 | | | | 1,667,824 | |
Chicago, IL Transit Authority, Sales & Transfer Tax Receipts Revenue, Retiree Health Care, Series 2008 B, 6.899%, 12/01/40 | | | 1,700,000 | | | | 1,772,063 | |
Clark County, NV Airport System Revenue, Taxable Build America, Series 2010 C, 6.820%, 07/01/45 | | | 800,000 | | | | 854,640 | |
Illinois Municipal Electric Agency Power Supply System Revenue, Taxable Build America, Series 2009 C, 6.832%, 02/01/35 | | | 800,000 | | | | 871,456 | |
Illinois State General Obligation, 4.071%, 01/01/14 | | | 1,200,000 | | | | 1,238,772 | |
Illinois State General Obligation, Taxable Build America, Series 2010-3, 6.725%, 04/01/35 | | | 400,000 | | | | 389,484 | |
Los Angeles, CA Unified School District General Obligation, Series A-1, 4.500%, 07/01/22 (AGM Insured)11 | | | 3,600,000 | | | | 3,736,188 | |
Los Angeles, CA Unified School District General Obligation, Taxable Build America, Series 2010 RY, 6.758%, 07/01 /34 | | | 4,000,000 | | | | 4,375,360 | |
Los Angeles, CA Wastewater System Revenue, Series 2010 A, 5.713%, 06/01/39 | | | 1,000,000 | | | | 981,470 | |
New York City Municipal Finance Authority, Water and Sewer System General Resolution, Taxable Build America, Fiscal 2010 Series GG, 5.724%, 06/15/42 | | | 5,000,000 | | | | 5,121,100 | |
The accompanying notes are an integral part of these financial statements.
17
Managers PIMCO Bond Fund
Schedule of Portfolio Investments (continued)
| | | | | | | | |
| | | Principal Amount | | | Value | |
Municipal Bonds - 2.7% (continued) | | | | | | | | |
North Carolina Turnpike Authority State Annual Appropriation Revenue, Triangle Expressway System, | | | | | | | | |
Taxable Build America, Series 2009 B, 6.700%, 01/01/39 | | $ | 900,000 | | | $ | 967,104 | |
Public Power Generation Agency Revenue, Whelan Energy Center Unit 2, Taxable Build America, | | | | | | | | |
Series 2009 A, 7.242%, 01/01/41 | | | 1,200,000 | | | | 1,246,524 | |
San Francisco, CA Bay Area Toll Authority Subordinate Toll Bridge Revenue, Series 2010 S-1, 7.043%, 04/01/50 | | | 900,000 | | | | 944,433 | |
Texas State Transportation Commission Mobility Fund, Series 2005 A, 4.750%, 04/01/35 | | | 700,000 | | | | 716,464 | |
Truckee Meadows Water Authority, NV Water Revenue, Series 2005 A, 5.000%, 07/01/36 (NATL-RE)11 | | | 200,000 | | | | 201,640 | |
University of California General Revenue, Taxable Build America, Series 2009 R, 6.270%, 05/15/31 | | | 2,500,000 | | | | 2,536,175 | |
Total Municipal Bonds
(cost $36,556,528) | | | | | | | 38,285,996 | |
| | |
| | | Shares | | | | |
Municipal Bond Funds - 0.5% | | | | | | | | |
Dreyfus Municipal Income, Inc. | | | 37,500 | | | | 352,875 | |
DWS Municipal Income Trust | | | 55,000 | | | | 698,500 | |
Invesco Van Kampen Advantage Municipal Income Trust II | | | 61,796 | 2 | | | 781,719 | |
Invesco Van Kampen Trust for Investment Grade Municipals | | | 55,000 | | | | 825,000 | |
MFS Municipal Income Trust | | | 53,800 | 2 | | | 388,974 | |
Nuveen Performance Plus Municipal Fund | | | 55,000 | | | | 823,900 | |
Nuveen Premium Income Municipal Fund II | | | 55,000 | | | | 799,700 | |
Nuveen Premium Income Municipal Fund IV | | | 55,000 | | | | 733,700 | |
Nuveen Quality Income Municipal Fund | | | 55,000 | | | | 812,350 | |
Putnam Municipal Opportunities Trust | | | 33,648 | 2 | | | 412,188 | |
Total Municipal Bond Funds
(cost $6,544,612) | | | | | | | 6,628,906 | |
Preferred Stocks - 0.8% | | | | | | | | |
Bank of America Corp., Series L, 7.250%. Exercise Price $50.00, Expiration Date 12/31/4914 | | | 7,000 | | | | 6,629,000 | |
DG Funding Trust, 0.643%, 12/31/10 (a)5,9 | | | 573 | | | | 4,405,898 | |
Total Preferred Stocks
(cost $12,745,273) | | | | | | | 11,034,898 | |
Short-Term Investments - 16.0% | | | | | | | | |
Other Investment Companies - 12.0%1 | | | | | | | | |
BNY Institutional Cash Reserves Fund, Series B*3,10 | | | 643,217 | | | | 511,523 | |
BNY Mellon Overnight Government Fund, 0.21%3 | | | 164,600,000 | | | | 164,600,000 | |
Dreyfus Cash Management Fund, Institutional Class Shares, 0.16%12 | | | 6,715,090 | | | | 6,715,090 | |
Total Other Investment Companies | | | | | | | 171,826,613 | |
| | |
| | | Principal Amount | | | | |
Repurchase Agreements - 4.0% | | | | | | | | |
TD Securities LLC, dated 10/28/10, due 11/01/10, 0.23%, total to be received $39,600,759 (secured by $40,750,154 U.S. Treasury Bonds, 6.125%, 11/15/27) | | $ | 39,600,000 | | | | 39,600,000 | |
Barclays Capital, Inc., dated 10/29/10, due 11/01/10, 0.23%, total to be received $17,500,335 (secured by $17,928,706 U.S. Treasury Notes, 3.375%, 11/15/19) | | | 17,500,000 | | | | 17,500,000 | |
Total Repurchase Agreements | | | | | | | 57,100,000 | |
Total Short-Term Investments
(cost $229,058,307) | | | | | | | 228,926,613 | |
Total Investments - 135.7%
(cost $1,900,787,489) | | | | | | | 1,934,268,560 | |
Other Assets, less Liabilities - (35.7)% | | | | | | | (508,927,936 | ) |
Net Assets - 100.0% | | | | | | $ | 1,425,340,624 | |
The accompanying notes are an integral part of these financial statements.
18
Managers PIMCO Bond Fund
Notes to Schedule of Portfolio Investments
Note: Based on the cost of investments of $1,900,938,382 for Federal income tax purposes at October 31, 2010, the aggregate gross unrealized appreciation and depreciation were $55,152,084 and $21,821,906, respectively, resulting in net unrealized appreciation of investments of $33,330,178.
| * | Non-income-producing security. |
| (a) | Security exempt from registration under Rule 144A of the Securities Act of 1933. This security may be resold in transactions exempt from registration, normally to qualified buyers. At October 31, 2010, the value of these securities amounted to $155,743,290, or 10.9 % of net assets. |
| 1 | Yield shown for each investment company listed represents the October 31, 2010, seven-day average yield, which refers to the sum of the previous seven days’ dividends paid, expressed as an annual percentage. |
| 2 | Some or all of these securities, amounting to a market value of $162,064,988, or 11.4% of net assets, were out on loan to various brokers. |
| 3 | Collateral received from brokers for securities lending was invested in this short-term investment. |
| 4 | Floating Rate Security. The rate listed is as of October 31, 2010. Date in parentheses represents the security’s next coupon rate reset. |
| 5 | Variable Rate Security. The rate listed is as of October 31, 2010, and is periodically reset subject to terms and conditions set forth in the debenture. |
| 6 | Perpetuity Bond. The date shown is the final call date. |
| 7 | Some or all of this security is held as collateral for futures contracts, amounting to a market value of $1,875,559, or 0.1% of net assets. |
| 8 | Illiquid Security. A security not readily convertible into cash such as a stock, bond or commodity that is not actively traded and would be difficult to sell in a current sale. The Fund may not invest more than 15% of its net assets in illiquid securities. |
| 9 | Security is in default. Issuer has failed to make a timely payment of either principal or interest or has failed to comply with some provision of the bond indenture. |
| 10 | On September 12, 2008, The Bank of New York Mellon established a separate sleeve of the BNY Institutional Cash Reserves Fund (Series B) to hold certain Lehman Brothers floating rate notes. The Fund’s position in Series B is being fair valued daily. (See Note 4 in the Notes to Financial Statements.) |
| 11 | Securities in the portfolio were backed by insurance of financial institutions and financial guaranty assurance agencies amounted to $3,937,828, or 0.3% of net assets. |
| 12 | Collateral received from brokers for swap contracts in the amount of $2,720,000, or 0.2% of net assets, were invested in this short-term investment. |
| 13 | Collateral segregated with brokers for swap contracts, amounting to a market value of $ 1,315,259, or 0.1 % of net assets. |
| 14 | Convertible Security. A corporate bond or preferred stock, usually a junior debenture, that can be converted, at the option of the holder, for a specific number of shares of the company’s preferred stock or common stock. Convertible Bonds and Convertible Preferred Stocks at October 31, 2010, amounted to $7,004,500, or 0.5% of net assets, and $6,629,000, or 0.5% of net assets, respectively. |
| 15 | Principal amount is stated in BRL Units. |
Investment Definitions and Abbreviations:
| | |
| AGM: | | Assured Guaranty Municipal Corp. |
| EMTN: | | European Medium Term Note |
| FHLMC: | | Federal Home Loan Mortgage Corp. |
| FNMA: | | Federal National Mortgage Association |
| GMTN: | | Global Medium Term Note |
| GNMA: | | Government National Mortgage Association |
| MTN: | | Medium Term Note |
| NATL-RE: | | National Public Finance Guarantee Corp. |
| TBA: | | To Be Announced |
Abbreviations have been used throughout the portfolio to indicate amounts shown in currencies other than the U.S. dollar (USD):
| | |
BRL: | | Brazilian Real |
CAD: | | Canadian Dollar |
EUR: | | Euro |
GBP: | | British Pound |
The accompanying notes are an integral part of these financial statements.
19
Managers PIMCO Bond Fund
Notes to Schedule of Portfolio Investments (continued)
The following table summarizes the inputs used to value the Fund’s net assets by the above fair value hierarchy levels as of October 31, 2010: (See Note 1 (a) in the Notes to the Financial Statements.)
| | | | | | | | | | | | | | | | |
| | | Quoted Prices in
Active Markets
for Identical
Investments
Level 1 | | | Significant
Other
Observable
Inputs
Level 2 | | | Significant
Unobservable
Inputs
Level 3 | | | Total | |
Managers PIMCO Bond Fund | | | | | | | | | | | | | | | | |
Investments in Securities | | | | | | | | | | | | | | | | |
Corporate Bonds† | | | — | | | $ | 435,732,201 | | | | — | | | $ | 435,732,201 | |
Foreign Government and Agency Obligations | | | — | | | | 22,830,258 | | | | — | | | | 22,830,258 | |
U.S. Government and Agency Obligations | | | | | | | | | | | | | | | | |
Federal Home Loan Mortgage Corporation | | | — | | | | 107,879,123 | | | | — | | | | 107,879,123 | |
Federal National Mortgage Association | | | — | | | | 450,100,448 | | | | — | | | | 450,100,448 | |
Government National Mortgage Association | | | — | | | | 9,834,552 | | | | — | | | | 9,834,552 | |
United States Treasury Securities | | | — | | | | 518,833,476 | | | | — | | | | 518,833,476 | |
Asset-Backed Securities | | | — | | | | 28,834,973 | | | | — | | | | 28,834,973 | |
Mortgage-Backed Securities | | | — | | | | 75,347,116 | | | | — | | | | 75,347,116 | |
Municipal Bonds | | | — | | | | 38,285,996 | | | | — | | | | 38,285,996 | |
Municipal Bond Funds | | $ | 6,628,906 | | | | — | | | | | | | | 6,628,906 | |
Preferred Stocks | | | — | | | | 11,034,898 | | | | — | | | | 11,034,898 | |
Short-Term Investments | | | | | | | | | | | | | | | | |
Other Investment Companies | | | 171,315,090 | | | | 511,523 | | | | — | | | | 171,826,613 | |
Repurchase Agreements | | | — | | | | 57,100,000 | | | | — | | | | 57,100,000 | |
| | | | | | | | | | | | | | | | |
Total Investments in Securities | | $ | 177,943,996 | | | $ | 1,756,324,564 | | | | — | | | $ | 1,934,268,560 | |
| | | | | | | | | | | | | | | | |
Derivatives‡ | | | | | | | | | | | | | | | | |
Credit Contracts | | | — | | | $ | 1,762,322 | | | | — | | | $ | 1,762,322 | |
Foreign Exchange Contracts | | | — | | | | (2,140,557 | ) | | | — | | | | (2,140,557 | ) |
Interest Rate Contracts | | $ | 1,017,453 | | | | 4,041,505 | | | | — | | | | 5,058,958 | |
| | | | | | | | | | | | | | | | |
Total Derivatives | | $ | 1,017,453 | | | $ | 3,663,270 | | | | — | | | $ | 4,680,723 | |
| | | | | | | | | | | | | | | | |
| 1 | All corporate bonds held in the Fund are Level 2 securities. For a detailed break-out of the corporate bonds by major industry classification, please refer to the Schedule of Portfolio Investments. |
| 2 | Derivative instruments, such as futures, forwards, options and swap contracts, are not reflected in the Schedule of Portfolio Investments and are valued at the unrealized appreciation/depreciation of the instrument. |
As of October 31, 2010, the Fund had no significant transfers between Level 1 and Level 2 from the beginning of the reporting period.
The accompanying notes are an integral part of these financial statements.
20
Managers PIMCO Bond Fund
Notes to Schedule of Portfolio Investments (continued)
The following schedule is the fair values of derivative instruments at October 31, 2010:
| | | | | | | | | | | | |
| | | Asset Derivatives | | | Liability Derivatives | |
Derivatives not accounted for as hedging
instruments | | Statement of Assets and Liabilities Location | | Fair Value | | | Statement of Assets and Liabilities Location | | Fair Value | |
Credit contracts | | Unrealized appreciation on swap contracts | | $ | 1,766,427 | | | Unrealized depreciation on swap contracts | | $ | 4,105 | |
Interest rate contracts | | Unrealized appreciation on swap contracts | | | 2,789,169 | | | Unrealized depreciation on swap contracts | | | 1,236,093 | |
Interest rate contracts | | — | | | — | | | Options written | | | 1,864,113 | |
Interest rate contracts | | Variation margin receivable on futures contracts* | | | 66,794 | | | Variation margin payable on futures contracts* | | | — | |
Foreign exchange contracts | | Unrealized appreciation of foreign currency contracts | | | 2,546,273 | | | Unrealized depreciation of foreign currency contracts | | | 4,686,829 | |
| | | | | | | | | | | | |
| | Totals | | $ | 7,168,663 | | | | | $ | 7,791,140 | |
| | | | | | | | | | | | |
| * | Includes only the current day’s variation margin. Prior variation margin movements have been reflected in cash on the Statement of Assets and Liabilities upon receipt or payment. |
For the fiscal year ended October 31, 2010, the effect of derivative instruments on the Statement of Operations and the amount of realized gain/(loss) on derivatives recognized in income were as follows:
| | | | | | | | | | | | | | | | | | | | |
Derivatives not accounted for as hedging instruments | | Futures | | | Forward Currency
Contracts | | | Options | | | Swaps | | | Total | |
Credit contracts | | | — | | | | — | | | $ | 8,250 | | | | ($62,065 | ) | | | ($53,815 | ) |
Foreign exchange contracts | | | — | | | $ | 4,649,863 | | | | 199,527 | | | | — | | | | 4,849,390 | |
Interest rate contracts | | $ | 24,465,914 | | | | — | | | | 6,065,155 | | | | 4,075,698 | | | | 34,606,767 | |
| | | | | | | | | | | | | | | | | | | | |
Totals | | $ | 24,465,914 | | | $ | 4,649,863 | | | $ | 6,272,932 | | | $ | 4,013,633 | | | $ | 39,402,342 | |
| | | | | | | | | | | | | | | | | | | | |
The change in unrealized gain/ (loss) on derivatives recognized in income were as follows:
| | | | | | | | | | | | | | | | | | | | |
Derivatives not accounted for as hedging instruments | | Futures | | | Forward Currency
Contracts | | | Options | | | Swaps | | | Total | |
Credit contracts | | | — | | | | — | | | | — | | | $ | 1,590,383 | | | $ | 1,590,383 | |
Foreign exchange contracts | | | — | | | | ($2,061,791 | ) | | | — | | | | — | | | | (2,061,791 | ) |
Interest rate contracts | | | ($3,095,687 | ) | | | — | | | $ | 744,568 | | | | (2,806,025 | ) | | | (5,157,144 | ) |
| | | | | | | | | | | | | | | | | | | | |
Totals | | ($ | 3,095,687 | ) | | ($ | 2,061,791 | ) | | $ | 744,568 | | | ($ | 1,215,642 | ) | | ($ | 5,628,552 | ) |
| | | | | | | | | | | | | | | | | | | | |
At October 31, 2010, the Fund had the following TBA sale commitments:
(See Note 1 (i) in the Notes to the Financial Statements.)
| | | | | | |
Principal/Share Amount | | Security | | Current Liability | |
$3,000,000 | | FNMA, 6.000%, 11/01/40 | | $ | 3,257,346 | |
At October 31, 2010, the Fund had the following futures contracts:
(See Note 9 in the Notes to the Financial Statements.)
| | | | | | | | | | | | | | | | |
Type | | Number of
Contracts | | | Position | | | Expiration Date | | | Unrealized
Gain/(Loss) | |
90-Day Euribor | | | 26 | | | | Long | | | | 12/19/11 - 3/12/12 | | | | ($5,715 | ) |
90-Day Eurodollar | | | 2,143 | | | | Long | | | | 3/14/11 - 9/16/13 | | | | 1,035,375 | |
90-Day Pound Sterling Interest Rate | | | 59 | | | | Long | | | | 12/21/11 - 09/19/12 | | | | (12,207 | ) |
| | | | | | | | | | | | | | | | |
| | | | | | | | | | | Total | | | $ | 1,017,453 | |
| | | | | | | | | | | | | | | | |
The accompanying notes are an integral part of these financial statements.
21
Managers PIMCO Bond Fund
Notes to Schedule of Portfolio Investments (continued)
At October 31, 2010, the Fund had the following swap contracts:
(See Note 10 in the Notes to the Financial Statements.)
| | | | | | | | | | | | | | | | | | | | | | | | | | | | | | |
Pay/Receive Floating
Rate | | Floating Rate Index | | Fixed Rate | | | Counterparty | | | Maturity | | | Currency | | | Notional Amount | | | Net Premiums
Paid/(Received) | | | Unrealized
Gain/(Loss) | |
| | Interest Rate Swaps | | | | | | | | | | | | | | | | | | | | | | | | | | | | |
Pay | | 1-YearBRL-CDI | | | 10.575 | % | | | BRC | | | | 01/02/12 | | | | BRL | | | $ | 6,700,000 | | | | ($21,314 | ) | | | ($27,321 | ) |
Pay | | 1-YearBRL-CDI | | | 10.60 | % | | | BRC | | | | 01/02/12 | | | | BRL | | | | 900,000 | | | | — | | | | 4,178 | |
Pay | | 1-YearBRL-CDI | | | 10.60 | % | | | JPM | | | | 01/02/12 | | | | BRL | | | | 600,000 | | | | — | | | | 2,785 | |
Pay | | 1-YearBRL-CDI | | | 10.61 | % | | | HUS | | | | 01/02/12 | | | | BRL | | | | 1,400,000 | | | | — | | | | 6,681 | |
Pay | | 1-YearBRL-CDI | | | 11.42 | % | | | UBS | | | | 01/02/12 | | | | BRL | | | | 27,800,000 | | | | (4,925 | ) | | | 164,650 | |
Pay | | 1-YearBRL-CDI | | | 11.76 | % | | | CS | | | | 01/02/12 | | | | BRL | | | | 8,200,000 | | | | 30,143 | | | | 58,392 | |
Pay | | 1-YearBRL-CDI | | | 11.95 | % | | | RBS | | | | 01/02/13 | | | | BRL | | | | 5,800,000 | | | | 5,661 | | | | 16,297 | |
Pay | | 1-YearBRL-CDI | | | 11.98 | % | | | MLC | | | | 01/02/12 | | | | BRL | | | | 5,800,000 | | | | — | | | | 124,109 | |
Pay | | 1-YearBRL-CDI | | | 12.07 | % | | | RBS | | | | 01/02/13 | | | | BRL | | | | 13,700,000 | | | | 25,652 | | | | 56,001 | |
Pay | | 1-YearBRL-CDI | | | 12.07 | % | | | UBS | | | | 01/02/13 | | | | BRL | | | | 4,900,000 | | | | 9,223 | | | | 40,402 | |
Pay | | 1-YearBRL-CDI | | �� | 12.08 | % | | | RBS | | | | 01/02/12 | | | | BRL | | | | 8,200,000 | | | | 11,517 | | | | 59,005 | |
Pay | | 1-YearBRL-CDI | | | 12.17 | % | | | JPM | | | | 01/02/13 | | | | BRL | | | | 38,200,000 | | | | 120,995 | | | | 317,077 | |
Pay | | 1-YearBRL-CDI | | | 12.20 | % | | | JPM | | | | 01/02/14 | | | | BRL | | | | 8,100,000 | | | | (901 | ) | | | 101,994 | |
Pay | | 1-YearBRL-CDI | | | 12.25 | % | | | UBS | | | | 01/02/14 | | | | BRL | | | | 7,000,000 | | | | 15,790 | | | | 78,267 | |
Pay | | 1-YearBRL-CDI | | | 12.48 | % | | | CS | | | | 01/02/13 | | | | BRL | | | | 64,200,000 | | | | 103,296 | | | | 599,705 | |
Pay | | 1-YearBRL-CDI | | | 12.54 | % | | | BRC | | | | 01/02/12 | | | | BRL | | | | 3,400,000 | | | | (439 | ) | | | 103,843 | |
Pay | | 1-YearBRL-CDI | | | 12.54 | % | | | UBS | | | | 01/02/12 | | | | BRL | | | | 3,400,000 | | | | (440 | ) | | | 103,843 | |
Pay | | 1-YearBRL-CDI | | | 12.54 | % | | | MLC | | | | 01/02/12 | | | | BRL | | | | 7,300,000 | | | | (13,841 | ) | | | 235,854 | |
Pay | | 1-YearBRL-CDI | | | 12.55 | % | | | RBS | | | | 01/02/13 | | | | BRL | | | | 3,700,000 | | | | 15,233 | | | | 30,893 | |
Pay | | 1-YearBRL-CDI | | | 14.765 | % | | | HUS | | | | 01/02/12 | | | | BRL | | | | 300,000 | | | | 822 | | | | 17,018 | |
Pay | | 1-YearBRL-CDI | | | 14.765 | % | | | MLC | | | | 01/02/12 | | | | BRL | | | | 1,200,000 | | | | 2,114 | | | | 69,244 | |
Pay | | 28-DayMXNTIIE | | | 7.33 | % | | | JPM | | | | 01/25/15 | | | | MXN | | | | 14,100,000 | | | | (810 | ) | | | 82,401 | |
Pay | | 28-Day MXN TIIE | | | 7.34 | % | | | BRC | | | | 01/28/15 | | | | MXN | | | | 47,500,000 | | | | (1,344 | ) | | | 277,707 | |
Pay | | 3-Month AUD-BBR-BBSW | | | 4.50 | % | | | DUB | | | | 06/15/11 | | | | AUD | | | | 27,000,000 | | | | 1,601 | | | | (93,673 | ) |
Pay | | 6-Month AUD-BBR-BBSW | | | 6.00 | % | | | UBS | | | | 09/15/12 | | | | AUD | | | | 15,300,000 | | | | — | | | | 232,028 | |
Pay | | 6-Month EUR-EURIBOR-Reuters | | | 2.00 | % | | | RBS | | | | 09/15/15 | | | | EUR | | | | 5,100,000 | | | | (41,739 | ) | | | 6,795 | |
Receive | | 3-Month USD-LIBOR-BBA | | | 1.45 | % | | | JPM | | | | 11/02/15 | | | | USD | | | | 2,800,000 | | | | — | | | | (3,684 | ) |
Receive | | 3-Month USD-LIBOR-BBA | | | 1.60 | % | | | JPM | | | | 11/02/15 | | | | USD | | | | 300,000 | | | | — | | | | (2,587 | ) |
Receive | | 3-Month USD-LIBOR-BBA | | | 3.25 | % | | | CS | | | | 11/02/20 | | | | USD | | | | 21,600,000 | | | | — | | | | (1,108,828 | ) |
| | | | | | | | | | | | | | | | | | | | | | | | | | | | | | |
| | | | | | | | | | | | | | | | | | | | | Totals | | | $ | 256,294 | | | $ | 1,553,076 | |
| | | | | | | | | | | | | | | | | | | | | | | | | | | | | | |
| | | | | | | | | | | | | | | | | | | | | | | | | | | | | | | | | | |
Pay/Receive Fixed Rate | | Reference Entity | | Fixed
Rate | | | Counterparty | | | Maturity | | | Rating‡ | | | Currency | | | Notional
Amount | | | Net Premiums
Paid/(Received) | | | Unrealized
Gain/(Loss) | |
| | Credit Default Swaps - Sell Protection† | | | | | | | | | | | | | | | | | | | | | | | | | | | | | | | | |
Receive | | American International Group, Inc. | | | 5.00 | % | | | JPM | | | | 09/20/16 | | | | A- | | | | USD | | | $ | 800,000 | | | | ($57,065 | ) | | $ | 183,525 | |
Receive | | Brazil Federative Republic Bond | | | 1.52 | % | | | MSC | | | | 01/20/17 | | | | BBB- | | | | USD | | | | 3,000,000 | | | | — | | | | 89,676 | |
Receive | | Brazil Federative Republic Bond | | | 1.95 | % | | | MSC | | | | 08/20/16 | | | | BBB- | | | | USD | | | | 3,500,000 | | | | — | | | | 186,330 | |
Receive | | Brazil Federative Republic Bond | | | 1.00 | % | | | JPM | | | | 09/20/15 | | | | BBB- | | | | USD | | | | 1,400,000 | | | | (15,211 | ) | | | 18,564 | |
Receive | | Brazil Federative Republic Bond | | | 1.00 | % | | | UBS | | | | 09/20/15 | | | | BBB- | | | | USD | | | | 1,000,000 | | | | (9,209 | ) | | | 11,604 | |
Receive | | Brazil Federative Republic Bond | | | 1.00 | % | | | CS | | | | 06/20/15 | | | | BBB- | | | | USD | | | | 2,200,000 | | | | (50,566 | ) | | | 58,078 | |
Receive | | CDX.EM.12 Index | | | 5.00 | % | | | DUB | | | | 12/20/14 | | | | N/A | | | | USD | | | | 1,000,000 | | | | 82,012 | | | | 40,676 | |
The accompanying notes are an integral part of these financial statements.
22
Managers PIMCO Bond Fund
Notes to Schedule of Portfolio Investments (continued)
| | | | | | | | | | | | | | | | | | | | | | | | | | | | | | | | | | |
Pay/Receive Fixed Rate | | Reference Entity | | Fixed
Rate | | | Counterparty | | | Maturity | | | Rating‡ | | | Currency | | | Notional
Amount | | | Net Premiums
Paid/(Received) | | | Unrealized
Gain/(Loss) | |
Receive | | CDX.EM.13 Index | | | 5.00 | % | | | DUB | | | | 12/20/14 | | | | N/A | | | | USD | | | $ | 1,000,000 | | | $ | 105,988 | | | $ | 28,951 | |
Receive | | CDX.EM.13 Index | | | 5.00 | % | | | DUB | | | | 06/20/15 | | | | N/A | | | | USD | | | | 5,800,000 | | | | 663,653 | | | | 118,996 | |
Receive | | CDX.EM.13 Index | | | 5.00 | % | | | JPM | | | | 06/20/15 | | | | N/A | | | | USD | | | | 4,600,000 | | | | 505,142 | | | | 115,579 | |
Receive | | CDX.EM.14 Index | | | 5.00 | % | | | JPM | | | | 12/20/15 | | | | N/A | | | | USD | | | | 700,000 | | | | 90,897 | | | | 11,373 | |
Receive | | CDX.EM.14 Index | | | 5.00 | % | | | UBS | | | | 12/20/15 | | | | N/A | | | | USD | | | | 900,000 | | | | 123,176 | | | | 8,313 | |
Receive | | CDX.EM.14 Index | | | 5.00 | % | | | DUB | | | | 12/20/15 | | | | N/A | | | | USD | | | | 4,100,000 | | | | 526,303 | | | | 72,704 | |
Receive | | CDX.NA.HY. 15 Index | | | 5.00 | % | | | UBS | | | | 12/20/15 | | | | N/A | | | | USD | | | | 2,200,000 | | | | (21,711 | ) | | | 43,553 | |
Receive | | CDX.NA.HY. 15 Index | | | 5.00 | % | | | DUB | | | | 12/20/15 | | | | N/A | | | | USD | | | | 4,900,000 | | | | (36,266 | ) | | | 84,916 | |
Receive | | CDX.NA.HY. 15 Index | | | 5.00 | % | | | JPM | | | | 12/20/15 | | | | N/A | | | | USD | | | | 4,800,000 | | | | (47,046 | ) | | | 94,703 | |
Receive | | CDX.NA.IG.15 Index | | | 1.00 | % | | | JPM | | | | 12/20/15 | | | | N/A | | | | USD | | | | 11,100,000 | | | | 17,549 | | | | 25,608 | |
Receive | | CDX.NA.IG.15 Index | | | 1.00 | % | | | BOA | | | | 12/20/15 | | | | N/A | | | | USD | | | | 400,000 | | | | (1,633 | ) | | | 3,189 | |
Receive | | CDX.NA.IG.15 Index | | | 1.00 | % | | | DUB | | | | 12/20/15 | | | | N/A | | | | USD | | | | 7,500,000 | | | | (16,065 | ) | | | 45,225 | |
Receive | | CDX.NA.IG.15 Index | | | 1.00 | % | | | CS | | | | 12/20/15 | | | | N/A | | | | USD | | | | 23,000,000 | | | | (86,070 | ) | | | 175,495 | |
Receive | | China Government | | | 1.00 | % | | | RBS | | | | 06/20/15 | | | | A+ | | | | USD | | | | 1,900,000 | | | | 28,795 | | | | 12,240 | |
Receive | | Citigroup Inc. | | | 1.00 | % | | | BRC | | | | 03/20/11 | | | | A- | | | | USD | | | | 200,000 | | | | (401 | ) | | | 891 | |
Receive | | Citigroup Inc. | | | 1.00 | % | | | UBS | | | | 03/20/11 | | | | A- | | | | USD | | | | 800,000 | | | | (1,515 | ) | | | 3,476 | |
Receive | | French Republic Government | | | 0.25 | % | | | RBS | | | | 12/20/15 | | | | AAA | | | | USD | | | | 1,000,000 | | | | (19,707 | ) | | | (2,306 | ) |
Receive | | French Republic Government | | | 0.25 | % | | | UBS | | | | 12/20/15 | | | | AAA | | | | USD | | | | 1,000,000 | | | | (20,214 | ) | | | (1,799 | ) |
Receive | | General Electric Capital Corp. | | | 5.00 | % | | | JPM | | | | 09/20/11 | | | | AA | | | | USD | | | | 2,000,000 | | | | 38,659 | | | | 47,002 | |
Receive | | General Electric Capital Corp. | | | 1.00 | % | | | DUB | | | | 09/20/11 | | | | AA | | | | USD | | | | 3,600,000 | | | | (24,856 | ) | | | 32,917 | |
Receive | | General Electric Capital Corp. | | | 1.00 | % | | | DUB | | | | 03/20/16 | | | | AA+ | | | | USD | | | | 300,000 | | | | (16,591 | ) | | | 9,516 | |
Receive | | Japan Government | | | 1.00 | % | | | DUB | | | | 03/20/15 | | | | AA | | | | USD | | | | 400,000 | | | | 4,021 | | | | 5,650 | |
Receive | | Japan Government | | | 1.00 | % | | | JPM | | | | 03/20/15 | | | | AA | | | | USD | | | | 600,000 | | | | 6,155 | | | | 8,350 | |
Receive | | Merrill Lynch & Co., Inc. | | | 1.00 | % | | | JPM | | | | 12/20/11 | | | | A | | | | USD | | | | 3,000,000 | | | | (8,481 | ) | | | 4,326 | |
Receive | | Mexico Government | | | 1.00 | % | | | BRC | | | | 03/20/15 | | | | BBB | | | | USD | | | | 700,000 | | | | (13,475 | ) | | | 14,858 | |
Receive | | Mexico Government | | | 1.00 | % | | | DUB | | | | 03/20/15 | | | | BBB | | | | USD | | | | 1,100,000 | | | | (21,609 | ) | | | 23,782 | |
Receive | | Mexico Government | | | 1.00 | % | | | UBS | | | | 09/20/15 | | | | BBB | | | | USD | | | | 1,000,000 | | | | (13,768 | ) | | | 13,029 | |
Receive | | Royal Bank of Scotland PLC | | | 5.00 | % | | | RBS | | | | 12/20/15 | | | | A | | | | USD | | | | 1,200,000 | | | | (8,141 | ) | | | 20,056 | |
Receive | | United Kingdom Gilt | | | 1.00 | % | | | JPM | | | | 12/20/14 | | | | AAA | | | | USD | | | | 200,000 | | | | 1,233 | | | | 3,548 | |
Receive | | United Kingdom Gilt | | | 1.00 | % | | | BPS | | | | 12/20/14 | | | | AAA | | | | USD | | | | 200,000 | | | | 1,233 | | | | 3,548 | |
Receive | | United Kingdom Gilt | | | 1.00 | % | | | BPS | | | | 03/20/15 | | | | AAA | | | | USD | | | | 700,000 | | | | 2,848 | | | | 13,940 | |
Receive | | United Kingdom Gilt | | | 1.00 | % | | | JPM | | | | 03/20/15 | | | | AAA | | | | USD | | | | 1,300,000 | | | | 4,758 | | | | 26,419 | |
Receive | | United Kingdom Gilt | | | 1.00 | % | | | DUB | | | | 12/20/14 | | | | AAA | | | | USD | | | | 1,400,000 | | | | 8,097 | | | | 25,370 | |
Receive | | United Kingdom Gilt | | | 1.00 | % | | | JPM | | | | 06/20/15 | | | | AAA | | | | USD | | | | 3,900,000 | | | | 40,343 | | | | 53,442 | |
Receive | | United Kingdom Gilt | | | 1.00 | % | | | JPM | | | | 12/20/15 | | | | AAA | | | | USD | | | | 1,000,000 | | | | 23,022 | | | | 1,152 | |
Receive | | U.S. Treasury | | | 0.25 | % | | | UBS | | | | 09/20/15 | | | | AAA | | | | EUR | | | | 5,000,000 | | | | (71,431 | ) | | | 25,857 | |
| | | | | | | | | | | | | | | | | | | | | | | | | | | | | | | | | | |
| | | | | | | | | | | | | | | | | | | | | | | | | Totals | | | $ | 1,712,853 | | | $ | 1,762,322 | |
| | | | | | | | | | | | | | | | | | | | | | | | | | | | | | | | | | |
The accompanying notes are an integral part of these financial statements.
23
Managers PIMCO Bond Fund
Notes to Schedule of Portfolio Investments (continued)
| † | If the Fund is a seller of protection and a credit event occurs, as defined under the terms of that particular swap agreement, the Fund will either (a) pay to the buyer of protection an amount equal to the notional amount of the swap and take delivery of the referenced obligation, or (b) pay a net settlement in the form of cash or securities equal to the notional amount of the swap less the recovery value of the referenced obligation. |
| ‡ | The period end reference entity ratings are included in the equivalent S&P “unaudited” rating category. The reference entity rating represents the likelihood of a potential credit event on the reference entity which would result in a related payment by the Fund. |
At October 31, 2010, the Fund had the following written put and call options and swaptions:
(See Note 10 in the Notes to the Financial Statements.)
| | | | | | | | | | | | | | | | | | | | | | | | | | | | |
Pay/Receive Floating Rate | | Description | | Counterparty | | | Floating Rate Index | | Exercise
Rate | | | Expiration
Date | | | Notional
Amount | | | Premium | | | Unrealized
Gain/(Loss) | |
Swaptions | | Swaptions | | | | | | | | | | | | | | | | | | | | | | | | | | |
Receive | | 2-Year Interest Rate Swap (Put) | | | RBS | | | 3-Month USD-LIBOR | | | 2.250 | % | | | 09/24/12 | | | $ | 74,000,000 | | | $ | 577,730 | | | $ | 251,685 | |
Receive | | 3-Year Interest Rate Swap (Put) | | | JPM | | | 3-Month USD-LIBOR | | | 3.000 | % | | | 06/18/12 | | | | 37,200,000 | | | | 376,477 | | | | 248,643 | |
Receive | | 3-Year Interest Rate Swap (Put) | | | RBS | | | 3-Month USD-LIBOR | | | 3.000 | % | | | 06/18/12 | | | | 45,100,000 | | | | 415,008 | | | | 260,027 | |
Receive | | 3-Year Interest Rate Swap (Put) | | | DUB | | | 3-Month USD-LIBOR | | | 3.000 | % | | | 06/18/12 | | | | 14,000,000 | | | | 152,411 | | | | 104,301 | |
Receive | | 3-Year Interest Rate Swap (Put) | | | DUB | | | 3-Month USD-LIBOR | | | 2.750 | % | | | 06/18/12 | | | | 17,300,000 | | | | 179,584 | | | | 102,333 | |
Receive | | 3-Year Interest Rate Swap (Put) | | | RBS | | | 3-Month USD-LIBOR | | | 2.750 | % | | | 06/18/12 | | | | 14,600,000 | | | | 143,080 | | | | 77,885 | |
Receive | | 5-Year Interest Rate Swap (Call) | | | CS | | | 3-Month USD-LIBOR | | | 1.350 | % | | | 12/13/10 | | | | 15,300,000 | | | | 36,338 | | | | (1,486 | ) |
Receive | | 5-Year Interest Rate Swap (Put) | | | DUB | | | 3-Month USD-LIBOR | | | 4.000 | % | | | 12/01/10 | | | | 1,400,000 | | | | 9,240 | | | | 9,240 | |
Receive | | 5-Year Interest Rate Swap (Put) | | | RBS | | | 3-Month USD-LIBOR | | | 4.000 | % | | | 12/01/10 | | | | 86,600,000 | | | | 556,625 | | | | 556,625 | |
Receive | | 5-Year Interest Rate Swap (Put) | | | RBS | | | 3-Month USD-LIBOR | | | 3.250 | % | | | 07/16/12 | | | | 3,700,000 | | | | 92,907 | | | | 47,911 | |
Receive | | 5-Year Interest Rate Swap (Put) | | | CS | | | 3-Month USD-LIBOR | | | 1.950 | % | | | 12/13/10 | | | | 15,300,000 | | | | 30,600 | | | | 20,206 | |
Receive | | 10-Year Interest Rate Swap (Call) | | | DUB | | | 3-Month USD-LIBOR | | | 2.250 | % | | | 12/13/10 | | | | 12,800,000 | | | | 56,320 | | | | 43,662 | |
Receive | | 10-Year Interest Rate Swap (Put) | | | DUB | | | 3-Month USD-LIBOR | | | 10.000 | % | | | 07/10/12 | | | | 78,800,000 | | | | 547,659 | | | | 544,424 | |
Receive | | 10-Year Interest Rate Swap (Put) | | | DUB | | | 3-Month USD-LIBOR | | | 5.000 | % | | | 01/24/11 | | | | 13,400,000 | | | | 139,360 | | | | 139,246 | |
Receive | | 10-Year Interest Rate Swap (Put) | | | DUB | | | 3-Month USD-LIBOR | | | 4.000 | % | | | 06/13/11 | | | | 7,400,000 | | | | 101,010 | | | | 63,902 | |
Receive | | 10-Year Interest Rate Swap (Put) | | | RBS | | | 3-Month USD-LIBOR | | | 4.000 | % | | | 06/13/11 | | | | 4,200,000 | | | | 59,365 | | | | 38,304 | |
Receive | | 10-Year Interest Rate Swap (Put) | | | DUB | | | 3-Month USD-LIBOR | | | 2.750 | % | | | 12/13/10 | | | | 12,800,000 | | | | 102,400 | | | | (67,906 | ) |
| | | | | | | | | | | | | | | | | | | | | | | | | | | | |
| | | | | | | | | | | | | | | | | | | Totals | | | $ | 3,576,114 | | | $ | 2,439,002 | |
| | | | | | | | | | | | | | | | | | | | | | | | | | | | |
| | | | | | | | | | | | | | | | | | | | | | | | |
Description | | Counterparty | | | Strike
Index | | | Expiration
Date | | | Notional
Amount | | | Premium | | | Unrealized
Gain/(Loss) | |
Inflation Floor | | | | | | | | | | | | | | | | | | | | | | | | |
Inflation Floor - OTC CPURNSA Index | | | DUB | | | | 215.949 | | | | 03/10/20 | | | $ | 11,400,000 | | | $ | 85,500 | | | | ($9,455 | ) |
| | | | | | | | | | | | | | | | | | | | | | | | |
Description | | Counterparty | | | Exercise
Price | | | Expiration
Date | | | Notional
Amount | | | Premium | | | Unrealized
Gain/(Loss) | |
Swaption Straddle Options | | | | | | | | | | | | | | | | | | | | | | | | |
1-Year OTC Option on 1-Year Swap Straddle vs. Forward Volatility Agreement | | | JPM | | | | TBD | | | | 10/11/11 | | | $ | 8,500,000 | | | $ | 43,180 | | | | ($6,220 | ) |
2-Year OTC Option on 2-Year Swap Straddle vs. Forward Volatility Agreement | | | MLC | | | | TBD | | | | 10/11/12 | | | | 27,900,000 | | | | 310,086 | | | | 12,695 | |
2-Year OTC Option on 2-Year Swap Straddle vs. Forward Volatility Agreement | | | MLC | | | | TBD | | | | 11/14/12 | | | | 14,700,000 | | | | 160,028 | | | | 5,868 | |
| | | | | | | | | | | | | | | | | | | | | | | | |
| | | | | | | | | | | | | | | Totals | | | $ | 513,294 | | | $ | 12,343 | |
| | | | | | | | | | | | | | | | | | | | | | | | |
The accompanying notes are an integral part of these financial statements.
24
Managers PIMCO Bond Fund
Notes to Schedule of Portfolio Investments (continued)
| | | | | | | | | | | | | | | | | | | | |
Description | | Exercise
Price | | | Expiration
Date | | | Number of
Contracts | | | Premium | | | Unrealized
Gain/(Loss) | |
Options on Exchange-Traded Futures | | | | | | | | | | | | | | | | | | | | |
1-Year Euro-Dollar Mid-Curve Futures (Call) | | $ | 127.000 | | | | 11/26/10 | | | | 20 | | | $ | 8,388 | | | | ($5,050 | ) |
5-Year U.S. Treasury Note Futures (Call) | | | 121.000 | | | | 11/26/10 | | | | 38 | | | | 19,499 | | | | (12,564 | ) |
5-Year U.S. Treasury Note Futures (Call) | | | 121.500 | | | | 11/26/10 | | | | 60 | | | | 15,772 | | | | (15,634 | ) |
5-Year U.S. Treasury Note Futures (Put) | | | 119.000 | | | | 11/26/10 | | | | 98 | | | | 53,958 | | | | 50,896 | |
10-Year U.S. Treasury Note Futures (Call) | | | 129.000 | | | | 11/26/10 | | | | 93 | | | | 40,799 | | | | 26,267 | |
10-Year U.S. Treasury Note Futures (Put) | | | 124.000 | | | | 11/26/10 | | | | 91 | | | | 31,023 | | | | 5,429 | |
10-Year U.S. Treasury Note Futures (Put) | | | 125.000 | | | | 11/26/10 | | | | 22 | | | | 8,195 | | | | (2,805 | ) |
| | | | | | | | | | | | | | | | | | | | |
| | | | | | | | | | | Totals | | | $ | 177,634 | | | $ | 46,539 | |
| | | | | | | | | | | | | | | | | | | | |
Transactions in written put and call options and swaptions for the fiscal year ended October 31, 2010, were as follows:
(See Note 10 in the Notes to the Financial Statements.)
| | | | | | | | | | | | |
| | | Number of
Contracts | | | Notional Amount | | | Amount of
Premiums | |
Options and swaptions outstanding at October 31, 2009 | | | 407 | | | $ | 307,000,000 | | | $ | 2,550,510 | |
Options and swaptions written | | | 3,629 | | | | 1,080,301,110 | | | | (9,250,747 | ) |
Options and swaptions exercised/expired | | | (3,614 | ) | | | (870,901,110 | ) | | | 11,052,779 | |
| | | | | | | | | | | | |
Options and swaptions outstanding at October 31, 2010 | | | 422 | | | $ | 516,400,000 | | | $ | 4,352,542 | |
| | | | | | | | | | | | |
At October 31, 2010, the Fund had the following forward foreign currency contracts (in U.S. Dollars):
(See Note 8 in the Notes to the Financial Statements.)
| | | | | | | | | | | | | | | | | | |
Foreign Currency | | Position | | Settlement Date | | Counterparty | | Receivable
Amount | | | Payable
Amount | | | Unrealized
Gain/(Loss) | |
Australian Dollar | | Long | | 12/03/10 | | CIT | | $ | 3,701,646 | | | $ | 3,727,336 | | | | ($25,690 | ) |
Brazilian Real | | Long | | 03/02/11 | | CIT | | | 22,910,198 | | | | 23,408,435 | | | | (498,237 | ) |
Brazilian Real | | Long | | 12/02/10 to 09/02/11 | | MSC | | | 21,452,524 | | | | 20,391,213 | | | | 1,061,311 | |
Brazilian Real | | Long | | 12/02/10 | | RBS | | | 1,971,920 | | | | 1,900,000 | | | | 71,920 | |
Canadian Dollar | | Long | | 11/18/10 | | CIT | | | 401,835 | | | | 399,144 | | | | 2,691 | |
Canadian Dollar | | Long | | 11/18/10 | | CS | | | 1,205,504 | | | | 1,196,209 | | | | 9,295 | |
Canadian Dollar | | Long | | 11/18/10 to 11/28/10 | | DUB | | | 5,935,233 | | | | 5,891,941 | | | | 43,292 | |
Canadian Dollar | | Long | | 11/18/10 | | JPM | | | 1,709,268 | | | | 1,693,976 | | | | 15,292 | |
Canadian Dollar | | Long | | 11/18/10 | | RBS | | | 1,297,632 | | | | 1,311,332 | | | | (13,700 | ) |
Canadian Dollar | | Long | | 11/18/10 | | UBS | | | 1,309,393 | | | | 1,309,317 | | | | 76 | |
Chinese Yuan Renminbi | | Long | | 11/23/10 | | BRC | | | 197,968 | | | | 199,000 | | | | (1,032 | ) |
Chinese Yuan Renminbi | | Long | | 11/17/10 | | CIT | | | 320,299 | | | | 322,000 | | | | (1,701 | ) |
Chinese Yuan Renminbi | | Long | | 11/17/10 | | DUB | | | 826,910 | | | | 832,288 | | | | (5,378 | ) |
Chinese Yuan Renminbi | | Long | | 11/15/11 | | JPM | | | 1,503,422 | | | | 1,529,006 | | | | (25,584 | ) |
Chinese Yuan Renminbi | | Long | | 11/17/10 to 11/23/10 | | MSC | | | 6,252,689 | | | | 6,166,794 | | | | 85,895 | |
Pound Sterling | | Long | | 12/20/10 | | JPM | | | 2,402,563 | | | | 2,355,403 | | | | 47,160 | |
Indonesian Rupiah | | Long | | 04/15/11 to 07/27/11 | | CIT | | | 2,308,859 | | | | 2,322,637 | | | | (13,778 | ) |
Indonesian Rupiah | | Long | | 11/24/10 to 07/27/11 | | DUB | | | 1,107,137 | | | | 1,100,576 | | | | 6,561 | |
The accompanying notes are an integral part of these financial statements.
25
Managers PIMCO Bond Fund
Notes to Schedule of Portfolio Investments (continued)
| | | | | | | | | | | | | | | | | | |
Foreign Currency | | Position | | Settlement Date | | Counterparty | | Receivable
Amount | | | Payable
Amount | | | Unrealized
Gain/(Loss) | |
Indonesian Rupiah | | Long | | 11/24/10 to 07/27/11 | | JPM | | $ | 4,432,194 | | | $ | 4,464,418 | | | | ($32,224 | ) |
Indonesian Rupiah | | Long | | 07/27/11 | | RBS | | | 192,343 | | | | 190,000 | | | | 2,343 | |
Indian Rupee | | Long | | 01/12/11 | | CIT | | | 706,311 | | | | 700,000 | | | | 6,311 | |
Indian Rupee | | Long | | 01/12/11 | | MSC | | | 1,013,896 | | | | 1,000,000 | | | | 13,896 | |
Japanese Yen | | Long | | 12/06/10 | | CIT | | | 302,741 | | | | 300,481 | | | | 2,260 | |
Japanese Yen | | Long | | 12/06/10 | | CS | | | 403,294 | | | | 398,389 | | | | 4,905 | |
Japanese Yen | | Long | | 12/06/10 | | JPM | | | 4,627,823 | | | | 4,584,326 | | | | 43,497 | |
South Korean Won | | Long | | 11/12/10 | | BRC | | | 53,662 | | | | 51,602 | | | | 2,060 | |
South Korean Won | | Long | | 11/12/10 | | CIT | | | 1,906,624 | | | | 1,880,529 | | | | 26,095 | |
South Korean Won | | Long | | 11/12/10 to 05/09/11 | | DUB | | | 386,649 | | | | 369,691 | | | | 16,958 | |
South Korean Won | | Long | | 11/12/10 | | GS | | | 62,513 | | | | 60,000 | | | | 2,513 | |
South Korean Won | | Long | | 11/12/10 to 05/09/11 | | JPM | | | 925,554 | | | | 918,972 | | | | 6,582 | |
South Korean Won | | Long | | 11/12/10 to 05/09/11 | | MSC | | | 5,604,685 | | | | 5,519,632 | | | | 85,053 | |
South Korean Won | | Long | | 11/12/10 to 05/09/11 | | RBS | | | 537,926 | | | | 531,462 | | | | 6,464 | |
Mexican Peso | | Long | | 02/22/11 | | CIT | | | 3,200,556 | | | | 3,094,671 | | | | 105,885 | |
Mexican Peso | | Long | | 02/22/11 | | DUB | | | 102,238 | | | | 100,000 | | | | 2,238 | |
Mexican Peso | | Long | | 02/22/11 | | JPM | | | 203,833 | | | | 200,000 | | | | 3,833 | |
Mexican Peso | | Long | | 02/22/11 | | MSC | | | 3,763,452 | | | | 3,700,000 | | | | 63,452 | |
Mexican Peso | | Long | | 02/22/11 | | UBS | | | 102,217 | | | | 100,000 | | | | 2,217 | |
Malaysian Ringgit | | Long | | 02/07/11 | | CIT | | | 306,473 | | | | 309,678 | | | | (3,205 | ) |
Malaysian Ringgit | | Long | | 02/07/11 | | DUB | | | 536,327 | | | | 541,324 | | | | (4,997 | ) |
Malaysian Ringgit | | Long | | 02/07/11 | | JPM | | | 1,382,876 | | | | 1,396,966 | | | | (14,090 | ) |
Malaysian Ringgit | | Long | | 02/07/11 | | RBS | | | 284,126 | | | | 287,403 | | | | (3,277 | ) |
Phillippine Peso | | Long | | 11/15/10 to 06/15/11 | | CIT | | | 1,803,520 | | | | 1,760,099 | | | | 43,421 | |
Phillippine Peso | | Long | | 11/15/10 | | DUB | | | 64,797 | | | | 59,974 | | | | 4,823 | |
Phillippine Peso | | Long | | 06/15/11 | | JPM | | | 1,715,448 | | | | 1,695,576 | | | | 19,872 | |
New Taiwan Dollar | | Long | | 1/14/11 to 04/06/11 | | DUB | | | 216,092 | | | | 214,131 | | | | 1,961 | |
New Taiwan Dollar | | Long | | 1/14/11 to 04/06/11 | | JPM | | | 435,081 | | | | 436,767 | | | | (1,686 | ) |
New Taiwan Dollar | | Long | | 01/14/11 | | MSC | | | 80,148 | | | | 77,995 | | | | 2,153 | |
New Taiwan Dollar | | Long | | 01/14/11 | | UBS | | | 43,393 | | | | 41,868 | | | | 1,525 | |
Singapore Dollar | | Long | | 11/12/10 to 03/09/11 | | CIT | | | 1,438,914 | | | | 1,400,000 | | | | 38,914 | |
Singapore Dollar | | Long | | 02/24/11 to 03/09/11 | | MSC | | | 507,352 | | | | 500,000 | | | | 7,352 | |
Singapore Dollar | | Long | | 06/09/11 | | DUB | | | 1,030,512 | | | | 1,023,272 | | | | 7,240 | |
Turkish Lira | | Long | | 01/27/11 | | CIT | | | 416,072 | | | | 400,000 | | | | 16,072 | |
Turkish Lira | | Long | | 01/27/11 | | JPM | | | 1,541,999 | | | | 1,500,000 | | | | 41,999 | |
Turkish Lira | | Long | | 01/27/11 | | CS | | | 207,226 | | | | 200,000 | | | | 7,226 | |
Brazilian Real | | Short | | 12/02/10 | | CIT | | | 23,854,643 | | | | 23,321,908 | | | | 532,735 | |
Canadian Dollar | | Short | | 11/18/10 | | JPM | | | 4,936,978 | | | | 5,126,824 | | | | (189,846 | ) |
Canadian Dollar | | Short | | 11/18/10 | | MSC | | | 699,367 | | | | 721,342 | | | | (21,975 | ) |
Canadian Dollar | | Short | | 11/18/10 | | CS | | | 1,665,006 | | | | 1,683,786 | | | | (18,780 | ) |
Canadian Dollar | | Short | | 11/18/10 | | RBS | | | 2,053,276 | | | | 2,060,138 | | | | (6,862 | ) |
Chinese Yuan Renminbi | | Short | | 11/17/10 | | JPM | | | 1,479,037 | | | | 1,472,665 | | | | 6,372 | |
Euro | | Short | | 11/23/10 | | DUB | | | 25,980,141 | | | | 28,228,076 | | | | (2,247,935 | ) |
Euro | | Short | | 11/23/10 | | UBS | | | 3,991,961 | | | | 4,122,827 | | | | (130,866 | ) |
The accompanying notes are an integral part of these financial statements.
26
Managers PIMCO Bond Fund
Notes to Schedule of Portfolio Investments (continued)
| | | | | | | | | | | | | | | | | | | | | | |
Foreign Currency | | Position | | | Settlement Date | | Counterparty | | | Receivable
Amount | | | Payable
Amount | | | Unrealized
Gain/(Loss) | |
Euro | | | Short | | | 11/23/10 | | | CS | | | $ | 265,968 | | | $ | 272,722 | | | | ($6,754 | ) |
Euro | | | Short | | | 11/23/10 | | | CIT | | | | 36,027 | | | | 38,960 | | | | (2,933 | ) |
Pound Sterling | | | Short | | | 12/20/10 | | | UBS | | | | 4,091,553 | | | | 4,198,078 | | | | (106,525 | ) |
Pound Sterling | | | Short | | | 12/20/10 | | | CS | | | | 91,155 | | | | 92,899 | | | | (1,744 | ) |
Pound Sterling | | | Short | | | 12/20/10 | | | DUB | | | | 106,668 | | | | 107,314 | | | | (646 | ) |
Indonesian Rupiah | | | Short | | | 11/24/10 | | | JPM | | | | 2,623,000 | | | | 2,613,520 | | | | 9,480 | |
Japanese Yen | | | Short | | | 11/01/10 | | | MSC | | | | 16,284,529 | | | | 17,031,266 | | | | (746,737 | ) |
Japanese Yen | | | Short | | | 12/06/10 | | | RBS | | | | 16,800,290 | | | | 17,036,568 | | | | (236,278 | ) |
South Korean Won | | | Short | | | 11/12/10 | | | CIT | | | | 2,345,311 | | | | 2,463,569 | | | | (118,258 | ) |
South Korean Won | | | Short | | | 11/12/10 | | | JPM | | | | 800,556 | | | | 843,829 | | | | (43,273 | ) |
South Korean Won | | | Short | | | 11/12/10 | | | RBS | | | | 416,845 | | | | 424,106 | | | | (7,261 | ) |
Phillippine Peso | | | Short | | | 11/15/10 | | | JPM | | | | 1,107,446 | | | | 1,115,735 | | | | (8,289 | ) |
Phillippine Peso | | | Short | | | 11/15/10 | | | CIT | | | | 375,573 | | | | 379,026 | | | | (3,453 | ) |
Singapore Dollar | | | Short | | | 11/12/10 | | | DUB | | | | 1,023,126 | | | | 1,030,451 | | | | (7,325 | ) |
South African Rand | | | Short | | | 01/28/11 | | | JPM | | | | 2,788,577 | | | | 2,846,432 | | | | (57,855 | ) |
South African Rand | | | Short | | | 01/28/2011 to 09/13/11 | | | MSC | | | | 1,379,202 | | | | 1,400,000 | | | | (20,798 | ) |
South African Rand | | | Short | | | 09/13/11 | | | UBS | | | | 207,215 | | | | 200,000 | | | | 7,215 | |
| | | | | | | | | | | | | | | | | | | | | | |
| | | | | | | | | Totals | | | $ | 232,757,317 | | | $ | 234,897,874 | | | | ($2,140,557 | ) |
| | | | | | | | | | | | | | | | | | | | | | |
Currency, Counterparty and Investment Abbreviations:
| | | | |
| AUD: Australian Dollar | | EUR: Euro | | |
| BRL: Brazilian Real | | MXN: Mexican Peso | | |
| | |
| BOA: Bank of America | | DUB: Deutsche Bank | | MLC: Merrill Lynch |
| BPS: BNP Paribas | | GS: Goldman Sachs | | MSC: Morgan Stanley |
| BRC: Barclays Bank | | HUS: HSBC Bank | | RBS: Royal Bank of Scotland |
| CS: Credit Suisse | | JPM: JPMorgan Chase | | UBS: UBS |
| CIT: Citigroup | | | | |
| |
| N/A: No composite rating is available for this index. | | |
| OTC: Over-the-counter | | | | |
| TBD: To be determined | | | | |
The accompanying notes are an integral part of these financial statements.
27
Managers PIMCO Bond Fund
Statement of Assets and Liabilities
October 31, 2010
| | | | |
Assets: | | | | |
Investments at value* (including securities on loan valued at $162,064,988) | | $ | 1,934,268,560 | |
Foreign currency** | | | 607,986 | |
Receivable for delayed delivery investments sold | | | 32,683,713 | |
Receivable for investments sold | | | 91,779,791 | |
Receivable for Fund shares sold | | | 3,596,164 | |
Swap premiums paid | | | 2,615,931 | |
Unrealized appreciation on swaps | | | 4,555,596 | |
Variation margin receivable | | | 66,794 | |
Unrealized appreciation on foreign currency contracts | | | 2,546,273 | |
Dividends, interest and other receivables | | | 9,279,232 | |
Receivable from affiliate | | | 138,773 | |
Prepaid expenses | | | 50,652 | |
Total assets | | | 2,082,189,465 | |
Liabilities: | | | | |
Payable for investments purchased | | | 97,219,135 | |
Payable to brokers upon termination of swap contracts | | | 3,979,011 | |
Payable for delayed delivery investments purchased | | | 368,044,483 | |
Payable for TBA sale commitments | | | 3,257,346 | |
Payable for Fund shares repurchased | | | 9,079,210 | |
Payable upon return of securities loaned | | | 165,243,217 | |
Options written (premiums received $4,352,542) | | | 1,864,113 | |
Swap premiums received | | | 646,784 | |
Unrealized depreciation on swaps | | | 1,240,198 | |
Unrealized depreciation on foreign currency contracts | | | 4,686,829 | |
Dividends payable to shareholders | | | 519,469 | |
Accrued expenses: | | | | |
Investment advisory and management fees | | | 482,347 | |
Administrative fees | | | 242,174 | |
Other | | | 344,525 | |
Total liabilities | | | 656,848,841 | |
Net Assets | | $ | 1,425,340,624 | |
Shares outstanding | | | 126,797,084 | |
Net asset value, offering and redemption price per share | | $ | 11.24 | |
Net Assets Represent: | | | | |
Paid-in capital | | $ | 1,321,277,041 | |
Undistributed net investment loss | | | 8,639,343 | |
Accumulated net realized gain from investments, options, futures, swaps, and foreign currency transactions | | | 57,014,259 | |
Net unrealized appreciation of investments, options, futures, swaps, and foreign currency translations | | | 38,409,981 | |
Net Assets | | $ | 1,425,340,624 | |
* Investments at cost | | $ | 1,900,787,489 | |
** Foreign currency at cost | | $ | 367,730 | |
The accompanying notes are an integral part of these financial statements.
28
Managers PIMCO Bond Fund
Statement of Operations
For the fiscal year ended October 31, 2010
| | | | |
Investment Income: | | | | |
Interest income | | $ | 37,227,076 | |
Dividend income | | | 461,918 | |
Securities lending fees | | | 33,849 | |
Total investment income | | | 37,722,843 | |
Expenses: | | | | |
Investment advisory and management fees | | | 5,091,308 | |
Administrative fees | | | 2,948,630 | |
Transfer agent | | | 404,890 | |
Professional fees | | | 318,753 | |
Custodian | | | 290,920 | |
Reports to shareholders | | | 142,081 | |
Trustees fees and expenses | | | 95,860 | |
Registration fees | | | 67,207 | |
Insurance | | | 52,276 | |
Miscellaneous | | | 22,083 | |
Total expenses before offsets | | | 9,434,008 | |
Expense reimbursements | | | (1,643,094 | ) |
Fee waivers | | | (402,977 | ) |
Expense reductions | | | (2,210 | ) |
Net expenses | | | 7,385,727 | |
Net investment income | | | 30,337,116 | |
Net Realized and Unrealized Gain (Loss): | | | | |
Net realized gain on investments, options, futures and swap transactions | | | 68,241,328 | |
Net realized gain on foreign currency transactions | | | 4,090,942 | |
Net change in unrealized appreciation of investments, options, futures, swaps and foreign currency translations | | | 27,514,704 | |
Net realized and unrealized gain | | | 99,846,974 | |
Net increase in net assets resulting from operations | | $ | 130,184,090 | |
The accompanying notes are an integral part of these financial statements.
29
Managers PIMCO Bond Fund
Statement of Changes in Net Assets
For the fiscal year ended October 31,
| | | | | | | | |
| | | 2010 | | | 2009 | |
Increase (Decrease) in Net Assets From Operations: | | | | | | | | |
Net investment income | | $ | 30,337,116 | | | $ | 37,657,178 | |
Net realized gain on investments, options, futures, swaps and foreign currency transactions | | | 72,332,270 | | | | 49,219,652 | |
Net change in unrealized appreciation of investments, options, futures, swaps and foreign currency translations | | | 27,514,704 | | | | 103,136,316 | |
Net increase in net assets resulting from operations | | | 130,184,090 | | | | 190,013,146 | |
Distributions to Shareholders: | | | | | | | | |
From net investment income | | | (37,655,274 | ) | | | (49,075,351 | ) |
From net realized gain on investments | | | (14,261,392 | ) | | | (69,131,312 | ) |
Total distributions to shareholders | | | (51,916,666 | ) | | | (118,206,663 | ) |
From Capital Share Transactions: | | | | | | | | |
Proceeds from the sale of shares | | | 522,015,610 | | | | 384,079,754 | |
Reinvestment of dividends | | | 44,372,952 | | | | 104,726,190 | |
Cost of shares repurchased | | | (333,479,229 | ) | | | (482,953,055 | ) |
Net increase from capital share transactions | | | 232,909,333 | | | | 5,852,889 | |
Total increase in net assets | | | 311,176,757 | | | | 77,659,372 | |
Net Assets: | | | | | | | | |
Beginning of year | | | 1,114,163,867 | | | | 1,036,504,495 | |
End of year | | $ | 1,425,340,624 | | | $ | 1,114,163,867 | |
End of year undistributed net investment income | | $ | 8,639,343 | | | $ | 4,372,366 | |
| | | | | | | | |
Share Transactions: | | | | | | | | |
Sale of shares | | | 48,516,222 | | | | 38,751,647 | |
Shares issued in connection with reinvestment of dividends | | | 4,170,494 | | | | 11,025,577 | |
Shares repurchased | | | (30,911,673 | ) | | | (50,015,482 | ) |
Net increase (decrease) in shares | | | 21,775,043 | | | | (238,258 | ) |
The accompanying notes are an integral part of these financial statements.
30
Managers PIMCO Bond Fund
Financial Highlights
For a share outstanding throughout each fiscal year
| | | | | | | | | | | | | | | | | | | | |
| | | For the fiscal year ended October 31, | |
| | | 2010 | | | 2009 | | | 2008 | | | 2007 | | | 2006 | |
Net Asset Value, Beginning of Year | | $ | 10.61 | | | $ | 9.85 | | | $ | 10.41 | | | $ | 10.31 | | | $ | 10.31 | |
Income from Investment Operations: | | | | | | | | | | | | | | | | | | | | |
Net investment income | | | 0.35 | | | | 0.49 | | | | 0.57 | | | | 0.47 | | | | 0.47 | |
Net realized and unrealized gain (loss) on investments | | | 0.73 | | | | 1.44 | | | | (0.61 | ) | | | 0.13 | | | | (0.00 | )3 |
Total from investment operations | | | 1.08 | | | | 1.93 | | | | (0.04 | ) | | | 0.60 | | | | 0.47 | |
Less Distributions to Shareholders from: | | | | | | | | | | | | | | | | | | | | |
Net investment income | | | (0.32 | ) | | | (0.49 | ) | | | (0.52 | ) | | | (0.50 | ) | | | (0.47 | ) |
Net realized gain on investments | | | (0.13 | ) | | | (0.68 | ) | | | — | | | | — | | | | — | |
Total distributions to shareholders | | | (0.45 | ) | | | (1.17 | ) | | | (0.52 | ) | | | (0.47 | ) | | | (0.47 | ) |
Net Asset Value, End of Year | | $ | 11.24 | | | $ | 10.61 | | | $ | 9.85 | | | $ | 10.41 | | | $ | 10.31 | |
Total Return1 | | | 10.52 | % | | | 20.62 | % | | | (0.60 | )% | | | 5.96 | % | | | 4.75 | % |
Ratio of net operating expenses to average net assets | | | 0.58 | % | | | 0.58 | % | | | 0.58 | % | | | 0.60 | % | | | 0.60 | % |
Ratio of net investment income to average net assets1 | | | 2.38 | % | | | 3.78 | % | | | 4.47 | % | | | 4.86 | % | | | 4.72 | % |
Portfolio turnover | | | 359 | % | | | 531 | % | | | 431 | % | | | 249 | % | | | 244 | % |
Net assets at end of year (000’s omitted) | | $ | 1,425,341 | | | $ | 1,114,164 | | | $ | 1,036,504 | | | $ | 1,207,072 | | | $ | 1,163,251 | |
| | | | | | | | | | | | | | | | | | | | |
Ratios absent expense offsets:2 | | | | | | | | | | | | | | | | | | | | |
Ratio of total expenses to average net assets | | | 0.74 | % | | | 0.78 | % | | | 0.75 | % | | | 0.77 | % | | | 0.77 | % |
Ratio of net investment income to average net assets | | | 2.22 | % | | | 3.58 | % | | | 4.30 | % | | | 4.69 | % | | | 4.55 | % |
| | | | | | | | | | | | | | | | | | | | |
| 1 | Total returns and net investment income would have been lower had certain expenses not been reduced. (See Note 1(c) of Notes to Financial Statements.) |
| 2 | Excludes the impact of expense reimbursements or fee waivers and expense reductions such as brokerage credits, but includes nonreimbursable expenses, if any, such as interest and taxes. (See Note 1(c) of Notes to Financial Statements.) |
| 3 | Rounds to less than ($0.01) per share. |
31
Managers PIMCO Bond Fund
Notes to Financial Statements
October 31, 2010
| 1. | Summary of Significant Accounting Policies |
Managers Trust I (the “Trust”) is an open-end management investment company organized as a Massachusetts business trust and registered under the Investment Company Act of 1940, as amended (the “1940 Act”). Currently, the Trust is comprised of a number of investment series. Included in this report is the Managers PIMCO Bond Fund (the “Fund”) (formerly Managers Fremont Bond Fund). Effective January 1, 2010, the Fund was renamed Managers PIMCO Bond Fund.
The Fund’s financial statements are prepared in accordance with accounting principles generally accepted in the United States of America, which require management to make estimates and assumptions that affect the reported amounts of assets and liabilities and disclosure of contingent assets and liabilities at the date of the financial statements and the reported amounts of income and expenses during the reporting periods. Actual results could differ from those estimates and such differences could be material. The following is a summary of significant accounting policies followed by the Fund in the preparation of its financial statements:
| a. | Valuation of Investments |
Equity securities traded on a domestic or international securities exchange are valued at the last quoted sale price, or, lacking any sales, at the last quoted bid price. Over-the-counter securities are valued at the Nasdaq Official Closing Price, if one is available. Lacking any sales, over-the-counter securities are valued at the last quoted bid price. The Fund’s investments are generally valued based on market quotations provided by the third-party pricing services approved by the Board of Trustees of the Fund. Under certain circumstances, the value of certain Fund investments may be based on an evaluation of its fair value, pursuant to procedures established by and under the general supervision of the Board of Trustees of the Fund. The Fund may use the fair value of a portfolio security to calculate its NAV when, for example, (1) market quotations are not readily available because a portfolio security is not traded in a public market or the principal market in which the security trades is closed, (2) trading in a portfolio security is suspended and has not resumed before the Fund calculates its NAV, (3) a significant event affecting the value of a portfolio security is determined to have occurred between the time of the market quotation provided for a portfolio security and the time as of which the Fund calculates its NAV, (4) a security’s price has remained unchanged over a period of time (often referred to as a “stale price”), or (5) Managers Investment Group LLC (the “Investment Manager”) determines that a market quotation is inaccurate. Portfolio investments that trade primarily on foreign markets are priced based upon the market quotation of such securities as of the close of their respective principal markets, as adjusted to reflect the Investment Manager’s determination of the impact of events occurring subsequent to the close of such markets but prior to the time as of which the Fund calculates its NAV. In accordance with procedures approved by the Board of Trustees, the Investment Manager relies upon recommendations of a third-party fair valuation service in adjusting the prices of such foreign portfolio investments. The Fund may invest in securities that may be thinly traded. The Board of Trustees has adopted procedures to adjust prices when thinly traded securities are judged to be stale so that they reflect fair value. An investment valued on the basis of its fair value may be valued at a price higher or lower than available market quotations. An investment’s valuation may differ depending on the method used and the factors considered in determining value according to the Fund’s fair value procedures.
Fixed-income securities are valued based on valuations furnished by independent pricing services that utilize matrix systems, which reflect such factors as security prices, yields, maturities, and ratings, and are supplemented by dealer and exchange quotations. Futures contracts for which market quotations are readily available are valued at the settlement price as of the close of the futures exchange. Short-term investments having a remaining maturity of 60 days or less are valued at amortized cost, which approximates market value. Investments in other regulated investment companies are valued at their end of day net asset value per share. Investments in certain mortgage-backed and stripped mortgage-backed securities, preferred stocks, convertible securities, derivatives and other debt securities not traded on an organized securities market are valued on the basis of valuations provided by dealers or by a pricing service which uses information with respect to transactions in such securities and various relationships between securities and yield to maturity in determining value. Securities (including derivatives) for which market quotations are not readily available are valued at fair value, as determined in good faith, and pursuant to procedures adopted by the Board of Trustees of the Trust. The values assigned to fair value investments are based on available information and do not necessarily represent amounts that might ultimately be realized, since such amounts depend on future developments inherent in long-term investments. Further, because of the inherent uncertainty of valuation, those estimated values may differ significantly from the values that would have been used had a ready market for the investments existed, and the differences could be material.
Generally Accepted Accounting Principles (GAAP) define fair value as the price that a Fund would receive to sell an asset or pay to transfer a liability in an orderly transaction between market participants at the measurement date. GAAP also establishes a framework for measuring fair value, and a three-level hierarchy for fair value measurements based upon the transparency of inputs to the valuation of an asset or liability. Inputs may be observable or unobservable and refer broadly to the assumptions that market participants would use in pricing the asset or liability. Observable inputs reflect the assumptions market participants would use in pricing the asset or liability based on market data obtained from sources independent of the Fund. Unobservable inputs reflect the Fund’s own assumptions about the assumptions that market participants would use in pricing the asset or liability developed based on the best information available in the circumstances. Each investment is assigned a level based upon the observability of the inputs which are significant to the overall valuation.
32
Managers PIMCO Bond Fund
Notes to Financial Statements (continued)
The three-tier hierarchy of inputs is summarized below:
Level 1 — inputs are quoted prices in active markets for identical investments (i.e. equity securities, open-end investment companies, futures contracts, options contracts)
Level 2 — other observable inputs (including, but not limited to: quoted prices for similar assets or liabilities in markets that are active, quoted prices for identical or similar assets or liabilities in markets that are not active, inputs other than quoted prices that are observable for the assets or liabilities (such as interest rates, yield curves, volatilities, prepayment speeds, loss severities, credit risks and default rates) or other market corroborated inputs) (i.e. debt securities, government securities, swap contracts, foreign currency exchange contracts, foreign securities utilizing international fair value pricing)
Level 3 — inputs are significant unobservable inputs (including the Fund’s own assumptions used to determine the fair value of investments) (i.e. broker-quoted securities, fair valued securities)
The inputs or methodologies used for valuing investments are not necessarily an indication of the risk associated with investing in those investments.
Security transactions are accounted for as of the trade date. Realized gains and losses on securities sold are determined on the basis of identified cost.
| c. | Investment Income and Expenses |
Dividend income is recorded on the ex-dividend date except certain dividends from foreign securities where the ex-dividend date may have passed. These dividends are recorded as soon as the Trust is informed of the ex-dividend date. Dividend income on foreign securities is recorded net of any withholding tax. Interest income, which includes amortization of premium and accretion of discount on debt securities, as required, is accrued as earned. Non-cash dividends included in dividend income, if any, are reported at the fair market value of the securities received. Other income and expenses are recorded on an accrual basis. Expenses that cannot be directly attributed to a fund are apportioned among the Funds in the Trust and in some cases other affiliated funds based upon their relative average net assets or number of shareholders.
The Fund has a “balance credit” arrangement with The Bank of New York Mellon (“BNYM”), the Fund’s custodian, whereby the Fund is credited with an interest factor equal to 0.75% below the effective 90-day T-Bill rate for account balances left uninvested overnight. If the T-Bill rate falls below 0.75%, no credits will be earned. These credits serve to reduce custody expenses that would otherwise be charged to the Fund. For the fiscal year ended October 31, 2010, there were no balance credits to reduce the custodian expense.
Overdrafts will cause a reduction of any earnings credits, computed at 2% above the Federal funds rate on the day of the overdraft. For the fiscal year ended October 31, 2010, overdraft fees equaled $63.
The Trust also has a balance credit arrangement with its Transfer Agent, BNY Mellon Investment Servicing (US) Inc. (formerly PNC Global Investment Servicing (U.S.) Inc.), whereby earnings credits are used to offset banking charges and other out-of-pocket expenses. For the fiscal year ended October 31, 2010, the transfer agent expense was reduced by $2,210.
Total returns and net investment income for the Fund would have been lower had certain expenses not been offset. Total expenses before offsets exclude the impact of expense reimbursements or fee waivers and expense offsets such as brokerage recapture credits, but include non-reimbursable expenses, if any, such as interest and taxes.
| d. | Dividends and Distributions |
Dividends resulting from net investment income, if any, normally will be declared daily and paid monthly. Distributions of capital gains, if any, will be made on an annual basis and when required for Federal excise tax purposes. Income and capital gain distributions are determined in accordance with Federal income tax regulations, which may differ from GAAP. These differences are primarily due to differing treatments for losses deferred due to wash sales, equalization accounting for tax purposes, foreign currency, options, futures and market discount transactions. Permanent book and tax basis differences, if any, relating to shareholder distributions will result in reclassifications to paid-in capital. The tax character of distributions paid during the fiscal years ended October 31, 2010 and 2009 were as follows:
| | | | | | | | |
Distributions paid from: | | 2010 | | | 2009 | |
Ordinary income | | $ | 37,655,274 | | | $ | 49,075,351 | |
Short-term capital gains | | | 14,261,392 | | | | 47,684,315 | |
Long-term capital gains | | | — | | | | 21,446,997 | |
| | | | | | | | |
| | $ | 51,916,666 | | | $ | 118,206,663 | |
| | | | | | | | |
As of October 31, 2010, the components of distributable earnings (excluding unrealized appreciation/depreciation) on a tax basis consisted of:
| | | | |
Capital loss carryforward | | | — | |
Undistributed ordinary income | | $ | 7,184,752 | |
Undistributed short-term capital gains | | | 39,288,874 | |
Undistributed long-term capital gains | | | 18,948,873 | |
The Fund intends to comply with the requirements under Subchapter M of the Internal Revenue Code of 1986, as amended, to distribute substantially all of its taxable income and gains to its shareholders and to meet certain diversification and income requirements with respect to investment companies. Therefore, no provision for Federal income or excise tax is included in the accompanying financial statements.
33
Managers PIMCO Bond Fund
Notes to Financial Statements (continued)
Additionally, based on the Fund’s understanding of the tax rules and rates related to income, gains and transactions for the foreign jurisdictions in which it invests, the Fund will provide for foreign taxes, and where appropriate, deferred foreign taxes.
Management has analyzed the Fund’s tax positions taken on federal income tax returns for all open tax years (tax years ended October 31, 2007-2010), and has concluded that no provision for federal income tax is required in the Fund’s financial statements. Additionally, the Fund is not aware of any tax position for which it is reasonably possible that the total amounts of unrecognized tax benefits will change materially in the next twelve months.
The Trust’s Declaration of Trust authorizes for each series the issuance of an unlimited number of shares of beneficial interest, without par value. The Fund records sales and repurchases of its capital stock on the trade date. The cost of securities contributed to the Fund in connection with the issuance of shares is based on the valuation of those securities in accordance with the Fund’s policy on investment valuation. Dividends and distributions to shareholders are recorded on the ex-dividend date.
At October 31, 2010, certain unaffiliated shareholders of record, specifically omnibus accounts, individually held greater than 10% of the outstanding shares of the Fund as follows: 2 collectively own 37%. Transactions by these shareholders may have a material impact on the Fund.
The Fund may enter into repurchase agreements provided that the value of the underlying collateral, including accrued interest, will equal or exceed the value of the repurchase agreement during the term of the agreement. The underlying collateral for all repurchase agreements is held in safekeeping by the Fund’s custodian or at the Federal Reserve Bank. If the seller defaults and the value of the collateral declines, or if bankruptcy proceedings commence with respect to the seller of the security, realization of the collateral by the Fund may be delayed or limited. At October 31, 2010, the market value of repurchase agreements outstanding was $57,100,000.
| h. | Foreign Currency Translation |
The books and records of the Fund are maintained in U.S. dollars. The value of investments, assets and liabilities denominated in currencies other than U.S. dollars are translated into U.S. dollars based upon current foreign exchange rates. Purchases and sales of foreign investments, income and expenses are converted into U.S. dollars based on currency exchange rates prevailing on the respective dates of such transactions. Net realized and unrealized gain (loss) on foreign currency transactions represent: (1) foreign exchange gains and losses from the sale and holdings of foreign currencies; (2) gains and losses between trade date and settlement date on investment securities transactions and forward foreign currency exchange contracts; and (3) gains and losses from the difference between amounts of interest and dividends recorded and the amounts actually received.
The Fund does not isolate the net realized and unrealized gain or loss resulting from changes in exchange rates from the fluctuations in market prices of securities held. Such fluctuations are included with the net realized and unrealized gain or loss on investments.
| i. | Securities Transacted on a When Issued Basis |
The Fund may enter into To Be Announced (“TBA”) sale commitments to hedge its portfolio positions or to sell mortgage-backed securities it owns under delayed delivery arrangements. Proceeds of TBA sale commitments are not received until the contractual settlement date. During the time a TBA sale commitment is outstanding, equivalent deliverable securities, or an offsetting TBA purchase commitment deliverable on or before the sale commitment date, are held as “cover” for the transaction. Unsettled TBA sale commitments are valued at the current market value of the underlying securities according to the procedures described under “Valuation of Investments,” in footnote 1a above. Each contract is marked-to-market daily and the change in market value is recorded by the Fund as an unrealized gain or loss. If the TBA sale commitment is closed through the acquisition of an offsetting purchase commitment, the Fund realizes a gain or loss. If the Fund delivers securities under the commitment, the Fund realizes a gain or a loss from the sale of the securities based upon the unit price established at the date the commitment was entered into.
| 2. | Agreements and Transactions with Affiliates |
The Trust has entered into an Investment Management Agreement under which the Investment Manager, an independently managed subsidiary of Affiliated Managers Group, Inc. (“AMG”), provides or oversees investment management services to the Fund. The Investment Manager selects subadvisors for the Fund (subject to Trustee approval) and monitors each subadvisor’s investment programs and results. The Fund’s investment portfolio is managed by a portfolio manager who serves pursuant to a subadvisory agreement with the Investment Manager.
Investment management fees are paid directly by the Fund to the Investment Manager based on average daily net assets. The annual investment management fee rate, as a percentage of average daily net assets, for the fiscal year ended October 31, 2010, was 0.40%.
The Trust has entered into an Administration and Shareholder Servicing Agreement under which the Investment Manager serves as the Fund’s administrator (the “Administrator”) and is responsible for all aspects of managing the Fund’s operations, including administration and shareholder services to the Fund, its shareholders, and certain institutions, such as bank trust departments, broker-dealers and registered investment advisers, that advise or act as an intermediary with the Fund’s shareholders. For its services, the Administrator is paid a fee at a rate of 0.20% per annum. (Prior to July 1, 2010, the Administrator was paid a fee of 0.25% per annum.) For the period from November 1, 2009 to June 30, 2010, the Administrator waived a portion of its fee equal to 0.05% per annum. During the fiscal year ended October 31, 2010, the Fund paid administration fees of $2,545,653, net of waivers.
34
Managers PIMCO Bond Fund
Notes to Financial Statements (continued)
The Investment Manager has contractually agreed, through at least March 1, 2011, to limit net annual fund operating expenses (exclusive of brokerage costs, acquired fund fees and expenses, interest, taxes and extraordinary expenses) to 0.58% of average daily net assets of the Fund.
The Fund is obligated to repay the Investment Manager such amounts waived, paid or reimbursed in future years provided that the repayment occurs within thirty-six (36) months after the waiver or reimbursement and that such repayment would not cause the Fund’s expenses in any such future year to exceed the previously stated expense limitation percentage of the Fund’s average daily net assets. For the fiscal year ended October 31, 2010, the Fund’s components of reimbursement are detailed in the following chart:
| | | | |
| | | Managers PIMCO
Bond Fund | |
Reimbursement Available-10/31/09 | | $ | 3,967,446 | |
Additional Reimbursements | | | 1,643,094 | |
Repayments | | | — | |
Expired Reimbursements | | | (1,249,443 | ) |
| | | | |
Reimbursement Available-10/31/10 | | $ | 4,361,097 | |
| | | | |
The aggregate annual retainer paid to each Independent Trustee is $65,000, plus $4,000 or $2,500 for each regular or special meeting attended, respectively. The Trustees’ fees and expenses are allocated amongst all of the Funds for which the Investment Manager serves as the advisor (the “Managers Funds”) based on the relative net assets of such Funds. The Independent Chairman of the Trusts receives an additional payment of $15,000 per year. The Chairman of the Audit Committee receives an additional payment of $5,000 per year. The “Trustees fees and expenses” shown in the financial statements represent the Fund’s allocated portion of the total fees and expenses paid by the Fund and other affiliated funds in the Managers Funds.
The Funds are distributed by Managers Distributors, Inc. (“MDI”), a wholly-owned subsidiary of the Investment Manager. MDI serves as the principal underwriter for each Fund and is a registered broker-dealer and member of the Financial Industry Regulatory Authority, Inc. (“FINRA”). Shares of each Fund will be continuously offered and will be sold by brokers, dealers or other financial intermediaries who have executed selling agreements with MDI. MDI bears all the expenses of providing services pursuant to the Underwriting Agreement, including the payment of the expenses relating to the distribution of Prospectuses for sales purposes and any advertising or sales literature. Certain Trustees and Officers of the Funds are Officers and/or Directors of the Investment Manager, AMG and/or MDI.
On June 23, 2009, the Securities and Exchange Commission granted an exemptive order that permits the Fund to lend and borrow money for certain temporary purposes directly to and from other eligible Funds in the Managers Family of Funds (the “Fund Family”). Participation in this interfund lending program is voluntary for both borrowing and lending Funds, and an interfund loan is only made if it benefits each participating Fund. The Investment Manager administers the program according to procedures approved by the Funds’ Board of Trustees (the “Board”), and the Board monitors the operation of the program. An interfund loan must comply with certain conditions set out in the exemptive order, which are designed to assure fairness and protect all participating Funds. For the fiscal year ended October 31, 2010, the Fund neither borrowed from nor lent to other Funds in the Fund Family.
| 3. | Purchases and Sales of Securities |
Purchases and sales of investment securities (excluding short-term securities and U.S. Government Obligations) for the fiscal year ended October 31, 2010, were $713,660,199 and $630,574,752, respectively. Purchases and sales of U.S. Government obligations for the fiscal year ended October 31, 2010, were $5,009,050,912 and $4,480,460,431, respectively.
| 4. | Portfolio Securities Loaned |
The Fund participates in a securities lending program offered by BNYM, providing for the lending of securities to qualified brokers. Securities lending fees include earnings of such temporary cash investments, plus or minus any rebate to a borrower. These earnings (after any rebate) are then divided between BNYM, as a fee for its services under the program, and the Fund, according to agreed-upon rates. Collateral on all securities loaned is accepted in cash and/ or government securities and is maintained at a minimum level of 102% (105% in the case of certain foreign securities) of the market value, plus interest, if applicable, of investments on loan. It is the Fund’s policy to obtain additional collateral from or return excess collateral to the borrower by the end of the next business day, following the valuation date of the securities loaned. Therefore, the value of the collateral held may be temporarily less than the value of the securities on loan. Lending securities entails a risk of loss to the Fund if and to the extent that the market value of the securities loaned were to increase and the borrower did not increase the collateral accordingly, and the borrower fails to return the securities. The Fund bears the risk of any deficiency in the amount of the collateral available for return to the borrower due to any loss on the collateral invested. Collateral received in the form of cash is invested temporarily in the BNY Mellon Overnight Government Fund, formerly the BNY Institutional Cash Reserves Fund (the “ICRF”), or other short-term investments as defined in the Securities Lending Agreement with BNYM.
Effective August 2, 2010, the Trust, on behalf of the Fund, has entered into an agreement with The Bank of New York Mellon and the Bank of New York Mellon Corporation (“BNYMC”) with respect to each Fund’s position in ICRF, pursuant to which (i) BNYMC will support the value of certain defaulted securities issued by Lehman Brothers Holdings, Inc. and held by ICRF, and (ii) if certain conditions are met, BNYMC will purchase the defaulted securities from the Fund in September 2011. The Fund is fair valuing its position in the ICRF daily. The Fund’s position in the separate sleeves of the ICRF Fund is included in the Schedule of Portfolio Investments and the unrealized loss on such investment is included in Net Unrealized Depreciation on the Statement of Assets and Liabilities and Statement of Operations.
35
Managers PIMCO Bond Fund
Notes to Financial Statements (continued)
| 5. | Commitments and Contingencies |
In the normal course of business, the Fund may enter into contracts and agreements that contain a variety of representations and warranties, which provide general indemnifications. The maximum exposure to the Fund under these arrangements is unknown, as this would involve future claims that may be made against the Fund that have not yet occurred. However, based on experience, the Fund expects the risk of loss to be remote.
Certain transactions, such as futures and forward transactions, dollar roll agreements, or purchases of when-issued or delayed delivery securities may have a similar effect on the Fund’s net asset value as if the Fund had created a degree of leverage in its portfolio. However, if the Fund enters into such a transaction, the Fund will establish a segregated account with its custodian in which it will maintain cash, U.S. government securities or other liquid securities equal in value to its obligations in respect to such transaction. Securities and other assets held in the segregated account may not be sold while the transaction is outstanding, unless other suitable assets are substituted.
The following disclosures contain information on how and why the Fund uses derivative instruments and how derivative instruments affect the Fund’s financial position, results of operations and cash flows. The location and fair value amounts of these instruments on the Statement of Assets and Liabilities and the realized and changes in unrealized gains and losses on the Statement of Operations, each categorized by type of derivative contract, are included in a table in the Schedule of Portfolio Investments. The derivative instruments outstanding as of the fiscal year end as disclosed in the Statement of Assets and Liabilities and the realized and unrealized changes in gains and losses on derivative instruments during the period as disclosed in the Statement of Operations serve as indicators of the volume of derivative activity for the Fund.
| 8. | Forward Foreign Currency Contracts |
The Fund entered into forward foreign currency contracts to facilitate transactions in foreign securities and to hedge against foreign currency exchange rate risk on its non-U.S. dollar denominated investment securities.
A forward foreign currency contract is an agreement between a Fund and another party to buy or sell a currency at a set price at a future date. The market value of the contract will fluctuate with changes in currency exchange rates. The contract is marked-to-market daily, and the change in market value is recorded as an unrealized gain or loss. Gain or loss on the purchase or sale of contracts having the same settlement date, amount and counterparty is realized on the date of offset, otherwise gain or loss is realized on the settlement date.
Risks may arise upon entering into these contracts from the potential inability of counterparties to meet the terms of their contracts and from unanticipated movements in the value of a foreign currency relative to the U.S. dollar.
The Fund entered into futures contracts to achieve a desired level of investment, whether to accommodate portfolio turnover, cash flows from capital shares transactions and to manage interest rate risk. There are certain risks associated with futures contracts. Prices may not move as expected or the Fund may not be able to close out the contract when it desires to do so, resulting in losses.
On entering into a futures contract, either cash or securities in an amount equal to a certain percentage of the contract value (initial margin) must be deposited with the futures broker. Subsequent payments (variation margin) are made or received each day. The variation margin payments equal the daily changes in the contract value and are recorded as unrealized gains or losses. The Fund recognizes a realized gain or loss when the contract is closed or expires equal to the difference between the value of the contract at the time it was opened and the value at the time it was closed. Futures are valued at their quoted daily settlement prices. The aggregate principal amounts of the contracts are not recorded in the financial statements. Fluctuations in the value of the contracts are recorded in the Statement of Assets and Liabilities as an asset (liability) and in the Statement of Operations as unrealized appreciation (depreciation) until the contracts are closed, when they are recorded as realized gains (losses) on futures contracts.
| 10. | Interest Rate Caps and Floors, Swap Contracts and Options |
The Fund entered into over-the-counter transactions involving interest rate caps and floors, swap contracts, or purchased and written (sold) options to enter into such contracts, in order to manage its exposure to credit, currency, interest rate and inflation risk.
In interest rate caps and floor agreements, one party agrees to make payments only when interest rates exceed a specified rate or “cap” or fall below a specified rate or “floor,” usually in return for payment of a fee by the other party. Interest rate caps and floors entitle the purchaser, to the extent that a specified index exceeds or falls below a predetermined interest rate, to receive payments of interest on a notional principal amount from the party selling such interest rate caps or floors.
Swap contracts represent an agreement between counterparties to exchange cash flows based on the difference between two rates applied to a notional principal amount for a specified period. The most common type of interest rate swap involves the exchange of fixed-rate cash flows for variable-rate cash flows. Swaps do not involve the exchange of principal between the parties. Purchased options on swap contracts (“swaptions”) give the holder the right, but not the obligation, to enter into a swap contract with the counterparty which has written the option on a date, at an interest rate, and with a notional amount as specified in the swaption agreement. If the counterparty to the swap transaction defaults, the Fund will be limited to contractual remedies pursuant to the agreements governing the transaction. There is no assurance that swap or swaption contract counterparties will be able to meet their obligations under the contracts or that, in the event of default, the Fund will succeed in pursuing contractual remedies. The Fund may thus assume the risk that payments owed to the Fund under a swap or swaption contract
36
Managers PIMCO Bond Fund
Notes to Financial Statements (continued)
will be delayed, or not received at all. During the term of the swap agreement or swaption, unrealized gains or losses are recorded as a result of “marking to market.” When the swap agreement or swaption is terminated, the Fund will record a realized gain or loss equal to the difference between the proceeds from (or cost of) the closing transaction and the Fund’s basis in the contract, if any. Accrued interest and interest paid are recognized as unrealized and realized gain (loss), respectively. In each of the contracts, the Fund pays a premium, to the counterparty, in return for the swaption. These swaptions may be exercised by entering into a swap contract with the counterparty only on the date specified in each contract. The Fund also sold credit protection through credit default swaps. Under the terms of the swaps, the seller of the credit protection receives a periodic payment amount (premium) from the buyer that is a fixed percentage amount applied to a notional principal amount. In return, the seller agrees to pay the buyer the notional amount and take delivery of a debt instrument of the reference issuer of the same notional par amount if the reference entity is subject to a credit event (such as bankruptcy, failure to pay, or obligation acceleration) during the term of the swap.
A written option contract is a contract in which the writer of the option grants the buyer of the option the right to purchase from (call option) or sell to (put option) the writer a designated instrument at a specified price within a specified period of time. Options written (sold) are recorded as liabilities. When an option expires, the premium (original option value) is realized as a gain if the option was written or as a loss if the option was purchased. When the exercise of an option results in a cash settlement, the difference between the premium and the settlement proceeds is recognized as realized gain or loss. When securities are acquired or delivered upon exercise of an option, the acquisition cost or sale proceeds are adjusted by the amount of the premium. When an option is closed, the difference between the premium and the cost to close the position is realized as a gain or loss.
| 11. | Risks Associated with Collateralized Mortgage Obligations (“CMOs”) |
The net asset value of the Fund may be sensitive to interest rate fluctuations because the Fund may hold several instruments, including CMOs and other derivatives, whose values can be significantly impacted by interest rate movements. CMOs are obligations collateralized by a portfolio of mortgages or mortgage-related securities. Payments of principal and interest on the mortgage are passed through to the holder of the CMOs on the same schedule as they are received, although certain classes of CMOs have priority over others with respect to the receipt of prepayments on the mortgages.
Therefore, the investment in CMOs may be subject to a greater or lesser risk of prepayment than other types of mortgage-related securities. CMOs may have a fixed or variable rate of interest.
| 12. | Dollar Roll Transactions |
The Fund entered into dollar rolls in which it sells debt securities for delivery currently and simultaneously contracts to repurchase similar, but not identical, securities at the same price or a lower price on an agreed date. The Fund receives compensation as consideration for entering into the commitment to repurchase. The compensation is the difference between the current sale price and the repurchase price (often referred to as the “drop”) as well as the interest earned on the cash proceeds of the initial sale. The Fund may also be compensated by the receipt of a commitment fee. As the holder, the counterparty receives all principal and interest payments, including prepayments, made with respect to the similar security. Dollar rolls may be renewed with a new sale and repurchase price with a cash settlement made at renewal without physical delivery of the securities subject to the contract.
Certain risks may arise upon entering into dollar rolls from the potential inability of counterparties to meet the terms of their commitments. Additionally, the value of such securities may change adversely before the Fund is able to repurchase them. There can be no assurance that the Fund’s use of the cash that it receives from a dollar roll will provide a return that exceeds its costs.
The Fund has determined that no additional material events or transactions occurred through the issuance of the Fund’s financial statements, which require additional disclosure in the Fund’s financial statements.
Tax Information (unaudited)
The Fund hereby designates the maximum amount allowable of its net taxable income as qualified dividends as provided in the Jobs and Growth Tax Relief Reconciliation Act of 2003. The 2010 Form 1099-DIV you receive for the Fund will show the tax status of all distributions paid to you during the year.
Pursuant to section 852 of the Internal Revenue Code, Managers PIMCO Bond hereby designates $18,948,873, as a capital gain distribution with respect to the taxable year ended October 31, 2010, or if subsequently determined to be different, the net capital gains of such year.
37
Report of Independent Registered Public Accounting Firm
To the Board of Trustees of Managers Trust I and the Shareholders of Managers PIMCO Bond Fund (formerly Managers Fremont Bond Fund):
In our opinion, the accompanying statement of assets and liabilities, including the schedule of portfolio investments, and the related statements of operations and of changes in net assets and the financial highlights present fairly, in all material respects, the financial position of Managers PIMCO Bond Fund (formerly Managers Fremont Bond Fund) (one of the series constituting Managers Trust I, hereafter referred to as the “Fund”) at October 31, 2010, the results of its operations for the year then ended, the changes in its net assets for each of two years in the period then ended and the financial highlights for the each of the five years in the period then ended, in conformity with accounting principles generally accepted in the United States of America. These financial statements and financial highlights (hereafter referred to as “financial statements”) are the responsibility of the Fund’s management; our responsibility is to express an opinion on these financial statements based on our audits. We conducted our audits of these financial statements in accordance with the standards of the Public Company Accounting Oversight Board (United States). Those standards require that we plan and perform the audit to obtain reasonable assurance about whether the financial statements are free of material misstatement. An audit includes examining, on a test basis, evidence supporting the amounts and disclosures in the financial statements, assessing the accounting principles used and significant estimates made by management, and evaluating the overall financial statement presentation. We believe that our audits, which included confirmation of securities at October 31, 2010 by correspondence with the custodian and brokers, provide a reasonable basis for our opinion.
PricewaterhouseCoopers LLP
Philadelphia, Pennsylvania
December 22, 2010
38
Trustees and Officers
The Trustees and Officers of the Trust, their business addresses, principal occupations for the past five years and dates of birth are listed below. The Trustees provide broad supervision over the affairs of the Trust and the Funds. The Trustees are experienced executives who meet periodically throughout the year to oversee the Funds’ activities, review contractual arrangements with companies that provide services to the Funds, and review the Funds’ performance. Unless otherwise noted, the address of each Trustee or Officer is the address of the Trust: 800 Connecticut Avenue, Norwalk, Connecticut 06854.
There is no stated term of office for Trustees. Trustees serve until their resignation, retirement or removal in accordance with the Trust’s organizational documents and policies adopted by the Board from time to time. The Chairman of the Trustees, President, Treasurer and Secretary of the Trust are elected by the Trustees annually. Other officers hold office at the pleasure of the Trustees.
Independent Trustees
The following Trustees are not “interested persons” of the Trust within the meaning of the 1940 Act:
| | |
Name, Date of Birth, Number of Funds Overseen in Fund
Complex* | | Principal Occupation(s) During Past 5 Years and Other Directorships Held by Trustee |
Jack W. Aber, 9/9/37 • Trustee since 2000 • Oversees 38 Funds in Fund Complex | | Professor of Finance, Boston University School of Management (1972-Present); Trustee of Appleton Growth Fund (1 portfolio); Trustee of Third Avenue Trust (5 portfolios); Trustee of Third Avenue Variable Trust (1 portfolio); Trustee of Aston Funds (24 portfolios). |
| |
William E. Chapman, II, 9/23/41 • Independent Chairman • Trustee since 2000 • Oversees 38 Funds in Fund Complex | | President and Owner, Longboat Retirement Planning Solutions (1998-Present); Hewitt Associates, LLC (part time) (provider of Retirement and Investment Education Seminars) (resigned Nov. 2009); Trustee of Bowdoin College (2002-Present); Director of Harding, Loevner Funds, Inc. (6 portfolios); Trustee of Third Avenue Trust (5 portfolios); Trustee of Third Avenue Variable Trust (1 portfolio); Trustee of Aston Funds (24 portfolios). |
| |
Edward J. Kaier, 9/23/45 • Trustee since 2000 • Oversees 38 Funds in Fund Complex | | Attorney at Law and Partner, Teeters Harvey Gilboy & Kaier LLP (2007-Present); Attorney at Law and Partner, Hepburn Willcox Hamilton & Putnam, LLP (1977-2007); Trustee of Third Avenue Trust (5 portfolios); Trustee of Third Avenue Variable Trust (1 portfolio); Trustee of Aston Funds (24 portfolios). |
| |
Steven J. Paggioli, 4/3/50 • Trustee since 2000 • Oversees 38 Funds in Fund Complex | | Consultant (2001-Present); Formerly Executive Vice President and Director, The Wadsworth Group (1986-2001); Executive Vice President, Secretary and Director, Investment Company Administration, LLC (1990-2001); Vice President, Secretary and Director, First Fund Distributors, Inc. (1991-2001); Trustee, Professionally Managed Portfolios (40 portfolios); Advisory Board Member, Sustainable Growth Advisors, LP; Independent Director, Chase Investment Counsel (2008 - Present); Trustee of Aston Funds (24 portfolios). |
| |
Eric Rakowski, 6/5/58 • Trustee since 2000 • Oversees 38 Funds in Fund Complex | | Professor, University of California at Berkeley School of Law (1990-Present); Director of Harding, Loevner Funds, Inc. (6 portfolios); Trustee of Third Avenue Trust (5 portfolios); Trustee of Third Avenue Variable Trust (1 portfolio); Trustee of Aston Funds (24 portfolios). |
| |
Thomas R. Schneeweis, 5/10/47 • Trustee since 2000 • Oversees 38 Funds in Fund Complex | | Professor of Finance, University of Massachusetts (1977-Present); Director, CISDM at the University of Massachusetts, (1996-Present); President, Alternative Investment Analytics, LLC, (formerly Schneeweis Partners, LLC) (2001-Present); Partner, White Bear Partners, LLC (2007-Present); Partner, Schneeweis Capital Management, LLC (2007-Present); Partner, Schneeweis Associates, LLC (2007-Present); Partner, Northampton Capital Management, LLC (2004-Present); Partner, TRS Associates (2007-Present); Trustee of Aston Funds (24 portfolios). |
| * | The Fund Complex consists of Managers AMG Funds, The Managers Funds, Managers Trust I and Managers Trust II. |
Interested Trustees
The following Trustees are “interested persons” of the Trust within the meaning of the 1940 Act. Mr. Dalton is an interested person by virtue of his positions with, and interest in securities of, Affiliated Managers Group, Inc. and his position with Managers Distributors, Inc. Mr. Streur is an interested person by virtue of his positions with Managers Investment Group LLC.
| | |
Name, Date of Birth, Number of Funds Overseen in Fund
Complex* | | Principal Occupation(s) During Past 5 Years and Other Directorships Held by Trustee |
Nathaniel Dalton, 9/29/66 • Trustee since 2008 • Oversees 38 Funds in Fund Complex | | Executive Vice President and Chief Operating Officer, Affiliated Managers Group, Inc., (2006-Present); Executive Vice President, Affiliated Managers Group, Inc., (2002 -2006); Executive Vice President and General Counsel, Affiliated Managers Group, Inc. (2001-2002); Senior Vice President and General Counsel, Affiliated Managers Group, Inc. (1996-2001). Director, Managers Distributors, Inc. (2000-Present). |
| |
John H. Streur, 2/6/60 • Trustee since 2008 • President since 2008 • Oversees 38 Funds in Fund Complex | | Senior Managing Partner, Managers Investment Group LLC (2006-Present); President, Managers Distributors, Inc. (2006-Present); Managing Partner, Managers Investment Group LLC (2005-2006); Chief Executive Officer, President and Chief Operating Officer, The Burridge Group LLC (1996-2004). |
| |
| Officers | | |
| |
Name, Date of Birth, Position(s)
Held with Fund and Length of
Time Served | | Principal Occupation(s) During Past 5 Years |
Christine C. Carsman, 4/2/52 • Secretary since 2004 | | Senior Vice President and Chief Regulatory Counsel, Affiliated Managers Group, Inc. (2004-Present); Secretary, The Managers Funds, Managers AMG Funds and Managers Trust II (2004-Present); Senior Counsel, Vice President and Director of Operational Risk Management and Compliance, Wellington Management Company, LLP (1995-2004); Deputy General Counsel, The Boston Company, Inc. (1993-1995); Associate General Counsel, The Boston Company Advisors, Inc. (1991-1993); Associate, Sullivan & Worcester LLP (1987-1991). |
| |
Donald S. Rumery, 5/29/58 • Chief Financial Officer since 2007 • Treasurer since 2000 | | Senior Vice President, Managers Investment Group LLC (2005-Present); Director, Finance and Planning, The Managers Funds LLC, (1994-2004); Treasurer and Chief Financial Officer, Managers Distributors, Inc. (2000-Present); Treasurer, The Managers Funds (1995-Present); Treasurer, Managers AMG Funds (1999-Present); Treasurer, Managers Trust II (2000-Present); Secretary, Managers Trust I and Managers Trust II (2000-2004) and Secretary, The Managers Funds (1997-2004); Chief Financial Officer, The Managers Funds, Managers AMG Funds and Managers Trust II (2007-Present). |
| |
Keitha L. Kinne, 5/16/58 • Chief Operating Officer since 2007 | | Managing Partner and Chief Operating Officer, Managers Investment Group LLC (2007-Present); Chief Operating Officer, The Managers Funds, Managers AMG Funds and Managers Trust II (2007-Present); Chief Investment Officer, Managers Investment Group LLC (2008-Present); Managing Director, Legg Mason & Co., LLC (2006-2007); Managing Director, Citigroup Asset Management (2004-2006); Senior Vice President, Prudential Investments (1999-2004). |
| |
David Kurzweil, 6/22/74 • Assistant Secretary since 2008 | | Senior Vice President and Associate Counsel, Managers Investment Group LLC (2008-Present); Assistant Secretary, The Managers Funds, Managers Trust II, and Managers AMG Funds (2008-Present); Counsel and Senior Vice President, Lazard Asset Management LLC (2003-2008). |
39
Annual Renewal of Investment Advisory Agreements
On June 10-11, 2010, the Board of Trustees, including a majority of the Trustees who are not “interested persons” of the Trust (the “Independent Trustees”), approved the Investment Management Agreement with the Investment Manager for the Managers PIMCO Bond Fund (formerly Managers Fremont Bond Fund) (the “Fund”) and the Subadvisory Agreement for the Subadvisor of the Fund. The Independent Trustees were separately represented by independent counsel in connection with their consideration of the approval of these agreements. In considering the Investment Management and Subadvisory Agreements, the Trustees reviewed a variety of materials relating to the Fund, the Investment Manager and the Subadvisor, including comparative performance, fee and expense information for an appropriate peer group of similar mutual funds (the “Peer Group”), performance information for the relevant benchmark index (the “Fund Benchmark”) and, with respect to the Subadvisor, comparative performance information for an appropriate peer group of managed accounts, and, as to all other matters, other information provided to them on a periodic basis throughout the year, as well as information provided in connection with the meetings of June 10-11, 2010, regarding the nature, extent and quality of services provided by the Investment Manager and the Subadvisor under their respective agreements. Prior to voting, the Independent Trustees: (a) reviewed the foregoing information with their independent legal counsel and with management; (b) received materials from their independent legal counsel discussing the legal standards applicable to their consideration of the Investment Management Agreement and the Subadvisory Agreement; and (c) met with their independent legal counsel in private sessions at which no representatives of management were present.
Nature, extent and quality of services.
In considering the nature, extent and quality of the services provided by the Investment Manager, the Trustees reviewed information relating to the Investment Manager’s operations and personnel. Among other things, the Investment Manager provided financial information, biographical information on its supervisory and professional staff and descriptions of its organizational and management structure. The Trustees also took into account information provided periodically throughout the previous year by the Investment Manager relating to the performance of its duties with respect to the Fund and the Trustees’ familiarity with the Investment Manager’s management through Board meetings, discussions and reports. In the course of their deliberations regarding the Investment Management Agreement, the Trustees evaluated, among other things: (a) the extent and quality of the Investment Manager’s oversight of the operation and management of the Fund; (b) the quality of the search, selection and monitoring services performed by the Investment Manager in overseeing the portfolio management responsibilities of the Subadvisor; (c) the Investment Manager’s ability to supervise the Fund’s other service providers; and (d) the Investment Manager’s compliance programs. The Trustees also took into account the financial condition of the Investment Manager with respect to its ability to provide the services required under the Investment Management Agreement and to maintain a contractual expense limitation for the Fund.
The Trustees also reviewed information relating to the Subadvisor’s operations and personnel and the investment philosophy, strategies and techniques (the “Investment Strategy”) used in managing the Fund. Among other things, the Trustees reviewed biographical information on portfolio management and other professional staff, information regarding the Subadvisor’s organizational and management structure and the Subadvisor’s brokerage policies and practices. The Trustees considered specific information provided regarding the experience of the individual or individuals at the Subadvisor with portfolio management responsibility for the Fund, including the information set forth in the Fund’s prospectus and statement of additional information. In the course of their deliberations, the Trustees evaluated, among other things: (a) the services rendered by the Subadvisor in the past; (b) the qualifications and experience of the Subadvisor’s personnel; and (c) the Subadvisor’s compliance programs. The Trustees also took into account the financial condition of the Subadvisor with respect to its ability to provide the services required under the Subadvisory Agreement.
Performance.
Among other information relating to the Fund’s performance, the Trustees noted that the Fund’s performance for the 1-year, 3-year, 5-year and 10-year periods ended March 31, 2010 was above the median performance of the Peer Group and above the performance of the Fund Benchmark, the Barclays Capital U.S. Aggregate Bond Index, for each period. The Board also took into account management’s discussion of the Fund’s performance, noting that the Fund outperformed the Fund Benchmark and exceeded the median of the Peer Group for each period. The Trustees concluded that the Fund’s performance has been satisfactory.
As noted above, the Board considered the Fund’s performance during relevant time periods as compared to the Fund’s Peer Group and considered the Subadvisor’s performance as compared to an appropriate peer group of managed accounts and also considered the gross performance of the Fund as compared to the Subadvisor’s relevant performance composite that utilizes the same investment strategy and approach and noted that the Board reviews on a quarterly basis detailed information about the Fund’s performance results, portfolio composition and Investment Strategies. The Board noted the Investment Manager’s expertise and resources in monitoring the performance, investment style and risk-adjusted performance of the Subadvisor. The Board was mindful of the Investment Manager’s attention to monitoring the Subadvisor’s performance with respect to the Fund and its discussions with management regarding the factors that contributed to the performance of the Fund.
Advisory Fees and Profitability.
In considering the reasonableness of the advisory fee charged by the Investment Manager for managing the Fund, the Trustees noted that the Investment Manager, and not the Fund, is responsible for paying the fees charged by the Fund’s Subadvisor and, therefore, that the fees paid to the Investment Manager cover the cost of providing portfolio management services as well as the cost of providing search, selection and monitoring services in operating a “manager-of-man-agers” complex of mutual funds. The Trustees concluded that, in
40
Annual Renewal of Investment Advisory Agreements (continued)
light of the additional high quality supervisory services provided by the Investment Manager and the fact that the subadvisory fees are paid out of the advisory fee, the advisory fee payable by the Fund to the Investment Manager can reasonably be expected to exceed the median advisory fee for the Peer Group, which consists of many funds that do not operate with a manager-of-managers structure. In this regard, the Trustees also noted that the Investment Manager has undertaken to maintain an expense limitation for the Fund.
In considering the reasonableness of the advisory fee payable to the Investment Manager, the Trustees also reviewed information provided by the Investment Manager setting forth all revenues and other benefits, both direct and indirect, received by the Investment Manager and its affiliates attributable to managing the Fund and all the mutual funds in the Managers Family of Funds, the cost of providing such services and the resulting profitability to the Investment Manager and its affiliates from these relationships. The Trustees also noted the current and potential asset levels of the Fund and the willingness of the Investment Manager to waive fees and pay expenses for the Fund from time to time as a means of limiting the total expenses of the Fund. The Trustees also considered management’s discussion of the current asset level of the Fund, including the effect on assets attributable to the economic and market conditions over the past eighteen months, and considered the impact on profitability of the current asset level and any future growth of assets of the Fund. The Board took into account management’s discussion of the current advisory fee structure. The Trustees also noted that the subadvisory fees are paid by the Investment Manager out of its advisory fee. Based on the foregoing, the Trustees concluded that the profitability to the Investment Manager is reasonable and that the Investment Manager is not realizing material benefits from economies of scale that would warrant adjustments to the advisory fees for the Fund at this time. With respect to economies of scale, the Trustees also noted that as the Fund’s assets increase over time, the Fund may realize other economies of scale to the extent that the increase in assets is proportionally greater than the increase in certain other expenses.
The Trustees noted that the Fund’s advisory fee and total expenses (net of applicable expense waivers/reimbursements) as of March 31, 2010 were higher and lower, respectively, than the average for the Peer Group. The Trustees took into account the fact that the Investment Manager has contractually agreed, through March 1, 2011, to limit the Fund’s net annual operating expenses to 0.58%. The Trustees concluded that, in light of the nature, extent and quality of the services provided by the Investment Manager and the Subadvisor, the Fund’s performance, the foregoing expense limitation and the considerations noted above with respect to the Subadvisor and the Investment Manager, the Fund’s advisory fees are reasonable.
Subadvisory Fees and Profitability.
In considering the reasonableness of the fee payable by the Investment Manager to the Subadvisor, the Trustees relied on the ability of the Investment Manager to negotiate the terms of the Subadvisory Agreement at arm’s length as part of the manager-of-managers structure, noting that the Subadvisor is not affiliated with the Investment Manager. In addition, the Trustees noted that the subadvisory fees are paid by the Investment Manager out of its advisory fee. Accordingly, the cost of services to be provided by the Subadvisor and the profitability to the Subadvisor of its relationship with the Fund were not material factors in the Trustees’ deliberations. For similar reasons, and based on the current size of the Fund managed by the Subadvisor, the Trustees concluded that any economies of scale being realized by the Subadvisor was not a material factor in the Trustees’ deliberations at this time.
* * * *
After consideration of the foregoing, the Trustees also reached the following conclusions regarding the Investment Management Agreement and the Subadvisory Agreement, in addition to those conclusions discussed above: (a) the Investment Manager and the Subadvisor have demonstrated that they possess the capability and resources to perform the duties required of them under the Investment Management Agreement and the Subadvisory Agreement; (b) the Subadvisor’s Investment Strategy is appropriate for pursuing the Fund’s investment objectives; (c) the Subadvisor is reasonably likely to execute its Investment Strategy consistently over time; and (d) the Investment Manager and the Subadvisor maintain appropriate compliance programs.
Based on all of the above-mentioned factors and related conclusions, with no single factor or conclusion being determinative and with each Trustee not necessarily attributing the same weight to each factor, the Trustees concluded that approval of the Investment Management Agreement and the Subadvisory Agreement would be in the best interests of the Fund and its shareholders. Accordingly, on June 10-11, 2010, the Trustees, including a majority of the Independent Trustees, voted to approve the Investment Management Agreement and the Subadvisory Agreement for the Fund’s Subadvisor.
41
THIS PAGE INTENTIONALLY LEFT BLANK
THIS PAGE INTENTIONALLY LEFT BLANK
Investment Manager and Administrator
Managers Investment Group LLC
333 W. Wacker Drive
Suite 1200
Chicago, IL 60606
(800) 835-3879
Distributor
Managers Distributors, Inc.
333 W. Wacker Drive
Suite 1200
Chicago, IL 60606
(800) 835-3879
Custodian
The Bank of New York Mellon
2 Hanson Place
Brooklyn, New York 11217
Legal Counsel
Ropes & Gray LLP
Prudential Tower, 800 Boylston Street
Boston, Massachusetts 02199-3600
Transfer Agent
BNY Mellon Investment Servicing (US) Inc.*
Attn: Managers
P.O. Box 9769
Providence, Rhode Island 02940
(800) 548-4539
For Managers Choice Only
Managers
c/o BNY Mellon Investment Servicing (US) Inc.*
P.O. Box 9847
Providence, Rhode Island 02940-8047
(800) 358-7668
| * | Formerly PNC Global Investment Servicing (U.S.) Inc. |
MANAGERSAND MANAGERS AMG FUNDS
| | | | |
EQUITY FUNDS | | BALANCED FUNDS |
| CADENCE CAPITAL APPRECIATION | | INTERNATIONAL EQUITY | | CHICAGO EQUITY PARTNERS BALANCED |
| CADENCE FOCUSED GROWTH | | AllianceBernstein L.P. | | Chicago Equity Partners, LLC |
| CADENCE MID-CAP | | Lazard Asset Management, LLC | | |
| CADENCE EMERGING COMPANIES | | Martin Currie Inc. | | ALTERNATIVE FUNDS |
| Cadence Capital Management, LLC | | | | |
| | REAL ESTATE SECURITIES | | FQ GLOBAL ALTERNATIVES |
| CHICAGO EQUITY PARTNERS MID-CAP | | Urdang Securities Management, Inc. | | FQ GLOBAL ESSENTIALS |
| Chicago Equity Partners, LLC | | | | First Quadrant, L.P. |
| | RENAISSANCE LARGE CAP GROWTH | | |
| EMERGING MARKETS EQUITY | | Renaissance Group LLC | | INCOME FUNDS |
| Rexiter Capital Management Limited | | | | BOND (MANAGERS) |
| Schroder Investment Management North America Inc. | | SKYLINE SPECIAL EQUITIES PORTFOLIO Skyline Asset Management, L.P. | | FIXED INCOME GLOBAL BOND Loomis, Sayles & Co., L.P. |
| | |
| ESSEX GROWTH | | |
| ESSEX LARGE CAP GROWTH | | | | |
| ESSEX SMALL/MICRO CAP GROWTH | | SPECIAL EQUITY | | BOND (MANAGERS PIMCO) |
| Essex Investment Management Co., LLC | | Ranger Investment Management, L.P. Lord, Abbett & Co. LLC | | Pacific Investment Management Co. LLC |
| FQ TAX-MANAGED U.S. EQUITY | | Smith Asset Management Group, L.P. | | CALIFORNIA INTERMEDIATE TAX-FREE |
| FQ U.S. EQUITY | | Federated MDTA LLC | | Miller Tabak Asset Management LLC |
| First Quadrant, L.P. | | | | |
| | SYSTEMATIC VALUE | | GW&K MUNICIPAL BOND |
| FRONTIER SMALL CAP GROWTH | | SYSTEMATIC MID CAP VALUE | | GW&K MUNICIPAL ENHANCED YIELD |
| Frontier Capital Management Company, LLC | | Systematic Financial Management, L.P. | | Gannett Welsh & Kotler, LLC |
| | |
| GW&K SMALL CAP EQUITY | | TIMESSQUARE MID CAP GROWTH | | HIGH YIELD |
| Gannett Welsh & Kotler, LLC | | TIMESSQUARE SMALL CAP GROWTH | | J.P. Morgan Investment Management LLC |
| | TSCM GROWTH EQUITY | | |
| INSTITUTIONAL MICRO-CAP | | TimesSquare Capital Management, LLC | | INTERMEDIATE DURATION GOVERNMENT |
| MICRO-CAP | | | | SHORT DURATION GOVERNMENT |
| Lord, Abbett & Co. LLC | | | | Smith Breeden Associates, Inc. |
| WEDGE Capital Management L.L.P. | | | | |
| Next Century Growth Investors LLC | | | | |
| RBC Global Asset Management (U.S.) Inc. | | | | |
This report is prepared for the Fund’s shareholders. It is authorized for distribution to prospective investors only when preceded or accompanied by an effective prospectus. To receive a free copy of the prospectus or Statement of Additional Information, which includes additional information about Fund Trustees, please contact us by calling 800.835.3879. Distributed by Managers Distributors, Inc., member FINRA.
A description of the policies and procedures each Fund uses to vote its proxies is available: (i) without charge, upon request, by calling 800.835.3879, or (ii) on the Securities and Exchange Commission’s (SEC) Web site at www.sec.gov. For information regarding each Fund’s proxy voting record for the 12-month period ended June 30, call 800.835.3879 or visit the SEC Web site at www.sec.gov.
The Fund files its complete schedule of portfolio holdings with the SEC for the first and third quarters of each fiscal year on Form N-Q. The Fund’s Forms N-Q are available on the SEC’s website at www.sec.gov. A Fund’s Forms N-Q may be reviewed and copied at the SEC’s Public Reference Room in Washington, DC. Information on the operation of the Public Reference Room may be obtained by calling 1-800-SEC-0330. To review a complete list of the Fund’s portfolio holdings, or to view the most recent quarterly holdings report, semiannual report, or annual report, please visit www.managersinvest.com.
www.managersinvest.com

ANNUAL REPORT
Managers Funds
October 31, 2010
Managers Frontier Small Cap Growth Fund
(formerly Managers Small Cap Fund)
Managers AMG TSCM Growth Equity Fund
Managers Micro-Cap Fund
(formerly Managers Fremont Micro-Cap Fund)
Managers Institutional Micro-Cap Fund
(formerly Managers Fremont Institutional Micro-Cap Fund)
Managers Real Estate Securities Fund
Managers California Intermediate Tax-Free Fund
Managers Funds
Annual Report — October 31, 2010
TABLE OF CONTENTS
| | | | |
| | | Page | |
LETTER TO SHAREHOLDERS | | | 1 | |
| |
ABOUT YOUR FUND’S EXPENSES | | | 4 | |
| |
INVESTMENT MANAGERS’ COMMENTS, FUND SNAPSHOTS, AND SCHEDULES OF PORTFOLIO INVESTMENTS | | | | |
| |
Managers Frontier Small Cap Growth Fund | | | 5 | |
| |
Managers AMG TSCM Growth Equity Fund | | | 11 | |
| |
Managers Micro-Cap Fund | | | 16 | |
| |
Managers Institutional Micro-Cap Fund | | | 25 | |
| |
Managers Real Estate Securities Fund | | | 34 | |
| |
Managers California Intermediate Tax-Free Fund | | | 39 | |
| |
FINANCIAL STATEMENTS: | | | | |
| |
Statements of Assets and Liabilities | | | 51 | |
| |
Funds’ balance sheets, net asset value (NAV) per share computations and cumulative undistributed amounts | | | | |
| |
Statements of Operations | | | 53 | |
| |
Detail of sources of income, Fund expenses, and realized and unrealized gains (losses) during the fiscal year | | | | |
| |
Statements of Changes in Net Assets | | | 54 | |
| |
Detail of changes in Fund assets for the past two fiscal years | | | | |
| |
FINANCIAL HIGHLIGHTS | | | 56 | |
| |
Historical net asset values per share, distributions, total returns, expense ratios, turnover ratios and net assets | | | | |
| |
NOTES TO FINANCIAL STATEMENTS | | | 62 | |
| |
Accounting and distribution policies, details of agreements and transactions with Fund management and affiliates, and descriptions of certain investment risks | | | | |
| |
REPORT OF INDEPENDENT REGISTERED PUBLIC ACCOUNTING FIRM | | | 69 | |
| |
TRUSTEES AND OFFICERS | | | 70 | |
| |
ANNUAL RENEWAL OF INVESTMENT ADVISORY AGREEMENTS | | | 71 | |
Nothing contained herein is to be considered an offer, sale or solicitation of an offer to buy shares of any series of the Managers Family of Funds. Such offering is made only by Prospectus, which includes details as to offering price and other material information.
Letter to Shareholders
Dear Shareholder:
Our foremost goal at Managers Investment Group (“MIG”) is to structure and manage mutual funds that will help our shareholders and clients successfully reach their investment goals and objectives.
Each of our Funds is geared to provide you with exposure to a specific asset class or style of investing. We believe investors tend to use our Funds as part of their broader portfolio in order to tailor their asset allocation to meet their individual needs. Most of our Funds, like those detailed in this report, are therefore designed to be building blocks.
At MIG, we have overall responsibility for the investment management and administration of the Funds. As a “manager of managers,” we work with external investment managers that make the day-to-day investment decisions in the Funds (the “Portfolio Managers”). We devote considerable resources to our disciplined process of identifying and selecting Portfolio Managers for the Funds. As a manager of managers, MIG performs many activities to monitor the ongoing investment, compliance, and administrative aspects of all of the Funds, which we believe gives our shareholders added confidence in their investments.
Our parent company, Affiliated Managers Group (“AMG”), is a global asset management company with ownership interests in a diverse group of boutique investment management firms (its “Affiliates”). MIG has the unique opportunity to access the investment skills and acumen of some of AMG’s Affiliates. The set of our Funds managed by these proprietary firms also benefits from our activities to monitor the investment, compliance, and administrative aspects of the Funds.
Below is a brief overview of the securities markets and the performance results for the Funds. Following this letter, we also provide the Portfolio Managers’ discussion of their investment management approach, performance results, and market outlook.
In anticipation of an enduring economic recovery, stocks and bonds posted strong gains over the past twelve months, especially in the U.S., even after accounting for the weak results experienced during the second quarter when concerns over sovereign debt and the potential collapse of the Euro weighed heavily on the minds of investors. More specifically, riskier assets such as small-cap stocks and high yield bonds were among the performance leaders. After the brief setback during the second quarter, markets resumed their upward paths in the third quarter despite signs that economic growth had slowed, especially in the developed nations. Throughout the third quarter, investor optimism grew in anticipation of the next round of quantitative easing, also known as QE2. Then in mid-October during a speech in Boston, Federal Reserve Chairman Ben Bernanke provided a rather clear signal that the Fed was ready to engage in another round of quantitative easing in order to spur the U.S. economy. The Fed’s plan, while criticized by some well-known market participants, has apparently contributed to renewed strength in risk-based assets. Only time will tell as to whether this plan will achieve the Fed’s objectives.
1
Letter to Shareholders (continued)
Against this backdrop, the Managers Frontier Small Cap Growth Fund, Managers Micro-Cap Fund, Managers Institutional Micro-Cap Fund, Managers Real Estate Securities Fund, Managers California Intermediate Tax-Free Fund and the Managers AMG TSCM Growth Equity Fund (each a “Fund” and collectively the “Funds”), generally posted solid absolute returns, as detailed below. Please note that some Funds have multiple share classes, and for these Funds the performance shown only reflects the share class indicated.
| | | | | | | | | | | | | | | | | | | | | | | | | | | | |
Periods Ended 10/31/10 | | 6 Months | | | 1 Year | | | 3 Years | | | 5 Years | | | 10 Years | | | Since
Inception | | | Inception
Date | |
Managers Frontier Small Cap Growth Fund - Service Class | | | 1.58 | % | | | 24.59 | % | | | (2.19 | )% | | | 5.34 | % | | | (0.03 | )% | | | 5.80 | % | | | 9/24/1997 | |
Russell 2000® Growth Index | | | 2.53 | % | | | 28.67 | % | | | (3.81 | )% | | | 3.99 | % | | | 1.15 | % | | | 2.30 | % | | | | |
Managers Frontier Small Cap Growth Fund - Investor Class | | | 1.46 | % | | | — | | | | — | | | | — | | | | — | | | | 14.07 | % | | | 1/1/2010 | |
Managers Frontier Small Cap Growth Fund - Institutional Class | | | 1.64 | % | | | — | | | | — | | | | — | | | | — | | | | 14.34 | % | | | 1/1/2010 | |
Russell 2000® Growth Index | | | 2.53 | % | | | — | | | | — | | | | — | | | | — | | | | 14.97 | % | | | | |
Managers AMG TSCM Growth Equity Fund - Investor Class | | | — | | | | — | | | | — | | | | — | | | | — | | | | 9.30 | % | | | 7/30/2010 | |
Managers AMG TSCM Growth Equity Fund - Service Class | | | — | | | | — | | | | — | | | | — | | | | — | | | | 9.40 | % | | | 7/30/2010 | |
Managers AMG TSCM Growth Equity Fund - Institutional Class | | | — | | | | — | | | | — | | | | — | | | | — | | | | 9.40 | % | | | 7/30/2010 | |
Russell 3000® Growth Index | | | — | | | | — | | | | — | | | | — | | | | — | | | | 10.50 | % | | | | |
Managers Micro-Cap Fund | | | 2.70 | % | | | 27.16 | % | | | (5.06 | )% | | | 3.88 | % | | | 1.29 | % | | | 12.65 | % | | | 6/30/1994 | |
Russell Microcap® Index | | | (4.32 | )% | | | 25.07 | % | | | (7.26 | )% | | | (0.40 | )% | | | 5.32 | % | | | — | | | | | |
Managers Institutional Micro-Cap Fund | | | 3.22 | % | | | 25.95 | % | | | (5.31 | )% | | | 3.54 | % | | | 1.48 | % | | | 13.91 | % | | | 12/31/1986 | |
Russell Microcap® Index | | | (4.32 | )% | | | 25.07 | % | | | (7.26 | )% | | | (0.40 | )% | | | 5.32 | % | | | — | | | | | |
Managers Real Estate Securities Fund | | | 7.13 | % | | | 44.47 | % | | | (2.29 | )% | | | 5.38 | % | | | 11.70 | % | | | 8.09 | % | | | 12/31/1997 | |
Dow Jones U.S. Select REIT Index | | | 6.07 | % | | | 42.63 | % | | | (5.93 | )% | | | 2.72 | % | | | 11.11 | % | | | 8.28 | % | | | | |
Managers California Intermediate Tax-Free Fund | | | 3.53 | % | | | 6.41 | % | | | 4.42 | % | | | 4.33 | % | | | 4.44 | % | | | 5.26 | % | | | 11/16/1990 | |
Barclays Capital U.S. Municipal Bond: 5 Year Index | | | 3.58 | % | | | 6.91 | % | | | 6.62 | % | | | 5.49 | % | | | 5.19 | % | | | — | | | | | |
For the 12 months ended October 31, 2010, the Managers Frontier Small Cap Growth Fund Service Share Class returned 24.59%, compared to 28.67% for the Russell 2000® Growth Index. The Fund’s underperformance can be primarily attributed to its growth-at-a-reasonable-price investment approach and weak stock performance. Frontier has historically emphasized valuation when identifying attractive growth candidates. Over the last 12 months small-cap value stocks lagged growth stocks, so Frontier’s emphasis on valuation created a headwind. From a stock selection perspective, performance within the financials and consumer discretionary sectors detracted the most.
For the 12 months ended October 31, 2010, the Managers California Intermediate Tax-Free Fund returned 6.41%, compared to 6.91% for the Barclays Capital 5-Year Municipal Bond Index. The Fund’s underperformance can be primarily attributed to the weaker overall financial profile of the State of California relative to a majority of the rest of the country. The benchmark is a broad index, with exposure to states and municipalities across the U.S. As such, we believe the relatively modest underperformance is a somewhat positive development as it indicates the Fund’s California state-specific holdings performed relatively closely to the national market.
2
Letter to Shareholders (continued)
For the three months ended October 31, 2010, the Managers AMG TSCM Growth Equity Fund Institutional Share Class returned 9.40%, while its benchmark, the Russell 3000® Growth Index returned 10.50%. The primary driver of the Fund’s underperformance was its asset-allocation positioning. Specifically, the Fund’s underweight to the resilient consumer discretionary sector and its overweight to the lagging healthcare sector negatively impacted results. It is important to note that the Fund’s sector weights are solely a function of TimesSquare’s bottom-up investment approach. Stock selection was positive during the period with the Fund’s holdings in the industrials and healthcare sectors contributing positively to performance.
For the 12 months ended October 31, 2010, the Managers Real Estate Securities Fund returned 44.47%, while the benchmark, the Dow Jones U.S. Select REIT Index, returned 42.63%. During this period, the solid relative performance of the Fund has helped contribute to strong relative performance for the portfolio over a longer-term time horizon. Over the past year, performance has been primarily driven by solid stock selection across several areas of the REIT market.
For the 12 months ended October 31, 2010, the Managers Micro-Cap Fund returned 27.16% and the Managers Institutional Micro-Cap Fund returned 25.95% compared with 25.07% for their benchmark, the Russell Microcap® Index. Performance continues to remain strong relative to the Index since each Fund was converted to a multi-manager, multi-style approach in early 2008. Solid outperformance for both Funds over the last year has been driven by both positive stock selection as well as by relative sector positioning versus the benchmark. From a stock selection standpoint, most of the value over the past year has been led by holdings within the cyclically oriented consumer discretionary and information technology sectors. By the end of the fiscal year, the holdings within these two sectors combined to comprise nearly half of the positions in the overall portfolio. From a positioning standpoint, both Funds added value by virtue of their underweights to the underperforming financials sector and their overweights to the outperforming information technology sector.
The following report covers the one-year period that ended October 31, 2010. Should you have any questions about this report, or if you’d like to receive a prospectus and additional information, including fees and expenses for these or any of the other Funds in our family, please feel free to contact us at 1-800-835-3879, or visit our Web site at www.managersinvest.com. As always, please read the prospectus carefully before you invest or send money.
If you are curious about how you can better diversify your investment program, visit the Knowledge Center on our Web site and view our articles in the investment strategies section. You can rest assured that under all market conditions our team is focused on delivering excellent investment management services for your benefit.
We thank you for your continued confidence and investment in The Managers Funds.
|
| Respectfully, |
|
|
| John H. Streur |
| Senior Managing Partner |
| Managers Investment Group LLC |
3
About Your Fund’s Expenses
As a shareholder of a Fund, you may incur two types of costs: (1) transaction costs, which may include sales charges (loads) on purchase payments; redemption fees; and exchange fees; and (2) ongoing costs, including management fees; distribution (12b-1) fees; and other Fund expenses. This example is intended to help you understand your ongoing costs (in dollars) of investing in the Fund and to compare these costs with the ongoing costs of investing in other mutual funds. The example is based on $1,000 invested at the beginning of the period and held for the entire period as indicated below.
Actual Expenses
The first line of the following table provides information about the actual account values and actual expenses. You may use the information in this line, together with the amount you invested, to estimate the expenses that you paid over the period. Simply divide your account value by $1,000 (for example, an $8,600 account value divided by $1,000 = 8.6), then multiply the result by the number in the first line under the heading entitled “Expenses Paid During Period” to estimate the expenses you paid on your account during this period.
Hypothetical Example for Comparison Purposes
The second line of the following table provides information about hypothetical account values and hypothetical expenses based on the Fund’s actual expense ratio and an assumed annual rate of return of 5% before expenses, which is not the Fund’s actual return. The hypothetical account values and expenses may not be used to estimate the actual ending account balance or expenses you paid for the period. You may use this information to compare the ongoing costs of investing in the Fund and other funds by comparing this 5% hypothetical example with the 5% hypothetical examples that appear in the shareholder reports of other funds.
Please note that the expenses shown in the table are meant to highlight your ongoing costs only and do not reflect any transactional costs, such as sales charges (loads), redemption fees, or exchange fees. Therefore, the second line of the table is useful in comparing ongoing costs only, and will not help you determine the relative total costs of owning different funds.
| | | | | | | | | | | | | | | | |
Six Months Ended October 31, 2010 | | Expense
Ratio for
the Period | | | Beginning
Account Value
05/01/2010 | | | Ending
Account Value
10/31/2010 | | | Expenses Paid
During the
Period* | |
Managers Frontier Small Cap Growth Fund | | | | | | | | | | | | | | | | |
Investor Class1 | | | | | | | | | | | | | | | | |
Based on Actual Fund Return | | | 1.55 | % | | $ | 1,000 | | | $ | 1,015 | | | $ | 7.87 | |
Based on Hypothetical 5% Annual Return | | | 1.55 | % | | $ | 1,000 | | | $ | 1,017 | | | $ | 7.88 | |
Service Class | | | | | | | | | | | | | | | | |
Based on Actual Fund Return | | | 1.30 | % | | $ | 1,000 | | | $ | 1,016 | | | $ | 6.61 | |
Based on Hypothetical 5% Annual Return | | | 1.30 | % | | $ | 1,000 | | | $ | 1,019 | | | $ | 6.61 | |
Institutional Class1 | | | | | | | | | | | | | | | | |
Based on Actual Fund Return | | | 1.05 | % | | $ | 1,000 | | | $ | 1,016 | | | $ | 5.34 | |
Based on Hypothetical 5% Annual Return | | | 1.05 | % | | $ | 1,000 | | | $ | 1,020 | | | $ | 5.35 | |
Managers AMG TSCM Growth Equity Fund | | | | | | | | | | | | | | | | |
Investor Class2 | | | | | | | | | | | | | | | | |
Based on Actual Fund Return | | | 1.19 | % | | $ | 1,000 | | | $ | 1,000 | | | $ | 3.03 | |
Based on Hypothetical 5% Annual Return | | | 1.19 | % | | $ | 1,000 | | | $ | 1,000 | | | $ | 3.05 | |
Service Class2 | | | | | | | | | | | | | | | | |
Based on Actual Fund Return | | | 1.04 | % | | $ | 1,000 | | | $ | 1,000 | | | $ | 2.65 | |
Based on Hypothetical 5% Annual Return | | | 1.04 | % | | $ | 1,000 | | | $ | 1,010 | | | $ | 2.66 | |
Institutional Class2 | | | | | | | | | | | | | | | | |
Based on Actual Fund Return | | | 0.79 | % | | $ | 1,000 | | | $ | 1,000 | | | $ | 2.01 | |
Based on Hypothetical 5% Annual Return | | | 0.79 | % | | $ | 1,000 | | | $ | 1,011 | | | $ | 2.02 | |
Managers Micro-Cap Fund | | | | | | | | | | | | | | | | |
Based on Actual Fund Return | | | 1.43 | % | | $ | 1,000 | | | $ | 1,027 | | | $ | 7.31 | |
Based on Hypothetical 5% Annual Return | | | 1.43 | % | | $ | 1,000 | | | $ | 1,018 | | | $ | 7.27 | |
Managers Institutional Micro-Cap Fund | | | | | | | | | | | | | | | | |
Based on Actual Fund Return | | | 1.23 | % | | $ | 1,000 | | | $ | 1,032 | | | $ | 6.30 | |
Based on Hypothetical 5% Annual Return | | | 1.23 | % | | $ | 1,000 | | | $ | 1,019 | | | $ | 6.26 | |
Managers Real Estate Securities Fund | | | | | | | | | | | | | | | | |
Based on Actual Fund Return | | | 1.50 | % | | $ | 1,000 | | | $ | 1,071 | | | $ | 7.83 | |
Based on Hypothetical 5% Annual Return | | | 1.50 | % | | $ | 1,000 | | | $ | 1,018 | | | $ | 7.63 | |
Managers California Intermediate Tax-Free Fund | | | | | | | | | | | | | | | | |
Based on Actual Fund Return | | | 0.55 | % | | $ | 1,000 | | | $ | 1,035 | | | $ | 2.82 | |
Based on Hypothetical 5% Annual Return | | | 0.55 | % | | $ | 1,000 | | | $ | 1,022 | | | $ | 2.80 | |
| * | Expenses are equal to the Fund’s annualized expense ratio multiplied by the average account value over the period, multiplied by the number of days in the most recent fiscal half-year (184), then divided by 365. |
| 1 | Commencement of operations for this class was January 1, 2010. |
| 2 | Commenced operations on July 30, 2010, and as such, the expenses are equal to the Fund’s annualized expense ratio multiplied by the average account value over the period, multiplied by the number of days in the most recent fiscal period (93), then divided by 365. |
4
Managers Frontier Small Cap Growth Fund
Portfolio Manager’s Comments
The Portfolio Manager
Frontier manages client assets in small-, small/mid-, mid- and large-cap U.S. equity strategies. The Managers Frontier Small Cap Growth Fund follows a small-cap growth discipline as Frontier implements its “GARP” investment approach to select attractive small-cap stocks.
Frontier believes:
| | • | | Fundamental research is the cornerstone to adding value |
| | • | | Stock prices ultimately are linked to sales and earnings growth |
| | • | | Growth must be purchased at a reasonable price |
| | • | | Research is a continuous process |
Frontier utilizes and draws support from its entire team of 16 investment professionals to identify opportunities and conduct fundamental research. Through fundamental bottom-up research, Frontier seeks long-term capital appreciation by investing in small-capitalization companies that it believes have above-average earnings growth potential and are available at reasonable valuations.
Frontier looks for companies it believes can generate long-term, sustainable earnings, managed by qualified professionals capable of executing a well-conceived strategic plan. Frontier seeks businesses that can generate superior rates of return on capital in excess of their cost of capital over a business cycle due to above-average secular growth prospects or a competitive advantage.
The Year in Review
For the fiscal year ended October 31, 2010, the Managers Frontier Small Cap Growth Fund (Service Share Class) returned 24.59%, underperforming the Russell 2000® Growth Index, which returned 28.67%.
U.S. equities finished the twelve months ended October 31, 2010, with positive returns across the market-cap spectrum. Small caps were particularly strong and outperformed large caps. The small-cap Russell 2000® Index rose 26.58% versus the 17.67% gain of the large-cap Russell 1000® Index. From a style perspective, the Russell 2000® Growth Index, up 28.67%, outperformed the 24.43% return of the Russell 2000® Value Index.
The fiscal year ended on a strong note in October, fueled by expectations for renewed quantitative easing, the mid-term elections, and strong corporate earnings reports. While third quarter GDP rose at a lackluster 2.5% annual rate, it was better than the 1.7% rate posted in the previous quarter. Consumer spending, which accounts for approximately 70% of economic activity, rose 2.8% which marks the fastest pace in four years. The key issue remains when employment will improve and produce a more stable recovery. To that end, the Institute for Supply Management’s October manufacturing index rose 2.5 points to 56.9, better than expected and signaling growth. The important new orders gauge in the index shot up 7.8 points to 58.9, which ended a four-month slide. The service index rose 1.1 points to 54.3 and also showed a notable pickup in forward-looking new orders. A longer-term unknown is the efficacy and potential unintended consequences of the Fed’s renewed quantitative easing. As such, our focus remains investing in companies with the most compelling risk-adjusted return potential.
The Fund’s underperformance relative to the Russell 2000® Growth Index is primarily due to our GARP investment approach and stock selection. Small-Cap Growth performed better than value, so our emphasis on valuation hurt performance relative to the growth Index and more “growthy” peers. Our results in the financials and consumer discretionary sectors also detracted from performance. Within financials, a sector we are overweight relative to the Index, our return substantially lagged the near 20% gain of the Index. Our underperformance was driven by a handful of poor performers. The first of note, Argo Group, an insurance company that we sold from the portfolio back in January, was down 21.3%. The sale of Argo Group reflects our belief that we were much less likely to see a hardening of pricing in the insurance industry, which still has not materialized. Additionally, the company’s acquisitive history has yielded mixed financial results that continue to lag peers. Another key detractor from performance within financials was Investment Technology Group, an algorithmic trading platform for institutional investors, which declined 30.0%. We had significantly reduced the ITG position size last year at higher levels based on concerns the company had lost market share of overall trading volumes. We sold the remaining position in late summer as we did not have conviction that ITG will regain market share in the foreseeable future.
5
Managers Frontier Small Cap Growth Fund
Portfolio Manager’s Comments (continued)
Another notable detractor was the consumer discretionary sector as our portfolio holdings appreciated nicely (19.7%) but significantly lagged those within the Index (29.1%). Notable detractors included Chico’s FAS, Inc. (-17.8%), Harman International Industries, Inc. (-10.8%), and Corinthian Colleges, Inc. (-67.0%). Corinthian Colleges, Inc. is a for-profit education company that was the victim of intense regulatory change and scrutiny from the Department of Education and Congress. Chico’s FAS, Inc. is an apparel retailer focused on the missy women sector. The company has executed well, but the stock moved up sharply and subsequently has corrected. We believe their strong merchandise offerings will drive earnings of close to $1 per share next year. With $3 per share in cash on their balance sheet and no debt, we find the stock a compelling value at current levels and it remains a large position.
Stock performance within the health care sector also hurt relative performance. Given the uncertainty of health care reform and a more aggressive Food and Drug Administration (FDA), we maintained an underweight position in health care. The underweight proved beneficial, but was offset by poor security selection within the sector. Our largest detractor in the health care sector was Beckman Coulter, Inc., down -16.2%. As a provider of lab diagnostic equipment and consumable supplies to hospitals, Beckman Coulter, Inc. has a recurring and predictable revenue business model. However, a change in FDA policies forced the company to pull one of its key test modules from the market and this led to a shortfall in earnings and revenues. Another detractor within health care was VCA Antech, Inc., down -13.0%. The operator of veterinary hospitals and labs has not seen demand for its services return as expected and as a result, earnings numbers were lowered.
Partially offsetting the aforementioned detractors were strong results in the industrials and information technology sectors. In industrials, our 31.0% gain compared favorably to the 25.6% advance of the Index. Our outperformance was broad. Two stocks of note were Pall Corp. and WABCO Holdings, Inc. Pall Corp., a filtration company focused on improving profitability and returns by eliminating cost and selectively taking price increases, was up 36.7%. WABCO Holdings, Inc., a commercial truck component supplier, advanced 95.7% during the year and was the second strongest contributing stock within the portfolio.
Within technology, Skyworks Solutions, Inc. (+120.0%) and iGATE Corp. (+134.2%) led the way. Skyworks Solutions, Inc., a mixed-signal company focused on the cellular phone market, was the top contributing stock to the overall portfolio. iGATE Corp., a leading IT outsourcing company, was our highest returning stock in the portfolio and our second strongest relative contributor in the technology sector. Other strong technology investments included RF Micro Devices, Inc. (+73.6%), and Ariba, Inc. (+58.9%).
There were other notable strong performers across other economic sectors including Dollar Tree, Inc., Tractor Supply Co., and Nu Skin Enterprises, Inc. Dollar Tree, Inc. was up 70.5% and continues to have robust sales trends and financial results. Our long-term holding of retailer Tractor Supply Co. (+78.2%) and our investment in direct seller Nu Skin Enterprises, Inc. (+36.9%) also contributed strongly to our results in consumer discretionary.
Most macroeconomic indicators continue to suggest sluggish economic growth, including the manufacturing and service Institute for Supply Management indices, durable goods orders, employment statistics, and the leading economic indicators index. Given the many challenges still facing the global economy, this has resulted in an overall stock market that we believe is attractively valued, but very narrow in its leadership as investors have continued to chase the highest growth companies to considerable valuations. While our growth-at-reasonable-price style was largely responsible for our slight underperformance, we remain committed to this discipline and believe our portfolios are well positioned to deliver strong investment results in the upcoming year.
The views expressed above represent the views of Frontier as of October 31, 2010, and are not intended as a forecast or guarantee of future results.
Cumulative Total Return Performance
Managers Frontier Small Cap Growth Fund (formerly Managers Small Cap) cumulative total return is based on the daily change in net asset value (NAV), and assumes that all distributions were reinvested. The Russell 2000® Growth Index measures the performance of those Russell 2000® companies with higher price-to-book ratios and higher forecasted growth values. Unlike the Fund, the above stated index is unmanaged, is not available for investment, and does not incur expenses. This chart compares a hypothetical $10,000 investment made in the Managers Frontier Small Cap
6
Managers Frontier Small Cap Growth Fund
Portfolio Manager’s Comments (continued)
Cumulative Total Return Performance (continued)
Growth Fund on October 31, 2000, to a $10,000 investment made in the Russell 2000® Growth Index for the same time period. Performance for periods longer than one year is annualized. The graph and table do not reflect the deduction of taxes that a shareholder would pay on a Fund distribution or redemption of shares. The listed returns for the Fund are net of expenses and the returns for the index exclude expenses. Total returns for the Fund would have been lower had certain expenses not been reduced.
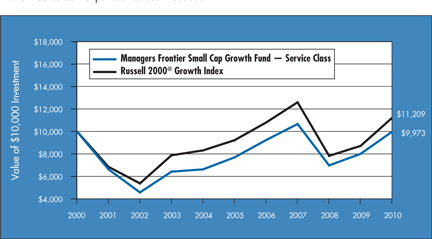
The table below shows the average annual total returns for the Managers Frontier Small Cap Growth Fund and the Russell 2000® Growth Index for the same periods ended October 31, 2010.
| | | | | | | | | | | | | | | | | | | | |
Average Annualized Total Returns1 | | One Year | | | Five Years | | | Ten Years | | | Since
Inception | | | Inception
Date | |
Managers Frontier Small Cap Growth Fund2,3 | | | | | | | | | | | | | | | | | | | | |
Service Class | | | 24.59 | % | | | 5.34 | % | | | (0.03 | )% | | | 5.80 | % | | | 9/24/97 | |
Investor Class4 | | | — | | | | — | | | | — | | | | 14.07 | % | | | 1/1/10 | |
Institutional Class4 | | | — | | | | — | | | | — | | | | 14.34 | % | | | 1/1/10 | |
Russell 2000® Growth Index5 | | | 28.67 | % | | | 3.99 | % | | | 1.15 | % | | | 14.97 | % | | | | |
The performance data shown represents past performance. Past performance is not a guarantee of future results. Current performance may be lower or higher than the performance data quoted. The investment return and principal value of an investment in the Fund will fluctuate so that an investor’s shares, when redeemed, may be worth more or less than their original cost. For performance information through the most recent month end, please call (800) 835-3879 or visit our Web site at www.managersinvest.com.
In choosing a Fund, investors should carefully consider the amount they plan to invest, their investment objectives, the Fund’s investment objectives, risks, charges and expenses before investing. For this and other information, please call (800) 835-3879 or visit www.managersinvest.com for a free prospectus. Read it carefully before investing or sending money. Distributed by Managers Distributors, Inc., member FINRA.
| 1 | Total return equals income yield plus share price change and assumes reinvestment of all dividends and capital gain distributions. Returns are net of fees and may reflect offsets of Fund expenses as described in the Prospectus. No adjustment has been made for taxes payable by shareholders on their reinvested dividends and capital gain distributions. Returns for periods greater than one year are annualized. The listed returns on the Fund are net of expenses and based on the published NAV as of October 31, 2010. All returns are in U.S. dollars($). |
| 2 | Fund for which, from time to time, the advisor has waived its fees and/or absorbed Fund expenses, which has resulted in higher returns. |
| 3 | The Fund is subject to risks associated with investments in small-capitalization companies, such as erratic earnings patterns, competitive conditions, limited earnings history, and a reliance on one or a limited number of products. |
| 4 | Commencement of operations for this class was January 1,2010. |
| 5 | The Russell 2000® Growth Index measures the performance of those Russell 2000® companies with higher price-to- book ratios and higher forecasted growth values. Unlike the Fund, the above stated index is unmanaged, is not available for investment, and does not incur expenses. |
The Russell 2000® Growth Index is a trademark of Russell Investments. Russell® is a trademark of Russell Investments.
Not FDIC insured, nor bank guaranteed. May lose value.
7
Managers Frontier Small Cap Growth Fund
Fund Snapshots
October 31, 2010
Portfolio Breakdown
| | | | | | | | |
Industry | | Managers Frontier Small
Cap Growth Fund** | | | Russell 2000®
Growth Index | |
Information Technology | | | 30.5 | % | | | 19.4 | % |
Industrials | | | 25.5 | % | | | 15.9 | % |
Consumer Discretionary | | | 11.3 | % | | | 13.4 | % |
Health Care | | | 11.0 | % | | | 14.9 | % |
Financials | | | 7.4 | % | | | 19.7 | % |
Energy | | | 7.3 | % | | | 4.5 | % |
Materials | | | 1.9 | % | | | 4.1 | % |
Consumer Staples | | | 1.7 | % | | | 3.4 | % |
Telecommunication Services | | | 1.3 | % | | | 1.2 | % |
Utilities | | | 0.0 | % | | | 3.5 | % |
Other Assets and Liabilities | | | 2.1 | % | | | 0.0 | % |
| ** | As a percentage of net assets |
Top Ten Holdings
| | | | |
Security Name | | Percentage
of Net Assets | |
Raymond James Financial, Inc.* | | | 2.8 | % |
Jabil Circuit, Inc. | | | 2.8 | |
Mednax, Inc.* | | | 2.7 | |
United Therapeutics Corp. * | | | 2.6 | |
Dollar Tree, Inc. | | | 2.2 | |
Ariba, Inc. | | | 2.0 | |
Tessera Technologies, Inc. | | | 2.0 | |
WABCO Holdings, Inc. * | | | 1.9 | |
Watsco, Inc. | | | 1.9 | |
Tech Data Corp. | | | 1.8 | |
| | | | |
Top Ten as a Group | | | 22.7 | % |
| | | | |
| * | Top Ten Holding at April 30, 2010 |
Any sectors, industries, or securities discussed should not be perceived as investment recommendations. Mention of a specific security should not be considered a recommendation to buy or solicitation to sell that security. Specific securities mentioned in this report may have been sold from the Fund’s portfolio of investments by the time you receive this report.
8
Managers Frontier Small Cap Growth Fund
Schedule of Portfolio Investments
October 31, 2010
| | | | | | | | |
| | | Shares | | | Value | |
Common Stocks - 97.9% | | | | | | | | |
Consumer Discretionary - 11.3% | | | | | | | | |
Bebe Stores, Inc. | | | 8,000 | | | $ | 52,480 | |
Cheesecake Factory, Inc., The* | | | 12,300 | | | | 358,176 | |
Chico’s FAS, Inc. | | | 52,200 | | | | 507,384 | |
Corinthian Colleges, Inc.* | | | 11,300 | | | | 58,986 | |
Dollar Tree, Inc.* | | | 13,150 | | | | 674,726 | |
Harman International Industries, Inc.* | | | 13,300 | | | | 446,215 | |
hhgregg, Inc.* | | | 11,900 | 2 | | | 274,176 | |
LKQ Corp.* | | | 21,300 | | | | 463,062 | |
P.F. Chang’s China Bistro, Inc. | | | 3,000 | | | | 137,760 | |
Tractor Supply Co. | | | 3,900 | | | | 154,440 | |
WMS Industries, Inc.* | | | 6,800 | | | | 296,684 | |
Total Consumer Discretionary | | | | | | | 3,424,089 | |
Consumer Staples - 1.7% | | | | | | | | |
Nu Skin Enterprises, Inc., Class A | | | 17,300 | | | | 529,380 | |
Energy - 7.3% | | | | | | | | |
Carrizo Oil & Gas, Inc.* | | | 14,900 | | | | 351,938 | |
Core Laboratories, N.V. | | | 500 | 2 | | | 38,885 | |
Denbury Resources, Inc.* | | | 25,500 | | | | 434,010 | |
Northern Oil & Gas, Inc.* | | | 14,900 | | | | 293,232 | |
Rex Energy Corp.* | | | 13,200 | | | | 162,624 | |
St. Mary Land & Exploration Co. | | | 10,500 | | | | 437,640 | |
World Fuel Services Corp. | | | 18,300 | | | | 516,609 | |
Total Energy | | | | | | | 2,234,938 | |
Financials - 7.4% | | | | | | | | |
Jefferies Group, Inc. | | | 13,500 | | | | 323,055 | |
optionsXpress, Inc.* | | | 9,000 | | | | 143,730 | |
Penson Worldwide, Inc.* | | | 9,500 | | | | 48,925 | |
Raymond James Financial, Inc. | | | 30,500 | | | | 860,710 | |
W.R. Berkley Corp. | | | 12,300 | | | | 338,496 | |
Waddell & Reed Financial, Inc. | | | 18,100 | | | | 526,167 | |
Total Financials | | | | | | | 2,241,083 | |
HealthCare - 11.0% | | | | | | | | |
American Medical Systems Holdings, Inc.* | | | 7,000 | | | | 141,400 | |
Beckman Coulter, Inc. | | | 5,100 | 2 | | | 271,524 | |
CONMED Corp.* | | | 15,600 | | | | 343,356 | |
Cumberland Pharmaceuticals, Inc.* | | | 13,600 | | | | 85,272 | |
DexCom, Inc.* | | | 14,700 | | | | 202,125 | |
Insulet Corp.* | | | 14,100 | | | | 224,895 | |
Mednax, Inc.* | | | 13,900 | | | | 823,019 | |
PSS World Medical, Inc.* | | | 9,000 | | | | 212,670 | |
United Therapeutics Corp.* | | | 13,200 | | | | 792,000 | |
VCA Antech, Inc.* | | | 6,600 | | | | 136,422 | |
West Pharmaceutical Services, Inc. | | | 3,400 | | | | 121,346 | |
Total Health Care | | | | | | | 3,354,029 | |
Industrials - 25.5% | | | | | | | | |
A.O. Smith Corp. | | | 5,000 | | | | 280,150 | |
Administaff, Inc. | | | 9,000 | | | | 235,890 | |
Advisory Board Co., The* | | | 6,000 | | | | 280,860 | |
Aecom Technology Corp.* | | | 11,000 | | | | 291,390 | |
Ameresco, Class A* | | | 8,200 | | | | 107,584 | |
Belden, Inc. | | | 11,800 | | | | 329,220 | |
Brady Corp. | | | 12,100 | | | | 372,075 | |
Carlisle Cos., Inc. | | | 7,600 | | | | 266,532 | |
CLARCOR, Inc. | | | 7,700 | | | | 305,382 | |
Comfort Systems USA, Inc. | | | 13,400 | | | | 153,430 | |
EnPro Industries, Inc.* | | | 4,400 | | | | 154,616 | |
Hub Group, Inc.* | | | 11,200 | | | | 363,664 | |
Kaman Corp., Class A | | | 5,400 | 2 | | | 145,530 | |
Kaydon Corp. | | | 3,400 | | | | 118,558 | |
Ladish Co., Inc.* | | | 3,700 | | | | 118,363 | |
Landstar System, Inc. | | | 12,300 | | | | 462,726 | |
MasTec, Inc.* | | | 42,700 | | | | 520,940 | |
Mine Safety Appliances Co. | | | 7,500 | | | | 211,200 | |
Navistar International Corp.* | | | 7,700 | | | | 370,986 | |
Pall Corp. | | | 10,200 | | | | 435,234 | |
Quanta Services, Inc.* | | | 16,800 | | | | 330,288 | |
UTI Worldwide, Inc. | | | 8,500 | | | | 163,370 | |
WABCO Holdings, Inc.* | | | 12,500 | | | | 580,250 | |
Waste Connections, Inc.* | | | 8,900 | | | | 362,586 | |
Watsco, Inc. | | | 10,3002 | | | | 576,491 | |
Wesco International, Inc.* | | | 5,700 | | | | 244,074 | |
Total Industrials | | | | | | | 7,781,389 | |
Information Technology - 30.5% | | | | | | | | |
Advanced Analogic Technologies, Inc.* | | | 22,800 | | | | 85,728 | |
Ariba, Inc.* | | | 32,800 | | | | 615,984 | |
Blackboard, Inc.* | | | 4,200 | 2 | | | 175,308 | |
Brightpoint, Inc.* | | | 48,400 | | | | 362,516 | |
Constant Contact, Inc.* | | | 7,100 | | | | 163,300 | |
Cymer, Inc.* | | | 6,000 | | | | 221,700 | |
Equinix, Inc.* | | | 3,000 | | | | 252,720 | |
Factset Research Systems, Inc. | | | 1,700 | | | | 149,226 | |
Fairchild Semiconductor International, Inc.* | | | 8,100 | | | | 91,287 | |
Fortinet, Inc.* | | | 5,400 | | | | 162,000 | |
iGATE Corp. | | | 7,200 | | | | 147,168 | |
The accompanying notes are an integral part of these financial statements.
9
Managers Frontier Small Cap Growth Fund
Schedule of Portfolio Investments (continued)
| | | | | | | | |
| | | Shares | | | Value | |
Information Technology - 30.5% (continued) | | | | | | | | |
Insight Enterprises, Inc.* | | | 13,100 | | | $ | 198,072 | |
Integrated Device Technology, Inc.* | | | 70,200 | | | | 413,478 | |
Intevac, Inc.* | | | 6,300 | | | | 63,630 | |
Jabil Circuit, Inc. | | | 54,500 | 2 | | | 836,030 | |
Littelfuse, Inc.* | | | 2,700 | | | | 114,561 | |
Loop Net, Inc.* | | | 15,100 | | | | 159,305 | |
Monolithic Power Systems, Inc.* | | | 14,700 | | | | 236,229 | |
Monster Worldwide, Inc.* | | | 13,000 | | | | 234,780 | |
Motricity, Inc.* | | | 4,200 | 2 | | | 92,274 | |
Ness Technologies, Inc.* | | | 16,400 | | | | 79,048 | |
ON Semiconductor Corp.* | | | 42,200 | | | | 323,674 | |
QLogic Corp.* | | | 12,600 | | | | 221,382 | |
QuinStreet, Inc.* | | | 22,200 | | | | 344,766 | |
Radisys Corp.* | | | 5,600 | | | | 54,712 | |
RF Micro Devices, Inc.* | | | 65,700 | | | | 478,953 | |
RightNow Technologies, Inc.* | | | 15,200 | | | | 397,024 | |
Rogers Corp.* | �� | | 4,500 | | | | 160,200 | |
Semtech Corp.* | | | 15,900 | | | | 340,419 | |
Skyworks Solutions, Inc.* | | | 10,500 | | | | 240,555 | |
Sonic Solutions, Inc.* | | | 9,400 | | | | 112,518 | |
Tech Data Corp.* | | | 12,700 | | | | 545,973 | |
Tessera Technologies, Inc.* | | | 30,200 | | | | 595,846 | |
VeriFone Systems, Inc.* | | | 6,700 | | | | 226,661 | |
Verint Systems, Inc.* | | | 5,700 | | | | 187,587 | |
Virtusa Corp.* | | | 15,100 | 2 | | | 215,326 | |
Total Information Technology | | | | | | | 9,299,940 | |
Materials - 1.9% | | | | | | | | |
Albemarle Corp. | | | 4,500 | | | | 225,585 | |
Cabot Corp. | | | 5,200 | | | | 176,904 | |
RTI International Metals, Inc.* | | | 5,200 | | | | 161,720 | |
Total Materials | | | | | | | 564,209 | |
Telecommunication Services - 1.3% | | | | | | | | |
Cogent Communications Group, Inc.* | | | 18,100 | | | | 196,385 | |
Premiere Global Services, Inc.* | | | 29,700 | | | | 202,851 | |
Total Telecommunication Services | | | | | | | 399,236 | |
Total Common Stocks
(cost $25,015,036) | | | | | | | 29,828,293 | |
Short-Term Investments - 5.7%1 | | | | | | | | |
BNY Institutional Cash Reserves Fund,
Series B*3,4 | | | 118,432 | | | | 94,184 | |
BNY Mellon Overnight Government
Fund, 0.21 %3 | | | 863,000 | | | | 863,000 | |
Dreyfus Cash Management Fund,
Institutional Class Shares, 0.16% | | | 771,499 | | | | 771,499 | |
Total Short-Term Investments
(cost $1,752,931) | | | | | | | 1,728,683 | |
Total Investments - 103.6%
(cost $26,767,967) | | | | | | | 31,556,976 | |
Other Assets, less Liabilities - (3.6)% | | | | | | | (1,110,459 | ) |
Net Assets - 100.0% | | | | | | $ | 30,446,517 | |
Note: Based on the approximate cost of investments of $27,025,980 for Federal income tax purposes at October 31, 2010, the aggregate gross unrealized appreciation and depreciation were $5,180,795 and $649,799, respectively, resulting in net unrealized appreciation of investments of $4,530,996.
| * | Non-income-producing security. |
| 1 | Yield shown for each investment company represents the October 31, 2010, seven-day average yield, which refers to the sum of the previous seven days’ dividends paid, expressed as an annual percentage. |
| 2 | Some or all of these shares, amounting to a market value of $916,920, or 3.0% of net assets, were out on loan to various brokers. |
| 3 | Collateral received from brokers for securities lending was invested in this short-term investment. |
| 4 | On September 12, 2008, The Bank of New York Mellon established a separate sleeve of the BNY Institutional Cash Reserves Fund (Series B) to hold certain Lehman Brothers floating rate notes. The Fund’s position in Series B is being fair valued daily. (See Note 4 in the Notes to Financial Statements.) |
The following table summarizes the inputs used to value the Fund’s net assets by the fair value hierarchy levels as of October 31, 2010. (See Note 1 (a) in the Notes to Financial Statements.)
| | | | | | | | | | | | | | | | |
| | | Quoted Prices
in Active
Markets for
Identical
Investments
Level 1 | | | Significant
Other
Observable
Inputs
Level 2 | | | Significant
Unobservable
Inputs
Level 3 | | | Total | |
Investments in Securities | | | | | | | | | | | | | | | | |
Common Stocks† | | $ | 29,828,293 | | | | — | | | | — | | | $ | 29,828,293 | |
Short-Term Investments | | | 1,634,499 | | | $ | 94,184 | | | | — | | | | 1,728,683 | |
| | | | | | | | | | | | | | | | |
Total Investments in Securities | | $ | 31,462,792 | | | $ | 94,184 | | | | — | | | $ | 31,556,976 | |
| | | | | | | | | | | | | | | | |
| † | All common stocks held in the Fund are Level 1 securities. For a detailed break-out of the common stocks by major industry classification, please refer to the Schedule of Portfolio Investments. |
As of October 31, 2010, the Fund had no significant transfers between Level 1 and Level 2 from the beginning of the reporting period.
The accompanying notes are an integral part of these financial statements.
10
Managers AMG TSCM Growth Equity Fund
Portfolio Manager’s Comments
The Managers AMG TSCM Growth Equity Fund (the “Fund”) seeks to achieve long-term capital appreciation by investing in the stocks of large-, mid- and small-capitalization companies.
The Portfolio Manager
TimesSquare Capital Management, LLC (“TimesSquare”), the Fund’s subadvisor, utilizes a bottom-up fundamental approach to all-cap investing. Led by co-managers Andrew Galligan, Tony Rosenthal, and Grant Babyak, the investment team at TimesSquare believes its proprietary fundamental research skills, which place a particular emphasis on the assessment of management quality and an in-depth understanding of superior business models, enable the team to build a diversified portfolio of large-cap, mid-cap and small-cap growth stocks designed to generate good risk-adjusted returns. When selecting growth stocks, Fund management utilizes a fundamental, bottom-up process to identify companies that demonstrate consistent and sustainable revenue and earnings growth, offer distinct and sustainable competitive advantages, have strong, experienced management teams, have stocks selling at reasonable valuations, and that Fund management believes have the potential to appreciate in price by 25 to 50% within the next 12 to 18 months.
The Period in Review
For the three-months ended October 31, 2010, the Managers AMG TSCM Growth Equity Fund (Institutional Share Class) returned 9.40%, while its benchmark, the Russell 3000® Growth Index returned 10.50%.
After July’s rally, macroeconomic concerns appeared to catch up with the U.S. equity market in August. The Institute of Supply Management’s gauge of manufacturing activity slipped again, though still above the crucial level of 50, which is indicative of growth and expansion. Private payrolls increased, though not as much as was expected and not enough to offset the decrease from government payrolls, so unemployment crept up to 9.6%. Consumer activity seemed disconnected from those economic forces since Consumer Confidence unexpectedly increased in August. This was also evident when consumer spending rose above forecasts despite a decrease in real disposable income.
September marked a significant upswing in the markets, more than erasing the drop in August. As has been the case for most of the year, market concerns regarding macroeconomic uncertainty and conflicting indicators drove stock returns. The Institute for Supply Management reported that the economy grew in September for the 17th consecutive month; however, growth in new orders continued to slow, which indicated weaker expectations for the fourth quarter. Overall inflation remained low with the Consumer Price Index trending lower to an annualized rate of 1.1%, but that masked recent price surges in commodities such as oil and corn. Even though the last recession – the longest since World War II – was officially pronounced to have ended in June 2009, the price of gold hit an all-time high of more than $1,300 an ounce. While the stock market grappled with such cognitive dissonance, the macroeconomic focus swamped the influence of individual stock selection decisions. For many stocks, high valuations seemed to stretch even further as investors looked for potential growth at any price.
Equities continued to rally in October prompted by positive sentiment. The market appeared to price in the Fed’s QE2 measures and Republican gains from the midterm election. Consumer confidence, as measured by the Conference Board, increased slightly in October prodded by improvement in both the present situation and expectation components. The Institute of Supply Management’s indices of manufacturing and services rose in October surpassing economists’ forecasts. Employment news was encouraging with the current month’s surge and prior month’s upward revision. Despite these developments, the unemployment rate remained unchanged at 9.6%.
During this period, the broad market return of the all caps performed in line with the small and large caps, yet trailed the mid caps with the Russell 3000® Index return of 8.37%, compared with the Russell 2000® Index return of 8.39%, the Russell 1000® Index return of 8.36%, and the Russell Midcap® Index return of 9.80%. In terms of style, growth stocks outperformed value stocks within each size segment; specific to the all cap space, the Russell 3000® Growth Index’s return of 10.50% handily beat the Russell 3000® Value Index return of 6.25%.
The portfolio underperformed the Russell 3000® Growth Index on a relative basis during the period. Stock selection had a net positive effect; in general, our investments in health care, producer durables, technology, and consumer staples outpaced their counterparts in the Index, while our holdings in materials and processing, financial services, and energy lagged. Sector allocation had a net negative effect and drove our underperformance although we continue to build our concentrated all-cap growth portfolio from the bottom-up.
Our overall stock selection in health care helped our performance. The top contributor for the period was DaVita, Inc., a provider of dialysis services for patients suffering from chronic kidney failure. DaVita rose by 25% as the company reported an in-line quarter with good organic volume growth and raised guidance for the low end of operating income. Management reported lower costs from lower Epogen drug utilization during the quarter; if this trend persists, DaVita could experience meaningful margin expansion as it moves to a bundled payment system for Medicare patients next January. DaVita’s current round of refinancing appears to be on track at better than expected rates, and their share buybacks have continued. Cephalon, Inc. is a biopharmaceutical company focused on products for the central nervous system, inflammatory disease, pain, and oncology therapeutic areas. Cephalon handily beat estimates, raised 2010 guidance, and issued 2011 guidance at 3 to 5% above consensus. Phase 2 and Phase 3 clinical trial data from their pipeline and the emergence of a follow-on drug to Treanda – their current drug used to treat patients suffering from non-Hodgkin’s lymphoma – could also serve as catalysts for the stock in 2011. Their shares appreciated by 17%, and we added to our position.
In the producer durables sector, Ametek, Inc. manufactures and sells electronic instruments for various applications used in transportation industries, such as aircraft cockpit instruments and displays, and electromechanical devices such as drive motors. Climbing 22%, Ametek beat earnings estimates with better-than-
11
Managers AMG TSCM Growth Equity Fund
Portfolio Manager’s Comments (continued)
expected sales driving their operating margins higher. Acquisitions helped to fuel the growth in the company’s orders in the third quarter, and management raised guidance for the fourth quarter and full year. URS Corporation is a power, oil and gas, and infrastructure engineering and construction company for public agencies and private sector companies. URS reported earnings in line with consensus, although revenues and project backlogs had decreased, and their shares slipped by -4%. We added to our position. Traditionally, this fiscal quarter has been a low point for URS’s backlog, so part of the issue appeared to be normal seasonality. On a more positive note, the company reaffirmed its forward guidance and subsequently increased its current share buyback program.
Stock selection within our technology holdings, while a positive contributor to our performance overall, netted some mixed individual results. Apple, Inc. manufactures and markets personal computers, mobile communication and media devices, portable digital music players, and related software, services, and peripherals under the Mac, iPod, iPad, and iPhone lines. With a 70% surge in quarterly earnings driven by demand for its iPhone, Apple’s shares gained 17%, and we added to our position. Apple also unveiled the latest generation of iPods. While the latest sales results for Apple’s iPad came in lower than expectations, Apple has increased production in preparation for holiday sales and expanded retail distribution of the product. Up 19%, QUALCOMM Incorporated designs and manufactures digital wireless telecommunications products and services including CDMA-based integrated circuits. QUALCOMM reported a solid quarter and outlook that reversed most of the recent concerns around volumes. The company continues to benefit from consumers increasing their use of 3G devices, and they have partnered with Microsoft on the new Windows Phone 7. Google, Inc. maintains a search engine on an index of websites and other online content. Google shares surged 27% as the company exceeded revenue and earnings estimates. Management gave insights for the first time on the strength of their nascent mobile (Android) and online display ad businesses (DoubleClick Exchange and YouTube/video), both of which are on track to become significant parts of their business. Juniper Networks, Inc. specializes in products and services for network infrastructure, including routing and switching products that control and direct network traffic as well as firewall VPN systems. With a strong quarterly report with revenues across all segments ahead of expectations as was the overall bottom line, Juniper’s shares rose 17%. We trimmed our position on strength. The company has also been selected by AT&T for a key supply contract, and they are acquiring privately held SMobile Systems, a developer of security software for smartphones and tablets, for $70 million in cash. American Tower Corporation, a wireless and broadcast communications infrastructure company that owns and operates communications sites, ran up by 12%, and we trimmed our position on strength. American Tower reported a solid quarter, and new smartphones continue to drive wireless usage. As the bottom most detractor to our returns during the period, shares of Varian Semiconductor Equipment Associates, Inc., the leading manufacturer of ion implantation systems used in the fabrication process for integrated circuits, fell by -11%. Weakness in many of the electronics end markets is negatively impacting the demand for semi-cap stocks such as Varian. PC weakness in Europe has broadened to China and the U.S. consumer, non-smartphone handset demand is weak, and other consumer electronics such as LCD TVs are encountering demand issues as well; we sold our position.
In the materials and processing sector, Monsanto Company provides agricultural products for farmers worldwide including seeds, biotechnology traits that help control insects and weeds, and herbicides. Their net sales decreased, and the company lowered the top end of its profit guidance for the full year. Their stock fell by -15% on concerns over disappointing harvest results of the company’s new highly touted corn seed, SmartStax. We exited our position.
Our stock selection in financial services detracted from our performance. CME Group Inc. operates the CME, CBOT, NYMEX, and COMEX exchanges, which specialize in futures and options covering all major asset classes. Their shares were dragged down by -5% with a seasonally slow month in August. More importantly, the difficult economic outlook and the lack of upcoming expected Fed funds rate hikes will likely prevent CME from returning to peak interest rate futures volume levels until 2012, which limits near-term revenue growth, thus we decided to sell our position. MasterCard, Inc. provides transaction processing and related services in support of their credit, ATM payment card, and traveler’s check programs. The company may face risk when the new debit card provision becomes law, which is aimed at saving retailers money in debit card fees, as merchants typically pay 1% to 2% of a debit transaction. We sold our shares, which finished down by -5%, over concerns regarding potential concessions on credit interchange and potential investment/technology spending.
Turning to the energy sector, Range Resources Corporation is a natural gas exploration and production (E&P) company focused on the Permian Basin of west Texas and eastern New Mexico, the Barnett Shale of north central Texas, and Appalachian regions of the US. During the period, there was a fire and an explosion at wells operated by other companies, but stock prices for all the natural gas E&Ps active in the area were caught in the subsequent downdraft. The stock finished up just 1%, which trailed the benchmark sector return of 9%, as ongoing concerns regarding well safety in the Marcellus shale weighed on this segment.
At TimesSquare, we remain steadfast in our belief that a bottom-up approach focused on long-term quality growth will be rewarded. Each day brings new challenges, and we continuously work to meet them, prudently adjusting the portfolio as necessary. As always, we appreciate the confidence you have placed in our investment team.
The views expressed above represent the views of TimesSquare as of October 31, 2010, and are not intended as a forecast or guarantee of future results.
Cumulative Total Return Performance
Managers AMG TSCM Growth Equity Fund’s cumulative total return is based on the daily change in net asset value (NAV), and assumes that all distributions were reinvested. The Russell 3000® Growth Index measures the performance of those Russell 3000® Index companies with higher price-to-book ratios and higher forecasted growth values. Unlike the Fund, the Russell 3000® Growth Index is unmanaged, is not available for investment, and does not incur expenses. This chart compares a hypothetical $10,000 investment made in the Fund’s Institutional Class on July 30, 2010
12
Managers AMG TSCM Growth Equity Fund
Portfolio Manager’s Comments (continued)
Cumulative Total Return Performance (continued)
(commencement of operations) to a $10,000 investment made in the Russell 3000® Growth Index for the same time period. The graph and table do not reflect the deduction of taxes that a shareholder would pay on a Fund distribution or redemption of shares. The listed returns for the Fund are net of expenses and the returns for the index exclude expenses. Total returns for the Fund would have been lower had certain expenses not been reduced.
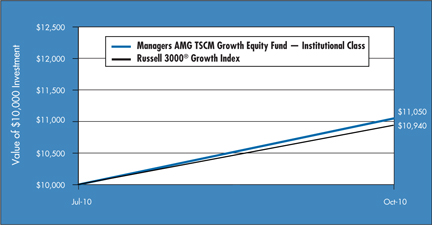
The table below shows the total return for the Managers AMG TSCM Growth Equity Fund and the Russell 3000® Growth Index since inception to October 31, 2010.
| | | | | | | | |
Total Returns1 | | Since Inception | | | Inception Date | |
Managers AMG TSCM Growth Equity Fund2,3,4,5 | | | | | | | | |
Investor Class | | | 9.30 | % | | | 7/30/10 | |
Service Class | | | 9.40 | % | | | 7/30/10 | |
Institutional Class | | | 9.40 | % | | | 7/30/10 | |
Russell 3000® Growth Index6 | | | 10.50 | % | | | | |
The performance data shown represents past performance. Past performance is not a guarantee of future results. Current performance may be lower or higher than the performance data quoted. The investment return and principal value of an investment in the Fund will fluctuate so that an investor’s shares, when redeemed, may be worth more or less than their original cost. For performance information through the most recent month end, please call (800) 835-3879 or visit our Web site at www.managersinvest.com.
In choosing a Fund, investors should carefully consider the amount they plan to invest, their investment objectives, the Fund’s investment objectives, risks, charges and expenses before investing. For this and other information, please call (800) 835-3879 or visit www.managersinvest.com for a free prospectus. Read it carefully before investing or sending money. Distributed by Managers Distributors, Inc., member FINRA.
| 1 | Total return equals income yield plus share price change and assumes reinvestment of all dividends and capital gain distributions. Returns are net of fees and may reflect offsets of Fund expenses as described in the Prospectus. No adjustment has been made for taxes payable by shareholders on their reinvested dividends and capital gain distributions. Returns for periods greater than one year are annualized. The listed returns on the Fund are net of expenses and based on the published NAV as of October 31, 2010. All returns are in U.S. dollars($). |
| 2 | The Fund invests in growth stocks, which may be more sensitive to market movements because their prices tend to reflect future investor expectations rather than just current profits. Growth stocks may underperform value stocks during given periods. |
| 3 | The Fund is subject to risks associated with investments in small-and mid-capitalization companies, such as erratic earnings patterns, competitive conditions, limited earnings history, and a reliance on one or a limited number of products. |
| 4 | A greater percentage of the Fund’s holdings may be focused in a smaller number of securities which may place the Fund at greater risk than a more diversified fund. |
| 5 | Fund for which, from time to time, the advisor has waived its fees and/or absorbed Fund expenses, which has resulted in higher returns. |
| 6 | The Russell 3000® Growth Index measures the performance of those Russell 3000® Index companies with higher price-to-book ratios and higher forecasted growth values. Unlike the Fund, the Russell 3000® Growth Index is unmanaged, is not available for investment, and does not incur expenses. |
The Russell 3000® Growth Index is a trademark of Russell Investments. Russell® is a trademark of Russell Investments.
Not FDIC insured, nor bank guaranteed. May lose value.
13
Managers AMG TSCM Growth Equity Fund
Fund Snapshots
October 31, 2010
Portfolio Breakdown
| | | | | | | | |
Industry | | Managers AMG TSCM
Growth Equity Fund** | | | Russell 3000®
Growth Index | |
Information Technology | | | 28.9 | % | | | 18.9 | % |
Industrials | | | 20.6 | % | | | 11.4 | % |
Health Care | | | 17.9 | % | | | 11.6 | % |
Consumer Discretionary | | | 11.6 | % | | | 11.5 | % |
Financials | | | 6.9 | % | | | 16.0 | % |
Energy | | | 5.6 | % | | | 10.4 | % |
Telecommunication Services | | | 3.1 | % | | | 2.9 | % |
Materials | | | 2.8 | % | | | 4.2 | % |
Consumer Staples | | | 1.5 | % | | | 9.5 | % |
Utilities | | | 0.0 | % | | | 3.6 | % |
Other Assets and Liabilities | | | 1.1 | % | | | 0.0 | % |
| ** | As a percentage of net assets |
Top Ten Holdings
| | | | |
Security Name | | Percentage
of Net Assets | |
Google, Inc. | | | 6.1 | % |
Apple, Inc. | | | 5.9 | |
DaVita, Inc. | | | 4.8 | |
Danaher Corp. | | | 4.6 | |
Ametek, Inc. | | | 4.4 | |
United Parcel Service, Inc., Class B | | | 4.2 | |
QUALCOMM, Inc. | | | 4.1 | |
Cephalon, Inc. | | | 3.6 | |
Allstate Corp., The | | | 3.4 | |
Express Scripts, Inc. | | | 3.1 | |
| | | | |
Top Ten as a Group | | | 44.2 | % |
| | | | |
Any sectors, industries, or securities discussed should not be perceived as investment recommendations. Mention of a specific security should not be considered a recommendation to buy or solicitation to sell that security. Specific securities mentioned in this report may have been sold from the Fund’s portfolio of investments by the time you receive this report.
14
Managers AMG TSCM Growth Equity Fund
Schedule of Portfolio Investments
October 31, 2010
| | | | | | | | |
| | | Shares | | | Value | |
Common Stocks - 98.9% | | | | | | | | |
Consumer Discretionary - 11.6% | | | | | | | | |
Amazon.com, Inc.* | | | 93 | | | $ | 15,358 | |
Coach, Inc. | | | 495 | | | | 24,750 | |
Hasbro, Inc. | | | 390 | | | | 18,038 | |
Home Depot, Inc., The | | | 541 | | | | 16,706 | |
Kohl’s Corp.* | | | 410 | | | | 20,992 | |
Nike, Inc. | | | 370 | | | | 30,132 | |
Total Consumer Discretionary | | | | | | | 125,976 | |
Consumer Staples - 1.5% | | | | | | | | |
General Mills, Inc. | | | 435 | | | | 16,330 | |
Energy - 5.6% | | | | | | | | |
Denbury Resources, Inc.* | | | 1,045 | | | | 17,786 | |
Halliburton Co. | | | 995 | | | | 31,701 | |
Range Resources Corp. | | | 300 | | | | 11,217 | |
Total Energy | | | | | | | 60,704 | |
Financials - 6.9% | | | | | | | | |
Aflac, Inc. | | | 155 | | | | 8,662 | |
Allstate Corp., The | | | 1,195 | | | | 36,436 | |
JPMorgan Chase & Co. | | | 141 | | | | 5,306 | |
Lazard, Ltd., Class A | | | 690 | | | | 25,461 | |
Total Financials | | | | | | | 75,865 | |
Health Care - 17.9% | | | | | | | | |
Aetna, Inc. | | | 1,010 | | | | 30,158 | |
Boston Scientific Corp.* | | | 3,139 | | | | 20,027 | |
Cephalon, Inc.* | | | 595 | | | | 39,532 | |
DaVita, Inc.* | | | 722 | | | | 51,804 | |
Express Scripts, Inc.* | | | 689 | | | | 33,430 | |
Shire PLC | | | 280 | | | | 19,628 | |
Total Health Care | | | | | | | 194,579 | |
Industrials - 20.6% | | | | | | | | |
Allegiant Travel Co. | | | 510 | | | | 24,016 | |
Ametek, Inc. | | | 895 | | | | 48,375 | |
Danaher Corp. | | | 1,156 | | | | 50,124 | |
Parker Hannifin Corp. | | | 75 | | | | 5,741 | |
Union Pacific Corp. | | | 320 | | | | 28,058 | |
United Parcel Service, Inc., Class B | | | 675 | | | | 45,454 | |
URS Corp.* | | | 575 | | | | 22,385 | |
Total Industrials | | | | | | | 224,153 | |
Information Technology - 28.9% | | | | | | | | |
Accenture PLC, Class A | | | 725 | | | | 32,415 | |
Analog Devices, Inc. | | | 355 | | | | 11,953 | |
Apple, Inc.* | | | 212 | | | | 63,784 | |
Broadcom Corp., Class A | | | 150 | | | | 6,111 | |
Cognizant Technology Solutions Corp.* | | | 85 | | | | 5,541 | |
Google, Inc.* | | | 108 | | | | 66,203 | |
Juniper Networks, Inc.* | | | 845 | | | | 27,370 | |
Micron Technology, Inc.* | | | 620 | | | | 5,127 | |
MICROS Systems, Inc.* | | | 260 | | | | 11,801 | |
QUALCOMM, Inc. | | | 980 | | | | 44,227 | |
Teradata Corp.* | | | 570 | | | | 22,435 | |
Texas Instruments, Inc. | | | 575 | | | | 17,004 | |
Total Information Technology | | | | | | | 313,971 | |
Materials - 2.8% | | | | | | | | |
Ecolab, Inc. | | | 615 | | | | 30,332 | |
Telecommunication Services - 3.1% | | | | | | | | |
American Tower Corp., Class A* | | | 645 | | | | 33,288 | |
Total Common Stocks
(cost $977,466) | | | | | | | 1,075,198 | |
Short-Term Investments - 1.8%1 | | | | | | | | |
Dreyfus Cash Management Fund, Institutional Class Shares, 0.16%
(cost $19,642) | | | 19,642 | | | | 19,642 | |
Total Investments - 100.7%
(cost $997,108) | | | | | | | 1,094,840 | |
Other Assets, less Liabilities - (0.7)% | | | | | | | (7,449 | ) |
Net Assets - 100.0% | | | | | | $ | 1,087,391 | |
Note: Based on the approximate cost of investments of $997,949 for Federal income tax purposes at October 31, 2010, the aggregate gross unrealized appreciation and depreciation were $97,802 and $911, respectively, resulting in net unrealized appreciation of investments of $96,891.
| * | Non-income-producing security. |
| 1 | Yield shown for each investment company represents the October 31, 2010, seven-day average yield, which refers to the sum of the previous seven days’ dividends paid, expressed as an annual percentage. |
The following table summarizes the inputs used to value the Fund’s net assets by the fair value hierarchy levels as of October 31, 2010. (See Note 1(a) in the Notes to Financial Statements.)
| | | | | | | | | | | | | | | | |
| | | Quoted
Prices in
Active
Markets for
Identical
Investments
Level 1 | | | Significant
Other
Observable
Inputs
Level 2 | | | Significant
Unobservable
Inputs
Level 3 | | | Total | |
Investments in Securities | | | | | | | | | | | | | | | | |
Common Stocks† | | $ | 1,075,198 | | | | — | | | | — | | | $ | 1,075,198 | |
Short-Term Investments | | | 19,642 | | | | — | | | | — | | | | 19,642 | |
| | | | | | | | | | | | | | | | |
Total Investments in Securities | | $ | 1,094,840 | | | | — | | | | — | | | $ | 1,094,840 | |
| | | | | | | | | | | | | | | | |
| † | All common stocks held in the Fund are Level 1 securities. For a detailed break-out of the common stocks by major industry classification, please refer to the Schedule of Portfolio Investments. |
As of October 31, 2010, the Fund had no significant transfers between Level 1 and Level 2 from the beginning of the reporting period.
The accompanying notes are an integral part of these financial statements.
15
Managers Micro-Cap Fund
Portfolio Manager’s Comments
The Managers Micro-Cap Fund primarily invests in the stocks of U.S. micro-capitalization companies. Normally the Fund will invest at least 80% of its net assets in U.S. micro-cap stocks. The Fund employs multiple portfolio managers who specialize in distinct investment approaches. This “intelligence diversification” not only serves to manage risk, but also seeks to incorporate into the portfolio the breadth of the micro-cap market by focusing different analytical insights on micro-cap investing. The Fund’s team of subadvisors strives to achieve this performance and diversification while ensuring that the Fund operates within the framework of its investment objective and principal investment strategies. The Russell Microcap® Index is the benchmark for the Fund.
The Portfolio Managers
Lord, Abbett & Co., LLC (“Lord Abbett”)
The team focuses its stock selection effort by focusing on companies that have revenue growth of at least 15%, are experiencing year-to-year operating margin improvement, and are experiencing earnings growth that is driven by top-line growth rather than being driven by one-time events or simple cost-cutting measures. The focus is also on identifying companies with higher-quality balance sheets (often captured by finding companies with manageable debt-to-total-capital ratios) and that are already profitable. Once this process is completed, the focus for the team is on forecasting both revenue and earnings growth over the next several years. To achieve this goal, and to find companies that are expected to grow faster than their industry average, members of the team spend an extensive amount of time understanding the competitive advantages of a firm, the industry dynamics within which they operate, and the strength of management.
The sell discipline is enacted if there is a fundamental change in the business, a more attractive alternative is found, or if a holding reaches a 5% weight in the overall portfolio. The Lord Abbett portfolio typically holds between 75 and 100 stocks with no individual holding typically exceeding 5%. There is a risk constraint that prevents any individual industry from being greater than 25% of the total portfolio weight. The annual turnover of the portfolio is expected to be relatively high although there is no explicit target as part of either the stock selection or the portfolio-construction process.
Next Century Growth Investors, LLC (“Next Century”)
The team requires historical revenue growth of at least 15% for a company before conducting further research. Other key factors considered initially by the team are strong historical revenue growth, low debt, and high ROE. Quantitative screening is done on a regular basis to see which stocks over the past year are experiencing significant growth. The next stage of this process involves intensive first-hand research to determine the growth prospects of a company with the team choosing a stock only when it has become convinced a company has an extraordinary opportunity to grow its business. The uniqueness of this process lies in the fact that the team seeks out these companies regardless of their short-term prospects and or current valuation. The team is looking for “home runs” and companies that will grow to the point that they will eventually reach a small-market capitalization.
The sell discipline is enacted if there is a change in the original investment thesis or a fundamental change in business of the company. In addition, a holding will become a candidate for sale if it reaches an extreme valuation, becomes larger than 5% of the overall portfolio or as it approaches $1 billion in market capitalization. Typically companies are sold out of the micro-cap portfolio because they have approached $1 billion in market capitalization.
The Next Century portion of the portfolio is concentrated and typically has 40-60 holdings, which can create a high level of volatility. The only risk constraints are that sector weights cannot exceed two times the Russell 2000® Growth sector weights, and no individual holding can be greater than 5% of the portfolio.
RBC Global Asset Management (U.S.) Inc. (“RBC”)
The team uses an investment process that focuses on generating solid stock selection by identifying companies with strong, long-term, attractive business fundamentals that are selling at low valuations. In order to initially generate ideas, the team at RBC uses quantitative screens and industry research to concentrate stock selection on a narrower sub-universe of micro-cap companies. The team then focuses a majority of its time on conducting intensive “on-the-ground” fundamental research in order to uncover these opportunities. The focus is on identifying companies with long-term, solid business fundamentals and near-term profitability improvement potential. In terms of short-term factors, the team looks for companies that have shown institutional investor neglect or avoidance and sizeable insider ownership with the potential for both improving profit margins and accelerating earnings in the near future. In terms of long-term factors, the team looks for companies with proven products or services that are leading in market share within their respective industries while maintaining a sustainable competitive advantage and a solid balance sheet.
The resulting portfolio that is generated by this stock selection process tends to exhibit low turnover with company stocks generally held for several years. The portfolio is well diversified with anywhere from 60 to 90 holdings with a maximum of 5% in any single holding.
WEDGE Capital Management L.L.P. (“WEDGE”)
The investment process is a combination of both quantitative and fundamental research insights. The quantitative portion of the investment process uses commonly found factors and characteristics that can be accessed via any number of commercial databases. The value-added portion of the process, therefore, uses a number of different factors across five major categories: valuation, earnings quality, operating efficiency, capital usage and momentum, whose efficacy has been verified via long-term regression analysis. This is referred to as the Fundamental Value model. The top results of this model are combined with the best resulting stocks from the Financial Quality model, which measures stocks across categories such as multiple earnings growth, profitability, leverage, and liquidity. The top stocks that appear in both models are eligible for fundamental research. The fundamental research portion of the investment process is exclusionary in nature and meant to eliminate stocks that are not strong in earnings forecasts, valuation metrics, sector\industry outlook, or any factor that cannot be easily captured quantitatively.
16
Managers Micro-Cap Fund
Portfolio Manager’s Comments (continued)
A stock is scrutinized for possible sale if it falls below the top four deciles in the Fundamental Value model. Stocks are sold when they become fairly valued, an upgrade opportunity develops, or the original investment thesis materially deteriorates. The portion of the portfolio managed by WEDGE is confined to plus or minus 10% in any given sector, although sector positions tend to be much closer to the Index weight than this (it should be noted that these self-imposed sector weighting constraints are based on a proprietary liquidity analysis conducted on an ongoing basis by the micro-cap team and is NOT driven by the sector weightings of any micro-cap benchmark). The final portfolio seeks to be a well-diversified, micro-cap portfolio holding approximately 150 securities and consistently maintaining a value bias relative to the benchmark. The portfolio tends to hold securities within the $40 million to $400 million market capitalization range, although it does not require a sale of a holding until it reaches $800 million in market capitalization.
The Year in Review
The past twelve months saw a continuation of the market rally that began back in March 2009, although certainly with more stops and starts than witnessed at the beginning of the rally. The lower- quality nature of the equity rally leveled off during the fourth quarter of 2010, although high-quality stocks have yet to significantly outpace their lower-quality counterparts and the market has continued to be driven by headline and macroeconomic news as opposed to underlying fundamentals of individual companies. The early portion of the year was characterized by the relative strength of the U.S. Dollar (and its subsequent consequences for companies in the U.S. with different levels of exposure to the strength of the Dollar) as global investors found the reserve status of the Dollar particularly comforting in the wake of a weakening Euro amid the concern of potential default risk for several sovereign nations in continental Europe. The second quarter of 2010 was marked by renewed fears of financial contagion and slowing economic growth. The third quarter of 2010 was a perfect microcosm of the skittishness of the market and investors over the course of the past year. In July, solid earnings from a number of bell weather companies led to strong market results. August featured a renewed round of lukewarm economic data that led to a market pullback and increased risk aversion amongst investors. September and October, on the other hand, saw a sharp market bounce back and increased risk taking among investors who still have considerable cash waiting to be invested but are still hesitant about reentering equity markets. Against this backdrop, micro-cap equities performed quite well, only modestly trailing small-cap equities but significantly outperforming U.S. large-cap equities.
For the 12 months that ended October 31, 2010, the Managers Micro-Cap Fund returned 27.16%, compared with 25.07% for its benchmark, the Russell Microcap® Index. Performance continues to remain strong relative to both the Index and peers since the Fund was converted to a multi-manager, multi-style approach in early 2008. Solid outperformance over the last year has been driven by both positive stock selections as well as by relative sector positioning versus the benchmark. From a stock selection standpoint, most of the value over the past year has been led by holdings within the cyclically oriented consumer discretionary and information technology sectors. By the end of the fiscal year, the holdings within these two sectors combined to comprise nearly half of the positions in the overall portfolio. From a positioning standpoint, the Fund added value by virtue of its underweight to the underperforming financials sector and its overweight to the outperforming information technology sector. The financial sector tends to be a perpetual underweight in the Fund while the overweight to the improving information technology sector was certainly timely, given it was the best performing micro-cap sector as the economy rebounded throughout the last fiscal year. Similar to the prior fiscal year, the Fund’s growth subadvisors performed the best, which is not surprising given the economic backdrop and increased optimism of the prior twelve months.
Looking Forward
The portfolio managers are optimistic about forward-looking prospects for the economy and, more specifically, for micro-cap equities as they believe the potential for a double-dip recession continues to shrink. Therefore, the portfolio is currently positioned with a sizable overweight compared to the benchmark in the more economically sensitive areas such as the consumer discretionary, industrials, and information technology sectors which all stand to benefit from an improved and stable economy. As uncertainty continues to come out of the market, stock price movements will increasingly be driven by individual company fundamentals. This type of market would be to the direct benefit of this portfolio which is comprised of four subadvisors who focus their efforts on generating performance via bottom-up stock selection.
Cumulative Total Return Performance
Managers Micro-Cap Fund (formerly Managers Fremont Micro-Cap Fund) cumulative total return is based on the daily change in net asset value (NAV), and assumes that all distributions were reinvested. The Russell Microcap® Index tracks the micro-cap segment of the U.S. equity market. It makes up less than 3% of the U.S. equity market and is represented by the smallest 1,000 securities in the small-cap Russell 2000® Index plus the next 1,000 securities. Unlike the Fund, the above stated index is unmanaged, is not available for investment, and does not incur expenses. This chart compares a hypothetical $10,000 investment made in the Managers Micro-Cap Fund on October 31, 2000, to a $10,000 investment made in the
17
Managers Micro-Cap Fund
Portfolio Manager’s Comments (continued)
Cumulative Total Return Performance (continued)
Russell Microcap® Index for the same time period. Performance for periods longer than one year is annualized. The graph and table do not reflect the deduction of taxes that a shareholder would pay on a Fund distribution or redemption of shares. The listed returns for the Fund are net of expenses and the returns for the index exclude expenses. Total returns for the Fund would have been lower had certain expenses not been reduced.
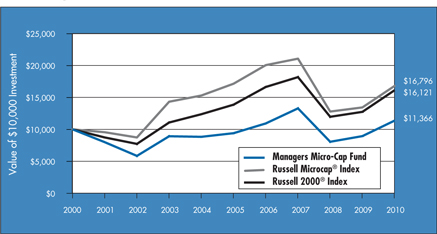
The table below shows the average annual total returns for the Managers Micro-Cap Fund, the Russell Microcap® Index and the Russell 2000® Index for the one-year, five-year and ten-year periods ended October 31, 2010.
| | | | | | | | | | | | |
Average Annual Total Returns1 | | One Year | | | Five Years | | | Ten Years | |
Managers Micro-Cap Fund2,3 | | | 27.16 | % | | | 3.88 | % | | | 1.29 | % |
Russell Microcap® Index4 | | | 25.07 | % | | | (0.40 | )% | | | 5.32 | % |
Russell 2000® Index5 | | | 26.58 | % | | | 3.07 | % | | | 4.89 | % |
The performance data shown represents past performance. Past performance is not a guarantee of future results. Current performance may be lower or higher than the performance data quoted. The investment return and principal value of an investment in the Fund will fluctuate so that an investor’s shares, when redeemed, may be worth more or less than their original cost. For performance information through the most recent month end, please call (800) 835-3879 or visit our Web site at www.managersinvest.com.
In choosing a Fund, investors should carefully consider the amount they plan to invest, their investment objectives, the Fund’s investment objectives, risks, charges and expenses before investing. For this and other information, please call (800) 835-3879 or visit www.managersinvest.com for a free prospectus. Read it carefully before investing or sending money. Distributed by Managers Distributors, Inc., member FINRA.
| 1 | Total return equals income yield plus share price change and assumes reinvestment of all dividends and capital gain distributions. Returns are net of fees and may reflect offsets of Fund expenses as described in the Prospectus. No adjustment has been made for taxes payable by shareholders on their reinvested dividends and capital gain distributions. Returns for periods greater than one year are annualized. The listed returns on the Fund are net of expenses and based on the published NAV as of October 31, 2010. All returns are in U.S. dollars($). |
| 2 | The Fund is subject to the special risks associated with investments in micro-cap companies, such as relatively short earnings histories, competitive conditions, less publicly available corporate information, and reliance on a limited number of products. |
| 3 | Fund for which, from time to time, the advisor has waived its fees and/or absorbed Fund expenses, which has resulted in higher returns. |
| 4 | The Russell Microcap® Index tracks the micro-cap segment of the U.S. equity market. It makes up less than 3% of the U.S. equity market and is represented by the smallest 1,000 securities in the small-cap Russell 2000® Index plus the next 1,000 securities. Unlike the Fund, the above stated index is unmanaged, is not available for investment, and does not incur expenses. |
| 5 | The Russell 2000® Index is composed of the 2,000 smallest stocks in the Russell 3000® Index and is widely regarded in the industry as the premier measure of small-cap stock performance. Unlike the Fund, the stated index is unmanaged, is not available for investment, and does not incur expenses. |
The Russell Microcap® Index and the Russell 2000® Index are trademarks of Russell Investments. Russell® is a trademark of Russell Investments.
Not FDIC insured, nor bank guaranteed. May lose value.
18
Managers Micro-Cap Fund
Fund Snapshots
October 31, 2010
Portfolio Breakdown
| | | | | | | | | | | | |
Industry | | Managers
Micro Cap Fund** | | | Russell
Microcap® Index | | | Russell 2000®
Index | |
Information Technology | | | 27.9 | % | | | 20.5 | % | | | 19.1 | % |
Industrials | | | 19.3 | % | | | 13.8 | % | | | 15.5 | % |
Consumer Discretionary | | | 16.9 | % | | | 11.8 | % | | | 13.6 | % |
Health Care | | | 10.9 | % | | | 16.5 | % | | | 12.6 | % |
Financials | | | 10.3 | % | | | 23.0 | % | | | 20.7 | % |
Materials | | | 4.2 | % | | | 3.9 | % | | | 5.6 | % |
Energy | | | 3.6 | % | | | 5.3 | % | | | 5.6 | % |
Consumer Staples | | | 1.7 | % | | | 2.6 | % | | | 3.0 | % |
Utilities | | | 0.7 | % | | | 1.2 | % | | | 3.3 | % |
Telecommunication Services | | | 0.2 | % | | | 1.4 | % | | | 1.0 | % |
Other Assets and Liabilities | | | 4.3 | % | | | 0.0 | % | | | 0.0 | % |
| ** | As a percentage of net assets |
Top Ten Holdings
| | | | |
Security Name | | Percentage of Net
Assets | |
Spectrum Control, Inc.* | | | 1.3 | % |
NxStage Medical, Inc. | | | 1.3 | |
Sonic Solutions, Inc.* | | | 1.3 | |
LaBarge, Inc.* | | | 1.2 | |
Universal Stainless & Alloy Products, Inc.* | | | 1.2 | |
Universal Electronics, Inc.* | | | 1.1 | |
Columbus McKinnon Corp.* | | | 1.1 | |
Shutterfly, Inc. | | | 1.0 | |
IPG Photonics Corp. | | | 0.9 | |
Xyratex, Ltd.* | | | 0.9 | |
| | | | |
Top Ten as a Group | | | 11.3 | % |
| | | | |
| * | Top Ten Holding at April 30, 2010 |
Any sectors, industries, or securities discussed should not be perceived as investment recommendations. Mention of a specific security should not be considered a recommendation to buy or solicitation to sell that security. Specific securities mentioned in this report may have been sold from the Fund’s portfolio of investments by the time you receive this report.
19
Managers Micro-Cap Fund
Schedule of Portfolio Investments
October 31, 2010
| | | | | | | | |
| | | Shares | | | Value | |
Common Stocks - 95.7% | | | | | | | | |
Consumer Discretionary - 16.9% | | | | | | | | |
7 Days Group Holdings, Sponsored ADR* | | | 29,300 | | | $ | 588,051 | |
Amerigon, Inc.* | | | 41,490 | | | | 447,262 | |
Benihana, Inc.* | | | 105,464 | | | | 889,062 | |
BJ’s Restaurants, Inc.* | | | 31,647 | | | | 1,049,098 | |
Body Central Corp.* | | | 40,728 | | | | 545,755 | |
Books-A-Million, Inc. | | | 21,400 | | | | 135,890 | |
Bravo Brio Restaurant Group, Inc.* | | | 15,200 | | | | 273,600 | |
Bridgepoint Education, Inc.* | | | 9,191 | | | | 130,880 | |
Cache, Inc.* | | | 63,773 | | | | 318,227 | |
California Pizza Kitchen, Inc.* | | | 12,000 | | | | 198,120 | |
Carrols Restaurant Group, Inc.* | | | 29,900 | | | | 202,124 | |
Casual Male Retail Group, Inc.* | | | 271,638 | | | | 1,197,924 | |
Core-Mark Holding Co., Inc.* | | | 5,600 | | | | 184,800 | |
Country Style Cooking Restaurant Chain Co., Ltd., Sponsored ADR* | | | 9,800 | | | | 289,688 | |
CPI Corp. | | | 9,400 | | | | 231,804 | |
Delta Apparel, Inc.* | | | 21,100 | | | | 272,612 | |
Destination Maternity Corp.* | | | 2,504 | | | | 91,471 | |
Finish Line, Inc., The, Class A | | | 10,100 | | | | 154,530 | |
Fred’s, Inc. | | | 6,600 | | | | 79,068 | |
Furniture Brands International, Inc.* | | | 34,200 | | | | 171,342 | |
Grand Canyon Education, Inc.* | | | 7,419 | | | | 139,551 | |
hhgregg, Inc.* | | | 39,030 | | | | 899,251 | |
Hooker Furniture Corp. | | | 13,088 | | | | 138,340 | |
IMAX Corp.* | | | 23,577 | | | | 510,442 | |
Interclick, Inc.* | | | 49,285 | | | | 265,646 | |
iRobot Corp.* | | | 25,200 | | | | 526,176 | |
K12, Inc.* | | | 18,500 | | | | 516,335 | |
Kenneth Cole Productions, Inc.* | | | 13,907 | | | | 187,049 | |
Learning Tree International, Inc. | | | 14,900 | | | | 144,530 | |
Lincoln Educational Services Corp.* | | | 11,300 | | | | 140,798 | |
Lumber Liquidators Holdings, Inc.* | | | 21,670 | | | | 521,814 | |
Mac-Gray Corp. | | | 20,400 | | | | 247,860 | |
Maidenform Brands, Inc.* | | | 5,600 | | | | 149,856 | |
Marcus Corp., The | | | 12,500 | | | | 160,250 | |
McCormick & Schmick’s Seafood Restaurants, Inc.* | | | 28,279 | | | | 252,531 | |
Meritage Corp.* | | | 11,839 | | | | 216,772 | |
Midas, Inc.* | | | 18,500 | | | | 136,160 | |
Monro Muffler Brake, Inc. | | | 10,800 | | | | 515,592 | |
Morton’s Restaurant Group, Inc.* | | | 13,500 | | | | 75,600 | |
Overstock.com, Inc. | | | 19,200 | | | | 257,472 | |
Peet’s Coffee & Tea, Inc.* | | | 9,200 | | | | 351,900 | |
R.G. Barry Corp. | | | 53,100 | | | | 549,054 | |
RC2 Corp.* | | | 6,525 | | | | 137,678 | |
Red Robin Gourmet Burgers, Inc.* | | | 12,300 | | | | 249,690 | |
Rue21,Inc.* | | | 15,707 | | | | 418,120 | |
Shuffle Master, Inc.* | | | 34,800 | | | | 327,468 | |
Shutterfly, Inc.* | | | 46,160 | | | | 1,389,416 | |
Steinway Musical Instruments, Inc.* | | | 53,725 | | | | 913,862 | |
Stoneridge, Inc.* | | | 18,932 | | | | 208,252 | |
Summer Infant, Inc.* | | | 36,845 | | | | 294,760 | |
True Religion Apparel, Inc.* | | | 57,039 | | | | 1,166,448 | |
Universal Electronics, Inc.* | | | 73,563 | | | | 1,549,237 | |
US Auto Parts Network, Inc.* | | | 78,655 | | | | 628,453 | |
Vera Bradley, Inc.* | | | 6,500 | | | | 177,775 | |
Vitamin Shoppe, Inc.* | | | 15,700 | | | | 436,617 | |
West Marine, Inc.* | | | 14,600 | | | | 143,226 | |
Zumiez, Inc.* | | | 19,100 | | | | 500,802 | |
Total Consumer Discretionary | | | | | | | 22,896,091 | |
Consumer Staples - 1.7% | | | | | | | | |
Andersons, Inc., The | | | 4,200 | | | | 165,354 | |
Boston Beer Co., Inc.* | | | 2,500 | | | | 178,975 | |
Elizabeth Arden, Inc.* | | | 11,400 | | | | 233,130 | |
Inter Parfums, Inc. | | | 28,308 | | | | 495,107 | |
Nash Finch Co. | | | 20,100 | | | | 842,190 | |
Nutraceutical International Corp.* | | | 4,800 | | | | 78,000 | |
Pantry, Inc., The* | | | 7,100 | | | | 138,095 | |
Susser Holdings Corp.* | | | 11,200 | | | | 153,104 | |
Total Consumer Staples | | | | | | | 2,283,955 | |
Energy - 3.6% | | | | | | | | |
Approach Resources, Inc.* | | | 14,400 | | | | 222,480 | |
Bolt Technology Corp.* | | | 7,500 | | | | 83,325 | |
Clean Energy Fuels Corp.* | | | 12,500 | | | | 181,500 | |
Dawson Geophysical Co.* | | | 6,000 | | | | 149,040 | |
GeoResources, Inc.* | | | 36,500 | | | | 627,800 | |
Gulf Island Fabrication, Inc. | | | 15,496 | | | | 353,929 | |
Gulfport Energy Corp.* | | | 30,900 | | | | 514,794 | |
Kodiak Oil & Gas Corp.* | | | 155,300 | | | | 639,836 | |
Natural Gas Services Group, Inc.* | | | 19,300 | | | | 303,975 | |
North American Energy Partners, Inc.* | | | 25,600 | | | | 222,208 | |
The accompanying notes are an integral part of these financial statements.
20
Managers Micro-Cap Fund
Schedule of Portfolio Investments (continued)
| | | | | | | | |
| | | Shares | | | Value | |
Energy - 3.6% (continued) | | | | | | | | |
Northern Oil & Gas, Inc.* | | | 42,975 | | | $ | 845,748 | |
OYO Geospace Corp.* | | | 1,500 | | | | 90,915 | |
Panhandle Oil and Gas, Inc. | | | 5,700 | | | | 140,790 | |
Tesco Corp.* | | | 18,900 | | | | 239,274 | |
TGC Industries, Inc.* | | | 19,220 | | | | 71,114 | |
Willbros Group, Inc.* | | | 23,000 | | | | 203,780 | |
Total Energy | | | | | | | 4,890,508 | |
Financials - 10.3% | | | | | | | | |
Alliance Financial Corp. | | | 2,500 | | | | 76,175 | |
Altisource Portfolio Solutions S.A.* | | | 13,400 | | | | 350,544 | |
American Physicians Service Group | | | 4,500 | | | | 145,800 | |
American Safety Insurance Holdings, Ltd.* | | | 13,600 | | | | 252,552 | |
Amerisafe, Inc.* | | | 27,600 | | | | 526,884 | |
Associated Estates Realty Corp. | | | 11,000 | | | | 152,790 | |
Asta Funding, Inc. | | | 55,100 | | | | 453,473 | |
Baldwin & Lyons, Inc. | | | 3,200 | | | | 80,000 | |
Bancorp Rhode Island, Inc. | | | 5,100 | | | | 148,359 | |
Bank of Marin Bancorp | | | 7,200 | | | | 239,832 | |
Boston Private Financial Holdings, Inc. | | | 30,200 | | | | 172,442 | |
Cardinal Financial Corp. | | | 22,500 | | | | 224,775 | |
CoBiz Financial, Inc. | | | 28,700 | | | | 138,908 | |
Cogdell Spencer, Inc. | | | 10,800 | | | | 70,956 | |
Columbia Banking System, Inc. | | | 15,600 | | | | 284,076 | |
Community Trust Bancorp, Inc. | | | 10,900 | | | | 297,679 | |
Compass Diversified Holdings | | | 68,800 | | | | 1,171,664 | |
Cypress Sharpridge Investments, Inc. | | | 20,300 | | | | 264,509 | |
Danvers Bancorp, Inc. | | | 19,400 | | | | 291,582 | |
Eagle Bancorp, Inc.* | | | 18,700 | | | | 231,132 | |
Eastern Insurance Holdings, Inc. | | | 13,636 | | | | 151,769 | |
Encore Capital Group, Inc.* | | | 37,760 | | | | 767,283 | |
ESB Financial Corp. | | | 5,600 | | | | 80,584 | |
Financial Engines, Inc.* | | | 36,800 | | | | 542,064 | |
First Cash Financial Services, Inc.* | | | 11,800 | | | | 343,026 | |
First of Long Island Corp., The | | | 5,500 | | | | 136,840 | |
Flushing Financial Corp. | | | 11,800 | | | | 155,170 | |
FPIC Insurance Group, Inc.* | | | 9,400 | | | | 332,948 | |
Hallmark Financial Services, Inc.* | | | 14,900 | | | | 133,206 | |
Independent Bank Corp. (MA) | | | 8,700 | | | | 204,363 | |
LaSalle Hotel Properties | | | 12,700 | | | | 300,863 | |
MarketAxess Holdings, Inc. | | | 31,800 | | | | 577,806 | |
Meadowbrook Insurance Group, Inc. | | | 42,800 | | | | 369,364 | |
Merchants Bancshares, Inc. | | | 3,200 | | | | 82,592 | |
Mission West Properties, Inc. | | | 11,700 | | | | 78,390 | |
National Bankshares, Inc. | | | 8,300 | | | | 217,045 | |
National Interstate Corp. | | | 28,000 | | | | 601,160 | |
Northrim Bancorp, Inc. | | | 16,936 | | | | 288,759 | |
OceanFirst Financial Corp., Inc. | | | 11,600 | | | | 138,504 | |
Ramco-Gershenson Properties Trust | | | 19,800 | | | | 229,284 | |
S.Y. Bancorp, Inc. | | | 12,600 | | | | 308,700 | |
SCBT Financial Corp. | | | 6,366 | | | | 194,354 | |
SeaBright Insurance Holdings, Inc. | | | 18,700 | 2 | | | 156,519 | |
Simmons First National Corp., Class A | | | 11,500 | | | | 312,685 | |
Texas Capital Bancshares, Inc.* | | | 15,200 | | | | 275,880 | |
United Financial Bancorp, Inc. | | | 10,100 | | | | 136,754 | |
Urstadt Biddle Properties, Inc., Class A | | | 8,900 | | | | 170,969 | |
ViewPoint Financial Group | | | 7,820 | | | | 75,072 | |
Washington Banking Co. | | | 27,200 | | | | 342,448 | |
Washington Trust Bancorp, Inc. | | | 8,000 | | | | 160,720 | |
Western Alliance Bancorp* | | | 81,600 | | | | 492,864 | |
Total Financials | | | | | | | 13,932,117 | |
HealthCare - 10.9% | | | | | | | | |
America Service Group, Inc. | | | 25,700 | | | | 393,210 | |
American Dental Partners, Inc.* | | | 18,100 | | | | 211,046 | |
Assisted Living Concepts, Inc.* | | | 5,100 | | | | 164,475 | |
Bio-Reference Laboratories, Inc.* | | | 22,000 | | | | 474,320 | |
BioScrip, Inc.* | | | 43,400 | | | | 244,342 | |
Cantel Medical Corp. | | | 15,000 | | | | 277,800 | |
CryoLife, Inc.* | | | 24,900 | | | | 160,605 | |
Cyberonics, Inc.* | | | 25,400 | | | | 698,754 | |
DexCom, Inc.* | | | 52,700 | | | | 724,625 | |
Endologix, Inc.* | | | 100,500 | | | | 555,765 | |
Ensign Group, Inc.,The | | | 7,900 | | | | 148,283 | |
eResearch Technology, Inc.* | | | 26,300 | | | | 200,406 | |
Eurand N.V.* | | | 53,300 | | | | 584,168 | |
Exactech, Inc.* | | | 28,000 | | | | 455,280 | |
HeartWare International, Inc.* | | | 8,300 | | | | 567,222 | |
HMS Holdings Corp.* | | | 2,400 | | | | 144,264 | |
Insulet Corp.* | | | 56,650 | | | | 903,568 | |
Kensey Nash Corp.* | | | 30,800 | | | | 830,368 | |
Landauer, Inc. | | | 6,000 | | | | 366,540 | |
LHC Group, Inc.* | | | 23,000 | | | | 618,700 | |
MAKO Surgical Corp.* | | | 13,800 | | | | 148,764 | |
Medical Action Industries, Inc.* | | | 24,500 | | | | 243,040 | |
The accompanying notes are an integral part of these financial statements.
21
Managers Micro-Cap Fund
Schedule of Portfolio Investments (continued)
| | | | | | | | |
| | | Shares | | | Value | |
Health Care - 10.9% (continued) | | | | | | | | |
Meridian Bioscience, Inc. | | | 20,600 | 2 | | $ | 471,534 | |
MWI Veterinary Supply, Inc.* | | | 9,200 | | | | 526,240 | |
Neogen Corp.* | | | 18,700 | | | | 624,954 | |
NxStage Medical, Inc.* | | | 87,740 | | | | 1,768,838 | |
Obagi Medical Products, Inc.* | | | 13,200 | | | | 150,612 | |
Symmetry Medical, Inc.* | | | 25,800 | | | | 228,330 | |
Synovis Life Technologies, Inc.* | | | 21,000 | | | | 315,000 | |
U.S. Physical Therapy, Inc.* | | | 44,300 | | | | 831,511 | |
Vascular Solutions, Inc.* | | | 32,200 | | | | 348,726 | |
Young Innovations, Inc. | | | 5,185 | | | | 143,987 | |
Zoll Medical Corp.* | | | 9,800 | | | | 318,794 | |
Total Health Care | | | | | | | 14,844,071 | |
Industrials - 19.3% | | | | | | | | |
AAON, Inc. | | | 6,000 | | | | 147,300 | |
Acacia Research Corp.* | | | 33,800 | | | | 899,756 | |
Acco Brands Corp.* | | | 67,800 | | | | 422,394 | |
Alamo Group, Inc. | | | 6,800 | | | | 163,200 | |
Allied Defense Group, Inc., The* | | | 32,600 | | | | 88,020 | |
American Ecology Corp. | | | 20,900 | | | | 338,998 | |
Ameron International Corp. | | | 4,700 | | | | 323,172 | |
Apogee Enterprises, Inc. | | | 16,000 | | | | 167,840 | |
Astronics Corp.* | | | 16,570 | | | | 345,484 | |
AZZ, Inc. | | | 32,100 | | | | 1,192,194 | |
C&D Technologies, Inc.* | | | 130,900 | | | | 17,017 | |
Cascade Corp. | | | 7,500 | | | | 265,425 | |
CBIZ, Inc.* | | | 43,651 | | | | 258,414 | |
Celadon Group, Inc.* | | | 59,515 | | | | 771,910 | |
Chart Industries, Inc.* | | | 53,379 | | | | 1,243,731 | |
China Valves Technology, Inc.* | | | 33,600 | | | | 292,992 | |
Columbus McKinnon Corp.* | | | 88,200 | | | | 1,548,792 | |
Comfort Systems USA, Inc. | | | 13,000 | | | | 148,850 | |
Commercial Vehicle Group, Inc.* | | | 18,427 | | | | 247,475 | |
Courier Corp. | | | 14,700 | | | | 217,560 | |
Covenant Transportation Group, Inc.* | | | 45,162 | | | | 330,586 | |
CRA International, Inc.* | | | 24,100 | | | | 449,465 | |
Ducommun, Inc. | | | 13,400 | | | | 287,698 | |
Dynamex, Inc.* | | | 11,000 | | | | 232,540 | |
Dynamic Materials Corp. | | | 4,300 | | | | 66,779 | |
Eagle Bulk Shipping, Inc.* | | | 33,700 | | | | 172,881 | |
Ennis, Inc. | | | 29,300 | | | | 528,572 | |
EnPro Industries, Inc.* | | | 6,900 | | | | 242,466 | |
Exponent, Inc.* | | | 6,600 | | | | 210,672 | |
Furmanite Corp.* | | | 39,900 | | | | 229,425 | |
G&K Services, Inc., Class A | | | 6,800 | | | | 168,096 | |
GeoEye, Inc.* | | | 11,100 | | | | 491,397 | |
Gibraltar Industries, Inc.* | | | 16,700 | | | | 152,471 | |
GP Strategies Corp.* | | | 16,533 | | | | 143,506 | |
Graham Corp. | | | 15,000 | | | | 254,550 | |
Greenbrier Co., Inc.* | | | 40,715 | | | | 741,013 | |
Hawaiian Holdings, Inc.* | | | 12,900 | | | | 94,428 | |
Hawk Corp., Class A* | | | 3,745 | | | | 186,613 | |
Higher One Holdings, Inc.* | | | 26,288 | | | | 458,988 | |
Hurco Companies, Inc.* | | | 24,700 | | | | 454,480 | |
Interface, Inc., Class A | | | 58,800 | | | | 846,132 | |
Kforce, Inc.* | | | 33,500 | | | | 502,835 | |
Kimball International, Inc., Class B | | | 41,000 | | | | 249,280 | |
Knoll, Inc. | | | 18,400 | | | | 279,128 | |
LaBarge, Inc.* | | | 131,900 | | | | 1,673,812 | |
Ladish Co., Inc.* | | | 16,390 | | | | 524,316 | |
LB Foster Co., Class A* | | | 20,200 | | | | 667,004 | |
Lihua International, Inc.* | | | 5,000 | | | | 53,350 | |
Marten Transport, Ltd.* | | | 16,700 | | | | 354,708 | |
Met-Pro Corp. | | | 20,100 | | | | 226,929 | |
Michael Baker Corp.* | | | 8,200 | | | | 267,976 | |
MYR Group, Inc.* | | | 2,900 | | | | 45,211 | |
OceanFreight, Inc., Class A* | | | 39,000 | | | | 38,610 | |
Old Dominion Freight Line, Inc.* | | | 13,500 | | | | 378,675 | |
Orion Marine Group, Inc.* | | | 48,000 | | | | 600,480 | |
PGT, Inc.* | | | 126,700 | | | | 266,070 | |
Powell Industries, Inc.* | | | 7,400 | | | | 228,364 | |
RBC Bearings, Inc.* | | | 14,300 | | | | 476,476 | |
Saia, Inc.* | | | 20,200 | | | | 292,496 | |
Satcon Technology Corp.* | | | 69,300 | | | | 278,586 | |
SFN Group, Inc.* | | | 24,100 | | | | 182,678 | |
Standard Parking Corp.* | | | 29,900 | | | | 510,991 | |
Sun Hydraulics Corp. | | | 9,900 | | | | 307,593 | |
TBS International PLC, Class A* | | | 38,400 | | | | 158,976 | |
TrueBlue, Inc.* | | | 25,400 | | | | 356,870 | |
Universal Truckload Services, Inc.* | | | 9,100 | | | | 130,585 | |
USA Truck, Inc.* | | | 16,349 | | | | 224,308 | |
Vitran Corp., Inc., Class A* | | | 45,000 | | | | 503,550 | |
Westport Innovations, Inc.* | | | 33,600 | | | | 608,832 | |
Total Industrials | | | | | | | 26,231,971 | |
The accompanying notes are an integral part of these financial statements.
22
Managers Micro-Cap Fund
Schedule of Portfolio Investments (continued)
| | | | | | | | |
| | | Shares | | | Value | |
Information Technology - 27.9% | | | | | | | | |
Actuate Corp.* | | | 46,200 | | | $ | 223,608 | |
American Software, Inc., Class A | | | 26,800 | | | | 161,872 | |
Anadigics, Inc.* | | | 122,539 | | | | 829,589 | |
Anaren Microwave, Inc.* | | | 14,100 | | | | 235,893 | |
Ancestry.com, Inc.* | | | 17,500 | | | | 466,725 | |
Applied Micro Circuits Corp.* | | | 22,166 | | | | 223,212 | |
Aspen Technology, Inc.* | | | 48,400 | | | | 542,080 | |
Bel Fuse, Inc. | | | 9,600 | | | | 218,976 | |
ChinaCache International Holdings, Ltd., Sponsored ADR* | | | 15,700 | | | | 379,155 | |
Compellent Technologies, Inc.* | | | 28,600 | | | | 722,722 | |
Computer Task Group, Inc.* | | | 37,500 | | | | 299,250 | |
comScore, Inc.* | | | 25,000 | | | | 587,750 | |
Comtech Telecommunications Corp.* | | | 12,500 | | | | 385,250 | |
Constant Contact, Inc.* | | | 21,500 | | | | 494,500 | |
Dice Holdings, Inc.* | | | 53,850 | | | | 487,342 | |
Digi International, Inc.* | | | 30,728 | | | | 296,832 | |
DSP Group, Inc.* | | | 21,200 | | | | 151,792 | |
DTS, Inc.* | | | 8,060 | | | | 320,788 | |
EMS Technologies, Inc.* | | | 37,600 | | | | 670,784 | |
Entropic Communications, Inc.* | | | 34,790 | | | | 290,844 | |
Envestnet, Inc.* | | | 17,931 | | | | 236,869 | |
Extreme Networks, Inc.* | | | 72,600 | | | | 231,594 | |
FARO Technologies, Inc.* | | | 39,315 | | | | 949,064 | |
Forrester Research, Inc. | | | 4,700 | | | | 155,429 | |
GSI Technology, Inc.* | | | 11,700 | | | | 81,315 | |
Hackett Group, Inc., The* | | | 19,400 | | | | 75,660 | |
hiSoft Technology International, Sponsored ADR* | | | 33,500 | | | | 891,100 | |
Hollysys Automation Technologies, Ltd.* | | | 24,600 | | | | 310,944 | |
iGATE Corp. | | | 36,745 | | | | 751,068 | |
Interactive Intelligence, Inc.* | | | 43,400 | 2 | | | 1,072,414 | |
IntraLinks Holdings, Inc.* | | | 24,100 | | | | 527,067 | |
IPG Photonics Corp.* | | | 56,480 | | | | 1,270,800 | |
Ixia* | | | 15,820 | | | | 247,583 | |
IXYS Corp.* | | | 15,700 | | | | 160,768 | |
JinkoSolar Holding Co., Ltd., Sponsored ADR* | | | 12,500 | | | | 376,875 | |
Kenexa Corp.* | | | 16,300 | | | | 298,127 | |
KIT Digital, Inc.* | | | 29,900 | | | | 411,723 | |
KVH Industries, Inc.* | | | 15,940 | | | | 223,798 | |
Limelight Networks, Inc.* | | | 122,000 | | | | 827,160 | |
Lionbridge Technologies, Inc.* | | | 142,700 | | | | 713,500 | |
Liquidity Services, Inc.* | | | 33,600 | | | | 537,600 | |
LivePerson, Inc.* | | | 114,180 | | | | 1,057,307 | |
LogMeIn, Inc.* | | | 29,050 | | | | 1,154,156 | |
MaxLinear, Inc., Class A* | | | 13,400 | | | | 139,896 | |
Maxwell Technologies, Inc.* | | | 57,755 | | | | 936,786 | |
Methode Electronics, Inc. | | | 21,600 | | | | 200,664 | |
Mindspeed Technologies, Inc.* | | | 38,885 | | | | 286,971 | |
MIPS Technologies, Inc.* | | | 39,625 | | | | 582,488 | |
ModusLink Global Solutions, Inc.* | | | 20,500 | | | | 135,915 | |
MTS Systems Corp. | | | 12,600 | | | | 412,902 | |
Multi-Fineline Electronix, Inc.* | | | 3,000 | | | | 73,440 | |
NIC, Inc. | | | 90,700 | | | | 787,276 | |
Omnivision Technologies, Inc.* | | | 17,220 | | | | 467,179 | |
Oplink Communications, Inc.* | | | 22,945 | | | | 401,079 | |
OSI Systems, Inc.* | | | 4,300 | | | | 154,800 | |
PC Connection, Inc.* | | | 22,500 | | | | 189,450 | |
Perficient, Inc.* | | | 28,000 | | | | 295,680 | |
QuinStreet, Inc.* | | | 14,916 | | | | 231,645 | |
Radisys Corp.* | | | 14,700 | | | | 143,619 | |
Renesola, Ltd., Sponsored ADR* | | | 53,900 | | | | 645,183 | |
Richardson Electronics, Ltd. | | | 16,900 | | | | 182,858 | |
RightNow Technologies, Inc.* | | | 14,900 | | | | 389,188 | |
Rubicon Technology, Inc.* | | | 22,140 | | | | 511,877 | |
S1 Corp.* | | | 36,400 | | | | 211,848 | |
Sierra Wireless, Inc.* | | | 20,866 | | | | 251,853 | |
Sonic Solutions, Inc.* | | | 145,948 | | | | 1,746,998 | |
Sourcefire, Inc.* | | | 8,515 | | | | 200,869 | |
Spectrum Control, Inc.* | | | 116,218 | | | | 1,773,487 | |
Symmetricom, Inc.* | | | 27,292 | | | | 170,029 | |
Synchronoss Technologies, Inc.* | | | 30,000 | | | | 639,300 | |
Taleo Corp.* | | | 13,400 | | | | 384,446 | |
Terremark Worldwide, Inc.* | | | 20,830 | | | | 208,092 | |
TESSCO Technologies, Inc. | | | 4,800 | | | | 72,480 | |
Travelzoo, Inc.* | | | 18,163 | | | | 623,899 | |
Tyler Technologies, Inc.* | | | 32,000 | | | | 653,120 | |
VanceInfo Technologies, Inc., Sponsored ADR* | | | 16,800 | | | | 611,016 | |
Virtusa Corp.* | | | 80,105 | | | | 1,142,297 | |
Vocus, Inc.* | | | 3,621 | | | | 80,205 | |
Xyratex, Ltd.* | | | 81,600 | | | | 1,263,168 | |
Total Information Technology | | | | | | | 37,752,888 | |
The accompanying notes are an integral part of these financial statements.
23
Managers Micro-Cap Fund
Schedule of Portfolio Investments (continued)
| | | | | | | | |
| | | Shares | | | Value | |
Materials - 4.2% | | | | | | | | |
Brush Engineered Materials, Inc.* | | | 19,900 | | | $ | 659,685 | |
Buckeye Technologies, Inc. | | | 21,500 | | | | 388,075 | |
Koppers Holdings, Inc. | | | 32,800 | | | | 914,464 | |
Landec Corp.* | | | 32,300 | | | | 203,167 | |
Myers Industries, Inc. | | | 18,800 | | | | 166,004 | |
Omnova Solutions, Inc.* | | | 123,200 | | | | 983,136 | |
Quaker Chemical Corp. | | | 4,900 | | | | 178,458 | |
STR Holdings, Inc.* | | | 22,700 | | | | 564,095 | |
Universal Stainless & Alloy Products, Inc.* | | | 55,200 | | | | 1,597,488 | |
Total Materials | | | | | | | 5,654,572 | |
Telecommunication Services - 0.2% | | | | | | | | |
Shenandoah Telecommunications Co.* | | | 11,549 | | | | 210,769 | |
Utilities - 0.7% | | | | | | | | |
Central Vermont Public Service Corp. | | | 18,700 | | | | 378,114 | |
Chesapeake Utilities Corp. | | | 6,200 | | | | 227,478 | |
Unitil Corp. | | | 18,500 | | | | 401,820 | |
Total Utilities | | | | | | | 1,007,412 | |
Total Common Stocks (cost $100,858,827) | | | | | | | 129,704,354 | |
Exchange Traded Funds - 0.6% | | | | | | | | |
SPDR KBW Regional Banking ETF
(cost $738,291) | | | 33,900 | | | | 767,157 | |
Short-Term Investments - 3.5%1 | | | | | | | | |
BNY Mellon Overnight Government Fund, 0.21%3 | | | 509,000 | | | | 509,000 | |
Dreyfus Cash Management Fund, Institutional Class Shares, 0.16% | | | 4,253,654 | | | | 4,253,654 | |
Total Short-Term Investments
(cost $4,762,654) | | | | | | | 4,762,654 | |
Total Investments - 99.8%
(cost $106,359,772) | | | | | | | 135,234,165 | |
Other Assets, less Liabilities - 0.2% | | | | | | | 335,429 | |
Net Assets - 100.0% | | | | | | $ | 135,569,594 | |
Note: Based on the approximate cost of investments of $108,044,800 for Federal income tax purposes at October 31, 2010, the aggregate gross unrealized appreciation and depreciation were $30,817,015 and $3,627,650, respectively, resulting in net unrealized appreciation of investments of $27,1 89,365.
| * | Non-income-producing security. |
| 1 | Yield shown for each investment company represents the October 31, 2010, seven-day average yield, which refers to the sum of the previous seven days’ dividends paid, expressed as an annual percentage. |
| 2 | Some or all of these shares, amounting to a market value of $485,563, or 0.4% of net assets, were out on loan to various brokers. |
| 3 | Collateral received from brokers for securities lending was invested in this short-term investment. |
The following table summarizes the inputs used to value the Fund’s net assets by the fair value hierarchy levels as of October 31, 2010. (See Note 1 (a) in the Notes to Financial Statements.)
| | | | | | | | | | | | | | | | |
| | | Quoted Prices
in Active
Markets for
Identical
Investments
Level 1 | | | Significant
Other
Observable
Inputs
Level 2 | | | Significant
Unobservable
Inputs
Level 3 | | | Total | |
Investments in Securities | | | | | | | | | | | | | | | | |
Common Stocks† | | $ | 129,704,354 | | | | — | | | | — | | | $ | 129,704,354 | |
Exchange Traded Funds | | | 767,157 | | | | — | | | | — | | | | 767,157 | |
Short-Term Investments | | | 4,762,654 | | | | — | | | | — | | | | 4,762,654 | |
| | | | | | | | | | | | | | | | |
Total Investments in Securities | | $ | 135,234,165 | | | | — | | | | — | | | $ | 135,234,165 | |
| | | | | | | | | | | | | | | | |
| † | All common stocks held in the Fund are Level 1 securities. For a detailed break-out of the common stocks by major industry classification, please refer to the Schedule of Portfolio Investments. |
As of October 31, 2010, the Fund had no significant transfers between Level 1 and Level 2 from the beginning of the reporting period.
Investment Definitions and Abbreviations:
| | |
ADR: | | ADR after the name of a holding stands for American Depositary Receipt, representing ownership of foreign securities on deposit with a domestic custodian bank. The value of the ADR security is determined or significantly influenced by trading on exchanges not located in the United States or Canada. Sponsored ADRs are initiated by the underlying foreign company. |
ETF: | | Exchange Traded Fund. |
The accompanying notes are an integral part of these financial statements.
24
Managers Institutional Micro-Cap Fund
Portfolio Manager’s Comments
The Managers Institutional Micro-Cap Fund primarily invests in the stocks of U.S. micro-capitalization companies. Normally the Fund will invest at least 80% of its net assets in U.S. micro-cap stocks. The Fund employs multiple portfolio managers who specialize in distinct investment approaches. This “intelligence diversification” not only serves to manage risk, but also seeks to incorporate into the portfolio the breadth of the micro-cap market by focusing different analytical insights on micro-cap investing. The Fund’s team of subadvisors strives to achieve this performance and diversification while ensuring that the Fund operates within the framework of its investment objective and principal investment strategies. The Russell Microcap® Index is the benchmark for the Fund.
The Portfolio Managers
Lord, Abbett & Co., LLC (“Lord Abbett”)
The team focuses its stock selection effort by focusing on companies that have revenue growth of at least 15%, are experiencing year-to-year operating margin improvement and are experiencing earnings growth that is driven by top-line growth rather than being driven by one time events or simple cost-cutting measures. The focus is also on identifying companies with higher-quality balance sheets (often captured by finding companies with manageable debt-to-total-capital ratios) and that are already profitable. Once this process is completed, the focus for the team is on forecasting both revenue and earnings growth over the next several years. To achieve this goal, and to find companies that are expected to grow faster than their industry average, members of the team spend an extensive amount of time understanding the competitive advantages of a firm, the industry dynamics within which they operate, and the strength of management.
The sell discipline is enacted if there is a fundamental change in the business, a more attractive alternative is found, or if a holding reaches a 5% weight in the overall portfolio. The Lord Abbett portfolio typically holds between 75 and 100 stocks with no individual holding typically exceeding 5%. There is a risk constraint that prevents any individual industry from being greater than 25% of the total portfolio weight. The annual turnover of the portfolio is expected to be relatively high although there is no explicit target as part of either the stock selection or the portfolio-construction process.
Next Century Growth Investors, LLC (“Next Century”)
The team requires historical revenue growth of at least 15% for a company before conducting further research. Other key factors considered initially by the team are strong historical revenue growth, low debt and high ROE. Quantitative screening is done on a regular basis to see which stocks over the past year are experiencing significant growth. The next stage of this process involves intensive first-hand research to determine the growth prospects of a company with the team choosing a stock only when it has become convinced a company has an extraordinary opportunity to grow its business. The uniqueness of this process lies in the fact that the team seeks out these companies regardless of their short-term prospects and\ or current valuation. The team is looking for “home runs” and companies that will grow to the point that they will eventually reach a small market capitalization.
The sell discipline is enacted if there is a change in the original investment thesis or a fundamental change in business of the company. In addition, a holding will become a candidate for sale if it reaches an extreme valuation, becomes larger than 5% of the overall portfolio or as it approaches $1 billion in market capitalization. Typically companies are sold out of the micro-cap portfolio because they have approached $1 billion in market capitalization.
The Next Century portion of the portfolio is concentrated and typically has 40-60 holdings, which can create a high level of volatility. The only risk constraints are that sector weights cannot exceed two times the Russell 2000® Growth sector weights, and no individual holding can be greater than 5% of the portfolio.
RBC Global Asset Management (U.S.) Inc. (“RBC”)
The team uses an investment process that focuses on generating solid stock selection by identifying companies with strong long-term attractive business fundamentals that are selling at low valuations. In order to initially generate ideas, the team at RBC uses quantitative screens and industry research to concentrate stock selection on a narrower sub-universe of micro-cap companies. The team then focuses a majority of its time on conducting intensive “on the ground” fundamental research in order to uncover these opportunities. The focus is on identifying companies with long-term solid business fundamentals and near-term profitability improvement potential. In terms of short-term factors, the team looks for companies that have shown institutional investor neglect or avoidance and sizeable insider ownership with the potential for both improving proving profit margins and accelerating earnings in the near future. In terms of long-term factors, the team looks for companies with proven products or services that are leading in market share within their respective industry while maintaining a sustainable competitive advantage and a solid balance sheet.
The resulting portfolio that comes from this stock selection process tends to be low turnover with companies generally held for several years. The portfolio is well diversified with anywhere from 60 to 90 holdings with a maximum of 5% in any single holding.
WEDGE Capital Management L.L.P. (“WEDGE”)
The investment process is a combination of both quantitative and fundamental research insights. The quantitative portion of the investment process uses commonly found factors and characteristics that can be accessed via any number of commercial databases. The value-added portion of the process, therefore, uses a number of different factors across five major categories: valuation, earnings quality, operating efficiency, capital usage and momentum, whose efficacy has been verified via long-term regression analysis. This is referred to as the Fundamental Value model. The top results of this model are combined with the best resulting stocks from the Financial Quality model, which measures stocks across categories such as multiple earnings growth, profitability, leverage and liquidity. The top stocks that appear in both models are eligible for fundamental research. The fundamental research portion of the investment process is exclusionary in nature and meant to eliminate stocks that are not strong in earnings forecasts, valuation metrics, sector\industry outlook or any factor that cannot be easily captured quantitatively.
25
Managers Institutional Micro-Cap Fund
Portfolio Manager’s Comments (continued)
A stock is scrutinized for possible sale if it falls below the top four deciles in the Fundamental Value model. Stocks are sold when they become fairly valued, an upgrade opportunity develops or the original investment thesis materially deteriorates. The portion of the portfolio managed by WEDGE is confined to plus or minus 10% in any given sector although sector positions tend to be much closer to the index weight than this (it should be noted that these self-imposed sector weighting constraints are based on a proprietary liquidity analysis conducted on an ongoing basis by the micro-cap team and is NOT driven by the sector weightings of any micro-cap benchmark). The final portfolio seeks to be a well diversified micro-cap portfolio holding approximately 150 securities and consistently maintaining a value bias relative to the benchmark. The portfolio tends to hold securities within the $40 million to $400 million market capitalization range, although does not require a sale of a holding until it reaches $800 million in market capitalization.
The Year in Review
The past twelve months saw a continuation of the market rally that began back in March 2009, although certainly with more stops and starts than witnessed at the beginning of the rally. The lower- quality nature of the equity rally leveled off during the fourth quarter of 2010, although high-quality stocks have yet to significantly outpace their lower-quality counterparts and the market has continued to be driven by headline and macroeconomic news as opposed to underlying fundamentals of individual companies. The early portion of the year was characterized by the relative strength of the U.S. Dollar (and its subsequent consequences for companies in the U.S. with different levels of exposure to the strength of the Dollar) as global investors found the reserve status of the Dollar particularly comforting in the wake of a weakening Euro amid the concern of potential default risk for several sovereign nations in continental Europe. The second quarter of 2010 was marked by renewed fears of financial contagion and slowing economic growth. The third quarter of 2010 was a perfect microcosm of the skittishness of the market and investors over the course of the past year. In July, solid earnings from a number of bell weather companies led to strong market results. August featured a renewed round of lukewarm economic data that led to a market pullback and increased risk aversion amongst investors. September and October, on the other hand, saw a sharp market bounce back and increased risk taking among investors who still have considerable cash waiting to be invested but are still hesitant about reentering equity markets. Against this backdrop, micro-cap equities performed quite well only modestly trailing small-cap equities but significantly outperforming US large-cap equities.
For the 12 months that ended October 31, 2010, the Managers Institutional Micro-Cap Fund returned 25.95%, compared with 25.07% for its benchmark, the Russell Microcap® Index. Performance continues to remain strong relative to both the Index and peers since the Fund was converted to a multi-manager, multi-style approach in early 2008. Solid outperformance over the last year has been driven by both positive stock selection as well as by relative sector positioning versus the benchmark. From a stock selection standpoint, most of the value over the past year has been led by holdings within the cyclically oriented consumer discretionary and information technology sectors. By the end of the fiscal year, the holdings within these two sectors combined to comprise nearly half of the positions in the overall portfolio. From a positioning standpoint, the Fund added value by virtue of its underweight to the underperforming financials sector and its overweight to the outperforming information technology sector. The financials sector tends to be a perpetual underweight in the Fund while the overweight to the improving information technology sector was certainly timely given it was the best performing micro-cap sector as the economy rebounded throughout the last fiscal year. Similar to the prior fiscal year, the Fund’s growth subadvisors performed the best, not too surprisingly given the economic backdrop and increased optimism of the prior twelve months.
Looking Forward
The portfolio managers are optimistic about forward looking prospects for the economy and, more specifically, for micro-cap equities as they believe the potential for a double-dip recession continues to shrink. Therefore, the portfolio is currently positioned with a sizable overweight compared to the benchmark in the more economically sensitive areas such as the consumer discretionary, industrials, and information technology sectors which all stand to benefit from an improved and stable economy. As uncertainty continues to come out of the market, stock price movements will increasingly be driven by individual company fundamentals. This type of market would be to the direct benefit of this portfolio which is comprised of four subadvisors who focus their efforts on generating performance via bottom-up stock selection.
Cumulative Total Return Performance
Managers Institutional Micro-Cap Fund (formerly Managers Fremont Institutional Micro-Cap Fund) cumulative total return is based on the daily change in net asset value (NAV), and assumes that all distributions were reinvested. The Russell Microcap® Index tracks the micro-cap segment of the U.S. equity markets. It makes up less than 3% of the U.S. equity market and is represented by the smallest 1,000 securities in the small-cap Russell 2000® Index plus the next 1,000 securities. Unlike the Fund, the above stated index is unmanaged, is not available for investment, and does not
26
Managers Institutional Micro-Cap Fund
Portfolio Manager’s Comments (continued)
Cumulative Total Return Performance (continued)
incur expenses. This chart compares a hypothetical $10,000 investment made in the Managers Institutional Micro-Cap Fund on October 31, 2000, to a $10,000 investment made in the Russell Microcap® Index for the same time period. Performance for periods longer than one year is annualized. The graph and table do not reflect the deduction of taxes that a shareholder would pay on a Fund distribution or redemption of shares. The listed returns for the Fund are net of expenses and the returns for the index exclude expenses. Total returns for the Fund would have been lower had certain expenses not been reduced.
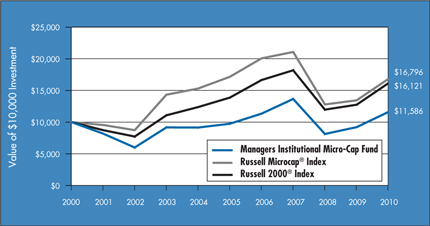
The table below shows the average annual total returns for the Managers Institutional Micro-Cap Fund, the Russell Microcap® Index and the Russell 2000® Index for the one-year, five-year and ten-year periods ended October 31, 2010.
| | | | | | | | | | | | |
Average Annual Total Returns1 | | One Year | | | Five Years | | | Ten Years | |
Managers Institutional Micro-Cap Fund2,3 | | | 25.95 | % | | | 3.54 | % | | | 1.48 | % |
Russell Microcap® Index4 | | | 25.07 | % | | | (0.40 | )% | | | 5.32 | % |
Russell 2000® Index5 | | | 26.58 | % | | | 3.07 | % | | | 4.89 | % |
The performance data shown represents past performance. Past performance is not a guarantee of future results. Current performance may be lower or higher than the performance data quoted. The investment return and principal value of an investment in the Fund will fluctuate so that an investor’s shares, when redeemed, may be worth more or less than their original cost. For performance information through the most recent month end, please call (800) 835-3879 or visit our Web site at www.managersinvest.com.
In choosing a Fund, investors should carefully consider the amount they plan to invest, their investment objectives, the Fund’s investment objectives, risks, charges and expenses before investing. For this and other information, please call (800) 835-3879 or visit www.managersinvest.com for a free prospectus. Read it carefully before investing or sending money. Distributed by Managers Distributors, Inc., member FINRA.
| 1 | Total return equals income yield plus share price change and assumes reinvestment of all dividends and capital gain distributions. Returns are net of fees and may reflect offsets of Fund expenses as described in the Prospectus. No adjustment has been made for taxes payable by shareholders on their reinvested dividends and capital gain distributions. Returns for periods greater than one year are annualized. The listed returns on the Fund are net of expenses and based on the published NAV as of October 31, 2010. All returns are in U.S. dollars($). |
| 2 | The Fund is subject to the special risks associated with investments in micro-cap companies, such as relatively short earnings histories, competitive conditions, less publicly available corporate information, and reliance on a limited number of products. |
| 3 | Fund for which, from time to time, the advisor has waived its fees and/or absorbed Fund expenses, which has resulted in higher returns. |
| 4 | The Russell Microcap® Index tracks the micro-cap segment of the U.S. equity markets. It makes up less than 3% of the U.S. equity market and is represented by the smallest 1,000 securities in the small-cap Russell 2000® Index plus the next 1,000 securities. Unlike the Fund, the above stated index is unmanaged, is not available for investment, and does not incur expenses. |
| 5 | The Russell 2000® Index is composed of the 2,000 smallest stocks in the Russell 3000® Index and is widely regarded in the industry as the premier measure of small-cap stock performance. Unlike the Fund, the stated index is unmanaged, is not available for investment, and does not incur expenses. |
The Russell Microcap® Index and the Russell 2000® Index are trademarks of Russell Investments. Russell® is a trademark of Russell Investments.
Not FDIC insured, nor bank guaranteed. May lose value.
27
Managers Institutional Micro-Cap Fund
Fund Snapshots
October 31, 2010
Portfolio Breakdown
| | | | | | | | | | | | |
Industry | | Managers
Institutional
Micro-Cap Fund** | | | Russell
Microcap® Index | | | Russell 2000®
Index | |
Information Technology | | | 27.5 | % | | | 20.5 | % | | | 19.1 | % |
Industrials | | | 18.6 | % | | | 13.8 | % | | | 15.5 | % |
Consumer Discretionary | | | 16.6 | % | | | 11.8 | % | | | 13.6 | % |
Health Care | | | 10.8 | % | | | 16.5 | % | | | 12.6 | % |
Financials | | | 10.1 | % | | | 23.0 | % | | | 20.7 | % |
Materials | | | 4.1 | % | | | 3.9 | % | | | 5.6 | % |
Energy | | | 3.6 | % | | | 5.3 | % | | | 5.6 | % |
Consumer Staples | | | 1.7 | % | | | 2.6 | % | | | 3.0 | % |
Utilities | | | 0.6 | % | | | 1.2 | % | | | 3.3 | % |
Telecommunication Services | | | 0.2 | % | | | 1.4 | % | | | 1.0 | % |
Other Assets and Liabilities | | | 6.2 | % | | | 0.0 | % | | | 0.0 | % |
| ** | As a percentage of net assets |
Top Ten Holdings
| | | | |
Security Name | | Percentage of Net
Assets | |
Spectrum Control, Inc.* | | | 1.4 | % |
Sonic Solutions, Inc.* | | | 1.3 | |
NxStage Medical, Inc. | | | 1.3 | |
Universal Stainless & Alloy Products, Inc.* | | | 1.1 | |
Universal Electronics, Inc.* | | | 1.1 | |
LaBarge, Inc.* | | | 1.1 | |
Columbus McKinnon Corp.* | | | 1.1 | |
Shutterfly, Inc. | | | 1.0 | |
Casual Male Retail Group, Inc. | | | 0.9 | |
IPG Photonics Corp. | | | 0.9 | |
| | | | |
Top Ten as a Group | | | 11.2 | % |
| | | | |
| * | Top Ten at April 30, 2010 |
Any sectors, industries, or securities discussed should not be perceived as investment recommendations. Mention of a specific security should not be considered a recommendation to buy or solicitation to sell that security. Specific securities mentioned in this report may have been sold from the Fund’s portfolio of investments by the time you receive this report.
28
Managers Institutional Micro-Cap Fund
Schedule of Portfolio Investments
October 31, 2010
| | | | | | | | |
| | | Shares | | | Value | |
Common Stocks - 93.8% | | | | | | | | |
Consumer Discretionary - 16.6% | | | | | | | | |
7 Days Group Holdings, Sponsored ADR* | | | 5,100 | | | $ | 102,357 | |
Amerigon, Inc.* | | | 6,860 | | | | 73,951 | |
Benihana, Inc.* | | | 18,950 | | | | 159,748 | |
BJ’s Restaurants, Inc.* | | | 5,275 | | | | 174,866 | |
Body Central Corp.* | | | 6,983 | | | | 93,572 | |
Books-A-Million, Inc. | | | 3,800 | | | | 24,130 | |
Bravo Brio Restaurant Group, Inc.* | | | 2,700 | | | | 48,600 | |
Bridgepoint Education, Inc.* | | | 1,516 | | | | 21,588 | |
Cache, Inc.* | | | 10,781 | | | | 53,797 | |
California Pizza Kitchen, Inc.* | | | 2,250 | | | | 37,148 | |
Carrols Restaurant Group, Inc.* | | | 5,050 | | | | 34,138 | |
Casual Male Retail Group, Inc.* | | | 48,982 | | | | 216,010 | |
Core-Mark Holding Co., Inc.* | | | 883 | | | | 29,139 | |
Country Style Cooking Restaurant Chain Co., Ltd., Sponsored ADR* | | | 1,800 | | | | 53,208 | |
CPI Corp. | | | 1,400 | | | | 34,524 | |
Delta Apparel, Inc.* | | | 3,500 | | | | 45,220 | |
Destination Maternity Corp.* | | | 426 | | | | 15,562 | |
Finish Line, Inc., The, Class A | | | 1,700 | | | | 26,010 | |
Fred’s, Inc. | | | 1,100 | | | | 13,178 | |
Furniture Brands International, Inc.* | | | 6,500 | | | | 32,565 | |
Grand Canyon Education, Inc.* | | | 1,229 | | | | 23,117 | |
hhgregg, Inc.* | | | 6,585 | | | | 151,718 | |
Hooker Furniture Corp. | | | 2,147 | | | | 22,694 | |
IMAX Corp.* | | | 4,044 | | | | 87,553 | |
Interclick, Inc.* | | | 8,145 | | | | 43,902 | |
iRobot Corp.* | | | 4,300 | | | | 89,784 | |
K12, Inc.* | | | 3,100 | | | | 86,521 | |
Kenneth Cole Productions, Inc.* | | | 2,328 | | | | 31,312 | |
Learning Tree International, Inc. | | | 2,300 | | | | 22,310 | |
Lincoln Educational Services Corp.* | | | 1,760 | | | | 21,930 | |
Lumber Liquidators Holdings, Inc.* | | | 3,590 | | | | 86,447 | |
Mac-Gray Corp. | | | 2,504 | | | | 30,424 | |
Maidenform Brands, Inc.* | | | 850 | | | | 22,746 | |
Marcus Corp., The | | | 2,150 | | | | 27,563 | |
McCormick & Schmick’s Seafood Restaurants, Inc.* | | | 4,420 | | | | 39,471 | |
Meritage Corp.* | | | 1,957 | | | | 35,833 | |
Midas, Inc.* | | | 3,204 | | | | 23,581 | |
Monro Muffler Brake, Inc. | | | 1,900 | | | | 90,706 | |
Morton’s Restaurant Group, Inc.* | | | 2,550 | | | | 14,280 | |
Overstock.com, Inc. | | | 3,400 | | | | 45,594 | |
Peet’s Coffee & Tea, Inc.* | | | 1,500 | | | | 57,375 | |
R.G. Barry Corp. | | | 8,686 | | | | 89,813 | |
RC2 Corp.* | | | 1,105 | | | | 23,316 | |
Red Robin Gourmet Burgers, Inc.* | | | 2,200 | | | | 44,660 | |
Rue21,Inc.* | | | 2,597 | | | | 69,132 | |
Shuffle Master, Inc.* | | | 5,800 | | | | 54,578 | |
Shutterfly, Inc.* | | | 7,705 | | | | 231,920 | |
Steinway Musical Instruments, Inc.* | | | 8,674 | | | | 147,545 | |
Stoneridge, Inc.* | | | 3,129 | | | | 34,419 | |
Summer Infant, Inc.* | | | 6,090 | | | | 48,720 | |
True Religion Apparel, Inc.* | | | 9,473 | | | | 193,723 | |
Universal Electronics, Inc.* | | | 12,108 | | | | 254,994 | |
US Auto Parts Network, Inc.* | | | 13,205 | | | | 105,508 | |
Vera Bradley, Inc.* | | | 1,100 | | | | 30,085 | |
Vitamin Shoppe, Inc.* | | | 2,600 | | | | 72,306 | |
West Marine, Inc.* | | | 2,450 | | | | 24,034 | |
Zumiez, Inc.* | | | 3,300 | | | | 86,526 | |
Total Consumer Discretionary | | | | | | | 3,855,451 | |
Consumer Staples - 1.7% | | | | | | | | |
Andersons, Inc., The | | | 650 | | | | 25,590 | |
Boston Beer Co., Inc.* | | | 500 | | | | 35,795 | |
Elizabeth Arden, Inc.* | | | 1,912 | | | | 39,100 | |
Inter Parfums, Inc. | | | 4,661 | | | | 81,521 | |
Nash Finch Co. | | | 3,800 | | | | 159,220 | |
Nutraceutical International Corp.* | | | 808 | | | | 13,130 | |
Pantry, Inc., The* | | | 1,100 | | | | 21,395 | |
Susser Holdings Corp.* | | | 2,100 | | | | 28,707 | |
Total Consumer Staples | | | | | | | 404,458 | |
Energy - 3.6% | | | | | | | | |
Approach Resources, Inc.* | | | 1,975 | | | | 30,514 | |
Bolt Technology Corp.* | | | 1,300 | | | | 14,443 | |
Clean Energy Fuels Corp.* | | | 2,300 | | | | 33,396 | |
Dawson Geophysical Co.* | | | 1,005 | | | | 24,964 | |
GeoResources, Inc.* | | | 6,800 | | | | 116,960 | |
Gulf Island Fabrication, Inc. | | | 2,395 | | | | 54,702 | |
Gulfport Energy Corp.* | | | 5,000 | | | | 83,300 | |
Kodiak Oil & Gas Corp.* | | | 25,900 | | | | 106,708 | |
The accompanying notes are an integral part of these financial statements.
29
Managers Institutional Micro-Cap Fund
Schedule of Portfolio Investments (continued)
| | | | | | | | |
| | | Shares | | | Value | |
Energy - 3.6% (continued) | | | | | | | | |
Natural Gas Services Group, Inc.* | | | 3,100 | | | $ | 48,825 | |
North American Energy Partners, Inc.* | | | 3,900 | | | | 33,852 | |
Northern Oil & Gas, Inc.* | | | 7,105 | | | | 139,826 | |
OYO Geospace Corp.* | | | 250 | | | | 15,152 | |
Panhandle Oil and Gas, Inc. | | | 1,100 | | | | 27,170 | |
Tesco Corp.* | | | 3,500 | | | | 44,310 | |
TGC Industries, Inc.* | | | 3,254 | | | | 12,040 | |
Willbros Group, Inc.* | | | 4,400 | | | | 38,984 | |
Total Energy | | | | | | | 825,146 | |
Financials - 10.1% | | | | | | | | |
Alliance Financial Corp. | | | 425 | | | | 12,950 | |
Altisource Portfolio Solutions S.A.* | | | 2,200 | | | | 57,552 | |
American Physicians Service Group | | | 775 | | | | 25,110 | |
American Safety Insurance Holdings, Ltd.* | | | 2,325 | | | | 43,175 | |
Amerisafe, Inc.* | | | 4,200 | | | | 80,178 | |
Associated Estates Realty Corp. | | | 1,918 | | | | 26,641 | |
Asta Funding, Inc. | | | 7,200 | | | | 59,256 | |
Baldwin & Lyons, Inc. | | | 509 | | | | 12,725 | |
Bancorp Rhode Island, Inc. | | | 850 | | | | 24,726 | |
Bank of Marin Bancorp | | | 1,150 | | | | 38,306 | |
Boston Private Financial Holdings, Inc. | | | 5,600 | | | | 31,976 | |
Cardinal Financial Corp. | | | 3,800 | | | | 37,962 | |
CoBiz Financial, Inc. | | | 5,400 | | | | 26,136 | |
Cogdell Spencer, Inc. | | | 1,800 | | | | 11,826 | |
Columbia Banking System, Inc. | | | 2,600 | | | | 47,346 | |
Community Trust Bancorp, Inc. | | | 1,861 | | | | 50,824 | |
Compass Diversified Holdings | | | 11,900 | 2 | | | 202,657 | |
Cypress Sharpridge Investments, Inc. | | | 4,100 | | | | 53,423 | |
Danvers Bancorp, Inc. | | | 3,125 | | | | 46,969 | |
Eagle Bancorp, Inc.* | | | 3,175 | | | | 39,243 | |
Eastern Insurance Holdings, Inc. | | | 2,245 | | | | 24,987 | |
Encore Capital Group, Inc.* | | | 6,310 | | | | 128,218 | |
ESB Financial Corp. | | | 875 | | | | 12,591 | |
Financial Engines, Inc.* | | | 6,200 | | | | 91,326 | |
First Cash Financial Services, Inc.* | | | 1,878 | | | | 54,593 | |
First of Long Island Corp., The | | | 925 | | | | 23,014 | |
Flushing Financial Corp. | | | 2,000 | | | | 26,300 | |
FPIC Insurance Group, Inc.* | | | 1,450 | | | | 51,359 | |
Hallmark Financial Services, Inc.* | | | 2,425 | | | | 21,680 | |
Independent Bank Corp. (MA) | | | 1,490 | | | | 35,000 | |
LaSalle Hotel Properties | | | 2,500 | | | | 59,225 | |
MarketAxess Holdings, Inc. | | | 5,400 | | | | 98,118 | |
Meadowbrook Insurance Group, Inc. | | | 7,208 | | | | 62,205 | |
Merchants Bancshares, Inc. | | | 550 | | | | 14,196 | |
Mission West Properties, Inc. | | | 2,044 | | | | 13,695 | |
National Bankshares, Inc. | | | 1,525 | | | | 39,879 | |
National Interstate Corp. | | | 4,300 | 2 | | | 92,321 | |
Northrim Bancorp, Inc. | | | 3,200 | | | | 54,560 | |
OceanFirst Financial Corp., Inc. | | | 1,950 | | | | 23,283 | |
Ramco-Gershenson Properties Trust | | | 3,350 | | | | 38,793 | |
S.Y. Bancorp, Inc. | | | 2,090 | | | | 51,205 | |
SCBT Financial Corp. | | | 1,190 | | | | 36,331 | |
SeaBright Insurance Holdings, Inc. | | | 3,500 | 2 | | | 29,295 | |
Simmons First National Corp., Class A | | | 1,850 | | | | 50,302 | |
Texas Capital Bancshares, Inc.* | | | 2,500 | | | | 45,375 | |
United Financial Bancorp, Inc. | | | 1,700 | | | | 23,018 | |
Urstadt Biddle Properties, Inc., Class A | | | 1,400 | | | | 26,894 | |
ViewPoint Financial Group | | | 1,260 | | | | 12,096 | |
Washington Banking Co. | | | 5,100 | | | | 64,209 | |
Washington Trust Bancorp, Inc. | | | 1,300 | | | | 26,117 | |
Western Alliance Bancorp* | | | 13,900 | | | | 83,956 | |
Total Financials | | | | | | | 2,343,122 | |
HealthCare - 10.8% | | | | | | | | |
America Service Group, Inc. | | | 4,600 | | | | 70,380 | |
American Dental Partners, Inc.* | | | 3,000 | | | | 34,980 | |
Assisted Living Concepts, Inc.* | | | 850 | | | | 27,412 | |
Bio-Reference Laboratories, Inc.* | | | 3,800 | | | | 81,928 | |
BioScrip, Inc.* | | | 7,100 | | | | 39,973 | |
Cantel Medical Corp. | | | 2,275 | | | | 42,133 | |
CryoLife, Inc.* | | | 4,550 | | | | 29,348 | |
Cyberonics, Inc.* | | | 4,300 | | | | 118,293 | |
DexCom, Inc.* | | | 8,900 | | | | 122,375 | |
Endologix, Inc.* | | | 17,100 | | | | 94,563 | |
Ensign Group, Inc.,The | | | 1,475 | | | | 27,686 | |
eResearch Technology, Inc.* | | | 4,650 | | | | 35,433 | |
Eurand N.V.* | | | 9,100 | | | | 99,736 | |
Exactech, Inc.* | | | 5,100 | | | | 82,926 | |
HeartWare International, Inc.* | | | 1,300 | | | | 88,842 | |
HMS Holdings Corp.* | | | 400 | | | | 24,044 | |
Insulet Corp.* | | | 9,565 | | | | 152,562 | |
Kensey Nash Corp.* | | | 5,350 | | | | 144,236 | |
The accompanying notes are an integral part of these financial statements.
30
Managers Institutional Micro-Cap Fund
Schedule of Portfolio Investments (continued)
| | | | | | | | |
| | | Shares | | | Value | |
Health Care - 10.8% (continued) | | | | | | | | |
Landauer, Inc. | | | 500 | 2 | | $ | 30,545 | |
LHC Group, Inc.* | | | 4,037 | | | | 108,595 | |
MAKO Surgical Corp.* | | | 2,500 | | | | 26,950 | |
Medical Action Industries, Inc.* | | | 3,886 | | | | 38,549 | |
Meridian Bioscience, Inc. | | | 3,400 | 2 | | | 77,826 | |
MWI Veterinary Supply, Inc.* | | | 1,600 | | | | 91,520 | |
Neogen Corp.* | | | 3,000 | | | | 100,260 | |
NxStage Medical, Inc.* | | | 14,785 | | | | 298,066 | |
Obagi Medical Products, Inc.* | | | 2,450 | | | | 27,954 | |
Symmetry Medical, Inc.* | | | 4,900 | | | | 43,365 | |
Synovis Life Technologies, Inc.* | | | 3,600 | | | | 54,000 | |
U.S. Physical Therapy, Inc.* | | | 7,826 | | | | 146,894 | |
Vascular Solutions, Inc.* | | | 5,500 | | | | 59,565 | |
Young Innovations, Inc. | | | 987 | | | | 27,409 | |
Zoll Medical Corp.* | | | 1,575 | | | | 51,235 | |
Total Health Care | | | | | | | 2,499,583 | |
Industrials- 18.6% | | | | | | | | |
AAON, Inc. | | | 1,025 | | | | 25,164 | |
Acacia Research Corp.* | | | 5,800 | | | | 154,396 | |
Acco Brands Corp.* | | | 11,800 | | | | 73,514 | |
Alamo Group, Inc. | | | 1,059 | | | | 25,416 | |
Allied Defense Group, Inc., The* | | | 6,000 | | | | 16,200 | |
American Ecology Corp. | | | 3,371 | | | | 54,678 | |
Ameron International Corp. | | | 800 | | | | 55,008 | |
Apogee Enterprises, Inc. | | | 2,720 | | | | 28,533 | |
Astronics Corp.* | | | 2,725 | | | | 56,816 | |
AZZ, Inc. | | | 5,000 | | | | 185,700 | |
C&D Technologies, Inc.* | | | 24,600 | | | | 3,198 | |
Cascade Corp. | | | 1,125 | | | | 39,814 | |
CBIZ, Inc.* | | | 7,744 | | | | 45,844 | |
Celadon Group, Inc.* | | | 9,957 | | | | 129,142 | |
Chart Industries, Inc.* | | | 8,360 | | | | 194,788 | |
China Valves Technology, Inc.* | | | 5,800 | | | | 50,576 | |
Columbus McKinnon Corp.* | | | 14,300 | | | | 251,108 | |
Comfort Systems USA, Inc. | | | 2,300 | | | | 26,335 | |
Commercial Vehicle Group, Inc.* | | | 3,047 | | | | 40,921 | |
Courier Corp. | | | 2,422 | | | | 35,846 | |
Covenant Transportation Group, Inc.* | | | 7,465 | | | | 54,644 | |
CRA International, Inc.* | | | 3,850 | | | | 71,802 | |
Ducommun, Inc. | | | 2,475 | | | | 53,138 | |
Dynamex, Inc.* | | | 1,844 | | | | 38,982 | |
Dynamic Materials Corp. | | | 850 | | | | 13,200 | |
Eagle Bulk Shipping, Inc.* | | | 5,900 | | | | 30,267 | |
Ennis, Inc. | | | 4,950 | | | | 89,298 | |
EnPro Industries, Inc.* | | | 1,150 | | | | 40,411 | |
Exponent, Inc.* | | | 1,105 | | | | 35,272 | |
Furmanite Corp.* | | | 6,725 | | | | 38,669 | |
G&K Services, Inc., Class A | | | 1,150 | | | | 28,428 | |
GeoEye, Inc.* | | | 2,100 | | | | 92,967 | |
Gibraltar Industries, Inc.* | | | 2,825 | | | | 25,792 | |
GP Strategies Corp.* | | | 2,816 | | | | 24,443 | |
Graham Corp. | | | 2,450 | | | | 41,576 | |
Greenbrier Co., Inc.* | | | 7,255 | | | | 132,041 | |
Hawaiian Holdings, Inc.* | | | 2,100 | | | | 15,372 | |
Hawk Corp., Class A* | | | 625 | | | | 31,144 | |
Higher One Holdings, Inc.* | | | 4,374 | | | | 76,370 | |
Hurco Companies, Inc.* | | | 2,621 | | | | 48,226 | |
Interface, Inc., Class A | | | 10,100 | | | | 145,339 | |
Kforce, Inc.* | | | 5,600 | | | | 84,056 | |
Kimball International, Inc., Class B | | | 6,750 | | | | 41,040 | |
Knoll, Inc. | | | 3,100 | | | | 47,027 | |
LaBarge, Inc.* | | | 20,074 | | | | 254,739 | |
Ladish Co., Inc.* | | | 2,705 | | | | 86,533 | |
LB Foster Co., Class A* | | | 3,900 | | | | 128,778 | |
Lihua International, Inc.* | | | 900 | | | | 9,603 | |
Marten Transport, Ltd.* | | | 2,725 | | | | 57,879 | |
Met-Pro Corp. | | | 3,500 | | | | 39,515 | |
Michael Baker Corp.* | | | 1,350 | | | | 44,118 | |
MYR Group, Inc.* | | | 500 | | | | 7,795 | |
OceanFreight, Inc., Class A* | | | 7,333 | | | | 7,260 | |
Old Dominion Freight Line, Inc.* | | | 1,950 | | | | 54,698 | |
Orion Marine Group, Inc.* | | | 8,000 | | | | 100,080 | |
PGT, Inc.* | | | 23,700 | | | | 49,770 | |
Powell Industries, Inc.* | | | 1,300 | | | | 40,118 | |
RBC Bearings, Inc.* | | | 2,500 | | | | 83,300 | |
Saia, Inc.* | | | 3,291 | | | | 47,654 | |
Satcon Technology Corp.* | | | 12,100 | | | | 48,642 | |
SFN Group, Inc.* | | | 3,550 | | | | 26,909 | |
Standard Parking Corp.* | | | 3,571 | | | | 61,028 | |
Sun Hydraulics Corp. | | | 1,700 | | | | 52,819 | |
TBS International PLC, Class A* | | | 6,500 | | | | 26,910 | |
The accompanying notes are an integral part of these financial statements.
31
Managers Institutional Micro-Cap Fund
Schedule of Portfolio Investments (continued)
| | | | | | | | |
| | | Shares | | | Value | |
Industrials - 18.6% (continued) | | | | | | | | |
TrueBlue, Inc.* | | | 4,400 | | | $ | 61,820 | |
Universal Truckload Services, Inc.* | | | 1,650 | | | | 23,678 | |
USA Truck, Inc.* | | | 2,846 | | | | 39,047 | |
Vitran Corp., Inc., Class A* | | | 7,440 | | | | 83,254 | |
Westport Innovations, Inc.* | | | 5,400 | | | | 97,848 | |
Total Industrials | | | | | | | 4,326,296 | |
Information Technology - 27.5% | | | | | | | | |
Actuate Corp.* | | | 7,888 | | | | 38,178 | |
American Software, Inc., Class A | | | 5,100 | | | | 30,804 | |
Anadigics, Inc.* | | | 21,020 | | | | 142,305 | |
Anaren Microwave, Inc.* | | | 2,275 | | | | 38,061 | |
Ancestry.com, Inc.* | | | 3,700 | | | | 98,679 | |
Applied Micro Circuits Corp.* | | | 3,666 | | | | 36,917 | |
Aspen Technology, Inc.* | | | 7,500 | | | | 84,000 | |
Bel Fuse, Inc. | | | 1,709 | | | | 38,982 | |
ChinaCache International Holdings, Ltd., Sponsored ADR* | | | 2,700 | | | | 65,205 | |
Compellent Technologies, Inc.* | | | 5,100 | | | | 128,876 | |
Computer Task Group, Inc.* | | | 6,500 | | | | 51,870 | |
comScore, Inc.* | | | 4,125 | | | | 96,979 | |
Comtech Telecommunications Corp.* | | | 2,300 | | | | 70,886 | |
Constant Contact, Inc.* | | | 3,700 | | | | 85,100 | |
Dice Holdings, Inc.* | | | 8,895 | | | | 80,500 | |
Digi International, Inc.* | | | 5,205 | | | | 50,280 | |
DSP Group, Inc.* | | | 3,850 | | | | 27,566 | |
DTS, Inc.* | | | 1,265 | | | | 50,347 | |
EMS Technologies, Inc.* | | | 5,600 | | | | 99,904 | |
Entropic Communications, Inc.* | | | 5,750 | | | | 48,070 | |
Envestnet, Inc.* | | | 2,965 | | | | 39,168 | |
Extreme Networks, Inc.* | | | 12,275 | | | | 39,157 | |
FARO Technologies, Inc.* | | | 6,530 | | | | 157,634 | |
Forrester Research, Inc. | | | 843 | | | | 27,878 | |
GSI Technology, Inc.* | | | 2,050 | | | | 14,248 | |
Hackett Group, Inc., The* | | | 3,275 | | | | 12,772 | |
hiSoft Technology International, Sponsored ADR* | | | 6,100 | | | | 162,260 | |
Hollysys Automation Technologies, Ltd.* | | | 4,100 | | | | 51,824 | |
iGATE Corp. | | | 6,076 | | | | 124,193 | |
Interactive Intelligence, Inc.* | | | 6,900 | | | | 170,499 | |
IntraLinks Holdings, Inc.* | | | 4,200 | | | | 91,854 | |
IPG Photonics Corp.* | | | 9,480 | | | | 213,300 | |
Ixia* | | | 2,610 | | | | 40,846 | |
IXYS Corp.* | | | 2,987 | | | | 30,587 | |
JinkoSolar Holding Co., Ltd., Sponsored ADR* | | | 2,200 | | | | 66,330 | |
Kenexa Corp.* | | | 2,750 | | | | 50,298 | |
KIT Digital, Inc.* | | | 5,100 | | | | 70,227 | |
KVH Industries, Inc.* | | | 2,630 | | | | 36,925 | |
Limelight Networks, Inc.* | | | 21,200 | | | | 143,736 | |
Lionbridge Technologies, Inc.* | | | 24,500 | | | | 122,500 | |
Liquidity Services, Inc.* | | | 6,000 | | | | 96,000 | |
LivePerson, Inc.* | | | 19,050 | | | | 176,403 | |
LogMeIn, Inc.* | | | 4,875 | | | | 193,684 | |
MaxLinear, Inc., Class A* | | | 2,300 | | | | 24,012 | |
Maxwell Technologies, Inc.* | | | 9,420 | | | | 152,792 | |
Methode Electronics, Inc. | | | 4,268 | | | | 39,650 | |
Mindspeed Technologies, Inc.* | | | 6,420 | | | | 47,380 | |
MIPS Technologies, Inc.* | | | 6,615 | | | | 97,240 | |
ModusLink Global Solutions, Inc.* | | | 3,475 | | | | 23,039 | |
MTS Systems Corp. | | | 2,076 | | | | 68,031 | |
Multi-Fineline Electronix, Inc.* | | | 500 | | | | 12,240 | |
NIC, Inc. | | | 14,800 | 2 | | | 128,464 | |
Omnivision Technologies, Inc.* | | | 2,845 | | | | 77,185 | |
Oplink Communications, Inc.* | | | 3,717 | | | | 64,973 | |
OSI Systems, Inc.* | | | 725 | | | | 26,100 | |
PC Connection, Inc.* | | | 3,496 | | | | 29,436 | |
Perficient, Inc.* | | | 5,100 | | | | 53,856 | |
QuinStreet, Inc.* | | | 2,466 | | | | 38,297 | |
RadisysCorp.* | | | 2,525 | | | | 24,669 | |
Renesola, Ltd., Sponsored ADR* | | | 9,400 | | | | 112,518 | |
Richardson Electronics, Ltd. | | | 2,650 | | | | 28,673 | |
RightNow Technologies, Inc.* | | | 2,500 | | | | 65,300 | |
Rubicon Technology, Inc.* | | | 3,790 | | | | 87,625 | |
S1 Corp.* | | | 6,150 | | | | 35,793 | |
Sierra Wireless, Inc.* | | | 3,570 | | | | 43,090 | |
Sonic Solutions, Inc.* | | | 25,183 | | | | 301,441 | |
Sourcefire, Inc.* | | | 1,446 | | | | 34,111 | |
Spectrum Control, Inc.* | | | 21,457 | | | | 327,434 | |
Symmetricom, Inc.* | | | 4,800 | | | | 29,904 | |
Synchronoss Technologies, Inc.* | | | 4,900 | | | | 104,419 | |
Taleo Corp.* | | | 2,400 | | | | 68,856 | |
Terremark Worldwide, Inc.* | | | 3,444 | | | | 34,406 | |
TESSCO Technologies, Inc. | | | 812 | | | | 12,261 | |
Travelzoo, Inc.* | | | 3,003 | | | | 103,153 | |
Tyler Technologies, Inc.* | | | 4,400 | | | | 89,804 | |
The accompanying notes are an integral part of these financial statements.
32
Managers Institutional Micro-Cap Fund
Schedule of Portfolio Investments (continued)
| | | | | | | | |
| | | Shares | | | Value | |
Information Technology - 27.5% (continued) | | | | | | | | |
VanceInfo Technologies, Inc., Sponsored ADR* | | | 2,800 | | | $ | 101,836 | |
Virtusa Corp.* | | | 13,275 | | | | 189,302 | |
Vocus, Inc.* | | | 598 | | | | 13,246 | |
Xyratex, Ltd.* | | | 13,700 | | | | 212,076 | |
Total Information Technology | | | | | | | 6,398,444 | |
Materials - 4.1% | | | | | | | | |
Brush Engineered Materials, Inc.* | | | 3,525 | | | | 116,854 | |
Buckeye Technologies, Inc. | | | 3,639 | | | | 65,684 | |
Koppers Holdings, Inc. | | | 5,400 | | | | 150,552 | |
Landec Corp.* | | | 4,000 | | | | 25,160 | |
Myers Industries, Inc. | | | 3,200 | | | | 28,256 | |
Omnova Solutions, Inc.* | | | 22,900 | | | | 182,742 | |
Quaker Chemical Corp. | | | 700 | | | | 25,494 | |
STR Holdings, Inc.* | | | 4,100 | | | | 101,885 | |
Universal Stainless & Alloy Products, Inc.* | | | 9,225 | | | | 266,972 | |
Total Materials | | | | | | | 963,599 | |
Telecommunication Services - 0.2% | | | | | | | | |
Shenandoah Telecommunications Co.* | | | 2,088 | | | | 38,106 | |
Utilities - 0.6% | | | | | | | | |
Central Vermont Public Service Corp. | | | 2,700 | | | | 54,594 | |
Chesapeake Utilities Corp. | | | 1,000 | | | | 36,690 | |
Unitil Corp. | | | 2,5002 | | | | 54,300 | |
Total Utilities | | | | | | | 145,584 | |
Total Common Stocks
(cost $16,770,391) | | | | | | | 21,799,789 | |
Exchange Traded Funds - 0.5% | | | | | | | | |
SPDR KBW Regional Banking ETF
(cost $113,134) | | | 5,300 | | | | 119,939 | |
Short-Term Investments - 5.8%1 | | | | | | | | |
BNY Mellon Overnight Government Fund, 0.21%3 | | | 108,000 | | | | 108,000 | |
Dreyfus Cash Management Fund, Institutional Class Shares, 0.16% | | | 1,250,896 | | | | 1,250,896 | |
Total Short-Term Investments
(cost $1,358,896) | | | | | | | 1,358,896 | |
Total Investments - 100.1%
(cost $18,242,421) | | | | | | | 23,278,624 | |
Other Assets, less Liabilities - (0.1)% | | | | | | | (29,023 | ) |
Net Assets - 100.0% | | | | | | $ | 23,249,601 | |
Note: Based on the approximate cost of investments of $18,641,411 for Federal income tax purposes at October 31, 2010, the aggregate gross unrealized appreciation and depreciation were $5,246,417 and $609,204, respectively, resulting in net unrealized appreciation of investments of $4,637,213.
| * | Non-income-producing security. |
| 1 | Yield shown for each investment company represents the October 31, 2010, seven-day average yield, which refers to the sum of the previous seven days’ dividends paid, expressed as an annual percentage. |
| 2 | Some or all of these shares, amounting to a market value of $ 102,772, or 0.4% of net assets, were out on loan to various brokers. |
| 3 | Collateral received from brokers for securities lending was invested in this short-term investment. |
The following table summarizes the inputs used to value the Fund’s net assets by the fair value hierarchy levels as of October 31, 2010. (See Note 1 (a) in the Notes to Financial Statements.)
| | | | | | | | | | | | | | | | |
| | | Quoted Prices
in Active
Markets for
Identical
Investments
Level 1 | | | Significant
Other
Observable
Inputs
Level 2 | | | Significant
Unobservable
Inputs
Level 3 | | | Total | |
Investments in Securities | | | | | | | | | | | | | | | | |
Common Stocks† | | $ | 21,799,789 | | | | -— | | | | — | | | $ | 21,799,789 | |
Exchange Traded Funds | | | 119,939 | | | | — | | | | — | | | | 119,939 | |
Short-Term Investments | | | 1,358,896 | | | | — | | | | — | | | | 1,358,896 | |
| | | | | | | | | | | | | | | | |
Total Investments in Securities | | $ | 23,278,624 | | | | — | | | | — | | | $ | 23,278,624 | |
| | | | | | | | | | | | | | | | |
| † | All common stocks held in the Fund are Level 1 securities. For a detailed break-out of the common stocks by major industry classification, please refer to the Schedule of Portfolio Investments. |
As of October 31, 2010, the Fund had no significant transfers between Level 1 and Level 2 from the beginning of the reporting period.
Investment Definitions and Abbreviations:
| | |
ADR: | | ADR after the name of a holding stands for American Depositary Receipt, representing ownership of foreign securities on deposit with a domestic custodian bank. The value of the ADR security is determined or significantly influenced by trading on exchanges not located in the United States or Canada. Sponsored ADRs are initiated by the underlying foreign company. |
ETF: | | Exchange Traded Fund. |
The accompanying notes are an integral part of these financial statements.
33
Managers Real Estate Securities Fund
Portfolio Manager’s Comments
Managers Real Estate Securities Fund seeks a combination of income and long-term capital appreciation by investing in stocks of companies that are principally engaged in owning and operating commercial real estate properties for the benefit of their investors including Real Estate Investment Trusts (REITs). Managers utilizes an independent subadvisor, Urdang Securities Management, Inc (“Urdang”), to manage the assets of this portfolio.
The Portfolio Manager
Urdang Securities Management, Inc.
The investment team at Urdang believes real estate securities play an important role in a multi-asset class investment portfolio. Urdang’s strategy recognizes that real estate securities are not simply stocks, or real estate. They are hybrid financial investments that must be valued on the basis of a number of meaningful factors, only one of which is the value of the firm’s property portfolio. To accurately assess the relative value of a REIT, Urdang takes into account critical business and market factors, such as: the company’s capitalization, its position within public capital markets, and the quality of the management team.
Urdang believes that investment success is the result of the company’s ability to provide a consistently accurate answer to the question at the heart of its value-oriented investment strategy: Which REITs do they believe will generate the highest risk-adjusted returns? Urdang believes that a diversified portfolio with a value orientation will result in strong risk-adjusted returns.
Urdang employs a value-oriented investment process with two distinct and complementary components: bottom-up real estate research and the company’s proprietary Relative Value Model (RVM) securities valuation process, which was designed to provide a uniform basis for evaluating the validity of a security’s trading price. Combining real estate research and the RVM process has been central to Urdang’s track record of delivering strong returns without incurring high levels of risk.
The Year in Review
For the 12 months that ended October 31, 2010, the Managers Real Estate Securities Fund returned 44.47%, compared with 42.63% for its benchmark, the Dow Jones U.S. Select REIT Index.
Towards the end of the fiscal year, fundamentals broadly turned positive with worries about a double-dip recession receding which continued to benefit REITs, which returned over 40% for the year. REITs, along with other higher yielding stocks, were the top performers over the course of the past year as both benefited from the low interest rate environment. The period ended with the supply of new real estate at historic lows. Demand for commercial space continued to improve throughout the year (except for office space) as occupancy rates have stabilized and market rents have flattened. Meanwhile, apartment rents have moved up and hotel occupancies are up significantly, although still well below peak levels.
The solid relative performance of the Fund over the course of the past fiscal year has helped contribute to strong relative performance for the portfolio over a longer-term time horizon. Over the past year, performance has been primarily driven by solid stock selection across several areas of the REIT market and has also benefited from relative sector positioning compared to the benchmark. In addition, the Fund’s tilt towards higher-quality REITs has also been beneficial throughout the past fiscal year.
Urdang believes that REITs remain a compelling value despite a strong rally post- March 2009. The cap for implied rate REITs is slightly above cap rates observed in the private market for assets of like quality and location and forward earnings multiples are above average by historical standards, but this is to be expected at this point in the cycle as today’s earnings are at trough levels. The yield spread between REITs and the 10-year U.S. government bond now stands at 127 basis points, above the 20-year average of 107 basis points. REIT dividend payout ratios are well below the historical norm, making for a fertile environment for meaningful dividend growth. Most REITs are trading significantly below replacement cost, meaning a REIT can be bought for less than it would cost to build its properties. Urdang believes that job growth will be necessary for the future profitability of REITs as they continue to recover from trough earnings levels.
Cumulative Total Return Performance
The Fund’s cumulative total return is based on the daily change in net asset value (NAV), and assumes that all distributions were reinvested. The Dow Jones U.S. Select REIT Index measures U.S. publicly traded Real Estate Investment Trusts. Unlike the Fund, the Dow Jones U.S. Select REIT Index is unmanaged, is not available to investment, and does not incur expenses. The chart
34
Managers Real Estate Securities Fund
Portfolio Manager’s Comments (continued)
Cumulative Total Return Performance (continued)
illustrates the performance of a hypothetical $10,000 investment made in the Managers Real Estate Securities Fund on
October 31, 2000, to a $10,000 investment made in the Dow Jones U.S. Select REIT Index for the same time period. Performance for periods longer than one year is annualized. The graph and table do not reflect the deduction of taxes that a shareholder would pay on a Fund distribution or redemption of shares. The listed returns for the Fund are net of expenses and the returns for the index exclude expenses. Total returns for the Fund would have been lower had certain expenses not been reduced.
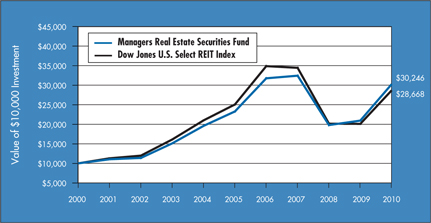
The table below shows the average annual total returns for the Managers Real Estate Securities Fund and the Dow Jones U.S. Select REIT Index for the one-year, five-year and ten-year periods ended October 31, 2010.
| | | | | | | | | | | | |
Average Annual Total Returns1 | | One Year | | | Five Years | | | Ten Years | |
Managers Real Estate Securities Fund2,3 | | | 44.47 | % | | | 5.38 | % | | | 11.70 | % |
Dow Jones U.S. Select REIT Index4 | | | 42.63 | % | | | 2.72 | % | | | 11.11 | % |
The performance data shown represents past performance. Past performance is not a guarantee of future results. Current performance may be lower or higher than the performance data quoted. The investment return and principal value of an investment in the Fund will fluctuate so that an investor’s shares, when redeemed, may be worth more or less than their original cost. For performance information through the most recent month end, please call (800) 835-3879 or visit our Web site at www.managersinvest.com.
In choosing a Fund, investors should carefully consider the amount they plan to invest, their investment objectives, the Fund’s investment objectives, risks, charges and expenses before investing. For this and other information, please call (800) 835-3879 or visit www.managersinvest.com for a free prospectus. Read it carefully before investing or sending money. Distributed by Managers Distributors, Inc., member FINRA.
| 1 | Total return equals income yield plus share price change and assumes reinvestment of all dividends and capital gain distributions. Returns are net of fees and may reflect offsets of Fund expenses as described in the Prospectus. No adjustment has been made for taxes payable by shareholders on their reinvested dividends and capital gain distributions. Returns for periods greater than one year are annualized. The listed returns on the Fund are net of expenses and based on the published NAV as of October 31, 2010. All returns are in U.S. dollars($). |
| 2 | Fund for which, from time to time, the advisor has waived fees or reimbursed expenses, which may have resulted in higher returns. |
| 3 | The Fund is subject to special risk considerations similar to those associated with the direct ownership of real estate. Real estate valuations may be subject to factors such as changing general and local economic, financial, competitive, and environmental conditions. |
| 4 | The Dow Jones U.S. Select REIT Index measures U.S. publicly traded Real Estate Investment Trusts. Unlike the Fund, the Dow Jones U.S. Select REIT Index is unmanaged, is not available to investment, and does not incur expenses. |
Not FDIC insured, nor bank guaranteed. May lose value.
35
Managers Real Estate Securities Fund
Fund Snapshots
October 31, 2010
Portfolio Breakdown
| | | | |
Industry | | Managers Real Estate
Securities Fund** | |
REITs (Office Properties) | | | 14.9 | % |
REITs (Apartments) | | | 14.7 | % |
REITs (Regional Malls) | | | 14.6 | % |
REITs (Diversified) | | | 12.0 | % |
REITs (Health Care) | | | 11.3 | % |
REITs (Shopping Centers) | | | 8.0 | % |
REITs (Hotels) | | | 6.6 | % |
REITs (Warehouse/Industrials) | | | 6.6 | % |
REITs (Storage) | | | 5.1 | % |
REITs (Manufactured Homes) | | | 0.8 | % |
REITs (Mortgages) | | | 0.0 | % |
Other Assets and Liabilities | | | 5.4 | % |
| ** | As a percentage of net assets |
Top Ten Holdings
| | | | |
Security Name | | Percentage
of Net Assets | |
Simon Property Group, Inc.* | | | 7.1 | % |
Vornado Realty Trust* | | | 6.7 | |
Equity Residential* | | | 6.6 | |
The Macerich Company * | | | 4.5 | |
Public Storage, Inc.* | | | 4.3 | |
ProLogis* | | | 4.2 | |
Boston Properties, Inc.* | | | 3.9 | |
Kimco Realty Corp * | | | 3.3 | |
Health Care REIT, Inc. | | | 3.2 | |
Digital Realty Trust, Inc. | | | 2.9 | |
| | | | |
Top Ten as a Group | | | 46.7 | % |
| | | | |
| * | Top Ten Holding at April 30, 2010 |
Any sectors, industries, or securities discussed should not be perceived as investment recommendations. Mention of a specific security should not be considered a recommendation to buy or solicitation to sell that security. Specific securities mentioned in this report may have been sold from the Fund’s portfolio of investments by the time you receive this report.
36
Managers Real Estate Securities Fund
Schedule of Portfolio Investments
October 31, 2010
| | | | | | | | |
| | | Shares | | | Value | |
REITs - 94.6% | | | | | | | | |
Apartments - 14.7% | | | | | | | | |
American Campus Communities, Inc. | | | 3,480 | | | $ | 110,072 | |
Apartment Investment & Management Co. | | | 6,000 | | | | 139,860 | |
AvalonBay Communities, Inc. | | | 1,810 | | | | 192,421 | |
Camden Property Trust | | | 12,690 | | | | 629,297 | |
Equity Residential | | | 32,180 | | | | 1,564,913 | |
Essex Property Trust, Inc. | | | 5,560 | | | | 628,058 | |
UDR, Inc. | | | 10,560 | | | | 237,389 | |
Total Apartments | | | | | | | 3,502,010 | |
Diversified - 12.0% | | | | | | | | |
Coresite Realty Corp.* | | | 5,440 | | | | 81,926 | |
Digital Realty Trust, Inc. | | | 11,490 | | | | 686,298 | |
Duke Realty Corp. | | | 39,930 | | | | 497,927 | |
Vornado Realty Trust | | | 18,290 | | | | 1,598,363 | |
Total Diversified | | | | | | | 2,864,514 | |
Health Care - 11.3% | | | | | | | | |
Cogdell Spencer, Inc. | | | 14,450 | | | | 94,937 | |
HCP, Inc. | | | 15,020 | | | | 540,870 | |
Health Care REIT, Inc. | | | 15,080 | | | | 770,588 | |
Nationwide Health Properties, Inc. | | | 13,630 | | | | 556,513 | |
Senior Housing Properties Trust | | | 7,500 | | | | 179,175 | |
Ventas, Inc. | | | 10,300 | | | | 551,668 | |
Total Health Care | | | | | | | 2,693,751 | |
Hotels - 6.6% | | | | | | | | |
BioMed Realty Trust, Inc. | | | 4,790 | | | | 87,896 | |
Hospitality Properties Trust | | | 8,870 | | | | 202,325 | |
Host Hotels & Resorts, Inc. | | | 38,530 | | | | 612,242 | |
LaSalle Hotel Properties | | | 11,890 | | | | 281,674 | |
Pebblebrook Hotel Trust* | | | 12,440 | | | | 243,700 | |
Sunstone Hotel Investors, Inc.* | | | 14,000 | | | | 151,900 | |
Total Hotels | | | | | | | 1,579,737 | |
Manufactured Homes - 0.8% | | | | | | | | |
Equity Lifestyle Properties, Inc. | | | 3,230 | | | | 183,852 | |
Office Properties - 14.9% | | | | | | | | |
Alexandria Real Estate Equities, Inc. | | | 4,010 | | | | 294,655 | |
Boston Properties, Inc. | | | 10,820 | | | | 932,576 | |
Brandywine Realty Trust | | | 19,770 | | | | 236,647 | |
Colonial Properties Trust | | | 8,500 | | | | 152,405 | |
CommonWealth REIT | | | 20,560 | | | | 523,252 | |
Government Properties Income Trust | | | 6,690 | | | | 178,556 | |
Hudson Pacific Properties, Inc. | | | 12,030 | | | | 192,480 | |
Kilroy Realty Corp. | | | 8,410 | | | | 287,370 | |
Parkway Properties, Inc. | | | 9,480 | | | | 147,509 | |
SL Green Realty Corp. | | | 9,040 | | | | 594,109 | |
Total Office Properties | | | | | | | 3,539,559 | |
Regional Malls - 14.6% | | | | | | | | |
CBL & Associates Properties, Inc. | | | 20,980 | | | | 328,966 | |
Macerich Co., The | | | 23,710 | | | | 1,057,703 | |
Simon Property Group, Inc. | | | 17,620 | | | | 1,691,872 | |
Taubman Centers, Inc. | | | 8,400 | | | | 389,928 | |
Total Regional Malls | | | | | | | 3,468,469 | |
Shopping Centers - 8.0% | | | | | | | | |
Acadia Realty Trust | | | 10,000 | | | | 190,800 | |
Federal Realty Investment Trust | | | 3,210 | | | | 263,156 | |
Kimco Realty Corp. | | | 46,150 | | | | 795,165 | |
Weingarten Realty Investors | | | 27,420 | | | | 661,645 | |
Total Shopping Centers | | | | | | | 1,910,766 | |
Storage - 5.1% | | | | | | | | |
Public Storage, Inc. | | | 10,190 | | | | 1,011,052 | |
U-Store-It Trust | | | 22,040 | | | | 189,764 | |
Total Storage | | | | | | | 1,200,816 | |
Warehouse/Industrials - 6.6% | | | | | | | | |
AMB Property Corp. | | | 14,710 | | | | 414,675 | |
DCT Industrial Trust, Inc. | | | 28,230 | | | | 141,432 | |
ProLogis | | | 73,930 | | | | 1,009,144 | |
Total Warehouse/Industrials | | | | | | | 1,565,251 | |
Total REITs
(cost $17,921,047) | | | | | | | 22,508,725 | |
REOCs - 2.4% | | | | | | | | |
Hotels & Motels - 1.0% | | | | | | | | |
Hyatt Hotels Corp., Class A* | | | 5,720 | | | | 230,516 | |
Wireless Equipment - 1.4% | | | | | | | | |
Crown Castle International Corp.* | | | 7,610 | | | | 328,143 | |
Total REOCs
(cost $514,887) | | | | | | | 558,659 | |
Short-Term Investments - 2.9%1 | | | | | | | | |
Dreyfus Cash Management Fund, Institutional Class Shares 0.16%
(cost $689,384) | | | 689,384 | | | | 689,384 | |
Total Investments - 99.9%
(cost $19,125,318) | | | | | | | 23,756,768 | |
Other Assets, less Liabilities - 0.1% | | | | | | | 30,321 | |
Net Assets - 100.0% | | | | | | $ | 23,787,089 | |
The accompanying notes are an integral part of these financial statements.
37
Managers Real Estate Securities Fund
Schedules of Portfolio Investments (continued)
Note: Based on the approximate cost of investments of $20,867,869 for Federal income tax purposes at October 31, 2010, the aggregate gross unrealized appreciation and depreciation were $2,946,569 and $57,670, respectively, resulting in net unrealized appreciation of investments of $2,888,899.
| * | Non-income-producing security. |
| 1 | Yield shown for each investment company represents the October 31, 2010, seven-day average yield, which refers to the sum of the previous seven days’ dividends paid, expressed as an annual percentage. |
The following table summarizes the inputs used to value the Fund’s net assets by the fair value hierarchy levels as of October 31, 2010. (See Note 1(a) in the Notes to Financial Statements.)
| | | | | | | | | | | | | | | | |
| | | Quoted Prices
in Active
Markets for
Identical
Investments
Level 1 | | | Significant
Other
Observable
Inputs
Level 2 | | | Significant
Unobservable
Inputs
Level 3 | | | Total | |
Investments in Securities | | | | | | | | | | | | | | | | |
Common Stocks† | | $ | 23,067,384 | | | | — | | | | — | | | $ | 23,067,384 | |
Short-Term Investments | | | 689,384 | | | | — | | | | — | | | | 689,384 | |
| | | | | | | | | | | | | | | | |
Total Investments in Securities | | $ | 23,756,768 | | | | — | | | | — | | | $ | 23,756,768 | |
| | | | | | | | | | | | | | | | |
| † | All common stocks held in the Fund are Level 1 securities. For a detailed break-out of the common stocks by major industry classification, please refer to the Schedule of Portfolio Investments. |
As of October 31, 2010, the Fund had no significant transfers between Level 1 and Level 2 from the beginning of the reporting period.
Investment Definitions and Abbreviations:
| | |
REIT: | | Real Estate Investment Trust |
REOC: | | Real Estate Operating Company |
The accompanying notes are an integral part of these financial statements.
38
Managers California Intermediate Tax-Free Fund
Portfolio Manager’s Comments
The Managers California Intermediate Tax-Free Fund’s (the “Fund”) objective is to achieve income free from Federal income taxes and California state income taxes, including the Alternative Minimum Tax (“AMT”).
The Fund invests at least 80% of its total assets in intermediate-term California municipal bonds that are free from both Federal and California state income taxes, including the AMT. The Fund’s securities will have quality ratings comparable to the four highest rating categories of Moody’s or Standard & Poor’s. The dollar-weighted average maturity of these intermediate-term securities is normally 3 to 10 years. The Fund’s benchmark is the Barclays Capital 5-Year Municipal Bond Index.
The Portfolio Manager
Miller Tabak Asset Management (“MTAM”), the subadvisor for the Fund, was founded in early 2008, and is a division of Miller Tabak + Co. LLC (“Miller Tabak”). Miller Tabak is a 26 year-old institutional trading firm that specializes in the discrete handling of stock purchases and sales, portfolio rebalancing, and listed options. MTAM focuses exclusively on managing municipal bond portfolios and is based in New York City. As previously described in the Information Statement sent to shareholders on September 15, 2008, MTAM took over the subadvisory duties previously performed by Evergreen Investment Management Company, LLC (“Evergreen”) with respect to the Fund. As of that date, MTAM has managed the Fund’s entire portfolio of investments.
Philosophy
The MTAM team focuses on purchasing municipal credits exhibiting improving credit characteristics while maintaining geographic and economic diversity as key elements in the portfolio-construction process. MTAM believes proactive total-return portfolio management offers greater potential rewards in an increasingly inefficient municipal bond market. Achieving reasonable and consistent growth of clients’ capital without taking elevated levels of principal risk is MTAM’s objective.
The municipal bond market is a unique sector within the domestic fixed-income universe, consisting of over 48,000 issuers with distinct security structures and varying credit risks. MTAM seeks to exploit these nuances through a disciplined, risk-controlled, relative-value investment management process.
Process
| | • | | Active total-return portfolio management is MTAM’s central theme for achieving objectives that benefit the Fund |
| | • | | MTAM is committed to extensive, proprietary, and original research and analysis |
| | • | | MTAM follows a disciplined and well-defined investment process |
MTAM’s portfolio management starts by setting income and return objectives, the time horizon, liquidity and cash flow needs, and tax considerations. After client needs have been assessed, MTAM establishes specific investment guidelines for each account. They focus on maturity, duration, minimum acceptable credit quality, sector limitations, selection of the benchmark, and risk tolerance. Lastly, MTAM creates a detailed investment policy statement for each account and begins implementing its investment process.
MTAM’s investment process can be divided into two distinct parts. The first part focuses on risk analysis. MTAM’s risk analysis has two components, interest-rate analysis and credit-risk analysis. MTAM strives to control interest-rate volatility by defining the appropriate ranges for duration and maturity based on the Fund’s predetermined liquidity requirements, the specific risk profile, and the given market environment. Daniel Greenhaus, Miller Tabak’s Chief Bond Strategist, helps mold MTAM’s macro perspective. He is a valuable resource in shaping MTAM’s market perspective and is often tapped by other investment firms for his well-respected insight. His input is particularly important in shaping the Fund’s duration and maturity targets.
The second component of MTAM’s risk analysis focuses on credit risk. MTAM applies rigorous standards for tax-exempt issuers, continually reviews financial statements, and closely monitors rating agency commentary and relative trading spreads in the secondary market. Michael Pietronico, the Fund’s portfolio manager, has 15 years experience managing municipal bond portfolios, which gives him excellent knowledge of the key factors influencing the municipal bond market and an experienced eye to identify high-quality California municipal bonds.
The second major part of MTAM’s investment process assesses relative value. MTAM starts by creating expectations for the slope of the yield curve and yield spreads going forward. Once forecasts are finalized, MTAM assesses how its forecast and other potential
39
Managers California Intermediate Tax-Free Fund
Portfolio Manager’s Comments (continued)
outcomes may affect market prices. This ultimately helps MTAM identify what securities are most attractively valued and offer the best risk-adjusted return. MTAM also uses its market outlook to determine what sectors of the municipal market will add to and detract from performance and adjust weightings accordingly. Lastly, credit research at the security level is undertaken to analyze credit quality, yield, duration, structure, and call protection in order to assess a security’s potential contribution to the Fund.
Buy Discipline
There are three parts to MTAM’s buy discipline:
Macro View
Aggregate Municipal Supply
Secondary Market Supply
Dealer Inventories
Micro View
Supply/Demand Per State
Macro View
Major Economic Trends in Place
Micro View
Legal Structure of Securities
Service-Area Economic Performance
Project and System Operations
| | • | | Individual Bond Structure Analysis |
Prepayment Risk
Original Issue Discount
Reinvestment Risk
Municipal Bond Credit Research - Credit Review Process
| | 1. | Comprehensive bottom-up analysis of issuer, pledged security, and historical economic performance |
| | 2. | Site visits and conference calls with key public officials |
| | 3. | Comprehensive financial statement review with feasibility analysis |
| | 4. | Negotiate with underwriters to strengthen key security covenants and secure optimal pricing |
| | 5. | Limits are implemented upon credit approval exposure |
Credit Surveillance
| | • | | Database is maintained for holdings by issuer and Fund exposure |
| | • | | The relevant performance statistics are tracked on a monthly, quarterly, and annual basis to help capture meaningful trends, for example trading spreads |
| | • | | Outside resources are utilized; for example financial statement repositories, industry publications, internet search engines, and rating agencies |
Sell Discipline
An individual security may become a candidate for sale for any of the following reasons:
| | • | | The issuer’s investment fundamentals begin to deteriorate |
| | • | | To take advantage of more attractive yield opportunities |
| | • | | The individual security no longer appears to meet the portfolio’s investment objective(s) |
| | • | | To meet liquidity needs |
| | • | | To help shorten or lengthen the overall duration of the portfolio |
The Year in Review
For the 12 months ended October 31, 2010, the Managers California Intermediate Tax-Free Fund returned 6.41%. The Fund’s benchmark, the Barclays Capital 5-Year Municipal Bond Index, returned 6.91% during the same time period.
The fiscal year began with investor expectations that the United States economy would rebound, and the Federal Reserve would need to begin the process of withdrawing the extraordinary amount of stimulus it dispatched after the financial crisis unfolded. Market participants quickly changed their views in the summer months of 2010 as an economic “soft patch” stirred investor concerns over the potential for a “double- dip” recession. As the fiscal year ended, the bond market, which initially cheered the possibility for more stimulus from the Federal Reserve, became increasingly concerned that the onset of “QE2” (the second round of quantitative easing) would drive inflation (and bond yields) higher in its aftermath.
40
Managers California Intermediate Tax-Free Fund
Portfolio Manager’s Comments (continued)
The Fund’s underperformance relative to its benchmark can be primarily attributed to the weaker overall financial profile of the State of California relative to a majority of the rest of the country. The benchmark has exposure to many Midwestern and Southeastern issuers that are in much stronger financial condition than the Golden State. As such, we view our relatively modest under-performance as a positive development as it indicates the Fund’s California state-specific holdings performed relatively closely to the national market. Given California’s unemployment rate at about 3% higher than the national average, it can be viewed favorably that the Fund performed as well as it has in the past 12 months. A lack of exposure to longer bonds and tobacco bonds hurt performance relative to peers as both segments performed well during the trailing fiscal year.
During the early months of 2010, the Fund abandoned its shorter duration bias relative to the benchmark as it became apparent to the investment team at MTAM that the economy was slowly losing elevation as fiscal stimulus began to wane at home, and concerns over potential defaults by sovereign governments in the Eurozone began to wane on consumer and business spending habits. MTAM correctly assumed that inflation expectations would weaken, and in fact, deflation became the more predominant worry for a time. Accordingly, they tactically liquidated the Fund’s significant holdings of shorter-maturity pre-refunded bonds to purchase municipal bonds in the 10-year to 15-year area of the yield curve, which would react more positively should inflation expectations erode. MTAM carried this slightly-longer-than-benchmark duration for the Fund into the end of the fiscal year as they remained concerned about the sustainability of the economic recovery into 2011, when fiscal policy in America is expected to become more contractionary with government spending set to slow, and tax rates poised to move higher.
The municipal market over the past year has climbed a seemingly tall “wall of worry” with consistent negative headlines about the eroding fiscal positions of many states (including California) failing to negate a rather strong overall flow of investor dollars into the asset class. The municipal market was specifically buoyed by the ongoing emergence of the Build America Bonds (“BAB”) program, which essentially siphoned about 25% of the tax-free bond supply out of the market, thus creating a chronic shortage of high-quality tax-free bonds for investors. The rather one-sided results of the 2010 midterm congressional elections have cast doubt about the future of the BAB program. Many political pundits see the more fiscally conservative composition of Congress as a mandate for “smaller government,” which in turn could be perceived as a negative for the prospects of an extension of the BAB program, which is set to expire on December 31, 2010. Given the perceived diminished likelihood of the extension of BAB program, tax-free bond investors were quick to discount higher levels of supply and as such, market rates moved notably higher in intermediate and longer maturities as the fiscal year ended. The single most important near-term factor for the California municipal bond market will be the ability of the state and local issuers to access the bond market at attractive interest rate levels. The fate of the BAB program will play a significant role in determining borrowing costs for California issuers throughout 2011.
Looking Forward
Moving forward, the Fund is positioned for a tax-free yield curve that we believe should remain exceptionally steep as the Federal Reserve keeps short-term rates anchored close to zero due to persistently high unemployment and inflation that is deemed “too low” by the central bank. While it is well intentioned, the effects of the Fed’s “QE2” program may prove to be problematic for longer maturity bonds as inflation expectations should continue to march higher as long as the program remains in place. As an intermediate-positioned product, the Fund stands to benefit on a relative basis to both very short maturities (which in many cases are offered below 1% currently) and longer maturity bonds (20-year to 30-year), which will see some upward pressure on yields as inflation concerns remain a key topic in an environment where the Fed is seen as “printing money.” We suspect the coming months may be relatively kind to the intermediate range as yields, now approaching 4%, should keep retail investors interested in the 7-year to 15-year maturities, to which the Fund has solid exposure.
MTAM sees economic growth in the United States remaining in the 1.5% to 3% range for at least the next several quarters, as persistently high unemployment keeps economic “slack” widespread. However, given the potential for inflation expectations to move higher in light of the “QE2” strategy by the Federal Reserve, MTAM remains concerned about the fate of the property market in the U.S. They remain convinced that any notable move higher in mortgage rates could bring a notable downshift in housing prices, and renew concerns about a possible “double-dip” recession. As such, MTAM intends to be opportunistic buyers during periods of weakening tax-free bond prices, as higher yields could prove “transitory.” MTAM expects to keep the Fund positioned slightly longer than its benchmark as the incremental additional yield available in the 7-year to 15-year area seems very attractive relative to the 5-year area of the curve, where the benchmark is most concentrated.
41
Managers California Intermediate Tax-Free Fund
Portfolio Manager’s Comments (continued)
Cumulative Total Return Performance
Managers California Intermediate Tax-Free Fund’s cumulative total return is based on the daily change in net asset value (NAV) and assumes that all distributions were reinvested. The Barclays Capital U.S. Municipal Bond: 5 Year Index is a rules-based, market-value-weighted index engineered for the long-term tax-exempt bond market. The index has four main sectors: general obligation bonds, revenue bonds, insured bonds (including all insured bonds with a Aaa/AAA rating), and prerefunded bonds. This index is the 5 Year (4-6) component of the Municipal Bond index. Unlike the Fund, the Barclays Capital U.S. Municipal Bond: 5 Year Index is unmanaged, is not available to investment, and does not incur expenses. This chart compares a hypothetical $10,000 investment made in the Managers California Intermediate Tax-Free Fund on October 31, 2000 to a $10,000 investment made in the Barclays Capital U.S. Municipal Bond: 5 Year Index for the same time period. Performance for periods longer than one year is annualized. The graph and table do not reflect the deduction of taxes that a shareholder would pay on a Fund distribution or redemption of shares. The listed returns for the Fund are net of expenses and the returns for the index exclude expenses. Total returns for the Fund would have been lower had certain expenses not been reduced.
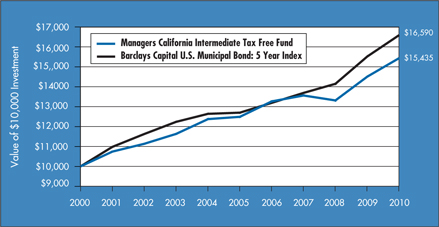
The table below shows the average annual total returns for the Managers California Intermediate Tax-Free Fund and the Barclays Capital U.S. Municipal Bond: 5 Year Index for the one-year, five-year and ten-year periods ended October 31, 2010.
| | | | | | | | | | | | |
Average Annual Total Returns1 | | One Year | | | Five Years | | | Ten Years | |
Managers California Intermediate Tax Free Fund2,3,4,5 | | | 6.41 | % | | | 4.33 | % | | | 4.44 | % |
Barclays Capital U.S. Municipal Bond: 5 Year Index6 | | | 6.91 | % | | | 5.49 | % | | | 5.19 | % |
The performance data shown represents past performance. Past performance is not a guarantee of future results. Current performance may be lower or higher than the performance data quoted. The investment return and principal value of an investment in the Fund will fluctuate so that an investor’s shares, when redeemed, may be worth more or less than their original cost. For performance information through the most recent month end, please call (800) 835-3879 or visit our Web site at www.managersinvest.com.
In choosing a Fund, investors should carefully consider the amount they plan to invest, their investment objectives, the Fund’s investment objectives, risks, charges and expenses before investing. For this and other information, please call (800) 835-3879 or visit www.managersinvest.com for a free prospectus. Read it carefully before investing or sending money. Distributed by Managers Distributors, Inc., member FINRA.
| 1 | Total return equals income yield plus share price change and assumes reinvestment of all dividends and capital gain distributions. Returns are net of fees and may reflect offsets of Fund expenses as described in the Prospectus. No adjustment has been made for taxes payable by shareholders on their reinvested dividends and capital gain distributions. Returns for periods greater than one year are annualized. The listed returns on the Fund are net of expenses and based on the published NAV as of October 31, 2010. All returns are in U.S. dollars($). |
| 2 | Fund for which, from time to time, the advisor has waived fees or reimbursed expenses, which may have resulted in higher returns. |
| 3 | The Fund is subject to the risks associated with investments in debt securities, such as default risk and fluctuations in the perception of the debtors’ ability to pay their creditors. |
| 4 | Changing interest rates may adversely affect the value of an investment. An increase in interest rates typically causes the value of bonds and other fixed-income securities to fall. |
| 5 | The Fund is subject to risks associated from economic, political, geographic, and demographic conditions of California that could adversely affect the value of the Fund’s investment portfolio. |
| 6 | Prior to October 31, 2008, the Index was known as the Lehman Brothers 5-Year Municipal Bond Index. |
Not FDIC insured, nor bank guaranteed. May lose value.
42
Managers California Intermediate Tax-Free Fund
Fund Snapshots
October 31, 2010
Portfolio Breakdown
| | | | |
Portfolio Credit Quality | | Managers California
Intermediate
Tax-Free Fund** | |
Aaa | | | 1.7 | % |
Aa | | | 52.0 | % |
A | | | 46.3 | % |
| ** | As a percentage of net assets |
Top Ten Holdings
| | | | |
Security Name | | Percentage
of Net Assets | |
Santa Ana, CA Unified School District, Election 2008, Series A, 5.250%, 08/01/25* | | | 4.6 | % |
Los Angeles, CA Municipal Improvement Corp. Revenue, Police Headquarters Facility, Series A, 5.000%, 01/01/25 (FGIC Insured)* | | | 2.6 | |
San Bernardino, CA Community College District General Obligation, Election 2002, Series A, 6.250%, 08/01/23* | | | 2.4 | |
Puerto Rico Sales Tax Financing Corp., Sales Tax Revenue, First Subordinated, Series A, 4.375%, 08/01/20* | | | 2.3 | |
Val Verde, CA Unified School District General Obligation, Election 2008, Series A, 5.500%, 08/01/24* | | | 2.2 | |
Los Angeles, CA Municipal Improvement Corp. Revenue, Capital Equipment, Series A, 5.000%, 09/01/23 | | | 2.2 | |
Port of Oakland, CA Revenue, Series B, 5.000%, 11/01/21 (National Insured)* | | | 2.1 | |
Fairfield-Suisun, CA Unified School District General Obligation, Election 2002, 5.000% 08/01/24 (National Insured)* | | | 1.9 | |
San Bernardino, CA Community College District General Obligation, Election 2002, Series A, 6.375%, 08/01/26* | | | 1.9 | |
Yosemite, CA Community College General Obligation, Election 2004, Series A, 5.000%, 08/01/22 (FGIC Insured)* | | | 1.8 | |
| | | | |
Top Ten as a Group | | | 24.0 | % |
| | | | |
| * | Top Ten Holding at April 30, 2010 |
Any sectors, industries, or securities discussed should not be perceived as investment recommendations. Mention of a specific security should not be considered a recommendation to buy or solicitation to sell that security. Specific securities mentioned in this report may have been sold from the Fund’s portfolio of investments by the time you receive this report.
43
Managers California Intermediate Tax-Free Fund
Schedule of Portfolio Investments
October 31, 2010
| | | | | | | | |
| | | Principal Amount | | | Value | |
Municipal Bonds - 97.2% | | | | | | | | |
Albany, CA Unified School District General Obligation, Election 2004, Series B, 5.500%, 08/01/12 (National Insured) | | $ | 25,000 | | | $ | 26,882 | |
Alvord, CA Unified School District General Obligation, Series A, 5.900%, 02/01/24 (National Insured) | | | 45,000 | | | | 50,751 | |
Anaheim, CA Union High School District General Obligation, 5.375%, 08/01/20 (AGM Insured) | | | 35,000 | | | | 38,024 | |
Bakersfield, CA City School District, Series A, 5.250%, 11/01/21 (AGM Insured) | | | 110,000 | | | | 123,198 | |
Bakersfield, CA Wastewater System Revenue Series A, 5.000%, 09/15/19 (AGM Insured) | | | 175,000 | | | | 199,245 | |
Barstow, CA Unified School District General Obligation, Election 2001, Series B, 5.000%, 08/01/24 (National Insured) | | | 375,000 | | | | 389,220 | |
Bay Area, CA Toll Authority, Series F, 5.000%, 04/01/13 | | | 50,000 | | | | 55,004 | |
Bay Area, CA Toll Authority, Series F, 5.000%, 04/01/17 | | | 20,000 | | | | 23,449 | |
Bay Area, CA Toll Authority, Series F, 5.000%, 04/01/22 | | | 35,000 | | | | 38,563 | |
Bonita, CA Unified School District, Election 2004, Series B, 5.000%, 08/01/16 (FGIC Insured) | | | 50,000 | | | | 58,456 | |
Butte-Glenn Counties, CA Community College District General Obligation, Series B, 5.000%, 08/01/23 (National Insured) | | | 325,000 | | | | 349,063 | |
Byron, CA Unified School District, Series A, 5.000%, 08/01/14 (FGIC Insured) | | | 35,000 | | | | 38,756 | |
California State Department of Water Resources, Series A, 5.250%, 05/01/11 (AGM Insured) | | | 45,000 | | | | 46,107 | |
California State Department of Water Resources, Series A, 5.500%, 05/01/14 (AMBAC Insured) | | | 210,000 | | | | 228,228 | |
California State Department of Water Resources Power Supply Revenue, Series A, 5.000%, 05/01/13 (AGM Insured) | | | 45,000 | | | | 48,212 | |
California State Department of Water Resources Power Supply Revenue, Series A, 5.375%, 05/01/21 | | | 40,000 | | | | 43,398 | |
California State Department of Water Resources Power Supply Revenue, Series A, 5.500%, 05/01/16 (AMBAC Insured) | | | 50,000 | | | | 54,340 | |
California State Department of Water Resources Power Supply Revenue, Series A, 5.750%, 05/01/17 (National Insured) | | | 35,000 | | | | 38,169 | |
California State Public Works Board, Series A, 3.700%, 12/01/12 (AMBAC Insured) | | | 35,000 | | | | 36,452 | |
California State Public Works Board, Series A, 5.000%, 12/01/11 | | | 50,000 | | | | 51,694 | |
California State Public Works Board, Series C, 5.000%, 06/01/12 | | | 10,000 | | | | 10,537 | |
California State Public Works Board, Series A, 5.150%, 12/01/11 (AMBAC Insured) | | | 50,000 | | | | 50,152 | |
California State Public Works Board, Series A, 5.250%, 06/01/11 (AMBAC Insured) | | | 5,000 | | | | 5,127 | |
California State Public Works Board, Series B, 5.250%, 03/01/19 (AMBAC Insured) | | | 200,000 | | | | 206,150 | |
California State Public Works Board, Series A, 6.000%, 04/01/24 | | | 500,000 | | | | 553,120 | |
Carlsbad, CA Unified School District General Obligation, Election 2006, Series A, 5.000%, 08/01/21 (National Insured) | | | 20,000 | | | | 22,373 | |
Carlsbad, CA Unified School District General Obligation, Series B, 5.250%, 05/01/25 | | | 70,000 | | | | 78,226 | |
Central Marin, CA Sanitation Agency Revenue, 5.000%, 09/01/21 (National Insured) | | | 100,000 | | | | 110,392 | |
Cerritos, CA Community College General Obligation, Election 2004, Series C, 5.250%, 08/01/25 | | | 15,000 | | | | 16,866 | |
Chaffey, CA Joint Union High School District, Series B, 5.000%, 08/01/25 (FGIC Insured) | | | 55,000 | | | | 55,716 | |
Chino Valley, CA Unified School District, Series A, 5.375%, 08/01/14 (AGM Insured) | | | 70,000 | | | | 75,511 | |
City of El Paso De Robles, CA General Obligation, 5.000%, 08/01/23 (National Insured) | | | 125,000 | | | | 134,674 | |
City of El Paso De Robles, CA General Obligation, 5.000%, 08/01/25 (National Insured) | | | 250,000 | | | | 265,618 | |
City of El Paso De Robles, CA General Obligation, 5.000%, 08/01/27 (National Insured) | | | 20,000 | | | | 21,062 | |
City of Escondido, CA General Obligation, Series A, 4.000%, 09/01/13 (National Insured) | | | 50,000 | | | | 53,376 | |
City of Escondido, CA General Obligation, Series A, 5.000%, 09/01/14 (National Insured) | | | 90,000 | | | | 99,269 | |
City of Los Angeles, CA General Obligation, Series A, 5.000%, 09/01/13 (AGM Insured) | | | 60,000 | | | | 66,942 | |
City of Los Angeles, CA General Obligation, Series A, 5.250%, 09/01/11 (National Insured) | | | 40,000 | | | | 41,612 | |
The accompanying notes are an integral part of these financial statements.
44
Managers California Intermediate Tax-Free Fund
Schedule of Portfolio Investments (continued)
| | | | | | | | |
| | | Principal Amount | | | Value | |
Municipal Bonds - 97.2% (continued) | | | | | | | | |
City of Los Angeles, CA Sanitation Equipment Charge Revenue, Series A, 5.000%, 02/01/13 (FGIC Insured) | | $ | 25,000 | | | $ | 27,097 | |
City of San Jose, CA 5.000%, 09/01/12 | | | 25,000 | | | | 26,992 | |
Clovis, CA Unified School District General Obligation, Series B, 5.000%, 08/01/23 (National Insured) | | | 115,000 | | | | 124,210 | |
Contra Costa County, CA Water District, Series L, 4.000%, 10/01/13 (AGM Insured) | | | 75,000 | | | | 79,764 | |
Corona-Norca, CA Unified School District, 5.000%, 09/01/12 (AGM Insured) | | | 45,000 | | | | 48,542 | |
Corona-Norca, CA Unified School District, Election 2006, Series A, 5.000%, 08/01/25 (AGM Insured) | | | 50,000 | | | | 53,140 | |
Cotati-Rohnert Park, CA Unified School District, Series B, 4.000%, 08/01/13 (FGIC Insured) | | | 50,000 | | | | 52,588 | |
Covina-Valley, CA Unified School District, Election 2006, Series A, 4.000%, 08/01/13 (National Insured) | | | 115,000 | | | | 122,380 | |
Covina-Valley, CA Unified School District, Election 2006, Series A, 5.000%, 08/01/21 (National Insured) | | | 410,000 | | | | 438,868 | |
Desert Sands, CA Unified School District General Obligation, 5.000%, 08/01/16 | | | 50,000 | | | | 58,604 | |
Desert Sands, CA Unified School District General Obligation, 5.000%, 08/01/27 | | | 235,000 | | | | 251,474 | |
Desert Sands, CA Unified School District General Obligation, 5.500%, 08/01/28 | | | 25,000 | | | | 27,791 | |
Desert Sands, CA University School District Refunding, 5.000%, 06/01/22 (AMBAC Insured) | | | 40,000 | | | | 43,757 | |
Eastern, CA Municipal Water District, Water & Sewer Revenue, Series A, 5.000%, 07/01/21 (National Insured) | | | 330,000 | | | | 364,297 | |
El Dorado County, CA Rescue Union School District General Obligation, Election 1998, 5.000%, 09/01/21 (National Insured) | | | 25,000 | | | | 29,214 | |
El Dorado County, CA Rescue Union School District General Obligation, Election 1998, 5.000%, 07/01/23 (National Insured) | | | 50,000 | | | | 57,894 | |
El Monte, CA City School District General Obligation, Series A, 4.250%, 05/01/15 (FGIC Insured) | | | 300,000 | | | | 324,978 | |
El Monte, CA Union High School District General Obligation, Series B, 3.750%, 03/01/13 (National Insured) | | | 50,000 | | | | 52,504 | |
El Monte, CA Union High School District General Obligation, Series C, 5.000%, 06/01/21 (AGM Insured) | | | 40,000 | | | | 44,271 | |
Fairfield-Suisun, CA Unified School District, Election 2002, 5.000%, 08/01/27 (National Insured) | | | 100,000 | | | | 105,442 | |
Fairfield-Suisun, CA Unified School District, Election 2002, 5.250%, 08/01/16 (National Insured) | | | 225,000 | | | | 251,852 | |
Fairfield-Suisun, CA Unified School District General Obligation, Election 2002, 5.000%, 08/01/24 (National Insured) | | | 565,000 | | | | 593,459 | |
Fairfield-Suisun, CA Unified School District General Obligation, Election 2002, 5.250%, 08/01/23 (National Insured) | | | 240,000 | | | | 258,098 | |
Fresno County, CA Central Unified School District General Obligation, 5.000%, 07/01/21 (National Insured) | | | 50,000 | | | | 53,542 | |
Fresno County, CA Central Unified School District General Obligation, Series A, 5.000%, 08/01/22 (Assured Guaranty) | | | 25,000 | | | | 27,802 | |
Fresno County, CA Central Unified School District General Obligation, 5.000%, 07/01/23 (National Insured) | | | 25,000 | | | | 26,539 | |
Fresno County, CA Unified School District General Obligation, Series C, 5.900%, 08/01/22 (National Insured) | | | 25,000 | | | | 28,682 | |
Grossmont, CA Union High School District General Obligation, 5.000%, 08/01/23 (National Insured) | | | 85,000 | | | | 93,053 | |
Grossmont-Cuyamaca, CA Community College District General Obligation, Series C, 5.000%, 08/01/24 (Assured Guaranty) | | | 50,000 | | | | 55,046 | |
Hacienda La Puente, CA Unified School District General Obligation, 4.000%, 08/01/11 (FGIC Insured) | | | 25,000 | | | | 25,611 | |
Hemet, CA Unified School District General Obligation, Series A, 5.000%, 08/01/22 (AGM Insured) | | | 125,000 | | | | 136,551 | |
Imperial, CA Community College District General Obligation, Series B, 4.250%, 08/01/14 (AMBAC Insured) | | | 150,000 | | | | 161,214 | |
Imperial, CA Irrigation District Electric System Revenue, Series A, 5.250%, 11/01/24 | | | 100,000 | | | | 111,742 | |
Jurupa, CA Unified School District, Election 2001, 5.000%, 08/01/14 (FGIC Insured) | | | 225,000 | | | | 242,870 | |
La Mesa-Spring Valley, CA School District General Obligation, 3.250%, 08/01/11 (FGIC Insured) | | | 25,000 | | | | 25,518 | |
La Mesa-Spring Valley, CA School District General Obligation, 3.750%, 08/01/13 (FGIC Insured) | | | 35,000 | | | | 37,158 | |
Lincoln, CA Unified School District, Election 2004, 4.000%, 08/01/14 (FGIC Insured) | | | 75,000 | | | | 79,382 | |
The accompanying notes are an integral part of these financial statements.
45
Managers California Intermediate Tax-Free Fund
Schedule of Portfolio Investments (continued)
| | | | | | | | |
| | | Principal Amount | | | Value | |
Municipal Bonds - 97.2% (continued) | | | | | | | | |
Long Beach, CA Unified School District General Obligation, Series A, 5.500%, 08/01/26 | | $ | 85,000 | | | $ | 96,268 | |
Los Angeles County, CA Citrus Community College District General Obligation, Election 2004, Series B, 5.000%, 06/01/22 (National Insured) | | | 20,000 | | | | 21,810 | |
Los Angeles County, CA Golden West Schools Financing Authority General Obligation, 5.250%, 09/01/24 (FGIC Insured) | | | 365,000 | | | | 419,374 | |
Los Angeles County, CA Metropolitan Transportation Authority Revenue, Series A, 5.000%, 07/01 /13 (AGM Insured) | | | 55,000 | | | | 61,147 | |
Los Angeles County, CA Metropolitan Transportation Authority Revenue, Series E, 5.000%, 07/01/25 | | | 35,000 | | | | 39,086 | |
Los Angeles County, CA Public Works Financing Authority Revenue, Series A, 5.000%, 03/01/12 (National Insured) | | | 100,000 | | | | 105,837 | |
Los Angeles County, CA Public Works Financing Authority Revenue, 5.000%, 10/01/15 (National Insured) | | | 15,000 | | | | 17,492 | |
Los Angeles County, CA Public Works Financing Authority Revenue, Series A, 5.250%, 10/01/16 (AGM Insured) | | | 25,000 | | | | 29,846 | |
Los Angeles County, CA Sanitation Districts Financing Authority Capital Projects Revenue, 5.000%, 10/01/23 (FGIC Insured) | | | 80,000 | | | | 85,369 | |
Los Angeles, CA Community College District General Obligation, Series A, 5.500%, 08/01/17 (National Insured) | | | 15,000 | | | | 15,581 | |
Los Angeles, CA Department of Water & Power Revenue, Series A, 5.000%, 07/01/11 (National Insured) | | | 15,000 | | | | 15,448 | |
Los Angeles, CA Department of Water & Power Revenue, Series A, 5.000%, 07/01/13 (AMBAC Insured) | | | 50,000 | | | | 55,588 | |
Los Angeles, CA Harbor Department Revenue, Series A, 4.000%, 08/01/17 | | | 25,000 | | | | 27,789 | |
Los Angeles, CA Harbor Department Revenue, Series B, 5.000%, 08/01/20 (National Insured) | | | 275,000 | | | | 310,324 | |
Los Angeles, CA Municipal Improvement Corp. Revenue, Series C, 5.000%, 09/01/18 | | | 300,000 | | | | 339,114 | |
Los Angeles, CA Municipal Improvement Corp. Revenue, Series B1, 5.000%, 08/01/21 (FGIC Insured) | | | 125,000 | | | | 131,790 | |
Los Angeles, CA Municipal Improvement Corp. Revenue, Series B1, 5.000%, 08/01/23 (FGIC Insured) | | | 50,000 | | | | 52,250 | |
Los Angeles, CA Municipal Improvement Corp. Revenue, Series A, 5.000%, 09/01/24 | | | 100,000 | | | | 104,605 | |
Los Angeles, CA Municipal Improvement Corp. Revenue, Series B, 5.000%, 08/01/26 (FGIC Insured) | | | 200,000 | | | | 206,458 | |
Los Angeles, CA Municipal Improvement Corp. Revenue, Series A, 5.000%, 09/01/16 | | | 470,000 | | | | 527,105 | |
Los Angeles, CA Municipal Improvement Corp. Revenue, Series A, 5.000%, 09/01/23 | | | 640,000 | | | | 673,818 | |
Los Angeles, CA Municipal Improvement Corp. Revenue, Series A, 5.000%, 01/01/25 (FGIC Insured) | | | 780,000 | | | | 803,696 | |
Los Angeles, CA Municipal Improvement Corp. Revenue, Series A, 5.000%, 09/01/25 | | | 50,000 | | | | 52,032 | |
Los Angeles, CA Unified School District General Obligation, Election 2004, Series G, 5.000%, 07/01/24 (AMBAC Insured) | | | 35,000 | | | | 37,211 | |
Los Banos, CA Unified School District General Obligation, 4.150%, 08/01/11 (FGIC Insured) | | | 40,000 | | | | 40,859 | |
Los Nietos, CA School District General Obligation, 5.000%, 08/01/12 (Assured Guaranty) | | | 25,000 | | | | 26,532 | |
Metropolitan Water District of Southern California, Series A, 5.000%, 03/01/12 | | | 25,000 | | | | 26,518 | |
Monrovia, CA Unified School District General Obligation, Election 2006, Series B, 5.250%, 08/01/25 (FSA Insured) | | | 30,000 | | | | 33,138 | |
Moorpark, CA Unified School District General Obligation, Series A, 5.375%, 08/01/18 (AGM Insured) | | | 50,000 | | | | 54,320 | |
Moreno Valley, CA Unified School District, 4.000%, 08/01/13 (National lnsured) | | | 200,000 | | | | 211,450 | |
Moreno Valley, CA Unified School District, 4.000%, 08/01/14 (National Insured) | | | 75,000 | | | | 79,936 | |
Moreno Valley, CA Unified School District, 5.000%, 08/01/17 (National Insured) | | | 50,000 | | | | 55,546 | |
Moreno Valley, CA Unified School District General Obligation, 5.000%, 08/01/15 (National Insured) | | | 420,000 | | | | 467,880 | |
Moreno Valley, CA Unified School District General Obligation, 5.000%, 08/01/16 (National Insured) | | | 25,000 | | | | 27,927 | |
Mount Diablo, CA Unified School District, Election 2002, 4.125%, 07/01/14 (FGIC Insured) | | | 50,000 | | | | 52,328 | |
Orange County, CA Coast Community College District General Obligation, 4.500%, 08/01/11 (National Insured) | | | 20,000 | | | | 20,603 | |
Orange County, CA Sanitation District, Series A, 5.000%, 02/01/22 | | | 135,000 | | | | 152,481 | |
The accompanying notes are an integral part of these financial statements.
46
Managers California Intermediate Tax-Free Fund
Schedule of Portfolio Investments (continued)
| | | | | | | | |
| | | Principal Amount | | | Value | |
Municipal Bonds - 97.2% (continued) | | | | | | | | |
Peralta, CA Community College District General Obligation, Election 2006, Series B, 5.250%, 08/01/22 (AGM Insured) | | $ | 45,000 | | | $ | 50,554 | |
Peralta, CA Community College District General Obligation, Series A, 5.000%, 08/01/24 (National Insured) | | | 50,000 | | | | 53,870 | |
Placentia-Yorba Linda, CA Unified School District General Obligation, Series B, 5.500%, 08/01/27 (FGIC Insured) | | | 65,000 | | | | 70,257 | |
Port of Oakland, CA Series B, 5.000%, 11/01/16 (National Insured) | | | 255,000 | | | | 286,809 | |
Port of Oakland, CA Series B, 5.000%, 11/01/24 (National Insured) | | | 50,000 | | | | 51,486 | |
Port of Oakland, CA Revenue, Series M, 4.000%, 11/01/12 (FGIC Insured) | | | 10,000 | | | | 10,477 | |
Port of Oakland, CA Revenue, Series B, 4.000%, 11/01/14 (National Insured) | | | 450,000 | | | | 483,309 | |
Port of Oakland, CA Revenue, Series B, 4.000%, 11/01/15 (National Insured) | | | 105,000 | | | | 112,914 | |
Port of Oakland, CA Revenue, Series C, 5.000%, 11/01/15 (National Insured) | | | 310,000 | | | | 347,879 | |
Port of Oakland, CA Revenue, Series B, 5.000%, 11/01/17 (National Insured) | | | 10,000 | | | | 11,213 | |
Port of Oakland, CA Revenue, Series C, 5.000%, 11/01/17 (National Insured) | | | 275,000 | | | | 308,363 | |
Port of Oakland, CA Revenue, Series B, 5.000%, 11/01/21 (National Insured) | | | 625,000 | | | | 667,125 | |
Port of Oakland, CA Revenue, Series B, 5.000%, 11/01/22 (National Insured) | | | 30,000 | | | | 31,257 | |
Port of Oakland, CA Revenue, Series B, 5.000%, 11/01/26 (National Insured) | | | 275,000 | | | | 280,525 | |
Puerto Rico Sales Tax Financing Corp. Sales Tax Revenue, Series A, 4.375%, 08/01/20 | | | 685,000 | | | | 724,189 | |
Puerto Rico Sales Tax Financing Corp. Sales Tax Revenue, Series A, 5.000%, 08/01/18 | | | 70,000 | | | | 78,426 | |
Rancho, CA Water District Financing Authority Refunding Revenue, Series 2008A, 5.000%, 08/01/15 (AGM Insured) | | | 50,000 | | | | 58,534 | |
Riverside, CA Community College District, 5.000%, 08/01/24 (AGM Insured) | | | 35,000 | | | | 37,992 | |
Riverside County, CA Perris Union High School District, Series B, 3.750%, 09/01/11 (National Insured) | | | 50,000 | | | | 51,294 | |
Riverside County, CA Perris Union High School District General Obligation, Series B, 4.000%, 09/01/13 (FGIC Insured) | | | 50,000 | | | | 53,274 | |
Riverside County, CA Perris Union High School District General Obligation, Election 2004, Series A, 5.000%, 09/01/26 (FGIC Insured) | | | 15,000 | | | | 15,612 | |
Rosemead, CA School District General Obligation, Election 2000, Series B, 5.125%, 08/01/27 (FGIC Insured) | | | 25,000 | | | | 25,960 | |
Rosemead, CA School District General Obligation, Election 2000, Series D, 5.250%, 08/01/24 (AGM Insured) | | | 150,000 | | | | 166,634 | |
Rosemead, CA School District General Obligation, Election 2000, Series D, 5.250%, 08/01/25 (AGM Insured) | | | 55,000 | | | | 60,112 | |
Rosemead, CA School District General Obligation, Election 2000, Series D, 5.250%, 08/01/26 (AGM Insured) | | | 145,000 | | | | 157,585 | |
Rosemead, CA School District General Obligation, Election 2000, Series D, 5.500%, 08/01/28 (AGM Insured) | | | 125,000 | | | | 136,590 | |
Roseville, CA Joint Union High School District General Obligation, Election 2004, Series A, 5.000%, 08/01/26 (FGIC Insured) | | | 120,000 | | | | 127,081 | |
Sacramento, CA Municipal Utility District Revenue, Series S, 5.000%, 11/15/11 (National Insured) | | | 25,000 | | | | 26,097 | |
Sacramento, CA Municipal Utility District Revenue, Series S, 5.000%, 11/15/12 (National Insured) | | | 60,000 | | | | 65,187 | |
Sacramento, CA Municipal Utility District Revenue, Series R, 5.000%, 08/15/18 (National Insured) | | | 150,000 | | | | 162,290 | |
Sacramento, CA Municipal Utility District Revenue, Series K, 5.250%, 07/01/24 (AMBAC Insured) | | | 145,000 | | | | 163,126 | |
Sacramento County, CA Sanitation District Financing Authority Revenue, Series A, 5.250%, 12/01/12 | | | 100,000 | | | | 101,390 | |
San Bernardino, CA Community College District, Election 2001, Series C, 5.000%, 08/01/26 (AGM Insured) | | | 175,000 | | | | 188,921 | |
San Bernardino, CA Community College District, Election 2002, Series A, 6.250%, 08/01/23 | | | 620,000 | | | | 753,511 | |
San Bernardino, CA Community College District, Election 2002, Series A, 6.375%, 08/01/26 | | | 480,000 | | | | 577,930 | |
San Diego, CA Public Facilities Financing Authority Revenue, Series A, 4.000%, 05/15/12 | | | 475,000 | | | | 498,864 | |
San Diego, CA Public Facilities Financing Authority Revenue, Series B, 5.000%, 08/01/20 | | | 30,000 | | | | 34,935 | |
San Diego, CA Public Facilities Financing Authority Revenue, Series B, 5.000%, 05/15/21 | | | 50,000 | | | | 57,317 | |
The accompanying notes are an integral part of these financial statements.
47
Managers California Intermediate Tax-Free Fund
Schedule of Portfolio Investments (continued)
| | | | | | | | |
| | | Principal Amount | | | Value | |
Municipal Bonds - 97.2% (continued) | | | | | | | | |
San Diego, CA Unified Port District Revenue, Series B, 5.000%, 09/01/23 (National Insured) | | $ | 325,000 | | | $ | 341,712 | |
San Diego, CA Unified School District, Series C, 5.000%, 07/01/19 (AGM Insured) | | | 200,000 | | | | 209,656 | |
San Diego County, CA Southwestern Community College District General Obligation, 5.000%, 08/01/23 (National Insured) | | | 285,000 | | | | 312,967 | |
San Francisco, CA City & County Airport Commission Revenue, Second Series, Issue 28B, 4.000%, 05/01/11 (National Insured) | | | 20,000 | | | | 20,290 | |
San Francisco, CA City & County Airport Commission Revenue, Second Series, Issue 29B, 4.000%, 05/01/11 (FGIC Insured) | | | 30,000 | | | | 30,435 | |
San Francisco, CA City & County Airport Commission Revenue, Second Series, Issue 34F, 5.000%, 05/01/16 (FGIC Insured) | | | 45,000 | | | | 51,412 | |
San Francisco, CA City & County Airport Commission Revenue, Second Series, Issue 34F, 5.000%, 05/01/16 (Assured Guaranty) | | | 50,000 | | | | 57,543 | |
San Francisco, CA City & County Airport Commission Revenue, Second Series, Issue 27B, 5.250%, 05/01/12 (FGIC Insured) | | | 60,000 | | | | 61,481 | |
San Francisco, CA City & County Airport Commission Revenue, Second Series, Issue 30, 5.250%, 05/01/15 (XLCA Insured) | | | 75,000 | | | | 80,689 | |
San Francisco, CA City & County Airport Commission Revenue, Second Series, Issue 32F, 5.250%, 05/01/17 (FGIC Insured) | | | 465,000 | | | | 539,405 | |
San Francisco, CA City & County General Obligation, Laguna Honda Hospital, Series R3, 5.000%, 06/15/23 | | | 50,000 | | | | 54,392 | |
San Francisco, CA City & County General Obligation, Series 2002, 5.000%, 06/15/11 | | | 25,000 | | | | 25,583 | |
San Francisco, CA City & County Public Utilities Commission Revenue, Series B, 4.000%, 11/01/12 (National Insured) | | | 40,000 | | | | 42,684 | |
San Francisco, CA City & County Public Utilities Commission Revenue, Series A, 5.000%, 10/01/12 (National Insured) | | | 35,000 | | | | 37,824 | |
San Francisco, CA City & County Unified School District, Series B, 5.000%, 06/15/13 (AGM Insured) | | | 250,000 | | | | 272,407 | |
San Francisco, CA City & County Unified School District General Obligation, Election 2003, Series C, 5.000%, 06/15/22 (National Insured) | | | 55,000 | | | | 60,645 | |
San Francisco, CA Community College District, Series B, 5.000%, 06/15/14 (AMBAC Insured) | | | 120,000 | | | | 130,427 | |
San Francisco, CA Unified School District General Obligation, Series B, 5.000%, 06/15/12 (AGM Insured) | | | 100,000 | | | | 107,000 | |
San Juan, CA Unified School District General Obligation, Election 2002, 4.250%, 08/01/14 (FGIC Insured) | | | 240,000 | | | | 265,234 | |
San Juan, CA Unified School District General Obligation, Election 2002, Series A, 5.000%, 08/01/16 (National Insured) | | | 150,000 | | | | 167,416 | |
Santa Ana, CA Unified School District, Election 2008, Series A, 5.250%, 08/01/25 | | | 1,300,000 | | | | 1,431,768 | |
Santa Ana, CA Unified School District General Obligation, Series A, 5.250%, 08/01/26 | | | 500,000 | | | | 549,625 | |
Santa Clara County, CA Alum Rock Union Elementary School District General Obligation Refunding, 3.500%, 09/01/12 (FGIC Insured) | | | 15,000 | | | | 15,558 | |
Santa Clara County, CA Campbell Union School District General Obligation, Election 2002, Series B, 5.125%, 08/01/29 (FGIC Insured) | | | 10,000 | | | | 11,028 | |
Santa Clara County, CA East Side Union High School District General Obligation, Election 1999, Series C, 3.300%, 08/01/11 (FGIC Insured) | | | 25,000 | | | | 25,559 | |
Santa Clara County, CA East Side Union High School District General Obligation, Election 2002, Series D, 4.000%, 08/01/14 (XLCA Insured) | | | 40,000 | | | | 42,983 | |
Santa Clara County, CA East Side Union High School District General Obligation, Series A, 4.000%, 09/01/18 (AMBAC Insured) | | | 75,000 | | | | 78,370 | |
Santa Clara County, CA East Side Union High School District General Obligation, Election 2002, Series B, 5.000%, 08/01/12 (FGIC Insured) | | | 30,000 | | | | 31,648 | |
The accompanying notes are an integral part of these financial statements.
48
Managers California Intermediate Tax-Free Fund
Schedule of Portfolio Investments (continued)
| | | | | | | | |
| | | Principal Amount | | | Value | |
Municipal Bonds - 97.2% (continued) | | | | | | | | |
Santa Clara County, CA East Side Union High School District General Obligation, Election 2002, Series C, 5.000%, 08/01/12 (AGM Insured) | | $ | 15,000 | | | $ | 16,081 | |
Santa Clara County, CA East Side Union High School District, Election 2002, Series C, 5.000%, 08/01/14 (AGM Insured) | | | 60,000 | | | | 65,087 | |
Santa Clara County, CA East Side Union High School District General Obligation, Election 2002, Series D, 5.000%, 08/01/19 (XLCA Insured) | | | 65,000 | | | | 69,738 | |
Santa Clara County, CA East Side Union High School District General Obligation, Election 2002, Series D, 5.000%, 08/01/19 (XLCA Insured) | | | 265,000 | | | | 285,784 | |
Santa Clara County, CA East Side Union High School District General Obligation, Series B, 5.100%, 02/01/22 (National Insured) | | | 500,000 | | | | 535,335 | |
Santa Clara County, CA East Side Union High School District General Obligation, Series B, 5.250%, 02/01/24 (National Insured) | | | 40,000 | | | | 42,350 | |
Santa Clara County, CA Franklin-McKinley CA School District General Obligation, 5.000%, 07/01/15 (AGM Insured) | | | 40,000 | | | | 44,765 | |
Santa Rosa, CA High School District, Election 2002, 5.000%, 08/01/19 (National Insured) | | | 100,000 | | | | 105,443 | |
Sierra Sands, CA Unified School District General Obligation, Series A, 5.000%, 11/01/22 (FGIC Insured) | | | 50,000 | | | | 53,327 | |
Sierra, CA Joint Community College District, Election 2004, Series B, 5.000%, 08/01/24 (National Insured) | | | 100,000 | | | | 106,768 | |
Sierra, CA Joint Community College District, Election 2004, 5.000%, 08/01/25 (National Insured) | | | 100,000 | | | | 105,673 | |
Solano County, CA Community College District, 4.000%, 08/01/15 (National Insured) | | | 25,000 | | | | 27,742 | |
Solano County, CA Community College District, 5.000%, 08/01/16 (National Insured) | | | 40,000 | | | | 46,031 | |
Sonoma County, CA Junior College District General Obligation, Series D, 5.000%, 08/01/16 | | | 15,000 | | | | 17,537 | |
Southern California Public Power Authority Revenue, Series B, 5.750%, 07/01/24 | | | 75,000 | | | | 87,899 | |
State of California, 5.000%, 04/01/14 | | | 15,000 | | | | 16,723 | |
State of California General Obligation, 5.000%, 02/01/29 | | | 15,000 | | | | 15,867 | |
State of California General Obligation, 5.000%, 02/01/32 | | | 50,000 | | | | 52,890 | |
State of California General Obligation, 5.000%, 02/01/32 (CIFG Insured) | | | 25,000 | | | | 26,397 | |
Sweetwater, CA Authority Revenue, 5.000%, 04/01/17 (AMBAC Insured) | | | 50,000 | | | | 56,167 | |
Tahoe-Truckee, CA Unified School District General, 5.500%, 08/01/19 (National Insured) | | | 75,000 | | | | 90,155 | |
Tracy, CA Joint Unified School District General Obligation, Election 2006, 5.000%, 08/01/25 (Assured Guaranty) | | | 100,000 | | | | 106,987 | |
University of California, Revenue Bonds, Series Q, 5.000%, 09/01/11 (AGM Insured) | | | 55,000 | | | | 57,084 | |
University of California, Revenue Bonds, Series Q, 5.000%, 09/01/33 (AGM Insured) | | | 20,000 | | | | 20,978 | |
Vacaville, CA Unified School District, Election 2001, 5.000%, 08/01/16 (National Insured) | | | 120,000 | | | | 134,308 | |
Vacaville, CA Unified School District General Obligation, Election 2001, 4.600%, 08/01/17 (AGM Insured) | | | 25,000 | | | | 27,071 | |
Vacaville, CA Unified School District General Obligation, Election 2001, 5.000%, 08/01/17 (National Insured) | | | 40,000 | | | | 44,333 | |
Vacaville, CA Unified School District General Obligation, Election 2001, 5.000%, 08/01/22 (AGM Insured) | | | 20,000 | | | | 21,796 | |
Vacaville, CA Unified School District General Obligation, Election 2001, 5.000%, 08/01/22 (National Insured) | | | 15,000 | | | | 16,009 | |
Vacaville, CA Unified School District General Obligation, Election 2001, 5.000%, 08/01/25 (AMBAC Insured) | | | 130,000 | | | | 136,201 | |
Vacaville, CA Unified School District General Obligation, Election 2001, 5.000%, 08/01/25 (National Insured) | | | 220,000 | | | | 230,571 | |
Vacaville, CA Unified School District General Obligation, Election 2001, 5.000%, 08/01/26 (National Insured) | | | 55,000 | | | | 57,570 | |
Vacaville, CA Unified School District General Obligation, Election 2001, 5.000%, 08/01/26 (AMBAC Insured) | | | 30,000 | | | | 31,288 | |
Val Verde, CA Unified School District General Obligation, Election 2008, Series A, 5.500%, 08/01/22 | | | 100,000 | | | | 111,662 | |
Val Verde, CA Unified School District General Obligation, Election 2008, Series A, 5.500%, 08/01/24 | | | 615,000 | | | | 675,879 | |
The accompanying notes are an integral part of these financial statements.
49
Managers California Intermediate Tax-Free Fund
Schedule of Portfolio Investments (continued)
| | | | | | | | |
| | | Principal Amount | | | Value | |
Municipal Bonds - 97.2% (continued) | | | | | | | | |
Walnut, CA Energy Center Authority Revenue, Series A, 5.000%, 01/01/12 (AMBAC Insured) | | $ | 155,000 | | | $ | 162,266 | |
Wiseburn, CA School District, Class A, 5.000%, 08/01/16 (National Insured) | | | 75,000 | | | | 86,123 | |
Yosemite, CA Community College District General Obligation, Election 2004, Series A, 5.000%, 08/01/22 (FGIC Insured) | | | 515,000 | | | | 559,022 | |
Yuba, CA Community College District General Obligation, Election 2006, Series A, 5.000%, 08/01/23 (AMBAC Insured) | | | 90,000 | | | | 96,367 | |
Yuba, CA Community College District General Obligation, Election 2006, Series A, 5.000%, 08/01/24 (AMBAC Insured) | | | 25,000 | | | | 26,615 | |
Total Municipal Bonds
(cost $29,195,358) | | | | | | | 30,438,935 | |
| | |
| | | Shares | | | | |
Short-Term Investments - 1.7%1 | | | | | | | | |
BlackRock Liquidity Funds, Institutional Class Shares - California Money Fund, 0.22% (cost $547,437) | | | 547,437 | | | | 547,437 | |
Total Investments - 98.9%
(cost $29,742,795)2 | | | | | | | 30,986,372 | |
Other Assets, less Liabilities - 1.1% | | | | | | | 328,964 | |
Net Assets - 100.0% | | | | | | $ | 31,315,336 | |
Note: Based on the approximate cost of investments of $29,742,795 for Federal income tax purposes at October 31, 2010, the aggregate gross unrealized appreciation and depreciation were $1,255,609 and $12,032, respectively, resulting in net unrealized appreciation of investments of $1,243,577.
| 1 | Yield shown for each investment company represents the October 31, 2010, seven-day average yield, which refers to the sum of the previous seven days’ dividends paid, expressed as an annual percentage. |
| 2 | At October 31, 2010, the concentration of the Fund’s investments by state or territory determined as a percentage of net assets was as follows: California 94.6% and Puerto Rico 2.6%. At October 31, 2010, 82.4% of the securities in the portfolio were backed by insurance of financial institutions and financial guaranty assurance agencies. Insurers with a concentration greater than 10% of net assets were as follows: National Insured 38.8%, FGIC 21.3%, and AGM 11.4%. |
The following table summarizes the inputs used to value the Fund’s net assets by the fair value hierarchy levels as of October 31, 2010. (See Note 1(a) in the Notes to Financial Statements.)
| | | | | | | | | | | | | | | | |
| | | Quoted Prices
in Active
Markets for
Identical
Investments
Level 1 | | | Significant
Other
Observable
Inputs
Level 2 | | | Significant
Unobservable
Inputs
Level 3 | | | Total | |
Investments in Securities | | | | | | | | | | | | | | | | |
Municipal Bonds† | | | — | | | $ | 30,438,935 | | | | — | | | $ | 30,438,935 | |
Short-Term Investments | | $ | 547,437 | | | | — | | | | — | | | | 547,437 | |
| | | | | | | | | | | | | | | | |
Total Investments in Securities | | $ | 547,437 | | | $ | 30,438,935 | | | | — | | | $ | 30,986,372 | |
| | | | | | | | | | | | | | | | |
| † | All municipal bonds held in the Fund are Level 2 securities; please refer to the Schedule of Portfolio Investments. |
As of October 31, 2010, the Fund had no significant transfers between Level 1 and Level 2 from the beginning of the reporting period.
Investment Definitions and Abbreviations:
| | |
| AMBAC: | | American Municipal Bond Assurance Corp. |
| AGM: | | Assured Guaranty Municipal Corp. |
| CIFG: | | CIFG, NA |
| FGIC: | | Financial Guaranty Insurance Corp. |
| FSA: | | FSA Capital, Inc. |
| National: | | National Public Finance Guarantee Corp. |
| XLCA: | | XL Capital Assurance, Inc. |
The accompanying notes are an integral part of these financial statements.
50
Statements of Assets and Liabilities
October 31, 2010
| | | | | | | | |
| | | Managers Frontier
Small Cap
Growth Fund | | | Managers AMG
TSCM Growth
Equity Fund | |
Assets: | | | | | | | | |
Investments at value*
(including securities on loan valued at $947,664 and $0, respectively) | | $ | 31,556,976 | | | $ | 1,094,840 | |
Receivable for investments sold | | | 355,530 | | | | 25,845 | |
Receivable for Fund shares sold | | | 8,654 | | | | — | |
Dividends, interest and other receivables | | | 9,453 | | | | 692 | |
Receivable from affiliate | | | 9,040 | | | | 12,965 | |
Prepaid expenses | | | 22,918 | | | | 28,112 | |
Total assets | | | 31,962,571 | | | | 1,162,454 | |
Liabilities: | | | | | | | | |
Payable upon return of securities loaned | | | 981,432 | | | | — | |
Payable for investments purchased | | | 460,314 | | | | 8,984 | |
Payable for Fund shares repurchased | | | 200 | | | | — | |
Accrued expenses: | | | | | | | | |
Investment management and advisory fees | | | 25,276 | | | | 12,965 | |
Distribution fees - Investor Class | | | 82 | | | | 7 | |
Other | | | 48,750 | | | | 53,107 | |
Total liabilities | | | 1,516,054 | | | | 75,063 | |
Net Assets | | $ | 30,446,517 | | | $ | 1,087,391 | |
Net Assets Represent: | | | | | | | | |
Paid-in capital | | $ | 25,915,521 | | | $ | 990,243 | |
Undistributed net investment income | | | — | | | | 728 | |
Accumulated net realized loss from investments | | | (258,013 | ) | | | (1,312 | ) |
Net unrealized appreciation of investments | | | 4,789,009 | | | | 97,732 | |
Net Assets | | $ | 30,446,517 | | | $ | 1,087,391 | |
Investor Class Shares - Net Assets | | $ | 406,285 | | | $ | 13,887 | |
Shares outstanding | | | 24,335 | | | | 1,270 | |
Net asset value, offering and redemption price per share | | $ | 16.70 | | | $ | 10.93 | |
Service Class Shares - Net Assets | | $ | 18,290,110 | | | $ | 10,936 | |
Shares outstanding | | | 1,094,187 | | | | 1,000 | |
Net asset value, offering and redemption price per share | | $ | 16.72 | | | $ | 10.94 | |
Institutional Class Shares - Net Assets | | $ | 11,750,122 | | | $ | 1,062,568 | |
Shares outstanding | | | 701,717 | | | | 97,098 | |
Net asset value, offering and redemption price per share | | $ | 16.74 | | | $ | 10.94 | |
* Investments at cost | | $ | 26,767,967 | | | $ | 997,108 | |
The accompanying notes are an integral part of these financial statements.
51
Statements of Assets and Liabilities
October 31, 2010
| | | | | | | | | | | | | | | | |
| | | Managers
Micro-Cap Fund | | | Managers
Institutional
Micro-Cap Fund | | | Managers
Real Estate
Securities Fund | | | Managers California
Intermediate
Tax-Free Fund | |
Assets: | | | | | | | | | | | | | | | | |
Investments at value* (including securities on loan valued at $485,563, $102,772, $0, $0, respectively) | | $ | 135,234,165 | | | $ | 23,278,624 | | | $ | 23,756,768 | | | $ | 30,986,372 | |
Receivable for investments sold | | | 2,061,195 | | | | 247,451 | | | | 335,718 | | | | — | |
Receivable for Fund shares sold | | | 16,325 | | | | 24,790 | | | | 163,679 | | | | — | |
Dividends, interest and other receivables | | | 32,576 | | | | 5,211 | | | | 22,518 | | | | 400,819 | |
Receivable from affiliate | | | 24,603 | | | | 8,755 | | | | 2,787 | | | | 12,016 | |
Prepaid expenses | | | 13,171 | | | | 12,820 | | | | 5,030 | | | | 532 | |
Total assets | | | 137,382,035 | | | | 23,577,651 | | | | 24,286,500 | | | | 31,399,739 | |
Liabilities: | | | | | | | | | | | | | | | | |
Payable upon return of securities loaned | | | 509,000 | | | | 108,000 | | | | — | | | | — | |
Payable for investments purchased | | | 950,034 | | | | 128,019 | | | | 412,317 | | | | — | |
Payable for Fund shares repurchased | | | 75,703 | | | | 18,282 | | | | 7,382 | | | | 195 | |
Dividends payable to shareholders | | | — | | | | — | | | | — | | | | 14,525 | |
Accrued expenses: | | | | | | | | | | | | | | | | |
Investment management and advisory fees | | | 113,239 | | | | 19,368 | | | | 16,713 | | | | 12,016 | |
Administrative fees | | | 28,310 | | | | 4,842 | | | | 4,915 | | | | 5,058 | |
Other | | | 136,155 | | | | 49,539 | | | | 58,084 | | | | 52,609 | |
Total liabilities | | | 1,812,441 | | | | 328,050 | | | | 499,411 | | | | 84,403 | |
Net Assets | | $ | 135,569,594 | | | $ | 23,249,601 | | | $ | 23,787,089 | | | $ | 31,315,336 | |
Net Assets Represent: | | | | | | | | | | | | | | | | |
Paid-in capital | | $ | 124,189,142 | | | $ | 22,229,762 | | | $ | 25,324,916 | | | $ | 30,486,110 | |
Undistributed net investment income (loss) | | | 1,568 | | | | 241 | | | | 89,485 | | | | (1,576 | ) |
Accumulated net realized loss from investments | | | (17,495,509 | ) | | | (4,016,605 | ) | | | (6,258,762 | ) | | | (412,775 | ) |
Net unrealized appreciation of investments | | | 28,874,393 | | | | 5,036,203 | | | | 4,631,450 | | | | 1,243,577 | |
Net Assets | | $ | 135,569,594 | | | $ | 23,249,601 | | | $ | 23,787,089 | | | $ | 31,315,336 | |
Shares outstanding | | | 4,056,063 | | | | 2,197,079 | | | | 2,931,237 | | | | 2,921,000 | |
Net asset value, offering and redemption price per share | | $ | 33.42 | | | $ | 10.58 | | | $ | 8.12 | | | $ | 10.72 | |
* Investments at cost | | $ | 106,359,772 | | | $ | 18,242,421 | | | $ | 19,125,318 | | | $ | 29,742,795 | |
The accompanying notes are an integral part of these financial statements.
52
Statements of Operations
For the fiscal year ended October 31, 2010
| | | | | | | | | | | | | | | | | | | | | | | | |
| | | Managers
Frontier Small
Cap Growth
Fund | | | Managers AMG
TSCM Growth
Equity Fund* | | | Managers
Micro-Cap
Fund | | | Managers
Institutional
Micro-Cap
Fund | | | Managers
Real Estate
Securities Fund | | | Managers
California
Intermediate
Tax-Free
Fund | |
Investment Income: | | | | | | | | | | | | | | | | | | | | | | | | |
Dividend income | | $ | 177,656 | | | $ | 2,918 | | | $ | 866,335 | | | $ | 157,609 | | | $ | 488,860 | | | | — | |
Interest income | | | 27 | | | | — | | | | 276 | | | | 19 | | | | 24 | | | $ | 1,162,388 | |
Foreign withholding tax | | | (318 | ) | | | — | | | | — | | | | — | | | | — | | | | — | |
Securities lending fees | | | 1,692 | | | | — | | | | 6,913 | | | | 1,129 | | | | — | | | | — | |
Total investment income | | | 179,057 | | | | 2,918 | | | | 873,524 | | | | 158,757 | | | | 488,884 | | | | 1,162,388 | |
Expenses: | | | | | | | | | | | | | | | | | | | | | | | | |
Investment management and advisory fees | | | 299,371 | | | | 2,063 | | | | 1,319,280 | | | | 244,218 | | | | 159,180 | | | | 120,992 | |
Administrative fees | | | 15,166 | | | | 688 | | | | 329,820 | | | | 61,054 | | | | 46,818 | | | | 77,493 | |
Distribution Fees - Investor Class | | | 351 | | | | 7 | | | | N/A | | | | N/A | | | | N/A | | | | N/A | |
Transfer agent | | | 63,449 | | | | 170 | | | | 407,408 | | | | 8,087 | | | | 37,535 | | | | 5,661 | |
Professional fees | | | 35,443 | | | | 15,495 | | | | 47,367 | | | | 27,493 | | | | 38,829 | | | | 30,752 | |
Registration fees | | | 38,983 | | | | 18,515 | | | | 22,985 | | | | 20,469 | | | | 23,238 | | | | 6,499 | |
Custodian | | | 21,619 | | | | 1,855 | | | | 64,301 | | | | 30,185 | | | | 15,543 | | | | 47,052 | |
Trustees fees and expenses | | | 2,202 | | | | 212 | | | | 10,593 | | | | 1,950 | | | | 1,324 | | | | 2,350 | |
Reports to shareholders | | | 5,142 | | | | 1,161 | | | | 61,029 | | | | 11,119 | | | | 11,809 | | | | 3,070 | |
Miscellaneous | | | 4,157 | | | | 387 | | | | 7,333 | | | | 1,311 | | | | 1,252 | | | | 2,199 | |
Total expenses before offsets | | | 485,883 | | | | 40,553 | | | | 2,270,116 | | | | 405,886 | | | | 335,528 | | | | 296,068 | |
Expense reimbursements | | | (92,681 | ) | | | (38,363 | ) | | | (266,870 | ) | | | (85,108 | ) | | | (54,573 | ) | | | (125,527 | ) |
Expense reductions | | | (53 | ) | | | — | | | | (24,883 | ) | | | (5,867 | ) | | | (2,476 | ) | | | (54 | ) |
Net expenses | | | 393,149 | | | | 2,190 | | | | 1,978,363 | | | | 314,911 | | | | 278,479 | | | | 170,487 | |
Net investment income (loss) | | | (214,092 | ) | | | 728 | | | | (1,104,839 | ) | | | (156,154 | ) | | | 210,405 | | | | 991,901 | |
Net Realized and Unrealized Gain (Loss): | | | | | | | | | | | | | | | | | | | | | | | | |
Net realized gain (loss) on investments | | | 1,807,400 | | | | (1,312 | ) | | | 8,053,879 | | | | 1,225,691 | | | | 3,547,200 | | | | 35,518 | |
Net change in unrealized appreciation of investments | | | 5,623,078 | | | | 97,732 | | | | 24,521,471 | | | | 4,684,980 | | | | 2,882,384 | | | | 897,302 | |
Net realized and unrealized gain | | | 7,430,478 | | | | 96,420 | | | | 32,575,350 | | | | 5,910,671 | | | | 6,429,584 | | | | 932,820 | |
Net increase in net assets resulting from operations | | $ | 7,216,386 | | | $ | 97,148 | | | $ | 31,470,511 | | | $ | 5,754,517 | | | $ | 6,639,989 | | | $ | 1,924,721 | |
| * | Commenced operations on July 30, 2010. |
The accompanying notes are an integral part of these financial statements.
53
Statements of Changes in Net Assets
For the fiscal year ended October 31,
| | | | | | | | | | | | | | | | | | | | |
| | | Managers Frontier
Small Cap Growth Fund | | | Managers AMG
TSCM Growth
Equity Fund | | | Managers
Micro-Cap Fund | |
| | | 2010 | | | 2009 | | | 2010* | | | 2010 | | | 2009 | |
Increase (Decrease) in Net Assets From Operations: | | | | | | | | | | | | | | | | | | | | |
Net investment income (loss) | | | ($214,092 | ) | | | ($386,570 | ) | | $ | 728 | | | | ($1,104,839 | ) | | | ($1,071,787 | ) |
Net realized gain (loss) on investments | | | 1,807,400 | | | | 697,620 | | | | (1,312 | ] | | | 8,053,879 | | | | (21,757,590 | ) |
Net change in unrealized appreciation of investments | | | 5,623,078 | | | | 4,928,468 | | | | 97,732 | | | | 24,521,471 | | | | 34,913,102 | |
Net increase in net assets resulting from operations | | | 7,216,386 | | | | 5,239,518 | | | | 97,148 | | | | 31,470,511 | | | | 12,083,725 | |
Distributions to Shareholders: | | | | | | | | | | | | | | | | | | | | |
From net investment income | | | — | | | | — | | | | — | | | | — | | | | — | |
From net realized gain on investments | | | — | | | | — | | | | — | | | | — | | | | (7,917,520 | ) |
Total distributions to shareholders | | | — | | | | — | | | | — | | | | — | | | | (7,917,520 | ) |
From Capital Share Transactions: | | | | | | | | | | | | | | | | | | | | |
Proceeds from sale of shares | | | 12,220,563 | | | | 7,633,128 | | | | 1,090,343 | | | | 3,601,646 | | | | 3,765,447 | |
Reinvestment of dividends and distributions | | | — | | | | — | | | | — | | | | — | | | | 7,785,548 | |
Cost of shares repurchased | | | (28,526,838 | ) | | | (24,393,560 | ) | | | (100,100 | ) | | | (26,824,668 | ) | | | (20,818,945 | ) |
Net increase (decrease) from capital share transactions | | | (16,306,275 | ) | | | (16,760,432 | ) | | | 990,243 | | | | (23,223,022 | ) | | | (9,267,950 | ) |
Total increase (decrease) in net assets | | | (9,089,889 | ) | | | (11,520,914 | ) | | | 1,087,391 | | | | 8,247,489 | | | | (5,101,745 | ) |
Net Assets: | | | | | | | | | | | | | | | | | | | | |
Beginning of year | | | 39,536,406 | | | | 51,057,320 | | | | — | | | | 127,322,105 | | | | 132,423,850 | |
End of year | | $ | 30,446,517 | | | $ | 39,536,406 | | | $ | 1,087,391 | | | $ | 135,569,594 | | | $ | 127,322,105 | |
End of year undistributed net investment income | | | — | | | | — | | | $ | 728 | | | $ | 1,568 | | | $ | 2,839 | |
| | | | | | | | | | | | | | | | | | | | |
Share Transactions: | | | | | | | | | | | | | | | | | | | | |
Sale of shares | | | 820,435 | 1 | | | 695,597 | | | | 108,700 | 1 | | | 120,296 | | | | 161,725 | |
Reinvestment of dividends and distributions | | | — | | | | — | | | | — | | | | — | | | | 362,624 | |
Shares repurchased | | | (1,945,580 | )1 | | | (2,116,995 | ) | | | (9,332 | )1 | | | (893,039 | ) | | | (907,457 | ) |
Net increase (decrease) in shares | | | (1,125,145 | )1 | | | (1,421,398 | ) | | | 99,368 | 1 | | | (772,743 | ) | | | (383,108 | ) |
| * | Commenced operations on July 30, 2010. |
| 1 | See note 1(g) of the Notes to Financial Statements. |
The accompanying notes are an integral part of these financial statements.
54
Statements of Changes in Net Assets
For the fiscal year ended October 31,
| | | | | | | | | | | | | | | | | | | | | | | | |
| | | Managers
Institutional Micro-Cap Fund | | | Managers
Real Estate Securities Fund | | | Managers California Intermediate
Tax-Free Fund | |
| | | 2010 | | | 2009 | | | 2010 | | | 2009 | | | 2010 | | | 2009 | |
Increase (Decrease) in Net Assets From Operations: | | | | | | | | | | | | | | | | | | | | | | | | |
Net investment income (loss) | | | ($156,154 | ) | | | ($152,663 | ) | | $ | 210,405 | | | $ | 260,542 | | | $ | 991,901 | | | $ | 984,709 | |
Net realized gain (loss) on investments | | | 1,225,691 | | | | (3,953,858 | ) | | | 3,547,200 | | | | (7,01,780 | ) | | | 35,518 | | | | 250,408 | |
Net change in unrealized appreciation of investments | | | 4,684,980 | | | | 6,146,351 | | | | 2,882,384 | | | | 7,821,113 | | | | 897,302 | | | | 1,516,580 | |
Net increase in net assets resulting from operations | | | 5,754,517 | | | | 2,039,830 | | | | 6,639,989 | | | | 1,019,875 | | | | 1,924,721 | | | | 2,751,697 | |
Distributions to Shareholders: | | | | | | | | | | | | | | | | | | | | | | | | |
From net investment income | | | — | | | | — | | | | (195,055 | ) | | | (299,371 | ) | | | (991,896 | ) | | | (984,686 | ) |
From net realized gain on investments | | | — | | | | (3,256,607 | ) | | | — | | | | — | | | | — | | | | — | |
Total distributions to shareholders | | | — | | | | (3,256,607 | ) | | | (195,055 | ) | | | (299,371 | ) | | | (991,896 | ) | | | (984,686 | ) |
From Capital Share Transactions: | | | | | | | | | | | | | | | | | | | | | | | | |
Proceeds from sale of shares | | | 3,228,476 | | | | 5,097,840 | | | | 9,003,122 | | | | 4,960,375 | | | | 3,180,468 | | | | 3,316,692 | |
Reinvestment of dividends and distributions | | | — | | | | 3,131,896 | | | | 191,341 | | | | 294,105 | | | | 525,318 | | | | 807,882 | |
Cost of shares repurchased | | | (9,495,816 | ) | | | (10,009,632 | ) | | | (6,378,675 | ) | | | (3,814,439 | ) | | | (4,504,131 | ) | | | (7,665,822 | ) |
Net increase (decrease) from capital share transactions | | | (6,267,340 | ) | | | (1,779,896 | ) | | | 2,815,788 | | | | 1,440,041 | | | | (798,345 | ) | | | (3,541,248 | ) |
Total increase (decrease) in net assets | | | (512,823 | ) | | | (2,996,673 | ) | | | 9,260,722 | | | | 2,160,545 | | | | 134,480 | | | | (1,774,237 | ) |
Net Assets: | | | | | | | | | | | | | | | | | | | | | | | | |
Beginning of year | | | 23,762,424 | | | | 26,759,097 | | | | 14,526,367 | | | | 12,365,822 | | | | 31,180,856 | | | | 32,955,093 | |
End of year | | $ | 23,249,601 | | | $ | 23,762,424 | | | $ | 23,787,089 | | | $ | 14,526,367 | | | $ | 31,315,336 | | | $ | 31,180,856 | |
End of year undistributed net investment income (loss) | | $ | 241 | | | $ | 371 | | | $ | 89,485 | | | $ | 45,121 | | | | ($1,576 | ) | | | ($1,581 | ) |
| | | | | | | | | | | | | | | | | | | | | | | | |
Share Transactions: | | | | | | | | | | | | | | | | | | | | | | | | |
Sale of shares | | | 338,471 | | | | 686,426 | | | | 1,248,965 | | | | 1,139,096 | | | | 300,261 | | | | 326,236 | |
Reinvestment of dividends and distributions | | | — | | | | 463,985 | | | | 27,361 | | | | 64,678 | | | | 49,707 | | | | 78,990 | |
Shares repurchased | | | (1,013,229 | ) | | | (1,376,996 | ) | | | (901,249 | ) | | | (875,731 | ) | | | (425,846 | ) | | | (757,169 | ) |
Net increase (decrease) in shares | | | (674,758 | ) | | | (226,585 | ) | | | 375,077 | | | | 328,043 | | | | (75,878 | ) | | | (351,943 | ) |
The accompanying notes are an integral part of these financial statements.
55
Financial Highlights
For a share outstanding throughout the fiscal period
| | | | | | | | | | | | | | | | | | | | |
| | | For the fiscal year ended October 31, | |
Managers Frontier Small Cap Growth Fund - Service Class* | | 2010 | | | 2009 | | | 2008 | | | 2007 | | | 2006 | |
Net Asset Value, Beginning of Year | | $ | 13.42 | | | $ | 11.69 | | | $ | 17.87 | | | $ | 15.47 | | | $ | 12.90 | |
Income from Investment Operations: | | | | | | | | | | | | | | | | | | | | |
Net investment loss | | | (0.12 | )3 | | | (0.10 | )3 | | | (0.1 2 | )3 | | | (0.11 | )3 | | | (0.12 | )3 |
Net realized and unrealized gain (loss) on investments | | | 3.42 | 3 | | | 1.83 | 3 | | | (6.06 | )3 | | | 2.51 | 3 | | | 2.69 | 3 |
Total from investment operations | | | 3.30 | | | | 1.73 | | | | (6.18 | ) | | | 2.40 | | | | 2.57 | |
Net Asset Value, End of Year | | $ | 16.72 | | | $ | 13.42 | | | $ | 11.69 | | | $ | 17.87 | | | $ | 15.47 | |
Total Return1 | | | 24.59 | % | | | 14.80 | % | | | (34.58 | )% | | | 15.51 | % | | | 19.92 | % |
Ratio of net expenses to average net assets | | | 1.37 | % | | | 1.46 | % | | | 1.41 | % | | | 1.39 | % | | | 1.38 | % |
Ratio of net investment loss to average net assets1 | | | (0.78 | )% | | | (0.90 | )% | | | (0.79 | )% | | | (0.68 | )% | | | (0.84 | )% |
Portfolio turnover | | | 52 | % | | | 136 | % | | | 59 | % | | | 49 | % | | | 49 | % |
Net assets at end of year (000’s omitted) | | $ | 18,290 | | | $ | 39,536 | | | $ | 51,057 | | | $ | 87,015 | | | $ | 87,015 | |
| | | | | | | | | | | | | | | | | | | | |
Ratios absent expense offsets:2 | | | | | | | | | | | | | | | | | | | | |
Ratio of total expenses to average net assets | | | 1.66 | % | | | 1.50 | % | | | 1.43 | % | | | 1.41 | % | | | 1.42 | % |
Ratio of net investment loss to average net assets | | | (1.07 | )% | | | (0.94 | )% | | | (0.80 | )% | | | (0.70 | )% | | | (0.88 | )% |
| | | | | | | | | | | | | | | | | | | | |
| | | | |
Managers Frontier Small Cap Growth Fund Investor Class Shares* | | For the fiscal
period ended
October 31, 2010 | |
Net Asset Value, Beginning of Period | | $ | 14.64 | |
Income from Investment Operations: | | | | |
Net investment loss | | | (0.11 | )3 |
Net realized and unrealized gain on investments | | | 2.17 | 3 |
Total from investment operations | | | 2.06 | |
Net Asset Value, End of Period | | $ | 16.70 | |
Total Return1 | | | 14.07 | %5 |
Ratio of net expenses to average net assets | | | 1.55 | %6 |
Ratio of net investment loss to average net assets1 | | | (0.91 | )%6 |
Portfolio turnover | | | 52 | %5 |
Net assets at end of period (000’s omitted) | | $ | 406 | |
| | | | |
Ratios absent expense offsets:2 | | | | |
Ratio of total expenses to average net assets | | | 1.94 | %6 |
Ratio of net investment loss to average net assets | | | (1.30 | )%6 |
| | | | |
| | | | |
Managers Frontier Small Cap Growth Fund Investor Class Shares* | | For the fiscal
period ended
October 31, 2010 | |
Net Asset Value, Beginning of Period | | $ | 14.64 | |
Income from Investment Operations: | | | | |
Net investment loss | | | (0.05 | )3 |
Net realized and unrealized gain on investments | | | 2.15 | 3 |
Total from investment operations | | | 2.10 | |
Net Asset Value, End of Period | | $ | 16.74 | |
Total Return1 | | | 14.34 | %5 |
Ratio of net expenses to average net assets | | | 1.05 | %6 |
Ratio of net investment loss to average net assets1 | | | (0.41 | )%6 |
Portfolio turnover | | | 52 | %5 |
Net assets at end of period (000’s omitted) | | $ | 11,750 | |
| | | | |
Ratios absent expense offsets:2 | | | | |
Ratio of total expenses to average net assets | | | 1.44 | %6 |
Ratio of net investment loss to average net assets | | | (0.80 | )%6 |
| | | | |
56
Financial Highlights
For a share outstanding throughout each fiscal period
| | | | |
Managers AMG TSCM Growth Equity Fund - Investor Class ** | | For the fiscal
period ended
October 31, 2010 | |
Net Asset Value, Beginning of Period | | $ | 10.00 | |
Income from Investment Operations: | | | | |
Net investment loss | | | (0.00 | )#,3 |
Net realized and unrealized gain on investments | | | 0.93 | 3 |
Total from investment operations | | | 0.93 | |
Net Asset Value, End of Period | | $ | 10.93 | |
Total Return1 | | | 9.30 | %5 |
Ratio of net expenses to average net assets | | | 1.17 | %6 |
Ratio of net investment loss to average net assets1 | | | (0.11 | )%6 |
Portfolio turnover | | | 50 | %5 |
Net assets at end of period (000’s omitted) | | $ | 14 | |
| | | | |
Ratios absent expense offsets:2 | | | | |
Ratio of total expenses to average net assets | | | 15.15 | %6 |
Ratio of net investment loss to average net assets | | | (14.09 | )%6 |
| | | | |
| | | | |
Managers AMG TSCM Growth Equity Fund - Institutional Class ** | | For the fiscal
period ended
October 31, 2010 | |
Net Asset Value, Beginning of Period | | $ | 10.00 | |
Income from Investment Operations: | | | | |
Net investment income | | | 0.01 | 3 |
Net realized and unrealized gain on investments | | | 0.93 | 3 |
Total from investment operations | | | 0.94 | |
Net Asset Value, End of Period | | $ | 10.94 | |
Total Return1 | | | 9.40 | %5 |
Ratio of net expenses to average net assets | | | 0.79 | %6 |
Ratio of net investment income to average net assets1 | | | 0.27 | %6 |
Portfolio turnover | | | 50 | %5 |
Net assets at end of period (000’s omitted) | | $ | 1,063 | |
| | | | |
Ratios absent expense offsets:2 | | | | |
Ratio of total expenses to average net assets | | | 14.74 | %6 |
Ratio of net investment loss to average net assets | | | (13.68 | )%6 |
| | | | |
| | | | |
Managers AMG TSCM Growth Equity Fund - Service Class ** | | For the fiscal
period ended
October 31, 2010 | |
Net Asset Value, Beginning of Period | | $ | 10.00 | |
Income from Investment Operations: | | | | |
Net investment income | | | 0.00 | #,3 |
Net realized and unrealized gain on investments | | | 0.94 | 3 |
Total from investment operations | | | 0.94 | |
Net Asset Value, End of Period | | $ | 10.94 | |
Total Return1 | | | 9.40 | %5 |
Ratio of net expenses to average net assets | | | 1.03 | %6 |
Ratio of net investment income to average net assets1 | | | 0.00 | %#,6 |
Portfolio turnover | | | 50 | %5 |
Net assets at end of period (000’s omitted) | | $ | 11 | |
| | | | |
Ratios absent expense offsets:2 | | | | |
Ratio of total expenses to average net assets | | | 15.00 | %6 |
Ratio of net investment loss to average net assets | | | (13.97 | )%6 |
| | | | |
57
Financial Highlights
For a share outstanding throughout each fiscal year
| | | | | | | | | | | | | | | | | | | | |
| | | For the fiscal year ended October 31, | |
Managers Micro-Cap Fund | | 2010 | | | 2009 | | | 2008 | | | 2007 | | | 2006 | |
Net Asset Value, Beginning of Year | | $ | 26.37 | | | $ | 25.41 | | | $ | 41.90 | | | $ | 34.48 | | | $ | 29.65 | |
Income from Investment Operations: | | | | | | | | | | | | | | | | | | | | |
Net investment loss | | | (0.25 | )3 | | | (0.21 | )3 | | | (0.31 | )3 | | | (0.37 | )3 | | | (0.26 | )3 |
Net realized and unrealized gain (loss) on investments | | | 7.30 | 3 | | | 2.73 | 3 | | | (16.18 | )3 | | | 7.79 | 3 | | | 5.09 | 3 |
Total from investment operations | | | 7.05 | | | | 2.52 | | | | (16.49 | ) | | | 7.42 | | | | 4.83 | |
Less Distribution to Shareholders from: | | | | | | | | | | | | | | | | | | | | |
Net realized gain on investments | | | — | | | | (1.56 | ) | | | — | | | | — | | | | — | |
Total distributions to shareholders | | | — | | | | (1.56 | ) | | | — | | | | — | | | | — | |
Net Asset Value End of Year | | $ | 33.42 | | | $ | 26.37 | | | $ | 25.41 | | | $ | 41.90 | | | $ | 34.48 | |
Total Return 1 | | | 26.73 | %4 | | | 11.34 | %4 | | | (39.37 | )% | | | 21.52 | %4 | | | 16.29 | % |
Ratio of net expenses to average net assets | | | 1.50 | % | | | 1.53 | % | | | 1.54 | % | | | 1.53 | % | | | 1.54 | % |
Ratio of net investment loss to average net assets1 | | | (0.84 | )% | | | (0.90 | )% | | | (0.92 | )% | | | (1.01 | )% | | | (0.79 | )% |
Portfolio turnover | | | 93 | % | | | 82 | % | | | 193 | % | | | 76 | % | | | 82 | % |
Net assets at end of year (000’s omitted) | | $ | 135,570 | | | $ | 127,322 | | | $ | 132,424 | | | $ | 271,934 | | | $ | 303,474 | |
| | | | | | | | | | | | | | | | | | | | |
Ratios absent expense offsets:2 | | | | | | | | | | | | | | | | | | | | |
Ratio of net expenses to average net assets | | | 1.72 | % | | | 1.75 | % | | | 1.66 | % | | | 1.53 | % | | | 1.54 | % |
Ratio of net investment loss to average net assets | | | (1.06 | )% | | | (1.12 | )% | | | (1.04 | )% | | | (1.01 | )% | | | (0.79 | )% |
58
Financial Highlights
For a share outstanding throughout each fiscal year
| | | | | | | | | | | | | | | | | | | | |
| | | For the fiscal year ended October 31, | |
Managers Institutional Micro-Cap Fund | | 2010 | | | 2009 | | | 2008 | | | 2007 | | | 2006 | |
Net Asset Value, Beginning of Year | | $ | 8.27 | | | $ | 8.64 | | | $ | 16.65 | | | $ | 15.07 | | | $ | 14.94 | |
Income from Investment Operations: | | | | | | | | | | | | | | | | | | | | |
Net investment loss | | | (0.06 | )3 | | | (0.05 | )3 | | | (0.10 | )3 | | | (0.13 | )3 | | | (0.09 | )3 |
Net realized and unrealized gain (loss) on investments | | | 2.37 | 3 | | | 0.79 | 3 | | | (5.87 | )3 | | | 2.99 | 3 | | | 2.36 | 3 |
Total from investment operations | | | 2.31 | | | | 0.74 | | | | (5.97 | ) | | | 2.86 | | | | 2.27 | |
Less Distributions to Shareholders from: | | | | | | | | | | | | | | | | | | | | |
Net investment income | | | — | | | | — | | | | — | | | | — | | | | — | |
Net realized gain on investments | | | — | | | | (1.11 | ) | | | (2.04 | ) | | | (1.28 | ) | | | (2.14 | ) |
Total distribution to shareholders | | | — | | | | (1.11 | ) | | | (2.04 | ) | | | (1.28 | ) | | | (2.14 | ) |
Net Asset Value End of Year | | $ | 10.58 | | | $ | 8.27 | | | $ | 8.64 | | | $ | 16.65 | | | $ | 15.07 | |
Total Return 1 | | | 27.93 | %4 | | | 11.44 | %4 | | | (40.45 | )% | | | 20.48 | % | | | 16.33 | % |
Ratio of net expenses to average net assets | | | 1.29 | % | | | 1.31 | % | | | 1.30 | % | | | 1.35 | % | | | 1.35 | % |
Ratio of net investment loss to average net assets1 | | | (0.64 | )% | | | (0.66 | )% | | | (0.74 | )% | | | (0.83 | )% | | | (0.83 | )% |
Portfolio turnover | | | 98 | % | | | 81 | % | | | 198 | % | | | 129 | % | | | 78 | % |
Net assets at end of year (000’s omitted) | | $ | 23,250 | | | $ | 23,762 | | | $ | 26,759 | | | $ | 141,223 | | | $ | 259,395 | |
| | | | | | | | | | | | | | | | | | | | |
Ratios absent expense offsets:2 | | | | | | | | | | | | | | | | | | | | |
Ratio of total expenses to average net assets | | | 1.66 | % | | | 1.67 | % | | | 1.55 | % | | | 1.39 | % | | | 1.37 | % |
Ratio of net investment loss to average net assets | | | (1.01 | )% | | | (1.02 | )% | | | (0.99 | )% | | | (0.87 | )% | | | (0.65 | )% |
| | | | | | | | | | | | | | | | | | | | |
59
Financial Highlights
For a share outstanding throughout each fiscal year
| | | | | | | | | | | | | | | | | | | | |
| | | For the fiscal year ended October 31, | |
Managers Real Estate Securities Fund | | 2010 | | | 2009 | | | 2008 | | | 2007 | | | 2006 | |
Net Asset Value, Beginning of Year | | $ | 5.68 | | | $ | 5.55 | | | $ | 12.57 | | | $ | 14.74 | | | $ | 12.86 | |
Income from Investment Operations: | | | | | | | | | | | | | | | | | | | | |
Net investment income | | | 0.08 | 3 | | | 0.12 | 3 | | | 0.13 | 3 | | | 0.06 | | | | 0.18 | |
Net realized and unrealized gain (loss) on investments | | | 2.43 | 3 | | | 0.16 | 3 | | | (4.06 | )3 | | | 0.22 | | | | 3.87 | |
Total from investment operations | | | 2.51 | | | | 0.28 | | | | (3.93 | ) | | | 0.28 | | | | 4.05 | |
Less Distributions to Shareholders from: | | | | | | | | | | | | | | | | | | | | |
Net investment income | | | (0.07 | ) | | | (0.15 | ) | | | (0.12 | ) | | | (0.10 | ) | | | (0.10 | ) |
Net realized gain on investments | | | — | | | | — | | | | (2.97 | ) | | | (2.35 | ) | | | (2.07 | ) |
Total distributions to shareholders | | | (0.07 | ) | | | (0.15 | ) | | | (3.09 | ) | | | (2.45 | ) | | | (2.17 | ) |
Net Asset Value, End of Year | | $ | 8.12 | | | $ | 5.68 | | | $ | 5.55 | | | $ | 12.57 | | | $ | 14.74 | |
Total Return 1 | | | 44.47 | % | | | 5.77 | % | | | (38.95 | )% | | | 2.10 | % | | | 36.43 | % |
Ratio of net expenses to average net assets | | | 1.49 | % | | | 1.48 | % | | | 1.48 | % | | | 1.40 | % | | | 1.46 | % |
Ratio of net investment income to average net assets1 | | | 1.12 | % | | | 2.56 | % | | | 1.63 | % | | | 0.82 | % | | | 0.97 | % |
Portfolio turnover | | | 99 | % | | | 107 | % | | | 127 | % | | | 126 | % | | | 69 | % |
Net assets at end of year (000’s omitted) | | $ | 23,787 | | | $ | 14,526 | | | $ | 12,366 | | | $ | 26,561 | | | $ | 27,624 | |
| | | | | | | | | | | | | | | | | | | | |
Ratios absent expense offsets:2 | | | | | | | | | | | | | | | | | | | | |
Ratio of total expenses to average net assets | | | 1.79 | % | | | 2.47 | % | | | 1.80 | % | | | 1.41 | % | | | 1.46 | % |
Ratio of net investment income to average net assets | | | 0.82 | % | | | 1.57 | % | | | 1.31 | % | | | 0.83 | % | | | 0.97 | % |
| | | | | | | | | | | | | | | | | | | | |
60
Financial Highlights
For a share outstanding throughout each fiscal year
| | | | | | | | | | | | | | | | | | | | |
| | | For the fiscal year ended October 31, | |
Managers California Intermediate Tax-Free Fund | | 2010 | | | 2009 | | | 2008 | | | 2007 | | | 2006 | |
Net Asset Value, Beginning of Year | | $ | 10.40 | | | $ | 9.84 | | | $ | 10.56 | | | $ | 10.75 | | | $ | 10.66 | |
Income from Investment Operations: | | | | | | | | | | | | | | | | | | | | |
Net investment income | | | 0.34 | | | | 0.32 | | | | 0.38 | | | | 0.40 | | | | 0.39 | |
Net realized and unrealized gain (loss) on investments | | | 0.32 | | | | 0.55 | | | | (0.56 | ) | | | (0.16 | ) | | | 0.25 | |
Total from investment operations | | | 0.66 | | | | 0.87 | | | | (0.18 | ) | | | 0.24 | | | | 0.64 | |
Less Distributions to Shareholders from: | | | | | | | | | | | | | | | | | | | | |
Net investment income | | | (0.34 | ) | | | (0.31 | ) | | | (0.38 | ) | | | (0.40 | ) | | | (0.40 | ) |
Net realized gain on investments | | | — | | | | — | | | | (0.16 | ) | | | (0.03 | ) | | | (0.15 | ) |
Total distributions to shareholders | | | (0.34 | ) | | | (0.31 | ) | | | (0.54 | ) | | | (0.43 | ) | | | (0.55 | ) |
Net Asset Value, End of Year | | $ | 10.72 | | | $ | 10.40 | | | $ | 9.84 | | | $ | 10.56 | | | $ | 10.75 | |
Total Return 1 | | | 6.41 | % | | | 8.97 | % | | | (1.82 | )% | | | 2.23 | % | | | 6.21 | % |
Ratio of net expenses to average net assets | | | 0.55 | % | | | 0.55 | % | | | 0.55 | % | | | 0.56 | % | | | 0.55 | % |
Ratio of net investment income to average net assets1 | | | 3.20 | % | | | 3.08 | % | | | 3.71 | % | | | 3.75 | % | | | 3.76 | % |
Portfolio turnover | | | 64 | % | | | 152 | % | | | 33 | % | | | 35 | % | | | 22 | % |
Net assets at end of year (000’s omitted) | | $ | 31,315 | | | $ | 31,181 | | | $ | 32,955 | | | $ | 35,982 | | | $ | 54,144 | |
| | | | | | | | | | | | | | | | | | | | |
Ratios absent expense offsets:2 | | | | | | | | | | | | | | | | | | | | |
Ratio of total expenses to average net assets | | | 0.96 | % | | | 0.86 | % | | | 0.80 | % | | | 0.82 | % | | | 0.82 | % |
Ratio of net investment income to average net assets | | | 2.79 | % | | | 2.77 | % | | | 3.46 | % | | | 3.49 | % | | | 3.49 | % |
| | | | | | | | | | | | | | | | | | | | |
| # | Rounds to less than $0.01 per share or 0.01%. |
| * | Effective January 1, 2010, existing shares of Managers Frontier Small Cap Growth Fund (formerly shares of Managers Small Cap Fund) were reclassified and redesignated as Service Class shares. Investor Class and Institutional Class shares commenced operations on January 1, 2010. |
| ** | Commenced operations on July 30, 2010. |
| 1 | Total returns and net investment income would have been lower had certain expenses not been reduced. (See Note 1(c) of Notes to Financial Statements.) |
| 2 | Excludes the impact of expense reimbursements or fee waivers and expense reductions such as brokerage credits, but includes non-reimbursable expenses, if any, such as interest and taxes. (See Note 1(c) of Notes to Financial Statements.) |
| 3 | Per share numbers have been calculated using average shares. |
| 4 | The Total Return is based on the Financial Statement Net Asset Values as shown above. |
61
Notes to Financial Statements
October 31, 2010
| 1. | Summary of Significant Accounting Policies |
Managers Trust I (the “Trust”) is an open-end management investment company organized as a Massachusetts business trust and registered under the Investment Company Act of 1940, as amended (the “1940 Act”). Currently, the Trust is comprised of a number of investment series. Included in this report are the Managers Frontier Small Cap Growth Fund (“Small Cap”) (formerly Managers Small Cap Fund), Managers Micro-Cap Fund (“Micro-Cap”) (formerly Managers Fremont Micro-Cap Fund), Managers Institutional Micro-Cap Fund (“Institutional Micro-Cap”) (formerly Managers Fremont Institutional Micro-Cap Fund), Managers Real Estate Securities Fund (“Real Estate Securities”), Managers California Intermediate Tax-Free Fund (“California Intermediate Tax-Free”), and Managers AMG TSCM Growth Equity Fund (“TSCM Growth Equity”), collectively the “Funds.” TSCM Growth Equity commenced operations on July 30, 2010.
Effective January 1, 2010, Small Cap added new classes of shares. Small Cap offers three classes of shares, Institutional, Service and Investor, each offering varying levels of shareholder servicing and / or 12b-1 fees. Legacy Small Cap shareholders became shareholders in the Institutional Class and Service Class.
Small Cap and TSCM Growth Equity each offers three classes of shares: Investor Class, Service Class, and Institutional Class. Each class represents an interest in the same assets of the Fund and the classes are identical except for class specific expenses related to shareholder activity. Each class has equal voting privileges except that each class has exclusive voting rights with respect to its services and/or distribution plan. Please refer to a current prospectus for additional information on each share class.
The Funds’ financial statements are prepared in accordance with accounting principles generally accepted in the United States of America, which require management to make estimates and assumptions that affect the reported amounts of assets and liabilities and disclosure of contingent assets and liabilities at the date of the financial statements and the reported amounts of income and expenses during the reporting periods. Actual results could differ from those estimates and such differences may be material. The following is a summary of significant accounting policies followed by the Funds in the preparation of their financial statements:
| a. | Valuation of Investments |
Equity securities traded on a domestic or international securities exchange are valued at the last quoted sale price, or, lacking any sales, at the last quoted bid price. Over-the-counter securities are valued at the Nasdaq Official Closing Price, if one is available. Lacking any sales, over-the-counter securities are valued at the last quoted bid price. The Funds’ investments are generally valued based on market quotations provided by third party pricing services approved by the Board of Trustees of the Funds. Under certain circumstances, the value of certain investments may be based on an evaluation of fair value, pursuant to procedures established by and under the general supervision of the Board of Trustees of the Trust. Each Fund may use the fair value of a portfolio security to calculate its NAV when, for example, (1) market quotations are not readily available because a portfolio security is not traded in a public market or the principal market in which the security trades is closed, (2) trading in a portfolio security is suspended and has not resumed before the Fund calculates its NAV, (3) a significant event affecting the value of a portfolio security is determined to have occurred between the time of the market quotation provided for a portfolio security and the time as of which the Fund calculates its NAV, (4) a security’s price has remained unchanged over a period of time (often referred to as a “stale price”), or (5) the Investment Manager determines that a market quotation is inaccurate. The Investment Manager monitors intervening events that may affect the value of securities held in each Fund’s portfolio and, in accordance with procedures adopted by the Funds’ Trustees, will adjust the prices of securities traded in foreign markets, as appropriate, to reflect the impact of events occurring subsequent to the close of such markets but prior to the time each Fund’s NAV is calculated.
Fixed-income securities are valued based on valuations furnished by independent pricing services that utilize matrix systems, which reflect such factors as security prices, yields, maturities, and ratings, and are supplemented by dealer and exchange quotations. Futures contracts for which market quotations are readily available are valued at the settlement price as of the close of the futures exchange. Short-term investments having a remaining maturity of 60 days or less are valued at amortized cost, which approximates market value. Investments in other open-end regulated investment companies are valued at their end of day net asset value per share. Investments in certain mortgage-backed and stripped mortgage-backed securities, preferred stocks, convertible securities, derivatives and other debt securities not traded on an organized securities market are valued on the basis of valuations provided by dealers or by a pricing service which uses information with respect to transactions in such securities and various relationships between securities and yield to maturity in determining value. Securities (including derivatives) for which market quotations are not readily available are valued at fair value, as determined in good faith, and pursuant to procedures adopted by the Board of Trustees of the Trust. The values assigned to fair value investments are based on available information and do not necessarily represent amounts that might ultimately be realized, since such amounts depend on future developments inherent in long-term investments. Further, because of the inherent uncertainty of valuation, those estimated values may differ significantly from the values that would have been used had a ready market for the investments existed, and the differences could be material.
Generally Accepted Accounting Principles (GAAP) define fair value as the price that a Fund would receive to sell an asset or pay to transfer a liability in an orderly transaction between market participants at the measurement date. GAAP also establishes a framework for measuring fair value, and a three-level hierarchy for fair value measurements based upon the transparency of inputs to the valuation of an asset or liability. Inputs may be observable or unobservable and refer broadly to the assumptions that market participants would use in pricing the asset or liability. Observable inputs reflect
62
Notes to Financial Statements (continued)
the assumptions market participants would use in pricing the asset or liability based on market data obtained from sources independent of the Funds. Unobservable inputs reflect the Funds’ own assumptions about the assumptions that market participants would use in pricing the asset or liability developed based on the best information available in the circumstances. Each investment is assigned a level based upon the observability of the inputs which are significant to the overall valuation.
The three-tier hierarchy of inputs is summarized below:
Level 1 – quoted prices in active markets for identical investments
Level 2 – other significant observable inputs (including quoted prices for similar investments, interest rates, prepayment speeds, credit risk)
Level 3 – significant unobservable inputs (including the Funds’ own assumptions in determining the fair value of investments)
The inputs or methodologies used for valuing investments are not necessarily an indication of the risk associated with investing in those investments.
Security transactions are accounted for as of the trade date. Realized gains and losses on securities sold are determined on the basis of identified cost.
| c. | Investment Income and Expenses |
Dividend income is recorded on the ex-dividend date except certain dividends from foreign securities where the ex-dividend date may have passed. These dividends are recorded as soon as the Trust is informed of the ex-dividend date. Dividend income on foreign securities is recorded net of any withholding tax. Interest income, which includes amortization of premium and accretion of discount on debt securities, as required, is accrued as earned. Non-cash dividends included in dividend income, if any, are reported at the fair value of the securities received. Other income and expenses are recorded on an accrual basis. Expenses that cannot be directly attributed to a fund are apportioned among the Funds in the Trust and in some cases other affiliated funds based upon their relative average net assets or number of shareholders. For Small Cap and TSCM Growth Equity Funds, investment income, realized and unrealized capital gains and losses, the common expenses of the Funds, and certain Fund level expense reductions, if any, are allocated on a pro rata basis to each class based on the relative net assets of each class to the total net assets of each Fund.
The following Funds had certain portfolio trades directed to various brokers, under a brokerage recapture program, which paid a portion of the Fund’s expenses. For the fiscal year ended October 31, 2010, under these arrangements the amount by which the Funds’ expenses were reduced and the impact on the expense ratios were as follows: Micro-Cap - $24,655 or 0.02%, Institutional Micro-Cap - $5,825 or 0.03% and Real Estate Securities - $2,443 or 0.01%.
The Funds have a “balance credit” arrangement with The Bank of New York Mellon (“BNYM”), the Funds’ custodian, whereby each Fund is credited with an interest factor equal to 0.75% below the effective 90-day T-Bill rate for account balances left uninvested overnight. If the T-Bill rate falls below 0.75%, no credits will be earned. These credits serve to reduce custody expenses that would otherwise be charged to each Fund. For the fiscal year ended October 31, 2010, the custodian expense was not reduced for any of the Funds.
Overdrafts will cause a reduction of any earnings credits, computed at 2% above the effective Federal Funds rate on the day of the overdraft. For the fiscal year ended October 31, 2010, the overdraft fees were as follows: Small Cap - $90, Micro-Cap - $3, Institutional Micro-Cap - $2, Real Estate Securities - $15, California Intermediate Tax-Free - $2. TSCM Growth Equity did not incur an overdraft.
The Trust also has a balance credit arrangement with its Transfer Agent, BNY Mellon Investment Servicing (US) Inc., (formerly PNC Global Investment Servicing (U.S.) Inc., whereby earnings credits are used to offset banking charges and other out-of-pocket expenses. For the fiscal year ended October 31, 2010, the transfer agent expense was reduced as follows: Small Cap - $53, Micro-Cap - $228, Institutional Micro-Cap - $42, Real Estate Securities - $33 and California Intermediate Tax-Free - $54.
Total returns and net investment income for the Funds would have been lower had certain expenses not been offset. Total expenses before offsets exclude the impact of expense reimbursements or fee waivers and expense reductions such as brokerage recapture credits, but include non-reimbursable expenses, if any, such as interest and taxes.
| d. | Dividends and Distributions |
Dividends resulting from net investment income, if any, normally will be declared and paid as follows:
Annually - Small Cap, TSCM Growth Equity, Micro-Cap, and Institutional Micro-Cap
Quarterly - Real Estate Securities
Declared daily, paid monthly - California Intermediate Tax-Free
Distributions of capital gains, if any, will be made on an annual basis and when required for Federal excise tax purposes. Income and capital gain distributions are determined in accordance with Federal income tax regulations, which may differ from generally accepted accounting principles. These differences are primarily due to differing treatments for losses deferred due to wash sales,
63
Notes to Financial Statements (continued)
REITs, equalization accounting for tax purposes, foreign currency, futures and market discount transactions. Permanent book and tax basis differences, if any, relating to shareholder distributions will result in reclassifications to paid-in capital. The tax character of distributions paid during the fiscal years ended October 31, 2010 and October 31, 2009 were as follows:
| | | | | | | | | | | | | | | | | | | | |
| | | Small Cap | | | TSCM Growth
Equity* | | | Micro-Cap | |
| | | 2010 | | | 2009 | | | 2010 | | | 2010 | | | 2009 | |
Distributions paid from: | | | | | | | | | | | | | | | | | | | | |
Ordinary income | | | — | | | | — | | | | — | | | | — | | | | — | |
Short-term capital gains | | | — | | | | — | | | | — | | | | — | | | | — | |
Long-term capital gains | | | — | | | | — | | | | — | | | | — | | | $ | 7,917,520 | |
| | | | | | | | | | | | | | | | | | | | |
Totals | | | — | | | | — | | | | — | | | | — | | | $ | 7,917,520 | |
| | | | | | | | | | | | | | | | | | | | |
| | | | | | | | | | | | | | | | | | | | | | | | |
| | | Institutional Micro-Cap | | | Real Estate Securities | | | California
Intermediate
Tax-Free | |
| | | 2010 | | | 2009 | | | 2010 | | | 2009 | | | 2010 | | | 2009 | |
Distributions paid from: | | | | | | | | | | | | | | | | | | | | | | | | |
Ordinary income | | | — | | | | — | | | $ | 195,055 | | | $ | 299,371 | | | $ | 991,896 | | | $ | 984,686 | |
| | | | | | | | | | | | | | | | | | | | | | | | |
Short-term capital gains | | | — | | | | — | | | | — | | | | — | | | | — | | | | — | |
Long-term capital gains | | | — | | | $ | 3,256,607 | | | | — | | | | — | | | | — | | | | — | |
| | | | | | | | | | | | | | | | | | | | | | | | |
Totals | | | — | | | $ | 3,256,607 | | | $ | 195,055 | | | $ | 299,371 | | | $ | 991,896 | | | $ | 984,686 | |
| | | | | | | | | | | | | | | | | | | | | | | | |
| * | Commenced operations on July 30, 2010. |
As of October 31, 2010, the components of distributable earnings (excluding unrealized appreciation/depreciation) on a tax basis consisted of:
| | | | | | | | | | | | | | | | | | | | | | | | |
| | | Small Cap | | | TSCM Growth
Equity | | | Micro-Cap | | | Institutional
Micro-Cap | | | Real Estate
Securities | | | California
Intermediate
Tax-Free | |
Capital loss carryforward | | | — | | | $ | 471 | | | $ | 15,808,913 | | | $ | 3,617,374 | | | $ | 4,516,211 | | | $ | 412,775 | |
Undistributed ordinary income | | | — | | | | 728 | | | | — | | | | — | | | | 89,485 | | | | 12,949 | |
Undistributed short-term capital gains | | | — | | | | — | | | | — | | | | — | | | | — | | | | — | |
Undistributed long-term capital gains | | | — | | | | — | | | | — | | | | — | | | | — | | | | — | |
Each Fund intends to comply with the requirements under Subchapter M of the Internal Revenue Code of 1986, as amended, to distribute substantially all of their taxable income and gains to their shareholders and to meet certain diversification and income requirements with respect to investment companies. Therefore, no provision for Federal income or excise tax is included in the accompanying financial statements.
Additionally, based on each Fund’s understanding of the tax rules and rates related to income, gains and transactions for the foreign jurisdictions in which it invests, each Fund will provide for foreign taxes, and where appropriate, deferred foreign taxes.
Management has analyzed the Funds’ tax positions taken on federal income tax returns for all open tax years (tax years ended October 31, 2007-2010), and has concluded that no provision for federal income tax is required in the Funds’ financial statements. The Funds are not aware of any tax position for which it is reasonably possible that the total amounts of unrecognized tax benefits will change materially in the next twelve months.
| f. | Capital Loss Carryovers |
As of October 31, 2010, the following Funds had accumulated net realized capital loss carryovers from securities transactions for Federal income tax purposes as shown in the following chart. These amounts may be used to offset realized capital gains, if any, through the expiration dates listed.
| | | | | | | | |
Fund | | Capital Loss
Carryover Amount | | | Expires
October 31, | |
TSCM Growth Equity | | $ | 471 | | | | 2018 | |
Micro-Cap | | $ | 15,808,913 | | | | 2017 | |
Institutional Micro-Cap | | $ | 3,617,374 | | | | 2017 | |
Real Estate Securities | | $ | 4,516,211 | | | | 2017 | |
California Intermediate Tax-Free | | $ | 412,775 | | | | 2016 | |
64
Notes to Financial Statements (continued)
For the fiscal year ended October 31, 2010, Small Cap, Micro-Cap, Institutional Micro-Cap, Real Estate Securities, and California Intermediate Tax-Free utilized capital loss carryovers in the amounts of $1,939,346, $5,868,763, $657,711, $2,585,558, and $35,518, respectively.
The Trust’s Declaration of Trust authorizes for each series the issuance of an unlimited number of shares of beneficial interest, without par value. Each Fund records sales and repurchases of its capital stock on the trade date. The cost of securities contributed to the Funds in connection with the issuance of shares is based on the valuation of those securities in accordance with the Funds’ policy on investment valuation. Dividends and distributions to shareholders are recorded on the ex-dividend date.
The capital stock transactions by class for Small Cap and TSCM Growth Equity for the fiscal periods ended October 31, 2010, were as follows:
| | | | | | | | | | | | | | | | |
| | | Small Cap | | | TSCM Growth Equity ** | |
| | | 2010 | | | 2010 | |
| | | Shares | | | Amount | | | Shares | | | Amount | |
Investor Class Shares* | | | | | | | | | | | | | | | | |
Proceeds from sale of shares | | | 25,018 | | | $ | 375,533 | | | | 1,270 | | | $ | 12,963 | |
Reinvestments of dividends and distributions | | | — | | | | — | | | | — | | | | — | |
Cost of shares repurchased | | | (683 | ) | | | (11,557 | ) | | | — | | | | — | |
| | | | | | | | | | | | | | | | |
Net increase - Investor Shares | | | 24,335 | | | $ | 363,976 | | | | 1,270 | | | $ | 12,963 | |
| | | | | | | | | | | | | | | | |
Service Class Shares | | | | | | | | | | | | | | | | |
Proceeds from sale of shares | | | 74,867 | | | $ | 1,124,823 | | | | 1,000 | | | $ | 10,000 | |
Reinvestments of dividends and distributions | | | — | | | | — | | | | — | | | | — | |
Cost of shares repurchased | | | (1,926,064 | ) | | | (28,232,180 | ) | | | — | | | | — | |
| | | | | | | | | | | | | | | | |
Net decrease - Service Shares | | | (1,851,197 | ) | | ($ | 27,107,357 | ) | | | 10,000 | | | $ | 10,000 | |
| | | | | | | | | | | | | | | | |
Institutional Class Shares* | | | | | | | | | | | | | | | | |
Proceeds from sale of shares | | | 720,550 | | | $ | 10,720,207 | | | | 106,430 | | | $ | 1,067,380 | |
Reinvestments of dividends and distributions | | | — | | | | — | | | | — | | | | — | |
Cost of shares repurchased | | | (18,833 | ) | | | (283,101 | ) | | | (9,332 | ) | | | (100,100 | ) |
| | | | | | | | | | | | | | | | |
Net increase - Institutional Shares | | | 701,717 | | | $ | 10,437,106 | | | | 97,098 | | | $ | 967,280 | |
| | | | | | | | | | | | | | | | |
| * | Commenced operations on January 1, 2010. |
| ** | Commenced operations on July 30, 2010. |
65
Notes to Financial Statements (continued)
At October 31, 2010, certain shareholders and omnibus shareholder accounts individually held greater than 10% of the outstanding shares of the following Funds: Small Cap - two collectively own 53%; TSCM Growth Equity - four collectively own 81%; Micro-Cap - two collectively own 49%; Institutional Micro-Cap - three collectively own 53%; Real Estate Securities - three collectively own 61%; California Intermediate Tax-Free - three collectively own 64%. Transactions by these shareholders may have a material impact on their respective Funds.
| 2. | Agreements and Transactions with Affiliates |
The Trust has entered into an Investment Management Agreement under which Managers Investment Group LLC (the “Investment Manager”), an independently managed subsidiary of Affiliated Managers Group, Inc. (“AMG”), provides or oversees investment management services to the Funds. The Investment Manager selects subadvisors for each Fund (subject to Trustee approval) and monitors the subadvisors’ investment programs and results. Each Fund’s investment portfolio is managed by portfolio managers who serve pursuant to subadvisory agreements with the Investment Manager.
The Small Cap investment portfolio is managed by Frontier Capital Management Co., LLC (“Frontier”). AMG indirectly owns a majority interest in Frontier. The TSCM Growth Equity investment portfolio is managed by TimesSquare Capital Management, LLC (“TimesSquare”). AMG indirectly owns a majority interest in TimesSquare.
Investment management fees are paid directly by each Fund to the Investment Manager based on average daily net assets. The annual investment management fee rates, as a percentage of average daily net assets, for the fiscal year ended October 31, 2010, were as follows:
| | | | |
Fund | | Investment
Management Fee | |
Small Cap | | | 1.00 | % |
TSCM Growth Equity | | | | |
on first $100 million | | | 0.65 | % |
on next $250 million | | | 0.40 | % |
on balance over $350 million | | | 0.30 | % |
Micro-Cap | | | 1.00 | % |
Institutional Micro-Cap | | | 1.00 | % |
Real Estate Securities | | | 0.85 | % |
California Intermediate Tax-Free | | | | |
on first $25 million | | | 0.40 | % |
on next $25 million | | | 0.35 | % |
on next $50 million | | | 0.30 | % |
on next $50 million | | | 0.25 | % |
on balance over $150 million | | | 0.20 | % |
Small Cap is obligated by its investment management contract to pay an annual management fee to the Investment Manager. The Investment Manager, in turn, pays all or a portion of this fee to Frontier. Under its Investment Manager Agreement with the Fund, the Investment Manager provides a variety of administrative services to the Fund. Effective as of January 1, 2010, the Investment Manager receives compensation from Frontier for its administrative services to the Fund pursuant to a separate agreement between the Investment Manager and Frontier.
For each of the Funds other than Small Cap, the Trust has entered into an Administration and Shareholder Servicing Agreement under which the Investment Manager serves as each Fund’s administrator (the “Administrator”) and is responsible for all aspects of managing the Funds’ operations, including administration and shareholder services to each Fund, its shareholders, and certain institutions, such as bank trust departments, broker-dealers and registered investment advisers, that advise or act as an intermediary with the Funds’ shareholders. For its services, the Administrator is paid a fee at a rate of 0.25% of average net assets per annum. Effective January 1, 2010, Small Cap terminated its Administration agreement.
At a meeting held on September 10-11, 2009, the Trust’s Board of Trustees approved a contractual expense limitation with respect to Small Cap. Effective January 1, 2010, the Investment Manager has contractually agreed, through at least March 1, 2011, to waive fees and pay or reimburse Fund expenses in order to limit total annual Fund operating expenses after fee waiver and expense reimbursements (exclusive of taxes, interest, shareholder servicing fees, distribution and service (12b-1) fees, brokerage commissions, acquired fund fees and expenses and extraordinary items) to 1.05% of the Fund’s average daily net assets.
At a meeting held June 10-11, 2010, the Board of Trustees approved new contractual expense limitation agreements with respect to the Micro-Cap and Institutional Micro-Cap Funds. Effective July 1, 2010, the Investment Manager has contractually agreed, through at least March 1, 2012, to waive fees and pay or reimburse Fund expenses of Micro-Cap and Institutional Micro-Cap in order to limit total annual Fund operating expenses after fee waiver and expense reimbursements (exclusive of taxes, interest, brokerage commissions, acquired fund fees and expenses and extraordinary items) to 1.43%, and 1.23%, respectively, of each Fund’s average daily net assets. Immediately prior to July 1, 2010, Micro-Cap and Institutional Micro-Cap had contractual expense limitations of 1.56%, and 1.35%, respectively.
The Investment Manager has contractually agreed, through at least March 1, 2011, to waive fees and pay or reimburse Fund expenses of Small Cap, Real Estate Securities and California Intermediate Tax-Free in order to limit total annual Fund operating expenses after fee waiver and expense reimbursements (exclusive of taxes, interest, shareholder servicing fees, distribution and service (12b-1) fees, brokerage commissions, acquired fund fees and expenses and extraordinary items) to 1.05%, 1.50% and 0.55%, respectively, of each Fund’s average daily net assets.
66
Notes to Financial Statements (continued)
The Investment Manager has contractually agreed, through at least March 1, 2012, to waive fees and pay or reimburse Fund expenses of TSCM Growth Equity in order to limit total annual Fund operating expenses after fee waiver and expense reimbursements (exclusive of taxes, interest, shareholder servicing fees, distribution and service (12b-1) fees, brokerage commissions, acquired fund fees and expenses and extraordinary items) to 0.79% of the Fund’s average daily net assets.
Each of Small Cap, TSCM Growth Equity, Micro-Cap, Institutional Micro-Cap, Real Estate Securities, and California Intermediate Tax-Free is obligated to repay the Investment Manager such amounts waived, paid or reimbursed in future years provided that the repayment occurs within thirty-six (36) months after the waiver or reimbursement and that such repayment would not cause the Fund’s expenses in any such year to exceed the previously stated expense limitation percentages of that Fund’s average daily net assets. For the fiscal year ended October 31, 2010, each Fund’s components of reimbursement are detailed in the following chart:
| | | | | | | | | | | | |
| | | Small Cap | | | TSCM Growth
Equity | | | Micro-Cap | |
Reimbursement Available - 10/31/09 | | | — | | | | — | | | $ | 447,014 | |
Additional Reimbursements | | $ | 92,681 | | | $ | 38,363 | | | | 266,870 | |
Repayments | | | — | | | | — | | | | — | |
Expired Reimbursements | | | — | | | | — | | | | — | |
Reimbursement Available - 10/31/10 | | $ | 92,681 | | | $ | 38,363 | | | $ | 713,884 | |
| | | |
| | | Institutional
Micro-Cap | | | Real Estate
Securities | | | California
Intermediate
Tax-Free | |
Reimbursement Available - 10/31/09 | | $ | 245,420 | | | $ | 148,428 | | | $ | 303,313 | |
Additional Reimbursements | | | 85,108 | | | | 54,573 | | | | 125,527 | |
Repayments | | | — | | | | — | | | | — | |
Expired Reimbursements | | | (69,870 | ) | | | — | | | | (109,437 | ) |
Reimbursement Available - 10/31/10 | | $ | 260,658 | | | $ | 203,001 | | | $ | 319,403 | |
The aggregate annual retainer paid to each Independent Trustee is $65,000, plus $4,000 or $2,500 for each regular or special meeting attended, respectively. The Trustees’ fees and expenses are allocated among all of the Funds for which the Investment Manager serves as the advisor (the “Managers Funds”) based on the relative net assets of such Funds. The Independent Chairman of the Trusts receives an additional payment of $15,000 per year. The Chairman of the Audit Committee receives an additional payment of $5,000 per year. The “Trustees fees and expenses” shown in the financial statements represents the Funds’ allocated portion of the total fees and expenses paid by the Managers Funds.
The Funds are distributed by Managers Distributors, Inc. (“MDI”), a wholly-owned subsidiary of the Investment Manager. MDI serves as the principal underwriter for each Fund and is a registered broker-dealer and member of the Financial Industry Regulatory Authority, Inc. (“FINRA”). Shares of each Fund will be continuously offered and will be sold by brokers, dealers or other financial intermediaries who have executed selling agreements with MDI. MDI bears all the expenses of providing services pursuant to the Underwriting Agreement, including payment of the expenses relating to the distribution of Prospectuses for sales purposes and any advertising or sales literature. Certain Trustees and Officers of the Funds are Officers and/or Directors of the Investment Manager, AMG and/or MDI.
Small Cap and TSCM Growth Equity have adopted a distribution and service plan (the “plan”) with respect to the Investor Class shares of each Fund, in accordance with the requirements of Rule 12b-1 under the 1940 Act and the requirements of the applicable rules of the FINRA regarding asset-based sales charges. Pursuant to the Plan, each Fund may compensate the Distributor for its expenditures in financing any activity primarily intended to result in the sale of such class of the Fund’s shares and for maintenance and personal service provided to existing shareholders of that class. The Plan authorizes payments to the Distributors up to 0.25% annually of the Fund’s average daily net assets attributable to the Investor Class shares. The Plan further provides for periodic payments by MDI to brokers, dealers and other financial intermediaries for providing shareholder services and for promotional and other sales related costs. The portion of payments by the Investor Class shares for shareholder servicing may not exceed an annual rate of 0.25% of the average daily net asset value of the Fund’s shares of that class owned by its clients of such broker, dealer or financial intermediary.
On June 23, 2009, the Securities and Exchange Commission granted an exemptive order that permits the Funds to lend and borrow money for certain temporary purposes directly to and from other eligible Funds in the Managers Family of Funds (the “Fund Family”). Participation in this interfund lending program is voluntary for both borrowing and lending Funds, and an interfund loan is only made if it benefits each participating Fund. The Investment Manager administers the program according to procedures approved by the Funds’ Board of Trustees (the “Board”), and the Board monitors the operation of the program. An interfund loan must comply with certain conditions set out in the exemptive order, which are designed to assure fairness and protect all participating Funds. For the fiscal year ended October 31, 2010, the following Funds lent to other Funds in the Fund family: Small Cap lent $305,732 for 1 day earning interest of $9; Micro-Cap lent $1,253,392 for 9 days earning interest of $276; Institutional Micro-Cap lent $159,121 for 4 days earning interest of $19; Real Estate lent $355,051 for 2 days earning interest of $23. For the same period, the Funds did not borrow from other Funds in the Fund Family. The interest amounts are included in the Statement of Operations as interest income.
67
Notes to Financial Statements (continued)
| 3. | Purchases and Sales of Securities |
Purchases and sales of investment securities (excluding short-term securities and U.S. Government obligations) for the fiscal year ended October 31, 2010, were as follows:
| | | | | | | | |
Fund | | Purchases | | | Sales | |
Small Cap | | $ | 15,187,537 | | | $ | 30,963,513 | |
TSCM Growth Equity * | | | 1,474,172 | | | | 495,394 | |
Micro-Cap | | | 117,698,046 | | | | 143,755,538 | |
Institutional Micro-Cap | | | 22,622,055 | | | | 29,824,714 | |
Real Estate Securities | | | 20,346,323 | | | | 17,994,626 | |
California Intermdiate Tax-Free | | | 19,112,935 | | | | 19,176,453 | |
| * | Commenced operations on July 30, 2010. |
The Funds had no purchases or sales of U.S. Government obligations for the fiscal year ended October 31, 2010.
| 4. | Portfolio Securities Loaned |
The Funds may participate in a securities lending program offered by BNYM, providing for the lending of securities to qualified brokers. Securities lending fees include earnings of such temporary cash investments, plus or minus any rebate to a borrower. These earnings (after any rebate) are then divided between BNYM, as a fee for its services under the program, and the Fund, according to agreed-upon rates. Collateral on all securities loaned is accepted in cash and/or government securities and is maintained at a minimum level of 102% (105% in the case of certain foreign securities) of the market value, plus interest, if applicable, of investments on loan. It is the Funds’ policy to obtain additional collateral from or return excess collateral to the borrower by the end of the next business day, following the valuation date of the securities loaned. Therefore, the value of the collateral held may be temporarily less than the value of the securities on loan. Lending securities entails a risk of loss to the Funds if and to the extent that the market value of the securities loaned were to increase and the borrower did not increase the collateral accordingly, and the borrower fails to return the securities. The Funds bear the risk of any deficiency in the amount of the collateral available for return to the borrower due to any loss on the collateral invested. Collateral received in the form of cash is invested temporarily in the BNY Mellon Overnight Government Fund, formerly the BNY Institutional Cash Reserves Fund (the “ICRF”), or other short-term investments as defined in the Securities Lending Agreement with BNYM. For the fiscal year ended October 31, 2010, Small Cap, Micro-Cap, and Institutional Micro-Cap participated in the securities lending program.
Effective August 2, 2010, the Trust, on behalf of each applicable Fund, has entered into an agreement with The Bank of New York Mellon and the Bank of New York Mellon Corporation (“BNYMC”) with respect to each Fund’s position in the BNY Institutional Cash Reserves Fund (the “ICRF”), pursuant to which (i) BNYMC will support the value of certain defaulted securities issued by Lehman Brothers Holdings, Inc. and held by ICRF, and (ii) if certain conditions are met, BNYMC will purchase the defaulted securities from each Fund in September 2011. Each applicable Fund is fair valuing its position in the ICRF daily. Each Fund’s position, if any, in the separate sleeve of the ICRF is included in the Schedule of Portfolio Investments and the unrealized loss on such investment is included in Net Unrealized Depreciation on the Statement of Assets and Liabilities and Statement of Operations.
| 5. | Commitments and Contingencies |
In the normal course of business, the Funds may enter into contracts and agreements that contain a variety of representations and warranties, which provide general indemnifications. The maximum exposure to the Funds under these arrangements is unknown, as this would involve future claims that may be against the Funds that have not yet occurred. However, based on experience, the Funds expect the risks of loss to be remote.
The Funds have determined that no additional material events or transactions occurred through the issuance date of the Funds’ financial statements, which require additional disclosure in the Funds’ financial statements.
Tax Information (unaudited)
Each Fund hereby designates the maximum amount allowable of its net taxable income as qualified dividends as provided in the Jobs and Growth Tax Relief Reconciliation Act of 2003.
In accordance with federal tax law, the following Funds hereby make the following designations regarding its year ended October 31, 2010:
California Intermediate Tax-Free
| | • | | All the dividends paid from net investment income are “exempt-interest dividends” (not generally subject to regular federal income tax), except $621 that is being designated as an ordinary income distribution for reporting purposes. |
Pursuant to section 852 of the Internal Revenue Code, Small Cap, TSCM Growth Equity, Micro-Cap, Institutional Micro-Cap, Real Estate Securities and California Intermediate Tax-Free hereby designate as a capital gain distribution with respect to the taxable year ended October 31, 2010, $0, $0, $0, $0, $0 and $0, respectively, or, if subsequently determined to be different, the net capital gains of such year.
The 2010 Form 1099-DIVs you receive for each Fund will show the tax status of all distributions paid to you during the respective calendar year.
68
Report of Independent Registered Public Accounting Firm
To the Board of Trustees of Managers Trust I and the Shareholders of Managers Frontier Small Cap Growth Fund (formerly Managers Small Cap Fund), Managers AMG TSCM Growth Equity Fund, Managers Micro-Cap Fund (formerly Managers Fremont Micro-Cap Fund), Managers Institutional Micro-Cap Fund (formerly Managers Fremont Institutional Micro-Cap Fund), Managers Real Estate Securities Fund and Managers California Intermediate Tax-Free Fund (collectively, six of the series constituting Managers Trust I, hereafter referred to as the “Funds”):
In our opinion, the accompanying statements of assets and liabilities, including the schedules of portfolio investments, and the related statements of operations and of changes in net assets and the financial highlights present fairly, in all material respects, the financial position of Managers Frontier Small Cap Growth Fund (formerly Managers Small Cap Fund), Managers Micro-Cap Fund (formerly Fremont Micro-Cap Fund), Managers Institutional Micro-Cap Fund (formerly Fremont Institutional Micro-Cap Fund), Managers Real Estate Securities Fund and Managers California Intermediate Tax-Free Fund at October 31, 2010, the results of each of their operations for the year then ended, the changes in each of their net assets for each of the two years in the period then ended and the financial highlights for each of the periods indicated, and the financial position of Managers AMG TSCM Growth Equity Fund at October 31, 2010 and the results of its operations, the changes in its net assets and the financial highlights for the period July 30, 2010 (commencement of operations) to October 31, 2010, in conformity with accounting principles generally accepted in the United States of America. These financial statements and financial highlights (hereafter referred to as “financial statements”) are the responsibility of the Funds’ management; our responsibility is to express an opinion on these financial statements based on our audits. We conducted our audits of these financial statements in accordance with the standards of the Public Company Accounting Oversight Board (United States). Those standards require that we plan and perform the audit to obtain reasonable assurance about whether the financial statements are free of material misstatement. An audit includes examining, on a test basis, evidence supporting the amounts and disclosures in the financial statements, assessing the accounting principles used and significant estimates made by management, and evaluating the overall financial statement presentation. We believe that our audits, which included confirmation of securities at October 31, 2010 by correspondence with the custodian and brokers, provide a reasonable basis for our opinion.
PricewaterhouseCoopers LLP
Philadelphia, Pennsylvania
December 22, 2010
69
Trustees and Officers
The Trustees and Officers of the Trust, their business addresses, principal occupations for the past five years and dates of birth are listed below. The Trustees provide broad supervision over the affairs of the Trust and the Funds. The Trustees are experienced executives who meet periodically throughout the year to oversee the Funds’ activities, review contractual arrangements with companies that provide services to the Funds, and review the Funds’ performance. Unless otherwise noted, the address of each Trustee or Officer is the address of the Trust: 800 Connecticut Avenue, Norwalk, Connecticut 06854.
There is no stated term of office for Trustees. Trustees serve until their resignation, retirement or removal in accordance with the Trust’s organizational documents and policies adopted by the Board from time to time. The Chairman of the Trustees, President, Treasurer and Secretary of the Trust are elected by the Trustees annually. Other officers hold office at the pleasure of the Trustees.
Independent Trustees
The following Trustees are not “interested persons” of the Trust within the meaning of the 1940 Act:
| | |
Name, Date of Birth, Number of
Funds Overseen in Fund
Complex* | | Principal Occupation(s) During Past 5 Years and Other Directorships Held by Trustee |
Jack W. Aber, 9/9/37 • Trustee since 2000 • Oversees 38 Funds in Fund Complex | | Professor of Finance, Boston University School of Management (1972-Present); Trustee of Appleton Growth Fund (1 portfolio); Trustee of Third Avenue Trust (5 portfolios); Trustee of Third Avenue Variable Trust (1 portfolio); Trustee of Aston Funds (24 portfolios). |
| |
William E. Chapman, II, 9/23/41 • Independent Chairman • Trustee since 2000 • Oversees 38 Funds in Fund Complex | | President and Owner, Longboat Retirement Planning Solutions (1998-Present); Hewitt Associates, LLC (part time) (provider of Retirement and Investment Education Seminars) (resigned Nov. 2009); Trustee of Bowdoin College (2002-Present); Director of Harding, Loevner Funds, Inc. (6 portfolios); Trustee of Third Avenue Trust (5 portfolios); Trustee of Third Avenue Variable Trust (1 portfolio); Trustee of Aston Funds (24 portfolios). |
| |
Edward J. Kaier, 9/23/45 • Trustee since 2000 • Oversees 38 Funds in Fund Complex | | Attorney at Law and Partner, Teeters Harvey Gilboy & Kaier LLP (2007-Present); Attorney at Law and Partner, Hepburn Willcox Hamilton & Putnam, LLP (1977-2007); Trustee of Third Avenue Trust (5 portfolios); Trustee of Third Avenue Variable Trust (1 portfolio); Trustee of Aston Funds (24 portfolios). |
| |
Steven J. Paggioli, 4/3/50 • Trustee since 2000 • Oversees 38 Funds in Fund Complex | | Consultant (2001-Present); Formerly Executive Vice President and Director, The Wadsworth Group (1986-2001); Executive Vice President, Secretary and Director, Investment Company Administration, LLC (1990-2001); Vice President, Secretary and Director, First Fund Distributors, Inc. (1991-2001); Trustee, Professionally Managed Portfolios (40 portfolios); Advisory Board Member, Sustainable Growth Advisors, LP; Independent Director, Chase Investment Counsel (2008 – Present); Trustee of Aston Funds (24 portfolios). |
| |
Eric Rakowski, 6/5/58 • Trustee since 2000 • Oversees 38 Funds in Fund Complex | | Professor, University of California at Berkeley School of Law (1990-Present); Director of Harding, Loevner Funds, Inc. (6 portfolios); Trustee of Third Avenue Trust (5 portfolios); Trustee of Third Avenue Variable Trust (1 portfolio); Trustee of Aston Funds (24 portfolios). |
| |
Thomas R. Schneeweis, 5/10/47 • Trustee since 2000 • Oversees 38 Funds in Fund Complex | | Professor of Finance, University of Massachusetts (1977-Present); Director, CISDM at the University of Massachusetts, (1996-Present); President, Alternative Investment Analytics, LLC, (formerly Schneeweis Partners, LLC) (2001-Present); Partner, White Bear Partners, LLC (2007-Present); Partner, Schneeweis Capital Management, LLC (2007-Present); Partner, Schneeweis Associates, LLC (2007-Present); Partner, Northampton Capital Management, LLC (2004-Present); Partner, TRS Associates (2007-Present); Trustee of Aston Funds (24 portfolios). |
Interested Trustees
The following Trustees are “interested persons” of the Trust within the meaning of the 1940 Act. Mr. Dalton is an interested person by virtue of his positions with, and interest in securities of, Affiliated Managers Group, Inc. and his position with Managers Distributors, Inc. Mr. Streur is an interested person by virtue of his positions with Managers Investment Group LLC.
| | |
Name, Date of Birth, Number of
Funds Overseen in Fund
Complex* | | Principal Occupation(s) During Past 5 Years and Other Directorships Held by Trustee |
Nathaniel Dalton, 9/29/66 • Trustee since 2008 • Oversees 38 Funds in Fund Complex | | Executive Vice President and Chief Operating Officer, Affiliated Managers Group, Inc., (2006-Present); Executive Vice President, Affiliated Managers Group, Inc., (2002 -2006); Executive Vice President and General Counsel, Affiliated Managers Group, Inc. (2001-2002); Senior Vice President and General Counsel, Affiliated Managers Group, Inc. (1996-2001). Director, Managers Distributors, Inc. (2000-Present). |
| |
John H. Streur, 2/6/60 • Trustee since 2008 • President since 2008 • Oversees 38 Funds in Fund Complex | | Senior Managing Partner, Managers Investment Group LLC (2006-Present); President, Managers Distributors, Inc. (2006-Present); Managing Partner, Managers Investment Group LLC (2005-2006); Chief Executive Officer, President and Chief Operating Officer, The Burridge Group LLC (1996-2004). |
| |
| Officers | | |
| |
Name, Date of Birth, Position(s) Held with Fund and
Length of Time Served | | Principal Occupation(s) During Past 5 Years |
Christine C. Carsman, 4/2/52 • Secretary since 2004 | | Senior Vice President and Chief Regulatory Counsel, Affiliated Managers Group, Inc. (2004-Present); Secretary, The Managers Funds, Managers AMG Funds and Managers Trust II (2004-Present); Senior Counsel, Vice President and Director of Operational Risk Management and Compliance, Wellington Management Company, LLP (1995-2004); Deputy General Counsel, The Boston Company, Inc. (1993-1995); Associate General Counsel, The Boston Company Advisors, Inc. (1991-1993); Associate, Sullivan & Worcester LLP (1987-1991). |
| |
Donald S. Rumery, 5/29/58 • Chief Financial Officer since 2007 • Treasurer since 2000 | | Senior Vice President, Managers Investment Group LLC (2005-Present); Director, Finance and Planning, The Managers Funds LLC, (1994-2004); Treasurer and Chief Financial Officer, Managers Distributors, Inc. (2000-Present); Treasurer, The Managers Funds (1995-Present); Treasurer, Managers AMG Funds (1999-Present); Treasurer, Managers Trust II (2000-Present); Secretary, Managers Trust I and Managers Trust II (2000-2004) and Secretary, The Managers Funds (1997-2004); Chief Financial Officer, The Managers Funds, Managers AMG Funds and Managers Trust II (2007-Present). |
| |
Keitha L. Kinne, 5/16/58 • Chief Operating Officer since 2007 | | Managing Partner and Chief Operating Officer, Managers Investment Group LLC (2007-Present); Chief Operating Officer, The Managers Funds, Managers AMG Funds and Managers Trust II (2007-Present); Chief Investment Officer, Managers Investment Group LLC (2008-Present); Managing Director, Legg Mason & Co., LLC (2006-2007); Managing Director, Citigroup Asset Management (2004-2006); Senior Vice President, Prudential Investments (1999-2004). |
| |
David Kurzweil, 6/22/74 • Assistant Secretary since 2008 | | Senior Vice President and Associate Counsel, Managers Investment Group LLC (2008-Present); Assistant Secretary, The Managers Funds, Managers Trust II, and Managers AMG Funds (2008-Present); Counsel and Senior Vice President, Lazard Asset Management LLC (2003-2008). |
| * | The Fund Complex consists of Managers AMG Funds, The Managers Funds, Managers Trust I and Managers Trust II. |
70
Annual Renewal of Investment Advisory Agreements
MANAGERS FRONTIER SMALL CAP GROWTH FUND
On June 10-11, 2010, the Board of Trustees, including a majority of the Trustees who are not “interested persons” of the Trust (the “Independent Trustees”), approved the Investment Management Agreement with the Investment Manager for the Managers Frontier Small Cap Growth Fund (formerly Managers Small Cap Fund) (the “Fund”). The Independent Trustees were separately represented by independent counsel in connection with their consideration of the approval of this agreement. In considering the Investment Management Agreement, the Trustees reviewed a variety of materials relating to the Fund, the Investment Manager and the Subadvisor, including comparative performance, fee and expense information for an appropriate peer group of similar mutual funds (the “Peer Group”), performance information for the relevant benchmark index (the “Fund Benchmark”) and other information provided to them on a periodic basis throughout the year, as well as information provided in connection with the meetings of June 10-11, 2010, regarding the nature, extent and quality of services provided by the Investment Manager under its agreement. Prior to voting, the Independent Trustees: (a) reviewed the foregoing information with their independent legal counsel and with management; (b) received materials from their independent legal counsel discussing the legal standards applicable to their consideration of the Investment Management Agreement; and (c) met with their independent legal counsel in private sessions at which no representatives of management were present.
Nature, extent and quality of services.
In considering the nature, extent and quality of the services provided by the Investment Manager, the Trustees reviewed information relating to the Investment Manager’s operations and personnel. Among other things, the Investment Manager provided financial information, biographical information on its supervisory and professional staff and descriptions of its organizational and management structure. The Trustees also took into account information provided periodically throughout the previous year by the Investment Manager relating to the performance of its duties with respect to the Fund and the Trustees’ familiarity with the Investment Manager’s management through Board meetings, discussions and reports. In the course of their deliberations regarding the Investment Management Agreement, the Trustees evaluated, among other things: (a) the extent and quality of the Investment Manager’s oversight of the operation and management of the Fund; (b) the quality of the search, selection and monitoring services performed by the Investment Manager in overseeing the portfolio management responsibilities of the Subadvisor; (c) the Investment Manager’s ability to supervise the Fund’s other service providers; and (d) the Investment Manager’s compliance programs. The Trustees also took into account the financial condition of the Investment Manager with respect to its ability to provide the services required under the Investment Management Agreement and to maintain a contractual expense limitation for the Fund.
Performance.
Among other information relating to the Fund’s performance, the Trustees noted that the Fund’s performance for Service Class shares for the 1-year, 3-year, 5-year and 10-year periods ended March 31, 2010 was below, above, above and below, respectively, the median performance of the Peer Group and below, above, above and below, respectively, the performance of the Fund Benchmark, the Russell 2000 Growth Index. The Trustees noted that the Investment Manager replaced the Fund’s previous Subadvisor with a new Subadvisor in mid-September 2009, and also, at meetings held on September 10-11, 2009, the Trustees previously noted that the performance of a product managed by the new Subadvisor with similar investment objectives and strategies to those of the Fund had ranked in the top quartile of its peer universe since inception (1985). The Trustees also took into account the fact that over the 3-year and 5-year periods, the Fund has outperformed the Fund Benchmark and ranked in the top quintile of the Peer Group. The Trustees concluded that management has taken appropriate steps to address the Fund’s performance.
Furthermore, the Board reviews on a quarterly basis detailed information about the Fund’s performance results, portfolio composition and the Subadvisor’s investment philosophy, strategies and techniques in managing the Fund. The Board noted the Investment Manager’s expertise and resources in monitoring the performance, investment style and risk-adjusted performance of the Subadvisor. The Board was mindful of the Investment Manager’s attention to monitoring the Subadvisor’s performance with respect to the Fund and its discussions with management regarding the factors that contributed to the performance of the Fund.
Advisory Fees and Profitability.
In considering the reasonableness of the advisory fee charged by the Investment Manager for managing the Fund, the Trustees noted that the Investment Manager, and not the Fund, is responsible for paying the fees charged by the Fund’s Subadvisor and, therefore, that the fees paid to the Investment Manager cover the cost of providing portfolio management services as well as the cost of providing search, selection and monitoring services in operating a “manager-of-managers” complex of mutual funds. The Trustees concluded that, in light of the additional high quality supervisory services provided by the Investment Manager and the fact that the subadvisory fees are paid out of the advisory fee, the advisory fee payable by the Fund to the Investment Manager can reasonably be expected to exceed the median advisory fee for an appropriate peer group of similar mutual funds, which consists of many funds that do not operate with a manager-of-managers structure. In this regard, the Trustees also noted that the Investment Manager has undertaken to maintain an expense limitation for the Fund.
In considering the reasonableness of the advisory fee payable to the Investment Manager, the Trustees also reviewed information provided by the Investment Manager setting forth all revenues and other benefits, both direct and indirect, received by the Investment Manager and its affiliates attributable to managing the Fund and all the mutual funds in the Managers Family of Funds, the cost of providing such services and the resulting profitability to the Investment Manager and its affiliates from these relationships. The Trustees also noted the current and potential asset levels of the Fund and the willingness of the Investment Manager to waive fees and pay expenses for the Fund from time to time as a means of limiting the total expenses of the Fund. The Trustees also considered management’s discussion of the current asset level of the Fund, including the effect on assets attributable to the economic and market conditions over the past eighteen months, and considered the impact on profitability of the current asset level and any future growth of assets of the Fund. The Board took into account management’s discussion
71
Annual Renewal of Investment Advisory Agreements (continued)
of the current advisory fee structure. The Trustees also noted that the subadvisory fees are paid by the Investment Manager out of its advisory fee. Based on the foregoing, the Trustees concluded that the profitability to the Investment Manager is reasonable and that the Investment Manager is not realizing material benefits from economies of scale that would warrant adjustments to the advisory fees for the Fund at this time. With respect to economies of scale, the Trustees also noted that as the Fund’s assets increase over time, the Fund may realize other economies of scale to the extent that the increase in assets is proportionally greater than the increase in certain other expenses.
The Trustees noted that the Fund’s advisory fee and total expenses (net of applicable expense waivers/reimbursements) as of March 31, 2010 were both lower than the average for the Peer Group. The Trustees took into account the fact that the Investment Manager has contractually agreed, through March 1, 2011, to limit the Fund’s net annual operating expenses to 1.05%. The Trustees concluded that, in light of the nature, extent and quality of the services provided by the Investment Manager and the Subadvisor, the foregoing expense limitation and the considerations noted above with respect to the Subadvisor and the Investment Manager, the Fund’s advisory fees are reasonable.
* * * *
After consideration of the foregoing, the Trustees also reached the following conclusions regarding the Investment Management Agreement, in addition to those conclusions discussed above: (a) the Investment Manager has demonstrated that it possesses the capability and resources to perform the duties required of it under the Investment Management Agreement; and (b) the Investment Manager maintains an appropriate compliance program.
Based on all of the above-mentioned factors and related conclusions, with no single factor or conclusion being determinative and with each Trustee not necessarily attributing the same weight to each factor, the Trustees concluded that approval of the Investment Management Agreement would be in the best interests of the Fund and its shareholders. Accordingly, on June 10-11, 2010, the Trustees, including a majority of the Independent Trustees, voted to approve the Investment Management Agreement for the Fund.
**************************************************
72
Annual Renewal of Investment Advisory Agreements (continued)
On June 10-11, 2010, the Board of Trustees, including a majority of the Trustees who are not “interested persons” of the Trust (the “Independent Trustees”), approved the Investment Management Agreement with the Investment Manager for each of the Funds identified below and the Subadvisory Agreement for each of the Subadvisors, except for the Subadvisory Agreements between the Investment Manager and RBC Global Asset Management (U.S.) Inc. (formerly Voyageur Asset Management Inc.) with respect to each of Managers Institutional Micro-Cap Fund and Managers Micro-Cap Fund, which were recently approved in December, 2009 (for purposes of this section, each a “Subadvisor” and “Subadvisory Agreement” and collectively the “Subadvisors” and “Subadvisory Agreements”). The Independent Trustees were separately represented by independent counsel in connection with their consideration of the approval of these agreements. In considering the Investment Management and Subadvisory Agreements, the Trustees reviewed a variety of materials relating to each Fund, the Investment Manager and each Subadvisor, including comparative performance, fee and expense information for an appropriate peer group of similar mutual funds (each a “Peer Group”), performance information for relevant benchmark indices (each a “Fund Benchmark”) and, with respect to each Subadvisor, comparative performance information for an appropriate peer group of managed accounts, and, as to all other matters, other information provided to them on a periodic basis throughout the year, as well as information provided in connection with the meetings of June 10-11, 2010, regarding the nature, extent and quality of services provided by the Investment Manager and the Subadvisors under their respective agreements. Prior to voting, the Independent Trustees: (a) reviewed the foregoing information with their independent legal counsel and with management; (b) received materials from their independent legal counsel discussing the legal standards applicable to their consideration of the Investment Management Agreement and the Subadvisory Agreements; and (c) met with their independent legal counsel in private sessions at which no representatives of management were present.
Nature, extent and quality of services.
In considering the nature, extent and quality of the services provided by the Investment Manager, the Trustees reviewed information relating to the Investment Manager’s operations and personnel. Among other things, the Investment Manager provided financial information, biographical information on its supervisory and professional staff and descriptions of its organizational and management structure. The Trustees also took into account information provided periodically throughout the previous year by the Investment Manager relating to the performance of its duties with respect to the Funds and the Trustees’ familiarity with the Investment Manager’s management through Board meetings, discussions and reports. In the course of their deliberations regarding the Investment Management Agreement, the Trustees evaluated, among other things: (a) the extent and quality of the Investment Manager’s oversight of the operation and management of the Funds; (b) the quality of the search, selection and monitoring services performed by the Investment Manager in overseeing the portfolio management responsibilities of the Subadvisors; (c) the Investment Manager’s ability to supervise the Funds’ other service providers; and (d) the Investment Manager’s compliance programs. The Trustees also took into account the financial condition of the Investment Manager with respect to its ability to provide the services required under the Investment Management Agreement and to maintain contractual expense limitations for the Funds.
For each Fund, the Trustees also reviewed information relating to each Subadvisor’s operations and personnel and the investment philosophy, strategies and techniques (for each Subadvisor, its “Investment Strategy”) used in managing the Fund or the portion of the Fund for which the Subadvisor has portfolio management responsibility. Among other things, the Trustees reviewed biographical information on portfolio management and other professional staff, information regarding each Subadvisor’s organizational and management structure and each Subadvisor’s brokerage policies and practices. The Trustees considered specific information provided regarding the experience of the individual or individuals at each Subadvisor with portfolio management responsibility for the portion of a Fund managed by the Subadvisor, including the information set forth in the Fund’s prospectus and statement of additional information. With respect to those Funds managed with multiple Subadvisors, the Trustees also noted information provided by the Investment Manager regarding the manner in which each Subadvisor’s Investment Strategy complements those utilized by the Fund’s other Subadvisors. In the course of their deliberations, the Trustees evaluated, among other things: (a) the services rendered by each Subadvisor in the past; (b) the qualifications and experience of the Subadvisor’s personnel; and (c) the Subadvisor’s compliance programs. The Trustees also took into account the financial condition of each Subadvisor with respect to its ability to provide the services required under its Subadvisory Agreement.
Performance.
As noted above, the Board considered each Fund’s performance during relevant time periods as compared to each Fund’s Peer Group and considered each Subadvisor’s performance as compared to an appropriate peer group of managed accounts and also considered the gross performance of the Fund or the portion of the Fund managed by each Subadvisor as compared to the Subadvisor’s relevant performance composite that utilizes the same investment strategy and approach and noted that the Board reviews on a quarterly basis detailed information about each Fund’s performance results, portfolio composition and Investment Strategies, including with respect to the portion of the Fund managed by each Subadvisor. The Board noted the Investment Manager’s expertise and resources in monitoring the performance, investment style and risk-adjusted performance of each Subadvisor. The Board also noted each Subadvisor’s performance record with respect to the Funds. The Board was mindful of the Investment Manager’s attention to monitoring each Subadvisor’s performance with respect to the Funds and its discussions with management regarding the factors that contributed to the performance of the Funds.
Advisory Fees and Profitability.
In considering the reasonableness of the advisory fee charged by the Investment Manager for managing each Fund, the Trustees noted that the Investment Manager, and not the Fund, is responsible for paying the fees charged by the Fund’s Subadvisor(s) and, therefore, that the fees paid to the Investment Manager cover the cost of providing portfolio management services as well as the cost of providing search, selection and monitoring services in operating a “manager-of-managers” complex of mutual funds. The Trustees concluded that, in light of the additional high quality supervisory services provided by the Investment Manager and the fact that the subadvisory fees are paid out of the advisory fee, the advisory fee payable by each Fund to the Investment Manager can reasonably
73
Annual Renewal of Investment Advisory Agreements (continued)
be expected to exceed the median advisory fee for the Peer Group, which consists of many funds that do not operate with a manager-of-managers structure. In this regard, the Trustees also noted that the Investment Manager has undertaken to maintain expense limitations for the Funds.
In considering the reasonableness of the advisory fee payable to the Investment Manager, the Trustees also reviewed information provided by the Investment Manager setting forth all revenues and other benefits, both direct and indirect, received by the Investment Manager and its affiliates attributable to managing each Fund and all the mutual funds in the Managers Family of Funds, the cost of providing such services and the resulting profitability to the Investment Manager and its affiliates from these relationships. The Trustees also noted the current and potential asset levels of each Fund and the willingness of the Investment Manager to waive fees and pay expenses for certain of the Funds from time to time as a means of limiting total expenses. The Trustees also considered management’s discussion of the current asset levels of the Funds, including the effect on assets attributable to the economic and market conditions over the past eighteen months, and considered the impact on profitability of the current asset levels and any future growth of assets of the Funds. The Board took into account management’s discussion of the current advisory fee structure. In this regard, the Trustees noted that, unlike a mutual fund that is managed by a single investment adviser, the Funds operate in a manager-of-managers structure. The Trustees also noted that the subadvisory fees are paid by the Investment Manager out of its advisory fee. Based on the foregoing, the Trustees concluded that the profitability to the Investment Manager is reasonable and that the Investment Manager is not realizing material benefits from economies of scale that would warrant adjustments to the advisory fees for any Fund at this time. With respect to economies of scale, the Trustees also noted that as a Fund’s assets increase over time, the Fund may realize other economies of scale to the extent that the increase in assets is proportionally greater than the increase in certain other expenses.
Subadvisory Fees and Profitability.
In considering the reasonableness of the fee payable by the Investment Manager to each Subadvisor, the Trustees relied on the ability of the Investment Manager to negotiate the terms of the Subadvisory Agreement at arm’s length as part of the manager-of-managers structure, noting that the Subadvisor is not affiliated with the Investment Manager. In addition, the Trustees noted that the subadvisory fees are paid by the Investment Manager out of its advisory fee. Accordingly, the cost of services to be provided by the Subadvisor and the profitability to the Subadvisor of its relationship with a Fund were not material factors in the Trustees’ deliberations. For similar reasons, and based on the current size of the portion of a Fund managed by a Subadvisor, the Trustees concluded that any economies of scale being realized by the Subadvisor was not a material factor in the Trustees’ deliberations at this time.
In addition to the foregoing, the Trustees considered the specific factors and related conclusions set forth below with respect to each Fund.
MANAGERS REAL ESTATE SECURITIES FUND
Fund Performance.
Among other information relating to the Fund’s performance, the Trustees noted that the Fund’s performance for the 1-year, 3-year, 5-year and 10-year periods ended March 31, 2010 was above the median performance of the Peer Group for each period and below, above, above and below, respectively, the performance of the Fund Benchmark, the Dow Jones U.S. Select REIT Index (formerly known as Dow Jones Wilshire REIT Index). The Trustees took into account management’s discussion of the Fund’s performance, including the fact that the Fund has performed in the top quartile of the Peer Group for each of the 1-, 3-, and 5-year periods. The Trustees concluded that the Fund’s performance has been satisfactory.
Advisory Fees.
The Trustees noted that the Fund’s advisory fee and total expenses (net of applicable expense waivers/reimbursements) as of March 31, 2010 were both higher than the average for the Peer Group. The Trustees took into account the fact that the Investment Manager has contractually agreed, through March 1, 2011, to limit the Fund’s net annual operating expenses to 1.50%. The Board also took into account the current size of the Fund. The Trustees concluded that, in light of the nature, extent and quality of the services provided by the Investment Manager and the Subadvisor, the Fund’s performance, the foregoing expense limitation and the considerations noted above with respect to the Subadvisor and the Investment Manager, the Fund’s advisory fees are reasonable.
MANAGERS INSTITUTIONAL MICRO-CAP FUND
(formerly Managers Fremont Institutional Micro-Cap Fund)
Fund Performance.
Among other information relating to the Fund’s performance, the Trustees noted that the Fund’s performance for the 1-year, 3-year, 5-year and 10-year periods ended March 31, 2010 was below, above, above and below, respectively, the median performance of the Peer Group and for the 1-year, 3-year and 5-year periods ended March 31, 2010 was below, above and above, respectively, the performance of the Fund Benchmark, the Russell Microcap Index. The Trustees noted that the Investment Manager recently replaced a Subadvisor to the Fund, and also, at meetings held on December 3-4, 2009, the Trustees previously noted that the strategy managed by the Fund’s new Subadvisor had outperformed the Fund Benchmark in each full calendar year since the Benchmark’s inception (May 2003). The Trustees also took into account the fact that the Fund has outperformed the Fund Benchmark by more than five percent on an annual basis over the last three years and has been in the second quartile of the Peer Group during this time. The Trustees concluded that the Fund’s overall performance has been addressed and has been satisfactory in light of all factors considered.
74
Annual Renewal of Investment Advisory Agreements (continued)
Advisory Fees.
The Trustees noted that the Fund’s advisory fee and total expenses (net of applicable expense waivers/reimbursements) as of March 31, 2010 were higher and lower, respectively, than the average for the Peer Group. The Trustees took into account the fact that the Investment Manager has contractually agreed to lower the Fund’s contractual expense limitation from 1.35% to 1.23% of the Fund’s net annual operating expenses effective July 1, 2010 through at least March 1, 2012. The Board also took into account the current size of the Fund. The Trustees concluded that, in light of the nature, extent and quality of the services provided by the Investment Manager and the Subadvisors, the Fund’s performance, the foregoing expense limitation and the considerations noted above with respect to the Subadvisors and the Investment Manager, the Fund’s advisory fees are reasonable.
MANAGERS MICRO-CAP FUND
(formerly Managers Fremont Micro-Cap Fund)
Fund Performance.
Among other information relating to the Fund’s performance, the Trustees noted that the Fund’s performance for the 1-year, 3-year, 5-year and 10-year periods ended March 31, 2010 was below, above, above and below, respectively, the median performance of the Peer Group and for the 1-year, 3-year and 5-year periods ended March 31, 2010 was below, above and above, respectively, the performance of the Fund Benchmark, the Russell Microcap Index. The Trustees noted that the Investment Manager recently replaced a Subadvisor to the Fund, and also, at meetings held on December 3-4, 2009, the Trustees previously noted that the strategy managed by the Fund’s new Subadvisor had outperformed the Fund Benchmark in each full calendar year since the Benchmark’s inception (May 2003). The Trustees also took into account management’s discussion of the Fund’s performance, noting that the Fund has outperformed the Fund Benchmark by more than five percent on an annual basis over the last three years and has been in the second quartile of the Peer Group during this time. The Trustees concluded that the Fund’s overall performance has been addressed and has been satisfactory in light of all factors considered.
Advisory Fees.
The Trustees noted that the Fund’s advisory fee and total expenses (net of applicable expense waivers/reimbursements) as of March 31, 2010 were both higher than the average for the Peer Group. The Trustees took into account the fact that the Investment Manager has contractually agreed to lower the Fund’s contractual expense limitation from 1.56% to 1.43% of the Fund’s net annual operating expenses effective July 1, 2010 through at least March 1, 2012. The Trustees concluded that, in light of the nature, extent and quality of the services provided by the Investment Manager and the Subadvisors, the Fund’s performance, the foregoing expense limitation and the considerations noted above with respect to the Subadvisors and the Investment Manager, the Fund’s advisory fees are reasonable.
MANAGERS CALIFORNIA INTERMEDIATE TAX-FREE FUND
Fund Performance.
Among other information relating to the Fund’s performance, the Trustees noted that the Fund’s performance for the 1-year, 3-year, 5-year and 10-year periods ended March 31, 2010 was below, below, above and above, respectively, the median performance of the Peer Group and below the performance of the Fund Benchmark, the Barclays Capital 5-Year Municipal Bond Index, for each period. The Trustees took into account management’s discussion of the impact of current market conditions on the Fund’s performance because of the Fund’s investment style. The Trustees also took into account management’s discussion of the Fund’s performance, including the fact that the Fund has placed in the top 35 percent of the Peer Group for the 5-year and 10-year periods The Trustees concluded that the Fund’s overall performance has been satisfactory in light of all factors considered.
Advisory Fees.
The Trustees noted that the Fund’s advisory fee and total expenses (net of applicable expense waivers/reimbursements) as of March 31, 2010 were higher and lower, respectively, than the average for the Peer Group. The Trustees took into account the fact that the Investment Manager has contractually agreed, through March 1, 2011, to limit the Fund’s net annual operating expenses to 0.55%. The Board also took into account the current size of the Fund. The Trustees concluded that, in light of the nature, extent and quality of the services provided by the Investment Manager and the Subadvisor, the foregoing expense limitation and the considerations noted above with respect to the Subadvisor and the Investment Manager, the Fund’s advisory fees are reasonable.
* * * *
After consideration of the foregoing, the Trustees also reached the following conclusions regarding the Investment Management Agreement and each Subadvisory Agreement, in addition to those conclusions discussed above: (a) the Investment Manager and each Subadvisor have demonstrated that they possess the capability and resources to perform the duties required of them under the Investment Management Agreement and the applicable Subadvisory Agreements; (b) each Subadvisor’s Investment Strategy is appropriate for pursuing the applicable Fund’s investment objectives; (c) each Subadvisor is reasonably likely to execute its Investment Strategy consistently over time; and (d) the Investment Manager and each Subadvisor maintain appropriate compliance programs.
Based on all of the above-mentioned factors and their related conclusions, with no single factor or conclusion being determinative and with each Trustee not necessarily attributing the same weight to each factor, the Trustees concluded that approval of each Investment Management Agreement and each Subadvisory Agreement (as applicable) would be in the best interests of each Fund and its shareholders. Accordingly, on June 10-11, 2010, the Trustees, including a majority of the Independent Trustees, voted to approve the Investment Management Agreement and the Subadvisory Agreements (as applicable) for each Fund, with the exception of RBC Global Asset Management (U.S.) Inc. (which contracts had previously been approved at meetings held on December 3-4, 2009).
75
Investment Manager and Administrator
Managers Investment Group LLC
333 W. Wacker Drive
Suite 1200
Chicago, IL 60606
(800) 835-3879
Distributor
Managers Distributors, Inc.
333 W. Wacker Drive
Suite 1200
Chicago, IL 60606
(800) 835-3879
Custodian
The Bank of New York Mellon
2 Hanson Place
Brooklyn, New York 11217
Legal Counsel
Ropes & Gray LLP
Prudential Tower, 800 Boylston Street
Boston, Massachusetts 02199-3600
Transfer Agent
BNY Mellon Investment Servicing (US) Inc.*
Attn: Managers
P.O. Box 9769
Providence, Rhode Island 02940
(800) 548-4539
For Managers Choice Only
Managers
c/o BNY Mellon Investment Servicing (US) Inc.*
P.O. Box 9847
Providence, Rhode Island 02940-8047
(800) 358-7668
| * | Formerly PNC Global Investment Servicing (U.S.) Inc. |
MANAGERSAND MANAGERS AMG FUNDS
| | | | |
EQUITY FUNDS | | BALANCED FUNDS |
CADENCE CAPITAL APPRECIATION | | INTERNATIONAL EQUITY | | CHICAGO EQUITY PARTNERS BALANCED |
CADENCE FOCUSED GROWTH | | AllianceBernstein L.P. | | Chicago Equity Partners, LLC |
CADENCE MID-CAP | | Lazard Asset Management, LLC | | |
CADENCE EMERGING COMPANIES | | Martin Currie Inc. | | ALTERNATIVE FUNDS |
| Cadence Capital Management, LLC | | | | |
| | REAL ESTATE SECURITIES | | FQ GLOBAL ALTERNATIVES |
CHICAGO EQUITY PARTNERS MID-CAP | | Urdang Securities Management, Inc. | | FQ GLOBAL ESSENTIALS |
| Chicago Equity Partners, LLC | | | | First Quadrant, L.P. |
| | RENAISSANCE LARGE CAP GROWTH | | |
EMERGING MARKETS EQUITY | | Renaissance Group LLC | | INCOME FUNDS |
| Rexiter Capital Management Limited | | | | BOND (MANAGERS) |
Schroder Investment Management North America Inc. ESSEX GROWTH ESSEX LARGE CAP GROWTH | | SKYLINE SPECIAL EQUITIES PORTFOLIO Skyline Asset Management, L.P. | | FIXED INCOME GLOBAL BOND Loomis, Sayles & Co., L.P. |
ESSEX SMALL/MICRO CAP GROWTH | | SPECIAL EQUITY | | BOND (MANAGERS PIMCO) |
| Essex Investment Management Co., LLC | | Ranger Investment Management, L.P. Lord, Abbett & Co. LLC | | Pacific Investment Management Co. LLC |
| | |
| FQ TAX-MANAGED U.S. EQUITY | | Smith Asset Management Group, L.P. | | CALIFORNIA INTERMEDIATE TAX-FREE |
| FQ U.S. EQUITY | | Federated MDTA LLC | | Miller Tabak Asset Management LLC |
| First Quadrant, L.P. | | | | |
| | SYSTEMATIC VALUE | | GW&K MUNICIPAL BOND |
FRONTIER SMALL CAP GROWTH | | SYSTEMATIC MID CAP VALUE | | GW&K MUNICIPAL ENHANCED YIELD |
| Frontier Capital Management Company, LLC | | Systematic Financial Management, L.P. | | Gannett Welsh & Kotler, LLC |
| | |
| GW&K SMALL CAP EQUITY | | TIMESSQUARE MID CAP GROWTH | | HIGH YIELD |
| Gannett Welsh & Kotler, LLC | | TIMESSQUARE SMALL CAP GROWTH | | J.P. Morgan Investment Management LLC |
| | TSCM GROWTH EQUITY | | |
INSTITUTIONAL MICRO-CAP MICRO-CAP | | TimesSquare Capital Management, LLC | | INTERMEDIATE DURATION GOVERNMENT SHORT DURATION GOVERNMENT |
| Lord,Abbett&Co.LLC | | | | Smith Breeden Associates, Inc. |
| WEDGE Capital Management L.L.P. | | | | |
| Next Century Growth Investors LLC | | | | |
| RBC Global Asset Management (U.S.) Inc. | | | | |
This report is prepared for the Funds’ shareholders. It is authorized for distribution to prospective investors only when preceded or accompanied by an effective prospectus. To receive a free copy of the prospectus or Statement of Additional Information, which includes additional information about Fund Trustees, please contact us by calling 800.835.3879. Distributed by Managers Distributors, Inc., member FINRA.
A description of the policies and procedures each Fund uses to vote its proxies is available: (i) without charge, upon request, by calling 800.835.3879, or (ii) on the Securities and Exchange Commission’s (SEC) Web site at www.sec.gov. For information regarding each Fund’s proxy voting record for the 12-month period ended June 30, call 800.835.3879 or visit the SEC Web site at www.sec.gov.
The Funds file their complete schedule of portfolio holdings with the SEC for the first and third quarters of each fiscal year on Form N-Q. The Funds’ Forms N-Q are available on the SEC’s website at www.sec.gov. A Fund’s Forms N-Q may be reviewed and copied at the SEC’s Public Reference Room in Washington, DC. Information on the operation of the Public Reference Room may be obtained by calling 800.SEC.0330. To review a complete list of the Funds’ portfolio holdings, or to view the most recent quarterly holdings report, semiannual report, or annual report, please visit www.managersinvest.com.
www.managersinvest.com

Registrant has adopted a Code of Ethics. See attached Exhibit (a)(1).
| Item 3. | AUDIT COMMITTEE FINANCIAL EXPERT |
Registrant’s Board of Trustees has determined that independent Trustees Mr. Jack W. Aber and Mr. Steven J. Paggioli each qualify as the Audit Committee Financial Expert. Mr. Aber and Mr. Paggioli are “independent” as such term is defined in Form N-CSR.
| Item 4. | PRINCIPAL ACCOUNTANT FEES AND SERVICES |
The aggregate fees billed by PwC to the Fund for the Funds’ two most recent fiscal years for professional services rendered for audits of annual financial statements, or services that are normally provided in connection with statutory and regulatory filings or engagements (“Audit Fees”) were as follows:
| | | | | | | | |
| | | Fiscal 2010 | | | Fiscal 2009 | |
Managers AMG FQ Tax-Managed U.S. Equity Fund | | | 20,454 | | | | 21,519 | |
Managers AMG FQ U.S. Equity Fund | | | 20,328 | | | | 21,387 | |
Managers AMG FQ Global Alternatives Fund | | | 27,712 | | | | 31,260 | |
Managers AMG FQ Global Essentials Fund | | | 22,832 | | | | 26,126 | |
Managers Frontier Small Cap Growth Fund | | | 18,549 | | | | 21,619 | |
Managers Micro-Cap Fund | | | 18,851 | | | | 19,833 | |
Managers Institutional Micro-Cap Fund | | | 18,931 | | | | 19,917 | |
Managers Real Estate Securities Fund | | | 19,769 | | | | 20,799 | |
Managers PIMCO Bond Fund | | | 40,987 | | | | 43,122 | |
Managers CA Intermediate Tax-Free Fund | | | 19,503 | | | | 20,519 | |
Managers AMG TSCM Growth Equity Fund1 | | | 12,000 | | | | 0 | |
| 1 | Fund commenced operations on August 1, 2010 |
Audit-Related Fees
There were no fees billed by PwC to the Fund in its two recent fiscal years for services rendered for assurance and related services that are reasonably related to the performance of the audit or review of the Fund’s financial statements, but are not reported as Audit Fees (“Audit-Related Fees”).
For the Funds’ two most recent fiscal years, there were no Audit-Related Fees billed by PwC for engagements related directly to the operations and financial reporting of one or more Funds by a Fund Service Provider. A Fund Service Provider is (a) any investment adviser to the Fund (not including any Subadvisor whose role is primarily
portfolio management and is subcontracted with or overseen by another investment adviser) or (b) any entity that provides ongoing services to the Fund and is controlling, controlled by or under common control with a Fund investment adviser described in (a).
Tax Fees
The aggregate fees billed by PwC to the Funds for the two most recent fiscal years for professional services rendered for tax compliance, tax advice, and tax planning (“Tax Fees”) were as follows:
| | | | | | | | |
| | | Fiscal 2010 | | | Fiscal 2009 | |
Managers AMG FQ Tax-Managed U.S. Equity Fund | | | 6,900 | | | | 6,900 | |
Managers AMG FQ U.S. Equity Fund | | | 6,900 | | | | 6,500 | |
Managers AMG FQ Global Alternatives Fund | | | 11,200 | | | | 11,200 | |
Managers AMG FQ Global Essentials Fund | | | 9,600 | | | | 9,600 | |
Managers Frontier Small Cap Growth Fund | | | 6,650 | | | | 6,650 | |
Managers Micro-Cap Fund | | | 6,500 | | | | 6,500 | |
Managers Institutional Micro-Cap Fund | | | 5,800 | | | | 5,800 | |
Managers Real Estate Securities Fund | | | 10,100 | | | | 10,100 | |
Managers PIMCO Bond Fund | | | 11,200 | | | | 11,200 | |
Managers CA Intermediate Tax-Free Fund | | | 8,500 | | | | 8,500 | |
Managers AMG TSCM Growth Equity Fund1 | | | 5,300 | | | | 0 | |
| 1 | Fund commenced operations on August 1, 2010 |
For the Funds’ two most recent fiscal years, Tax Fees billed by PwC for engagements by Fund Service Providers that related directly to the operations and financial reporting of the Funds were $0 for fiscal 2007 and $0 for fiscal 2006, respectively.
The services for which Tax Fees were charged comprise all services performed by professional staff in PwC’s tax division except those services related to the audit. Typically, this category would include fees for tax compliance, tax planning, and tax advice. Tax compliance, tax advice, and tax planning services include preparation of original and amended tax returns, claims for refund and tax payment-planning services, assistance with tax audits and appeals, tax advice related to mergers and acquisitions and requests for rulings or technical advice from taxing authorities.
All Other Fees
There were no other fees billed by PwC to the Funds for all other non-audit services (“Other Fees”) during the Funds’ two most recent fiscal years. During the same period, there were no Other Fees billed by PwC for engagements by Fund Service Providers that related directly to the operations and financial reporting of the Funds.
According to policies adopted by the Audit Committee, services provided by PwC to the Funds must be pre-approved by the Audit Committee. On an annual basis, the Audit Committee reviews and pre-approves various types of services that PwC may perform for the Funds without specific approval of each engagement, subject to specified budget limitations. As contemplated by the Sarbanes-Oxley Act of 2002 and related SEC rules, the Audit Committee also pre-approves non-audit services provided by PwC to any Fund Service Provider for any engagement that relates directly to the operations and financial reporting of the Funds. Any engagement that is not already pre-approved or that will exceed a pre-approved budget must be submitted to the Audit Committee for pre-approval. The Chairman of the Audit Committee is authorized on behalf of the Board of Trustees and the Audit Committee to approve the engagement of PwC to perform non-audit services subject to certain conditions, including notification to the Audit Committee of such pre-approval not later than the next meeting of the Audit Committee following the date of such pre-approval.
There were no other fees billed by PwC for non-audit services rendered to the Funds and to Fund Service Providers for the Funds’ two most recent fiscal years.
The Audit Committee has considered whether the provision of non-audit services by PwC to Fund Service Providers that were not required to be pre-approved by the Audit Committee is compatible with maintaining PwC’s independence in its audit of the Funds, taking into account representations from PwC, in accordance with Independence Standards Board Standard No. 1, regarding its independence from the Funds and its related entities.
The following table sets forth the non-audit services provided by PwC to the Funds and its service affiliates defined as the Funds’ investment advisor and any entity controlling, controlled by or under common control with Managers Investment Group LLC that provides ongoing services to the Funds (“Control Affiliates”) for the last two fiscal years.
| | | | | | | | | | | | | | | | | | | | | | | | |
| | | Audit-related fees A | | | Tax fees A | | | All other fees A | |
| | | 2010 | | | 2009 | | | 2010 | | | 2009 | | | 2010 | | | 2009 | |
Control Affiliates | | $ | 580,765 | | | $ | 343,015 | | | $ | 479,175 | | | $ | 897,895 | | | $ | 0 | | | $ | 0 | |
| A | Aggregate amounts may reflect rounding. |
| Item 5. | AUDIT COMMITTEE OF LISTED REGISTRANTS |
Not applicable.
| Item 6. | SCHEDULE OF INVESTMENTS |
The schedule of investments in unaffiliated issuers as of the close of the reporting period is included as part of the shareholder report contained in Item 1 hereof.
| Item 7. | DISCLOSURE OF PROXY VOTING POLICIES AND PROCEDURES FOR CLOSED-END MANAGEMENT INVESTMENT COMPANIES |
Not applicable.
| Item 8. | PORTFOLIO MANAGERS OF CLOSED-END MANAGEMENT INVESTMENT COMPANIES |
Not applicable.
| Item 9. | PURCHASES OF EQUITY SECURITIES BY CLOSED-END MANAGEMENT INVESTMENT COMPANIES AND AFFILIATED PURCHASERS |
Not applicable.
| Item 10. | SUBMISSION OF MATTERS TO A VOTE OF SECURITY HOLDERS |
Not applicable.
| Item 11. | CONTROLS AND PROCEDURES |
(a) The Registrant’s principal executive and principal financial officers have concluded, based on their evaluation of the registrant’s disclosure controls and procedures as of a date within 90 days of the filing of this report, that the Registrant’s disclosure controls and procedures are reasonably designed to ensure that information required to be disclosed by the Registrant on Form N-CSR is recorded, processed, summarized and reported within the required time periods and that information required to be disclosed by the registrant in the reports that it files or submits on Form N-CSR is accumulated and communicated to the Registrant’s management, including its principal executive and principal financial officers, as appropriate to allow timely decisions regarding required disclosure.
(b) There were no changes in the Registrant’s internal control over financial reporting during the Registrant’s fourth fiscal quarter of the period covered by this report that have materially affected, or are reasonably likely to affect, the internal control over financial reporting.
| | |
(a) (1) | | Any Code of Ethics or amendments hereto. Filed herewith. |
| |
(a) (2) | | Certifications pursuant to Rule 30a-2(a) under the Investment Company Act of 1940 - Filed herewith. |
| |
(a) (3) | | Not applicable. |
| |
(b) | | Certifications pursuant to Rule 30a-2(b) under the Investment Company Act of 1940 - Filed herewith. |
SIGNATURES
Pursuant to the requirements of the Securities Exchange Act of 1934 and the Investment Company Act of 1940, the registrant has duly caused this report to be signed on its behalf by the undersigned, thereunto duly authorized.
| | |
| MANAGERS TRUST I |
| |
| By: | | /s/ JOHN H. STREUR |
| | John H. Streur, President |
Date: January 4, 2011
Pursuant to the requirements of the Securities Exchange Act of 1934 and the Investment Company Act of 1940, this report has been signed below by the following persons on behalf of the registrant and in the capacities and on the dates indicated.
| | |
| By: | | /s/ JOHN H. STREUR |
| | John H. Streur, President |
Date: January 4, 2011
| | |
| By: | | /s/ DONALD S. RUMERY |
| | Donald S. Rumery, Chief Financial Officer |
Date: January 4, 2011