UNITED STATES
SECURITIES AND EXCHANGE COMMISSION
Washington, D.C. 20549
FORM N-CSR
CERTIFIED SHAREHOLDER REPORT OF
REGISTERED MANAGEMENT INVESTMENT COMPANIES
Investment Company Act file number: 811-06520
MANAGERS TRUST I
(Exact name of registrant as specified in charter)
800 Connecticut Avenue, Norwalk, Connecticut 06854
(Address of principal executive offices) (Zip code)
Managers Investment Group LLC
800 Connecticut Avenue, Norwalk, Connecticut 06854
(Name and address of agent for service)
Registrant’s telephone number, including area code: (203) 299-3500
| | |
| Date of fiscal year end: | | OCTOBER 31 |
| |
Date of reporting period: | | NOVEMBER 1, 2007 – OCTOBER 31, 2008 |
| | (Annual Shareholder Report) |
| Item 1. | Reports to Shareholders |
ANNUAL REPORT
Managers AMG
October 31, 2008
FQ Tax-Managed U.S. Equity Fund
FQ U.S. Equity Fund
FQ Global Alternatives Fund

AR014-1008
Managers AMG FQ Funds
FQ Tax-Managed U.S. Equity, FQ U.S. Equity, FQ Global Alternatives
Annual Report—October 31, 2008
| | |
TABLE OF CONTENTS | | Page |
LETTER TO SHAREHOLDERS | | 1 |
| |
ABOUT YOUR FUND’S EXPENSES | | 3 |
| |
INVESTMENT MANAGER’S COMMENTS, FUND SNAPSHOTS, AND SCHEDULES OF PORTFOLIO INVESTMENTS | | |
| |
FQ Tax-Managed U.S. Equity Fund | | 4 |
| |
FQ U.S. Equity Fund | | 9 |
| |
FQ Global Alternatives Fund | | 16 |
| |
FINANCIAL STATEMENTS: | | |
| |
Statements of Assets and Liabilities | | 18 |
FQ Tax-Managed U.S. Equity and FQ U.S. Equity | | |
Fund balance sheets, net asset value (NAV) per share computations and cumulative undistributed amounts | | |
| |
Statement of Net Assets | | 19 |
FQ Global Alternatives | | |
Portfolio of Investments, Fund balance sheet, net asset value (NAV) per share computation and cumulative undistributed amounts | | |
| |
Statements of Operations | | 20 |
Detail of sources of income, Fund expenses, and realized and unrealized gains (losses) during the fiscal year | | |
| |
Statements of Changes in Net Assets | | 21 |
Detail of changes in Fund assets for the past two fiscal years | | |
| |
FINANCIAL HIGHLIGHTS | | 22 |
Historical net asset values per share, distributions, total returns, expense ratios, turnover ratios and net assets | | |
| |
NOTES TO FINANCIAL STATEMENTS | | 27 |
Accounting and distribution policies, details of agreements and transactions with Fund management and affiliates, and descriptions of certain investment risks | | |
| |
REPORT OF INDEPENDENT REGISTERED PUBLIC ACCOUNTING FIRM | | 35 |
| |
TRUSTEES AND OFFICERS | | 36 |
| |
ANNUAL RENEWAL OF INVESTMENT ADVISORY AGREEMENTS | | 37 |
Nothing contained herein is to be considered an offer, sale or solicitation of an offer to buy shares of The Managers Funds or Managers AMG Funds. Such offering is made only by Prospectus, which includes details as to offering price and other material information.
Letter to Shareholders
Dear Shareholder:
As has been well documented, the financial markets were under significant pressure during a majority of the one-year period ending October 31, 2008. The year began with investors focused on the U.S. housing crisis and eventually shifted toward concerns about a broader credit crisis both in the U.S. and abroad. Despite these fears, stocks saw a rebound in April and May before selling off dramatically towards the end of the second quarter as investors’ concerns over surging commodity prices, continuing fallout from the credit crisis, slowing economic growth, and declining corporate profits took center stage.
Volatility remained high during July and August as major headlines in the news included reports of falling energy and commodity prices along with higher-than-expected economic growth. This was countered by further contraction in housing, weakness in the labor markets, tighter credit conditions, and uncertainty about the stability of Fannie Mae and Freddie Mac. The months of July and August proved to be the calm before the storm, as the number of events significantly affecting the markets in September, greatly outnumbered any other period in recent memory. September included the U.S. Treasury’s bailout of mortgage agencies Fannie Mae and Freddie Mac as well as insurer AIG. In addition, market turmoil even extended to money markets where interbank lending rates soared to record highs as banks hoarded cash. In October, Congress approved a $700 billion “bailout” called the Troubled Asset Relief Program (TARP) with the goal of opening up credit markets by buying distressed assets.
Equity losses were dramatic as a result of the market turmoil. For the period, the Russell 1000® (large cap), Russell 2000® (small cap), and the Russell 3000® (all cap) Indexes returned -36.80%, -34.16%, and -36.60%, respectively. International stocks underperformed their domestic counterparts as the MSCI EAFE Index returned -46.62% in U.S. dollar terms, although international investments outperformed when measured in local terms, as captured by the MSCI EAFE Index, returning -41.31%. This deviation in performance from U.S. dollar to local currency returns was driven by the strengthening U.S. dollar during this period. Fixed income securities were certainly not immune to recent financial events either in the U.S. or abroad as the Barclays Capital U.S. Aggregate Index® and the Barclays Capital Global Aggregate Index® yielded mixed performance, returning 0.30% and -2.57%, respectively.
Against this backdrop, for the one-year period ended October 31, 2008, the Managers AMG FQ U.S. Equity Fund (“U.S. Equity Fund”) returned -36.43% and the Managers AMG FQ Tax-Managed U.S. Equity Fund (“Tax-Managed Fund”) returned -40.26% compared to -36.60% for the benchmark Russell 3000® Index. Both Funds have performed well over the last three and five year periods on an absolute, relative, and peer universe basis. As for the Managers AMG FQ Global Alternatives Fund (“Global Alternatives Fund”) it returned 12.07% compared to a return of 1.97% for the benchmark 30-day Treasury bill for the one year period ended October 31, 2008.
| | | | | | | | | | | | | | | | | | |
Periods Ended 10/31/08 | | 6 Months | | | 1 Year | | | 3 Years | | | 5 Years | | | 10 Years | | | Since Inception | |
Managers AMG FQ Tax-Managed U.S. Equity (I) | | (28.80 | )% | | (40.26 | )% | | (5.41 | )% | | 1.58 | % | | — | | | 0.36 | % |
Russell 3000® Index | | (29.70 | )% | | (36.60 | )% | | (5.46 | )% | | 0.46 | % | | 1.05 | % | | (1.62 | )% |
Managers AMG FQ U.S. Equity (I) | | (28.09 | )% | | (36.43 | )% | | (3.46 | )% | | 2.29 | % | | 0.85 | % | | 6.47 | % |
Russell 3000® Index | | (29.70 | )% | | (36.60 | )% | | (5.46 | )% | | 0.46 | % | | 1.05 | % | | N/A | |
Managers AMG FQ Global Alternatives (A) (No Load) | | 9.90 | % | | 12.07 | % | | — | | | — | | | — | | | 4.99 | % |
Citigroup 1-Month Treasury Bill Index 1 | | 0.70 | % | | 1.97 | % | | — | | | — | | | — | | | 3.69 | % |
1 | Performance for the Citigroup 1-Month U.S. Treasury Bill Index reflects an inception date of March 31, 2006. |
Performance for all share classes and detailed Fund positioning reviews are included within this report.
It was a disappointing year for both the U.S. Equity and the Tax-Managed Funds on an absolute basis as these equity portfolios were not immune to the broader economic upheaval that brought significant losses to the equity markets. Relative to the benchmark, sector positioning was positive for both Portfolios as an underweight to the struggling financials sectors was beneficial. Both portfolios did, however, experience negative impact
1
Letter to Shareholders (continued)
from stock selection in certain areas of the market, including within the struggling consumer discretionary and energy sectors. Meanwhile, the style positioning in the Funds was neutral relative to the benchmark, as each Fund was positioned broadly in line with the Russell 3000® Index from a style perspective. The Tax-Managed Fund, meanwhile, continues to operate with a sizeable tax loss carry forward, creating the potential to benefit tax-sensitive shareholders during the next few years during tax time.
The Funds’ subadvisor, First Quadrant L.P. (“First Quadrant”), remains concerned about the current market conditions and the slowing global economy. As such, the portfolio management team at First Quadrant continues to position the Funds defensively across a majority of exposures, such as value and growth, in line with the Russell 3000® Index. The Funds do, however, continue to generally favor lower-yielding stocks, while smaller-capitalization issues have begun to look increasingly compelling. Additional holdings were added to both portfolios over the last six months as the higher volatility of markets resulted in the need to better diversify each Fund in order to maintain risk profiles consistent with long-term targets.
Meanwhile, the Global Alternatives Fund’s favorable positive performance during a difficult period for the global capital markets can be attributed to its unique investment and portfolio construction process that focuses on seeking to generate positive absolute performance regardless of the market cycle. During this period, the solid performance reflects First Quadrant’s currency selection strategy where a majority of the positions, both long and short, but particularly the long to the U.S. dollar over the last several months, were profitable.
The tactical risk allocation in the Fund has begun to find its most compelling opportunities within the bond country selection strategy where the largest active positions are long positions relative to the Japanese and U.S. bond markets, and a short position relative to the Australian bond market. Within the stock country selection strategy, the largest active positions reflect a strategy to be long to the U.S. equity market and short to the Canadian equity market. The opportunity within currency markets has come down considerably over the last several months. However some significant currency exposure still remains as the Fund is positioned long to the U.S. dollar and short to the euro. The current historic volatility levels being witnessed in global capital markets are an opportunity for this Fund. Periods of market turmoil often result in significant mispricing that can be taken advantage of by an active global macro strategy such as this.
One of our foremost goals at Managers Investment Group is to structure and manage mutual funds that will help our shareholders and clients become more successful in reaching their investment goals and objectives. Each of our Funds is geared to provide you with exposure to a specific asset class, combination of asset classes, or segment of the market. Investors tend to use our Funds as part of their overall asset allocation in order to structure a well-diversified portfolio intended to meet individual needs. Most of our Funds, like the Managers AMG FQ U.S. Equity Fund, Managers AMG FQ Tax-Managed U.S. Equity Fund, and Managers AMG FQ Global Alternatives Fund, are therefore designed to be building blocks.
The following report covers the one-year period ended October 31, 2008. Should you have any questions about this report, or if you’d like to receive a prospectus and additional information, including fees and expenses for these or any of the other Funds in our family, please feel free to contact us at 1-800-835-3879, or visit our Web site at www.managersinvest.com. As always, please read the prospectus carefully before you invest or send money.
If you are curious about how you can better diversify your investment program, visit the Knowledge Center on our Web site and view our articles in the investment strategies section. You can rest assured that under all market conditions our team is focused on delivering excellent investment management services for your benefit.
We thank you for your continued confidence and investment in The Managers Funds.
|
| Respectfully, |
|
 |
| John H. Streur |
| Senior Managing Partner |
| Managers Investment Group LLC |
2
About Your Fund’s Expenses
As a shareholder of a Fund, you may incur two types of costs: (1) transaction costs, which may include sales charges (loads) on purchase payments; redemption fees; and exchange fees; and (2) ongoing costs, including management fees; distribution (12b-1) fees; and other Fund expenses. This example is intended to help you understand your ongoing costs (in dollars) of investing in the Fund and to compare these costs with the ongoing costs of investing in other mutual funds. The example is based on $1,000 invested at the beginning of the period and held for the entire period as indicated below.
Actual Expenses
The first line of the table to the right provides information about the actual account values and actual expenses. You may use the information in this line, together with the amount you invested, to estimate the expenses that you paid over the period. Simply divide your account value by $1,000 (for example, an $8,600 account value divided by $1,000 = 8.6), then multiply the result by the number in the first line under the heading entitled “Expenses Paid During Period” to estimate the expenses you paid on your account during this period.
Hypothetical Example for Comparison Purposes
The second line of the table to the right provides information about hypothetical account values and hypothetical expenses based on the Fund’s actual expense ratio and an assumed annual rate of return of 5% before expenses, which is not the Fund’s actual return. The hypothetical account values and expenses may not be used to estimate the actual ending account balance or expenses you paid for the period. You may use this information to compare the ongoing costs of investing in the Fund and other funds by comparing this 5% hypothetical example with the 5% hypothetical examples that appear in the shareholder reports of other funds.
Please note that the expenses shown in the table are meant to highlight your ongoing costs only and do not reflect any transactional costs, such as sales charges (loads), redemption fees, or exchange fees. Therefore, the second line of the table is useful in comparing ongoing costs only, and will not help you determine the relative total costs of owning different funds.
| | | | | | | | | | | | |
Six Months Ended October 31, 2008 | | Expense
Ratio for
the Period | | | Beginning
Account Value
5/1/08 | | Ending
Account Value
10/31/08 | | Expenses
Paid During
the Period* |
FQ Tax-Managed U.S. Equity Fund | | | | | | | | | | | | |
Class A Shares | | | | | | | | | | | | |
Based on Actual Fund Return | | 1.24 | % | | $ | 1,000 | | $ | 703 | | $ | 5.31 |
Hypothetical (5% return before expenses) | | 1.24 | % | | $ | 1,000 | | $ | 1,019 | | $ | 6.29 |
Class C Shares | | | | | | | | | | | | |
Based on Actual Fund Return | | 1.99 | % | | $ | 1,000 | | $ | 708 | | $ | 8.54 |
Hypothetical (5% return before expenses) | | 1.99 | % | | $ | 1,000 | | $ | 1,015 | | $ | 10.08 |
Institutional Class Shares | | | | | | | | | | | | |
Based on Actual Fund Return | | 0.99 | % | | $ | 1,000 | | $ | 712 | | $ | 4.26 |
Hypothetical (5% return before expenses) | | 0.99 | % | | $ | 1,000 | | $ | 1,020 | | $ | 5.03 |
FQ U.S. Equity Fund | | | | | | | | | | | | |
Class A Shares | | | | | | | | | | | | |
Based on Actual Fund Return | | 1.04 | % | | $ | 1,000 | | $ | 719 | | $ | 4.49 |
Hypothetical (5% return before expenses) | | 1.04 | % | | $ | 1,000 | | $ | 1,020 | | $ | 5.28 |
Class C Shares | | | | | | | | | | | | |
Based on Actual Fund Return | | 1.79 | % | | $ | 1,000 | | $ | 716 | | $ | 7.72 |
Hypothetical (5% return before expenses) | | 1.79 | % | | $ | 1,000 | | $ | 1,016 | | $ | 9.07 |
Institutional Class Shares | | | | | | | | | | | | |
Based on Actual Fund Return | | 0.79 | % | | $ | 1,000 | | $ | 719 | | $ | 3.41 |
Hypothetical (5% return before expenses) | | 0.79 | % | | $ | 1,000 | | $ | 1,021 | | $ | 4.01 |
FQ Global Alternatives Fund | | | | | | | | | | | | |
Class A Shares | | | | | | | | | | | | |
Based on Actual Fund Return | | 1.99 | % | | $ | 1,000 | | $ | 1,099 | | $ | 10.50 |
Hypothetical (5% return before expenses) | | 1.99 | % | | $ | 1,000 | | $ | 1,015 | | $ | 10.08 |
Class C Shares | | | | | | | | | | | | |
Based on Actual Fund Return | | 2.74 | % | | $ | 1,000 | | $ | 1,094 | | $ | 14.42 |
Hypothetical (5% return before expenses) | | 2.74 | % | | $ | 1,000 | | $ | 1,011 | | $ | 13.85 |
| * | Expenses are equal to the Fund’s annualized expense ratio multiplied by the average account value over the period, multiplied by the number of days in the most recent fiscal half-year (184), then divided by 366. |
3
Managers AMG FQ Tax-Managed U.S. Equity Fund
Portfolio Manager’s Comments
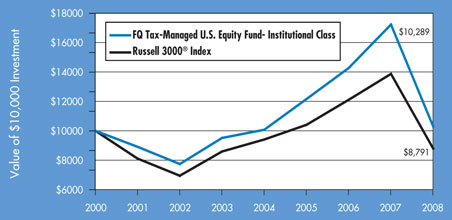
For the fiscal year ending October 31, 2008, the Fund returned -40.26% compared to -36.60% for the benchmark Russell 3000® Index. Please refer to the table on page 5 for returns for various classes of shares.
The financial markets were under significant pressure for the majority of the past year. The period began with the focus of investors on the U.S. housing crisis and eventually morphed into concerns about a broader credit crisis both in the U.S. and abroad. Despite these fears, stocks saw a rebound in April and May before selling off dramatically toward the end of the second quarter as investors’ concerns over surging commodity prices, continuing fallout from the credit crisis, slowing economic growth, and declining corporate profits took center stage. Volatility remained high during July and August as major headlines included falling energy and commodity prices along with higher-than-expected economic growth, countered by further contraction in housing, weakness in the labor markets, tighter credit conditions, and uncertainty about the stability of Fannie Mae and Freddie Mac. July and August proved to be the calm before the storm, as the number of events significantly affecting the markets in September greatly outnumbered any other period in recent memory. September included the U.S. Treasury’s bailout of mortgage agencies Fannie Mae and Freddie Mac, as well as insurer AIG. Market turmoil even extended to money markets where interbank lending rates soared to record highs as banks hoarded cash. In October, Congress approved a $700 billion “bailout” called the Troubled Asset Relief Program (TARP) with the goal of opening up credit markets by buying distressed assets.
The Fund delivered a disappointing absolute return for the year and trailed its benchmark, as this Fund was not immune to the broader economic upheaval that brought significant losses to the equity markets. Relative to the benchmark, sector positioning was positive for the Portfolio as an underweight to the struggling financials sectors was beneficial, as was an underweight to the materials sector as commodity prices began to tumble during the latter half of the fiscal year. The Fund did, however, experience poor stock selection in certain areas of the market, including within the struggling consumer discretionary and energy sectors. This was, however, somewhat mitigated by solid stock selection within the financials sector over the last year. Meanwhile, the style positioning in the Fund was neutral relative to the benchmark, as the Fund was positioned broadly in line with the Russell 3000® Index from a style perspective. The Fund continues to operate with a sizeable tax loss carry forward, creating the potential to benefit tax-sensitive shareholders during the next few years during tax time.
First Quadrant L.P. (“First Quadrant”) remains concerned about current market conditions and the slowing global economy. As such, First Quadrant continues to position the Fund defensively with a majority of exposures, such as value and growth, in line with the Russell 3000® Index. The Fund does, however, continue to generally favor lower yielding stocks, while smaller-capitalization issues have begun to look increasingly compelling. Additional holdings were added to the Portfolio over the last six months as the higher volatility of markets resulted in the need to better diversify the Fund in order to maintain a risk profile consistent with long-term targets.
Cumulative Total Return Performance
Managers AMG FQ Tax-Managed U.S. Equity Fund’s cumulative total return is based on the daily change in net asset value (NAV), and assumes that all distributions were reinvested. The Russell 3000® Index is composed of the 3000 largest U.S. companies as measured by market capitalization, and represents about 98% of the U.S. stock market. Unlike the Fund, the Russell 3000® Index is unmanaged, is not available for investment, and does not incur expenses. The chart on page 5 illustrates the performance of a hypothetical $10,000 investment made in the Institutional Class Shares of the Fund on December 18, 2000 (commencement of operations) to a $10,000 investment made in the Russell 3000® Index for the same time periods. Performance for periods longer than one year is annualized. Figures include reinvestment of capital gains and dividends. The listed returns for the Fund are net of expenses and the returns for the indices exclude expenses. Total returns for the Fund would have been lower had certain expenses not been reduced.
4
Managers AMG FQ Tax-Managed U.S. Equity Fund
Portfolio Manager’s Comments (continued)
Cumulative Total Return Performance
The table below shows the average annualized total returns for the Managers AMG FQ Tax-Managed U.S. Equity Fund and the Russell 3000® Index since inception through October 31, 2008.
| | | | | | | | | | | |
Average Annual Total Returns | | One Year | | | Five Years | | | Since Inception | | | Inception Date |
Managers AMG FQ Tax-Managed U.S. Equity Fund 1 | | | | | | | | | | | |
No Load Before Tax: | | | | | | | | | | | |
Institutional Class | | (40.26 | )% | | 1.58 | % | | 0.36 | % | | 12/18/00 |
Class A* | | (40.21 | )% | | — | | | (9.34 | )% | | 03/01/06 |
Class C* | | (40.56 | )% | | — | | | (10.00 | )% | | 03/01/06 |
Russell 3000® Index | | (36.60 | )% | | 0.46 | % | | (1.62 | )% | | 12/18/00 |
No Load After Tax on Distributions 2 | | | | | | | | | | | |
Institutional Class | | (40.36 | )% | | 1.46 | % | | 0.23 | % | | 12/18/00 |
Class A* | | (40.29 | )% | | — | | | (9.38 | )% | | 03/01/06 |
Class C* | | (40.56 | )% | | — | | | (10.00 | )% | | 03/01/06 |
No Load After Tax on Distributions & sale of shares 2 | | | | | | | | | | | |
Institutional Class | | (26.13 | )% | | 1.29 | % | | 0.24 | % | | 12/18/00 |
Class A* | | (26.11 | )% | | — | | | (7.85 | )% | | 03/01/06 |
Class C* | | (26.36 | )% | | — | | | (8.39 | )% | | 03/01/06 |
With Load Before Tax: | | | | | | | | | | | |
Class A* | | (43.65 | )% | | — | | | (11.32 | )% | | 03/01/06 |
Class C* | | (41.15 | )% | | — | | | (10.00 | )% | | 03/01/06 |
With Load After Tax on Distributions 2 | | | | | | | | | | | |
Class A* | | (43.71 | )% | | — | | | (11.36 | )% | | 03/01/06 |
Class C* | | (41.15 | )% | | — | | | (10.00 | )% | | 03/01/06 |
With Load After Tax on Distributions & sale of shares 2 | | | | | | | | | | | |
Class A* | | (28.34 | )% | | — | | | (9.48 | )% | | 03/01/06 |
Class C* | | (26.75 | )% | | — | | | (8.39 | )% | | 03/01/06 |
| * | Class A and Class C shares commenced operations on March 1, 2006. |
1 | Performance based on published NAV as of October 31, 2008. |
2 | After-tax returns are calculated using the historical highest individual federal marginal income tax rates and do not reflect the impact of state and local taxes. Actual after-tax returns depend on an investor’s tax situation and may differ from those shown, and after-tax returns are not relevant to investors who hold their Fund shares through tax-deferred arrangements, such as 401(K) plans or individual retirement accounts. |
The performance data shown represents past performance, which is not a guarantee of future results. Current performance may be lower or higher than the performance data quoted. The investment return and principal value of an investment in the Funds will fluctuate so that an investor’s shares, when redeemed, may be worth more or less than their original cost. For performance information through the most recent month end please call (800) 835-3879 or visit our website at www.managersinvest.com.
In choosing a Fund, investors should carefully consider the amount they plan to invest, their investment objectives, the Fund’s investment objectives, risks, charges and expenses before investing. For this and other information, please call 800.835.3879 or visit www.managersinvest.com for a free prospectus. Read it carefully before investing or sending money. Distributed by Managers Distributors, Inc., member FINRA.
The Russell 3000® Index is a trademark of Russell Investments. Russell® is a trademark of Russell Investments.
Not FDIC insured, nor bank guaranteed. May lose value.
5
Managers AMG FQ Tax-Managed U.S. Equity Fund
Fund Snapshots
October 31, 2008
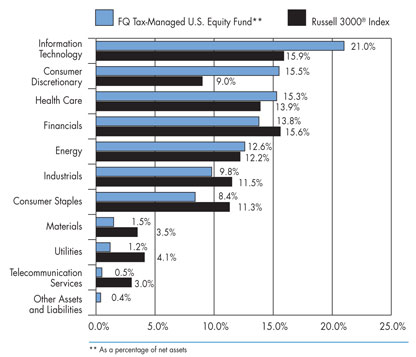
Portfolio Breakdown
| | | | | | |
Industry | | FQ Tax-Managed
U.S. Equity Fund** | | | Russell 3000®
Index | |
Information Technology | | 21.0 | % | | 15.9 | % |
Consumer Discretionary | | 15.5 | % | | 9.0 | % |
Health Care | | 15.3 | % | | 13.9 | % |
Financials | | 13.8 | % | | 15.6 | % |
Energy | | 12.6 | % | | 12.2 | % |
Industrials | | 9.8 | % | | 11.5 | % |
Consumer Staples | | 8.4 | % | | 11.3 | % |
Materials | | 1.5 | % | | 3.5 | % |
Utilities | | 1.2 | % | | 4.1 | % |
Telecommunication Services | | 0.5 | % | | 3.0 | % |
Other Assets and Liabilities | | 0.4 | % | | 0.0 | % |
Top Ten Holdings
| | | |
Security Name | | Percentage
of Net Assets | |
Hewlett-Packard Co. | | 4.8 | % |
Kroger Co., The* | | 4.4 | |
Amgen, Inc. | | 4.2 | |
Frontline, Ltd.* | | 3.4 | |
Microsoft Corp.* | | 3.2 | |
Walt Disney Co., The | | 3.0 | |
Cimarex Energy Co. | | 3.0 | |
Liberty Global, Inc. | | 2.3 | |
ConocoPhillips Co. | | 2.1 | |
McKesson Corp. | | 2.0 | |
| | | |
Top Ten as a Group | | 32.4 | % |
| | | |
| * | Top Ten Holding at April 30, 2008 |
Any sectors, industries, or securities discussed should not be perceived as investment recommendations. Mention of a specific security should not be considered a recommendation to buy or solicitation to sell that security.
6
Managers AMG FQ Tax-Managed U.S. Equity Fund
Schedule of Portfolio Investments
October 31, 2008
| | | | | | |
| | | Shares | | | Value |
Common Stocks - 99.6% | | | | | | |
Consumer Discretionary - 15.5% | | | | | | |
Apollo Group, Inc., Class A* | | 14,200 | 2 | | $ | 987,042 |
AutoZone, Inc.* | | 7,600 | | | | 967,404 |
Cablevision Systems Corp.* | | 40,000 | 2 | | | 709,200 |
Callaway Golf Co. | | 8,400 | | | | 87,864 |
Chipotle Mexican Grill, Inc.* | | 3,800 | 2 | | | 192,850 |
DIRECTV Group, Inc., The* | | 13,600 | 2 | | | 297,704 |
Gap Inc., The | | 14,000 | | | | 181,160 |
IAC/InterActiveCorp.* | | 37,600 | 2 | | | 630,176 |
Jo-Ann Stores, Inc.* | | 13,200 | 2 | | | 252,912 |
Liberty Global, Inc., Class A* | | 98,200 | 2 | | | 1,619,318 |
Polo Ralph Lauren Corp. | | 16,400 | | | | 773,588 |
RadioShack Corp. | | 7,800 | 2 | | | 98,748 |
Rent-A-Center, Inc.* | | 21,600 | 2 | | | 315,360 |
Sally Beauty Co., Inc.* | | 17,000 | 2 | | | 86,360 |
Service Corp. International | | 38,000 | | | | 262,200 |
Target Corp. | | 9,600 | | | | 385,152 |
Time Warner Co., Inc. | | 13,400 | | | | 135,206 |
Urban Outfitters, Inc.* | | 7,600 | 2 | | | 165,224 |
Walt Disney Co., The | | 81,000 | | | | 2,097,901 |
Washington Post Co., The | | 500 | | | | 213,400 |
Whirlpool Corp. | | 3,400 | 2 | | | 158,610 |
WMS Industries, Inc.* | | 14,600 | 2 | | | 365,000 |
Total Consumer Discretionary | | | | | | 10,982,379 |
Consumer Staples - 8.4% | | | | | | |
Bunge, Ltd. | | 7,400 | 2 | | | 284,234 |
Chiquita Brands International, Inc.* | | 6,000 | 2 | | | 81,900 |
Dean Foods Co.* | | 45,600 | | | | 996,816 |
Hormel Foods Corp. | | 2,400 | | | | 67,824 |
Kroger Co., The | | 112,800 | | | | 3,097,488 |
PepsiAmericas, Inc. | | 6,000 | | | | 113,580 |
Procter & Gamble Co., The | | 11,400 | | | | 735,756 |
Ralcorp Holdings, Inc.* | | 8,200 | | | | 554,976 |
Total Consumer Staples | | | | | | 5,932,574 |
Energy - 12.6% | | | | | | |
Apache Corp. | | 1,800 | | | | 148,194 |
Callon Petroleum Co.* | | 21,400 | | | | 220,848 |
Cimarex Energy Co. | | 51,800 | 2 | | | 2,095,828 |
Complete Production Services, Inc. | | 23,800 | 2 | | | 294,882 |
ConocoPhillips Co. | | 29,200 | | | | 1,518,984 |
El Paso Corp. | | 28,200 | 2 | | | 273,540 |
Exxon Mobil Corp. | | 10,000 | | | | 741,200 |
Frontline, Ltd. | | 74,800 | 2 | | | 2,378,640 |
Murphy Oil Corp. | | 8,000 | | | | 405,120 |
Pioneer Drilling Co.* | | 6,000 | | | | 46,440 |
Pioneer Natural Resources Co. | | 30,000 | | | | 834,900 |
Total Energy | | | | | | 8,958,576 |
Financials - 13.8% | | | | | | |
American Financial Group, Inc. | | 52,400 | | | | 1,191,052 |
AON Corp. | | 23,000 | | | | 972,900 |
Cash America International, Inc. | | 10,000 | | | | 353,700 |
Charles Schwab Corp., The | | 17,000 | | | | 325,040 |
Chubb Corp., The | | 11,200 | | | | 580,384 |
Discover Financial Services | | 21,400 | | | | 262,150 |
Loews Corp. | | 20,400 | | | | 677,484 |
Northern Trust Corp. | | 16,200 | | | | 912,222 |
Platinum Underwriter Holdings | | 3,600 | 2 | | | 114,264 |
Rayonier, Inc. | | 6,400 | 2 | | | 211,712 |
Republic Bancorp, Inc., Class A | | 21,000 | 2 | | | 483,420 |
South Financial Group, Inc., The | | 28,000 | 2 | | | 162,680 |
Southside Bancshares, Inc. | | 23,600 | 2 | | | 568,524 |
State Street Corp. | | 5,000 | | | | 216,750 |
TD Ameritrade Holding Corp.* | | 86,400 | | | | 1,148,256 |
TFS Financial Corp. | | 17,800 | 2 | | | 232,646 |
Transatlantic Holdings, Inc. | | 1,200 | | | | 51,420 |
UMB Financial Corp. | | 17,000 | 2 | | | 770,610 |
UnumProvident Corp. | | 33,400 | | | | 526,050 |
Total Financials | | | | | | 9,761,264 |
Health Care - 15.3% | | | | | | |
Amgen, Inc.* | | 49,600 | | | | 2,970,544 |
Cardiac Science Corp.* | | 25,200 | | | | 235,116 |
CIGNA Corp. | | 8,400 | | | | 136,920 |
Express Scripts, Inc.* | | 20,400 | | | | 1,236,444 |
Henry Schein, Inc.* | | 7,600 | | | | 355,756 |
Invitrogen Corp.* | | 2,400 | 2 | | | 69,096 |
Lifepoint Hospitals, Inc.* | | 23,200 | 2 | | | 556,104 |
Lincare Holdings, Inc.* | | 16,200 | 2 | | | 426,870 |
Magellan Health Services, Inc.* | | 15,000 | | | | 554,100 |
McKesson Corp. | | 39,285 | | | | 1,445,295 |
OSI Pharmaceuticals, Inc.* | | 9,400 | 2 | | | 356,730 |
Owens & Minor, Inc. | | 24,000 | 2 | | | 1,038,480 |
PDL BioPharma, Inc.* | | 69,200 | 2 | | | 674,700 |
Tenet Healthcare Corp.* | | 47,600 | 2 | | | 208,488 |
The accompanying notes are an integral part of these financial statements.
7
Managers AMG FQ Tax-Managed U.S. Equity Fund
Schedule of Portfolio Investments (continued)
| | | | | | | |
| | | Shares | | | Value | |
Health Care - 15.3% (continued) | | | | | | | |
Thermo Fisher Scientific, Inc.* | | 9,800 | 2 | | $ | 397,880 | |
Varian Medical Systems, Inc.* | | 3,400 | | | | 154,734 | |
Total Health Care | | | | | | 10,817,257 | |
Industrials - 9.8% | | | | | | | |
Columbus McKinnon Corp.* | | 9,000 | | | | 126,360 | |
Cummins, Inc. | | 6,800 | | | | 175,780 | |
Dun & Bradstreet Corp., The | | 14,000 | | | | 1,031,660 | |
EMCOR Group, Inc.* | | 64,298 | 2 | | | 1,142,575 | |
Encore Wire Corp. | | 28,400 | | | | 544,428 | |
Enpro Industries, Inc.* | | 4,000 | 2 | | | 88,840 | |
Gardner Denver, Inc.* | | 19,000 | | | | 486,780 | |
Hudson Highland Group, Inc.* | | 35,400 | | | | 185,496 | |
Lydall, Inc.* | | 12,600 | | | | 83,790 | |
Old Dominion Freight Line, Inc.* | | 9,400 | | | | 285,196 | |
Parker Hannifin Corp. | | 16,300 | | | | 631,951 | |
Southwest Airlines Co. | | 8,600 | 2 | | | 101,308 | |
Transdigm Group, Inc.* | | 32,100 | 2 | | | 967,494 | |
Triumph Group, Inc. | | 13,200 | 2 | | | 578,952 | |
United Rentals, Inc.* | | 15,400 | 2 | | | 157,850 | |
United Stationers, Inc.* | | 10,400 | | | | 388,856 | |
Total Industrials | | | | | | 6,977,316 | |
Information Technology - 21.0% | | | | | | | |
Activision Blizzard, Inc.* | | 93,200 | 2 | | | 1,161,272 | |
Amkor Technology, Inc.* | | 63,600 | | | | 258,216 | |
Anixter International, Inc.* | | 22,000 | 2 | | | 739,420 | |
Apple, Inc.* | | 6,300 | | | | 677,817 | |
Broadcom Corp., Class A* | | 5,400 | | | | 92,232 | |
Cisco Systems, Inc.* | | 59,600 | | | | 1,059,092 | |
CSG Systems International, Inc.* | | 13,000 | 2 | | | 216,190 | |
Dell, Inc.* | | 17,000 | | | | 206,550 | |
EarthLink, Inc.* | | 10,500 | | | | 72,450 | |
Fairchild Semiconductor International, Inc.* | | 128,000 | | | | 727,040 | |
Hewitt Associates, Inc., Class A* | | 15,800 | | | | 440,662 | |
Hewlett-Packard Co. | | 89,300 | | | | 3,418,404 | |
Integrated Device Technology, Inc.* | | 70,800 | | | | 450,288 | |
International Business Machines Corp. | | 10,200 | | | | 948,294 | |
Lexmark International, Inc.* | | 11,800 | 2 | | | 304,794 | |
Microsoft Corp. | | 100,400 | | | | 2,241,932 | |
Oracle Corp.* | | 18,000 | | | | 329,220 | |
Plantronics, Inc. | | 19,000 | | | | 274,360 | |
SAIC, Inc.* | | 50,400 | 2 | | | 930,888 | |
Teradata Corp.* | | 23,600 | | | | 363,204 | |
Total Information Technology | | | | | | 14,912,325 | |
Materials - 1.5% | | | | | | | |
Freeport McMoRan Copper & Gold, Inc., Class B | | 11,800 | | | | 343,380 | |
Reliance Steel & Aluminum Co. | | 10,000 | | | | 250,400 | |
Terra Industries, Inc. | | 20,800 | | | | 457,392 | |
Total Materials | | | | | | 1,051,172 | |
Telecommunication Services - 0.5% | | | | | | | |
General Communication, Inc., Class A* | | 35,800 | 2 | | | 274,944 | |
Premiere Global Services, Inc.* | | 10,400 | 2 | | | 103,480 | |
Total Telecommunication Services | | | | | | 378,424 | |
Utility - 1.2% | | | | | | | |
Energen Corp. | | 25,600 | | | | 859,392 | |
Total Common Stocks
(cost $87,138,398) | | | | | | 70,630,679 | |
Other Investment Companies - 25.6%1 | | | | | | | |
Bank of New York Institutional Cash Reserves Fund, Series A, 1.07%3 | | 17,034,505 | | | | 17,034,505 | |
Bank of New York Institutional Cash Reserves Fund, Series B* 3, 4 | | 320,520 | | | | 37,661 | |
Bank of New York Institutional Cash Reserves Fund, Series C* 3, 5 | | 191,326 | | | | 191,326 | |
Dreyfus Cash Management Fund, Institutional Class Shares, 2.84%6 | | 920,150 | | | | 920,150 | |
Total Other Investment Companies
(cost $18,466,501) | | | | | | 18,183,642 | |
Total Investments - 125.2%
(cost $105,604,899) | | | | | | 88,814,321 | |
Other Assets, less Liabilities - (25.2)% | | | | | | (17,905,518 | ) |
Net Assets - 100.0% | | | | | $ | 70,908,803 | |
Note: Based on the cost of investments of $105,603,684 for Federal income tax purposes at October 31, 2008, the aggregate gross unrealized appreciation and depreciation were $2,114,582 and $18,903,945, respectively, resulting in net unrealized depreciation of investments of $16,789,363.
* | Non-income-producing securities. |
1 | Yield shown for each investment company below represents the October 31, 2008, seven-day average yield, which refers to the sum of the previous seven days’ dividends paid, expressed as an annual percentage. |
2 | Some or all of these shares, amounting to a market value of $17,427,286, or 24.6% of net assets, were out on loan to various brokers. |
3 | Collateral received from brokers for securities lending was invested in these short-term investments. |
4 | On September 12, 2008, The Bank of New York Mellon (“BNYM”) established a separate sleeve of the Institutional Cash Reserves Fund (“ICRF”) (Series B) to hold certain Lehman Brothers floating rate notes. The Fund’s position in Series B is being marked to market daily. |
5 | On October 6, 2008, BNYM established a separate sleeve of the ICRF (Series C) to hold a security issued by Whistlejacket Capital Ltd. The Fund’s position in Series C is being marked to market daily. |
6 | The Fund’s investment is covered under the U.S. Treasury Temporary Money Market Fund Guarantee Program up to a maximum of $599,935. |
The accompanying notes are an integral part of these financial statements.
8
Managers AMG FQ U.S. Equity Fund
Portfolio Manager’s Comments
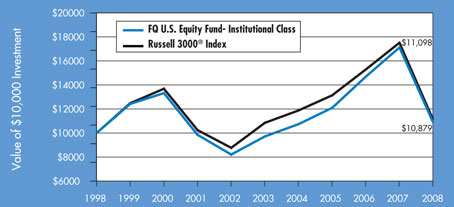
For the fiscal year ending October 31, 2008, the Fund returned -36.43% compared to -36.60% for the benchmark Russell 3000® Index. Please refer to the table on page 10 for returns for various classes of shares.
The financial markets were under significant pressure for the majority of the past year. The period began with the focus of investors on the U.S. housing crisis and eventually morphed into concerns about a broader credit crisis both in the U.S. and abroad. Despite these fears, stocks saw a rebound in April and May before selling off dramatically towards the end of the second quarter as investors’ concerns over surging commodity prices, continuing fallout from the credit crisis, slowing economic growth, and declining corporate profits took center stage. Volatility remained high during July and August as major headlines included falling energy and commodity prices along with higher-than-expected economic growth, countered by further contraction in housing, weakness in the labor markets, tighter credit conditions, and uncertainty about the stability of Fannie Mae and Freddie Mac. July and August proved to be the calm before the storm, as the number of events significantly affecting the markets in September greatly outnumbered any other period in recent memory. September included the U.S. Treasury’s bailout of mortgage agencies Fannie Mae and Freddie Mac as well as insurer AIG. In addition, market turmoil even extended to money markets where interbank lending rates soared to record highs as banks hoarded cash. In October, Congress approved a $700 billion “bail-out” called the Troubled Asset Relief Program (TARP) with the goal of opening up credit markets by buying distressed assets.
The Fund delivered disappointing absolute returns for the year but performed in line with its benchmark as the Fund was not immune to the broader economic upheaval that brought significant losses to the equity market. Relative to the benchmark, sector positioning was positive for the Fund, as an underweight to the struggling financials sector was beneficial. The Fund did, however, experience negative impact from stock selection in certain areas of the market, including within the struggling consumer discretionary and energy sectors. This was, however, mitigated by particularly strong stock selection within the financials sector over the last year. Meanwhile, the style positioning in the Fund was neutral during the period relative to the benchmark as the Fund was positioned broadly in line with the Russell 3000® Index from a style perspective.
First Quadrant L.P. (“First Quadrant”) remains concerned about current market conditions and the slowing global economy. As such, First Quadrant continues to position the Fund defensively with a majority of exposures, such as value and growth, in line with the Russell 3000® Index. The Fund does, however, continue to generally favor lower yielding stocks, while smaller-capitalization issues have begun to look increasingly compelling. Additional holdings were added to the Fund over the last six months as the higher volatility of markets resulted in the need to better diversify the Fund in order to maintain a risk profile consistent with long-term targets.
Cumulative Total Return Performance
Managers AMG FQ U.S. Equity Fund’s cumulative total return is based on the daily change in net asset value (NAV), and assumes that all distributions were reinvested. The Russell 3000® Index is composed of the 3000 largest U.S. companies as measured by market capitalization, and represents about 98% of the U.S. stock market. Unlike the Fund, the Russell 3000® Index is unmanaged, is not available for investment, and does not incur expenses. The chart on page 10 illustrates the performance of a hypothetical $10,000 investment made in the Institutional Class Shares of the Fund on October 31, 1998 to a $10,000 investment made in the Russell 3000® Index for the same time periods. Performance for periods longer than one year is annualized. Figures include reinvestment of capital gains and dividends. The listed returns for the Fund are net of expenses and the returns for the indices exclude expenses. Total returns for the Fund would have been lower had certain expenses not been reduced.
9
Managers AMG FQ U.S. Equity Fund
Portfolio Manager’s Comments (continued)
Cumulative Total Return Performance
The table below shows the average annualized total returns for the Managers AMG FQ U.S. Equity Fund and the Russell 3000® Index since October 31, 1998 through October 31, 2008.
| | | | | | | | | | | | | | |
Average Annual Total Returns | | One Year | | | Five Years | | | Ten Years | | | Since Inception | | | Inception Date |
Managers AMG FQ U.S. Equity Fund | | | | | | | | | | | | | | |
No Load: | | | | | | | | | | | | | | |
Institutional Class | | (36.43 | )% | | 2.29 | % | | 0.85 | % | | 6.47 | % | | 08/14/92 |
Class A* | | (36.64 | )% | | — | | | — | | | (7.58 | )% | | 03/01/06 |
Class C* | | (37.12 | )% | | — | | | — | | | (8.19 | )% | | 03/01/06 |
Russell 3000® Index | | (36.60 | )% | | 0.46 | % | | 1.05 | % | | | | | |
With Load: | | | | | | | | | | | | | | |
Class A* | | (40.28 | )% | | — | | | — | | | (9.62 | )% | | 03/01/06 |
Class C* | | (37.67 | )% | | — | | | — | | | (8.19 | )% | | 03/01/06 |
| * | Class A and Class C shares commenced operations on March 1, 2006. |
The performance data shown represents past performance, which is not a guarantee of future results. Current performance may be lower or higher than the performance data quoted. The investment return and principal value of an investment in the Funds will fluctuate so that an investor’s shares, when redeemed, may be worth more or less than their original cost. For performance information through the most recent month end please call (800) 835-3879 or visit our website at www.managersinvest.com.
In choosing a Fund, investors should carefully consider the amount they plan to invest, their investment objectives, the Fund’s investment objectives, risks, charges and expenses before investing. For this and other information, please call 800.835.3879 or visit www.managersinvest.com for a free prospectus. Read it carefully before investing or sending money. Distributed by Managers Distributors, Inc., member FINRA.
The Russell 3000® Index is a trademark of Russell Investments. Russell® is a trademark of Russell Investments.
Not FDIC insured, nor bank guaranteed. May lose value.
10
Managers AMG FQ U.S. Equity Fund
Fund Snapshots
October 31, 2008
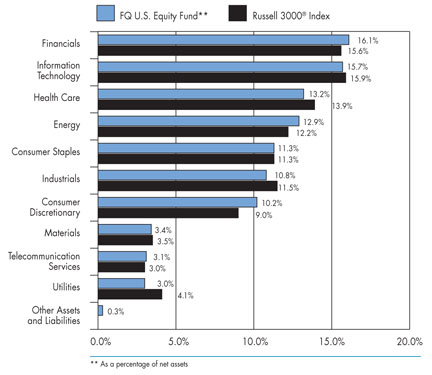
Portfolio Breakdown
| | | | | | |
Industry | | FQ U.S.
Equity** | | | Russell 3000®
Index | |
Financials | | 16.1 | % | | 15.6 | % |
Information Technology | | 15.7 | % | | 15.9 | % |
Health Care | | 13.2 | % | | 13.9 | % |
Energy | | 12.9 | % | | 12.2 | % |
Consumer Staples | | 11.3 | % | | 11.3 | % |
Industrials | | 10.8 | % | | 11.5 | % |
Consumer Discretionary | | 10.2 | % | | 9.0 | % |
Materials | | 3.4 | % | | 3.5 | % |
Telecommunication Services | | 3.1 | % | | 3.0 | % |
Utilities | | 3.0 | % | | 4.1 | % |
Other Assets and Liabilities | | 0.3 | % | | 0.0 | % |
Top Ten Holdings
| | | |
Security Name | | Percentage
of Net Assets | |
Exxon Mobil Corp.* | | 3.8 | % |
Procter & Gamble Co., The | | 2.1 | |
Microsoft Corp.* | | 1.7 | |
General Electric Co.* | | 1.6 | |
Johnson & Johnson* | | 1.6 | |
Chevron Corp. | | 1.5 | |
International Business Machines Corp. | | 1.4 | |
AT&T, Inc.* | | 1.3 | |
Wal-Mart Stores, Inc. | | 1.2 | |
JPMorgan Chase & Co.* | | 1.2 | |
| | | |
Top Ten as a Group | | 17.4 | % |
| | | |
| * | Top Ten Holding at April 30, 2008 |
Any sectors, industries, or securities discussed should not be perceived as investment recommendations. Mention of a specific security should not be considered a recommendation to buy or solicitation to sell that security.
11
Managers AMG FQ U.S. Equity Fund
Schedule of Portfolio Investments
October 31, 2008
| | | | | | |
| | | Shares | | | Value |
Common Stocks - 99.7% | | | | | | |
Consumer Discretionary - 10.2% | | | | | | |
1-800-FLOWERS.COM, Inc.* | | 17,800 | | | $ | 95,230 |
Advance Auto Parts, Inc. | | 10,200 | | | | 318,240 |
Amazon.com, Inc.* | | 1,800 | | | | 103,032 |
Apollo Group, Inc., Class A* | | 2,600 | 2 | | | 180,726 |
Carnival Corp. | | 2,000 | 2 | | | 50,800 |
Comcast Corp., Class A | | 23,400 | | | | 368,784 |
DIRECTV Group, Inc., The* | | 9,000 | 2 | | | 197,010 |
Exide Technologies, Inc.* | | 19,200 | 2 | | | 91,200 |
Gap Inc., The | | 19,300 | | | | 249,742 |
H&R Block, Inc. | | 7,000 | | | | 138,040 |
Home Depot, Inc., The | | 5,200 | 2 | | | 122,668 |
Jo-Ann Stores, Inc.* | | 13,600 | 2 | | | 260,576 |
Johnson Controls, Inc. | | 9,200 | | | | 163,116 |
Liberty Media Corp., Class A* | | 16,400 | | | | 264,040 |
Lowe’s Companies, Inc. | | 8,400 | | | | 182,280 |
McDonald’s Corp. | | 6,400 | | | | 370,752 |
News Corp., Inc., Class A | | 24,800 | | | | 263,872 |
Nike, Inc. | | 2,000 | | | | 115,260 |
Polo Ralph Lauren Corp. | | 5,000 | | | | 235,850 |
priceline.com, Inc.* | | 4,000 | 2 | | | 210,520 |
Rent-A-Center, Inc.* | | 10,400 | 2 | | | 151,840 |
Ross Stores, Inc. | | 8,000 | 2 | | | 261,520 |
Snap-On, Inc. | | 7,400 | | | | 273,430 |
Stewart Enterprises, Inc. | | 30,200 | 2 | | | 156,134 |
Stoneridge, Inc.* | | 7,800 | 2 | | | 44,382 |
Target Corp. | | 4,500 | 2 | | | 180,540 |
Timberland Co.* | | 5,300 | 2 | | | 64,130 |
Time Warner Co., Inc. | | 31,800 | | | | 320,862 |
Walt Disney Co., The | | 15,600 | | | | 404,040 |
Whirlpool Corp. | | 3,800 | 2 | | | 177,270 |
Total Consumer Discretionary | | | | | | 6,015,886 |
Consumer Staples - 11.3% | | | | | | |
Altria Group, Inc. | | 12,050 | | | | 231,240 |
Anheuser-Busch Companies, Inc. | | 1,900 | | | | 117,857 |
Avon Products, Inc. | | 8,200 | | | | 203,606 |
Bunge, Ltd. | | 6,000 | 2 | | | 230,460 |
Church & Dwight Co., Inc. | | 5,400 | 2 | | | 319,086 |
Coca-Cola Co., The | | 10,600 | | | | 467,036 |
Colgate-Palmolive Co. | | 1,600 | | | | 100,416 |
Corn Products International, Inc. | | 7,600 | | | | 184,832 |
Costco Wholesale Corp. | | 2,400 | | | | 136,824 |
CVS Caremark Corp. | | 9,700 | | | | 297,305 |
Darling International, Inc.* | | 33,400 | 2 | | | 251,836 |
Kraft Foods, Inc. | | 5,200 | | | | 151,528 |
Kroger Co., The | | 10,000 | | | | 274,600 |
Molson Coors Brewing Co. | | 6,600 | | | | 246,576 |
Nash Finch Co. | | 2,200 | 2 | | | 86,746 |
PepsiCo, Inc. | | 7,300 | | | | 416,173 |
Philip Morris International, Inc. | | 9,000 | | | | 391,230 |
Procter & Gamble Co., The | | 19,400 | | | | 1,252,075 |
Ralcorp Holdings, Inc.* | | 4,000 | | | | 270,720 |
Sysco Corp. | | 10,400 | | | | 272,480 |
Walgreen Co. | | 2,700 | | | | 68,742 |
Wal-Mart Stores, Inc. | | 12,600 | | | | 703,206 |
Total Consumer Staples | | | | | | 6,674,574 |
Energy - 12.9% | | | | | | |
Apache Corp. | | 3,300 | | | | 271,689 |
Arch Coal, Inc. | | 10,100 | 2 | | | 216,241 |
Chevron Corp. | | 11,900 | | | | 887,740 |
Cimarex Energy Co. | | 6,800 | | | | 275,128 |
Complete Production Services, Inc. | | 18,100 | 2 | | | 224,259 |
ConocoPhillips Co. | | 8,900 | | | | 462,978 |
Devon Energy Corp. | | 4,200 | | | | 339,612 |
Encore Acquisition Co.* | | 9,000 | | | | 280,350 |
Exxon Mobil Corp. | | 30,400 | | | | 2,253,248 |
Halliburton Co. | | 13,600 | | | | 269,144 |
Hess Corp. | | 4,600 | | | | 276,966 |
Knightsbridge Tankers, Ltd. | | 9,600 | | | | 171,936 |
Massey Energy Co. | | 7,800 | | | | 180,102 |
Murphy Oil Corp. | | 5,800 | | | | 293,712 |
National-Oilwell, Inc.* | | 8,400 | | | | 251,076 |
Occidental Petroleum Corp. | | 6,800 | 2 | | | 377,672 |
Schlumberger, Ltd. | | 4,600 | 2 | | | 237,590 |
Transocean, Inc. | | 1,700 | | | | 139,961 |
W&T Offshore, Inc. | | 12,800 | 2 | | | 245,376 |
Total Energy | | | | | | 7,654,780 |
Financials - 16.1% | | | | | | |
Aflac, Inc. | | 6,600 | | | | 292,248 |
American Express Co. | | 4,500 | | | | 123,750 |
American Financial Group, Inc. | | 7,100 | | | | 161,383 |
Anworth Mortgage Asset Corp. | | 19,400 | 2 | | | 113,684 |
Aon Corp. | | 8,300 | | | | 351,090 |
Bank of America Corp. | | 21,668 | | | | 523,716 |
Bank of Hawaii Corp. | | 6,100 | 2 | | | 309,331 |
The accompanying notes are an integral part of these financial statements.
12
Managers AMG FQ U.S. Equity Fund
Schedule of Portfolio Investments (continued)
| | | | | | |
| | | Shares | | | Value |
Financials - 16.1% (continued) | | | | | | |
Bank of New York Mellon Corp. | | 6,400 | | | $ | 208,640 |
Cash America International, Inc. | | 6,386 | | | | 225,873 |
Charles Schwab Corp., The | | 5,200 | | | | 99,424 |
Chubb Corp., The | | 6,000 | | | | 310,920 |
Citigroup, Inc. | | 19,800 | | | | 270,270 |
Community Bank System, Inc. | | 4,800 | 2 | | | 119,760 |
CVB Financial Corp | | 23,500 | 2 | | | 297,510 |
Goldman Sachs Group, Inc. | | 2,100 | | | | 194,250 |
Hospitality Properties Trust | | 20,400 | | | | 207,060 |
Hudson City Bancorp, Inc. | | 17,000 | | | | 319,770 |
Interactive Brokers Group, Inc., Class A* | | 8,600 | 2 | | | 183,782 |
JPMorgan Chase & Co. | | 17,000 | | | | 701,250 |
Loews Corp. | | 7,300 | | | | 242,433 |
Metlife, Inc. | | 4,371 | | | | 145,205 |
Morgan Stanley Co. | | 6,300 | | | | 110,061 |
NASDAQ OMX Group, Inc., The* | | 11,700 | 2 | | | 379,782 |
NBT Bancorp, Inc. | | 4,800 | | | | 133,824 |
Northern Trust Corp. | | 4,400 | | | | 247,764 |
Old National Bancorp | | 16,100 | 2 | | | 304,934 |
Platinum Underwriter Holdings | | 11,400 | 2 | | | 361,836 |
ProLogis | | 1,400 | 2 | | | 19,600 |
Prudential Financial, Inc. | | 4,400 | | | | 132,000 |
Public Storage, Inc. | | 2,800 | | | | 228,200 |
Rayonier, Inc. | | 8,600 | 2 | | | 284,488 |
Republic Bancorp, Inc., Class A | | 1,600 | 2 | | | 36,832 |
Stancorp Financial Group, Inc. | | 2,200 | | | | 74,976 |
State Street Corp. | | 6,200 | | | | 268,770 |
T Rowe Price Group, Inc. | | 1,400 | 2 | | | 55,356 |
Transatlantic Holdings, Inc. | | 2,600 | | | | 111,410 |
Travelers Companies, Inc., The | | 8,500 | | | | 361,675 |
U.S. Bancorp | | 7,400 | | | | 220,594 |
UnumProvident Corp. | | 11,600 | | | | 182,700 |
Wells Fargo & Co. | | 19,000 | | | | 646,950 |
Total Financials | | | | | | 9,563,101 |
Health Care - 13.2% | | | | | | |
Abbott Laboratories Co. | | 8,500 | | | | 468,775 |
Amgen, Inc.* | | 8,700 | | | | 521,043 |
Baxter International, Inc. | | 3,500 | | | | 211,715 |
Biogen Idec, Inc.* | | 1,600 | | | | 68,080 |
Bristol-Myers Squibb Co. | | 10,800 | | | | 221,940 |
Covidien, Ltd. | | 2,800 | | | | 124,012 |
Eli Lilly & Co. | | 8,800 | | | | 297,616 |
Express Scripts, Inc.* | | 4,200 | | | | 254,562 |
Genentech, Inc.* | | 700 | | | | 58,058 |
Gilead Sciences, Inc.* | | 5,200 | | | | 238,420 |
Invitrogen Corp.* | | 10,600 | 2 | | | 305,174 |
Johnson & Johnson | | 15,200 | | | | 932,368 |
Lifepoint Hospitals, Inc.* | | 12,200 | 2 | | | 292,434 |
McKesson Corp. | | 5,700 | | | | 209,703 |
Medtronic, Inc. | | 6,400 | | | | 258,112 |
Merck & Co., Inc. | | 7,000 | | | | 216,650 |
OSI Pharmaceuticals, Inc.* | | 7,600 | 2 | | | 288,420 |
Owens & Minor, Inc. | | 7,500 | 2 | | | 324,525 |
Perrigo Co. | | 10,462 | 2 | | | 355,708 |
Pfizer, Inc. | | 39,000 | | | | 690,690 |
Schering-Plough Corp | | 1,800 | | | | 26,082 |
St. Jude Medical, Inc.* | | 6,900 | | | | 262,407 |
Thermo Fisher Scientific, Inc.* | | 6,400 | | | | 259,840 |
Universal Health Services, Inc., Class B | | 6,800 | | | | 285,872 |
Valeant Pharmaceuticals International* | | 5,100 | 2 | | | 95,727 |
Varian Medical Systems, Inc.* | | 5,600 | | | | 254,856 |
WellPoint, Inc.* | | 400 | | | | 15,548 |
Wyeth | | 8,400 | | | | 270,312 |
Total Health Care | | | | | | 7,808,649 |
Industrials - 10.8% | | | | | | |
3M Co. | | 2,000 | | | | 128,600 |
AGCO Corp.* | | 5,400 | | | | 170,208 |
Avis Budget Group, Inc.* | | 39,600 | 2 | | | 64,944 |
Boeing Co., The | | 3,900 | | | | 203,853 |
Bucyrus International, Inc. | | 6,800 | | | | 164,084 |
Caterpillar, Inc. | | 3,200 | | | | 122,144 |
CSX Corp. | | 6,400 | | | | 292,608 |
Emerson Electric Co. | | 3,700 | | | | 121,101 |
EnPro Industries, Inc.* | | 3,600 | 2 | | | 79,956 |
Esterline Technologies Corp.* | | 1,700 | | | | 61,285 |
Fluor Corp. | | 6,600 | | | | 263,538 |
Gardner Denver, Inc.* | | 10,400 | | | | 266,448 |
General Dynamics Corp. | | 4,200 | | | | 253,344 |
General Electric Co. | | 48,400 | | | | 944,284 |
Gibraltar Industries, Inc. | | 4,000 | 2 | | | 53,000 |
Goodrich Corp. | | 4,200 | | | | 153,552 |
GrafTech International, Ltd.* | | 7,300 | | | | 59,203 |
Hawaiian Holdings, Inc.* | | 23,090 | 2 | | | 161,630 |
HEICO Corp. | | 2,800 | 2 | | | 107,716 |
Honeywell International, Inc. | | 6,100 | | | | 185,745 |
Lockheed Martin Corp. | | 2,800 | | | | 238,140 |
NCI Building Systems, Inc.* | | 2,800 | 2 | | | 52,108 |
The accompanying notes are an integral part of these financial statements.
13
Managers AMG FQ U.S. Equity Fund
Schedule of Portfolio Investments (continued)
| | | | | | |
| | | Shares | | | Value |
Industrials - 10.8% (continued) | | | | | | |
Northrop Grumman Corp. | | 6,000 | | | $ | 281,340 |
On Assignment, Inc.* | | 31,900 | | | | 207,350 |
Perini Corp.* | | 3,200 | | | | 60,864 |
R.R. Donnelley & Sons Co. | | 13,400 | | | | 222,038 |
Southwest Airlines Co. | | 22,300 | | | | 262,694 |
Transdigm Group, Inc.* | | 7,800 | 2 | | | 235,092 |
Union Pacific Corp. | | 5,000 | | | | 333,850 |
United Parcel Service, Inc., Class B | | 2,200 | | | | 116,116 |
United Rentals, Inc.* | | 6,200 | 2 | | | 63,550 |
United Technologies Corp. | | 3,400 | | | | 186,864 |
Watson Wyatt & Co. | | 5,200 | | | | 220,844 |
Wesco International, Inc.* | | 4,200 | 2 | | | 83,496 |
Total Industrials | | | | | | 6,421,589 |
Information Technology - 15.7% | | | | | | |
Accenture Ltd. | | 3,400 | | | | 112,370 |
Affiliated Computer Services, Inc.* | | 5,800 | | | | 237,800 |
Amkor Technology, Inc.* | | 39,600 | | | | 160,776 |
Anixter International, Inc.* | | 6,000 | 2 | | | 201,660 |
Apple, Inc.* | | 4,900 | | | | 527,191 |
Cisco Systems, Inc.* | | 34,194 | | | | 607,627 |
CSG Systems International, Inc.* | | 21,900 | 2 | | | 364,197 |
Dell, Inc.* | | 3,400 | | | | 41,310 |
Dolby Laboratories, Inc.* | | 8,000 | 2 | | | 252,560 |
EarthLink, Inc.* | | 34,100 | 2 | | | 235,290 |
Fairchild Semiconductor International, Inc.* | | 15,900 | | | | 90,312 |
Google, Inc.* | | 1,200 | | | | 431,232 |
Hewlett-Packard Co. | | 17,400 | | | | 666,072 |
Intel Corp. | | 32,500 | | | | 520,000 |
International Business Machines Corp. | | 9,200 | | | | 855,324 |
JDA Software Group, Inc.* | | 4,600 | | | | 65,688 |
Marvell Technology Group Ltd.* | | 34,600 | | | | 240,816 |
MasterCard, Inc. | | 1,400 | 2 | | | 206,948 |
Microsoft Corp. | | 45,600 | | | | 1,018,248 |
Oracle Corp.* | | 15,600 | | | | 285,324 |
Plexus Corp.* | | 3,200 | 2 | | | 59,712 |
QUALCOMM, Inc. | | 6,400 | | | | 244,864 |
ScanSource, Inc.* | | 2,600 | 2 | | | 51,584 |
Skyworks Solutions, Inc.* | | 44,800 | 2 | | | 319,424 |
Sybase, Inc.* | | 7,300 | 2 | | | 194,399 |
Symantec Corp.* | | 16,200 | | | | 203,796 |
Take-Two Interactive Software, Inc.* | | 17,500 | | | | 207,550 |
Texas Instruments, Inc. | | 1,800 | 2 | | | 35,208 |
TriQuint Semiconductor, Inc.* | | 28,400 | 2 | | | 127,232 |
United Online, Inc. | | 23,800 | | | | 176,120 |
Visa, Inc., Class A | | 2,400 | | | | 132,840 |
Western Digital Corp.* | | 15,600 | | | | 257,400 |
Western Union Co., The | | 12,800 | | | | 195,328 |
Total Information Technology | | | | | | 9,326,202 |
Materials - 3.4% | | | | | | |
AK Steel Holding Corp. | | 5,800 | 2 | | | 80,736 |
CF Industries Holdings, Inc. | | 4,000 | | | | 256,760 |
Cliffs Natural Resources, Inc. | | 8,000 | 2 | | | 215,920 |
Compass Minerals International, Inc. | | 3,400 | 2 | | | 186,762 |
Dow Chemical Co. | | 1,000 | | | | 26,670 |
E.I. du Pont de Nemours & Co. | | 5,200 | | | | 166,400 |
Freeport McMoRan Copper & Gold, Inc., Class B | | 2,200 | 2 | | | 64,020 |
Innophos Holdings, Inc. | | 14,000 | | | | 374,500 |
Monsanto Co. | | 2,200 | | | | 195,756 |
Mosaic Co., The, | | 5,400 | | | | 212,814 |
Terra Industries, Inc. | | 9,600 | | | | 211,104 |
Total Materials | | | | | | 1,991,442 |
Telecommunication Services - 3.1% | | | | | | |
AT&T, Inc. | | 29,600 | | | | 792,392 |
Embarq Corp. | | 7,900 | | | | 237,000 |
Syniverse Holdings, Inc.* | | 6,600 | | | | 124,080 |
Verizon Communications, Inc. | | 16,100 | | | | 477,687 |
Windstream Corp. | | 29,000 | | | | 217,790 |
Total Telecommunication Services | | | | | | 1,848,949 |
Utilities - 3.0% | | | | | | |
AES Corp., The* | | 3,800 | | | | 30,286 |
Allegheny Energy, Inc. | | 800 | | | | 24,120 |
American Electric Power Co., Inc. | | 2,200 | | | | 71,786 |
Calpine Corp.* | | 2,000 | 2 | | | 23,400 |
Cleco Corp | | 200 | | | | 4,602 |
DPL, Inc. | | 600 | 2 | | | 13,686 |
DTE Energy Co. | | 8,000 | | | | 282,400 |
Duke Energy Corp. | | 7,200 | | | | 117,936 |
El Paso Electric Co.* | | 200 | | | | 3,704 |
Entergy Corp. | | 1,000 | | | | 78,050 |
Exelon Corp. | | 3,600 | | | | 195,264 |
FirstEnergy Corp. | | 1,600 | | | | 83,456 |
FPL Group, Inc. | | 2,200 | | | | 103,928 |
ITC Holdings Corp. | | 200 | 2 | | | 8,116 |
Laclede Group, Inc., The | | 3,100 | 2 | | | 162,192 |
Pepco Holdings, Inc. | | 1,000 | | | | 20,650 |
PG&E Corp. | | 2,000 | | | | 73,340 |
The accompanying notes are an integral part of these financial statements.
14
Managers AMG FQ U.S. Equity Fund
Schedule of Portfolio Investments (continued)
| | | | | | |
| | | Shares | | Value | |
Utilities - 3.0% (continued) | | | | | | |
PPL Corp. | | 2,000 | | $ | 65,640 | |
Progress Energy, Inc. | | 1,400 | | | 55,118 | |
Public Service Enterprise Group, Inc. | | 2,800 | | | 78,820 | |
Puget Energy, Inc. | | 600 | | | 14,058 | |
Southern Co., The | | 4,400 | | | 151,096 | |
UGI Corp. | | 5,900 | | | 140,833 | |
Total Utilities | | | | | 1,802,481 | |
Total Common Stocks
(cost $74,907,318) | | | | | 59,107,653 | |
Other Investment Companies - 17.9%1 | | | | | | |
Bank of New York Institutional Cash Reserves Fund, Series A, 1.07%3 | | 10,155,301 | | | 10,155,301 | |
Bank of New York Institutional Cash Reserves Fund, Series B* 3, 4 | | 201,100 | | | 23,629 | |
Bank of New York Institutional Cash Reserves Fund, Series C* 3, 5 | | 116,377 | | | 116,377 | |
Dreyfus Cash Management Fund, Institutional Class Shares, 2.84%6 | | 311,416 | | | 311,416 | |
Total Other Investment Companies
(cost $10,784,194) | | | | | 10,606,723 | |
Total Investments - 117.6%
(cost $85,691,512) | | | | | 69,714,376 | |
Other Assets, less Liabilities - (17.6)% | | | | | (10,455,436 | ) |
Net Assets - 100% | | | | $ | 59,258,940 | |
Note: Based on the cost of investments of $88,182,170 for Federal income tax purposes at October 31, 2008, the aggregate gross unrealized appreciation and depreciation were $520,936 and $18,988,730, respectively, resulting in net unrealized depreciation of investments of $18,467,794.
* | Non-income-producing securities. |
1 | Yield shown for each investment company below represents the October 31, 2008, seven-day average yield, which refers to the sum of the previous seven days’ dividends paid, expressed as an annual percentage. |
2 | Some or all of these shares, amounting to a market value of $10,427,157 or 17.6% of net assets, were out on loan to various brokers. |
3 | Collateral received from brokers for securities lending was invested in these short-term investments. |
4 | On September 12, 2008, The Bank of New York Mellon (“BNYM”) established a separate sleeve of the Institutional Cash Reserves Fund (“ICRF”) (Series B) to hold certain Lehman Brothers floating rate notes. The Fund’s position in Series B is being marked to market daily. |
5 | On October 6, 2008, BNYM established a separate sleeve of the ICRF (Series C) to hold a security issued by Whistlejacket Capital Ltd. The Fund’s position in Series C is being market to market daily. |
6 | The Fund’s investment is covered under the U.S. Treasury Temporary Money Market Fund Guarantee Program up to a maximum of $1,008,765. |
The accompanying notes are an integral part of these financial statements.
15
Managers AMG FQ Global Alternatives Fund
Portfolio Manager’s Comments
The Managers AMG FQ Global Alternatives Fund delivered positive absolute returns for the fiscal year ended October 31, 2008. The Fund returned 12.07% while the benchmark 30-day T-bill returned 1.97% during this time. Please refer to the table on page 17 for returns of various share classes. It was an extremely difficult period for global capital markets, but the Fund’s investment and portfolio construction process, which focuses on building a market neutral portfolio, thrived during this time by successfully identifying both long and short investment opportunities within the equity, fixed income, and currency markets globally.
Global capital markets were under significant pressure during the last fiscal year with the initial focus of investors on the U.S. housing crisis eventually converting into worries about a broader credit crisis both in the U.S. and abroad. Equity losses were dramatic as a result of the market turmoil. For the period, the Russell 1000® (large cap), Russell 2000® (small cap), and the Russell 3000® (all cap) Indexes returned -36.80%, -34.16%, and -36.60%, respectively. International stocks underperformed their domestic counterparts as the MSCI EAFE Index returned -46.62% in U.S. dollar terms although international investments outperformed when measured in local terms, as captured by the MSCI EAFE Index, returning -41.31% in local currency terms. This deviation in performance between U.S. dollar and local currency returns was driven by the strengthening U.S. dollar during this period. Fixed income securities were certainly not immune to recent financial events either in the U.S. or abroad as the Barclays Capital U.S. Aggregate Index® and the Barclays Capital Global Aggregate Index® yielded mixed performance, returning 0.30% and -2.57%, respectively.
During this period, the solid performance generated in the Fund can be primarily attributed to the First Quadrant L.P. (“First Quadrant”) currency selection strategy, where a majority of the positions, both long and short, but particularly the long to the U.S. dollar over the last several months, were profitable. Solid performance was seen across a variety of other currency positions, including recent gains from longs to the Australian dollar and Japanese yen. Earlier in the year, virtually all currency positions, long and short, contributed positively to performance with the exception to the U.S. dollar, which was weakening at that time. The bond country selection strategy continued to be a consistent performer for the Fund, although it did detract some value toward the end of the period as the long to the U.S. bond market and the short to the Australian bond market were detrimental positions. The stock country selection strategy yielded mixed results throughout the course of the fiscal year, struggling earlier on, but gaining momentum towards the end of the period. Early in 2008, for example, a short position to the Canadian equity market and long positions to the Hong Kong and Japanese equity markets were detrimental. However, the long-standing short position to Spain eventually began to add significant value as this market plunged through the latter half of the year. The same can also be said for the short position to the Canadian equity market although this was slightly mitigated in the final weeks of the fiscal year by the long position to the U.S. equity market. Finally, the asset class selection strategy marginally detracted value, as a modest tilt towards global equities more recently has led to negative performance from this strategy.
The tactical risk allocation in the Fund has begun to find its most compelling opportunities within the bond country selection strategy where the largest active positions are long positions relative to the Japanese and U.S. bond markets and a short position relative to the Australian bond market. Within the stock country selection strategy, the largest active positions reflect a strategy long to the U.S. equity market and short to the Canadian equity market. The opportunity within currency markets has come down considerably over the last several months. However some significant currency exposure still remains as the Fund is positioned long to the U.S. dollar and short to the euro. The current historic volatility levels being witnessed in global capital markets are an opportunity for this Fund as periods of market turmoil often result in significant mispricing that can be taken advantage of by an active global macro strategy such as this.
Cumulative Total Return Performance
Managers AMG FQ Global Alternatives Fund’s cumulative total return is based on the daily change in net asset value (NAV), and assumes that all distributions were reinvested. The Citigroup 1-Month U.S. Treasury Bill Index (“1-Month Treasury Index”) measures returns of 1-month treasury bills. Unlike the Fund, the 1-Month Treasury Index is unmanaged, is not available for investment, and does not incur expenses. The chart on page 17 illustrates the performance of a hypothetical $10,000 investment made in the Class A shares (with load) of the Fund on March 30, 2006 (commencement of operations), to a $10,000 investment made in the 1-Month Treasury Index for the same time period. Figures include reinvestment of capital gains and dividends. The listed returns for the Fund are net of expenses and the returns for the index exclude expenses. The graph and table do not reflect the deduction of taxes that a shareholder would pay on a Fund distribution or redemption of shares. Total returns for the Fund would have been lower had certain expenses not been reduced.
16
Managers AMG FQ Global Alternatives Fund
Portfolio Manager’s Comments (continued)
Cumulative Total Return Performance
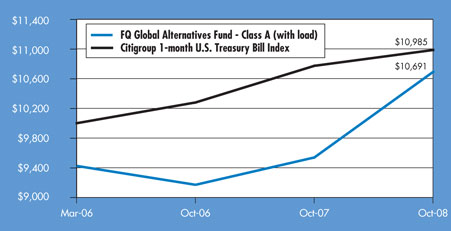
The table below shows the average annualized total returns for the Managers AMG FQ Global Alternatives Fund and the Citigroup 1-Month U.S. Treasury Bill Index since inception through October 31, 2008.
| | | | | | | | |
Average Total Returns | | One Year | | | Since
Inception | | | Inception
Date |
Managers AMG FQ Global Alternatives Equity Fund* 2,3,4,5,6 | | | | | | | | |
No Load: | | | | | | | | |
Class A | | 12.07 | % | | 4.99 | % | | 3/30/06 |
Class C | | 11.21 | % | | 4.19 | % | | 3/30/06 |
Citigroup 1-Month U.S. Treasury Bill Index 1 | | 1.97 | % | | 3.69 | % | | 3/31/06 |
With Load: | | | | | | | | |
Class A | | 5.58 | % | | 2.61 | % | | 3/30/06 |
Class C | | 10.21 | % | | 4.19 | % | | 3/30/06 |
| * | Commencement of operations was March 30, 2006. |
The performance data shown represents past performance, which is not a guarantee of future results. Current performance may be lower or higher than the performance data quoted. The investment return and principal value of an investment in the Funds will fluctuate so that an investor’s shares, when redeemed, may be worth more or less than their original cost. For performance information through the most recent month end please call (800) 835-3879 or visit our website at www.managersinvest.com.
In choosing a Fund, investors should carefully consider the amount they plan to invest, their investment objectives, the Fund’s investment objectives, risks, charges and expenses before investing. For this and other information, please call 800.835.3879 or visit www.managersinvest.com for a free prospectus. Read it carefully before investing or sending money. Distributed by Managers Distributors, Inc., member FINRA.
1 | Performance for the Citigroup 1-Month U.S. Treasury Bill Index reflects an inception date of March 31, 2006. |
2 | Performance based on published NAV as of October 31, 2008. |
3 | Fixed-income funds are subject to the risks associated with investments in debt securities, such as default risk, fluctuations in debtors’ perceived ability to pay their creditors, and changing interest rate risk. An increase in interest rates typically causes the value of bonds and other fixed-income securities to fall. |
4 | The Fund may use derivative instruments for hedging purposes or as part of its investment strategy. There is a risk that a derivative intended as a hedge may not perform as expected. The main risk with derivatives is that some types can amplify a gain or loss, potentially earning or losing substantially more money than the actual cost of the derivative or that the counterparty may fail to honor its contract terms, causing a loss for the Fund. Use of these instruments may also involve certain costs and risks such as liquidity risk, interest rate risk, market risk, credit risk, management risk, and the risk that a fund could not close out a position when it would be most advantageous to do so. |
5 | Investments in foreign securities and currency instruments are subject to additional risks such as erratic market conditions, economic and political instability, and currency exchange rate fluctuations. |
6 | Class C Shares convert to an equal dollar value of Class A Shares at the end of the tenth year after purchase. |
Not FDIC insured, nor bank guaranteed. May lose value.
17
Managers AMG FQ Funds
Statements of Assets and Liabilities
October 31, 2008
| | | | | | | | |
| | | FQ Tax-Managed
U.S. Equity | | | FQ U.S.
Equity | |
Assets: | | | | | | | | |
Investments at value (including securities on loan valued at $17,427,286 and $10,427,157, respectively)* | | $ | 88,814,321 | | | $ | 69,714,376 | |
Cash collateral for futures | | | — | | | | 77,000 | |
Receivable for Fund shares sold | | | 25,155 | | | | 18,616 | |
Dividends and other receivables | | | 39,019 | | | | 74,977 | |
Receivable for variation margin on futures contracts | | | — | | | | 1,450 | |
Prepaid expenses | | | 9,555 | | | | 14,657 | |
| | | | | | | | |
Total assets | | | 88,888,050 | | | | 69,901,076 | |
| | | | | | | | |
Liabilities: | | | | | | | | |
Payable upon return of securities loaned | | | 17,546,351 | | | | 10,472,778 | |
Payable for Fund shares repurchased | | | 313,186 | | | | 53,658 | |
Accrued expenses: | | | | | | | | |
Investment advisory and management fees | | | 43,605 | | | | 2,377 | |
Administrative fees | | | — | | | | 12,694 | |
Distribution fees | | | 9,373 | | | | 5,883 | |
Professional fees | | | 38,640 | | | | 36,288 | |
Other | | | 28,092 | | | | 58,458 | |
| | | | | | | | |
Total liabilities | | | 17,979,247 | | | | 10,642,136 | |
| | | | | | | | �� |
Net Assets | | $ | 70,908,803 | | | $ | 59,258,940 | |
| | | | | | | | |
Net Assets Represent: | | | | | | | | |
Paid-in capital | | $ | 143,364,608 | | | $ | 84,729,505 | |
Undistributed net investment income | | | 675,684 | | | | 677,554 | |
Accumulated net realized loss from investments and futures contracts | | | (56,340,911 | ) | | | (10,099,789 | ) |
Net unrealized depreciation of investments and futures contracts | | | (16,790,578 | ) | | | (16,048,330 | ) |
| | | | | | | | |
Net Assets | | $ | 70,908,803 | | | $ | 59,258,940 | |
| | | | | | | | |
Class A Shares - Net Assets | | $ | 15,333,868 | | | $ | 22,966,089 | |
Shares outstanding | | | 1,535,627 | | | | 2,662,656 | |
| | | | | | | | |
Net asset value and redemption price per share | | $ | 9.99 | | | $ | 8.63 | |
| | | | | | | | |
Offering price per share based on a maximum sales charge of 5.75%
(Net asset value per share/(100% - maximum sales charge)) | | $ | 10.60 | | | $ | 9.16 | |
Class C Shares - Net Assets | | $ | 6,692,797 | | | $ | 1,157,816 | |
Shares outstanding | | | 681,769 | | | | 135,927 | |
| | | | | | | | |
Net asset value and redemption price per share | | $ | 9.82 | | | $ | 8.52 | |
| | | | | | | | |
Institutional Class Shares - Net Assets | | $ | 48,882,138 | | | $ | 35,135,035 | |
Shares outstanding | | | 4,894,765 | | | | 4,047,223 | |
| | | | | | | | |
Net asset value, offering and redemption price per share | | $ | 9.99 | | | $ | 8.68 | |
| | | | | | | | |
* Investments at cost | | $ | 105,604,899 | | | $ | 85,691,512 | |
The accompanying notes are an integral part of these financial statements.
18
Managers AMG FQ Global Alternatives Fund
Statement of Net Assets
October 31, 2008
| | | | | | |
Assets: | | Principal
Amount | | Value |
Investments in Securities - 84.4% | | | | | | |
U.S. Government Obligations- 9.3% | | | | | | |
U.S. Treasury Bills, 1.800%, 04/23/09 (cost $9,370,604)1,2 | | $ | 9,435,000 | | $ | 9,393,543 |
| | |
| | | Shares | | |
Exchange Traded Fund- 18.0% | | | | | | |
S&P 500 SPDR Trust Series I (cost $21,686,106) | | | 188,510 | | | 18,253,423 |
Short-Term Investments- 57.1%3 | | | | | | |
Dreyfus Cash Management Fund, Institutional Class Shares, 2.84%4 | | | 25,524,328 | | | 25,524,328 |
JPMorgan Liquid Assets Money Market Fund, Capital Shares, 2.85%4 | | | 32,362,065 | | | 32,362,065 |
| | | | | | |
Total Short-Term Investments (cost $57,886,393) | | | | | | 57,886,393 |
| | | | | | |
Total Investments in Securities (cost $88,943,103) | | | | | | 85,533,359 |
| | | | | | |
Cash held as collateral5 | | | | | | 1,000,000 |
Receivable for investments sold | | | | | | 1,215,159 |
Receivable for Fund shares sold | | | | | | 9,983,858 |
Interest and other receivables | | | | | | 38,283 |
Receivable for variation margin on futures contracts | | | | | | 1,657,324 |
Unrealized gains on forward foreign currency contracts | | | | | | 17,711,265 |
Prepaid expenses | | | | | | 10,989 |
| | | | | | |
Total assets | | | | | | 117,150,237 |
| | | | | | |
Liabilities: | | | | | | |
Payable to custodian | | | | | | 1,137,741 |
Payable for foreign currency contracts | | | | | | 314,880 |
Payable for Fund shares repurchased | | | | | | 274,353 |
Payable for investments purchased | | | | | | 1,190,643 |
Unrealized losses on forward foreign currency contracts | | | | | | 11,594,829 |
Payable for variation margin on futures contracts | | | | | | 1,093,305 |
Accrued expenses: | | | | | | |
Investment advisory and management fees | | | | | | 78,964 |
Administrative fees | | | | | | 16,231 |
Distribution fees | | | | | | 23,463 |
Professional fees | | | | | | 44,750 |
Other | | | | | | 20,797 |
| | | | | | |
Total liabilities | | | | | | 15,789,956 |
| | | | | | |
Net Assets | | | | | $ | 101,360,281 |
| | | | | | |
Net Assets Represent: | | | | | | |
Paid-in capital | | | | | $ | 94,314,329 |
Undistributed net investment income | | | | | | 4,977,692 |
Accumulated net realized gain from investments, futures and foreign currency contracts | | | | | | 1,781,186 |
Net unrealized appreciation of investments, futures and foreign currency contracts | | | | | | 287,074 |
| | | | | | |
Net Assets | | | | | $ | 101,360,281 |
| | | | | | |
Class A Shares - Net Assets | | | | | $ | 89,232,171 |
Shares outstanding | | | | | | 8,114,576 |
| | | | | | |
Net asset value and redemption price per share | | | | | $ | 11.00 |
| | | | | | |
Offering price per share based on a maximum sales charge of 5.75%
(Net asset value per share/(100% - maximum sales charge)) | | | | | $ | 11.67 |
Class C Shares - Net Assets | | | | | $ | 12,128,110 |
Shares outstanding | | | | | | 1,121,998 |
| | | | | | |
Net asset value and redemption price per share | | | | | $ | 10.81 |
| | | | | | |
Note: Based on the cost of investments of $88,943,103 for Federal income tax purposes at October 31, 2008, the aggregate gross unrealized appreciation and depreciation were $22,938 and $3,432,682, respectively, resulting in net unrealized depreciation of investments of $3,409,744.
1 | Security held as collateral for futures contracts, amounting to a market value of $9,393,543, or 9.3% of net assets. |
2 | Yield shown represents yield to maturity at October 31, 2008. |
3 | Yield shown for each investment company listed below represents the October 31, 2008, seven-day average yield, which refers to the sum of the previous seven days’ dividends paid, expressed as an annual percentage. |
4 | The Fund’s investment in Dreyfus Cash Management Fund and JPMorgan Liquid Assets Money Market Fund are covered under the U.S. Treasury Temporary Money Market Fund Guarantee Program up to a maximum of $7,677,578 and $32,419,104, respectively. |
5 | Cash held as collateral for forward contracts in a segregated account at The Bank of New York Mellon. |
The accompanying notes are an integral part of these financial statements.
19
Managers AMG FQ Funds
Statements of Operations
For the fiscal year ended October 31, 2008
| | | | | | | | | | | | |
| | | FQ Tax-Managed
U.S. Equity | | | FQ U.S. Equity | | | FQ Global
Alternatives | |
Investment Income: | | | | | | | | | | | | |
Dividend income | | $ | 1,977,382 | | | $ | 1,709,618 | | | $ | 1,472,404 | |
Interest income | | | — | | | | — | | | | 47,463 | |
Securities lending fees | | | 173,313 | | | | 100,259 | | | | — | |
Foreign withholding tax | | | (2,932 | ) | | | — | | | | — | |
| | | | | | | | | | | | |
Total investment income | | | 2,147,763 | | | | 1,809,877 | | | | 1,519,867 | |
| | | | | | | | | | | | |
Expenses: | | | | | | | | | | | | |
Investment advisory and management fees | | | 956,419 | | | | 296,458 | | | | 984,102 | |
Administrative fees | | | — | | | | 211,756 | | | | 144,721 | |
Distribution fees Class A | | | 59,608 | | | | 47,332 | | | | 122,045 | |
Distribution fees Class C | | | 96,367 | | | | 17,128 | | | | 90,704 | |
Transfer agent | | | 58,280 | | | | 120,462 | | | | 27,803 | |
Professional fees | | | 54,719 | | | | 45,338 | | | | 52,964 | |
Registration fees | | | 39,687 | | | | 37,105 | | | | 32,950 | |
Custodian | | | 23,855 | | | | 28,480 | | | | 10,133 | |
Reports to shareholders | | | 14,654 | | | | 14,076 | | | | 14,820 | |
Trustees fees and expenses | | | 8,705 | | | | 7,254 | | | | 4,054 | |
Miscellaneous | | | 7,333 | | | | 5,585 | | | | 2,442 | |
| | | | | | | | | | | | |
Total expenses before offsets | | | 1,319,627 | | | | 830,974 | | | | 1,486,738 | |
| | | | | | | | | | | | |
Fee waivers | | | — | | | | — | | | | (8,848 | ) |
Expense reimbursements | | | (47,896 | ) | | | (97,751 | ) | | | (98,043 | ) |
Expense reductions | | | (1,082 | ) | | | (1,026 | ) | | | (2,071 | ) |
| | | | | | | | | | | | |
Net expenses | | | 1,270,649 | | | | 732,197 | | | | 1,377,776 | |
| | | | | | | | | | | | |
Net investment income | | | 877,114 | | | | 1,077,680 | | | | 142,091 | |
| | | | | | | | | | | | |
Net Realized and Unrealized Gain (Loss): | | | | | | | | | | | | |
Net realized gain (loss) on investment transactions | | | (9,642,674 | ) | | | (9,985,815 | ) | | | 27,690 | |
Net realized gain (loss) on futures contracts | | | — | | | | (188,344 | ) | | | 278,128 | |
Net realized gain on foreign currency contracts | | | — | | | | — | | | | 3,583,012 | |
Net unrealized depreciation of investments | | | (43,337,251 | ) | | | (26,925,020 | ) | | | (4,516,042 | ) |
Net unrealized depreciation of futures contracts | | | — | | | | (73,875 | ) | | | (1,922,481 | ) |
Net unrealized appreciation of foreign currency contracts | | | — | | | | — | | | | 9,217,373 | |
| | | | | | | | | | | | |
Net realized and unrealized gain (loss) | | | (52,979,925 | ) | | | (37,173,054 | ) | | | 6,667,680 | |
| | | | | | | | | | | | |
Net Increase (Decrease) in Net Assets Resulting from Operations | | | ($52,102,811 | ) | | | ($36,095,374 | ) | | $ | 6,809,771 | |
| | | | | | | | | | | | |
The accompanying notes are an integral part of these financial statements.
20
Managers AMG FQ Funds
Statements of Changes in Net Assets
For the year ended October 31,
| | | | | | | | | | | | | | | | | | | | | | | | |
| | | FQ Tax-Managed U.S. Equity | | | FQ U.S. Equity | | | FQ Global Alternatives | |
| | | 2008 | | | 2007 | | | 2008 | | | 2007 | | | 2008 | | | 2007 | |
Increase (Decrease) in Net Assets From Operations: | | | | | | | | | | | | | | | | | | | | | | | | |
Net investment income | | $ | 877,114 | | | $ | 354,740 | | | $ | 1,077,680 | | | $ | 824,531 | | | $ | 142,091 | | | $ | 613,315 | |
Net realized gain (loss) on investments, futures and foreign currency transactions | | | (9,642,674 | ) | | | 5,137,603 | | | | (10,174,159 | ) | | | 11,027,192 | | | | 3,888,830 | | | | 1,472,378 | |
Net unrealized appreciation (depreciation) of investments, futures and foreign currency translations | | | (43,337,251 | ) | | | 13,324,156 | | | | (26,998,895 | ) | | | 1,475,588 | | | | 2,778,850 | | | | (2,172,643 | ) |
| | | | | | | | | | | | | | | | | | | | | | | | |
Net increase (decrease) in net assets resulting from operations | | | (52,102,811 | ) | | | 18,816,499 | | | | (36,095,374 | ) | | | 13,327,311 | | | | 6,809,771 | | | | (86,950 | ) |
| | | | | | | | | | | | | | | | | | | | | | | | |
Distributions to Shareholders: | | | | | | | | | | | | | | | | | | | | | | | | |
From net investment income | | | (537,697 | ) | | | (63,118 | ) | | | (1,004,699 | ) | | | (826,430 | ) | | | (121,939 | ) | | | (428,312 | ) |
From net realized gain on investments | | | — | | | | — | | | | (10,995,141 | ) | | | (7,967,797 | ) | | | (447,105 | ) | | | — | |
| | | | | | | | | | | | | | | | | | | | | | | | |
Total distributions to shareholders | | | (537,697 | ) | | | (63,118 | ) | | | (11,999,840 | ) | | | (8,794,227 | ) | | | (569,044 | ) | | | (428,312 | ) |
| | | | | | | | | | | | | | | | | | | | | | | | |
From Capital Share Transactions: | | | | | | | | | | | | | | | | | | | | | | | | |
Proceeds from the sale of shares | | | 35,754,385 | | | | 51,835,490 | | | | 18,968,205 | | | | 33,962,254 | | | | 81,169,035 | | | | 46,376,569 | |
Reinvestment of dividends and distributions | | | 454,409 | | | | 58,882 | | | | 11,587,804 | | | | 8,561,477 | | | | 354,090 | | | | 425,858 | |
Cost of shares repurchased | | | (41,462,127 | ) | | | (26,335,187 | ) | | | (30,215,539 | ) | | | (18,579,846 | ) | | | (31,583,474 | ) | | | (22,463,071 | ) |
| | | | | | | | | | | | | | | | | | | | | | | | |
Net increase (decrease) from capital share transactions | | | (5,253,333 | ) | | | 25,559,185 | | | | 340,470 | | | | 23,943,885 | | | | 49,939,651 | | | | 24,339,356 | |
| | | | | | | | | | | | | | | | | | | | | | | | |
Total increase (decrease) in net assets | | | (57,893,841 | ) | | | 44,312,566 | | | | (47,754,744 | ) | | | 28,476,969 | | | | 56,180,378 | | | | 23,824,094 | |
| | | | | | | | | | | | | | | | | | | | | | | | |
Net Assets: | | | | | | | | | | | | | | | | | | | | | | | | |
Beginning of year | | | 128,802,644 | | | | 84,490,078 | | | | 107,013,684 | | | | 78,536,715 | | | | 45,179,903 | | | | 21,355,809 | |
| | | | | | | | | | | | | | | | | | | | | | | | |
End of year | | $ | 70,908,803 | | | $ | 128,802,644 | | | $ | 59,258,940 | | | $ | 107,013,684 | | | $ | 101,360,281 | | | $ | 45,179,903 | |
| | | | | | | | | | | | | | | | | | | | | | | | |
End of year undistributed net investment income | | $ | 675,684 | | | $ | 349,337 | | | $ | 677,554 | | | $ | 686,021 | | | $ | 4,977,692 | | | $ | 3,073,916 | |
| | | | | | | | | | | | | | | | | | | | | | | | |
Share Transactions: | | | | | | | | | | | | | | | | | | | | | | | | |
Sale of shares | | | 2,517,854 | | | | 3,273,716 | | | | 1,781,746 | | | | 2,282,565 | | | | 7,747,805 | | | | 4,509,114 | |
Reinvestment of dividends and distributions | | | 28,638 | | | | 3,711 | | | | 881,812 | | | | 619,547 | | | | 35,643 | | | | 43,154 | |
Shares repurchased | | | (3,114,114 | ) | | | (1,665,406 | ) | | | (2,733,178 | ) | | | (1,256,742 | ) | | | (3,101,019 | ) | | | (2,193,872 | ) |
| | | | | | | | | | | | | | | | | | | | | | | | |
Net increase (decrease) in shares | | | (567,622 | ) | | | 1,612,021 | | | | (69,620 | ) | | | 1,645,370 | | | | 4,682,429 | | | | 2,358,396 | |
| | | | | | | | | | | | | | | | | | | | | | | | |
The accompanying notes are an integral part of these financial statements.
21
Managers AMG FQ Tax-Managed U.S. Equity Fund
Financial Highlights
For a share outstanding throughout each fiscal year
| | | | | | | | | | | | | | | | | | | | |
| | | For the fiscal year ended October 31, | |
Institutional Class Shares | | 2008 | | | 2007 | | | 2006 | | | 2005 | | | 2004 | |
Net Asset Value, Beginning of Year | | $ | 16.80 | | | $ | 13.93 | | | $ | 11.89 | | | $ | 9.94 | | | $ | 9.39 | |
| | | | | | | | | | | | | | | | | | | | |
Income from Investment Operations: | | | | | | | | | | | | | | | | | | | | |
Net investment income | | | 0.13 | | | | 0.06 | | | | 0.03 | | | | 0.01 | | | | 0.11 | |
Net realized and unrealized gain (loss) on investments | | | (6.87 | ) | | | 2.82 | | | | 2.03 | | | | 2.04 | | | | 0.44 | |
| | | | | | | | | | | | | | | | | | | | |
Total from investment operations | | | (6.74 | ) | | | 2.88 | | | | 2.06 | | | | 2.05 | | | | 0.55 | |
| | | | | | | | | | | | | | | | | | | | |
Less Distributions to Shareholders from: | | | | | | | | | | | | | | | | | | | | |
Net investment income | | | (0.07 | ) | | | (0.01 | ) | | | (0.02 | ) | | | (0.10 | ) | | | — | |
| | | | | | | | | | | | | | | | | | | | |
Net Asset Value, End of Year | | $ | 9.99 | | | $ | 16.80 | | | $ | 13.93 | | | $ | 11.89 | | | $ | 9.94 | |
| | | | | | | | | | | | | | | | | | | | |
Total Return1 | | | (40.26 | )% | | | 20.68 | % | | | 17.37 | % | | | 20.75 | % | | | 5.86 | % |
| | | | | | | | | | | | | | | | | | | | |
Ratio of net expenses to average net assets | | | 0.99 | % | | | 0.99 | % | | | 0.99 | % | | | 0.99 | % | | | 0.99 | % |
Ratio of net investment income to average net assets1 | | | 0.92 | % | | | 0.37 | % | | | 0.23 | % | | | 0.04 | % | | | 0.99 | % |
Portfolio turnover | | | 136 | % | | | 65 | % | | | 98 | % | | | 105 | % | | | 131 | % |
Net assets at end of year (000’s omitted) | | $ | 48,882 | | | $ | 95,510 | | | $ | 82,975 | | | $ | 55,377 | | | $ | 45,321 | |
| | | | | | | | | | | | | | | | | | | | |
Expense Offsets:2 | | | | | | | | | | | | | | | | | | | | |
Ratio of total expenses to average net assets | | | 1.03 | % | | | 1.07 | % | | | 1.11 | % | | | 1.21 | % | | | 1.20 | % |
Ratio of net investment income (loss) to average net assets | | | 0.88 | % | | | 0.29 | % | | | 0.12 | % | | | (0.17 | )% | | | 0.79 | % |
| | | | | | | | | | | | | | | | | | | | |
1 | Total returns and net investment income would have been lower had certain expenses not been reduced. (See Note 1(c) of Notes to Financial Statements.) |
2 | Excludes the impact of expense reimbursements or fee waivers and expense reductions such as brokerage credits, but includes non-reimbursable expenses, if any, such as interest and taxes. (See Note 1(c) of Notes to Financial Statements.) |
22
Managers AMG FQ Tax-Managed U.S. Equity Fund
Financial Highlights
For a share outstanding throughout each fiscal period
| | | | | | | | | | | | |
| | | For the fiscal year
ended October 31, | | | For the fiscal period
ended October 31,
2006 * | |
Class A Shares | | 2008 | | | 2007 | | |
Net Asset Value, Beginning of Period | | $ | 16.75 | | | $ | 13.91 | | | $ | 13.01 | |
| | | | | | | | | | | | |
Income from Investment Operations: | | | | | | | | | | | | |
Net investment income | | | 0.10 | | | | 0.02 | | | | 0.00 | 5 |
Net realized and unrealized gain (loss) on investments | | | (6.81 | ) | | | 2.82 | | | | 0.90 | |
| | | | | | | | | | | | |
Total from investment operations | | | (6.71 | ) | | | 2.84 | | | | 0.90 | |
| | | | | | | | | | | | |
Less Distributions to Shareholders from: | | | | | | | | | | | | |
Net investment income | | | (0.05 | ) | | | — | | | | — | |
| | | | | | | | | | | | |
Net Asset Value, End of Period | | $ | 9.99 | | | $ | 16.75 | | | $ | 13.91 | |
| | | | | | | | | | | | |
Total Return1 | | | (40.15 | )%6 | | | 20.42 | % | | | 6.92 | %2 |
| | | | | | | | | | | | |
Ratio of net expenses to average net assets | | | 1.24 | % | | | 1.24 | % | | | 1.24 | %3 |
Ratio of net investment income (loss) to average net assets1 | | | 0.67 | % | | | 0.30 | % | | | (0.11 | )%3 |
Portfolio turnover | | | 136 | % | | | 65 | % | | | 98 | %2 |
Net assets at end of period (000’s omitted) | | $ | 15,334 | | | $ | 23,803 | | | $ | 574 | |
| | | | | | | | | | | | |
Expense Offsets:4 | | | | | | | | | | | | |
Ratio of total expenses to average net assets | | | 1.28 | % | | | 1.32 | % | | | 1.40 | %3 |
Ratio of net investment income (loss) to average net assets | | | 0.63 | % | | | 0.22 | % | | | (0.27 | )%3 |
| | | | | | | | | | | | |
| | |
| | | For the fiscal year
ended October 31, | | | For the fiscal period
ended October 31,
2006 * | |
Class C Shares | | 2008 | | | 2007 | | |
Net Asset Value, Beginning of Period | | $ | 16.53 | | | $ | 13.83 | | | $ | 13.01 | |
| | | | | | | | | | | | |
Income from Investment Operations: | | | | | | | | | | | | |
Net investment income (loss) | | | (0.02 | ) | | | 0.00 | 5 | | | (0.03 | ) |
Net realized and unrealized gain (loss) on investments | | | (6.69 | ) | | | 2.70 | | | | 0.85 | |
| | | | | | | | | | | | |
Total from investment operations | | | (6.71 | ) | | | 2.70 | | | | 0.82 | |
| | | | | | | | | | | | |
Net Asset Value, End of Period | | $ | 9.82 | | | $ | 16.53 | | | $ | 13.83 | |
| | | | | | | | | | | | |
Total Return1 | | | (40.56 | )% | | | 19.52 | %6 | | | 6.30 | %2 |
| | | | | | | | | | | | |
Ratio of net expenses to average net assets | | | 1.99 | % | | | 1.99 | % | | | 1.99 | %3 |
Ratio of net investment loss to average net assets1 | | | (0.09 | )% | | | (0.36 | )% | | | (0.91 | )%3 |
Portfolio turnover | | | 136 | % | | | 65 | % | | | 98 | %2 |
Net assets at end of period (000’s omitted) | | $ | 6,693 | | | $ | 9,490 | | | $ | 941 | |
| | | | | | | | | | | | |
Expense Offsets:4 | | | | | | | | | | | | |
Ratio of total expenses to average net assets | | | 2.03 | % | | | 2.07 | % | | | 2.15 | %3 |
Ratio of net investment loss to average net assets | | | (0.13 | )% | | | (0.44 | )% | | | (1.06 | )%3 |
| | | | | | | | | | | | |
| * | Class A and Class C shares commenced operations on March 1, 2006. (See Notes to Financial Statements.) |
1 | Total returns and net investment income would have been lower had certain expenses not been reduced. (See Note 1(c) of Notes to Financial Statements.) |
4 | Excludes the impact of expense reimbursements or fee waivers and expense reductions such as brokerage credits, but includes non-reimbursable expenses, if any, such as interest and taxes. (See Note 1(c) of Notes to Financial Statements.) |
5 | Rounds to less than $0.01. |
6 | The Total Return is based on the Financial Statement Net Asset Value as shown above. |
23
Managers AMG FQ U.S. Equity Fund
Financial Highlights
For a share outstanding throughout each fiscal year
| | | | | | | | | | | | | | | | | | | | |
| | | For the fiscal year ended October 31, | |
Institutional Class Shares | | 2008 | | | 2007 | | | 2006 | | | 2005 | | | 2004 | |
Net Asset Value, Beginning of Year | | $ | 15.49 | | | $ | 14.90 | | | $ | 12.93 | | | $ | 11.62 | | | $ | 10.59 | |
| | | | | | | | | | | | | | | | | | | | |
Income from Investment Operations: | | | | | | | | | | | | | | | | | | | | |
Net investment income | | | 0.19 | | | | 0.15 | | | | 0.17 | | | | 0.20 | | | | 0.11 | |
Net realized and unrealized gain (loss) on investments | | | (5.23 | ) | | | 2.11 | | | | 2.49 | | | | 1.26 | | | | 1.00 | |
| | | | | | | | | | | | | | | | | | | | |
Total from investment operations | | | (5.04 | ) | | | 2.26 | | | | 2.66 | | | | 1.46 | | | | 1.11 | |
| | | | | | | | | | | | | | | | | | | | |
Less Distributions to Shareholders from: | | | | | | | | | | | | | | | | | | | | |
Net investment income | | | (0.16 | ) | | | (0.16 | ) | | | (0.18 | ) | | | (0.15 | ) | | | (0.08 | ) |
Net realized gain on investments | | | (1.61 | ) | | | (1.51 | ) | | | (0.51 | ) | | | — | | | | — | |
| | | | | | | | | | | | | | | | | | | | |
Total distributions to shareholders | | | (1.77 | ) | | | (1.67 | ) | | | (0.69 | ) | | | (0.15 | ) | | | (0.08 | ) |
| | | | | | | | | | | | | | | | | | | | |
Net Asset Value, End of Year | | $ | 8.68 | | | $ | 15.49 | | | $ | 14.90 | | | $ | 12.93 | | | $ | 11.62 | |
| | | | | | | | | | | | | | | | | | | | |
Total Return1 | | | (36.43 | )% | | | 16.54 | % | | | 21.44 | % | | | 12.64 | % | | | 10.52 | % |
| | | | | | | | | | | | | | | | | | | | |
Ratio of net expenses to average net assets | | | 0.79 | % | | | 0.79 | % | | | 0.79 | % | | | 0.85 | % | | | 0.79 | % |
Ratio of net investment income to average net assets1 | | | 1.36 | % | | | 0.96 | % | | | 1.23 | % | | | 1.49 | % | | | 0.97 | % |
Portfolio turnover | | | 227 | % | | | 106 | % | | | 89 | % | | | 105 | % | | | 106 | % |
Net assets at end of year (000’s omitted) | | $ | 35,135 | | | $ | 82,915 | | | $ | 78,068 | | | $ | 72,470 | | | $ | 72,878 | |
| | | | | | | | | | | | | | | | | | | | |
Expense Offsets:2 | | | | | | | | | | | | | | | | | | | | |
Ratio of total expenses to average net assets | | | 0.91 | % | | | 0.83 | % | | | 0.82 | % | | | — | | | | — | |
Ratio of net investment income to average net assets | | | 1.24 | % | | | 0.92 | % | | | 1.19 | % | | | — | | | | — | |
| | | | | | | | | | | | | | | | | | | | |
1 | Total returns and net investment income would have been lower had certain expenses not been reduced. (See Note 1(c) of Notes to Financial Statements.) |
2 | Excludes the impact of expense reimbursements or fee waivers and expense reductions such as brokerage credits, but includes non-reimbursable expenses, if any, such as interest and taxes. (See Note 1(c) of Notes to Financial Statements.) |
24
Managers AMG FQ U.S. Equity Fund
Financial Highlights
For a share outstanding throughout each fiscal period
| | | | | | | | | | | | |
| | | For the fiscal year
ended October 31, | | | For the fiscal period
ended October 31,
2006* | |
Class A Shares | | 2008 | | | 2007 | | |
Net Asset Value, Beginning of Period | | $ | 15.43 | | | $ | 14.88 | | | $ | 13.53 | |
| | | | | | | | | | | | |
Income from Investment Operations: | | | | | | | | | | | | |
Net investment income | | | 0.09 | | | | 0.17 | | | | 0.01 | |
Net realized and unrealized gain (loss) on investments | | | (5.14 | ) | | | 2.05 | | | | 1.34 | |
| | | | | | | | | | | | |
Total from investment operations | | | (5.05 | ) | | | 2.22 | | | | 1.35 | |
| | | | | | | | | | | | |
Less Distributions to Shareholders from: | | | | | | | | | | | | |
Net investment income | | | (0.14 | ) | | | (0.16 | ) | | | — | |
Net realized gain on investments | | | (1.61 | ) | | | (1.51 | ) | | | — | |
| | | | | | | | | | | | |
Total distributions to shareholders | | | (1.75 | ) | | | (1.67 | ) | | | — | |
| | | | | | | | | | | | |
Net Asset Value, End of Period | | $ | 8.63 | | | $ | 15.43 | | | $ | 14.88 | |
| | | | | | | | | | | | |
Total Return1 | | | (36.64 | )% | | | 16.28 | % | | | 9.98 | %2 |
| | | | | | | | | | | | |
Ratio of net expenses to average net assets | | | 1.04 | % | | | 1.04 | % | | | 1.04 | %3 |
Ratio of net investment income to average net assets1 | | | 1.07 | % | | | 0.56 | % | | | 0.63 | %3 |
Portfolio turnover | | | 227 | % | | | 106 | % | | | 89 | %2 |
Net assets at end of period (000’s omitted) | | $ | 22,966 | | | $ | 21,773 | | | $ | 371 | |
| | | | | | | | | | | | |
Expense Offsets:4 | | | | | | | | | | | | |
Ratio of total expenses to average net assets | | | 1.16 | % | | | 1.08 | % | | | 1.13 | %3 |
Ratio of net investment income to average net assets | | | 0.95 | % | | | 0.52 | % | | | 0.54 | %3 |
| | | | | | | | | | | | |
| | |
| | | For the fiscal year
ended October 31, | | | For the fiscal period
ended October 31,
2006* | |
Class C Shares | | 2008 | | | 2007 | | |
Net Asset Value, Beginning of Period | | $ | 15.27 | | | $ | 14.85 | | | $ | 13.53 | |
| | | | | | | | | | | | |
Income from Investment Operations: | | | | | | | | | | | | |
Net investment income | | | 0.04 | | | | 0.13 | | | | 0.00 | 5 |
Net realized and unrealized gain (loss) on investments | | | (5.13 | ) | | | 1.96 | | | | 1.32 | |
| | | | | | | | | | | | |
Total from investment operations | | | (5.09 | ) | | | 2.09 | | | | 1.32 | |
| | | | | | | | | | | | |
Less Distributions to Shareholders from: | | | | | | | | | | | | |
Net investment income | | | (0.05 | ) | | | (0.16 | ) | | | — | |
Net realized gain on investments | | | (1.61 | ) | | | (1.51 | ) | | | — | |
| | | | | | | | | | | | |
Total distributions to shareholders | | | (1.66 | ) | | | (1.67 | ) | | | — | |
| | | | | | | | | | | | |
Net Asset Value, End of Period | | $ | 8.52 | | | $ | 15.27 | | | $ | 14.85 | |
| | | | | | | | | | | | |
Total Return1 | | | (37.12 | )% | | | 15.35 | % | | | 9.76 | %2 |
| | | | | | | | | | | | |
Ratio of net expenses to average net assets | | | 1.79 | % | | | 1.79 | % | | | 1.79 | %3 |
Ratio of net investment income (loss) to average net assets1 | | | 0.37 | % | | | (0.13 | )% | | | 0.16 | %3 |
Portfolio turnover | | | 227 | % | | | 106 | % | | | 89 | %2 |
Net assets at end of period (000’s omitted) | | $ | 1,158 | | | $ | 2,326 | | | $ | 97 | |
| | | | | | | | | | | | |
Expense Offsets:4 | | | | | | | | | | | | |
Ratio of total expenses to average net assets | | | 1.91 | % | | | 1.83 | % | | | 1.88 | %3 |
Ratio of net investment income (loss) to average net assets | | | 0.25 | % | | | (0.17 | )% | | | (0.07 | )%3 |
| | | | | | | | | | | | |
| * | Class A and Class C shares commenced operations on March 1, 2006. (See Notes to Financial Statements.) |
1 | Total returns and net investment income would have been lower had certain expenses not been reduced. (See Note 1(c) of Notes to Financial Statements.) |
4 | Excludes the impact of expense reimbursements or fee waivers and expense reductions such as brokerage credits, but includes non-reimbursable expenses, if any, such as interest and taxes. (See Note 1(c) of Notes to Financial Statements.) |
5 | Rounds to less than $0.01. |
25
Managers AMG FQ Global Alternatives Fund
Financial Highlights
For a share outstanding throughout each fiscal period
| | | | | | | | | | | | |
| | | For the fiscal year
ended October 31, | | | For the fiscal period
ended October 31,
2006 * | |
Class A Shares | | 2008 | | | 2007 | | |
Net Asset Value, Beginning of Period | | $ | 9.94 | | | $ | 9.73 | | | $ | 10.00 | |
| | | | | | | | | | | | |
Income from Investment Operations: | | | | | | | | | | | | |
Net investment income | | | 0.04 | 6 | | | 0.18 | 6 | | | 0.16 | |
Net realized and unrealized gain (loss) on investments | | | 1.15 | 6 | | | 0.22 | 6 | | | (0.43 | ) |
| | | | | | | | | | | | |
Total from investment operations | | | 1.19 | | | | 0.40 | | | | (0.27 | ) |
| | | | | | | | | | | | |
Less Distributions to Shareholders from: | | | | | | | | | | | | |
Net investment income | | | (0.03 | ) | | | (0.19 | ) | | | — | |
Net realized gain on investments | | | (0.10 | ) | | | — | | | | — | |
| | | | | | | | | | | | |
Total distributions to shareholders | | | (0.13 | ) | | | (0.19 | ) | | | — | |
| | | | | | | | | | | | |
Net Asset Value, End of Period | | $ | 11.00 | | | $ | 9.94 | | | $ | 9.73 | |
| | | | | | | | | | | | |
Total Return1 | | | 12.17 | %5 | | | 4.11 | %5 | | | (2.70 | )%2 |
| | | | | | | | | | | | |
Ratio of net expenses to average net assets | | | 2.26 | % | | | 2.50 | % | | | 2.50 | %3 |
Ratio of net investment income to average net assets1 | | | 0.36 | % | | | 1.72 | % | | | 1.38 | %3 |
Portfolio turnover | | | 133 | % | | | 104 | % | | | 48 | %2 |
Net assets at end of period (000’s omitted) | | $ | 89,232 | | | $ | 37,716 | | | $ | 20,661 | |
| | | | | | | | | | | | |
Expense Offsets:4 | | | | | | | | | | | | |
Ratio of total expenses to average net assets | | | 2.45 | % | | | 2.56 | % | | | 3.20 | %3 |
Ratio of net investment income to average net assets | | | 0.17 | % | | | 1.66 | % | | | 0.68 | %3 |
| | | | | | | | | | | | |
| | |
| | | For the fiscal year
ended October 31, | | | For the fiscal period
ended October 31,
2006 * | |
Class C Shares | | 2008 | | | 2007 | | |
Net Asset Value, Beginning of Period | | $ | 9.82 | | | $ | 9.69 | | | $ | 10.00 | |
| | | | | | | | | | | | |
Income from Investment Operations: | | | | | | | | | | | | |
Net investment income | | | (0.04 | )6 | | | 0.11 | 6 | | | 0.02 | |
Net realized and unrealized gain (loss) on investments | | | 1.13 | 6 | | | 0.21 | 6 | | | (0.33 | ) |
| | | | | | | | | | | | |
Total from investment operations | | | 1.09 | | | | 0.32 | | | | (0.31 | ) |
| | | | | | | | | | | | |
Less Distributions to Shareholders from: | | | | | | | | | | | | |
Net investment income | | | (0.01 | ) | | | (0.19 | ) | | | — | |
Net realized gain on investments | | | (0.09 | ) | | | — | | | | — | |
| | | | | | | | | | | | |
Total distributions to shareholders | | | (0.10 | ) | | | (0.19 | ) | | | — | |
| | | | | | | | | | | | |
Net Asset Value, End of Period | | $ | 10.81 | | | $ | 9.82 | | | $ | 9.69 | |
| | | | | | | | | | | | |
Total Return1 | | | 11.31 | %5 | | | 3.30 | %5 | | | (3.10 | )%2 |
| | | | | | | | | | | | |
Ratio of net expenses to average net assets | | | 3.02 | % | | | 3.25 | % | | | 3.25 | %3 |
Ratio of net investment income (loss) to average net assets1 | | | (0.38 | )% | | | 1.03 | % | | | 1.03 | %3 |
Portfolio turnover | | | 133 | % | | | 104 | % | | | 48 | %2 |
Net assets at end of period (000’s omitted) | | $ | 12,128 | | | $ | 7,464 | | | $ | 695 | |
| | | | | | | | | | | | |
Expense Offsets:4 | | | | | | | | | | | | |
Ratio of total expenses to average net assets | | | 3.21 | % | | | 3.31 | % | | | 3.52 | %3 |
Ratio of net investment income (loss) to average net assets | | | (0.57 | )% | | | 0.97 | % | | | 0.76 | %3 |
| | | | | | | | | | | | |
| * | Commencement of operations was on March 30, 2006. |
1 | Total returns and net investment income would have been lower had certain expenses not been reduced. (See Note 1(c) of Notes to Financial Statements.) |
4 | Excludes the impact of expense reimbursements / recoupments or fee waivers and expense reductions such as brokerage credits, but include non-reimbursable expenses, if any, such as interest and taxes. (See Note 1(c) of Notes to Financial Statements.) |
5 | The Total Return is based on the Financial Statement Net Asset Values as shown above. |
6 | Per share numbers have been calculated using average shares. |
26
Managers AMG FQ Funds
Notes to Financial Statements
October 31, 2008
| 1. | Summary of Significant Accounting Policies |
Managers Trust I (the “Trust”) is an open-end management investment company, organized as a Massachusetts business trust, and registered under the Investment Company Act of 1940, as amended (the “1940 Act”). Currently, the Trust is comprised of a number of different funds, each having distinct investment management objectives, strategies, risks, and policies. Included in this report are: Managers AMG FQ Tax-Managed U.S. Equity Fund (“Tax-Managed”), Managers AMG FQ U.S. Equity Fund (“U.S. Equity”), and Managers AMG FQ Global Alternatives Fund (“Global Alternatives”), collectively the “Funds.”
Each Fund offers Class A and Class C shares. In addition, Tax-Managed and U.S. Equity offer an Institutional Class. Each class represents an interest in the same assets of the Fund and the classes are identical except for class specific expenses related to shareholder activity. Investment income, realized and unrealized capital gains and losses, the common expenses of the Fund, and certain Fund level expense reductions, if any, are allocated on a pro rata basis to each class based on the relative net assets of each class to the total net assets of the Fund. All classes have equal voting privileges except that each class has exclusive voting rights with respect to its services and/or distribution plan. Sales of Class A shares may be subject to a front-end sales charge of up to 5.75%. Redemptions of Class A and Class C shares may be subject to a contingent-deferred sales charge (as a percentage of the original offering price or the net asset value at the time of sale, whichever is less). Tax-Managed and U.S. Equity Institutional Class shares are available, with no sales charge, to certain institutional investors and qualifying individual investors. Please refer to a current prospectus for additional information on each share class.
The Funds’ financial statements are prepared in accordance with accounting principles generally accepted in the United States of America, which require management to make estimates and assumptions that affect the reported amounts of assets and liabilities and disclosure of contingent assets and liabilities at the date of the financial statements and the reported amounts of income and expenses during the reporting period. Actual results could differ from those estimates and such differences could be material. The following is a summary of significant accounting policies followed by the Funds in the preparation of their financial statements:
| a. | Valuation of Investments |
Equity securities traded on a domestic or international securities exchange are valued at the last quoted sale price, or, lacking any sales, at the last quoted bid price. Over-the-counter securities are valued at the Nasdaq Official Closing Price, if one is available. Lacking any sales, over-the-counter securities are valued at the last quoted bid price. Under certain circumstances, the value of certain Fund investments may be based on an evaluation of fair value, pursuant to procedures established by and under the general supervision of the Board of Trustees of the Trust. A Fund may use the fair value of a portfolio security to calculate its NAV when, for example, (1) market quotations are not readily available because a portfolio security is not traded in a public market or the principal market in which the security trades is closed, (2) trading in a portfolio security is suspended and has not resumed before the Fund calculates its NAV, (3) a significant event affecting the value of a portfolio security is determined to have occurred between the time of the market quotation provided for a portfolio security and the time as of which the Fund calculates its NAV, (4) a security’s price has remained unchanged over a period of time (often referred to as a “stale price”), or (5) Managers Investment Group LLC (“the Investment Manager”) determines that a market quotation is inaccurate. The Investment Manager monitors intervening events that may affect the value of securities held in a Fund’s portfolio and, in accordance with procedures adopted by the Fund’s Trustees, will adjust the prices of securities traded in foreign markets, as appropriate, to reflect the impact of events occurring subsequent to the close of such markets but prior to the time each Fund’s NAV is calculated.
Fixed income securities are valued based on valuations furnished by independent pricing services that utilize matrix systems, which reflect such factors as security prices, yields, maturities, and ratings, and are supplemented by dealer and exchange quotations. Futures contracts for which market quotations are readily available are valued at the settlement price as of the close of the futures exchange. Short-term investments having a remaining maturity of 60 days or less are valued at amortized cost, which approximates market value. Investments in other open-end regulated investment companies are valued at their end of day net asset value per share. Investments in certain mortgage-backed and stripped mortgage-backed securities, preferred stocks, convertible securities, derivatives and other debt securities not traded on an organized securities market are valued on the basis of valuations provided by dealers or by a pricing service which uses information with respect to transactions in such securities and various relationships between securities and yield to maturity in determining value. Securities (including derivatives) for which market quotations are not readily available are valued at fair value, as determined in good faith, and pursuant to procedures adopted by the Board of Trustees of the Trust. The values assigned to fair value investments are based on available information and do not necessarily represent amounts that might ultimately be realized, since such amounts depend on future developments inherent in long-term investments. Further, because of the inherent uncertainty of valuation, those estimated values may differ significantly from the values that would have been used had a ready market for the investments existed, and the differences could be material.
The Funds adopted Financial Accounting Standards Board Statement of Financial Accounting Standards No. 157, Fair Value Measurements (“FAS 157”), effective November 1, 2007. In accordance with FAS 157, fair value is defined as the price that the Fund would receive to sell an asset or pay to transfer a liability in an orderly transaction between market participants at the measurement date. FAS 157 also establishes a framework for measuring fair value, and a three-level hierarchy for fair value measurements based upon the transparency of inputs to the valuation of an asset or liability. Inputs may be observable or unobservable and refer broadly to the assumptions that market participants would use in pricing the asset or liability. Observable inputs reflect the assumptions market participants would use in pricing the asset or liability based on market data obtained from sources independent of the Funds. Unobservable inputs reflect the Funds’ own assumptions about the assumptions that market participants would use in pricing the asset or liability
27
Managers AMG FQ Funds
Notes to Financial Statements (continued)
developed based on the best information available in the circumstances. Each investment is assigned a level based upon the observability of the inputs which are significant to the overall valuation. The three-tier hierarchy of inputs is summarized below.
Level 1 – quoted prices in active markets for identical investments
Level 2 – other significant observable inputs (including quoted prices for similar investments, interest rates, prepayment speeds, credit risk, etc.)
Level 3 – significant unobservable inputs (including the Funds’ own assumptions in determining the fair value of investments)
The following table summarizes the valuation of the Funds’ investments by the above fair value hierarchy levels as of October 31, 2008:
| | | | | | | | | | | | | | | | | | |
| | | Tax-Managed | | U.S. Equity | | | Global Alternatives | |
Valuation Inputs | | Investments in
Securities | | Other Financial
Instruments* | | Investments in
Securities | | Other Financial
Instruments* | | | Investments in
Securities | | Other Financial
Instruments* | |
Level 1 - Quoted Prices | | $ | 88,585,334 | | — | | $ | 69,574,370 | | ($71,194 | ) | | $ | 76,139,816 | | | ($2,446,639 | ) |
Level 2 - Other Significant Observable Inputs | | | 228,987 | | — | | | 140,006 | | — | | | | 9,393,543 | | | 6,140,952 | |
Level 3 - Significant Unobservable Inputs | | | — | | — | | | — | | — | | | | — | | | — | |
| | | | | | | | | | | | | | | | | | |
Total | | $ | 88,814,321 | | — | | $ | 69,714,376 | | ($71,194 | ) | | $ | 85,533,359 | | $ | 3,694,313 | |
| | | | | | | | | | | | | | | | | | |
| * | Other financial instruments are derivative instruments not reflected in the Schedule of Portfolio of Investments, such as futures, forwards and swap contracts, which are valued at the unrealized appreciation/depreciation on the instrument. |
Security transactions are accounted for as of trade date. Realized gains and losses on securities sold are determined on the basis of identified cost.
| c. | Investment Income and Expenses |
Dividend income is recorded on the ex-dividend date, except certain dividends from foreign securities where the ex-dividend date may have passed. These dividends are recorded as soon as the Trust is informed of the ex-dividend date. Dividend income on foreign securities is recorded net of any withholding tax. Interest income, which includes amortization of premium and accretion of discount on debt securities, is accrued as earned. Non-cash dividends included in dividend income, if any, are reported at the fair market value of the securities received. Other income and expenses are recorded on an accrual basis. Expenses which cannot be directly attributed to a fund are apportioned among the Funds in the Trust and in some cases other affiliated funds based upon their relative average net assets or number of shareholders.
U.S. Equity directed certain portfolio trades to a brokerage firm, under a brokerage recapture program, which paid a portion of the Fund’s expenses. For the fiscal year ended October 31, 2008, under this arrangement the Fund’s expenses were reduced by $186 which had no impact on the annualized expense ratio.
Each of the Funds has a “balance credit” agreement with The Bank of New York Mellon (“BNYM”), the Funds’ custodian, whereby each Fund is credited with an interest factor equal to 0.75% below the effective 90-day T-Bill rate for account balances left uninvested overnight. If the T-Bill rate falls below 0.75%, no credits will be earned. These credits serve to reduce custody expenses that would otherwise be charged to each Fund. For the fiscal year ended October 31, 2008, the custodian expense was reduced as follows: Tax-Managed - $20, U.S. Equity - $16 and Global Alternatives - $1,578.
Overdrafts will cause a reduction of any earnings credits, computed at 2% above the effective Federal funds rate on the day of the overdraft. For the fiscal year ended October 31, 2008, overdraft fees for Tax-Managed, U.S. Equity and Global Alternatives equaled $726, $1,591, and $0, respectively.
The Trust also has a balance credit arrangement with its Transfer Agent, PNC Global Investment Servicing (U.S.) Inc. (formerly PFPC, Inc.), whereby earnings credits are used to offset banking charges and other out-of-pocket expenses. For the fiscal year ended October 31, 2008, the transfer agent expense was reduced as follows: Tax-Managed - $1,062, U.S. Equity - $824, and Global Alternatives - $493.
The Investment Manager has agreed to waive a portion of its management fee in consideration of shareholder servicing fees that it has received from JPMorgan Distribution Services, Inc., with respect to short-term cash investments each Fund may have made in the JPMorgan Liquid Assets Portfolio- Capital Share Class. For the fiscal year ended October 31, 2008, the management fee was reduced as follows: Tax-Managed - $0, U.S. Equity -$0, Global Alternatives - $8,848.
Total returns and net investment income for the Funds would have been lower had certain expenses not been offset. Total expenses before offsets exclude the impact of expense reimbursements or fee waivers and expense reductions such as brokerage recapture credits but include non-reimbursable expenses, if any, such as interest and taxes.
| d. | Dividends and Distributions |
Dividends resulting from net investment income and distributions of capital gains, if any, normally will be declared and paid annually in December and when required for Federal excise tax purposes. Distributions are recorded on the ex-dividend date and are declared separately for each class. Income and capital gain distributions
28
Managers AMG FQ Funds
Notes to Financial Statements (continued)
are determined in accordance with Federal income tax regulations, which may differ from generally accepted accounting principles. These differences are primarily due to differing treatments for losses deferred due to wash sales, contributed securities, and possibly equalization accounting for tax purposes. Permanent book and tax basis differences, if any, relating to shareholder distributions will result in reclassifications to paid-in capital. The tax character of distributions paid during the past two years were as follows:
| | | | | | | | | | | | | | | | | | |
| | | Tax-Managed Equity | | U.S. Equity | | Global Alternatives |
| | | 2008 | | 2007 | | 2008 | | 2007 | | 2008 | | 2007 |
Distributions paid from: | | | | | | | | | | | | | | | | | | |
Ordinary income | | $ | 537,697 | | $ | 63,118 | | $ | 1,004,699 | | $ | 826,430 | | $ | 121,939 | | $ | 438,312 |
Short-term capital gains | | | — | | | — | | | 3,272,050 | | | 3,556,489 | | | — | | | — |
Long-term capital gains | | | — | | | — | | | 7,723,091 | | | 4,411,308 | | | 447,105 | | | — |
| | | | | | | | | | | | | | | | | | |
| | $ | 537,697 | | $ | 63,118 | | $ | 11,999,840 | | $ | 8,794,227 | | $ | 569,044 | | $ | 438,312 |
| | | | | | | | | | | | | | | | | | |
As of October 31, 2008, the components of distributable earnings (excluding unrealized appreciation/deprecation) on a tax basis consisted of:
| | | | | | | | | |
| | | Tax-Managed
Equity | | U.S. Equity | | Global
Alternatives |
Capital loss carryforward | | $ | 56,342,126 | | $ | 7,674,402 | | $ | 176,926 |
Undistributed ordinary income | | | 675,684 | | | 671,630 | | | 11,094,128 |
Undistributed short-term capital gains | | | — | | | — | | | — |
Undistributed long-term capital gains | | | — | | | — | | | — |
Each Fund intends to comply with the requirements under Subchapter M of the Internal Revenue Code of 1986, as amended, to distribute substantially all of their taxable income and gains to their shareholders and to meet certain diversification and income requirements with respect to investment companies. Therefore, no provision for Federal income or excise tax is included in the accompanying financial statements.
Additionally, based on each Fund’s understanding of the tax rules and rates related to income, gains and transactions for the foreign jurisdictions in which it invests, each Fund will provide for foreign taxes, and where appropriate, deferred foreign taxes.
Management has analyzed the Funds’ tax positions taken on federal income tax returns for all open tax years (tax years ended October 31, 2005-2008), and has concluded that no provision for federal income tax is required in the Funds’ financial statements.
| f. | Capital Loss Carryovers |
As of October 31, 2008, the following Funds had accumulated net realized capital loss carryovers from securities transactions for Federal income tax purposes as shown in the following chart. These amounts may be used to offset realized capital gains, if any, through the expiration dates listed.
| | | | | |
Fund | | Capital Loss
Carryover Amount | | Expires
October 31, |
Tax-Managed | | $ | 9,626,944 | | 2016 |
| | | 62,547 | | 2011 |
| | | 18,367,213 | | 2010 |
| | | 28,285,422 | | 2009 |
| | | | | |
Total | | $ | 56,342,126 | | |
| | | | | |
U.S. Equity | | | 7,674,402 | | 2016 |
Global Alternatives | | | 176,926 | | 2016 |
For the fiscal year ended October 31, 2008, Tax-Managed, U.S. Equity and Global Alternatives utilized no capital loss carryovers.
The Trust’s Declaration of Trust authorizes for each series the issuance of an unlimited number of shares of beneficial interest, without par value. Each Fund records sales and repurchases of its capital stock on the trade date. Dividends and distributions to shareholders are recorded on the ex-dividend date.
29
Managers AMG FQ Funds
Notes to Financial Statements (continued)
For the fiscal years ended October 31, 2008, and October 31, 2007, the capital stock transactions in the Funds by class were as follows:
| | | | | | | | | | | | | | | | | | | | | | | | | | | | |
| | | Tax-Managed | | | U.S. Equity | |
| | | 2008 | | | 2007 | | | 2008 | | | 2007 | |
| | | Shares | | | Amount | | | Shares | | | Amount | | | Shares | | | Amount | | | Shares | | | Amount | |
Class A Shares | | | | | | | | | | | | | | | | | | | | | | | | | | | | |
Sale of shares | | 1,083,470 | | | $ | 15,075,982 | | | 1,714,462 | | | $ | 27,420,567 | | | 1,566,421 | | | $ | 16,619,942 | | | 1,823,106 | | | $ | 27,198,907 | |
Reinvestment of dividends and distributions | | 1,904 | | | | 30,137 | | | — | | | | — | | | 174,679 | | | | 2,290,036 | | | 3,541 | | | | 48,285 | |
Shares repurchased | | (971,029 | ) | | | (12,672,266 | ) | | (334,458 | ) | | | (5,373,188 | ) | | (489,573 | ) | | | (5,432,086 | ) | | (440,449 | ) | | | (6,632,355 | ) |
| | | | | | | | | | | | | | | | | | | | | | | | | | | | |
Net increase | | 114,345 | | | $ | 2,433,853 | | | 1,380,004 | | | $ | 22,047,379 | | | 1,251,527 | | | $ | 13,477,892 | | | 1,386,198 | | | $ | 20,614,837 | |
| | | | | | | | | | | | | | | | | | | | | | | | | | | | |
Class C Shares | | | | | | | | | | | | | | | | | | | | | | | | | | | | |
Sale of shares | | 344,329 | | | $ | 4,887,814 | | | 527,386 | | | $ | 8,233,271 | | | 28,722 | | | $ | 347,005 | | | 162,315 | | | $ | 2,397,014 | |
Reinvestment of dividends and distributions | | — | | | | — | | | — | | | | — | | | 8,512 | | | | 110,908 | | | 81 | | | | 1,109 | |
Shares repurchased | | (236,813 | ) | | | (3,098,613 | ) | | (21,223 | ) | | | (329,547 | ) | | (53,602 | ) | | | (642,435 | ) | | (16,663 | ) | | | (252,257 | ) |
| | | | | | | | | | | | | | | | | | | | | | | | | | | | |
Net increase (decrease) | | 107,516 | | | $ | 1,789,201 | | | 506,163 | | | $ | 7,903,724 | | | (16,368 | ) | | | ($184,522 | ) | | 145,733 | | | $ | 2,145,866 | |
| | | | | | | | | | | | | | | | | | | | | | | | | | | | |
Institutional Class | | | | | | | | | | | | | | | | | | | | | | | | | | | | |
Sale of shares | | 1,090,055 | | | $ | 15,790,589 | | | 1,031,868 | | | $ | 16,181,652 | | | 186,603 | | | $ | 2,001,258 | | | 297,144 | | | $ | 4,366,333 | |
Reinvestment of dividends and distributions | | 26,734 | | | | 424,272 | | | 3,711 | | | | 58,882 | | | 698,621 | | | | 9,186,860 | | | 615,925 | | | | 8,512,083 | |
Shares repurchased | | (1,906,272 | ) | | | (25,691,248 | ) | | (1,309,725 | ) | | | (20,632,452 | ) | | (2,190,003 | ) | | | (24,141,018 | ) | | (799,630 | ) | | | (11,695,234 | ) |
| | | | | | | | | | | | | | | | | | | | | | | | | | | | |
Net increase (decrease) | | (789,483 | ) | | | ($9,476,387 | ) | | (274,146 | ) | | | ($4,391,918 | ) | | (1,304,779 | ) | | | ($12,952,900 | ) | | 113,439 | | | $ | 1,183,182 | |
| | | | | | | | | | | | | | | | | | | | | | | | | | | | |
| | | | | | | | | | | | | | |
| | | Global Alternatives | |
| | | 2008 | | | 2007 | |
| | | Shares | | | Amount | | | Shares | | | Amount | |
Class A Shares | | | | | | | | | | | | | | |
Sale of shares | | 6,997,102 | | | $ | 73,521,698 | | | 3,750,168 | | | $ | 38,528,654 | |
Reinvestment of dividends and distributions | | 30,757 | | | | 306,011 | | | 41,696 | | | | 411,541 | |
Shares repurchased | | (2,707,381 | ) | | | (27,611,339 | ) | | (2,121,805 | ) | | | (21,737,119 | ) |
| | | | | | | | | | | | | | |
Net increase | | 4,320,478 | | | $ | 46,216,370 | | | 1,670,059 | | | $ | 17,203,076 | |
| | | | | | | | | | | | | | |
Class C Shares | | | | | | | | | | | | | | |
Sale of shares | | 750,703 | | | $ | 7,647,337 | | | 758,946 | | | $ | 7,847,915 | |
Reinvestment of dividends and distributions | | 4,886 | | | | 48,079 | | | 1,458 | | | | 14,317 | |
Shares repurchased | | (393,638 | ) | | | (3,972,135 | ) | | (72,067 | ) | | | (725,952 | ) |
| | | | | | | | | | | | | | |
Net increase | | 361,951 | | | $ | 3,723,281 | | | 688,337 | | | $ | 7,136,280 | |
| | | | | | | | | | | | | | |
At October 31, 2008, certain unaffiliated shareholders of record, specifically omnibus accounts, individually or collectively held greater than 10% of the outstanding shares of the Funds as follows:
| | | | | | |
Fund | | Class A | | Class C | | Institutional Class |
Tax-Managed | | 3 collectively own 59% | | 2 collectively own 69% | | 2 collectively own 34% |
U.S. Equity | | None | | 1 owns 45% | | None |
Global Alternatives | | 1 owns 18% | | 3 collectively own 83% | | N/A |
30
Managers AMG FQ Funds
Notes to Financial Statements (continued)
| h. | Foreign Currency Translation |
The books and records of the Funds are maintained in U.S. dollars. The value of investments, assets and liabilities denominated in currencies other than U.S. dollars are translated into U.S. dollars based upon current foreign exchange rates. Purchases and sales of foreign investments, income and expenses are converted into U.S. dollars based on currency exchange rates prevailing on the respective dates of such transactions. Net realized and unrealized gain (loss) on foreign currency transactions represent: (1) foreign exchange gains and losses from the sale and holdings of foreign currencies; (2) gains and losses between trade date and settlement date on investment securities transactions and forward foreign currency exchange contracts; and (3) gains and losses from the difference between amounts of interest and dividends recorded and the amounts actually received.
The Funds do not isolate the net realized and unrealized gain or loss resulting from changes in exchange rates from the fluctuations in market prices of securities held. Such fluctuations are included with the net realized and unrealized gain or loss on investments.
| 2. | Agreements and Transactions with Affiliates |
The Trust has entered into an Investment Management Agreement under which Managers Investment Group LLC (the “Investment Manager”), an independently managed subsidiary of Affiliated Managers Group, Inc. (“AMG”), serves as investment manager to the Funds and is responsible for the Funds’ overall administration. The Funds are distributed by Managers Distributors, Inc., (“MDI” or the “Distributor”), a wholly-owned subsidiary of Managers Investment Group LLC. The Funds’ investment portfolios are managed by First Quadrant, L.P. (“First Quadrant” or the “Subadvisor”), which serves pursuant to a Subadvisory Agreement between the Investment Manager and First Quadrant with respect to each of the Funds. AMG indirectly owns a majority interest in First Quadrant. Certain Trustees and Officers of the Funds are Officers and/or Directors of the Investment Manager, AMG and/or MDI. MDI serves as the principal underwriter for each fund and is a registered broker-dealer and member of the Financial Industry Regulatory Authority, Inc. (“FINRA”). Shares of the Funds will be continuously offered and will be sold by brokers, dealers, or other financial intermediaries who have executed selling agreements with the Distributor. The Distributor bears all the expenses of providing services pursuant to an Underwriting Agreement, including payment of the expenses relating to the distribution of Prospectuses for sales purposes and advertising or sales literature.
Tax-Managed is obligated by the Investment Management Agreement to pay an annual management fee to the Investment Manager of 0.85% of the average daily net assets of the Fund. The Investment Manager, in turn, pays First Quadrant 0.85% of the average daily net assets of the Fund for its services as subadvisor. Under the Investment Management Agreement with the Fund, the Investment Manager provides a variety of administrative services to the Fund. The Investment Manager receives no additional compensation from the Fund for these services. Pursuant to a Reimbursement Agreement between the Investment Manager and First Quadrant, First Quadrant reimburses the Investment Manager for the costs the Investment Manager bears in providing such services to the Fund.
U.S. Equity and Global Alternatives are obligated by the Investment Management Agreement to pay an annual management fee to the Investment Manager of 0.35% and 1.70%, respectively, of the average daily net assets of the Fund. The Investment Manager, in turn, pays a portion of this fee to First Quadrant for its services as subadvisor. U.S. Equity and Global Alternatives have entered into an Administration and Shareholder Servicing Agreement under which the Investment Manager serves as the Funds’ administrator (the “Administrator”) and is responsible for all aspects of managing the Funds’ operations, including administration and shareholder services to each Fund, its shareholders, and certain institutions, such as bank trust departments, broker-dealers and registered investment advisers, that advise or act as an intermediary with the Funds’ shareholders. For its services, the Administrator is paid a fee at a rate of 0.25% of the average daily net assets of each Fund.
The Investment Manager has contractually agreed, through at least March 1, 2009, to waive fees and pay or reimburse expenses for Tax-Managed and Global Alternatives to the extent that the total annual operating expenses (exclusive of taxes, interest, brokerage costs, acquired fund expenses, and extraordinary expenses) will be limited to the following amounts of the Funds’ average daily net assets:
| | | | | | | | | |
Fund | | Class A | | | Class C | | | Institutional
Class | |
Tax-Managed | | 1.24 | % | | 1.99 | % | | 0.99 | % |
Global Alternatives | | 1.99 | % | | 2.74 | % | | N/A | |
At a meeting held on June 5-6, 2008, the Trust’s Board of Trustees approved a new contractual expense limitation with respect to Global Alternatives. Effective June 9, 2008, the Investment Manager has contractually agreed to limit net annual fund operating expenses (exclusive of taxes, interest, brokerage commissions, acquired fund fees and expenses, and extraordinary items) to 1.99% and 2.74% of average daily net assets of Class A and Class C shares, respectively. Prior to June 9, 2008, the Fund had a contractual expense limitation of 2.50% and 3.25% for Class A and Class C shares, respectively.
Tax-Managed and Global Alternatives are obligated to repay the Investment Manager such amounts waived, paid, or reimbursed in future years provided that the repayment occurs within thirty-six (36) months after the waiver or reimbursement occurs and that such repayment would not cause the Funds’ total operating expenses in any such future year to exceed that Fund’s respective expense cap. For the fiscal year ended October 31, 2008, Global Alternatives made repayments to the Investment Manager of $26,086. At October 31, 2008, the twelve-month and cumulative amounts of reimbursable expenses for the Funds were as follows:
| | | | | | |
Fund | | Fiscal year ended
October 31, 2008 | | Cumulative
Reimbursement
Amount |
Tax-Managed | | $ | 47,896 | | $ | 209,549 |
Global Alternatives | | | 98,043 | | | 195,290 |
31
Managers AMG FQ Funds
Notes to Financial Statements (continued)
The Investment Manager of U.S. Equity, has voluntarily agreed through March 1, 2009 to limit the total annual operating expenses (exclusive of taxes, interest, brokerage costs, acquired fund expenses, and extraordinary expenses) to 0.79% of the Fund’s average daily net assets allocable to the Institutional Class shares. This arrangement may be modified or terminated by the Investment Manager at any time. For the fiscal year ended October 31, 2008, the total operating expenses have exceeded the expense cap by $97,751.
Prior to July 1, 2007, the aggregate annual retainer paid to each Independent Trustee was $55,000, plus $4,000 or $2,000 for each regular or special meeting attended, respectively. Effective July 1, 2007, the aggregate annual retainer paid to each Independent Trustee is $65,000, plus $4,000 or $2,500 for each regular or special meeting attended, respectively. The Trustees’ fees and expenses are allocated amongst all of the Funds for which the Investment Manager serves as the advisor (the “Managers Funds”) based on the relative net assets of such Funds. The Independent Chairman of the Trusts receives an additional payment of $15,000 per year. (Prior to July 1, 2007, the Independent Chairman received an additional payment of $10,000 per year). The Chairman of the Audit Committee receives an additional payment of $5,000 per year. (Prior to July 1, 2007, the Chairman of the Audit Committee received an additional payment of $2,000 per year). The “Trustee fees and expenses” shown in the financial statements represents each Fund’s allocated portion of the total fees and expenses paid by the Managers Funds.
Effective March 1, 2006, Tax-Managed and U.S. Equity adopted a distribution and service plan (the “Plan”) and effective March 30, 2006, Global Alternatives adopted the Plan with respect to the Class A and Class C shares of each Fund, in accordance with the requirements of Rule 12b-1 under the 1940 Act and the requirements of the applicable rules of the FINRA regarding asset-based sales charges. Pursuant to the Plan, the Funds may compensate the Distributor for its expenditures in financing any activity primarily intended to result in the sale of each such class of the Fund’s shares and for maintenance and personal service provided to existing shareholders of that class. The Plan authorizes payments to the Distributor up to 0.25% and 1.00% annually of the Fund’s average daily net assets attributable to Class A and Class C shares, respectively. The Plan further provides for periodic payments by MDI to brokers, dealers and other financial intermediaries for providing shareholder services and for promotional and other sales related costs. The portion of payments by Class A or Class C shares of U.S. Equity, Tax-Managed and Global Alternatives for shareholder servicing may not exceed an annual rate of 0.25% of the average daily net asset value of the Fund’s shares of that class owned by clients of such broker, dealer or financial intermediary.
| 3. | Purchases and Sales of Securities |
Purchases and sales of securities, excluding short-term securities, for the fiscal year ended October 31, 2008, were as follows:
| | | | | | | | | | | | |
| | | Long-Term Securities | | U.S. Government Securities |
Fund | | Purchases | | Sales | | Purchases | | Sales |
Tax-Managed | | $ | 151,343,067 | | $ | 155,053,467 | | | N/A | | | N/A |
U.S. Equity | | | 190,890,551 | | | 200,708,728 | | | N/A | | | N/A |
Global Alternatives | | | 12,464,311 | | | 248,571 | | $ | 24,540,556 | | $ | 21,250,000 |
| 4. | Portfolio Securities Loaned |
The Funds may participate in a securities lending program offered by BNYM, providing for the lending of securities to qualified brokers. Securities lending fees include earnings of such temporary cash investments, plus or minus any rebate to a borrower. These earnings (after any rebate) are then divided between BNYM, as a fee for its services under the program, and the Fund, according to agreed-upon rates. Collateral on all securities loaned is accepted in cash and/or government securities and is maintained at a minimum level of 102% (105% in the case of certain foreign securities) of the market value, plus interest, if applicable, of investments on loan. Collateral received in the form of cash is invested temporarily in the BNYM Institutional Cash Reserves Fund (the “ICRF”), or other short-term investments as defined in the Securities Lending Agreement with BNYM.
In September and October of 2008, BNYM advised the Investment Manager that the ICRF had exposure to certain defaulted debt obligations, and that BNYM had established separate sleeves of the ICRF to hold these securities. The net impact of these positions is not material to each Fund. Each Fund’s position in the separate sleeves of the ICRF Fund is included in the Schedule of Investments and the unrealized loss on such investment is included in Net Unrealized Depreciation on the Statement of Assets and Liabilities and the Statement of Operations.
| 5. | Commitments and Contingencies |
In the normal course of business, the Funds may enter into contracts and agreements that contain a variety of representations and warranties, which provide general indemnifications. The maximum exposure to the Funds under these arrangements is unknown, as this would involve future claims that may be made against a Fund that have not yet occurred. However, based on experience, the Funds expect the risks of loss to be remote.
Certain transactions, such as futures and forward transactions, dollar roll agreements, or purchases of when-issued or delayed delivery securities may have a similar effect on a Fund’s net asset value as if the Fund had created a degree of leverage in its portfolio. However, if a Fund enters into such a transaction, the Fund will establish a segregated account with its custodian in which it will maintain cash, U.S. government securities or other liquid securities equal in value to its obligations in respect to such transaction. Securities and other assets held in the segregated account may not be sold while the transaction is outstanding, unless other suitable assets are substituted.
| 7. | Forward Foreign Currency Contracts |
Global Alternatives invests in forward foreign currency exchange contracts to manage currency exposure. These investments may involve greater market risk than the amounts disclosed in the Fund’s financial statements.
A forward foreign currency exchange contract is an agreement between a Fund and another party to buy or sell a currency at a set price at a future date. The market value of the contract will fluctuate with changes in currency exchange rates. The contract is marked-to-market daily, and the change in market value is recorded as an unrealized gain or loss. Gain or loss on the purchase or sale of contracts having the same settlement date, amount and counterparty is realized on the date of offset, otherwise gain or loss is realized on the settlement date.
32
Managers AMG FQ Funds
Notes to Financial Statements (continued)
The Fund may invest in non-U.S. dollar denominated instruments subject to limitations, and enter into forward foreign currency exchange contracts to facilitate transactions in foreign securities and to hedge against foreign currency exchange rate risk on its non-U.S. dollar denominated investment securities. Risks may arise upon entering into these contracts from the potential inability of counterparties to meet the terms of their contracts and from unanticipated movements in the value of a foreign currency relative to the U.S. dollar.
Cash pledged to cover margin requirements for open forward positions in Global Alternatives at October 31, 2008 was $1,000,000. Open forward foreign currency exchange contracts (in U.S. Dollars) at October 31, 2008 were as follows:
Global Alternatives - Foreign Currency
| | | | | | | | | | | | | | |
Type | | Position | | Settlement Date | | Receivable Amount | | | Payable Amount | | | Unrealized Gain/Loss | |
Australian Dollar | | Short | | 12/17/2008 | | ($24,011,195 | ) | | ($29,238,936 | ) | | $ | 5,227,741 | |
Canadian Dollar | | Short | | 12/17/2008 | | (7,262,776 | ) | | (7,940,361 | ) | | | 677,585 | |
Swiss Franc | | Short | | 12/17/2008 | | (18,370,312 | ) | | (19,172,258 | ) | | | 801,946 | |
euro | | Short | | 12/17/2008 | | (42,501,918 | ) | | (46,158,960 | ) | | | 3,657,042 | |
Pound Sterling | | Short | | 12/17/2008 | | (12,067,558 | ) | | (13,283,833 | ) | | | 1,216,275 | |
Japanese Yen | | Short | | 12/17/2008 | | (22,666,791 | ) | | (22,075,546 | ) | | | (591,245 | ) |
New Zealand Dollar | | Short | | 12/17/2008 | | (12,542,980 | ) | | (14,144,563 | ) | | | 1,601,583 | |
Swedish Krona | | Short | | 12/17/2008 | | (16,051,592 | ) | | (17,845,757 | ) | | | 1,794,165 | |
Australian Dollar | | Long | | 12/17/2008 | | 15,493,935 | | | 17,482,627 | | | | (1,988,692 | ) |
Canadian Dollar | | Long | | 12/17/2008 | | 12,265,861 | | | 13,257,509 | | | | (991,648 | ) |
Swiss Franc | | Long | | 12/17/2008 | | 22,375,193 | | | 23,095,442 | | | | (720,249 | ) |
euro | | Long | | 12/17/2008 | | 22,624,973 | | | 24,384,486 | | | | (1,759,513 | ) |
Pound Sterling | | Long | | 12/17/2008 | | 10,327,739 | | | 11,308,770 | | | | (981,031 | ) |
Japanese Yen | | Long | | 12/17/2008 | | 26,446,815 | | | 24,233,882 | | | | 2,212,933 | |
New Zealand Dollar | | Long | | 12/17/2008 | | 16,300,330 | | | 18,323,642 | | | | (2,023,312 | ) |
Swedish Krona | | Long | | 12/17/2008 | | 12,175,859 | | | 14,193,003 | | | | (2,017,144 | ) |
| | | | | | | | | | | | | | |
Total | | | | | | ($17,464,417 | ) | | ($23,580,853 | ) | | $ | 6,116,436 | |
| | | | | | | | | | | | | | |
| 8. | Futures Contracts Held or Issued for Purposes other than Trading |
U.S. Equity uses Equity Index futures contracts with the objective of maintaining exposure to equity stock markets while maintaining liquidity. Global Alternatives may use futures contracts, including futures contracts on global equity and fixed income securities, interest rate futures contracts, foreign currency futures contracts and futures contracts on security indices (including broad-based security indices), for any purpose. The Funds may purchase or sell futures contracts to achieve a desired level of investment, whether to accommodate portfolio turnover or cash flows from capital shares transactions. There are certain risks associated with futures contracts. Prices may not move as expected or a Fund may not be able to close out the contract when it desires to do so, resulting in losses.
On entering into a futures contract, either cash or securities in an amount equal to a certain percentage of the contract value (initial margin) must be deposited with the futures broker. Subsequent payments (variation margin) are made or received each day. The variation margin payments equal the daily changes in the contract value and are recorded as unrealized gains or losses. The Funds recognize a realized gain or loss when the contract is closed or expires equal to the difference between the value of the contract at the time it was opened and the value at the time it was closed. Futures are valued at their quoted daily settlement prices. The aggregate principal amounts of the contracts are not recorded in the financial statements. Fluctuations in the value of the contracts are recorded in the Statement of Assets and Liabilities as an asset (liability) and in the Statement of Operations as unrealized appreciation (depreciation) until the contracts are closed, when they are recorded as realized gains (losses) on futures or forward currency contracts.
33
Managers AMG FQ Funds
Notes to Financial Statements (continued)
Assets pledged to cover margin requirements for the open futures positions at October 31, 2008 amounted to $77,000 and $9,393,543 for U.S. Equity and Global Alternatives, respectively. Each Fund had the following open futures contracts as of October 31, 2008:
FQ U.S. Equity
| | | | | | | | | |
Type | | Number of
Contracts | | Position | | Expiration
Date | | Unrealized
Gain/(Loss) | |
S&P 500 Index | | 1 | | Long | | 12/18/2008 | | ($71,194 | ) |
FQ Global Alternatives
| | | | | | | | | | | |
Type | | Currency | | Number of
Contracts | | Position | | Expiration Date | | Unrealized
Gain/ (Loss) | |
Australian 10-Year Bond | | AUD | | 982 | | Short | | 12/15/2008 | | ($1,288,119 | ) |
Australian SPI 200 | | AUD | | 41 | | Long | | 12/18/2008 | | (38,589 | ) |
Canadian 10-Year Bond | | CAD | | 197 | | Short | | 12/18/2008 | | 238,488 | |
S&P/TSE 60 Index | | CAD | | 141 | | Short | | 12/18/2008 | | 1,315,308 | |
CAC40 10 Euro | | EUR | | 46 | | Short | | 11/21/2008 | | (98,048 | ) |
Amsterdam Index | | EUR | | 34 | | Long | | 11/21/2008 | | (69,116 | ) |
DAX Index | | EUR | | 39 | | Long | | 12/19/2008 | | 106,529 | |
IBEX 35 Index | | EUR | | 59 | | Short | | 11/21/2008 | | 747,793 | |
euro-Bund 10-Year | | EUR | | 92 | | Short | | 12/8/2008 | | (55,279 | ) |
S&P/MIB Index | | EUR | | 50 | | Long | | 12/19/2008 | | (916,441 | ) |
U.K. 10-Year Gilt | | GBP | | 208 | | Short | | 12/29/2008 | | 115,843 | |
FTSE 100 Index | | GBP | | 61 | | Long | | 12/19/2008 | | (478,109 | ) |
Hang Seng Index | | HKD | | 25 | | Short | | 11/27/2008 | | (334,972 | ) |
Japanese 10-Year Bond | | JPY | | 48 | | Long | | 12/11/2008 | | 141,022 | |
TOPIX Index | | JPY | | 44 | | Short | | 12/11/2008 | | 125,164 | |
S&P 500 Index | | USD | | 29 | | Short | | 12/18/2008 | | (288,871 | ) |
U.S. Treasury 20-Year Bond | | USD | | 410 | | Long | | 12/19/2008 | | (1,669,242 | ) |
Total | | | | | | | | | | ($2,446,639 | ) |
Investments Definitions and Abbreviations:
Abbreviations have been used throughout this table to indicate the underlying currencies:
AUD: Australian Dollar
CAD: Canadian Dollar
EUR: euro
GBP: British Pound
HKD: Hong Kong Dollar
JPY: Japanese Yen
USD: U.S. Dollar
Tax Information (unaudited)
Each Fund hereby designates the maximum amount allowable of its net taxable income as qualified dividends as provided in the Jobs and Growth Tax Relief Reconciliation Act of 2003. The 2008 Form 1099-DIV you receive for the Fund will show the tax status of all distributions paid to you during the year.
Pursuant to section 852 of the Internal Revenue Code, Tax-Managed, U.S. Equity and Global Alternatives hereby designate as a capital gain distribution with respect to the taxable year ended October 31, 2008, $0, $0 and $0, respectively or, if subsequently determined to be different, the net capital gains of such year.
34
Report of Independent Registered Public Accounting Firm
To the Board of Trustees of Managers Trust I and the Shareholders of Managers AMG FQ Tax-Managed U.S. Equity Fund, Managers AMG FQ U.S. Equity Fund and Managers AMG FQ Global Alternatives Fund:
In our opinion, the accompanying statements of assets and liabilities for Managers AMG FQ Tax-Managed U.S. Equity Fund and Managers AMG FQ U.S. Equity Fund, including the schedules of portfolio investments, the statement of net assets for Managers AMG FQ Global Alternatives Fund, and the related statements of operations and of changes in net assets and the financial highlights present fairly, in all material respects, the financial position of Managers AMG FQ Tax-Managed U.S. Equity Fund, Managers AMG FQ U.S. Equity Fund and Managers AMG FQ Global Alternatives Fund (three of the series constituting Managers Trust I, hereafter referred to as the “Funds”) at October 31, 2008, the results of each of their operations for the year then ended, the changes in each of their net assets for each of two years in the period then ended and the financial highlights for each of the periods indicated, in conformity with accounting principles generally accepted in the United States of America. These financial statements and financial highlights (hereafter referred to as “financial statements”) are the responsibility of the Funds’ management; our responsibility is to express an opinion on these financial statements based on our audits. We conducted our audits of these financial statements in accordance with the standards of the Public Company Accounting Oversight Board (United States). Those standards require that we plan and perform the audit to obtain reasonable assurance about whether the financial statements are free of material misstatement. An audit includes examining, on a test basis, evidence supporting the amounts and disclosures in the financial statements, assessing the accounting principles used and significant estimates made by management, and evaluating the overall financial statement presentation. We believe that our audits, which included confirmation of securities at October 31, 2008 by correspondence with the custodian and brokers, provide a reasonable basis for our opinion.
PricewaterhouseCoopers LLP
Philadelphia, Pennsylvania
December 23, 2008
35
Trustees and Officers
The Trustees and Officers of the Trust, their business addresses, principal occupations for the past five years and dates of birth are listed below. The Trustees provide broad supervision over the affairs of the Trust and the Funds. The Trustees are experienced executives who meet periodically throughout the year to oversee the Funds’ activities, review contractual arrangements with companies that provide services to the Funds, and review the Funds’ performance. Unless otherwise noted, the address of each Trustee or Officer is the address of the Trust: 800 Connecticut Avenue, Norwalk, Connecticut 06854.
There is no stated term of office for Trustees. Trustees serve until their resignation, retirement or removal in accordance with the Trust’s organizational documents and policies adopted by the Board from time to time. The Chairman of the Trustees, President, Treasurer and Secretary of the Trust are elected by the Trustees annually. Other officers hold office at the pleasure of the Trustees.
Independent Trustees
The following Trustees are not “interested persons” of the Trust within the meaning of the 1940 Act:
| | |
Name, Date of Birth, Number of Funds
Overseen in Fund Complex* | | Principal Occupation(s) During Past 5 Years and Other Directorships Held by Trustee |
Jack W. Aber, 9/9/37 • Trustee since 2000 • Oversees 32 Funds in Fund Complex | | Professor of Finance, Boston University School of Management (1972-Present); Trustee of Appleton Growth Fund (1 portfolio); Trustee of Third Avenue Trust (4 portfolios); Trustee of Third Avenue Variable Trust (1 portfolio). |
| |
William E. Chapman, II, 9/23/41 • Independent Chairman • Trustee since 2000 • Oversees 32 Funds in Fund Complex | | President and Owner, Longboat Retirement Planning Solutions (1998-Present); Hewitt Associates, LLC (part time) (provider of Retirement and Investment Education Seminars); Trustee of Bowdoin College (2002-Present); Trustee of Third Avenue Trust (4 portfolios); Trustee of Third Avenue Variable Trust (1 portfolio). |
| |
Edward J. Kaier, 9/23/45 • Trustee since 2000 • Oversees 32 Funds in Fund Complex | | Attorney at Law and Partner, Teeters Harvey Gilboy & Kaier LLP (2007-Present); Attorney at Law and Partner, Hepburn Willcox Hamilton & Putnam, LLP (1977-2007); Trustee of Third Avenue Trust (4 portfolios); Trustee of Third Avenue Variable Trust (1 portfolio). |
| |
Steven J. Paggioli, 4/3/50 • Trustee since 2000 • Oversees 32 Funds in Fund Complex | | Consultant (2001-Present); Formerly Executive Vice President and Director, The Wadsworth Group (1986- 2001); Executive Vice President, Secretary and Director, Investment Company Administration, LLC (1990-2001); Vice President, Secretary and Director, First Fund Distributors, Inc. (1991-2001); Trustee, Professionally Managed Portfolios (22 portfolios); Advisory Board Member, Sustainable Growth Advisors, LP. Independent Director, Chase Investment Counsel (2008 – Present). |
| |
Eric Rakowski, 6/5/58 • Trustee since 2000 • Oversees 32 Funds in Fund Complex | | Professor, University of California at Berkeley School of Law (1990-Present); Trustee of Third Avenue Trust (4 portfolios); Trustee of Third Avenue Variable Trust (1 portfolio). |
| |
Thomas R. Schneeweis, 5/10/47 • Trustee since 2000 • Oversees 32 Funds in Fund Complex | | Professor of Finance, University of Massachusetts (1977-Present); Director, CISDM at the University of Massachusetts, (1996-Present); President, Alternative Investment Analytics, LLC, (formerly Schneeweis Partners, LLC) (2001-Present); Partner, White Bear Partners, LLC (2007-Present); Partner, Schneeweis Capital Management, LLC (2007-Present); Partner, Schneeweis Associates, LLC (2007-Present); Partner, Northampton Capital Management, LLC (2004-Present); Partner, TRS Associates (2007-Present). |
| * | The Fund Complex consists of Managers AMG Funds, The Managers Funds, Managers Trust I and Managers Trust II. |
Interested Trustees
The following Trustees are “interested persons” of the Trust within the meaning of the 1940 Act. Mr. Dalton is an interested person by virtue of his positions with, and interest in securities of, Affiliated Managers Group, Inc. Mr. Streur is an interested person by virtue of his positions with Managers Investment Group LLC.
| | |
Name, Date of Birth, Number of Funds
Overseen in Fund Complex* | | Principal Occupation(s) During Past 5 Years and Other Directorships Held by Trustee |
Nathaniel Dalton, 9/29/66 • Trustee since 2008 • Oversees 32 Funds in Fund Complex | | Executive Vice President and Chief Operating Officer, Affiliated Managers Group, Inc., (2006-Present); Executive Vice President, Affiliated Managers Group, Inc., ( 2002 -2006); Executive Vice President and General Counsel, Affiliated Managers Group, Inc. (2001-2002); Senior Vice President and General Counsel, Affiliated Managers Group, Inc. (1996-2001). Director, Managers Distributors, Inc. (2000-Present). |
| |
John H. Streur, 2/6/60 • Trustee since 2008 • President since 2008 • Oversees 32 Funds in Fund Complex | | Senior Managing Partner, Managers Investment Group LLC (2006-Present); President, Managers Distributors, Inc. (2006 to President); Managing Partner, Managers Investment Group LLC (2005-2006); Chief Executive Officer, President and Chief Operating Officer, The Burridge Group LLC (1996-2004). |
Officers
| | |
Name, Date of Birth, Position(s) Held with
Fund and Length of Time Served | | Principal Occupation(s) During Past 5 Years |
Christine C. Carsman, 4/2/52 • Secretary since 2004 | | Senior Vice President and Chief Regulatory Counsel, Affiliated Managers Group, Inc. (2004-Present); Secretary, The Managers Funds, Managers AMG Funds and Managers Trust II (2004-Present); Senior Counsel, Vice President and Director of Operational Risk Management and Compliance, Wellington Management Company, LLP (1995-2004); Deputy General Counsel, The Boston Company, Inc. (1993-1995); Associate General Counsel, The Boston Company Advisors, Inc. (1991-1993); Associate, Sullivan & Worcester LLP (1987-1991). |
| |
Donald S. Rumery, 5/29/58 • Chief Financial Officer since 2007 • Treasurer since 2000 | | Senior Vice President, Managers Investment Group LLC (2005-Present); Director, Finance and Planning, The Managers Funds LLC, (1994-2004); Treasurer and Chief Financial Officer, Managers Distributors, Inc. (2000-Present); Treasurer, The Managers Funds (1995-Present); Treasurer, Managers AMG Funds (1999-Present); Treasurer, Managers Trust II (2000-Present); Secretary, Managers Trust I and Managers Trust II (2000-2004) and Secretary, The Managers Funds (1997-2004); Chief Financial Officer, The Managers Funds, Managers AMG Funds and Managers Trust II (2007-Present). |
| |
Keitha L. Kinne, 5/16/58 • Chief Operating Officer since 2007 | | Managing Partner and Chief Operating Officer, Managers Investment Group LLC (2007-Present); Chief Operating Officer, The Managers Funds, Managers AMG Funds and Managers Trust II (2007-Present); Managing Director, Legg Mason & Co., LLC (2006-2007); Managing Director, Citigroup Asset Management (2004-2006); Senior Vice President, Prudential Investments (1999-2004). |
36
Annual Renewal of Investment Advisory Agreements
On June 6, 2008, the Board of Trustees, including a majority of the Trustees who are not “interested persons” of the Trust (the “Independent Trustees”), approved the Investment Management Agreement with the Investment Manager for each of the Managers AMG FQ U.S. Equity Fund, Managers AMG FQ Tax-Managed U.S. Equity Fund and Managers AMG FQ Global Alternatives Fund (each a “Fund”) and the Subadvisory Agreement with respect to each Fund. The Independent Trustees were separately represented by independent counsel in connection with their consideration of the approval of these agreements. In considering the Investment Management and Subadvisory Agreements, the Trustees reviewed a variety of materials relating to each Fund, the Investment Manager and the Subadvisor, including comparative performance, fee and expense information for an appropriate peer group of similar mutual funds for each Fund (each a “Peer Group”), performance information for the relevant benchmark index for each Fund (each a “Fund Benchmark”) and other information regarding the nature, extent and quality of services provided by the Investment Manager and the Subadvisor under their respective agreements. The Trustees also took into account information on the services provided by the Investment Manager and the Subadvisor (including information provided at meetings held on May 15-16 and June 5-6, 2008), as well as performance, fee and expense information regarding the Funds provided to them on a quarterly basis throughout the year. Prior to voting, the Independent Trustees: (a) reviewed the foregoing information with their independent legal counsel and with management; (b) received materials from their independent legal counsel discussing the legal standards applicable to their consideration of the Investment Management and Subadvisory Agreements; and (c) met with their independent legal counsel in private sessions at which no representatives of management were present.
Nature, extent and quality of services
In considering the nature, extent and quality of the services provided by the Investment Manager, the Trustees reviewed information relating to the Investment Manager’s operations and personnel. Among other things, the Investment Manager provided financial information, biographical information on its supervisory and professional staff and descriptions of its organizational and management structure. The Trustees also took into account information provided periodically throughout the previous year by the Investment Manager relating to the performance of its duties with respect to the Funds and the Trustees’ familiarity with the Investment Manager’s management through Board meetings, discussions and reports. In the course of their deliberations regarding the Investment Management Agreement, the Trustees evaluated, among other things: (a) the extent and quality of the Investment Manager’s oversight of the operation and management of the Funds; (b) the quality of the Investment Manager’s oversight of the performance by the Subadvisor of its portfolio management duties; (c) the Investment Manager’s ability to supervise the Funds’ other service providers; and (d) the Investment Manager’s compliance programs. The Trustees also took into account the financial condition of the Investment Manager with respect to its ability to provide the services required under the Investment Management Agreement and the Investment Manager’s undertaking to maintain contractual expense limitations for the Funds.
The Trustees also reviewed information relating to the Subadvisor’s financial condition, operations and personnel and the investment philosophy, strategies and techniques (its “Investment Strategy”) used in managing each Fund. Among other things, the Trustees reviewed biographical information on portfolio management and other professional staff, information regarding the Subadvisor’s organizational and management structure and the Subadvisor’s brokerage policies and practices. The Trustees considered specific information provided regarding the experience of the individuals at the Subadvisor with portfolio management responsibility for the Funds, including the information set forth in each Fund’s prospectus and statement of additional information. In the course of their deliberations, the Trustees evaluated, among other things: (a) the services rendered by the Subadvisor in the past; (b) the qualifications and experience of the Subadvisor’s personnel; and (c) the Subadvisor’s compliance programs. The Trustees also took into account the financial condition of the Subadvisor with respect to its ability to provide the services required under each Subadvisory Agreement.
Performance.
With respect to the Managers AMG FQ U.S. Equity Fund, among other information related to the Fund’s performance, the Trustees noted that the Fund’s performance for the 1-year, 3-year, 5-year and 10-year periods ended March 31, 2008 was below, above, above and below, respectively, the median performance of its Peer Group and below, above, above and below, respectively, the performance of the Fund Benchmark, the Russell 3000 Index. The Trustees took into account management’s discussion of the Fund’s performance. They also noted that the Fund’s current Subadvisor was engaged in 2004. The Trustees concluded that the Fund’s performance has been satisfactory.
With respect to the Managers AMG FQ Tax-Managed U.S. Equity Fund, among other information related to the Fund’s performance, the Trustees noted that the Fund’s performance for the 1-year, 3-year and 5-year periods ended March 31, 2008 and for the period from the Fund’s inception on December 18, 2000 through March 31, 2008 was below, above, above and above, respectively, the median performance of its Peer Group and below, above, above and above, respectively, the performance of the Fund Benchmark, the Russell 3000 Index. The Trustees also took into account management’s discussion of the Fund’s performance. The Trustees concluded that the Fund’s performance has been satisfactory.
With respect to the Managers AMG FQ Global Alternatives Fund, among other information related to the Fund’s performance, the Trustees noted that the Fund’s performance for the 1-year period ended March 31, 2008 and for the period from the Fund’s inception on March 30, 2006 through March 31, 2008 was above the median performance of its Peer Group and below the performance of the Fund Benchmark, the Citigroup 1-Month T-Bill Index, for each period. The Trustees concluded that the Fund’s performance was satisfactory in light of its limited performance record.
As noted above, the Board considered each Fund’s performance during relevant time periods as compared to the Fund’s Peer Group and noted that the Board reviews on a quarterly basis detailed information about each Fund’s performance results and portfolio composition as well as the Subadvisor’s Investment Strategy. The Board noted the Investment Manager’s expertise and resources in monitoring the performance, investment style and risk-adjusted performance of the Subadvisor. The Board was mindful of the Investment Manager’s attention to monitoring the Subadvisor’s performance with respect to the Funds and its discussions with management regarding the factors that contributed to the performance of the Funds.
37
Annual Renewal of Investment Advisory Agreements (continued)
Advisory and Subadvisory Fees and Profitability.
In considering the reasonableness of the advisory fee payable to the Investment Manager and the subadvisory fee payable by the Investment Manager to the Subadvisor, the Trustees reviewed information provided by the Investment Manager setting forth all revenues and other benefits, both direct and indirect, received by the Investment Manager and its affiliates attributable to managing each Fund and all the mutual funds in the Managers Family of Funds, the cost of providing such services and the resulting profitability to the Investment Manager and its affiliates from these relationships. The Trustees noted that the Investment Manager and the Subadvisor are affiliated and that, in the case of the Managers AMG FQ Tax-Managed U.S. Equity Fund and the Managers AMG FQ U.S. Equity Fund, the Investment Manager pays the Subadvisor a subadvisory fee that is equal to the advisory fee that it receives from the Fund. The Trustees also noted the current asset levels of the Funds and the impact on profitability of any future growth of assets of the Funds.
In considering the cost of services to be provided by the Investment Manager under the Investment Management Agreement and the profitability to the Investment Manager of its relationship with the Funds, the Trustees noted the current asset level of the Funds and the undertaking by the Investment Manager to maintain contractual expense limitations for the Managers AMG FQ Tax-Managed U.S. Equity Fund and the Managers AMG FQ Global Alternatives Fund and a voluntary expense limitation for the AMG FQ U.S. Equity Fund. The Board also took into account management’s discussion of the current advisory fee structure. Based on the foregoing, the Trustees concluded that the profitability to the Investment Manager is reasonable and that the Investment Manager is not realizing material benefits from economies of scale that would warrant adjustments to the advisory fee at this time. Also with respect to economies of scale, the Trustees noted that as a Fund’s assets increase over time, the Fund may realize other economies of scale to the extent the increase in assets is proportionally greater than the increase in certain other expenses.
In considering the reasonableness of the subadvisory fees payable by the Investment Manager to the Subadvisor, the Trustees reviewed information provided by the Subadvisor regarding the cost of providing subadvisory services to each of the Funds and the resulting profitability to the Subadvisor from these relationships. In considering the cost of services to be provided by the Subadvisor under the Subadvisory Agreements and the profitability to the Subadvisor of its relationship with the Funds, the Trustees noted the current asset level of each Fund and the undertaking by the Investment Manager to maintain a contractual expense limitation for the Managers AMG FQ Tax-Managed U.S. Equity Fund and the Managers AMG FQ Global Alternatives Fund and a voluntary expense limitation for the Managers AMG FQ U.S. Equity Fund. As a consequence, the cost of services to be provided by the Subadvisor and the profitability to the Subadvisor of its relationship with each Fund were not material factors in the Trustees’ deliberations. For similar reasons, the Trustees did not consider potential economies of scale in the management of the Funds by the Subadvisor to be a material factor in their considerations at this time.
With respect to the Managers AMG FQ U.S. Equity Fund, the Trustees noted that the Fund’s advisory fee and total expenses (net of applicable expense waivers/reimbursements) as of March 31, 2008 were both lower than the average for the Fund’s Peer Group. The Trustees took into account the fact that the Investment Manager has voluntarily agreed to limit the Fund’s net annual operating expenses to 1.04%, 1.79% and 0.79% for Class A shares, Class C shares and Institutional Class shares, respectively, and also noted that such arrangement may be modified or terminated by the Investment Manager at any time. The Trustees concluded that, in light of the nature, extent and quality of the services provided by the Investment Manager and the Subadvisor, the Fund’s performance, and the considerations noted above with respect to the Subadvisor and the Investment Manager, the Fund’s advisory fees are reasonable.
With respect to the Managers AMG FQ Tax-Managed U.S. Equity Fund, the Trustees noted that the Fund’s advisory fee and total expenses (net of applicable expense waivers/reimbursements) as of March 31, 2008 were both higher than the average for the Fund’s Peer Group. The Trustees took into account the fact that the Investment Manager has contractually agreed, through March 1, 2009, to limit the Fund’s net annual operating expenses to 1.24%, 1.99% and 0.99% for Class A shares, Class C shares and Institutional Class shares, respectively. The Trustees concluded that, in light of the nature, extent and quality of the services provided by the Investment Manager and the Subadvisor, the Fund’s performance, the foregoing expense limitation and the considerations noted above with respect to the Subadvisor and the Investment Manager, the Fund’s advisory fees are reasonable.
With respect to the Managers AMG FQ Global Alternatives Fund, the Trustees noted that the Fund’s advisory fee and total expenses (net of applicable expense waivers/reimbursements) as of March 31, 2008 were both higher than the average for the Fund’s Peer Group. In this regard, the Trustees noted that because of the Investment Strategy of the Fund, the Peer Group contains a small group of funds, some of which pursue an investment strategy considerably different from that of the Fund. The Trustees took into account the fact that the Investment Manager has contractually agreed, through at least March 1, 2009, to limit the Fund’s net annual operating expenses to 1.99% for Class A shares and 2.74% for Class C shares. The Trustees concluded that, in light of the nature, extent and quality of the services to be provided by the Investment Manager and the Subadvisor, the foregoing expense limitations and the considerations noted above with respect to the Subadvisor and the Investment Manager, the Fund’s advisory fees are reasonable.
* * * *
After consideration of the foregoing, the Trustees also reached the following conclusions regarding the Investment Management and Subadvisory Agreements in addition to the conclusions discussed above: (a) the Investment Manager has demonstrated that it possesses the resources and capability to perform its duties under the Investment Management Agreement; (b) the Subadvisor has the resources to perform its duties under the Subadvisory Agreements and is qualified to manage each Fund’s assets in accordance with its investment objectives and policies; and (c) the Investment Manager and Subadvisor maintain appropriate compliance programs.
Based on all of the above-mentioned factors and their related conclusions, with no single factor or conclusion being determinative and with each Trustee not necessarily attributing the same weight to each factor, the Trustees concluded that approval of the Investment Management Agreement and each Subadvisory Agreement (as applicable) would be in the best interests of each Fund and its shareholders. Accordingly, on June 6, 2008, the Trustees, including a majority of the Independent Trustees, voted to approve the Investment Management and Subadvisory Agreements for each Fund.
38
THIS PAGE INTENTIONALLY LEFT BLANK
Investment Manager and Administrator
Managers Investment Group LLC
800 Connecticut Avenue
Norwalk, Connecticut 06854
(203) 299-3500 or (800) 835-3879
Distributor
Managers Distributors, Inc.
800 Connecticut Avenue
Norwalk, Connecticut 06854
(203) 299-3500 or (800) 835-3879
Subadvisor
First Quadrant, L.P.
800 E. Colorado Boulevard, Suite 900
Pasadena, CA 91101
Custodian
The Bank of New York Mellon
2 Hanson Place
Brooklyn, New York 11217
Legal Counsel
Ropes & Gray LLP
One International Place
Boston, Massachusetts 02110-2624
Transfer Agent
PNC Global Investment Servicing (U.S.) Inc.
Attn: Managers
P.O. Box 9769
Providence, Rhode Island 02940
(800) 548-4539
For Managers Choice Only
Managers
c/o PNC Global Investment Servicing (U.S.) Inc.
P.O. Box 61204
King of Prussia, Pennslyvania 19406-0851
(800) 358-7668

MANAGERS AND MANAGERS AMG FUNDS
EQUITY FUNDS
EMERGING MARKETS EQUITY
Rexiter Capital Management Limited
ESSEX GROWTH
ESSEX LARGE CAP GROWTH
ESSEX SMALL/MICRO CAP GROWTH
Essex Investment Management Co., LLC
FQ TAX-MANAGED U.S. EQUITY
FQ U.S. EQUITY
First Quadrant, L.P.
GW&K MULTI-CAP EQUITY
Gannet Welsh & Kotler, LLC
INSTITUTIONAL MICRO-CAP
MICRO-CAP
Lord, Abbett & Co. LLC
WEDGE Capital Management L.L.P.
OFI Institutional Asset Management, Inc.
Next Century Growth Investors LLC
INTERNATIONAL EQUITY
AllianceBernstein L.P.
Lazard Asset Management, LLC
Wellington Management Company, LLP
CHICAGO EQUITY PARTNERS MID-CAP
Chicago Equity Partners, LLC
REAL ESTATE SECURITIES
Urdang Securities Management, Inc.
SKYLINE SPECIAL EQUITIES PORTFOLIO
Skyline Asset Management, L.P.
SMALL CAP
TIMESSQUARE MID CAP GROWTH
TIMESSQUARE SMALL CAP GROWTH
TimesSquare Capital Management, LLC
SPECIAL EQUITY
Ranger Investment Management, L.P.
Lord, Abbett & Co. LLC
Skyline Asset Management, L.P.
Smith Asset Management Group, L.P.
Federated MDTA LLC
Westport Asset Management, Inc.
SYSTEMATIC VALUE
SYSTEMATIC MID CAP VALUE
Systematic Financial Management, L.P.
BALANCED FUNDS
CHICAGO EQUITY PARTNERS BALANCED
Chicago Equity Partners, LLC
GLOBAL
AllianceBernstein L.P.
First Quadrant, L.P.
Wellington Management Company, LLP
ALTERNATIVE FUNDS
FQ GLOBAL ALTERNATIVES
First Quadrant, L.P.
INCOME FUNDS
BOND (MANAGERS)
FIXED INCOME
GLOBAL BOND
Loomis, Sayles & Co., L.P.
BOND (MANAGERS FREMONT)
Pacific Investment Management Co. LLC
CALIFORNIA INTERMEDIATE TAX-FREE
Miller Tabak Asset Management LLC
GW&K MUNICIPAL ENHANCED YIELD
Gannet Welsh & Kotler, LLC
HIGH YIELD
J.P. Morgan Investment Management LLC
INTERMEDIATE DURATION GOVERNMENT
SHORT DURATION GOVERNMENT
Smith Breeden Associates, Inc.
MONEY MARKET
JPMorgan Investment Advisors Inc.
This report is prepared for the Funds’ shareholders. It is authorized for distribution to prospective investors only when preceded or accompanied by an effective prospectus. To receive a free copy of the prospectus or Statement of Additional Information, which includes additional information about Fund Trustees, please contact us by calling 800.835.3879. Distributed by Managers Distributors, Inc., member FINRA.
A description of the policies and procedures each Fund uses to vote its proxies is available: (i) without charge, upon request, by calling 800.835.3879, or (ii) on the Securities and Exchange Commission’s (SEC) Web site at www.sec.gov. For information regarding each Fund’s proxy voting record for the 12-month period ended June 30, call 800.835.3879 or visit the SEC Web site at www.sec.gov.
The Funds file their complete schedule of portfolio holdings with the SEC for the first and third quarters of each fiscal year on Form N-Q. The Funds’ Forms N-Q are available on the SEC’s website at www.sec.gov. A Fund’s Forms N-Q may be reviewed and copied at the SEC’s Public Reference Room in Washington, DC. Information on the operation of the Public Reference Room may be obtained by calling 800.SEC.0330. To review a complete list of the Funds’ portfolio holdings, or to view the most recent quarterly holdings report, semiannual report, or annual report, please visit www.managersinvest.com.
www.managersinvest.com


ANNUAL REPORT
Managers Funds
October 31, 2008
Managers Fremont Bond Fund

AR021-1008
Managers Fremont Bond Fund
Annual Report — October 31, 2008
Nothing contained herein is to be considered an offer, sale or solicitation of an offer to buy shares of The Managers Funds or Managers AMG Funds. Such offering is made only by Prospectus, which includes details as to offering price and other material information.
Letter to Shareholders
Dear Shareholder:
As has been well documented, the financial markets were under significant pressure during a majority of the one-year period ending October 31, 2008. The year began with investors focused on the U.S. housing crisis and eventually shifted toward concerns about a broader credit crisis both in the U.S. and abroad. Despite these fears and a difficult beginning to the year, bonds generally rose in the early parts of 2008 as interest rates fell. The economy, however, began to weaken further towards the end of the second quarter as investors’ concerns over surging commodity prices, continuing fallout from the credit crisis, slowing economic growth, and declining corporate profits took center stage.
Volatility remained high during July and August as major headlines in the news included reports of falling energy and commodity prices along with higher-than-expected economic growth. This was countered by further contraction in housing, weakness in the labor markets, tighter credit conditions and uncertainty about the stability of Fannie Mae and Freddie Mac. The months of July and August proved to be the calm before the storm, as the number of events significantly affecting the markets in September greatly outnumbered any other period in recent memory. September included the U.S. Treasury’s bailout of mortgage agencies Fannie Mae and Freddie Mac as well as insurer AIG. In addition, market turmoil even extended to money markets where interbank lending rates soared to record highs as banks hoarded cash. In October, Congress approved a $700 billion “bailout” called the Troubled Asset Relief Program (TARP) with the goal of opening up credit markets by buying distressed assets.
For the period, bonds generated mixed returns with the Barclays Capital U.S. Aggregate Index® returning 0.30%. U.S. Treasuries were, however, solid performers amid the flight to quality returning 7.76%. U.S. Investment Grade Corporate bonds, on the other hand, were pummeled in the limited liquidity environment and returned -13.82%.
Against this backdrop, for the one-year period ended October 31, 2008, the Managers Fremont Bond Fund returned -0.60%, compared with a return of 0.30% for the Barclays Capital U.S. Aggregate Index®, the Fund’s primary benchmark. Despite trailing the benchmark for the period, the Fund has still performed quite well over longer time periods relative to its benchmark and peer universe.
Against this backdrop, the Managers Fremont Bond Fund provided the following returns:
| | | | | | | | | | | | | | | | | |
Periods Ended 10/31/08 | | 6 Months | | | 1 Year | | | 3 Years | | | 5 Years | | | 10 Years | | | Inception Date |
Managers Fremont Bond Fund | | (6.16 | )% | | (0.60 | )% | | 3.33 | % | | 3.68 | % | | 5.34 | % | | 4/30/1993 |
Barclays Capital U.S. Aggregate Bond Index® | | (3.63 | )% | | 0.30 | % | | 3.60 | % | | 3.48 | % | | 5.00 | % | | 4/30/1993 |
A detailed review of Fund positioning is included within this report.
The Fund’s negative absolute and relative returns are primarily attributable to an overweight to bonds of financial companies, including Lehman Brothers and AIG, as contagion from subprime-related deleveraging swept through this sector despite unprecedented government support. The Fund’s exposure to corporate issues, in general, was detrimental to performance as spreads reached historic highs towards the end of this period with massive global deleveraging depressing valuations of these assets. Earlier in the year, an overweight to high-quality mortgages was detrimental to performance as these securities lost value versus like-duration Treasuries as liquidity contracted. The Fund’s modest exposure to emerging market currencies detracted from performance, particularly in August, as the U.S. dollar rallied. Meanwhile, the Fund’s focus on shorter maturities within the U.S. and U.K. added to performance at both the start and end of this period when the yield curves steepened for these economies.
Looking ahead, we anticipate the Fund will continue to employ defensive strategies with a focus on high quality assets as the global deleveraging cycle moves forward. The Fund will likely continue to emphasize the short end of yield curves in the U.S., Europe, and the U.K., in an effort to benefit from potential additional central bank easing and a continued flight to high quality, short maturity assets. Despite recent price declines, the Fund will also likely continue to hold positions in bonds of financial companies with a focus on those companies
1
Letter to Shareholders (continued)
deemed to be under the Fed’s “umbrella” and that should benefit over the longer term from recapitalization, deleveraging, and greater balance sheet transparency. During this time, the Fund will continue to focus on effective cash management along with the ongoing understanding of the Fund’s collateral and counterparty risk as the credit crisis persists.
One of our foremost goals at Managers Investment Group is to structure and manage mutual funds that will help our shareholders and clients become more successful in reaching their investment goals and objectives. Each of our Funds is geared to provide you with exposure to a specific asset class, combination of asset classes, or segment of the market. Investors tend to use our Funds as part of their overall asset allocation in order to structure a well-diversified portfolio intended to meet individual needs. Most of our Funds, like the Managers Fremont Bond Fund, are therefore designed to be building blocks.
The following report covers the one year period ended October 31, 2008. Should you have any questions about this report, or if you’d like to receive a prospectus and additional information, including fees and expenses for these or any of the other Funds in our family, please feel free to contact us at 1-800-835-3879, or visit our Web site at www.managersinvest.com. As always, please read the prospectus carefully before you invest or send money.
If you are curious about how you can better diversify your investment program, visit the Knowledge Center on our Web site and view our articles in the investment strategies section. You can rest assured that under all market conditions our team is focused on delivering excellent investment management services for your benefit .
We thank you for your continued confidence and investment in the Managers Funds.
|
| Respectfully, |
|
 |
| John H. Streur |
Senior Managing Partner Managers Investment Group LLC |
2
About Your Fund’s Expenses
As a shareholder of a Fund, you may incur two types of costs: (1) transaction costs, which may include sales charges (loads) on purchase payments; redemption fees; and exchange fees; and (2) ongoing costs, including management fees; distribution (12b-1) fees; and other Fund expenses. This example is intended to help you understand your ongoing costs (in dollars) of investing in the Fund and to compare these costs with the ongoing costs of investing in other mutual funds. The example is based on $1,000 invested at the beginning of the period and held for the entire period as indicated below.
Actual Expenses
The first line of the following table provides information about the actual account values and actual expenses. You may use the information in this line, together with the amount you invested, to estimate the expenses that you paid over the period. Simply divide your account value by $1,000 (for example, an $8,600 account value divided by $1,000 = 8.6), then multiply the result by the number in the first line under the heading entitled “Expenses Paid During Period” to estimate the expenses you paid on your account during this period.
Hypothetical Example for Comparison Purposes
The second line of the following table provides information about hypothetical account values and hypothetical expenses based on the Fund’s actual expense ratio and an assumed annual rate of return of 5% before expenses, which is not the Fund’s actual return. The hypothetical account values and expenses may not be used to estimate the actual ending account balance or expenses you paid for the period. You may use this information to compare the ongoing costs of investing in the Fund and other funds by comparing this 5% hypothetical example with the 5% hypothetical examples that appear in the shareholder reports of other funds.
Please note that the expenses shown in the table are meant to highlight your ongoing costs only and do not reflect any transactional costs, such as sales charges (loads), redemption fees, or exchange fees. Therefore, the second line of the table is useful in comparing ongoing costs only, and will not help you determine the relative total costs of owning different funds.
| | | | | | | | | | | | |
Six Months Ended October 31, 2008 | | Expense
Ratio | | | Beginning
Account Value
5/1/08 | | Ending
Account Value
10/31/08 | | Expenses Paid
During the
Period* |
Managers Fremont Bond Fund | | | | | | | | | | | | |
Actual | | 0.58 | % | | $ | 1,000 | | $ | 938 | | $ | 2.83 |
Hypothetical (5% return before expenses) | | 0.58 | % | | $ | 1,000 | | $ | 1,022 | | $ | 2.95 |
| * | Expenses are equal to the Fund’s annualized expense ratio multiplied by the average account value over the period, multiplied by the number of days in the most recent fiscal half-year (184), then divided by 366. |
3
Managers Fremont Bond Fund
Portfolio Managers’ Comments
Managers Fremont Bond Fund seeks to maximize total return consistent with the preservation of capital by investing in debt securities such as corporate, mortgage-backed, international, and government bonds. Normally, the Fund will invest at least 80% of its total assets in these types of bonds.
The Portfolio Manager
Pacific Investment Management Company, LLC (“PIMCO”), the subadvisor for the Managers Fremont Bond Fund (“the Fund”), was founded in 1971. PIMCO is one of the world’s leading fixed-income managers with expertise and significant resources committed to virtually every sector of the global bond market.
Managers Fremont Bond Fund is an actively managed, diversified bond fund that focuses on intermediate-term, investment-grade bonds. The universe for the Fund includes all sectors of the bond market: governments, corporate bonds, mortgage-backed and asset-backed securities, money market instruments, and international bonds. The Fund seeks total return consistent with preservation of capital by employing PIMCO’s “Total Return” fixed income investment philosophy. This philosophy follows three key principles:
| | • | | Major shifts in portfolio strategy are driven by longer-term, or secular, trends as opposed to short-term interest rate fluctuations. |
| | • | | Consistent investment performance is achieved by avoiding extreme swings in maturity/duration of a portfolio. |
| | • | | Emphasis is placed on adding value through state-of-the-art tools such as futures, options, and volatility analysis. |
Economic analysis serves as the base for PIMCO’s portfolio strategy. Annually, PIMCO investment professionals conduct a three-day secular forum, where long-term economic and market forces are evaluated and portfolio strategies are set. Each quarter, the team meets to evaluate the current business cycle and develop shorter-term forecasts, which are used to fine-tune investment strategy. PIMCO’s fixed income research efforts focus on identifying relative value and understanding the risks inherent in different portfolio structures, strategies, and bond market sectors. Using proprietary analytics and bottom-up credit analysis, the portfolio managers select individual bonds based on recommendations from sector analysts (who specialize in corporate, mortgage, high yield, government, and international bonds).
The ideal investment exhibits many of the following traits:
| | • | | It allows management to meet its overall portfolio positioning targets. Management typically invests in investment-grade securities but may invest up to 10% of the portfolio in securities that are below investment grade. |
| | • | | The investment has been independently analyzed by PIMCO. PIMCO does not rely solely on the credit ratings assigned by outside credit agencies. |
| | • | | Fund management deems that the security provides value relative to other securities within the same sector. |
Portfolio management:
| | • | | Is committed to seeking value across all bond market sectors. |
| | • | | Actively manages duration exposure, yield-curve position, volatility, sector allocation, and security selection and takes only modest exposures in each of these areas relative to the market. |
| | • | | Normally hedges at least 75% of its foreign currency exposure. |
| | • | | Utilizes derivatives (futures, options, swap agreements) as substitutes for physical securities as a means of gaining more cost-effective exposure. |
The investment team may sell securities when:
| | • | | Securities individually no longer represent relative value. |
| | • | | Fund management makes a shift in its portfolio strategy (change in duration, yield curve positioning, sector strategy, etc.). |
The Year in Review
The U.S. bond market was initially headlined by the continuing U.S. housing subprime fallout, which eventually morphed into a larger global credit crisis in the fiscal year ended October 31, 2008. Towards the end of the fiscal year, significant market events occurred on an almost daily basis with the highlights including the U.S. Treasury’s bailout of mortgage agencies Fannie Mae and Fred-die Mac as well as insurer AIG and market turmoil eventually even extending to money markets. Eventually, the Troubled Asset Relief Program (TARP) was approved by Congress in an effort to open up credit markets. As a result of all this activity, volatility in global capital markets continued to increase throughout the course of the year with bonds ultimately generating mixed returns. There was a protracted flight to quality that led to U.S. Treasuries outperforming riskier bonds by a substantial margin while investment grade corporate bonds were pummeled in the limited liquidity environment.
For the 12-month period ended October 31, 2008, the Managers Fremont Bond Fund returned -0.60%, compared with a return of 0.30% for the Barclays Capital U.S. Aggregate Index®, the Fund’s primary benchmark. Despite trailing the benchmark for the period, the Fund has still performed quite well over longer time periods relative to its benchmark and peer universe. The Fund’s negative absolute and relative returns are primarily attributable to an overweighting of bonds of financial companies, including Lehman Brothers and AIG, as contagion from subprime-related deleveraging swept through this sector despite unprecedented government support. The Fund’s exposure to corporate issues, in general, was detrimental to performance as spreads reached historical highs towards the end of this period, with massive global deleveraging depressing valuations of these assets. Earlier in the year, an overweighting of high quality mortgages was detrimental to performance as these securities lost value versus like-duration Treasuries as liquidity contracted. The Fund’s modest exposure to emerging market currencies detracted from performance, particularly in August, as the U.S. dollar rallied. Meanwhile, the Fund’s focus on shorter maturities within the U.S. and U.K. added to performance at both the start and end of this period when the yield curves steepened for these economies.
Looking Forward
The portfolio management team at PIMCO believes that the crisis in credit and financial markets will cause developed economies to operate well below potential for some time. With the global economy mired in the most serious financial crisis since the Great Depression, policymakers continue to struggle to find responses that are both necessary and sufficient to cope with the problems. It remains to be seen what will constitute a sufficient response. Inherent in a crisis of this magnitude are heightened risks associated with the left
4
Managers Fremont Bond Fund
Portfolio Managers’ Comments (continued)
tail of the probability distribution; that is, events that seem unlikely, but that could have consequences that are highly negative and destabilizing. The key elements of PIMCO’s outlook include:
| | • | | The Paradox of Deleveraging – The bursting of the residential real estate bubble has helped produce what PIMCO terms the “paradox of deleveraging.” As banks and other heavily indebted investors rationally attempt to unload mortgage-related assets, a spiral of debt deflation has ensued because there are not enough buyers with capacity on their balance sheets to accept the assets. Compounding the problem is the illiquidity and complexity of many of these securities, which makes them difficult to value. |
| | • | | A Potential Floor for the Market – Government policy has shifted during this crisis from targeting financial institutions to targeting both institutions and the financial markets. PIMCO believes that government support for the real estate and mortgage markets has been justified for some time. The best way to put a floor under the market, provide a mechanism for price discovery, and set the stage for recovery is for the U.S. government to take at least some of these assets onto its balance sheet. However, even with implementation of the U.S. Treasury’s program for accomplishing these objectives, the Troubled Asset Relief Program (TARP), there is unlikely to be an economic revival anytime soon. |
| | • | | Options for Policymakers – Global policymakers have other options besides TARP, and PIMCO believes that they should use them. With interbank lending rates at record levels and credit markets paralyzed, financial conditions are tight and the case for continued central bank easing is compelling. The European Central Bank and Bank of England are likely to ease even more than the Federal Reserve as their economies slow. |
| | • | | More Options – In the U.S., the Treasury has the authority to buy mortgage-backed securities or the bonds of Fannie Mae and Freddie Mac outright, as well as expand Fannie and Freddie’s balance sheets. PIMCO believes the Fed can, and probably will continue to inject massive liquidity into the financial system. The Fed has already announced a program to assume credit risk by buying corporate commercial paper. The Treasury appears poised to inject equity capital directly into troubled banks. Lastly, PIMCO believes that the Fed should act as a clearing house for payments and settlements of financial transactions in order to bring normalcy back to this area of the system. |
| | • | | EM to Cushion the Blow – PIMCO believes growth in emerging markets, led by China, may cushion the blow delivered by the credit crisis. Chinese growth will decelerate in the face of weaker external demand and the need to contain inflation, but the slowdown will come off of very rapid rates in the recent past. Domestic consumption and investment will continue to support the Chinese economy. Moreover, China and other emerging economies have the financial reserves needed to use fiscal stimulus to sustain domestic demand. Policymakers in emerging economies and elsewhere will have more flexibility to employ fiscal stimulus over the next year. Headline inflation pressures will likely abate as the weakening global economy keeps commodity prices soft compared to recently elevated levels. |
PIMCO went into the present crisis with a defensive orientation, including a focus on the front end of yield curves worldwide and holdings of high-quality assets deemed to be under the Fed/Treasury policy umbrella. All of these elements will remain in place and should build in effective hedges to downside risk that will be a prominent feature of the investment landscape. In addition, PIMCO’s investment process will continue to concentrate on elements not readily visible to outside observers, such as cash, collateral, and counterparty risk management.
| | • | | Interest Rate Exposures – PIMCO will be neutral to slightly overweight duration overall with tactical interest rate exposure to Europe and the U.K. Interest rates in developed markets are unlikely to rise as these economies weaken. PIMCO will retain exposure to the front end of yield curves in the U.S., Europe, and the U.K. in the belief that shorter maturities are likely to outperform as markets anticipate central bank easing and injections of liquidity. |
| | • | | Concentrate on High-Quality Assets – Agency mortgage pass-throughs will continue to be PIMCO’s largest sector overweight. PIMCO has about the level of exposure that they want to these high-quality assets, which have performed relatively well amid the recent market turmoil. PIMCO will also focus on maintaining the liquidity that they need to gain exposure to other high-quality assets as they become attractive. These securities could include municipals, where yields are near their historic highs relative to Treasuries, and select asset-backed bonds with strong collateral protection and attractive yields. |
| | • | | Hold Positions in Financials – In hindsight, PIMCO was premature in their purchases of banking and finance company bonds that offered highly attractive yield premiums but exposed the Fund to the worsening situation in the financial sector. PIMCO is no longer adding to these positions but neither do they plan to sell them. PIMCO has focused the exposure primarily on large institutions that they believe fall under the protective “umbrella” of the Fed and, therefore, have potential for price recovery once financial and credit markets stabilize. Besides an expectation of government support, the Fund’s holdings should also benefit going forward from bondholder-friendly economic trends that were already in place before the crisis. These trends include the consolidation and recapitalization of financial services companies, as well as deleveraging and greater balance sheet transparency. |
| | • | | Currency Exposure Emphasizing Emerging Markets – PIMCO came into the financial market crisis with relatively neutral currency exposure overall – modest long positions in emerging market currencies, roughly offset by short positions in developed currencies, especially the U.K. pound. PIMCO plans to retain this approach. Interest rate differentials among developed economies that now favor Europe and the U.K. over the U.S. are likely to narrow as all developed economies slow down. This trend should favor the U.S. dollar versus other developed currencies. By contrast, currencies of emerging economies should fare better against the U.S. dollar given their faster expected growth. |
5
Managers Fremont Bond Fund
Portfolio Managers’ Comments (continued)
Cumulative Total Return Performance
The Fund’s cumulative total return is based on the daily change in net asset value (NAV), and assumes that all distributions were reinvested. The Barclays Capital U.S. Aggregate Index® is an index of the U.S. investment grade fixed-rate bond market, including both government and corporate bonds. Unlike the Fund, the Barclays Capital U.S. Aggregate Index® is unmanaged, is not available to investment, and does not incur expenses. The chart illustrates the performance of a hypothetical $10,000 investment made in the Managers Fremont Bond Fund on October 31, 1998, to a $10,000 investment made in the Barclays Capital U.S. Aggregate Index® for the same period. Performance for periods longer than one year is annualized. The graph and table do not reflect the deduction of taxes that a shareholder would pay on a Fund distribution or redemption of shares. The listed returns for the Fund are net of expenses and the returns for the index exclude expenses. Total returns for the Fund would have been lower had certain expenses not been reduced.
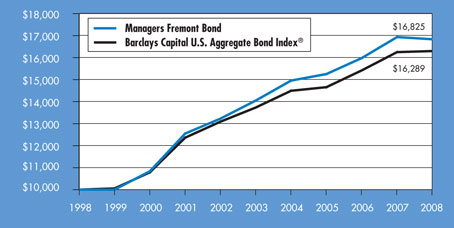
The table below shows the average annual total returns for the Managers Fremont Bond Fund and the Barclays Capital U.S. Aggregate Index® from October 31, 1998 through October 31, 2008.
| | | | | | | | | |
Average Annualized Total Returns 1 | | One Year | | | Five Years | | | Ten Years | |
Managers Fremont Bond 2,3,4,5,6,7 | | (0.60 | )% | | 3.68 | % | | 5.34 | % |
Barclays Capital U.S. Aggregate Bond Index®8 | | 0.30 | % | | 3.48 | % | | 5.00 | % |
The performance data shown represents past performance. Past performance is not a guarantee of future results. Current performance may be lower or higher than the performance data quoted. The investment return and principal value of an investment in the Fund will fluctuate so that an investor’s shares, when redeemed, may be worth more or less than their original cost. For performance information through the most recent month end, please call (800) 835-3879 or visit our Web site at www.managersinvest.com.
In choosing a Fund, investors should carefully consider the amount they plan to invest, their investment objectives, the Fund’s investment objectives, risks, charges and expenses before investing. For this and other information, please call 800.835.3879 or visit www.managersinvest.com for a free prospectus. Read it carefully before investing or sending money. Distributed by Managers Distributors, Inc., member FINRA.
1 | Total return equals income yield plus share price change and assumes reinvestment of all dividends and capital gain distributions. Returns are net of fees and may reflect offsets of Fund expenses as described in the Prospectus. No adjustment has been made for taxes payable by shareholders on their reinvested dividends and capital gain distributions. Returns for periods greater than one year are annualized. The listed returns on the Fund are net of expenses and based on the published NAV as of October 31, 2008. All returns are in U.S. dollars($). |
2 | Fund for which, from time to time, the advisor has waived its fees and/or absorbed Fund expenses, which has resulted in higher returns. |
3 | Fixed-income funds are subject to the risks associated with investments in debt securities, such as default risk, fluctuation in debtors’ perceived ability to pay their creditors, and changing interest rate risk. An increase in interest rates typically causes the value of bonds and other fixed-income securities to fall. |
4 | The Fund may use derivative instruments for hedging purposes or as part of its investment strategy. There is a risk that a derivative intended as a hedge may not perform as expected. The main risk with derivatives is that some types can amplify a gain or loss, potentially earning or losing substantially more money than the actual cost of the derivative; or that the counterparty may fail to honor its contract terms, causing a loss for the Fund. Use of these instruments may also involve certain costs and risks such as liquidity risk, interest rate risk, market risk, credit risk, management risk, and the risk that a fund could not close out a position when it would be most advantageous to do so. |
5 | Investments in international securities are subject to certain risks of overseas investing including currency fluctuations and changes in political and economic conditions, which could result in significant market fluctuations. These risks are magnified in emerging markets. |
6 | High Yield Bonds (also known as “junk bonds”) are subject to additional risks such as the risk of default. |
7 | Many bonds have call provisions which allow the debtors to pay them back before maturity. This is especially true with mortgage securities, which can be paid back anytime. Typically debtors prepay their debt when it is to their advantage (when interest rates drop making a new loan at current rates more attractive), and thus likely to the disadvantage of bondholders, who may have to reinvest prepayment proceeds in securities with lower yields. Prepayment risk will vary depending on the provisions of the security and current interest rates relative to the interest rate of the debt. |
8 | Prior to October 31, 2008, the Index was known as the Lehman Brothers U.S. Aggregate Bond Index. |
Not FDIC insured, nor bank guaranteed. May lose value.
6
Managers Fremont Bond Fund
Fund Snapshots
October 31, 2008
Portfolio Breakdown

| | | | | | |
Rating | | Managers
Fremont Bond** | | | Barclays Capital
U.S. Aggregate
Bond Index® | |
U.S. Treasury & Agency | | 62.7 | % | | 74.1 | % |
Aaa | | 13.3 | % | | 7.5 | % |
Aa | | 10.6 | % | | 4.1 | % |
A | | 10.0 | % | | 7.9 | % |
Baa | | 1.6 | % | | 6.4 | % |
Ba & lower | | 1.8 | % | | 0.0 | % |
Top Ten Holdings
| | | |
Security Name | | Percentage
of Net Assets | |
FNMA, 5.500%, TBA | | 21.0 | % |
FNMA, 5.000%, TBA | | 9.0 | |
FNMA, 5.000%, TBA | | 6.1 | |
FNMA, 6.000%, TBA | | 6.1 | |
FHLMC, 5.500%, TBA | | 5.7 | |
FNMA, 5.500%, TBA | | 3.8 | |
JPMorgan Chase & Co., dated 10/31/08, due 11/03/08, 1.90%, total to be received $35,300,441 (secured by $35,300,000 U.S. Treasury Notes, 3.500%, 02/15/18) | | 3.4 | |
FNMA, 5.500%, TBA | | 3.0 | |
U.S. Treasury Inflation Indexed Notes, 3.000%, 07/15/12 | | 2.1 | |
Bear Stearns Adjustable Rate Mortgage Trust, Series 2005-5, Class A2, 4.550%, 08/25/35* | | 2.0 | |
| | | |
Top Ten as a Group | | 62.2 | % |
| | | |
| * | Top Ten Holding at April 30, 2008. |
Any sectors, industries, or securities discussed should not be perceived as investment recommendations. Mention of a specific security should not be considered a recommendation to buy or solicitation to sell that security.
7
Managers Fremont Bond Fund
Schedule of Portfolio Investments
October 31, 2008
| | | | | | |
| | | Principal Amount | | Value |
Corporate Bonds - 51.7% | | | | | | |
Asset-Backed Securities - 4.2% | | | | | | |
Amortizing Residential Collateral Trust, 3.549%, 07/25/32, (11/25/08)4 | | $ | 77,398 | | $ | 54,027 |
Argent Securities, Inc., 3.309%, 09/25/36, (11/25/08)4 | | | 227,560 | | | 225,505 |
Asset Backed Funding Certificates, Series 2006-OPT3 A3A, 3.319%, 11/25/36, (11/25/08)4 | | | 842,466 | | | 812,206 |
Asset Backed Securities Corp. Home Equity, 3.309%, 11/25/36, (11/25/08)4 | | | 422,114 | | | 419,173 |
Bear Stearns Asset Backed Securities, Inc., 3.339%, 10/25/36, (11/25/08)4 | | | 683,995 | | | 654,537 |
Citigroup Mortgage Loan Trust, Inc., 3.309%, 11/25/36, (11/25/08)4 | | | 57,176 | | | 56,878 |
Countrywide Asset-Backed Certificates, 3.309%, 05/25/37, (11/25/08)4 | | | 871,575 | | | 848,085 |
EMC Mortgage Loan Trust, Class A, 3.629%, 05/25/40, (11/25/08) (a)4 | | | 1,179,579 | | | 976,105 |
First Franklin Mortgage Loan Asset Backed Certificates, Series 2006-FF15, Class A3, 3.309%, 11/25/36, (11/25/08)4 | | | 1,635,753 | | | 1,547,228 |
First NLC Trust, 3.329%, 08/25/37, (11/25/08) (a)4 | | | 1,577,915 | | | 1,452,914 |
Fremont Home Loan Trust, 3.319%, 01/25/37, (11/25/08)4 | | | 1,052,962 | | | 983,178 |
GSAMP Trust, Series 2006-HE7, Class A2A, 3.299%, 10/25/46, (11/25/08)4 | | | 1,357,485 | | | 1,329,469 |
HSI Asset Securitization Corp. Trust, 3.309%, 12/25/36, (11/25/08)4 | | | 681,935 | | | 645,182 |
Indymac Residential Asset Backed Trust, 3.319%, 04/25/37, (11/25/08)4 | | | 616,152 | | | 601,522 |
JPMorgan Acquisition Corp., Class A, 3.309%, 08/25/36, (11/25/08)4 | | | 362,168 | | | 355,724 |
Lehman XS Trust, 3.329%, 05/25/46, (11/25/08)4 | | | 219,397 | | | 213,039 |
Lehman XS Trust, 3.339%, 11/25/46, (11/25/08)4 | | | 1,623,279 | | | 1,546,829 |
Long Beach Mortgage Loan Trust, 3.539%, 10/25/34, (11/25/08)4 | | | 55,661 | | | 36,431 |
Morgan Stanley ABS Capital I, 3.299%, 10/25/36, (11/25/08)4 | | | 452,508 | | | 440,859 |
Morgan Stanley ABS Capital I, 3.309%, 10/25/36, (11/25/08)4 | | | 376,798 | | | 364,835 |
Morgan Stanley IXIC Real Estate Capital Trust, 3.309%, 11/25/36, (11/25/08)4 | | | 744,228 | | | 721,608 |
Option One Mortgage Loan Trust, 3.309%, 01/25/37, (11/25/08)4 | | | 932,151 | | | 894,494 |
Park Place Securities, Inc., Series 2005-WCW1, Class A1B, 3.519%, 09/25/35, (11/25/08)4 | | | 1,587,551 | | | 1,445,682 |
Residential Asset Mortgage Products, Inc., 3.329%, 11/25/36, (11/25/08)4 | | | 398,109 | | | 395,617 |
Residential Asset Securities Corp., 3.329%, 11/25/36, (11/25/08)4 | | | 2,317,682 | | | 2,281,182 |
Saxon Asset Securities Trust, 3.319%, 10/25/46, (11/25/08)4 | | | 343,478 | | | 334,138 |
Securitized Asset Backed Receivables LLC Trust, 3.319%, 12/25/36, (11/25/08)4 | | | 1,258,716 | | | 1,161,593 |
Securitized Asset Backed Receivables LLC Trust, Series 2007-NC2, Class A2A, 3.299%, 01/25/37, (11/25/08)4 | | | 1,789,466 | | | 1,673,663 |
Structured Asset Securities Corp., 3.309%, 10/25/36, (11/25/08)4 | | | 1,206,295 | | | 1,144,147 |
Structured Asset Securities Corp., 3.549%, 01/25/33, (11/25/08)4 | | | 77,557 | | | 60,945 |
U.S. Small Business Administration Participation Certificates, Series 2008-10E, Class 1, 5.110%, 09/01/18 | | | 4,124,000 | | | 4,120,169 |
U.S. Small Business Administration Participation Certificates, 5.130%, 09/01/23 | | | 122,904 | | | 121,249 |
U.S. Small Business Administration Participation Certificates, Series 2007-20K, Class 1, 5.510%, 11/01/27 | | | 5,198,908 | | | 5,156,043 |
U.S. Small Business Administration Participation Certificates, Series 2008-20I, 5.600%, 09/01/28 | | | 10,015,000 | | | 9,918,297 |
U.S. Small Business Administration Surety Bonds, 6.344%, 08/01/11 | | | 520,204 | | | 532,892 |
U.S. Small Business Administration Surety Bonds, 7.449%, 08/01/10 | | | 20,338 | | | 20,713 |
Total Asset-Backed Securities | | | | | | 43,546,158 |
The accompanying notes are an integral part of these financial statements.
8
Managers Fremont Bond Fund
Schedule of Portfolio Investments (continued)
| | | | | | | |
| | | Principal Amount | | | Value |
Financials - 30.5% | | | | | | | |
Allstate Life Global Funding Trusts, 5.375%, 04/30/13 | | $ | 1,600,000 | 2 | | $ | 1,447,330 |
American Express Bank FSB, 4.338%, 10/20/09, (11/20/08)4 | | | 2,300,000 | | | | 2,232,612 |
American Express Centurion Bank, 4.607%, 06/12/09, (11/12/08)4 | | | 1,500,000 | | | | 1,462,561 |
American Express Co., 7.000%, 03/19/18 | | | 1,000,000 | | | | 771,532 |
American Express Credit Co., 4.200%, 11/09/09, (11/10/08)4 | | | 2,400,000 | | | | 2,180,998 |
American International Group, Inc., 4.519%, 06/16/09, (11/17/08) (a)4 | | | 3,100,000 | | | | 2,405,112 |
American International Group, Inc., 5.050%, 10/01/15 | | | 400,000 | | | | 149,568 |
ANZ National Bank, Ltd., 2.842%, 08/07/09, (11/10/08) (a)4 | | | 2,500,000 | | | | 2,496,853 |
ANZ National International, Ltd., 6.200%, 07/19/13 (a) | | | 1,800,000 | | | | 1,626,172 |
Bank of America Corp., 6.000%, 10/15/36 | | | 900,000 | | | | 693,994 |
Bank of America Corp., 8.000%, 12/29/495,6 | | | 27,300,000 | | | | 20,469,868 |
Bank of Ireland, 3.072%, 12/19/08, (12/19/08)4 | | | 4,200,000 | | | | 4,199,656 |
Bank of Ireland, 4.793%, 01/15/10, (01/15/09)4 | | | 7,400,000 | | | | 7,357,361 |
Barclays Bank PLC, 5.450%, 09/12/12 | | | 17,300,000 | | | | 16,685,175 |
Bear Stearns Companies, Inc., The, 2.901%, 08/21/09, (11/21/08)4 | | | 4,800,000 | | | | 4,710,835 |
Bear Stearns Companies, Inc., The, 3.765%, 01/30/09, (01/30/09)4 | | | 2,700,000 | | | | 2,690,869 |
Bear Stearns Companies, Inc., The, 3.852%, 03/30/09, (12/30/08)4 | | | 2,400,000 | | | | 2,387,201 |
Bear Stearns Companies, Inc., The, 4.905%, 07/16/09, (01/16/09)4 | | | 1,600,000 | | | | 1,602,043 |
Bear Stearns Companies, Inc., The, 6.950%, 08/10/12 | | | 5,800,000 | | | | 5,727,865 |
C10 Capital SPV, Ltd., 6.722%, 12/31/49 (a)5,6 | | | 1,500,000 | | | | 705,195 |
China Development Bank, 5.000%, 10/15/15 | | | 300,000 | | | | 257,286 |
CIT Group, Inc., 2.927%, 08/17/09, (11/17/08)4 | | | 2,400,000 | | | | 1,993,695 |
CIT Group, Inc., 3.615%, 01/30/09, (01/30/09)4 | | | 5,400,000 | | | | 4,947,950 |
Citigroup Capital XXI, 8.300%, 12/21/57 | | | 1,200,000 | | | | 825,444 |
Citigroup Funding, Inc., 3.476%, 06/26/09, (12/29/08)4 | | | 1,600,000 | | | | 1,554,450 |
Citigroup Global Markets Holdings, Inc., 2.916%, 03/17/09, (12/17/08) (a)4 | | | 2,200,000 | | | | 2,184,521 |
Citigroup, Inc., 2.805%, 12/28/08, (12/28/08)4 | | | 400,000 | | | | 399,624 |
Citigroup, Inc., 3.505%, 01/30/09, (01/30/09)4 | | | 2,500,000 | | | | 2,469,000 |
Citigroup, Inc., 3.799%, 12/28/09, (12/29/08)4 | | | 300,000 | | | | 283,648 |
Citigroup, Inc., 3.809%, 12/26/08, (12/26/08)4 | | | 5,000,000 | | | | 4,993,115 |
Citigroup, Inc., 5.300%, 10/17/12 | | | 200,000 | | | | 183,028 |
Citigroup, Inc., 5.500%, 08/27/12 | | | 500,000 | | | | 463,084 |
Citigroup, Inc., 5.850%, 07/02/13 | | | 100,000 | | | | 92,082 |
Citigroup, Inc., 6.000%, 08/15/17 | | | 4,200,000 | | | | 3,616,145 |
Citigroup, Inc., 6.125%, 05/15/18 | | | 800,000 | | | | 686,526 |
Citigroup, Inc., 6.125%, 08/25/36 | | | 4,900,000 | | | | 3,312,586 |
Citigroup, Inc., 8.400%, 04/29/496 | | | 1,200,000 | | | | 835,619 |
Countrywide Financial Corp., 5.363%, 05/28/09, (11/24/08)4 | | € | 4,000,000 | | | | 4,581,756 |
Countrywide Financial Corp., 5.800%, 06/07/12 | | | 4,400,000 | | | | 4,095,080 |
Credit Agricole (London), 2.809%, 05/28/09, (11/28/08) (a)4 | | | 1,900,000 | | | | 1,895,620 |
Credit Agricole (London), 2.859%, 05/28/10, (11/28/08) (a)4 | | | 2,200,000 | | | | 2,185,469 |
The accompanying notes are an integral part of these financial statements.
9
Managers Fremont Bond Fund
Schedule of Portfolio Investments (continued)
| | | | | | | |
| | | Principal Amount | | | Value |
Financials - 29.8% (continued) | | | | | | | |
Deutsche Bank AG London, 6.000%, 09/01/17 | | $ | 5,000,000 | | | $ | 4,445,120 |
DnB NOR Bank ASA, 4.889%, 10/13/09, (01/13/09) (a)4 | | | 13,100,000 | | | | 13,127,156 |
Ford Motor Credit Company LLC, 5.700%, 01/15/10 | | | 1,500,000 | | | | 1,113,726 |
Ford Motor Credit Company LLC, 5.800%, 01/12/09 | | | 2,600,000 | 2 | | | 2,410,767 |
Ford Motor Credit Company LLC, 6.375%, 11/05/08 | | | 6,100,000 | | | | 6,100,000 |
Ford Motor Credit Company LLC, 7.250%, 10/25/11 | | | 200,000 | | | | 121,158 |
Ford Motor Credit Company LLC, 7.375%, 02/01/11 | | | 300,000 | | | | 186,757 |
Ford Motor Credit Company LLC, 7.875%, 06/15/10 | | | 2,900,000 | | | | 1,949,096 |
Ford Motor Credit Company LLC, 8.625%, 11/01/10 | | | 700,000 | | | | 462,974 |
General Electric Capital Corp., 2.874%, 08/15/11, (11/17/08)4 | | | 3,600,000 | | | | 3,405,283 |
General Electric Capital Corp., 3.565%, 10/26/09, (01/26/09)4 | | | 6,000,000 | | | | 5,880,588 |
General Electric Capital Corp., 4.247%, 01/05/09, (01/05/09)4 | | | 2,500,000 | | | | 2,492,507 |
General Electric Capital Corp., 4.519%, 10/21/10, (01/21/09)4 | | | 5,000,000 | | | | 4,558,550 |
General Electric Capital Corp., 4.572%, 01/20/10, (01/20/09)4 | | | 3,900,000 | | | | 3,814,368 |
General Electric Capital Corp., 5.500%, 09/15/67 (a) | | € | 5,500,000 | | | | 4,117,966 |
General Electric Capital Corp., 5.875%, 01/14/38 | | | 2,300,000 | | | | 1,645,342 |
GMAC LLC, 4.054%, 05/15/09, (11/17/08)4 | | | 3,200,000 | | | | 2,788,864 |
GMAC LLC, 6.000%, 12/15/11 | | | 400,000 | | | | 225,904 |
Goldman Sachs Group, Inc., 2.887%, 11/16/09, (11/17/08)4 | | | 1,300,000 | | | | 1,217,762 |
Goldman Sachs Group, Inc., 3.250%, 12/23/08, (12/23/08)4 | | | 100,000 | | | | 99,168 |
Goldman Sachs Group, Inc., 3.294%, 12/22/08, (12/22/08)4 | | | 8,800,000 | | | | 8,723,378 |
Goldman Sachs Group, Inc., 3.300%, 06/23/09, (12/23/08)4 | | | 4,300,000 | | | | 4,166,416 |
Goldman Sachs Group, Inc., 5.950%, 01/18/18 | | | 4,800,000 | | | | 3,921,010 |
Goldman Sachs Group, Inc., 6.150%, 04/01/18 | | | 2,000,000 | | | | 1,659,580 |
Goldman Sachs Group, Inc., 6.250%, 09/01/17 | | | 3,200,000 | | | | 2,678,582 |
HBOS PLC, 5.920%, 09/01/49 (a)5,6 | | | 400,000 | | | | 191,016 |
HBOS Treasury Services PLC, 4.590%, 07/17/09, (01/20/09) (a)4 | | | 3,600,000 | 2 | | | 3,591,385 |
HSBC Finance Corp., 4.479%, 10/21/09, (01/21/09)4 | | | 1,600,000 | | | | 1,538,448 |
HSBC Holdings PLC, 6.500%, 05/02/36 | | | 800,000 | | | | 634,700 |
HSBC Holdings PLC, 6.500%, 09/15/37 | | | 900,000 | | | | 711,642 |
ICICI Bank, Ltd., 5.290%, 01/12/10, (01/12/09) (a)4 | | | 3,400,000 | | | | 3,310,196 |
Idearc, Inc., Term B Loan, 5.120%, 11/17/14 | | | 223,158 | | | | 96,330 |
Idearc, Inc., Term B Loan, 5.770%, 11/09/14 | | | 4,984,092 | | | | 2,151,468 |
JPMorgan Chase & Co., 3.309%, 06/26/09, (11/26/08)4 | | | 1,800,000 | | | | 1,796,584 |
JPMorgan Chase & Co., 6.000%, 10/01/17 | | | 5,800,000 | | | | 5,085,672 |
JPMorgan Chase & Co., 6.000%, 01/15/18 | | | 1,600,000 | | | | 1,437,778 |
JPMorgan Chase Capital XX, 6.550%, 09/29/36 | | | 400,000 | 2 | | | 280,938 |
KBC Bank Fund Trust II, 6.875%, 06/01/495,6 | | € | 1,900,000 | | | | 2,403,170 |
Key Bank N.A., 5.061%, 06/02/10, (12/02/08)4 | | | 2,700,000 | | | | 1,833,880 |
Korea Development Bank, 4.348%, 04/03/10, (01/02/09)4 | | | 7,100,000 | | | | 6,841,290 |
Lehman Brothers Holdings, Inc., 04/03/09*8,9 | | | 4,700,000 | | | | 575,750 |
The accompanying notes are an integral part of these financial statements.
10
Managers Fremont Bond Fund
Schedule of Portfolio Investments (continued)
| | | | | | | |
| | | Principal Amount | | | Value |
Financials - 29.8% (continued) | | | | | | | |
Lehman Brothers Holdings, Inc., 05/25/10*8,9 | | $ | 1,000,000 | | | $ | 122,500 |
Lehman Brothers Holdings, Inc., 07/18/11*8,9 | | | 1,700,000 | | | | 208,250 |
Lehman Brothers Holdings, Inc., 10/22/08*8,9 | | | 3,900,000 | | | | 477,750 |
Lehman Brothers Holdings, Inc., 11/16/09*8,9 | | | 1,200,000 | | | | 147,000 |
Lehman Brothers Holdings, Inc., 12/23/08*8,9 | | | 200,000 | | | | 24,500 |
Lehman Brothers Holdings, Inc., 01/24/13*8,9 | | | 2,000,000 | | | | 270,000 |
Lehman Brothers Holdings, Inc., 05/02/18*8,9 | | | 600,000 | | | | 81,000 |
Lloyds TSB Capital, 7.375%, 12/01/495,6 | | € | 1,800,000 | | | | 2,010,194 |
Merrill Lynch & Co., Inc., 2.893%, 12/04/09, (12/04/08)4 | | | 2,100,000 | | | | 1,941,784 |
Merrill Lynch & Co., Inc., 2.894%, 08/14/09, (11/14/08)4 | | | 2,200,000 | | | | 2,068,807 |
Merrill Lynch & Co., Inc., 3.735%, 07/25/11, (01/26/09)4 | | | 3,000,000 | | | | 2,538,753 |
Merrill Lynch & Co., Inc., 6.400%, 08/28/17 | | | 2,300,000 | | | | 1,946,504 |
Merrill Lynch & Co., Inc., 6.875%, 04/25/18 | | | 5,000,000 | | | | 4,448,350 |
Met Life Global Funding, 2.847%, 05/17/10, (11/17/08) (a)4 | | | 4,100,000 | | | | 3,633,716 |
Metlife, Inc., 6.400%, 12/15/36 | | | 800,000 | | | | 399,008 |
Morgan Stanley & Co., Inc., 2.913%, 02/09/09, (11/21/08)4 | | | 1,400,000 | | | | 1,386,595 |
Morgan Stanley & Co., Inc., 4.221%, 11/21/08, (11/21/08)4 | | | 1,800,000 | | | | 1,797,971 |
Morgan Stanley & Co., Inc., 4.843%, 01/15/10, (01/15/09)4 | | | 4,600,000 | | | | 4,209,106 |
Morgan Stanley & Co., Inc., 4.904%, 05/14/10, (11/14/08)4 | | | 3,100,000 | | | | 2,853,823 |
Morgan Stanley & Co., Inc., 5.950%, 12/28/17 | | | 1,800,000 | | | | 1,444,192 |
Morgan Stanley & Co., Inc., 6.250%, 08/28/17 | | | 1,000,000 | | | | 816,879 |
MUFG Capital Finance, Ltd., 6.346%, 07/29/495,6 | | | 400,000 | | | | 280,387 |
National Australia Bank, Ltd., 5.350%, 06/12/13 (a) | | | 1,500,000 | | | | 1,390,401 |
Petroleum Export Ltd., 5.265%, 06/15/11 (a) | | | 195,567 | | | | 195,483 |
Principal Life Income Funding Trust, 5.300%, 04/24/13 | | | 1,500,000 | | | | 1,377,510 |
Principal Life Income Funding Trust, 5.550%, 04/27/15 | | | 2,300,000 | | | | 2,013,983 |
Residential Capital LLC, 5.912%, 05/22/09, (11/24/08)4 | | | 2,500,000 | 2 | | | 1,312,500 |
Resona Bank, Ltd., 5.850%, 04/15/49 (a)5,6 | | | 500,000 | | | | 316,379 |
Royal Bank of Scotland Group PLC, 6.990%, 10/29/49 (a)5,6 | | | 2,600,000 | | | | 1,395,430 |
Royal Bank of Scotland Group PLC, 9.118%, 10/01/495,6 | | | 1,000,000 | | | | 926,361 |
Santander, 6.671%, 10/29/49 (a)5,6 | | | 2,100,000 | | | | 1,480,781 |
SLM Corp., 3.019%, 03/15/11, (12/15/08)4 | | | 4,500,000 | | | | 3,223,814 |
SMFG Preferred Capital, Ltd., 6.078%, 01/29/49 (a)5,6 | | | 1,100,000 | | | | 761,750 |
State Street Capital, 3.819%, 06/15/37, (12/15/08)4 | | | 300,000 | | | | 192,922 |
State Street Capital Trust III, 8.250%, 12/29/495,6 | | | 2,000,000 | | | | 1,723,740 |
TNK-BP Finance SA, 6.125%, 03/20/12 (a) | | | 400,000 | | | | 214,000 |
TransCapitalInvest, Ltd., 8.700%, 08/07/18 (a) | | | 600,000 | | | | 354,470 |
UBS AG, 5.750%, 04/25/18 | | | 1,300,000 | | | | 1,012,430 |
UBS AG, 5.875%, 12/20/17 | | | 1,400,000 | | | | 1,119,317 |
USB AG, 6.189%, 03/29/495,6 | | | 300,000 | | | | 156,074 |
Wachovia Corp., 2.861%, 12/01/09, (12/01/08)4 | | | 4,500,000 | | | | 4,218,426 |
The accompanying notes are an integral part of these financial statements.
11
Managers Fremont Bond Fund
Schedule of Portfolio Investments (continued)
| | | | | | | |
| | | Principal Amount | | | Value |
Financials - 29.8% (continued) | | | | | | | |
Wachovia Corp., 4.883%, 10/15/11, (01/15/09)4 | | $ | 2,300,000 | | | $ | 2,070,577 |
Wachovia Corp., 5.750%, 02/01/18 | | | 4,400,000 | 2 | | | 3,848,117 |
Wachovia Corp., 7.980%, 02/28/495,6 | | | 21,200,000 | | | | 16,049,948 |
Total Financials | | | | | | | 316,112,279 |
Industrials - 6.4% | | | | | | | |
Amgen, Inc., 2.889%, 11/28/08, (11/28/08)4 | | | 2,200,000 | | | | 2,198,482 |
Amgen, Inc., 6.150%, 06/01/18 | | | 4,900,000 | | | | 4,411,749 |
AstraZeneca PLC, 5.900%, 09/15/17 | | | 800,000 | | | | 739,650 |
AstraZeneca PLC, 6.450%, 09/15/37 | | | 700,000 | | | | 601,113 |
AT&T, Inc., 2.959%, 02/05/10, (02/05/09)4 | | | 1,200,000 | | | | 1,141,011 |
AT&T, Inc., 4.950%, 01/15/13 | | | 1,700,000 | | | | 1,575,432 |
AT&T, Inc., 5.500%, 02/01/18 | | | 1,700,000 | | | | 1,446,902 |
AT&T, Inc., 6.300%, 01/15/38 | | | 1,200,000 | | | | 950,358 |
Chrysler Term Loan, 6.820%, 08/03/14 | | | 5,940,000 | | | | 4,073,848 |
Codelco, Inc., 6.150%, 10/24/36 (a) | | | 300,000 | | | | 217,845 |
Comcast Corp., 5.875%, 02/15/18 | | | 600,000 | | | | 503,340 |
Comcast Corp., 6.450%, 03/15/37 | | | 600,000 | | | | 462,054 |
DaimlerChrysler NA Holdings, 3.169%, 03/13/09, (12/15/08)4 | | | 2,900,000 | | | | 2,728,001 |
DaimlerChrysler NA Holdings, 3.643%, 08/03/09, (02/03/09)4 | | | 2,200,000 | | | | 1,982,075 |
GAZ Capital, 6.212%, 11/22/16 (a) | | | 400,000 | | | | 250,000 |
GAZ Capital SA, 8.625%, 04/28/34 | | | 5,500,000 | | | | 3,850,000 |
Gazprom OAO, 10.500%, 10/21/09 | | | 2,100,000 | 2 | | | 2,055,900 |
General Electric, 4.489%, 01/08/16, (01/08/09)4 | | | 1,000,000 | | | | 791,598 |
Goodyear Tire & Rubber 2nd Lien Term Loan, 4.540%, 04/20/14 | | | 2,000,000 | | | | 1,423,334 |
Heinz (H.J.) Co., 6.428%, 12/01/08 (a) | | | 400,000 | | | | 401,268 |
IBM Corp., 5.700%, 09/14/17 | | | 16,100,000 | | | | 14,649,664 |
NGPL Pipeco LLC, 6.514%, 12/15/12 (a) | | | 1,800,000 | | | | 1,675,377 |
Peabody Energy Corp., 7.875%, 11/01/26 | | | 700,000 | | | | 551,250 |
Philip Morris International, Inc., 5.650%, 05/16/18 | | | 1,000,000 | | | | 856,960 |
Qwest Capital Funding, Inc., 7.250%, 02/15/11 | | | 1,813,000 | | | | 1,396,010 |
Ras Laffan Liquefied Natural Gas Co., Ltd., 5.298%, 09/30/20 (a) | | | 900,000 | | | | 786,658 |
Rohm & Haas Holdings, 6.000%, 09/15/17 | | | 1,100,000 | | | | 955,480 |
Sonat, Inc., 7.625%, 07/15/11 | | | 1,300,000 | | | | 1,087,243 |
Telefonica Emisiones SAU, 3.504%, 06/19/09, (12/22/08)4 | | | 3,000,000 | | | | 2,889,414 |
Tennessee Gas Pipeline Co., 7.000%, 10/15/28 | | | 6,145,000 | 2 | | | 4,449,244 |
Time Warner, Inc., 3.034%, 11/13/09, (11/13/08)4 | | | 2,000,000 | | | | 1,880,548 |
Time Warner, Inc., 5.875%, 11/15/16 | | | 1,200,000 | | | | 961,850 |
UnitedHealth Group, Inc., 4.875%, 02/15/13 | | | 1,600,000 | | | | 1,494,186 |
Vale Overseas, Ltd., 6.250%, 01/23/17 | | | 500,000 | | | | 407,871 |
Vale Overseas, Ltd., 6.875%, 11/01/36 | | | 500,000 | | | | 361,743 |
Total Industrials | | | | | | | 66,207,458 |
The accompanying notes are an integral part of these financial statements.
12
Managers Fremont Bond Fund
Schedule of Portfolio Investments (continued)
| | | | | | |
| | | Principal Amount | | Value |
Mortgage-Backed Securities - 10.2% | | | | | | |
American Home Mortgage Investment Trust, 4.390%, 02/25/45, (11/25/09) (a)4 | | $ | 938,066 | | $ | 615,784 |
Bank of America Funding Corp., 4.148%, 05/25/35, (07/01/09)4 | | | 1,402,285 | | | 1,117,160 |
Bear Stearns Adjustable Rate Mortgage Trust, 4.675%, 11/25/30, (12/01/08)4 | | | 36,138 | | | 35,484 |
Bear Stearns Adjustable Rate Mortgage Trust, 5.037%, 04/25/33 | | | 756,454 | | | 656,953 |
Bear Stearns Adjustable Rate Mortgage Trust, 5.598%, 02/25/33 | | | 173,986 | | | 161,563 |
Bear Stearns Adjustable Rate Mortgage Trust, Series 2005-2, Class A2, 4.125%, 03/25/35, (12/25/08)4 | | | 16,216,112 | | | 15,554,598 |
Bear Stearns Adjustable Rate Mortgage Trust, Series 2005-2, Class A1, 4.125%, 03/25/35, (01/25/09)4 | | | 18,000,132 | | | 16,695,680 |
Bear Stearns Adjustable Rate Mortgage Trust, Series 2005-5, Class A2, 4.550%, 08/25/35, (10/25/09)4 | | | 22,066,728 | | | 21,053,728 |
Bear Stearns Alt-A Trust, 5.366%, 05/25/35 | | | 1,880,211 | | | 1,523,532 |
Bear Stearns Alt-A Trust, Series 2005-7, Class 22A1, 5.499%, 09/25/35 | | | 910,596 | | | 708,339 |
Bear Stearns Commercial Mortgage Securities, Series 2007-PW18, Class A4, 5.700%, 06/11/50 | | | 2,800,000 | | | 2,092,597 |
Bear Stearns Mortgage Funding Trust, 3.329%, 02/25/37, (11/25/08)4 | | | 2,588,787 | | | 2,306,590 |
Citigroup Commercial Mortgage Trust, 4.630%, 11/15/21, (11/15/08) (a)4 | | | 37,058 | | | 33,889 |
Citigroup Mortgage Loan Trust, 2005-11 2A1, 4.700%, 12/25/35, (07/25/10)4 | | | 586,587 | | | 530,751 |
Citigroup Mortgage Loan Trust, Inc., Series 2005-6, Class A1, 4.747%, 08/25/35, (10/25/09)4 | | | 11,169,438 | | | 10,567,687 |
Countrywide Alternative Loan Trust, 3.439%, 05/25/47, (11/25/08)4 | | | 1,690,073 | | | 929,948 |
Countrywide Home Loans, Inc., 5.250%, 02/20/36, (11/20/10)4 | | | 598,249 | | | 440,037 |
Greenpoint Mortgage Funding Trust, 3.339%, 10/25/46, (11/25/08)4 | | | 1,776,294 | | | 1,521,231 |
Greenpoint Mortgage Funding Trust, 3.339%, 12/25/47, (11/25/08)4 | | | 1,893,081 | | | 1,791,595 |
GS Mortgage Securities Corp., 4.135%, 03/06/20, (11/06/08) (a)4 | | | 2,303,337 | | | 1,946,177 |
GSR Mortgage Loan Trust, Series 2005-AR7, Class 6A1, 5.248%, 11/25/35 | | | 2,279,540 | | | 1,901,235 |
Impac Secured Assets Corp., 3.339%, 01/25/37, (11/25/08)4 | | | 853,179 | | | 805,256 |
Indymac Index Mortgage Loan Trust, 3.349%, 11/25/46, (11/25/08)4 | | | 1,023,457 | | | 960,262 |
IndyMac Index Mortgage Loan Trust, Series 2005-AR31, Class 1A1, 5.230%. 01/25/36 | | | 2,332,617 | | | 1,491,179 |
JPMorgan Chase Commercial Mortgage Securities Corp., 2006-LDP9, Class A3, 5.336%, 05/15/47 | | | 2,100,000 | | | 1,516,491 |
JPMorgan Chase Mortgage Trust, Series 2005-A1, Class 6T1, 5.023%, 02/25/35 | | | 1,606,102 | | | 1,336,561 |
Lehman Brothers Floating Rate Commercial Mortgage Trust, 4.640%, 09/15/21, (11/15/08) (a)4 | | | 282,157 | | | 241,497 |
Merrill Lynch Mortgage Investors, Inc., Series 2005-A10, Class A, 3.469%, 02/25/36, (11/25/08)4 | | | 996,580 | | | 770,215 |
MLCC Mortgage Investors, Inc., Series 2005-3, Class 4A, 3.509%, 11/25/35, (11/25/08)4 | | | 282,217 | | | 255,120 |
Morgan Stanley Capital I, Series 2007-IQ16, Class A4, 5.809%, 12/12/49 | | | 3,000,000 | | | 2,249,418 |
Prime Mortgage Trust, 3.659%, 02/25/19, (11/25/08)4 | | | 65,039 | | | 61,742 |
Prime Mortgage Trust, 3.659%, 02/25/34, (11/25/08)4 | | | 368,154 | | | 334,311 |
Structured Asset Mortgage Investments, Inc., 4.607%, 09/19/32, (11/19/08)4 | | | 473,282 | | | 422,192 |
Structured Asset Mortgage Investments, Inc., Series 2005-AR5, Class A2, 4.527%, 07/19/35, (11/19/08)4 | | | 1,110,252 | | | 1,009,834 |
Structured Asset Securities Corp., 5.034%, 10/25/35 (a) | | | 1,391,760 | | | 1,122,137 |
Structured Asset Securities Corp., 5.057%, 01/25/32 | | | 28,306 | | | 28,275 |
Thornburg Mortgage Securities Trust, 3.369%, 12/25/46, (11/25/08)4 | | | 1,501,896 | | | 1,363,038 |
Wachovia Bank Commercial Mortgage Trust, 4.640%, 06/15/20, (11/15/08) (a)4 | | | 2,547,462 | | | 2,160,161 |
Wachovia Bank Commercial Mortgage Trust, Series 2006-WL7A Class A1, 4.650%, 09/15/21, (11/15/08) (a)4 | | | 5,832,377 | | | 5,027,724 |
The accompanying notes are an integral part of these financial statements.
13
Managers Fremont Bond Fund
Schedule of Portfolio Investments (continued)
| | | | | | | |
| | | Principal Amount | | | Value |
Mortgage-Backed Securities - 10.2% (continued) | | | | | | | |
Washington Mutual MSC Mortgage Pass-Through, 5.056%, 02/25/31 | | $ | 68,478 | | | $ | 67,106 |
Washington Mutual Pass-Through, 3.865%, 11/25/42, (12/01/08)4 | | | 239,677 | | | | 214,123 |
Washington Mutual, Series 2005-AR13, Class A1A1, 3.549%, 10/25/45, (11/25/08)4 | | | 412,732 | | | | 234,771 |
Wells Fargo Mortgage Backed Securities Trust, Series 2006-AR2, Class 2A1, 4.950%, 03/25/36 | | | 2,542,506 | | | | 1,976,651 |
Total Mortgage-Backed Securities | | | | | | | 105,832,622 |
Utilities - 0.4% | | | | | | | |
Enel Finance International SA, 6.800%, 09/15/37 (a) | | | 5,800,000 | | | | 4,122,512 |
Total Corporate Bonds (cost $621,247,174) | | | | | | | 535,821,029 |
Foreign Government and Agency Obligations - 0.3% | | | | | | | |
Export-Import Bank of China, The, 4.875%, 07/21/15 (a) | | | 300,000 | | | | 256,431 |
Export-Import Bank of Korea, 2.901%, 06/01/09, (12/01/08)4 | | | 2,700,000 | | | | 2,684,661 |
Republic of Brazil, 10.250%, 01/10/28 | | R$ | 1,250,000 | | | | 403,877 |
Total Foreign Government and Agency Obligations (cost $3,715,440) | | | | | | | 3,344,969 |
U.S. Government and Agency Obligations - 96.0% | | | | | | | |
Federal Home Loan Mortgage Corporation - 16.7% | | | | | | | |
FHLMC, 4.737%, 07/15/19 to 10/15/20, (11/15/08)4 | | | 31,624,696 | | | | 30,914,593 |
FHLMC, 4.817%, 02/15/19, (11/15/08)4 | | | 11,387,997 | | | | 11,074,240 |
FHLMC, 4.830%, 11/01/34, (09/01/09)4 | | | 3,374,740 | | | | 3,452,130 |
FHLMC, 4.875%, 06/13/18 | | | 1,900,000 | 2 | | | 1,861,924 |
FHLMC, 4.888%, 05/15/36, (11/15/08)4 | | | 1,565,503 | | | | 1,509,433 |
FHLMC, 5.000%, 02/16/17 to 12/14/18 | | | 8,950,165 | 2 | | | 8,750,560 |
FHLMC, 5.028%, 08/01/35, (08/01/15)4 | | | 376,927 | | | | 372,773 |
FHLMC, 5.088%, 09/15/30, (11/15/08)4 | | | 60,097 | | | | 59,816 |
FHLMC, 5.376%, 07/01/30, (07/01/09)4 | | | 3,661 | | | | 3,754 |
FHLMC, 5.500%, 08/01/37 | | | 3,530,628 | | | | 3,446,187 |
FHLMC, 5.500%, TBA | | | 60,000,000 | | | | 58,528,140 |
FHLMC, 6.000%, 02/01/16 to 09/01/16 | | | 200,145 | | | | 201,798 |
FHLMC, 6.500%, 01/01/26 to 08/15/31 | | | 11,265,681 | | | | 11,555,384 |
FHLMC, 7.000%, 11/15/20 | | | 32,697 | | | | 33,963 |
FHLMC, 7.500%, 08/15/30 | | | 394,866 | | | | 414,559 |
FHLMC Gold Pool, 4.500%, 02/01/14 | | | 237,275 | | | | 238,318 |
FHLMC Gold Pool, 5.500%, 04/01/37 to 09/01/38 | | | 9,987,919 | | | | 9,748,105 |
FHLMC Gold Pool, 6.000%, 05/01/16 to 10/01/38 | | | 31,134,552 | | | | 31,102,800 |
FHLMC Structured Pass Through Securities, 4.055%, 02/25/45, (12/01/08)4 | | | 201,523 | | | | 183,402 |
Total Federal Home Loan Mortgage Corporation | | | | | | | 173,451,879 |
Federal National Mortgage Association - 71.2% | | | | | | | |
FNMA, 3.319%, 12/25/36, (11/25/08)4 | | | 1,043,498 | | | | 1,007,630 |
FNMA, 3.500%, 07/01/11 | | | 486,674 | | | | 482,967 |
FNMA, 4.000%, 05/01/14 | | | 295,102 | | | | 292,448 |
FNMA, 4.055%, 07/01/44, (11/01/08)4 | | | 376,219 | | | | 372,568 |
FNMA, 4.404%, 05/01/36, (11/01/08)4 | | | 1,821,929 | | | | 1,815,124 |
The accompanying notes are an integral part of these financial statements.
14
Managers Fremont Bond Fund
Schedule of Portfolio Investments (continued)
| | | | | | | |
| | | Principal Amount | | | Value |
Federal National Mortgage Association - 71.2% (continued) | | | | | | | |
FNMA, 4.439%, 05/01/36, (11/01/08)4 | | $ | 1,026,775 | | | $ | 1,022,966 |
FNMA, 4.500%, 11/15/18 to 05/01/21 | | | 135,977 | | | | 129,570 |
FNMA, 4.500%, TBA | | | 6,000,000 | | | | 5,711,250 |
FNMA, 4.633%, 09/01/35, (08/01/10)4 | | | 3,694,876 | | | | 3,690,083 |
FNMA, 4.665%, 05/25/35 | | | 443,997 | | | | 424,586 |
FNMA, 4.830%, 06/01/35, (06/01/10)4 | | | 6,233,716 | | | | 6,230,191 |
FNMA, 5.000%, 12/01/16 to 03/01/36 | | | 95,659,032 | | | | 92,116,951 |
FNMA, 5.000%, TBA | | | 166,400,000 | | | | 157,584,354 |
FNMA, 5.066%, 05/01/35, (05/01/15)4 | | | 327,281 | | | | 321,726 |
FNMA, 5.500%, 12/01/16 to 09/01/38 | | | 118,472,839 | | | | 117,251,251 |
FNMA, 5.500%, TBA | | | 254,500,000 | | | | 248,604,874 |
FNMA, 6.000%, 04/01/16 to 05/01/38 | | | 20,775,739 | | | | 20,807,618 |
FNMA, 6.000%, TBA | | | 72,500,000 | | | | 72,451,159 |
FNMA, 6.500%, 07/01/36 to 04/01/37 | | | 2,274,762 | | | | 2,307,719 |
FNMA, 6.500%, TBA | | | 3,800,000 | | | | 3,851,657 |
FNMA Whole Loan, 6.500%, 12/25/42 | | | 359,926 | | | | 362,352 |
FNMA, 7.200%, 05/25/23 | | | 859,491 | | | | 912,456 |
Total Federal National Mortgage Association | | | | | | | 737,751,500 |
Government National Mortgage Association - 1.3% | | | | | | | |
GNMA, 5.125%, 11/20/24 to 11/20/29, (01/01/09)4 | | | 392,267 | | | | 394,211 |
GNMA, 5.375%, 04/20/21, (07/01/09)4 | | | 9,352 | | | | 9,430 |
GNMA, 5.375%, 03/20/24, (04/01/09)4 | | | 47,158 | | | | 47,378 |
GNMA, 5.625%, 08/20/25, (10/01/09)4 | | | 29,481 | | | | 29,660 |
GNMA, 6.000%, TBA | | | 3,200,000 | | | | 3,200,499 |
GNMA, 6.500%, 06/20/28 | | | 1,081,508 | | | | 1,103,240 |
GNMA, 6.750%, 10/16/40 | | | 8,583,960 | | | | 8,869,492 |
Total Government National Mortgage Association | | | | | | | 13,653,910 |
United States Treasury Securities - 6.8% | | | | | | | |
U.S. Treasury Bills, 0.10%, 11/28/087 | | | 6,500,000 | 2 | | | 6,499,506 |
U.S. Treasury Bills, 0.21%, 12/11/08 | | | 3,750,000 | 2 | | | 3,749,089 |
U.S. Treasury Bills, 0.26%, 12/26/087 | | | 15,000,000 | 2 | | | 14,993,880 |
U.S. Treasury Inflation Indexed Bonds, 1.750%, 01/15/28 | | | 12,760,102 | 2 | | | 9,978,808 |
U.S. Treasury Inflation Indexed Bonds, 2.375%, 01/15/25 | | | 14,065,403 | 2 | | | 12,186,364 |
U.S. Treasury Inflation Indexed Notes, 2.625%, 07/15/17 | | | 1,057,210 | 2 | | | 991,052 |
U.S. Treasury Inflation Indexed Notes, 3.000%, 07/15/12 | | | 22,765,941 | | | | 22,209,245 |
Total United States Treasury Securities | | | | | | | 70,607,944 |
Total U.S. Government and Agency Obligations (cost $1,015,139,375) | | | | | | | 995,465,233 |
Municipal Bonds - 1.6% | | | | | | | |
Badger Tobacco Asset Securitization Corp. (WI), 6.000%, 06/01/17 | | | 2,600,000 | | | | 2,532,036 |
Buckeye Tobacco Settlement Financing Authority (OH), Class A-2, 5.875%, 06/01/30 | | | 1,000,000 | | | | 743,320 |
The accompanying notes are an integral part of these financial statements.
15
Managers Fremont Bond Fund
Schedule of Portfolio Investments (continued)
| | | | | | | |
| | | Principal Amount | | | Value |
Municipal Bonds - 1.6% (continued) | | | | | | | |
Chicago Transit Authority, Series A (IL), 6.300%, 12/01/21 | | $ | 300,000 | | | $ | 277,110 |
Chicago Transit Authority (IL), Series A, 6.899%, 12/01/40 | | | 1,600,000 | | | | 1,447,232 |
Chicago Transit Authority (IL), Series B, 6.899%, 12/01/40 | | | 1,700,000 | | | | 1,537,684 |
Los Angeles, CA Unified School District, Series A-1, 4.500%, 07/01/22 | | | 3,600,000 | | | | 3,253,356 |
State of California, 5.000%, 06/01/32 | | | 6,600,000 | | | | 5,909,310 |
State of Texas, Transportation Commission Mobility Fund, Series A, 4.750%, 04/01/35 | | | 1,200,000 | | | | 1,057,452 |
Truckee Meadows Water Authority (NY), 5.000%, 07/01/36 | | | 200,000 | | | | 164,570 |
Total Municipal Bonds (cost $18,185,740) | | | | | | | 16,922,070 |
| | |
| Municipal Bond Funds - 0.5% | | Shares | | | |
Dreyfus Municipal Income, Inc. | | | 37,500 | | | | 255,000 |
DWS Municipal Income Trust | | | 55,000 | 2 | | | 452,650 |
MFS Municipal Income Trust | | | 53,800 | | | | 264,158 |
Nuveen Performance Plus Municipal Fund | | | 55,000 | | | | 632,500 |
Nuveen Premium Income Municipal Fund II | | | 55,000 | 2 | | | 565,400 |
Nuveen Premium Income Municipal Fund IV | | | 55,000 | | | | 508,200 |
Nuveen Quality Income Municipal Fund | | | 55,000 | | | | 641,850 |
Putnam Municipal Opportunities Trust | | | 33,648 | 2 | | | 313,936 |
Van Kampen Advantage Municipal Income Trust II | | | 61,796 | | | | 519,086 |
Van Kampen Trust for Investment Grade Municipals | | | 55,000 | | | | 556,050 |
Total Municipal Bond Funds (cost $6,544,611) | | | | | | | 4,708,830 |
Preferred Stocks - 1.2% | | | | | | | |
Bank of America Corp., 7.250% | | | 9,000 | | | | 6,300,000 |
DG Funding Trust, 6.012%, (12/31/08) (a)4 | | | 573 | | | | 5,828,484 |
Total Preferred Stocks (cost $15,037,773) | | | | | | | 12,128,484 |
| | |
Options and Swaptions - 0.4% | | | Notional Amount | | | | |
3-Month USD-LIBOR-BBA (Call), 3.150%, 12/15/08 | | $ | 209,100,000 | | | | 1,809,485 |
3-Month USD-LIBOR-BBA (Call), 3.150%, 12/15/08 | | | 15,300,000 | | | | 132,401 |
3-Month USD-LIBOR-BBA (Call), 3.150%, 02/02/09 | | | 110,400,000 | | | | 997,564 |
3-Month USD-LIBOR-BBA (Call), 3.450%, 08/03/09 | | | 6,100,000 | | | | 65,294 |
3-Month USD-LIBOR-BBA (Call), 3.500%, 02/02/09 | | | 72,900,000 | | | | 993,470 |
3-Month USD-LIBOR-BBA (Call), 3.600%, 07/07/11 | | | 16,100,000 | | | | 205,614 |
3-Month USD-LIBOR-BBA (Call), 3.850%, 08/03/09 | | | 3,700,000 | | | | 55,992 |
Total Options and Swaptions (cost $4,254,700) | | | | | | | 4,259,820 |
Short-Term Investments - 12.6% | | | | | | | |
| | |
Commercial Paper - 0.7% | | | Principal Amount | | | | |
Morgan Stanley & Co., Inc., 3.800%, 01/06/09 | | $ | 6,800,000 | | | | 6,738,271 |
| | |
Other Investment Companies - 8.5%1 | | | Shares | | | | |
Bank of New York Institutional Cash Reserve Fund, Series A, 1.07%3 | | | 74,526,210 | | | | 74,526,210 |
Bank of New York Institutional Cash Reserve Fund, Series B*3,10 | | | 643,217 | | | | 75,578 |
The accompanying notes are an integral part of these financial statements.
16
Managers Fremont Bond Fund
Schedule of Portfolio Investments (continued)
| | | | | | | |
| | | Shares | | Value | |
Other Investment Companies - 8.5% (continued) | | | | | | | |
Bank of New York Institutional Cash Reserve Fund, Series C*3,11 | | | 506,671 | | $ | 506,671 | |
Dreyfus Cash Management Fund, Institutional Class Shares, 2.84%12 | | | 13,238,610 | | | 13,238,610 | |
Total Other Investment Companies | | | | | | 88,347,069 | |
| | |
Repurchase Agreements - 3.4% | | | Principal Amount | | | | |
JPMorgan Chase & Co., dated 10/31/08, due 11/03/08, 1.90%, total to be received $35,300,441 (secured by $35,300,000 U.S. Treasury Notes, 3.500%, 02/15/18) | | $ | 35,300,000 | | | 35,300,000 | |
Total Short-Term Investments (cost $130,952,979) | | | | | | 130,385,340 | |
Total Investments - 164.3% (cost $1,815,077,792) | | | | | | 1,703,035,775 | |
Other Assets, less Liabilities - (64.3)% | | | | | | (666,531,280 | ) |
Net Assets - 100.0% | | | | | $ | 1,036,504,495 | |
Note: Based on the cost of investments of $1,819,572,785 for Federal income tax purposes at October 31, 2008, the aggregate gross unrealized appreciation and depreciation were $3,683,684 and $120,220,694, respectively, resulting in net unrealized depreciation of investments of $116,537,010.
* | Non-income-producing security. |
| (a) | Security exempt from registration under Rule 144A of the Securities Act of 1933. This security may be resold in transactions exempt from registration, normally to qualified buyers. At October 31, 2008, the value of these securities amounted to $74,694,034, or 7.2% of net assets. |
1 | Yield shown for each investment company listed represents the October 31, 2008, seven-day average yield, which refers to the sum of the previous seven days’ dividends paid, expressed as an annual percentage. |
2 | Some or all of these shares, amounting to a market value of $71,605,708, or 6.9% of net assets, were out on loan to various brokers. |
3 | Collateral received from brokers for securities lending was invested in this short-term investment. |
4 | Floating Rate Security. The rate listed is as of October 31, 2008. Date in parentheses represents the security’s next coupon rate reset. |
5 | Variable Rate Security. The rate listed is as of October 31, 2008 and is periodically reset subject to terms and conditions set forth in the debenture. |
6 | Perpetuity Bond. The date shown is the final call date. |
7 | Security held as collateral for swap contracts, amounting to a market value of $10,536,460, or 1.0% of net assets. |
8 | Illiquid Security. A security not readily convertible into cash such as a stock, bond or commodity that is not actively traded and would be difficult to sell in a current sale. The Funds may not invest more than 15% of their net assets in illiquid securities. |
9 | Security is in default. Issuer has failed to make a timely payment of either principal or interest or has failed to comply with some provision of the bond indenture. |
10 | On September 12, 2008, The Bank of New York Mellon (“BNYM”) established a separate sleeve of the Institutional Cash Reserves Fund (“ICRF”) (Series B) to hold certain Lehman Brothers floating rate notes. The Fund’s position in Series B is being marked to market daily. |
11 | On October 6, 2008, The BNYM established a separate sleeve of the ICRF (Series C) to hold certain securities issued by Whistlejacket Capital Ltd. The Fund’s position in Series C is being marked to market daily. |
12 | Under the U.S. Treasury Temporary Money Market Fund Guarantee Program, the maximum amount covered for the Fund’s investment in the Dreyfus Cash Management Fund is $794,700. |
Investment Definitions and Abbreviations:
| | |
BBA: | | British Banker’s Association |
FHLMC: | | Federal Home Loan Mortgage Corp. |
FNMA: | | Federal National Mortgage Association |
GNMA: | | Government National Mortgage Association |
LIBOR: | | London Inter-Bank Offered Rate |
TBA: | | To Be Announced |
USD: | | United States Dollar |
Abbreviations have been used throughout the portfolio to indicate amounts shown in currencies other than the U.S. dollar (USD):
€: Euro
R$: Brazilian Real
The accompanying notes are an integral part of these financial statements.
17
Managers Fremont Bond Fund
Statement of Assets and Liabilities
October 31, 2008
| | | | |
Assets: | | | | |
Investments at value* (including securities on loan valued at $71,605,708) | | $ | 1,703,035,775 | |
Cash | | | 8,804,293 | |
Foreign currency** | | | 7,086,003 | |
Receivable for delayed delivery investments sold | | | 258,741,464 | |
Receivable for Fund shares sold | | | 2,076,046 | |
Unrealized appreciation on swaps | | | 4,110,093 | |
Variation margin receivable | | | 621,505 | |
Unrealized appreciation on foreign currency contracts | | | 12,425,307 | |
Dividends, interest and other receivables | | | 7,368,358 | |
Prepaid expenses | | | 32,963 | |
| | | | |
Total assets | | | 2,004,301,807 | |
| | | | |
Liabilities: | | | | |
Payable for delayed delivery investments purchased | | | 859,060,879 | |
Payable for Fund shares repurchased | | | 3,707,792 | |
Payable upon return of securities loaned | | | 75,676,098 | |
Options written (premiums received $4,385,034) | | | 3,243,412 | |
Variation margin payable | | | 770,249 | |
Unrealized depreciation on swaps | | | 12,655,807 | |
Unrealized depreciation on foreign currency contracts | | | 11,488,763 | |
Dividends payable to shareholders | | | 392,309 | |
Accrued expenses: | | | | |
Investment advisory and management fees | | | 244,232 | |
Administrative fees | | | 177,770 | |
Other | | | 380,001 | |
| | | | |
Total liabilities | | | 967,797,312 | |
| | | | |
Net Assets | | $ | 1,036,504,495 | |
| | | | |
Shares outstanding | | | 105,260,299 | |
| | | | |
Net asset value, offering and redemption price per share | | $ | 9.85 | |
| | | | |
Net Assets Represent: | | | | |
Paid-in capital | | $ | 1,082,791,362 | |
Undistributed net investment income | | | 3,739,280 | |
Accumulated net realized gain from investments, options, futures, swaps, foreign currency contracts and transactions | | | 42,214,892 | |
Net unrealized depreciation of investments, options, futures, swaps, foreign currency contracts and translations | | | (92,241,039 | ) |
| | | | |
Net Assets | | $ | 1,036,504,495 | |
| | | | |
* Investments at cost | | $ | 1,815,077,792 | |
** Foreign currency at cost | | $ | 7,425,747 | |
The accompanying notes are an integral part of these financial statements.
18
Managers Fremont Bond Fund
Statement of Operations
For the fiscal year ended October 31, 2008
| | | | |
Investment Income: | | | | |
Interest income | | $ | 58,813,549 | |
Dividend income | | | 1,162,252 | |
Securities lending fees | | | 165,008 | |
| | | | |
Total investment income | | | 60,140,809 | |
| | | | |
Expenses: | | | | |
Investment advisory and management fees | | | 4,765,240 | |
Administrative fees | | | 2,978,275 | |
Transfer agent fees | | | 340,521 | |
Professional fees | | | 266,175 | |
Custodian fees | | | 261,724 | |
Reports to shareholders | | | 85,361 | |
Trustees fees and expenses | | | 81,808 | |
Insurance | | | 43,250 | |
Registration fees | | | 41,800 | |
Miscellaneous | | | 14,435 | |
| | | | |
Total expenses before offsets | | | 8,878,589 | |
| | | | |
Expense reimbursements | | | (1,357,687 | ) |
Fee waivers | | | (595,682 | ) |
Expense reductions | | | (14,111 | ) |
| | | | |
Net expenses | | | 6,911,109 | |
| | | | |
Net investment income | | | 53,229,700 | |
| | | | |
Net Realized and Unrealized Gain (Loss): | | | | |
Net realized gain on investments, options, futures, and swap transactions | | | 48,032,501 | |
Net realized gain on foreign currency contracts and transactions | | | 12,654,563 | |
Net unrealized depreciation of investments, options, futures, swaps, foreign currency contracts and translations | | | (113,536,012 | ) |
| | | | |
Net realized and unrealized loss | | | (52,848,948 | ) |
| | | | |
Net increase in net assets resulting from operations | | $ | 380,752 | |
| | | | |
The accompanying notes are an integral part of these financial statements.
19
Managers Fremont Bond Fund
Statement of Changes in Net Assets
For the fiscal years ended October 31,
| | | | | | | | |
| | | 2008 | | | 2007 | |
Increase (Decrease) in Net Assets From Operations: | | | | | | | | |
Net investment income | | $ | 53,229,700 | | | $ | 56,403,318 | |
Net realized gain (loss) on investments, options, futures, swaps, foreign currency contracts and transactions | | | 60,687,064 | | | | (6,920,374 | ) |
Net unrealized appreciation (depreciation) of investments, options, futures, swaps, foreign currency contracts and translations | | | (113,536,012 | ) | | | 17,679,216 | |
| | | | | | | | |
Net increase in net assets resulting from operations | | | 380,752 | | | | 67,162,160 | |
| | | | | | | | |
Distributions to Shareholders: | | | | | | | | |
From net investment income | | | (58,764,642 | ) | | | (56,156,859 | ) |
| | | | | | | | |
From Capital Share Transactions: | | | | | | | | |
Proceeds from the sale of shares | | | 442,971,996 | | | | 226,861,632 | |
Reinvestment of dividends | | | 54,573,251 | | | | 52,581,882 | |
Cost of shares repurchased | | | (609,729,159 | ) | | | (246,627,792 | ) |
| | | | | | | | |
Net increase (decrease) from capital share transactions | | | (112,183,912 | ) | | | 32,815,721 | |
| | | | | | | | |
Total increase (decrease) in net assets | | | (170,567,802 | ) | | | 43,821,022 | |
| | | | | | | | |
Net Assets: | | | | | | | | |
Beginning of year | | | 1,207,072,297 | | | | 1,163,251,275 | |
| | | | | | | | |
End of year | | $ | 1,036,504,495 | | | $ | 1,207,072,297 | |
| | | | | | | | |
End of year undistributed net investment income (loss) | | $ | 3,739,280 | | | | ($1,709,097 | ) |
| | | | | | | | |
Share Transactions: | | | | | | | | |
Sale of shares | | | 41,903,295 | | | | 22,117,028 | |
Shares issued in connection with reinvestment of dividends | | | 5,209,779 | | | | 5,134,152 | |
Shares repurchased | | | (57,793,808 | ) | | | (24,153,549 | ) |
| | | | | | | | |
Net increase (decrease) in shares | | | (10,680,734 | ) | | | 3,097,631 | |
| | | | | | | | |
The accompanying notes are an integral part of these financial statements.
20
Managers Fremont Bond Fund
Financial Highlights
For a share outstanding throughout each fiscal year
| | | | | | | | | | | | | | | | | | | | |
| | | For the fiscal year ended October 31, | |
| | | 2008 | | | 2007 | | | 2006 | | | 2005 | | | 2004 | |
Net Asset Value, Beginning of Year | | $ | 10.41 | | | $ | 10.31 | | | $ | 10.31 | | | $ | 10.79 | | | $ | 10.43 | |
| | | | | | | | | | | | | | | | | | | | |
Income from Investment Operations: | | | | | | | | | | | | | | | | | | | | |
Net investment income | | | 0.57 | | | | 0.47 | | | | 0.47 | | | | 0.37 | | | | 0.24 | |
Net realized and unrealized gain (loss) on investments | | | (0.61 | ) | | | 0.13 | | | | (0.00 | )3 | | | (0.17 | ) | | | 0.42 | |
| | | | | | | | | | | | | | | | | | | | |
Total from investment operations | | | (0.04 | ) | | | 0.60 | | | | 0.47 | | | | 0.20 | | | | 0.66 | |
| | | | | | | | | | | | | | | | | | | | |
Less Distributions to Shareholders from: | | | | | | | | | | | | | | | | | | | | |
Net investment income | | | (0.52 | ) | | | (0.50 | ) | | | (0.47 | ) | | | (0.35 | ) | | | (0.25 | ) |
Net realized gain on investments | | | — | | | | — | | | | — | | | | (0.33 | ) | | | (0.05 | ) |
| | | | | | | | | | | | | | | | | | | | |
Total distributions to shareholders | | | (0.52 | ) | | | (0.50 | ) | | | (0.47 | ) | | | (0.68 | ) | | | (0.30 | ) |
| | | | | | | | | | | | | | | | | | | | |
Net Asset Value, End of Year | | $ | 9.85 | | | $ | 10.41 | | | $ | 10.31 | | | $ | 10.31 | | | $ | 10.79 | |
| | | | | | | | | | | | | | | | | | | | |
Total Return 1 | | | (0.60 | )% | | | 5.96 | % | | | 4.75 | % | | | 2.00 | % | | | 6.45 | % |
| | | | | | | | | | | | | | | | | | | | |
Ratio of net operating expenses to average net assets | | | 0.58 | % | | | 0.60 | % | | | 0.60 | % | | | 0.60 | % | | | 0.60 | % |
Ratio of net investment income to average net assets 1 | | | 4.47 | % | | | 4.86 | % | | | 4.72 | % | | | 3.43 | % | | | 2.24 | % |
Portfolio turnover | | | 431 | % | | | 249 | % | | | 244 | % | | | 392 | % | | | 113 | % |
Net assets at end of year (000’s omitted) | | $ | 1,036,504 | | | $ | 1,207,072 | | | $ | 1,163,251 | | | $ | 971,130 | | | $ | 852,799 | |
| | | | | | | | | | | | | | | | | | | | |
Ratios absent expense offsets: 2 | | | | | | | | | | | | | | | | | | | | |
Ratio of total expenses to average net assets | | | 0.75 | % | | | 0.77 | % | | | 0.77 | % | | | 0.72 | % | | | 0.69 | % |
Ratio of net investment income to average net assets | | | 4.30 | % | | | 4.69 | % | | | 4.55 | % | | | 3.31 | % | | | 2.15 | % |
| | | | | | | | | | | | | | | | | | | | |
1 | Total returns and net investment income would have been lower had certain expenses not been reduced. (See Note 1(c) of Notes to Financial Statements.) |
2 | Excludes the impact of expense reimbursements or fee waivers and expense reductions such as brokerage credits, but includes non-reimbursable expenses, if any, such as interest and taxes. (See Note 1(c) of Notes to Financial Statements.) |
3 | Rounds to less than ($0.01) per share. |
21
Managers Fremont Bond Fund
Notes to Financial Statements
October 31, 2008
| 1. | Summary of Significant Accounting Policies |
Managers Trust I (the “Trust”) is an open-end management investment company organized as a Massachusetts business trust and registered under the Investment Company Act of 1940, as amended (the “1940 Act”). Currently, the Trust is comprised of a number of investment series. Included in this report is the Managers Fremont Bond Fund (the “Fund”).
The Fund’s financial statements are prepared in accordance with accounting principles generally accepted in the United States of America, which require management to make estimates and assumptions that affect the reported amounts of assets and liabilities and disclosure of contingent assets and liabilities at the date of the financial statements and the reported amounts of income and expenses during the reporting periods. Actual results could differ from those estimates and such differences could be material. The following is a summary of significant accounting policies followed by the Fund in the preparation of its financial statements:
| a. | Valuation of Investments |
Equity securities traded on a domestic or international securities exchange are valued at the last quoted sale price, or, lacking any sales, at the last quoted bid price. Over-the-counter securities are valued at the Nasdaq Official Closing Price, if one is available. Lacking any sales, over-the-counter securities are valued at the last quoted bid price. The Fund’s investments are generally valued based on market quotations provided by third party pricing services approved by the Board of Trustees of the Fund. Under certain circumstances, the value of certain Fund investments may be based on an evaluation of fair value, pursuant to procedures established by and under the general supervision of the Board of Trustees of the Trust. A Fund may use the fair value of a portfolio security to calculate its NAV when, for example, (1) market quotations are not readily available because a portfolio security is not traded in a public market or the principal market in which the security trades is closed, (2) trading in a portfolio security is suspended and has not resumed before the Fund calculates its NAV, (3) a significant event affecting the value of a portfolio security is determined to have occurred between the time of the market quotation provided for a portfolio security and the time as of which the Fund calculates its NAV, (4) a security’s price has remained unchanged over a period of time (often referred to as a “stale price”), or (5) the Investment Manager determines that a market quotation is inaccurate. The Investment Manager monitors intervening events that may affect the value of securities held in a Fund’s portfolio and, in accordance with procedures adopted by the Fund’s Trustees, will adjust the prices of securities traded in foreign markets, as appropriate, to reflect the impact of events occurring subsequent to the close of such markets but prior to the time each Fund’s NAV is calculated.
Fixed income securities are valued based on valuations furnished by independent pricing services that utilize matrix systems, which reflect such factors as security prices, yields, maturities, and ratings, and are supplemented by dealer and exchange quotations. Futures contracts for which market quotations are readily available are valued at the settlement price as of the close of the futures exchange. Short-term investments having a remaining maturity of 60 days or less are valued at amortized cost, which approximates market value. Investments in other open-end regulated investment companies are valued at their end of day net asset value per share. Investments in certain mortgage-backed and stripped mortgage-backed securities, preferred stocks, convertible securities, derivatives and other debt securities not traded on an organized securities market are valued on the basis of valuations provided by dealers or by a pricing service which uses information with respect to transactions in such securities and various relationships between securities and yield to maturity in determining value. Securities (including derivatives) for which market quotations are not readily available are valued at fair value, as determined in good faith, and pursuant to procedures adopted by the Board of Trustees of the Trust. The values assigned to fair value investments are based on available information and do not necessarily represent amounts that might ultimately be realized, since such amounts depend on future developments inherent in long-term investments. Further, because of the inherent uncertainty of valuation, those estimated values may differ significantly from the values that would have been used had a ready market for the investments existed, and the differences could be material.
The Fund adopted Financial Accounting Standards Board Statement of Financial Accounting Standards No. 157, Fair Value Measurements (“FAS 157”), effective November 1, 2008. In accordance with FAS 157, fair value is defined as the price that a Fund would receive to sell an asset or pay to transfer a liability in an orderly transaction between market participants at the measurement date. FAS 157 also establishes a framework for measuring fair value, and a three-level hierarchy for fair value measurements based upon the transparency of inputs to the valuation of an asset or liability. Inputs may be observable or unobservable and refer broadly to the assumptions that market participants would use in pricing the asset or liability. Observable inputs reflect the assumptions market participants would use in pricing the asset or liability based on market data obtained from sources independent of the Fund. Unobservable inputs reflect the Fund’s own assumptions about the assumptions that market participants would use in pricing the asset or liability developed based on the best information available in the circumstances. Each investment is assigned a level based upon the observability of the inputs which are significant to the overall valuation. The three-tier hierarchy of inputs is summarized below:
Level 1 – quoted prices in active markets for identical investments
Level 2 – other significant observable inputs (including quoted prices for similar investments, interest rates, prepayment speeds, credit risk)
Level 3 –significant unobservable inputs (including the Fund’s own assumptions in determining the fair value of investments)
22
Managers Fremont Bond Fund
Notes to Financial Statements (continued)
The inputs or methodologies used for valuing investments are not necessarily an indication of the risk associated with investing in those investments. The following table summarizes the inputs used to value the Fund’s net assets by the above fair value hierarchy levels as of October 31, 2008:
| | | | | | | |
Level | | Investments in
Securities | | Other Financial
Instruments* | |
Managers Fremont Bond | | | | | | | |
Level 1 | | $ | 104,602,135 | | $ | 28,594,027 | |
Level 2 | | | 1,598,433,640 | | | (6,698,451 | ) |
Level 3 | | | — | | | — | |
| | | | | | | |
Total | | $ | 1,703,035,775 | | $ | 21,895,576 | |
| | | | | | | |
| * | Other financial instruments are derivative instruments not reflected in the Schedule of Portfolio Investments, such as futures, forwards and swap contracts, which are valued at the unrealized appreciation/depreciation of the instrument. |
The following table is a reconciliation of investments in which significant unobservable inputs (Level 3) were used in determining fair value:
| | | | | | |
Balance as of October 31, 2008 | | Investments
in Securities | | Other Financial
Instruments |
Level 3 | | $ | 0 | | $ | 0 |
Security transactions are accounted for as of the trade date. Realized gains and losses on securities sold are determined on the basis of identified cost.
| c. | Investment Income and Expenses |
Dividend income is recorded on the ex-dividend date. Dividend income on foreign securities is recorded net of any withholding tax. Interest income, which includes amortization of premium and accretion of discount on debt securities, as required, is accrued as earned. Non-cash dividends included in dividend income, if any, are reported at the fair market value of the securities received. Other income and expenses are recorded on an accrual basis. Expenses that cannot be directly attributed to a fund are apportioned among the Funds in the Trust and in some cases other affiliated funds based upon their relative average net assets or number of shareholders.
The Fund has a “balance credit” arrangement with The Bank of New York Mellon (“BNYM”), the Fund’s custodian, whereby the Fund is credited with an interest factor equal to 0.75% below the effective 90-day T-Bill rate for account balances left uninvested overnight. If the T-Bill rate falls below 0.75%, no credits will be earned. These credits serve to reduce custody expenses that would otherwise be charged to the Fund. For the fiscal year ended October 31, 2008, the custodian expense was reduced by $3,284.
Overdrafts will cause a reduction of any earnings credits, computed at 2% above the Federal funds rate on the day of the overdraft. For the fiscal year ended October 31, 2008, overdraft fees equaled $1,538.
The Trust also has a balance credit arrangement with its Transfer Agent, PNC Global Investment Servicing (U.S.) Inc. (formerly PFPC, Inc.), whereby earnings credits are used to offset banking charges and other out-of-pocket expenses. For the fiscal year ended October 31, 2008, the transfer agent expense was reduced by $10,827.
Total returns and net investment income for the Fund would have been lower had certain expenses not been offset. Total expenses before offsets exclude the impact of expense reimbursements or fee waivers and expense reductions such as brokerage recapture credits, but include non-reimburseable expenses such as interest and taxes, if any.
| d. | Dividends and Distributions |
Dividends resulting from net investment income, if any, normally will be declared daily and paid monthly. Distributions of capital gains, if any, will be made on an annual basis and when required for Federal excise tax purposes. Income and capital gain distributions are determined in accordance with Federal income tax regulations, which may differ from generally accepted accounting principles. These differences are primarily due to differing treatments for losses deferred due to wash sales, equalization accounting for tax purposes, foreign currency, options, futures and market discount transactions. Permanent book and tax basis differences, if any, relating to shareholder distributions will result in reclassifications to paid-in capital. The tax character of distributions paid during the fiscal years 2008 and 2007 were as follows:
| | | | | | |
Distributions paid from: | | 2008 | | 2007 |
Ordinary income | | $ | 58,764,642 | | $ | 56,156,859 |
Short-term capital gains | | | — | | | — |
Long-term capital gains | | | — | | | — |
| | | | | | |
| | $ | 58,764,642 | | $ | 56,156,859 |
| | | | | | |
As of October 31, 2008, the components of distributable earnings (excluding unrealized appreciation/depreciation) on a tax basis consisted of:
| | | |
Capital loss carryforward | | | — |
Undistributed ordinary income | | $ | 6,702,065 |
Undistributed short-term capital gains | | | 47,678,694 |
Undistributed long-term capital gains | | | 21,446,997 |
The Fund intends to comply with the requirements under Subchapter M of the Internal Revenue Code of 1986, as amended, to distribute substantially all of its taxable income and gains to its shareholders and to meet certain diversification and income requirements with respect to investment companies. Therefore, no provision for Federal income or excise tax is included in the accompanying financial statements.
23
Managers Fremont Bond Fund
Notes to Financial Statements (continued)
Additionally, based on the Fund’s understanding of the tax rules and rates related to income, gains and transactions for the foreign jurisdictions in which it invests, the Fund will provide for foreign taxes, and where appropriate, deferred foreign taxes.
Management has analyzed the Fund’s tax positions taken on federal income tax returns for all open tax years (tax years ended October 31, 2005-2008), and has concluded that no provision for federal income tax is required in the Fund’s financial statements.
| f. | Capital Loss Carryovers |
As of October 31, 2008, the Fund had no accumulated net realized capital loss carryover from securities transactions for Federal income tax purposes.
For the fiscal year ended October 31, 2008, the Fund utilized capital loss carryover in the amount of $151,009.
The Trust’s Declaration of Trust authorizes for each series the issuance of an unlimited number of shares of beneficial interest, without par value. The Fund records sales and repurchases of its capital stock on the trade date. The cost of securities contributed to the Fund in connection with the issuance of shares is based on the valuation of those securities in accordance with the Fund’s policy on investment valuation. Dividends and distributions to shareholders are recorded on the ex-dividend date.
At October 31, 2008, certain unaffiliated shareholders of record, specifically omnibus accounts, individually held greater than 10% of the outstanding shares of the Fund as follows: 2 collectively own 40%. Transactions by these shareholders may have a material impact on the Fund.
The Fund may enter into repurchase agreements provided that the value of the underlying collateral, including accrued interest, will be equal to or exceed the value of the repurchase agreement during the term of the agreement. The underlying collateral for all repurchase agreements is held in safekeeping by the Fund’s custodian or at the Federal Reserve Bank. If the seller defaults and the value of the collateral declines, or if bankruptcy proceedings commence with respect to the seller of the security, realization of the collateral by the Fund may be delayed or limited. At October 31, 2008, the market value of repurchase agreements outstanding was $35,300,000.
| i. | Foreign Currency Translation |
The books and records of the Fund are maintained in U.S. dollars. The value of investments, assets and liabilities denominated in currencies other than U.S. dollars are translated into U.S. dollars based upon current foreign exchange rates. Purchases and sales of foreign investments, income and expenses are converted into U.S. dollars based on currency exchange rates prevailing on the respective dates of such transactions. Net realized and unrealized gain (loss) on foreign currency transactions represent: (1) foreign exchange gains and losses from the sale and holdings of foreign currencies; (2) gains and losses between trade date and settlement date on investment securities transactions and forward foreign currency exchange contracts; and (3) gains and losses from the difference between amounts of interest and dividends recorded and the amounts actually received.
The Fund does not isolate the net realized and unrealized gain or loss resulting from changes in exchange rates from the fluctuations in market prices of securities held. Such fluctuations are included with the net realized and unrealized gain or loss on investments.
| j. | Securities Transacted on a When Issued Basis |
The Fund may enter into To Be Announced (“TBA”) sale commitments to hedge its portfolio positions or to sell mortgage-backed securities it owns under delayed delivery arrangements. Proceeds of TBA sale commitments are not received until the contractual settlement date. During the time a TBA sale commitment is outstanding, equivalent deliverable securities, or an offsetting TBA purchase commitment deliverable on or before the sale commitment date, are held as “cover” for the transaction. Unsettled TBA sale commitments are valued at the current market value of the underlying securities according to the procedures described under “Valuation of Investments,” in footnote 1a above. Each contract is marked-to-market daily and the change in market value is recorded by the Fund as an unrealized gain or loss. If the TBA sale commitment is closed through the acquisition of an offsetting purchase commitment, the Fund realizes a gain or loss. If the Fund delivers securities under the commitment, the Fund realizes a gain or a loss from the sale of the securities based upon the unit price established at the date the commitment was entered into. The Fund had no TBA sale commitments outstanding as of October 31, 2008.
| 2. | Agreements and Transactions with Affiliates |
The Trust has entered into an Investment Management Agreement dated January 15, 2005, under which Managers Investment Group LLC (the “Investment Manager”), an independently managed subsidiary of Affiliated Managers Group, Inc. (“AMG”), provides or oversees investment management services to the Fund. The Investment Manager selects subadvisors for the Fund (subject to Trustee approval) and monitors each subadvisor’s investment programs and results. The Fund’s investment portfolio is managed by a portfolio manager who serves pursuant to a subadvisory agreement with the Investment Manager.
Investment management fees are paid directly by the Fund to the Investment Manager based on average daily net assets. The annual investment management fee rate, as a percentage of average daily net assets for the fiscal year ended October 31, 2008, was 0.40%.
The Trust has entered into an Administration and Shareholder Servicing Agreement under which the Investment Manager serves as the Fund’s administrator (the “Administrator”) and is responsible for all aspects of managing the Fund’s operations, including administration and shareholder services to the Fund, its shareholders, and certain institutions, such as bank trust departments, broker-dealers and registered investment advisers, that advise or act as an intermediary with the Fund’s shareholders. For its services, the Administrator is paid a fee at a rate of 0.25% per annum. For the fiscal year ended October 31, 2008, the Administrator voluntarily agreed to waive 0.05% of its fee amounting to $595,655. During the fiscal year ended October 31, 2008, the Fund paid administration fees of $2,382,620, net of waivers.
24
Managers Fremont Bond Fund
Notes to Financial Statements (continued)
Effective June 9, 2008, the Investment Manager has contractually agreed, through at least March 1, 2009, to limit net annual fund operating expenses (exclusive of brokerage costs, acquired fund fees and expenses, interest, taxes and extraordinary expenses) to 0.58% of average daily net assets of the Fund. Prior to June 9, 2008, the Fund had a contractual expense limitation of 0.60%. Furthermore, Managers voluntarily agreed to reimburse additional expenses incurred by the Fund as of June 9, 2008 in the amount of $152,092.
As of January 15, 2005, the Fund is obligated to repay the Investment Manager such amounts waived, paid or reimbursed in future years provided that the repayment occurs within thirty-six (36) months after the waiver or reimbursement and that such repayment would not cause the Fund’s expenses in any such year to exceed the previously stated contractual expense limitation percentages of that Fund’s average daily net assets. For the fiscal year ended October 31, 2008, the Fund made no such repayments to the Investment Manager. At October 31, 2008, the cumulative amount of reimbursement by the Investment Manager subject to repayment by the Fund equaled $3,909,187.
Prior to July 1, 2007, the aggregate annual retainer paid to each Independent Trustee was $55,000, plus $4,000 or $2,000 for each regular or special meeting attended, respectively. Effective July 1, 2007, the aggregate annual retainer paid to each Independent Trustee is $65,000, plus $4,000 or $2,500 for each regular or special meeting attended, respectively. The Trustees’ fees and expenses are allocated amongst all of the Funds for which the Investment Manager serves as the advisor (the “Managers Funds”) based on the relative net assets of such Funds. The Independent Chairman of the Trusts receives an additional payment of $15,000 per year. (Prior to July 1, 2007, the Independent Chairman received an additional payment of $10,000 per year). The Chairman of the Audit Committee receives an additional payment of $5,000 per year. (Prior to July 1, 2007, the Chairman of the Audit Committee received an additional payment of $2,000 per year). The “Trustees fees and expenses” shown in the financial statements represents the Fund’s allocated portion of the total fees and expenses paid by the Fund and other affiliated funds in the Managers Funds.
The Funds are distributed by Managers Distributors, Inc. (“MDI”), a wholly-owned subsidiary of the Investment Manager. MDI serves as the principal underwriter for each Fund and is a registered broker-dealer and member of the Financial Industry Regulatory Authority, Inc. (“FINRA”). Shares of each Fund will be continuously offered and will be sold by brokers, dealers or other financial intermediaries who have executed selling agreements with MDI. MDI bears all the expenses of providing services pursuant to the Underwriting Agreement, including the payment of the expenses relating to the distribution of Prospectuses for sales purposes and any advertising or sales literature. Certain Trustees and Officers of the Funds are Officers and/or Directors of the Investment Manager, AMG and/or MDI.
| 3. | Purchases and Sales of Securities |
Purchases and sales of securities, excluding short-term securities, for the fiscal year ended October 31, 2008, were $8,566,945,941 and $8,470,470,122, respectively. Purchases and sales of U.S. Government securities for the fiscal year ended October 31, 2008, were $8,365,443,920 and $8,276,102,222, respectively.
| 4. | Portfolio Securities Loaned |
The Fund may participate in a securities lending program offered by BNYM, providing for the lending of securities to qualified brokers. Securities lending fees include earnings of such temporary cash investments, plus or minus any rebate to a borrower. These earnings (after any rebate) are then divided between BNYM, as a fee for its services under the program, and the Fund, according to agreed-upon rates. Collateral on all securities loaned is accepted in cash and/or government securities and is maintained at a minimum level of 102% (105% in the case of certain foreign securities) of the market value, plus interest, if applicable, of investments on loan. Collateral received in the form of cash is invested temporarily in the BNYM Institutional Cash Reserves Fund (the “ICRF”), or other short-term investments as defined in the Securities Lending Agreement with BNYM.
In September and October of 2008, BNYM advised the Investment Manager that the ICRF had exposure to certain defaulted debt obligations, and that BNYM had established separate sleeves of the ICRF to hold these securities. The net impact of these positions is not material to the Fund. The Fund’s position in the separate sleeves of the ICRF Fund is included in the Schedule of Investments and the unrealized loss on such investment is included in Net Unrealized Depreciation on the Statement of Assets and Liabilities and Statement of Operations.
| 5. | Commitments and Contingencies |
In the normal course of business, the Fund may enter into contracts and agreements that contain a variety of representations and warranties, which provide general indemnifications. The maximum exposure to the Fund under these arrangements is unknown, as this would involve future claims that may be made against the Fund that have not yet occurred. However, based on experience, the Fund expects the risk of loss to be remote.
Certain transactions, such as futures and forward transactions, dollar roll agreements, or purchases of when-issued or delayed delivery securities may have a similar effect on the Fund’s net asset value as if the Fund had created a degree of leverage in its portfolio. However, if the Fund enters into such a transaction, the Fund will establish a segregated account with its custodian in which it will maintain cash, U.S. government securities or other liquid securities equal in value to its obligations in respect to such transaction. Securities and other assets held in the segregated account may not be sold while the transaction is outstanding, unless other suitable assets are substituted.
| 7. | Futures Contracts Held or Issued |
The Fund may purchase or sell futures contracts to achieve a desired level of investment, whether to accommodate portfolio turnover or cash flows from capital shares transactions. There are certain risks associated with futures contracts. Prices may not move as expected or the Fund may not be able to close out the contract when it desires to do so, resulting in losses.
25
Managers Fremont Bond Fund
Notes to Financial Statements (continued)
Futures are valued at their quoted daily settlement prices. The aggregate principal amounts of the contracts are not recorded in the financial statements. Daily fluctuations in the value of the contracts are recorded in the Statement of Assets and Liabilities as an asset (liability) and in the Statement of Operations as unrealized appreciation (depreciation) until the contracts are closed, when they are recorded as realized gains (losses) on futures or forward currency contracts.
At October 31, 2008, the Fund had the following open futures contracts:
| | | | | | | | | | |
Type | | Number of
Contracts | | Position | | Expiration Date | | Unrealized
Gain/(Loss) | |
3-Month Eurodollar | | 5,917 | | Long | | 12/15/08-09/13/10 | | $ | 22,321,601 | |
3-Month Euro Euribor | | 176 | | Long | | 12/15/08-06/15/09 | | | 1,157,998 | |
3-Month Pound Sterling | | 1,017 | | Long | | 12/17/08-12/16/09 | | | 5,020,221 | |
5-Year U.S. Treasury Note | | 27 | | Long | | 12/31/08 | | | (34,172 | ) |
| | | | | | | | | | |
Total | | | | | | | | $ | 28,465,648 | |
| | | | | | | | | | |
| 8. | Interest Rate Caps, Swap Contracts and Options |
The Fund may enter into over-the-counter transactions involving interest rate caps, swap contracts, or purchased and written (sell) options to enter into such contracts, in order to manage interest rate risk. In an interest rate cap agreement, one party agrees to make payments only under specified circumstances, usually in return for payment of a fee by the other party. An interest rate cap entitles the purchaser, to the extent that a specified index exceeds a predetermined interest rate, to receive payments of interest on a notional principal amount from the party selling such interest rate cap. Swap contracts represent an agreement between counterparties to exchange cash flows based on the difference between two rates applied to a notional principal amount for a specified period. The most common type of interest rate swap involves the exchange of fixed-rate cash flows for variable-rate cash flows. Swaps do not involve the exchange of principal between the parties. Purchased options on swap contracts (“swaptions”) give the holder the right, but not the obligation, to enter into a swap contract with the counterparty which has written the option on a date, at an interest rate, and with a notional amount as specified in the swaption agreement. If the counterparty to the swap transaction defaults, the Fund will be limited to contractual remedies pursuant to the agreements governing the transaction. There is no assurance that swap or swaption contract counterparties will be able to meet their obligations under the contracts or that, in the event of default, the Fund will succeed in pursuing contractual remedies. The Fund may thus assume the risk that payments owed the Fund under a swap or swaption contract will be delayed, or not received at all. During the term of the swap agreement or swaption, unrealized gains or losses are recorded as a result of “marking to market.” When the swap agreement or swaption is terminated, the Fund will record a realized gain or loss equal to the difference between the proceeds from (or cost of) the closing transaction and the Fund’s basis in the contract, if any. Accrued interest and interest paid are recognized as unrealized and realized gain (loss), respectively. In each of the contracts, the Fund pays a premium, to the counterparty, in return for the swaption. These swaptions may be exercised by entering into a swap contract with the counterparty only on the date specified in each contract. The fund also sold credit protection through credit default swaps. Under the terms of the swaps, the seller of the credit protection receives a periodic payment amount (premium) from the buyer that is a fixed percentage amount applied to a notional principal amount. In return, the seller agrees to pay the buyer the notional amount and take delivery of a debt instrument of the reference issuer of the same notional par amount if the reference entity is subject to a credit event (such as bankruptcy, failure to pay, or obligation acceleration) during the term of the swap.
At October 31, 2008, the Fund had the following open swap contracts:
| | | | | | | | | | | | |
Pay | | Receive | | Counterparty | | Maturity | | Notional Amount | | Unrealized
Gain/(Loss) |
Interest Rate Swaps | | | | | | | | | | | | |
3-Month Australian Bank Bill Rate | | Fixed Rate 7.000% | | UAG | | 06/15/10 | | A$ | 37,500,000 | | $ | 481,742 |
3-Month Australian Bank Bill Rate | | Fixed Rate 7.500% | | UAG | | 03/15/10 | | A$ | 2,300,000 | | | 39,878 |
3-Month USD-LIBOR-BBA | | Fixed Rate 4.000% | | RYL | | 06/17/10 | | $ | 15,800,000 | | | 193,180 |
3-Month USD-LIBOR-BBA | | Fixed Rate 4.000% | | MYC | | 06/17/10 | | $ | 11,600,000 | | | 141,828 |
3-Month USD-LIBOR-BBA | | Fixed Rate 4.000% | | BRC | | 12/16/10 | | $ | 2,700,000 | | | 22,429 |
3-Month USD-LIBOR-BBA | | Fixed Rate 4.000% | | MLC | | 12/17/10 | | $ | 11,100,000 | | | 265,326 |
6-Month Australian Bank Bill Rate | | Fixed Rate 7.000% | | DUB | | 03/20/13 | | A$ | 2,200,000 | | | 66,612 |
6-Month Australian Bank Bill Rate | | Fixed Rate 7.500% | | UAG | | 03/15/11 | | A$ | 14,800,000 | | | 419,216 |
6-Month EUR-EURIBOR-Reuters | | Fixed Rate 4.500% | | BPS | | 03/18/14 | | € | 2,200,000 | | | 59,356 |
26
Managers Fremont Bond Fund
Notes to Financial Statements (continued)
| | | | | | | | | | | | | |
Pay | | Receive | | Counterparty | | Maturity | | Notional Amount | | Unrealized
Gain/(Loss) | |
6-Month France CPI Excl. Tobacco Index | | Fixed Rate 1.950% | | RYL | | 03/30/12 | | € | 1,200,000 | | $ | 16,614 | |
6-Month France CPI Excl. Tobacco Index | | Fixed Rate 1.955% | | RYL | | 03/28/12 | | € | 1,000,000 | | | 14,365 | |
6-Month France CPI Excl. Tobacco Index | | Fixed Rate 1.960% | | GLM | | 03/30/12 | | € | 800,000 | | | 12,528 | |
6-Month France CPI Excl. Tobacco Index | | Fixed Rate 1.960% | | BRC | | 04/05/12 | | € | 400,000 | | | 5,200 | |
6-Month France CPI Excl. Tobacco Index | | Fixed Rate 2.103% | | BRC | | 10/15/10 | | € | 3,900,000 | | | 135,998 | |
6-Month France CPI Excl. Tobacco Index | | Fixed Rate 2.146% | | UAG | | 10/15/10 | | € | 1,000,000 | | | 35,522 | |
6-Month GBP-LIBOR-BBA | | Fixed Rate 5.000% | | FBF | | 06/15/09 | | £ | 1,000,000 | | | 4,805 | |
6-Month GBP-LIBOR-BBA | | Fixed Rate 5.000% | | BRC | | 06/15/09 | | £ | 5,000,000 | | | 24,026 | |
6-Month GBP-LIBOR-BBA | | Fixed Rate 5.000% | | GLM | | 06/15/09 | | £ | 9,800,000 | | | 47,091 | |
6-Month GBP-LIBOR-BBA | | Fixed Rate 5.000% | | GLM | | 09/17/13 | | £ | 500,000 | | | 12,287 | |
6-Month GBP-LIBOR-BBA | | Fixed Rate 5.000% | | HUS | | 09/17/13 | | £ | 2,900,000 | | | 71,266 | |
6-Month GBP-LIBOR-BBA | | Fixed Rate 5.000% | | DUB | | 03/18/14 | | £ | 3,100,000 | | | 96,039 | |
6-Month GBP-LIBOR-BBA | | Fixed Rate 5.000% | | DUB | | 03/18/14 | | £ | 9,000,000 | | | 278,822 | |
6-Month GBP-LIBOR-BBA | | Fixed Rate 5.250% | | RYL | | 03/18/14 | | £ | 1,500,000 | | | 72,842 | |
6-Month GBP-LIBOR-BBA | | Fixed Rate 5.250% | | GLM | | 03/18/14 | | £ | 600,000 | | | 29,137 | |
6-Month GBP-LIBOR-BBA | | Fixed Rate 6.000% | | BRC | | 12/20/08 | | £ | 8,300,000 | | | (3,873 | ) |
6-Month GBP-LIBOR-BBA | | Fixed Rate 6.000% | | DUB | | 12/20/08 | | £ | 5,000,000 | | | (2,333 | ) |
6-Month GBP-LIBOR-BBA | | Fixed Rate 6.000% | | RYL | | 03/20/09 | | £ | 4,400,000 | | | (4,195 | ) |
6-Month GBP-LIBOR-BBA | | Fixed Rate 6.000% | | BRC | | 03/20/09 | | £ | 4,700,000 | | | (4,481 | ) |
6-Month GBP-LIBOR-BBA | | Fixed Rate 6.000% | | RYL | | 06/19/09 | | £ | 6,600,000 | | | 98,037 | |
6-Month GBP-LIBOR-BBA | | Fixed Rate 6.000% | | GLM | | 06/19/09 | | £ | 23,400,000 | | | 347,587 | |
6-Month GBP-LIBOR-BBA | | Fixed Rate 6.000% | | GLM | | 12/19/09 | | £ | 2,400,000 | | | 84,370 | |
Fixed Rate 0.710% | | USD Swap Spread Semi 5 YR | | BPS | | 02/05/09 | | $ | 4,800,000 | | | (30,830 | ) |
Fixed Rate 0.7625% | | USD Swap Spread Semi 2 YR | | BPS | | 02/05/09 | | $ | 9,700,000 | | | (82,982 | ) |
Fixed Rate 4.000% | | 6-Month GBP-LIBOR-BBA | | MLC | | 12/15/35 | | £ | 1,100,000 | | | 22,047 | |
Fixed Rate 4.000% | | 6-Month GBP-LIBOR-BBA | | BRC | | 12/15/36 | | £ | 1,200,000 | | | 98,687 | |
Fixed Rate 4.000% | | 6-Month GBP-LIBOR-BBA | | RYL | | 12/15/36 | | £ | 3,500,000 | | | 287,836 | |
Fixed Rate 4.000% | | 6-Month GBP-LIBOR-BBA | | HUS | | 12/15/36 | | £ | 1,900,000 | | | 156,254 | |
Fixed Rate 4.000% | | 6-Month GBP-LIBOR-BBA | | DUB | | 12/15/36 | | £ | 1,300,000 | | | 106,910 | |
Fixed Rate 5.000% | | 3-Month USD-LIBOR-BBA | | MYC | | 12/17/38 | | $ | 1,700,000 | | | (144,984 | ) |
Fixed Rate 5.000% | | 3-Month USD-LIBOR-BBA | | MLC | | 12/17/38 | | $ | 5,300,000 | | | (452,010 | ) |
Fixed Rate 5.000% | | 3-Month USD-LIBOR-BBA | | CBK | | 12/17/38 | | $ | 4,400,000 | | | (375,254 | ) |
Fixed Rate 5.000% | | 3-Month USD-LIBOR-BBA | | BOA | | 12/17/38 | | $ | 15,600,000 | | | (1,330,446 | ) |
Fixed Rate 5.000% | | 3-Month USD-LIBOR-BBA | | RYL | | 12/17/38 | | $ | 10,800,000 | | | (921,078 | ) |
Fixed Rate 5.000% | | 3-Month USD-LIBOR-BBA | | MLC | | 12/17/23 | | $ | 6,500,000 | | | (334,231 | ) |
Fixed Rate 5.000% | | 3-Month USD-LIBOR-BBA | | MYC | | 12/17/28 | | $ | 1,200,000 | | | (81,209 | ) |
Fixed Rate 5.000% | | 3-Month USD-LIBOR-BBA | | RYL | | 12/17/28 | | $ | 1,700,000 | | | (115,046 | ) |
Fixed Rate 5.000% | | 3-Month USD-LIBOR-BBA | | BOA | | 12/17/28 | | $ | 71,300,000 | | | (4,825,185 | ) |
Fixed Rate 5.000% | | 6-Month GBP-LIBOR-BBA | | GLM | | 12/19/37 | | £ | 300,000 | | | (54,595 | ) |
Fixed Rate 5.500% | | 3-Month GBP-LIBOR-BBA | | BRC | | 12/17/18 | | £ | 11,900,000 | | | (499,153 | ) |
Fixed Rate 5.500% | | 6-Month GBP-LIBOR-BBA | | GLM | | 12/15/36 | | £ | 1,600,000 | | | (475,422 | ) |
Fixed Rate 5.500% | | 6-Month GBP-LIBOR-BBA | | RYL | | 12/15/36 | | £ | 400,000 | | | (118,855 | ) |
27
Managers Fremont Bond Fund
Notes to Financial Statements (continued)
| | | | | | | | | | | | | |
Pay | | Receive | | Counterparty | | Maturity | | Notional Amount | | Unrealized
Gain/(Loss) | |
Fixed Rate 6.500% | | 6-Month Australian Bank Bill Rate | | DUB | | 03/20/18 | | A$ | 3,000,000 | | | ($39,232 | ) |
ICAP CMM FRA Fixing Rate | | Fixed Rate 5.000% | | MLC | | 02/20/09 | | $ | 3,300,000 | | | 257,240 | |
ICAP CMM FRA Fixing Rate | | Fixed Rate 5.500% | | MLC | | 05/21/09 | | $ | 4,000,000 | | | 105,016 | |
Credit Default Swaps | | | | | | | | | | | | | |
Federative Republic of Brazil Bond | | Fixed Rate 1.520% | | MYC | | 01/20/17 | | $ | 3,000,000 | | | (196,632 | ) |
Federative Republic of Brazil Bond | | Fixed Rate 1.950% | | MYC | | 08/20/16 | | $ | 3,500,000 | | | (140,153 | ) |
Petroleos Mexicanos Bond | | Fixed Rate 0.620% | | BRC | | 08/20/11 | | $ | 3,500,000 | | | (243,863 | ) |
Republic of Panama Bond | | Fixed Rate 1.250% | | JPM | | 01/20/17 | | $ | 200,000 | | | (29,574 | ) |
Russian Federation Bond | | Fixed Rate 0.495% | | BRC | | 08/20/11 | | $ | 3,500,000 | | | (648,668 | ) |
Ukraine Government Bond | | Fixed Rate 0.710% | | BRC | | 12/20/08 | | $ | 2,000,000 | | | (68,948 | ) |
Zero Coupon Swaps | | | | | | | | | | | | | |
Brazil Interbank Deposit Rate | | Fixed Rate 10.575% | | UAG | | 01/02/12 | | R$ | 6,700,000 | | | (394,025 | ) |
Brazil Interbank Deposit Rate | | Fixed Rate 11.360% | | BRC | | 01/04/10 | | R$ | 5,500,000 | | | (108,922 | ) |
Brazil Interbank Deposit Rate | | Fixed Rate 11.430% | | MLC | | 01/04/10 | | R$ | 3,600,000 | | | (68,710 | ) |
Brazil Interbank Deposit Rate | | Fixed Rate 11.465% | | GLM | | 01/04/10 | | R$ | 1,400,000 | | | (26,232 | ) |
Brazil Interbank Deposit Rate | | Fixed Rate 11.980% | | MLC | | 01/02/12 | | R$ | 5,800,000 | | | (234,215 | ) |
Brazil Interbank Deposit Rate | | Fixed Rate 12.410% | | UAG | | 01/04/10 | | R$ | 2,800,000 | | | (26,949 | ) |
Brazil Interbank Deposit Rate | | Fixed Rate 12.540% | | UAG | | 01/02/12 | | R$ | 3,400,000 | | | (116,975 | ) |
Brazil Interbank Deposit Rate | | Fixed Rate 12.540% | | BRC | | 01/02/12 | | R$ | 3,400,000 | | | (116,975 | ) |
Brazil Interbank Deposit Rate | | Fixed Rate 12.540% | | MLC | | 01/02/12 | | R$ | 7,300,000 | | | (251,152 | ) |
Brazil Interbank Deposit Rate | | Fixed Rate 12.670% | | MYC | | 01/04/10 | | R$ | 2,800,000 | | | (26,724 | ) |
Brazil Interbank Deposit Rate | | Fixed Rate 12.780% | | MYC | | 01/04/10 | | R$ | 5,000,000 | | | (29,365 | ) |
Brazil Interbank Deposit Rate | | Fixed Rate 12.948% | | MLC | | 01/04/10 | | R$ | 2,100,000 | | | (8,577 | ) |
Brazil Interbank Deposit Rate | | Fixed Rate 14.765% | | HUS | | 01/02/12 | | R$ | 300,000 | | | (4,751 | ) |
Brazil Interbank Deposit Rate | | Fixed Rate 14.765% | | MLC | | 01/02/12 | | R$ | 1,200,000 | | | (19,003 | ) |
| | | | | | | | | | | | | |
Total | | | | | | | | | | | ($ | 8,545,714 | ) |
| | | | | | | | | | | | | |
A$: Australian Dollar
R$: Brazilian Real
£: British Pound
€: Euro
$: U.S. Dollar
BOA: Bank of America
BPS: BNP Paribas
BRC: Barclays Bank
CBK: Citibank
DUB: Deutsche Bank
FBF: Credit Suisse
GLM: Goldman Sachs
HUS: HSBC Bank
JPM: JPMorgan Chase
MLC: Merrill Lynch
MYC: Morgan Stanley
RYL: Royal Bank of Scotland
UAG: UBS
For the fiscal year ended October 31, 2008, the Fund paid and received premiums of $57,684,809 and $56,010,736, respectively, on swap contracts. At October 31, 2008, the unrealized depreciation (excluding premiums) on open swap contracts was $10,219,787.
A written option contract is a contract in which the writer of the option grants the buyer of the option the right to purchase from (call option) or sell to (put option) the writer a designated instrument at a specified price within a specified period of time. Options written (sold) are recorded as liabilities. When an option expires, the premium (original option value) is realized as a gain if the option was written or as a loss if the option was purchased. When the exercise of an option results in a cash settlement, the difference between the premium and the settlement proceeds is recognized as realized gain or loss. When securities are acquired or delivered upon exercise of an option, the acquisition cost or sale proceeds are adjusted by the amount of the premium. When an option is closed, the difference between the premium and the cost to close the position is realized as a gain or loss.
28
Managers Fremont Bond Fund
Notes to Financial Statements (continued)
At October 31, 2008, the following written options and swaptions were outstanding:
| | | | | | | | | | | |
Name | | Number of
Contracts/Par | | Exercise
Price | | | Expiration
Date | | Value | |
FLR EUR CMS 10-02 0.75% (Call) | | 2,100,000 | | 0.75 | % | | 12/24/08 | | $ | 22,655 | |
3-Month USD-LIBOR-BBA (Call) | | 7,000,000 | | 4.20 | % | | 07/02/09 | | | (3,616 | ) |
3-Month USD-LIBOR-BBA (Call) | | 36,800,000 | | 4.25 | % | | 02/02/09 | | | 392,524 | |
3-Month USD-LIBOR-BBA (Call) | | 9,200,000 | | 4.30 | % | | 02/02/09 | | | (20,885 | ) |
3-Month USD-LIBOR-BBA (Call) | | 69,900,000 | | 4.30 | % | | 12/15/08 | | | 551,283 | |
3-Month USD-LIBOR-BBA (Call) | | 5,100,000 | | 4.30 | % | | 12/15/08 | | | 48,668 | |
3-Month USD-LIBOR-BBA (Call) | | 2,100,000 | | 4.40 | % | | 08/03/09 | | | 12,244 | |
3-Month USD-LIBOR-BBA (Call) | | 1,200,000 | | 4.55 | % | | 08/03/09 | | | (891 | ) |
3-Month USD-LIBOR-BBA (Call) | | 17,100,000 | | 4.60 | % | | 02/02/09 | | | 11,261 | |
10-Year U.S. Treasury Notes (Put) | | 72 | | 110.00 | | | 11/21/08 | | | 29,914 | |
10-Year U.S. Treasury Notes (Put) | | 93 | | 113.00 | | | 11/21/08 | | | (56,451 | ) |
10-Year U.S. Treasury Notes (Call) | | 72 | | 115.00 | | | 11/21/08 | | | 7,976 | |
10-Year U.S. Treasury Notes (Call) | | 106 | | 117.00 | | | 11/21/08 | | | 103,188 | |
10-Year U.S. Treasury Notes (Call) | | 93 | | 119.00 | | | 11/21/08 | | | 43,752 | |
| | | | | | | | | | | |
Total | | 150,500,436 | | | | | | | $ | 1,141,622 | |
| | | | | | | | | | | |
Transactions in written put and call options for the fiscal year ended October 31, 2008, were as follows:
| | | | | | | |
| | | Number of
Contracts | | | Amount of
Premiums | |
Options outstanding at October 31, 2007 | | 213,700,605 | | | $ | 2,676,498 | |
Options written | | 150,502,451 | | | | 6,285,210 | |
Options exercised/expired | | (213,702,620 | ) | | | (4,576,674 | ) |
| | | | | | | |
Options outstanding at October 31, 2008 | | 150,500,436 | | | $ | 4,385,034 | |
| | | | | | | |
| 9. | Forward Foreign Currency Contracts |
During the fiscal year ended October 31, 2008, the Fund invested in forward foreign currency exchange contracts to manage currency exposure. These investments may involve greater market risk than the amounts disclosed in the Fund’s financial statements.
A forward foreign currency exchange contract is an agreement between a Fund and another party to buy or sell a currency at a set price at a future date. The market value of the contract will fluctuate with changes in currency exchange rates. The contract is marked-to-market daily, and the change in market value is recorded as an unrealized gain or loss. Gain or loss on the purchase or sale of contracts having the same settlement date, amount and counterparty is realized on the date of offset, otherwise gain or loss is realized on the settlement date.
The Fund may invest in non-U.S. dollar denominated instruments subject to limitations, and enter into forward foreign currency exchange contracts to facilitate transactions in foreign securities and to protect against a possible loss resulting from an adverse change in the relationship between the U.S. dollar and such foreign currency. Risks may arise upon entering into these contracts from the potential inability of counterparties to meet the terms of their contracts and from unanticipated movements in the value of a foreign currency relative to the U.S. dollar.
29
Managers Fremont Bond Fund
Notes to Financial Statements (continued)
Open forward foreign currency exchange contracts (in U.S. Dollars) at October 31, 2008, were as follows:
| | | | | | | | | | | | | | |
Foreign Currency | | Settlement Date | | Contract Value
(Receivable) | | Contract Value
(Payable) | | Unrealized
Gain/Loss | |
Brazilian Real | | Short | | 12/02/08 | | $ | 37,139,145 | | $ | 30,105,969 | | $ | 7,033,176 | |
Brazilian Real | | Long | | 12/02/08 | | | 35,734,846 | | | 41,319,813 | | | (5,584,967 | ) |
Chillian Peso | | Long | | 12/10/08 | | | 389,989 | | | 542,379 | | | (152,390 | ) |
Chinese Yuan Renminbi | | Short | | 11/13/08 | | | 2,817,816 | | | 2,819,381 | | | (1,565 | ) |
Chinese Yuan Renminbi | | Long | | 07/15/09-11/13/09 | | | 13,380,160 | | | 14,032,748 | | | (652,588 | ) |
Euro | | Short | | 12/04/08 | | | 18,432,960 | | | 18,661,081 | | | (228,121 | ) |
Indian Rupee | | Short | | 11/12/08 | | | 4,077,909 | | | 3,993,944 | | | 83,965 | |
Indian Rupee | | Long | | 11/12/08-04/09/09 | | | 7,315,948 | | | 8,075,469 | | | (759,521 | ) |
Indonesian Rupiah | | Long | | 03/31/09 | | | 706,611 | | | 765,515 | | | (58,904 | ) |
Japanese Yen | | Short | | 11/05/08 | | | 1,084,189 | | | 1,080,530 | | | 3,659 | |
Japanese Yen | | Long | | 11/05/08 | | | 2,162,234 | | | 2,188,538 | | | (26,304 | ) |
Malaysian Ringgit | | Short | | 11/12/08-02/12/09 | | | 2,606,054 | | | 2,595,631 | | | 10,423 | |
Malaysian Ringgit | | Long | | 11/12/08-04/14/09 | | | 6,402,977 | | | 6,843,233 | | | (440,256 | ) |
Philippine Peso | | Short | | 11/12/08-12/24/10 | | | 2,192,370 | | | 2,137,024 | | | 55,346 | |
Philippine Peso | | Long | | 11/12/08-12/24/10 | | | 5,772,328 | | | 6,171,014 | | | (398,686 | ) |
Pound Sterling | | Short | | 11/03/08-12/09/08 | | | 60,059,076 | | | 55,986,271 | | | 4,072,805 | |
Pound Sterling | | Long | | 11/03/08-11/05/08 | | | 39,812,799 | | | 41,261,188 | | | (1,448,389 | ) |
Russian Ruble | | Short | | 11/19/08-05/06/09 | | | 5,147,326 | | | 4,219,321 | | | 928,005 | |
Russian Ruble | | Long | | 11/19/08-05/06/09 | | | 4,219,321 | | | 5,049,366 | | | (830,045 | ) |
Singapore Dollar | | Short | | 11/21/08-01/16/09 | | | 10,332,458 | | | 10,256,334 | | | 76,124 | |
Singapore Dollar | | Long | | 11/21/08-04/14/09 | | | 16,768,696 | | | 17,524,276 | | | (755,580 | ) |
South African Rand | | Short | | 12/10/08 | | | 196,074 | | | 158,134 | | | 37,940 | |
South African Rand | | Long | | 12/10/08 | | | 158,133 | | | 185,716 | | | (27,583 | ) |
| | | | | | | | | | | | | | |
Total | | | | | | $ | 276,909,419 | | $ | 275,972,875 | | $ | 936,544 | |
| | | | | | | | | | | | | | |
| 10. | Risks Associated with Collateralized Mortgage Obligations (“CMOs”) |
The net asset value of the Fund may be sensitive to interest rate fluctuations because the Fund may hold several instruments, including CMOs and other derivatives, whose values can be significantly impacted by interest rate movements. CMOs are obligations collateralized by a portfolio of mortgages or mortgage-related securities. Payments of principal and interest on the mortgage are passed through to the holder of the CMOs on the same schedule as they are received, although certain classes of CMOs have priority over others with respect to the receipt of prepayments on the mortgages.
Therefore, the investment in CMOs may be subject to a greater or lesser risk of prepayment than other types of mortgage-related securities. CMOs may have a fixed or variable rate of interest.
| 11. | Dollar Roll Transactions |
The Fund may enter into dollar rolls in which it sells debt securities for delivery currently and simultaneously contracts to repurchase similar, but not identical, securities at the same price or a lower price on an agreed date. The Fund receives compensation as consideration for entering into the commitment to repurchase. The compensation is the difference between the current sale price and the forward price for the future price (often referred to as the “drop”) as well as the interest earned on the cash proceeds of the initial sale. The Fund may also be compensated by the receipt of a commitment fee. As the holder, the counterparty receives all principal and interest payments, including prepayments, made with respect to the similar security. Dollar rolls may be renewed with a new sale and repurchase price with a cash settlement made at renewal without physical delivery of the securities subject to the contract.
30
Managers Fremont Bond Fund
Notes to Financial Statements (continued)
Certain risks may arise upon entering into dollar rolls from the potential inability of counterparties to meet the terms of their commitments. Additionally, the value of such securities may change adversely before the Fund is able to repurchase them. There can be no assurance that the Fund’s use of the cash that it receives from a dollar roll will provide a return that exceeds its costs.
Tax Information (unaudited)
The Fund hereby designates the maximum amount allowable of its net taxable income as qualified dividends as provided in the Jobs and Growth Tax Relief Reconciliation Act of 2003. The 2008 Form 1099-DIV you receive for the Fund will show the tax status of all distributions paid to you during the year.
Pursuant to section 852 of the Internal Revenue Code, Managers Fremont Bond hereby designates $21,446,997 as a capital gain distribution with respect to the taxable year ended October 31, 2008, or if subsequently determined to be different, the net capital gains of such year.
31
Report of Independent Registered Public Accounting Firm
To the Board of Trustees of Managers Trust I and the Shareholders of Managers Fremont Bond Fund:
In our opinion, the accompanying statement of assets and liabilities, including the schedule of portfolio investments, and the related statements of operations and of changes in net assets and the financial highlights present fairly, in all material respects, the financial position of Managers Fremont Bond Fund (one of the series constituting Managers Trust I, hereafter referred to as the “Fund”) at October 31, 2008, the results of its operations for the year then ended, the changes in its net assets for each of two years in the period then ended and the financial highlights for the each of the five years in the period then ended, in conformity with accounting principles generally accepted in the United States of America. These financial statements and financial highlights (hereafter referred to as “financial statements”) are the responsibility of the Fund’s management; our responsibility is to express an opinion on these financial statements based on our audits. We conducted our audits of these financial statements in accordance with the standards of the Public Company Accounting Oversight Board (United States). Those standards require that we plan and perform the audit to obtain reasonable assurance about whether the financial statements are free of material misstatement. An audit includes examining, on a test basis, evidence supporting the amounts and disclosures in the financial statements, assessing the accounting principles used and significant estimates made by management, and evaluating the overall financial statement presentation. We believe that our audits, which included confirmation of securities at October 31, 2008 by correspondence with the custodian and brokers, provide a reasonable basis for our opinion.
PricewaterhouseCoopers LLP
Philadelphia, Pennsylvania
December 23, 2008
32
Trustees and Officers
The Trustees and Officers of the Trust, their business addresses, principal occupations for the past five years and dates of birth are listed below. The Trustees provide broad supervision over the affairs of the Trust and the Funds. The Trustees are experienced executives who meet periodically throughout the year to oversee the Funds’ activities, review contractual arrangements with companies that provide services to the Funds, and review the Funds’ performance. Unless otherwise noted, the address of each Trustee or Officer is the address of the Trust: 800 Connecticut Avenue, Norwalk, Connecticut 06854.
There is no stated term of office for Trustees. Trustees serve until their resignation, retirement or removal in accordance with the Trust’s organizational documents and policies adopted by the Board from time to time. The Chairman of the Trustees, President, Treasurer and Secretary of the Trust are elected by the Trustees annually. Other officers hold office at the pleasure of the Trustees.
Independent Trustees
The following Trustees are not “interested persons” of the Trust within the meaning of the 1940 Act:
| | |
Name, Date of Birth, Number
of Funds Overseen in Fund
Complex* | | Principal Occupation(s) During Past 5 Years and Other Directorships Held by Trustee |
| |
Jack W. Aber, 9/9/37 • Trustee since 2000 • Oversees 32 Funds in Fund Complex | | Professor of Finance, Boston University School of Management (1972-Present); Trustee of Appleton Growth Fund (1 portfolio); Trustee of Third Avenue Trust (4 portfolios); Trustee of Third Avenue Variable Trust (1 portfolio). |
| |
William E. Chapman, II, 9/23/41 • Independent Chairman • Trustee since 2000 • Oversees 32 Funds in Fund Complex | | President and Owner, Longboat Retirement Planning Solutions (1998-Present); Hewitt Associates, LLC (part time) (provider of Retirement and Investment Education Seminars); Trustee of Bowdoin College (2002-Present); Trustee of Third Avenue Trust (4 portfolios); Trustee of Third Avenue Variable Trust (1 portfolio). |
| |
Edward J. Kaier, 9/23/45 • Trustee since 2000 • Oversees 32 Funds in Fund Complex | | Attorney at Law and Partner, Teeters Harvey Gilboy & Kaier LLP (2007-Present); Attorney at Law and Partner, Hepburn Willcox Hamilton & Putnam, LLP (1977-2007); Trustee of Third Avenue Trust (4 portfolios); Trustee of Third Avenue Variable Trust (1 portfolio). |
| |
Steven J. Paggioli, 4/3/50 • Trustee since 2000 • Oversees 32 Funds in Fund Complex | | Consultant (2001-Present); Formerly Executive Vice President and Director, The Wadsworth Group (1986-2001); Executive Vice President, Secretary and Director, Investment Company Administration, LLC (1990-2001); Vice President, Secretary and Director, First Fund Distributors, Inc. (1991-2001); Trustee, Professionally Managed Portfolios (22 portfolios); Advisory Board Member, Sustainable Growth Advisors, LP. Independent Director, Chase Investment Counsel (2008 – Present). |
| |
Eric Rakowski, 6/5/58 • Trustee since 2000 • Oversees 32 Funds in Fund Complex | | Professor, University of California at Berkeley School of Law (1990-Present); Trustee of Third Avenue Trust (4 portfolios); Trustee of Third Avenue Variable Trust (1 portfolio). |
| |
Thomas R. Schneeweis, 5/10/47 • Trustee since 2000 • Oversees 32 Funds in Fund Complex | | Professor of Finance, University of Massachusetts (1977-Present); Director, CISDM at the University of Massachusetts, (1996-Present); President, Alternative Investment Analytics, LLC, (formerly Schneeweis Partners, LLC) (2001-Present); Partner, White Bear Partners, LLC (2007-Present); Partner, Schneeweis Capital Management, LLC (2007-Present); Partner, Schneeweis Associates, LLC (2007-Present); Partner, Northampton Capital Management, LLC (2004-Present); Partner, TRS Associates (2007-Present). |
| * | The Fund Complex consists of Managers AMG Funds, The Managers Funds, Managers Trust I and Managers Trust II. |
Interested Trustees
The following Trustees are “interested persons” of the Trust within the meaning of the 1940 Act. Mr. Dalton is an interested person by virtue of his positions with, and interest in securities of, Affiliated Managers Group, Inc. Mr. Streur is an interested person by virtue of his positions with Managers Investment Group LLC.
| | |
Name, Date of Birth, Number
of Funds Overseen in Fund
Complex* | | Principal Occupation(s) During Past 5 Years and Other Directorships Held by Trustee |
Nathaniel Dalton, 9/29/66 • Trustee since 2008 • Oversees 32 Funds in Fund Complex | | Executive Vice President and Chief Operating Officer, Affiliated Managers Group, Inc., (2006-Present); Executive Vice President, Affiliated Managers Group, Inc., ( 2002-2006); Executive Vice President and General Counsel, Affiliated Managers Group, Inc. (2001-2002); Senior Vice President and General Counsel, Affiliated Managers Group, Inc. (1996-2001). Director, Managers Distributors, Inc. (2000-Present). |
| |
John H. Streur, 2/6/60 • Trustee since 2008 • President since 2008 • Oversees 32 Funds in Fund Complex | | Senior Managing Partner, Managers Investment Group LLC (2006-Present); President, Managers Distributors, Inc. (2006 to President); Managing Partner, Managers Investment Group LLC (2005-2006); Chief Executive Officer, President and Chief Operating Officer, The Burridge Group LLC (1996-2004). |
Officers
| | |
Name, Date of Birth, Position(s) Held with Fund
and Length of Time Served | | Principal Occupation(s) During Past 5 Years |
| |
Christine C. Carsman, 4/2/52 • Secretary since 2004 | | Senior Vice President and Chief Regulatory Counsel, Affiliated Managers Group, Inc. (2004-Present); Secretary, The Managers Funds, Managers AMG Funds and Managers Trust II (2004-Present); Senior Counsel, Vice President and Director of Operational Risk Management and Compliance, Wellington Management Company, LLP (1995-2004); Deputy General Counsel, The Boston Company, Inc. (1993-1995); Associate General Counsel, The Boston Company Advisors, Inc. (1991-1993); Associate, Sullivan & Worcester LLP (1987-1991). |
| |
Donald S. Rumery, 5/29/58 • Chief Financial Officer since 2007 • Treasurer since 2000 | | Senior Vice President, Managers Investment Group LLC (2005-Present); Director, Finance and Planning, The Managers Funds LLC, (1994-2004); Treasurer and Chief Financial Officer, Managers Distributors, Inc. (2000-Present); Treasurer, The Managers Funds (1995-Present); Treasurer, Managers AMG Funds (1999-Present); Treasurer, Managers Trust II (2000-Present); Secretary, Managers Trust I and Managers Trust II (2000-2004) and Secretary, The Managers Funds (1997-2004); Chief Financial Officer, The Managers Funds, Managers AMG Funds and Managers Trust II (2007-Present). |
| |
Keitha L. Kinne, 5/16/58 • Chief Operating Officer since 2007 | | Managing Partner and Chief Operating Officer, Managers Investment Group LLC (2007-Present); Chief Operating Officer, The Managers Funds, Managers AMG Funds and Managers Trust II (2007-Present); Managing Director, Legg Mason & Co., LLC (2006-2007); Managing Director, Citigroup Asset Management (2004-2006); Senior Vice President, Prudential Investments (1999-2004). |
33
Annual Renewal of Investment Advisory Agreements
On June 6, 2008, the Board of Trustees, including a majority of the Trustees who are not “interested persons” of the Trust (the “Independent Trustees”), approved the Investment Management Agreement with the Investment Manager for the Fremont Bond Fund (the “Fund”) and the Subadvisory Agreement for the Subadvisor of the Fund. The Independent Trustees were separately represented by independent counsel in connection with their consideration of the approval of these agreements. In considering the Investment Management and Subadvisory Agreements, the Trustees reviewed a variety of materials relating to the Fund, the Investment Manager and the Subadvisor, including comparative performance, fee and expense information for an appropriate peer group of similar mutual funds (the “Peer Group”), performance information for the relevant benchmark index (the “Fund Benchmark”) and other information regarding the nature, extent and quality of services provided by the Investment Manager and the Subadvisor under their respective agreements. The Trustees also took into account information on the services provided by the Investment Manager and the Subadvisor (including information provided at meetings held on May 15-16 and June 5-6, 2008), as well as performance, fee and expense information regarding the Fund provided to them on a quarterly basis throughout the year. Prior to voting, the Independent Trustees: (a) reviewed the foregoing information with their independent legal counsel and with management; (b) received materials from their independent legal counsel discussing the legal standards applicable to their consideration of the Investment Management Agreement and the Subadvisory Agreement; and (c) met with their independent legal counsel in private sessions at which no representatives of management were present.
Nature, extent and quality of services.
In considering the nature, extent and quality of the services provided by the Investment Manager, the Trustees reviewed information relating to the Investment Manager’s operations and personnel. Among other things, the Investment Manager provided financial information, biographical information on its supervisory and professional staff and descriptions of its organizational and management structure. The Trustees also took into account information provided periodically throughout the previous year by the Investment Manager relating to the performance of its duties with respect to the Fund and the Trustees’ familiarity with the Investment Manager’s management through Board meetings, discussions and reports. In the course of their deliberations regarding the Investment Management Agreement, the Trustees evaluated, among other things: (a) the extent and quality of the Investment Manager’s oversight of the operation and management of the Fund; (b) the quality of the search, selection and monitoring services performed by the Investment Manager in overseeing the portfolio management responsibilities of the Subadvisor; (c) the Investment Manager’s ability to supervise the Fund’s other service providers; and (d) the Investment Manager’s compliance programs. The Trustees also took into account the financial condition of the Investment Manager with respect to its ability to provide the services required under the Investment Management Agreement and to maintain a contractual expense limitation for the Fund.
The Trustees also reviewed information relating to the Subadvisor’s operations and personnel and the investment philosophy, strategies and techniques (the “Investment Strategy”) used in managing the Fund. Among other things, the Trustees reviewed biographical information on portfolio management and other professional staff, information regarding the Subadvisor’s organizational and management structure and the Subadvisor’s brokerage policies and practices. The Trustees considered specific information provided regarding the experience of the individual or individuals at the Subadvisor with portfolio management responsibility for the Fund, including the information set forth in the Fund’s prospectus and statement of additional information. In the course of their deliberations, the Trustees evaluated, among other things: (a) the services rendered by the Subadvisor in the past; (b) the qualifications and experience of the Subadvisor’s personnel; and (c) the Subadvisor’s compliance programs. The Trustees also took into account the financial condition of the Subadvisor with respect to its ability to provide the services required under the Subadvisory Agreement.
Performance.
Among other information relating to the Fund’s performance, the Trustees noted that the Fund’s performance for the 1-year, 3-year, 5-year and 10-year periods ended March 31, 2008 was above the median performance of the Peer Group and above the performance of the Fund Benchmark, the Lehman Brothers U.S. Aggregate Bond Index, for each period. The Trustees concluded that the Fund’s performance has been satisfactory.
As noted above, the Board considered the Fund’s performance during relevant time periods as compared to the Fund’s Peer Group and noted that the Board reviews on a quarterly basis detailed information about the Fund’s performance results, portfolio composition and Investment Strategies. The Board noted the Investment Manager’s expertise and resources in monitoring the performance, investment style and risk-adjusted performance of the Subadvisor. The Board was mindful of the Investment Manager’s attention to monitoring the Subadvisor’s performance with respect to the Fund and its discussions with management regarding the factors that contributed to the performance of the Fund.
Advisory Fees and Profitability.
In considering the reasonableness of the advisory fee charged by the Investment Manager for managing the Fund, the Trustees noted that the Investment Manager, and not the Fund, is responsible for paying the fees charged by the Fund’s Subadvisor and, therefore, that the fees paid to the Investment Manager cover the cost of providing portfolio management services as well as the cost of providing search, selection and monitoring services in operating a “manager-of-managers” complex of mutual funds. The Trustees concluded that, in light of the additional high quality supervisory services provided by the Investment Manager and the fact that the subadvisory fees are paid out of the advisory fee, the advisory fee payable by the Fund to the Investment Manager can reasonably be expected to exceed the median advisory fee for the Peer Group, which consists of many funds that do not operate with a manager-of-managers structure. In this regard, the Trustees also noted that the Investment Manager has undertaken to maintain an expense limitation for the Fund.
In considering the reasonableness of the advisory fee payable to the Investment Manager, the Trustees also reviewed information provided by the Investment Manager setting forth all revenues and other benefits, both direct and indirect, received by the Investment Manager and its affiliates attributable to managing the Fund and all the mutual
34
Annual Renewal of Investment Advisory Agreements (continued)
funds in the Managers Family of Funds, the cost of providing such services and the resulting profitability to the Investment Manager and its affiliates from these relationships. The Trustees also noted the current and potential asset levels of the Fund and the willingness of the Investment Manager to waive fees and pay expenses for the Fund from time to time as a means of limiting the total expenses of the Fund. The Board took into account management’s discussion of the current advisory fee structure. In this regard, the Trustees noted that, unlike a mutual fund that is managed by a single investment adviser, the Fund operates in a manager-of-managers structure and, as the Fund grows in size, it is common practice for the Investment Manager to recommend the selection of an additional Subadvisor to manage a portion of the Fund’s portfolio. The Trustees also noted that the subadvisory fees are paid by the Investment Manager out of its advisory fee. The Trustees further noted that, because of this practice, the Investment Manager’s oversight and supervisory responsibilities with respect to the Fund can be expected to increase with the size of the Fund. Based on the foregoing, the Trustees concluded that the profitability to the Investment Manager is reasonable and that the Investment Manager is not realizing material benefits from economies of scale that would warrant adjustments to the advisory fees for the Fund at this time. With respect to economies of scale, the Trustees also noted that as the Fund’s assets increase over time, the Fund may realize other economies of scale to the extent that the increase in assets is proportionally greater than the increase in certain other expenses.
The Trustees noted that the Fund’s advisory fee and total expenses (net of applicable expense waivers/reimbursements) as of March 31, 2008 were higher and lower, respectively, than the average for the Peer Group. The Trustees took into account the fact that the Investment Manager has contractually agreed, through March 1, 2009, to limit the Fund’s net annual operating expenses to 0.58%. The Trustees concluded that, in light of the nature, extent and quality of the services provided by the Investment Manager and the Subadvisor, the Fund’s performance, the foregoing expense limitation and the considerations noted above with respect to the Subadvisor and the Investment Manager, the Fund’s advisory fees are reasonable.
Subadvisory Fees and Profitability.
In considering the reasonableness of the fee payable by the Investment Manager to the Subadvisor, the Trustees relied on the ability of the Investment Manager to negotiate the terms of the Subadvisory Agreement at arm’s length as part of the manager-of-managers structure, noting that the Subadvisor is not affiliated with the Investment Manager. In addition, the Trustees noted that the subadvisory fees are paid by the Investment Manager out of its advisory fee. Accordingly, the cost of services to be provided by the Subadvisor and the profitability to the Subadvisor of its relationship with the Fund were not material factors in the Trustees’ deliberations. For similar reasons, and based on the current size of the portion of the Fund managed by the Subadvisor, the Trustees concluded that any economies of scale being realized by the Subadvisor was not a material factor in the Trustees’ deliberations at this time.
* * * *
After consideration of the foregoing, the Trustees also reached the following conclusions regarding the Investment Management Agreement and the Subadvisory Agreement, in addition to those conclusions discussed above: (a) the Investment Manager and the Subadvisor have demonstrated that they possess the capability and resources to perform the duties required of them under the Investment Management Agreement and the Subadvisory Agreement; (b) the Subadvisor’s Investment Strategy is appropriate for pursuing the Fund’s investment objectives; (c) the Subadvisor is reasonably likely to execute its Investment Strategy consistently over time; and (d) the Investment Manager and the Subadvisor maintain appropriate compliance programs.
Based on all of the above-mentioned factors and related conclusions, with no single factor or conclusion being determinative and with each Trustee not necessarily attributing the same weight to each factor, the Trustees concluded that approval of the Investment Management Agreement and the Subadvisory Agreement would be in the best interests of the Fund and its shareholders. Accordingly, on June 6, 2008, the Trustees, including a majority of the Independent Trustees, voted to approve the Investment Management Agreement and the Subadvisory Agreement for the Fund’s Subadvisor.
35
Investment Manager and Administrator
Managers Investment Group LLC
800 Connecticut Avenue
Norwalk, Connecticut 06854
(203) 299-3500 or (800) 835-3879
Distributor
Managers Distributors, Inc.
800 Connecticut Avenue
Norwalk, Connecticut 06854
(203) 299-3500 or (800) 835-3879
Custodian
The Bank of New York Mellon
2 Hanson Place
Brooklyn, New York 11217
Legal Counsel
Ropes & Gray LLP
One International Place
Boston, Massachusetts 02110-2624
Transfer Agent
PNC Global Investment Servicing (U.S.) Inc.
Attn: Managers
P.O. Box 9769
Providence, Rhode Island 02940
(800) 548-4539
For Managers Choice Only
Managers
c/o PNC Global Investment Servicing (U.S.) Inc.
P.O. Box 61204
King of Prussia, Pennsylvania 19406-0851
(800) 358-7668

MANAGERSAND MANAGERS AMG FUNDS
Equity Funds
EMERGING MARKETS EQUITY
Rexiter Capital Management Limited
ESSEX GROWTH
ESSEX LARGE CAP GROWTH
ESSEX SMALL/MICRO CAP GROWTH
Essex Investment Management Co., LLC
FQ TAX-MANAGED U.S. EQUITY
FQ U.S. EQUITY
First Quadrant, L.P.
GW&K MULTI-CAP EQUITY
Gannet Welsh & Kotler, LLC
INSTITUTIONAL MICRO-CAP
MICRO-CAP
Lord, Abbett & Co. LLC
WEDGE Capital Management L.L.P.
OFI Institutional Asset Management, Inc.
Next Century Growth Investors LLC
INTERNATIONAL EQUITY
AllianceBernstein L.P.
Lazard Asset Management, LLC
Wellington Management Company, LLP
CHICAGO EQUITY PARTNERS MID-CAP
Chicago Equity Partners, LLC
REAL ESTATE SECURITIES
Urdang Securities Management, Inc.
SKYLINE SPECIAL EQUITIES PORTFOLIO
Skyline Asset Management, L.P.
SMALL CAP
TIMESSQUARE MID CAP GROWTH
TIMESSQUARE SMALL CAP GROWTH
TimesSquare Capital Management, LLC
SPECIAL EQUITY
Ranger Investment Management, L.P.
Lord, Abbett & Co. LLC
Skyline Asset Management, L.P.
Smith Asset Management Group, L.P.
Federated MDTA LLC
Westport Asset Management, Inc.
SYSTEMATIC VALUE
SYSTEMATIC MID CAP VALUE
Systematic Financial Management, L.P.
BALANCED FUNDS
CHICAGO EQUITY PARTNERS BALANCED
Chicago Equity Partners, LLC
GLOBAL
AllianceBernstein L.P.
First Quadrant, L.P.
Wellington Management Company, LLP
ALTERNATIVE FUNDS
FQ GLOBAL ALTERNATIVES
First Quadrant, L.P.
INCOME FUNDS
BOND (MANAGERS)
FIXED INCOME
GLOBAL BOND
Loomis, Sayles & Co., L.P.
BOND (MANAGERS FREMONT)
Pacific Investment Management Co. LLC
CALIFORNIA INTERMEDIATE TAX-FREE
Miller Tabak Asset Management LLC
GW&K MUNICIPAL ENHANCED YIELD
Gannet Welsh & Kotler, LLC
HIGH YIELD
J.P. Morgan Investment Management LLC
INTERMEDIATE DURATION GOVERNMENT
SHORT DURATION GOVERNMENT
Smith Breeden Associates, Inc.
MONEY MARKET
JPMorgan Investment Advisors Inc.
This report is prepared for the Fund’s shareholders. It is authorized for distribution to prospective investors only when preceded or accompanied by an effective prospectus. To receive a free copy of the prospectus or Statement of Additional Information, which includes additional information about Fund Trustees, please contact us by calling 800.835.3879. Distributed by Managers Distributors, Inc., member FINRA.
A description of the policies and procedures each Fund uses to vote its proxies is available: (i) without charge, upon request, by calling 800.835.3879, or (ii) on the Securities and Exchange Commission’s (SEC) Web site at www.sec.gov. For information regarding each Fund’s proxy voting record for the 12-month period ended June 30, call 800.835.3879 or visit the SEC Web site at www.sec.gov.
The Fund files its complete schedule of portfolio holdings with the SEC for the first and third quarters of each fiscal year on Form N-Q. The Fund’s Forms N-Q are available on the SEC’s website at www.sec.gov. A Fund’s Forms N-Q may be reviewed and copied at the SEC’s Public Reference Room in Washington, DC. Information on the operation of the Public Reference Room may be obtained by calling 1-800-SEC-0330. To review a complete list of the Fund’s portfolio holdings, or to view the most recent quarterly holdings report, semiannual report, or annual report, please visit www.managersinvest.com.
www.managersinvest.com


ANNUAL REPORT
Managers Funds
October 31, 2008
Managers Fremont Global Fund
Managers Small Cap Fund
Managers Fremont Micro-Cap Fund
Managers Fremont Institutional Micro-Cap Fund
Managers Real Estate Securities Fund
Managers California Intermediate Tax-Free Fund

AR022-1008
Managers Funds
Annual Report — October 31, 2008
| | |
TABLE OF CONTENTS | | Page |
| |
LETTER TO SHAREHOLDERS | | 1 |
| |
ABOUT YOUR FUNDS’ EXPENSES | | 3 |
| |
INVESTMENT MANAGERS’ COMMENTS, FUND SNAPSHOTS, AND SCHEDULES OF PORTFOLIO INVESTMENTS | | |
| |
Managers Fremont Global Fund | | 4 |
| |
Managers Small Cap Fund | | 13 |
| |
Managers Fremont Micro-Cap Fund | | 18 |
| |
Managers Fremont Institutional Micro-Cap Fund | | 26 |
| |
Managers Real Estate Securities Fund | | 34 |
| |
Managers California Intermediate Tax-Free Fund | | 38 |
| |
NOTES TO SCHEDULES OF PORTFOLIO INVESTMENTS | | 44 |
| |
FINANCIAL STATEMENTS: | | |
| |
Statements of Assets and Liabilities | | 45 |
Funds’ balance sheets, net asset value (NAV) per share computations and cumulative undistributed amounts | | |
| |
Statements of Operations | | 46 |
Detail of sources of income, Fund expenses, and realized and unrealized gains (losses) during the fiscal year | | |
| |
Statements of Changes in Net Assets | | 47 |
Detail of changes in Fund assets for the past two fiscal years | | |
| |
FINANCIAL HIGHLIGHTS | | 49 |
Historical net asset values per share, distributions, total returns, expense ratios, turnover ratios and net assets | | |
| |
NOTES TO FINANCIAL STATEMENTS | | 52 |
Accounting and distribution policies, details of agreements and transactions with Fund management and affiliates, and descriptions of certain investment risks | | |
| |
REPORT OF INDEPENDENT REGISTERED PUBLIC ACCOUNTING FIRM | | 59 |
| |
TRUSTEES AND OFFICERS | | 60 |
| |
ANNUAL RENEWAL OF INVESTMENT ADVISORY AGREEMENTS | | 61 |
Nothing contained herein is to be considered an offer, sale or solicitation of an offer to buy shares of The Managers Funds or Managers AMG Funds. Such offering is made only by Prospectus, which includes details as to offering price and other material information.
Letter to Shareholders
Dear Shareholder:
As has been well documented, the financial markets were under significant pressure during a majority of the one-year period ending October 31, 2008. The year began with investors focused on the U.S. housing crisis and eventually shifted toward concerns about a broader credit crisis both in the U.S. and abroad. Despite these fears and a difficult beginning to the year, bonds generally rose in the early part of 2008 as interest rates fell. The economy, however, began to weaken further towards the end of the second quarter as investors’ concerns over surging commodity prices, continuing fallout from the credit crisis, slowing economic growth, and declining corporate profits took center stage.
Volatility remained high during July and August as major headlines in the news included reports of falling energy and commodity prices along with higher-than-expected economic growth. This was countered by further contraction in housing, weakness in the labor markets, tighter credit conditions, and uncertainty about the stability of Fannie Mae and Freddie Mac. The months of July and August proved to be the calm before the storm, as the number of events significantly affecting the markets in September greatly outnumbered any other period in recent memory. September included the U.S. Treasury’s bailout of mortgage agencies Fannie Mae and Freddie Mac as well as insurer AIG. In addition, market turmoil extended to money markets where interbank lending rates soared to record highs, as banks hoarded cash. In October, Congress approved a $700 billion “bailout” called the Troubled Asset Relief Program (TARP) with the goal of opening up credit markets by buying distressed assets.
Equity losses were dramatic as a result of the market turmoil. For the one-year period, the Russell 1000® (large cap), Russell 2000® (small cap), Russell 3000® (all cap), and the Russell MicroCap® Indexes returned -36.80%, -34.16%, -36.60%, and -39.30%, respectively. International stocks underperformed their domestic counterparts as the MSCI EAFE Index returned - -46.62% in U.S. Dollar terms, due in part to the strengthening of the U.S. Dollar during this period. Over the same time period, REITs also underperformed domestic U.S. equities as the Dow Jones Wilshire REIT Index returned -41.48%. Fixed income securities in the U.S. and abroad were not immune to recent financial events, either as the Barclays Capital U.S. Aggregate Index and the Barclays Capital Global Aggregate Index yielded mixed results, returning 0.30% and -2.57%, respectively. Within the fixed income markets, U.S. Treasuries were, however, solid performers amid the flight to quality returning 7.76%. U.S. investment-grade corporate bonds, on the other hand, were pummeled in the limited-liquidity environment and returned - -13.82%, as evidenced by the return of the Barclays Capital US Corporate Investment Grade Index.
Against this backdrop, the Managers Fremont Global Fund, Managers Small Cap Fund, Managers Fremont Micro-Cap Fund, Managers Fremont Institutional Micro-Cap Fund, Managers Real Estate Fund, and the Managers California Intermediate Tax-Free Fund (each a “Fund” and collectively the “Funds”), generated mostly disappointing absolute returns in this challenging environment, as detailed below.
| | | | | | | | | | | | | | | | | | | | |
Periods Ended 10/31/08 | | 6 Months | | | 1 Year | | | 3 Years | | | 5 Years | | | 10 Years | | | Since
Inception | | | Inception
Date |
Managers Fremont Global Fund | | (33.69 | )% | | (38.66 | )% | | (6.58 | )% | | (0.46 | )% | | 0.98 | % | | 5.25 | % | | 11/18/1988 |
65% MSCI World/35% Barclays Capital Global Aggregate Index | | (26.73 | )% | | (29.61 | )% | | (1.74 | )% | | 2.86 | % | | 2.36 | % | | N/A | | | 11/18/1988 |
Managers Small Cap Fund | | (24.63 | )% | | (34.58 | )% | | (3.20 | )% | | 1.67 | % | | 5.10 | % | | 3.48 | % | | 9/24/1997 |
Russell 2000® Growth Index | | (27.63 | )% | | (37.87 | )% | | (5.31 | )% | | (0.13 | )% | | 1.63 | % | | (0.55 | )% | | 9/24/1997 |
Managers Real Estate Securities Fund | | (34.91 | )% | | (38.95 | )% | | (5.26 | )% | | 5.54 | % | | 8.14 | % | | 5.45 | % | | 12/31/1997 |
Dow Jones Wilshire REIT Index | | (36.86 | )% | | (41.48 | )% | | (7.02 | )% | | 4.58 | % | | 8.92 | % | | 6.37 | % | | 12/31/1997 |
Managers California Intermediate Tax-Free Fund | | (3.45 | )% | | (1.82 | )% | | 2.15 | % | | 2.74 | % | | 3.51 | % | | 4.99 | % | | 11/16/1990 |
Barclays Capital Municipal Bond: 5 Year | | (0.05 | )% | | 3.33 | % | | 3.67 | % | | 2.94 | % | | 4.22 | % | | N/A | | | 11/16/1990 |
For the fiscal year ended October 31, 2008, the Managers Fremont Global Fund returned -38.66% compared with a return of -29.61% for its benchmark, which consists of 65% of the return of the MSCI World Index and 35% of the return of the Barclays Global Aggregate Index. The Fund’s recent performance difficulties have hurt the Fund’s long-term track record, and it now trails the Index in most time periods. The absolute and relative underperformance this fiscal year was driven by both the equity and fixed income portions of the Fund. On the equity side, weak stock selection within the more economically sensitive areas of the market, such as the consumer discretionary and financial sectors, was to blame for the underperformance. The fixed income portion of the Fund, managed by Loomis Sayles & Company, L.P., generated weak performance relative to its benchmark primarily because of an overweight in corporate positions in the U.S., U.K., and European bond markets.
1
Letter to Shareholders (continued)
For the fiscal year ended October 31, 2008, the Managers Small Cap Fund returned -34.58%, outperforming the Russell 2000® Growth Index, which returned -37.87%. As detailed in the above table, the Fund’s returns also exceed those of the benchmark on a three-, five- and ten-year basis as well as since inception. Absolute returns during the last fiscal year were quite poor, but the Fund did outperform its benchmark on a relative basis due to its focus on well-managed businesses possessing less risk. For the most recent 12-month period, the primary driver of the relative outperformance was strong stock selection within several sectors including information technology, consumer discretionary, telecommunications services and industrials. The Fund did, however, experience poor results in the energy sector.
For the fiscal year ended October 31, 2008, the Managers Fremont Micro-Cap Fund returned -39.37% and the Managers Fremont Institutional Micro-Cap Fund returned -40.45%, compared to a return of -39.30% for the Russell MicroCap® Index. Both Funds’ returns were basically in line with that of the Index over the trailing fiscal year, but have held up much better over the trailing three-year time period. While absolute returns this fiscal year have been disappointing, performance versus the benchmark has been strong since the Funds’ restructuring to a multi-manager, multi-style approach earlier this year. The Funds’ underweighting to the financials sector, which rebounded somewhat from its very weak performance earlier in the year, detracted most from the Funds’ relative performance during the latter portion of this period. However, the Funds benefited from good stock selection, relatively speaking, across a number of different sectors including the consumer discretionary and information technology sectors.
For the fiscal year ended October 31, 2008, the Managers Real Estate Fund returned -38.95% compared to -41.48% for its benchmark, the Dow Jones Wilshire REIT Index. Recent strong relative outperformance has improved the Fund’s long-term record and it has now outperformed the Index on a three- and five-year basis. The REIT market depreciated significantly during the last fiscal year and the Fund, which invests primarily in REITs, followed suit. However, the Fund did outperform the Index as a result of favorable stock and advantageous sector selection relative to the Index. Early in the fiscal year, solid stock selection was driven by apartment REITS and a holding of Nationwide Health Properties, a health care REIT. Towards the latter portion of the fiscal year, relative performance of the Fund was mixed, as good stock selection within the several sectors was mitigated by weak stock selection within the regional mall, office, and hotel sectors. Solid sector selection continued to contribute to the Fund’s relative performance, as the Portfolio benefited from an underweight to the industrial and hotel sectors and an overweight to the health care and triple-net-lease sectors.
For the fiscal year ended October 31, 2008, the Managers California Intermediate Tax-Free Fund returned -1.82%, compared with 3.33% for its benchmark, the Barclays Capital 5-Year Municipal Bond Index. The last 12 months have hurt the Fund’s relative performance record, but it still compares very favorably to peers over longer time periods. The Fund’s relative underperformance for the fiscal year can be mostly attributed to its overweight position in municipals maturing longer than five years. Investors favored the safety of shorter-term bonds, which put pressure on the middle and end of the municipal bond yield curve. Relative performance was also hurt by significant exposure to high-rated, insured bonds. Several monoline insurers were downgraded this year and investors fled high-rated insured bonds because many felt the insurance was meaningless and, typically, the underlying issuer was of lower quality. The Fund’s relative performance was somewhat aided by the overall high credit quality of the Fund’s portfolio.
Looking forward, there is little doubt that the global economy faces significant headwinds and a potentially painful recessionary environment. Global growth has slowed markedly as a result of the severe credit crisis and the gradual thawing of liquidity will need to occur at a more rapid pace before we can realistically conceive of a recovery. The unprecedented monetary and fiscal response of both governments and central banks worldwide will inevitably help ease the crisis, although there is always a lag time before stimulus brings results. We continue to remind investors that the bottom of a market is virtually impossible to predict and markets tend to move to the positive quickly after they have hit a bottom. This tendency for quick rebounds is all the more reason to continue investing with your long-term goals in mind and ignore short-term market movements, as difficult as that may be in a period such as this.
The following report covers the one-year period ended October 31, 2008. Should you have any questions about this report, or if you’d like to receive a prospectus and additional information, including fees and expenses for these or any of the other Funds in our family, please feel free to contact us at 1-800-835-3879, or visit our Web site at www.managersinvest.com. As always, please read the prospectus carefully before you invest or send money.
If you are curious about how you can better diversify your investment program, visit the Knowledge Center on our Web site and view our articles in the investment strategies section. You can rest assured that under all market conditions our team is focused on delivering excellent investment management services for your benefit.
We thank you for your continued confidence and investment in the Managers Funds.
Respectfully,

John H. Streur
Senior Managing Partner
Managers Investment Group LLC
2
About Your Fund’s Expenses
As a shareholder of a Fund, you may incur two types of costs: (1) transaction costs, which may include sales charges (loads) on purchase payments; redemption fees; and exchange fees; and (2) ongoing costs, including management fees; distribution (12b-1) fees; and other Fund expenses. This example is intended to help you understand your ongoing costs (in dollars) of investing in the Fund and to compare these costs with the ongoing costs of investing in other mutual funds. The example is based on $1,000 invested at the beginning of the period and held for the entire period as indicated below.
Actual Expenses
The first line of the table to the right provides information about the actual account values and actual expenses. You may use the information in this line, together with the amount you invested, to estimate the expenses that you paid over the period. Simply divide your account value by $1,000 (for example, an $8,600 account value divided by $1,000 = 8.6), then multiply the result by the number in the first line under the heading entitled “Expenses Paid During Period” to estimate the expenses you paid on your account during this period.
Hypothetical Example for Comparison Purposes
The second line of the table to the right provides information about hypothetical account values and hypothetical expenses based on the Fund’s actual expense ratio and an assumed annual rate of return of 5% before expenses, which is not the Fund’s actual return. The hypothetical account values and expenses may not be used to estimate the actual ending account balance or expenses you paid for the period. You may use this information to compare the ongoing costs of investing in the Fund and other funds by comparing this 5% hypothetical example with the 5% hypothetical examples that appear in the shareholder reports of other funds.
Please note that the expenses shown in the table are meant to highlight your ongoing costs only and do not reflect any transactional costs, such as sales charges (loads), redemption fees, or exchange fees. Therefore, the second line of the table is useful in comparing ongoing costs only, and will not help you determine the relative total costs of owning different funds.
| | | | | | | | | | | | |
Six Months Ended October 31, 2008 | | Expense
Ratio for
the Period | | | Beginning
Account Value
05/01/2008 | | Ending
Account Value
10/31/2008 | | Expenses Paid
During the
Period* |
Managers Fremont Global Fund | | | | | | | | | | | | |
Based on Actual Fund Return | | 0.75 | % | | $ | 1,000 | | $ | 663 | | $ | 3.13 |
Based on Hypothetical 5% Annual Return | | 0.75 | % | | $ | 1,000 | | $ | 1,021 | | $ | 3.80 |
Managers Small Cap Fund | | | | | | | | | | | | |
Based on Actual Fund Return | | 1.40 | % | | $ | 1,000 | | $ | 754 | | $ | 6.17 |
Based on Hypothetical 5% Annual Return | | 1.40 | % | | $ | 1,000 | | $ | 1,018 | | $ | 7.11 |
Managers Fremont Micro-Cap Fund | | | | | | | | | | | | |
Based on Actual Fund Return | | 1.56 | % | | $ | 1,000 | | $ | 762 | | $ | 6.91 |
Based on Hypothetical 5% Annual Return | | 1.56 | % | | $ | 1,000 | | $ | 1,017 | | $ | 7.91 |
Managers Fremont Institutional Micro-Cap Fund | | | | | | | | | | | | |
Based on Actual Fund Return | | 1.35 | % | | $ | 1,000 | | $ | 768 | | $ | 6.00 |
Based on Hypothetical 5% Annual Return | | 1.35 | % | | $ | 1,000 | | $ | 1,018 | | $ | 6.85 |
Managers Real Estate Securities Fund | | | | | | | | | | | | |
Based on Actual Fund Return | | 1.50 | % | | $ | 1,000 | | $ | 651 | | $ | 6.22 |
Based on Hypothetical 5% Annual Return | | 1.50 | % | | $ | 1,000 | | $ | 1,018 | | $ | 7.61 |
Managers California Intermediate Tax Free Fund | | | | | | | | | | | | |
Based on Actual Fund Return | | 0.55 | % | | $ | 1,000 | | $ | 966 | | $ | 2.72 |
Based on Hypothetical 5% Annual Return | | 0.55 | % | | $ | 1,000 | | $ | 1,022 | | $ | 2.80 |
| * | Expenses are equal to the Fund’s annualized expense ratio multiplied by the average account value over the period, multiplied by the number of days in the most recent fiscal half-year (184), then divided by 366. |
3
Managers Fremont Global Fund
Portfolio Manager’s Comments
The Managers Fremont Global Fund seeks to maximize total return while reducing risk by investing in U.S. and international stocks, bonds, and short-term securities (cash).
The Portfolio Managers
First Quadrant, L.P. (“First Quadrant”)
First Quadrant believes that there are significant and recurring market inefficiencies and that history can help identify which inefficiencies are profitable. Inefficiencies may be identified through ongoing fundamental research conducted by First Quadrant’s research team. Incorporating this fundamental research into a quantitative model leads to a consistent, disciplined investment process.
Led by portfolio managers Chris Luck and Max Darnell, First Quadrant’s investment team uses a proprietary multi-factor quantitative model to construct portfolios that combine a top-down analysis of market and economic conditions with a bottom-up stock-selection process. The top-down analysis consists of a review of market and economic data to identify those industries and sectors of the market that are likely to benefit from present and future economic conditions. The top-down analysis helps the Fund management team at First Quadrant determine how to tilt the portfolio, relative to the benchmark, in terms of style, market cap, and industry weightings. Individual stock selection, however, is driven by bottom-up models that focus primarily on market sentiment, valuation, and accounting fundamentals.
Wellington Management Company, LLP (“Wellington Management”)
Wellington Management’s portfolio is managed by its International Growth Team (“IGT”), comprised of portfolio managers Jean-Marc Berteaux and Andrew S. Offit. Messers. Berteaux and Offit are supported by Wellington Management’s global industry analysts and regional analysts, as well as specialized fundamental, quantitative, and technical analysts, and traders. The IGT’s investment philosophy is built on the belief that industry is the dominant competitive factor for companies, that companies can dominate industries on a global basis, and that expectations about companies, specifically earnings, drive stock prices. Wellington’s focus is to identify industry leaders with earnings forecasts ahead of market expectations, and to identify the key drivers for earnings.
The initial investable universe comprises companies in the MSCI EAFE Index with market capitalizations greater than $1 billion. These companies are researched by Wellington Management’s specialist group of industry analysts who perform intensive ongoing fundamental analysis. Analysts provide assessments, financial models, and fundamental research to the IGT. The focus of this research is to update an ongoing assessment of management, current business challenges, and aggregate industry trends. Thorough analysis is conducted in preparation for, and following company contacts, to ensure that “the numbers support the story” – that the strategy and challenges outlined by management are coming through in financial results. The companies ultimately purchased for the portfolio will exhibit the following characteristics: industry leadership, identified earnings drivers, and above consensus earnings growth expectations. Companies in the portfolio are continually monitored to ensure their fundamental attractiveness based on the identified earnings drivers. Market expectations catching up to their earnings forecast and/or deterioration in earnings drivers will factor into the sell decision. The portfolio will generally hold 50 to 80 securities. Portfolio turnover is expected to be high. While the portfolio’s holdings-based turnover is expected to be in the 100% range, the IGT will actively trade these positions as a result of significant near-term price movements and other factors.
Bernstein Investment Research and Management (“Bernstein”)
Bernstein’s approach to investing is value based and research driven. Bernstein’s thesis is that human nature leads investors to buy and sell financial assets based on an overreaction to near-term events as they confuse temporary or cyclical characteristics with structural change. Thus, short-term problems, which cause profits and stocks to decline, can create buying opportunities, as investors underestimate the potential for corrective strategies to restore long-term earnings power. The investment team, led by Kevin Simms, attempts to exploit this by using research to separate fact from emotion. Bernstein’s International Strategic Value discipline is designed to crate a focused portfolio of companies with strong fundamentals and sound business prospects not yet reflected in their share price.
The investment process begins with a broad universe of several thousand companies. The investment team screens this universe with a proprietary return model to identify the companies with the most attractive valuations relative to their earnings power. The model derives an expected return for each company by assessing it both from a global industry-based perspective and from a country-based standpoint, including such factors as price to cash earnings, price to book, return on equity, and price momentum. A deep team of analysts perform extensive research, focusing on the most attractively valued stocks. These analysts dissect corporate financial statements and visit company management and also meet frequently with customers, suppliers, or other industry experts. They build spreadsheets of historical and projected balance-sheet and income-statement information in order to estimate normalized earnings power, cash flow, and asset values for each company for the next five years, performing simulations to see the potential impact of changes in various components. Analysts then present their estimates and ratings for each security to the Research Review Committee of the Investment Policy Group (IPG). The Committee challenges the analyst’s assumptions and conclusions to ensure they are sound. The IPG uses this research to build a portfolio of 40 to 85 of the best ideas, building on the combined convictions of Bern-stein industry analysts and regional portfolio management teams. A stock is sold when it has achieved its forecasted fair value target, or if a change in the earnings forecast reduces the price target to current levels.
Loomis Sayles & Company, L.P. (“Loomis”)
The Fund accesses the global bond management services of Loomis Sayles & Company, L.P. (“Loomis”) through an investment in the Managers Global Bond Fund, which is subadvised by Loomis. The investment team at Loomis believes that there are inefficiencies inherent in bond markets, hence the greatest opportunities to add value reside in the pricing of credit risk. Loomis’s philosophy is to
4
Managers Fremont Global Fund
Portfolio Manager’s Comments (continued)
identify attractively valued issues through fundamental research. The investment team and analysts at Loomis generally seek fixed income securities of issuers whose credit profiles it believes are improving. The investment team also analyzes political, economic, and other fundamental factors and combines this analysis with a comparison of the yield spreads of various fixed income securities throughout the world in an effort to find securities that they believe may produce attractive returns in comparison to their risk. Finally, if a security that is believed to be attractive is denominated in a foreign currency, Loomis analyzes whether to accept or to hedge the currency risk.
Portfolio managers Kenneth Buntrock and David Rolley and their team of credit analysts at Loomis research debt offerings in the same way equity analysts research stocks, looking for undervalued bonds where they see a yield premium, the potential for price appreciation, or both. They analyze the financial condition of individual countries and companies in detail, as well as the terms of specific bond offerings. They believe price appreciation can come from a variety of catalysts including improving country or company fundamentals which would lead to credit upgrades, changing market supply and demand forces, or improving sector or economic trends.
The Year in Review
The financial markets were under significant pressure during a majority of the past year. The period began with the focus of investors on the U.S. housing crisis and eventually morphed into concerns about a broader credit crisis both in the U.S. and abroad. Despite these fears, stocks saw a rebound in April and May before selling off dramatically toward the end of the second quarter as investors’ concerns over surging commodity prices, continuing fallout from the credit crisis, slowing economic growth, and declining corporate profits took center stage. Volatility remained high during July and August as major headlines included falling energy and commodity prices along with higher-than-expected economic growth, countered by further contraction in housing, weakness in the labor markets, tighter credit conditions, and uncertainty about the stability of Fannie Mae and Freddie Mac. July and August proved, however, to be the calm before the real storm, as the number of events significantly affecting the markets in September greatly outnumbered any other period in recent memory. September included the U.S. Treasury’s bailout of mortgage agencies Fannie Mae and Freddie Mac as well as insurer AIG. Market turmoil even extended to money markets where interbank lending rates soared to record highs as banks hoarded cash. In October, Congress approved a $700 billion “bailout” called the Troubled Asset Relief Program (TARP) with the goal of opening up credit markets by buying distressed assets.
During 2008, the Fund’s team of subadvisors was modified to reduce the number of U.S. equity subadvisors to the Fund, which also impacted the Fund’s overall asset allocation. In May, the number of U.S. equity managers was reduced as First Quadrant was retained as the sole domestic equity manager. Bernstein and Wellington were retained as international equity managers and Loomis was retained as the sole global fixed income manager during this restructuring. In addition, the Fund’s asset allocation was adjusted to better reflect the actual capitalization split of the global equity markets. Each of the subadvisors in the Fund have distinct investment approaches and complementary investment processes which allow the Fund to remain well diversified while offering “intelligence diversification” to effectively manage the overall risk in the Portfolio.
For the fiscal year ended October 31, 2008, the Managers Fremont Global Fund returned -38.66% compared to a return of -29.61% for its benchmark, which consists of 65% of the return of the MSCI World Index and 35% of the return of the Barclays Global Aggregate Index. The absolute and relative under-performance was driven by both the equity and fixed income portions of the Fund. On the equity side, weak stock selection within the more economically sensitive areas of the market, such as the consumer discretionary and financial sectors, was to blame for the under-performance. The fixed income portion of the Fund, managed by Loomis, generated weak performance relative to its benchmark primarily because of an overweight to corporate positions in the U.S., U.K., and European bond markets. This primarily occurred in September, reflecting market developments occurring globally within the financials sector.
Looking Forward
Sector positioning on the equity portion of the Fund did not significantly change during the last fiscal year, although the portfolio managers of the Fund have recently taken the opportunity to add higher quality holdings within the financials sector as many of these securities’ valuations have become extremely compelling. The portfolio managers in the equity portion of the Fund anticipate significant opportunities across a variety of sectors over the course of the next year as extreme market dislocations continue globally. As for Loomis, it continues to seek opportunities at the now substantial discounts that offer solid, long-term value in the global fixed income markets as spreads have hit historical levels.
Cumulative Total Return Performance
Managers Fremont Global Fund’s cumulative total return is based on the daily change in net asset value (NAV), and assumes that all distributions are reinvested. The S&P 500 Index is designed to measure performance of the broad domestic economy through changes in aggregate market value of 500 stocks representing all major industries. The Managers Fremont Global Fund Composite Index is a hypothetical representation of the performance of the Fund’s stock and bond asset classes according to their respective weightings in the Fund’s neutral mix (65% MSCI World Index and 35% Barclays Global Aggregate Index). The MSCI World Index is an unmanaged index composed of more than 1,400 stocks listed on exchanges in the U.S., Europe, Canada, Australia, New Zealand, and the Far East. It assumes the reinvestment of dividends. The Barclays Global Aggregate Index provides a broad-based measure of the global investment-grade fixed income markets. The three major components of this index are the U.S. Aggregate, the Pan-European Aggregate, and the Asian-Pacific Aggregate Indices. The Index also includes eurodollar and euro-yen corporate bonds, Canadian government, agency, and corporate securities, and USD investment grade 144A securities. Unlike the Fund, the above stated indices are unmanaged, are not available to investment, and do not incur expenses. The chart on page 6 compares a hypothetical $10,000 investment made in the Managers Fremont Global Fund on October 31, 1998, to a $10,000 investment made in the above stated indices for the same period.
5
Managers Fremont Global Fund
Portfolio Manager’s Comments (continued)
Cumulative Total Return Performance
The graph and table do not reflect the deduction of taxes that a shareholder would pay on a Fund distribution or redemption of shares. The listed returns for the Fund are net of expenses and the returns for the indices exclude expenses. Total returns for the Fund would have been lower had certain expenses not been reduced.
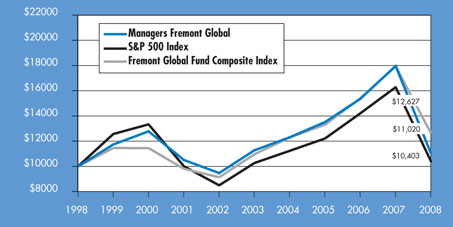
The table below shows the average annual total returns for Managers Fremont Global Fund, S&P 500 Index, and the Managers Fremont Global Fund Composite Index (before taxes) since October 31, 1998 through October 31, 2008.
| | | | | | | | | |
Average Annualized Total Returns 1 | | One Year | | | Five Years | | | Ten Years | |
Managers Fremont Global 2, 3 | | (38.66 | )% | | (0.46 | )% | | 0.98 | % |
S&P 500 Index | | (36.10 | )% | | 0.26 | % | | 0.40 | % |
Managers Fremont Global Fund Composite Index | | (29.61 | )% | | 2.86 | % | | 2.36 | % |
The performance data shown represents past performance. Past performance is not a guarantee of future results. Current performance may be lower or higher than the performance data quoted. The investment return and principal value of an investment in the Fund will fluctuate so that an investor’s shares, when redeemed, may be worth more or less than their original cost. For performance information through the most recent month end, please call (800) 835-3879 or visit our Web site at www.managersinvest.com.
In choosing a Fund, investors should carefully consider the amount they plan to invest, their investment objectives, the Fund’s investment objectives, risks, charges and expenses before investing. For this and other information, please call 800.835.3879 or visit www.managersinvest.com for a free prospectus. Read it carefully before investing or sending money. Distributed by Managers Distributors, Inc., member FINRA.
1 | Total return equals income yield plus share price change and assumes reinvestment of all dividends and capital gain distributions. Returns are net of fees and may reflect offsets of Fund expenses as described in the Prospectus. No adjustment has been made for taxes payable by shareholders on their reinvested dividends and capital gain distributions. Returns for periods greater than one year are annualized. The listed returns on the Fund are net of expenses and based on the published NAV as of October 31, 2008. All returns are in U.S. dollars($). |
2 | Investments in foreign securities, even though publicly traded in the United States, may involve risks which are in addition to those inherent in domestic investments. |
3 | The Fund is subject to the risks associated with investments in debt securities, such as default risk and fluctuations in the perception of the debtors’ ability to pay their creditors. |
Not FDIC insured, nor bank guaranteed. May lose value.
6
Managers Fremont Global Fund
Fund Snapshots
October 31, 2008
Portfolio Breakdown
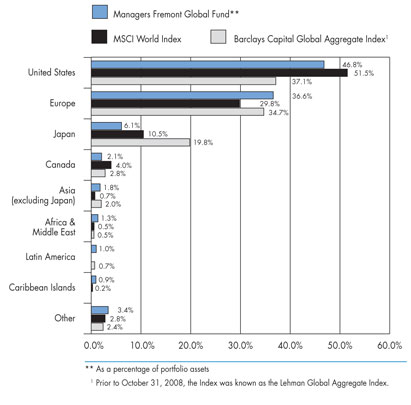
| | | | | | | | | |
Geographic Diversification | | Managers
Fremont Global
Fund** | | | MSCI World
Index | | | Barclays Capital
Global Aggregate
Index1 | |
United States | | 46.8 | % | | 51.5 | % | | 37.1 | % |
Europe | | 36.6 | % | | 29.8 | % | | 34.7 | % |
Japan | | 6.1 | % | | 10.5 | % | | 19.8 | % |
Canada | | 2.1 | % | | 4.0 | % | | 2.8 | % |
Asia (excluding Japan) | | 1.8 | % | | 0.7 | % | | 2.0 | % |
Africa & Middle East | | 1.3 | % | | 0.5 | % | | 0.5 | % |
Latin America | | 1.0 | % | | 0.0 | % | | 0.7 | % |
Caribbean Islands | | 0.9 | % | | 0.2 | % | | 0.0 | % |
Other | | 3.4 | % | | 2.8 | % | | 2.4 | % |
Top Ten Holdings
| | | |
Security Name | | Percentage
of Net Assets | |
Managers Global Bond Fund* | | 33.7 | % |
Exxon Mobil Corp. | | 1.2 | |
Royal Dutch Shell PLC, Class A (United Kingdom) | | 1.1 | |
Sanofi-Aventis SA (France) | | 0.8 | |
Teva Pharmaceutical Industries, Ltd., Sponsored ADR (Israel) | | 0.8 | |
Total SA (France) | | 0.8 | |
Roche Holding AG (Switzerland) | | 0.7 | |
BNP Paribas, SA (France) | | 0.7 | |
Procter & Gamble Co.* | | 0.7 | |
Nestle, SA (Switzerland) | | 0.6 | |
| | | |
Top Ten as a Group | | 41.1 | % |
| | | |
| * | Top Ten Holding at April 30, 2008 |
Any sectors, industries, or securities discussed should not be perceived as investment recommendations. Mention of a specific security should not be considered a recommendation to buy or solicitation to sell that security.
7
Managers Fremont Global Fund
Schedule of Portfolio Investments
October 31, 2008
| | | | | | |
| | | Shares | | | Value |
Common Stocks - 65.2% | | | | | | |
Consumer Discretionary - 5.3% | | | | | | |
Advance Auto Parts, Inc. | | 4,200 | | | $ | 131,040 |
Amazon.com, Inc. * | | 600 | 2 | | | 34,344 |
Apollo Group, Inc., Class A * | | 1,400 | 2 | | | 97,314 |
Carnival Corp. (Panama) | | 1,000 | 2 | | | 25,400 |
Comcast Corp., Class A | | 10,000 | | | | 157,600 |
Compagnie Generale des Etablissements Michelin SCA (France) | | 1,650 | | | | 84,927 |
Ctrip.com International, Ltd., ADR (China) | | 3,900 | | | | 119,262 |
DIRECTV Group, Inc., The * | | 5,400 | 2 | | | 118,206 |
Exide Technologies, Inc. * | | 7,800 | | | | 37,050 |
Gap, Inc., The | | 8,559 | | | | 110,753 |
H&R Block, Inc. | | 1,400 | | | | 27,608 |
Home Depot, Inc., The | | 2,200 | 2 | | | 51,898 |
Jo-Ann Stores, Inc. * | | 6,600 | 2 | | | 126,456 |
Johnson Controls, Inc. | | 4,800 | | | | 85,104 |
Lagardere (France) | | 3,500 | | | | 139,160 |
Liberty Media Corp., Class A | | 7,000 | | | | 112,700 |
Lowe’s Companies, Inc. | | 3,600 | | | | 78,120 |
McDonald’s Corp. | | 2,800 | | | | 162,204 |
News Corp., Inc., Class A | | 10,000 | | | | 106,400 |
Next PLC (United Kingdom) | | 11,220 | | | | 190,706 |
Nike, Inc. | | 800 | | | | 46,104 |
Nissan Motor Co., Ltd. (Japan) | | 55,300 | | | | 274,642 |
Parkson Retail Group, Ltd. (China) | | 84,500 | | | | 78,438 |
Pinault-Printemps-Redoute SA (France) | | 2,658 | | | | 169,396 |
Polo Ralph Lauren Corp. | | 1,800 | | | | 84,906 |
priceline.com, Inc. * | | 1,600 | 2 | | | 84,208 |
Renault, SA (France) | | 10,200 | | | | 312,608 |
Rent-A-Center, Inc. * | | 4,400 | 2 | | | 64,240 |
Ross Stores, Inc. | | 4,800 | | | | 156,912 |
Sharp Corp. (Japan) | | 25,000 | | | | 178,431 |
Snap-On, Inc. | | 3,200 | | | | 118,240 |
Stewart Enterprises, Inc. | | 13,979 | 2 | | | 72,271 |
Stoneridge, Inc. * | | 3,800 | 2 | | | 21,622 |
Target Corp. | | 1,800 | | | | 72,216 |
Timberland Co. * | | 3,400 | | | | 41,140 |
Time Warner Co., Inc. | | 12,800 | 2 | | | 129,152 |
Unifirst Corp. | | 800 | | | | 26,104 |
Walt Disney Co., The | | 6,800 | | | | 176,120 |
Whirlpool Corp. | | 1,600 | | | | 74,640 |
Total Consumer Discretionary | | | | | | 4,177,642 |
Consumer Staples - 7.3% | | | | | | |
Altria Group, Inc. | | 5,000 | | | | 95,950 |
Anheuser-Busch Companies, Inc. | | 1,000 | | | | 62,030 |
Associated British Foods PLC (United Kingdom) | | 10,700 | | | | 119,727 |
Avon Products, Inc. | | 3,600 | | | | 89,388 |
British American Tobacco PLC (United Kingdom) | | 4,389 | | | | 120,387 |
Bunge, Ltd. | | 2,600 | | | | 99,866 |
Cadbury PLC (United Kingdom) | | 14,608 | | | | 134,134 |
Carlsberg A/S, Class B (Denmark) | | 1,393 | | | | 54,840 |
Church & Dwight Co., Inc. | | 2,600 | | | | 153,634 |
Coca-Cola Co., The | | 5,000 | | | | 220,300 |
Colgate-Palmolive Co. | | 800 | | | | 50,208 |
Corn Products International, Inc. | | 3,000 | | | | 72,960 |
Costco Wholesale Corp. | | 1,000 | | | | 57,010 |
CVS Caremark Corp. | | 5,000 | | | | 153,250 |
Darling International, Inc. * | | 15,200 | 2 | | | 114,608 |
Delhaize Le Lion (Belgium) | | 1,300 | | | | 73,110 |
J Sainsbury PLC (United Kingdom) | | 34,250 | | | | 156,460 |
Japan Tobacco, Inc. (Japan) | | 54 | | | | 191,574 |
Koninklijke Ahold, N.V. (Netherlands) | | 21,700 | | | | 232,958 |
Kraft Foods, Inc. | | 2,200 | | | | 64,108 |
Kroger Co., The | | 4,600 | | | | 126,316 |
Metro AG (Germany) | | 1,605 | | | | 51,178 |
Molson Coors Brewing Co. | | 3,000 | | | | 112,080 |
Nash Finch Co. | | 1,000 | 2 | | | 39,430 |
Nestle, SA (Switzerland) | | 12,363 | | | | 480,760 |
PepsiCo, Inc. | | 3,400 | | | | 193,834 |
Philip Morris International, Inc. | | 4,000 | | | | 173,880 |
Procter & Gamble Co., The | | 8,400 | | | | 542,136 |
Ralcorp Holdings, Inc. * | | 1,800 | | | | 121,824 |
Reckitt Benckiser Group PLC (United Kingdom) | | 9,666 | | | | 408,870 |
SUPERVALU, Inc. | | 5,400 | | | | 76,896 |
Swedish Match AB (Sweden) | | 5,800 | | | | 80,544 |
Sysco Corp. | | 4,600 | | | | 120,520 |
Tesco PLC (United Kingdom) | | 33,213 | | | | 181,978 |
Unicharm Corp. (Japan) | | 1,800 | | | | 129,103 |
Walgreen Co. | | 200 | | | | 5,092 |
Wal-Mart Stores, Inc. | | 6,800 | 2 | | | 379,508 |
William Morrison Supermarkets PLC (United Kingdom) | | 35,306 | | | | 150,331 |
Total Consumer Staples | | | | | | 5,690,782 |
The accompanying notes are an integral part of these financial statements.
8
Managers Fremont Global Fund
Schedule of Portfolio Investments (continued)
| | | | | | |
| | | Shares | | | Value |
Energy - 8.4% | | | | | | |
Apache Corp. | | 1,400 | | | $ | 115,262 |
Arch Coal, Inc. | | 4,600 | | | | 98,486 |
BP PLC (United Kingdom) | | 14,200 | | | | 115,751 |
Canadian Natural Resources, Ltd. (Canada) | | 1,500 | | | | 75,691 |
Chevron Corp. | | 5,200 | | | | 387,920 |
China Petroleum and Chemical Corp., Class H (China) | | 334,000 | | | | 219,327 |
Cimarex Energy Co. | | 3,000 | | | | 121,380 |
Complete Production Services, Inc. | | 7,400 | 2 | | | 91,686 |
ConocoPhillips Co. | | 3,910 | | | | 203,398 |
Devon Energy Corp. | | 2,000 | | | | 161,720 |
Encore Acquisition Co. * | | 4,000 | | | | 124,600 |
Eni S.p.A. (Italy) | | 12,600 | | | | 300,739 |
Exxon Mobil Corp. | | 13,200 | | | | 978,384 |
Halliburton Co. | | 5,800 | | | | 114,782 |
Hess Corp. | | 2,000 | | | | 120,420 |
Knightsbridge Tankers, Ltd. (Bermuda) | | 4,600 | | | | 82,386 |
LUKOIL Holdings, ADR (Russia) | | 7,200 | 2 | | | 279,360 |
Massey Energy Co. | | 3,200 | | | | 73,888 |
Murphy Oil Corp. | | 2,400 | | | | 121,536 |
National-Oilwell, Inc. * | | 3,600 | | | | 107,604 |
Occidental Petroleum Corp. | | 3,000 | 2 | | | 166,620 |
Petro-Canada (Canada) | | 12,300 | | | | 307,577 |
Petroleo Brasileiro, S.A., Sponsored ADR (Brazil) | | 3,400 | | | | 91,426 |
Royal Dutch Shell PLC, Class A (United Kingdom)* | | 31,836 | | | | 880,499 |
Schlumberger, Ltd. | | 2,400 | | | | 123,960 |
StatoilHydro ASA (Norway) | | 15,600 | | | | 313,772 |
Talisman Energy, Inc. (Canada) | | 6,400 | | | | 63,241 |
Total SA (France) | | 10,821 | | | | 595,301 |
Transocean, Inc. | | 800 | | | | 65,864 |
W&T Offshore, Inc. | | 5,600 | 2 | | | 107,352 |
Total Energy | | | | | | 6,609,932 |
Financials - 11.6% | | | | | | |
3i Group PLC (United Kingdom)* | | 17,695 | | | | 154,345 |
Aflac, Inc. | | 1,600 | | | | 70,848 |
Allianz SE (Germany) | | 5,793 | | | | 425,148 |
American Express Co. | | 2,000 | | | | 55,000 |
American Financial Group, Inc. | | 3,200 | | | | 72,736 |
Anworth Mortgage Asset Corp. | | 8,400 | | | | 49,224 |
AON Corp. | | 3,200 | | | | 135,360 |
Aviva PLC (United Kingdom) | | 22,681 | | | | 135,292 |
Bank of America Corp. | | 9,751 | | | | 235,682 |
Bank of Hawaii Corp. | | 2,600 | 2 | | | 131,846 |
Bank of New York Mellon Corp., The | | 2,800 | | | | 91,280 |
Barclays PLC (United Kingdom) | | 90,874 | | | | 260,498 |
BNP Paribas, SA (France) | | 7,942 | | | | 573,423 |
Cash America International, Inc. | | 3,121 | | | | 110,390 |
Charles Schwab Corp., The | | 2,200 | | | | 42,064 |
Chubb Corp., The | | 2,400 | | | | 124,368 |
Citigroup, Inc. | | 8,800 | | | | 120,120 |
Community Bank System, Inc. | | 1,800 | 2 | | | 44,910 |
Credit Agricole, SA (France) | | 18,700 | | | | 270,533 |
Credit Suisse Group AG (Switzerland)* | | 9,400 | | | | 351,502 |
CVB Financial Corp. | | 11,567 | 2 | | | 146,438 |
Deutsche Bank AG (Germany) | | 7,900 | | | | 295,120 |
Goldman Sachs Group, Inc. | | 800 | | | | 74,000 |
HBOS PLC (United Kingdom) | | 98,102 | | | | 160,636 |
Hospitality Properties Trust | | 7,200 | | | | 73,080 |
HSBC Holdings PLC | | 9,400 | | | | 111,336 |
Hudson City Bancorp, Inc. | | 8,400 | | | | 158,004 |
ING Groep NV (Netherlands) | | 14,000 | | | | 131,325 |
Interactive Brokers Group, Inc., Class A * | | 3,000 | 2 | | | 64,110 |
JPMorgan Chase & Co. | | 7,400 | | | | 305,250 |
Julius Baer Holding, Ltd. (Switzerland) | | 3,572 | | | | 139,702 |
KB Financial Group, Inc., ADR (South Korea)* | | 4,000 | 2 | | | 98,440 |
Lloyds TSB Group PLC (United Kingdom) | | 24,500 | | | | 79,187 |
Loews Corp. | | 3,600 | | | | 119,556 |
Merrill Lynch & Co., Inc. | | 1,000 | | | | 18,590 |
Metlife, Inc. | | 1,821 | | | | 60,494 |
Mitsui Fudosan Co., Ltd. (Japan) | | 5,000 | | | | 87,216 |
Morgan Stanley & Co. | | 2,600 | | | | 45,422 |
Muenchener Rueckversicherungs AG (Germany) | | 2,800 | | | | 370,914 |
NASDAQ OMX Group, Inc., The* | | 5,200 | | | | 168,792 |
NBT Bancorp, Inc. | | 2,000 | | | | 55,760 |
Northern Trust Corp. | | 2,200 | | | | 123,882 |
Old National Bancorp. | | 7,200 | 2 | | | 136,368 |
ORIX Corp. (Japan) | | 2,360 | | | | 242,474 |
Platinum Underwriters Holdings, Ltd. (Bermuda) | | 5,000 | | | | 158,700 |
ProLogis | | 600 | 2 | | | 8,400 |
Prudential Financial, Inc. | | 2,000 | | | | 60,000 |
Public Storage, Inc. | | 1,600 | | | | 130,400 |
Rayonier, Inc. | | 3,600 | 2 | | | 119,088 |
Republic Bancorp, Inc., Class A | | 600 | 2 | | | 13,812 |
The accompanying notes are an integral part of these financial statements.
9
Managers Fremont Global Fund
Schedule of Portfolio Investments (continued)
| | | | | | |
| | | Shares | | | Value |
Financials - 11.6% (continued) | | | | | | |
Royal Bank of Scotland Group PLC (United Kingdom) | | 164,772 | | | $ | 181,499 |
Societe Generale (France) | | 6,001 | | | | 327,085 |
Stancorp Financial Group, Inc. | | 1,600 | | | | 54,528 |
State Street Corp. | | 2,653 | | | | 115,008 |
Sumitomo Mitsui Financial Group, Inc. (Japan) | | 28 | | | | 112,248 |
T Rowe Price Group, Inc. | | 600 | 2 | | | 23,724 |
Transatlantic Holdings, Inc. | | 800 | | | | 34,280 |
Travelers Companies, Inc., The | | 3,800 | | | | 161,690 |
U.S. Bancorp. | | 3,000 | | | | 89,430 |
UBS AG (Switzerland)* | | 20,550 | | | | 348,677 |
UnumProvident Corp. | | 8,000 | | | | 126,000 |
Wells Fargo & Co. | | 7,800 | | | | 265,590 |
Total Financials | | | | | | 9,050,824 |
Health Care - 9.4% | | | | | | |
Abbott Laboratories Co. | | 3,800 | | | | 209,570 |
Actelion, Ltd. (Switzerland)* | | 2,082 | | | | 109,988 |
Amgen, Inc. * | | 3,800 | | | | 227,582 |
AstraZeneca PLC (United Kingdom) | | 9,361 | | | | 396,705 |
Baxter International, Inc. | | 1,800 | | | | 108,882 |
Biogen Idec, Inc.* | | 600 | | | | 25,530 |
Bristol-Myers Squibb Co. | | 3,600 | | | | 73,980 |
Celgene Corp.* | | 200 | | | | 12,852 |
Covidien, Ltd. (Bermuda) | | 1,200 | | | | 53,148 |
CSL, Ltd. (Australia) | | 8,761 | | | | 213,065 |
Daiichi Sankyo Co., Ltd. (Japan) | | 3,300 | | | | 67,666 |
Eisai Co., Ltd. (Japan) | | 3,200 | | | | 103,823 |
Eli Lilly & Co. | | 4,000 | | | | 135,280 |
Express Scripts, Inc.* | | 2,200 | | | | 133,342 |
Fresenius Medical Care AG (Germany) | | 4,292 | | | | 191,980 |
Genentech, Inc.* | | 600 | | | | 49,764 |
Gilead Sciences, Inc.* | | 2,200 | | | | 100,870 |
GlaxoSmithKline PLC (United Kingdom) | | 11,300 | | | | 217,231 |
Invitrogen Corp.* | | 4,600 | 2 | | | 132,434 |
Johnson & Johnson Co. | | 6,800 | | | | 417,112 |
Lifepoint Hospitals, Inc.* | | 5,200 | 2 | | | 124,644 |
McKesson Corp. | | 3,160 | | | | 116,256 |
Medtronic, Inc. | | 2,800 | | | | 112,924 |
Merck & Co., Inc. | | 3,600 | | | | 111,420 |
Novartis AG (Switzerland)* | | 8,797 | | | | 446,518 |
OSI Pharmaceuticals, Inc.* | | 3,400 | 2 | | | 129,030 |
Owens & Minor, Inc. | �� | 3,307 | 2 | | | 143,094 |
Perrigo Co. | | 4,400 | 2 | | | 149,600 |
Pfizer, Inc. | | 17,200 | | | | 304,612 |
Roche Holding AG (Switzerland)* | | 3,832 | | | | 586,016 |
Sanofi-Aventis SA (France) | | 9,787 | | | | 620,077 |
Schering-Plough Corp. | | 800 | | | | 11,592 |
St. Jude Medical, Inc.* | | 3,800 | | | | 144,514 |
Synthes, Inc. (Switzerland) | | 1,596 | | | | 205,952 |
Teva Pharmaceutical Industries, Ltd., Sponsored ADR (Israel) | | 13,901 | 2 | | | 596,075 |
Thermo Fisher Scientific, Inc.* | | 2,200 | 2 | | | 89,320 |
UnitedHealth Group, Inc. | | 1,200 | | | | 28,476 |
Universal Health Services, Inc., Class B | | 2,800 | | | | 117,712 |
Valeant Pharmaceuticals International * | | 2,400 | 2 | | | 45,048 |
Varian Medical Systems, Inc.* | | 1,800 | 2 | | | 81,918 |
Wyeth | | 2,800 | | | | 90,104 |
Yamanouchi Pharmaceutical Co., Ltd. (Japan) | | 3,300 | | | | 132,920 |
Total Health Care | | | | | | 7,368,626 |
Industrials - 5.6% | | | | | | |
3M Co. | | 1,000 | | | | 64,300 |
AGCO Corp.* | | 2,200 | | | | 69,344 |
Air France-KLM (France) | | 6,200 | | | | 89,328 |
Avis Budget Group, Inc.* | | 27,000 | 2 | | | 44,280 |
Boeing Co., The | | 1,800 | | | | 94,086 |
Bucyrus International, Inc. | | 2,600 | | | | 62,738 |
Burlington Northern Santa Fe Corp. | | 200 | | | | 17,812 |
Capita Group PLC (United Kingdom) | | 27,257 | | | | 281,646 |
Caterpillar, Inc. | | 1,000 | | | | 38,170 |
China Communications Constuction Co., Ltd. (China) | | 42,000 | | | | 29,750 |
Cliffs Natural Resources, Inc. | | 3,400 | | | | 91,766 |
CSX Corp. | | 2,800 | | | | 128,016 |
Deutsche Lufthansa AG (Germany) | | 9,800 | | | | 135,731 |
easyJet PLC (United Kingdom)* | | 94,481 | | | | 471,326 |
Emerson Electric Co. | | 1,800 | | | | 58,914 |
Enpro Industries, Inc. * | | 1,800 | 2 | | | 39,978 |
Esterline Technologies Corp. * | | 600 | | | | 21,630 |
European Aeronautic Defense and Space Co. (Netherlands) | | 5,790 | | | | 96,304 |
Fluor Corp. | | 2,800 | | | | 111,804 |
Gardner Denver, Inc.* | | 4,000 | | | | 102,480 |
General Dynamics Corp. | | 1,800 | | | | 108,576 |
General Electric Co. | | 21,616 | | | | 421,728 |
Gibraltar Industries, Inc. | | 1,600 | 2 | | | 21,200 |
Goodrich Corp. | | 1,400 | | | | 51,184 |
GrafTech International, Ltd.* | | 4,600 | 2 | | | 37,306 |
The accompanying notes are an integral part of these financial statements.
10
Managers Fremont Global Fund
Schedule of Portfolio Investments (continued)
| | | | | | |
| | | Shares | | | Value |
Industrials - 5.9% (continued) | | | | | | |
Hansen Transmissions International N.V. (Belgium)* | | 61,881 | | | $ | 103,807 |
Hawaiian Holdings, Inc.* | | 7,960 | 2 | | | 55,720 |
HEICO Corp. | | 1,000 | 2 | | | 38,470 |
Honeywell International, Inc. | | 3,200 | | | | 97,440 |
Lockheed Martin Corp. | | 1,200 | | | | 102,060 |
Michael Page International PLC (United Kingdom) | | 42,332 | | | | 137,119 |
Mitsubishi Corp. (Japan) | | 3,900 | | | | 65,371 |
Mitsui & Co., Ltd. (Japan) | | 6,000 | | | | 58,137 |
NCI Building Systems, Inc.* | | 1,200 | 2 | | | 22,332 |
Northrop Grumman Corp. | | 2,600 | | | | 121,914 |
Perini Corp.* | | 1,800 | | | | 34,236 |
R.R. Donnelley & Sons Co. | | 5,600 | | | | 92,792 |
Southwest Airlines Co. | | 10,400 | 2 | | | 122,512 |
Transdigm Group, Inc.* | | 3,600 | 2 | | | 108,504 |
Union Pacific Corp. | | 2,000 | | | | 133,540 |
United Parcel Service, Inc., Class B | | 720 | | | | 38,002 |
United Rentals, Inc.* | | 4,000 | 2 | | | 41,000 |
United Technologies Corp. | | 1,500 | | | | 82,440 |
Vestas Wind Systems A/S (Denmark)* | | 3,109 | | | | 127,345 |
Watson Wyatt & Co. | | 2,200 | 2 | | | 93,434 |
Wesco International, Inc.* | | 1,200 | 2 | | | 23,856 |
Total Industrials | | | | | | 4,389,428 |
Information Technology - 8.1% | | | | | | |
Accenture, Ltd. (Bermuda) | | 1,400 | | | | 46,270 |
Affiliated Computer Services, Inc.* | | 2,600 | | | | 106,600 |
Amkor Technology, Inc.* | | 17,900 | 2 | | | 72,674 |
Anixter International, Inc.* | | 2,800 | 2 | | | 94,108 |
Apple, Inc.* | | 2,200 | | | | 236,698 |
ARM Holdings PLC (United Kingdom) | | 237,235 | | | | 369,879 |
Autonomy Corporation PLC (United Kingdom)* | | 21,344 | | | | 338,423 |
Cisco Systems, Inc.* | | 14,900 | | | | 264,773 |
CSG Systems International, Inc.* | | 9,400 | 2 | | | 156,322 |
Dell, Inc.* | | 2,000 | | | | 24,300 |
Dolby Laboratories, Inc.* | | 3,400 | 2 | | | 107,338 |
EarthLink, Inc.* | | 14,800 | | | | 102,120 |
Ericsson LM, Class B (Sweden) | | 20,000 | | | | 136,148 |
Fairchild Semiconductor International, Inc.* | | 5,800 | | | | 32,944 |
Fujitsu, Ltd. (Japan) | | 47,000 | | | | 184,795 |
Google, Inc.* | | 600 | | | | 215,616 |
Hewlett-Packard Co. | | 8,200 | | | | 313,896 |
Hynix Semiconductor, Inc. (South Korea) (a)* | | 10,800 | | | | 90,352 |
Intel Corp. | | 14,200 | | | | 227,200 |
International Business Machines Corp. | | 4,200 | | | | 390,474 |
JDA Software Group, Inc.* | | 1,800 | | | | 25,704 |
Marvell Technology Group, Ltd. (Bermuda)* | | 13,600 | 2 | | | 94,656 |
MasterCard, Inc. | | 600 | 2 | | | 88,692 |
Microsoft Corp. | | 20,200 | | | | 451,066 |
Nintendo Co., Ltd. (Japan) | | 400 | | | | 128,523 |
Nokia Oyj (Finland) | | 20,224 | | | | 309,795 |
Oracle Corp.* | | 6,800 | | | | 124,372 |
QUALCOMM, Inc. | | 2,800 | | | | 107,128 |
Research In Motion, Ltd. (Canada)* | | 2,500 | | | | 126,075 |
Samsung Electronics Co., Ltd., GDR (South Korea) (a) | | 700 | | | | 145,048 |
Scansource, Inc.* | | 936 | 2 | | | 18,570 |
Skyworks Solutions, Inc.* | | 20,400 | 2 | | | 145,452 |
Sohu.com, Inc.* | | 2,700 | 2 | | | 148,338 |
Sybase, Inc.* | | 3,000 | 2 | | | 79,890 |
Symantec Corp.* | | 8,000 | | | | 100,640 |
Take-Two Interactive Software, Inc.* | | 7,000 | | | | 83,020 |
Texas Instruments, Inc. | | 1,000 | | | | 19,560 |
Toshiba Corp. (Japan) | | 40,000 | | | | 144,577 |
Triquint Semiconductor, Inc.* | | 15,400 | 2 | | | 68,992 |
United Online, Inc. | | 9,400 | 2 | | | 69,560 |
Visa, Inc., Class A | | 1,000 | | | | 55,350 |
Western Digital Corp. * | | 6,200 | | | | 102,300 |
Western Union Co., The | | 5,600 | | | | 85,456 |
Yahoo Japan Corp. (Japan) | | 360 | | | | 119,120 |
Total Information Technology | | | | | | 6,352,814 |
Materials - 4.8% | | | | | | |
AK Steel Holding Corp. | | 3,400 | | | | 47,328 |
Anglo American PLC (United Kingdom) | | 9,395 | | | | 235,732 |
Antofagasta PLC (United Kingdom) | | 8,900 | | | | 54,988 |
Arcelor (Luxembourg) | | 5,979 | | | | 155,510 |
Barrick Gold Corp. (Canada) | | 3,300 | | | | 74,976 |
BASF SE (Germany) | | 13,300 | | | | 439,082 |
BHP Billiton PLC (United Kingdom) | | 15,938 | | | | 270,636 |
CF Industries Holdings, Inc. | | 1,800 | | | | 115,542 |
Compania Vale do Rio Doce - ADR (Brazil) | | 11,600 | | | | 145,001 |
Compass Minerals International, Inc. | | 1,400 | 2 | | | 76,902 |
Dow Chemical Co. | | 600 | | | | 16,002 |
The accompanying notes are an integral part of these financial statements.
11
Managers Fremont Global Fund
Schedule of Portfolio Investments (continued)
| | | | | | | |
| | | Shares | | | Value | |
Materials - 4.8% (continued) | | | | | | | |
E.I. du Pont de Nemours & Co. | | 2,000 | | | $ | 64,000 | |
Freeport McMoRan Copper & Gold, Inc., Class B | | 900 | 2 | | | 26,190 | |
GMK Norilsk Nickel, Sponsored ADR (Russia) | | 21,900 | | | | 228,855 | |
Innophos Holdings, Inc. | | 6,400 | 2 | | | 171,200 | |
JFE Holdings, Inc. (Japan) | | 6,000 | | | | 153,092 | |
Kazakmys PLC (United Kingdom) | | 6,800 | | | | 31,882 | |
Koninklijke DSM N.V. (Netherlands) | | 2,300 | | | | 64,051 | |
Mitsubishi Chemical Holdings Corp. (Japan) | | 57,000 | | | | 230,432 | |
Monsanto Co. | | 800 | | | | 71,184 | |
Mosaic Co., The | | 2,400 | | | | 94,584 | |
Potash Corp. of Saskatchewan, Inc. (Canada) | | 4,100 | 2 | | | 349,566 | |
Rio Tinto PLC (United Kingdom) | | 4,817 | | | | 225,012 | |
Solvay SA (Belgium) | | 1,800 | | | | 167,426 | |
Stora Enso Oyj (Finland)* | | 5,300 | | | | 49,287 | |
Svenska Cellulosa AB (Sweden) | | 11,000 | | | | 81,228 | |
Terra Industries, Inc. | | 3,800 | | | | 83,562 | |
Xstrata PLC (United Kingdom) | | 3,730 | | | | 63,799 | |
Total Materials | | | | | | 3,787,049 | |
Telecommunication Services - 3.4% | | | | | | | |
AT&T, Inc. | | 13,204 | | | | 353,471 | |
China Mobile Ltd. (Hong Kong) | | 7,000 | | | | 61,623 | |
Deutsche Telekom AG (Germany) | | 18,794 | | | | 275,728 | |
Embarq Corp. | | 3,800 | | | | 114,000 | |
France Telecom SA (France) | | 10,109 | | | | 254,904 | |
Millicom International Cellular SA (Luxembourg) | | 3,500 | 2 | | | 140,000 | |
Nippon Telegraph & Telephone Corp. (Japan) | | 35 | | | | 142,825 | |
NTT DoCoMo, Inc. (Japan) | | 76 | | | | 120,532 | |
Rogers Communications, Class B (Canada) | | 4,200 | | | | 121,926 | |
Royal KPN NV (Netherlands) | | 9,440 | | | | 132,945 | |
Syniverse Holdings, Inc. * | | 2,800 | | | | 52,640 | |
Telecom Italia S.p.A. (Italy) | | 116,000 | | | | 133,257 | |
Verizon Communications, Inc. | | 7,000 | | | | 207,690 | |
Vimpel Communication, ADR (Russia) | | 7,100 | | | | 102,950 | |
Vodafone Group PLC (United Kingdom) | | 183,383 | | | | 352,775 | |
Windstream Corp. | | 9,200 | 2 | | | 69,092 | |
Total Telecommunication Services | | | | | | 2,636,358 | |
Utilities - 1.3% | | | | | | | |
AES Corp., The * | | 1,600 | | | | 12,752 | |
American Electric Power Co., Inc. | | 1,000 | | | | 32,630 | |
DTE Energy Co. | | 3,400 | | | | 120,020 | |
Duke Energy Corp. | | 3,000 | | | | 49,140 | |
E.ON AG (Germany) | | 5,400 | | | | 202,364 | |
Entergy Corp. | | 400 | | | | 31,220 | |
Exelon Corp. | | 1,400 | | | | 75,936 | |
FirstEnergy Corp. | | 800 | | | | 41,728 | |
FPL Group, Inc. | | 1,000 | | | | 47,240 | |
PG&E Corp. | | 800 | | | | 29,336 | |
Progress Energy, Inc. | | 600 | | | | 23,622 | |
Public Service Enterprise Group, Inc. | | 1,200 | | | | 33,780 | |
Southern Co., The | | 1,800 | | | | 61,812 | |
UGI Corp. | | 5,000 | | | | 119,350 | |
UIL Holdings Corp. | | 3,600 | | | | 118,800 | |
Total Utilities | | | | | | 999,730 | |
Total Common Stocks
(cost $71,313,578) | | | | | | 51,063,185 | |
Warrants - 0.4% | | | | | | | |
AU Optronics Corp. 0.00001, 01/17/12 (Luxembourg) (a) | | 183,500 | | | | 126,248 | |
United Microelectronics Corp., 0.000001, 01/24/17 (Luxembourg) (a) | | 631,528 | | | | 175,565 | |
Total Warrants
(cost $670,113) | | | | | | 301,813 | |
Other Investment Companies - 33.7% | | | | | | | |
Managers Global Bond Fund
(cost $31,352,006)6 | | 1,495,769 | | | | 26,400,316 | |
Short-Term Investments - 9.4%1 | | | | | | | |
Bank of New York Institutional Cash Reserve Fund, Series A, 1.07%3 | | 5,997,178 | | | | 5,997,178 | |
Bank of New York Institutional Cash Reserve Fund, Series B*3,4 | | 103,687 | | | | 12,183 | |
Bank of New York Institutional Cash Reserve Fund, Series C*3,5 | | 89,235 | | | | 89,235 | |
Dreyfus Cash Management Fund, Institutional Class Shares, 2.84%7 | | 1,272,119 | | | | 1,272,119 | |
Total Short-Term Investments
(cost $7,462,219) | | | | | | 7,370,715 | |
Total Investments - 108.7%
(cost $110,797,916) | | | | | | 85,136,029 | |
Other Assets, less Liabilities - (8.7)% | | | | | | (6,797,477 | ) |
Net Assets - 100.0% | | | | | $ | 78,338,552 | |
The accompanying notes are an integral part of these financial statements.
12
Managers Small Cap Fund
Portfolio Manager’s Comments
The Managers Small Cap Fund seeks to achieve long-term capital appreciation by investing primarily in the stocks of small-capitalization companies.
The Portfolio Manager
TimesSquare Capital Management LLC (“TimesSquare”) utilizes a bottom-up fundamental approach to small-cap investing. Led by co-managers Grant Babyak and Kenneth Duca, the investment team at TimesSquare believes its proprietary fundamental research skills, which place a particular emphasis on the assessment of management quality and an in-depth understanding of superior business models, enable the team to build a diversified portfolio of small-cap growth stocks designed to generate good risk-adjusted returns. When selecting small-cap growth stocks, the portfolio manager utilizes a fundamental, bottom-up process to identify companies that demonstrate consistent and sustainable revenue and earnings growth, offer distinct and sustainable competitive advantages, have strong, experienced management teams, have stock selling at reasonable valuations, and that the investment team believes have the potential to appreciate in price by 25-50% within the next 12-18 months.
The Year in Review
For the fiscal year ended October 31, 2008, the Managers Small Cap Fund (the “Fund”) returned - -34.58%, outperforming the Russell 2000 Growth Index®, which returned -37.87%.
The fiscal year ending October 2008 was one of the most turbulent periods in the history of financial markets. Credit is no longer in abundant supply as banks and finance companies work to shore up their balance sheets; thus tightening lending standards for consumers and businesses alike. Fannie Mae and Freddie Mac buckled under subprime mortgages and weak housing values and were placed under the U.S. Treasury’s conservatorship. Wall Street has been reshaped with the demise of Bear Stearns and Lehman Brothers, and the rush of Merrill Lynch into the waiting arms of Bank of America. The last two remaining major independent investment banks – Goldman Sachs and Morgan Stanley – have begun the process of restructuring themselves into bank holding companies. Consumer confidence has fallen to a record low in part due to a worsening labor picture. President-elect Barack Obama will likely inherit a very weak economy. The question is no longer whether the country is in a recession; the question is how long and how global in scope the recession will be? Policy makers and central banks around the world have introduced measures designed to fortify fragile markets dealing with unprecedented levels of volatility.
U.S. equities, as measured by the Russell indices, have plummeted across the style and market-cap spectrum. The Fund outperformed its benchmark on a relative basis in this difficult market environment due to its focus on well managed businesses possessing less risk. On a sector level, strong stock selection within several areas including information technology, industrials, and consumer discretionary contributed to relative performance. The Fund did, however, experience poor results in stock selection in the energy sector.
Among the Fund’s technology-oriented positions, Solera Holdings and Stanley were among the top contributors to relative performance. Solera, a solutions provider for auto insurance claims processing, has posted strong results in each quarter. Its geographic diversity gives the company growth opportunities and enables margin expansion. Solera’s shares rose 22.1% during the period. Stanley, an information technology company, possesses a healthy revenue mix from the Department of Defense and federal civilian government agencies. Stanley’s services include consulting, systems integration, logistics, outsourcing, and engineering. The company’s revenue growth and expanding project backlog drove its shares up 40.2%.
In industrials, the Fund’s top contributors included Watsco, which was up 56.8% and Clean Harbors which gained 24.8%. Watsco, a distributor of air conditioning, heating, and refrigeration equipment was a position held in the portfolio until mid-May at which point it had become fully valued according to price targets. During the recent market sell-off, management re-established a position in this well-run distributor, which generates free cash flow and possesses a clean balance sheet. Clean Harbors is involved in environmental services through two operating segments: Technical Services and Site Services. Technical Services collects, transports, treats, and disposes of waste. Site Services helps to maintain industrial facilities and is involved with the clean up of hazardous materials. The hurricane season and other disasters, such as the Midwest floods, create emergency response business opportunities for Clean Harbors. Hub Group was a substantial contributor among the Fund’s transportation-related holdings, rising 30.2%. Hub Group is an asset-light freight transportation management company that provides intermodal, truck brokerage, and logistics services. Hub’s intermodal freight shipping business combines truck and rail in order to present its customers with an efficient, cost-effective method of delivery. The company has experienced volume growth and improved pricing.
Energy prices have risen and fallen over the last 12 months as have the fortunes of many companies subject to the volatility of underlying commodity prices. Exterran dropped 72.7% and NATCO fell by 58.2%. Exterran, a supplier of compression outsourcing used in the natural gas industry, has been hampered by weakness in its domestic business and its difficulties in improving operating margins. Its international operations have performed well and are the driver of revenue growth. NATCO is an oil well equipment and service company that supplies unique technology used to separate oil and gas from water and other contaminants. The company experienced lost revenue from hurricane activity in the Gulf of Mexico. Management has been more upbeat recently with respect to customer booking activity.
The Fund experienced mixed results in health care. An underweight position in health care detracted from performance, whereas stock selection contributed to performance. Pharmion, a specialty pharmaceutical company, was acquired by Celgene in March. The company’s shares advanced 42.1% over the period. Respironics, one of two major participants involved in respiratory devices, gained 32.1% due to the premium at which it was acquired by Royal Philips Electronics.
An overweight to financial services stocks was also positive, however, stock selection was weak. Wright Express, a payment processing and information management service company to the fleet industry, lost 64.4% due in part to the volatility in gasoline prices, which impacted its hedging program. Amerisafe, which provides workers’ compensation insurance for employers in hazardous industries, was up 26.6% since the position was added to the Fund in April. Amerisafe is disciplined in its underwriting, has done well to retain clients and surpassed consensus estimates for the last three quarters.
13
Managers Small Cap Fund
Portfolio Manager’s Comments (continued)
TimesSquare remains focused on bottom-up identification and analysis of strong businesses with top-flight management teams that have the potential to produce consistent growth regardless of the environment. Further, TimesSquare’s goal is to build a portfolio of companies that seek to preserve capital in difficult periods, and participate in the upside during better times. Management appreciates your ongoing confidence in its ability to do so.
Cumulative Total Return Performance
Managers Small Cap’s cumulative total return is based on the daily change in net asset value (NAV), and assumes that all distributions were reinvested. The Russell 2000® Growth Index measures the performance of those Russell 2000® companies with higher price-to-book ratios and higher forecasted growth values. Unlike the Fund, the above stated index is unmanaged, is not available for investment, and does not incur expenses. This chart compares a hypothetical $10,000 investment made in the Managers Small Cap Fund on October 31, 1998 to a $10,000 investment made in the Russell 2000® Growth Index for the same time period. Performance for periods longer than one year is annualized. The graph and table do not reflect the deduction of taxes that a shareholder would pay on a Fund distribution or redemption of shares. The listed returns for the Fund are net of expenses and the returns for the index exclude expenses. Total returns for the Fund would have been lower had certain expenses not been reduced.
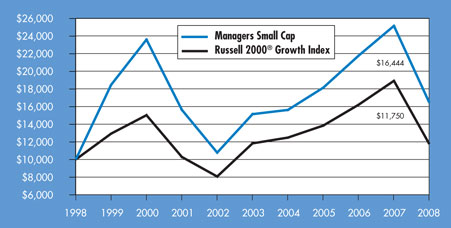
The table below shows the average annual total returns for the Managers Small Cap Fund and the Russell 2000® Growth Index since inception through October 31, 2008.
| | | | | | | | | |
Average Annualized Total Returns1 | | One Year | | | Five Years | | | Ten Years | |
Managers Small Cap2,3 | | (34.58 | )% | | 1.67 | % | | 5.10 | % |
Russell 2000® Growth Index | | (37.87 | )% | | (0.13 | )% | | 1.63 | % |
The performance data shown represents past performance. Past performance is not a guarantee of future results. Current performance may be lower or higher than the performance data quoted. The investment return and principal value of an investment in the Fund will fluctuate so that an investor’s shares, when redeemed, may be worth more or less than their original cost. For performance information through the most recent month end, please call (800) 835-3879 or visit our Web site at www.managersinvest.com.
In choosing a Fund, investors should carefully consider the amount they plan to invest, their investment objectives, the Fund’s investment objectives, risks, charges and expenses before investing. For this and other information, please call 800.835.3879 or visit www.managersinvest.com for a free prospectus. Read it carefully before investing or sending money. Distributed by Managers Distributors, Inc., member FINRA.
1 | Total return equals income yield plus share price change and assumes reinvestment of all dividends and capital gain distributions. Returns are net of fees and may reflect offsets of Fund expenses as described in the Prospectus. No adjustment has been made for taxes payable by shareholders on their reinvested dividends and capital gain distributions. Returns for periods greater than one year are annualized. The listed returns on the Fund are net of expenses and based on the published NAV as of October 31, 2008. All returns are in U.S. dollars($). |
2 | Fund for which, from time to time, the advisor has waived its fees and/or absorbed Fund expenses, which has resulted in higher returns. |
3 | The Fund is subject to risks associated with investments in small-capitalization companies, such as erratic earnings patterns, competitive conditions, limited earnings history, and a reliance on one or a limited number of products. |
The Russell 2000® Growth Index is a trademark of Russell Investments. Russell® is a trademark of Russell Investments. An investment cannot be made directly into an index.
Not FDIC insured, nor bank guaranteed. May lose value.
14
Managers Small Cap Fund
Fund Snapshots
October 31, 2008
Portfolio Breakdown
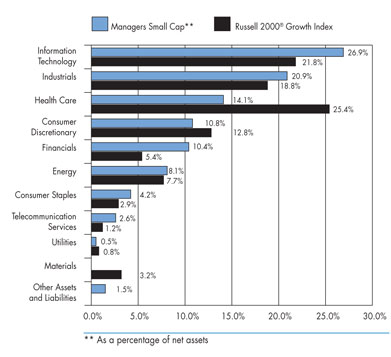
| | | | | | |
Industry | | Managers
Small Cap** | | | Russell 2000®
Growth Index | |
Information Technology | | 26.9 | % | | 21.8 | % |
Industrials | | 20.9 | % | | 18.8 | % |
Health Care | | 14.1 | % | | 25.4 | % |
Consumer Discretionary | | 10.8 | % | | 12.8 | % |
Financials | | 10.4 | % | | 5.4 | % |
Energy | | 8.1 | % | | 7.7 | % |
Consumer Staples | | 4.2 | % | | 2.9 | % |
Telecommunication Services | | 2.6 | % | | 1.2 | % |
Utilities | | 0.5 | % | | 0.8 | % |
Materials | | 0.0 | % | | 3.2 | % |
Other Assets and Liabilities | | 1.5 | % | | 0.0 | % |
Top Ten Holdings
| | | |
Security Name | | Percentage
of Net Assets | |
Solera Holdings, Inc.* | | 3.0 | % |
Global Payments, Inc.* | | 2.9 | |
Bio-Rad Laboratories, Inc.* | | 2.2 | |
Capella Education Co. | | 2.1 | |
Haemonetics Corp.* | | 1.9 | |
NTELOS Holdings Corp. | | 1.9 | |
Arena Resources, Inc.* | | 1.8 | |
Henry (Jack) & Associates, Inc.* | | 1.6 | |
SkillSoft PLC | | 1.6 | |
Corinthian Colleges, Inc. | | 1.6 | |
| | | |
Top Ten as a Group | | 20.6 | % |
| | | |
| * | Top Ten Holding at April 30, 2008 |
Any sectors, industries, or securities discussed should not be perceived as investment recommendations. Mention of a specific security should not be considered a recommendation to buy or solicitation to sell that security.
15
Managers Small Cap Fund
Schedule of Portfolio Investments
October 31, 2008
| | | | | | |
| | | Shares | | | Value |
Common Stocks - 98.5% | | | | | | |
Consumer Discretionary - 10.8% | | | | | | |
American Public Education, Inc.* | | 17,300 | | | $ | 765,871 |
Arbitron, Inc. | | 8,600 | 2 | | | 280,188 |
Capella Education Co.* | | 22,700 | | | | 1,075,980 |
Corinthian Colleges, Inc.* | | 55,700 | 2 | | | 795,396 |
FGX International Holdings, Ltd.* | | 23,600 | | | | 259,600 |
Gaylord Entertainment Co., Class A* | | 22,700 | | | | 486,007 |
Hibbett Sports, Inc.* | | 14,600 | | | | 260,026 |
Iconix Brand Group, Inc.* | | 26,600 | | | | 289,674 |
Monro Muffler Brake, Inc. | | 22,300 | | | | 480,119 |
Orient-Express Hotels, Ltd. | | 11,300 | | | | 138,990 |
Pool Corp. | | 21,550 | | | | 375,186 |
RRSat Global Communications Network, Ltd. | | 31,300 | | | | 323,642 |
Total Consumer Discretionary | | | | | | 5,530,679 |
Consumer Staples - 4.2% | | | | | | |
Chattem, Inc.* | | 9,000 | 2 | | | 681,030 |
Green Mountain Coffee Roasters, Inc.* | | 12,400 | 2 | | | 359,476 |
Herbalife, Ltd. | | 15,900 | | | | 388,437 |
Smart Balance, Inc.* | | 43,000 | | | | 307,880 |
United Natural Foods, Inc.* | | 18,900 | | | | 422,226 |
Total Consumer Staples | | | | | | 2,159,049 |
Energy - 8.1% | | | | | | |
Approach Resources, Inc.* | | 32,200 | | | | 350,980 |
Arena Resources, Inc.* | | 29,400 | | | | 896,112 |
Cal Dive International, Inc.* | | 43,500 | | | | 370,185 |
Concho Resources, Inc.* | | 31,800 | 2 | | | 675,750 |
Exterran Holdings, Inc.* | | 14,800 | 2 | | | 331,668 |
Hercules Offshore, Inc.* | | 24,570 | | | | 179,115 |
NATCO Group, Inc.* | | 20,800 | | | | 439,712 |
Quicksilver Resources, Inc.* | | 25,400 | | | | 265,938 |
Rex Energy Corp.* | | 29,200 | 2 | | | 197,976 |
T-3 Energy Services, Inc.* | | 17,100 | | | | 412,281 |
Total Energy | | | | | | 4,119,717 |
Financials - 10.4% | | | | | | |
Amerisafe, Inc.* | | 18,900 | | | | 325,836 |
Argo Group International Holdings, Ltd.* | | 22,774 | | | | 726,491 |
Assured Guaranty, Ltd. | | 33,400 | | | | 375,082 |
Bank of Florida Corp.* | | 20,900 | | | | 127,490 |
Cohen & Steers, Inc. | | 13,800 | | | | 250,746 |
Evercore Partners, Inc., Class A | | 22,400 | | | | 272,608 |
Jefferies Group, Inc. | | 15,300 | | | | 242,199 |
National Financial Partners Corp. | | 33,100 | 2 | | | 220,446 |
optionsXpress, Inc. | | 38,700 | | | | 687,312 |
Portfolio Recovery Associates, Inc.* | | 17,800 | | | | 638,664 |
Resource America, Inc. | | 18,900 | | | | 108,675 |
Safety Insurance Group, Inc. | | 12,800 | | | | 486,272 |
Webster Financial Corp. | | 23,300 | 2 | | | 431,982 |
Wintrust Financial Corp. | | 16,700 | 2 | | | 427,520 |
Total Financials | | | | | | 5,321,323 |
Health Care - 14.1% | | | | | | |
Align Technology, Inc.* | | 41,100 | 2 | | | 284,823 |
American Dental Partners, Inc.* | | 31,650 | | | | 276,304 |
AtriCure, Inc.* | | 39,900 | | | | 258,153 |
BioMarin Pharmaceutical, Inc.* | | 26,300 | | | | 481,816 |
Bio-Rad Laboratories, Inc., Class A* | | 12,880 | | | | 1,099,694 |
Catalyst Health Solutions, Inc. | | 22,200 | | | | 374,514 |
Emergency Medical Services Corp., Class A* | | 9,900 | | | | 325,314 |
Haemonetics Corp.* | | 16,700 | | | | 986,302 |
K-V Pharmaceutical Co., Class A* | | 9,900 | 2 | | | 168,300 |
Magellan Health Services, Inc.* | | 20,700 | | | | 764,658 |
MedAssets, Inc.* | | 34,500 | | | | 497,835 |
Mentor Corp. | | 25,900 | 2 | | | 437,710 |
Volcano Corp.* | | 38,400 | | | | 597,120 |
WellCare Health Plans, Inc.* | | 15,800 | 2 | | | 381,886 |
WuXi PharmaTech, Inc.* | | 31,100 | | | | 291,096 |
Total Health Care | | | | | | 7,225,525 |
Industrials - 20.9% | | | | | | |
Advisory Board Co., The* | | 14,600 | | | | 359,890 |
American Reprographics Co.* | | 24,400 | | | | 259,616 |
Clean Harbors, Inc.* | | 8,200 | | | | 537,674 |
Columbus McKinnon Corp.* | | 26,000 | 2 | | | 365,040 |
Corporate Executive Board Co. | | 17,900 | | | | 533,957 |
CoStar Group, Inc.* | | 16,400 | | | | 590,728 |
Duff & Phelps Corp., Class A* | | 10,800 | | | | 205,200 |
Energy Recovery, Inc.* | | 26,900 | 2 | | | 156,020 |
Hub Group, Inc.* | | 19,100 | | | | 600,695 |
Huron Consulting Group, Inc.* | | 11,000 | | | | 598,070 |
Interline Brands, Inc.* | | 40,000 | | | | 425,600 |
Middleby Corp., The* | | 9,100 | 2 | | | 367,549 |
The accompanying notes are an integral part of these financial statements.
16
Managers Small Cap Fund
Schedule of Portfolio Investments (continued)
| | | | | | | |
| | | Shares | | | Value | |
Industrials - 20.9% (continued) | | | | | | | |
Mobile Mini, Inc.* | | 35,900 | | | $ | 603,120 | |
On Assignment, Inc.* | | 75,900 | | | | 493,350 | |
Orbital Sciences Corp.* | | 29,200 | | | | 598,308 | |
RBC Bearings, Inc.* | | 16,800 | | | | 398,664 | |
Regal-Beloit Corp. | | 12,000 | 2 | | | 390,720 | |
Resources Connection, Inc.* | | 40,900 | | | | 709,206 | |
Stanley, Inc.* | | 21,000 | | | | 719,460 | |
Stericycle, Inc.* | | 5,800 | | | | 338,894 | |
Transdigm Group, Inc.* | | 20,800 | 2 | | | 626,912 | |
UTI Worldwide, Inc. | | 36,900 | | | | 433,944 | |
Watsco, Inc. | | 8,600 | 2 | | | 353,374 | |
Total Industrials | | | | | | 10,665,991 | |
Information Technology - 26.9% | | | | | | | |
Advanced Analogic Technologies, Inc.* | | 114,700 | | | | 345,247 | |
Alvarion, Ltd.* | | 56,900 | | | | 197,443 | |
Blackboard, Inc.* | | 10,600 | 2 | | | 259,488 | |
Cognex Corp. | | 27,500 | | | | 440,550 | |
CommVault Systems, Inc.* | | 28,600 | | | | 306,020 | |
Constant Contact, Inc.* | | 21,700 | | | | 260,617 | |
CPI International, Inc.* | | 44,200 | | | | 435,812 | |
CyberSource Corp.* | | 25,339 | | | | 307,869 | |
DealerTrack Holdings, Inc.* | | 44,700 | | | | 479,631 | |
Global Payments, Inc. | | 36,100 | | | | 1,462,411 | |
Hittite Microwave Corp.* | | 17,700 | | | | 580,029 | |
Informatica Corp.* | | 46,400 | | | | 651,920 | |
Information Services Group, Inc.* | | 3,500 | | | | 9,625 | |
J2 Global Communications, Inc.* | | 38,400 | | | | 619,008 | |
Jack Henry & Associates, Inc. | | 42,800 | 2 | | | 813,628 | |
Monolithic Power Systems, Inc.* | | 36,900 | | | | 626,931 | |
Monotype Imaging Holdings, Inc.* | | 28,600 | | | | 194,766 | |
Netezza Corp.* | | 26,600 | | | | 258,020 | |
ORBCOMM, Inc.* | | 38,400 | | | | 115,200 | |
Power Integrations, Inc.* | | 19,500 | | | | 409,305 | |
SkillSoft PLC* | | 103,600 | | | | 797,720 | |
Solera Holdings, Inc.* | | 60,600 | | | | 1,508,334 | |
SRA International, Inc.* | | 17,200 | | | | 317,856 | |
Synaptics, Inc.* | | 12,900 | | | | 398,481 | |
Ultimate Software Group, Inc., The* | | 28,300 | | | | 377,239 | |
Varian Semiconductor Equipment Associates, Inc.* | | 12,200 | 2 | | | 239,364 | |
VeriFone Holdings, Inc.* | | 25,600 | 2 | | | 290,816 | |
ViaSat, Inc.* | | 29,800 | | | | 542,956 | |
Wright Express Corp.* | | 34,400 | | | | 470,936 | |
Total Information Technology | | | | | | 13,717,222 | |
Telecommunication Services - 2.6% | | | | | | | |
General Communication, Inc., Class A* | | 47,000 | | | | 360,960 | |
NTELOS Holdings Corp. | | 37,500 | | | | 975,000 | |
Total Telecommunication Services | | | | | | 1,335,960 | |
Utilities - 0.5% | | | | | | | |
ITC Holdings Corp. | | 5,700 | | | | 231,306 | |
Total Common Stocks
(cost $55,964,793) | | | | | | 50,306,772 | |
Other Investment Companies - 11.5%1 | | | | | | | |
Bank of New York Institutional Cash Reserve Fund, Series A, 1.07%3 | | 4,890,145 | | | | 4,890,145 | |
Bank of New York Institutional Cash Reserve Fund, Series B*3,4 | | 118,432 | | | | 13,916 | |
Bank of New York Institutional Cash Reserve Fund, Series C*3,5 | | 73,879 | | | | 73,879 | |
Dreyfus Cash Management Fund, Institutional Class Shares, 2.84%7 | | 909,438 | | | | 909,438 | |
Total Other Investment Companies
(cost $5,991,894) | | | | | | 5,887,378 | |
Total Investments - 110.0%
(cost $61,956,687) | | | | | | 56,194,150 | |
Other Assets, less Liabilities - (10.0)% | | | | | | (5,136,830 | ) |
Net Assets - 100.0% | | | | | $ | 51,057,320 | |
The accompanying notes are an integral part of these financial statements.
17
Managers Fremont Micro-Cap Fund
Portfolio Manager’s Comments
The Managers Fremont Micro-Cap Fund primarily invests in the stocks of U.S. micro-capitalization companies. These companies have market capitalizations that, at the time of initial purchase, place them among the smallest 5% of companies listed on U.S. stock markets. Normally, the Fund will invest at least 80% of its assets in U.S. micro-cap stocks. The Fund employs multiple portfolio managers who specialize in distinct investment approaches. This “intelligence diversification” not only serves to manage risk, but also seeks to incorporate into the portfolio the breadth of the micro-cap market by focusing different analytical insights on micro-cap investing. The Fund’s team of subadvisors strive to achieve this performance and diversification while ensuring that the Fund operates within the framework of its investment objective and principal investment strategies. The Russell 2000® Index is the benchmark for the Fund.
The Portfolio Managers
Lord, Abbett & Co., LLC (“Lord Abbett”)
The team focuses its stock selection effort by focusing on companies that have revenue growth of at least 15%, are experiencing year-to-year operating margin improvement and are experiencing earnings growth that is driven by top-line growth rather than being driven by one time events or simple cost-cutting measures. The focus is also on identifying companies with higher quality balance sheets (often captured by finding companies with manageable debt-to-total-capital ratios) and that are already profitable. Once this process is completed, the focus for the team is on forecasting both revenue and earnings growth over the next several years. To achieve this goal, and to find companies that are expected to grow faster than their industry average, members of the team spend an extensive amount of time understanding the competitive advantages of a firm, the industry dynamics within which they operate, and the strength of management.
The sell discipline is enacted if there is a fundamental change in the business, a more attractive alternative is found, or if a holding reaches a 5% weight in the overall portfolio. The Lord Abbett portfolio typically holds between 75 and 100 stocks with no individual holding exceeding 5%. There is a risk constraint that prevents any individual industry from being greater than 25% of the total portfolio weight. The annual turnover of the portfolio is expected to be relatively high although there is no explicit target as part of either the stock selection or the portfolio-construction processes.
Next Century Growth Investors, LLC (“Next Century”)
The team requires historical revenue growth of at least 15% for a company before conducting further research. Other key factors considered initially by the team are strong historical revenue growth, low debt and high ROE. Quantitative screening is done on a regular basis to see which stocks over the past year are experiencing significant growth. The next stage of this process involves intensive first-hand research to determine the growth prospects of a company with the team choosing a stock only when it has become convinced a company has an extraordinary opportunity to grow its business. The uniqueness of this process lies in the fact that the team seeks out these companies regardless of their short-term prospects and\or current valuation. The team is looking for “home runs” and companies that will grow to the point that they will eventually reach a small market capitalization.
The sell discipline is enacted if there is a change in the original investment thesis or a fundamental change in business of the company. In addition, a holding will become a candidate for sale if it reaches an extreme valuation, becomes larger than 5% of the overall portfolio or as it approaches $1 billion in market capitalization. Typically companies are sold out of the micro-cap portfolio because they have approached $1 billion in market capitalization.
The Next Century portfolio is concentrated and typically has 40-60 holdings, which can create a high level of volatility. The only risk constraints are that sector weights cannot exceed two times the Russell 2000® Growth sector weights, and no individual holding can be greater than 5% of the portfolio.
OFI Institutional Asset Management (“OFI”)
The team relies on both quantitative and qualitative tools to help with their stock selection process. The team quantitatively screens on both quality and value characteristics, such as high return on equity and assets for quality and low Price/Earnings and Price/ Book ratios for valuation. The quality and valuation screen leaves the team with a strong, focused universe with which to conduct its fundamental analysis where the team spends more time meeting with company management as well as customers and suppliers in an effort to better understand the dynamics of the industry within which a company operates. The analysts then use a discounted cash flow analysis to arrive at a price target for each security, using a static discount rate over a 1-year rolling time horizon.
The sell discipline is enacted if a stock achieves desired profitability or valuation, or the fundamentals of the original investment thesis deteriorate. In addition, a stock may be sold if a more attractive opportunity is found in the portfolio or if a stock reaches a 5% total position. The OFI managed portfolio typically holds between 40-70 securities, with position sizes generally ranging from 1% to 3% with a maximum of 5% allowed in any one holding. In addition, there is a constraint that limits the maximum exposure to any sector at 30%.
WEDGE Capital Management L.L.P. (“WEDGE”)
The investment process is a combination of both quantitative and fundamental research insights. The quantitative portion of the investment process uses commonly found factors and characteristics that can be accessed via any number of commercial databases. The value-added portion of the process, therefore, uses a number of different factors across five major categories: valuation, earnings quality, operating efficiency, capital usage and momentum, whose efficacy has been verified via long-term regression analysis. This is the Fundamental Value model. The top results of this model are combined with the best resulting stocks from the Financial Quality model, which measures stocks across categories such as multiple earnings growth, profitability, leverage and liquidity. The top stocks that appear in both models are eligible for fundamental research. The fundamental research portion of the investment process is exclusionary in nature and meant to eliminate stocks that are not strong in earnings forecasts, valuation metrics, sector\industry outlook or any factor that can not be easily captured quantitatively.
18
Managers Fremont Micro-Cap Fund
Portfolio Manager’s Comments (continued)
A stock is scrutinized for possible sale if it falls below the top four deciles in the Fundamental Value model. Stocks are sold when they become fairly valued, an upgrade opportunity develops or the original investment thesis materially deteriorates. The portfolio managed by WEDGE is confined to plus or minus 10% in any given sector although sector positions tend to be much closer to the index weight than this (it should be noted that these self-imposed sector weighting constraints are based on a proprietary liquidity analysis conducted on an ongoing basis by the micro-cap team and is NOT driven by the sector weightings of any micro-cap benchmark). The final portfolio is a well diversified micro-cap portfolio holding approximately 150 securities and consistently maintaining a value bias relative to the benchmark. The portfolio tends to hold securities within the $40 million to $400 million market capitalization range, although does not require a sale of a holding until it reaches $800 million in market capitalization.
The Year in Review
The financial markets were under significant pressure during a majority of the fiscal year ending October 31, 2008. The period began with the focus of investors on the U.S. housing crisis and eventually morphed into concerns about a broader credit crisis both in the U.S. and abroad. Despite these fears, stocks saw a rebound in April and May before selling off dramatically towards the end of the second quarter as investors’ concerns over surging commodity prices, continuing fallout from the credit crisis, slowing economic growth, and declining corporate profits took center stage. Volatility remained high during July and August as major headlines included falling energy and commodity prices along with higher-than-expected economic growth, countered by further contraction in housing, weakness in the labor markets, tighter credit conditions, and uncertainty about the stability of Fannie Mae and Freddie Mac. July and August proved to be the calm before the storm, as the number of events significantly affecting the markets in September greatly outnumbered any other period in recent memory. September included the U.S. Treasury’s bailout of mortgage agencies Fannie Mae and Freddie Mac as well as insurer AIG. In addition, market turmoil even extended to money markets where interbank lending rates soared to record highs as banks hoarded cash. In October, Congress approved a $700 billion “bailout” called the Troubled Asset Relief Program (TARP) with the goal of opening up credit markets by buying distressed assets.
The micro-cap universe and Managers Fremont Micro-Cap Fund were not immune to the aforementioned market downturn. For the past fiscal year, the Fund returned -39.37% while the benchmark Russell Micro-Cap® Index returned -39.30% during this same time. While absolute returns have been disappointing, the performance versus the benchmark has been strong since the Fund’s restructuring to a multi-manager, multi-style approach earlier this year. The new subadvisory team assembled in early 2008 consists of four investment managers, each with a unique philosophy and investment process: Lord, Abbett & Co. LLC, OFI Institutional Asset Management, Inc., Next Century Growth Investors LLC, and WEDGE Capital Management L.L.P. The Fund had previously been managed by a single subadvisor, Kern Capital Management, LLC. Both Lord Abbett and Next Century provide growth-oriented philosophies and investment processes in the management of their portions of the Fund. OFI has a bottom-up, core fundamental investment style, and WEDGE uses a quantitative, value-oriented investment philosophy and process. Managers believes that these four subadvisors are among the most respected portfolio managers in micro-cap investing, and in combination they provide the Fund with a well-diversified micro-cap portfolio while maintaining strong performance potential by applying complementary approaches to investment management.
For this period, the portfolio managers of the Fund were the beneficiaries of good stock selection across a number of different sectors including the consumer discretionary and information technology sectors. On the downside, some relative performance was detracted during the latter portion of this period by virtue of the rather large underweighting the Fund maintains to the financials sector, which rebounded from its very weak performance earlier in the year. Each of the four subadvisors within the Fund maintains a significant underweighting to the sector reflecting minimal quality growth opportunities in financial stocks in general.
Looking Forward
The portfolio managers’ focus on companies that can “self-finance” their growth continues to be well-rewarded, particularly in the current market environment, as tight credit conditions do not bode well for companies that are highly dependent on outside financing for their long-term growth prospects. Broadly speaking, the Fund appears positioned to potentially take advantage of a global economic recovery if, and when, the fiscal and monetary actions taken over the past several months begin to take hold. In the meantime, the Fund maintains large absolute and relative overweights to biotech stocks, as well as to companies within the industrials and information technology sectors. The portfolio managers continue to believe that the high level of recent market volatility has created an excellent opportunity to add companies with solid business plans now selling at much more compelling valuations.
19
Managers Fremont Micro-Cap Fund
Portfolio Manager’s Comments (continued)
Cumulative Total Return Performance
Managers Fremont Micro-Cap Fund’s cumulative total return is based on the daily change in net asset value (NAV), and assumes that all distributions were reinvested. The Russell 2000 Growth® Index measures the performance of those Russell 2000® companies with higher price-to-book ratios and higher forecasted growth values. This chart compares a hypothetical $10,000 investment made in the Managers Fremont Micro-Cap Fund on October 31, 1998, to a $10,000 investment made in the Russell 2000® Growth Index for the same time period. The graph and table do not reflect the deduction of taxes that a shareholder would pay on a Fund distribution or redemption of shares. Past performance is not indicative of future results.
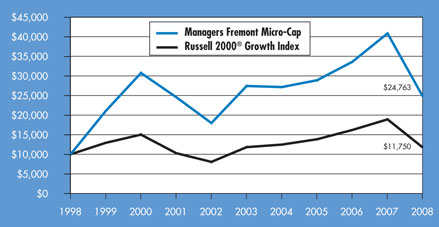
The table below shows the average annualized total returns for the Managers Fremont Micro-Cap Fund, the Russell Microcap® Index and the Russell 2000® Growth Index for the one-year, five-year and ten-year periods ending October 31, 2008.
| | | | | | | | | |
Average Annual Total Returns 1,2 | | One Year | | | Five Years | | | Ten Years | |
Managers Fremont Micro-Cap 4 | | (39.37 | )% | | (2.02 | )% | | 9.49 | % |
Russell Microcap® Index 3 | | (39.30 | )% | | (2.25 | )% | | — | 5 |
Russell 2000® Growth Index | | (37.87 | )% | | (0.13 | )% | | 1.63 | % |
The performance data shown represents past performance. Past performance is not a guarantee of future results. Current performance may be lower or higher than the performance data quoted. The investment return and principal value of an investment in the Fund will fluctuate so that an investor’s shares, when redeemed, may be worth more or less than their original cost. For performance information through the most recent month end, please call (800) 835-3879 or visit our Web site at www.managersinvest.com.
In choosing a Fund, investors should carefully consider the amount they plan to invest, their investment objectives, the Fund’s investment objectives, risks, charges and expenses before investing. For this and other information, please call 800.835.3879 or visit www.managersinvest.com for a free prospectus. Read it carefully before investing or sending money. Distributed by Managers Distributors, Inc., member FINRA.
1 | Total return equals income yield plus share price change and assumes reinvestment of all dividends and capital gain distributions. Returns are net of fees and may reflect offsets of Fund expenses as described in the Prospectus. No adjustment has been made for taxes payable by shareholders on their reinvested dividends and capital gain distributions. Returns for periods greater than one year are annualized. The listed returns on the Fund are net of expenses and based on the published NAV as of October 31, 2008. All returns are in U.S. dollars($). |
2 | The Funds are subject to the special risks associated with investments in micro-cap companies, such as relatively short earnings histories, competitive conditions, less publicly available corporate information, and reliance on a limited number of products. |
3 | Russell Microcap® Index tracks the micro-cap segment of the U.S. equity market. It makes up less than 3% of the U.S. Equity market and is represented by the smallest 1,000 securities in the small-cap Russell 2000® Index plus the next 1,000 securities. The Index reflects no deduction of fees, expenses, or taxes. |
4 | Fund for which, from time to time, the advisor has waived its fees and/or absorbed Fund expenses, which has resulted in higher returns. |
5 | Since the Russell Microcap® Index’s inception date of June 30, 2000, the average annual total return for the Index was 2.14%. |
Russell 2000® Growth Index was the Fund’s prior benchmark. The Investment Manager changed the benchmark to the Russell Microcap® Index because it determined that the Russell Microcap® Index more accurately reflects the types of securities in which the Fund invests. The Russell 2000® Growth Index measures the performance of those companies in the Russell 2000® Index with higher price-to-book ratios and higher forecasted values. The Russell 2000® Index measures the performance of the 2,000 smallest companies in the Russell 3000® Index, which measures the performance of the 3,000 largest U.S. companies based on total market capitalization. The Index reflects no deduction of fees, expenses, or taxes.
The Russell Microcap® Index, the Russell 2000® Growth Index and the Russell 2000® Index are registered trademarks of Russell Investments. Russell® is a trademark of Russell Investments.
Not FDIC insured, nor bank guaranteed. May lose value.
20
Managers Fremont Micro-Cap Fund
Fund Snapshots
October 31, 2008
Portfolio Breakdown
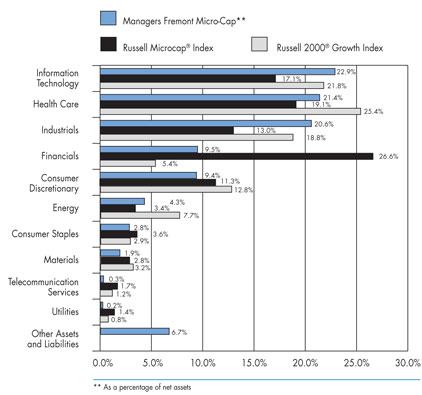
| | | | | | | | | |
Industry | | Managers Fremont
Micro Cap** | | | Russell
Microcap®
Index | | | Russell 2000®
Growth Index | |
Information Technology | | 22.9 | % | | 17.1 | % | | 21.8 | % |
Health Care | | 21.4 | % | | 19.1 | % | | 25.4 | % |
Industrials | | 20.6 | % | | 13.0 | % | | 18.8 | % |
Financials | | 9.5 | % | | 26.6 | % | | 5.4 | % |
Consumer Discretionary | | 9.4 | % | | 11.3 | % | | 12.8 | % |
Energy | | 4.3 | % | | 3.4 | % | | 7.7 | % |
Consumer Staples | | 2.8 | % | | 3.6 | % | | 2.9 | % |
Materials | | 1.9 | % | | 2.8 | % | | 3.2 | % |
Telecommunication Services | | 0.3 | % | | 1.7 | % | | 1.2 | % |
Utilities | | 0.2 | % | | 1.4 | % | | 0.8 | % |
Other Assets and Liabilities | | 6.7 | % | | 0.0 | % | | 0.0 | % |
Top Ten Holdings
| | | |
Security Name | | Percentage of Net
Assets | |
HMS Holdings Corp. | | 1.9 | % |
Bio-Reference Laboratories, Inc.* | | 1.7 | |
LaBarge, Inc. | | 1.5 | |
Multi-Color Corp.* | | 1.3 | |
Exponent, Inc.* | | 1.2 | |
MWI Veterinary Supply, Inc. | | 1.2 | |
EMS Technologies, Inc.* | | 1.1 | |
CardioNet, Inc. | | 1.1 | |
Balchem Corp.* | | 1.0 | |
Standard Parking Corp. | | 0.9 | |
| | | |
Top Ten as a Group | | 12.9 | % |
| | | |
| * | Top Ten Holding at April 30, 2008 |
Any sectors, industries, or securities discussed should not be perceived as investment recommendations. Mention of a specific security should not be considered a recommendation to buy or solicitation to sell that security.
21
Managers Fremont Micro-Cap Fund
Schedule of Portfolio Investments
October 31, 2008
| | | | | |
| | | Shares | | Value |
Common Stocks - 93.3% | | | | | |
Consumer Discretionary - 9.4% | | | | | |
AC Moore Arts & Crafts, Inc.* | | 45,700 | | $ | 127,046 |
Ambassadors Group, Inc. | | 47,300 | | | 493,812 |
American Public Education, Inc.* | | 25,440 | | | 1,126,228 |
Ark Restaurants Corp. | | 3,100 | | | 38,719 |
BJ’s Restaurants, Inc.* | | 20,005 | | | 177,844 |
Buffalo Wild Wings, Inc.* | | 20,425 | | | 577,619 |
Cache, Inc.* | | 94,700 | | | 339,973 |
California Pizza Kitchen, Inc.* | | 23,800 | | | 232,526 |
Christopher & Banks Corp. | | 19,900 | | | 103,878 |
Citi Trends, Inc.* | | 50,100 | | | 838,173 |
Core-Mark Holding Co., Inc.* | | 8,000 | | | 158,160 |
CSS Industries, Inc. | | 9,700 | | | 215,340 |
Famous Dave’s of America, Inc.* | | 20,000 | | | 83,800 |
FGX International Holdings, Ltd.* | | 70,800 | | | 778,800 |
Fuel Systems Solutions, Inc.* | | 17,800 | | | 506,410 |
Hibbett Sports, Inc.* | | 20,600 | | | 366,886 |
Hooker Furniture Corp. | | 10,700 | | | 97,477 |
Jo-Ann Stores, Inc.* | | 8,700 | | | 166,692 |
K12, Inc.* | | 20,100 | | | 552,750 |
Kenneth Cole Productions, Inc. | | 18,307 | | | 243,117 |
Learning Tree International, Inc.* | | 13,600 | | | 173,400 |
Lincoln Educational Services Corp.* | | 11,100 | | | 160,506 |
Luby’s, Inc.* | | 56,600 | | | 273,944 |
Maidenform Brands, Inc.* | | 29,900 | | | 328,302 |
Marine Products Corp. | | 28,087 | | | 173,859 |
McCormick & Schmick’s Seafood Restaurants, Inc.* | | 43,100 | | | 210,759 |
Midas, Inc.* | | 13,000 | | | 169,390 |
Monro Muffler Brake, Inc. | | 14,400 | | | 310,032 |
Morton’s Restaurant Group, Inc.* | | 24,100 | | | 83,386 |
O’Charley’s, Inc. | | 24,800 | | | 186,000 |
Peet’s Coffee & Tea, Inc.* | | 3,400 | | | 76,364 |
Pinnacle Entertainment, Inc.* | | 60,400 | | | 338,240 |
RC2 Corp.* | | 10,225 | | | 129,858 |
Rentrak Corp.* | | 8,600 | | | 97,610 |
Shiloh Industries, Inc.* | | 11,400 | | | 57,114 |
Stamps.com, Inc.* | | 9,900 | | | 96,624 |
Steiner Leisure, Ltd.* | | 29,500 | | | 764,050 |
Steinway Musical Instruments, Inc.* | | 7,800 | | | 173,628 |
The Finish Line, Inc., Class A | | 20,900 | | | 200,013 |
True Religion Apparel, Inc.* | | 35,700 | | | 597,975 |
Ulta Salon, Cosmetics & Fragrance, Inc.* | | 7,900 | | | 69,678 |
Universal Electronics, Inc.* | | 13,100 | | | 276,803 |
Westport Innovations, Inc.* | | 19,300 | | | 85,499 |
Zumiez, Inc.* | | 12,330 | | | 120,341 |
Total Consumer Discretionary | | | | | 12,378,625 |
Consumer Staples - 2.8% | | | | | |
Boston Beer Co., Inc.* | | 19,000 | | | 718,010 |
Elizabeth Arden, Inc.* | | 13,500 | | | 233,415 |
Green Mountain Coffee Roasters, Inc.* | | 22,810 | | | 661,262 |
Inter Parfums, Inc. | | 6,300 | | | 73,458 |
J&J Snack Foods Corp. | | 7,400 | | | 232,064 |
Lance, Inc. | | 8,400 | | | 17,796 |
Nutraceutical International Corp.* | | 7,400 | | | 67,710 |
Rocky Mountain Chocolate Factory, Inc. | | 9,000 | | | 63,540 |
Smart Balance, Inc.* | | 149,300 | | | 1,068,987 |
Zhongpin, Inc.* | | 50,200 | | | 432,222 |
Total Consumer Staples | | | | | 3,724,464 |
Energy - 4.3% | | | | | |
Bolt Technology Corp.* | | 5,400 | | | 43,794 |
Brigham Exploration Co.* | | 64,480 | | | 505,523 |
Carrizo Oil & Gas, Inc.* | | 28,400 | | | 664,276 |
Dawson Geophysical Co.* | | 26,000 | | | 637,780 |
Gulf Island Fabrication, Inc. | | 17,200 | | | 339,012 |
Mitcham Industries, Inc.* | | 5,500 | | | 30,030 |
National Coal Corp.* | | 151,050 | | | 648,004 |
Northern Oil & Gas, Inc.* | | 85,795 | | | 467,583 |
Parallel Petroleum Corp.* | | 32,510 | | | 130,365 |
PetroQuest Energy, Inc.* | | 38,120 | | | 379,294 |
Rex Energy Corp.* | | 45,865 | | | 310,965 |
RPC, Inc. | | 46,200 | | | 489,258 |
T-3 Energy Services, Inc.* | | 27,260 | | | 657,239 |
TGC Industries, Inc.* | | 26,794 | | | 60,286 |
Union Drilling, Inc.* | | 66,200 | | | 362,776 |
Total Energy | | | | | 5,726,185 |
Financials - 9.5% | | | | | |
Abington Bancorp, Inc. | | 19,400 | | | 200,790 |
American Physicians Capital, Inc. | | 6,900 | | | 282,279 |
Amerisafe, Inc.* | | 18,106 | | | 312,147 |
Associated Estates Realty Corp. | | 11,400 | | | 93,024 |
The accompanying notes are an integral part of these financial statements.
22
Managers Fremont Micro-Cap Fund
Schedule of Portfolio Investments (continued)
| | | | | |
| | | Shares | | Value |
Financials - 9.3% (continued) | | | | | |
Baldwin & Lyons, Inc. | | 3,700 | | $ | 67,303 |
Bancorp Rhode Island, Inc. | | 22,147 | | | 536,400 |
Bank of the Ozarks, Inc. | | 14,200 | | | 431,680 |
Berkshire Hills Bancorp, Inc. | | 6,600 | | | 171,798 |
Bryn Mawr Bank Corp. | | 4,500 | | | 95,355 |
Center Financial Corp. | | 16,400 | | | 168,920 |
Columbia Banking Systems | | 24,500 | | | 390,040 |
Community Trust Bancorp, Inc. | | 10,200 | | | 340,476 |
Donegal Group, Inc. | | 33,547 | | | 549,500 |
Eastern Insurance Holdings, Inc. | | 12,100 | | | 113,619 |
Financial Institutions, Inc. | | 51,755 | | | 838,949 |
First Bancorp (NC) | | 5,500 | | | 96,250 |
First Cash Financial Services, Inc.* | | 19,100 | | | 293,567 |
First Community Bancshares, Inc. | | 9,175 | | | 287,178 |
First Financial Holdings, Inc. | | 16,673 | | | 361,804 |
Flushing Financial Corp. | | 16,900 | | | 262,795 |
Hallmark Financial Services, Inc.* | | 17,700 | | | 115,050 |
Iberia Bank Corp. | | 8,600 | | | 438,084 |
Independent Bank Corp. (MA) | | 10,700 | | | 307,839 |
Lakeland Bancorp, Inc. | | 24,900 | | | 274,398 |
Legacy Bancorp, Inc. | | 56,685 | | | 739,172 |
Meadowbrook Insurance Group, Inc. | | 47,900 | | | 252,433 |
Mission West Properties, Inc. | | 11,900 | | | 103,054 |
OceanFirst Financial Corp., Inc. | | 38,000 | | | 630,420 |
Penson Worldwide, Inc.* | | 80,800 | | | 576,912 |
Pinnacle Financial Partners, Inc.* | | 10,052 | | | 294,122 |
S.Y. Bancorp, Inc. | | 12,900 | | | 355,266 |
SCBT Financial Corp. | | 4,566 | | | 154,742 |
SeaBright Insurance Holdings, Inc.* | | 29,900 | | | 312,754 |
Shore Bancshares, Inc. | | 4,800 | | | 116,544 |
Simmons First National Corp., Class A | | 8,400 | | | 260,568 |
Smithtown Bancorp, Inc. | | 20,400 | | | 401,268 |
Southside Bancshares, Inc. | | 14,250 | | | 343,282 |
Texas Capital Bancshares, Inc.* | | 28,700 | | | 512,295 |
Washington Trust Bancorp, Inc. | | 8,400 | | | 179,088 |
WSFS Financial Corp. | | 6,800 | | | 325,516 |
Total Financials | | | | | 12,586,681 |
Health Care - 21.4% | | | | | |
Abiomed, Inc.* | | 23,100 | | | 336,798 |
Acorda Therapeutics, Inc.* | | 23,200 | | | 473,280 |
Air Methods Corp.* | | 13,700 | | | 229,886 |
Allion Healthcare, Inc.* | | 19,100 | | | 82,703 |
American Caresource Holdings, Inc.* | | 27,720 | | | 207,900 |
Array BioPharma, Inc.* | | 71,400 | | | 351,288 |
Bio-Reference Laboratories, Inc.* | | 92,020 | | | 2,262,772 |
CardioNet, Inc.* | | 55,785 | | | 1,427,538 |
Cutera, Inc.* | | 14,000 | | | 119,140 |
eResearch Technology, Inc.* | | 56,100 | | | 362,406 |
Eurand N.V.* | | 63,103 | | | 599,478 |
Exactech, Inc.* | | 55,600 | | | 1,123,120 |
Genomic Health, Inc.* | | 15,800 | | | 291,194 |
Genoptix, Inc.* | | 25,165 | | | 841,518 |
Hanger Orthopedic Group, Inc.* | | 57,800 | | | 962,948 |
Hansen Medical, Inc.* | | 17,300 | | | 161,063 |
Harvard Bioscience, Inc.* | | 157,096 | | | 486,998 |
HMS Holdings Corp.* | | 103,020 | | | 2,551,805 |
Home Diagnostics, Inc.* | | 16,300 | | | 141,973 |
Insulet Corp.* | | 28,600 | | | 160,160 |
IPC The Hospitalist Co., Inc.* | | 35,100 | | | 714,636 |
Landauer, Inc. | | 4,100 | | | 221,646 |
LHC Group, Inc.* | | 25,125 | | | 886,410 |
Medical Action Industries, Inc.* | | 21,700 | | | 249,550 |
MEDTOX Scientific, Inc.* | | 110,540 | | | 1,088,819 |
Merit Medical Systems, Inc.* | | 61,200 | | | 1,119,960 |
Micrus Endovascular Corp.* | | 19,490 | | | 229,982 |
Minrad International, Inc.* | | 48,905 | | | 36,190 |
MWI Veterinary Supply, Inc.* | | 45,300 | | | 1,568,739 |
Natus Medical, Inc.* | | 29,500 | | | 451,350 |
Neogen Corp.* | | 29,600 | | | 872,312 |
Obagi Medical Products, Inc.* | | 17,500 | | | 145,600 |
Phase Forward, Inc.* | | 79,880 | | | 1,139,888 |
Psychemedics Corp. | | 48,447 | | | 495,128 |
Res-Care, Inc.* | | 22,800 | | | 351,348 |
RTI Biologics, Inc.* | | 67,965 | | | 207,293 |
Somanetics Corp.* | | 29,200 | | | 547,500 |
SonoSite, Inc.* | | 16,900 | | | 356,083 |
Symmetry Medical, Inc.* | | 32,900 | | | 425,068 |
U.S. Physical Therapy, Inc.* | | 76,947 | | | 1,068,024 |
VIVUS, Inc.* | | 52,300 | | | 318,507 |
VNUS Medical Technologies, Inc.* | | 70,233 | | | 1,083,695 |
Volcano Corp.* | | 70,295 | | | 1,093,087 |
The accompanying notes are an integral part of these financial statements.
23
Managers Fremont Micro-Cap Fund
Schedule of Portfolio Investments (continued)
| | | | | |
| | | Shares | | Value |
Health Care - 21.4% (continued) | | | | | |
Young Innovations, Inc. | | 4,300 | | $ | 73,100 |
Zoll Medical Corp.* | | 18,700 | | | 450,296 |
Total Health Care | | | | | 28,368,179 |
Industrials - 20.6% | | | | | |
AeroVironment, Inc.* | | 15,800 | | | 567,536 |
Alamo Group, Inc. | | 10,600 | | | 133,348 |
Altra Holdings, Inc.* | | 62,500 | | | 558,750 |
American Ecology Corp. | | 11,200 | | | 196,448 |
Apogee Enterprises, Inc. | | 27,300 | | | 269,178 |
Applied Signal Technology, Inc. | | 10,300 | | | 184,576 |
AZZ, Inc.* | | 18,300 | | | 533,994 |
Barrett Business Services, Inc. | | 20,737 | | | 228,107 |
CBIZ, Inc.* | | 45,700 | | | 370,170 |
Celadon Group, Inc.* | | 28,500 | | | 304,665 |
Colfax Corp.* | | 42,300 | | | 360,396 |
Cornell Companies, Inc.* | | 10,200 | | | 232,254 |
Courier Corp. | | 14,900 | | | 259,409 |
Ducommun, Inc.* | | 20,000 | | | 403,800 |
DXP Enterprises, Inc.* | | 38,200 | | | 533,272 |
Dynamex, Inc.* | | 11,500 | | | 280,715 |
Energy Recovery, Inc.* | | 25,000 | | | 145,000 |
EnerNOC, Inc.* | | 64,800 | | | 427,680 |
Exponent, Inc.* | | 54,717 | | | 1,610,321 |
Furmanite Corp.* | | 42,880 | | | 343,040 |
GP Strategies Corp.* | | 166,833 | | | 1,004,335 |
Graham Corp. | | 1,315 | | | 27,615 |
Great Lakes Dredge & Dock Corp. | | 185,800 | | | 832,384 |
Hexcel Corp.* | | 20,300 | | | 267,960 |
Hill International, Inc.* | | 182,835 | | | 1,148,204 |
Houston Wire & Cable Co. | | 39,300 | | | 452,736 |
II-VI, Inc.* | | 13,900 | | | 390,451 |
Kimball International, Inc., Class B | | 10,800 | | | 80,460 |
Knight Transportation, Inc. | | 31,700 | | | 504,030 |
LaBarge, Inc.* | | 141,032 | | | 1,939,190 |
Lindsay Corp. | | 7,650 | | | 363,987 |
LMI Aerospace, Inc.* | | 48,500 | | | 740,595 |
LSI Industries, Inc. | | 45,800 | | | 359,530 |
Lydall, Inc.* | | 12,200 | | | 81,130 |
Marten Transport, Ltd.* | | 45,700 | | | 839,966 |
Metalico, Inc.* | | 61,045 | | | 195,344 |
Multi-Color Corp. | | 86,024 | | | 1,694,673 |
NN, Inc. | | 17,600 | | | 126,896 |
Old Dominion Freight Line, Inc.* | | 18,500 | | | 561,290 |
On Assignment, Inc.* | | 88,300 | | | 573,950 |
Orbit International Corp.* | | 74,209 | | | 188,491 |
Raven Industries, Inc. | | 25,100 | | | 807,969 |
RBC Bearings, Inc.* | | 17,500 | | | 415,275 |
Saia, Inc.* | | 32,900 | | | 349,069 |
Spherion Corp.* | | 22,300 | | | 70,914 |
Standard Parking Corp.* | | 59,500 | | | 1,247,120 |
Sterling Construction, Inc.* | | 76,126 | | | 1,005,624 |
Sun Hydraulics Corp. | | 6,900 | | | 144,486 |
Sykes Enterprises, Inc.* | | 18,800 | | | 300,048 |
Team, Inc.* | | 20,465 | | | 568,313 |
Titan International, Inc. | | 32,943 | | | 380,821 |
Titan Machinery, Inc.* | | 38,800 | | | 480,344 |
Universal Truckload Services, Inc.* | | 9,100 | | | 139,048 |
Vitran Corp., Inc., Class A* | | 84,013 | | | 746,876 |
Volt Information Sciences, Inc.* | | 17,400 | | | 133,110 |
Wabash National Corp. | | 24,974 | | | 150,843 |
Total Industrials | | | | | 27,255,736 |
Information Technology - 22.9% | | | | | |
3PAR, Inc.* | | 193,008 | | | 1,231,391 |
Actuate Corp.* | | 62,700 | | | 178,068 |
Anaren Microwave, Inc.* | | 14,300 | | | 178,035 |
Art Technology Group, Inc.* | | 70,020 | | | 136,539 |
Aruba Networks, Inc.* | | 126,000 | | | 391,860 |
Bankrate, Inc.* | | 22,300 | | | 733,893 |
Bel Fuse, Inc. | | 21,300 | | | 462,210 |
Blue Coat Systems, Inc.* | | 59,900 | | | 808,650 |
Bottomline Technologies, Inc.* | | 15,700 | | | 123,716 |
Cavium Networks, Inc.* | | 68,500 | | | 872,690 |
Compellent Technologies, Inc.* | | 45,575 | | | 496,768 |
comScore, Inc.* | | 46,400 | | | 566,080 |
Constant Contact, Inc.* | | 31,837 | | | 382,362 |
CTS Corp. | | 33,000 | | | 230,670 |
CyberSource Corp.* | | 47,100 | | | 572,265 |
DemandTec, Inc.* | | 76,900 | | | 554,449 |
DG FastChannel, Inc.* | | 28,345 | | | 501,990 |
Digi International, Inc.* | | 40,428 | | | 413,983 |
Double-Take Software, Inc.* | | 32,500 | | | 240,500 |
DTS, Inc.* | | 31,450 | | | 649,442 |
EMS Technologies, Inc.* | | 70,800 | | | 1,479,720 |
The accompanying notes are an integral part of these financial statements.
24
Managers Fremont Micro-Cap Fund
Schedule of Portfolio Investments (continued)
| | | | | |
| | | Shares | | Value |
Information Technology - 22.9% (continued) | | | | | |
Forrester Research, Inc.* | | 40,900 | | $ | 1,147,245 |
Gerber Scientific, Inc.* | | 47,500 | | | 227,050 |
GSI Commerce, Inc.* | | 39,900 | | | 412,965 |
Hittite Microwave Corp.* | | 15,700 | | | 514,489 |
IPG Photonics Corp.* | | 23,300 | | | 330,860 |
IXYS Corp.* | | 17,200 | | | 136,568 |
Keithley Instruments, Inc. | | 21,700 | | | 92,225 |
LoJack Corp.* | | 68,900 | | | 301,093 |
Measurement Specialties, Inc.* | | 20,800 | | | 222,144 |
Mellanox Technologies, Ltd.* | | 108,400 | | | 841,184 |
Methode Electronics, Inc. | | 8,500 | | | 64,515 |
MSC Software Corp.* | | 44,500 | | | 382,700 |
MTS Systems Corp. | | 12,800 | | | 415,744 |
NCI, Inc., Class A* | | 31,400 | | | 747,320 |
Netezza Corp.* | | 107,180 | | | 1,039,646 |
Netgear, Inc.* | | 28,600 | | | 316,030 |
NetLogic Microsystems, Inc.* | | 34,500 | | | 728,640 |
Neutral Tandem, Inc.* | | 46,380 | | | 807,940 |
Nu Horizons Electronics Corp.* | | 109,836 | | | 206,492 |
Online Resources Corp.* | | 101,474 | | | 355,159 |
PC Connection, Inc.* | | 31,500 | | | 190,260 |
PC-Tel, Inc.* | | 24,600 | | | 144,402 |
PDF Solutions, Inc.* | | 203,500 | | | 610,500 |
Pericom Semiconductor Corp.* | | 29,000 | | | 226,200 |
QAD, Inc. | | 21,800 | | | 111,180 |
Rackspace Hosting, Inc.* | | 80,500 | | | 458,045 |
Renaissance Learning, Inc. | | 6,900 | | | 94,116 |
Rimage Corp.* | | 12,200 | | | 179,828 |
Riverbed Technology, Inc.* | | 64,500 | | | 808,185 |
SI International, Inc.* | | 37,100 | | | 1,068,480 |
SM&A* | | 57,420 | | | 315,810 |
SonicWALL, Inc.* | | 45,700 | | | 204,736 |
Spectrum Control, Inc.* | | 31,400 | | | 195,622 |
Starent Networks Corp.* | | 46,200 | | | 460,614 |
Super Micro Computer, Inc.* | | 11,900 | | | 74,732 |
Supertex, Inc.* | | 37,900 | | | 914,148 |
Switch and Data Facilities Co., Inc.* | | 86,925 | | | 818,834 |
Symmetricom, Inc.* | | 52,779 | | | 234,867 |
Synaptics, Inc.* | | 7,450 | | | 230,130 |
Taleo Corp.* | | 34,800 | | | 480,240 |
TESSCO Technologies, Inc.* | | 7,500 | | | 82,275 |
Tyler Technologies, Inc.* | | 23,400 | | | 318,006 |
Ultimate Software Group, Inc., The* | | 31,375 | | | 418,229 |
Vocus, Inc.* | | 45,940 | | | 773,170 |
White Electronic Designs Corp.* | | 46,200 | | | 184,338 |
Zygo Corp.* | | 34,200 | | | 293,778 |
Total Information Technology | | | | | 30,386,015 |
Materials - 1.9% | | | | | |
Balchem Corp. | | 49,266 | | | 1,259,239 |
Buckeye Technologies, Inc.* | | 44,200 | | | 260,338 |
Calgon Carbon Corp.* | | 24,643 | | | 328,245 |
ICO, Inc.* | | 79,500 | | | 355,365 |
PolyMet Mining Corp.* | | 78,846 | | | 96,981 |
Schweitzer-Mauduit International, Inc. | | 4,600 | | | 76,912 |
Universal Stainless & Alloy Products, Inc.* | | 9,100 | | | 167,713 |
Total Materials | | | | | 2,544,793 |
Telecommunication Services - 0.3% | | | | | |
D&E Communications, Inc. | | 9,000 | | | 63,000 |
Shenandoah Telecommunications Co.* | | 11,749 | | | 281,624 |
Total Telecommunication Services | | | | | 344,624 |
Utilities - 0.2% | | | | | |
American States Water Co. | | 7,300 | | | 249,733 |
Total Common Stocks
(cost $154,125,215) | | | | | 123,565,035 |
Other Investment Companies - 5.8%1 | | | | | |
Dreyfus Cash Management Fund,
Institutional Class Shares, 2.84%7
(cost $7,711,451) | | 7,711,451 | | | 7,711,451 |
Total Investments - 99.1%
(cost $161,836,666) | | | | | 131,276,486 |
Other Assets, less Liabilities - 0.9% | | | | | 1,147,364 |
Net Assets - 100.0% | | | | $ | 132,423,850 |
The accompanying notes are an integral part of these financial statements.
25
Managers Fremont Institutional Micro-Cap Fund
Portfolio Manager’s Comments
The Managers Fremont Institutional Micro-Cap Fund primarily invests in the stocks of U.S. micro-capitalization companies. These companies have market capitalizations that, at the time of initial purchase, place them among the smallest 5% of companies listed on U.S. stock markets. Normally, the Fund will invest at least 80% of its assets in U.S. micro-cap stocks. The Fund employs multiple portfolio managers who specialize in distinct investment approaches. This “intelligence diversification” not only serves to manage risk, but also seeks to incorporate into the portfolio the breadth of the micro-cap market by focusing different analytical insights on micro-cap investing. The Fund’s team of subadvisors strive to achieve this performance and diversification while ensuring that the Fund operates within the framework of its investment objective and principal investment strategies. The Russell 2000® Index is the benchmark for the Fund.
The Portfolio Managers
Lord, Abbett & Co., LLC (“Lord Abbett”)
The team focuses its stock selection effort by focusing on companies that have revenue growth of at least 15%, are experiencing year-to-year operating margin improvement and are experiencing earnings growth that is driven by top-line growth rather than being driven by one time events or simple cost-cutting measures. The focus is also on identifying companies with higher quality balance sheets (often captured by finding companies with manageable debt-to-total-capital ratios) and that are already profitable. Once this process is completed, the focus for the team is on forecasting both revenue and earnings growth over the next several years. To achieve this goal, and to find companies that are expected to grow faster than their industry average, members of the team spend an extensive amount of time understanding the competitive advantages of a firm, the industry dynamics within which they operate, and the strength of management.
The sell discipline is enacted if there is a fundamental change in the business, a more attractive alternative is found, or if a holding reaches a 5% weight in the overall portfolio. The Lord Abbett portfolio typically holds between 75 and 100 stocks with no individual holding exceeding 5%. There is a risk constraint that prevents any individual industry from being greater than 25% of the total portfolio weight. The annual turnover of the portfolio is expected to be relatively high although there is no explicit target as part of either the stock selection or the portfolio-construction processes.
Next Century Growth Investors, LLC (“Next Century”)
The team requires historical revenue growth of at least 15% for a company before conducting further research. Other key factors considered initially by the team are strong historical revenue growth, low debt and high ROE. Quantitative screening is done on a regular basis to see which stocks over the past year are experiencing significant growth. The next stage of this process involves intensive first-hand research to determine the growth prospects of a company with the team choosing a stock only when it has become convinced a company has an extraordinary opportunity to grow their business. The uniqueness of this process lies in the fact that the team seeks out these companies regardless of their short-term prospects and\or current valuation. The team is looking for “home runs” and companies that will grow to the point that they will eventually reach a small market capitalization.
The sell discipline is enacted if there is a change in the original investment thesis or a fundamental change in business of the company. In addition, a holding will become a candidate for sale if it reaches an extreme valuation, becomes larger than 5% of the overall portfolio or as it approaches $1 billion in market capitalization. Typically companies are sold out of the micro-cap portfolio because they have approached $1 billion in market capitalization.
The Next Century portfolio is concentrated and typically has 40-60 holdings, which can create a high level of volatility. The only risk constraints are that sector weights can not exceed two times the Russell 2000® Growth sector weights, and no individual holding can be greater than 5% of the portfolio.
OFI Institutional Asset Management (“OFI”)
The team relies on both quantitative and qualitative tools to help with their stock selection process. The team quantitatively screens on both quality and value characteristics, such as high return on equity and assets for quality and low Price/Earnings and Price/ Book ratios for valuation. The quality and valuation screen leaves the team with a strong, focused universe with which to conduct its fundamental analysis where the team spends more time meeting with company management as well as customers and suppliers in an effort to better understand the dynamics of the industry within which a company operates. The analysts then use a discounted cash flow analysis to arrive at a price target for each security, using a static discount rate over a 1-year rolling time horizon.
The sell discipline is enacted if a stock achieves desired profit-ability or valuation, or the fundamentals of the original investment thesis deteriorate. In addition, a stock may be sold if a more attractive opportunity is found in the portfolio or if a stock reaches a 5% total position. The OFI managed portfolio typically holds between 40-70 securities, with position sizes generally ranging from 1% to 3% with a maximum of 5% allowed in any one holding. In addition, there is a constraint that limits the maximum exposure to any sector at 30%.
WEDGE Capital Management L.L.P. (“WEDGE”)
The investment process is a combination of both quantitative and fundamental research insights. The quantitative portion of the investment process uses commonly found factors and characteristics that can be accessed via any number of commercial databases. The value-added portion of the process, therefore, uses a number of different factors across five major categories: valuation, earnings quality, operating efficiency, capital usage and momentum, whose efficacy has been verified via long-term regression analysis. This is the Fundamental Value model. The top results of this model are combined with the best resulting stocks from the Financial Quality
26
Managers Fremont Institutional Micro-Cap Fund
Portfolio Manager’s Comments (continued)
model, which measures stocks across categories such as multiple earnings growth, profitability, leverage and liquidity. The top stocks that appear in both models are eligible for fundamental research. The fundamental research portion of the investment process is exclusionary in nature and meant to eliminate stocks that are not strong in earnings forecasts, valuation metrics, sector\industry outlook or any factor that can not be easily captured quantitatively.
A stock is scrutinized for possible sale if it falls below the top four deciles in the Fundamental Value model. Stocks are sold when they become fairly valued, an upgrade opportunity develops or the original investment thesis materially deteriorates. The portfolio managed by WEDGE is confined to plus or minus 10% in any given sector although sector positions tend to be much closer to the index weight than this (it should be noted that these self-imposed sector weighting constraints are based on a proprietary liquidity analysis conducted on an ongoing basis by the micro-cap team and is NOT driven by the sector weightings of any micro-cap benchmark). The final portfolio is a well diversified micro-cap portfolio holding approximately 150 securities and consistently maintaining a value bias relative to the benchmark. The portfolio tends to hold securities within the $40 million to $400 million market capitalization range, although does not require a sale of a holding until it reaches $800 million in market capitalization.
The Year in Review
The financial markets were under significant pressure during a majority of the fiscal year ending October 31, 2008. The period began with the focus of investors on the U.S. housing crisis and eventually morphed into concerns about a broader credit crisis both in the U.S. and abroad. Despite these fears, stocks saw a rebound in April and May before selling off dramatically towards the end of the second quarter as investors’ concerns over surging commodity prices, continuing fallout from the credit crisis, slowing economic growth, and declining corporate profits took center stage. Volatility remained high during July and August as major headlines included falling energy and commodity prices along with higher-than-expected economic growth, countered by further contraction in housing, weakness in the labor markets, tighter credit conditions, and uncertainty about the stability of Fannie Mae and Freddie Mac. July and August proved to be the calm before the storm, as the number of events significantly affecting the markets in September greatly outnumbered any other period in recent memory. September included the U.S. Treasury’s bailout of mortgage agencies Fannie Mae and Freddie Mac as well as insurer AIG. In addition, market turmoil even extended to money markets where interbank lending rates soared to record highs as banks hoarded cash. In October, Congress approved a $700 billion “bailout” called the Troubled Asset Relief Program (TARP) with the goal of opening up credit markets by buying distressed assets.
The micro-cap universe and Managers Fremont Institutional Micro-Cap Fund were not immune to the aforementioned market downturn. For the past fiscal year, the Fund returned -40.45% while the benchmark Russell Micro-Cap® Index returned -39.30% during this same time. While absolute returns have been disappointing, the performance versus the benchmark has been strong since the Fund’s restructuring to a multi-manager, multi-style approach earlier this year. The new subadvisory team assembled in early 2008 consists of four investment managers, each with a unique philosophy and investment process: Lord, Abbett & Co. LLC, OFI Institutional Asset Management, Inc., Next Century Growth Investors LLC, and WEDGE Capital Management L.L.P. The Fund had previously been managed by a single subadvisor, Kern Capital Management, LLC. Both Lord Abbett and Next Century provide growth-oriented philosophies and investment processes to the management of their portions of the Fund. OFI has a bottom-up, core fundamental investment style, and WEDGE uses a quantitative, value-oriented investment philosophy and process. Managers believes that these four subadvisors are among the most respected portfolio managers in micro-cap investing, and in combination they provide the Fund with a well-diversified micro-cap portfolio while maintaining strong performance potential by applying complementary approaches to investment management.
For this period, the portfolio managers of the Fund were the beneficiaries of good stock selection across a number of different sectors including the consumer discretionary and information technology sectors. On the downside, some relative performance was detracted during the latter portion of this period by virtue of the rather large underweighting the Fund maintains to the financials sector which rebounded from its very weak performance earlier in the year. Each of the four subadvisors within the Fund maintains a significant underweighting to the sector, reflecting minimal quality growth opportunities in financial stocks in general.
Looking Forward
The portfolio managers’ focus on companies that can “self-finance” their growth continues to be well-rewarded, particularly in the current market environment, as tight credit conditions do not bode well for companies that are highly dependent on outside financing for their long-term growth prospects. Broadly speaking, the Fund appears positioned to potentially take advantage of a global economic recovery if, and when, the fiscal and monetary actions taken over the past several months begin to take hold. In the meantime, the Fund maintains large absolute and relative overweights to biotech stocks, as well as to companies within the industrials and information technology sectors. The portfolio managers continue to believe that the high level of recent market volatility has created an excellent opportunity to add companies with solid business plans now selling at much more compelling valuations.
27
Managers Fremont Institutional Micro-Cap Fund
Portfolio Manager’s Comments (continued)
Cumulative Total Return Performance
Managers Fremont Institutional Micro-Cap Fund’s cumulative total return is based on the daily change in net asset value (NAV), and assumes that all distributions were reinvested. The Russell 2000® Growth Index measures the performance of those Russell 2000® companies with higher price-to-book ratios and higher forecasted growth values. This chart compares a hypothetical $10,000 investment made in the Managers Fremont Institutional Micro-Cap Fund on October 31, 1998, to a $10,000 investment made in the Russell 2000® Growth Index for the same time period. The graph and table do not reflect the deduction of taxes that a shareholder would pay on a Fund distribution or redemption of shares. Past performance is not indicative of future results.
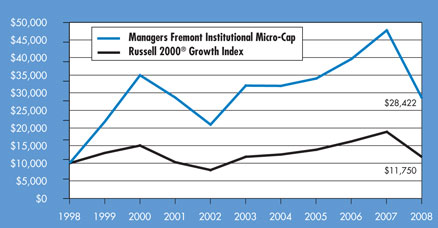
The table below shows the average annualized total returns for the Managers Fremont Institutional Micro-Cap Fund, the Russell Microcap® Index and the Russell 2000® Growth Index for the one-year, five-year and ten-year periods ending October 31, 2008.
| | | | | | | | | |
Average Annual Total Returns 1,2 | | One
Year | | | Five
Years | | | Ten
Years | |
Managers Fremont Institutional Micro-Cap4 | | (40.45 | )% | | (2.36 | )% | | 11.01 | % |
Russell Microcap® Index3 | | (39.30 | )% | | (2.25 | )% | | — | 5 |
Russell 2000® Growth Index | | (37.87 | )% | | (0.13 | )% | | 1.63 | % |
The performance data shown represents past performance. Past performance is not a guarantee of future results. Current performance may be lower or higher than the performance data quoted. The investment return and principal value of an investment in the Fund will fluctuate so that an investor’s shares, when redeemed, may be worth more or less than their original cost. For performance information through the most recent month end, please call (800) 835-3879 or visit our Web site at www.managersinvest.com.
In choosing a Fund, investors should carefully consider the amount they plan to invest, their investment objectives, the Fund’s investment objectives, risks, charges and expenses before investing. For this and other information, please call 800.835.3879 or visit www.managersinvest.com for a free prospectus. Read it carefully before investing or sending money. Distributed by Managers Distributors, Inc., member FINRA.
1 | Total return equals income yield plus share price change and assumes reinvestment of all dividends and capital gain distributions. Returns are net of fees and may reflect offsets of Fund expenses as described in the Prospectus. No adjustment has been made for taxes payable by shareholders on their reinvested dividends and capital gain distributions. Returns for periods greater than one year are annualized. The listed returns on the Fund are net of expenses and based on the published NAV as of October 31, 2008. All returns are in U.S. dollars($). |
2 | The Funds are subject to the special risks associated with investments in micro-cap companies, such as relatively short earnings histories, competitive conditions, less publicly available corporate information, and reliance on a limited number of products. |
3 | Russell Microcap® Index tracks the micro-cap segment of the U.S. equity market. It makes up less than 3% of the U.S. Equity market and is represented by the smallest 1,000 securities in the small-cap Russell 2000® Index plus the next 1,000 securities. The Index reflects no deduction of fees, expenses, or taxes. |
4 | Fund for which, from time to time, the advisor has waived its fees and/or absorbed Fund expenses, which has resulted in higher returns. |
5 | Since the Russell Microcap® Index’s inception date of June 30, 2000, the average annual total return for the Index was 2.14%. |
Russell 2000® Growth Index was the Fund’s prior benchmark. The Investment Manager changed the benchmark to the Russell Microcap® Index because it determined that the Russell Microcap® Index more accurately reflects the types of securities in which the Fund invests. The Russell 2000® Growth Index measures the performance of those companies in the Russell 2000® Index with higher price-to-book ratios and higher forecasted values. The Russell 2000® Index measures the performance of the 2,000 smallest companies in the Russell 3000® Index, which measures the performance of the 3,000 largest U.S. companies based on total market capitalization. The Index reflects no deduction of fees, expenses, or taxes.
The Russell Microcap® Index, the Russell 2000® Growth Index and the Russell 2000® Index are registered trademarks of Russell Investments. Russell® is a trademark of Russell Investments.
Not FDIC insured, nor bank guaranteed. May lose value.
28
Managers Fremont Institutional Micro-Cap Fund
Fund Snapshots
October 31, 2008
Portfolio Breakdown
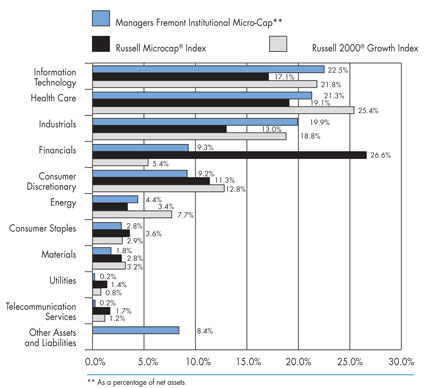
| | | | | | | | | |
Industry | | Managers Fremont
Institutional
Micro-Cap** | | | Russell
Microcap®
Index | | | Russell 2000®
Growth | |
Information Technology | | 22.5 | % | | 17.1 | % | | 21.8 | % |
Health Care | | 21.3 | % | | 19.1 | % | | 25.4 | % |
Industrials | | 19.9 | % | | 13.0 | % | | 18.8 | % |
Financials | | 9.3 | % | | 26.6 | % | | 5.4 | % |
Consumer Discretionary | | 9.2 | % | | 11.3 | % | | 12.8 | % |
Energy | | 4.4 | % | | 3.4 | % | | 7.7 | % |
Consumer Staples | | 2.8 | % | | 3.6 | % | | 2.9 | % |
Materials | | 1.8 | % | | 2.8 | % | | 3.2 | % |
Utilities | | 0.2 | % | | 1.4 | % | | 0.8 | % |
Telecommunication Services | | 0.2 | % | | 1.7 | % | | 1.2 | % |
Other Assets and Liabilities | | 8.4 | % | | 0.0 | % | | 0.0 | % |
Top Ten Holdings
| | | |
Security Name | | Percentage of Net
Assets | |
HMS Holdings Corp. | | 1.9 | % |
Bio-Reference Laboratories, Inc.* | | 1.8 | |
LaBarge, Inc. | | 1.5 | |
Exponent, Inc. | | 1.2 | |
CardioNet, Inc. | | 1.2 | |
Multi-Color Corp.* | | 1.2 | |
MWI Veterinary Supply, Inc. | | 1.1 | |
EMS Technologies, Inc.* | | 1.1 | |
3PAR, Inc. | | 1.0 | |
American Public Education, Inc. | | 0.9 | |
| | | |
Top Ten as a Group | | 12.9 | % |
| | | |
| * | Top Ten at April 30, 2008 |
Any sectors, industries, or securities discussed should not be perceived as investment recommendations. Mention of a specific security should not be considered a recommendation to buy or solicitation to sell that security.
29
Managers Fremont Institutional Micro-Cap Fund
Schedule of Portfolio Investments
October 31, 2008
| | | | | |
| | | Shares | | Value |
Common Stocks - 91.6% | | | | | |
Consumer Discretionary - 9.2% | | | | | |
AC Moore Arts & Crafts, Inc.* | | 6,600 | | $ | 18,348 |
Ambassadors Group, Inc. | | 9,136 | | | 95,380 |
American Public Education, Inc.* | | 5,630 | | | 249,240 |
Ark Restaurants Corp. | | 746 | | | 9,318 |
BJ’s Restaurants, Inc.* | | 4,080 | | | 36,271 |
Buffalo Wild Wings, Inc.* | | 4,475 | | | 126,552 |
Cache, Inc.* | | 17,765 | | | 63,776 |
California Pizza Kitchen, Inc.* | | 4,500 | | | 43,965 |
Christopher & Banks Corp. | | 4,500 | | | 23,490 |
Citi Trends, Inc.* | | 9,871 | | | 165,142 |
Core-Mark Holding Co., Inc.* | | 1,833 | | | 36,238 |
CSS Industries, Inc. | | 1,838 | | | 40,804 |
Famous Dave’s of America, Inc.* | | 4,067 | | | 17,041 |
FGX International Holdings, Ltd.* | | 14,991 | | | 164,901 |
Fuel Systems Solutions, Inc.* | | 4,100 | | | 116,645 |
Hibbett Sports, Inc.* | | 4,000 | | | 71,240 |
Hooker Furniture Corp. | | 2,100 | | | 19,131 |
Jo-Ann Stores, Inc.* | | 1,600 | | | 30,656 |
K12, Inc.* | | 4,300 | | | 118,250 |
Kenneth Cole Productions, Inc. | | 4,053 | | | 53,824 |
Learning Tree International, Inc.* | | 2,300 | | | 29,325 |
Lincoln Educational Services Corp.* | | 2,860 | | | 41,356 |
Luby’s, Inc.* | | 9,838 | | | 47,616 |
Maidenform Brands, Inc.* | | 5,200 | | | 57,096 |
Marine Products Corp. | | 4,189 | | | 25,930 |
McCormick & Schmick’s Seafood Restaurants, Inc.* | | 8,100 | | | 39,609 |
Midas, Inc.* | | 2,779 | | | 36,210 |
Monro Muffler Brake, Inc. | | 3,051 | | | 65,688 |
Morton’s Restaurant Group, Inc. | | 4,500 | | | 15,570 |
O’Charley’s, Inc. | | 5,061 | | | 37,958 |
Peet’s Coffee & Tea, Inc.* | | 600 | | | 13,476 |
Pinnacle Entertainment, Inc.* | | 11,971 | | | 67,038 |
RC2 Corp.* | | 1,905 | | | 24,194 |
Rentrak Corp.* | | 1,445 | | | 16,401 |
Shiloh Industries, Inc.* | | 1,553 | | | 7,781 |
Stamps.com, Inc.* | | 1,319 | | | 12,873 |
Steiner Leisure, Ltd.* | | 5,800 | | | 150,220 |
Steinway Musical Instruments, Inc.* | | 1,253 | | | 27,892 |
The Finish Line, Inc., Class A | | 4,400 | | | 42,108 |
True Religion Apparel, Inc.* | | 7,200 | | | 120,600 |
Ulta Salon, Cosmetics & Fragrance, Inc.* | | 1,300 | | | 11,466 |
Universal Electronics, Inc.* | | 2,300 | | | 48,599 |
Zumiez, Inc.* | | 2,480 | | | 24,205 |
Total Consumer Discretionary | | | | | 2,463,423 |
Consumer Staples - 2.8% | | | | | |
Boston Beer Co., Inc.* | | 4,308 | | | 162,798 |
Elizabeth Arden, Inc.* | | 2,837 | | | 49,052 |
Green Mountain Coffee Roasters, Inc.* | | 4,640 | | | 134,514 |
Inter Parfums, Inc. | | 1,347 | | | 15,706 |
J&J Snack Foods Corp. | | 1,529 | | | 47,949 |
Lance, Inc. | | 1,413 | | | 29,235 |
Nutraceutical International Corp.* | | 1,883 | | | 17,229 |
Rocky Mountain Chocolate Factory, Inc. | | 2,004 | | | 14,148 |
Smart Balance, Inc.* | | 26,245 | | | 187,914 |
Zhongpin, Inc.* | | 11,000 | | | 94,710 |
Total Consumer Staples | | | | | 753,255 |
Energy - 4.4% | | | | | |
Bolt Technology Corp.* | | 1,200 | | | 9,732 |
Brigham Exploration Co.* | | 13,175 | | | 103,292 |
Carrizo Oil & Gas, Inc.* | | 5,755 | | | 134,609 |
Dawson Geophysical Co.* | | 5,405 | | | 132,585 |
Gulf Island Fabrication, Inc. | | 3,196 | | | 62,993 |
Mitcham Industries, Inc.* | | 1,200 | | | 6,552 |
National Coal Corp.* | | 30,865 | | | 132,411 |
Northern Oil & Gas, Inc.* | | 17,535 | | | 95,566 |
Parallel Petroleum Corp.* | | 6,638 | | | 26,618 |
PetroQuest Energy, Inc.* | | 7,800 | | | 77,610 |
Rex Energy Corp.* | | 9,405 | | | 63,766 |
RPC, Inc. | | 8,814 | | | 93,340 |
T-3 Energy Services, Inc.* | | 6,165 | | | 148,638 |
TGC Industries, Inc.* | | 5,052 | | | 11,367 |
Union Drilling, Inc.* | | 12,473 | | | 68,352 |
Total Energy | | | | | 1,167,431 |
Financials - 9.3% | | | | | |
Abington Bancorp, Inc. | | 3,100 | | | 32,085 |
American Physicians Capital, Inc. | | 1,255 | | | 51,342 |
Amerisafe, Inc.* | | 3,365 | | | 58,013 |
Associated Estates Realty Corp. | | 1,443 | | | 11,775 |
Baldwin & Lyons, Inc. | | 909 | | | 16,535 |
The accompanying notes are an integral part of these financial statements.
30
Managers Fremont Institutional Micro-Cap Fund
Schedule of Portfolio Investments (continued)
| | | | | |
| | | Shares | | Value |
Financials - 9.3% (continued) | | | | | |
Bancorp Rhode Island, Inc. | | 4,560 | | $ | 110,443 |
Bank of the Ozarks, Inc. | | 2,900 | | | 88,160 |
Berkshire Hills Bancorp, Inc. | | 1,200 | | | 31,236 |
Bryn Mawr Bank Corp. | | 900 | | | 19,071 |
Center Financial Corp. | | 2,500 | | | 25,750 |
Columbia Banking Systems | | 5,009 | | | 79,743 |
Community Trust Bancorp, Inc. | | 2,061 | | | 68,796 |
Donegal Group, Inc. | | 7,539 | | | 123,489 |
Eastern Insurance Holdings, Inc. | | 2,800 | | | 26,292 |
Financial Institutions, Inc. | | 11,015 | | | 178,552 |
First Bancorp | | 1,300 | | | 22,750 |
First Cash Financial Services, Inc.* | | 3,553 | | | 54,610 |
First Community Bancshares, Inc. | | 1,655 | | | 51,802 |
First Financial Holdings, Inc. | | 3,225 | | | 69,982 |
Flushing Financial Corp. | | 2,648 | | | 41,176 |
Hallmark Financial Services, Inc.* | | 3,900 | | | 25,350 |
Iberia Bank Corp. | | 1,577 | | | 80,332 |
Independent Bank Corp. (MA) | | 1,790 | | | 51,498 |
Lakeland Bancorp, Inc. | | 4,826 | | | 53,183 |
Legacy Bancorp, Inc. | | 13,028 | | | 169,885 |
Meadowbrook Insurance Group, Inc. | | 9,333 | | | 49,185 |
Mission West Properties, Inc. | | 2,494 | | | 21,598 |
OceanFirst Financial Corp., Inc. | | 7,400 | | | 122,766 |
Penson Worldwide, Inc.* | | 15,664 | | | 111,841 |
Pinnacle Financial Partners, Inc. | | 2,700 | | | 79,002 |
S.Y. Bancorp, Inc. | | 2,290 | | | 63,067 |
SCBT Financial Corp. | | 840 | | | 28,468 |
SeaBright Insurance Holdings, Inc.* | | 4,930 | | | 51,568 |
Shore Bancshares, Inc. | | 1,000 | | | 24,280 |
Simmons First National Corp., Class A | | 1,500 | | | 46,530 |
Smithtown Bancorp, Inc. | | 3,621 | | | 71,225 |
Southside Bancshares, Inc. | | 2,855 | | | 68,777 |
Texas Capital Bancshares, Inc.* | | 6,500 | | | 116,025 |
Washington Trust Bancorp, Inc. | | 1,400 | | | 29,848 |
WSFS Financial Corp. | | 1,180 | | | 56,487 |
Total Financials | | | | | 2,482,517 |
Health Care - 21.3% | | | | | |
Abiomed, Inc.* | | 4,600 | | | 67,068 |
Acorda Therapeutics, Inc.* | | 4,800 | | | 97,920 |
Air Methods Corp.* | | 3,374 | | | 56,616 |
Allion Healthcare, Inc.* | | 3,800 | | | 16,454 |
American Caresource Holdings, Inc.* | | 5,665 | | | 42,488 |
Bio-Reference Laboratories, Inc.* | | 19,604 | | | 482,062 |
CardioNet, Inc.* | | 12,870 | | | 329,343 |
Cutera, Inc.* | | 3,068 | | | 26,109 |
eResearch Technology, Inc.* | | 7,300 | | | 47,158 |
Eurand N.V.* | | 14,088 | | | 133,836 |
Exactech, Inc.* | | 10,870 | | | 219,574 |
Genomic Health, Inc. | | 3,800 | | | 70,034 |
Genoptix, Inc.* | | 5,147 | | | 172,116 |
Hanger Orthopedic Group, Inc.* | | 11,100 | | | 184,926 |
Hansen Medical, Inc.* | | 7,500 | | | 69,825 |
Harvard Bioscience, Inc.* | | 31,964 | | | 99,088 |
HMS Holdings Corp.* | | 20,280 | | | 502,336 |
Home Diagnostics, Inc.* | | 1,892 | | | 16,479 |
IPC The Hospitalist Co., Inc.* | | 8,000 | | | 162,880 |
Landauer, Inc. | | 721 | | | 38,977 |
LHC Group, Inc.* | | 5,357 | | | 188,995 |
Medical Action Industries, Inc.* | | 4,536 | | | 52,164 |
MEDTOX Scientific, Inc.* | | 21,898 | | | 215,695 |
Merit Medical Systems, Inc.* | | 13,136 | | | 240,389 |
Micrus Endovascular Corp.* | | 9,285 | | | 109,563 |
Minrad International, Inc.* | | 9,975 | | | 7,382 |
MWI Veterinary Supply, Inc.* | | 8,800 | | | 304,744 |
Natus Medical, Inc.* | | 5,000 | | | 76,500 |
Neogen Corp.* | | 5,841 | | | 172,134 |
Obagi Medical Products, Inc.* | | 3,400 | | | 28,288 |
Phase Forward, Inc.* | | 16,970 | | | 242,162 |
Psychemedics Corp. | | 11,182 | | | 114,280 |
Res-Care, Inc.* | | 4,090 | | | 63,027 |
RTI Biologics, Inc.* | | 13,880 | | | 42,334 |
Somanetics Corp.* | | 6,029 | | | 113,044 |
Symmetry Medical, Inc.* | | 7,300 | | | 94,316 |
U.S. Physical Therapy, Inc.* | | 13,851 | | | 192,252 |
VIVUS, Inc.* | | 11,100 | | | 67,599 |
VNUS Medical Technologies, Inc.* | | 12,593 | | | 194,310 |
Volcano Corp.* | | 14,748 | | | 229,331 |
Young Innovations, Inc. | | 1,147 | | | 19,499 |
Zoll Medical Corp.* | | 3,800 | | | 91,504 |
Total Health Care | | | | | 5,694,801 |
Industrials - 19.9% | | | | | |
AeroVironment, Inc.* | | 3,100 | | | 111,352 |
Alamo Group, Inc. | | 1,709 | | | 21,499 |
The accompanying notes are an integral part of these financial statements.
31
Managers Fremont Institutional Micro-Cap Fund
Schedule of Portfolio Investments (continued)
| | | | | |
| | | Shares | | Value |
Industrials - 19.9% (continued) | | | | | |
Altra Holdings, Inc.* | | 12,000 | | $ | 107,280 |
American Ecology Corp. | | 1,896 | | | 33,256 |
Apogee Enterprises, Inc. | | 6,345 | | | 62,562 |
Applied Signal Technology, Inc. | | 2,018 | | | 36,163 |
AZZ, Inc.* | | 3,559 | | | 103,852 |
Barrett Business Services, Inc. | | 4,185 | | | 46,035 |
CBIZ, Inc.* | | 7,832 | | | 63,439 |
Celadon Group, Inc.* | | 4,607 | | | 49,249 |
Colfax Corp.* | | 9,500 | | | 80,940 |
Cornell Companies, Inc.* | | 1,600 | | | 36,432 |
Courier Corp. | | 2,697 | | | 46,955 |
Ducommun, Inc.* | | 3,800 | | | 76,722 |
DXP Enterprises, Inc.* | | 7,770 | | | 108,469 |
Dynamex, Inc.* | | 1,869 | | | 45,622 |
Energy Recovery, Inc.* | | 7,100 | | | 41,180 |
Exponent, Inc.* | | 11,306 | | | 332,736 |
Furmanite Corp.* | | 8,750 | | | 70,000 |
GP Strategies Corp.* | | 35,441 | | | 213,355 |
Graham Corp. | | 265 | | | 5,565 |
Great Lakes Dredge & Dock Corp. | | 35,707 | | | 159,967 |
Hexcel Corp.* | | 4,800 | | | 63,360 |
Hill International, Inc.* | | 38,110 | | | 239,331 |
Houston Wire & Cable Co. | | 7,578 | | | 87,299 |
II-VI, Inc.* | | 2,637 | | | 74,073 |
Kimball International, Inc., Class B | | 2,400 | | | 17,880 |
Knight Transportation, Inc. | | 6,245 | | | 99,296 |
LaBarge, Inc.* | | 30,078 | | | 413,572 |
Lindsay Corp. | | 1,540 | | | 73,273 |
LMI Aerospace, Inc.* | | 9,300 | | | 142,011 |
LSI Industries, Inc. | | 9,472 | | | 74,355 |
Lydall, Inc.* | | 1,600 | | | 10,640 |
Marten Transport, Ltd.* | | 9,140 | | | 167,993 |
Metalico, Inc.* | | 12,465 | | | 39,888 |
Multi-Color Corp. | | 16,469 | | | 324,439 |
NN, Inc. | | 2,600 | | | 18,746 |
Old Dominion Freight Line, Inc.* | | 3,849 | | | 116,779 |
On Assignment, Inc.* | | 18,339 | | | 119,204 |
Raven Industries, Inc. | | 4,903 | | | 157,828 |
RBC Bearings, Inc.* | | 3,700 | | | 87,801 |
Saia, Inc.* | | 6,391 | | | 67,809 |
Spherion Corp.* | | 4,500 | | | 14,310 |
Standard Parking Corp.* | | 11,846 | | | 248,292 |
Sterling Construction, Inc.* | | 15,615 | | | 206,274 |
Sun Hydraulics Corp. | | 1,118 | | | 23,411 |
Sykes Enterprises, Inc.* | | 3,466 | | | 55,317 |
Team, Inc.* | | 4,165 | | | 115,662 |
Titan International, Inc. | | 6,706 | | | 77,521 |
Titan Machinery, Inc.* | | 8,002 | | | 99,065 |
Universal Truckload Services, Inc.* | | 1,900 | | | 29,032 |
Vitran Corp., Inc., Class A* | | 17,116 | | | 152,161 |
Volt Information Sciences, Inc.* | | 3,500 | | | 26,775 |
Wabash National Corp. | | 4,126 | | | 24,921 |
Total Industrials | | | | | 5,320,948 |
Information Technology - 22.5% | | | | | |
3PAR, Inc.* | | 40,918 | | | 261,057 |
Actuate Corp.* | | 14,913 | | | 42,353 |
Anaren Microwave, Inc.* | | 3,400 | | | 42,330 |
Art Technology Group, Inc.* | | 14,310 | | | 27,904 |
Bankrate, Inc.* | | 5,300 | | | 174,423 |
Bel Fuse, Inc. | | 3,784 | | | 82,113 |
Blue Coat Systems, Inc.* | | 14,900 | | | 201,150 |
Bottomline Technologies, Inc.* | | 3,600 | | | 28,368 |
Compellent Technologies, Inc.* | | 9,325 | | | 101,642 |
comScore, Inc.* | | 11,521 | | | 140,556 |
Constant Contact, Inc.* | | 6,500 | | | 78,065 |
CTS Corp. | | 5,599 | | | 39,137 |
CyberSource Corp.* | | 9,900 | | | 120,285 |
DemandTec, Inc.* | | 15,800 | | | 113,918 |
DG FastChannel, Inc.* | | 5,795 | | | 102,629 |
Digi International, Inc.* | | 7,105 | | | 72,755 |
Double-Take Software, Inc.* | | 6,300 | | | 46,620 |
DTS, Inc.* | | 6,430 | | | 132,780 |
EMS Technologies, Inc.* | | 13,959 | | | 291,743 |
Forrester Research, Inc.* | | 7,993 | | | 224,204 |
Gerber Scientific, Inc.* | | 11,418 | | | 54,578 |
GSI Commerce, Inc.* | | 8,800 | | | 91,080 |
Hittite Microwave Corp.* | | 4,000 | | | 131,080 |
Infinera Corp.* | | 11,700 | | | 91,026 |
IPG Photonics Corp.* | | 5,600 | | | 79,520 |
IXYS Corp.* | | 3,087 | | | 24,511 |
Keithley Instruments, Inc. | | 4,427 | | | 18,815 |
LoJack Corp.* | | 12,891 | | | 56,334 |
Measurement Specialties, Inc.* | | 3,592 | | | 38,363 |
The accompanying notes are an integral part of these financial statements.
32
Managers Fremont Institutional Micro-Cap Fund
Schedule of Portfolio Investments (continued)
| | | | | |
| | | Shares | | Value |
Information Technology - 22.5% (continued) | | | | | |
Mellanox Technologies, Ltd.* | | 20,800 | | $ | 161,408 |
Methode Electronics, Inc. | | 1,893 | | | 14,368 |
MSC Software Corp.* | | 9,443 | | | 81,210 |
MTS Systems Corp. | | 2,101 | | | 68,240 |
NCI, Inc., Class A* | | 6,100 | | | 145,180 |
Netezza Corp.* | | 24,579 | | | 238,416 |
Netgear, Inc.* | | 6,400 | | | 70,720 |
Neutral Tandem, Inc.* | | 9,485 | | | 165,229 |
Nu Horizons Electronics Corp.* | | 21,783 | | | 40,952 |
Online Resources Corp.* | | 20,011 | | | 70,038 |
PC Connection, Inc.* | | 4,021 | | | 24,287 |
PC-Tel, Inc.* | | 3,544 | | | 20,803 |
PDF Solutions, Inc.* | | 39,453 | | | 118,358 |
Perfect World Co., Ltd. (ADR)* | | 75 | | | 1,397 |
Pericom Semiconductor Corp.* | | 5,557 | | | 43,345 |
QAD, Inc. | | 5,400 | | | 27,540 |
Rackspace Hosting, Inc.* | | 19,000 | | | 108,110 |
Renaissance Learning, Inc. | | 1,642 | | | 22,397 |
Rimage Corp.* | | 2,000 | | | 29,480 |
Riverbed Technology, Inc.* | | 14,400 | | | 180,432 |
SI International, Inc.* | | 7,942 | | | 228,730 |
SM&A* | | 7,967 | | | 43,818 |
SonicWALL, Inc.* | | 9,700 | | | 43,456 |
Spectrum Control, Inc.* | | 7,864 | | | 48,993 |
Starent Networks Corp.* | | 11,300 | | | 112,661 |
Super Micro Computer, Inc.* | | 2,436 | | | 15,298 |
Supertex, Inc.* | | 7,157 | | | 172,627 |
Switch and Data Facilities Co., Inc.* | | 17,702 | | | 166,753 |
Symmetricom, Inc.* | | 9,400 | | | 41,830 |
Synaptics, Inc.* | | 2,374 | | | 73,333 |
Taleo Corp.* | | 8,219 | | | 113,422 |
TESSCO Technologies, Inc.* | | 1,600 | | | 17,552 |
Tyler Technologies, Inc.* | | 4,540 | | | 61,699 |
Ultimate Software Group, Inc., The* | | 6,924 | | | 92,297 |
Vocus, Inc.* | | 9,997 | | | 168,250 |
White Electronic Designs Corp.* | | 6,869 | | | 27,407 |
Zygo Corp.* | | 6,855 | | | 58,884 |
Total Information Technology | | | | | 6,028,259 |
Materials - 1.8% | | | | | |
Balchem Corp. | | 9,461 | | | 241,823 |
Buckeye Technologies, Inc.* | | 9,689 | | | 57,068 |
Calgon Carbon Corp.* | | 5,075 | | | 67,599 |
ICO, Inc.* | | 13,600 | | | 60,792 |
PolyMet Mining Corp.* | | 16,106 | | | 19,810 |
Schweitzer-Mauduit International, Inc. | | 962 | | | 16,085 |
Universal Stainless & Alloy Products, Inc.* | | 1,800 | | | 33,174 |
Total Materials | | | | | 496,351 |
Telecommunication Services - 0.2% | | | | | |
D&E Communications, Inc. | | 2,000 | | | 14,000 |
Shenandoah Telecommunications Co.* | | 1,938 | | | 46,454 |
Total Telecommunication Services | | | | | 60,454 |
Utilities - 0.2% | | | | | |
American States Water Co. | | 1,359 | | | 46,491 |
Total Common Stocks
(cost $30,309,058) | | | | | 24,513,930 |
Other Investment Companies - 8.0%1 | | | | | |
Dreyfus Cash Management Fund,
Institutional Class Shares, 2.84%7
(cost $2,129,346) | | 2,129,346 | | | 2,129,346 |
Total Investments - 99.6%
(cost $32,438,404) | | | | | 26,643,276 |
Other Assets, less Liabilities - 0.4% | | | | | 115,821 |
Net Assets - 100.0% | | | | $ | 26,759,097 |
The accompanying notes are an integral part of these financial statements.
33
Managers Real Estate Securities Fund
Portfolio Manager’s Comments
Managers Real Estate Securities Fund seeks a combination of income and long-term capital appreciation by investing in stocks of companies that are principally engaged in owning and operating commercial real estate properties for the benefit of their investors including Real Estate Investment Trusts (REIT’s). Managers utilizes an independent subadvisor to manage the assets of the portfolio. Todd Briddell leads the investment team of Urdang Securities Management, Inc. (“Urdang”) in managing this Fund.
The Portfolio Manager
Urdang Securities Management, Inc.
Todd Briddell and the investment team at Urdang believe real estate securities play an important role in a multi-asset class investment portfolio. Urdang’s strategy recognizes that real estate securities are not simply stocks, or real estate. They are hybrid financial investments that must be valued on the basis of a number of meaningful factors, only one of which is the value of the firm’s property portfolio. To accurately assess the relative value of a REIT security, they take into account critical business and market factors, such as: the company’s capitalization, its position within public capital markets, and the quality of the management team.
Investment success is the result of the company’s ability to provide a consistently accurate answer to the question at the heart of its value-oriented investment strategy: Which REITs does Urdang believe will generate the highest risk-adjusted returns? Urdang believes that a diversified portfolio with a value orientation will result in strong risk-adjusted returns.
Urdang employs a value-oriented investment process with two distinct and complementary components: bottom-up real estate research and the company’s proprietary Relative Value Model (RVM) securities valuation process, which was designed to provide a uniform basis for evaluating the validity of a security’s trading price. Combining real estate research and the RVM process has been central to Urdang’s track record of delivering strong returns without incurring high levels of risk.
The Year in Review
For the 12-month period ended October 31, 2008, the Fund returned -38.95% compared to -41.48% for its benchmark, the Dow Jones Wilshire REIT Index. The Fund’s returns now exceed the benchmark on a one-year, three-year, and five-year basis.
For the fiscal year, REITs underperformed even the disappointing returns generated by the broader equity markets. Sectors that tended to perform better within the REIT universe, such as apartments and health care REITs in the latter portion of the year, were those sectors that had more resilient fundamentals and employed lower leverage on their balance sheets. Despite delivering difficult absolute returns during the last year in this environment, the Fund did generate solid relative results compared to the benchmark by virtue of both good stock and sector selection. Early in the year, solid stock selection was driven by apartment REITS such as UDR Inc. and BRE Properties and a holding of Nationwide Health Properties, a health care REIT. Apartment REITs, which were among the poorest performers at the end of 2007 (the start of this fiscal year), benefited from a bounce back in early 2008.
In the second quarter of this year, solid relative performance was more a result of good sector selection and, more specifically, the avoidance of the underperforming hotel sector. Towards the latter portion of the fiscal year, as REITs began to outperform the broader equity markets, relative performance of the Fund was mixed, as good stock selection within the shopping center, apartment, and storage sectors was mitigated by weak stock selection within the regional mall, office, and hotel sectors. All REIT sectors delivered negative returns during the fiscal year although the Fund did benefit on a relative basis from positive sector selection in the latter portion of the year, resulting from an underweight to the industrial and hotel sectors and an overweight to the health care and triple net lease sectors.
Looking Forward
The Fund is overweight high-quality REITs with low leverage, limited near-term maturities, and well-located real estate leased on a long-term basis. The Fund remains very cautious in light of the global credit crunch and the dampened global growth outlook. REIT prices have, however, been hit pretty hard already, reflecting a higher equity risk premium. Urdang believes they are trading at a significant discount to replacement cost. While multiples appear to be reasonable for REITs, the possibility remains that growth may turn negative due to weakening fundamentals and higher future debt costs. Therefore, Urdang will continue to take a conservative approach in choosing REITs and focus on the long-term merits of these securities in managing the Fund.
34
Managers Real Estate Securities Fund
Portfolio Manager’s Comments (continued)
Cumulative Total Return Performance
The Fund’s cumulative total return is based on the daily change in net asset value (NAV), and assumes that all distributions were reinvested. The Dow Jones Wilshire REIT Index measures U.S. publicly traded Real Estate Investment Trusts. Unlike the Fund, the Dow Jones Wilshire REIT Index is unmanaged, is not available to investment, and does not incur expenses. The chart illustrates the performance of a hypothetical $10,000 investment made in the Managers Real Estate Securities Fund on October 31, 1998, to a $10,000 investment made in the Dow Jones Wilshire REIT Index for the same period. Performance for periods longer than one year is annualized. The graph and table do not reflect the deduction of taxes that a shareholder would pay on a Fund distribution or redemption of shares. The listed returns for the Fund are net of expenses and the returns for the index exclude expenses. Total returns for the Fund would have been lower had certain expenses not been reduced.
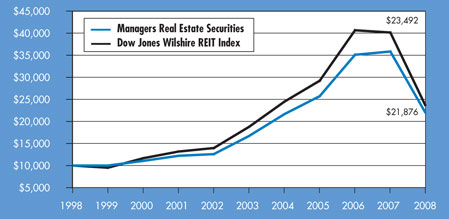
The table below shows the average annual total returns for the Managers Real Estate Securities Fund and the Dow Jones Wilshire REIT Index since inception through October 31, 2008.
| | | | | | | | | |
Average Annualized Total Returns 1 | | One Year | | | Five Years | | | Since Inception | |
Managers Real Estate Securities 2,3 | | (38.95 | )% | | 5.54 | % | | 8.14 | % |
Dow Jones Wilshire REIT Index | | (41.48 | )% | | 4.58 | % | | 8.92 | % |
The performance data shown represents past performance. Past performance is not a guarantee of future results. Current performance may be lower or higher than the performance data quoted. The investment return and principal value of an investment in the Fund will fluctuate so that an investor’s shares, when redeemed, may be worth more or less than their original cost. For performance information through the most recent month end, please call (800) 835-3879 or visit our Web site at www.managersinvest.com.
In choosing a Fund, investors should carefully consider the amount they plan to invest, their investment objectives, the Fund’s investment objectives, risks, charges and expenses before investing. For this and other information, please call 800.835.3879 or visit www.managersinvest.com for a free prospectus. Read it carefully before investing or sending money. Distributed by Managers Distributors, Inc., member FINRA.
1 | Total return equals income yield plus share price change and assumes reinvestment of all dividends and capital gain distributions. Returns are net of fees and may reflect offsets of Fund expenses as described in the Prospectus. No adjustment has been made for taxes payable by shareholders on their reinvested dividends and capital gain distributions. Returns for periods greater than one year are annualized. The listed returns on the Fund are net of expenses and based on the published NAV as of October 31, 2008. All returns are in U.S. dollars($). |
2 | Fund for which, from time to time, the advisor has waived its fees and/or absorbed Fund expenses, which has resulted in higher returns. |
3 | The Fund is subject to special risk considerations similar to those associated with the direct ownership of real estate. Real estate valuations may be subject to factors such as changing general and local economic, financial, competitive, and environmental conditions. |
Not FDIC insured, nor bank guaranteed. May lose value.
35
Managers Real Estate Securities Fund
Fund Snapshots
October 31, 2008
Portfolio Breakdown
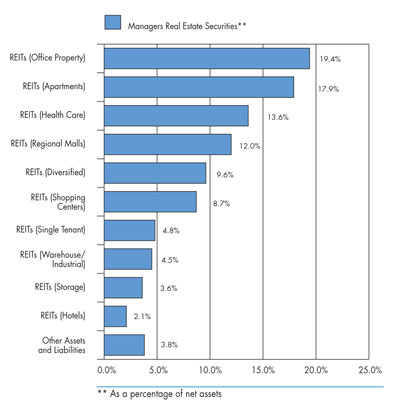
| | | |
Industry | | Managers Real
Estate Securities** | |
REITs (Office Property) | | 19.4 | % |
REITs (Apartments) | | 17.9 | % |
REITs (Health Care) | | 13.6 | % |
REITs (Regional Malls) | | 12.0 | % |
REITs (Diversified) | | 9.6 | % |
REITs (Shopping Centers) | | 8.7 | % |
REITs (Single Tenant) | | 4.8 | % |
REITs (Warehouse/Industrial) | | 4.5 | % |
REITs (Storage) | | 3.6 | % |
REITs (Hotels) | | 2.1 | % |
Other Assets and Liabilities | | 3.8 | % |
Top Ten Holdings
| | | |
Security Name | | Percentage
of Net Assets | |
Simon Property Group, Inc.* | | 7.7 | % |
Boston Properties, Inc. | | 5.3 | |
Vornado Realty Trust* | | 5.2 | |
AvalonBay Communities, Inc. | | 4.5 | |
Nationwide Health Properties, Inc. | | 4.5 | |
Equity Residential | | 4.4 | |
Ventas, Inc. | | 3.8 | |
Kilroy Realty Corp. | | 3.7 | |
Public Storage, Inc.* | | 3.6 | |
National Retail Properties, Inc.* | | 3.2 | |
| | | |
Top Ten as a Group | | 45.9 | % |
| | | |
| * | Top Ten Holding at April 30, 2008 |
Any sectors, industries, or securities discussed should not be perceived as investment recommendations. Mention of a specific security should not be considered a recommendation to buy or solicitation to sell that security.
36
Managers Real Estate Securities Fund
Schedule of Portfolio Investments
October 31, 2008
| | | | | |
| | | Shares | | Value |
REITs - 96.2% | | | | | |
Apartments - 17.9% | | | | | |
Apartment Investment & Management Co. | | 4,740 | | $ | 69,346 |
AvalonBay Communities, Inc. | | 7,860 | | | 558,217 |
BRE Properties, Inc. | | 8,620 | | | 300,062 |
Camden Property Trust | | 7,300 | | | 246,083 |
Education Realty Trust, Inc. | | 11,180 | | | 47,515 |
Equity Residential | | 15,580 | | | 544,209 |
Essex Property Trust, Inc. | | 410 | | | 39,893 |
Home Properties of NY, Inc. | | 2,870 | | | 116,206 |
UDR, Inc. | | 14,660 | | | 289,682 |
Total Apartments | | | | | 2,211,213 |
Diversified - 9.6% | | | | | |
Cousins Properties, Inc. | | 1,000 | | | 14,480 |
Digital Realty Trust, Inc. | | 5,910 | | | 197,867 |
Duke Realty Corp. | | 5,310 | | | 74,924 |
Lexington Realty Trust | | 10,260 | | | 82,388 |
Rayonier, Inc. | | 5,160 | | | 170,693 |
Vornado Realty Trust | | 9,160 | | | 646,238 |
Total Diversified | | | | | 1,186,590 |
Health Care - 13.6% | | | | | |
HCP, Inc. | | 5,240 | | | 156,833 |
Health Care REIT, Inc. | | 2,350 | | | 104,598 |
Healthcare Realty Trust, Inc. | | 5,310 | | | 135,670 |
Nationwide Health Properties, Inc. | | 18,630 | | | 555,919 |
Senior Housing Properties Trust | | 13,310 | | | 255,153 |
Ventas, Inc. | | 13,140 | | | 473,828 |
Total Health Care | | | | | 1,682,001 |
Hotels - 2.1% | | | | | |
Diamondrock Hospitality Co. | | 11,930 | | | 61,797 |
Host Hotels & Resorts, Inc. | | 16,670 | | | 172,368 |
Sunstone Hotel Investors, Inc. | | 4,220 | | | 27,641 |
Total Hotels | | | | | 261,806 |
Office Property - 19.4% | | | | | |
Alexandria Real Estate Equities, Inc. | | 2,970 | | | 206,474 |
Boston Properties, Inc. | | 9,190 | | | 651,387 |
Brandywine Realty Trust | | 18,820 | | | 162,605 |
Highwoods Properties, Inc. | | 6,650 | | | 165,053 |
HRPT Properties Trust | | 55,540 | | | 200,499 |
Kilroy Realty Corp. | | 14,200 | | | 456,530 |
Mack-Cali Realty Corp. | | 8,530 | | | 193,802 |
Parkway Properties, Inc. | | 590 | | | 10,178 |
SL Green Realty Corp. | | 8,200 | | | 344,728 |
Total Office Property | | | | | 2,391,256 |
Regional Malls - 12.0% | | | | | |
General Growth Properties, Inc. | | 20,690 | | | 85,657 |
Macerich Co., The | | 4,530 | | | 133,273 |
Simon Property Group, Inc. | | 14,260 | | | 955,848 |
Taubman Centers, Inc. | | 9,370 | | | 311,271 |
Total Regional Malls | | | | | 1,486,049 |
Shopping Centers - 8.7% | | | | | |
Acadia Realty Trust | | 2,930 | | | 52,945 |
Federal Realty Investment Trust | | 5,730 | | | 351,077 |
Kimco Realty Corp. | | 16,930 | | | 382,279 |
Regency Centers Corp. | | 5,350 | | | 211,111 |
Tanger Factory Outlet Center, Inc. | | 2,130 | | | 77,042 |
Total Shopping Centers | | | | | 1,074,454 |
Single Tenant - 4.8% | | | | | |
Equity Lifestyle Properties, Inc. | | 4,650 | | | 195,254 |
National Retail Properties, Inc. | | 22,520 | | | 401,532 |
Total Single Tenant | | | | | 596,786 |
Storage - 3.6% | | | | | |
Public Storage, Inc. | | 5,440 | | | 443,360 |
Warehouse/Industrials - 4.5% | | | | | |
AMB Property Corp. | | 9,420 | | | 226,363 |
DCT Industrial Trust, Inc. | | 11,390 | | | 56,153 |
ProLogis | | 19,750 | | | 276,500 |
Total Warehouse/Industrials | | | | | 559,016 |
Total REITs (cost $17,761,353) | | | | | 11,892,531 |
REOCs - 3.0% | | | | | |
Hotels & Motels - 1.7% | | | | | |
Starwood Hotels & Resorts Worldwide, Inc. | | 9,490 | | | 213,905 |
Wireless Equipment - 1.3% | | | | | |
American Tower Corp., Class A* | | 4,820 | | | 155,734 |
Total REOCs (cost $572,864) | | | | | 369,639 |
Other Investment Companies - 0.3%1 | | | | | |
Dreyfus Cash Management Fund, Institutional Class Shares, 2.84%7 (cost $38,123) | | 38,123 | | | 38,123 |
Total Investments - 99.5% (cost $18,372,340) | | | | | 12,300,293 |
Other Assets, less Liabilities - 0.5% | | | | | 65,529 |
Net Assets - 100.0% | | | | $ | 12,365,822 |
The accompanying notes are an integral part of these financial statements.
37
Managers California Intermediate Tax-Free Fund
Portfolio Manager’s Comments
The Managers California Intermediate Tax-Free Fund’s objective is to achieve income free from Federal income taxes and California state income taxes, including alternative minimum tax.
The Managers California Intermediate Tax-Free Fund invests at least 80% of its total assets in intermediate-term California municipal bonds that are free from both Federal and California state income taxes, including Alternative Minimum Tax. The Fund’s securities will have quality ratings comparable to the four highest ratings categories of Moody’s or Standard & Poor’s. The dollar-weighted average maturity of these intermediate-term securities is normally 3 to 10 years. The Fund’s benchmark is the Barclays Capital
5-Year Municipal Bond Index.
The Portfolio Manager
Miller Tabak Asset Management (“MTAM”), the subadvisor for the Managers California Intermediate Tax-Free Fund, was founded earlier this year, and is a division of Miller Tabak + Co. LLC (“Miller Tabak”). Miller Tabak is a twenty-six-year-old institutional trading firm that specializes in the discrete handling of stock purchases and sales, portfolio rebalancing, and listed options. MTAM focuses exclusively on managing municipal bond portfolios and is based in New York City. As previously described in the Information Statement sent to shareholders, on September 15, 2008, MTAM took over the subadvisory duties previously performed by Evergreen Investment Management Company, LLC (“Evergreen”) with respect to the Fund. As of that date, MTAM has managed the Fund’s entire portfolio of investments.
Philosophy
The MTAM team focuses on purchasing municipal credits exhibiting improving credit characteristics while maintaining geographic and economic diversity as key elements in the portfolio-construction process. MTAM believes proactive total-return portfolio management offers greater potential rewards in an increasingly inefficient municipal bond market. Achieving reasonable and consistent growth of clients’ capital without taking elevated levels of principal risk is MTAM’s objective.
The municipal bond market is a unique sector within the domestic fixed-income universe, consisting of over 48,000 issuers with distinct security structures and varying credit risks. MTAM seeks to exploit these nuances through a disciplined risk-controlled, relative-value investment management process.
Process
| | • | | Active total-return portfolio management is MTAM’s central theme for achieving objectives that benefit the Fund. |
| | • | | MTAM is committed to extensive, proprietary, and original research and analysis. |
| | • | | MTAM follows a disciplined and well defined investment process. |
MTAM’s portfolio management starts by setting income and return objectives, the time horizon, liquidity and cash flow needs, and tax considerations. After client needs have been assessed, MTAM establishes specific investment guidelines for each account. It focuses on maturity, duration, minimum acceptable credit quality, sector limitations, selection of the benchmark, and risk tolerance. Lastly, MTAM creates a detailed investment policy statement for each account and begins implementing its investment process.
MTAM’s investment process can be divided into two distinct parts. The first part focuses on risk analysis. MTAM’s risk analysis has two components, interest-rate analysis and credit-risk analysis. MTAM strives to control interest-rate volatility by defining the appropriate ranges for duration and maturity based on the fund’s predetermined liquidity requirements, the specific risk profile, and the given market environment. Anthony Crescenzi is the Fund’s co-Portfolio Manager and helps mold MTAM’s macro perspective. Mr. Crescenzi has been Miller Tabak’s Chief Bond Strategist since 1990 and has been with Miller Tabak for over 20 years. He is a renowned bond market expert, with deep knowledge of economic data affecting broad markets, particularly the domestic bond market. He is an invaluable resource in shaping MTAM’s market perspective and is often tapped by other investment firms for his well-respected insight. His input is particularly important in shaping the Fund’s duration and maturity targets.
The second component of MTAM’s risk analysis focuses on credit risk. MTAM applies rigorous standards for tax-exempt issuers, continually reviews financial statements, and closely monitors rating agency commentary and relative trading spreads in the secondary market. Michael Pietronico’s 15 years experience managing municipal bond portfolios gives him excellent knowledge of the key factors influencing the municipal bond market and an experienced eye to identify high-quality California Municipal bonds.
The second major part of MTAM’s investment process assesses relative value. MTAM starts by creating expectations for the slope of the yield curve and yield spreads going forward. Once forecasts are finalized, MTAM assesses how its forecast and other potential outcomes may affect market prices. This ultimately helps MTAM identify what securities are most attractively valued and offer the best risk-adjusted return. MTAM also uses its market outlook to determine what sectors of the municipal market will add to and detract from performance and adjust weightings accordingly. Lastly, credit research at the security level is undertaken to analyze credit quality, yield, duration, structure, and call protection in order to assess a securities potential contribution to the Fund.
Buy Discipline
There are three parts to MTAM’s buy discipline:
Macro View
Aggregate Municipal Supply
Secondary Market Supply
Dealer Inventories
Micro View
Supply/Demand Per State
38
Managers California Intermediate Tax-Free Fund
Portfolio Manager’s Comments (continued)
Macro View
Major Economic Trends in Place
Micro View
Legal Structure of Securities
Service-Area Economic Performance
Project and System Operations
| | • | | Individual Bond Structure Analysis |
Prepayment Risk
Original Issue Discount
Reinvestment Risk
Municipal Bond Credit Research – Credit Review Process
| 1. | Comprehensive bottom-up analysis of issuer, pledged security, and historical economic performance |
| 2. | Site visits and conference calls with key public officials |
| 3. | Comprehensive financial statement review with feasibility analysis |
| 4. | Negotiate with underwriters to strengthen key security covenants and secure optimal pricing |
| 5. | Upon credit approval exposure limits are implemented |
Credit Surveillance
| | • | | Database is maintained for holdings by issuer and fund exposure |
| | • | | The relevant performance statistics are tracked on a monthly, quarterly, and annual basis to help capture meaningful trends, for example trading spreads |
| | • | | Outside resources are utilized; for example financial statement repositories, industry publications, internet search engines, and rating agencies |
Sell Discipline
An individual security may become a candidate for sale if:
| | • | | The issuer’s investment fundamentals begin to deteriorate |
| | • | | To take advantage of more attractive yield opportunities |
| | • | | The individual security no longer appears to meet the portfolio’s investment objective(s) |
| | • | | To meet liquidity needs |
| | • | | To help shorten or lengthen the overall duration of the portfolio |
The Year in Review
For the twelve months ended October 31, 2008, the Managers California Intermediate Tax-Free Fund returned -1.82%. The Fund’s benchmark, the Barclays Capital 5-Year Municipal Bond Index, returned 3.33% during the same time period.
The Fund’s underperformance relative to its benchmark can be mostly attributed to its overweight position in municipals maturing longer than five years. The Fund had a higher weighted average maturity than the Barclays Capital 5-Year Municipal Bond Index throughout the trailing twelve-month period. This hurt performance as shorter-term municipals, such as those maturing between three and five years, outperformed intermediate- and long-term municipals. Investors favored the safety of shorter-term bonds and this preference put downward pressure on the middle and end of the municipal bond yield curve. Specifically, the Barclays Capital
3-Year Municipal Bond Index returned 4.26%, compared to 1.91% and -0.63% for the Barclays Capital 7-Year Municipal Bond Index and the Barclays Capital 10-Year Municipal Bond Index, respectively. The Fund’s relative performance was also hurt by significant exposure to high-rated, insured bonds. Monoline insurers, in particular MBIA and AMBAC, were under tremendous pressure during the period. These two insurers were initially put on warning by the credit agencies and ultimately downgraded. As a result, investors fled high-rated insured bonds because many felt the insurance was meaningless and, typically, the underlying issuer was of lower quality.
Liquidity was limited over the last twelve months, as some of the biggest municipal bond dealers left the market and investors flocked towards the safety of U.S. Treasuries. This would have made it challenging to quickly, and cost-effectively, reposition the Fund to potentially benefit from short-term trends in the marketplace. Congruently, the prior Subadvisor, Evergreen, felt intermediate bonds were, and are very attractively priced and did not want to chase performance by buying the front-end of the yield curve. Similarly, MTAM feels intermediate bonds appear undervalued from a historical perspective and that the overweight to intermediate bonds is justified.
During the past twelve months the Fund’s relative performance was somewhat aided by the overall high credit quality of the Fund’s portfolio. Similar to shorter-term securities, investors preferred the security of higher-rated investment, and AAA bonds performed better than lower-rated bonds. Overall, California municipal credit spreads have been volatile since California has been one of the states most negatively affected by the bursting housing bubble, it has an unemployment rate meaningfully above the rest of the nation, and seems already in the midst of an economic recession. The spread between high-rated California Municipal Bonds and comparably rated bonds from other states is near an all-time high and well above its historical average.
Looking Forward
Moving forward, portfolio management believes municipal investors will benefit from an investment bias towards higher quality securities as credit access remains tight and the economy slows. Generally speaking, this bias, and the increased potential for higher federal tax rates, should benefit the municipal bond market and the Fund. MTAM intends to continue to add selectively to sectors such as general obligation debt and essential purpose revenue bonds when the opportunity to purchase these securities at attractive levels presents itself.
39
Managers California Intermediate Tax-Free Fund
Portfolio Manager’s Comments (continued)
Cumulative Total Return Performance
Managers California Intermediate Tax-Free Fund’s cumulative total return is based on the daily change in net asset value (NAV) and assumes that all distributions were reinvested. The Barclays Capital Municipal Bond Index is a rules-based, market-value-weighted index engineered for the long-term tax-exempt bond market. The index has four main sectors: general obligation bonds, revenue bonds, insured bonds (including all insured bonds with a Aaa/AAA rating), and prerefunded bonds. This index is the 5 Year (4-6) component of the Municipal Bond index. Unlike the Fund, the Barclays Capital Municipal Bond Index is unmanaged, is not available to investment, and does not incur expenses. This chart compares a hypothetical $10,000 investment made in the Managers California Intermediate Tax-Free Fund on October 31, 1998, to a $10,000 investment made in the Barclays Capital 5-Year Municipal Bond Index for the same time period. Performance for periods longer than one year is annualized. The graph and table do not reflect the deduction of taxes that a shareholder would pay on a Fund distribution or redemption of shares. The listed returns for the Fund are net of expenses and the returns for the index exclude expenses. Total returns for the Fund would have been lower had certain expenses not been reduced.
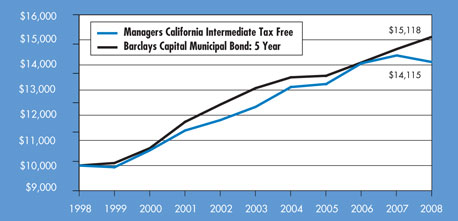
The table below shows the average annual total returns for the Managers California Intermediate Tax-Free Fund and the Barclays Capital 5-Year Municipal Bond Index from October 31, 1998 through October 31, 2008.
| | | | | | | | | |
Average Annualized Total Returns 1 | | One Year | | | Five Years | | | Ten Years | |
Managers California Intermediate Tax Free2,3,4,5 | | (1.82 | )% | | 2.74 | % | | 3.51 | % |
Barclays Capital Municipal Bond: 5 Year6 | | 3.33 | % | | 2.94 | % | | 4.22 | % |
The performance data shown represents past performance. Past performance is not a guarantee of future results. Current performance may be lower or higher than the performance data quoted. The investment return and principal value of an investment in the Fund will fluctuate so that an investor’s shares, when redeemed, may be worth more or less than their original cost. For performance information through the most recent month end, please call (800) 835-3879 or visit our Web site at www.managersinvest.com.
In choosing a Fund, investors should carefully consider the amount they plan to invest, their investment objectives, the Fund’s investment objectives, risks, charges and expenses before investing. For this and other information, please call 800.835.3879 or visit www.managersinvest.com for a free prospectus. Read it carefully before investing or sending money. Distributed by Managers Distributors, Inc., member FINRA.
1 | Total return equals income yield plus share price change and assumes reinvestment of all dividends and capital gain distributions. Returns are net of fees and may reflect offsets of Fund expenses as described in the Prospectus. No adjustment has been made for taxes payable by shareholders on their reinvested dividends and capital gain distributions. Returns for periods greater than one year are annualized. The listed returns on the Fund are net of expenses and based on the published NAV as of October 31, 2008. All returns are in U.S. dollars($). |
2 | Fund for which, from time to time, the advisor has waived its fees and/or absorbed Fund expenses, which has resulted in higher returns. |
3 | The Fund is subject to the risks associated with investments in debt securities, such as default risk and fluctuations in the perception of the debtors’ ability to pay their creditors. |
4 | Changing interest rates may adversely affect the value of an investment. An increase in interest rates typically causes the value of bonds and other fixed income securities to fall. |
5 | The Fund is subject to risks associated from economic, political, geographic, and demographic conditions of California that could adversely affect the value of the Fund’s investment portfolio. |
6 | Prior to October 31, 2008, the Index was known as the Lehman Brothers 5-Year Municipal Bond Index. |
Not FDIC insured, nor bank guaranteed. May lose value.
40
Managers California Intermediate Tax-Free Fund
Fund Snapshots
October 31, 2008
Portfolio Breakdown
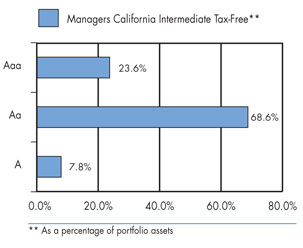
| | | |
Portfolio Credit Quality | | Managers California
Intermediate Tax-Free** | |
Aaa | | 23.6 | % |
Aa | | 68.6 | % |
A | | 7.8 | % |
Top Ten Holdings
| | | |
Security Name | | Percentage
of Net Assets | |
California State Department of Water Resources Revenue, 5.000%, 05/01/22* | | 6.0 | % |
Bay Area Toll Authority of San Francisco, CA Toll Bridge Revenue, Series F, 5.000%, 04/01/21* | | 5.3 | |
Sonoma County, CA Junior College District Election of 2002, Series C, 5.000%, 08/01/22 (MBIA Insured)* | | 5.0 | |
Novato, CA United School District Election, 5.000%, 08/01/20 (MBIA Insured)* | | 4.1 | |
California State Public Works Board, 5.000%, 01/01/21* | | 3.6 | |
San Francisco, CA City & Country Public Utilities, Series A, 5.250%, 10/01/19 (MBIA Insured) | | 3.5 | |
Kern, CA High School District, 5.000%, 08/01/21 (FSA Insured)* | | 3.3 | |
California Educational Facilities Authority Revenue, Santa Clara University, 5.250%, 09/01/17 (AMBAC Insured)* | | 3.2 | |
State of California, 5.250%, 02/01/15 | | 3.2 | |
Bay Area Toll Authority, CA Toll Bridge Revenue, Series F, 5.000%, 04/01/19 | | 3.1 | |
| | | |
Top Ten as a Group | | 40.3 | % |
| | | |
| * | Top Ten Holding at April 30, 2008 |
Any sectors, industries, or securities discussed should not be perceived as investment recommendations. Mention of a specific security should not be considered a recommendation to buy or solicitation to sell that security.
41
Managers California Intermediate Tax-Free Fund
Schedule of Portfolio Investments
October 31, 2008
| | | | | | |
| | | Principal Amount | | Value |
Municipal Bonds - 83.4% | | | | | | |
Bakersfield, CA Waste Water Revenue, 5.000%, 09/15/19 (FSA Insured) | | $ | 150,000 | | $ | 152,136 |
Bakersfield, CA City School District, 5.250%, 11/01/21 (FSA Insured) | | | 110,000 | | | 110,974 |
Bay Area Government Association, CA Revenue, 5.000%, 08/01/20 (AMBAC Insured) | | | 500,000 | | | 488,255 |
Bay Area Toll Authority, CA Toll Bridge Revenue, Series F, 5.000%, 04/01/19 | | | 1,000,000 | | | 1,018,540 |
Bay Area Toll Authority of San Francisco, CA Toll Bridge Revenue, Series F, 5.000%, 04/01/21 | | | 1,750,000 | | | 1,753,133 |
California Educational Facilities Authority Revenue, Santa Clara University, 5.250%, 09/01/17 (AMBAC Insured) | | | 1,000,000 | | | 1,066,050 |
California Infrastructure & Economic Development Bank Revenue, 5.000%, 10/01/20 | | | 455,000 | | | 460,310 |
California State Department of Water Resources Revenue, 5.000%, 05/01/22 | | | 2,000,000 | | | 1,974,900 |
California State Public Works Board, 5.000%, 01/01/21 | | | 1,250,000 | | | 1,197,162 |
California State Public Works Board, 5.250%, 03/01/19 (AMBAC Insured) | | | 200,000 | | | 200,346 |
Chaffey, CA Unified High School District, 5.375%, 05/01/23 (FSA Insured) | | | 300,000 | | | 299,847 |
Clovis, CA Unified School District, 5.000%, 08/01/21 (MBIA Insured) | | | 540,000 | | | 529,000 |
East Bay, CA Municipal Utility District, 4.750%, 06/01/20 (FSA Insured) | | | 340,000 | | | 332,003 |
Eastern Municipal Water District, Water & Sewer Revenue, 5.000%, 07/01/17 (MBIA Insured) | | | 100,000 | | | 103,006 |
Eastern Municipal Water District, Water & Sewer Revenue, Series A, 5.000%, 07/01/21 (MBIA Insured) | | | 330,000 | | | 323,314 |
El Monte, CA City School District, Election of 2004, Series A, 5.000%, 05/01/19 (FGIC Insured) | | | 225,000 | | | 217,163 |
El Monte, CA Unified High School District, 4.250%, 03/01/10 (MBIA Insured) | | | 150,000 | | | 152,544 |
Fresno, CA Sewer Revenue, Series A-1, 5.250%, 09/01/19 (AMBAC Insured) | | | 1,000,000 | | | 1,007,750 |
Kern, CA High School District, 5.000%, 08/01/21 (FSA Insured) | | | 1,100,000 | | | 1,077,593 |
Long Beach, CA Harbor Revenue Refunding - Series B, 5.000%, 05/15/18 (FGIC Insured) | | | 670,000 | | | 677,075 |
Los Angeles, CA Certificate Participation Real Property Program, 5.250%, 04/01/19 (AMBAC Insured) | | | 300,000 | | | 304,182 |
Los Angeles, CA Department of Water & Power, Series C, 5.250%, 07/01/18 (MBIA Insured) | | | 510,000 | | | 530,431 |
Los Angeles, CA Department of Water Works, 5.000%, 06/01/21 (FSA Insured) | | | 300,000 | | | 298,053 |
Los Angeles, CA Harbor Department of Revenue, Series B, 5.000%, 08/01/20 (MBIA Insured) | | | 275,000 | | | 274,013 |
Los Angeles, CA Improvement Corp. Lease Revenue, 5.000%, 01/01/22 (FGIC Insured) | | | 300,000 | | | 285,444 |
Moorpark, CA United School District, 5.000%, 08/01/18 (FSA Insured) | | | 390,000 | | | 393,748 |
Murrieta Valley, CA United School District, 5.000%, 09/01/22 (FSA Insured) | | | 500,000 | | | 486,350 |
North Orange County, CA Community College District, 5.000%, 08/01/19 (MBIA Insured) | | | 340,000 | | | 342,876 |
Novato, CA Unified School District, 5.000%, 08/01/21 (MBIA Insured) | | | 465,000 | | | 453,422 |
Novato, CA Unified School District Election, 5.000%, 08/01/20 (MBIA Insured) | | | 1,385,000 | | | 1,364,364 |
Perris, CA Unified High School District, Series A, 5.000%, 09/01/18 (FGIC Insured) | | | 300,000 | | | 295,863 |
Port of Oakland, CA, Series B, 5.000%, 11/01/21 (MBIA Insured) | | | 1,000,000 | | | 952,970 |
Rancho Santiago, CA Community College District, 5.250%, 09/01/23 (FSA Insured) | | | 300,000 | | | 309,672 |
Rancho Santiago, CA Community College District, Election 2002, Series C, 5.000%, 09/01/20 (FSA Insured) | | | 460,000 | | | 462,332 |
Riverside, CA Community College District, 5.000%, 08/01/21 (FSA Insured) | | | 250,000 | | | 247,198 |
Sacramento, CA Municipal Utility District, 5.000%, 08/15/23 (FSA Insured) | | | 300,000 | | | 288,441 |
Sacramento, CA Utility District Electric Revenue, 5.000%, 08/15/18 (MBIA Insured) | | | 100,000 | | | 100,923 |
Sacramento, CA Utility District Electric Revenue, Series R, 5.200%, 12/01/11 | | | 150,000 | | | 157,524 |
San Diego, CA Unified School District, Series C, 5.000%, 07/01/19 (FSA Insured) | | | 200,000 | | | 211,236 |
The accompanying notes are an integral part of these financial statements.
42
Managers California Intermediate Tax-Free Fund
Schedule of Portfolio Investments (continued)
| | | | | | |
| | | Principal Amount | | Value |
Municipal Bonds - 83.4% (continued) | | | | | | |
San Francisco, CA City & County Public Utilities, Series A, 5.250%, 10/01/19 (MBIA Insured) | | $ | 1,145,000 | | $ | 1,158,396 |
San Jose, CA Library, Parks, & Public Safety Projects, 5.000%, 09/01/19 | | | 500,000 | | | 506,905 |
San Jose-Evergreen, CA Community College District, 5.250%, 09/01/16 (AMBAC Insured) | | | 500,000 | | | 527,100 |
Santa Clara Valley, CA Water District, Series A, 5.000%, 02/01/18 (FGIC Insured) | | | 655,000 | | | 666,115 |
Santa Rosa, CA High School District, Election of 2002, 5.000%, 08/01/19 (MBIA Insured) | | | 100,000 | | | 100,201 |
Simi Valley, CA School Financing Authority, 5.000%, 08/01/22 (FSA Insured) | | | 225,000 | | | 218,880 |
Sonoma County, CA Junior College District Election of 2002, Series C, 5.000%, 08/01/22 (MBIA Insured) | | | 1,700,000 | | | 1,653,760 |
Southern CA Metropolitan Water District Waterworks Revenue, 5.000%, 07/01/23 | | | 100,000 | | | 98,160 |
Southwestern Community College, 5.000%, 08/01/18 (MBIA Insured) | | | 600,000 | | | 605,484 |
State of California, 5.250%, 02/01/15 | | | 1,000,000 | | | 1,038,970 |
Total Municipal Bonds
(cost $28,644,419) | | | | | | 27,474,114 |
| | |
Other Investment Companies - 15.7%1 | | Shares | | |
Blackrock Liquidity Funds, Institutional Class Shares - California Money Fund, 1.55%8 | | | 4,178,515 | | | 4,178,515 |
Fidelity California AMT Tax-Free Money Market Fund, Institutional Class Shares, 1.10% | | | 1,000,183 | | | 1,000,183 |
Total Other Investment Companies
(cost $5,178,698) | | | | | | 5,178,698 |
Total Investments - 99.1%
(cost $33,823,117)9 | | | | | | 32,652,812 |
Other Assets, less Liabilities - 0.9% | | | | | | 302,281 |
Net Assets - 100.0% | | | | | $ | 32,955,093 |
The accompanying notes are an integral part of these financial statements.
43
Notes to Schedules of Portfolio Investments
The following footnotes and abbreviations are to be read in conjunction with the Schedules of Portfolio Investments previously presented in the report.
At October 31, 2008, the cost of securities for Federal income tax purposes and the gross aggregate unrealized appreciation and/or depreciation based on tax cost were:
| | | | | | | | | | | | |
Fund | | Cost | | Appreciation | | Depreciation | | | Net | |
Managers Fremont Global | | $ | 113,294,028 | | $ | 442,525 | | ($28,600,524 | ) | | ($28,157,999 | ) |
Managers Small Cap | | | 62,167,210 | | | 6,239,497 | | (12,212,557 | ) | | (5,973,060 | ) |
Managers Micro-Cap | | | 165,653,027 | | | 5,480,968 | | (39,857,509 | ) | | (34,376,541 | ) |
Managers Institutional Micro-Cap | | | 33,731,628 | | | 1,132,969 | | (8,221,321 | ) | | (7,088,352 | ) |
Managers Real Estate Securities | | | 19,652,721 | | | 2,153 | | (7,354,581 | ) | | (7,352,428 | ) |
Managers California Intermediate Tax-Free | | | 33,823,117 | | | 47,834 | | (1,218,139 | ) | | (1,170,305 | ) |
| * | Non-income-producing security. |
(a) Security exempt from registration under Rule 144A of the Securities Act of 1933. This security may be resold in transactions exempt from registration, normally to qualified buyers. At October 31, 2008, the value of these securities amounted to the following:
| | | | | | |
Fund | | Market Value | | % of Net Assets | |
Managers Fremont Global | | $ | 537,213 | | 0.7 | % |
1 | Yield shown for each investment company represents the October 31, 2008, seven-day average yield, which refers to the sum of the previous seven days’ dividends paid, expressed as an annual percentage. |
2 | Some or all of these shares were out on loan to various brokers as of October 31, 2008, amounting to: |
| | | | | | |
Fund | | Market Value | | % of Net Assets | |
Managers Fremont Global | | $ | 6,124,801 | | 7.8 | % |
Managers Small Cap | | | 5,065,003 | | 9.9 | % |
3 | Collateral received from brokers for securities lending was invested in this short-term investment. |
4 | On September 12, 2008, The Bank of New York Mellon (“BNYM”) established a separate sleeve of the Institutional Cash Reserves Fund (“ICRF”) (Series B) to hold certain Lehman Brothers floating rate notes. The Fund’s position in Series B is being marked to market daily. |
5 | On October 6, 2008, The BNYM established a separate sleeve of the ICRF (Series C) to hold certain securities issued by Whistlejacket Capital Ltd. The Fund’s position in Series C is being marked to market daily. |
7 | Under the U.S. Treasury Temporary Money Market Fund Guarantee Program, the maximum amount covered for each Fund’s investment in the Dreyfus Cash Management Fund is: |
| | | |
Fund | | Market
Value |
Managers Fremont Global | | $ | 2,154,888 |
Managers Small Cap | | | 3,608,525 |
Managers Micro-Cap | | | 9,181,340 |
Managers Institutional Micro-Cap | | | 1,060,665 |
Managers Real Estate Securities | | | 595,984 |
8 | Under the U.S. Treasury Temporary Money Market Fund Guarantee Program, the maximum amount covered for the Fund’s investment in the Blackrock Liquidity Fund is $1,367,815. |
9 | At October 31, 2008, the concentration of the Fund’s investments by state or territory determined as a percentage of net assets was as follows: California 99.1%. At October 31, 2008, 58.5% of the securities in the portfolio were backed by insurance of financial institutions and financial guaranty assurance agencies. Insurers with a concentration greater than 10% of net assets were as follows: MBIA 26.2%, FSA 14.8%, AMBAC 10.9%. |
Investment Definitions and Abbreviations:
| | |
| ADR/GDR: | | ADR after the name of a holding stands for American Depositary Receipt, representing ownership of foreign securities on deposit with a domestic custodian bank; a GDR (Global Depositary Receipt) is comparable, but foreign securities are held on deposit in a non-U.S. bank. The value of the ADR/GDR securities is determined or significantly influenced by trading on exchanges not located in the United States or Canada. Sponsored ADR/ GDRs are initiated by the underlying foreign company. |
| |
| MBIA: | | Municipal Bond Investor Assurance Corp. |
| |
| AMBAC: | | American Municipal Bond Assurance Corp. |
| |
| FGIC: | | Financial Guaranty Insurance Corp. |
| |
| FSA: | | FSA Capital, Inc |
| |
| REIT: | | Real Estate Investment Trust |
| |
| REOC: | | Real Estate Operating Company |
44
Statements of Assets and Liabilities
October 31, 2008
| | | | | | | | | | | | | | | | | | | | | | | | |
| | | Managers
Fremont Global
Fund | | | Managers Small
Cap Fund | | | Managers
Fremont
Micro-Cap Fund | | | Managers
Fremont
Intitutioanl
Micro-Cap Fund | | | Managers Real
Estate
Securities Fund | | | Managers
California
Intermediate
Tax-Free Fund | |
Assets: | | | | | | | | | | | | | | | | | | | | | | | | |
Investments at value* (including securities on loan valued at $6,124,801, $5,065,003, $0, $0, $0, $0 respectively) | | $ | 85,136,029 | | | $ | 56,194,150 | | | $ | 131,276,486 | | | $ | 26,643,276 | | | $ | 12,300,293 | | | $ | 32,652,812 | |
Cash | | | — | | | | — | | | | — | | | | — | | | | 936 | | | | — | |
Foreign currency** | | | 209,372 | | | | — | | | | — | | | | — | | | | — | | | | — | |
Receivable for investments sold | | | 1,072,949 | | | | 330,477 | | | | 2,705,644 | | | | 446,007 | | | | 177,160 | | | | 1,306,172 | |
Receivable for Fund shares sold | | | 720 | | | | 61,075 | | | | 26,311 | | | | 71,108 | | | | 12,323 | | | | 2,958 | |
Unrealized appreciation of foreign currency contracts | | | 3,054 | | | | — | | | | — | | | | — | | | | — | | | | — | |
Dividends, interest and other receivables | | | 154,694 | | | | 11,449 | | | | 80,545 | | | | 17,683 | | | | 35,319 | | | | 406,475 | |
Prepaid expenses | | | 8,707 | | | | 10,718 | | | | 7,013 | | | | 9,900 | | | | 4,200 | | | | 1,805 | |
| | | | | | | | | | | | | | | | | | | | | | | | |
Total assets | | | 86,585,525 | | | | 56,607,869 | | | | 134,095,999 | | | | 27,187,974 | | | | 12,530,231 | | | | 34,370,222 | |
| | | | | | | | | | | | | | | | | | | | | | | | |
Liabilities: | | | | | | | | | | | | | | | | | | | | | | | | |
Payable to Custodian | | | 51,278 | | | | — | | | | — | | | | 8,163 | | | | — | | | | — | |
Payable for Fund shares repurchased | | | 51,671 | | | | 129,590 | | | | 1,272,770 | | | | 63,979 | | | | 15,540 | | | | 18,277 | |
Payable upon return of securities loaned | | | 6,190,100 | | | | 5,082,456 | | | | — | | | | — | | | | — | | | | — | |
Payable for investments purchased | | | 1,744,849 | | | | 226,210 | | | | 135,849 | | | | 258,011 | | | | 86,709 | | | | 1,314,898 | |
Unrealized depreciation of foreign currency contracts | | | 11,630 | | | | — | | | | — | | | | — | | | | — | | | | — | |
Dividends payable to shareholders | | | — | | | | — | | | | — | | | | — | | | | — | | | | 9,883 | |
Accrued expenses: | | | | | | | | | | | | | | | | | | | | | | | | |
Investment advisory and management fees | | | 27,731 | | | | 44,411 | | | | 102,657 | | | | 23,430 | | | | 7,957 | | | | 7,560 | |
Administrative fees | | | 12,860 | | | | 11,103 | | | | 28,919 | | | | 5,860 | | | | 2,829 | | | | 7,058 | |
Other | | | 156,854 | | | | 56,779 | | | | 131,954 | | | | 69,434 | | | | 51,374 | | | | 57,453 | |
| | | | | | | | | | | | | | | | | | | | | | | | |
Total liabilities | | | 8,246,973 | | | | 5,550,549 | | | | 1,672,149 | | | | 428,877 | | | | 164,409 | | | | 1,415,129 | |
| | | | | | | | | | | | | | | | | | | | | | | | |
Net Assets | | $ | 78,338,552 | | | $ | 51,057,320 | | | $ | 132,423,850 | | | $ | 26,759,097 | | | $ | 12,365,822 | | | $ | 32,955,093 | |
| | | | | | | | | | | | | | | | | | | | | | | | |
Net Assets Represent: | | | | | | | | | | | | | | | | | | | | | | | | |
Paid-in capital | | $ | 155,122,563 | | | $ | 66,053,832 | | | $ | 158,884,903 | | | $ | 30,593,094 | | | $ | 21,085,598 | | | $ | 34,825,703 | |
Undistributed net investment income (loss) | | | 716,819 | | | | — | | | | 7,752 | | | | 981 | | | | 41,849 | | | | (1,604 | ) |
Accumulated net realized gain (loss) from investments, futures and foreign currency transactions | | | (51,838,798 | ) | | | (9,233,975 | ) | | | 4,091,375 | | | | 1,960,150 | | | | (2,689,578 | ) | | | (698,701 | ) |
Net unrealized depreciation of investments, futures, and foreign currency contracts and translations | | | (25,662,032 | ) | | | (5,762,537 | ) | | | (30,560,180 | ) | | | (5,795,128 | ) | | | (6,072,047 | ) | | | (1,170,305 | ) |
| | | | | | | | | | | | | | | | | | | | | | | | |
Net Assets | | $ | 78,338,552 | | | $ | 51,057,320 | | | $ | 132,423,850 | | | $ | 26,759,097 | | | $ | 12,365,822 | | | $ | 32,955,093 | |
| | | | | | | | | | | | | | | | | | | | | | | | |
Shares Outstanding | | | 7,977,261 | | | | 4,366,782 | | | | 5,211,914 | | | | 3,098,422 | | | | 2,228,117 | | | | 3,348,821 | |
| | | | | | | | | | | | | | | | | | | | | | | | |
Net asset value, offering and redemption price per share | | $ | 9.82 | | | $ | 11.69 | | | $ | 25.41 | | | $ | 8.64 | | | $ | 5.55 | | | $ | 9.84 | |
| | | | | | | | | | | | | | | | | | | | | | | | |
* Investments at cost | | $ | 110,797,916 | | | $ | 61,956,687 | | | $ | 161,836,666 | | | $ | 32,438,404 | | | $ | 18,372,340 | | | $ | 33,823,117 | |
** Foreign currency at cost | | $ | 215,489 | | | | — | | | | — | | | | — | | | | — | | | | — | |
The accompanying notes are an integral part of these financial statements.
45
Statements of Operations
For the fiscal year ended October 31, 2008
| | | | | | | | | | | | | | | | | | | | | | | | |
| | | Managers
Fremont Global
Fund | | | Managers Small
Cap Fund | | | Managers
Fremont
Micro-Cap Fund | | | Managers
Fremont
Institutional
Micro-Cap Fund | | | Managers
Real Estate
Securities Fund | | | Managers
California
Intermediate
Tax-Free Fund | |
Investment Income: | | | | | | | | | | | | | | | | | | | | | | | | |
Dividend income | | $ | 2,205,321 | | | $ | 427,193 | | | $ | 1,214,121 | | | $ | 325,910 | | | $ | 539,929 | | | $ | 59,223 | |
Dividend income from affiliate | | | 3,295,018 | | | | — | | | | — | | | | — | | | | — | | | | — | |
Interest income | | | 94,221 | | | | — | | | | — | | | | — | | | | — | | | | 1,573,731 | |
Foreign withholding tax | | | (106,311 | ) | | | (3,393 | ) | | | — | | | | — | | | | (651 | ) | | | — | |
Securities lending fees | | | 52,370 | | | | 55,694 | | | | 6,420 | | | | 1,232 | | | | — | | | | — | |
| | | | | | | | | | | | | | | | | | | | | | | | |
Total investment income | | | 5,540,619 | | | | 479,494 | | | | 1,220,541 | | | | 327,142 | | | | 539,278 | | | | 1,632,954 | |
| | | | | | | | | | | | | | | | | | | | | | | | |
Expenses: | | | | | | | | | | | | | | | | | | | | | | | | |
Investment management fees | | | 834,966 | | | | 764,549 | | | | 1,965,386 | | | | 578,862 | | | | 147,527 | | | | 146,741 | |
Administrative fees | | | 347,903 | | | | 191,137 | | | | 491,347 | | | | 144,715 | | | | 43,390 | | | | 95,886 | |
Custodian | | | 138,836 | | | | 25,040 | | | | 89,450 | | | | 71,612 | | | | 17,509 | | | | 9,432 | |
Transfer agent | | | 87,708 | | | | 30,371 | | | | 568,934 | | | | 28,844 | | | | 41,732 | | | | 7,993 | |
Professional fees | | | 53,826 | | | | 37,544 | | | | 58,823 | | | | 33,357 | | | | 36,496 | | | | 38,285 | |
Registration fees | | | 16,670 | | | | 21,226 | | | | 23,329 | | | | 18,729 | | | | 18,269 | | | | 3,602 | |
Trustees fees and expenses | | | 9,525 | | | | 5,592 | | | | 12,230 | | | | 3,360 | | | | 1,293 | | | | 2,133 | |
Reports to shareholders | | | 7,958 | | | | 7,566 | | | | 50,813 | | | | 11,173 | | | | 2,664 | | | | 136 | |
Miscellaneous | | | 7,516 | | | | 8,093 | | | | 10,145 | | | | 7,698 | | | | 3,770 | | | | 2,177 | |
| | | | | | | | | | | | | | | | | | | | | | | | |
Total expenses before offsets | | | 1,504,908 | | | | 1,091,118 | | | | 3,270,457 | | | | 898,350 | | | | 312,650 | | | | 306,385 | |
| | | | | | | | | | | | | | | | | | | | | | | | |
Fee waivers | | | (372,248 | ) | | | — | | | | (80 | ) | | | (11 | ) | | | — | | | | — | |
Expense reimbursements | | | — | | | | — | | | | (215,749 | ) | | | (93,430 | ) | | | (49,736 | ) | | | (94,983 | ) |
Expense reductions | | | (18,265 | ) | | | (6,334 | ) | | | (34,050 | ) | | | (27,765 | ) | | | (4,115 | ) | | | (449 | ) |
| | | | | | | | | | | | | | | | | | | | | | | | |
Net expenses | | | 1,114,395 | | | | 1,084,784 | | | | 3,020,578 | | | | 777,144 | | | | 258,799 | | | | 210,953 | |
| | | | | | | | | | | | | | | | | | | | | | | | |
Net investment income (loss) | | | 4,426,224 | | | | (605,290 | ) | | | (1,800,037 | ) | | | (450,002 | ) | | | 280,479 | | | | 1,422,001 | |
| | | | | | | | | | | | | | | | | | | | | | | | |
Net Realized and Unrealized Gain (Loss): | | | | | | | | | | | | | | | | | | | | | | | | |
Net realized gain (loss) on investments and futures | | | (8,103,510 | ) | | | 2,924,678 | | | | 10,110,817 | | | | 12,333,780 | | | | (2,478,209 | ) | | | (698,701 | ) |
Net realized loss on affiliated investment | | | (334,077 | ) | | | — | | | | — | | | | — | | | | — | | | | — | |
Net realized loss on foreign currency contracts and transactions | | | (67,834 | ) | | | — | | | | — | | | | — | | | | — | | | | — | |
Net unrealized depreciation of investments and futures | | | (54,040,383 | ) | | | (30,980,059 | ) | | | (104,806,788 | ) | | | (45,318,730 | ) | | | (6,586,212 | ) | | | (1,410,920 | ) |
Net unrealized depreciation of foreign currency contracts and translations | | | (8,861 | ) | | | — | | | | — | | | | — | | | | — | | | | — | |
| | | | | | | | | | | | | | | | | | | | | | | | |
Net realized and unrealized loss | | | (62,554,665 | ) | | | (28,055,381 | ) | | | (94,695,971 | ) | | | (32,984,950 | ) | | | (9,064,421 | ) | | | (2,109,621 | ) |
| | | | | | | | | | | | | | | | | | | | | | | | |
Net decrease in net assets resulting from operations | | | ($58,128,441 | ) | | | ($28,660,671 | ) | | | ($96,496,008 | ) | | | ($33,434,952 | ) | | | ($8,783,942 | ) | | | ($687,620 | ) |
| | | | | | | | | | | | | | | | | | | | | | | | |
The accompanying notes are an integral part of these financial statements.
46
Statements of Changes in Net Assets
For the fiscal year ended October 31, 2008
| | | | | | | | | | | | | | | | |
| | | Managers Fremont Global Fund | | | Managers Small Cap Fund | |
| | | 2008 | | | 2007 | | | 2008 | | | 2007 | |
Increase (Decrease) in Net Assets From Operations: | | | | | | | | | | | | | | | | |
Net investment income (loss) | | $ | 4,426,224 | | | $ | 886,615 | | | | ($605,290 | ) | | | ($624,343 | ) |
Net realized gain (loss) on investments, futures and foreign currency transactions | | | (8,505,421 | ) | | | 21,595,594 | | | | 2,924,678 | | | | 13,262,018 | |
Net unrealized appreciation (depreciation) of investments, futures and foreign currency translations | | | (54,049,244 | ) | | | 3,979,911 | | | | (30,980,059 | ) | | | 185,638 | |
| | | | | | | | | | | | | | | | |
Net increase (decrease) in net assets resulting from operations | | | (58,128,441 | ) | | | 26,462,120 | | | | (28,660,671 | ) | | | 12,823,313 | |
| | | | | | | | | | | | | | | | |
Distributions to Shareholders: | | | | | | | | | | | | | | | | |
From net investment income | | | (4,898,251 | ) | | | (1,566,989 | ) | | | — | | | | — | |
From net realized gain on investments | | | — | | | | — | | | | — | | | | — | |
| | | | | | | | | | | | | | | | |
Total distributions to shareholders | | | (4,898,251 | ) | | | (1,566,989 | ) | | | — | | | | — | |
| | | | | | | | | | | | | | | | |
From Capital Share Transactions: | | | | | | | | | | | | | | | | |
Proceeds from sale of shares | | | 4,188,647 | | | | 9,201,522 | | | | 14,957,611 | | | | 14,102,109 | |
Reinvestment of dividends and distributions | | | 4,836,471 | | | | 1,546,508 | | | | — | | | | — | |
Cost of shares repurchased | | | (42,764,695 | ) | | | (42,925,589 | ) | | | (22,254,972 | ) | | | (29,084,600 | ) |
| | | | | | | | | | | | | | | | |
Net increase (decrease) from capital share transactions | | | (33,739,577 | ) | | | (32,177,559 | ) | | | (7,297,361 | ) | | | (14,982,491 | ) |
| | | | | | | | | | | | | | | | |
Total decrease in net assets | | | (96,766,269 | ) | | | (7,282,428 | ) | | | (35,958,032 | ) | | | (2,159,178 | ) |
| | | | | | | | | | | | | | | | |
Net Assets: | | | | | | | | | | | | | | | | |
Beginning of year | | | 175,104,821 | | | | 182,387,249 | | | | 87,015,352 | | | | 89,174,530 | |
| | | | | | | | | | | | | | | | |
End of year | | $ | 78,338,552 | | | $ | 175,104,821 | | | $ | 51,057,320 | | | $ | 87,015,352 | |
| | | | | | | | | | | | | | | | |
End of year undistributed net investment income (loss) | | $ | 716,819 | | | $ | 1,264,047 | | | | — | | | | — | |
| | | | | | | | | | | | | | | | |
Share Transactions: | | | | | | | | | | | | | | | | |
Sale of shares | | | 305,414 | | | | 604,188 | | | | 987,049 | | | | 857,366 | |
Reinvestment of dividends and distributions | | | 312,116 | | | | 101,795 | | | | — | | | | — | |
Shares repurchased | | | (3,256,235 | ) | | | (2,899,643 | ) | | | (1,490,236 | ) | | | (1,752,454 | ) |
| | | | | | | | | | | | | | | | |
Net increase (decrease) in shares | | | (2,638,705 | ) | | | (2,193,660 | ) | | | (503,187 | ) | | | (895,088 | ) |
| | | | | | | | | | | | | | | | |
The accompanying notes are an integral part of these financial statements.
47
| | | | | | | | | | | | | | | | | | | | | | | | | | | | |
Managers Fremont Micro-Cap Fund | | | Managers Fremont
Institutional Micro-Cap Fund | | | Managers Real Estate Securities Fund | | | Managers California Intermediate
Tax-Free Fund | |
2008 | | 2007 | | | 2008 | | | 2007 | | | 2008 | | | 2007 | | | 2008 | | | 2007 | |
| | | | | | | | | | | | | | | | | | | | | | | | | | | | |
| ($1,800,037) | | | ($2,862,395 | ) | | | ($450,002 | ) | | | ($1,466,986 | ) | | $ | 280,479 | | | $ | 239,017 | | | $ | 1,422,001 | | | $ | 1,587,981 | |
| 10,110,817 | | | 12,362,253 | | | | 12,333,780 | | | | 16,552,417 | | | | (2,478,209 | ) | | | 5,467,457 | | | | (698,701 | ) | | | 546,277 | |
| (104,806,788) | | | 45,248,831 | | | | (45,318,730 | ) | | | 16,404,048 | | | | (6,586,212 | ) | | | (5,762,676 | ) | | | (1,410,920 | ) | | | (1,167,644 | ) |
| | | | | | | | | | | | | | | | | | | | | | | | | | | | | |
| (96,496,008) | | | 54,748,689 | | | | (33,434,952 | ) | | | 31,489,479 | | | | (8,783,942 | ) | | | (56,202 | ) | | | (687,620 | ) | | | 966,614 | |
| | | | | | | | | | | | | | | | | | | | | | | | | | | | | |
| | | | | | | | | | | | | | | | | | | | | | | | | | | | |
| — | | | — | | | | — | | | | — | | | | (233,497 | ) | | | (218,890 | ) | | | (1,422,039 | ) | | | (1,587,981 | ) |
| — | | | — | | | | (13,276,494 | ) | | | (21,312,721 | ) | | | (5,615,212 | ) | | | (4,343,649 | ) | | | (543,580 | ) | | | (129,154 | ) |
| — | | | — | | | | (13,276,494 | ) | | | (21,312,721 | ) | | | (5,848,709 | ) | | | (4,562,539 | ) | | | (1,965,619 | ) | | | (1,717,135 | ) |
| | | | | | | | | | | | | | | | | | | | | | | | | | | | | |
| 6,372,989 | | | 11,063,517 | | | | 8,195,763 | | | | 14,208,603 | | | | 7,348,008 | | | | 10,672,920 | | | | 9,476,529 | | | | 9,294,908 | |
| | | | | | | | | | | | | | | | | | | | | | | | | | | | | |
| | | | | | | | | | | | | | | | | | | | | | | | | | | | |
| — | | | — | | | | 12,682,280 | | | | 20,832,879 | | | | 5,743,504 | | | | 4,393,797 | | | | 1,550,014 | | | | 1,353,390 | |
| (49,387,600) | | | (97,351,781 | ) | | | (88,630,068 | ) | | | (163,391,112 | ) | | | (12,653,705 | ) | | | (11,511,748 | ) | | | (11,399,870 | ) | | | (28,060,226 | ) |
| | | | | | | | | | | | | | | | | | | | | | | | | | | | | |
| (43,014,611) | | | (86,288,264 | ) | | | (67,752,025 | ) | | | (128,349,630 | ) | | | 437,807 | | | | 3,554,969 | | | | (373,327 | ) | | | (17,411,928 | ) |
| | | | | | | | | | | | | | | | | | | | | | | | | | | | | |
| (139,510,619) | | | (31,539,575 | ) | | | (114,463,471 | ) | | | (118,172,872 | ) | | | (14,194,844 | ) | | | (1,063,772 | ) | | | (3,026,566 | ) | | | (18,162,449 | ) |
| | | | | | | | | | | | | | | | | | | | | | | | | | | | | |
| | | | | | | | | | | | | | | | | | | | | | | | | | | | |
| 271,934,469 | | | 303,474,044 | | | | 141,222,568 | | | | 259,395,440 | | | | 26,560,666 | | | | 27,624,438 | | | | 35,981,659 | | | | 54,144,108 | |
| | | | | | | | | | | | | | | | | | | | | | | | | | | | | |
| $132,423,850 | | $ | 271,934,469 | | | $ | 26,759,097 | | | $ | 141,222,568 | | | $ | 12,365,822 | | | $ | 26,560,666 | | | $ | 32,955,093 | | | $ | 35,981,659 | |
| | | | | | | | | | | | | | | | | | | | | | | | | | | | | |
| 7,752 | | | — | | | | 981 | | | | — | | | $ | 41,849 | | | $ | 104,603 | | | | ($1,604 | ) | | $ | 208 | |
| | | | | | | | | | | | | | | | | | | | | | | | | | | | | |
| | | | | | | | | | | | | | | | | | | | | | | | | | | | |
| 184,730 | | | 298,464 | | | | 699,547 | | | | 941,852 | | | | 917,276 | | | | 792,155 | | | | 906,817 | | | | 875,926 | |
| — | | | — | | | | 918,613 | | | | 1,475,416 | | | | 707,023 | | | | 349,756 | | | | 149,744 | | | | 127,495 | |
| (1,462,126) | | | (2,611,430 | ) | | | (7,000,838 | ) | | | (11,144,890 | ) | | | (1,509,721 | ) | | | (902,548 | ) | | | (1,116,251 | ) | | | (2,632,539 | ) |
| | | | | | | | | | | | | | | | | | | | | | | | | | | | | |
| (1,277,396) | | | (2,312,966 | ) | | | (5,382,678 | ) | | | (8,727,622 | ) | | | 114,578 | | | | 239,363 | | | | (59,690 | ) | | | (1,629,118 | ) |
| | | | | | | | | | | | | | | | | | | | | | | | | | | | | |
The accompanying notes are an integral part of these financial statements.
48
Financial Highlights
For a share outstanding throughout each fiscal year
| | | | | | | | | | | | | | | | | | | | |
| | | For the fiscal year ended October 31, | |
Managers Fremont Global Fund | | 2008 | | | 2007 | | | 2006 | | | 2005 | | | 2004 | |
Net Asset Value, Beginning of Year | | $ | 16.49 | | | $ | 14.24 | | | $ | 13.19 | | | $ | 12.19 | | | $ | 11.17 | |
| | | | | | | | | | | | | | | | | | | | |
Income from Investment Operations: | | | | | | | | | | | | | | | | | | | | |
Net investment income | | | 0.45 | | | | 0.08 | 3 | | | 0.27 | | | | 0.46 | | | | 0.18 | |
Net realized and unrealized gain (loss) on investments | | | (6.65 | ) | | | 2.31 | 3 | | | 1.48 | | | | 0.69 | | | | 0.86 | |
| | | | | | | | | | | | | | | | | | | | |
Total from investment operations | | | (6.20 | ) | | | 2.39 | | | | 1.75 | | | | 1.15 | | | | 1.04 | |
| | | | | | | | | | | | | | | | | | | | |
Less Distributions to Shareholders from: | | | | | | | | | | | | | | | | | | | | |
Net investment income | | | (0.47 | ) | | | (0.14 | ) | | | (0.70 | ) | | | (0.15 | ) | | | (0.02 | ) |
| | | | | | | | | | | | | | | | | | | | |
Total distributions to shareholders | | | (0.47 | ) | | | (0.14 | ) | | | (0.70 | ) | | | (0.15 | ) | | | (0.02 | ) |
| | | | | | | | | | | | | | | | | | | | |
Net Asset Value, End of Year | | $ | 9.82 | | | $ | 16.49 | | | $ | 14.24 | | | $ | 13.19 | | | $ | 12.19 | |
| | | | | | | | | | | | | | | | | | | | |
Total Return 1 | | | (38.66 | )% | | | 16.94 | % | | | 13.67 | % | | | 9.79 | % | | | 9.27 | % |
| | | | | | | | | | | | | | | | | | | | |
Ratio of net expenses to average net assets | | | 0.80 | % | | | 0.90 | % | | | 1.11 | % | | | 1.09 | % | | | 1.02 | % |
Ratio of net investment income to average net assets 1 | | | 3.18 | % | | | 0.52 | % | | | 1.68 | % | | | 1.56 | % | | | 1.38 | % |
Portfolio turnover | | | 143 | % | | | 123 | % | | | 60 | % | | | 108 | % | | | 56 | % |
Net assets at end of year (000’s omitted) | | $ | 78,339 | | | $ | 175,105 | | | $ | 182,387 | | | $ | 183,197 | | | $ | 238,436 | |
| | | | | | | | | | | | | | | | | | | | |
Ratios absent expense offsets: 2 | | | | | | | | | | | | | | | | | | | | |
Ratio of total expenses to average net assets | | | 1.08 | % | | | 1.10 | % | | | 1.13 | % | | | 1.10 | % | | | 1.02 | % |
Ratio of net investment income to average net assets | | | 2.90 | % | | | 0.32 | % | | | 1.67 | % | | | 1.56 | % | | | 1.38 | % |
| | | | | | | | | | | | | | | | | | | | |
| |
| | | For the fiscal year ended October 31, | |
Managers Small Cap Fund | | 2008 | | | 2007 | | | 2006 | | | 2005 | | | 2004 | |
Net Asset Value, Beginning of Year | | $ | 17.87 | | | $ | 15.47 | | | $ | 12.90 | | | $ | 11.10 | | | $ | 10.76 | |
| | | | | | | | | | | | | | | | | | | | |
Income from Investment Operations: | | | | | | | | | | | | | | | | | | | | |
Net investment loss | | | (0.12 | )3 | | | (0.11 | )3 | | | (0.12 | )3 | | | (0.14 | )3 | | | (0.15 | ) |
Net realized and unrealized gain (loss) on investments | | | (6.06 | )3 | | | 2.51 | 3 | | | 2.69 | 3 | | | 1.94 | 3 | | | 0.49 | |
| | | | | | | | | | | | | | | | | | | | |
Total from investment operations | | | (6.18 | ) | | | 2.40 | | | | 2.57 | | | | 1.80 | | | | 0.34 | |
| | | | | | | | | | | | | | | | | | | | |
Net Asset Value, End of Year | | $ | 11.69 | | | $ | 17.87 | | | $ | 15.47 | | | $ | 12.90 | | | $ | 11.10 | |
| | | | | | | | | | | | | | | | | | | | |
Total Return 1 | | | (34.58 | )% | | | 15.51 | % | | | 19.92 | % | | | 16.13 | % | | | 3.16 | % |
| | | | | | | | | | | | | | | | | | | | |
Ratio of net expenses to average net assets | | | 1.41 | % | | | 1.39 | % | | | 1.38 | % | | | 1.47 | % | | | 1.60 | % |
Ratio of net investment loss to average net assets 1 | | | (0.79 | )% | | | (0.68 | )% | | | (0.84 | )% | | | (1.10 | )% | | | (1.43 | )% |
Portfolio turnover | | | 59 | % | | | 49 | % | | | 49 | % | | | 67 | % | | | 54 | % |
Net assets at end of year (000’s omitted) | | $ | 51,057 | | | $ | 87,015 | | | $ | 89,175 | | | $ | 66,301 | | | $ | 54,101 | |
| | | | | | | | | | | | | | | | | | | | |
Ratios absent expense offsets: 2 | | | | | | | | | | | | | | | | | | | | |
Ratio of total expenses to average net assets | | | 1.43 | % | | | 1.41 | % | | | 1.42 | % | | | 1.53 | % | | | 1.63 | % |
Ratio of net investment loss to average net assets | | | (0.80 | )% | | | (0.70 | )% | | | (0.88 | )% | | | (1.16 | )% | | | (1.46 | )% |
| | | | | | | | | | | | | | | | | | | | |
49
Financial Highlights
For a share outstanding throughout each fiscal year
| | | | | | | | | | | | | | | | | | | | |
| | | For the fiscal year ended October 31, | |
Managers Fremont Micro-Cap Fund | | 2008 | | | 2007 | | | 2006 | | | 2005 | | | 2004 | |
Net Asset Value, Beginning of Year | | $ | 41.90 | | | $ | 34.48 | | | $ | 29.65 | | | $ | 27.86 | | | $ | 28.14 | |
| | | | | | | | | | | | | | | | | | | | |
Income from Investment Operations: | | | | | | | | | | | | | | | | | | | | |
Net investment loss | | | (0.31 | )3 | | | (0.37 | )3 | | | (0.26 | )3 | | | (0.38 | ) | | | (0.44 | ) |
Net realized and unrealized gain (loss) on investments | | | (16.18 | )3 | | | 7.79 | 3 | | | 5.09 | 3 | | | 2.17 | | | | 0.16 | |
| | | | | | | | | | | | | | | | | | | | |
Total from investment operations | | | (16.49 | ) | | | 7.42 | | | | 4.83 | | | | 1.79 | | | | (0.28 | ) |
| | | | | | | | | | | | | | | | | | | | |
Net Asset Value End of Year | | $ | 25.41 | | | $ | 41.90 | | | $ | 34.48 | | | $ | 29.65 | | | $ | 27.86 | |
| | | | | | | | | | | | | | | | | | | | |
Total Return 1 | | | (39.37 | )% | | | 21.52 | %4 | | | 16.29 | % | | | 6.42 | % | | | (1.00 | )% |
| | | | | | | | | | | | | | | | | | | | |
Ratio of net expenses to average net assets | | | 1.54 | % | | | 1.53 | % | | | 1.54 | % | | | 1.56 | % | | | 1.62 | % |
Ratio of net investment loss to average net assets 1 | | | (0.92 | )% | | | (1.01 | )% | | | (0.79 | )% | | | (1.11 | )% | | | (1.41 | )% |
Portfolio turnover | | | 193 | % | | | 76 | % | | | 82 | % | | | 68 | % | | | 83 | % |
Net assets at end of year (000’s omitted) | | $ | 132,424 | | | $ | 271,934 | | | $ | 303,474 | | | $ | 397,629 | | | $ | 490,527 | |
| | | | | | | | | | | | | | | | | | | | |
Ratios absent expense offsets: 2 | | | | | | | | | | | | | | | | | | | | |
Ratio of net expenses to average net assets | | | 1.66 | % | | | 1.53 | % | | | 1.54 | % | | | 1.56 | % | | | — | |
Ratio of net investment loss to average net assets | | | (1.04 | )% | | | (1.01 | )% | | | (0.79 | )% | | | (1.11 | )% | | | — | |
| | | | | | | | | | | | | | | | | | | | |
| |
| | | For the fiscal year ended October 31, | |
Managers Fremont Institutional Micro-Cap Fund | | 2008 | | | 2007 | | | 2006 | | | 2005 | | | 2004 | |
Net Asset Value, Beginning of Year | | $ | 16.65 | | | $ | 15.07 | | | $ | 14.94 | | | $ | 14.49 | | | $ | 14.52 | |
| | | | | | | | | | | | | | | | | | | | |
Income from Investment Operations: | | | | | | | | | | | | | | | | | | | | |
Net investment loss | | | (0.10 | )3 | | | (0.13 | )3 | | | (0.09 | )3 | | | — | | | | (0.17 | ) |
Net realized and unrealized gain (loss) on investments | | | (5.87 | )3 | | | 2.99 | 3 | | | 2.36 | 3 | | | 0.97 | | | | 0.14 | |
| | | | | | | | | | | | | | | | | | | | |
Total from investment operations | | | (5.97 | ) | | | 2.86 | | | | 2.27 | | | | 0.97 | | | | (0.03 | ) |
| | | | | | | | | | | | | | | | | | | | |
Less Distributions to Shareholders from: | | | | | | | | | | | | | | | | | | | | |
Net investment income | | | — | | | | — | | | | — | | | | (0.00 | )# | | | — | |
Net realized gain on investments | | | (2.04 | ) | | | (1.28 | ) | | | (2.14 | ) | | | (0.52 | ) | | | — | |
| | | | | | | | | | | | | | | | | | | | |
Total distribution to shareholders | | | (2.04 | ) | | | (1.28 | ) | | | (2.14 | ) | | | (0.52 | ) | | | — | |
| | | | | | | | | | | | | | | | | | | | |
Net Asset Value End of Year | | $ | 8.64 | | | $ | 16.65 | | | $ | 15.07 | | | $ | 14.94 | | | $ | 14.49 | |
| | | | | | | | | | | | | | | | | | | | |
Total Return 1 | | | (40.45 | )% | | | 20.48 | % | | | 16.33 | % | | | 6.54 | % | | | (0.21 | )% |
| | | | | | | | | | | | | | | | | | | | |
Ratio of net expenses to average net assets | | | 1.30 | % | | | 1.35 | % | | | 1.35 | % | | | 1.35 | % | | | 1.30 | % |
Ratio of net investment loss to average net assets 1 | | | (0.74 | )% | | | (0.83 | )% | | | (0.63 | )% | | | (0.89 | )% | | | (1.09 | )% |
Portfolio turnover | | | 198 | % | | | 129 | % | | | 78 | % | | | 73 | % | | | 87 | % |
Net assets at end of year (000’s omitted) | | $ | 26,759 | | | $ | 141,223 | | | $ | 259,395 | | | $ | 295,701 | | | $ | 358,011 | |
| | | | | | | | | | | | | | | | | | | | |
Ratios absent expense offsets: 2 | | | | | | | | | | | | | | | | | | | | |
Ratio of total expenses to average net assets | | | 1.55 | % | | | 1.39 | % | | | 1.37 | % | | | 1.39 | % | | | 1.30 | % |
Ratio of net investment loss to average net assets | | | (0.99 | )% | | | (0.87 | )% | | | (0.65 | )% | | | (0.93 | )% | | | (1.09 | )% |
| | | | | | | | | | | | | | | | | | | | |
50
Financial Highlights
For a share outstanding throughout each fiscal year
| | | | | | | | | | | | | | | | | | | | |
| | | For the fiscal year ended October 31, | |
Managers Real Estate Securities Fund | | 2008 | | | 2007 | | | 2006 | | | 2005 | | | 2004 | |
Net Asset Value, Beginning of Year | | $ | 12.57 | | | $ | 14.74 | | | $ | 12.86 | | | $ | 12.75 | | | $ | 10.09 | |
| | | | | | | | | | | | | | | | | | | | |
Income from Investment Operations: | | | | | | | | | | | | | | | | | | | | |
Net investment income | | | 0.13 | 3 | | | 0.06 | | | | 0.18 | | | | 0.35 | | | | 0.30 | |
Net realized and unrealized gain (loss) on investments | | | (4.06 | )3 | | | 0.22 | | | | 3.87 | | | | 1.86 | | | | 2.66 | |
| | | | | | | | | | | | | | | | | | | | |
Total from investment operations | | | (3.93 | ) | | | 0.28 | | | | 4.05 | | | | 2.21 | | | | 2.96 | |
| | | | | | | | | | | | | | | | | | | | |
Less Distributions to Shareholders from: | | | | | | | | | | | | | | | | | | | | |
Net investment income | | | (0.12 | ) | | | (0.10 | ) | | | (0.10 | ) | | | (0.35 | ) | | | (0.30 | ) |
Net realized gain on investments | | | (2.97 | ) | | | (2.35 | ) | | | (2.07 | ) | | | (1.75 | ) | | | — | |
| | | | | | | | | | | | | | | | | | | | |
Total distributions to shareholders | | | (3.09 | ) | | | (2.45 | ) | | | (2.17 | ) | | | (2.10 | ) | | | (0.30 | ) |
| | | | | | | | | | | | | | | | | | | | |
Net Asset Value, End of Year | | $ | 5.55 | | | $ | 12.57 | | | $ | 14.74 | | | $ | 12.86 | | | $ | 12.75 | |
| | | | | | | | | | | | | | | | | | | | |
Total Return 1 | | | (38.95 | )% | | | 2.10 | % | | | 36.43 | % | | | 18.84 | % | | | 29.56 | % |
| | | | | | | | | | | | | | | | | | | | |
Ratio of net expenses to average net assets | | | 1.48 | % | | | 1.40 | % | | | 1.46 | % | | | 1.42 | % | | | 1.50 | % |
Ratio of net investment income to average net assets 1 | | | 1.63 | % | | | 0.82 | % | | | 0.97 | % | | | 1.93 | % | | | 2.68 | % |
Portfolio turnover | | | 127 | % | | | 126 | % | | | 69 | % | | | 70 | % | | | 136 | % |
Net assets at end of year (000’s omitted) | | $ | 12,366 | | | $ | 26,561 | | | $ | 27,624 | | | $ | 24,903 | | | $ | 28,586 | |
| | | | | | | | | | | | | | | | | | | | |
Ratios absent expense offsets: 2 | | | | | | | | | | | | | | | | | | | | |
Ratio of total expenses to average net assets | | | 1.80 | % | | | 1.41 | % | | | 1.46 | % | | | 1.54 | % | | | 1.67 | % |
Ratio of net investment income to average net assets | | | 1.31 | % | | | 0.83 | % | | | 0.97 | % | | | 1.81 | % | | | 2.51 | % |
| | | | | | | | | | | | | | | | | | | | |
| |
| | | For the fiscal year ended October 31, | |
Managers California Intermediate Tax-Free Fund | | 2008 | | | 2007 | | | 2006 | | | 2005 | | | 2004 | |
Net Asset Value, Beginning of Year | | $ | 10.56 | | | $ | 10.75 | | | $ | 10.66 | | | $ | 11.17 | | | $ | 11.08 | |
| | | | | | | | | | | | | | | | | | | | |
Income from Investment Operations: | | | | | | | | | | | | | | | | | | | | |
Net investment income | | | 0.38 | | | | 0.40 | | | | 0.39 | | | | 0.39 | | | | 0.40 | |
Net realized and unrealized gain (loss) on investments | | | (0.56 | ) | | | (0.16 | ) | | | 0.25 | | | | (0.31 | ) | | | 0.28 | |
| | | | | | | | | | | | | | | | | | | | |
Total from investment operations | | | (0.18 | ) | | | 0.24 | | | | 0.64 | | | | 0.08 | | | | 0.68 | |
| | | | | | | | | | | | | | | | | | | | |
Less Distributions to Shareholders from: | | | | | | | | | | | | | | | | | | | | |
Net investment income | | | (0.38 | ) | | | (0.40 | ) | | | (0.40 | ) | | | (0.40 | ) | | | (0.40 | ) |
Net realized gain on investments | | | (0.16 | ) | | | (0.03 | ) | | | (0.15 | ) | | | (0.19 | ) | | | (0.19 | ) |
| | | | | | | | | | | | | | | | | | | | |
Total distributions to shareholders | | | (0.54 | ) | | | (0.43 | ) | | | (0.55 | ) | | | (0.59 | ) | | | (0.59 | ) |
| | | | | | | | | | | | | | | | | | | | |
Net Asset Value, End of Year | | $ | 9.84 | | | $ | 10.56 | | | $ | 10.75 | | | $ | 10.66 | | | $ | 11.17 | |
| | | | | | | | | | | | | | | | | | | | |
Total Return 1 | | | (1.82 | )% | | | 2.23 | % | | | 6.21 | % | | | 0.92 | % | | | 6.39 | % |
| | | | | | | | | | | | | | | | | | | | |
Ratio of net expenses to average net assets | | | 0.55 | % | | | 0.56 | % | | | 0.55 | % | | | 0.55 | % | | | 0.55 | % |
Ratio of net investment income to average net assets 1 | | | 3.71 | % | | | 3.75 | % | | | 3.76 | % | | | 3.74 | % | | | 3.63 | % |
Portfolio turnover | | | 33 | % | | | 35 | % | | | 22 | % | | | 28 | % | | | 66 | % |
Net assets at end of year (000’s omitted) | | $ | 32,955 | | | $ | 35,982 | | | $ | 54,144 | | | $ | 47,847 | | | $ | 50,784 | |
| | | | | | | | | | | | | | | | | | | | |
Ratios absent expense offsets: 2 | | | | | | | | | | | | | | | | | | | | |
Ratio of total expenses to average net assets | | | 0.80 | % | | | 0.82 | % | | | 0.82 | % | | | 0.81 | % | | | 0.74 | % |
Ratio of net investment income to average net assets | | | 3.46 | % | | | 3.49 | % | | | 3.49 | % | | | 3.48 | % | | | 3.44 | % |
| | | | | | | | | | | | | | | | | | | | |
# | Rounds to less than $0.01 per share. |
1 | Total returns and net investment income would have been lower had certain expenses not been reduced. (See Note 1(c) of Notes to Financial Statements.) |
2 | Excludes the impact of expense reimbursements or fee waivers and expense reductions such as brokerage recapture credits, but includes non-reimbursable expenses, if any, such as interest and taxes. (See Note 1(c) of Notes to Financial Statements.) |
3 | Per share numbers have been calculated using average shares. |
4 | The Total Return is based on the Financial Statement Net Asset Values as shown above. |
51
Notes to Financial Statements
October 31, 2008
| 1. | Summary of Significant Accounting Policies |
Managers Trust I (the “Trust”) is an open-end management investment company organized as a Massachusetts business trust and registered under the Investment Company Act of 1940, as amended (the “1940 Act”). Currently, the Trust is comprised of a number of investment series. Included in this report are the Managers Fremont Global Fund (“Managers Fremont Global”), Managers Small Cap Fund (“Small Cap”), Managers Fremont Micro-Cap Fund (“Micro-Cap”), Managers Fremont Institutional Micro-Cap Fund (“Institutional Micro-Cap”), Managers Real Estate Securities Fund (“Real Estate Securities”), and Managers California Intermediate Tax-Free Fund (“California Intermediate Tax-Free”), collectively the “Funds.”
The Funds’ financial statements are prepared in accordance with accounting principles generally accepted in the United States of America, which require management to make estimates and assumptions that affect the reported amounts of assets and liabilities and disclosure of contingent assets and liabilities at the date of the financial statements and the reported amounts of income and expenses during the reporting periods. Actual results could differ from those estimates and such differences could be material. The following is a summary of significant accounting policies followed by the Funds in the preparation of their financial statements:
| a. | Valuation of Investments |
Equity securities traded on a domestic or international securities exchange are valued at the last quoted sale price, or, lacking any sales, at the last quoted bid price. Over-the-counter securities are valued at the Nasdaq Official Closing Price, if one is available. Lacking any sales, over-the-counter securities are valued at the last quoted bid price. The Funds’ investments are generally valued based on market quotations provided by third party pricing services approved by the Board of Trustees of the Funds. Under certain circumstances, the value of certain investments may be based on an evaluation of fair value, pursuant to procedures established by and under the general supervision of the Board of Trustees of the Trust. Each Fund may use the fair value of a portfolio security to calculate its NAV when, for example, (1) market quotations are not readily available because a portfolio security is not traded in a public market or the principal market in which the security trades is closed, (2) trading in a portfolio security is suspended and has not resumed before the Fund calculates its NAV, (3) a significant event affecting the value of a portfolio security is determined to have occurred between the time of the market quotation provided for a portfolio security and the time as of which the Fund calculates its NAV, (4) a security’s price has remained unchanged over a period of time (often referred to as a “stale price”), or (5) the Investment Manager determines that a market quotation is inaccurate. The Investment Manager monitors intervening events that may affect the value of securities held in each Fund’s portfolio and, in accordance with procedures adopted by the Funds’ Trustees, will adjust the prices of securities traded in foreign markets, as appropriate, to reflect the impact of events occurring subsequent to the close of such markets but prior to the time each Fund’s NAV is calculated.
Fixed income securities are valued based on valuations furnished by independent pricing services that utilize matrix systems, which reflect such factors as security prices, yields, maturities, and ratings, and are supplemented by dealer and exchange quotations. Futures contracts for which market quotations are readily available are valued at the settlement price as of the close of the futures exchange. Short-term investments having a remaining maturity of 60 days or less are valued at amortized cost, which approximates market value. Investments in other open-end regulated investment companies are valued at their end of day net asset value per share. Investments in certain mortgage-backed and stripped mortgage-backed securities, preferred stocks, convertible securities, derivatives and other debt securities not traded on an organized securities market are valued on the basis of valuations provided by dealers or by a pricing service which uses information with respect to transactions in such securities and various relationships between securities and yield to maturity in determining value. Securities (including derivatives) for which market quotations are not readily available are valued at fair value, as determined in good faith, and pursuant to procedures adopted by the Board of Trustees of the Trust. The values assigned to fair value investments are based on available information and do not necessarily represent amounts that might ultimately be realized, since such amounts depend on future developments inherent in long-term investments. Further, because of the inherent uncertainty of valuation, those estimated values may differ significantly from the values that would have been used had a ready market for the investments existed, and the differences could be material.
The Funds adopted Financial Accounting Standards Board Statement of Financial Accounting Standards No. 157, Fair Value Measurements (“FAS 157”), effective November 1, 2008. In accordance with FAS 157, fair value is defined as the price that a Fund would receive to sell an asset or pay to transfer a liability in an orderly transaction between market participants at the measurement date. FAS 157 also establishes a framework for measuring fair value, and a three-level hierarchy for fair value measurements based upon the transparency of inputs to the valuation of an asset or liability. Inputs may be observable or unobservable and refer broadly to the assumptions that market participants would use in pricing the asset or liability. Observable inputs reflect the assumptions market participants would use in pricing the asset or liability based on market data obtained from sources independent of the Funds. Unobservable inputs reflect the Funds’ own assumptions about the assumptions that market participants would use in pricing the asset or liability developed based on the best information available in the circumstances. Each investment is assigned a level based upon the observability of the inputs which are significant to the overall valuation. The three-tier hierarchy of inputs is summarized below:
Level 1 – quoted prices in active markets for identical investments
Level 2 – other significant observable inputs (including quoted prices for similar investments, interest rates, prepayment speeds, credit risk)
Level 3 – significant unobservable inputs (including the Funds’ own assumptions in determining the fair value of investments)
52
Notes to Financial Statements (continued)
The inputs or methodologies used for valuing investments are not necessarily an indication of the risk associated with investing in those investments. The following table summarizes the inputs used to value the Funds’ net assets by the above fair value hierarchy levels as of October 31, 2008:
| | | | | | | |
Level | | Investments in
Securities | | Other Financial
Instruments* | |
Managers Fremont Global | | | | | | | |
Level 1 | | $ | 63,036,812 | | | — | |
Level 2 | | | 22,099,217 | | | (8,576 | ) |
Level 3 | | | — | | | — | |
| | | | | | | |
Total | | $ | 85,136,029 | | | ($8,576 | ) |
| | | | | | | |
Small Cap | | | | | | | |
Level 1 | | $ | 56,106,355 | | | — | |
Level 2 | | | 87,795 | | | — | |
Level 3 | | | — | | | — | |
| | | | | | | |
Total | | $ | 56,194,150 | | $ | 0 | |
| | | | | | | |
Micro-Cap | | | | | | | |
Level 1 | | $ | 131,276,486 | | | — | |
Level 2 | | | — | | | — | |
Level 3 | | | — | | | — | |
| | | | | | | |
Total | | $ | 131,276,486 | | $ | 0 | |
| | | | | | | |
Institutional Micro-Cap | | | | | | | |
Level 1 | | $ | 26,643,276 | | | — | |
Level 2 | | | — | | | — | |
Level 3 | | | — | | | — | |
| | | | | | | |
Total | | $ | 26,643,276 | | $ | 0 | |
| | | | | | | |
Real Estate Securities | | | | | | | |
Level 1 | | $ | 12,300,293 | | | — | |
Level 2 | | | — | | | — | |
Level 3 | | | — | | | — | |
| | | | | | | |
Total | | $ | 12,300,293 | | $ | 0 | |
| | | | | | | |
California Intermediate Tax-Free | | | | | | | |
Level 1 | | $ | 5,178,698 | | | — | |
Level 2 | | | 27,474,114 | | | — | |
Level 3 | | | — | | | — | |
| | | | | | | |
Total | | $ | 32,652,812 | | $ | 0 | |
| | | | | | | |
| * | Other financial instruments are derivative instruments not reflected in the Schedule of Portfolio Investments, such as futures, forwards and swap contracts, which are valued at the unrealized appreciation/depreciation of the instrument. |
The following table is a reconciliation of investments in which significant unobservable inputs (Level 3) were used in determining fair value:
| | | | | | |
Balance as of October 31, 2008 | | Investments
in Securities | | Other Financial
Instruments |
Managers Fremont Global | | $ | 0 | | $ | 0 |
Small Cap | | $ | 0 | | $ | 0 |
Micro-Cap | | $ | 0 | | $ | 0 |
Institutional Micro-Cap | | $ | 0 | | $ | 0 |
Real Estate Securities | | $ | 0 | | $ | 0 |
California Intermediate Tax-Free | | $ | 0 | | $ | 0 |
Security transactions are accounted for as of the trade date. Realized gains and losses on securities sold are determined on the basis of identified cost.
| c. | Investment Income and Expenses |
Dividend income is recorded on the ex-dividend date except certain dividends from foreign securities where the ex-dividend date may have passed. These dividends are recorded as soon as the Trust is informed of the ex-dividend date. Dividend income on foreign securities is recorded net of any withholding tax. Interest income, which includes amortization of premium and accretion of discount on debt securities, as required, is accrued as earned. Non-cash dividends included in dividend income, if any, are reported at the fair value of the securities received. Other income and expenses are recorded on an accrual basis. Expenses that cannot be directly attributed to a fund are apportioned among the Funds in the Trust and in some cases other affiliated funds based upon their relative average net assets or number of shareholders.
The following Funds had certain portfolio trades directed to various brokers who paid a portion of such Fund’s expenses. For the fiscal year ended October 31, 2008, under these arrangements the amount by which the Funds’ expenses were reduced and the impact on the expense ratios were as follows: Managers Fremont Global - $16,867 or 0.01%, Small Cap - $5,595 or 0.01%, Micro-Cap - $31,973 or 0.02%, Institutional Micro-Cap - $26,978 or 0.05% and Real Estate Securities - $3,925 or 0.02%.
The Funds have a “balance credit” arrangement with The Bank of New York Mellon (“BNYM”), the Funds’ custodian, whereby each Fund is credited with an interest factor equal to 0.75% below the effective 90-day T-Bill rate for account balances left uninvested overnight. If the T-Bill rate falls below 0.75%, no credits will be earned. These credits serve to reduce custody expenses that would otherwise be charged to each Fund. For the fiscal year ended October 31, 2008, the custodian expense was reduced as follows: Managers Fremont Global - $18, Small Cap - $10, Micro-Cap - $98, Institutional Micro-Cap - $58, Real Estate Securities - $11 and California Intermediate Tax-Free - $106.
Overdrafts will cause a reduction of any earnings credits, computed at 2% above the effective Federal Funds rate on the day of the overdraft. For the fiscal year ended October 31, 2008, overdraft fees and the impact on the expense ratios, if any, for Managers Fremont
53
Notes to Financial Statements (continued)
Global, Small Cap, Micro-Cap, Institutional Micro-Cap, Real Estate Securities and California Intermediate Tax-Free equaled $407, $4,280 or 0.01%, $72, $22,669 or 0.04%, $2,666 or 0.01%, and $3, respectively.
The Trust also has a balance credit arrangement with its Transfer Agent, PNC Global Investment Servicing (U.S.) Inc. (formerly PFPC, Inc.), whereby earnings credits are used to offset banking charges and other out-of-pocket expenses. For the fiscal year ended October, 31, 2008, the transfer agent expense was reduced as follows: Managers Fremont Global - $1,380, Small Cap - $729, Micro-Cap - $1,979, Institutional Micro-Cap - $729, Real Estate Securities - $179 and California Intermediate Tax-Free - $343.
The Investment Manager has agreed to waive a portion of its management fee in consideration of shareholder servicing fees that it has received from JPMorgan Distribution Services, Inc., with respect to short-term cash investments each Fund may have made in the JPMorgan Liquid Assets Portfolio – Capital Shares and JPMorgan U.S. Government Money Market Portfolio – Capital Shares. For the fiscal year ended October 31, 2008, the management fee was reduced as follows: Micro-Cap - $80, Institutional Micro-Cap - $11.
Total returns and net investment income for the Funds would have been lower had certain expenses not been offset. Total expenses before offsets exclude the impact of expense reimbursements or fee waivers and expense reductions such as brokerage recapture credits, but include non-reimburseable expenses, if any, such as interest and taxes.
| d. | Dividends and Distributions |
Dividends resulting from net investment income, if any, normally will be declared and paid as follows:
Annually – Managers Fremont Global, Small Cap, Micro-Cap and Institutional Micro-Cap
Quarterly - Real Estate Securities
Declared daily, paid monthly - California Intermediate Tax-Free
Distributions of capital gains, if any, will be made on an annual basis and when required for Federal excise tax purposes. Income and capital gain distributions are determined in accordance with Federal income tax regulations, which may differ from generally accepted accounting principles. These differences are primarily due to differing treatments for losses deferred due to wash sales, REITs, equalization accounting for tax purposes, foreign currency, futures and market discount transactions. Permanent book and tax basis differences, if any, relating to shareholder distributions will result in reclassifications to paid-in capital. The tax character of distributions paid during the fiscal years ended 2008 and 2007 were as follows:
| | | | | | | | | | | | | | | | | | |
| | | Managers Fremont Global | | Small Cap | | Micro-Cap |
| | | 2008 | | 2007 | | 2008 | | 2007 | | 2008 | | 2007 |
Distributions paid from: | | | | | | | | | | | | | | | | | | |
Ordinary income | | $ | 4,898,251 | | $ | 1,566,989 | | | — | | | — | | | — | | | — |
Short-term capital gains | | | — | | | — | | | — | | | — | | | — | | | — |
Long-term capital gains | | | — | | | — | | | — | | | — | | | — | | | — |
| | | | | | | | | | | | | | | | | | |
| | $ | 4,898,251 | | $ | 1,566,989 | | | — | | | — | | | — | | | — |
| | | | | | | | | | | | | | | | | | |
| | | |
| | | Institutional Micro-Cap | | Real Estate Securities | | California
Intermediate Tax-Free |
| | | 2008 | | 2007 | | 2008 | | 2007 | | 2008 | | 2007 |
Distributions paid from: | | | | | | | | | | | | | | | | | | |
Ordinary income | | | — | | | — | | $ | 233,497 | | $ | 218,890 | | $ | 1,422,039 | | $ | 1,587,981 |
Short-term capital gains | | $ | 7,971,110 | | $ | 742,109 | | | 827,608 | | | 611,939 | | | 13,965 | | | 12,813 |
Long-term capital gains | | | 5,305,384 | | | 20,570,612 | | | 4,787,604 | | | 3,731,710 | | | 529,615 | | | 116,341 |
| | | | | | | | | | | | | | | | | | |
| | $ | 13,276,494 | | $ | 21,312,721 | | $ | 5,848,709 | | $ | 4,562,539 | | $ | 1,965,619 | | $ | 1,717,135 |
| | | | | | | | | | | | | | | | | | |
As of October 31, 2008, the components of distributable earnings (excluding unrealized appreciation/ depreciation) on a tax basis consisted of:
| | | | | | | | | | | | | | | | | | |
| | | Managers
Fremont
Global | | Small Cap | | Micro-Cap | | Institutional
Micro-Cap | | Real Estate
Securities | | California
Intermediate
Tax-Free |
Capital loss carryforward | | $ | 49,339,871 | | $ | 9,023,452 | | | — | | | — | | $ | 1,432,775 | | $ | 698,701 |
Undistributed ordinary income | | | 705,958 | | | — | | | — | | | — | | | 65,427 | | | 8,279 |
Undistributed short-term capital gains | | | — | | | — | | | — | | | — | | | — | | | — |
Undistributed long-term capital gains | | | — | | | — | | $ | 7,915,488 | | $ | 3,254,356 | | | — | | | — |
54
Notes to Financial Statements (continued)
Each Fund intends to comply with the requirements under Subchapter M of the Internal Revenue Code of 1986, as amended, to distribute substantially all of their taxable income and gains to their shareholders and to meet certain diversification and income requirements with respect to investment companies. Therefore, no provision for Federal income or excise tax is included in the accompanying financial statements.
Additionally, based on each Fund’s understanding of the tax rules and rates related to income, gains and transactions for the foreign jurisdictions in which it invests, each Fund will provide for foreign taxes, and where appropriate, deferred foreign taxes.
Management has analyzed the Funds’ tax positions taken on federal income tax returns for all open tax years (tax years ended October 31, 2005-2008), and has concluded that no provision for federal income tax is required in the Funds’ financial statements.
| f. | Capital Loss Carryovers |
As of October 31, 2008, the following Funds had accumulated net realized capital loss carryovers from securities transactions for Federal income tax purposes as shown in the following chart. These amounts may be used to offset realized capital gains, if any, through the expiration dates listed.
| | | | | |
Fund | | Capital Loss
Carryover Amount | | Expires
October 31, |
Managers Fremont Global | | $ | 43,288,254 | | 2011 |
| | | 6,051,617 | | 2016 |
Small Cap | | | 9,023,452 | | 2010 |
Real Estate Securities | | | 1,432,775 | | 2016 |
California Intermediate Tax-Free | | | 698,701 | | 2016 |
For the fiscal year ended October 31, 2008, Small Cap and Micro-Cap utilized capital loss carryovers in the amounts of $4,685,044 and $3,389,595, respectively.
The Trust’s Declaration of Trust authorizes for each series the issuance of an unlimited number of shares of beneficial interest, without par value. Each Fund records sales and repurchases of its capital stock on the trade date. The cost of securities contributed to the Funds in connection with the issuance of shares is based on the valuation of those securities in accordance with the Funds’ policy on investment valuation. Dividends and distributions to shareholders are recorded on the ex-dividend date.
At October 31, 2008, certain unaffiliated shareholders, specifically omnibus accounts, individually held greater than 10% of the outstanding shares of the following Funds: Small Cap - 3 collectively own 71%; Micro-Cap - 2 collectively own 49%; Institutional Micro-Cap - 3 collectively own 36%; Real Estate Securities - 3 collectively own 49%; California Intermediate Tax-Free - 3 collectively own 66%. Transactions by these shareholders may have a material impact on their respective Funds.
| h. | Foreign Currency Translation |
The books and records of the Funds are maintained in U.S. dollars. The value of investments, assets and liabilities denominated in currencies other than U.S. dollars are translated into U.S. dollars based upon current foreign exchange rates. Purchases and sales of foreign investments, income and expenses are converted into U.S. dollars based on currency exchange rates prevailing on the respective dates of such transactions. Net realized and unrealized gain (loss) on foreign currency transactions represent: (1) foreign exchange gains and losses from the sale and holdings of foreign currencies; (2) gains and losses between trade date and settlement date on investment securities transactions and forward foreign currency exchange contracts; and (3) gains and losses from the difference between amounts of interest and dividends recorded and the amounts actually received.
The Funds do not isolate the net realized and unrealized gain or loss resulting from changes in exchange rates from the fluctuations resulting from changes in market prices of securities held. Such fluctuations are included with the net realized and unrealized gain or loss on investments.
| 2. | Agreements and Transactions with Affiliates |
The Trust has entered into an Investment Management Agreement under which Managers Investment Group LLC (the “Investment Manager”), an independently managed subsidiary of Affiliated Managers Group, Inc. (“AMG”), provides or oversees investment management services to the Funds. The Investment Manager selects subadvisors for each Fund (subject to Trustee approval), allocates assets among subadvisors and monitors the subadvisors’ investment programs and results. Each Fund’s investment portfolio is managed by portfolio managers who serve pursuant to subadvisory agreements with the Investment Manager.
Investment management fees are paid directly by each Fund to the Investment Manager based on average daily net assets. The annual investment management fee rates, as a percentage of average daily net assets, for the fiscal year ended October 31, 2008, were as follows:
| | | |
Fund | | Investment
Management Fee | |
Managers Fremont Global | | 0.60 | % |
Small Cap | | 1.00 | % |
Micro-Cap | | 1.00 | % |
Institutional Micro-Cap | | 1.00 | % |
Real Estate Securities | | 0.85 | % |
California Intermediate Tax-Free | | | |
on first $25 million | | 0.40 | % |
on next $25 million | | 0.35 | % |
on next $50 million | | 0.30 | % |
on next $50 million | | 0.25 | % |
on balance over $150 million | | 0.20 | % |
55
Notes to Financial Statements (continued)
Effective January 10, 2007, the Investment Manager contractually agreed until at least March 1, 2009, to waive its entire management fee for Managers Fremont Global with respect to those assets of the Fund invested in Managers Global Bond Fund. The amount waived for the fiscal year ended October 31, 2008, was $279,186, or 0.20% annually of Managers Fremont Global’s average net assets. The net annualized management fee for the fiscal year ended October 31, 2008 was 0.40%.
The Trust has entered into an Administration and Shareholder Servicing Agreement under which the Investment Manager serves as each Fund’s administrator (the “Administrator”) and is responsible for all aspects of managing the Funds’ operations, including administration and shareholder services to each Fund, its shareholders, and certain institutions, such as bank trust departments, broker-dealers and registered investment advisers, that advise or act as an intermediary with the Funds’ shareholders. For its services, the Administrator is paid a fee at a rate of 0.25% of average net assets per annum.
Effective January 10, 2007, the Investment Manager contractually agreed until at least March 1, 2009, to waive a portion of its administrative fee for Managers Fremont Global with respect to those assets of the Fund invested in the Managers Global Bond Fund such that its administrative fee will be 0.05% per annum of the average daily net assets invested in the Managers Global Bond Fund. The amount waived for the fiscal year ended October 31, 2008, was $93,062 or 0.07% annually of Managers Fremont Global’s average net assets. The net annualized administrative fee for fiscal year ended October 31, 2008 was 0.18%.
The Investment Manager has contractually agreed, through at least March 1, 2009, to waive fees and pay or reimburse expenses of Micro-Cap, Institutional Micro-Cap, Real Estate Securities and California Intermediate Tax-Free to the extent that the total annual operating expenses (exclusive of taxes, interest, brokerage costs, acquired fund expenses and extraordinary expenses) of each Fund exceed 1.56%, 1.35%, 1.50% and 0.55%, respectively, of each Fund’s average daily net assets. Micro-Cap’s expense cap became effective January 1, 2008.
Each of Micro-Cap, Institutional Micro-Cap, Real Estate Securities and California Intermediate Tax-Free is obligated to repay the Investment Manager such amounts waived, paid or reimbursed in future years provided that the repayment occurs within thirty-six (36) months after the waiver or reimbursement and that such repayment would not cause the Funds’ expenses in any such year to exceed the previously stated percentages of that Fund’s average daily net assets. For the fiscal year ended October 31, 2008, the cumulative amount of expense reimbursement by the Investment Manager subject to repayment by Micro-Cap, Institutional Micro-Cap, Real Estate Securities and California Intermediate Tax-Free equaled $215,749, $207,028, $49,736 and $338,963, respectively.
Prior to July 1, 2007, the aggregate annual retainer paid to each Independent Trustee was $55,000, plus $4,000 or $2,000 for each regular or special meeting attended, respectively. Effective July 1, 2007, the aggregate annual retainer paid to each Independent Trustee is $65,000, plus $4,000 or $2,500 for each regular or special meeting attended, respectively. The Trustees’ fees and expenses are allocated amongst all of the Funds for which the Investment Manager serves as the advisor (the “Managers Funds”) based on the relative net assets of such Funds. The Independent Chairman of the Trusts receives an additional payment of $15,000 per year. (Prior to July 1, 2007, the Independent Chairman received an additional payment of $10,000 per year). The Chairman of the Audit Committee receives an additional payment of $5,000 per year. (Prior to July 1, 2007, the Chairman of the Audit Committee received an additional payment of $2,000 per year). The “Trustees fees and expenses” shown in the financial statements represents the Funds’ allocated portion of the total fees and expenses paid by the Managers Funds.
The Funds are distributed by Managers Distributors, Inc. (“MDI”), a wholly-owned subsidiary of the Investment Manager. MDI serves as the principal underwriter for each Fund and is a registered broker-dealer and member of the Financial Industry Regulatory Authority, Inc. (“FINRA”). Shares of each Fund will be continuously offered and will be sold by brokers, dealers or other financial intermediaries who have executed selling agreements with MDI. MDI bears all the expenses of providing services pursuant to the Underwriting Agreement, including payment of the expenses relating to the distribution of Prospectuses for sales purposes and any advertising or sales literature. Certain Trustees and Officers of the Funds are Officers and/or Directors of the Investment Manager, AMG and/or MDI.
| 3. | Purchases and Sales of Securities |
Purchases and sales of securities, excluding short-term securities, for the fiscal year ended October 31, 2008, were as follows:
| | | | | | |
Fund | | Purchases | | Sales |
Managers Fremont Global | | $ | 194,612,498 | | $ | 226,344,551 |
Small Cap | | | 43,444,288 | | | 50,282,551 |
Micro-Cap | | | 355,257,466 | | | 400,848,947 |
Institutional Micro-Cap | | | 111,261,220 | | | 187,203,985 |
Real Estate Securities | | | 22,098,218 | | | 26,716,649 |
California Intermediate Tax-Free | | | 11,501,971 | | | 16,115,671 |
The Funds had no purchases or sales of U.S. Government securities for the fiscal year ended October 31, 2008.
| 4. | Portfolio Securities Loaned |
The Funds may participate in a securities lending program offered by BNYM, providing for the lending of securities to qualified brokers. Securities lending fees include earnings of such temporary cash investments, plus or minus any rebate to a borrower. These earnings (after any rebate) are then divided between BNYM, as a fee for its services under the program, and the Fund, according to agreed-upon rates. Collateral on all securities loaned is accepted in cash and/or government securities and is maintained at a minimum level of 102% (105% in the case of certain foreign securities) of the market value, plus interest, if applicable, of investments on loan. Collateral received in the form of cash is invested temporarily in the BNYM Institutional Cash Reserves Fund (the “ICRF”), or other short-term investments as defined in the Securities Lending Agreement with BNYM.
56
Notes to Financial Statements (continued)
In September and October of 2008, BNYM advised the Investment Manager that the ICRF had exposure to certain defaulted debt obligations, and that BNYM had established separate sleeves of the ICRF to hold these securities. The net impact of these positions is not material to each Fund. Each Fund’s position in the separate sleeves of the ICRF Fund is included in the Schedule of Investments and the unrealized loss on such investment is included in Net Unrealized Depreciation on the Statement of Assets and Liabilities and Statement of Operations.
| 5. | Commitments and Contingencies |
In the normal course of business, the Funds may enter into contracts and agreements that contain a variety of representations and warranties, which provide general indemnifications. The maximum exposure to the Funds under these arrangements is unknown, as this would involve future claims that may be against the Funds that have not yet occurred. However, based on experience, the Funds expect the risks of loss to be remote.
Certain transactions, such as futures and forward transactions, dollar roll agreements, or purchases of when-issued or delayed delivery securities may have a similar effect on a Fund’s net asset value as if the Fund had created a degree of leverage in its portfolio. However, if a Fund enters into such a transaction, the Fund will establish a segregated account with its custodian in which it will maintain cash, U.S. government securities or other liquid securities equal in value to its obligations in respect to such transaction. Securities and other assets held in the segregated account may not be sold while the transaction is outstanding, unless other suitable assets are substituted.
| 7. | Futures Contracts Held or Issued for Purposes other than Trading |
Managers Fremont Global uses Equity Index futures contracts with the objective of maintaining exposure to equity stock markets while maintaining liquidity. The Fund may purchase or sell futures contracts to achieve a desired level of investment, whether to accommodate portfolio turnover or cash flows from capital shares transactions. There are certain risks associated with futures contracts. Prices may not move as expected or the Fund may not be able to close out the contract when it desires to do so, resulting in losses.
Futures are valued at their quoted daily settlement prices. The aggregate principal amounts of the contracts are not recorded in the financial statements. Fluctuations in the value of the contracts are recorded in the Statement of Assets and Liabilities as an asset (liability) and in the Statement of Operations as unrealized appreciation (depreciation) until the contracts are closed, when they are recorded as realized gains (losses) on futures or forward currency contracts. The Fund had no open futures contracts at October 31, 2008.
| 8. | Forward Foreign Currency Contracts |
During the fiscal year ended October 31, 2008, Managers Fremont Global invested in forward foreign currency exchange contracts to manage currency exposure. These investments may involve greater market risk than the amounts disclosed in the Fund’s financial statements.
A forward foreign currency exchange contract is an agreement between a Fund and another party to buy or sell a currency at a set price at a future date. The market value of the contract will fluctuate with changes in currency exchange rates. The contract is marked-to-market daily, and the change in market value is recorded as an unrealized gain or loss. Gain or loss on the purchase or sale of contracts having the same settlement date, amount and counterparty is realized on the date of offset, otherwise gain or loss is realized on settlement date.
Managers Fremont Global may invest in non-U.S. dollar denominated instruments subject to limitations, and enter into forward foreign currency exchange contracts to facilitate transactions in foreign securities and to hedge against foreign currency exchange rate risk on its non-U.S. dollar denominated investment securities. Risks may arise upon entering into these contracts from the potential inability of counterparties to meet the terms of their contracts and from unanticipated movements in the value of a foreign currency relative to the U.S. dollar.
Managers Fremont Global had the following open forward currency contracts as of October 31, 2008:
| | | | | | | | | | | | | | | | |
Foreign Currency | | | | Settlement Date | | Current Value
(Receivable) | | | Contract Value
(Payable) | | | Unrealized
Gain/Loss | |
Managers Fremont Global | | | | | | | | | | | | | | | | |
Canadian Dollar | | Long | | 11/03/08-11/05/08 | | $ | 136,172 | | | $ | 135,555 | | | $ | 617 | |
Danish Krone | | Long | | 11/04/08 | | | 36,385 | | | | 36,930 | | | | (545 | ) |
Euro | | Short | | 11/04/08-11/05/08 | | | (241,823 | ) | | | (242,570 | ) | | | 747 | |
Euro | | Long | | 11/03/08-11/04/08 | | | 119,950 | | | | 121,430 | | | | (1,480 | ) |
Hong Kong Dollar | | Long | | 11/03/08 | | | 60,770 | | | | 60,754 | | | | 16 | |
Japanese Yen | | Short | | 11/05/08-11/06/08 | | | (38,785 | ) | | | (39,120 | ) | | | 335 | |
Japanese Yen | | Long | | 11/04/08-11/05/08 | | | 172,163 | | | | 174,507 | | | | (2,344 | ) |
Norwegian Krone | | Short | | 11/03/08 | | | (35,625 | ) | | | (36,140 | ) | | | 515 | |
Pound Sterling | | Long | | 11/03/08-11/05/08 | | | 293,821 | | | | 299,314 | | | | (5,493 | ) |
Swiss Franc | | Short | | 11/03/08-11/05/08 | | | (193,268 | ) | | | (193,830 | ) | | | 562 | |
Swiss Franc | | Long | | 11/03/08-11/04/08 | | | 73,556 | | | | 75,062 | | | | (1,506 | ) |
| | | | | | | | | | | | | | | | |
Total | | | | | | $ | 383,316 | | | $ | 391,892 | | | | ($8,576 | ) |
| | | | | | | | | | | | | | | | |
57
Tax Information (continued)
Tax Information (unaudited)
Each Fund hereby designates the maximum amount allowable of its net taxable income as qualified dividends as provided in the Jobs and Growth Tax Relief Reconciliation Act of 2003. The 2008 Form 1099-DIV you receive for each Fund will show the tax status of all distributions paid to you during the year.
Pursuant to section 852 of the Internal Revenue Code, Managers Fremont Global, Small Cap, Micro-Cap, Institutional Micro-Cap, Real Estate Securities and California Intermediate Tax-Free hereby designate as a capital gain distribution with respect to the taxable year ended October 31, 2008, $0, $0, $7,915,488, $14,407,829, $0 and $0, respectively or, if subsequently determined to be different, the net capital gains of such year.
58
Report of Independent Registered Public Accounting Firm
To the Board of Trustees of Managers Trust I and the Shareholders of Managers Fremont Global Fund, Managers Small Cap Fund, Managers Fremont Micro-Cap Fund, Managers Fremont Institutional Micro-Cap Fund, Managers Real Estate Securities Fund and Managers California Intermediate Tax-Free Fund:
In our opinion, the accompanying statements of assets and liabilities, including the schedules of portfolio investments, and the related statements of operations and of changes in net assets and the financial highlights present fairly, in all material respects, the financial position of Managers Fremont Global Fund, Managers Small Cap Fund, Managers Fremont Micro-Cap Fund, Managers Fremont Institutional Micro-Cap Fund, Managers Real Estate Securities Fund and Managers California Intermediate Tax-Free Fund (six of the series constituting Managers Trust I, hereafter referred to as the “Funds”), at October 31, 2008, the results of each of their operations for the year then ended, the changes in each of their net assets for each of two years in the period then ended and the financial highlights for each of the five years in the period then ended, in conformity with accounting principles generally accepted in the United States of America. These financial statements and financial highlights (hereafter referred to as “financial statements”) are the responsibility of the Funds’ management; our responsibility is to express an opinion on these financial statements based on our audits. We conducted our audits of these financial statements in accordance with the standards of the Public Company Accounting Oversight Board (United States). Those standards require that we plan and perform the audit to obtain reasonable assurance about whether the financial statements are free of material misstatement. An audit includes examining, on a test basis, evidence supporting the amounts and disclosures in the financial statements, assessing the accounting principles used and significant estimates made by management, and evaluating the overall financial statement presentation. We believe that our audits, which included confirmation of securities at October 31, 2008 by correspondence with the custodian and brokers, provide a reasonable basis for our opinion.
PricewaterhouseCoopers LLP
Philadelphia, Pennsylvania
December 23, 2008
59
Trustees and Officers
The Trustees and Officers of the Trust, their business addresses, principal occupations for the past five years and dates of birth are listed below. The Trustees provide broad supervision over the affairs of the Trust and the Funds. The Trustees are experienced executives who meet periodically throughout the year to oversee the Funds’ activities, review contractual arrangements with companies that provide services to the Funds, and review the Funds’ performance. Unless otherwise noted, the address of each Trustee or Officer is the address of the Trust: 800 Connecticut Avenue, Norwalk, Connecticut 06854.
There is no stated term of office for Trustees. Trustees serve until their resignation, retirement or removal in accordance with the Trust’s organizational documents and policies adopted by the Board from time to time. The Chairman of the Trustees, President, Treasurer and Secretary of the Trust are elected by the Trustees annually. Other Officers hold office at the pleasure of the Trustees.
Independent Trustees
The following Trustees are not “interested persons” of the Trust within the meaning of the 1940 Act:
| | |
Name, Date of Birth, Number
of Funds Overseen in Fund
Complex* | | Principal Occupation(s) During Past 5 Years and Other Directorships Held by Trustee |
| |
Jack W. Aber, 9/9/37 • Trustee since 2000 • Oversees 32 Funds in Fund Complex | | Professor of Finance, Boston University School of Management (1972-Present); Trustee of Appleton Growth Fund (1 portfolio); Trustee of Third Avenue Trust (4 portfolios); Trustee of Third Avenue Variable Trust (1 portfolio). |
| |
William E. Chapman, II, 9/23/41 • Independent Chairman • Trustee since 2000 • Oversees 32 Funds in Fund Complex | | President and Owner, Longboat Retirement Planning Solutions (1998-Present); Hewitt Associates, LLC (part time) (provider of Retirement and Investment Education Seminars); Trustee of Bowdoin College (2002-Present); Trustee of Third Avenue Trust (4 portfolios); Trustee of Third Avenue Variable Trust (1 portfolio). |
| |
Edward J. Kaier, 9/23/45 • Trustee since 2000 • Oversees 32 Funds in Fund Complex | | Attorney at Law and Partner, Teeters Harvey Gilboy & Kaier LLP (2007-Present); Attorney at Law and Partner, Hepburn Willcox Hamilton & Putnam, LLP (1977-2007); Trustee of Third Avenue Trust (4 portfolios); Trustee of Third Avenue Variable Trust (1 portfolio). |
| |
Steven J. Paggioli, 4/3/50 • Trustee since 2000 • Oversees 32 Funds in Fund Complex | | Consultant (2001-Present); Formerly Executive Vice President and Director, The Wadsworth Group (1986-2001); Executive Vice President, Secretary and Director, Investment Company Administration, LLC (1990-2001); Vice President, Secretary and Director, First Fund Distributors, Inc. (1991-2001); Trustee, Professionally Managed Portfolios (22 portfolios); Advisory Board Member, Sustainable Growth Advisors, LP. Independent Director, Chase Investment Counsel (2008 – Present). |
| |
Eric Rakowski, 6/5/58 • Trustee since 2000 • Oversees 32 Funds in Fund Complex | | Professor, University of California at Berkeley School of Law (1990-Present); Trustee of Third Avenue Trust (4 portfolios); Trustee of Third Avenue Variable Trust (1 portfolio). |
| |
Thomas R. Schneeweis, 5/10/47 • Trustee since 2000 • Oversees 32 Funds in Fund Complex | | Professor of Finance, University of Massachusetts (1977-Present); Director, CISDM at the University of Massachusetts, (1996-Present); President, Alternative Investment Analytics, LLC, (formerly Schneeweis Partners, LLC) (2001-Present); Partner, White Bear Partners, LLC (2007-Present); Partner, Schneeweis Capital Management, LLC (2007-Present); Partner, Schneeweis Associates, LLC (2007-Present); Partner, Northampton Capital Management, LLC (2004-Present); Partner, TRS Associates (2007-Present). |
| * | The Fund Complex consists of Managers AMG Funds, The Managers Funds, Managers Trust I and Managers Trust II. |
Interested Trustees
The following Trustees are “interested persons” of the Trust within the meaning of the 1940 Act. Mr. Dalton is an interested person by virtue of his positions with, and interest in securities of, Affiliated Managers Group, Inc. Mr. Streur is an interested person by virtue of his positions with Managers Investment Group LLC.
| | |
Name, Date of Birth, Number
of Funds Overseen in Fund
Complex* | | Principal Occupation(s) During Past 5 Years and Other Directorships Held by Trustee |
| |
Nathaniel Dalton, 9/29/66 • Trustee since 2008 • Oversees 32 Funds in Fund Complex | | Executive Vice President and Chief Operating Officer, Affiliated Managers Group, Inc., (2006-Present); Executive Vice President, Affiliated Managers Group, Inc., ( 2002 -2006); Executive Vice President and General Counsel, Affiliated Managers Group, Inc. (2001-2002); Senior Vice President and General Counsel, Affiliated Managers Group, Inc. (1996-2001). Director, Managers Distributors, Inc. (2000-Present). |
| |
John H. Streur, 2/6/60 • Trustee since 2008 • President since 2008 • Oversees 32 Funds in Fund Complex | | Senior Managing Partner, Managers Investment Group LLC (2006-Present); President, Managers Distributors, Inc. (2006 to President); Managing Partner, Managers Investment Group LLC (2005-2006); Chief Executive Officer, President and Chief Operating Officer, The Burridge Group LLC (1996-2004). |
Officers
| | |
Name, Date of Birth,
Position(s) Held with Fund
and Length of Time Served | | Principal Occupation(s) During Past 5 Years |
Christine C. Carsman, 4/2/52 • Secretary since 2004 | | Senior Vice President and Chief Regulatory Counsel, Affiliated Managers Group, Inc. (2004-Present); Secretary, The Managers Funds, Managers AMG Funds and Managers Trust II (2004-Present); Senior Counsel, Vice President and Director of Operational Risk Management and Compliance, Wellington Management Company, LLP (1995-2004); Deputy General Counsel, The Boston Company, Inc. (1993-1995); Associate General Counsel, The Boston Company Advisors, Inc. (1991-1993); Associate, Sullivan & Worcester LLP (1987-1991). |
| |
Donald S. Rumery, 5/29/58 • Chief Financial Officer since 2007 • Treasurer since 2000 | | Senior Vice President, Managers Investment Group LLC (2005-Present); Director, Finance and Planning, The Managers Funds LLC, (1994-2004); Treasurer and Chief Financial Officer, Managers Distributors, Inc. (2000-Present); Treasurer, The Managers Funds (1995-Present); Treasurer, Managers AMG Funds (1999-Present); Treasurer, Managers Trust II (2000-Present); Secretary, Managers Trust I and Managers Trust II (2000-2004) and Secretary, The Managers Funds (1997-2004); Chief Financial Officer, The Managers Funds, Managers AMG Funds and Managers Trust II (2007-Present). |
| |
Keitha L. Kinne, 5/16/58 • Chief Operating Officer since 2007 | | Managing Partner and Chief Operating Officer, Managers Investment Group LLC (2007-Present); Chief Operating Officer, The Managers Funds, Managers AMG Funds and Managers Trust II (2007-Present); Managing Director, Legg Mason & Co., LLC (2006-2007); Managing Director, Citigroup Asset Management (2004-2006); Senior Vice President, Prudential Investments (1999-2004). |
60
Annual Renewal of Investment Advisory Agreements
On June 6, 2008, the Board of Trustees, including a majority of the Trustees who are not “interested persons” of the Trust (the “Independent Trustees”), approved the Investment Management Agreement with the Investment Manager for each of the Funds identified below and the Subadvisory Agreement for each of the Subadvisors. The Independent Trustees were separately represented by independent counsel in connection with their consideration of the approval of these agreements. In considering the Investment Management and Subadvisory Agreements, the Trustees reviewed a variety of materials relating to each Fund, the Investment Manager and each Subadvisor, including comparative performance, fee and expense information for an appropriate peer group of similar mutual funds (each a “Peer Group”), performance information for relevant benchmark indices (each a “Fund Benchmark”) and other information regarding the nature, extent and quality of services provided by the Investment Manager and the Subadvisors under their respective agreements. The Trustees also took into account information on the services provided by the Investment Manager and each Subadvisor (including information provided at meetings held on May 15-16 and June 5-6, 2008), as well as performance, fee and expense information regarding each Fund provided to them on a quarterly basis throughout the year. Prior to voting, the Independent Trustees: (a) reviewed the foregoing information with their independent legal counsel and with management; (b) received materials from their independent legal counsel discussing the legal standards applicable to their consideration of the Investment Management Agreement and the Subadvisory Agreements; and (c) met with their independent legal counsel in private sessions at which no representatives of management were present.
Nature, extent and quality of services.
In considering the nature, extent and quality of the services provided by the Investment Manager, the Trustees reviewed information relating to the Investment Manager’s operations and personnel. Among other things, the Investment Manager provided financial information, biographical information on its supervisory and professional staff and descriptions of its organizational and management structure. The Trustees also took into account information provided periodically throughout the previous year by the Investment Manager relating to the performance of its duties with respect to the Funds and the Trustees’ familiarity with the Investment Manager’s management through Board meetings, discussions and reports. In the course of their deliberations regarding the Investment Management Agreement, the Trustees evaluated, among other things: (a) the extent and quality of the Investment Manager’s oversight of the operation and management of the Funds; (b) the quality of the search, selection and monitoring services performed by the Investment Manager in overseeing the portfolio management responsibilities of the Subadvisors; (c) the Investment Manager’s ability to supervise the Funds’ other service providers; and (d) the Investment Manager’s compliance programs. The Trustees also took into account the financial condition of the Investment Manager with respect to its ability to provide the services required under the Investment Management Agreement and to maintain contractual expense limitations for certain of the Funds.
For each Fund, the Trustees also reviewed information relating to each Subadvisor’s operations and personnel and the investment philosophy, strategies and techniques (for each Subadvisor, its “Investment Strategy”) used in managing the Fund or the portion of the Fund for which the Subadvisor has portfolio management responsibility. Among other things, the Trustees reviewed biographical information on portfolio management and other professional staff, information regarding each Subadvisor’s organizational and management structure and each Subadvisor’s brokerage policies and practices. The Trustees considered specific information provided regarding the experience of the individual or individuals at each Subadvisor with portfolio management responsibility for the portion of a Fund managed by the Subadvisor, including the information set forth in the Fund’s prospectus and statement of additional information. With respect to those Funds managed with multiple Subadvisors, the Trustees also noted information provided by the Investment Manager regarding the manner in which each Subadvisor’s Investment Strategy complements those utilized by the Fund’s other Subadvisors. In the course of their deliberations, the Trustees evaluated, among other things: (a) the services rendered by each Subadvisor in the past; (b) the qualifications and experience of the Subadvisor’s personnel; and (c) the Subadvisor’s compliance programs. The Trustees also took into account the financial condition of each Subadvisor with respect to its ability to provide the services required under its Subadvisory Agreement.
Performance.
As noted above, the Board considered each Fund’s performance during relevant time periods as compared to each Fund’s Peer Group and noted that the Board reviews on a quarterly basis detailed information about each Fund’s performance results, portfolio composition and Investment Strategies, including with respect to the portion of the Fund managed by each Subadvisor. The Board noted the Investment Manager’s expertise and resources in monitoring the performance, investment style and risk-adjusted performance of each Subadvisor. The Board also noted each Subadvisor’s performance record with respect to the Funds. The Board was mindful of the Investment Manager’s attention to monitoring each Subadvisor’s performance with respect to the Funds and its discussions with management regarding the factors that contributed to the performance of the Funds.
Advisory Fees and Profitability.
In considering the reasonableness of the advisory fee charged by the Investment Manager for managing each Fund, the Trustees noted that the Investment Manager, and not the Fund, is responsible for paying the fees charged by the Fund’s Subadvisors and, therefore, that the fees paid to the Investment Manager cover the cost of providing portfolio management services as well as the cost of providing search, selection and monitoring services in operating a “manager-of-managers” complex of mutual funds. The Trustees concluded that, in light of the additional high quality supervisory services provided by the Investment Manager and the fact that the subadvisory fees are paid out of the advisory fee, the advisory fee payable by each Fund to the Investment Manager can reasonably
61
Annual Renewal of Investment Advisory Agreements (continued)
be expected to exceed the median advisory fee for the Peer Group, which consists of many funds that do not operate with a manager-of-managers structure. In this regard, the Trustees also noted that the Investment Manager has undertaken to maintain expense limitations for certain of the Funds.
In considering the reasonableness of the advisory fee payable to the Investment Manager, the Trustees also reviewed information provided by the Investment Manager setting forth all revenues and other benefits, both direct and indirect, received by the Investment Manager and its affiliates attributable to managing each Fund and all the mutual funds in the Managers Family of Funds, the cost of providing such services and the resulting profitability to the Investment Manager and its affiliates from these relationships. With respect to the Fremont Global Fund, the Trustees noted that the Investment Manager allocated a portion of that Fund’s assets to another fund in the Managers Family of Funds and received direct and indirect benefits from that arrangement. The Trustees also noted the current and potential asset levels of each Fund and the willingness of the Investment Manager to waive fees and pay expenses for certain of the Funds from time to time as a means of limiting the total expenses of the smaller Funds. The Board took into account management’s discussion of the current advisory fee structure. In this regard, the Trustees noted that, unlike a mutual fund that is managed by a single investment adviser, the Funds operate in a manager-of-managers structure and, as a Fund grows in size, it is common practice for the Investment Manager to recommend the selection of an additional Subadvisor to manage a portion of the Fund’s portfolio. The Trustees also noted that the subadvisory fees are paid by the Investment Manager out of its advisory fee. The Trustees further noted that, because of this practice, the Investment Manager’s oversight and supervisory responsibilities with respect to the Funds can be expected to increase with the size of the Funds. Based on the foregoing, the Trustees concluded that the profitability to the Investment Manager is reasonable and that the Investment Manager is not realizing material benefits from economies of scale that would warrant adjustments to the advisory fees for any Fund at this time. With respect to economies of scale, the Trustees also noted that as a Fund’s assets increase over time, the Fund may realize other economies of scale to the extent that the increase in assets is proportionally greater than the increase in certain other expenses.
Subadvisory Fees and Profitability.
In considering the reasonableness of the fee payable by the Investment Manager to each Subadvisor (other than First Quadrant, L.P. (“FQ”), which is an affiliate of the Investment Manager), the Trustees relied on the ability of the Investment Manager to negotiate the terms of the Subadvisory Agreement at arm’s length as part of the manager-of-managers structure, noting that the Subadvisor is not affiliated with the Investment Manager (other than FQ). In addition, the Trustees noted that the subadvisory fees are paid by the Investment Manager out of its advisory fee. Accordingly, the cost of services to be provided by the Subadvisor and the profitability to the Subadvisor of its relationship with a Fund were not material factors in the Trustees’ deliberations. For similar reasons, and based on the current size of the portion of a Fund managed by a Subadvisor, the Trustees concluded that any economies of scale being realized by the Subadvisor was not a material factor in the Trustees’ deliberations at this time.
In considering the reasonableness of the fee payable by the Investment Manager to FQ, a Subadvisor to the Fremont Global Fund, the Trustees noted that FQ is an affiliate of the Investment Manager and reviewed information provided by FQ regarding the cost to FQ of providing subadvisory services to the Fund and the resulting profitability from such relationship. The Trustees also noted that the subadvisory fee is paid by the Investment Manager out of the advisory fee. Based on the current size of the portion of the Fund managed by each Subadvisor, the Trustees concluded that the effect of any economies of scale being realized by FQ was not a material factor in the Trustees’ deliberations at this time.
In addition to the foregoing, the Trustees considered the specific factors and related conclusions set forth below with respect to each Fund.
CALIFORNIA INTERMEDIATE TAX-FREE FUND
Fund Performance.
Among other information relating to the Fund’s performance, the Trustees noted that the Fund’s performance for the 1-year, 3-year, 5-year and 10-year periods ended March 31, 2008 was below, above, above and above, respectively, the median performance of the Peer Group and below, below, above and below, respectively, the performance of the Fund Benchmark, the Lehman Brothers 5-Year Municipal Bond Index. The Trustees took into account management’s discussion of the Fund’s performance. The Trustees concluded that the Fund’s overall performance has been satisfactory.
Advisory Fees.
The Trustees noted that the Fund’s advisory fee and total expenses (net of applicable expense waivers/reimbursements) as of March 31, 2008 were higher and lower, respectively, than the average for the Peer Group. The Trustees took into account the fact that the Investment Manager has contractually agreed, through March 1, 2009, to limit the Fund’s net annual operating expenses to 0.55%. The Trustees concluded that, in light of the nature, extent and quality of the services provided by the Investment Manager and the Subadvisor, the Fund’s current size, the foregoing expense limitation and the considerations noted above with respect to the Subadvisor and the Investment Manager, the Fund’s advisory fees are reasonable.
FREMONT GLOBAL FUND
Fund Performance.
Among other information relating to the Fund’s performance, the Trustees noted that the Fund’s performance for the 1-year, 3-year, 5-year and 10-year periods ended March 31, 2008 was below the median performance of the Peer Group and below the performance of the Fund Benchmark, a Composite Index (65% MSCI World Index and 35% Lehman Brothers Global Aggregate Index), for each period. The Trustees noted management’s discussion of the Fund’s performance and the steps taken to address such performance, including the termination of two Subadvisors and the reallocation of their assets to a Subadvisor whose performance exceeded its Peer Group (Large Blend Funds) and its Benchmark (Russell 3000 Index) for the 3-year period ending March 31, 2008. The Trustees concluded that appropriate action has been taken to address the Fund’s performance.
62
Annual Renewal of Investment Advisory Agreements (continued)
Advisory Fees.
The Trustees noted that the Fund’s advisory fee and total expenses (net of applicable expense waivers/reimbursements) as of March 31, 2008 were higher and lower, respectively, than the average for the Peer Group. The Trustees concluded that, in light of the nature, extent and quality of the services provided by the Investment Manager and the Subadvisors, the Fund’s performance and the considerations noted above with respect to the Subadvisors and the Investment Manager, the Fund’s advisory fees are reasonable.
REAL ESTATE SECURITIES FUND
Fund Performance.
Among other information relating to the Fund’s performance, the Trustees noted that the Fund’s performance for the 1-year, 3-year, 5-year and 10-year periods ended March 31, 2008 was above, above, below and below, respectively, the median performance of the Peer Group and above, above, below and below, respectively, the performance of the Fund Benchmark, the Dow Jones Wilshire REIT Index. The Trustees further noted management’s discussion of the Fund’s performance, and that the Fund’s relative performance has improved since the engagement of a new Subadvisor in 2004. The Trustees concluded that the Fund’s performance has been satisfactory in light of all factors considered.
Advisory Fees.
The Trustees noted that the Fund’s advisory fee and total expenses (net of applicable expense waivers/reimbursements) as of March 31, 2008 were higher than the average for the Peer Group. The Trustees took into account the fact that the Investment Manager has contractually agreed, through March 1, 2009, to limit the Fund’s net annual operating expenses to 1.50%. The Trustees concluded that, in light of the nature, extent and quality of the services provided by the Investment Manager and the Subadvisor, the Fund’s performance, the foregoing expense limitation and the considerations noted above with respect to the Subadvisor and the Investment Manager, the Fund’s advisory fees are reasonable.
SMALL CAP FUND
Fund Performance.
Among other information relating to the Fund’s performance, the Trustees noted that the Fund’s performance for the 1-year, 3-year, 5-year and 10-year periods ended March 31, 2008 was above the median performance of the Peer Group and above the performance of the Fund Benchmark, the Russell 2000 Growth Index, for each such period. The Trustees concluded that the Fund’s performance has been satisfactory.
Advisory Fees.
The Trustees noted that the Fund’s advisory fee and total expenses (net of applicable expense waivers/reimbursements) as of March 31, 2008 were higher and lower, respectively, than the average for the Peer Group. The Trustees concluded that, in light of the nature, extent and quality of the services provided by the Investment Manager and the Subadvisor, the Fund’s performance, the foregoing expense limitation and the considerations noted above with respect to the Subadvisor and the Investment Manager, the Fund’s advisory fees are reasonable.
After consideration of the foregoing, the Trustees also reached the following conclusions regarding the Investment Management Agreement and each Subadvisory Agreement, in addition to those conclusions discussed above: (a) the Investment Manager and each Subadvisor have demonstrated that they possess the capability and resources to perform the duties required of them under the Investment Management Agreement and the applicable Subadvisory Agreements; (b) each Subadvisor’s Investment Strategy is appropriate for pursuing the applicable Fund’s investment objectives; (c) each Subadvisor is reasonably likely to execute its Investment Strategy consistently over time; and (d) the Investment Manager and each Subadvisor maintain appropriate compliance programs.
Based on all of the above-mentioned factors and their related conclusions, with no single factor or conclusion being determinative and with each Trustee not necessarily attributing the same weight to each factor, the Trustees concluded that approval of each Investment Management Agreement and each Subadvisory Agreement (as applicable) would be in the best interests of each Fund and its shareholders. Accordingly, on June 6, 2008, the Trustees, including a majority of the Independent Trustees, voted to approve the Investment Management Agreement and the Subadvisory Agreements for each Fund.
63
Annual Renewal of Investment Advisory Agreements (continued)
FREMONT INSTITUTIONAL MICRO-CAP FUND AND FREMONT MICRO-CAP FUND
On June 6, 2008, the Board of Trustees, including a majority of the Trustees who are not “interested persons” of the Trust (the “Independent Trustees”), approved the Investment Management Agreement with the Investment Manager for the Managers Fremont Institutional Micro-Cap Fund and the Managers Fremont Micro-Cap Fund (each a “Fund”). The Independent Trustees were separately represented by independent counsel in connection with their consideration of the approval of this agreement. In considering the Investment Management Agreement, the Trustees reviewed a variety of materials relating to the Funds, the Investment Manager and the Subadvisors, including performance, fee and expense information, performance information for the relevant benchmark index (each a “Fund Benchmark”) and other information regarding the nature, extent and quality of services provided by the Investment Manager under its agreement. The Trustees also took into account information on the services provided by the Investment Manager and each Subadvisor (including information provided at meetings held on May 15-16 and June 5-6, 2008), as well as performance, fee and expense information regarding each Fund provided to them on a quarterly basis throughout the year. Prior to voting, the Independent Trustees: (a) reviewed the foregoing information with their independent legal counsel and with management; (b) received materials from their independent legal counsel discussing the legal standards applicable to their consideration of the Investment Management Agreement; and (c) met with their independent legal counsel in private sessions at which no representatives of management were present.
Nature, extent and quality of services.
In considering the nature, extent and quality of the services provided by the Investment Manager, the Trustees reviewed information relating to the Investment Manager’s operations and personnel. Among other things, the Investment Manager provided financial information, biographical information on its supervisory and professional staff and descriptions of its organizational and management structure. The Trustees also took into account information provided periodically throughout the previous year by the Investment Manager relating to the performance of its duties with respect to the Funds and the Trustees’ familiarity with the Investment Manager’s management through Board meetings, discussions and reports. In the course of their deliberations regarding the Investment Management Agreement, the Trustees evaluated, among other things: (a) the extent and quality of the Investment Manager’s oversight of the operation and management of the Funds; (b) the quality of the search, selection and monitoring services performed by the Investment Manager in overseeing the portfolio management responsibilities of the Subadvisors; (c) the Investment Manager’s ability to supervise the Funds’ other service providers; and (d) the Investment Manager’s compliance programs. The Trustees also took into account the financial condition of the Investment Manager with respect to its ability to provide the services required under the Investment Management Agreement and to maintain a contractual expense limitation for certain of the Funds.
Performance.
With respect to the Managers Fremont Institutional Micro-Cap Fund, among other information relating to the Fund’s performance, the Trustees noted that the Fund’s performance for the 1-year, 3-year, 5-year and 10-year periods ended March 31, 2008 was above, below, below and above, respectively, the median performance of the Peer Group and for the 1-year, 3-year and 5-year periods ended March 31, 2008 was above, above and below, respectively, the performance of the Fund Benchmark, the Russell Micro-cap Index. The Trustees also noted the fact that the Fund’s previous Subadvisor was replaced with four new Subadvisors in late 2007, and also, at a Meeting held on December 5-6, 2007, the Trustees previously noted that the composite portfolio performance of the Fund’s new Subadvisors was above the Fund Benchmark for various periods for all such Subadvisors. They further noted management’s discussion of the Fund’s performance. The Trustees concluded that the Fund’s performance has been satisfactory in light of all factors considered.
With respect to the Managers Fremont Micro-Cap Fund, among other information relating to the Fund’s performance, the Trustees noted that the Fund’s performance for the 1-year, 3-year, 5-year and 10-year periods ended March 31, 2008 was above, above, below and above, respectively, the median performance of the Peer Group and for the 1-year, 3-year and 5-year periods ended March 31, 2008 was above, above and below, respectively, the performance of the Fund Benchmark, the Russell Microcap Index. The Trustees also noted the fact that the Fund’s previous Subadvisor was replaced with four new Subadvisors in late 2007, and also, at a Meeting held on December 5-6, 2007, the Trustees previously noted that the composite comparable portfolio performance of the Fund’s new Subadvisors was above the Fund Benchmark for various periods for all such Subadvisors. They further noted management’s discussion of the Fund’s performance. The Trustees concluded that the Fund’s performance has been satisfactory in light of all factors considered.
Furthermore, the Board reviews on a quarterly basis detailed information about each Fund’s performance results, portfolio composition and each Subadvisor’s investment philosophy, strategies and techniques in managing the Funds. The Board noted the Investment Manager’s expertise and resources in monitoring the performance, investment style and risk-adjusted performance of the Subadvisors. The Board was mindful of the Investment Manager’s attention to monitoring each Subadvisor’s performance with respect to the Funds and its discussions with management regarding the factors that contributed to the performance of the Funds.
Advisory Fees and Profitability.
In considering the reasonableness of the advisory fee charged by the Investment Manager for managing each Fund, the Trustees noted that the Investment Manager, and not the Fund, is responsible for paying the fees charged by the Fund’s Subadvisors and, therefore, that the fees paid to the Investment Manager cover the cost of providing portfolio management services as well as the cost
64
Annual Renewal of Investment Advisory Agreements (continued)
of providing search, selection and monitoring services in operating a “manager-of-managers” complex of mutual funds. The Trustees concluded that, in light of the additional high quality supervisory services provided by the Investment Manager and the fact that the subadvisory fees are paid out of the advisory fee, the advisory fee payable by each Fund to the Investment Manager can reasonably be expected to exceed the median advisory fee for an appropriate peer group of similar mutual funds, which consists of many funds that do not operate with a manager-of-managers structure. In this regard, the Trustees also noted that the Investment Manager has undertaken to maintain expense limitations for the Funds.
In considering the reasonableness of the advisory fee payable to the Investment Manager, the Trustees also reviewed information provided by the Investment Manager setting forth all revenues and other benefits, both direct and indirect, received by the Investment Manager and its affiliates attributable to managing the Funds and all the mutual funds in the Managers Family of Funds, the cost of providing such services and the resulting profitability to the Investment Manager and its affiliates from these relationships. The Trustees also noted the current and potential asset levels of the Funds and the willingness of the Investment Manager to waive fees and pay expenses for the Funds from time to time as a means of limiting the total expenses of the Funds. The Board took into account management’s discussion of the current advisory fee structure. In this regard, the Trustees noted that, unlike a mutual fund that is managed by a single investment adviser, the Funds operate in a manager-of-managers structure and, as a Fund grows in size, it is common practice for the Investment Manager to recommend the selection of an additional Subadvisor to manage a portion of the Fund’s portfolio. The Trustees also noted that the subadvisory fees are paid by the Investment Manager out of its advisory fee. The Trustees further noted that, because of this practice, the Investment Manager’s oversight and supervisory responsibilities with respect to a Fund can be expected to increase with the size of the Fund. Based on the foregoing, the Trustees concluded that the profitability to the Investment Manager is reasonable and that the Investment Manager is not realizing material benefits from economies of scale that would warrant adjustments to the advisory fees for the Funds at this time.
With respect to economies of scale, the Trustees also noted that as a Fund’s assets increase over time, the Fund may realize other economies of scale to the extent that the increase in assets is proportionally greater than the increase in certain other expenses.
The Trustees reviewed each Fund’s Expense Summary for the Fund’s fiscal year ended October 31, 2007. The Trustees took into account the fact that the Investment Manager has contractually agreed, through March 1, 2009, to limit the net annual operating expenses of the Fremont Institutional Micro-Cap Fund and the Fremont Micro-Cap Fund to 1.35% and 1.56%, respectively. The Trustees concluded that, in light of the nature, extent and quality of the services provided by the Investment Manager and the Subadvisors, each Fund’s performance, the foregoing expense limitations and the considerations noted above with respect to the Subadvisors and the Investment Manager, the Funds’ advisory fees are reasonable.
* * * *
After consideration of the foregoing, the Trustees also reached the following conclusions regarding the Investment Management Agreement, in addition to those conclusions discussed above: (a) the Investment Manager has demonstrated that it possesses the capability and resources to perform the duties required of it under the Investment Management Agreement; and (b) the Investment Manager maintains an appropriate compliance program.
Based on all of the above-mentioned factors and related conclusions, with no single factor or conclusion being determinative and with each Trustee not necessarily attributing the same weight to each factor, the Trustees concluded that approval of the Investment Management Agreement would be in the best interests of each Fund and its shareholders. Accordingly, on June 6, 2008, the Trustees, including a majority of the Independent Trustees, voted to approve the Investment Management Agreement for each Fund.
65
THIS PAGE INTENTIONALLY LEFT BLANK
THIS PAGE INTENTIONALLY LEFT BLANK
Investment Manager and Administrator
Managers Investment Group LLC
800 Connecticut Avenue
Norwalk, Connecticut 06854
(203) 299-3500 or (800) 835-3879
Distributor
Managers Distributors, Inc.
800 Connecticut Avenue
Norwalk, Connecticut 06854
(203) 299-3500 or (800) 835-3879
Custodian
The Bank of New York Mellon
2 Hanson Place
Brooklyn, New York 11217
Legal Counsel
Ropes & Gray LLP
One International Place
Boston, Massachusetts 02110-2624
Transfer Agent
PNC Global Investment Servicing (U.S.) Inc.
Attn: Managers
P.O. Box 9769
Providence, Rhode Island 02940
(800) 548-4539

MANAGERSAND MANAGERS AMG FUNDS
EQUITY FUNDS
EMERGING MARKETS EQUITY
Rexiter Capital Management Limited
ESSEX GROWTH
ESSEX LARGE CAP GROWTH
ESSEX SMALL/MICRO CAP GROWTH
Essex Investment Management Co., LLC
FQ TAX-MANAGED U.S. EQUITY
FQ U.S. EQUITY
First Quadrant, L.P.
GW&K MULTI-CAP EQUITY
Gannet Welsh & Kotler, LLC
INSTITUTIONAL MICRO-CAP
MICRO-CAP
Lord, Abbett & Co. LLC
WEDGE Capital Management L.L.P.
OFI Institutional Asset Management, Inc.
Next Century Growth Investors LLC
INTERNATIONAL EQUITY
AllianceBernstein L.P.
Lazard Asset Management, LLC
Wellington Management Company, LLP
CHICAGO EQUITY PARTNERS
MID-CAP
Chicago Equity Partners, LLC
REAL ESTATE SECURITIES
Urdang Securities Management, Inc.
SKYLINE SPECIAL EQUITIES PORTFOLIO
Skyline Asset Management, L.P.
SMALL CAP
TIMESSQUARE MID CAP GROWTH
TIMESSQUARE SMALL CAP GROWTH
TimesSquare Capital Management, LLC
SPECIAL EQUITY
Ranger Investment Management, L.P.
Lord, Abbett & Co. LLC
Skyline Asset Management, L.P.
Smith Asset Management Group, L.P.
Federated MDTA LLC
Westport Asset Management, Inc.
SYSTEMATIC VALUE
SYSTEMATIC MID CAP VALUE
Systematic Financial Management, L.P.
BALANCED FUNDS
CHICAGO EQUITY PARTNERS BALANCED
Chicago Equity Partners, LLC
GLOBAL
AllianceBernstein L.P.
First Quadrant, L.P.
Wellington Management Company, LLP
ALTERNATIVE FUNDS
FQ GLOBAL ALTERNATIVES
First Quadrant, L.P.
INCOME FUNDS
BOND (MANAGERS)
FIXED INCOME
GLOBAL BOND
Loomis, Sayles & Co., L.P.
BOND (MANAGERS FREMONT)
Pacific Investment Management Co. LLC
CALIFORNIA INTERMEDIATE TAX-FREE
Miller Tabak Asset Management LLC
GW&K MUNICIPAL ENHANCED YIELD
Gannet Welsh & Kotler, LLC
HIGH YIELD
J.P. Morgan Investment Management LLC
INTERMEDIATE DURATION GOVERNMENT
SHORT DURATION GOVERNMENT
Smith Breeden Associates, Inc.
MONEY MARKET
JPMorgan Investment Advisors Inc.
This report is prepared for the Funds’ shareholders. It is authorized for distribution to prospective investors only when preceded or accompanied by an effective prospectus. To receive a free copy of the prospectus or Statement of Additional Information, which includes additional information about Fund Trustees, please contact us by calling 800.835.3879. Distributed by Managers Distributors, Inc., member FINRA.
A description of the policies and procedures each Fund uses to vote its proxies is available: (i) without charge, upon request, by calling 800.835.3879, or (ii) on the Securities and Exchange Commission’s (SEC) Web site at www.sec.gov. For information regarding each Fund’s proxy voting record for the 12-month period ended June 30, call 800.835.3879 or visit the SEC Web site at www.sec.gov.
The Funds file their complete schedule of portfolio holdings with the SEC for the first and third quarters of each fiscal year on Form N-Q. The Funds’ Forms N-Q are available on the SEC’s website at www.sec.gov. A Fund’s Forms N-Q may be reviewed and copied at the SEC’s Public Reference Room in Washington, DC. Information on the operation of the Public Reference Room may be obtained by calling 800.SEC.0330. To review a complete list of the Funds’ portfolio holdings, or to view the most recent quarterly holdings report, semiannual report, or annual report, please visit www.managersinvest.com.
www.managersinvest.com


Registrant has adopted a Code of Ethics. See attached Exhibit (a)(1).
| Item 3. | AUDIT COMMITTEE FINANCIAL EXPERT |
Registrant’s Board of Trustees has determined that independent Trustees Mr. Jack W. Aber and Mr. Steven J. Paggioli each qualify as the Audit Committee Financial Expert. Mr. Aber and Mr. Paggioli are “independent” as such term is defined in Form N-CSR.
| Item 4. | PRINCIPAL ACCOUNTANT FEES AND SERVICES |
The aggregate fees billed by PwC to the Fund for the Funds’ two most recent fiscal years for professional services rendered for audits of annual financial statements, or services that are normally provided in connection with statutory and regulatory filings or engagements (“Audit Fees”) were as follows:
| | | | | | |
| | | Fiscal 2008 | | Fiscal 2007 |
Managers AMG FQ Tax-Managed U.S. Equity Fund | | $ | 21,437 | | $ | 23,519 |
Managers AMG FQ U.S. Equity Fund | | $ | 21,301 | | $ | 23,387 |
Managers AMG FQ Global Alternatives Fund 1 | | $ | 28,449 | | $ | 29,260 |
Managers Fremont Global Fund | | $ | 25,905 | | $ | 29,626 |
Managers Small Cap Fund | | $ | 17,135 | | $ | 17,619 |
Managers Fremont Micro-Cap Fund | | $ | 19,305 | | $ | 16,333 |
Managers Fremont Institutional Micro-Cap Fund | | $ | 19,387 | | $ | 16,417 |
Managers Real Estate Securities Fund | | $ | 20,189 | | $ | 20,799 |
Managers Fremont Bond Fund | | $ | 42,030 | | $ | 45,122 |
Managers CA Intermediate Tax-Free Fund | | $ | 19,937 | | $ | 20,519 |
1 | – Fund commenced operations on March 30, 2006 |
Audit-Related Fees
There were no fees billed by PwC to the Fund in its two recent fiscal years for services rendered for assurance and related services that are reasonably related to the performance of the audit or review of the Fund’s financial statements, but are not reported as Audit Fees (“Audit-Related Fees”).
For the Funds’ two most recent fiscal years, there were no Audit-Related Fees billed by PwC for engagements related directly to the operations and financial reporting of one or more Funds by a Fund Service Provider. A Fund Service Provider is (a) any investment adviser to the Fund (not including any Subadvisor whose role is primarily portfolio management and is subcontracted with or overseen by another investment adviser) or (b) any entity that provides ongoing services to the Fund and is controlling, controlled by or under common control with a Fund investment adviser described in (a).
Tax Fees
The aggregate fees billed by PwC to the Funds for the two most recent fiscal years for professional services rendered for tax compliance, tax advice, and tax planning (“Tax Fees”) were as follows:
| | | | | | |
| | | Fiscal 2008 | | Fiscal 2007 |
Managers AMG FQ Tax-Managed U.S. Equity Fund | | $ | 7,046 | | $ | 6,900 |
Managers AMG FQ U.S. Equity Fund | | $ | 7,046 | | $ | 7,200 |
Managers AMG FQ Global Alternatives Fund 1 | | $ | 10,593 | | $ | 11,000 |
Managers Fremont Global Fund | | $ | 9,298 | | $ | 9,200 |
Managers Small Cap Fund | | $ | 7,046 | | $ | 6,400 |
Managers Fremont Micro-Cap Fund | | $ | 7,237 | | $ | 6,400 |
Managers Fremont Institutional Micro-Cap Fund | | $ | 7,237 | | $ | 6,400 |
Managers Real Estate Securities Fund | | $ | 9,634 | | $ | 9,500 |
Managers Fremont Bond Fund | | $ | 10,593 | | $ | 11,100 |
Managers CA Intermediate Tax-Free Fund | | $ | 6,231 | | $ | 8,400 |
1 | – Fund commenced operations on March 30, 2006 |
For the Funds’ two most recent fiscal years, Tax Fees billed by PwC for engagements by Fund Service Providers that related directly to the operations and financial reporting of the Funds were $0 for fiscal 2007 and $0 for fiscal 2006, respectively.
The services for which Tax Fees were charged comprise all services performed by professional staff in PwC’s tax division except those services related to the audit. Typically, this category would include fees for tax compliance, tax planning, and tax advice. Tax compliance, tax advice, and tax planning services include preparation of original and amended tax returns, claims for refund and tax payment-planning services, assistance with tax audits and appeals, tax advice related to mergers and acquisitions and requests for rulings or technical advice from taxing authorities.
All Other Fees
There were no other fees billed by PwC to the Funds for all other non-audit services (“Other Fees”) during the Funds’ two most recent fiscal years. During the same period, there were no Other Fees billed by PwC for engagements by Fund Service Providers that related directly to the operations and financial reporting of the Funds.
According to policies adopted by the Audit Committee, services provided by PwC to the Funds must be pre-approved by the Audit Committee. On an annual basis, the Audit Committee reviews and pre-approves various types of services that PwC may perform for the Funds without specific approval of each engagement, subject to specified budget limitations. As contemplated by the Sarbanes-Oxley Act of 2002 and related SEC rules, the Audit Committee also pre-approves non-audit services provided by PwC to any Fund Service Provider for any engagement that relates directly to the operations and financial reporting of the Funds. Any engagement that is not already pre-approved or that will
exceed a pre-approved budget must be submitted to the Audit Committee for pre-approval. The Chairman of the Audit Committee is authorized on behalf of the Board of Trustees and the Audit Committee to approve the engagement of PwC to perform non-audit services subject to certain conditions, including notification to the Audit Committee of such pre-approval not later than the next meeting of the Audit Committee following the date of such pre-approval.
There were no other fees billed by PwC for non-audit services rendered to the Funds and to Fund Service Providers for the Funds’ two most recent fiscal years.
The Audit Committee has considered whether the provision of non-audit services by PwC to Fund Service Providers that were not required to be pre-approved by the Audit Committee is compatible with maintaining PwC’s independence in its audit of the Funds, taking into account representations from PwC, in accordance with Independence Standards Board Standard No. 1, regarding its independence from the Funds and its related entities.
The following table sets forth the non-audit services provided by PwC to the Funds and its service affiliates defined as the Funds’ investment advisor and any entity controlling, controlled by or under common control with Managers Investment Group LLC that provides ongoing services to the Funds (“Control Affiliates”) for the last two fiscal years.
| | | | | | | | | | | | | | | | | | |
| | | Audit-related fees A | | Tax fees A | | All other fees A |
| | | 2007 | | 2006 | | 2007 | | 2006 | | 2007 | | 2006 |
Control Affiliates | | $ | 467,485 | | $ | 357,120 | | $ | 1,264,360 | | $ | 839,245 | | $ | 0 | | $ | 0 |
A | Aggregate amounts may reflect rounding. |
| Item 5. | AUDIT COMMITTEE OF LISTED REGISTRANTS |
Not applicable.
| Item 6. | SCHEDULE OF INVESTMENTS |
The schedule of investments in unaffiliated issuers as of the close of the reporting period is included as part of the shareholder report contained in Item 1 hereof.
| Item 7. | DISCLOSURE OF PROXY VOTING POLICIES AND PROCEDURES FOR CLOSED-END MANAGEMENT INVESTMENT COMPANIES |
Not applicable.
| Item 8. | PORTFOLIO MANAGERS OF CLOSED-END MANAGEMENT INVESTMENT COMPANIES |
Not applicable.
| Item 9. | PURCHASES OF EQUITY SECURITIES BY CLOSED-END MANAGEMENT INVESTMENT COMPANIES AND AFFILIATED PURCHASERS |
Not applicable.
| Item 10. | SUBMISSION OF MATTERS TO A VOTE OF SECURITY HOLDERS |
Not applicable.
| Item 11. | CONTROLS AND PROCEDURES |
(a) The Registrant’s principal executive and principal financial officers have concluded, based on their evaluation of the registrant’s disclosure controls and procedures as of a date within 90 days of the filing of this report, that the Registrant’s disclosure controls and procedures are reasonably designed to ensure that information required to be disclosed by the Registrant on Form N-CSR is recorded, processed, summarized and reported within the required time periods and that information required to be disclosed by the registrant in the reports that it files or submits on Form N-CSR is accumulated and communicated to the Registrant’s management, including its principal executive and principal financial officers, as appropriate to allow timely decisions regarding required disclosure.
(b) There were no changes in the Registrant’s internal control over financial reporting during the Registrant’s fourth fiscal quarter of the period covered by this report that have materially affected, or are reasonably likely to affect, the internal control over financial reporting.
| | |
| |
(a)(1) | | Any Code of Ethics or amendments hereto. Filed herewith. |
| |
(a)(2) | | Certifications pursuant to Rule 30a-2(a) under the Investment Company Act of 1940 - Filed herewith. |
| |
(a)(3) | | Not applicable. |
| |
(b) | | Certifications pursuant to Rule 30a-2(b) under the Investment Company Act of 1940 - Filed herewith. |
SIGNATURES
Pursuant to the requirements of the Securities Exchange Act of 1934 and the Investment Company Act of 1940, the registrant has duly caused this report to be signed on its behalf by the undersigned, thereunto duly authorized.
| | |
| MANAGERS TRUST I |
| |
| By: | | /s/ John H. Streur |
| | John H. Streur, President |
| |
| Date: | | January 6, 2008 |
Pursuant to the requirements of the Securities Exchange Act of 1934 and the Investment Company Act of 1940, this report has been signed below by the following persons on behalf of the registrant and in the capacities and on the dates indicated.
| | |
| By: | | /s/ John H. Streur |
| | John H. Streur, President |
| |
| Date: | | January 6, 2008 |
| | |
| By: | | /s/ Donald S. Rumery |
| | Donald S. Rumery, Chief Financial Officer |
| |
| Date: | | January 6, 2008 |