UNITED STATES
SECURITIES AND EXCHANGE COMMISSION
Washington, D.C. 20549
FORM N-CSR
CERTIFIED SHAREHOLDER REPORT OF
REGISTERED MANAGEMENT INVESTMENT COMPANIES
Investment Company Act file number: 811-06520
MANAGERS TRUST I
(Exact name of registrant as specified in charter)
800 Connecticut Avenue, Norwalk, Connecticut 06854
(Address of principal executive offices) (Zip code)
Managers Investment Group LLC
800 Connecticut Avenue, Norwalk, Connecticut 06854
(Name and address of agent for service)
Registrant’s telephone number, including area code: (203) 299-3500
| | |
Date of fiscal year end: | | OCTOBER 31 |
| |
Date of reporting period: | | NOVEMBER 1, 2005 – OCTOBER 31, 2006 |
| | (Annual Shareholder Report) |
| Item 1. | Reports to Shareholders |
ANNUAL REPORT
Managers AMG
October 31, 2006
FQ Tax-Managed U.S. Equity Fund
FQ U.S. Equity Fund
FQ Global Alternatives Fund

Managers AMG FQ Funds
FQ Tax-Managed U.S. Equity, FQ U.S. Equity, FQ Global Alternatives
Annual Report—October 31, 2006
TABLE OF CONTENTS
| | |
| | | Page |
LETTER TO SHAREHOLDERS | | 1 |
| |
ABOUT YOUR FUND’S EXPENSES | | 2 |
| |
INVESTMENT MANAGER’S COMMENTS, FUND SNAPSHOTS, AND SCHEDULES OF PORTFOLIO INVESTMENTS | | |
| |
FQ Tax-Managed U.S. Equity Fund | | 3 |
| |
FQ U.S. Equity Fund | | 8 |
| |
FQ Global Alternatives Fund | | 13 |
| |
FINANCIAL STATEMENTS: | | |
| |
Statements of Assets and Liabilities | | 15 |
| |
FQ Tax-Managed U.S. Equity and FQ U.S. Equity | | |
| |
Funds’ balance sheet, net asset value (NAV) per share computation and cumulative undistributed amount | | |
| |
Statement of Net Assets | | 16 |
| |
FQ Global Alternatives | | |
| |
Portfolio of Investments, Fund balance sheet, net asset value (NAV) per share computation and cumulative undistributed amount | | |
| |
Statements of Operations | | 17 |
| |
Detail of sources of income, Fund expenses, and realized and unrealized gains (losses) during the fiscal year | | |
| |
Statements of Changes in Net Assets | | 18 |
| |
Detail of changes in Fund assets for the past two fiscal periods | | |
| |
FINANCIAL HIGHLIGHTS | | 19 |
| |
Historical net asset values per share, distributions, total returns, expense ratios, turnover ratios and net assets | | |
| |
NOTES TO FINANCIAL STATEMENTS | | 22 |
| |
Accounting and distribution policies, details of agreements and transactions with Fund management and affiliates, and descriptions of certain investment risks | | |
| |
REPORT OF INDEPENDENT REGISTERED PUBLIC ACCOUNTING FIRM | | 29 |
| |
TRUSTEES AND OFFICERS | | 30 |
| |
ANNUAL RENEWAL OF INVESTMENT ADVISORY AGREEMENTS | | 31 |
Nothing contained herein is to be considered an offer, sale or solicitation of an offer to buy shares of The Managers Funds or Managers AMG Funds. Such offering is made only by Prospectus, which includes details as to offering price and other material information.
Letter to Shareholders
Dear Fellow Shareholder:
The year 2006 has been volatile but rewarding for investors. Markets confronted new Federal Reserve leadership and accompanying communication style, commodity price increases, the end (at least for now) of interest rate hikes, and then a sharp decline in oil prices and a dramatic slowdown in the real estate market. Times like these challenge investors to remove emotion from decisions and remain disciplined with their long-term investment plans.
Regardless of market conditions, we at Managers maintain our focus on providing excellent, trusted, and rigorously monitored investment solutions across all major market segments and styles. We encourage our portfolio managers to take a long-term view and to invest accordingly. We strive to stay on track even when market volatility causes some investors concern.
Regardless of market conditions, we at Managers maintain our focus on providing excellent, trusted, and rigorously monitored investment solutions across all major market segments and styles.
Our overriding goal is to hire fund managers that can effectively manage assets in all types of market conditions. Toward this goal we maintain a team of skilled investment professionals focused solely on understanding the global capital markets and overseeing the managers in our Funds. We hire fund portfolio managers who excel over time, have a strong investment discipline, and stick to that discipline.
Our investment team oversees the Funds’ managers and portfolios every day so you don’t have to. Once you have selected Managers Funds as part of your asset allocation, you can be assured that we are monitoring that investment every day to help ensure it is delivering on its investment mandate.
As 2006 comes to a close, we begin to think about next year and beyond. The two things we believe will impact investment returns the most are the condition of the economy and the change to the political landscape this fall’s election brings. Obviously, these are only the headlines and there are many subtleties relating to each.
First, with regard to the health of the economy, the risk appears to be the leverage consumers have assumed through their exposure to the residential real estate market. The “house as cash machine” combined with the speculative investment in real estate has increased the economy’s exposure to any weakness in prices or excess supply of real estate. Both these factors seem to be in play. Aside from this risk, consumers and businesses seem to be in good financial shape with relatively healthy balance sheets.
Second, with regard to the changes in Washington D.C., much has and will be written regarding mid-term power shifts, the third year of a President’s term, tax policy and its relationship to growth, and the war in Iraq. Suffice it to say that there are many interesting challenges facing the financial markets, and managing an investment portfolio requires diligence, attention, and resources.
Each of us at Managers appreciates the trust you express in us by allowing us the privilege of investing some of your capital. We will do everything we can to continue to deserve your trust in the months and years ahead.
| | | | |
| Respectfully, | | | | |
| | |
 | | | |  |
| Peter M. Lebovitz | | | | Thomas G. Hoffman, CFA |
| President | | | | Executive Vice President |
| Managers Funds | | | | Chief Investment Officer |
| | | | Managers Investment Group LLC |
1
About Your Fund’s Expenses
As a shareholder of a Fund, you may incur two types of costs: (1) transaction costs, which may include sales charges (loads) on purchase payments; redemption fees; and exchange fees; and (2) ongoing costs, including management fees; distribution (12b-1) fees; and other Fund expenses. This example is intended to help you understand your ongoing costs (in dollars) of investing in the Fund and to compare these costs with the ongoing costs of investing in other mutual funds. The example is based on an investment of $1,000 invested at the beginning of the period and held for the entire period as indicated below.
Actual Expenses
The first line of the table below provides information about the actual account values and actual expenses. You may use the information in this line, together with the amount you invested, to estimate the expenses that you paid over the period. Simply divide your account value by $1,000 (for example, an $8,600 account value divided by $1,000 = 8.6), then multiply the result by the number in the first line under the heading entitled “Expenses Paid During Period” to estimate the expenses you paid on your account during this period.
Hypothetical Example for Comparison Purposes
The second line of the table below provides information about hypothetical account values and hypothetical expenses based on the Fund’s actual expense ratio and an assumed annual rate of return of 5% before expenses, which is not the Fund’s actual return. The hypothetical account values and expenses may not be used to estimate the actual ending account balance or expenses you paid for the period. You may use this information to compare the ongoing costs of investing in the Fund and other funds by comparing this 5% hypothetical example with the 5% hypothetical examples that appear in the shareholder reports of other funds.
Please note that the expenses shown in the table are meant to highlight your ongoing costs only and do not reflect any transactional costs, such as sales charges (loads), redemption fees, or exchange fees. Therefore, the second line of the table is useful in comparing ongoing costs only, and will not help you determine the relative total costs of owning different funds.
| | | | | | | | | |
Six Months Ended October 31, 2006 | | Beginning
Account Value
5/1/2006 | | Ending
Account Value
10/31/2006 | | Expenses
Paid During
the Period* |
FQ Tax-Managed U.S. Equity Fund | | | | | | | | | |
Class A Shares 1 | | | | | | | | | |
Projected | | $ | 1,000 | | $ | 1,052 | | $ | 6.41 |
Hypothetical (5% return before expenses) | | $ | 1,000 | | $ | 1,019 | | $ | 6.31 |
Class C Shares 1 | | | | | | | | | |
Projected | | $ | 1,000 | | $ | 1,049 | | $ | 10.28 |
Hypothetical (5% return before expenses) | | $ | 1,000 | | $ | 1,015 | | $ | 10.11 |
Institutional Class Shares | | | | | | | | | |
Actual | | $ | 1,000 | | $ | 1,054 | | $ | 5.12 |
Hypothetical (5% return before expenses) | | $ | 1,000 | | $ | 1,020 | | $ | 5.04 |
FQ U.S. Equity Fund | | | | | | | | | |
Class A Shares 1 | | | | | | | | | |
Projected | | $ | 1,000 | | $ | 1,071 | | $ | 5.43 |
Hypothetical (5% return before expenses) | | $ | 1,000 | | $ | 1,020 | | $ | 5.30 |
Class C Shares 1 | | | | | | | | | |
Projected | | $ | 1,000 | | $ | 1,069 | | $ | 9.34 |
Hypothetical (5% return before expenses) | | $ | 1,000 | | $ | 1,016 | | $ | 9.10 |
Institutional Class Shares | | | | | | | | | |
Actual | | $ | 1,000 | | $ | 1,071 | | $ | 4.12 |
Hypothetical (5% return before expenses) | | $ | 1,000 | | $ | 1,021 | | $ | 4.02 |
FQ Global Alternatives Fund 2 | | | | | | | | | |
Class A Shares 2 | | | | | | | | | |
Projected | | $ | 1,000 | | $ | 970 | | $ | 12.41 |
Hypothetical (5% return before expenses) | | $ | 1,000 | | $ | 1,013 | | $ | 12.68 |
Class C Shares 2 | | | | | | | | | |
Projected | | $ | 1,000 | | $ | 967 | | $ | 16.11 |
Hypothetical (5% return before expenses) | | $ | 1,000 | | $ | 1,009 | | $ | 16.46 |
| * | Expenses are equal to the Fund’s annualized expense ratio multiplied by the average account value over the period, multiplied by the number of days in the most recent fiscal half-year (184), then divided by 365. |
| 1 | Class A and Class C shares commenced operations on March 1, 2006. The amounts listed are based on the operating history of the Institutional Class shares during the past six months plus, Class A and Class C shares Rule 12b-1 fees of 0.25% and 1.00%, respectively. |
| 2 | Class A and Class C shares commenced operations on March 30, 2006. The amounts listed are based on the projected expenses for six months plus, Class A and Class C shares Rule 12b-1 fees of 0.25% and 1.00%, respectively. |
2
FQ Tax-Managed U.S. Equity Fund
Portfolio Manager’s Comments
The fiscal year ending October 31, 2006 was a very solid year. The Institutional Class Shares of the Fund returned 17.37% on a pre-tax basis, while the benchmark Russell 3000 Index returned 16.37%. Please refer to the table on page 4 for returns for various classes of shares and for after-tax returns. It was a very good fiscal year for the market, with most of the gain occurring in the early part of the fiscal year (November through January) and in the last several months of the fiscal year.
It was a market environment characterized by strong corporate profit growth, solid corporate productivity with corporate efficiency that remained at record highs. The market during the past year had valuations trading very close to historic norms – interestingly as corporate profit growth has expanded, multiples have actually stayed constant. Stock prices have more or less been keeping pace with profit growth. Investors are not paying more for that growth.
We have modestly outperformed the market over this time period, following an excellent year last year where we outperformed the market by 10%. The modest outperformance was driven primarily by stock selection. The portfolio positioning did not work quite as well this past fiscal year, as we were slow to move from a smaller-cap orientation to a larger-cap orientation, although we have reduced considerably our smaller-cap tilt as interest rates have increased and economic growth has slowed. The biggest contributors based on stock selection have generally been Financial Services firms - Goldman Sachs (up 51% over the fiscal year), Bear Stearns (44%), Fannie Mae (27%), WR Berkeley (28%). Other very strong contributors have been JC Penney (up 48%) and above all Phelps Dodge (up 84%) on the explosion in commodity prices.
Stock selection did not work out as well in the Energy sector, which we were overweight last year and has struggled in the latter part of this year. The good news is we moved to an underweight stance mid-2006. Dell Computer and United Health Group have also struggled, the former on earnings issues, the latter on options backdating issues. We have taken our profits in United Health, and have reduced our position in Dell to benchmark weight.
On the tax management side we continue to operate with a tax loss carryforward, and will not be delivering a capital gain distribution to our fellow shareholders. In fact we have never delivered a capital gain distribution over the entire history of the Fund, while significantly outperforming the market.
We remain cautiously optimistic looking forward to the next year. Corporate earnings growth continues to impress. Although economic growth is slowing, short-term interest rates have increased, and the housing market mania has cooled, we continue to believe we will see a soft landing for the economy, and continue to believe that U.S. equities offer a compelling risk premium.
Cumulative Total Return Performance
Managers AMG FQ Tax-Managed U.S. Equity Fund’s cumulative total return is based on the daily change in net asset value (NAV), and assumes that all distributions were reinvested. The Russell 3000 Index is composed of the 3000 largest U.S. companies as measured by market capitalization, and represents about 98% of the U.S. stock market. Unlike the Fund, the Russell 3000 Index is unmanaged, is not available for investment, and does not incur expenses. The chart illustrates the performance of a hypothetical
(continued on next page)
3
FQ Tax-Managed U.S. Equity Fund
Portfolio Manager’s Comments (continued)
$10,000 investment made in the Institutional Class Shares of the Fund on December 18, 2000 (commencement of operations) to a $10,000 investment made in the Russell 3000 Index for the same time periods. Performance for periods longer than one year is annualized. Figures include reinvestment of capital gains and dividends. The listed returns for the Fund are net of expenses and the returns for the indices exclude expenses. Total returns for the Fund would have been lower had certain expenses not been reduced.
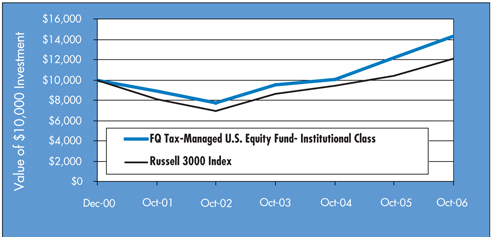
The table below shows the average annualized total returns for the Managers AMG FQ Tax-Managed U.S. Equity Fund and the Russell 3000 Index since inception through October 31, 2006.
| | | | | | | | | | | |
Average Annual Total Returns | | One Year | | | Five Years | | | Since
Inception | | | Inception
Date |
Managers AMG FQ Tax- Managed U.S. Equity Fund | | | | | | | | | | | |
No Load Before Tax: | | | | | | | | | | | |
Institutional Class | | 17.37 | % | | 9.88 | % | | 6.25 | % | | 12/18/00 |
Class A* | | | | | | | | 6.92 | % | | 3/1/06 |
Class C* | | | | | | | | 6.30 | % | | 3/1/06 |
Russell 3000 Index | | 16.37 | % | | 8.35 | % | | | | | |
No Load After Tax on Distributions | | | | | | | | | | | |
Institutional Class | | 17.30 | % | | 9.69 | % | | 6.09 | % | | 12/18/00 |
Class A* | | | | | | | | 6.92 | % | | 3/1/06 |
Class C* | | | | | | | | 6.30 | % | | 3/1/06 |
No Load After Tax on Distributions & sale of shares | | | | | | | | | | | |
Institutional Class | | 11.29 | % | | 8.48 | % | | 5.31 | % | | 12/18/00 |
Class A* | | | | | | | | 4.50 | % | | 3/1/06 |
Class C* | | | | | | | | 4.10 | % | | 3/1/06 |
With Load Before Tax: | | | | | | | | | | | |
Class A* | | | | | | | | 0.80 | % | | 3/1/06 |
Class C* | | | | | | | | 5.30 | % | | 3/1/06 |
With Load After Tax on Distributions | | | | | | | | | | | |
Class A* | | | | | | | | 0.80 | % | | 3/1/06 |
Class C* | | | | | | | | 5.30 | % | | 3/1/06 |
With Load After Tax on Distributions & sale of shares | | | | | | | | | | | |
Class A* | | | | | | | | 0.52 | % | | 3/1/06 |
Class C* | | | | | | | | 3.45 | % | | 3/1/06 |
| * | Class A and Class C shares commenced operations on March 1, 2006. |
4
FQ Tax-Managed U.S. Equity Fund
Fund Snapshots
October 31, 2006
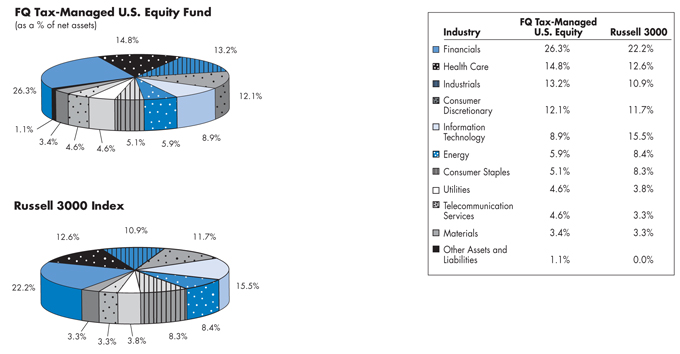
Portfolio Breakdown
Top Ten Holdings
| | | |
Security Name | | Percentage
of Net Assets | |
Goldman Sachs Group, Inc.* | | 3.9 | % |
Amgen, Inc.* | | 3.5 | |
FedEx Corp. | | 3.5 | |
J.C. Penney Co., Inc.* | | 3.4 | |
Fannie Mae Co.* | | 3.4 | |
Target Corp. | | 3.3 | |
Phelps Dodge Corp. | | 3.1 | |
Bear, Stearns Co. Inc.* | | 3.1 | |
Kroger Co. | | 3.0 | |
Aetna, Inc.* | | 2.9 | |
| | | |
Top Ten as a Group | | 33.1 | % |
| | | |
| * | Top Ten Holding at April 30, 2006 |
Any sectors, industries, or securities discussed should not be perceived as investment recommendations. Mention of a specific security should not be considered a recommendation to buy or solicitation to sell that security.
5
FQ Tax-Managed U.S. Equity Fund
Schedule of Portfolio Investments
October 31, 2006
| | | | | | |
| | | Shares | | | Value |
Common Stocks - 98.9% | | | | | | |
Consumer Discretionary - 12.1% | | | | | | |
J.C. Penney Co., Inc. | | 38,600 | | | $ | 2,903,878 |
Pantry, Inc., The* | | 11,000 | 2 | | | 600,380 |
Service Corp. International | | 38,000 | | | | 346,560 |
Shaw Communications, Inc. | | 61,300 | | | | 2,010,027 |
Starbucks Corp.* | | 12,000 | 2 | | | 453,000 |
Target Corp. | | 47,200 | | | | 2,793,296 |
Walt Disney Co., The | | 35,000 | | | | 1,101,100 |
Total Consumer Discretionary | | | | | | 10,208,241 |
Consumer Staples - 5.1% | | | | | | |
Energizer Holdings, Inc.* | | 12,600 | | | | 984,690 |
Kroger Co. | | 112,800 | | | | 2,536,872 |
Smithfield Foods, Inc.* | | 29,000 | 2 | | | 779,520 |
Total Consumer Staples | | | | | | 4,301,082 |
Energy - 5.9% | | | | | | |
ConocoPhillips Co. | | 39,600 | | | | 2,385,504 |
Occidental Petroleum Corp. | | 3,200 | 2 | | | 150,208 |
Tesoro Corp. | | 33,300 | 2 | | | 2,129,202 |
Valero Energy Corp. | | 6,200 | | | | 324,446 |
Total Energy | | | | | | 4,989,360 |
Financials - 26.3% | | | | | | |
Bank of America Corp. | | 5,000 | | | | 269,350 |
Bear, Stearns & Co., Inc. | | 17,000 | | | | 2,572,950 |
Capital One Financial Corp. | | 14,400 | | | | 1,142,352 |
Centennial Bank Holdings, Inc.* | | 10,400 | | | | 99,840 |
Chubb Corp. | | 1,600 | | | | 85,040 |
CIT Group, Inc. | | 7,200 | | | | 374,760 |
Fannie Mae Co. | | 48,200 | | | | 2,856,332 |
Fidelity National Title Group. Inc. | | 82,800 | 2 | | | 1,822,428 |
Goldman Sachs Group, Inc. | | 17,400 | | | | 3,302,346 |
Hartford Financial Services Group, Inc. | | 2,400 | | | | 209,208 |
Lehman Brothers Holdings, Inc. | | 25,600 | | | | 1,992,704 |
Loews Corp. | | 4,000 | | | | 155,680 |
MGIC Investment Corp. | | 8,800 | | | | 517,088 |
National City Corp. | | 14,074 | 2 | | | 524,257 |
PMI Group, Inc. | | 6,400 | 2 | | | 272,960 |
Popular, Inc. | | 35,800 | 2 | | | 651,202 |
R&G Financial Corp., Class B | | 18,200 | | | | 140,140 |
Radian Group, Inc. | | 34,200 | | | | 1,822,860 |
Safeco Corp. | | 18,000 | | | | 1,047,420 |
Sovereign Bancorp, Inc. | | 80,430 | | | | 1,919,060 |
Wachovia Corp. | | 7,894 | | | | 438,117 |
Total Financials | | | | | | 22,216,094 |
Health Care - 14.8% | | | | | | |
Aetna, Inc. | | 59,800 | | | | 2,464,956 |
Amgen, Inc.* | | 39,000 | | | | 2,960,490 |
Biogen Idec, Inc.* | | 26,000 | 2 | | | 1,237,600 |
Charles River Laboratories | | | | | | |
International, Inc.* | | 13,000 | 2 | | | 557,960 |
CIGNA Corp. | | 2,800 | | | | 327,544 |
Forest Laboratories, Inc.* | | 9,200 | 2 | | | 450,248 |
King Pharmaceuticals, Inc.* | | 19,600 | 2 | | | 327,908 |
Magellan Health Services, Inc.* | | 2,600 | 2 | | | 113,464 |
Mylan Laboratories, Inc. | | 103,000 | | | | 2,111,500 |
Pfizer, Inc. | | 8,800 | | | | 234,520 |
SurModics, Inc.* | | 1,800 | | | | 62,820 |
WellPoint, Inc.* | | 21,200 | | | | 1,617,984 |
Total Health Care | | | | | | 12,466,994 |
Industrials - 13.2% | | | | | | |
Cummins, Inc. | | 4,600 | | | | 584,108 |
Eaton Corp. | | 7,000 | | | | 507,010 |
FedEx Corp. | | 25,500 | | | | 2,920,770 |
Northrop Grumman Corp. | | 27,400 | | | | 1,819,086 |
Parker Hannifin Corp. | | 18,000 | | | | 1,505,340 |
Raytheon Co. | | 28,000 | | | | 1,398,600 |
Reliance Steel & Aluminum Co. | | 40,800 | 2 | | | 1,401,480 |
Waste Connections, Inc.* | | 24,800 | | | | 1,009,112 |
Total Industrials | | | | | | 11,145,506 |
Information Technology - 8.9% | | | | | | |
Arrow Electronics, Inc.* | | 17,800 | | | | 531,330 |
Dell, Inc.* | | 22,000 | | | | 535,260 |
Google, Inc.* | | 4,800 | 2 | | | 2,286,672 |
International Business Machines Corp. | | 10,200 | | | | 941,766 |
Microsoft Corp. | | 43,400 | | | | 1,246,014 |
Motorola, Inc. | | 37,400 | | | | 862,444 |
NCR Corp.* | | 23,600 | | | | 979,872 |
Oracle Corp.* | | 8,200 | | | | 151,454 |
Total Information Technology | | | | | | 7,534,812 |
Materials - 3.4% | | | | | | |
Abitibi-Consolidated, Inc. | | 100,000 | 2 | | | 249,000 |
Phelps Dodge Corp. | | 25,800 | | | | 2,589,804 |
Total Materials | | | | | | 2,838,804 |
Telecommunication Services - 4.6% | | | | | | |
Centurytel, Inc. | | 47,400 | 2 | | | 1,907,376 |
Qwest Communications International, Inc.* | | 232,200 | 2 | | | 2,003,886 |
Total Telecommunication Services | | | | | | 3,911,262 |
The accompanying notes are an integral part of these financial statements.
6
FQ Tax-Managed U.S. Equity Fund
Schedule of Portfolio Investments (continued)
| | | | | | |
| | | Shares | | Value | |
Utilities - 4.6% | | | | | | |
Energen Corp. | | 35,600 | | $ | 1,524,392 | |
Mirant Corp.* | | 81,200 | | | 2,401,084 | |
Total Utilities | | | | | 3,925,476 | |
Total Common Stocks
(cost $ 70,315,114) | | | | | 83,537,631 | |
Other Investment Companies - 17.1%1 | | | | | | |
Bank of New York Institutional Cash Reserves Fund, 5.39%3 | | 13,470,989 | | | 13,470,989 | |
JPMorgan Prime Money Market Fund, Institutional Class Shares, 5.18% | | 996,144 | | | 996,144 | |
Total Other Investment Companies
(cost $ 14,467,133) | | | | | 14,467,133 | |
Total Investments - 116.0%
(cost $ 84,782,247) | | | | | 98,004,764 | |
Other Assets, less Liabilities - (16.0)% | | | | | (13,514,686 | ) |
Net Assets - 100.0% | | | | $ | 84,490,078 | |
Note: Based on the cost of investments of $84,790,146 for Federal income tax purposes at October 31, 2006, the aggregate gross unrealized appreciation and depreciation were $13,518,301 and $303,684, respectively, resulting in net unrealized appreciation of investments of $13,214,617.
| * | Non-income-producing securities. |
| 1 | Yield shown for an investment company represents the October 31, 2006, seven-day average yield, which refers to the sum of the previous seven days’ dividends paid, expressed as an annual percentage. |
| 2 | Some or all of these shares, amounting to a market value of $13,064,770, or 15.5% of net assets, were out on loan to various brokers. |
| 3 | Collateral received from brokers for securities lending was invested in this short-term investment. |
The accompanying notes are an integral part of these financial statements.
7
FQ U.S. Equity Fund
Portfolio Manager’s Comments
The fiscal year ending October 31, 2006 was a very good year. The Institutional Class shares of the Fund returned 21.44% while the benchmark Russell 3000 Index returned 16.37%. Please refer to the table on page 9 for returns for various classes of shares. It was a very good twelve months for the market, with most of the gain occurring in the early part of the fiscal year (November through January) and in the last several months of the fiscal year. It was our second full fiscal year that we have been managing the Fund, and we are gratified to deliver such a strong performance, more than 5% over the market, after the Fund outperformed by 2% last fiscal year.
It was a market environment characterized by strong corporate profit growth, solid corporate productivity with corporate efficiency that remained at record highs. The market during the past year had valuations trading very close to historic norms – interestingly as corporate profit growth has expanded, multiples have actually stayed constant. Stock prices have more or less been keeping pace with profit growth. Investors are not paying more for that growth.
The primary contributor to the outperformance was stock selection again. Our style tilts were generally neutral - stronger value orientation worked, but the smaller size orientation did not in general. Currently we have moved to neutral on size, and have reduced our value orientation as well, in response to slowing economic growth and rising inflation and interest rates. Several industry overweights worked very well - brokerage houses had an outstanding year, with Goldman Sachs up 51%, Bear Stearns up 44%, and Lehman Brothers up 31%. Telephone stocks did very well, an overweight we introduced early in 2005. Qwest Communications was up 98%, and Verizon and CenturyTel up 24%. Our focus on natural resource stocks was perhaps the single largest contributor after brokerage houses, with Phelps Dodge up 84% and with Nucor (a steel company) more than doubling in price. The final strong performer was JC Penney, in a sector we have generally avoided due to the slowing economy and housing market and rising interest rates. JC Penney dominated its peer group, at least from a stock market perspective, by gaining 48% for the fiscal year.
We remain cautiously optimistic looking forward to the next year. Corporate earnings growth continues to impress. Although economic growth is slowing, short-term interest rates have increased, and the housing market mania has cooled, we continue to believe we will see a soft landing for the economy, and continue to believe that U.S. equities offer a compelling risk premium.
(continued on next page)
8
FQ U.S. Equity Fund
Portfolio Manager’s Comments (continued)
Cumulative Total Return Performance
Managers AMG FQ U.S. Equity Fund’s cumulative total return is based on the daily change in net asset value (NAV), and assumes that all distributions were reinvested. The Russell 3000 Index is composed of the 3,000 largest U.S. companies as measured by market capitalization, and represent about 98% of the U.S. stock market. Unlike the Fund, the Russell 3000 Index is unmanaged, is not available for investment, and does not incur expenses. The chart illustrates the performance of a hypothetical $10,000 investment made in the Institutional Class shares of the Fund on October 31, 1996 to a $10,000 investment made in the Russell 3000 Index for the same time period. Performance for periods longer than one year is annualized. Figures include reinvestment of capital gains and dividends. The listed returns for the Fund are net of expenses and the returns for the index exclude expenses. The graph and table do not reflect the deduction of taxes that a shareholder would pay on a Fund distribution or redemption of shares. Total returns for the Fund would have been lower had certain expenses not been reduced.
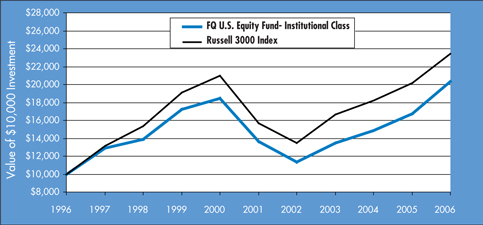
The table below shows the average annualized total returns for the Managers AMG FQ U.S. Equity Fund and the Russell 3000 Index since inception through October 31, 2006.
| | | | | | | | | | | | | | |
Average Annual Total Returns | | One Year | | | Five Years | | | Ten Years | | | Since
Inception | | | Inception
Date |
Managers AMG FQ U.S. Equity Fund | | | | | | | | | | | | | | |
No Load: | | | | | | | | | | | | | | |
Institutional Class | | 21.44 | % | | 8.32 | % | | 7.37 | % | | 9.70 | % | | 8/14/92 |
Class A* | | | | | | | | | | | 9.98 | % | | 3/1/06 |
Class C* | | | | | | | | | | | 9.76 | % | | 3/1/06 |
Russell 3000 Index | | 16.37 | % | | 8.35 | % | | 8.89 | % | | | | | |
With Load: | | | | | | | | | | | | | | |
Class A* | | | | | | | | | | | 3.62 | % | | 3/1/06 |
Class C* | | | | | | | | | | | 8.76 | % | | 3/1/06 |
| * | Class A and Class C shares commenced operations on March 1, 2006. |
9
FQ U.S. Equity Fund
Fund Snapshots
October 31, 2006
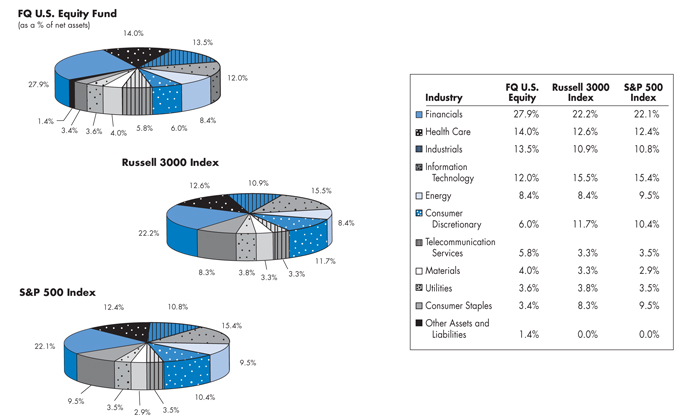
Portfolio Breakdown
Top Ten Holdings
| | | |
Security Name | | Percentage
of Net Assets | |
Bank of America Corp.* | | 4.6 | % |
Citigroup, Inc.* | | 4.5 | |
Goldman Sachs Group, Inc.* | | 4.1 | |
Amgen, Inc.* | | 3.7 | |
Verizon Communications, Inc.* | | 3.4 | |
Kroger Co. | | 3.0 | |
Applied Materials, Inc. | | 2.9 | |
J.C. Penney Co., Inc.* | | 2.9 | |
Raytheon Co.* | | 2.7 | |
Masco Corp.* | | 2.6 | |
| | | |
Top Ten as a Group | | 34.4 | % |
| | | |
| * | Top Ten Holding at April 30, 2006 |
Any sectors, industries, or securities discussed should not be perceived as investment recommendations. Mention of a specific security should not be considered a recommendation to buy or solicitation to sell that security.
10
FQ U.S. Equity Fund
Schedule of Portfolio Investments
October 31, 2006
| | | | | |
| | | Shares | | Value |
Common Stocks - 98.7% | | | | | |
Consumer Discretionary - 6.0% | | | | | |
American Eagle Outfitters, Inc. | | 19,800 | | $ | 906,840 |
J.C. Penney Co., Inc. | | 29,800 | | | 2,241,854 |
Lowe’s Co., Inc. | | 5,4002 | | | 162,756 |
Marriott International, Inc. | | 9,8002 | | | 409,346 |
NTL, Inc. | | 2,6002 | | | 70,278 |
Pantry, Inc., The* | | 7,8002 | | | 425,724 |
Starbucks Corp.* | | 3,6002 | | | 135,900 |
Target Corp. | | 5,800 | | | 343,244 |
Total Consumer Discretionary | | | | | 4,695,942 |
Consumer Staples - 3.4% | | | | | |
Del Monte Foods Co. | | 11,6002 | | | 125,164 |
Kroger Co. | | 103,400 | | | 2,325,466 |
Parlux Fragrances, Inc.* | | 17,000 | | | 117,810 |
Pilgrim’s Pride Corp., Class B | | 5,2002 | | | 129,896 |
Total Consumer Staples | | | | | 2,698,336 |
Energy - 8.4% | | | | | |
Anadarko Petroleum Corp. | | 3,800 | | | 176,396 |
ChevronTexaco Corp. | | 20,400 | | | 1,370,880 |
ConocoPhillips Co. | | 27,000 | | | 1,626,480 |
Dynegy, Inc., Class A* | | 85,600 | | | 520,448 |
Devon Energy Corp. | | 6,400 | | | 427,776 |
Helmerich & Payne, Inc. | | 11,400 | | | 273,030 |
Hess Corp. | | 2,2002 | | | 93,280 |
Marathon Oil Corp. | | 800 | | | 69,120 |
Patterson-UTI Energy, Inc. | | 3,4002 | | | 78,880 |
Pride International, Inc.* | | 5,8002 | | | 160,138 |
Tesoro Corp. | | 22,4002 | | | 1,432,256 |
Valero Energy Corp. | | 7,400 | | | 387,242 |
Total Energy | | | | | 6,615,926 |
Financials - 27.9% | | | | | |
American Home Mortgage Investment Corp. | | 15,2002 | | | 519,384 |
Bank of America Corp. | | 67,600 | | | 3,641,612 |
Bear, Stearns & Co., Inc. | | 8,8002 | | | 1,331,880 |
Capital One Financial Corp. | | 2,800 | | | 222,124 |
Central Pacific Financial Corp. | | 2,600 | | | 95,654 |
Chubb Corp. | | 15,000 | | | 797,250 |
Citigroup, Inc. | | 70,800 | | | 3,551,328 |
Corus Bankshares, Inc. | | 17,8002 | | | 365,434 |
Fannie Mae Co. | | 10,600 | | | 628,156 |
Goldman Sachs Group, Inc. | | 17,000 | | | 3,226,430 |
Hartford Financial Services Group, Inc. | | 6,200 | | | 540,454 |
JPMorgan Chase & Co. | | 27,800 | | | 1,318,832 |
Lehman Brothers Holdings, Inc. | | 10,400 | | | 809,536 |
MGIC Investment Corp. | | 1,400 | | | 82,264 |
National City Corp. | | 13,000 | | | 484,250 |
PMI Group, Inc. | | 20,8002 | | | 887,120 |
Radian Group, Inc. | | 16,000 | | | 852,800 |
Safeco Corp. | | 17,800 | | | 1,035,782 |
Sovereign Bancorp, Inc. | | 25,410 | | | 606,282 |
Thornburg Mortgage, Inc. | | 6,200 | | | 159,216 |
W Holding Co., Inc. | | 7,800 | | | 44,382 |
Washington Mutual, Inc. | | 17,400 | | | 736,020 |
Total Financials | | | | | 21,936,190 |
Health Care - 14.0% | | | | | |
Aetna, Inc. | | 18,400 | | | 758,448 |
Amgen, Inc.* | | 38,4002 | | | 2,914,944 |
Applera Corp. - Applied Biosystems Group | | 2,800 | | | 104,440 |
Biogen Idec, Inc.* | | 8,2002 | | | 390,320 |
CIGNA Corp. | | 1,600 | | | 187,168 |
Forest Laboratories, Inc.* | | 12,600 | | | 616,644 |
IMS Health, Inc. | | 7,400 | | | 206,090 |
Isis Pharmaceuticals, Inc.* | | 17,400 | | | 149,292 |
Kinetic Concepts, Inc.* | | 8,400 | | | 291,984 |
King Pharmaceuticals, Inc.* | | 32,400 | | | 542,052 |
Magellan Health Services, Inc.* | | 11,4002 | | | 497,496 |
Merck & Co., Inc. | | 24,400 | | | 1,108,248 |
Mylan Laboratories, Inc. | | 50,8002 | | | 1,041,400 |
Pfizer, Inc. | | 55,000 | | | 1,465,750 |
Sierra Health Services, Inc.* | | 16,2002 | | | 554,688 |
Tenet Healthcare Corp.* | | 25,8002 | | | 182,148 |
Total Health Care | | | | | 11,011,112 |
Industrials - 13.5% | | | | | |
Cummins, Inc. | | 6,600 | | | 838,068 |
Eaton Corp. | | 12,200 | | | 883,646 |
Lennox International, Inc. | | 22,400 | | | 603,904 |
Masco Corp. | | 72,6002 | | | 2,007,390 |
Northrop Grumman Corp. | | 29,600 | | | 1,965,144 |
PACCAR, Inc. | | 6,900 | | | 408,549 |
Parker Hannifin Corp. | | 16,200 | | | 1,354,806 |
Pitney Bowes, Inc. | | 3,400 | | | 158,814 |
Raytheon Co. | | 42,000 | | | 2,097,900 |
Reliance Steel & Aluminum Co. | | 7,600 | | | 261,060 |
Ryder System, Inc. | | 1,100 | | | 57,915 |
Total Industrials | | | | | 10,637,196 |
The accompanying notes are an integral part of these financial statements.
11
FQ U.S. Equity Fund
Schedule of Portfolio Investments (continued)
| | | | | | |
| | | Shares | | Value | |
Information Technology - 12.0% | | | | | | |
Applied Materials, Inc. | | 131,800 | | $ | 2,292,002 | |
Arrow Electronics, Inc.* | | 24,000 | | | 716,400 | |
Avaya, Inc.* | | 11,6002 | | | 148,596 | |
Cisco Systems, Inc.* | | 18,200 | | | 439,166 | |
Credence Systems Corp* | | 16,000 | | | 51,520 | |
Exar Corp.* | | 6,600 | | | 85,602 | |
Global Payments, Inc. | | 4,6002 | | | 201,066 | |
Google, Inc.* | | 3,4002 | | | 1,619,726 | |
IKON Office Solutions, Inc. | | 8,000 | | | 119,280 | |
Imation Corp. | | 2,400 | | | 109,848 | |
Ingram Micro, Inc., Class A* | | 20,200 | | | 416,322 | |
Intergraph Corp.* | | 11,600 | | | 506,804 | |
International Business Machines Corp. | | 11,000 | | | 1,015,630 | |
Motorola, Inc. | | 16,500 | | | 380,490 | |
NCR Corp. | | 5,4002 | | | 224,208 | |
Oracle Corp.* | | 24,600 | | | 454,362 | |
Paychex, Inc. | | 8,200 | | | 323,736 | |
Sabre Holdings Corp. | | 11,600 | | | 294,872 | |
Total Information Technology | | | | | 9,399,630 | |
Materials - 4.0% | | | | | | |
Eastman Chemical Co. | | 8002 | | | 48,736 | |
Louisana-Pacific Corp. | | 10,400 | | | 205,712 | |
Lyondell Chemical Co. | | 20,6002 | | | 528,802 | |
Mirant Corp.* | | 23,500 | | | 694,895 | |
Nucor Corp. | | 5,6002 | | | 327,096 | |
Phelps Dodge Corp. | | 13,200 | | | 1,325,016 | |
Total Materials | | | | | 3,130,257 | |
Telecommunication Services - 5.8% | | | | | | |
Centurytel, Inc. | | 30,4002 | | | 1,223,296 | |
Qwest Communications International, Inc.* | | 78,0002 | | | 673,140 | |
Verizon Communications, Inc. | | 71,100 | | | 2,630,700 | |
Total Telecommunication Services | | | | | 4,527,136 | |
Utilities - 3.6% | | | | | | |
Alliant Energy Corp. | | 14,200 | | | 544,570 | |
American Electric Power Co., Inc. | | 19,000 | | | 787,170 | |
Energen Corp. | | 22,200 | | | 950,604 | |
FirstEnergy Corp. | | 6,800 | | | 400,180 | |
National Fuel Gas Co. | | 4,000 | | | 149,600 | |
Total Utilities | | | | | 2,832,124 | |
Total Common Stocks
(cost $68,037,482) | | | | | 77,483,849 | |
Other Investment Companies - 22.5%1 | | | | | | |
Bank of New York Institutional Cash Reserves Fund, 5.39%3 | | 16,874,491 | | | 16,874,491 | |
JPMorgan Prime Money Market Fund, Institutional Class Shares, 5.18% | | 779,718 | | | 779,718 | |
Total Other Investment Companies
(cost $ 17,654,209) | | | | | 17,654,209 | |
Total Investments - 121.1%
(cost $ 85,691,691) | | | | | 95,138,058 | |
Other Assets, less Liabilities - (21.1)% | | | | | (16,601,343 | ) |
Net Assets - 100.0% | | | | $ | 78,536,715 | |
Note: Based on the cost of investments of $85,691,692 for Federal income tax purposes at October 31, 2006, the aggregate gross unrealized appreciation and depreciation were $10,429,586 and $954,609, respectively, resulting in net unrealized appreciation of investments of $9,474,977.
| * | Non-income-producing securities. |
| 1 | Yield shown for an investment company represents the October 31, 2006, seven-day average yield, which refers to the sum of the previous seven days’ dividends paid, expressed as an annual percentage. |
| 2 | Some or all of these shares, amounting to a market value of $16,346,092, or 20.8% of net assets, were out on loan to various brokers. |
| 3 | Collateral received from brokers for securities lending was invested in this short-term investment. |
The accompanying notes are an integral part of these financial statements.
12
FQ Global Alternatives Fund
Portfolio Manager’s Comments
The underperformance of the Global Alternatives Fund since inception is due to shortfalls in two of its four components. While gains in other dimensions have partially offset the losses, those gains have simply been too modest to overcome the losses from currency selection and country selection in 2006.
Currency selection experienced a material shortfall over the five months from April through August. The “expected equity flow” factor (investment capital fl owing between equity markets applies pressure on currencies) was the main culprit, although the failure of relative valuation to work effectively was also a significant cause of underperformance. Capital flows have behaved as we expected, but the impact on currencies that would be expected from such flows has not materialized. We have developed and examined several hypotheses as to why this may have occurred, but none of these hypotheses has led to solutions that would have worked over longer periods of time. For example, we hypothesized that large swings in the price of crude oil or commodities in general might have led to an offsetting currency impact. In fact, over the five months of underperformance, commodity importing markets such as the U.S. and Japan did experience currency declines, while commodity exporting markets in general, and Canada in particular, experienced currency appreciations. Examining this relationship more closely, we find that while it holds from time to time on a coincident basis, we find no reliable predictive power in this relationship.
With respect to the relative valuation factor, the yen has been the worst performer as the currency has grown very cheap. It is important to note that when relative valuation fails, it usually bounces back – we can just never be sure when that will happen.
Overall, the shortfall experienced in currency has not been extreme. Similar sized shortfalls (and larger) have been experienced several times in the past and the models have typically recovered fully and relatively quickly from these shortfalls. What is unique this time is that it has taken place without material offsetting gains from the other strategies.
Equity market selection has underperformed during this period, with a significant portion of this underperformance occurring in the fourth quarter. A short position on Spanish equities (driven by a large and growing current account deficit as well as modest currency risk) underperformed, as did a long position on Japanese equities (driven by good relative valuation, low currency risk, and an improving current account situation).
Overall, the relative value factor has been a positive contributor, while no premium has been paid to either currency risk or priced volatility risk. It has been the macro economic factors that have struggled this year, particularly in the fourth quarter. Specifically, the current account indicator (we dislike markets where the current account as a percentage of GDP is worsening) has led us towards the wrong countries year-to-date.
Our asset class selection decisions have been excellent this year, but only modest risk has been taken in this dimension due to the opportunity measured being low. Our bullishness on equities, and the corresponding relative bearishness on bonds, peaked at the end of June 2005 and continued to grow less and less aggressive as 2005 progressed. This meant that we began 2006 with a modest bullish posture on equities that shrank until becoming neutral in mid-April of this year. Rising bond yields along with climbing equity prices were principally responsible for the evolution in this position. We profited modestly from our bullish position on equities relative to bonds as equities outperformed bonds over this period. Subsequent to turning bearish on stocks relative to bonds in mid-April, stocks underperformed bonds as equities fell and bond prices rose. The reversal in interest rates (bond yields ceasing to rise and beginning to fall again) led our posture to revert back towards neutral until we passed through neutral again at the beginning of September. We have since moved further into a modest bullish position on global equities relative to bonds.
Bond country selection has delivered moderately strong alpha year to date. After underperforming slightly in the first quarter, it rebounded strongly in the 2nd and 3rd quarters and has begun the 4th quarter with small, but positive, performance. This positive performance has derived mostly from the overweight in Japanese bonds and the underweight in U.K. and Australian bonds. These gains were partially offset by smaller losses from the overweight in U.S. bonds in the first half of the year as well as small losses from the growing underweight in Canadian bonds in the second half of the year. Much of this success has derived from favoring markets with steep and steepening yield curves (relative to own country norms).
(continued on next page)
13
FQ Global Alternatives Fund
Portfolio Manager’s Comments (continued)
Cumulative Total Return Performance
Managers AMG FQ Global Alternatives Fund’s cumulative total return is based on the daily change in net asset value (NAV), and assumes that all distributions were reinvested. The Citigroup 1-Month U.S. Treasury Bill Index (“1-Month Treasury Index”) measures returns of 1-month treasury bills. Unlike the Fund, the 1-Month Treasury Index is unmanaged, is not available for investment, and does not incur expenses. The chart illustrates the performance of a hypothetical $10,000 investment made in the Class A shares (with load) of the Fund on March 30, 2006 (commencement of operations), to a $10,000 investment made in the 1-Month Treasury Index for the same time period. Figures include reinvestment of capital gains and dividends. The listed returns for the Fund are net of expenses and the returns for the index exclude expenses. The graph and table do not reflect the deduction of taxes that a shareholder would pay on a Fund distribution or redemption of shares. Total returns for the Fund would have been lower had certain expenses not been reduced.
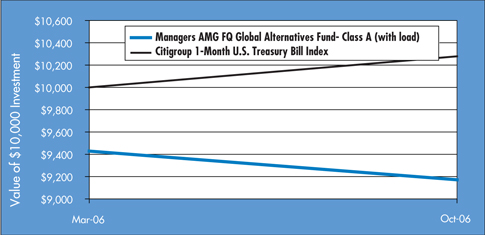
The table below shows the average total returns for the Managers AMG FQ Global Alternatives Fund and the Citigroup 1-Month U.S. Treasury Bill Index since inception through October 31, 2006.
| | | | | |
Average Total Returns | | Since
Inception | | | Inception
Date |
Managers AMG FQ Global Alternatives Equity Fund* | | | | | |
No Load: | | | | | |
Class A | | -2.70 | % | | 3/30/06 |
Class C | | -3.10 | % | | 3/30/06 |
Citigroup 1-Month U.S. Treasury Bill Index 1 | | 2.79 | % | | 3/31/06 |
With Load: | | | | | |
Class A | | -8.29 | % | | 3/30/06 |
Class C | | -4.07 | % | | 3/30/06 |
| * | Commencement of operations was March 30, 2006. |
| 1 | Performance for the Citigroup 1-Month U.S. Treasury Bill Index reflects an inception date of March 31, 2006. |
14
Managers AMG FQ Funds
Statements of Assets and Liabilities
October 31, 2006
| | | | | | | |
| | | FQ Tax- Managed
U.S. Equity | | | FQ U.S.
Equity |
Assets: | | | | | | | |
Investments at value (including securities on loan valued at $13,064,770 and $16,346,092, respectively)* | | $ | 98,004,764 | | | $ | 95,138,058 |
Cash | | | — | | | | 49,784 |
Receivable for investments sold | | | — | | | | 176,000 |
Receivable for Fund shares sold | | | 35,112 | | | | 200 |
Dividends and other receivables | | | 75,526 | | | | 111,449 |
Prepaid expenses | | | 27,498 | | | | 22,936 |
| | | | | | | |
Total assets | | | 98,142,900 | | | | 95,498,427 |
| | | | | | | |
Liabilities: | | | | | | | |
Payable upon return of securities loaned | | | 13,470,989 | | | | 16,874,491 |
Payable to Custodian | | | 31,391 | | | | — |
Payable for Fund shares repurchased | | | 44,374 | | | | — |
Accrued expenses: | | | | | | | |
Investment advisory and management fees | | | 45,265 | | | | 15,812 |
Administration fee | | | — | | | | 16,624 |
Distribution fees | | | 871 | | | | 111 |
Professional fees | | | 26,107 | | | | 27,927 |
Other | | | 33,825 | | | | 26,747 |
| | | | | | | |
Total liabilities | | | 13,652,822 | | | | 16,961,712 |
| | | | | | | |
Net Assets | | $ | 84,490,078 | | | $ | 78,536,715 |
| | | | | | | |
Net Assets Represent: | | | | | | | |
Paid-in capital | | $ | 123,058,756 | | | $ | 60,445,150 |
Undistributed net investment income | | | 61,925 | | | | 687,920 |
Accumulated net realized gain (loss) from investments and futures contracts | | | (51,853,120 | ) | | | 7,928,668 |
Net unrealized appreciation of investments and futures contracts | | | 13,222,517 | | | | 9,474,977 |
| | | | | | | |
Net Assets | | $ | 84,490,078 | | | $ | 78,536,715 |
| | | | | | | |
Class A Shares - Net Assets | | $ | 573,991 | | | $ | 371,029 |
Shares outstanding | | | 41,278 | | | | 24,931 |
| | | | | | | |
Net asset value, offering and redemption price per share | | $ | 13.91 | | | $ | 14.88 |
| | | | | | | |
Public offering price per share based on a maximum sales charge of 5.75% | | $ | 14.76 | | | $ | 15.79 |
Class C Shares - Net Assets | | $ | 941,435 | | | $ | 97,422 |
Shares outstanding | | | 68,090 | | | | 6,562 |
| | | | | | | |
Net asset value, offering and redemption price per share | | $ | 13.83 | | | $ | 14.85 |
| | | | | | | |
Institutional Class Shares - Net Assets | | $ | 82,974,652 | | | $ | 78,068,264 |
Shares outstanding | | | 5,958,394 | | | | 5,238,563 |
| | | | | | | |
Net asset value, offering and redemption price per share | | $ | 13.93 | | | $ | 14.90 |
| | | | | | | |
* Investments at cost | | $ | 84,782,247 | | | $ | 85,691,691 |
The accompanying notes are an integral part of these financial statements.
15
Managers AMG FQ Global Alternatives Fund
Statement of Net Assets
October 31, 2006
| | | | | | | |
| | | Principal
Amount | | Value | |
Assets: | | | | | | | |
Investments in Securities - 101.1% | | | | | | | |
U.S. Government Obligations - 9.3% | | | | | | | |
U.S. Treasury Bond, 4.87%, 12/14/06 1 | | $ | 2,000,000 | | $ | 1,988,330 | |
| | |
| | | Shares | | | |
Short-Term Investments - 91.8% | | | | | | | |
S&P 500 Depositary Receipts | | | 30,000 | | | 4,133,700 | |
JPMorgan Prime Money Market Fund, Institutional Class Shares, 5.18% 2 | | | 15,476,059 | | | 15,476,059 | |
| | | | | | | |
Total Investments in securities
(cost $21,366,426) | | | | | | 21,598,089 | |
| | | | | | | |
Cash | | | | | | 76,547 | |
Foreign currency (cost $13,931) | | | | | | 13,931 | |
Receivable for Fund shares sold | | | | | | 18,190 | |
Interest and other receivables | | | | | | 63,640 | |
Receivable for variation margin on futures | | | | | | 65,459 | |
Unrealized gains on forward foreign currency contracts | | | | | | 485,337 | |
Prepaid expenses | | | | | | 30,684 | |
| | | | | | | |
Total assets | | | | | | 22,351,877 | |
| | | | | | | |
Liabilities: | | | | | | | |
Payable for Fund shares repurchased | | | | | | 2,094 | |
Unrealized losses on forward foreign currency contracts | | | | | | 694,915 | |
Payable for variation margin | | | | | | 177,326 | |
Accrued expenses: | | | | | | | |
Investment advisory and management fees | | | | | | 27,974 | |
Administrative fees | | | | | | 4,502 | |
Distribution fees | | | | | | 4,818 | |
Professional fees | | | | | | 39,604 | |
Other | | | | | | 44,835 | |
| | | | | | | |
Total liabilities | | | | | | 996,068 | |
| | | | | | | |
Net Assets | | | | | $ | 21,355,809 | |
| | | | | | | |
Net Assets Represent: | | | | | | | |
Paid-in capital | | | | | $ | 21,899,620 | |
Undistributed net investment income | | | | | | 348,385 | |
Accumulated net realized loss from investments and futures contracts | | | | | | (594,047 | ) |
Accumulated net realized gain from currency contracts | | | | | | 20,984 | |
Net unrealized depreciation of investments, futures and foreign currency contracts | | | | | | (319,133 | ) |
| | | | | | | |
Net Assets | | | | | $ | 21,355,809 | |
| | | | | | | |
Class A Shares - Net Assets | | | | | $ | 20,660,935 | |
Shares outstanding | | | | | | 2,124,039 | |
| | | | | | | |
Net asset value, offering and redemption price per share | | | | | $ | 9.73 | |
| | | | | | | |
Public offering price per share based on a maximum sales charge of 5.75% | | | | | $ | 10.32 | |
Class C Shares - Net Assets | | | | | $ | 694,874 | |
Shares outstanding | | | | | | 71,710 | |
| | | | | | | |
Net asset value, offering and redemption price per share | | | | | $ | 9.69 | |
| | | | | | | |
| 1 | Security pledged to cover margin requirements for open futures positions at October 31, 2006. |
| 2 | Yield shown for an investment company represents the October 31, 2006, seven-day average yield, which refers to the sum of the previous seven days’ dividends paid, expressed as an annual percentage. |
The accompanying notes are an integral part of these financial statements.
16
Managers AMG FQ Funds
Statements of Operations
For the fiscal year ended October 31, 2006
| | | | | | | | | | | | |
| | | FQ Tax- Managed U.S. Equity | | | FQ U.S. Equity | | | FQ Global
Alternatives* | |
Investment Income: | | | | | | | | | | | | |
Dividend income | | $ | 838,148 | | | $ | 1,504,971 | | | $ | 31,267 | |
Interest income | | | — | | | | — | | | | 407,613 | |
Securities lending fees | | | 35,021 | | | | 17,728 | | | | — | |
Foreign withholding tax | | | (2,116 | ) | | | (45 | ) | | | — | |
| | | | | | | | | | | | |
Total investment income | | | 871,053 | | | | 1,522,654 | | | | 438,880 | |
| | | | | | | | | | | | |
Expenses: | | | | | | | | | | | | |
Investment advisory and management fees | | | 603,851 | | | | 265,060 | | | | 192,254 | |
Administrative fees | | | — | | | | 189,329 | | | | 28,273 | |
Distribution fees Class A | | | 437 | | | | 136 | | | | 28,090 | |
Distribution fees Class C | | | 2,616 | | | | 55 | | | | 732 | |
Transfer agent | | | 54,986 | | | | 56,150 | | | | 16,043 | |
Registration fees | | | 33,006 | | | | 28,327 | | | | 7,221 | |
Professional fees | | | 32,388 | | | | 34,955 | | | | 40,634 | |
Custodian | | | 30,493 | | | | 31,694 | | | | 24,958 | |
Reports to shareholders | | | 17,919 | | | | 7,115 | | | | 16,641 | |
Trustee fees and expenses | | | 5,944 | | | | 4,944 | | | | 1,324 | |
Miscellaneous | | | 4,556 | | | | 4,176 | | | | 6,172 | |
| | | | | | | | | | | | |
Total expenses before expense reimbursement | | | 786,196 | | | | 621,941 | | | | 362,342 | |
| | | | | | | | | | | | |
Less: Expense reimbursement | | | (79,376 | ) | | | (26,965 | ) | | | (79,067 | ) |
Expense reductions | | | — | | | | (400 | ) | | | — | |
| | | | | | | | | | | | |
Net expenses | | | 706,820 | | | | 594,576 | | | | 283,275 | |
| | | | | | | | | | | | |
Net investment income | | | 164,233 | | | | 928,078 | | | | 155,605 | |
| | | | | | | | | | | | |
Net Realized and Unrealized Gain (Loss): | | | | | | | | | | | | |
Net realized gain on investment transactions | | | 6,163,511 | | | | 7,916,539 | | | | 757 | |
Net realized gain (loss) on futures contracts | | | — | | | | 11,960 | | | | (423,008 | ) |
Net realized gain on foreign currency contracts | | | — | | | | — | | | | 20,984 | |
Net unrealized appreciation of investments | | | 4,777,717 | | | | 5,786,237 | | | | 231,663 | |
Net unrealized appreciation (depreciation) of futures contracts | | | — | | | | 35,735 | | | | (341,218 | ) |
Net unrealized depreciation of foreign currency contracts | | | — | | | | — | | | | (209,578 | ) |
| | | | | | | | | | | | |
Net realized and unrealized gain (loss) | | | 10,941,228 | | | | 13,750,471 | | | | (720,400 | ) |
| | | | | | | | | | | | |
Net Increase (Decrease) in Net Assets Resulting from Operations | | $ | 11,105,461 | | | $ | 14,678,549 | | | | ($564,795) | |
| | | | | | | | | | | | |
| * | Commencement of operations was March 30, 2006. |
The accompanying notes are an integral part of these financial statements.
17
Managers AMG FQ Funds
Statements of Changes in Net Assets
For the fiscal years ended October 31,
| | | | | | | | | | | | | | | | | | | | |
| | | FQ Tax- Managed U.S. Equity | | | FQ U.S. Equity | | | FQ Global
Alternatives* | |
| | | 2006 | | | 2005 | | | 2006 | | | 2005 | | | 2006 | |
Increase (Decrease) in Net Assets | | | | | | | | | | | | | | | | | | | | |
From Operations: | | | | | | | | | | | | | | | | | | | | |
Net investment income | | $ | 164,233 | | | $ | 21,634 | | | $ | 928,078 | | | $ | 1,109,164 | | | $ | 155,605 | |
Net realized gain (loss) on investments, futures and foreign currency transactions | | | 6,163,511 | | | | 6,293,568 | | | | 7,928,499 | | | | 11,924,709 | | | | (401,267 | ) |
Net unrealized appreciation (depreciation) of investments, futures and foreign currency translations | | | 4,777,717 | | | | 2,666,656 | | | | 5,821,972 | | | | (4,129,513 | ) | | | (319,133 | ) |
| | | | | | | | | | | | | | | | | | | | |
Net increase (decrease) in net assets resulting from operations | | | 11,105,461 | | | | 8,981,858 | | | | 14,678,549 | | | | 8,904,360 | | | | (564,795 | ) |
| | | | | | | | | | | | | | | | | | | | |
Distributions to Shareholders (Institutional Class): | | | | | | | | | | | | | | | | | | | | |
From net investment income | | | (111,569 | ) | | | (448,811 | ) | | | (1,014,832 | ) | | | (931,900 | ) | | | — | |
From net realized gain on investments | | | — | | | | — | | | | (2,823,880 | ) | | | — | | | | — | |
| | | | | | | | | | | | | | | | | | | | |
Total distributions to shareholders | | | (111,569 | ) | | | (448,811 | ) | | | (3,838,712 | ) | | | (931,900 | ) | | | — | |
| | | | | | | | | | | | | | | | | | | | |
From Capital Share Transactions: | | | | | | | | | | | | | | | | | | | | |
Proceeds from the sale of shares | | | 30,799,963 | | | | 11,829,718 | | | | 4,809,087 | | | | 3,021,007 | | | | 23,584,230 | |
Net asset value of shares issued in connection with reinvestment of dividends and distributions | | | 103,866 | | | | 429,263 | | | | 3,770,801 | | | | 913,866 | | | | — | |
Cost of shares repurchased | | | (12,784,257 | ) | | | (10,736,051 | ) | | | (13,353,393 | ) | | | (12,315,041 | ) | | | (1,663,626 | ) |
| | | | | | | | | | | | | | | | | | | | |
Net increase (decrease) from capital share transactions | | | 18,119,572 | | | | 1,522,930 | | | | (4,773,505 | ) | | | (8,380,168 | ) | | | 21,920,604 | |
| | | | | | | | | | | | | | | | | | | | |
Total increase (decrease) in net assets | | | 29,113,464 | | | | 10,055,977 | | | | 6,066,332 | | | | (407,708 | ) | | | 21,355,809 | |
| | | | | | | | | | | | | | | | | | | | |
Net Assets: | | | | | | | | | | | | | | | | | | | | |
Beginning of period | | | 55,376,614 | | | | 45,320,637 | | | | 72,470,383 | | | | 72,878,091 | | | | — | |
| | | | | | | | | | | | | | | | | | | | |
End of period | | $ | 84,490,078 | | | $ | 55,376,614 | | | $ | 78,536,715 | | | $ | 72,470,383 | | | $ | 21,355,809 | |
| | | | | | | | | | | | | | | | | | | | |
End of period undistributed net investment income | | $ | 61,925 | | | $ | 21,336 | | | $ | 687,920 | | | $ | 774,674 | | | $ | 348,385 | |
Share Transactions: | | | | | | | | | | | | | | | | | | | | |
Sale of shares | | | 2,389,184 | | | | 1,025,346 | | | | 350,267 | | | | 329,310 | | | | 2,363,264 | |
Shares issued in connection with reinvestment of dividends and distributions | | | 8,296 | | | | 39,747 | | | | 291,839 | | | | 74,622 | | | | — | |
Shares repurchased | | | (986,692 | ) | | | (969,422 | ) | | | (976,209 | ) | | | (1,071,398 | ) | | | (167,515 | ) |
| | | | | | | | | | | | | | | | | | | | |
Net increase (decrease) in shares | | | 1,410,788 | | | | 95,671 | | | | (334,103 | ) | | | (667,466 | ) | | | 2,195,749 | |
| | | | | | | | | | | | | | | | | | | | |
| * | Commencement of operations was March 30, 2006. |
The accompanying notes are an integral part of these financial statements.
18
Managers AMG FQ Tax-Managed U.S. Equity Fund
Financial Highlights
For a share outstanding throughout each fiscal period
| | | | | | | | | | | | | | | | | | | | |
| | | For the fiscal year ended October 31, | |
Institutional Class Shares | | 2006 | | | 2005 | | | 2004 | | | 2003 | | | 2002 | |
Net Asset Value, Beginning of Year | | $ | 11.89 | | | $ | 9.94 | | | $ | 9.39 | | | $ | 7.74 | | | $ | 8.91 | |
Income from Investment Operations: | | | | | | | | | | | | | | | | | | | | |
Net investment income | | | 0.03 | | | | 0.01 | | | | 0.11 | | | | 0.06 | | | | 0.06 | |
Net realized and unrealized gain (loss) on investments | | | 2.03 | | | | 2.04 | | | | 0.44 | | | | 1.69 | | | | (1.23 | ) |
| | | | | | | | | | | | | | | | | | | | |
Total from investment operations | | | 2.06 | | | | 2.05 | | | | 0.55 | | | | 1.75 | | | | (1.17 | ) |
| | | | | | | | | | | | | | | | | | | | |
Less Distributions to Shareholders from: | | | | | | | | | | | | | | | | | | | | |
Net investment income | | | (0.02 | ) | | | (0.10 | ) | | | — | | | | (0.10 | ) | | | — | |
| | | | | | | | | | | | | | | | | | | | |
Net Asset Value, End of Year | | $ | 13.93 | | | $ | 11.89 | | | $ | 9.94 | | | $ | 9.39 | | | $ | 7.74 | |
| | | | | | | | | | | | | | | | | | | | |
Total Return 1 | | | 17.37 | % | | | 20.75 | % | | | 5.86 | % | | | 22.90 | % | | | (13.13 | )% |
| | | | | | | | | | | | | | | | | | | | |
Ratio of net expenses to average net assets1 | | | 0.99 | % | | | 0.99 | % | | | 0.99 | % | | | 0.99 | % | | | 1.00 | % |
Ratio of net investment income to average net assets1 | | | 0.23 | % | | | 0.04 | % | | | 0.99 | % | | | 0.68 | % | | | 0.91 | % |
Portfolio turnover | | | 98 | % | | | 105 | % | | | 131 | % | | | 143 | % | | | 101 | % |
Net assets at end of year (000’s omitted) | | $ | 82,975 | | | $ | 55,377 | | | $ | 45,321 | | | $ | 53,538 | | | $ | 8,539 | |
| | | | | | | | | | | | | | | | | | | | |
Expense Offsets:4 | | | | | | | | | | | | | | | | | | | | |
Ratio of total expenses to average net assets | | | 1.11 | % | | | 1.21 | % | | | 1.20 | % | | | 1.62 | % | | | 2.55 | % |
Ratio of net investment income (loss) to average net assets | | | 0.12 | % | | | (0.17 | )% | | | 0.79 | % | | | 0.06 | % | | | (0.63 | )% |
| | | | | | | | | | | | | | | | | | | | |
| | | | |
Class A Shares | | For the fiscal
period ended
October 31, 2006* | |
Net Asset Value, Beginning of Period | | $ | 13.01 | |
Income from Investment Operations: | | | | |
Net investment income | | | 0.005 | |
Net realized and unrealized gain on investments | | | 0.90 | |
| | | | |
Total from investment operations | | | 0.90 | |
| | | | |
Net Asset Value, End of Period | | $ | 13.91 | |
| | | | |
Total Return1 | | | 6.92 | %2 |
| | | | |
Ratio of net expenses to average net assets1 | | | 1.24 | %3 |
Ratio of net investment loss to average net assets1 | | | (0.11 | )%3 |
Portfolio turnover | | | 98 | %2 |
Net assets at end of period (000’s omitted) | | $ | 574 | |
| | | | |
Expense Offsets:4 | | | | |
Ratio of total expenses to average net assets | | | 1.40 | %3 |
Ratio of net investment loss to average net assets | | | (0.27 | )%3 |
| | | | |
| |
Class C Shares | | For the fiscal
period ended
October 31, 2006* | |
Net Asset Value, Beginning of Period | | $ | 13.01 | |
Income from Investment Operations: | | | | |
Net investment loss | | | (0.03 | ) |
Net realized and unrealized gain on investments | | | 0.85 | |
| | | | |
Total from investment operations | | | 0.88 | |
| | | | |
Net Asset Value, End of Period | | $ | 13.89 | |
| | | | |
Total Return1 | | | 6.30 | %2 |
| | | | |
Ratio of net expenses to average net assets1 | | | 1.99 | %3 |
Ratio of net investment loss to average net assets1 | | | (0.91 | )%3 |
Portfolio turnover | | | 98 | %2 |
Net assets at end of period (000’s omitted) | | $ | 941 | |
| | | | |
Expense Offsets:4 | | | | |
Ratio of total expenses to average net assets | | | 2.15 | %3 |
Ratio of net investment loss to average net assets | | | (1.06 | )%3 |
| * | Class A and Class C shares commenced operations on March 1, 2006. (See Notes to Financial Statements.) |
| 1 | Total returns and net investment income would have been lower had certain expenses not been reduced. (See Note 1(c) of Notes to Financial Statements.) |
| 4 | Excludes the impact of expense reimbursements and expense offsets such as brokerage credits, but includes non-reimbursable expenses such as interest and taxes. (See Note 1(c) of Notes to Financial Statements.) |
| 5 | Rounds to less than $0.01. |
19
Managers AMG FQ U.S. Equity Fund
Financial Highlights
For a share outstanding throughout each fiscal period
| | | | | | | | | | | | | | | | | | | | |
| | | For the fiscal year ended October 31, | |
Institutional Class Shares | | 2006 | | | 2005 | | | 2004 | | | 2003 | | | 2002 | |
Net Asset Value, Beginning of Year | | $ | 12.93 | | | $ | 11.62 | | | $ | 10.59 | | | $ | 9.03 | | | $ | 10.90 | |
| | | | | | | | | | | | | | | | | | | | |
Income from Investment Operations: | | | | | | | | | | | | | | | | | | | | |
Net investment income | | | 0.17 | | | | 0.20 | | | | 0.11 | | | | 0.08 | | | | 0.07 | |
Net realized and unrealized gain (loss) on investments | | | 2.49 | | | | 1.26 | | | | 1.00 | | | | 1.56 | | | | (1.87 | ) |
| | | | | | | | | | | | | | | | | | | | |
Total from investment operations | | | 2.66 | | | | 1.46 | | | | 1.11 | | | | 1.64 | | | | (1.80 | ) |
| | | | | | | | | | | | | | | | | | | | |
Less Distributions to Shareholders from: | | | | | | | | | | | | | | | | | | | | |
Net investment income | | | (0.18 | ) | | | (0.15 | ) | | | (0.08 | ) | | | (0.08 | ) | | | (0.07 | ) |
Net realized gain on investments | | | (0.51 | ) | | | — | | | | — | | | | — | | | | — | |
| | | | | | | | | | | | | | | | | | | | |
Total distributions to shareholders | | | (0.69 | ) | | | (0.15 | ) | | | (0.08 | ) | | | (0.08 | ) | | | (0.07 | ) |
| | | | | | | | | | | | | | | | | | | | |
Net Asset Value, End of Year | | $ | 14.90 | | | $ | 12.93 | | | $ | 11.62 | | | $ | 10.59 | | | $ | 9.03 | |
| | | | | | | | | | | | | | | | | | | | |
Total Return1 | | | 21.44 | % | | | 12.64 | % | | | 10.52 | % | | | 18.37 | % | | | (16.65 | )% |
| | | | | | | | | | | | | | | | | | | | |
Ratio of net expenses to average net assets1 | | | 0.79 | % | | | 0.85 | % | | | 0.79 | % | | | 0.91 | % | | | 1.01 | % |
Ratio of net investment income to average net assets1 | | | 1.23 | % | | | 1.49 | % | | | 0.97 | % | | | 0.82 | % | | | 0.61 | % |
Portfolio turnover | | | 89 | % | | | 105 | % | | | 106 | % | | | 169 | % | | | 74 | % |
Net assets at end of year (000’s omitted) | | $ | 78,068 | | | $ | 72,470 | | | $ | 72,878 | | | $ | 71,265 | | | $ | 63,676 | |
| | | | | | | | | | | | | | | | | | | | |
Expense Offsets:4 | | | | | | | | | | | | | | | | | | | | |
Ratio of total expenses to average net assets | | | 0.82 | % | | | — | | | | — | | | | — | | | | — | |
Ratio of net investment income to average net assets | | | 1.19 | % | | | — | | | | — | | | | — | | | | — | |
| | | | | | | | | | | | | | | | | | | | |
| | | | |
Class A Shares | | For the fiscal
period ended
October 31, 2006* | |
Net Asset Value, Beginning of Period | | $ | 13.53 | |
Income from Investment Operations: | | | | |
Net investment income | | | 0.01 | |
Net realized and unrealized gain on investments | | | 1.34 | |
| | | | |
Total from investment operations | | | 1.35 | |
| | | | |
Net Asset Value, End of Period | | $ | 14.88 | |
| | | | |
Total Return1 | | | 9.98 | %2 |
| | | | |
Ratio of net expenses to average net assets1 | | | 1.04 | %3 |
Ratio of net investment income to average net assets1 | | | 0.63 | %3 |
Portfolio turnover | | | 89 | %2 |
Net assets at end of period (000’s omitted) | | $ | 371 | |
| | | | |
Expense Offsets:4 | | | | |
Ratio of total expenses to average net assets | | | 1.13 | %3 |
Ratio of net investment income to average net assets | | | 0.54 | %3 |
| | | | |
| |
Class C Shares | | For the fiscal
period ended
October 31, 2006* | |
Net Asset Value, Beginning of Period | | $ | 13.53 | |
Income from Investment Operations: | | | | |
Net investment income | | | 0.005 | |
Net realized and unrealized gain on investments | | | 1.32 | |
| | | | |
Total from investment operations | | | 1.32 | |
| | | | |
Net Asset Value, End of Period | | $ | 14.85 | |
| | | | |
Total Return1 | | | 9.76 | %2 |
| | | | |
Ratio of net expenses to average net assets1 | | | 1.79 | %3 |
Ratio of net investment income to average net assets1 | | | 0.16 | %3 |
Portfolio turnover | | | 89 | %2 |
Net assets at end of period (000’s omitted) | | $ | 97 | |
| | | | |
Expense Offsets:4 | | | | |
Ratio of total expenses to average net assets | | | 1.88 | %3 |
Ratio of net investment loss to average net assets | | | (0.07 | )%3 |
| | | | |
| * | Class A and Class C shares commenced operations on March 1, 2006. (See Notes to Financial Statements.) |
| 1 | Total returns and net investment income would have been lower had certain expenses not been reduced. (See Note 1(c) of Notes to Financial Statements.) |
| 4 | Excludes the impact of expense reimbursements and expense offsets such as brokerage credits, but includes non-reimbursable expenses such as interest and taxes. (See Note 1(c) of Notes to Financial Statements.) |
| 5 | Rounds to less than $0.01. |
20
Managers AMG FQ Global Alternatives Fund
Financial Highlights
For a share outstanding throughout the fiscal period
| | | | |
Class A Shares | | For the fiscal
period ended
October 31, 2006* | |
Net Asset Value, Beginning of Period | | $ | 10.00 | |
Income from Investment Operations: | | | | |
Net investment income | | | 0.16 | |
Net realized and unrealized loss on investments | | | (0.43 | ) |
| | | | |
Total from investment operations | | | (0.27 | ) |
| | | | |
Net Asset Value, End of Period | | $ | 9.73 | |
| | | | |
Total Return1 | | | (2.70 | )%2 |
| | | | |
Ratio of net expenses to average net assets1 | | | 2.50 | %3 |
Ratio of net investment income to average net assets1 | | | 1.38 | %3 |
Portfolio turnover | | | 48 | %2 |
Net assets at end of period (000’s omitted) | | $ | 20,661 | |
| | | | |
Expense Offsets:4 | | | | |
Ratio of total expenses to average net assets | | | 3.20 | %3 |
Ratio of net investment income to average net assets | | | 0.68 | %3 |
| | | | |
| |
Class C Shares | | For the fiscal
period ended
October 31, 2006* | |
Net Asset Value, Beginning of Period | | $ | 10.00 | |
Income from Investment Operations: | | | | |
Net investment income | | | 0.02 | |
Net realized and unrealized loss on investments | | | (0.33 | ) |
| | | | |
Total from investment operations | | | (0.31 | ) |
| | | | |
Net Asset Value, End of Period | | $ | 9.69 | |
| | | | |
Total Return1 | | | (3.10 | )%2 |
| | | | |
Ratio of net expenses to average net assets1 | | | 3.25 | %3 |
Ratio of net investment income to average net assets1 | | | 1.03 | %3 |
Portfolio turnover | | | 48 | %2 |
Net assets at end of period (000’s omitted) | | $ | 695 | |
| | | | |
Expense Offsets:4 | | | | |
Ratio of total expenses to average net assets | | | 3.52 | %3 |
Ratio of net investment income to average net assets | | | 0.76 | %3 |
| | | | |
| * | Class A and Class C shares commenced operations at the close of business on March 30, 2006. (See Notes to Financial Statements.) |
| 1 | Total returns and net investment income would have been lower had certain expenses not been reduced. (See Note 1(c) of Notes to Financial Statements.) |
| 4 | Excludes the impact of expense reimbursements and expense offsets such as brokerage credits, but includes non-reimbursable expenses such as interest and taxes. (See Note 1(c) of Notes to Financial Statements.) |
21
Managers AMG FQ Funds
Notes to Financial Statements
October 31, 2006
| 1. | Summary of Significant Accounting Policies |
Managers Trust I Funds (the “Trust”) is an open-end management investment company, organized as a Massachusetts business trust, and registered under the Investment Company Act of 1940, as amended (the “1940 Act”). Currently, the Trust is comprised of a number of different funds, each having distinct investment management objectives, strategies, risks, and policies. Included in this report are: Managers AMG FQ Tax-Managed U.S. Equity Fund, formerly First Quadrant Tax-Managed Equity Fund (“Tax-Managed”), Managers AMG FQ U.S. Equity Fund, formerly Managers Structured Core (“U.S. Equity”), and Managers AMG FQ Global Alternatives Fund (“Global Alternatives”), collectively the “Funds.”
On March 1, 2006, two new classes were added to Tax-Managed and U.S. Equity, Class A and Class C, in addition to the existing Institutional Class. Initial investments of $1,500 were made in each new class by Managers Investment Group LLC. Global Alternatives commenced operations on March 30, 2006 with an initial investment of $100 into Class A and $1,500 into Class C by Managers Investment Group LLC. Each class represents an interest in the same assets of the Fund and the classes are identical except for class specific expenses related to shareholder activity. Investment income, realized and unrealized capital gains and losses, the common expenses of the Fund, and certain Fund level expense reductions, if any, are allocated on a pro rata basis to each class based on the relative net assets of each class to the total net assets of the Fund. All classes have equal voting privileges except that each class has exclusive voting rights with respect to its services and/or distribution plan. Sales of Class A shares may be subject to a front-end sales charge of up to 5.75%. Redemptions of Class C shares may be subject to a contingent-deferred sales charge (as a percentage of the original offering price or the net asset value at the time of sale, whichever is less). Tax-Managed and U.S. Equity Institutional Class shares are available, with no sales charge, to certain institutional investors and qualifying individual investors. Please refer to a current prospectus for additional information on each share class.
The Funds’ financial statements are prepared in accordance with accounting principles generally accepted in the United States of America, which require management to make estimates and assumptions that affect the reported amount of assets and liabilities and disclosure of contingent assets and liabilities at the date of the financial statements and the reported amounts of income and expenses during the reporting period. Actual results could differ from those estimates. The following is a summary of significant accounting policies followed by the Funds in the preparation of their financial statements:
| a. | Valuation of Investments |
Equity securities traded on a domestic or international securities exchange are valued at the last quoted sale price, or, lacking any sales, at the last quoted bid price. Over-the-counter securities are valued at the Nasdaq Official Closing Price, if one is available. Lacking any sales, over-the counter securities are valued at the last quoted bid price. The Fund’s investments are generally valued based on market quotations provided by third-party pricing services approved by the Board of Trustees of the Trust. Under certain circumstances, the value of the Fund’s investment may be based on an evaluation of its fair value, pursuant to procedures established by and under the general supervision of the Board of Trustees of the Trust. The Fund may use the fair value of a portfolio security to calculate its NAV when, for example, (1) market quotations are not readily available because a portfolio security is not traded in a public market or the principal market in which the security trades is closed, (2) trading in a portfolio security is suspended and has not resumed prior to the time as of which the Fund calculates its NAV, (3) where a significant event affecting the value of a portfolio security is determined to have occurred between the time of the market quotation provided for a portfolio security and the time as of which the Fund calculates its NAV, (4) a security’s price has remained unchanged over a period of time (often referred to as a “stale price”), or (5) the Investment Manager determines that a market quotation is inaccurate. The Investment Manager monitors intervening events that may affect the value of securities held in the Fund’s portfolio and, in accordance with procedures adopted by the Fund’s Trustees, will adjust the prices of securities traded in foreign markets, as appropriate, to reflect the impact of events occurring subsequent to the close of such markets but prior to the time each Fund’s NAV is calculated. Futures contracts for which market quotations are readily available are valued at the settlement price as of the close of the futures exchange. Short-term investments having a remaining maturity of 60 days or less are valued at amortized cost, which approximates market value. Investments in other regulated investment companies are valued at their end of day net asset value per share except iShares or other ETF’s which are valued the same as equity securities. Securities (including derivatives) for which market quotations are not readily available are valued at fair value, as determined in good faith, and pursuant to procedures adopted by the Board of Trustees of the Trust.
The values assigned to fair value investments are based on available information and do not necessarily represent amounts that might ultimately be realized, since such amounts depend on future developments inherent in long-term investments. Further, because of the inherent uncertainty of valuation, those estimated values may differ significantly from the values that would have been used had a ready market for the investments existed, and the differences could be material.
Security transactions are accounted for as of trade date. Realized gains and losses on securities sold are determined on the basis of identified cost.
| c. | Investment Income and Expenses |
Dividend income is recorded on the ex-dividend date, except certain dividends from foreign securities where the ex-dividend date may have passed. These dividends are recorded as soon as the Trust is informed of the ex-dividend date. Dividend income on foreign securities is recorded net of any withholding tax. Interest income, which includes amortization of premium and accretion of discount on debt securities, is accrued as earned. Non-cash dividends included in dividend income, if any, are reported at the fair market value of the securities received. Other income and expenses are recorded on an accrual basis. Expenses which cannot be directly attributed to a fund are apportioned among the Funds in the Trust and in some cases other affiliated funds based upon their relative average net assets or number of shareholders.
22
Managers AMG FQ Funds
Notes to Financial Statements (continued)
U. S. Equity had certain portfolio trades directed to various brokers who paid a portion of the Fund’s expenses. For the fiscal year ended October 31, 2006, under this arrangement, the Fund’s expenses were reduced by $400 which had no impact on the expense ratio.
Each of the Funds has a “balance credit” agreement with The Bank of New York (“BNY”), the Funds’ custodian, whereby each Fund is credited with an interest factor equal to 1% below the effective 90-day T-Bill rate for account balances left uninvested overnight. These credits serve to reduce custody expenses that would otherwise be charged to each Fund. For the fiscal year ended October 31, 2006, the custodian expense was not reduced for any of the Funds.
Managers Investment Group, LLC (the “Investment Manager”), a subsidiary of Affiliated Managers Group, Inc. (“AMG”) and the Investment Manager for Tax-Managed and Global Alternatives, have contractually agreed, through at least March 1, 2007, to waive fees and pay or reimburse expenses to the extent that the total annual operating expenses (exclusive of taxes, interest, brokerage costs and extraordinary expenses) of the Funds exceed the following amounts of the Fund’s average daily net assets.
| | | | | | | | | |
Fund | | Class A | | | Class C | | | Institutional
Class | |
Tax-Managed | | 1.24 | % | | 1.99 | % | | 0.99 | % |
Global Alternatives | | 2.50 | % | | 3.25 | % | | NA | |
The Funds are obligated to repay the Investment Manager such amounts waived, paid or reimbursed in future years provided that the repayment occurs within three (3) years after the waiver or reimbursement occurs and that such repayment would not cause the Fund’s total operating expenses in any such future year to exceed that Funds respective expense cap. In addition to any other waiver or reimbursement agreed to by the Investment Manager, First Quadrant from time to time may waive all or a portion of its fee. In such an event, the Investment Manager will, subject to certain conditions, waive an equal amount of the management fee. At October 31, 2006, the fiscal year and cumulative amount of reimbursable expenses for the Funds were as follows:
| | | | | | |
Fund | | Fiscal year
ended October 31,
2006 | | Cumulative
Reimbursement
Amount |
Tax-Managed | | $ | 79,376 | | $ | 286,958 |
Global Alternatives | | | 79,067 | | | 79,067 |
The Investment Manager has voluntarily agreed through March 1, 2007 to limit U.S. Equity’s Institutional Class shares total annual operating expenses (exclusive of taxes, interest, brokerage costs and extraordinary expenses) to 0.79% of the Fund’s average daily net assets allocable to the Institutional Class shares. This arrangement may be modified or terminated by the Investment Manager at any time. As of October 31, 2006 the total operating expenses have exceeded the expense cap by $26,965.
Total returns and net investment income for the Funds would have been lower had certain expenses not been offset. Total expenses before offsets exclude the impact of expense reimbursements and expense offsets such as brokerage recapture credits but include non-reimbursable expenses such as interest and taxes, if any.
| d. | Dividends and Distributions |
Dividends resulting from net investment income, if any, normally will be declared and paid annually in December. Distributions of capital gains, if any, will also be made annually in December and when required for Federal excise tax purposes. Income and capital gain distributions are determined in accordance with Federal income tax regulations, which may differ from generally accepted accounting principles. These differences are primarily due to differing treatments for losses deferred due to wash sales, contributed securities, and possibly equalization accounting for tax purposes. Permanent book and tax basis differences, if any, relating to shareholder distributions will result in reclassifications to paid-in capital. The tax character of distributions paid during the past two years were as follows:
| | | | | | | | | | | | | | | | |
| | | FQ Tax-Managed Equity | | FQ US Equity | | FQ Global Alternatives |
| | | 2006 | | 2005 | | 2006 | | 2005 | | 2006 | | 2005 |
Distributions paid from: | | | | | | | | | | | | | | | | |
Ordinary income | | $ | 111,569 | | $ | 448,811 | | $ | 1,014,832 | | $ | 931,900 | | — | | — |
Short-term capital gains | | | — | | | — | | | — | | | — | | — | | — |
Long-term capital gains | | | — | | | — | | | 2,823,880 | | | — | | — | | — |
| | | | | | | | | | | | | | | | |
| | $ | 111,569 | | $ | 448,811 | | $ | 3,838,712 | | $ | 931,900 | | | | |
| | | | | | | | | | | | | | | | |
As of October 31, 2006, the components of distributable earnings (excluding unrealized appreciation/depreciation) on a tax basis consisted of:
| | | | | | | | | |
| | | FQ Tax-Managed
Equity | | FQ US Equity | | FQ Global
Alternatives |
Capital loss carryforward | | $ | 51,845,221 | | | — | | $ | 737,147 |
Undistributed ordinary income | | | 61,925 | | $ | 687,920 | | | 348,385 |
Undistributed short-term capital gains | | | — | | | 3,551,102 | | | — |
Undistributed long-term capital gains | | | — | | | 4,406,176 | | | — |
23
Managers AMG FQ Funds
Notes to Financial Statements (continued)
The Funds intend to comply with the requirements under Subchapter M of the Internal Revenue Code of 1986, as amended, to distribute substantially all of their taxable income and gains to their shareholders and to meet certain diversification and income requirements with respect to investment companies. Therefore, no provision for Federal income or excise tax is included in the accompanying financial statements.
| f. | Capital Loss Carryovers |
As of October 31, 2006, the following Funds had accumulated net realized capital loss carryovers from securities transactions for Federal income tax purposes as shown in the following chart. These amounts may be used to offset realized capital gains, if any, through the expiration dates listed.
| | | | | |
Fund | | Capital Loss
Carryover Amount | | Expires
October 31, |
Tax-Managed | | $ | 17,559,688 | | 2010 |
| | | 34,285,533 | | 2009 |
Global Alternatives | | | 737,147 | | 2014 |
For the fiscal year ended October 31, 2006 Tax-Managed utilized capital loss carryovers in the amount of $6,007,911.
The Trust’s Declaration of Trust authorizes for each series the issuance of an unlimited number of shares of beneficial interest, without par value. Each Fund records sales and repurchases of its capital stock on the trade date. Dividends and distributions to shareholders are recorded on the ex-dividend date. For the fiscal year ended October 31, 2006, the capital stock transactions in the Funds by class were:
| | | | | | | | | | | | | | | | | | | | | | | | | | | | |
| | | Tax-Managed | | | U.S. Equity | |
| | | 2006 | | | 2005 | | | 2006 | | | 2005 | |
| | | Shares | | | Amount | | | Shares | | | Amount | | | Shares | | | Amount | | | Shares | | | Amount | |
Class A Shares * | | | | | | | | | | | | | | | | | | | | | | | | | | | | |
Sale of shares | | 43,397 | | | $ | 558,178 | | | — | | | | — | | | 31,004 | | | $ | 441,439 | | | — | | | | — | |
Reinvestment of dividends and distributions | | — | | | | — | | | — | | | | — | | | — | | | | — | | | — | | | | — | |
Shares repurchased | | (2,119 | ) | | | (26,927 | ) | | — | | | | — | | | (6,073 | ) | | | (89,217 | ) | | — | | | | — | |
| | | | | | | | | | | | | | | | | | | | | | | | | | | | |
Net increase | | 41,278 | | | $ | 531,251 | | | — | | | | — | | | 24,931 | | | $ | 352,222 | | | — | | | | — | |
| | | | | | | | | | | | | | | | | | | | | | | | | | | | |
Class C Shares * | | | | | | | | | | | | | | | | | | | | | | | | | | | | |
Sale of shares | | 68,090 | | | $ | 875,865 | | | — | | | | — | | | 6,778 | | | $ | 99,470 | | | — | | | | — | |
Reinvestment of dividends and distributions | | — | | | | — | | | — | | | | — | | | — | | | | — | | | — | | | | — | |
Shares repurchased | | — | | | | — | | | — | | | | — | | | (216 | ) | | | (2,881 | ) | | — | | | | — | |
| | | | | | | | | | | | | | | | | | | | | | | | | | | | |
Net increase | | 68,090 | | | $ | 875,865 | | | — | | | | — | | | 6,562 | | | $ | 96,589 | | | — | | | | — | |
| | | | | | | | | | | | | | | | | | | | | | | | | | | | |
Institutional Class | | | | | | | | | | | | | | | | | | | | | | | | | | | | |
Sale of shares | | 2,277,697 | | | $ | 29,365,920 | | | 1,025,346 | | | $ | 11,829,718 | | | 312,485 | | | $ | 4,268,178 | | | 329,310 | | | $ | 3,021,007 | |
Reinvestment of dividends and distributions | | 8,296 | | | | 103,866 | | | 39,747 | | | | 429,263 | | | 291,839 | | | | 3,770,801 | | | 74,622 | | | | 913,866 | |
Shares repurchased | | (984,573 | ) | | | (12,757,330 | ) | | (969,422 | ) | | | (10,736,051 | ) | | (969,920 | ) | | | (13,261,295 | ) | | (1,071,398 | ) | | | (12,315,041 | ) |
| | | | | | | | | | | | | | | | | | | | | | | | | | | | |
Net increase (decrease) | | 1,301,420 | | | $ | 16,712,456 | | | 95,671 | | | $ | 1,522,930 | | | (365,596 | ) | | $ | (5,222,316 | ) | | (667,466 | ) | | $ | (8,380,168 | ) |
| | | | | | | | | | | | | | | | | | | | | | | | | | | | |
| * | Class A and Class C shares commenced operations on March 1, 2006. |
| | | | | | | |
| | | Global Alternatives 2006 * | |
| | | Shares | | | Amount | |
Class A Shares | | | | | | | |
Sale of shares | | 2,291,554 | | | $ | 22,875,480 | |
Shares repurchased | | (167,515 | ) | | | (1,663,626 | ) |
| | | | | | | |
Net increase | | 2,124,039 | | | $ | 21,211,854 | |
| | | | | | | |
Class C Shares | | | | | | | |
Sale of shares | | 71,710 | | | $ | 708,750 | |
Shares repurchased | | — | | | | — | |
| | | | | | | |
Net increase | | 71,710 | | | $ | 708,750 | |
| | | | | | | |
| * | Commenced operations on March 30, 2006. |
24
Managers AMG FQ Funds
Notes to Financial Statements (continued)
At October 31, 2006, certain unaffiliated shareholders, specifically omnibus accounts, individually or collectively held greater than 10% of the outstanding shares of the following Funds:
| | | | | | |
Fund | | Class A | | Class C | | Institutional Class |
Tax-Managed | | 3 collectively own 80% | | 1 owns 85% | | 2 collectively own 31% |
U.S. Equity | | 3 collectively own 75% | | 1 owns 98% | | 1 owns 16% |
Global Alternatives | | None | | 3 collectively own 37% | | NA |
| h. | Foreign Currency Translation |
The books and records of the Funds are maintained in U.S. dollars. The value of investments, assets and liabilities denominated in currencies other than U.S. dollars are translated into U.S. dollars based upon current foreign exchange rates. Purchases and sales of foreign investments, income and expenses are converted into U.S. dollars based on currency exchange rates prevailing on the respective dates of such transactions. Net realized and unrealized gain (loss) on foreign currency transactions represent: (1) foreign exchange gains and losses from the sale and holdings of foreign currencies; (2) gains and losses between trade date and settlement date on investment securities transactions and forward foreign currency exchange contracts; and (3) gains and losses from the difference between amounts of interest and dividends recorded and the amounts actually received.
In addition, the Funds do not isolate the net realized and unrealized gain or loss resulting from changes in exchange rates from the fluc-tuations resulting from changes in market prices of securities held. Such fluctuations are included with the net realized and unrealized gain or loss on investments.
| 2. | Agreements and Transactions with Affiliates |
The Trust has entered into an Investment Management Agreement under which Managers Investment Group LLC (the “Investment Manager”), an indirect wholly-owned subsidiary of Affiliated Managers Group, Inc. (“AMG”), serves as investment manager to the Funds and is responsible for the Funds’ overall administration. The Funds are distributed by Managers Distributors, Inc. (“MDI”), a wholly-owned subsidiary of Managers Investment Group LLC. The Funds’ investment portfolios are managed by First Quadrant, L.P. (“First Quadrant” or the “Subadvisor”), which serves pursuant to a Subadvisory Agreement between the Investment Manager and First Quadrant with respect to each of the Funds. AMG indirectly owns a majority interest in First Quadrant. Certain Trustees and Officers of the Funds are Officers and/or Directors of the Investment Manager, AMG, and/or MDI.
Tax-Managed is obligated by the Investment Management Agreement to pay an annual management fee to the Investment Manager 0.85% of the average daily net assets of the Fund. The Investment Manager, in turn, pays First Quadrant 0.85% of the average daily net assets of the Fund for its services as subadvisor. Under the Investment Management Agreement with the Fund, the Investment Manager provides a variety of administrative services to the Fund. The Investment Manager receives no additional compensation from the Fund for these services. Pursuant to a Reimbursement Agreement between the Investment Manager and First Quadrant, First Quadrant reimburses the Investment Manager for the costs the Investment Manager bears in providing such services to the Fund.
U.S. Equity and Global Alternatives are obligated by the Investment Management Agreement to pay an annual management fee to the Investment Manager of 0.35% and 1.70%, respectively, of their average daily net assets. The Investment Manager, in turn, pays First Quadrant 0.35% and 1.40% of the average daily net assets of the Funds for its services as subadvisor. U.S. Equity and Global Alternatives have entered into an Administration and Shareholder Servicing Agreement under which Managers Investment Group LLC serves as the Funds’ administrator (the “Administrator”) and is responsible for all aspects of managing the Funds’ operations, including administration and shareholder services to each Fund, its shareholders, and certain institutions, such as bank trust departments, broker-dealers and registered investment advisers, that advise or act as an intermediary with the Funds’ shareholders. For its services, the Administrator is paid a fee at a rate of 0.25% of the average daily net assets of each Fund.
Prior to July, 1, 2005, the aggregate annual retainer paid to each Independent Trustee was $52,000, plus $2,000 for each meeting attended. Effective, July 1, 2005, the aggregate annual retainer paid to each Independent Trustee is $55,000, plus $4,000 or $2,000 for each regular or special meeting attended, respectively. The Trustees’ fees and expenses are allocated amongst all of the Funds for which Managers Investment Group LLC serves as the Investment Manager (the ‘Managers Funds’) based on the relative net assets of such Funds. The Trust had an additional Independent Trustee who was paid an annual retainer of $30,000 plus $4,000 for each meeting attended. The fee is allocated amongst the Funds in the Trust based on the relative net assets of each Fund. The Independent Chairman of the Trust receives an additional payment of $10,000 per year. (Prior to July 1, 2005, the Independent Chairman was paid an additional $5,000 per year). Effective July 1, 2005, the Chairman of the Audit Committee receives an additional $2,000 per year. The “Trustee fees and expenses” shown in the financial statements represent each Fund’s allocated portion of the total fees and expenses paid by the Managers Funds.
The Trust is distributed by Managers Distributors, Inc. (“MDI”), a wholly-owned subsidiary of Managers Investment Group LLC. Certain Trustees and Officers of the Funds are Officers and/or Directors of the Investment Manager, AMG and/or MDI. Managers Distributors, Inc. (the “Distributor”) serves as the principal underwriter for the Funds. The Distributor is a registered broker-dealer and member of the National Association of Securities Dealers, Inc. (“NASD”). Shares of the Funds will be continuously offered and will be sold by brokers, dealers or other financial intermediaries who have executed selling agreements with the Distributor. The Distributor bears all the expenses of providing services pursuant to an Underwriting Agreement, including the payment of the expenses relating to the distribution of Prospectuses for sales purposes and any advertising or sales literature.
Effective March 1, 2006, Tax-Managed and U.S. Equity adopted a distribution and service plan (the “Plan”) and effective March 30, 2006, Global Alternatives adopted the Plan with respect to the
25
Managers AMG FQ Funds
Notes to Financial Statements (continued)
Class A and Class C shares of each Fund, in accordance with the requirements of Rule 12b-1 under the 1940 Act and the requirements of the applicable rules of the NASD regarding asset-based sales charges.
Pursuant to the Plan, the Funds may compensate MDI for its expenditures in financing any activity primarily intended to result in the sale of each such class of the Fund’s shares and for maintenance and personal service provided to existing shareholders of that class. The Plan authorizes payments to MDI up to 0.25% and 1.00% annually of the Fund’s average daily net assets attributable to Class A and Class C shares, respectively.
The Plan further provides for periodic payments by MDI to brokers, dealers and other financial intermediaries for providing shareholder services and for promotional and other sales related costs. The portion of payments by Class A or Class C shares of U.S. Equity and Global Alternatives for shareholder servicing may not exceed an annual rate of 0.25% of the average daily net asset value of the Fund’s shares of that class owned by clients of such broker, dealer or financial intermediary.
| 3. | Purchases and Sales of Securities |
Purchases and sales of securities, excluding short-term securities, for the fiscal year ended October 31, 2006, were as follows:
| | | | | | | | | | | | |
| | | Long-Term Securities | | U.S. Government Securities |
Fund | | Purchases | | Sales | | Purchases | | Sales |
Tax-Managed | | $ | 86,784,968 | | $ | 68,445,051 | | | N/A | | | N/A |
U.S. Equity | | | 66,588,139 | | | 74,582,099 | | | N/A | | | N/A |
Global Alternatives | | | 3,901,750 | | | 758 | | $ | 3,964,749 | | $ | 2,000,000 |
| 4. | Portfolio Securities Loaned |
The Trust may participate in a securities lending program offered by BNY providing for the lending of equities, corporate bonds and government securities to qualified brokers. Collateral on all securities loaned is accepted in cash and/or government securities. Collateral is maintained at a minimum level of 102% of the market value, plus interest, if applicable, of the investments on loan. Collateral received in the form of cash is invested temporarily in institutional money market funds or other short-term investments by BNY. Securities lending fees include earnings of such temporary cash investments, plus or minus any rebate to a borrower. These earnings (after any rebate) are then divided between BNY, as a fee for its services under the program, and the Fund according to agreed-upon rates.
| 5. | Commitments and contingencies |
In the normal course of business, the Funds may enter into contracts and agreements that contain a variety of representations and warranties, which provide general indemnifications. The maximum exposure to the Fund under these arrangements is unknown, as this would involve future claims that may be made against the Fund that have not yet occurred. However, based on experience, the Fund expects the risks of loss to be remote.
Certain transactions, such as futures and forward transactions, dollar roll agreements, or purchases of when-issued or delayed delivery securities may have a similar effect on a Fund’s net asset value as if the Fund had created a degree of leverage in its portfolio. However, if a Fund enters into such a transaction, the Fund will establish a segregated account with its custodian in which it will maintain cash, U.S. government securities or other liquid securities equal in value to its obligations in respect to such transaction. Securities and other assets held in the segregated account may not be sold while the transaction is outstanding, unless other suitable assets are substituted.
| 7. | Forward Foreign Currency Contracts |
Global Alternatives invests in forward foreign currency exchange contracts to manage currency exposure. These investments may involve greater market risk than the amounts disclosed in the Fund’s financial statements.
A forward foreign currency exchange contract is an agreement between a Fund and another party to buy or sell a currency at a set price at a future date. The market value of the contract will fluctuate with changes in currency exchange rates. The contract is marked-to-market daily, and the change in market value is recorded as an unrealized gain or loss. Gain or loss on the purchase or sale of contracts having the same settlement date, amount and counter party is realized on the date of offset, otherwise gain or loss is realized on settlement date.
Global Alternatives may invest in non-U.S. dollar denominated instruments subject to limitations, and enter into forward foreign currency exchange contracts to facilitate transactions in foreign securities and to protect against a possible loss resulting from an adverse change in the relationship between the U.S. dollar and such foreign currency. Risks may arise upon entering into these contracts from the potential inability of counterparties to meet the terms of their contracts and from unanticipated movements in the value of a foreign currency relative to the U.S. dollar.
26
Managers AMG FQ Funds
Notes to Financial Statements (continued)
Cash pledged to cover margin requirements for open forward positions in Global Alternatives at October 31, 2006 is $400,000. Open forward foreign currency exchange contracts (in U.S. Dollars) at October 31, 2006, were as follows:
| | | | | | | | | | | | | | | | |
Type | | Position | | Settlement
Date | | Receivable
Amount | | | Payable
Amount | | | Unrealized
Gain/Loss | |
Australian Dollar | | Short | | 12/20/06 | | ($ | 8,722,722 | ) | | ($ | 8,970,992 | ) | | ($ | 248,270 | ) |
Canadian Dollar | | Short | | 12/20/06 | | | (13,046,054 | ) | | | (12,976,514 | ) | | | 69,540 | |
Swiss Franc | | Short | | 12/20/06 | | | (5,017,210 | ) | | | (5,009,193 | ) | | | 8,017 | |
Euro-dollar | | Short | | 12/20/06 | | | (6,990,081 | ) | | | (7,038,351 | ) | | | (48,270 | ) |
Pound Sterling | | Short | | 12/20/06 | | | (9,578,198 | ) | | | (9,782,007 | ) | | | (203,809 | ) |
Japanese Yen | | Short | | 12/20/06 | | | (131,124 | ) | | | (131,767 | ) | | | (643 | ) |
New Zealand Dollar | | Short | | 12/20/06 | | | (5,915,155 | ) | | | (6,010,329 | ) | | | (95,174 | ) |
Swedish Krona | | Short | | 12/20/06 | | | (2,903,485 | ) | | | (2,917,797 | ) | | | (14,312 | ) |
Australian Dollar | | Long | | 12/20/06 | | | 4,194,589 | | | | 4,274,368 | | | | 79,779 | |
Swiss Franc | | Long | | 12/20/06 | | | 15,434,730 | | | | 15,471,942 | | | | 37,212 | |
Euro-dollar | | Long | | 12/20/06 | | | 3,096,151 | | | | 3,109,671 | | | | 13,520 | |
Pound Sterling | | Long | | 12/20/06 | | | 293,133 | | | | 299,605 | | | | 6,472 | |
Japanese Yen | | Long | | 12/20/06 | | | 13,729,627 | | | | 13,645,190 | | | | (84,437 | ) |
New Zealand Dollar | | Long | | 12/20/06 | | | 7,835,261 | | | | 8,080,553 | | | | 245,292 | |
Swedish Krona | | Long | | 12/20/06 | | | 2,892,292 | | | | 2,917,797 | | | | 25,505 | |
Total | | | | | | ($ | 4,828,246 | ) | | ($ | 5,037,824 | ) | | ($ | 209,578 | ) |
| 8. | Futures Contracts Held or Issued for Purposes other than Trading |
U.S. Equity uses Equity Index futures contracts to a limited extent, with the objective of maintaining exposure to equity stock markets while maintaining liquidity. Global Alternatives may use futures contracts, including futures contracts on global equity and fixed income securities, interest rate futures contracts, foreign currency futures contracts and future contracts on security indices (including broad-based security indices), for any purpose. The Funds may purchase or sell futures contracts to achieve a desired level of investment, whether to accommodate portfolio turnover or cash flows from capital shares transactions. There are certain risks associated with futures contracts. Prices may not move as expected or a Fund may not be able to close out the contract when it desires to do so, resulting in losses.
On entering into a futures contract, either cash or securities in an amount equal to a certain percentage of the contract value (initial margin) must be deposited with the futures broker. Subsequent payments (variation margin) are made or received each day. The variation margin payments equal the daily changes in the contract value and are recorded as unrealized gains or losses. The Fund recognizes a realized gain or loss when the contract is closed or expires equal to the difference between the value of the contract at the time it was opened and the value at the time it was closed. Futures are valued at their quoted daily settlement prices. The aggregate principal amounts of the contracts are not recorded in the financial statements. Fluctuations in the value of the contracts are recorded in the Statement of Assets and Liabilities for U.S. Equity, in the Statement of Net Assets for Global Alternatives as an asset (liability) and in the Statement of Operations as unrealized appreciation (depreciation) until the contracts are closed, when they are recorded as realized gains (losses) on futures or forward currency contracts. Assets pledged to cover margin requirements for the open futures positions at October 31, 2006 amounted to $35,000 for U.S. Equity and Global Alternatives has market value of securities pledged of $1,988,330. The open futures contracts as of October 31, 2006 are as follows:
FQ U.S. Equity
| | | | | | | | | |
Type | | Number of
Contracts | | Position | | Expiration
Month | | Unrealized Gain/(Loss) |
3-Month S&P 500 | | 2 | | Long | | 12/14/06 | | $ | 28,610 |
27
Managers AMG FQ Funds
Notes to Financial Statements (continued)
FQ Global Alternatives
| | | | | | | | | | | | |
Type | | Currency | | Number of
Contracts | | Position | | Expiration Month | | Unrealized
Gain/(Loss) | |
10-Year Bond | | AUD | | 14 | | Short | | 12/15/06 | | $ | 1,526 | |
SPI 200 Index | | AUD | | 6 | | Long | | 12/21/06 | | | 1,779 | |
10- Year Bond | | CAD | | 117 | | Short | | 12/18/06 | | | (150,787 | ) |
S&P/TSE 60 Index | | CAD | | 37 | | Short | | 12/14/06 | | | (219,223 | ) |
Amsterdam Index | | EUR | | 22 | | Long | | 11/17/06 | | | (14,204 | ) |
Month DAX Index | | EUR | | 20 | | Long | | 12/15/06 | | | 280,354 | |
Month IBEX 35 Index | | EUR | | 31 | | Short | | 11/17/06 | | | (157,300 | ) |
Euro Bond | | EUR | | 28 | | Short | | 12/7/06 | | | (32,611 | ) |
Month S&P/MIB Index | | EUR | | 12 | | Long | | 12/15/06 | | | 140,615 | |
Gilt | | GBP | | 4 | | Long | | 12/27/06 | | | 490 | |
Gilt | | GBP | | 37 | | Short | | 12/27/06 | | | (22,468 | ) |
FTSE 100 Index | | GBP | | 22 | | Short | | 12/15/06 | | | (83,221 | ) |
10- Year Bond | | JPY | | 14 | | Long | | 12/11/06 | | | 50,232 | |
TOPIX Index | | JPY | | 37 | | Long | | 12/7/06 | | | (61,363 | ) |
S&P 500 Index | | USD | | 8 | | Short | | 12/14/06 | | | (143,100 | ) |
U.S. Long Bond | | USD | | 33 | | Long | | 12/19/06 | | | 68,063 | |
| | | | | | | | | | | ($341,218 | ) |
| 9. | New Accounting Pronouncements |
The Financial Accounting Standards Board (“FASB”) has recently issued Interpretation No. 48, “Accounting for Uncertainty in Income Taxes – an Interpretation of FASB Statement No. 109) the “Interpretation”), which applies to all registered investment companies and clarifies the accounting for uncertain tax positions. The Interpretation is effective for financial statements for fiscal years beginning after December 15, 2006. Management has not yet completed their analysis of the Interpretation, and is not currently in a position to estimate the significance, if any, that the impact of adoption will have on the financial statements.
In addition, in September 2006, Statement of Financial Accounting Standards No. 157, Fair Value Measurements (“SFAS 157”), was issued and is effective for fiscal years beginning after November 15, 2007. SFAS 157 defines fair value, establishes a framework for measuring fair value and expands disclosures about fair value measurements. Management is currently evaluating the impact, if any, the adoption of SFAS 157 will have on the Global Alternatives’ financial statements.
Tax Information (unaudited)
The Funds hereby designate the maximum amount allowable of their net taxable income as qualified dividends as provided in the Jobs and Growth Tax Relief Reconciliation Act of 2003. The 2006 Form 1099-DIV you receive for the Fund, will show the tax status of all distributions paid to you during the year.
Pursuant to section 852 of the Internal Revenue Code, U. S. Equity designates $4,413,132 of long-term capital gain for the taxable year ended October 31, 2006.
28
Report of Independent Registered Public Accounting Firm
To the Board of Trustees of Managers AMG Funds and the Shareholders of
FQ Tax-Managed U.S. Equity Fund, FQ U.S. Equity Fund, and FQ Global Alternatives Fund:
In our opinion, the accompanying statements of assets and liabilities for Managers AMG FQ Tax-Managed U.S. Equity Fund (formerly First Quadrant Tax-Managed Equity Fund) and Managers AMG FQ U.S. Equity Fund (formerly Managers Structured Core), including the schedule of portfolio investments, the statement of net assets for Managers AMG FQ Global Alternatives Fund, and the related statements of operations and of changes in net assets and the financial highlights present fairly, in all material respects, the financial positions of Managers AMG FQ Tax-Managed U.S. Equity Fund, Managers AMG FQ U.S. Equity Fund and Managers AMG FQ Global Alternatives Fund (the “Funds”) at October 31, 2006, the results of each of their operations, the changes in each of their net assets and each of their financial highlights for the periods indicated, in conformity with accounting principles generally accepted in the United States of America. These financial statements and financial highlights (hereafter referred to as “financial statements”) are the responsibility of the Funds’ management; our responsibility is to express an opinion on these financial statements based on our audits. We conducted our audits of these financial statements in accordance with the standards of the Public Company Accounting Oversight Board (United States). Those standards require that we plan and perform the audit to obtain reasonable assurance about whether the financial statements are free of material misstatement. An audit includes examining, on a test basis, evidence supporting the amounts and disclosures in the financial statements, assessing the accounting principles used and significant estimates made by management, and evaluating the overall financial statement presentation. We believe that our audits, which included confirmation of securities at October 31, 2006 by correspondence with the custodian and brokers, provide a reasonable basis for our opinion.
PricewaterhouseCoopers LLP
Boston, Massachusetts
December 18, 2006
29
Trustees and Officers
The Trustees and Officers of the Trust, their business addresses, principal occupations for the past five years and dates of birth are listed below. The Trustees provide broad supervision over the affairs of the Trust and the Funds. The Trustees are experienced executives who meet periodically throughout the year to oversee the Funds’ activities, review contractual arrangements with companies that provide services to the Funds, and review the Funds’ performance. Unless otherwise noted, the address of each Trustee or Officer is the address of the Trust: 800 Connecticut Avenue, Norwalk, Connecticut 06854.
There is no stated term of office for Trustees. Trustees serve until their resignation, retirement or removal in accordance with the Trust’s organizational documents and policies adopted by the Board from time to time. The Chairman of the Trustees, President, Treasurer and Secretary of the Trust are elected by the Trustees annually. Other officers hold office at the pleasure of the Trustees.
Independent Trustees
The following Trustees are not “interested persons” of the Trust within the meaning of the 1940 Act:
| | |
Name, Date of Birth, Number
of Funds Overseen in Fund
Complex* | | Principal Occupation(s) During Past 5 Years and Other Directorships Held by Trustee |
Jack W. Aber, 9/9/37 • Trustee since 2000 • Oversees 33 Funds in Fund Complex | | Professor of Finance, Boston University School of Management (1972-Present); Trustee of Appleton Growth Fund (1 portfolio); Trustee of Third Avenue Trust (4 portfolios); Trustee of Third Avenue Variable Trust (1 portfolio) |
| |
William E. Chapman, II, 9/23/41 • Independent Chairman • Trustee since 2000 • Oversees 33 Funds in Fund Complex | | President and Owner, Longboat Retirement Planning Solutions (1998-Present); Hewitt Associates, LLC (part time) (provider of Retirement and Investment Education Seminars); Interim Executive Vice President, QuadraMed Corporation (2001); President, Retirement Plans Group, Kemper Funds (1990-1998); Trustee of Bowdoin College (2002-Present); Trustee of Third Avenue Trust (4 portfolios); Trustee of Third Avenue Variable Trust (1 portfolio) |
| |
Edward J. Kaier, 9/23/45 • Trustee since 2000 • Oversees 33 Funds in Fund Complex | | Attorney at Law and Partner, Hepburn Willcox Hamilton & Putnam, LLP (1977-Present); Trustee of Third Avenue Trust (4 portfolios); Trustee of Third Avenue Variable Trust (1 portfolio) |
| |
Steven J. Paggioli, 4/3/50 • Trustee since 2000 • Oversees 33 Funds in Fund Complex | | Consultant (2001-Present); Formerly Executive Vice President and Director, The Wadsworth Group (1986- 2001); Executive Vice President, Secretary and Director, Investment Company Administration, LLC (1990-2001); Vice President, Secretary and Director, First Fund Distributors, Inc. (1991-2001); Trustee, Professionally Managed Portfolios (22 portfolios); Advisory Board Member, Sustainable Growth Advisors, LP |
| |
Eric Rakowski, 6/5/58 • Trustee since 2000 • Oversees 33 Funds in Fund Complex | | Professor, University of California at Berkeley School of Law (1990-Present); Trustee of Third Avenue Trust (4 portfolios); Trustee of Third Avenue Variable Trust (1 portfolio) |
| |
Thomas R. Schneeweis, 5/10/47 • Trustee since 2000 • Oversees 33 Funds in Fund Complex | | Professor of Finance, University of Massachusetts (1985-Present); Director, CISDM at the University of Massachusetts, (1996-Present); President, Alternative Investment Analytics, LLC, (formerly Schneeweis Partners, LLC) (2001-Present); Director of Research, URSA Capital (subsidiaries: Lyra/Starview Capital LLC), (2004- Present); Partner, Northampton Capital Management, LLC; Partner, TRS Associates (Sole Proprietorship) and member of Massachusetts Finance Institute (wholly owned subsidiary of Alternative Investment Analytics). No other directorships held by Trustee. |
| * | The Fund Complex consists of Managers AMG Funds, The Managers Funds, Managers Trust I and Managers Trust II. |
Interested Trustees
The following Trustees are “interested persons” of the Trust within the meaning of the 1940 Act. Mr. Lebovitz is an interested person of the Trust within the meaning of the 1940 Act by virtue of his positions with Managers Investment Group LLC and Managers Distributors, Inc. Mr. Nutt is an interested person of the Trust within the meaning of the 1940 Act by virtue of his positions with, and interest in securities of, Affiliated Managers Group, Inc.
| | |
Name, Date of Birth, Number
of Funds Overseen in Fund
Complex* | | Principal Occupation(s) During Past 5 Years and Other Directorships Held by Trustee |
Peter M. Lebovitz, 1/18/55 • Trustee since 2002 • President since 2000 • Oversees 33 Funds in Fund Complex | | Managing Partner, Managers Investment Group LLC (2005-Present); President and Chief Executive Officer, The Managers Funds LLC (1999-2004); President, Managers Distributors, Inc. (2000-2006), Vice President, Managers Distributors, Inc. (2006-Present); President, The Managers Funds (1999-Present); President, Managers AMG Funds (1999-Present); President, Managers Trust II (2000- Present); Director of Marketing, The Managers Funds, LP (1994-1999). No other directorships held by trustee. |
| |
William J. Nutt, 3/30/45 • Trustee since 2005 • Oversees 33 Funds in Fund Complex | | Chairman and Founder of Affiliated Managers Group, Inc., (1993-Present); Chief Executive Officer of Affiliated Managers Group, Inc. (1993-2004); Director, Affiliated Managers Group, Inc. (1993-Present); President of Affiliated Managers Group, Inc. (1993-1999); President and Chief Operating Officer, The Boston Company (1989- 1993); Senior Executive Vice President, The Boston Company (1982-1989) |
| * | The Fund Complex consists of Managers AMG Funds, The Managers Funds, Managers Trust I and Managers Trust II. |
Officers
| | |
Name, Date of Birth,
Position(s) Held with Fund
and Length of Time Served | | Principal Occupation(s) During Past 5 Years |
Bruce M. Aronow, 5/31/65 • Chief Financial Officer since 2005 | | Managing Partner, Managers Investment Group LLC (2005-Present); Chief Financial Officer, The Managers Funds, Managers AMG Funds and Managers Trust II (2005-Present); Executive Vice President and Chief Financial Officer and Principal, Rorer Asset Management (1999-2004); Chief Operating Officer, Rorer Asset Management (2001-2004); Staff Accountant, Manager and Partner, PricewaterhouseCoopers LLP (1987-1998) |
| |
Christine C. Carsman, 4/2/52 • Secretary since 2004 | | Vice President and Chief Regulatory Counsel, Affiliated Managers Group, Inc. (2004-Present); Secretary, The Managers Funds, Managers AMG Funds and Managers Trust II (2004-Present); Senior Counsel, Vice President and Director of Operational Risk Management and Compliance, Wellington Management Company, LLP (1995-2004); Deputy General Counsel, The Boston Company, Inc. (1993-1995); Associate General Counsel, The Boston Company Advisors, Inc. (1991-1993); Associate, Sullivan & Worcester LLP (1987-1991) |
| |
Colin J. Dean, 3/6/77 • Assistant Secretary since 2006 | | Associate Counsel, Affiliated Managers Group, Inc. (2005-Present); Assistant Secretary, The Managers Funds, Managers AMG Funds and Managers Trust II (2006- Present); Associate, Dechert LLP (2002-2005). |
| |
Donald S. Rumery, 5/29/58 • Treasurer since 2000 | | Senior Vice-President, Managers Investment Group LLC (2005-Present); Director, Finance and Planning, The Managers Funds LLC, (1994-2004); Treasurer and Chief Financial Officer, Managers Distributors, Inc. (2000- Present); Treasurer, The Managers Funds (1995-Present); Treasurer, Managers AMG Funds (1999-Present); Treasurer, Managers Trust II (2000-Present); Secretary, Managers Trust II (2000-2004); Secretary, Managers AMG Funds (1999- 2004) and Secretary, The Managers Funds (1997-2004) |
30
Annual Renewal of Investment Advisory Agreements
On June 2, 2006, the Board of Trustees, including a majority of the Trustees who are not “interested persons” of the Trust (the “Independent Trustees”), approved the Investment Management Agreement with the Investment Manager for each of the Managers AMG FQ U.S. Equity Fund, Managers AMG FQ Tax-Managed U.S. Equity Fund and Managers AMG FQ Global Alternatives Fund (each, a “Fund”) and the Subadvisory Agreement with respect to each Fund. The Independent Trustees were separately represented by independent counsel in connection with their consideration of the approval of these agreements. In considering the Investment Management and Subadvisory Agreements, the Trustees reviewed a variety of materials relating to each Fund, the Investment Manager and the Subadvisor, including comparative performance, fee and expense information for an appropriate peer group of similar mutual funds for each Fund (each, a “Peer Group”), performance information for the relevant benchmark index for each Fund (each, a “Fund Benchmark”) and other information regarding the nature, extent and quality of services provided by the Investment Manager and the Subadvisor under their respective agreements. The Trustees also took into account performance, fee and expense information regarding the Funds provided to them on a quarterly basis throughout the year. Prior to voting, the Independent Trustees: (a) reviewed the foregoing information with their independent legal counsel and with management; (b) received materials from their independent legal counsel discussing the legal standards applicable to their consideration of the Investment Management and Subadvisory Agreements; and (c) met with their independent legal counsel in private sessions at which no representatives of management were present.
Nature, extent and quality of services.
In considering the nature, extent and quality of the services provided by the Investment Manager, the Trustees reviewed information relating to the Investment Manager’s operations and personnel. Among other things, the Investment Manager provided financial information, biographical information on its supervisory and professional staff and descriptions of its organizational and management structure. The Trustees also took into account information provided periodically throughout the previous year by the Investment Manager relating to the performance of its duties with respect to the Funds and the Trustees’ familiarity with the Investment Manager’s management through Board meetings, discussions and reports. In the course of their deliberations regarding the Investment Management Agreement, the Trustees evaluated, among other things: (a) the quality of the Investment Manager’s oversight of the performance by the Subadvisor of its portfolio management duties; (b) the Investment Manager’s ability to supervise the Funds’ other service providers; and (c) the Investment Manager’s compliance programs. The Trustees also took into account the financial condition of the Investment Manager with respect to its ability to provide the services required under the Investment Management Agreement and the Investment Manager’s undertaking to implement an expense limitation for the certain of the Funds.
The Trustees also reviewed information relating to the Subadvisor’s financial condition, operations and personnel and the investment philosophy, strategies and techniques (its “Investment Strategy”) used in managing each Fund. Among other things, the Trustees reviewed biographical information on portfolio management and other professional staff, information regarding the Subadvisor’s organizational and management structure and the Subadvisor’s brokerage policies and practices. The Trustees considered specific information provided regarding the experience of the individuals at the Subadvisor with portfolio management responsibility for the Funds, including the information set forth in each Fund’s prospectus and statement of additional information. In the course of their deliberations, the Trustees evaluated, among other things: (a) the services rendered by the Subadvisor in the past; (b) the qualifications and experience of the Subadvisor’s personnel; and (c) the Subadvisor’s compliance programs. The Trustees also took into account the financial condition of the Subadvisor with respect to its ability to provide the services required under the Subadvisory Agreements.
Performance.
With respect to the Managers AMG FQ U.S. Equity Fund, among other information related to the Fund’s performance, the Trustees noted that the Fund’s performance for the 1-year, 3-year, 5-year and 10-year periods ended March 31, 2006 was above, above, above and below, respectively, the median performance of its Peer Group and above, above, below and below, respectively, the performance of the Russell 3000 Index, which is the Fund Benchmark. They also noted that the Fund’s current Subadvisor was engaged in 2004. The Trustees concluded that the Fund’s performance has been satisfactory.
With respect to the Managers AMG FQ Tax-Managed U.S. Equity Fund, among other information related to the Fund’s performance, the Trustees noted that the Fund’s performance for the 1-year, 3-year and 5-year periods ended March 31, 2006 was above the median performance of its Peer Group and the performance of the Russell 3000 Index, which is the Fund Benchmark. The Trustees concluded that the Fund’s performance has been satisfactory.
With respect to the Managers AMG FQ Global Alternatives Fund, which commenced operations on March 30, 2006, the Trustees noted that the performance history was too brief to warrant the drawing of any conclusions.
As noted above, the Board considered each Fund’s performance during relevant time periods as compared to the Funds’ Peer Group and noted that the Board reviews on a quarterly basis detailed information about the Funds’ performance results and portfolio composition as well as the Subadvisor’s Investment Strategy. The Board noted the Investment Manager’s expertise and resources in monitoring the performance, investment style and risk adjusted performance of the Subadvisor.
Advisory and Subadvisory Fees and Profitability.
In considering the reasonableness of the advisory fee payable to the Investment Manager and the subadvisory fee payable by the Investment Manager to the Subadvisor, the Trustees reviewed information provided by the Investment Manager setting forth all revenues and other benefits, both direct and indirect, received by the Investment Manager and its affiliates attributable to managing each Fund (other than the Managers AMG FQ Global Alternatives Fund, which commenced operations on March 30, 2006), the cost of providing such services and the resulting profitability to the Investment Manager and its affiliates from these relationships. The Trustees noted that the Investment Manager and the Subadvisor are affiliated and that, in the case of the Managers AMG FQ Tax-Managed U.S. Equity Fund and the Managers AMG FQ Global Alternatives Fund, the Investment Manager pays the Subadvisor a subadvisory fee that is equal to the advisory fee that it receives from the Fund. The Trustees also noted the current asset level of the Funds and the impact on profitability of any future growth of assets of the Funds.
31
Annual Renewal of Investment Advisory Agreements (continued)
In considering the cost of services to be provided by the Investment Manager under the Investment Management Agreement and the profitability to the Investment Manager of its relationship with the Funds, the Trustees noted the current asset level of the Funds and the undertaking by the Investment Manager to maintain expense limitations for the Managers AMG FQ Tax-Managed U.S. Equity Fund and the Managers AMG FQ Global Alternatives Fund. On this basis, the Trustees concluded that the profitability to the Investment Manager and its affiliates is reasonable and that the Investment Manager is not realizing material benefits from economies of scale that would warrant adjustments to the fees for the Funds at this time. Also with respect to economies of scale, the Trustees noted that as the Funds’ assets increase over time, a Fund may realize other economies of scale to the extent the increase in assets is proportionally greater than the increase in certain other expenses.
In considering the reasonableness of the subadvisory fees payable by the Investment Manager to the Subadvisor, the Trustees reviewed information regarding the cost of providing subadvisory services to each of the Funds (other than the Managers AMG FQ Global Alternatives Fund, which commenced operations on March 30, 2006) and the resulting profitability to the Subadvisor from these relationships. In addition, the Trustees noted that the subadvisory fees are paid by the Investment Manager out of its advisory fee. In considering the cost of services to be provided by the Subadvisor under the Subadvisory Agreements and the profitability to the Subadvisor of its relationship with the Funds, the Trustees noted the current asset level of the Funds and the undertaking by the Investment Manager to maintain an expense limitation for the Managers AMG FQ Tax-Managed U.S. Equity Fund and the Managers AMG FQ Global Alternatives Fund.
With respect to the Managers AMG FQ U.S. Equity Fund, the Trustees noted that the Fund’s advisory fee and total expenses (net of applicable expense waivers/reimbursements) as of March 31, 2006 were lower than the average for the Fund’s Peer Group. The Trustees concluded that, in light of the nature, extent and quality of the services provided by the Investment Manager and the Subadvisor, the Fund’s performance, and the considerations noted above with respect to the Subadvisor and the Investment Manager, the Fund’s advisory fees and the profitability of the Subadvisor with respect to the Fund are reasonable.
With respect to the Managers AMG FQ Tax-Managed U.S. Equity Fund, the Trustees noted that the Fund’s advisory fee and total expenses (net of applicable expense waivers/reimbursements) as of March 31, 2006 were higher than the average for the Fund’s Peer Group. The Trustees also noted that the Investment Manager has contractually agreed through March 1, 2007 to limit the Fund’s net annual operating expenses to 0.99% (Class A shares). The Trustees concluded that, in light of the nature, extent and quality of the services provided by the Investment Manager and the Subadvisor, the Fund’s performance, the Investment Manager’s undertaking to limit the total expenses of the Fund and the considerations noted above with respect to the Subadvisor and the Investment Manager, the Fund’s advisory fees and the profitability of the Subadvisor with respect to the Fund are reasonable.
With respect to the Managers AMG FQ Global Alternatives Fund, the Trustees noted that the Fund’s advisory fee and total expenses (net of applicable expense waivers/reimbursements) as of March 31, 2006 were higher than the average for the Fund’s Peer Group. In this regard, the Trustees noted that because of the Investment Strategy of the Fund, the Peer Group contains a small group of funds, some of which pursue an investment strategy considerably different from that of the Fund. The Trustees also noted that the Investment Manager has contractually agreed through March 1, 2007 to limit the Fund’s net annual operating expenses to 2.50% (Class A shares). The Trustees concluded that, in light of the nature, extent and quality of the services to be provided by the Investment Manager and the Subadvisor, the Investment Manager’s undertaking to limit the total expenses of the Fund and the considerations noted above with respect to the Subadvisor and the Investment Manager, the Fund’s advisory fees are reasonable.
* * * *
After consideration of the foregoing, the Trustees also reached the following conclusions regarding the Investment Management and Subadvisory Agreements in addition to the conclusions discussed above: (a) the Investment Manager has demonstrated that it possesses the resources and capability to perform its duties under the Investment Management Agreement; (b) the Subadvisor has the resources to perform its duties under the Subadvisory Agreements and is qualified to manage each Fund’s assets in accordance with its investment objectives and policies; and (c) the Investment Manager and Subadvisor maintain appropriate compliance programs.
Based on all of the above-mentioned factors and their related conclusions, with no single factor or conclusion being determinative and with each Trustee not necessarily attributing the same weight to each factor, the Trustees concluded that approval of the Investment Management and Subadvisory Agreements would be in the interests of each Fund and its shareholders. Accordingly, on June 2, 2006 the Trustees, including a majority of the Independent Trustees, voted to approve the Investment Management and Subadvisory Agreements for each Fund.
32
THIS PAGE INTENTIONALLY LEFT BLANK
THIS PAGE INTENTIONALLY LEFT BLANK
Investment Manager and Administrator
Managers Investment Group LLC
800 Connecticut Avenue
Norwalk, Connecticut 06854
(203) 299-3500 or (800) 835-3879
Distributor
Managers Distributors, Inc.
800 Connecticut Avenue
Norwalk, Connecticut 06854
(203) 299-3500 or (800) 835-3879
Subadvisor
First Quadrant, L.P.
800 E. Colorado Boulevard, Suite 900
Pasadena, CA 91101
Custodian
The Bank of New York
2 Hanson Place
Brooklyn, New York 11217
Legal Counsel
Ropes & Gray LLP
One International Place
Boston, Massachusetts 02110-2624
Transfer Agent
PFPC, Inc.
attn: Managers
P.O. Box 9769
Providence, Rhode Island 02940
(800) 548-4539
Trustees
Jack W. Aber
William E. Chapman, II
Edward J. Kaier
Peter M. Lebovitz
William J. Nutt
Steven J. Paggioli
Eric Rakowski
Thomas R. Schneeweis
For Managers Choice Only
Managers
P.O. Box 61204
King of Prussia, Pennsylvania 19406-0851
(800) 358-7668
MANAGERSAND MANAGERS AMG EQUITY FUNDS
EMERGING MARKETS EQUITY
Rexiter Capital Management Limited
ESSEX GROWTH
ESSEX LARGE CAP GROWTH
(Formerly known as Capital Appreciation)
ESSEX SMALL/MICRO CAP GROWTH
Essex Investment Management Co., LLC
FQ TAX-MANAGED U.S. EQUITY
FQ U.S. EQUITY
First Quadrant, L.P.
INSTITUTIONAL MICRO-CAP
MICRO-CAP
Kern Capital Management LLC
INTERNATIONAL EQUITY
Alliance Bernstein L.P.
Lazard Asset Management, LLC
Wellington Management Company, LLP
MID-CAP
Chicago Equity Partners, LLC
REAL ESTATE SECURITIES
Urdang Securities Management, Inc.
RORER LARGE-CAP
Rorer Asset Management, LLC
SMALL CAP
TIMESSQUARE MID CAP GROWTH
TIMESSQUARE SMALL CAP GROWTH
TimesSquare Capital Management, LLC
SMALL COMPANY
Epoch Investment Partners, Inc.
Kalmar Investment Advisers, Inc.
SPECIAL EQUITY
Donald Smith & Co., Inc.
Kern Capital Management LLC
Skyline Asset Management, L.P.
Smith Asset Management Group, LP
Veredus Asset Management LLC
Westport Asset Management, Inc.
SYSTEMATIC VALUE
Systematic Financial Management, L.P.
VALUE
Armstrong Shaw Associates Inc.
Osprey Partners Investment Mgmt., LLC
MANAGERS BALANCED FUNDS
BALANCED
Chicago Equity Partners, LLC
Loomis, Sayles & Company L.P.
GLOBAL
333 Global Advisers*
Armstrong Shaw Associates Inc.
Alliance Bernstein L.P.
First Quadrant, L.P.
Kern Capital Management LLC
Northstar Capital Management, Inc.
Wellington Management Company, LLP
ALTERNATIVE FUNDS
FQ GLOBAL ALTERNATIVES
First Quadrant, L.P.
MANAGERS
FIXED INCOME FUNDS
BOND (MANAGERS)
FIXED INCOME
GLOBAL BOND
Loomis, Sayles & Company L.P.
BOND (MANAGERS FREMONT)
Pacific Investment Management Co. LLC
CALIFORNIA INTERMEDIATE TAX-FREE
Evergreen Investment Management Co., LLC
HIGH YIELD
J.P. Morgan Investment Management Inc.
INTERMEDIATE DURATION GOVERNMENT
SHORT DURATION GOVERNMENT
Smith Breeden Associates, Inc.
MONEY MARKET (MANAGERS)
JPMorgan Investment Advisors Inc.
MONEY MARKET (FREMONT)
333 Global Advisers*
This report is prepared for the Funds’ shareholders. It is authorized for distribution to prospective investors only when preceded or accompanied by an effective prospectus. To receive a free copy of the prospectus or Statement of Additional Information, which includes additional information about Fund Trustees, please contact us by calling 800.835.3879. Distributed by Managers Distributors, Inc., member NASD.
A description of the policies and procedures each Fund uses to vote its proxies is available: (i) without charge, upon request, by calling 800.835.3879, or (ii) on the Securities and Exchange Commission’s (SEC) Web site at www.sec.gov. For information regarding each Fund’s proxy voting record for the 12-month period ended June 30, call 800.835.3879 or visit the SEC Web site at www.sec.gov.
The Funds file their complete schedule of portfolio holdings with the SEC for the first and third quarters of each fiscal year on Form N-Q. The Funds’ Forms N-Q are available on the SEC’s website at www.sec.gov. The Funds’ Forms N-Q may be reviewed and copied at the SEC’s Public Reference Room in Washington, DC. Information on the operation of the Public Reference Room may be obtained by calling 800.SEC.0330. To review a complete list of the Funds’ portfolio holdings, or to view the most recent quarterly holdings report, semiannual report, or annual report, please visit www.managersinvest.com.
| * | A division of Managers Investment Group LLC |
| | |
| www.managerinvest.com | |  |
Registrant has adopted a Code of Ethics. See attached Exhibit (a)(1).
| Item 3. | AUDIT COMMITTEE FINANCIAL EXPERT |
Registrant’s Board of Trustees has determined that independent Trustees Mr. Jack W. Aber and Mr. Steven J. Paggioli each qualify as the Audit Committee Financial Expert. Mr. Aber and Mr. Paggioli are “independent” as such term is defined in Form N-CSR.
| Item 4. | PRINCIPAL ACCOUNTANT FEES AND SERVICES |
The aggregate fees billed by PwC to the Fund for the Funds’ two most recent fiscal years for professional services rendered for audits of annual financial statements, or services that are normally provided in connection with statutory and regulatory filings or engagements (“Audit Fees”) were as follows:
| | | | | | |
| | | Fiscal 2006 | | Fiscal 2005 |
Managers AMG FQ Tax-Managed U.S. Equity Fund | | $ | 16,506 | | $ | 15,720 |
Managers AMG FQ U.S. Equity Fund (formerly Managers Structured Core Fund) | | $ | 16,380 | | $ | 15,600 |
Managers AMG FQ Global Alternatives Fund 1 | | $ | 28,000 | | | N/A |
| 1 | – Fund commenced operations on March 30, 2006 |
Audit-Related Fees
There were no fees billed by PwC to the Fund in its two recent fiscal years for services rendered for assurance and related services that are reasonably related to the performance of the audit or review of the Fund’s financial statements, but are not reported as Audit Fees (“Audit-Related Fees”).
For the Funds’ two most recent fiscal years, there were no Audit-Related Fees billed by PwC for engagements related directly to the operations and financial reporting of one or more Funds by a Fund Service Provider. A Fund Service Provider is (a) any investment adviser to the Fund (not including any Subadvisor whose role is primarily portfolio management and is subcontracted with or overseen by another investment adviser) or (b) any entity that provides ongoing services to the Fund and is controlling, controlled by or under common control with a Fund investment adviser described in (a).
Tax Fees
The aggregate fees billed by PwC to the Funds for the two most recent fiscal years for professional services rendered for tax compliance, tax advice, and tax planning (“Tax Fees”) were as follows:
| | | | | | |
| | | Fiscal 2006 | | Fiscal 2005 |
Managers AMG FQ Tax-Managed U.S. Equity Fund | | $ | 7,370 | | $ | 6,700 |
Managers AMG FQ U.S. Equity Fund (formerly Managers Structured Core Fund) | | $ | 7,810 | | $ | 7,100 |
Managers AMG FQ Global Alternatives Fund 1 | | $ | 9,500 | | | N/A |
| 1 | – Fund commenced operations on March 30, 2006 |
For the Funds’ two most recent fiscal years, Tax Fees billed by PwC for engagements by Fund Service Providers that related directly to the operations and financial reporting of the Funds were $0 for fiscal 2005 and $0 for fiscal 2004, respectively.
The services for which Tax Fees were charged comprise all services performed by professional staff in PwC’s tax division except those services related to the audit. Typically, this category would include fees for tax compliance, tax planning, and tax advice. Tax compliance, tax advice, and tax planning services include preparation of original and amended tax returns, claims for refund and tax payment-planning services, assistance with tax audits and appeals, tax advice related to mergers and acquisitions and requests for rulings or technical advice from taxing authorities.
All Other Fees
There were no other fees billed by PwC to the Funds for all other non-audit services (“Other Fees”) during the Funds’ two most recent fiscal years. During the same period, there were no Other Fees billed by PwC for engagements by Fund Service Providers that related directly to the operations and financial reporting of the Funds.
According to policies adopted by the Audit Committee, services provided by PwC to the Funds must be pre-approved by the Audit Committee. On an annual basis, the Audit Committee reviews and pre-approves various types of services that PwC may perform for the Funds without specific approval of each engagement, subject to specified budget limitations. As contemplated by the Sarbanes-Oxley Act of 2002 and related SEC rules, the Audit Committee also pre-approves non-audit services provided by PwC to any Fund Service Provider for any engagement that relates directly to the operations and financial reporting of the Funds. Any engagement that is not already pre-approved or that will exceed a pre-approved budget must be submitted to the Audit Committee for pre-approval. The Chairman of the Audit Committee is authorized on behalf of the Board of Trustees and the Audit Committee to approve the engagement of PwC to perform non-audit services subject to certain conditions, including notification to the Audit Committee of such pre-approval not later than the next meeting of the Audit Committee following the date of such pre-approval.
There were no other fees billed by PwC for non-audit services rendered to the Funds and to Fund Service Providers for the Funds’ two most recent fiscal years.
The Audit Committee has considered whether the provision of non-audit services by PwC to Fund Service Providers that were not required to be pre-approved by the Audit Committee is compatible with maintaining PwC’s independence in its audit of the Funds, taking into account representations from PwC, in accordance with Independence Standards Board Standard No. 1, regarding its independence from the Funds and its related entities.
The following table sets forth the non-audit services provided by PwC to the Funds and its service affiliates defined as the Funds’ investment advisor and any entity controlling, controlled by or under common control with Managers Investment Group LLC that provides ongoing services to the Funds (“Control Affiliates”) for the last two fiscal years.
| | | | | | | | | | | | | | | | | | |
| | | Audit-related fees A | | Tax fees A | | All other fees A |
| | | 2005 | | 2004 | | 2005 | | 2004 | | 2005 | | 2004 |
Control Affiliates | | $ | 0 | | $ | 155,040 | | $ | 98,304 | | $ | 260,600 | | $ | 0 | | $ | 0 |
| A | Aggregate amounts may reflect rounding. |
| Item 5. | AUDIT COMMITTEE OF LISTED REGISTRANTS |
Not applicable.
| Item 6. | SCHEDULE OF INVESTMENTS |
Not applicable.
| Item 7. | DISCLOSURE OF PROXY VOTING POLICIES AND PROCEDURES FOR CLOSED-END MANAGEMENT INVESTMENT COMPANIES |
Not applicable.
| Item 8. | PORTFOLIO MANAGERS OF CLOSED-END MANAGEMENT INVESTMENT COMPANIES |
Not applicable.
| Item 9. | PURCHASES OF EQUITY SECURITIES BY CLOSED-END MANAGEMENT INVESTMENT COMPANIES AND AFFILIATED PURCHASERS |
Not applicable.
| Item 10. | SUBMISSION OF MATTERS TO A VOTE OF SECURITY HOLDERS |
Not applicable.
| Item 11. | CONTROLS AND PROCEDURES |
(a) The Registrant’s principal executive and principal financial officers have concluded, based on their evaluation of the registrant’s disclosure controls and procedures as of a date within 90 days of the filing of this report, that the Registrant’s disclosure controls and procedures are reasonably designed to ensure that information required to be disclosed by the Registrant on Form N-CSR is recorded, processed, summarized and reported within the required time periods and that information required to be disclosed by the registrant in the reports that it files or submits on Form N-CSR is accumulated and communicated to the Registrant’s management, including its principal executive and principal financial officers, as appropriate to allow timely decisions regarding required disclosure.
(b) There were no changes in the Registrant’s internal control over financial reporting during the Registrant’s fourth fiscal quarter of the period covered by this report that have materially affected, or are reasonably likely to affect, the internal control over financial reporting.
| | |
| |
| (a)(1) | | Any Code of Ethics or amendments hereto. Filed herewith. |
| |
| (a)(2) | | Certifications pursuant to Rule 30a-2(a) under the Investment Company Act of 1940 - Filed herewith. |
| |
| (a)(3) | | Not applicable. |
| |
| (b) | | Certifications pursuant to Rule 30a-2(b) under the Investment Company Act of 1940 - Filed herewith. |
SIGNATURES
Pursuant to the requirements of the Securities Exchange Act of 1934 and the Investment Company Act of 1940, the registrant has duly caused this report to be signed on its behalf by the undersigned, thereunto duly authorized.
| | |
| MANAGERS TRUST I |
| |
| By: | | /s/ Peter M. Lebovitz |
| | Peter M. Lebovitz, President |
Date: December 29, 2006
Pursuant to the requirements of the Securities Exchange Act of 1934 and the Investment Company Act of 1940, this report has been signed below by the following persons on behalf of the registrant and in the capacities and on the dates indicated.
| | |
| |
| By: | | /s/ Peter M. Lebovitz |
| | Peter M. Lebovitz, President |
Date: December 29, 2006
| | |
| |
| By: | | /s/ Bruce M. Aronow |
| | Bruce M. Aronow, Chief Financial Officer |
Date: December 29, 2006