UNITED STATES
SECURITIES AND EXCHANGE COMMISSION
Washington, D.C. 20549
FORM N-CSR
CERTIFIED SHAREHOLDER REPORT OF
REGISTERED MANAGEMENT INVESTMENT COMPANIES
Investment Company Act file number: 811-06520
MANAGERS TRUST I
(Exact name of registrant as specified in charter)
| | |
| 800 Connecticut Avenue, Norwalk, Connecticut | | 06854 |
| (Address of principal executive offices) | | (Zip code) |
Managers Investment Group LLC
800 Connecticut Avenue, Norwalk, Connecticut 06854
(Name and address of agent for service)
Registrant’s telephone number, including area code: (203) 299-3500
| | |
| Date of fiscal year end: | | OCTOBER 31 |
| |
| Date of reporting period: | | NOVEMBER 1, 2004 - OCTOBER 31, 2005 |
| | | (Annual Shareholder Report) |
| Item 1. | Reports to Shareholders |
ANNUAL REPORT
Managers Funds
October 31, 2005
| • | | Managers Fremont Micro-Cap Fund |

MANAGERS FREMONT MICRO-CAP FUND
(formerly Fremont U.S. Micro-Cap Fund)
Annual Report
October 31, 2005
TABLE OF CONTENTS
Nothing contained herein is to be considered an offer, sale or solicitation of an offer to buy shares of The Managers Funds. Such offering is made only by Prospectus, which includes details as to offering price and other material information.
Letter to Shareholders
Dear Fellow Shareholder:
Over the past 12 months the markets have been beset with a number of difficult and unpredictable challenges, including a massive tsunami in Southeast Asia; continuing strife in the Middle East; numerous terrorist incidents; multiple hurricanes in the Gulf of Mexico; and a significant rise in energy prices. We are fortunate that the stock and bond markets have continued to perform so well under these circumstances.
These events serve to remind us that no one can predict the events that are going to shape the markets in coming months. This reinforces our belief that to invest successfully in an uncertain world you have to diversify your investments and be patient.
Most people think of diversification as holding different types of stocks and bonds, but we believe that there is another type of diversification that receives too little notice, and that is diversification by investment manager and holdings. Simply put, no single approach is going to succeed in every kind of market—some growth stock managers will be successful in a rising market, and some will be more successful in a stagnant market. This can be an issue with some investment firms that adhere to only one method of looking at the markets.
That is a major benefit that we bring you at Managers Funds —since we hire subadvisors (outside investment managers) to run our portfolios, we offer you a wide selection of very different investment styles to choose from, sometimes within the same asset class. Invest in multiple Managers Funds, and you can get managers with very different approaches and holdings, helping you reduce the risks created by changing economic conditions and natural and man-made events, such as those of the past 12 months.
We also believe that once you have made your manager selection, you must be patient. On the home page of our Web site at www.managersinvest.com, you will find a short article entitled “Stay Invested for the Long Term” that highlights how important it is to consistently stay in the market rather than trying to time the market. We think the implication is clear: to be successful in the market over the long term, select a wide variety of investments giving you good diversification, invest regularly and stick with your investment plan no matter what events dominate the news.
We invite you to visit our Web site on an ongoing basis to stay in tune with your Managers Funds holdings. The Web site provides detailed profiles of our subadvisors and their investment styles, as well as quarterly commentary on each Fund. If you have any questions, please do call us at 800.835.3879. Thank you for investing with Managers Funds.
| | | | |
Sincerely, | | | | |
| | |
 | | | |  |
| | |
| Peter M. Lebovitz | | | | Thomas G. Hoffman, CFA |
| President | | | | Chief Investment Officer |
| Managers Funds | | | | Managers Investment Group LLC |
1
About Your Fund’s Expenses
As a shareholder of the Fund, you may incur two types of costs: (1) transaction costs, which may include sales charges (loads) on purchase payments; redemption fees; and exchange fees; and (2) ongoing costs, including management fees; distribution (12b-1) fees; and other Fund expenses. This Fund incurs only ongoing costs. This example is intended to help you understand your ongoing costs (in dollars) of investing in the Fund and to compare these costs with the ongoing costs of investing in other mutual funds. The example is based on an investment of $1,000 invested at the beginning of the period and held for the entire period as indicated below.
Actual Expenses
The first line of the table below provides information about the actual account values and actual expenses. You may use the information in this line, together with the amount you invested, to estimate the expenses that you paid over the period. Simply divide your account value by $1,000 (for example, an $8,600 account value divided by $1,000 = 8.6), then multiply the result by the number in the first line under the heading entitled “Expenses Paid During Period” to estimate the expenses you paid on your account during this period.
Hypothetical Example for Comparison Purposes
The second line of the table below provides information about hypothetical account values and hypothetical expenses based on the Fund’s actual expense ratio and an assumed annual rate of return of 5% before expenses, which is not the Fund’s actual return. The hypothetical account values and expenses may not be used to estimate the actual ending account balance or expenses you paid for the period. You may use this information to compare the ongoing costs of investing in the Fund and other funds by comparing this 5% hypothetical example with the 5% hypothetical examples that appear in the shareholder reports of other funds.
Please note that the expenses shown in the table are meant to highlight your ongoing costs only and do not reflect any transactional costs, such as sales charges (loads), redemption fees, or exchange fees. Therefore, the second line of the table is useful in comparing ongoing costs only, and will not help you determine the relative total costs of owning different funds.
| | | | | | | | | |
Six Months Ended October 31, 2005
| | Beginning
Amount
Value
4/30/2005
| | Ending
Amount
Value
10/31/2005
| | Expenses
Paid
During
the Period*
|
Managers Fermont Micro-Cap Fund | | | | | | | | | |
Based on Actual Fund Return | | $ | 1,000 | | $ | 1,087 | | $ | 8.15 |
Based on Hypothetical 5% Annual Return | | $ | 1,000 | | $ | 1,017 | | $ | 7.88 |
| * | Expenses are equal to the Fund’s annualized expense ratio multiplied by the average account value over the period, multiplied by the number of days in the most recent fiscal half-year (184), then divided by 365. |
2
Managers Fremont Micro-Cap Fund
Portfolio Manager Comments
The Managers Fremont Micro-Cap Fund primarily invests in the stocks of U.S. micro-capitalization companies. These companies have market capitalizations that, at the time of initial purchase, place them among the smallest 5% of companies listed on U.S. stock markets. Normally, the Fund will invest at least 80% of its assets in U.S. micro-cap stocks. The Russell 2000 Growth Index is the benchmark for the Fund.
The Portfolio Manager
Kern Capital Management LLC
Kern Capital Management LLC (“KCM”) is the subadvisor for the Managers Fremont Micro-Cap Fund, was founded in 1997 by Robert (Bob) E. Kern, Jr. and David G. Kern. KCM is an employee owned investment advisory firm dedicated to researching and investing in innovative micro-cap and small-cap growth companies and its investment process is designed to capitalize on this inefficiency.
KCM believes the U.S. smaller company stock universe provides the opportunity to invest in innovative companies with exceptional growth prospects. With minimal research coverage by brokerage firms and low institutional ownership, KCM believes small and micro-cap stocks represent the least efficient sector of the market.
KCM’s fundamental research is dedicated to uncovering innovative small companies early in their growth cycle while they are still relatively undiscovered. With a huge universe of investment opportunity, KCM’s investment process focuses on the most innovative sectors in the U.S. economy (technology, healthcare, services and consumer sectors). Research specialization by economic sector provides the depth of knowledge necessary to make high quality investment decisions and minimize fundamental investment mistakes.
KCM builds portfolios one company at a time with investment research focused on the most innovative sectors of the economy (technology, health care, services and consumer). The team’s hands-on approach to fundamental investment research and financial analysis seeks to answer three basic questions to determine an investment’s attractiveness.
| | • | | How attractive is the business? Companies that are pioneering new markets or revolutionizing existing ones can often sustain rapid growth as they establish leading positions in their targeted markets. |
| | • | | How strong is the management? Successful companies require management capable of capitalizing on attractive growth opportunities. Management’s vision and ability to execute the business plan represent key elements in determining how successful a company will be. |
| | • | | How much is the company worth? The team’s process is valuation sensitive. Depending on the economic sector, different criteria are used to determine a company’s enterprise value, which determines if KCM would buy the entire company at the current market value of its equity. |
Given that KCM is focused on investing in innovative growth companies, the first two questions are answered before determining if the valuation is attractive. In fact, the answers to the first two questions will help determine the appropriate valuation for the company.
The ideal company exhibits many of the following traits:
| | • | | Leading market position in a rapidly growing market with high barriers to entry |
3
Managers Fremont Micro-Cap Fund
Portfolio Manager Comments (continued)
| | • | | Entrepreneurial management team with experience managing a growth business |
| | • | | Focused business plan with tight internal controls |
Portfolio management:
| | • | | Invests in between 70 and 90 companies which have market capitalizations that, at the time of initial purchase, place them among the smallest 5% of companies listed in the U.S. stock markets |
| | • | | Builds portfolios from the bottom up and seeks to identify companies early in their growth cycle |
| | • | | Utilizes a team approach to cover approximately 600 stocks through an extensive network of contact and other information sources: |
| | • | | Brokerage firm and industry analysts |
| | • | | Corporate management contacts |
| | • | | Trade shows and trade journals |
| | • | | Focuses on business sectors where KCM believes the level of innovation is greatest, such as technology, health care, services and consumer |
| | • | | Uses fundamental analysis to identify small, relatively unknown companies that exhibit the potential to become much larger and more successful |
| | • | | Meets with corporate management to discuss business plans and strategies |
The investment team will make a sell decision when:
| | • | | An investment’s growth prospects deteriorate |
| | • | | Investments achieve excessive valuation relative to the growth opportunities and/or addressable markets. |
| | • | | There is a negative change in fundamental confidence and/or investment time horizon |
The Year in Review
The fiscal year ended October 31, 2005 was up and down. Fiscal year 2005 started just as the prior year ended with positive double digit performance across all Russell 2000 Growth sectors. Sentiment changed as 2005 began and for the next four months every Russell 2000 Growth index sector declined except for energy. A summer rally beginning in May lasted to the end of July and produced strong results across all sectors with especially strong performance from the energy sector. The month of August was down a little and September was flat, which was somewhat surprising given the devastation and far reaching impact of Hurricane Katrina. October, on the other hand, proved very challenging as the concern over an already fragile energy infrastructure in the Gulf Coast region became threatened again by Hurricane Rita. In total, fiscal year 2005 produced 6 months of positive performance and 6 months of negative performance.
For the year as a whole, the Managers Fremont Micro-Cap Fund returned 6.42% while the Russell 2000 Growth Index returned 10.91%. An attribution analysis of the fiscal year reveals positive performance from every sector within the Russell 2000 Growth Index. With an emphasis on innovation, the Fund focuses on the information technology (IT), healthcare and consumer discretionary sectors. In each of these sectors, the Fund beat its benchmark.
4
Managers Fremont Micro-Cap Fund
Portfolio Manager Comments (continued)
However, two primary factors lead to the Fund’s underperformance relative to the Russell 2000 Growth Index: the strong performance of the energy sector and the Fund’s overweight position in the information technology sector.
First, and representing almost the entire performance differential between the Fund and the Benchmark, was the very strong performance of the energy sector. There is a lack of innovation in the energy field and the 68% average return for the energy stocks within the Russell 2000 Growth Index was driven by soaring commodity (oil and natural gas) prices. Second, the IT sector of the Russell 2000 Growth Index produced a return of just over 1% for the last twelve months, which was significantly less than the overall benchmark return and last among all benchmark sectors. Investment in key innovative areas like advanced televisions (Trident Microsystems) and internet filtering/security management software (Websense) helped the Fund outperform the benchmark IT sector performance but the overweight position the Fund had in this sector detracted from overall performance. Among individual holdings, delays in government funding for key biometric initiatives pressured the stock of Identix while disappointing quarterly results and a reorganization of management led to the poor performance of Greenfield Online.
Investments in key innovators within the healthcare sector performed strongly during the last year. Most notably, Intuitive Surgical’s robotic surgery platform has gained significant market share in radical prostatectomy surgeries and has the potential to become an important tool to improve many other surgeries. Additionally, 3D Visualization software, like that developed by Vital Images, is becoming a standard tool for radiologists for viewing CT and MRI images.
The traditional retailers, while not always known for high levels of innovation, can produce significant winners as was the case with Gymboree this past year. As one of the Fund’s largest investments, Gymboree has recovered from its merchandising problems of a year ago and is now beating analyst expectations through higher revenue growth and margin expansion and other investors have noticed.
Looking Forward
The performance of the energy sector has been off the charts - not just in 2005 but for the last three years. Additionally, small-cap value stocks have performed significantly better than small-cap growth stocks over the last five years. During times that are more challenging for the Fund’s investment focus on innovation, it is important to focus on the highest confidence investments and position the Fund for when investor confidence returns. The lagging performance and negative psychology of the technology sector has hampered Fund returns but, importantly, has also provided attractive purchase opportunities in companies well positioned to capitalize on future growth opportunities. The investment team at KCM strongly believes that innovation is a critical element for long-term success and the beginning of improved performance of small-cap growth stocks vs. value stocks may have already begun.
Any sectors, industries or securities discussed should not be perceived as investment recommendations. The views expressed represent the opinions of Managers Investment Group and are not intended as a forecast or guarantee of future results. Any securities discussed may no longer be held in an account’s portfolio. It should not be assumed that any of the securities transactions discussed were or will prove to be profitable, or that the investment recommendations we make in the future will be profitable.
5
Managers Fremont Micro-Cap Fund
Portfolio Manager Comments (continued)
Cumulative Total Return Performance
Managers Fremont Micro-Cap Fund’s cumulative total return is based on the daily change in net asset value (NAV), and assumes that all distributions were reinvested. The Russell 2000 Growth Index measures the performance of those Russell 2000 companies with higher price-to-book ratios and higher forecasted growth values. Unlike the Fund, the Russell 2000 Growth Index is unmanaged, is not available for investment, and does not incur expenses. This chart compares a hypothetical $10,000 investment made in the Managers Fremont Micro-Cap Fund on 10/31/95 to a $10,000 investment made in the Russell 2000 Growth Index for the same time period. The graph and table do not reflect the deduction of taxes that a shareholder would pay on a Fund distribution or redemption of shares. Past performance is not indicative of future results. Performance for periods longer than one year is annualized. Figures include reinvestment of capital gains and dividends. The listed returns for the Fund are net of expenses and the returns for the indices exclude expenses. Total returns for the Fund would have been lower had certain expenses not been reduced.
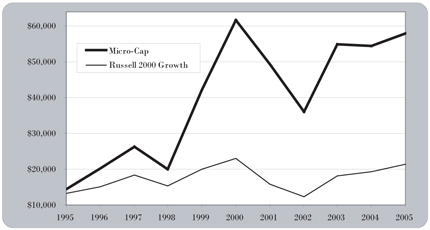
The table below shows the average annualized total returns for the Managers Fremont Micro-Cap Fund and the Russell 2000 Growth Index since inception through October 31, 2005.
| | | | | | | | | | | | |
Average Annual Total Returns:
| | 1 Year
| | | 5 Years
| | | 10 Years
| | | Since Inception*
| |
Managers Fremont Micro-Cap | | 6.42 | % | | (1.24 | )% | | 14.96 | % | | 16.76 | % |
Russell 2000 Growth Index | | 10.91 | % | | (1.62 | )% | | 4.81 | % | | 6.90 | % |
| * | Commencement of operations was June 30, 1994. |
The performance data shown represents past performance. Past performance is not a guarantee of future results. Current performance may be lower or higher than the performance data quoted. The investment return and the principal value of an investment will fluctuate so that an investor’s shares, when redeemed, may be worth more or less than their original cost. For performance information through the most recent month end please call (800) 835-3879 or visit our Web site at www.managersinvest.com.
6
Managers Fremont Micro-Cap Fund
Portfolio Manager Comments (continued)
The returns shown were achieved during a period of generally rising market values, especially in the technology sector. In addition, a portion of the Fund’s performance can be attributed to investments in Initial Public Offerings (IPOs). Investors should not expect that such favorable returns can be consistently achieved.
The Fund is subject to the special risks associated with investments in micro-cap companies such as relatively short earnings history, conditions, less publicly available corporate information, and a reliance on a limited number of products.
7
Managers Fremont Micro-Cap Fund
Fund Snapshots
October 31, 2005
Portfolio Breakdown
| | | | | | |
Major Sectors
| | Percentage of
Net Assets
| | | Percentage of
Russell 2000
Growth Index
| |
Information Technology | | 48.5 | % | | 24.8 | % |
Health Care | | 17.5 | | | 20.6 | |
Consumer Discretionary | | 11.0 | | | 15.5 | |
Industrials | | 10.3 | | | 14.6 | |
Financials | | 1.8 | | | 10.1 | |
Materials | | 1.5 | | | 3.3 | |
Energy | | 0.0 | | | 7.9 | |
Consumer Staples | | 0.0 | | | 2.1 | |
Telecommunication Services | | 0.0 | | | 1.0 | |
Utilities | | 0.0 | | | 0.1 | |
Other Assets and Liabilities | | 9.4 | | | 0.0 | |
| | |
|
| |
|
|
| | | 100.0 | % | | 100.0 | % |
| | |
|
| |
|
|
Any sectors, industries or securities discussed should not be perceived as investment recommendations.
Top Ten Holdings
| | | |
Security Name
| | Percentage of
Net Assets
| |
ATMI, Inc. * | | 4.9 | % |
Gymboree Corp. * | | 3.7 | |
Regeneration Technologies, Inc. * | | 3.4 | |
Integral Systems, Inc. * | | 3.3 | |
Anaren Microwave, Inc. * | | 2.8 | |
NeoPharm, Inc. * | | 2.8 | |
Identix, Inc. | | 2.6 | |
Terayon Communication Systems, Inc. * | | 2.4 | |
AudioCodes, Ltd. | | 2.2 | |
Equinix, Inc. | | 2.1 | |
| | |
|
|
Top Ten as a Group | | 30.2 | % |
| | |
|
|
| * | Top Ten Holding at April 30, 2005 |
Mention of a specific security should not be considered a recommendation to buy or solicitation to sell the security.
8
Managers Fremont Micro-Cap Fund
Schedule of Portfolio Investments
October 31, 2005
| | | | | | |
| | | Shares
| | | Value
|
Common Stocks - 90.6% | | | | | | |
Consumer Discretionary - 11.0% | | | | | | |
Alloy, Inc. * | | 1,507,200 | 1 | | $ | 6,933,120 |
Celebrate Express, Inc.* | | 264,500 | | | | 3,602,490 |
Century Casinos, Inc.* | | 442,900 | | | | 3,330,608 |
Gymboree Corp.* | | 841,900 | 1 | | | 14,901,630 |
Harris Interactive, Inc.* | | 752,700 | | | | 3,138,759 |
IMAX Corp.* | | 475,600 | 1 | | | 4,313,692 |
IMPCO Technologies, Inc.* | | 157,300 | 1 | | | 816,386 |
Lakes Gaming, Inc.* | | 98,600 | | | | 924,129 |
Nevada Gold & Casinos, Inc.* | | 165,300 | 1 | | | 1,727,385 |
Parker Vision, Inc. * | | 153,800 | 1 | | | 1,121,202 |
Rocky Shoes & Boots, Inc.* | | 123,800 | | | | 3,060,336 |
Total Consumer Discretionary | | | | | | 43,869,737 |
Financials - 1.8% | | | | | | |
Cash Systems, Inc. * 4 | | 1,212,600 | 1 | | | 7,045,206 |
Health Care - 17.5% | | | | | | |
AngioDynamics, Inc.* | | 249,400 | | | | 5,449,390 |
Atherogenics, Inc.* | | 133,800 | 1 | | | 2,007,000 |
Cepheid, Inc.* | | 289,600 | 1 | | | 1,836,064 |
Conceptus, Inc.* | | 618,500 | 1 | | | 6,351,995 |
DexCom, Inc.* | | 239,900 | 1 | | | 3,121,099 |
Eclipsys Corp.* | | 141,200 | 1 | | | 2,259,200 |
Harvard Bioscience, Inc. * | | 525,400 | | | | 1,686,534 |
ICON PLC.* | | 114,700 | | | | 4,614,381 |
Intuitive Surgical, Inc.* | | 49,200 | 1 | | | 4,365,516 |
NeoPharm, Inc.* | | 1,171,520 | 1 | | | 11,258,307 |
NxStage Medical, Inc.* | | 144,000 | | | | 1,634,400 |
OraSure Technologies, Inc.* | | 443,100 | | | | 4,878,531 |
Regeneration Technologies, Inc.* 4 | | 1,861,400 | 1 | | | 13,457,922 |
Sonosite, Inc. * | | 40,300 | | | | 1,184,417 |
Vital Images, Inc.* | | 230,700 | 1 | | | 5,363,775 |
Total Health Care | | | | | | 69,468,531 |
Industrials - 10.3% | | | | | | |
Aaon, Inc.* | | 180,600 | | | | 3,106,320 |
Allied Defense Group, Inc., The* | | 127,500 | | | | 2,843,250 |
Color Kinetics, Inc.* | | 365,200 | 1 | | | 5,565,648 |
CoStar Group, Inc.* | | 137,100 | 1 | | | 6,573,945 |
Gevity HR, Inc. | | 98,900 | 1 | | | 2,545,686 |
Insituform Technologies, Inc.* | | 379,400 | 1 | | | 6,814,024 |
KVH Industries, Inc.* 4 | | 769,300 | 1 | | | 7,108,332 |
Nuco2, Inc.* | | 44,800 | 1 | | | 1,025,920 |
TVI Corp.* | | 1,441,300 | | | | 5,361,636 |
Total Industrials | | | | | | 40,944,761 |
The accompanying notes are an integral part of these financial statements.
9
Managers Fremont Micro-Cap Fund
Schedule of Portfolio Investments (continued)
| | | | | | |
| | | Shares
| | | Value
|
Information Technology - 48.5% | | | | | | |
Actel Corp.* | | 424,700 | 1 | | $ | 5,924,565 |
Airspan Networks, Inc.* | | 349,700 | 1 | | | 1,741,506 |
Aladdin Knowledge Systems, Ltd.* | | 297,100 | 1 | | | 5,225,989 |
Anaren Microwave, Inc.* | | 800,400 | | | | 11,325,660 |
ASM International NV* | | 221,700 | 1 | | | 2,944,176 |
ATMI, Inc.* | | 717,900 | 1 | | | 19,605,849 |
AudioCodes, Ltd.* | | 787,800 | 1 | | | 8,878,506 |
Cascade Microtech, Inc.* | | 163,500 | | | | 1,896,600 |
Centra Software, Inc.* | | 547,700 | | | | 985,860 |
Ceragon Networks, Ltd. * 4 | | 1,952,600 | | | | 7,556,562 |
Comtech Group, Inc.* | | 513,400 | | | | 3,203,616 |
CyberOptics Corp.* | | 263,400 | | | | 3,487,416 |
Equinix, Inc.* | | 227,800 | 1 | | | 8,403,542 |
Exfo Electro-Optical Engineering, Inc.* 4 | | 1,574,500 | 1 | | | 6,880,565 |
Greenfield Online, Inc.* | | 336,200 | 1 | | | 1,687,724 |
Identix, Inc. * | | 2,330,268 | 1 | | | 10,323,089 |
Integral Systems, Inc. 4 | | 586,800 | | | | 12,933,072 |
Intevac, Inc.* | | 311,700 | 1 | | | 2,848,938 |
Kanbay International, Inc. * | | 185,900 | 1 | | | 2,710,422 |
MRO Software, Inc.* | | 372,400 | 1 | | | 6,099,912 |
NCI, Inc., Class A* | | 182,800 | | | | 2,211,880 |
Netscout Systems, Inc.* | | 458,900 | | | | 2,588,196 |
OPNET Technologies, Inc.* | | 648,500 | | | | 5,402,005 |
Optibase Ltd.* 4 | | 767,100 | | | | 3,789,474 |
Pervasive Software, Inc.* | | 556,500 | | | | 2,337,300 |
PLX Technology, Inc.* | | 259,900 | 1 | | | 1,946,651 |
Rae Systems, Inc.* | | 659,000 | 1 | | | 2,319,680 |
RightNow Technologies, Inc. * | | 300,400 | 1 | | | 4,572,088 |
RIT Technologies Ltd.* 4 | | 960,800 | 1 | | | 2,690,240 |
Silicon Motion Technology Corp., ADR* | | 254,300 | | | | 3,656,834 |
Sirenza Microdevices, Inc.* | | 1,239,600 | | | | 3,966,720 |
Stratasys, Inc.* | | 172,100 | 1 | | | 4,082,212 |
TechTeam Global, Inc. * 4 | | 510,900 | | | | 4,761,588 |
Terayon Communication Systems, Inc.* | | 3,612,500 | | | | 9,717,625 |
Terremark Worldwide, Inc. * | | 855,390 | 1 | | | 2,386,538 |
Trident Microsystems, Inc. * | | 92,700 | 1 | | | 2,805,102 |
Witness Systems, Inc.* | | 282,000 | 1 | | | 5,527,200 |
Woodhead Industries, Inc. | | 274,700 | | | | 3,458,473 |
Total Information Technology | | | | | | 192,883,375 |
Materials - 1.5% | | | | | | |
Calgon Carbon Corp. | | 806,900 | 1 | | | 4,397,605 |
Northern Technologies International Corp. 4 | | 330,450 | | | | 1,777,821 |
Total Materials | | | | | | 6,175,426 |
Total Common Stocks (cost $367,507,507) | | | | | | 360,387,036 |
The accompanying notes are an integral part of these financial statements.
10
Managers Fremont Micro-Cap Fund
Schedule of Portfolio Investments (continued)
| | | | | | |
| | | Shares
| | Value
| |
Other Investment Companies - 33.3%2 | | | | | | |
Bank of New York Institutional Cash Reserves Fund, 3.97%3 | | 91,686,105 | | $ | 91,686,105 | |
JPMorgan Prime Money Market Fund, Institutional Class Shares, 3.73% | | 25,526,414 | | | 25,526,414 | |
Vanguard Prime Money Market Fund, Institutional Class Shares, 3.79% | | 15,234,479 | | | 15,234,479 | |
Total Other Investment Companies (cost $132,446,998) | | | | | 132,446,998 | |
Total Investments - 123.9% (cost $499,954,505) | | | | | 492,834,034 | |
Other Assets, less Liabilities - (23.9)% | | | | | (95,205,267 | ) |
Net Assets - 100.0% | | | | $ | 397,628,767 | |
| Note: | Based on the cost of investments of $503,890,654 for Federal income tax purposes at October 31, 2005, the aggregate gross unrealized appreciation and depreciation were $37,436,926 and $48,493,546, respectively, resulting in net unrealized depreciation of investments of $11,056,620. |
| * | Non-income-producing securities. |
| 1 | Some or all of these shares, amounting to a market value of $90,477,773, or 22.8% of net assets, were out on loan to various brokers. |
| 2 | Yield shown for an investment company represents the October 31, 2005, seven-day average yield, which refers to the sum of the previous seven days’ dividends paid, expressed as an annual percentage. |
| 3 | Collateral received from brokers for securities lending was invested in this short-term investment. |
| 4 | Affiliated Company- See Note 7 in the Notes to Financial Statements. |
The accompanying notes are an integral part of these financial statements.
11
Managers Fremont Micro-Cap Fund
Statement of Assets and Liabilities
October 31, 2005
| | | | |
Assets: | | | | |
Investments at value (including securities on loan valued at $90,477,773) | | $ | 492,834,034 | |
Receivable for investments sold | | | 1,829,977 | |
Receivable for Fund shares sold | | | 102,168 | |
Dividends and other receivables | | | 176,417 | |
Prepaid expenses | | | 7,850 | |
| | |
|
|
|
Total assets | | | 494,950,446 | |
| | |
|
|
|
Liabilities: | | | | |
Payable for Fund shares repurchased | | | 884,912 | |
Payable upon return of securities loaned | | | 91,686,105 | |
Payable for investments purchased | | | 3,935,035 | |
Accrued expenses: | | | | |
Investment advisory and management fees | | | 346,459 | |
Administrative fees | | | 86,615 | |
Other | | | 382,553 | |
| | |
|
|
|
Total liabilities | | | 97,321,679 | |
| | |
|
|
|
Net Assets | | | $397,628,767 | |
| | |
|
|
|
Shares Outstanding | | | 13,412,010 | |
| | |
|
|
|
Net asset value, offering and redemption price per share | | $ | 29.65 | |
| | |
|
|
|
Net Assets Represent: | | | | |
Paid-in capital | | $ | 443,217,865 | |
Undistributed net investment income | | | — | |
Accumulated net realized loss from investments | | | (38,468,627 | ) |
Net unrealized depreciation of investments | | | (7,120,471 | ) |
| | |
|
|
|
Net Assets | | | $397,628,767 | |
| | |
|
|
|
Investments at cost | | $ | 499,954,505 | |
The accompanying notes are an integral part of these financial statements.
12
Managers Fremont Micro-Cap Fund
Statement of Operations
For the fiscal year ended October 31, 2005
| | | | |
Investment Income: | | | | |
Dividend income | | $ | 1,528,211 | |
Interest income | | | 213,165 | |
Securities lending fees | | | 341,377 | |
| | |
|
|
|
Total investment income | | | 2,082,753 | |
| | |
|
|
|
Expenses: | | | | |
Investment management fees | | | 5,284,466 | |
Administrative fees | | | 886,904 | |
Transfer agent | | | 681,889 | |
Custodian | | | 109,039 | |
Reports to shareholders | | | 103,854 | |
Professional fees | | | 95,938 | |
Trustees fees and expenses | | | 25,511 | |
Miscellaneous | | | 30,744 | |
| | |
|
|
|
Total expenses before offsets | | | 7,218,345 | |
| | |
|
|
|
Expense reductions | | | (199 | ) |
| | |
|
|
|
Net expenses | | | 7,218,146 | |
| | |
|
|
|
Net investment loss | | | (5,135,393 | ) |
| | |
|
|
|
Net Realized and Unrealized Gain (Loss): | | | | |
Net realized gain on investment transactions | | | 65,151,923 | |
Net unrealized depreciation of investments | | | (25,791,471 | ) |
| | |
|
|
|
Net realized and unrealized gain | | | 39,360,452 | |
| | |
|
|
|
Net Increase in Net Assets Resulting from Operations | | $ | 34,225,059 | |
| | |
|
|
|
The accompanying notes are an integral part of these financial statements.
13
Managers Fremont Micro-Cap Fund
Statement of Changes in Net Assets
For the fiscal year ended October 31,
| | | | | | | | |
| | | 2005
| | | 2004
| |
Increase (Decrease) in Net Assets | | | | | | | | |
From Operations: | | | | | | | | |
Net investment loss | | $ | (5,135,393 | ) | | $ | (7,827,000 | ) |
Net realized gain on investments | | | 65,151,923 | | | | 98,930,000 | |
Net unrealized depreciation of investments | | | (25,791,471 | ) | | | (96,203,000 | ) |
| | |
|
|
| |
|
|
|
Net increase (decrease) in net assets resulting from operations | | | 34,225,059 | | | | (5,100,000 | ) |
| | |
|
|
| |
|
|
|
From Capital Share Transactions: | | | | | | | | |
Proceeds from sale of shares | | | 42,000,900 | | | | 87,508,000 | |
Cost of shares repurchased | | | (169,124,192 | ) | | | (165,558,000 | ) |
| | |
|
|
| |
|
|
|
Net decrease from capital share transactions | | | (127,123,292 | ) | | | (78,050,000 | ) |
| | |
|
|
| |
|
|
|
Total decrease in net assets | | | (92,898,233 | ) | | | (83,150,000 | ) |
| | |
|
|
| |
|
|
|
Net Assets: | | | | | | | | |
Beginning of year | | | 490,527,000 | | | | 573,677,000 | |
| | |
|
|
| |
|
|
|
End of year | | $ | 397,628,767 | | | $ | 490,527,000 | |
| | |
|
|
| |
|
|
|
End of year undistributed net investment income | | $ | — | | | $ | — | |
| | |
|
|
| |
|
|
|
Share Transactions: | | | | | | | | |
Sale of shares | | | 1,633,719 | | | | 3,010,000 | |
Shares repurchased | | | (5,826,551 | ) | | | (5,790,000 | ) |
| | |
|
|
| |
|
|
|
Net decrease in shares | | | (4,192,832 | ) | | | (2,780,000 | ) |
| | |
|
|
| |
|
|
|
The accompanying notes are an integral part of these financial statements.
14
Managers Fremont Micro-Cap Fund
Financial Highlights
For a share outstanding throughout each fiscal year
| | | | | | | | | | | | | | | | | | | | |
| | | Fiscal year ended October 31,
| |
| | | 2005
| | | 2004
| | | 2003
| | | 2002
| | | 2001
| |
Net Asset Value, Beginning of Year | | $ | 27.86 | | | $ | 28.14 | | | $ | 18.43 | | | $ | 25.22 | | | $ | 34.99 | |
| | |
|
|
| |
|
|
| |
|
|
| |
|
|
| |
|
|
|
Income from Investment Operations: | | | | | | | | | | | | | | | | | | | | |
Net investment loss | | | (0.38 | ) | | | (0.44 | ) | | | (0.33 | ) | | | (0.35 | ) | | | (0.13 | ) |
Net realized and unrealized gain (loss) on investments | | | 2.17 | | | | 0.16 | | | | 10.04 | | | | (6.44 | ) | | | (6.69 | ) |
| | |
|
|
| |
|
|
| |
|
|
| |
|
|
| |
|
|
|
Total from investment operations | | | 1.79 | | | | (0.28 | ) | | | 9.71 | | | | (6.79 | ) | | | (6.82 | ) |
| | |
|
|
| |
|
|
| |
|
|
| |
|
|
| |
|
|
|
Less Distributions to Shareholders from: | | | | | | | | | | | | | | | | | | | | |
Net investment income | | | — | | | | — | | | | — | | | | — | | | | .— | |
Net realized gain on investments | | | — | | | | — | | | | — | | | | — | | | | (2.95 | ) |
| | |
|
|
| |
|
|
| |
|
|
| |
|
|
| |
|
|
|
Total distributions to shareholders | | | — | | | | — | | | | — | | | | — | | | | (2.95 | ) |
| | |
|
|
| |
|
|
| |
|
|
| |
|
|
| |
|
|
|
Net Asset Value, End of Year | | $ | 29.65 | | | $ | 27.86 | | | $ | 28.14 | | | $ | 18.43 | | | $ | 25.22 | |
| | |
|
|
| |
|
|
| |
|
|
| |
|
|
| |
|
|
|
Total Return (a) | | | 6.42 | % | | | (1.00 | )% | | | 52.69 | % | | | (26.92 | )% | | | (20.05 | )% |
| | |
|
|
| |
|
|
| |
|
|
| |
|
|
| |
|
|
|
Ratio of net operating expenses to average net assets | | | 1.56 | % (b) | | | 1.62 | % | | | 1.64 | % | | | 1.61 | % | | | 1.60 | % |
Ratio of net investment loss to average net assets (a) | | | (1.11 | )% | | | (1.41 | )% | | | (1.47 | )% | | | (1.33 | )% | | | (0.47 | )% |
Portfolio turnover | | | 68 | % | | | 83 | % | | | 105 | % | | | 68 | % | | | 90 | % |
Net assets at end of year (000’s omitted) | | $ | 397,629 | | | $ | 490,527 | | | $ | 573,677 | | | $ | 401,068 | | | $ | 600,259 | |
| | |
|
|
| |
|
|
| |
|
|
| |
|
|
| |
|
|
|
| (a) | Total returns and net investment income would have been lower had certain expenses not been reduced. |
| (b) | After expense offsets. (See Note 1(c) of “Notes to Financial Statements.”) |
15
Managers Fremont Micro-Cap Fund
Notes to Financial Statements
October 31, 2005
| (1) | Summary of Significant Accounting Policies |
Managers Trust I (the “Trust”) is an open-end management investment company organized as a Massachusetts business trust and registered under the Investment Company Act of 1940, as amended (the “1940 Act”). Currently, the Trust is comprised of a number of investment series. Included in this report is the Managers Fremont Micro-Cap Fund (the “Fund”), formerly Fremont U.S. Micro-Cap Fund (the “Predecessor Fund”).
At the close of business on January 14, 2005, the Predecessor Fund was re-organized from a series of Fremont Mutual Funds, Inc. into Managers Fremont Micro-Cap Fund, a series of Managers Trust I.
The Fund’s financial statements are prepared in accordance with accounting principles generally accepted in the United States of America, which require management to make estimates and assumptions that affect the reported amount of assets and liabilities and disclosure of contingent assets and liabilities at the date of the financial statements and the reported amounts of income and expenses during the reporting periods. Actual results could differ from those estimates. The following is a summary of significant accounting policies followed by the Fund in the preparation of its financial statements:
| (a) | Valuation of Investments |
Equity securities traded on a domestic securities exchange are valued at the last quoted sale price, or, lacking any sales, at the last quoted bid price. Over-the-counter securities are valued at the Nasdaq Official Closing Price, if one is available. Lacking any sales, over-the-counter securities are valued at the last quoted bid price. Under certain circumstances, the value of the Fund investment may be based on an evaluation of its fair value, pursuant to procedures established by and under the general supervision of the Board of Trustees of the Trust. The Fund may use the fair value of a portfolio security to calculate its NAV when, for example, (1) market quotations are not readily available because a portfolio security is not traded in a public market or the principal market in which the security trades is closed, (2) trading in a portfolio security is suspended and has not resumed prior to the time as of which the Fund calculates its NAV, (3) where a significant event affecting the value of a portfolio security is determined to have occurred between the time of the market quotation provided for a portfolio security and the time as of which the Fund calculates its NAV, (4) a security’s price has remained unchanged over an extended period of time (often referred to as a “stale price”), or (5) the Investment Manager determines that a market quotation is inaccurate. The Investment Manager monitors intervening events that may affect the value of securities held in the Fund’s portfolio and, in accordance with procedures adopted by the Fund’s Trustees, will adjust the prices of securities traded in foreign markets, as appropriate, to reflect the impact of events occurring subsequent to the close of such markets but prior to the time each Fund’s NAV is calculated. Fixed-income securities are valued based on valuations furnished by independent pricing services that utilize matrix systems, which reflect such factors as security prices, yields, maturities and ratings, and are supplemented by dealer and exchange quotations. Short-term investments having a remaining maturity of 60 days or less are valued at amortized cost, which approximates market value. Investments in other regulated investment companies are valued at their end of
16
Managers Fremont Micro-Cap Fund
Notes to Financial Statements (continued)
day net asset value per share except iShares or other ETF’s which are valued the same as equity securities. Securities (including derivatives) for which market quotations are not readily available are valued at fair value, as determined in good faith, and pursuant to procedures adopted by the Board of Trustees of the Trust. The values assigned to fair value investments are based on available information and do not necessarily represent amounts that might ultimately be realized, since such amounts depend on future developments inherent in long-term investments. Further, because of the inherent uncertainty of valuation, those estimated values may differ significantly from the values that would have been used had a ready market of the investments existed, and the differences could be material.
Security transactions are accounted for as of the trade date. Realized gains and losses on securities sold are determined on the basis of identified cost.
| (c) | Investment Income and Expenses |
Dividend income is recorded on the ex-dividend date except certain dividends from foreign securities where the ex-dividend date may have passed. These dividends are recorded as soon as the Trust is informed of the ex-dividend date. Dividend income on foreign securities is recorded net of any withholding tax. Interest income, which includes amortization of premium and accretion of discount on debt securities, is accrued as earned. Non-cash dividends included in dividend income, if any, are reported at the fair market value of the securities received. Other income and expenses are recorded on an accrual basis. Expenses that cannot be directly attributed to a fund are apportioned among the Funds in the Trust and in some cases other affiliated funds based upon their relative average net assets or number of shareholders.
The Fund may participate in a directed brokerage program whereby certain portfolio trades are directed to various brokers who pay a portion of the Fund’s expenses. For the fiscal year ended October 31, 2005 no trades were directed under this program.
In addition, the Fund has a “balance credit” arrangement with The Bank of New York (“BNY”), the Fund’s custodian, whereby the Fund is credited with an interest factor equal to 1% below the effective 90-day T-Bill rate for account balances left uninvested overnight. These credits serve to reduce custody expenses that would otherwise be charged the Fund. For the fiscal year ended October 31, 2005, the custodian expense was reduced by $199. (Prior to January 15, 2005, the Predecessor Fund participated in a similar program offered by State Street Bank, the Predecessor Fund’s custodian).
Managers Investment Group LLC (the “Investment Manager”), a subsidiary of Affiliated Managers Group, Inc. (“AMG”) and the Investment Manager for the Fund, has contractually agreed, through at least March 1, 2006, to waive fees and pay or reimburse expenses to the extent that the total annual operating expenses (exclusive of brokerage, interest, taxes and extraordinary expenses) of the Fund exceed 1.98% of the Fund’s average daily net assets. For the fiscal year ended October 31, 2005, no reimbursement payments were required.
Effective January 15, 2005, the Fund may be obligated to repay the Investment Manager such amounts waived, paid or reimbursed in future years provided that the repayment
17
Managers Fremont Micro-Cap Fund
Notes to Financial Statements (continued)
occurs within three (3) years after the waiver or reimbursement and that such repayment would not cause the Fund’s expenses in any such year to exceed the previously stated percentages of that Fund’s average daily net assets. Prior to January 15, 2005, the Fund had a similar expense reimbursement agreement with the former Investment Advisor, Fremont Investment Advisors, Inc. (“FIA”).
| (d) | Dividends and Distributions |
Dividends resulting from net investment income, if any, normally will be declared and paid annually. Distributions of capital gains, if any, will be made on an annual basis and when required for Federal excise tax purposes. Income and capital gain distributions are determined in accordance with Federal income tax regulations, which may differ from generally accepted accounting principles. These differences are primarily due to differing treatments for losses deferred due to wash sales, equalization accounting for tax purposes, foreign currency and market discount transactions. Permanent book and tax basis differences, if any, relating to shareholder distributions will result in reclassifications to paid-in capital. The Fund paid no distributions during 2005 or 2004.
The Fund intends to comply with the requirements under Subchapter M of the Internal Revenue Code of 1986, as amended, to distribute substantially all of its taxable income and gains to its shareholders and to meet certain diversification and income requirements with respect to investment companies. Therefore, no provision for Federal income or excise tax is included in the accompanying financial statements.
Additionally, based on the Fund’s understanding of the tax rules and rates related to income, gains and transactions for the foreign jurisdictions in which it invests, the Fund will provide for foreign taxes, and where appropriate, deferred foreign taxes.
| (f) | Capital Loss Carryovers |
As of October 31, 2005, the Fund had an accumulated net realized capital loss carryover of $34,532,478. This amount may be used to offset realized capital gains, if any, through October 31, 2010.
The Trust’s Declaration of Trust authorizes for each series the issuance of an unlimited number of shares of beneficial interest, without par value. The Fund records sales and repurchases of its capital stock on the trade date. Dividends and distributions to shareholders are recorded on the ex-dividend date.
At October 31, 2005, certain unaffiliated shareholders, specifically omnibus accounts, individually held greater than 10% of the outstanding shares of the Fund as follows: three own collectively 64%.
The Fund may enter into repurchase agreements provided that the value of the underlying collateral, including accrued interest, will be equal to or exceed the value of the repurchase agreement during the term of the agreement. The underlying collateral for all repurchase agreements is held in safekeeping by the Fund’s custodian or at the Federal Reserve Bank.
18
Managers Fremont Micro-Cap Fund
Notes to Financial Statements (continued)
If the seller defaults and the value of the collateral declines, or if bankruptcy proceedings commence with respect to the seller of the security, realization of the collateral by the Fund may be delayed or limited.
| (2) | Agreements and Transactions with Affiliates |
The Trust has entered into an Investment Management Agreement dated January 15, 2005 under which the Investment Manager provides or oversees investment management services to the Fund. (Prior to January 15, 2005, the Predecessor Fund had a Unitary Fee Agreement with FIA under which the Predecessor Fund paid FIA 2.50% of the first $30 million, 2.00% of the next $70 million, and 1.50% of the balance over $100 million of average net assets per annum. FIA, in turn, was obliged to pay all of the expenses of the Predecessor Fund). The Investment Manager selects subadvisors for the Fund (subject to Trustee approval) and monitors the subadvisor’s investment programs and results. The Fund’s investment portfolio is managed by a portfolio manager who serves pursuant to a Subadvisory Agreement with the Investment Manager.
Investment management fees are paid directly by the Fund to the Investment Manager based on average daily net assets. The annual investment management fee rate, as a percentage of average daily net assets for the period from January 15, 2005 to October 31, 2005, was 1.00%.
The Trust has entered into an Administration and Shareholder Servicing Agreement under which Managers Investment Group LLC serves as the Fund’s administrator (the “Administrator”) and is responsible for all aspects of managing the Fund’s operations, including administration and shareholder services to each Fund, its shareholders, and certain institutions, such as bank trust departments, broker-dealers and registered investment advisers, that advise or act as an intermediary with the Fund’s shareholders. During the period January 15, 2005 through October 31, 2005, the Fund paid a fee to the Administrator at the rate of 0.25% per annum of the Fund’s average daily net assets.
Prior to July 1, 2005, the aggregate annual retainer paid to each Independent Trustee for all Trusts in the Fund family was $52,000, plus $2,000 for each meeting attended. Effective July 1, 2005, the aggregate annual retainer paid to each Independent Trustee is $55,000, plus $4,000 for each meeting attended. The Trustees’ fees and expenses are allocated amongst all of the Funds for which Managers Investment Group LLC serves as the Investment Manager (the “Managers Funds”) based on the relative net assets of such Funds. The Trust has an additional Independent Trustee who is paid an annual retainer of $30,000, plus $4,000 for each meeting attended. The fee is allocated amongst the Funds in the Trust based on the relative net assets of each Fund. The Independent Chairman of the Trusts receives an additional payment of $10,000 per year. (Prior to July 1, 2005, the Independent Chairman was paid an additional $5,000 per year). Effective July 1, 2005, the Chairman of the Audit Committee receives an additional $2,000 per year. The “Trustee fees and expenses” shown in the financial statements amounting to $25,511 represent the Fund’s allocated portion of the total fees and expenses paid by the Fund and other affiliated funds in the Trust and in the complex for the period January 15, 2005 through October 31, 2005.
19
Managers Fremont Micro-Cap Fund
Notes to Financial Statements (continued)
The Fund is distributed by Managers Distributors, Inc. (“MDI”), a wholly-owned subsidiary of Managers Investment Group LLC. Certain Trustees and Officers of the Fund are Officers and/or Directors of the Investment Manager, AMG and/or MDI. MDI serves as the principal underwriter for the Fund. MDI is a registered broker-dealer and member of the National Association of Securities Dealers, Inc. Shares of the Fund will be continuously offered and will be sold by brokers, dealers or other financial intermediaries who have executed selling agreements with MDI. MDI bears all the expenses of providing services pursuant to an Underwriting Agreement, including the payment of the expenses relating to the distribution of Prospectuses for sales purposes and any advertising or sales literature. (Prior to January 15, 2005, the Predecessor Fund had a similar distribution agreement with Quasar Distributors, LLC).
| (3) | Purchases and Sales of Securities |
Purchases and sales of securities, excluding short-term securities, for the fiscal year ended October 31, 2005, were $281,729,919 and $380,267,074, respectively. There were no purchases or sales of U.S. Government securities.
| (4) | Portfolio Securities Loaned |
The Fund may participate in a securities lending program offered by BNY providing for the lending of equities, corporate bonds and government securities to qualified brokers. Collateral on all securities loaned is accepted in cash and/or government securities. Collateral is maintained at a minimum level of 102% of the market value, plus interest, if applicable, of investments on loan. Collateral received in the form of cash is invested temporarily in institutional money market funds or other short-term investments by BNY. Securities lending fees include earnings of such temporary cash investments, plus or minus any rebate to a borrower. These earnings (after rebate) are then divided between BNY, as a fee for its services under the program, and the Fund according to agreed-upon rates.
| (5) | Commitments and Contingencies |
In the normal course of business, the Fund may enter into contracts and agreements that contain a variety of representations and warranties, which provide general indemnifications. The maximum exposure to the Fund under these arrangements is unknown, as this would involve future claims that may be against the Fund that have not yet occurred. However, based on experience, the Fund expects the risk of loss to be remote.
Prior to January 15, 2005 the Predecessor Fund had a Line of Credit Arrangement (“LOC”) with State Street Bank and Trust Company (“SSB”). Under the terms of the LOC, the Predecessor Fund’s borrowings could not exceed 20% of the Fund’s net assets and the combined borrowings of all the former Fremont Funds could not exceed the $40 million cap on the total line of credit. The interest rate paid on the LOC equaled SSB’s overnight federal funds rate as determined on each day at 11:00 a.m. Boston time plus 0.50% per annum. The former Fremont Funds paid a commitment fee of 0.09% per annum of the unused balance of the LOC. The Predecessor Fund’s portion of this fee for the period November 1, 2004 through January 14, 2005, equaled $1,330. The LOC was terminated at the close of business on January 14, 2005.
20
Managers Fremont Micro-Cap Fund
Notes to Financial Statements (continued)
| (7) | Transactions with Affiliated Companies |
An affiliated company is a company that is directly or indirectly controlled by a related party or a company in which a fund has ownership of at least 5% of the voting securities. Transactions during the fiscal year ended October 31, 2005, with companies which are or were affiliates are as follows:
Summary of Transactions with Affiliated Companies:
| | | | | | | | | | | | |
Affiliate
| | Purchase
Cost
| | Sales
Cost
| | Dividend
Income
| | Market
Value
|
Cash Systems, Inc. | | $ | 8,337,021 | | | — | | | — | | $ | 7,045,206 |
Ceragon Networks, Ltd. | | | — | | $ | 1,639,337 | | | — | | | 7,556,562 |
Exfo Electro-Optical Engineering Inc. | | | 71,466 | | | — | | | — | | | 6,880,565 |
Integral Systems, Inc. | | | 9,960,224 | | | — | | $ | 59,656 | | | 12,933,072 |
KVH Industries, Inc. | | | 1,235,728 | | | 854,307 | | | — | | | 7,108,332 |
Northern Technologies International Corp. | | | — | | | — | | | 23,132 | | | 1,777,821 |
Optibase Ltd. | | | 4,337,571 | | | — | | | — | | | 3,789,474 |
Regeneration Technologies, Inc. | | | 4,402,196 | | | 625,225 | | | — | | | 13,457,922 |
RIT Technologies Ltd. | | | 848,474 | | | 2,899,381 | | | — | | | 2,690,240 |
TechTeam Global, Inc. | | | 6,832,622 | | | — | | | — | | | 4,761,588 |
| | |
|
| |
|
| |
|
| |
|
|
Totals | | $ | 36,025,302 | | $ | 6,018,250 | | $ | 82,788 | | $ | 68,000,782 |
| | |
|
| |
|
| |
|
| |
|
|
Tax Information (unaudited)
The Fund hereby designates the maximum amount allowable of its net taxable income as qualified dividends as provided in the Jobs and Growth Tax Relief Reconciliation Act of 2003. The 2005 Form 1099-DIV you receive for the Fund, will show the tax status of all distributions paid to you during the year.
Pursuant to section 852 of the Internal Revenue Code, there were no long-term capital gains for the Fund for the taxable year ended October 31, 2005.
21
Report of Independent Registered Public Accounting Firm
To the Board of Trustees of Managers Trust I and the Shareholders of Managers Fremont Micro-Cap Fund:
In our opinion, the accompanying statement of assets and liabilities, including the schedule of portfolio investments and the related statements of operations and of changes in net assets and the financial highlights present fairly, in all material respects, the financial position of Managers Fremont Micro-Cap Fund (formerly Fremont U.S. Micro-Cap Fund) (the “Fund”) at October 31, 2005, the results of its operations, the changes in its net assets and the financial highlights for the periods indicated, in conformity with accounting principles generally accepted in the United States of America. These financial statements and financial highlights (hereafter referred to as “financial statements”) are the responsibility of the Fund’s management; our responsibility is to express an opinion on these financial statements based on our audits. We conducted our audits of these financial statements in accordance with the standards of the Public Company Accounting Oversight Board (United States). Those standards require that we plan and perform the audit to obtain reasonable assurance about whether the financial statements are free of material misstatement. An audit includes examining, on a test basis, evidence supporting the amounts and disclosures in the financial statements, assessing the accounting principles used and significant estimates made by management, and evaluating the overall financial statement presentation. We believe that our audits, which included confirmation of securities at October 31, 2005 by correspondence with the custodian and brokers, provide a reasonable basis for our opinion.
PricewaterhouseCoopers LLP
Boston, Massachusetts
December 19, 2005
22
Trustees and Officers
The Trustees and Officers of the Trust, their business addresses, principal occupations for the past five years and dates of birth are listed below. The Trustees provide broad supervision over the affairs of the Trust and the Fund. The Trustees are experienced executives who meet periodically throughout the year to oversee the Fund’s activities, review contractual arrangements with companies that provide services to the Fund, and review the Fund’s performance. Unless otherwise noted, the address of each Trustee or Officer is the address of the Trust: 800 Connecticut Avenue, Norwalk, Connecticut 06854.
There is no stated term of office for Trustees. Trustees serve until their resignation, retirement or removal in accordance with the Trust’s organizational documents and policies adopted by the Board from time to time. The President, Treasurer and Secretary hold office until a successor has been duly elected and qualified. Other officers serve at the pleasure of the Trustees.
Independent Trustees
The following Trustees are not “interested persons” of the Trust within the meaning of the 1940 Act:
| | |
Name, Date of Birth, Number of Funds
Overseen in Fund Complex*
| | Principal Occupation(s) During Past 5 Years and Other Directorships Held by Trustee
|
Jack W.Aber, 9/9/37 • Trustee since 2000 • Oversees 36 Funds in Fund Complex | | Professor of Finance, Boston University School of Management (1972-Present); Trustee of Appleton Growth Fund (1 portfolio); Trustee of Third Avenue Trust (4 portfolios); Trustee of Third Avenue Variable Trust (1 portfolio) |
| |
William E. Chapman, II, 9/23/41 • Independent Chairman • Trustee since 2000 • Oversees 36 Funds in Fund Complex | | President and Owner, Longboat Retirement Planning Solutions (1998-Present); Hewitt Associates, LLC (part time) (provider of Retirement and Investment Education Seminars); Interim Executive Vice President, QuadraMed Corporation (2001); President, Retirement Plans Group, Kemper Funds (1990-1998); Trustee of Bowdoin College (2002-Present); Trustee of Third Avenue Trust (4 portfolios); Trustee of Third Avenue Variable Trust (1 portfolio) |
| |
Edward J. Kaier, 9/23/45 • Trustee since 2000 • Oversees 36 Funds in Fund Complex | | Attorney at Law and Partner, Hepburn Willcox Hamilton & Putnam, LLP (1977-Present); Trustee of Third Avenue Trust (4 portfolios); Trustee of Third Avenue Variable Trust (1 portfolio) |
23
Trustees and Officers (continued)
| | |
Richard E. Holmes, 5/14/43 • Trustee since 2005 • Oversees 11 Funds in Fund Complex | | Vice President and Director, BelMar Advisors, Inc. (1998-Present); Executive Director-Investment Management, Pacific Telesis Group (1983-1987); Managers Trust and Thrift Investments, Bechtel Power Corp. (1980-1983); Independent Director, Fremont Mutual Funds, Inc. (1988-2005) |
| |
Steven J. Paggioli, 4/3/50 • Trustee since 2000 • Oversees 36 Funds in Fund Complex | | Consultant (2001-Present); Formerly Executive Vice President and Director, The Wadsworth Group (1986-2001); Executive Vice President, Secretary and Director, Investment Company Administration, LLC (1990-2001); Vice President, Secretary and Director, First Fund Distributors, Inc. (1991-2001); Trustee, Professionally Managed Portfolios (21 portfolios); Advisory Board Member, Sustainable Growth Advisors, LP; Director, Guardian Mutual Funds (28 portfolios) |
| |
Eric Rakowski, 6/5/58 • Trustee since 2000 • Oversees 36 Funds in Fund Complex | | Professor, University of California at Berkeley School of Law (1990-Present); Visiting Professor, Harvard Law School (1998-1999); Trustee of Third Avenue Trust (4 portfolios); Trustee of Third Avenue Variable Trust (1 portfolio) |
| |
Thomas R. Schneeweis, 5/10/47 • Trustee since 2000 • Oversees 36 Funds in Fund Complex | | Professor of Finance, University of Massachusetts (1985-Present); Director, CISDM at the University of Massachusetts, (1996-Present); President, Alternative Investment Analytics, LLC, (formerly Schneeweis Partners, LLC) (2001- Present); Director of Research, Lyra/Starview Capital LLC, (2004-Present); Partner, Northampton Capital, LLC; Partner, Schneeweis Advisors and Massachusetts Finance Institute (both wholly owned subsidiaries of Alternative Investment Analytics). No other directorships held by Trustee. |
| * | The Fund Complex consists of Managers AMG Funds, The Managers Funds, Managers Trust I and Managers Trust II. |
24
Trustees and Officers (continued)
Interested Trustees
The following Trustees are “interested persons” of the Trust within the meaning of the 1940 Act. Mr. Lebovitz is an interested person of the Trust within the meaning of the 1940 Act by virtue of his positions with Managers Investment Group LLC and Managers Distributors, Inc. Mr. Nutt is an interested person of the Trust within the meaning of the 1940 Act by virtue of his positions with, and interest in securities of, Affiliated Managers Group, Inc.
| | |
Name, Date of Birth, Number of Funds
Overseen in Fund Complex*
| | Principal Occupation(s) During Past 5 Years and Other Directorships Held by Trustee
|
Peter M. Lebovitz, 1/18/55 • Trustee since 2002 • President since 2000 • Oversees 36 Funds in Fund Complex | | Managing Partner, Managers Investment Group LLC (2005-Present); President and Chief Executive Officer, The Managers Funds LLC (1999-2004); President, Managers Distributors, Inc. (2000-Present); President, The Managers Funds (1999-Present); President, Managers AMG Funds (1999-Present); President, Managers Trust II (2000-Present); Director of Marketing, The Managers Funds, LP (1994-1999); Director of Marketing, Hyperion Capital Management, Inc. (1993-1994); Senior Vice President, Greenwich Asset Management, Inc. (1989-1993); No other directorships held by trustee. |
| |
William J. Nutt, 3/30/45 • Trustee since 2005 • Oversees 36 Funds in Fund Complex | | Chairman and Founder of Affiliated Managers Group, Inc., (1993-Present); Chief Executive Officer of Affiliated Managers Group, Inc. (1993-2004); Director, Affiliated Managers Group, Inc. (1993-Present); President of Affiliated Managers Group, Inc. (1993-1999); President and Chief Operating Officer, The Boston Company (1989-1993); Senior Executive Vice President, The Boston Company (1982-1989) |
| * | The Fund Complex consists of Managers AMG Funds, The Managers Funds, Managers Trust I and Managers Trust II. |
25
Trustees and Officers (continued)
Officers
| | |
Name, Date of Birth, Position(s) Held with
Fund and Length of Time Served
| | Principal Occupation(s) During Past 5 Years
|
Bruce M. Aronow, 5/31/65 • Chief Financial Officer since 2005 | | Managing Partner, Managers Investment Group LLC (2005-Present); Executive Vice President and Chief Financial Officer and Principal, Rorer Asset Management (1999-2004); Chief Operating Officer, Rorer Asset Management (2001-2004); Staff Accountant, Manager and Partner, PricewaterhouseCoopers LLP (1987-1998) |
| |
Christine C. Carsman, 4/2/52 • Secretary since 2004 | | Vice President and Chief Regulatory Counsel, Affiliated Managers Group, Inc. (2004-Present); Secretary, The Managers Funds, Managers AMG Funds and Managers Trust II (2004-Present); Senior Counsel, Vice President and Director of Operational Risk Management and Compliance, Wellington Management Company, LLP (1995-2004); Deputy General Counsel, The Boston Company, Inc. (1993-1995); Associate General Counsel, The Boston Company Advisors, Inc. (1991-1993); Associate, Sullivan & Worcester LLP (1987-1991) |
| |
Donald S. Rumery, 5/29/58 • Treasurer since 2000 | | Senior Vice-President, Managers Investment Group LLC (2005-Present); Director, Finance and Planning, The Managers Funds LLC, (1994-2004); Treasurer and Chief Financial Officer, Managers Distributors, Inc. (2000-Present); Treasurer, The Managers Funds (1995-Present); Treasurer, Managers AMG Funds (1999-Present); Treasurer, Managers Trust II (2000-Present); Secretary, Managers Trust I and Managers Trust II (2000-2004) and Secretary, The Managers Funds (1997-2004) |
26
THIS PAGE INTENTIONALLY LEFT BLANK
Investment Manager and Administrator
Managers Investment Group LLC
800 Connecticut Avenue
Norwalk, Connecticut 06854
(203) 299-3500 or (800) 835-3879
Distributor
Managers Distributors, Inc.
800 Connecticut Avenue
Norwalk, Connecticut 06854
(203) 299-3500 or (800) 835-3879
Subadvisor
Kern Capital Management LLC
114 West 47th Street, 19th Floor
New York, New York 10036
Custodian
The Bank of New York
2 Hanson Place, 7th Floor
Brooklyn, New York 11217
Legal Counsel
Ropes & Gray LLP
One International Place
Boston, Massachusetts 02110-2624
Transfer Agent
PFPC, Inc.
Attn: Managers
P.O. Box 9769
Providence, Rhode Island 02940
(800) 358-7668
MANAGERS AND MANAGERS AMG EQUITY FUNDS
CAPITAL APPRECIATION
Bramwell Capital Management, Inc.
Essex Investment Management Co., LLC
EMERGING MARKETS EQUITY
Rexiter Capital Management Limited
ESSEX AGGRESSIVE GROWTH
ESSEX LARGE CAP GROWTH
ESSEX SMALL/MICRO CAP GROWTH
Essex Investment Management Co., LLC
FIRST QUADRANT TAX-MANAGED EQUITY
First Quadrant, L.P.
INSTITUTIONAL MICRO-CAP
Kern Capital Management LLC
INTERNATIONAL EQUITY
Bernstein Investment Research and Management
Lazard Asset Management, LLC
Wellington Management Company, LLP
INTERNATIONAL GROWTH
Wellington Management Company, LLP
MICRO-CAP
Kern Capital Management LLC
MID-CAP
Chicago Equity Partners, LLC
REAL ESTATE SECURITIES
Urdang Securities Management, Inc.
RENAISSANCE LARGE-CAP EQUITY
Renaissance Investment Management
RORER MID-CAP RORER LARGE-CAP
Rorer Asset Management, LLC
SMALL CAP
TimesSquare Capital Management, LLC
SMALL COMPANY
Kalmar Investment Advisers, Inc.
SPECIAL EQUITY
Donald Smith & Co., Inc.
Kern Capital Management LLC
Skyline Asset Management, L.P.
Veredus Asset Management LLC
Westport Asset Management, Inc.
STRUCTURED CORE
First Quadrant, L.P.
SYSTEMATIC VALUE
Systematic Financial Management, L.P.
TIMESSQUARE MID CAP GROWTH
TIMESSQUARE SMALL CAP GROWTH
TimesSquare Capital Management, LLC
VALUE
Armstrong Shaw Associates Inc.
Osprey Partners Investment Mgmt., LLC
20
Oak Associates, Ltd.
MANAGERS BALANCED FUNDS
BALANCED
Chicago Equity Partners, LLC
Loomis, Sayles & Company L.P.
GLOBAL
333 Global Advisers*
Armstrong Shaw Associates Inc.
Bernstein Investment Research and Management
First Quadrant, L.P.
Kern Capital Management LLC
Northstar Capital Management, Inc.
Wellington Management Company, LLP
MANAGERS FIXED INCOME FUNDS
BOND (MANAGERS)
Loomis, Sayles & Company L.P.
BOND (MANAGERS FREMONT)
Pacific Investment Management Co. LLC
CALIFORNIA INTERMEDIATE TAX-FREE
Evergreen Investment Management Company, LLC
FIXED INCOME
Loomis, Sayles & Company L.P.
GLOBAL BOND
Loomis, Sayles & Company L.P.
HIGH YIELD
J.P. Morgan Investment Management Inc.
INTERMEDIATE DURATION GOVERNMENT
Smith Breeden Associates, Inc.
MONEY MARKET (MANAGERS)
JPMorgan Investment Advisors Inc.
MONEY MARKET (FREMONT)
333 Global Advisers*
SHORT DURATION GOVERNMENT
Smith Breeden Associates, Inc.
| * | A division of Managers Investment Group LLC |
This report is prepared for the Fund’s shareholders. It is authorized for distribution to prospective investors only when preceded or accompanied by an effective prospectus. To receive a free copy of the prospectus or Statement of Additional Information, which includes additional information about Fund Trustees, please contact us by calling 1-800.835.3879. Distributed by Managers Distributors, Inc., member NASD.
A description of the policies and procedures each Fund uses to vote its proxies is available: (i) without charge, upon request, by calling 1-800.835.3879, or (ii) on the Securities and Exchange Commission’s (SEC) Web site at www.sec.gov. For information regarding each Fund’s proxy voting record for the 12-month period ended June 30, call 1-800.835.3879 or visit the SEC Web site at www.sec.gov.
The Fund files its complete schedule of portfolio holdings with the SEC for the first and third quarters of each fiscal year on Form N-Q. The Fund’s Forms N-Q are available on the SEC’s website at www.sec.gov. A Fund’s Forms N-Q may be reviewed and copied at the SEC’s Public Reference Room in Washington, DC. Information on the operation of the Public Reference Room may be obtained by calling 1-800-SEC-0330. To review a complete list of the Fund’s portfolio holdings, or to view the most recent quarterly holdings report, semiannual report, or annual report, please visit www.managersinvest.com.
AR010a-1005
| | |
| www.managersinvest.com | |  |
ANNUAL REPORT
Managers Funds
October 31, 2005
| • | | Managers Fremont Institutional Micro-Cap Fund |
MANAGERS FREMONT INSTITUTIONAL
MICRO-CAP FUND
(formerly Fremont Institutional U.S. Micro-Cap Fund)
Annual Report
October 31, 2005
TABLE OF CONTENTS
| | |
| | | Page
|
Letter to Shareholders | | 1 |
| |
About Your Fund’s Expenses | | 2 |
| |
Portfolio Manager Comments | | 3 |
| |
Fund Snapshots | | 8 |
| |
Top ten holdings and portfolio breakdown at October 31, 2005 | | |
| |
Schedule of Portfolio Investments | | 9 |
Detailed portfolio listings by security type and industry sector, as valued at October 31, 2005 | | |
| |
Financial Statements: | | |
| |
Statement of Assets and Liabilities | | 12 |
Fund balance sheet, net asset value (NAV) per share computation and cumulative undistributed amounts | | |
| |
Statement of Operations | | 13 |
Detail of sources of income, Fund expenses, and realized and unrealized gains (losses) during the fiscal year | | |
| |
Statement of Changes in Net Assets | | 14 |
Detail of changes in Fund assets for the past two fiscal years | | |
| |
Financial Highlights | | 15 |
| |
Historical net asset values per share, distributions, total returns, expense ratios, turnover ratios and total net assets | | |
| |
Notes to Financial Statements | | 16 |
| |
Accounting and distribution policies, details of agreements and transactions with Fund management and affiliates, and descriptions of certain investment risks | | |
| |
Report of Independent Registered Public Accounting Firm | | 22 |
| |
Trustees and Officers | | 23 |
Nothing contained herein is to be considered an offer, sale or solicitation of an offer to buy shares of The Managers Funds. Such offering is made only by Prospectus, which includes details as to offering price and other material information.
Letter to Shareholders
Dear Fellow Shareholder:
Over the past 12 months the markets have been beset with a number of difficult and unpredictable challenges, including a massive tsunami in Southeast Asia; continuing strife in the Middle East; numerous terrorist incidents; multiple hurricanes in the Gulf of Mexico; and a significant rise in energy prices. We are fortunate that the stock and bond markets have continued to perform so well under these circumstances.
These events serve to remind us that no one can predict the events that are going to shape the markets in coming months. This reinforces our belief that to invest successfully in an uncertain world you have to diversify your investments and be patient.
Most people think of diversification as holding different types of stocks and bonds, but we believe that there is another type of diversification that receives too little notice, and that is diversification by investment manager and holdings. Simply put, no single approach is going to succeed in every kind of market—some growth stock managers will be successful in a rising market, and some will be more successful in a stagnant market. This can be an issue with some investment firms that adhere to only one method of looking at the markets.
That is a major benefit that we bring you at Managers Funds —since we hire subadvisors (affiliates and non-affiliates) to run our portfolios, we offer you a wide selection of very different investment styles to choose from, sometimes within the same asset class. Invest in multiple Managers Funds, and you can get managers with very different approaches and holdings, helping you reduce the risks created by changing economic conditions and natural and man-made events, such as those of the past 12 months.
We also believe that once you have made your manager selection, you must be patient. On the home page of our Web site at www.managersinvest.com, you will find a short article entitled “Stay Invested for the Long Term” that highlights how important it is to consistently stay in the market rather than trying to time the market. We think the implication is clear: to be successful in the market over the long term, select a wide variety of investments giving you good diversification, invest regularly and stick with your investment plan no matter what events dominate the news.
We invite you to visit our Web site on an ongoing basis to stay in tune with your Managers Funds holdings. The Web site provides detailed profiles of our subadvisors and their investment styles, as well as quarterly commentary on each Fund. If you have any questions, please do call us at 800.835.3879. Thank you for investing with Managers Funds.
| | | | |
Sincerely, | | | | |
| | |
| | | | |
| | |
| Peter M. Lebovitz | | | | Thomas G. Hoffman, CFA |
| President | | | | Chief Investment Officer |
| Managers Funds | | | | Managers Investment Group LLC |
1
About Your Fund’s Expenses
As a shareholder of the Fund, you incur two types of costs: (1) transaction costs, including sales charges (loads) on purchase payments; reinvested dividends or other distributions; redemption fees; and exchange fees; and (2) ongoing costs, including management fees and other Fund expenses. The Fund incurs only ongoing costs. This example is intended to help you understand your ongoing costs (in dollars) of investing in the Fund and to compare these costs with the ongoing costs of investing in other mutual funds. The example is based on an investment of $1,000 invested at the beginning of the period and held for the entire period as indicated below.
Actual Fund return
The first line of the table below provides information about actual account values and actual expenses. You may use the information in this line, together with the amount you invested, to estimate the expenses that you paid over the period. Simply divide your account value by $1,000 (for example, an $8,600 account value divided by $1,000 = 8.6), then multiply the result by the number in the first line under the heading entitled “Expenses Paid During Period” to estimate the expenses you paid on your account during this period.
Hypothetical Example for Comparison Purposes
The second line of the table below provides information about hypothetical account values and hypothetical expenses based on the Fund’s actual expense ratio and an assumed rate of return of 5% per year before expenses, which is not the Fund’s actual return. The hypothetical account values and expenses may not be used to estimate the actual ending account balance or expenses you paid for the period. You may use this information to compare the ongoing costs of investing in the Fund and other funds. To do so, compare this 5% hypothetical example with the 5% hypothetical examples that appear in the shareholder reports of the other funds.
Please note that the expenses shown in the table are meant to highlight your ongoing costs only and do not reflect any transactional costs, such as sales charges (loads), redemption fees, or exchange fees. Therefore, the second line of the table is useful in comparing ongoing costs only, and will not help you determine the relative total costs of owning different funds. In addition, if these transactional costs were included, your costs would have been higher.
| | | | | | | | | |
Six Months Ended October 31, 2005
| | Account
Value
5/1/2005
| | Account
Value
10/31/2005
| | Paid
During
the Period*
|
Managers Fremont Institutional Micro-Cap | | | | | | | | | |
Based on Actual Fund Return | | $ | 1,000 | | $ | 1,086 | | $ | 7.10 |
Based on Hypothetical 5% Annual Return | | $ | 1,000 | | $ | 1,018 | | $ | 6.87 |
| * | Expenses are equal to the Fund’s annualized expense ratio multiplied by the average account value over the period, multiplied by the number of days in the most recent fiscal half-year (184), then divided by 365. |
2
Managers Fremont Institutional Micro-Cap Fund
Portfolio Manager Comments
The Managers Fremont Institutional Micro-Cap Fund primarily invests in the stocks of U.S. micro-capitalization companies. These companies have market capitalizations that, at the time of initial purchase, place them among the smallest 5% of companies listed on U.S. stock markets. Normally, the Fund will invest at least 80% of its assets in U.S. micro-cap stocks. The Russell 2000 Growth Index is the benchmark for the Fund.
The Portfolio Manager
Kern Capital Management LLC
Kern Capital Management LLC (“KCM”), subadvisor for the Managers Fremont Institutional Micro-Cap Fund was founded in 1997 by Robert (Bob) E. Kern, Jr. and David G. Kern. KCM is an employee owned investment advisory firm dedicated to researching and investing in innovative micro-cap and small-cap growth companies.
KCM believes the U.S. smaller company stock universe provides the opportunity to invest in innovative companies with exceptional growth prospects. With minimal research coverage by brokerage firms and low institutional ownership, KCM believes small and micro-cap stocks represent the least efficient sector of the market and its investment process is designed to capitalize on this inefficiency.
KCM’s fundamental research is dedicated to uncovering innovative small companies early in their growth cycle while they are still relatively undiscovered. With a huge universe of investment opportunity, KCM’s investment process focuses on the most innovative sectors in the U.S. economy (technology, healthcare, services and consumer sectors). Research specialization by economic sector provides the depth of knowledge necessary to make high quality investment decisions and minimize fundamental investment mistakes.
KCM builds portfolios one company at a time with investment research focused on the most innovative sectors of the economy (technology, health care, services and consumer). The team’s hands-on approach to fundamental investment research and financial analysis seeks to answer three basic questions to determine an investment’s attractiveness.
| | • | | How attractive is the business? Companies that are pioneering new markets or revolutionizing existing ones can often sustain rapid growth as they establish leading positions in their targeted markets. |
| | • | | How strong is the management? Successful companies require management capable of capitalizing on attractive growth opportunities. Management’s vision and ability to execute the business plan represent key elements in determining how successful a company will be. |
| | • | | How much is the company worth? The team’s process is valuation sensitive. Depending on the economic sector, different criteria are used to determine a company’s enterprise value, which determines if KCM would buy the entire company at the current market value of its equity. |
Given that KCM is focused on investing in innovative growth companies, the first two questions are answered before determining if the valuation is attractive. In fact, the answers to the first two questions will help determine the appropriate valuation for the company.
The ideal company exhibits many of the following traits:
| | • | | Leading market position in a rapidly growing market with high barriers to entry |
| | • | | Entrepreneurial management team with experience managing a growth business |
| | • | | Focused business plan with tight internal controls |
3
Managers Fremont Institutional Micro-Cap Fund
Portfolio Manager Comments (continued)
Portfolio management:
| | • | | Invests in between 70 and 90 companies which have market capitalizations that, at the time of initial purchase, place them among the smallest 5% of companies listed in the U.S. stock markets |
| | • | | Builds portfolios from the bottom up and seeks to identify companies early in their growth cycle |
| | • | | Utilizes a team approach to cover approximately 600 stocks through an extensive network of contact and other information sources: |
| | • | | Brokerage firm and industry analysts |
| | • | | Corporate management contacts |
| | • | | Trade shows and trade journals |
| | • | | Focuses on business sectors where KCM believes the level of innovation is greatest, such as technology, health care, services and consumer |
| | • | | Uses fundamental analysis to identify small, relatively unknown companies that exhibit the potential to become much larger and more successful |
| | • | | Meets with corporate management to discuss business plans and strategies |
The investment team will make a sell decision when:
| | • | | An investment’s growth prospects deteriorate |
| | • | | Investments achieve excessive valuation relative to the growth opportunities and/or addressable markets. |
| | • | | There is a negative change in fundamental confidence and/or investment time horizon |
The Year in Review
The fiscal year ended October 31, 2005 was up and down. Fiscal year 2005 started just as the prior year ended with positive double digit performance across all Russell 2000 Growth sectors. Sentiment changed as 2005 began and for the next four months every Russell 2000 Growth index sector declined except for energy. A summer rally beginning in May lasted to the end of July and produced strong results across all sectors with especially strong performance from the energy sector. The month of August was down a little and September was flat, which was somewhat surprising given the devastation and far reaching impact of Hurricane Katrina. October, on the other hand, proved very challenging as the concern over an already fragile energy infrastructure in the Gulf Coast region became threatened again by Hurricane Rita. In total, fiscal year 2005 produced 6 months of positive performance and 6 months of negative performance.
For the year as a whole, the Managers Fremont Institutional Micro-Cap Fund returned 6.54%, while the Russell 2000 Growth Index returned 10.91%. An attribution analysis of the fiscal year reveals positive performance from every sector within the Russell 2000 Growth Index. With an emphasis on innovation, the Fund focuses on the information technology (IT), healthcare and consumer discretionary sectors. In each of these sectors, the Fund beat its benchmark. However, two primary factors lead to the Fund’s underperformance relative to the Russell 2000 Growth Index: the strong performance of the energy sector and the Fund’s overweight position in the information technology sector.
First, and representing almost the entire performance differential between the Fund and the Benchmark, was the very strong performance of the energy sector. There is a lack of
4
Managers Fremont Institutional Micro-Cap Fund
Portfolio Manager Comments (continued)
innovation in the energy field and the 68% average return for the energy stocks within the Russell 2000 Growth Index was driven by soaring commodity (oil and natural gas) prices. Second, the IT sector of the Russell 2000 Growth Index produced a return of just over 1% for the last twelve months, which was significantly less than the overall benchmark return and last among all benchmark sectors. Investment in key innovative areas like advanced televisions (Trident Microsystems) and internet filtering/security management software (Websense) helped the Fund outperform the benchmark IT sector performance but the overweight position the Fund had in this sector detracted from overall performance. Among individual holdings, delays in government funding for key biometric initiatives pressured the stock of Identix while disappointing quarterly results and a reorganization of management led to the poor performance of Greenfield Online.
Investments in key innovators within the healthcare sector performed strongly during the last year. Most notably, Intuitive Surgical’s robotic surgery platform has gained significant market share in radical prostatectomy surgeries and has the potential to become an important tool to improve many other surgeries. Additionally, 3D Visualization software, like that developed by Vital Images, is becoming a standard tool for radiologists for viewing CT and MRI images.
The traditional retailers, while not always known for high levels of innovation, can produce significant winners as was the case with Gymboree this past year. As one of the Fund’s largest investments, Gymboree has recovered from its merchandising problems of a year ago and is now beating analyst expectations through higher revenue growth and margin expansion and other investors have noticed.
Looking Forward
The performance of the energy sector has been off the charts – not just in 2005 but for the last three years. Additionally, small-cap value stocks have performed significantly better than small-cap growth stocks over the last five years. During times that are more challenging for the Fund’s investment focus on innovation, it is important to focus on the highest confidence investments and position the Fund for when investor confidence returns. The lagging performance and negative psychology of the technology sector has hampered Fund returns but, importantly, has also provided attractive purchase opportunities in companies well positioned to capitalize on future growth opportunities. The investment team at KCM strongly believes that innovation is a critical element for long-term success and the beginning of improved performance of small-cap growth stocks vs. value stocks may have already begun.
Any sectors, industries or securities discussed should not be perceived as investment recommendations. The views expressed represent the opinions of Managers Investment Group and are not intended as a forecast or guarantee of future results. Any securities discussed may no longer be held in an account’s portfolio. It should not be assumed that any of the securities transactions discussed were or will prove to be profitable, or that the investment recommendations we make in the future will be profitable.
Cumulative Total Return Performance
Managers Fremont Institutional Micro-Cap Fund’s cumulative total return is based on the daily change in net asset value (NAV), and assumes that all distributions were reinvested. The Russell 2000 Growth Index measures the performance of the Russell 2000 companies with higher price-to-book ratios and higher forecasted growth values. Unlike the Fund, the Russell 2000 Growth Index is unmanaged, is not available for investment, and does not
5
Managers Fremont Institutional Micro-Cap Fund
Portfolio Manager Comments (continued)
incur expenses. The chart illustrates the performance of a hypothetical $10,000 investment made in the Fund on October 31, 1995 to a $10,000 investment made in the Russell 2000 Growth Index for the same time periods. The graph and table do not reflect the deduction of taxes that a shareholder would pay on a Fund distribution or redemption of shares. Performance for periods longer than one year is annualized. Figures include reinvestment of capital gains and dividends. The listed returns for the Fund are net of expenses and the returns for the indices exclude expenses. Total returns for the Fund would have been lower had certain expenses not been reduced.
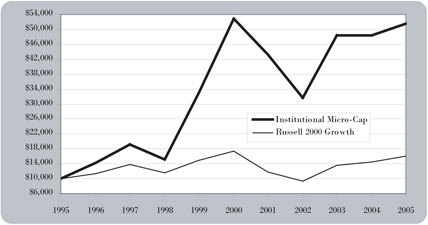
The table below shows the average annualized total returns for the Managers Fremont Institutional Micro-Cap Fund and the Russell 2000 Growth Index for the one-year, five-year, and ten-year periods ending October 31, 2005.
| | | | | | | | | |
Average Annual Total Returns:
| | 1 Year
| | | 5 Years
| | | 10 Years
| |
Managers Fremont Institutional Micro-Cap | | 6.54 | % | | (0.53 | )% | | 17.81 | % |
Russell 2000 Growth Index | | 10.91 | % | | (1.62 | )% | | 4.81 | % |
The performance data shown represents past performance. Past performance is not a guarantee of future results. Current performance may be lower or higher than the performance data quoted. The investment return and the principal value of an investment will fluctuate so that an investor’s shares, when redeemed, may be worth more or less than their original cost. For performance information through the most recent month end please call (800) 835-3879 or visit our Web site at www.managersinvest.com.
The returns shown were achieved during a period of generally rising market values, especially in the technology sector. In addition, a portion of the Fund’s performance can be attributed to investments in Initial Public Offerings (IPOs). Investors should not expect that such favorable returns can be consistently achieved.
The Fund is subject to the special risks associated with investments in micro-cap companies such as relatively short earnings history, conditions, less publicly available corporate information, and a reliance on a limited number of products.
6
Managers Fremont Institutional Micro-Cap Fund
Portfolio Manager Comments (continued)
Managers Fremont Institutional Micro-Cap Fund performance reflects the performance of the post-venture Fund of Fund A of the Bechtel Trust & Thrift Retirement Plan, whose assets were transferred into and became the Managers Fremont Institutional Micro-Cap Fund on 08/06/97. The post-venture Fund imposed higher fees and expenses than that of the Managers Fremont Institutional Micro-Cap Fund and was not registered with the Securities and Exchange Commission and therefore was not subject to the investment restrictions imposed on registered mutual funds.
7
Managers Fremont Institutional Micro-Cap Fund
Fund Snapshots
October 31, 2005
Portfolio Breakdown
| | | | | | |
Major Sectors
| | Percentage of
Net Assets
| | | Percentage of
Russell 2000
Growth Index
| |
Information Technology | | 49.0 | % | | 24.8 | % |
Health Care | | 17.7 | | | 20.6 | |
Industrials | | 10.7 | | | 14.6 | |
Consumer Discretionary | | 10.9 | | | 15.5 | |
Materials | | 1.5 | | | 3.3 | |
Financials | | 1.8 | | | 10.1 | |
Energy | | 0.0 | | | 7.9 | |
Consumer Staples | | 0.0 | | | 2.1 | |
Telecom Services | | 0.0 | | | 1.0 | |
Utilities | | 0.0 | | | 0.1 | |
Other Assets and Liabilities | | 8.4 | | | 0.0 | |
| | |
|
| |
|
|
| | | 100.0 | % | | 100.0 | % |
| | |
|
| |
|
|
Any sectors, industries, or securities discussed should not be perceived as investment recommendations.
Top Ten Holdings
| | | |
Security Name
| | Percentage of
Net Assets
| |
ATMI, Inc.* | | 5.1 | % |
Gymboree Corp.* | | 3.7 | |
Integral Systems, Inc. | | 3.4 | |
Regeneration Technologies, Inc. | | 3.3 | |
Anaren Microwave, Inc. | | 3.0 | |
NeoPharm, Inc. | | 2.9 | |
Identix, Inc. | | 2.7 | |
Terayon Communications Systems, Inc. | | 2.4 | |
AudioCodes, Ltd. | | 2.2 | |
Equinix, Inc. | | 2.1 | |
| | |
|
|
Top Ten as a Group | | 30.8 | % |
| | |
|
|
| * | Top Ten Holding at October 31, 2004 |
Mention of a specific security should not be considered a recommendation to buy or a solicitation to sell that security.
8
Managers Fremont Institutional Micro-Cap Fund
Schedule of Portfolio Investments
October 31, 2005
| | | | | | |
| | | Shares
| | | Value
|
Common Stocks - 91.6% | | | | | | |
Consumer Discretionary - 10.9% | | | | | | |
Alloy, Inc. * | | 1,129,900 | 1 | | $ | 5,197,540 |
Celebrate Express, Inc.* | | 194,300 | | | | 2,646,366 |
Century Casinos, Inc. * | | 329,300 | | | | 2,476,336 |
Gymboree Corp.* | | 614,400 | | | | 10,874,880 |
Harris Interactive, Inc.* | | 576,700 | | | | 2,404,839 |
IMAX Corp.* | | 348,000 | 1 | | | 3,156,360 |
IMPCO Technologies, Inc.* | | 113,800 | 1 | | | 590,622 |
Lakes Gaming, Inc.* | | 73,200 | | | | 686,067 |
Nevada Gold & Casinos, Inc.* | | 120,900 | 1 | | | 1,263,405 |
Parker Vision, Inc. * | | 114,500 | 1 | | | 834,705 |
Rocky Shoes & Boots, Inc.* | | 90,900 | | | | 2,247,048 |
Total Consumer Discretionary | | | | | | 32,378,168 |
Financials - 1.8% | | | | | | |
Cash Systems, Inc.*4 | | 903,300 | 1 | | | 5,248,173 |
Health Care - 17.7% | | | | | | |
AngioDynamics, Inc.* | | 188,400 | | | | 4,116,540 |
Atherogenics, Inc.* | | 103,000 | 1 | | | 1,545,000 |
Cepheid, Inc.* | | 213,500 | 1 | | | 1,353,590 |
Conceptus, Inc.* | | 475,700 | 1 | | | 4,885,439 |
DexCom, Inc.* | | 177,000 | 1 | | | 2,302,770 |
Eclipsys Corp.* | | 108,900 | 1 | | | 1,742,400 |
Harvard Bioscience, Inc. * | | 380,800 | | | | 1,222,368 |
ICON PLC.* | | 88,200 | | | | 3,548,286 |
Intuitive Surgical, Inc.* | | 37,700 | | | | 3,345,121 |
NeoPharm, Inc.* | | 889,941 | 1 | | | 8,552,333 |
NxStage Medical, Inc.* | | 107,000 | | | | 1,214,450 |
OraSure Technologies, Inc.* | | 340,300 | | | | 3,746,703 |
Regeneration Technologies, Inc.*4 | | 1,352,800 | 1 | | | 9,780,744 |
Sonosite, Inc.* | | 30,000 | | | | 881,700 |
Vital Images, Inc.* | | 173,100 | 1 | | | 4,024,575 |
Total Health Care | | | | | | 52,262,019 |
Industrials - 10.7% | | | | | | |
Aaon, Inc.* | | 133,200 | | | | 2,291,040 |
Allied Defense Group, Inc., The* | | 97,900 | | | | 2,183,170 |
Color Kinetics, Inc.* | | 271,700 | 1 | | | 4,140,708 |
CoStar Group, Inc.* | | 102,100 | 1 | | | 4,895,695 |
Gevity HR, Inc. | | 73,000 | | | | 1,879,020 |
Insituform Technologies, Inc.* | | 289,500 | 1 | | | 5,199,420 |
KVH Industries, Inc.* | | 587,900 | 1 | | | 5,432,196 |
Nuco2, Inc.* | | 63,200 | 1 | | | 1,447,280 |
TVI Corp.* | | 1,107,000 | | | | 4,118,040 |
Total Industrials | | | | | | 31,586,569 |
The accompanying notes are an integral part of these financial statements.
9
Managers Fremont Institutional Micro-Cap Fund
Schedule of Portfolio Investments (continued)
| | | | | | |
| | | Shares
| | | Value
|
Information Technology - 49.0% | | | | | | |
ActelCorp.* | | 322,900 | 1 | | $ | 4,504,455 |
Airspan Networks, Inc. * | | 260,100 | | | | 1,295,298 |
Aladdin Knowledge Systems, Ltd.* | | 228,700 | 1 | | | 4,022,833 |
Anaren Microwave, Inc.* | | 619,200 | | | | 8,761,680 |
ASM International NV* | | 171,200 | 1 | | | 2,273,536 |
ATMI, Inc.* | | 554,400 | 1 | | | 15,140,664 |
AudioCodes, Ltd.* | | 580,800 | 1 | | | 6,545,616 |
Cascade Microtech, Inc.* | | 125,700 | | | | 1,458,120 |
Centra Software, Inc.* | | 401,200 | | | | 722,160 |
Ceragon Networks, Ltd.*4 | | 1,508,300 | | | | 5,837,121 |
Comtech Group, Inc.* | | 378,200 | | | | 2,359,968 |
CyberOptics Corp.* | | 194,600 | | | | 2,576,504 |
Equinix, Inc.* | | 167,400 | 1 | | | 6,175,386 |
Exfo Electro-Optical Engineering, Inc.* | | 1,139,800 | 1 | | | 4,980,926 |
Greenfield Online, Inc.* | | 254,200 | 1 | | | 1,276,084 |
Homestore, Inc.* | | 1 | | | | 3 |
Identix, Inc. * | | 1,777,967 | 1 | | | 7,876,394 |
Integral Systems, Inc. | | 450,700 | | | | 9,933,428 |
Intevac, Inc.* | | 239,900 | | | | 2,192,686 |
Kanbay International, Inc. * | | 134,800 | 1 | | | 1,965,384 |
MRO Software, Inc.* | | 285,200 | | | | 4,671,576 |
NCI, Inc., Class A* | | 136,100 | | | | 1,646,810 |
Netscout Systems, Inc.* | | 353,500 | | | | 1,993,740 |
OPNET Technologies, Inc.* | | 495,800 | | | | 4,130,014 |
Optibase Ltd.* | | 593,800 | | | | 2,933,372 |
Pervasive Software, Inc.* | | 399,100 | | | | 1,676,220 |
PLX Technology, Inc.* | | 198,800 | 1 | | | 1,489,012 |
Rae Systems, Inc.* | | 487,400 | 1 | | | 1,715,648 |
RightNow Technologies, Inc.* | | 223,300 | 1 | | | 3,398,626 |
RIT Technologies Ltd.* | | 703,100 | 1 | | | 1,968,680 |
Silicon Motion Technology Corp., ADR* | | 187,900 | | | | 2,702,002 |
Sirenza Microdevices, Inc.* | | 921,800 | | | | 2,949,760 |
Stratasys, Inc.* | | 131,700 | 1 | | | 3,123,924 |
TechTeam Global, Inc. * | | 374,500 | | | | 3,490,340 |
Terayon Communication Systems, Inc.* | | 2,659,000 | | | | 7,152,710 |
Terremark Worldwide, Inc. * | | 636,990 | 1 | | | 1,777,202 |
Trident Microsystems, Inc* | | 69,050 | 1 | | | 2,089,453 |
Witness Systems, Inc.* | | 185,100 | 1 | | | 3,627,960 |
Woodhead Industries, Inc. | | 207,000 | | | | 2,606,130 |
Total Information Technology | | | | | | 145,041,425 |
Materials - 1.5% | | | | | | |
Calgon Carbon Corp. | | 597,300 | 1 | | | 3,255,285 |
Northern Technologies International Corp.4 | | 196,900 | | | | 1,059,322 |
Total Materials | | | | | | 4,314,607 |
Total Common Stocks (cost $271,760,827) | | | | | | 270,830,961 |
The accompanying notes are an integral part of these financial statements.
10
Managers Fremont Institutional Micro-Cap Fund
Schedule of Portfolio Investments (continued)
| | | | | | |
| | | Shares
| | Value
| |
Other Investment Companies – 32.1%2 | | | | | | |
Bank of New York Institutional Cash Reserves Fund, 3.97%3 | | 67,416,430 | | $ | 67,416,430 | |
JPMorgan Prime Money Market Fund, Institutional Class, 3.79% | | 17,389,315 | | | 17,389,315 | |
Vanguard Prime Money Market Fund, Institutional Class, 3.73% | | 10,156,319 | | | 10,156,319 | |
Total Other Investment Companies (cost $94,962,064) | | | | | 94,962,064 | |
Total Investments – 123.7% (cost $366,722,891) | | | | | 365,793,025 | |
Other Assets, less Liabilities – (23.7)% | | | | | (70,092,036 | ) |
Net Assets – 100.0% | | | | $ | 295,700,989 | |
| Note: | Based on the cost of investments of $369,499,174 for Federal income tax purposes at October 31, 2005, the aggregate gross unrealized appreciation and depreciation were $27,652,884 and $31,359,033, respectively, resulting in net unrealized depreciation of investments of $3,706,149. |
| * | Non-income-producing securities. |
| 1 | Some or all of these shares, amounting to a market value of $66,017,180, or 22.3% of net assets, were out on loan to various brokers. |
| 2 | Yield shown for an investment company represents the October 31, 2005, seven-day average yield, which refers to the sum of the previous seven days’ dividends paid, expressed as an annual percentage. |
| 3 | Collateral received from brokers for securities lending was invested in this short-term investment. |
| 4 | Affiliated Company- See Note 7 in the Notes to Financial Statements. |
The accompanying notes are an integral part of these financial statements.
11
Managers Fremont Institutional Micro-Cap Fund
Statement of Assets and Liabilities
October 31, 2005
| | | | |
| | | Managers Fremont
Institutional
Micro-Cap
Fund
| |
Assets: | | | | |
Investments at value (including securities on loan valued at $66,017,180) | | $ | 365,793,025 | |
Receivable for investments sold | | | 1,327,680 | |
Receivable for Fund shares sold | | | 153,541 | |
Dividends and other receivables | | | 121,279 | |
Prepaid expenses | | | 15,508 | |
| | |
|
|
|
Total assets | | | 367,411,033 | |
| | |
|
|
|
Liabilities: | | | | |
Payable for Fund shares repurchased | | | 950,139 | |
Payable upon return of securities loaned | | | 67,416,430 | |
Payable for investments purchased | | | 2,934,709 | |
Accrued expenses: | | | | |
Investment advisory and management fees | | | 246,822 | |
Administrative fees | | | 64,362 | |
Other | | | 97,582 | |
| | |
|
|
|
Total liabilities | | | 71,710,044 | |
| | |
|
|
|
Net Assets | | $ | 295,700,989 | |
| | |
|
|
|
Shares Outstanding | | | 19,789,391 | |
| | |
|
|
|
Net asset value, offering and redemption price per share | | $ | 14.94 | |
| | |
|
|
|
Net Assets Represent: | | | | |
Paid-in capital | | $ | 259,101,211 | |
Undistributed net investment income | | | — | |
Accumulated net realized gain from investments | | | 37,529,644 | |
Net unrealized depreciation of investments | | | (929,866 | ) |
| | |
|
|
|
Net Assets | | $ | 295,700,989 | |
| | |
|
|
|
Investments at cost | | $ | 366,722,891 | |
The accompanying notes are an integral part of these financial statements.
12
Managers Fremont Institutional Micro-Cap Fund
Statement of Operations
For the fiscal year ended October 31, 2005
| | | | |
| | | Managers Fremont
Institutional
Micro-Cap Fund
| |
Investment Income: | | | | |
Dividend income | | $ | 1,101,627 | |
Interest income | | | 232,684 | |
Securities lending fees | | | 258,717 | |
| | |
|
|
|
Total investment income | | | 1,593,028 | |
| | |
|
|
|
Expenses: | | | | |
Investment management fees | | | 3,469,692 | |
Administrative fees | | | 788,903 | |
Insurance | | | 177,409 | |
Transfer agent | | | 121,376 | |
Custodian | | | 82,477 | |
Professional fees | | | 81,707 | |
Registration fees | | | 30,172 | |
Trustees fees and expenses | | | 26,338 | |
Reports to shareholders | | | 22,266 | |
Miscellaneous | | | 8,670 | |
| | |
|
|
|
Total expenses before offsets | | | 4,809,010 | |
| | |
|
|
|
Expense reimbursement | | | (130,585 | ) |
Expense reductions | | | (105 | ) |
| | |
|
|
|
Net expenses | | | 4,678,320 | |
| | |
|
|
|
Net investment loss | | | (3,085,292 | ) |
| | |
|
|
|
Net Realized and Unrealized Gain (Loss): | | | | |
Net realized gain on investments | | | 49,508,104 | |
Net unrealized depreciation of investments | | | (20,867,105 | ) |
| | |
|
|
|
Net realized and unrealized gain | | | 28,640,999 | |
| | |
|
|
|
Net Increase in Net Assets Resulting from Operations | | $ | 25,555,707 | |
| | |
|
|
|
The accompanying notes are an integral part of these financial statements.
13
Managers Fremont Institutional Micro-Cap Fund
Statement of Changes in Net Assets
For the fiscal years ended October 31,
| | | | | | | | |
| | | 2005
| | | 2004
| |
Increase (Decrease) in Net Assets | | | | | | | | |
From Operations: | | | | | | | | |
Net investment loss | | $ | (3,085,292 | ) | | $ | (4,246,000 | ) |
Net realized gain on investments | | | 49,508,104 | | | | 68,675,000 | |
Net unrealized depreciation of investments | | | (20,867,105 | ) | | | (66,457,000 | ) |
| | |
|
|
| |
|
|
|
Net increase (decrease) in net assets resulting from operations | | | 25,555,707 | | | | (2,028,000 | ) |
| | |
|
|
| |
|
|
|
Distributions to Shareholders: | | | | | | | | |
From net investment income | | | (2,857 | ) | | | — | |
From net realized gain on investments | | | (12,361,161 | ) | | | — | |
| | |
|
|
| |
|
|
|
Total distributions to shareholders | | | (12,364,018 | ) | | | — | |
| | |
|
|
| |
|
|
|
From Capital Share Transactions: | | | | | | | | |
Proceeds from sale of shares | | | 43,846,665 | | | | 111,889,000 | |
Reinvestment of dividends and distributions | | | 11,637,724 | | | | — | |
Cost of shares repurchased | | | (130,986,089 | ) | | | (143,512,000 | ) |
| | |
|
|
| |
|
|
|
Net decrease from capital share transactions | | | (75,501,700 | ) | | | (31,623,000 | ) |
| | |
|
|
| |
|
|
|
Total decrease in net assets | | | (62,310,011 | ) | | | (33,651,000 | ) |
| | |
|
|
| |
|
|
|
Net Assets: | | | | | | | | |
Beginning of year | | | 358,011,000 | | | | 391,662,000 | |
| | |
|
|
| |
|
|
|
End of year | | $ | 295,700,989 | | | $ | 358,011,000 | |
| | |
|
|
| |
|
|
|
End of year undistributed net investment income | | $ | — | | | $ | — | |
| | |
|
|
| |
|
|
|
Share Transactions: | | | | | | | | |
Sale of shares | | | 3,135,379 | | | | 7,416,000 | |
Reinvested shares | | | 742,276 | | | | — | |
Shares repurchased | | | (8,826,603 | ) | | | (9,694,000 | ) |
| | |
|
|
| |
|
|
|
Net decrease in shares | | | (4,948,948 | ) | | | (2,278,000 | ) |
| | |
|
|
| |
|
|
|
The accompanying notes are an integral part of these financial statements.
14
Managers Fremont Institutional Micro-Cap Fund
Financial Highlights
For a share outstanding throughout each fiscal year
| | | | | | | | | | | | | | | | | | | | |
| | | For the fiscal year ended October 31,
| |
| | | 2005
| | | 2004
| | | 2003
| | | 2002
| | | 2001
| |
Net Asset Value, Beginning of Year | | $ | 14.49 | | | $ | 14.52 | | | $ | 9.50 | | | $ | 12.98 | | | $ | 17.37 | |
| | |
|
|
| |
|
|
| |
|
|
| |
|
|
| |
|
|
|
Income from Investment Operations: | | | | | | | | | | | | | | | | | | | | |
Net investment loss | | | 0.00 | | | | (0.17 | ) | | | (0.13 | ) | | | (0.11 | ) | | | (0.01 | ) |
Net realized and unrealized gain (loss) on investments | | | 0.97 | | | | 0.14 | | | | 5.15 | | | | (3.37 | ) | | | (3.08 | ) |
| | |
|
|
| |
|
|
| |
|
|
| |
|
|
| |
|
|
|
Total from investment operations | | | 0.97 | | | | (0.03 | ) | | | 5.02 | | | | (3.48 | ) | | | (3.09 | ) |
| | |
|
|
| |
|
|
| |
|
|
| |
|
|
| |
|
|
|
Less Distributions to Shareholders from: | | | | | | | | | | | | | | | | | | | | |
Net investment income | | | (0.00 | )(d) | | | — | | | | — | | | | — | | | | — | |
Net realized gain on investments | | | (0.52 | ) | | | — | | | | — | | | | — | | | | (1.30 | ) |
| | |
|
|
| |
|
|
| |
|
|
| |
|
|
| |
|
|
|
Net Asset Value, End of Year | | $ | 14.94 | | | $ | 14.49 | | | $ | 14.52 | | | $ | 9.50 | | | $ | 12.98 | |
| | |
|
|
| |
|
|
| |
|
|
| |
|
|
| |
|
|
|
Total Return (a) | | | 6.54 | % | | | (0.21 | )% | | | 52.84 | % | | | (26.81 | )% | | | (18.13 | )% |
| | |
|
|
| |
|
|
| |
|
|
| |
|
|
| |
|
|
|
Ratio of net operating expenses to average net assets (b) | | | 1.35 | % | | | 1.30 | % | | | 1.30 | % | | | 1.29 | % | | | 1.25 | % |
Ratio of net investment loss to average net assets (a) | | | (0.89 | )% | | | (1.09 | )% | | | (1.12 | )% | | | (0.96 | )% | | | (0.06 | )% |
Portfolio turnover | | | 73 | % | | | 87 | % | | | 119 | % | | | 64 | % | | | 85 | % |
Net assets at end of year (000’s omitted) | | $ | 295,701 | | | $ | 358,011 | | | $ | 391,662 | | | $ | 253,297 | | | $ | 286,408 | |
| | |
|
|
| |
|
|
| |
|
|
| |
|
|
| |
|
|
|
Ratios absent expense offsets (c): | | | | | | | | | | | | | | | | | | | | |
Ratio of total expenses to average net assets | | | 1.39 | % | | | 1.30 | % | | | 1.30 | % | | | 1.29 | % | | | 1.31 | % |
| | |
|
|
| |
|
|
| |
|
|
| |
|
|
| |
|
|
|
| (a) | Total returns and net investment income would have been lower had certain expenses not been reduced. |
| (b) | After expense offsets. (See Note 1(c) of “Notes to Financial Statements.”) |
| (c) | Ratio information assuming no reduction of Fund expenses. (See Notes to Financial Statements.) |
| (d) | Amount calculated is less than $0.005 per share. |
15
Managers Fremont Institutional Micro-Cap Fund
Notes to Financial Statements
October 31, 2005
| (1) | Summary of Significant Accounting Policies |
Managers Trust I (the “Trust”) is an open-end management investment company organized as a Massachusetts business trust and registered under the Investment Company Act of 1940, as amended (the “1940 Act”). Currently, the Trust is comprised of a number of investment series. Included in this report is the Managers Fremont Institutional Micro-Cap Fund (the “Fund”), formerly Fremont Institutional U.S. Micro-Cap Fund, (the “Predecessor Fund”).
At the close of business on January 14, 2005, the Fund was re-organized from a series of Fremont Mutual Funds, Inc., into the Managers Fremont Institutional Micro-Cap Fund, a series of Managers Trust I.
The Fund’s financial statements are prepared in accordance with accounting principles generally accepted in the United States of America, which require management to make estimates and assumptions that affect the reported amount of assets and liabilities and disclosure of contingent assets and liabilities at the date of the financial statements and the reported amounts of income and expenses during the reporting periods. Actual results could differ from those estimates. The following is a summary of significant accounting policies followed by the Fund in the preparation of its financial statements:
| (a) | Valuation of Investments |
Equity securities traded on a domestic securities exchange are valued at the last quoted sale price, or, lacking any sales, at the last quoted bid price. Over-the-counter securities are valued at the Nasdaq Official Closing Price, if one is available. Lacking any sales, over-the-counter securities are valued at the last quoted bid price. Under certain circumstances, the value of a Fund investment may be based on an evaluation of its fair value, pursuant to procedures established by and under the general supervision of the Board of Trustees of the Trust. The Fund may use the fair value of a portfolio security to calculate its NAV when, for example, (1) market quotations are not readily available because a portfolio security is not traded in a public market or the principal market in which the security trades is closed, (2) trading in a portfolio security is suspended and has not resumed prior to the time as of which the Fund calculates its NAV, (3) where a significant event affecting the value of a portfolio security is determined to have occurred between the time of the market quotation provided for a portfolio security and the time as of which the Fund calculates its NAV, (4) a security’s price has remained unchanged over an extended period of time (often referred to as a “stale price”), or (5) the Manager determines that a market quotation is inaccurate. The Manager monitors intervening events that may affect the value of securities held in the Fund’s portfolio and, in accordance with procedures adopted by the Fund’s Trustees, will adjust the prices of securities traded in foreign markets, as appropriate, to reflect the impact of events occurring subsequent to the close of such markets but prior to the time the Fund’s NAV is calculated. Fixed-income securities are valued based on valuations furnished by independent pricing services that utilize matrix systems, which reflect such factors as security prices, yields, maturities and ratings, and are supplemented by dealer and exchange quotations. Short-term investments having a remaining maturity of 60 days or less are valued at amortized cost, which approximates market value. Investments in other
16
Managers Fremont Institutional Micro-Cap Fund
Notes to Financial Statements (continued)
regulated investment companies are valued at their end of day net asset value per share, except iShares or other ETF’s which are valued the same as equity securities. Securities (including derivatives) for which market quotations are not readily available are valued at fair value, as determined in good faith, and pursuant to procedures adopted by the Board of Trustees of the Trust. The values assigned to fair value investments are based on available information and do not necessarily represent amounts that might ultimately be realized, since such amounts depend on future developments inherent in long-term investments. Further, because of the inherent uncertainty of valuation, those estimated values may differ significantly from the values that would have been used had a ready market for the investments existed, and the differences could be material.
Security transactions are accounted for as of the trade date. Realized gains and losses on securities sold are determined on the basis of identified cost.
| (c) | Investment Income and Expenses |
Dividend income is recorded on the ex-dividend date except certain dividends from foreign securities where the ex-dividend date may have passed. These dividends are recorded as soon as the Trust is informed of the ex-dividend date. Dividend income on foreign securities is recorded net of any withholding tax. Interest income, which includes amortization of premium and accretion of discount on debt securities, is accrued as earned. Non-cash dividends included in dividend income, if any, are reported at the fair market value of the securities received. Other income and expenses are recorded on an accrual basis. Expenses that cannot be directly attributed to a fund are apportioned among the Funds in the Trust and in some cases other affiliated funds based upon their relative average net assets or number of shareholders.
The Fund may participate in a directed brokerage program where certain portfolio trades are directed to various brokers who pay a portion of the Fund’s expenses. For the fiscal year ended October 31, 2005 no trades were directed under this program.
In addition, the Fund has a “balance credit” arrangement with The Bank of New York (“BNY”), the Fund’s custodian, whereby the Fund is credited with an interest factor equal to 1% below the effective 90-day T-Bill rate for account balances left uninvested overnight. These credits serve to reduce custody expenses that would otherwise be charged the Fund. For the fiscal year ended October 31, 2005, the custodian expense was reduced $105 under the BNY arrangement. (Prior to January 15, 2005, the Predecessor Fund participated in a similar program offered by State Street Bank, the Predecessor Fund’s custodian).
Managers Investment Group LLC (the “Investment Manager”), a subsidiary of Affiliated Managers Group, Inc. (“AMG”) and the Investment Manager for the Fund, has contractually agreed, through at least March 1, 2006, to waive fees and pay or reimburse expenses to the extent that the total annual operating expenses (exclusive of brokerage, interest, taxes and extraordinary expenses) of the Fund exceed 1.35% of the Fund’s average daily net assets.
Effective January 15, 2005, the Fund may be obligated to repay the Investment Manager such amounts waived, paid or reimbursed in future years provided that the
17
Managers Fremont Institutional Micro-Cap Fund
Notes to Financial Statements (continued)
repayment occurs within three (3) years after the waiver or reimbursement and that such repayment would not cause the Fund’s expenses in any such year to exceed the previously stated percentages of that Fund’s average daily net assets. [Prior to January 15, 2005, the Fund had a similar expense reimbursement agreement with the former Investment Advisor, Fremont Investment Advisors, Inc. (“FIA”)]. At October 31, 2005, the cumulative amount of expense reimbursement by the Manager subject to repayment by the Fund equaled $31,943.
| (d) | Dividends and Distributions |
Dividends resulting from net investment income, if any, normally will be declared and paid annually. Distributions of capital gains, if any, will be made on an annual basis and when required for Federal excise tax purposes. Income and capital gain distributions are determined in accordance with Federal income tax regulations, which may differ from generally accepted accounting principles. These differences are primarily due to differing treatments for losses deferred due to wash sales, equalization accounting for tax purposes, foreign currency and market discount transactions. Permanent book and tax basis differences, if any, relating to shareholder distributions will result in reclassifications to paid-in capital. The tax character of distributions paid during fiscal 2005 was as follows:
| | | | | | |
| | | 2005
| | 2004
|
Distributions paid from: | | | | | | |
Ordinary income | | $ | 2,857 | | $ | — |
Short-term capital gains | | | 8,312,723 | | | — |
Long-term capital gains | | | 4,048,438 | | | — |
| | |
|
| |
|
|
| | | $ | 12,364,018 | | $ | — |
| | |
|
| |
|
|
The Fund intends to comply with the requirements under Subchapter M of the Internal Revenue Code of 1986, as amended, to distribute substantially all of its taxable income and gains to its shareholders and to meet certain diversification and income requirements with respect to investment companies. Therefore, no provision for Federal income or excise tax is included in the accompanying financial statements.
Additionally, based on the Fund’s understanding of the tax rules and rates related to income, gains and transactions for the foreign jurisdictions in which it invests, the Fund will provide for foreign taxes, and where appropriate, deferred foreign taxes.
| (f) | Capital Loss Carryovers |
As of October 31, 2005, the Fund had no accumulated net realized capital loss carryover from securities transactions for Federal income tax purposes.
The Trust’s Declaration of Trust authorizes for each series the issuance of an unlimited number of shares of beneficial interest, without par value. The Fund records sales and repurchases of its capital stock on the trade date. Dividends and distributions to shareholders are recorded on the ex-dividend date.
18
Managers Fremont Institutional Micro-Cap Fund
Notes to Financial Statements (continued)
At October 31, 2005, certain unaffiliated shareholders, specifically omnibus accounts, individually held greater than 10% of the outstanding shares of the Fund as follows: 2 own collectively 62%.
The Fund may enter into repurchase agreements provided that the value of the underlying collateral, including accrued interest, will be equal to or exceed the value of the repurchase agreement during the term of the agreement. The underlying collateral for all repurchase agreements is held in safekeeping by the Fund’s custodian or at the Federal Reserve Bank.
If the seller defaults and the value of the collateral declines, or if bankruptcy proceedings commence with respect to the seller of the security, realization of the collateral by the Fund may be delayed or limited.
| (2) | Agreements and Transactions with Affiliates |
The Trust has entered into an Investment Management Agreement dated January 15, 2005 under which the Investment Manager provides or oversees investment management services to the Funds. (Prior to January 15, 2005, the Predecessor Fund had a similar Investment Management Agreement with FIA). The Investment Manager selects subadvisors for the Fund (subject to Trustee approval) and monitors the subadvisor’s investment programs and results. The Fund’s investment portfolio is managed by a portfolio manager who serves pursuant to a Subadvisory Agreement with the Investment Manager.
Investment management fees are paid directly by the Fund to the Investment Manager based on average daily net assets. The annual investment management fee rate, as a percentage of average daily net assets for the fiscal year ended October 31, 2005, was 1.00%.
The Trust has entered into an Administration and Shareholder Servicing Agreement under which Managers Investment Group LLC serves as the Fund’s administrator (the “Administrator”) and is responsible for all aspects of managing the Fund’s operations, including administration and shareholder services to each Fund, its shareholders, and certain institutions, such as bank trust departments, broker-dealers and registered investment advisers, that advise or act as an intermediary with the Fund’s shareholders. For its services, the Administrator is paid a fee at the rate of 0.25% per annum. Prior to January 15, 2005, the Predecessor Fund had a similar administration agreement with FIA at an annual rate of 0.15% per annum. During the period November 1, 2004 through January 14, 2005, the Predecessor Fund paid administration fees of $117,781. During the period January 15, 2005 through October 31, 2005, the Fund paid administration fees of $671,122.
Prior to July 1, 2005, the aggregate annual retainer paid to each Independent Trustee for all Trusts in the Fund family was $52,000, plus $2,000 for each meeting attended. Effective July 1, 2005, the aggregate annual retainer paid to each Independent Trustee is $55,000, plus $4,000 for each meeting attended. The Trustees’ fees and expenses are allocated amongst all of the Funds for which Managers Investment Group LLC serves as the Investment Manager (the “Managers Funds”) based on the relative net assets of
19
Managers Fremont Institutional Micro-Cap Fund
Notes to Financial Statements (continued)
such Funds. The Trust has an additional Independent Trustee who is paid an annual retainer of $30,000 plus $4,000 for each meeting attended. The fee is allocated amongst the Funds in the Trust based on the relative net assets of such Fund. The Independent Chairman of the Trusts receives an additional payment of $10,000 per year (prior to July 1, 2005, the Independent Chairman was paid an additional $5,000 per year). Effective July 1, 2005 the Audit Committee Chairperson receives an additional $2,000 per year. The “Trustee fees and expenses” shown in the financial statements amounting to $26,338 for the fiscal year ended October 31, 2005 represent the Fund’s allocated portion of the total fees and expenses paid by the Fund and other affiliated funds in the Managers Funds since January 15, 2005, and the amount paid from the Predecessor Fund from November 1, 2004 through January 14, 2005 to the Trustees of the Fremont Mutual Funds, Inc.
The Fund is distributed by Managers Distributors, Inc. (“MDI”), a wholly-owned subsidiary of Managers Investment Group LLC. Certain Trustees and Officers of the Funds are Officers and/or Directors of the Investment Manager, AMG and/or MDI. MDI serves as the principal underwriter for the Fund. MDI is a registered broker-dealer and member of the National Association of Securities Dealers, Inc. Shares of the Fund will be continuously offered and will be sold by brokers, dealers or other financial intermediaries who have executed selling agreements with MDI. MDI bears all the expenses of providing services pursuant to an Underwriting Agreement, including the payment of the expenses relating to the distribution of Prospectuses for sales purposes and any advertising or sales literature. (Prior to January 15, 2005, the Predecessor Fund had a similar distribution agreement with Quasar Distributors, LLC).
| (3) | Purchases and Sales of Securities |
Purchases and sales of securities, excluding short-term securities, for the fiscal year ended October 31, 2005, were $224,871,710 and $284,428,618, respectively. There were no purchases or sales of U.S. Government securities.
| (4) | Portfolio Securities Loaned |
The Fund may participate in a securities lending program offered by BNY providing for the lending of equities, corporate bonds and government securities to qualified brokers. Collateral on all securities loaned is accepted in cash and/or government securities. Collateral is maintained at a minimum level of 102% of the market value, plus interest, if applicable, of investments on loan. Collateral received in the form of cash is invested temporarily in institutional money market funds or other short-term investments by BNY. Securities lending fees include earnings of such temporary cash investments, plus or minus any rebate to a borrower. These earnings (after any rebate) are then divided between BNY, as a fee for its services under the program, and the Fund according to agreed-upon rates.
| (5) | Commitments and Contingencies |
In the normal course of business, the Fund may enter into contracts and agreements that contain a variety of representations and warranties, which provide general indemnifications. The maximum exposure to the Fund under these arrangements is unknown, as this would involve future claims that may be against the Fund that have not yet occurred. However, based on experience, the Fund expects the risk of loss to be remote.
20
Managers Fremont Institutional Micro-Cap Fund
Notes to Financial Statements (continued)
Prior to January 15, 2005 the Predecessor Fund had a Line of Credit Arrangement (“LOC”) with State Street Bank and Trust Company (“SSB”). Under the terms of the LOC, the Predecessor Fund’s borrowings could not exceed 20% of the Fund’s net assets and the combined borrowings of all the former Fremont Funds could not exceed the $40 million cap on the total line of credit. The interest rate paid on the LOC equaled SSB’s overnight federal funds rate as determined on each day at 11:00 a.m. Boston time plus 0.50% per annum. The former Fremont Funds paid a commitment fee of 0.09% of the unused balance of the LOC and the Predecessor Fund’s portion of this fee for the period November 1, 2004 through January 14, 2005, equaled $993. The LOC was terminated at the close of business on January 14, 2005.
| (7) | Transactions with Affiliated Companies |
An affiliated company is a company that is directly or indirectly controlled by a related party or a company in which a fund has ownership of at least 5% of the voting securities. Transactions during the fiscal year ended October 31, 2005, with companies which are or were affiliates are as follows:
Summary of Transactions with Affiliated Companies:
| | | | | | | | | | | | | |
Affiliate
| | Purchase
Cost
| | Sales
Cost
| | | Dividend
Income
| | Market
Value
|
Cash Systems Inc. | | $ | 6,202,544 | | | — | | | | — | | $ | 5,248,173 |
Ceragon Networks, Ltd. | | | 300,901 | | $ | (867,111 | ) | | | — | | | 5,837,121 |
Northern Technologies International Corp. | | | — | | | — | | | $ | 13,783 | | | 1,059,322 |
Regeneration Technologies Inc. | | | 2,869,991 | | | — | | | | — | | | 9,780,744 |
| | |
|
| |
|
|
| |
|
| |
|
|
Totals | | $ | 9,373,436 | | $ | (867,111 | ) | | $ | 13,783 | | $ | 21,925,360 |
| | |
|
| |
|
|
| |
|
| |
|
|
Tax Information (unaudited)
The Fund hereby designates the maximum amount allowable of its net taxable income as qualified dividends as provided in the Jobs and Growth Tax Relief Reconciliation Act of 2003. The 2005 Form 1099-DIV you receive for the Fund, will show the tax status of all distributions paid to you during the year.
Pursuant to section 852 of the Internal Revenue Code, there were long-term capital gains of $37,304,337 for the Fund for the taxable year ended October 31, 2005.
21
Report of Independent Registered Public Accounting Firm
To the Board of Trustees of Managers Trust I and the Shareholders of Managers Fremont Institutional Micro-Cap Fund:
In our opinion, the accompanying statement of assets and liabilities, including the schedule of portfolio investments and the related statements of operations and of changes in net assets and the financial highlights present fairly, in all material respects, the financial position of Managers Fremont Institutional Micro-Cap Fund (formerly Fremont Institutional U.S. Micro-Cap Fund) (the “Fund”) at October 31, 2005, the results of its operations, the changes in its net assets and the financial highlights for the periods indicated, in conformity with accounting principles generally accepted in the United States of America. These financial statements and financial highlights (hereafter referred to as “financial statements”) are the responsibility of the Fund’s management; our responsibility is to express an opinion on these financial statements based on our audits. We conducted our audits of these financial statements in accordance with the standards of the Public Company Accounting Oversight Board (United States). Those standards require that we plan and perform the audit to obtain reasonable assurance about whether the financial statements are free of material misstatement. An audit includes examining, on a test basis, evidence supporting the amounts and disclosures in the financial statements, assessing the accounting principles used and significant estimates made by management, and evaluating the overall financial statement presentation. We believe that our audits, which included confirmation of securities at October 31, 2005 by correspondence with the custodian and brokers, provide a reasonable basis for our opinion.
PricewaterhouseCoopers LLP
Boston, Massachusetts
December 19, 2005
22
Trustees and Officers
The Trustees and Officers of the Trust, their business addresses, principal occupations for the past five years and dates of birth are listed below. The Trustees provide broad supervision over the affairs of the Trust and the Fund. The Trustees are experienced executives who meet periodically throughout the year to oversee the Fund’s activities, review contractual arrangements with companies that provide services to the Fund, and review the Fund’s performance. Unless otherwise noted, the address of each Trustee or Officer is the address of the Trust: 800 Connecticut Avenue, Norwalk, Connecticut 06854.
There is no stated term of office for Trustees. Trustees serve until their resignation, retirement or removal in accordance with the Trust’s organizational documents and policies adopted by the Board from time to time. The President, Treasurer and Secretary hold office until a successor has been duly elected and qualified. Other officers serve at the pleasure of the Trustees.
Independent Trustees
The following Trustees are not “interested persons” of the Trust within the meaning of the 1940 Act:
| | |
Name, Date of Birth, Number of Funds
Overseen in Fund Complex*
| | Principal Occupation(s) During Past 5 Years and Other Directorships Held by Trustee
|
Jack W. Aber, 9/9/37 • Trustee since 2000 • Oversees 36 Funds in Fund Complex | | Professor of Finance, Boston University School of Management (1972-Present); Trustee of Appleton Growth Fund (1 portfolio); Trustee of Third Avenue Trust (4 portfolios); Trustee of Third Avenue Variable Trust (1 portfolio) |
| |
William E. Chapman, II, 9/23/41 • Independent Chairman • Trustee since 2000 • Oversees 36 Funds in Fund Complex | | President and Owner, Longboat Retirement Planning Solutions (1998-Present); Hewitt Associates, LLC (part time) (provider of Retirement and Investment Education Seminars); Interim Executive Vice President, QuadraMed Corporation (2001); President, Retirement Plans Group, Kemper Funds (1990-1998); Trustee of Bowdoin College (2002-Present); Trustee of Third Avenue Trust (4 portfolios); Trustee of Third Avenue Variable Trust (1 portfolio) |
| |
Edward J. Kaier, 9/23/45 • Trustee since 2000 • Oversees 36 Funds in Fund Complex | | Attorney at Law and Partner, Hepburn Willcox Hamilton & Putnam, LLP (1977-Present); Trustee of Third Avenue Trust (4 portfolios); Trustee of Third Avenue Variable Trust (1 portfolio) |
23
Trustees and Officers (continued)
| | |
Richard E. Holmes, 5/14/43 • Trustee since 2005 • Oversees 11 Funds in Fund Complex | | Vice President and Director, BelMar Advisors, Inc. (1998-Present); Executive Director-Investment Management, Pacific Telesis Group (1983-1987); Managers Trust and Thrift Investments, Bechtel Power Corp. (1980-1983); Independent Director, Fremont Mutual Funds, Inc. (1988-2005) |
| |
Steven J. Paggioli, 4/3/50 • Trustee since 2000 • Oversees 36 Funds in Fund Complex | | Consultant (2001-Present); Formerly Executive Vice President and Director, The Wadsworth Group (1986-2001); Executive Vice President, Secretary and Director, Investment Company Administration, LLC (1990-2001); Vice President, Secretary and Director, First Fund Distributors, Inc. (1991-2001); Trustee, Professionally Managed Portfolios (21 portfolios); Advisory Board Member, Sustainable Growth Advisors, LP; Director, Guardian Mutual Funds (28 portfolios) |
| |
Eric Rakowski, 6/5/58 • Trustee since 2000 • Oversees 36 Funds in Fund Complex | | Professor, University of California at Berkeley School of Law (1990-Present); Visiting Professor, Harvard Law School (1998-1999); Trustee of Third Avenue Trust (4 portfolios); Trustee of Third Avenue Variable Trust (1 portfolio) |
| |
Thomas R. Schneeweis, 5/10/47 • Trustee since 2000 • Oversees 36 Funds in Fund Complex | | Professor of Finance, University of Massachusetts (1985-Present); Director, CISDM at the University of Massachusetts, (1996-Present); President, Alternative Investment Analytics, LLC, (formerly Schneeweis Partners, LLC) (2001- Present); Director of Research, Lyra/Starview Capital LLC, (2004-Present); Partner, Northampton Capital, LLC; Partner, Schneeweis Advisors and Massachusetts Finance Institute (both wholly owned subsidiaries of Alternative Investment Analytics). No other directorships held by Trustee. |
| * | The Fund Complex consists of Managers AMG Funds, The Managers Funds, Managers Trust I and Managers Trust II. |
24
Trustees and Officers (continued)
Interested Trustees
The following Trustees are “interested persons” of the Trust within the meaning of the 1940 Act. Mr. Lebovitz is an interested person of the Trust within the meaning of the 1940 Act by virtue of his positions with Managers Investment Group LLC and Managers Distributors, Inc. Mr. Nutt is an interested person of the Trust within the meaning of the 1940 Act by virtue of his positions with, and interest in securities of, Affiliated Managers Group, Inc.
| | |
Name, Date of Birth, Number of Funds
Overseen in Fund Complex*
| | Principal Occupation(s) During Past 5 Years and Other Directorships Held by Trustee
|
Peter M. Lebovitz, 1/18/55 • Trustee since 2002 • President since 2000 • Oversees 36 Funds in Fund Complex | | Managing Partner, Managers Investment Group LLC (2005-Present); President and Chief Executive Officer, The Managers Funds LLC (1999-2004); President, Managers Distributors, Inc. (2000-Present); President, The Managers Funds (1999-Present); President, Managers AMG Funds (1999-Present); President, Managers Trust II (2000-Present); Director of Marketing, The Managers Funds, LP (1994-1999); Director of Marketing, Hyperion Capital Management, Inc. (1993-1994); Senior Vice President, Greenwich Asset Management, Inc. (1989-1993); No other directorships held by trustee. |
| |
William J. Nutt, 3/30/45 • Trustee since 2005 • Oversees 36 Funds in Fund Complex | | Chairman and Founder of Affiliated Managers Group, Inc., (1993-Present); Chief Executive Officer of Affiliated Managers Group, Inc. (1993-2004); Director, Affiliated Managers Group, Inc. (1993-Present); President of Affiliated Managers Group, Inc. (1993-1999); President and Chief Operating Officer, The Boston Company (1989-1993); Senior Executive Vice President, The Boston Company (1982-1989) |
| * | The Fund Complex consists of Managers AMG Funds, The Managers Funds, Managers Trust I and Managers Trust II. |
25
Trustees and Officers (continued)
Officers
| | |
Name, Date of Birth, Position(s) Held With
Fund and Length of Time Served
| | Principal Occupation(s) During Past 5 Years
|
Bruce M. Aronow, 5/31/65 • Chief Financial Officer since 2005 | | Managing Partner, Managers Investment Group LLC (2005-Present); Executive Vice President and Chief Financial Officer and Principal, Rorer Asset Management (1999-2004); Chief Operating Officer, Rorer Asset Management (2001-2004); Staff Accountant, Manager and Partner, PricewaterhouseCoopers LLP (1987-1998) |
| |
Christine C. Carsman, 4/2/52 • Secretary since 2004 | | Vice President and Chief Regulatory Counsel, Affiliated Managers Group, Inc. (2004-Present); Secretary, The Managers Funds, Managers AMG Funds and Managers Trust II (2004-Present); Senior Counsel, Vice President and Director of Operational Risk Management and Compliance, Wellington Management Company, LLP (1995-2004); Deputy General Counsel, The Boston Company, Inc. (1993-1995); Associate General Counsel, The Boston Company Advisors, Inc. (1991-1993); Associate, Sullivan & Worcester LLP (1987-1991) |
| |
Donald S. Rumery, 5/29/58 • Treasurer since 2000 | | Senior Vice-President, Managers Investment Group LLC (2005-Present); Director, Finance and Planning, The Managers Funds LLC, (1994-2004); Treasurer and Chief Financial Officer, Managers Distributors, Inc. (2000-Present); Treasurer, The Managers Funds (1995-Present); Treasurer, Managers AMG Funds (1999-Present); Treasurer, Managers Trust II (2000-Present); Secretary, Managers Trust I and Managers Trust II (2000-2004) and Secretary, The Managers Funds (1997-2004) |
26
THIS PAGE INTENTIONALLY LEFT BLANK
Investment Manager and Administrator
Managers Investment Group LLC
800 Connecticut Avenue
Norwalk, Connecticut 06854
(203) 299-3500 or (800) 835-3879
Distributor
Managers Distributors, Inc.
800 Connecticut Avenue
Norwalk, Connecticut 06854
(203) 299-3500 or (800) 835-3879
Subadvisor
Kern Capital Management LLC
114 West 47th Street, 19th Floor
New York, New York 10036
Custodian
The Bank of New York
2 Hanson Place, 7th Floor
Brooklyn, New York 11217
Legal Counsel
Ropes & Gray LLP
One International Place
Boston, Massachusetts 02110-2624
Transfer Agent
PFPC, Inc.
Attn: Managers
P.O. Box 9769
Providence, Rhode Island 02940
(800) 358-7668
MANAGERSAND MANAGERS AMG EQUITY FUNDS
CAPITAL APPRECIATION
Bramwell Capital Management, Inc.
Essex Investment Management Co., LLC
EMERGING MARKETS EQUITY
Rexiter Capital Management Limited
ESSEX AGGRESSIVE GROWTH
ESSEX LARGE CAP GROWTH
ESSEX SMALL/MICRO CAP GROWTH
Essex Investment Management Co., LLC
FIRST QUADRANT TAX-MANAGED EQUITY
First Quadrant, L.P.
INSTITUTIONAL MICRO-CAP
Kern Capital Management LLC
INTERNATIONAL EQUITY
Bernstein Investment Research and Management
Lazard Asset Management, LLC
Wellington Management Company, LLP
INTERNATIONAL GROWTH
Wellington Management Company, LLP
MICRO-CAP
Kern Capital Management LLC
MID-CAP
Chicago Equity Partners, LLC
REAL ESTATE SECURITIES
Urdang Securities Management, Inc.
RENAISSANCE LARGE-CAP EQUITY
Renaissance Investment Management
RORER MID-CAP
RORER LARGE-CAP
Rorer Asset Management, LLC
SMALL CAP
TimesSquare Capital Management, LLC
SMALL COMPANY
Kalmar Investment Advisers, Inc.
SPECIAL EQUITY
Donald Smith & Co., Inc.
Kern Capital Management LLC
Skyline Asset Management, L.P.
Veredus Asset Management LLC
Westport Asset Management, Inc.
STRUCTURED CORE
First Quadrant, L.P.
SYSTEMATIC VALUE
Systematic Financial Management, L.P.
TIMESSQUARE MID CAP GROWTH
TIMESSQUARE SMALL CAP GROWTH
TimesSquare Capital Management, LLC
VALUE
Armstrong Shaw Associates Inc.
Osprey Partners Investment Mgmt., LLC
20
Oak Associates, Ltd.
MANAGERS BALANCED FUNDS
BALANCED
Chicago Equity Partners, LLC
Loomis, Sayles & Company L.P.
GLOBAL
333 Global Advisers*
Armstrong Shaw Associates Inc.
Bernstein Investment Research and Management
First Quadrant, L.P.
Kern Capital Management LLC
Northstar Capital Management, Inc.
Wellington Management Company, LLP
MANAGERS FIXED INCOME FUNDS
BOND (MANAGERS)
Loomis, Sayles & Company L.P.
BOND (MANAGERS FREMONT)
Pacific Investment Management Co. LLC
CALIFORNIA INTERMEDIATE TAX-FREE
Evergreen Investment Management Company, LLC
��
FIXED INCOME
Loomis, Sayles & Company L.P.
GLOBAL BOND
Loomis, Sayles & Company L.P.
HIGH YIELD
J.P. Morgan Investment Management Inc.
INTERMEDIATE DURATION GOVERNMENT
Smith Breeden Associates, Inc.
MONEY MARKET (MANAGERS)
JPMorgan Investment Advisors Inc.
MONEY MARKET (FREMONT)
333 Global Advisers*
SHORT DURATION GOVERNMENT
Smith Breeden Associates, Inc.
| * | A division of Managers Investment Group LLC |
This report is prepared for the Fund’s shareholders. It is authorized for distribution to prospective investors only when preceded or accompanied by an effective prospectus. To receive a free copy of the prospectus or Statement of Additional Information, which includes additional information about Fund Trustees, please contact us by calling 1-800.835.3879. Distributed by Managers Distributors, Inc., member NASD.
A description of the policies and procedures each Fund uses to vote its proxies is available: (i) without charge, upon request, by calling 1-800.835.3879, or (ii) on the Securities and Exchange Commission’s (SEC) Web site at www.sec.gov. For information regarding each Fund’s proxy voting record for the 12-month period ended June 30, call 1-800.835.3879 or visit the SEC Web site at www.sec.gov.
The Fund files its complete schedule of portfolio holdings with the SEC for the first and third quarters of each fiscal year on Form N-Q. The Fund’s Forms N-Q are available on the SEC’s website at www.sec.gov. A Fund’s Forms N-Q may be reviewed and copied at the SEC’s Public Reference Room in Washington, DC. Information on the operation of the Public Reference Room may be obtained by calling 1-800-SEC-0330. To review a complete list of the Fund’s portfolio holdings, or to view the most recent quarterly holdings report, semiannual report, or annual report, please visit www.managersinvest.com.
AR010b-1005
| | |
| www.managersinvest.com | | |
ANNUAL REPORT
Managers Funds
October 31, 2005
| | • | | Managers Fremont Bond Fund |
MANAGERS FREMONT BOND FUND
(formerly Fremont Bond Fund)
Annual Report
October 31, 2005
TABLE OF CONTENTS
Nothing contained herein is to be considered an offer, sale or solicitation of an offer to buy shares of The Managers Funds. Such offering is made only by Prospectus, which includes details as to offering price and other material information.
Letter to Shareholders
Dear Fellow Shareholder:
Over the past 12 months the markets have been beset with a number of difficult and unpredictable challenges, including a massive tsunami in Southeast Asia; continuing strife in the Middle East; numerous terrorist incidents; multiple hurricanes in the Gulf of Mexico; and a significant rise in energy prices. We are fortunate that the stock and bond markets have continued to perform so well under these circumstances.
These events serve to remind us that no one can predict the events that are going to shape the markets in coming months. This reinforces our belief that to invest successfully in an uncertain world you have to diversify your investments and be patient.
Most people think of diversification as holding different types of stocks and bonds, but we believe that there is another type of diversification that receives too little notice, and that is diversification by investment manager and holdings. Simply put, no single approach is going to succeed in every kind of market—some growth stock managers will be successful in a rising market, and some will be more successful in a stagnant market. This can be an issue with some investment firms that adhere to only one method of looking at the markets.
That is a major benefit that we bring you at Managers Funds—since we hire subadvisors (outside investment managers) to run our portfolios, we offer you a wide selection of very different investment styles to choose from, sometimes within the same asset class. Invest in multiple Managers Funds, and you can get managers with very different approaches and holdings, helping you reduce the risks created by changing economic conditions and natural and man-made events, such as those of the past 12 months.
We also believe that once you have made your manager selection, you must be patient. On the home page of our Web site at www.managersinvest.com, you will find a short article entitled “Stay Invested for the Long Term” that highlights how important it is to consistently stay in the market rather than trying to time the market. We think the implication is clear: to be successful in the market over the long term, select a wide variety of investments giving you good diversification, invest regularly and stick with your investment plan no matter what events dominate the news.
We invite you to visit our Web site on an ongoing basis to stay in tune with your Managers Funds holdings. The Web site provides detailed profiles of our subadvisors and their investment styles, as well as quarterly commentary on each Fund. If you have any questions, please do call us at 800.835.3879. Thank you for investing with Managers Funds.
Sincerely,
| | | | |
| | |
| | | | |
| Peter M. Lebovitz | | | | Thomas G. Hoffman, CFA |
| President | | | | Executive Vice President |
| Managers Funds | | | | Chief Investment Officer |
| | | | | Managers Investment Group LLC |
1
About Your Fund’s Expenses
As a shareholder of the Fund, you may incur two types of costs: (1) transaction costs, which may include sales charges (loads) on purchase payments; redemption fees; and exchange fees; and (2) ongoing costs, including management fees; distribution (12b-1) fees; and other Fund expenses. This Fund incurs only ongoing costs. This example is intended to help you understand your ongoing costs (in dollars) of investing in the Fund and to compare these costs with the ongoing costs of investing in other mutual funds. The example is based on an investment of $1,000 invested at the beginning of the period and held for the entire period as indicated below.
Actual Expenses
The first line of the table below provides information about the actual account values and actual expenses. You may use the information in this line, together with the amount you invested, to estimate the expenses that you paid over the period. Simply divide your account value by $1,000 (for example, an $8,600 account value divided by $1,000 = 8.6), then multiply the result by the number in the first line under the heading entitled “Expenses Paid During Period” to estimate the expenses you paid on your account during this period.
Hypothetical Example for Comparison Purposes
The second line of the table below provides information about hypothetical account values and hypothetical expenses based on the Fund’s actual expense ratio and an assumed annual rate of return of 5% before expenses, which is not the Fund’s actual return. The hypothetical account values and expenses may not be used to estimate the actual ending account balance or expenses you paid for the period. You may use this information to compare the ongoing costs of investing in the Fund and other funds by comparing this 5% hypothetical example with the 5% hypothetical examples that appear in the shareholder reports of other funds.
Please note that the expenses shown in the table are meant to highlight your ongoing costs only and do not reflect any transactional costs, such as sales charges (loads), redemption fees, or exchange fees. Therefore, the second line of the table is useful in comparing ongoing costs only, and will not help you determine the relative total costs of owning different funds.
| | | | | | | | | |
Six Months Ended October 31, 2005
| | Beginning
Account
Value
4/30/2005
| | Ending
Account
Value
10/31/2005
| | Expenses
Paid
During
the Period*
|
Managers Fremont Bond Fund | | | | | | | | | |
Based on Actual Fund Return | | $ | 1,000 | | $ | 1,004 | | $ | 3.03 |
Based on Hypothetical 5% Annual Return | | $ | 1,000 | | $ | 1,022 | | $ | 3.06 |
| * | Expenses are equal to the Fund’s annualized expense ratio multiplied by the average account value over the period, multiplied by the number of days in the most recent fiscal half-year (184 days), then divided by the number of days in the full fiscal year (365 days). |
2
Managers Fremont Bond Fund
Portfolio Manager Comments
Managers Fremont Bond Fund (the “Fund”) seeks to maximize total return consistent with the preservation of capital by investing in debt securities such as corporate, mortgage backed, international and government bonds. Normally, the Fund will invest at least 80% of its total assets in these types of bonds.
The Portfolio Managers
Pacific Investment Management Company, LLC
Pacific Investment Management Company, LLC (“PIMCO”), the subadvisor for the Managers Fremont Bond Fund was founded in 1971. PIMCO is one of the world’s leading fixed income managers with expertise and significant resources committed to virtually every sector of the global bond market.
Managers Fremont Bond Fund is an actively managed, diversified bond fund that focuses on intermediate-term, investment-grade bonds. The universe for the Fund includes all sectors of the bond market: governments, corporate bonds, mortgages, asset-backed securities, money market instruments and international bonds. The Fund seeks total return consistent with preservation of capital by employing PIMCO’s “Total Return” fixed investment philosophy. This philosophy follows three key principles:
| | • | | Major shifts in portfolio strategy are driven by longer-term, or secular, trends as opposed to short-term interest rate fluctuations. |
| | • | | Consistent investment performance is achieved by avoiding extreme swings in maturity/duration of a portfolio. |
| | • | | Emphasis is placed on adding value through state-of-the-art tools such as futures, options and volatility analysis. |
Economic analysis serves as the base for PIMCO’s portfolio strategy. Annually, PIMCO investment professionals conduct a 3-day secular forum, where long-term economic and market forces are evaluated and portfolio strategies are set. Each quarter, the team meets to evaluate the current business cycle and develop shorter-term forecasts which are used to fine-tune investment strategy. PIMCO’s fixed income research efforts focus on identifying relative value and understanding the risks inherent in different portfolio structures, strategies and bond market sectors. Using proprietary analytics and bottom-up credit analysis, the portfolio managers select individual bonds based on recommendations from sector analysts (who specialize in corporate, mortgage, high yield, government and international bonds).
The ideal investment exhibits many of the following traits:
| | • | | It allows management to meet its overall portfolio positioning targets. Management typically invests in investment grade securities but may invest up to 10% of the portfolio in securities that are below investment grade. |
| | • | | The investment has been independently analyzed by PIMCO. PIMCO does not rely solely on the credit ratings assigned by outside credit agencies. |
| | • | | Fund management deems that the security provides value relative to other securities within the same sector. |
Portfolio management:
| | • | | Is committed to seeking value across all bond market sectors. |
| | • | | Actively manages duration exposure, yield curve position, volatility, sector allocation and security selection and takes only modest exposures in each of these areas relative to the market. |
| | • | | Normally hedges at least 75% of its foreign currency exposure. |
| | • | | Utilizes derivatives (futures, options, swap agreements) as substitutes for physical securities as a means of gaining more cost-effective exposure. |
3
Managers Fremont Bond Fund
Portfolio Manager Comments (continued)
The investment team may sell securities when:
| | • | | Securities individually no longer represent relative value. |
| | • | | Fund management makes a shift in its portfolio strategy (change in duration, yield curve positioning, sector strategy, etc.). |
The Year in Review
The bond market posted positive returns in the fiscal year ended October 31, 2005, despite facing considerable headwinds throughout the period. The market was exposed to high levels of volatility, as investors often struggled to identify the trajectory of U.S. growth and inflation. The year was marked by surging energy prices, which were exacerbated by the September hurricane disasters in the Gulf Coast; inflationary concerns, as high energy prices threatened to be passed through to the consumer; and a “bubbling” housing sector, which, if popped posed a threat to consumer spending. As the Federal Reserve hiked the Fed Funds rate from 1.75% to 3.75% over the period to achieve a more “neutral” level, longer maturity bond yields did not follow and remained relatively low, causing Fed Chairman Alan Greenspan to refer to the situation as a “conundrum.” This dramatic flattening of the yield curve increased speculation that the curve might invert from its normal upward slope, a dynamic often associated with future economic recessions.
For the 12-month period ending October 31, 2005, the Managers Fremont Bond Fund returned 2.00%, outperforming its benchmark, the Lehman Brothers Aggregate Bond Index by 0.87% (87 basis points). This outperformance was driven by various investment strategies, including: tactical management of yield curve and duration; diversifying exposure to out of index sectors; and an emphasis on high quality credits. Both a significant underweight to corporate bonds and a modest overweight to mortgage backed securities were neutral for performance, but security selection in both sectors added to relative returns. The portfolio’s exposure to currency hedged Euroland government issues added to performance, as lower inflation risk and slow economic growth held European rates down relative to U.S. rates. Modest exposure to emerging market debt was also a meaningful source of added return, as emerging economy fundamentals and improving credit quality led the asset class to outperform all other fixed income sectors over the period. An allocation to inflation-protected securities and municipal bonds added incremental return, as these sectors tend to outperform in volatile and rising rate environments. Conversely, the Fund’s small exposure to the Japanese Yen detracted from returns as the U.S. dollar rallied due to continued Fed rate hikes.
Looking Forward
The investment team at PIMCO currently expects that: The U.S. economy will grow more slowly over the next year with some increase in headline consumer price inflation; The yield on the benchmark 10-year Treasury will range between 3.75% and 4.50%; The combination of slower growth and continued flows of capital into U.S. fixed income markets from high saving countries will keep rates in this range; And the Federal Reserve will stop tightening at a federal funds rate near 4 percent as growth decelerates and the housing market cools.
The economic outlook is highly uncertain, however, because it is not clear how several key factors will play out. The first is the lagged impact of higher energy prices over the past year, driven by increased demand from China and elsewhere. Another is the more recent jolt delivered by higher natural gas and gasoline prices in the aftermath of hurricanes on
4
Managers Fremont Bond Fund
Portfolio Manager Comments (continued)
the U.S. Gulf Coast. Additionally, PIMCO expects that the U.S. economy will be hit with a slowing property market arising from reduced affordability of housing. An offsetting positive factor is expected to be the continued strength of U.S. corporate investment.
Key elements of PIMCO’s forecast are:
| | • | | A Slowdown in U.S. Housing – The direction of the U.S. housing market will be a critical factor in determining Fed policy over the next year. Recent gains in the U.S. property market have not only supported consumer confidence but also produced a surge in housing-related employment and residential investment. The greatest threat to the housing market is a decline in affordability. The last decade’s gains in home prices relative to incomes are not sustainable because higher mortgage rates and increased energy prices will reduce what consumers can afford. |
| | • | | But Not a Collapse – PIMCO believes that while the U.S. property market suffers from regional froth, the bubble does not extend nationwide. A soft landing, meaning a slowing in the rate of appreciation but not an outright decline, is their most likely scenario. They do not expect housing to crash because supply and demand nationwide are relatively balanced, lending conditions are favorable and low unemployment continues to support incomes and demand. |
| | • | | European Growth to Remain Meager – Domestic demand in Euroland is weak even though the region has enjoyed housing gains relative to personal incomes that exceed those in the U.S. The reason is anemic real wage growth, which dampens consumer confidence. PIMCO sees no evidence that these conditions will change over a cyclical time frame. If the European Central Bank takes any action over the next year, the most likely course will be to ease. |
| | • | | Japan and China to Contribute – Japan’s recovery appears durable after many false starts in the recent past. While investment by Japanese companies still lags their cash flows, the momentum in capital spending is strong. Consumer confidence is on the rise given improved labor market conditions and wage gains. Lower expected volatility in China’s economy will be positive for growth throughout Asia. Tight credit conditions have cooled the Chinese property market and prodded a shift in investment away from real estate. China’s currency revaluation is expected to have little impact on its trade balance as wage differentials between China and developed economies remain substantial. |
| | • | | Benign Core Inflation – Strong competition in globally traded goods and services will restrain core inflation (CPI less food and energy prices) even as headline inflation measures rise. Inflation is well contained in Euroland, where slow growth has driven core inflation below 2 percent. Japan will likely turn the corner from deflation to modest inflation. |
5
Managers Fremont Bond Fund
Portfolio Manager Comments (continued)
PIMCO takes moderate risks across a variety of strategies, but they will be especially price and value-sensitive in an unusually ambiguous economic environment. Major strategies will include:
| | • | | Interest Rate Strategies – They plan to target duration moderately above the index given an expected slowdown in growth, but retain tactical flexibility to trim this exposure should rates drop toward the lower end of their forecasted range. PIMCO plans to avoid longer maturity U.S. Treasuries, which offer little extra yield now that the yield curve has flattened considerably and are more sensitive to shifting expectations for headline inflation. Shorter maturities that react more to central bank policies are a better value given their forecast that these interest rates will be lower than markets now expect. |
| | • | | Mortgage-Backed Bonds – PIMCO will overweight mortgage-backed bonds, which continue to be an important structural holding because of their high credit quality and yield advantage versus Treasuries. However, most of PIMCO’s attempted added value will come from mortgage coupon and security selection. |
| | • | | Corporates – Valuation remains a major risk in the corporate bond market. With credit premiums overall near historic lows, PIMCO will retain its underweight to corporates. Pockets of value do exist, however, in select sectors with strong collateral protection, such as autos, telecom and utilities. |
| | • | | TIPS and Munis – They plan to retain modest tactical holdings of these defensive securities as a hedge against economic uncertainty. PIMCO has reduced its TIPS exposure in 2005 as real return bonds have rallied, but some exposure is still justified as a hedge in case inflation pressures prove greater than anticipated. The case for municipal bonds is similar, since munis typically hold their value better than taxable bonds when rates rise. In addition, muni yields remain attractive relative to taxable yields on a historical basis. |
| | • | | Emerging Markets – Most emerging economies continue to see improving credit fundamentals. Despite their recent gains, these issues still offer attractive yields compared to other credit-intensive alternatives such as corporate bonds. They will therefore retain the Fund’s exposure to this sector, though they do not plan to add to their positions. |
| | • | | Currency – Given PIMCO’s secular forecast for a weak dollar, a modest currency allocation focused on the yen and emerging market currencies has the potential to add value. |
6
Managers Fremont Bond Fund
Portfolio Manager Comments (continued)
Cumulative Total Return Performance
The Fund’s cumulative total return is based on the daily change in net asset value (NAV), and assumes that all distributions were reinvested. The Lehman Brothers Aggregate Bond Index (“Lehman Aggregate Bond”) is an index of the U.S. investment grade fixed-rate bond market, including both government and corporate bonds. Unlike the Fund, Lehman Aggregate Bond is unmanaged, is not available for investment, and does not incur expenses. The chart illustrates the performance of a hypothetical $10,000 investment made in the Fund on October 31, 1995, to a $10,000 investment made in the Lehman Aggregate Bond for the same time period. Performance for periods longer than one year is annualized. The graph and table do not reflect the deduction of taxes that a shareholder would pay on a Fund distribution or redemption of shares. Total returns for the Fund would have been lower had certain expenses not been reduced.
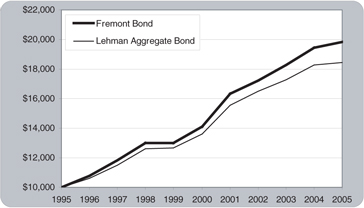
The table below shows the average annual total returns for Managers Fremont Bond Fund and the Lehman Brothers Aggregate Bond Index since October 31, 1995 through October 31, 2005.
| | | | | | | | | |
Average Annual Total Returns:
| | 1 Year
| | | 5 Years
| | | 10 Years
| |
Fremont Bond | | 2.00 | % | | 7.07 | % | | 7.09 | % |
Lehman Brothers Aggregate Bond | | 1.13 | % | | 6.31 | % | | 6.32 | % |
The performance data shown represents past performance. Past performance is not a guarantee of future results. Current performance may be lower or higher than the performance data quoted. The investment return and the principal value of an investment will fluctuate so that an investor’s shares, when redeemed, may be worth more or less than their original cost. For performance information through the most recent month end please call (800) 835-3879 or visit our Web site at www.managersinvest.com.
Fixed Income Funds are subject to the risks associated with investments in debt securities, such as default risk and fluctuations in the perception of the debtor’s ability to pay its creditors. Changing interest rates may adversely affect the value of a fixed income investment. An increase in interest rates typically causes the value of bonds and other fixed-income securities to fall.
7
Managers Fremont Bond Fund
Fund Snapshots
October 31, 2005
Summary of Portfolio Credit Quality
| | | |
Portfolio Credit Quality
| | Percentage of
Net Assets
| |
Aaa | | 88.0 | % |
Aa | | 0.6 | |
A | | 1.8 | |
Baa | | 5.6 | |
Ba and lower | | 4.0 | |
| | |
|
|
| | | 100.0 | % |
| | |
|
|
Top Ten Holdings
| | | |
Security Name
| | Percentage of
Net Assets
| |
FNMA, 5.500%, 02/01/35 | | 5.1 | % |
FNMA, 5.000%, 11/13/33 | | 4.3 | |
Rabobank USA Financial Corp., Discount Notes, 3.880%, 12/30/05 | | 2.7 | |
Bank of Ireland, Discount Notes, 3.770%, 12/13/05 | | 2.7 | |
Danske Corp., Discount Notes, 3.750%, 12/15/05 | | 2.7 | |
FHLMC Discount Notes, 0.000%, 12/12/05 | | 2.7 | |
Barclays U.S. Funding Corp., Discount Notes, 3.740%, 11/22/05 | | 2.7 | |
Societe Generale N.A., Discount Notes, 3.710%, 11/18/05 | | 2.7 | |
Spintab AB, 3.710%, 12/08/05 | | 2.6 | |
HBOS Treasury Services PLC, 3.690%, 12/09/05 | | 2.6 | |
| | |
|
|
Top Ten as a Group | | 30.8 | % |
| | |
|
|
Any sectors, industries, or securities discussed should not be preceived as investment recommendations. Mention of a specific security should not be considered a recommendation to buy or solicitation to sell the security. Any securities discussed may no longer be held in the account’s portfolio. It should not be assumed that any of the securities transactions discussed were or will prove to be profitable, or that the investment recommendations we make in the future will be profitable.
8
Managers Fremont Bond Fund
Schedule of Portfolio Investments
October 31, 2005
| | | | | | |
| | | Principal
Amount
| | Value
|
Corporate Bonds - 8.5% | | | | | | |
Asset-Backed Securities - 4.0% | | | | | | |
AAA Trust, Series 2005-2, Class A1, 4.151%, 11/26/35 (a)1 | | $ | 2,808,735 | | $ | 2,810,280 |
Aames Mortgage Investment Trust, Series 2005-2, Class 1A1, 4.118%, 07/25/351 | | | 211,088 | | | 211,213 |
American Home Mortgage Investment Trust, 4.390%, 02/25/451 | | | 2,135,970 | | | 2,092,977 |
Amortizing Residential Collateral Trust, 4.328%, 07/25/321 | | | 77,398 | | | 76,804 |
Badger Tobacco Asset Securitization Corp., 6.000%, 06/01/17 | | | 2,600,000 | | | 2,739,750 |
Banc of America Funding Corp., 4.117%, 05/25/351 | | | 2,049,295 | | | 2,020,420 |
Bear Stearns Adjustable Rate Mortgage Trust, 4.696%, 11/25/301 | | | 112,975 | | | 113,043 |
Bear Stearns Adjustable Rate Mortgage Trust, 5.070%, 04/25/331 | | | 1,346,478 | | | 1,316,638 |
Bear Stearns Adjustable Rate Mortgage Trust, 5.268%, 02/25/331 | | | 293,191 | | | 293,582 |
Bear Stearns Adjustable Rate Mortgage Trust, 5.279%, 10/25/321 | | | 91,638 | | | 91,384 |
Bear Stearns Alt-A Trust, 5.431%, 05/25/35 | | | 3,852,306 | | | 3,867,475 |
Bear Stearns Asset Backed Securities, Inc., 4.290%, 02/15/311 | | | 125,615 | | | 125,735 |
Capital Auto Receivables Asset Trust, Series 2005-1, Class A1, 3.980%, 06/15/06 (a)1 | | | 21,506 | | | 21,516 |
Carrington Mortgage Loan Trust, Series 2005-NC3, Class A1A, 4.118%, 06/25/351 | | | 753,431 | | | 753,195 |
Citibank Omni-S Master Trust, 4.350%, 11/17/091 | | | 7,700,000 | | | 7,704,798 |
Credit Suisse First Boston Mortgage Securities Corp., 4.590%, 08/25/33 (a) | | | 1,619,654 | | | 1,625,503 |
Credit Suisse First Boston Mortgage Securities Corp., 5.641%, 10/25/321 | | | 221,858 | | | 221,762 |
EMC Mortgage Loan Trust, Class A, 4.408%, 05/25/40 (a)1 | | | 2,485,135 | | | 2,493,897 |
GS Mortgage Securities Corp. II, 6.526%, 08/15/18 (a) | | | 800,000 | | | 857,326 |
Nationslink Funding Corp., 6.654%, 11/10/30 | | | 194,919 | | | 196,098 |
Prime Mortgage Trust, 2.930%, 02/25/191 | | | 174,637 | | | 174,964 |
Prime Mortgage Trust, 2.930%, 02/25/341 | | | 728,558 | | | 729,530 |
Prudential Home Mortgage Securities, 7.000%, 06/25/08 | | | 91,831 | | | 91,606 |
Structured Asset Mortgage Investments, Inc., 4.327%, 09/19/321 | | | 2,171,790 | | | 2,174,096 |
Structured Asset Securities Corp., 4.328%, 01/25/331 | | | 77,557 | | | 77,833 |
Structured Asset Securities Corp., 4.488%, 06/25/171 | | | 49,774 | | | 49,774 |
Structured Asset Securities Corp., 6.250%, 01/25/32 | | | 210,864 | | | 214,101 |
The accompanying notes are an integral part of these financial statements.
9
Managers Fremont Bond Fund
Schedule of Portfolio Investments (continued)
| | | | | | | |
| | | Principal
Amount
| | | Value
|
Asset-Backed Securities (continued) | | | | | | | |
U.S. Small Business Administration Participation Certificates, 5.130%, 09/01/23 | | $ | 177,382 | | | $ | 178,073 |
U.S. Small Business Administration Surety Bonds, 6.344%, 08/01/11 | | | 3,286,580 | | | | 3,426,138 |
U.S. Small Business Administration Surety Bonds, 7.449%, 08/01/10 | | | 98,734 | | | | 105,425 |
Washington Mutual MSC Mortgage Pass-Through, 5.771%, 02/25/311 | | | 381,723 | | | | 385,211 |
Washington Mutual Residential Secured Bonds, 2005-AR13, 4.328%, 10/25/451 | | | 1,200,000 | | | | 1,201,128 |
Wells Fargo Home Equity Trust, 4.198%, 06/25/191 | | | 8,209 | | | | 8,214 |
Total Asset-Backed Securities | | | | | | | 38,449,489 |
Finance - 2.8% | | | | | | | |
American General Finance Corp., 4.000%, 03/23/071 | | | 600,000 | | | | 600,019 |
American International Group, 5.050%, 10/01/15 (a) | | | 400,000 | | | | 391,744 |
China Development Bank, 5.000%, 10/15/15 | | | 300,0002 | | | | 291,094 |
Ford Motor Credit Co., 4.740%, 11/16/061 | | | 3,400,0002 | | | | 3,356,575 |
Ford Motor Credit Co., 5.800%, 01/12/09 | | | 8,500,000 | | | | 7,790,233 |
General Motors Acceptance Corp., 4.677%, 05/18/061 | | | 3,400,0002 | | | | 3,380,671 |
General Motors Acceptance Corp., 4.670%, 03/20/071 | | | 700,0002 | | | | 688,650 |
HBOS PLC, 5.920%, 09/01/49 (a) 1,5 | | | 400,000 | | | | 386,445 |
KBC Bank Fund Trust II, 6.875%, 06/30/491,5 | | € | 1,900,000 | | | | 2,542,439 |
Lloyds TSB Capital 1, L.P., 7.375%, 02/07/491,5 | | € | 1,800,000 | | | | 2,588,864 |
Qwest Capital Funding, Inc., 7.250%, 02/15/11 | | | 3,413,000 | 2 | | | 3,276,480 |
Resona Bank Ltd., 5.850%, 04/15/49 (a)1,5 | | | 600,000 | | | | 580,245 |
Royal Bank of Scotland Group PLC, 9.118%, 03/31/495 | | | 1,000,000 | | | | 1,150,300 |
UFJ Finance Aruba AEC, 6.750%, 07/15/13 | | | 500,000 | 2 | | | 541,910 |
Total Finance | | | | | | | 27,565,669 |
Industrials -1.7% | | | | | | | |
DaimlerChrysler, N.A. Holding Corp., 4.132%, 11/17/061 | | | 5,800,000 | | | | 5,806,780 |
Pemex Project Funding Master Trust, 8.000%, 11/15/11 | | | 1,800,000 | | | | 2,016,900 |
Pemex Project Funding Master Trust, 8.625%, 02/01/22 | | | 400,000 | | | | 479,000 |
Petroleum Export Ltd. (Cayman), 5.265%, 06/15/11 (a) | | | 300,000 | | | | 296,572 |
Ras Laffan Liquefied Natural Gas Co., Ltd, 5.298%, 09/30/20 (a) | | | 900,000 | | | | 879,668 |
Sonat, Inc., 7.625, 07/15/11 | | | 1,300,000 | | | | 1,313,000 |
Tennessee Gas Pipeline Co., 7.000%, 10/15/28 | | | 6,145,000 | | | | 5,968,251 |
Total Industrials | | | | | | | 16,760,171 |
Total Corporate Bonds (cost $77,570,048) | | | | | | | 82,775,329 |
The accompanying notes are an integral part of these financial statements.
10
Managers Fremont Bond Fund
Schedule of Portfolio Investments (continued)
| | | | | | | |
| | | Principal
Amount
| | | Value
|
Foreign Government and Agency Obligations - 2.6% | | | | | | | |
Canada Government Real Return Bonds, 3.000%, 12/01/36 | | $C | 417,700 | | | $ | 462,206 |
Export-Import Bank of China, The, 4.875%, 07/21/15(a) | | | 300,000 | | | | 287,117 |
Federal Republic of Brazil, 5.188%, 04/15/061 | | | 132,000 | 2 | | | 132,007 |
Federal Republic of Brazil, 5.250%, 04/15/091 | | | 205,898 | | | | 203,839 |
Federal Republic of Brazil, 5.250%, 04/15/091 | | | 41,180 | | | | 40,768 |
Federal Republic of Brazil, 7.875%, 03/07/15 | | | 3,200,000 | 2 | | | 3,259,200 |
Federal Republic of Brazil, 8.000%, 01/15/18 | | | 4,900,000 | 2 | | | 5,069,050 |
Federal Republic of Brazil, 9.760%, 06/29/091 | | | 100,000 | 2 | | | 116,625 |
Federal Republic of Brazil, 11.000%, 01/11/12 | | | 400,000 | 2 | | | 477,000 |
Mexico Government, 7.500%, 01/14/12 | | | 1,000,000 | | | | 1,110,500 |
Mexico Government, 8.375%, 01/14/11 | | | 600,000 | | | | 684,000 |
Republic of Panama, 8.250%, 04/22/08 | | | 500,000 | | | | 533,125 |
Republic of Panama, 8.875%, 09/30/27 | | | 200,000 | 2 | | | 233,500 |
Republic of Peru, 9.875%, 02/06/15 | | | 1,900,000 | 2 | | | 2,351,250 |
Russian Federation, 5.000%, 03/31/301 | | | 5,000,000 | | | | 5,570,185 |
Russian Federation, 5.000%, 03/31/30 (a)1 | | | 900,000 | | | | 1,001,250 |
United Mexican States, 6.375%, 01/16/13 | | | 1,860,000 | 2 | | | 1,953,000 |
United Mexican States, 8.000%, 09/24/22 | | | 1,000,000 | | | | 1,191,500 |
United Mexican States, 9.875%, 02/01/10 | | | 100,000 | | | | 117,635 |
United Mexican States, 11.375%, 09/15/16 | | | 300,000 | | | | 434,250 |
Total Foreign Government and Agency Obligations (cost $23,513,140) | | | | | | | 25,228,007 |
U.S. Government and Agency Obligations - 52.7% | | | | | | | |
Federal Home Loan Bank - 0.1%1,6 | | | | | | | |
FHLB, 0.000%, 02/05/07 | | | 700,000 | | | | 645,842 |
Federal Home Loan Mortgage Corporation - 2.9% | | | | | | | |
FHLMC, 4.470%, 09/15/301 | | | 121,259 | | | | 121,890 |
FHLMC, 4.901%, 11/01/351 | | | 7,219,167 | | | | 7,137,022 |
FHLMC, 5.000%, 10/01/18 to 11/01/18 | | | 2,953,888 | | | | 2,916,924 |
FHLMC, 5.638%, 07/01/30 | | | 6,693 | | | | 6,856 |
FHLMC, 6.000%, 02/01/16 to 09/01/16 | | | 511,235 | | | | 522,631 |
FHLMC, 6.500%, 01/01/26 to 08/15/31 | | | 15,747,389 | | | | 16,339,694 |
FHLMC, 7.000%, 11/15/20 | | | 60,996 | | | | 60,924 |
FHLMC, 7.500%, 08/15/30 | | | 934,551 | | | | 947,060 |
Total Federal Home Loan Mortgage Corporation | | | | | | | 28,053,001 |
Federal National Mortgage Association - 43.6% | | | | | | | |
FNMA, 3.799%, 09/22/061 | | | 3,700,000 | | | | 3,698,483 |
FNMA, 4.382%, 05/01/361 | | | 3,175,809 | | | | 3,198,628 |
FNMA, 4.446%, 05/01/361 | | | 1,833,266 | | | | 1,846,545 |
FNMA, 4.500%, 07/01/19 to 07/01/20 | | | 1,893,553 | | | | 1,832,680 |
FNMA, 4.699%, 09/01/351 | | | 7,004,430 | | | | 6,933,726 |
FNMA, 4.841%, 06/01/351 | | | 9,503,756 | | | | 9,402,046 |
FNMA, 5.000%, 12/01/17 to 10/01/35 | | | 121,364,898 | | | | 118,403,249 |
FNMA, 5.500%, 02/01/17 to 11/01/35 | | | 273,347,151 | | | | 269,941,202 |
The accompanying notes are an integral part of these financial statements.
11
Managers Fremont Bond Fund
Schedule of Portfolio Investments (continued)
| | | | | | | |
| | | Principal
Amount
| | | Value
|
Federal National Mortgage Association (continued) | | | | | | | |
FNMA, 6.000%, 04/01/16 to 11/01/33 | | $ | 4,878,793 | | | $ | 4,993,303 |
FNMA, 7.200%, 05/25/23 | | | 1,654,186 | | | | 1,733,577 |
FNMA, 7.500%, 02/25/08 | | | 100,000 | | | | 102,907 |
FNMA Grantor Trust, 3.712%, 11/28/351 | | | 656,089 | | | | 655,935 |
FNMA Whole Loan, 6.500%, 12/25/42 | | | 731,254 | | | | 748,609 |
Total Federal National Mortgage Association | | | | | | | 423,480,890 |
Government National Mortgage Association - 1.2% | | | | | | | |
GNMA, 3.375%, 04/20/21 to 03/20/24 | | | 111,070 | | | | 111,295 |
GNMA, 3.750%, 08/20/25 | | | 67,586 | | | | 68,668 |
GNMA, 4.125%, 11/20/24 to 11/20/29 | | | 981,726 | | | | 991,433 |
GNMA, 6.500%, 06/20/28 | | | 2,080,185 | | | | 2,146,380 |
GNMA, 6.750%, 10/16/40 | | | 7,183,857 | | | | 8,065,199 |
Total Government National Mortgage Association | | | | | | | 11,382,975 |
United States Treasury Bonds – 4.0% | | | | | | | |
U.S. Treasury Bonds, 2.375%, 01/15/25 | | | 6,250,560 | | | | 6,506,202 |
U.S. Treasury Bonds, 6.000%, 02/15/26 | | | 1,400,000 | 2 | | | 1,609,891 |
U.S. Treasury Bonds, 6.250%, 08/15/23 | | | 2,800,000 | 2 | | | 3,268,672 |
U.S. Treasury Bonds, 6.625%, 02/15/27 | | | 200,000 | 2 | | | 247,445 |
U.S. Treasury Bonds, 7.875%, 02/15/21 | | | 7,600,000 | 2 | | | 10,105,332 |
U.S. Treasury Bonds, 8.000%, 11/15/21 | | | 8,900,000 | 2 | | | 12,037,944 |
U.S. Treasury Bonds, 8.125%, 05/15/21 | | | 2,600,000 | | | | 3,535,189 |
U.S. Treasury Inflation Indexed Bonds, 3.375%, 01/15/077 | | | 867,594 | | | | 890,437 |
U.S. Treasury Inflation Indexed Bonds, 3.625%, 04/15/28 | | | 849,870 | 2 | | | 1,080,829 |
Total United States Treasury Bonds | | | | | | | 39,281,941 |
United States Treasury Notes - 0.9% | | | | | | | |
U.S. Treasury Notes, 3.500%, 12/15/10 | | | 300,000 | 2 | | | 288,821 |
U.S. Treasury Notes, 3.875%, 09/15/10 | | | 4,600,000 | | | | 4,481,049 |
U.S. Treasury Notes, 4.250%, 08/15/15 | | | 4,500,000 | | | | 4,392,423 |
Total United States Treasury Notes | | | | | | | 9,162,293 |
Total U.S. Government and Agency Obligations (cost $519,810,255) | | | | | | | 512,016,942 |
Municipal Bonds - 1.6% | | | | | | | |
Liberty, New York, Development Corp., Goldman Sachs Headquarters, 5.250%, 10/01/35 | | | 400,000 | | | | 438,500 |
New York City Transitional Finance Authority, Residuals - Series 1093, 7.140%, 02/01/33 (a)1 | | | 3,550,000 | | | | 3,731,938 |
New York State Environmental Facilities Corp., State Clean Water & Drinking Residuals, Series 658, 7.340%, 06/15/23 (a)1 | | | 1,050,000 | | | | 1,156,312 |
New York, N.Y. Residual - Series 1027, Municipal Bond, 7.040%, 03/01/30 (a)1 | | | 250,000 | | | | 259,063 |
State of Texas, Rite-PA 1306, 4.750%, 04/01/35 (a)1 | | | 600,000 | | | | 603,750 |
The accompanying notes are an integral part of these financial statements.
12
Managers Fremont Bond Fund
Schedule of Portfolio Investments (continued)
| | | | | | | |
| | | Principal
Amount
| | | Value
|
Municipal Bonds (continued) | | | | | | | |
Tobacco Settlement Funding Corp. NJ, 4.375%, 06/01/19 | | $ | 1,675,000 | | | $ | 1,675,000 |
Tobacco Settlement Funding Corp. NJ, 6.125%, 06/01/24 | | | 950,000 | | | | 1,061,625 |
Tobacco Settlement Funding Corp. NJ, 6.750%, 06/01/39 | | | 5,350,000 | | | | 6,152,500 |
Total Municipal Bonds (cost $14,115,404) | | | | | | | 15,078,688 |
| | |
| | | Shares
| | | |
Municipal Funds - 1.2% | | | | | | | |
Dreyfus Municipal Income, Inc. | | | 37,500 | 2 | | | 339,000 |
Managed Municipals Portfolio, Inc. | | | 55,000 | 2 | | | 586,850 |
MFS Municipal Income Trust | | | 53,800 | 2 | | | 445,464 |
MuniEnhanced Fund, Inc. | | | 44,000 | | | | 488,400 |
MuniHoldings Florida Insured Fund | | | 25,000 | | | | 367,750 |
MuniHoldings Insured Fund II, Inc. | | | 51,900 | 2 | | | 701,169 |
MuniVest Fund, Inc. | | | 55,000 | | | | 539,000 |
MuniYield Fund, Inc. | | | 55,000 | 2 | | | 781,000 |
MuniYield Quality Fund II, Inc. | | | 55,000 | | | | 707,300 |
MuniYield Quality Fund, Inc. | | | 55,000 | 2 | | | 784,850 |
Nuveen Performance Plus Municipal Fund | | | 55,000 | 2 | | | 793,650 |
Nuveen Premium Income Municipal Fund 2 | | | 55,000 | | | | 768,350 |
Nuveen Premium Income Municipal Fund 4 | | | 55,000 | 2 | | | 677,050 |
Nuveen Quality Income Municipal Fund | | | 55,000 | | | | 788,700 |
Putnam Municipal Bond Fund | | | 48,000 | | | | 579,360 |
Salomon Brothers Municipal Partners Fund, Inc. | | | 15,600 | 2 | | | 216,528 |
Scudder Municipal Income Trust | | | 55,000 | 2 | | | 706,200 |
Van Kampen Municipal Opportunity Trust II | | | 45,600 | | | | 600,552 |
Van Kampen Trust for Investment Grade Municipals | | | 55,000 | | | | 803,550 |
Van Kampen Value Municipal Income Trust | | | 14,200 | | | | 189,996 |
Total Municipal Funds (cost $11,638,151) | | | | | | | 11,864,719 |
Preferred Stock - 0.7% | | | | | | | |
DG Funding Trust, 6.270% (a)1 | | | 573 | | | | 6,157,959 |
FNMA, 7.000%1 | | | 12,800 | | | | 704,000 |
Total Preferred Stock (cost $6,689,560) | | | | | | | 6,861,959 |
Rights - 0.1% | | | | | | | |
United Mexican States Value Recovery Rights, Series D, Exp. June 2006 | | | 17,761,000 | | | | 394,294 |
United Mexican States Value Recovery Rights, Series E, Exp. June 2007 | | | 11,950,000 | | | | 322,650 |
Total Rights (cost $229,518) | | | | | | | 716,944 |
| | |
| | | Notional
Amount
| | | |
Options and Swaptions - 0.0%# | | | | | | | |
3-Month LIBOR (Put), $92.00,12/19/05 | | | 200,000 | | | | 0 |
3-Month LIBOR (Put), $94.50, 03/13/06 | | | 750,000 | | | | 1,875 |
3-Month LIBOR (Call), 4.250%, 10/11/06 | | | 17,000,000 | | | | 29,716 |
The accompanying notes are an integral part of these financial statements.
13
Managers Fremont Bond Fund
Schedule of Portfolio Investments (continued)
| | | | | | |
| | | Notional
Amount
| | Value
|
Options and Swaptions (continued) | | | | | | |
3-Month LIBOR (Call), 4.250%, 10/12/06 | | | 17,000,000 | | $ | 29,835 |
3-Month LIBOR (Call), 4.250%, 10/19/06 | | | 5,000,000 | | | 9,035 |
3-Month LIBOR (Call), 4.250%, 10/24/06 | | | 10,000,000 | | | 18,880 |
3-Month LIBOR (Call), 4.250%, 10/25/06 | | | 23,000,000 | | | 42,734 |
3-Month LIBOR (Call), 4.500%, 04/04/06 | | | 11,000,000 | | | 12,617 |
3-Month LIBOR (Call), 4.500%, 04/06/06 | | | 15,100,000 | | | 17,576 |
3-Month LIBOR (Call), 4.500%, 06/02/06 | | | 1,000,000 | | | 3,532 |
3-Month LIBOR (Call), 4.500%, 10/04/06 | | | 11,700,000 | | | 34,667 |
3-Month LIBOR (Call), 4.500%, 10/04/06 | | | 16,000,000 | | | 44,704 |
3-Month LIBOR (Call), 4.500%, 10/18/06 | | | 32,000,000 | | | 99,008 |
Total Options and Swaptions (cost $619,477) | | | | | | 344,179 |
| | |
| | | Principal Amount
| | |
Short-Term Investments - 43.9% | | | | | | |
Certificates of Deposit - 0.3% | | | | | | |
Morgan Stanley Warehouse Facilities, 4.200%, 10/29/061 | | $ | 2,400,000 | | | 2,400,000 |
Commercial Paper - 31.2% | | | | | | |
Bank of Ireland, Discount Notes, 3.770%, 12/13/05 | | | 26,400,000 | | | 26,284,192 |
Barclays U.S. Funding Corp., Discount Notes, 3.740%, 11/22/05 | | | 26,100,000 | | | 26,042,982 |
Barclays U.S. Funding Corp., Discount Notes, 3.820%, 12/27/05 | | | 2,800,000 | | | 2,783,318 |
Danske Corp., Discount Notes, 3.750%, 12/15/05 | | | 26,400,000 | | | 26,278,839 |
Danske Corp., Discount Notes, 3.890%, 01/17/06 | | | 1,300,000 | | | 1,289,434 |
Danske Corp., Discount Notes, 3.620%, 11/07/05 | | | 1,500,000 | | | 1,499,094 |
HBOS Treasury Services PLC, 3.690%, 12/09/05 | | | 25,000,000 | | | 24,902,493 |
IXIS Commercial Paper Corp., Discount Notes, 3.850%, 01/18/06 | | | 9,400,000 | | | 9,321,588 |
IXIS Commercial Paper Corp., Discount Notes, 3.770%, 12/15/05 | | | 19,200,000 | | | 19,111,531 |
Rabobank USA Financial Corp., Discount Notes, 3.880%, 12/30/05 | | | 26,600,000 | | | 26,429,764 |
Skandi Ensk Bank Discount Notes, 3.710%, 11/21/05 | | | 500,000 | | | 498,969 |
Skandi Ensk Bank Discount Notes, 3.840%, 12/22/05 | | | 500,000 | | | 497,273 |
Skandi Ensk Bank Discount Notes, 4.060%, 01/19/06 | | | 7,200,000 | | | 7,135,694 |
Societe Generale N.A., Discount Notes, 3.710%, 11/18/05 | | | 26,000,000 | | | 25,954,449 |
Societe Generale N.A., Discount Notes, 3.750%, 12/12/05 | | | 3,100,000 | | | 3,086,743 |
Societe Generale N.A., Discount Notes, 4.130%, 02/01/06 | | | 300,000 | | | 296,822 |
Spintab AB, 3.710%, 12/08/05 | | | 25,000,000 | | | 24,904,674 |
Swedbank, 3.900%, 12/28/05 | | | 4,200,000 | | | 4,173,999 |
Total Fina Elf SA, 3.750%, 12/01/05 | | | 18,500,000 | | | 18,442,033 |
The accompanying notes are an integral part of these financial statements.
14
Managers Fremont Bond Fund
Schedule of Portfolio Investments (continued)
| | | | | | | | |
| | | Principal
Amount
| | | Value
| |
Commercial Paper (continued) | | | | | | | | |
UBS Finance (Delaware) LLC, Discount Notes, 3.720%, 12/09/05 | | $ | 300,000 | | | $ | 299,060 | |
UBS Finance (Delaware) LLC, Discount Notes, 3.760%, 12/01/05 | | | 300,000 | | | | 298,819 | |
UBS Finance (Delaware) LLC, Discount Notes, 3.640%, 11/28/05 | | | 19,500,000 | | | | 19,446,911 | |
UBS Finance (Delaware) LLC, Discount Notes, 3.970%, 11/01/05 | | | 1,900,000 | | | | 1,900,000 | |
UBS Finance (Delaware) LLC, Discount Notes, 4.110%, 02/28/06 | | | 2,900,000 | | | | 2,860,170 | |
Westpac Capital Corp., Discount Notes, 3.890%, 12/23/05 | | | 10,500,000 | | | | 10,440,850 | |
Westpac Banking Corp., Discount Notes, 4.050%, 01/17/06 | | | 18,600,000 | | | | 18,438,679 | |
Total Commercial Paper | | | | | | | 302,618,380 | |
U.S. Government and Agency Discount Notes - 4.4%6 | | | | | | | | |
FHLMC, Discount Notes, 0.000%, 11/02/05 to 12/12/05 | | | 38,600,000 | | | | 38,488,456 | |
U.S. Treasury Bills, Discount Notes, 0.000%, 12/15/05 | | | 4,645,000 | 2 | | | 4,624,655 | |
Total U.S. Government and Agency Discount Notes | | | | | | | 43,113,111 | |
| | |
| | | Shares
| | | | |
Other Investment Companies - 8.0%3 | | | | | | | | |
Bank of New York Institutional Cash Reserves Fund, 3.97%4 | | | 62,091,843 | | | | 62,091,843 | |
JPMorgan Prime Money Market Fund, Institutional Class Shares, 3.73% | | | 15,959,853 | | | | 15,959,853 | |
Total Other Investment Companies | | | | | | | 78,051,696 | |
Total Short-Term Investments (cost $426,184,034) | | | | | | | 426,183,187 | |
Total Investments - 111.3% (cost $1,080,369,587) | | | | | | | 1,081,069,954 | |
Other Assets, less Liabilities - (11.3)% | | | | | | | (109,940,158 | ) |
Net Assets -100.0% | | | | | | $ | 971,129,796 | |
The accompanying notes are an integral part of these financial statements.
15
Managers Fremont Bond Fund
Notes to Schedule of Portfolio Investments
The following footnotes and abbreviations are to be read in conjunction with the Schedule of Portfolio Investments previously presented in this report.
| | |
| Note: | | Based on the cost of investments of $1,080,393,933 for Federal income tax purposes at April 30, 2005, the aggregate gross unrealized appreciation and depreciation were $10,505,506 and $9,829,485, respectively, resulting in net unrealized appreciation of investments of $676,021. |
| |
| * | | Non-income-producing securities. |
| |
| (a) | | Security exempt from registration under Rule 144A of the Securities Act of 1933. This security may be resold in transactions exempt from registration, normally to qualified buyers. At October 31, 2005, the value of these securities amounted to $20,759,571, or 2.1% of net assets. |
| |
| 1 | | Variable Rate Security. The rate listed is as of October 31, 2005. |
| |
| 2 | | Some or all of these shares, amounting to a market value of $60,887,021, or 6.3% of net assets, were out on loan to various brokers. |
| |
| 3 | | Yield shown for an investment company represents the October 31, 2005, seven-day average yield, which refers to the sum of the previous seven days’ dividends paid, expressed as an annual percentage. |
| |
| 4 | | Collateral received from brokers for securities lending was invested in this short-term investment. |
| |
| 5 | | Perpetuity Bond. The date shown is the final call date. |
| |
| 6 | | Zero coupon security. |
| |
| 7 | | Security held as collateral for futures contracts, amounting to a market value of $890,437, or 0.1% of net assets. |
| |
| # | | Rounds to less than 0.1%. |
Investment Definitions and Abbreviations:
FHLMC: Federal Home Loan Mortgage Corp.
FHLB: Federal Home Loan Bank
FNMA: Federal National Mortgage Association
GNMA: Government National Mortgage Association
Abbreviations have been used throughout the portfolios to indicate amounts shown in currencies other than the U.S. dollar (USD):
| | |
€: Euro | | $C: Canadian Dollar |
The accompanying notes are an integral part of these financial statements.
16
Managers Fremont Bond Fund
Statement of Assets and Liabilities
October 31, 2005
| | | | |
Assets: | | | | |
Investments at value* (including securities on loan valued at $60,887,021) | | $ | 1,081,069,954 | |
Cash | | | 2,299,321 | |
Foreign currency** | | | 365,715 | |
Receivable for investments sold | | | 4,105,803 | |
Receivable for Fund shares sold | | | 1,079,802 | |
Unrealized appreciation on foreign currency contracts | | | 50,298 | |
Swaps premiums paid | | | 183,229 | |
Unrealized appreciation on swaps | | | 16,672 | |
Dividends, interest and other receivables | | | 4,206,918 | |
Prepaid expenses | | | 14,342 | |
| | |
|
|
|
Total assets | | | 1,093,392,054 | |
| | |
|
|
|
Liabilities: | | | | |
Payable for investments purchased | | | 53,860,338 | |
Payable for Fund shares repurchased | | | 590,043 | |
Payable upon return of securities loaned | | | 62,091,843 | |
Unrealized depreciation on foreign currency contracts | | | 388,975 | |
Variation margin payable | | | 32,231 | |
Liability for options written (premiums received $1,410,189) | | | 1,548,511 | |
Swap premiums received | | | 2,028,860 | |
Unrealized depreciation on swaps | | | 513,899 | |
Dividends payable to shareholders | | | 535,098 | |
Accrued expenses: | | | | |
Investment advisory and management fees | | | 242,714 | |
Administrative fees | | | 164,487 | |
Other | | | 265,259 | |
| | |
|
|
|
Total liabilities | | | 122,262,258 | |
| | |
|
|
|
Net Assets | | $ | 971,129,796 | |
| | |
|
|
|
Shares outstanding | | | 94,208,090 | |
| | |
|
|
|
Net asset value, offering and redemption price per share | | $ | 10.31 | |
| | |
|
|
|
Net Assets Represent: | | | | |
Paid-in capital | | $ | 969,898,162 | |
Undistributed net investment income | | | 1,207,521 | |
Accumulated net realized gain from investments, options, futures, swaps, foreign currency contracts and transactions | | | 3,915,435 | |
Net unrealized depreciation of investments, options, futures, foreign currency contracts and translations | | | (3,891,322 | ) |
| | |
|
|
|
Net Assets | | $ | 971,129,796 | |
| | |
|
|
|
* Investments at cost | | $ | 1,080,369,587 | |
** Foreign currency at cost | | $ | 366,156 | |
The accompanying notes are an integral part of these financial statements.
17
Managers Fremont Bond Fund
Statement of Operations
For the fiscal year ended October 31, 2005
| | | | |
Investment Income: | | | | |
Interest income | | $ | 34,983,526 | |
Dividend income | | | 1,265,448 | |
Securities lending fees | | | 192,758 | |
| | |
|
|
|
Total investment income | | | 36,441,732 | |
| | |
|
|
|
Expenses: | | | | |
Investment advisory and management fees | | | 3,616,642 | |
Administrative fees | | | 1,666,598 | |
Transfer agent fees | | | 364,376 | |
Custodian fees | | | 275,697 | |
Insurance | | | 236,981 | |
Professional fees | | | 147,250 | |
Trustees fees and expenses | | | 70,544 | |
Reports to shareholders | | | 64,012 | |
Registration fees | | | 39,664 | |
Miscellaneous | | | 21,825 | |
| | |
|
|
|
Total expenses before offsets | | | 6,503,589 | |
| | |
|
|
|
Less: Expense reimbursements | | | (1,090,529 | ) |
| | |
|
|
|
Net expenses | | | 5,413,060 | |
| | |
|
|
|
Net investment income | | | 31,028,672 | |
| | |
|
|
|
Net Realized and Unrealized Gain (Loss): | | | | |
Net realized gain on investment, option, future, and swap transactions | | | 8,564,741 | |
Net realized gain on foreign currency contracts and transactions | | | 1,175,457 | |
Net unrealized depreciation of investments, options, futures, swaps, foreign currency contracts and translations | | | (24,367,108 | ) |
| | |
|
|
|
Net realized and unrealized loss | | | (14,626,910 | ) |
| | |
|
|
|
Net Increase in Net Assets Resulting from Operations | | $ | 16,401,762 | |
| | |
|
|
|
The accompanying notes are an integral part of these financial statements.
18
Managers Fremont Bond Fund
Statement of Changes in Net Assets
For the fiscal year ended October 31,
| | | | | | | | |
| | | October 31, 2005
| | | October 31, 2004
| |
Increase (Decrease) in Net Assets | | | | | | | | |
From Operations: | | | | | | | | |
Net investment income | | $ | 31,028,672 | | | $ | 18,779,000 | |
Net realized gain on investments, options, futures, swaps, foreign currency transactions | | | 9,740,198 | | | | 31,088,000 | |
Net unrealized appreciation (depreciation) of investments, options, futures, swaps, foreign currency contracts and translations | | | (24,367,108 | ) | | | 1,087,000 | |
| | |
|
|
| |
|
|
|
Net increase in net assets resulting from operations | | | 16,401,762 | | | | 50,954,000 | |
| | |
|
|
| |
|
|
|
Distributions to Shareholders: | | | | | | | | |
From net investment income | | | (30,445,598 | ) | | | (19,978,000 | ) |
From net realized gain on investments | | | (27,506,988 | ) | | | (4,036,000 | ) |
| | |
|
|
| |
|
|
|
Total distributions to shareholders | | | (57,952,586 | ) | | | (24,014,000 | ) |
| | |
|
|
| |
|
|
|
From Capital Share Transactions: | | | | | | | | |
Proceeds from the sale of shares | | | 298,492,130 | | | | 210,336,000 | |
Reinvestment of dividends and distributions | | | 52,735,949 | | | | 23,295,000 | |
Cost of shares repurchased | | | (191,346,721 | ) | | | (259,848,000 | ) |
| | |
|
|
| |
|
|
|
Net increase (decrease) from capital share transactions | | | 159,881,357 | | | | (26,217,000 | ) |
| | |
|
|
| |
|
|
|
Total increase in net assets | | | 118,330,533 | | | | 723,000 | |
| | |
|
|
| |
|
|
|
Net Assets: | | | | | | | | |
Beginning of year | | | 852,799,263 | | | | 852,076,000 | |
| | |
|
|
| |
|
|
|
End of year | | $ | 971,129,796 | | | $ | 852,799,000 | |
| | |
|
|
| |
|
|
|
Undistributed net investment income (loss) | | $ | 1,207,521 | | | $ | (379,000 | ) |
| | |
|
|
| |
|
|
|
Share Transactions: | | | | | | | | |
Sale of shares | | | 29,203,827 | | | | 19,886,000 | |
Shares issued in connection with reinvestment of dividends and distributions | | | 5,035,478 | | | | 2,211,000 | |
Shares repurchased | | | (19,089,390 | ) | | | (24,710,000 | ) |
| | |
|
|
| |
|
|
|
Net increase (decrease) in shares | | | 15,149,914 | | | | (2,613,000 | ) |
| | |
|
|
| |
|
|
|
The accompanying notes are an integral part of these financial statements.
19
Managers Fremont Bond Fund
Financial Highlights
For a share of outstanding throughout each fiscal year
| | | | | | | | | | | | | | | | | | | | |
| | | For the fiscal year ended October 31,
| |
| | | 2005
| | | 2004
| | | 2003
| | | 2002
| | | 2001
| |
Net Asset Value, Beginning of year | | $ | 10.79 | | | $ | 10.43 | | | $ | 10.51 | | | $ | 10.57 | | | $ | 9.73 | |
| | |
|
|
| |
|
|
| |
|
|
| |
|
|
| |
|
|
|
Income from Investment Operations: | | | | | | | | | | | | | | | | | | | | |
Net investment income | | | 0.37 | | | | 0.24 | | | | 0.27 | | | | 0.41 | | | | 0.54 | |
Net realized and unrealized gain (loss) on investments | | | (0.17 | ) | | | 0.42 | | | | 0.36 | | | | 0.13 | | | | 0.95 | |
| | |
|
|
| |
|
|
| |
|
|
| |
|
|
| |
|
|
|
Total from investment operations | | | 0.20 | | | | 0.66 | | | | 0.63 | | | | 0.54 | | | | 1.49 | |
| | |
|
|
| |
|
|
| |
|
|
| |
|
|
| |
|
|
|
Less Distributions to Shareholders from: | | | | | | | | | | | | | | | | | | | | |
Net investment income | | | (0.35 | ) | | | (0.25 | ) | | | (0.37 | ) | | | (0.47 | ) | | | (0.53 | ) |
Net realized gain on investments | | | (0.33 | ) | | | (0.05 | ) | | | (0.34 | ) | | | (0.13 | ) | | | (0.12 | ) |
| | |
|
|
| |
|
|
| |
|
|
| |
|
|
| |
|
|
|
Total distributions to shareholders | | | (0.68 | ) | | | (0.30 | ) | | | (0.71 | ) | | | (0.60 | ) | | | (0.65 | ) |
| | |
|
|
| |
|
|
| |
|
|
| |
|
|
| |
|
|
|
Net Asset Value, End of year | | $ | 10.31 | | | $ | 10.79 | | | $ | 10.43 | | | $ | 10.51 | | | $ | 10.57 | |
| | |
|
|
| |
|
|
| |
|
|
| |
|
|
| |
|
|
|
Total Return (a) | | | 2.00 | % | | | 6.45 | % | | | 6.20 | % | | | 5.43 | % | | | 15.79 | % |
| | |
|
|
| |
|
|
| |
|
|
| |
|
|
| |
|
|
|
Ratio of net operating expenses to average net assets (b) | | | 0.60 | % | | | 0.60 | % | | | 0.61 | % | | | 0.59 | % | | | 0.57 | % |
Ratio of total expenses to average net assets | | | 0.72 | %(c) | | | 0.69 | % | | | 0.66 | % | | | 0.64 | % | | | 0.63 | % |
Ratio of net investment income to average net assets (a) | | | 3.43 | % | | | 2.24 | % | | | 2.81 | % | | | 3.75 | % | | | 4.90 | % |
Portfolio turnover | | | 392 | % | | | 113 | % | | | 85 | % | | | 81 | % | | | 160 | % |
Net assets at end of year (000’s omitted) | | $ | 971,130 | | | $ | 852,799 | | | $ | 852,076 | | | $ | 1,150,534 | | | $ | 921,323 | |
| (a) | Total returns and net investment income would have been lower had certain expenses not been reduced. |
| (b) | After expense offsets. (See Note 1(c) of “Notes to Financial Statements.”) |
| (c) | Excludes the impact of expense (reimbursement)/recoupment and expense offsets such as brokerage credits, but includes non-reimbursable expenses such as interest and taxes. (See Note 1(c) to the Notes to Financial Statements.) |
20
Managers Fremont Bond Fund
Notes to Financial Statements
October 31, 2005
(1) Summary of Significant Accounting Policies
Managers Trust I (the “Trust”) is an open-end management investment company organized as a Massachusetts business trust and registered under the Investment Company Act of 1940, as amended (the “1940 Act”). Currently, the Trust is comprised of a number of investment series. Included in this report is the Managers Fremont Bond Fund (the “Fund”), formerly Fremont Bond Fund (the “Predecessor Fund”).
At the close of business on January 14, 2005, the Fund was re-organized from a series of Fremont Mutual Funds, Inc., into Managers Fremont Bond Fund, a series of Managers Trust I.
The Fund’s financial statements are prepared in accordance with accounting principles generally accepted in the United States of America, which require management to make estimates and assumptions that affect the reported amount of assets and liabilities and disclosure of contingent assets and liabilities at the date of the financial statements and the reported amounts of income and expenses during the reporting periods. Actual results could differ from those estimates. The following is a summary of significant accounting policies followed by the Fund in the preparation of its financial statements:
(a) Valuation of Investments
Equity securities traded on a domestic securities exchange are valued at the last quoted sale price, or, lacking any sales, at the last quoted bid price. Over-the-counter securities are valued at the Nasdaq Official Closing Price, if one is available. Lacking any sales, over-the-counter securities are valued at the last quoted bid price. Under certain circumstances, the value of the Fund investment may be based on an evaluation of its fair value, pursuant to procedures established by and under the general supervision of the Board of Trustees of the Trust. The Fund may use the fair value of a portfolio security to calculate its NAV when, for example, (1) market quotations are not readily available because a portfolio security is not traded in a public market or the principal market in which the security trades is closed, (2) trading in a portfolio security is suspended and has not resumed prior to the time as of which the Fund calculates its NAV, (3) where a significant event affecting the value of a portfolio security is determined to have occurred between the time of the market quotation provided for a portfolio security and the time as of which the Fund calculates its NAV, (4) a security’s price has remained unchanged over an extended period of time (often referred to as a “stale price”), or (5) the Investment Manager determines that a market quotation is inaccurate. The Investment Manager monitors intervening events that may affect the value of securities held in the Fund’s portfolio and, in accordance with procedures adopted by the Fund’s Trustees, will adjust the prices of securities traded in foreign markets, as appropriate, to reflect the impact of events occurring subsequent to the close of such markets but prior to the time each Fund’s NAV is calculated. Fixed-income securities are valued based on valuations furnished by independent pricing services that utilize matrix systems, which reflect such factors as security prices, yields, maturities and ratings, and are supplemented by dealer and exchange quotations. Short-term investments having a remaining maturity of 60 days or less are valued at amortized cost, which approximates market value. Investments in other regulated investment companies are valued at their end of day net asset value per share. Futures contracts for which market quotations are readily available are valued at the settlement price as of the close of the futures exchange. Securities (including derivatives) for which market quotations are not readily available are valued at fair value, as determined in good faith, and pursuant to procedures adopted by the Board of Trustees of the Trust.
21
Managers Fremont Bond Fund
Notes to Financial Statements (continued)
Investments in certain mortgage-backed, stripped mortgage-backed, preferred stocks, convertible securities and other debt securities not traded on an organized market, are valued on the basis of valuations provided by dealers or by a pricing service which uses information with respect to transactions in such securities, various relationships between securities and yield to maturity in determining value.
The values assigned to fair value investments are based on available information and do not necessarily represent amounts that might ultimately be realized, since such amounts depend on future developments inherent in long-term investments. Further, because of the inherent uncertainty of valuation, those estimated values may differ significantly from the values that would have been used had a ready market for the investments existed, and the differences could be material.
(b) Security Transactions
Security transactions are accounted for as of the trade date. Realized gains and losses on securities sold are determined on the basis of identified cost.
(c) Investment Income and Expenses
Dividend income is recorded on the ex-dividend date except certain dividends from foreign securities where the ex-dividend date may have passed. These dividends are recorded as soon as the Trust is informed of the ex-dividend date. Dividend income on foreign securities is recorded net of any withholding tax. Interest income, which includes amortization of premium and accretion of discount on debt securities, is accrued as earned. Non-cash dividends included in dividend income, if any, are reported at the fair market value of the securities received. Other income and expenses are recorded on an accrual basis. Expenses that cannot be directly attributed to a fund are apportioned among the Funds in the Trust and in some cases other affiliated funds based upon their relative average net assets or number of shareholders.
In addition, the Fund has a “balance credit” arrangement with The Bank of New York (“BNY”), the Fund’s custodian, whereby the Fund is credited with an interest factor equal to 1% below the effective 90-day T-Bill rate for account balances left uninvested overnight. These credits serve to reduce custody expenses that would otherwise be charged the Fund. For the fiscal year ended October 31, 2005, the custodian expense was not reduced. (Prior to January 15, 2005, the Predecessor Fund participated in a similar program offered by State Street Bank).
Managers Investment Group LLC (the “Investment Manager”), a subsidiary of Affiliated Managers Group, Inc. (“AMG”) and the Investment Manager for the Fund, has contractually agreed, through at least March 1, 2006, to waive fees and pay or reimburse expenses to the extent that the total annual operating expenses (exclusive of brokerage, interest, taxes and extraordinary expenses) of the Fund exceed 0.60% of the Fund’s average daily net assets.
As of January 15, 2005, the Fund may be obligated to repay the Investment Manager such amounts waived, paid or reimbursed in future years provided that the repayment occurs within three (3) years after the waiver or reimbursement and that such repayment would not cause the Fund’s expenses in any such year to exceed the previously stated percentages of that Fund’s average daily net assets. Prior to January 15, 2005, the Fund had a similar expense reimbursement agreement with the former Investment Advisor, Fremont Investment Advisors, Inc. (“FIA”). For the fiscal year ended October 31, 2005, the Fund made no such repayments to the Investment Manager. For the period January 15, 2005 through October 31, 2005, the cumulative amount of expense reimbursement by the Manager subject to repayment by the Fund equaled $699,190.
22
Managers Fremont Bond Fund
Notes to Financial Statements (continued)
(d) Dividends and Distributions
Dividends resulting from net investment income, if any, normally will be declared daily and paid monthly. Distributions of capital gains, if any, will be made on an annual basis and when required for Federal excise tax purposes. Income and capital gain distributions are determined in accordance with Federal income tax regulations, which may differ from generally accepted accounting principles. These differences are primarily due to differing treatments for losses deferred due to wash sales, equalization accounting for tax purposes, foreign currency and market discount transactions. Permanent book and tax basis differences, if any, relating to shareholder distributions will result in reclassifications to paid-in capital. The tax character of distributions paid during fiscal years 2005 and 2004 were as follows:
Distributions paid from:
| | | | | | |
| | | 2005
| | 2004
|
Ordinary income | | $ | 39,202,690 | | $ | 19,978,033 |
Short-term capital gains | | | 1,569,805 | | | 1,843,965 |
Long-term capital gains | | | 17,019,460 | | | 2,192,342 |
| | |
|
| |
|
|
| | | $ | 57,791,955 | | $ | 24,014,340 |
| | |
|
| |
|
|
| | |
| As of October 31, 2005, the components of distributable earnings (excluding unrealized appreciation/ depreciation) on a tax basis consisted of: | | | | | | |
| | |
Undistributed ordinary income | | $ | 1,207,521 | | | |
(e) Federal Taxes
The Fund intends to comply with the requirements under Subchapter M of the Internal Revenue Code of 1986, as amended, to distribute substantially all of its taxable income and gains to its shareholders and to meet certain diversification and income requirements with respect to investment companies. Therefore, no provision for Federal income or excise tax is included in the accompanying financial statements.
Additionally, based on the Fund’s understanding of the tax rules and rates related to income, gains and transactions for the foreign jurisdictions in which it invests, the Fund will provide for foreign taxes, and where appropriate, deferred foreign taxes.
(f) Capital Loss Carryovers
As of October 31, 2005, the Fund had an accumulated net realized capital loss carryover of $41,319. This amount may be used for Federal income tax purposes to offset future realized capital gains, if any, through October 31, 2013.
(g) Capital Stock
The Trust’s Declaration of Trust authorizes for each series the issuance of an unlimited number of shares of beneficial interest, without par value. The Fund records sales and repurchases of its capital stock on the trade date. Dividends and distributions to shareholders are recorded on the ex-dividend date.
At October 31, 2005, certain unaffiliated shareholders, specifically omnibus accounts, individually held greater than 10% of the outstanding shares of the Fund as follows: three own collectively 51%.
23
Managers Fremont Bond Fund
Notes to Financial Statements (continued)
(h) Repurchase Agreements
The Fund may enter into repurchase agreements provided that the value of the underlying collateral, including accrued interest, will be equal to or exceed the value of the repurchase agreement during the term of the agreement. The underlying collateral for all repurchase agreements is held in safekeeping by the Fund’s custodian or at the Federal Reserve Bank.
If the seller defaults and the value of the collateral declines, or if bankruptcy proceedings commence with respect to the seller of the security, realization of the collateral by the Fund may be delayed or limited.
(i) Foreign Currency Translation
The books and records of the Fund are maintained in U.S. dollars. The value of investments, assets and liabilities denominated in currencies other than U.S. dollars are translated into U.S. dollars based upon current foreign exchange rates. Purchases and sales of foreign investments, income and expenses are converted into U.S. dollars based on currency exchange rates prevailing on the respective dates of such transactions. Net realized and unrealized gain (loss) on foreign currency transactions represent: (1) foreign exchange gains and losses from the sale and holdings of foreign currencies; (2) gains and losses between trade date and settlement date on investment securities transactions and forward foreign currency exchange contracts; and (3) gains and losses from the difference between amounts of interest and dividends recorded and the amounts actually received.
In addition, the Fund does not isolate the net realized and unrealized gain or loss resulting from changes in exchange rates from the fluctuations resulting from changes in market prices of securities held. Such fluctuations are included with the net realized and unrealized gain or loss on investments.
(j) TBA Sale Commitments
The Fund may enter into TBA sale commitments to hedge its portfolio positions or to sell mortgage-backed securities it owns under delayed delivery arrangements. Proceeds of TBA sale commitments are not received until the contractual settlement date. During the time a TBA sale commitment is outstanding, equivalent deliverable securities, or an offsetting TBA purchase commitment deliverable on or before the sale commitment date, are held as “cover” for the transaction. Unsettled TBA sale commitments are valued at the current market value of the underlying securities, generally according to the procedures described under “Valuation of Investments,” in footnote 1a above. Each contract is marked-to-market daily and the change in market value is recorded by the Fund as an unrealized gain or loss. If the TBA sale commitment is closed through the acquisition of an offsetting purchase commitment, the Fund realizes a gain or loss. If the Fund delivers securities under the commitment, the Fund realizes a gain or a loss from the sale of the securities based upon the unit price established at the date the commitment was entered into. For the fiscal year ended October 31, 2005, the Fund had no open TBA sale commitments outstanding.
(2) Agreements and Transactions with Affiliates
The Trust has entered into an Investment Management Agreement dated January 15, 2005 under which the Investment Manager provides or oversee investment management services to the Fund. Prior to January 15, 2005, the Predecessor Fund had a similar Investment Management Agreement with FIA. The Investment Manager selects subadvisors for the Fund (subject to Trustee approval) and monitors the subadvisor’s investment programs and results. The Fund’s investment portfolio is managed by a portfolio manager who serves pursuant to a Subadvisory Agreement with the Investment Manager.
24
Managers Fremont Bond Fund
Notes to Financial Statements (continued)
Investment management fees are paid directly by the Fund to the Investment Manager based on average daily net assets. The annual investment management fee rate, as a percentage of average daily net assets for the fiscal year ended October 31, 2005, was 0.40%.
The Trust has entered into an Administration and Shareholder Servicing Agreement under which Managers Investment Group LLC serves as the Fund’s administrator (the “Administrator”) and is responsible for all aspects of managing the Fund’s operations, including administration and shareholder services to each Fund, its shareholders, and certain institutions, such as bank trust departments, broker-dealers and registered investment advisers, that advise or act as an intermediary with the Fund’s shareholders. For its services, the Administrator is paid a fee at a rate of 0.25% per annum. For the period January 15, 2005 through October 31, 2005, the Administrator voluntarily agreed to waive 0.05% of its fee amounting to $308,298. Prior to January 15, 2005, the Predecessor Fund had a similar expense reimbursement agreement with FIA at an annual rate of 0.20% per annum. During the period November 1, 2004 through January 14, 2005, the Predecessor Fund paid administration fees of $263,939. During the period January 15, 2005 through October 31, 2005, the Fund paid administration fees of $1,402,659, net of waivers.
Prior to July 1, 2005, the aggregate annual retainer paid to each Independent Trustee for all Trusts in the Fund family was $52,000, plus $2,000 for each meeting attended. Effective July 1, 2005, the aggregate annual retainer paid to each Independent Trustee is $55,000, plus $4,000 for each meeting attended. The Trustees’ fees and expenses are allocated amongst all of the Funds for which Managers Investment Group LLC serves as the Investment Manager (the “Managers Funds”) based on the relative net assets of such Funds. The Trust has an additional Independent Trustee who is paid an annual retainer of $30,000 plus $4,000 for each meeting attended. The fee is only allocated amongst the Funds in the Trust based on the relative net assets of each Fund. The Independent Chairman of the Managers Funds receives an additional payment of $10,000 per year. (Prior to July 1, 2005, the Independent Chairman was paid an additional $5,000 per year). Effective July 1, 2005, the Chairman of the Audit Committee receives an additional $2,000 pear year. The “Trustee fees and expenses” shown in the financial statements amounting to $70,544 for the fiscal year ended October 31, 2005 represents the Fund’s allocated portion of the total fees and expenses paid by the Fund and other affiliated funds in the Managers Funds complex since January 15, 2005 and the amount paid from the Predecessor Fund from November 1, 2004 through January 14, 2005 to the Trustees of the Fremont Mutual Funds, Inc.
The Fund is distributed by Managers Distributors, Inc. (the “Distributor”), a wholly-owned subsidiary of Managers Investment Group LLC. Certain Trustees and Officers of the Funds are Officers and/or Directors of the Investment Manager, AMG and/or the Distributor. The Distributor serves as the principal underwriter for the Fund. The Distributor is a registered broker-dealer and member of the National Association of Securities Dealers, Inc. Shares of the Fund will be continuously offered and will be sold by brokers, dealers or other financial intermediaries who have executed selling agreements with the Distributor. The Distributor bears all the expenses of providing services pursuant to an Underwriting Agreement, including the payment of the expenses relating to the distribution of Prospectuses for sales purposes and any advertising or sales literature. (Prior to January 15, 2005, the Predecessor Fund had a similar distribution agreement with Quasar Distributors, LLC).
(3) Purchases and Sales of Securities
Purchases and sales of securities, excluding short-term securities, for the fiscal year ended October 31, 2005, were $2,677,642,719 and $2,551,012,857, respectively. Purchases and sales of U.S. Government securities for the fiscal year ended October 31, 2005, were $2,087,102,163 and $1,917,684,661, respectively.
25
Managers Fremont Bond Fund
Notes to Financial Statements (continued)
(4) Portfolio Securities Loaned
The Fund may participate in a securities lending program offered by BNY providing for the lending of equities, corporate bonds and government securities to qualified brokers. Collateral on all securities loaned is accepted in cash and/or government securities. Collateral is maintained at a minimum level of 102% of the market value, plus interest, if applicable, of investments on loan. Collateral received in the form of cash is invested temporarily in institutional money market funds or other short-term investments by BNY. Earnings (after any rebate) of such temporary cash investments are divided between BNY, as a fee for its services under the program, and the Fund loaning the security, according to agreed-upon rates.
(5) Commitments and Contingencies
In the normal course of business, the Fund may enter into contracts and agreements that contain a variety of representations and warranties, which provide general indemnifications. The maximum exposure to the Fund under these arrangements is unknown, as this would involve future claims that may be against the Fund that have not yet occurred. However, based on experience, the Fund expects the risk of loss to be remote.
(6) Forward Commitments
Certain transactions, such as futures and forward transactions, dollar roll agreements, or purchases of when-issued or delayed delivery securities may have a similar effect on the Fund’s net asset value as if the Fund had created a degree of leverage in its portfolio. However, if the Fund enters into such a transaction, the Fund will establish a segregated account with its custodian in which it will maintain cash, U.S. government securities or other liquid securities equal in value to its obligations in respect to such transaction. Securities and other assets held in the segregated account may not be sold while the transaction is outstanding, unless other suitable assets are substituted.
(7) Futures Contracts Held or Issued for Purposes other than Trading
The Fund may purchase or sell futures contracts to achieve a desired level of investment, whether to accommodate portfolio turnover or cash flows from capital shares transactions. There are certain risks associated with futures contracts. Prices may not move as expected or the Fund may not be able to close out the contract when it desires to do so, resulting in losses.
Futures are valued at their quoted daily settlement prices. The aggregate principal amounts of the contracts are not recorded in the financial statements. Fluctuations in the value of the contracts are recorded in the Statement of Assets as an asset (liability) and in the Statement of Operations as unrealized appreciation (depreciation) until the contracts are closed, when they are recorded as realized gains (losses) on futures or forward currency contracts. At October 31, 2005, the Fund had the following open futures contracts:
| | | | | | | | | | |
Type
| | Number
of
Contracts
| | Position
| | Expiration Month
| | Unrealized
Gain/(Loss)
| |
3-Month Eurodollar | | 2,711 | | Short | | March 2006 -September 2007 | | $ | (2,007,868 | ) |
5-Year U.S. Treasury Note | | 210 | | Short | | December 2005 | | | (560,343 | ) |
10-Year U.S. Treasury Note | | 525 | | Long | | December 2005 | | | 33,518 | |
30-Year U.S. Treasury Bond | | 254 | | Long | | December 2005 | | | (1,079,656 | ) |
| | | | | | | | |
|
|
|
| | | | | | | | | $ | (3,614,349 | ) |
| | | | | | | | |
|
|
|
26
Managers Fremont Bond Fund
Notes to Financial Statements (continued)
(8) Interest Rate Caps, Swap Contracts and Options
The Fund may enter into over-the-counter transactions involving interest rate caps, swap contracts, or purchase and write (sell) options to enter into such contracts, in order to manage interest rate risk. In an interest rate cap agreement, one party agrees to make payments only under specified circumstances, usually in return for payment of a fee by the other party. An interest rate cap entitles the purchaser, to the extent that a specified index exceeds a predetermined interest rate, to receive payments of interest on a notional principal amount from the party selling such interest rate cap. Swap contracts represent an agreement between counter parties to exchange cash flows based on the difference between two rates applied to a notional principal amount for a specified period. The most common type of interest rate swap involves the exchange of fixed-rate cash flows for variable-rate cash flows. Swaps do not involve the exchange of principal between the parties. Purchased options on swap contracts (“swaptions”) give the holder the right, but not the obligation, to enter into a swap contract with the counter party which has written the option on a date, at an interest rate, and with a notional amount as specified in the swaption agreement. If the counter party to the swap transaction defaults, the Fund will be limited to contractual remedies pursuant to the agreements governing the transaction. There is no assurance that swap or swaption contract counter parties will be able to meet their obligations under the contracts or that, in the event of default, the Fund will succeed in pursuing contractual remedies. The Fund may thus assume the risk that payments owed the Fund under a swap or swaption contract will be delayed, or not received at all. During the term of the swap agreement or swaption, unrealized gains or losses are recorded as a result of “marking to market.” When the swap agreement or swaption is terminated, the Fund will record a realized gain or loss equal to the difference between the proceeds from (or cost of) the closing transaction and the Fund’s basis in the contract, if any. Accrued interest and interest paid are recognized as unrealized and realized gain (loss), respectively. In each of the contracts, the Fund pays a premium, to the counter party, in return for the swaption. These swaptions may be exercised by entering into a swap contract with the counter party only on the date specified in each contract.
27
Managers Fremont Bond Fund
Notes to Financial Statements (continued)
At October 31, 2005, the Fund had the following open swap contracts:
| | | | | | | | | | | |
Pay
| | Receive
| | Maturity
| | Notional
Amount
| | Unrealized
Gain/(Loss)
| |
Fixed 4.000% | | 3-Month LIBOR | | 12/15/07 | | $ | 21,500,000 | | $ | (346,903 | ) |
Fixed 4.000% | | 3-Month LIBOR | | 12/15/07 | | $ | 6,700,000 | | | (104,834 | ) |
6-Month France | | | | | | | | | | | |
CPI Excl. Tobacco Index | | Fixed Rate 2.1025% | | 10/15/10 | | € | 3,900,000 | | | (1,604 | ) |
6-Month France | | | | | | | | | | | |
CPI Excl. Tobacco Index | | Fixed Rate 2.1455% | | 10/15/10 | | € | 1,000,000 | | | 2,235 | |
3-Month LIBOR | | Fixed Rate 4.000% | | 12/15/10 | | $ | 1,400,000 | | | (58,804 | ) |
3-Month LIBOR | | Fixed Rate 4.000% | | 12/15/10 | | $ | 2,900,000 | | | (121,808 | ) |
3-Month LIBOR | | Fixed Rate 4.000% | | 12/15/10 | | $ | 4,100,000 | | | (172,212 | ) |
3-Month LIBOR | | Fixed Rate 4.000% | | 12/15/10 | | $ | 22,800,000 | | | (957,667 | ) |
3-Month LIBOR | | Fixed Rate 4.000% | | 12/15/10 | | $ | 4,000,000 | | | (168,012 | ) |
6-Month GBP-LIBOR | | Fixed Rate 5.000% | | 06/16/11 | | £ | 7,100,000 | | | 186,798 | |
Fixed Rate 2.000% | | 6 Month JPY-LIBOR | | 06/15/12 | | ¥ | 625,000,000 | | | (279,586 | ) |
Fixed Rate 2.000% | | 6 Month JPY-LIBOR | | 06/15/12 | | ¥ | 390,000,000 | | | (174,462 | ) |
Fixed Rate 2.000% | | 6 Month JPY-LIBOR | | 06/15/12 | | ¥ | 129,100,000 | | | (57,751 | ) |
Fixed Rate 2.000% | | 6 Month JPY-LIBOR | | 06/15/12 | | ¥ | 130,000,000 | | | (58,154 | ) |
Fixed Rate 5.000% | | 3-Month LIBOR | | 12/15/12 | | $ | 14,700,000 | | | (34,238 | ) |
3-Month LIBOR | | Fixed Rate 5.000% | | 12/15/15 | | $ | 1,000,000 | | | (6,713 | ) |
3-Month LIBOR | | Fixed Rate 5.000% | | 12/15/15 | | $ | 5,100,000 | | | 10,857 | |
| | | | | | | | | |
|
|
|
| | | | | | | | | | $ | (2,342,858 | ) |
| | | | | | | | | |
|
|
|
| | |
$: U.S. Dollar | | €: Euro |
£: British Pound | | ¥: Japanese Yen |
For the fiscal year ended October 31, 2005, the Fund paid and received premiums of $183,229 and $2,028,860, respectively, on swap contracts. At October 31, 2005, the unrealized depreciation on open swap contracts was $497,227.
A written option contract is a contract in which the writer of the option grants the buyer of the option the right to purchase from (call option) or sell to (put option) the writer a designated instrument at a specified price within a specified period of time. Options written (sold) are recorded as liabilities. When an option expires, the premium (original option value) is realized as a gain if the option was written or as a loss if the option was purchased. When the exercise of an option results in a cash settlement, the difference between the premium and the settlement proceeds is recognized as realized gain or loss. When securities are acquired or delivered upon exercise of an option, the acquisition cost or sale proceeds are adjusted by the amount of the premium. When an option is closed, the difference between the premium and the cost to close the position is realized as a gain or loss.
28
Managers Fremont Bond Fund
Notes to Financial Statements (continued)
At October 31, 2005, the following written options were outstanding:
| | | | | | | | | | | |
Name
| | Number of
Contracts
| | Exercise
Price
| | | Expiration Month
| | Unrealized
Gain/(Loss)
| |
6-Month JPY-LIBOR (Call) | | 1,000,000,000 | | 1.00 | % | | November 2005 | | $ | 13,151 | |
5-Year USTN (Call) | | 60 | | 108 | | | November 2005 | | | 4,492 | |
5-Year USTN (Call) | | 15 | | 108.5 | | | November 2005 | | | 1,592 | |
5-Year USTN (Call) | | 127 | | 109 | | | November 2005 | | | 18,087 | |
10-Year USTN (Call) | | 107 | | 110 | | | November 2005 | | | 18,793 | |
10-Year USTN (Call) | | 31 | | 111 | | | November 2005 | | | 8,134 | |
10-Year USTN (Call) | | 64 | | 112 | | | November 2005 | | | 9,604 | |
10-Year USTN (Call) | | 534 | | 114 | | | November 2005 | | | 83,949 | |
10-Year Japanese Government Bond (Call) | | 2 | | 140 | | | November 2005 | | | 3,519 | |
10-Year USTN (Call) | | 31 | | 113 | | | December 2005 | | | 5,712 | |
3-Month LIBOR (Call) | | 5,000,000 | | 4.54 | % | | April 2006 | | | 21,755 | |
3-Month LIBOR (Call) | | 6,500,000 | | 4.54 | % | | April 2006 | | | 28,808 | |
3-Month LIBOR (Call) | | 2,000,000 | | 4.00 | % | | June 2006 | | | 22,434 | |
3-Month LIBOR (Call) | | 7,000,000 | | 4.30 | % | | October 2006 | | | 22,401 | |
3-Month LIBOR (Call) | | 7,000,000 | | 4.30 | % | | October 2006 | | | 20,734 | |
3-Month LIBOR (Call) | | 2,000,000 | | 4.31 | % | | October 2006 | | | 4,908 | |
3-Month LIBOR (Call) | | 4,000,000 | | 4.31 | % | | October 2006 | | | 11,088 | |
3-Month LIBOR (Call) | | 10,000,000 | | 4.32 | % | | October 2006 | | | 23,600 | |
3-Month LIBOR (Call) | | 7,000,000 | | 4.54 | % | | October 2006 | | | 34,704 | |
3-Month LIBOR (Call) | | 5,400,000 | | 4.54 | % | | October 2006 | | | 25,649 | |
3-Month LIBOR (Call) | | 14000000 | | 4.56 | % | | October 2006 | | | 32,746 | |
5-Year USTN (Put) | | 60 | | 106 | | | November 2005 | | | (10,976 | ) |
5-Year USTN (Put) | | 60 | | 107 | | | November 2005 | | | (52,695 | ) |
10-Year USTN (Put) | | 176 | | 108 | | | November 2005 | | | (16,964 | ) |
10-Year USTN (Put) | | 557 | | 109 | | | November 2005 | | | (344,063 | ) |
3-Month EURO (Put) | | 30 | | 95 | | | December 2005 | | | (3,848 | ) |
10-Year USTN (Put) | | 31 | | 107 | | | December 2005 | | | (6,398 | ) |
3-Month EURO (Put) | | 372 | | 95.25 | | | December 2006 | | | (72,821 | ) |
3-Month GBP-LIBOR (Put) | | 33 | | 95.5 | | | December 2006 | | | (10,420 | ) |
6-Month LIBOR (Put) | | 18,800,000 | | 4.50 | % | | December 2006 | | | (35,997 | ) |
| | | | | | | | | |
|
|
|
Total: | | | | | | | | | $ | (138,322 | ) |
| | | | | | | | | |
|
|
|
Transactions in written put and call options for the fiscal year ended October 31, 2005 were as follows:
| | | | | | | |
| | | Amount of
Premiums
| | | Number of
Contracts
| |
Options outstanding at October 31, 2004 | | $ | 2,047,000 | | | 47,401,021 | |
Options sold | | | 1,410,189 | | | 1,088,702,290 | |
Options exercised | | | (2,047,000 | ) | | (47,401,021 | ) |
| | |
|
|
| |
|
|
Options outstanding at October 31, 2005 | | $ | 1,410,189 | | | 1,088,702,290 | |
| | |
|
|
| |
|
|
29
Managers Fremont Bond Fund
Notes to Financial Statements (continued)
(9) Risks Associated with Collateralized Mortgage Obligations (“CMOs”)
The net asset value of Funds may be sensitive to interest rate fluctuations because the Funds may hold several instruments, including CMOs and other derivatives, whose values can be significantly impacted by interest rate movements. CMOs are obligations collateralized by a portfolio of mortgages or mortgage-related securities. Payments of principal and interest on the mortgage are passed through to the holder of the CMOs on the same schedule as they are received, although certain classes of CMOs have priority over others with respect to the receipt of prepayments on the mortgages.
Therefore, the investment in CMOs may be subject to a greater or lesser risk of prepayment than other types of mortgage-related securities. CMOs may have a fixed or variable rate of interest.
(10) Forward Foreign Currency Contracts
During the fiscal year ended October 31, 2005, the Fund invested in forward foreign currency exchange contracts to manage currency exposure. These investments may involve greater market risk than the amounts disclosed in the Fund’s financial statements.
A forward foreign currency exchange contract is an agreement between a Fund and another party to buy or sell a currency at a set price at a future date. The market value of the contract will fluctuate with changes in currency exchange rates. The contract is marked-to-market daily, and the change in market value is recorded as an unrealized gain or loss. Gain or loss on the purchase or sale of contracts having the same settlement date, amount and counter party is realized on the date of offset, otherwise gain or loss is realized on settlement date.
The Fund may invest in non-U.S. dollar denominated instruments subject to limitations, and enter into forward foreign currency exchange contracts to facilitate transactions in foreign securities and to protect against a possible loss resulting from an adverse change in the relationship between the U.S. dollar and such foreign currency. Risks may arise upon entering into these contracts from the potential inability of counterparties to meet the terms of their contracts and from unanticipated movements in the value of a foreign currency relative to the U.S. dollar.
Open forward foreign currency exchange contracts (in U.S. Dollars) at October 31, 2005, were as follows:
| | | | | | | | | | | | | | | | |
Foreign Currency
| | | | Settlement Date
| | Contract
Value
(Receivable)
| | | Contract
Value
(Payable)
| | | Unrealized
Gain/Loss
| |
Canadian Dollar | | Short | | 11/21/05 | | $ | (339,316 | ) | | $ | (340,339 | ) | | $ | 1,023 | |
Chilean Peso | | Long | | 02/02/06 - 02/16/06 | | | 500,993 | | | | 503,424 | | | | (2,431 | ) |
Euro | | Short | | 11/08/05 | | | (8,192,554 | ) | | | (8,233,799 | ) | | | 41,245 | |
Euro | | Long | | 11/08/05 | | | 2,853,075 | | | | 2,894,705 | | | | (41,630 | ) |
Indian Rupee | | Long | | 03/20/06 | | | 302,767 | | | | 309,878 | | | | (7,111 | ) |
Japanese Yen | | Long | | 12/01/05 | | | 13,316,095 | | | | 13,585,792 | | | | (269,697 | ) |
South Korean Won | | Long | | 01/26/06 - 03/21/06 | | | 805,324 | | | | 818,967 | | | | (13,643 | ) |
Mexican Peso | | Long | | 02/28/06 - 03/23/06 | | | 383,024 | | | | 378,239 | | | | 4,785 | |
Peruvian Nuevo Sol | | Long | | 02/22/06 - 03/13/06 | | | 391,364 | | | | 404,560 | | | | (13,196 | ) |
Polish Zloty | | Long | | 02/24/06 - 03/27/06 | | | 403,500 | | | | 409,522 | | | | (6,022 | ) |
Russian Ruble | | Long | | 01/31/06 - 03/22/06 | | | 574,734 | | | | 574,976 | | | | (242 | ) |
Singapore Dollar | | Long | | 01/26/06 - 03/20/06 | | | 566,843 | | | | 578,044 | | | | (11,201 | ) |
Slovakian Koruna | | Long | | 03/02/06 - 03/27/06 | | | 388,982 | | | | 399,472 | | | | (10,490 | ) |
New Taiwan Dollar | | Long | | 02/24/06 - 03/26/06 | | | 382,882 | | | | 392,949 | | | | (10,067 | ) |
| | | | | | |
|
|
| |
|
|
| |
|
|
|
Total | | | | | | $ | 12,337,713 | | | $ | 12,676,390 | | | $ | (338,677 | ) |
| | | | | | |
|
|
| |
|
|
| |
|
|
|
30
Managers Fremont Bond Fund
Notes to Financial Statements (continued)
(11) Line of Credit
Prior to January 15, 2005 the Predecessor Fund had a Line of Credit Arrangement (“LOC”) with State Street Bank and Trust Company (“SSB”). Under the terms of the LOC, the Predecessor Fund’s borrowings could not exceed 20% of the Fund’s net assets and the combined borrowings of all the former Fremont Funds could not exceed the $40 million cap on the total line of credit. The interest rate paid on the LOC equaled SSB’s overnight federal funds rate as determined on each day at 11:00 a.m. Boston time plus 0.50% per annum. The former Fremont Funds paid a commitment fee of 0.09% of the unused balance of the LOC and the Predecessor Fund’s portion of this fee for the period November 1, 2004 through January 14, 2005, equaled $2,303. The LOC was terminated at the close of business on January 14, 2005.
Tax Information (unaudited)
The Fund hereby designates the maximum amounts allowable of its net taxable income as qualified dividends as provided in the Jobs and Growth Tax Relief Reconciliation Act of 2003. The 2005 Form 1099-DIV you receive for the Fund, will show the tax status of all distributions paid to you during the year.
Pursuant to section 852 of the Internal Revenue Code, the Fund designates there were no long-term capital gains for the taxable year ended October 31, 2005.
31
Report of Independent Registered Public Accounting Firm
To the Board of Trustees of Managers Trust I and the Shareholders of Managers Fremont Bond Fund:
In our opinion, the accompanying statement of assets and liabilities, including the schedule of portfolio investments and the related statements of operations and of changes in net assets and the financial highlights present fairly, in all material respects, the financial position of Managers Fremont Bond Fund (formerly, Fremont Bond Fund)(the “Fund”) at October 31, 2005, the results of its operations, the changes in its net assets and the financial highlights for the periods indicated, in conformity with accounting principles generally accepted in the United States of America. These financial statements and financial highlights (hereafter referred to as “financial statements”) are the responsibility of the Fund’s management; our responsibility is to express an opinion on these financial statements based on our audits. We conducted our audits of these financial statements in accordance with the standards of the Public Company Accounting Oversight Board (United States). Those standards require that we plan and perform the audit to obtain reasonable assurance about whether the financial statements are free of material misstatement. An audit includes examining, on a test basis, evidence supporting the amounts and disclosures in the financial statements, assessing the accounting principles used and significant estimates made by management, and evaluating the overall financial statement presentation. We believe that our audits, which included confirmation of securities at October 31, 2005 by correspondence with the custodian and brokers, provide a reasonable basis for our opinion.
PricewaterhouseCoopers LLP
Boston, Massachusetts
December 29, 2005
32
Trustees and Officers
The Trustees and Officers of the Trust, their business addresses, principal occupations for the past five years and dates of birth are listed below. The Trustees provide broad supervision over the affairs of the Trust and the Fund. The Trustees are experienced executives who meet periodically throughout the year to oversee the Fund’s activities, review contractual arrangements with companies that provide services to the Fund, and review the Fund’s performance. Unless otherwise noted, the address of each Trustee or Officer is the address of the Trust: 800 Connecticut Avenue, Norwalk, Connecticut 06854.
There is no stated term of office for Trustees. Trustees serve until their resignation, retirement or removal in accordance with the Trust’s organizational documents and policies adopted by the Board from time to time. The President, Treasurer and Secretary hold office until a successor has been duly elected and qualified. Other officers serve at the pleasure of the Trustees.
Independent Trustees
The following Trustees are not “interested persons” of the Trust within the meaning of the 1940 Act:
| | |
Name, Date of Birth, Number of Funds
Overseen in Fund Complex*
| | Principal Occupation(s) During Past 5 Years and Other Directorships Held by Trustee
|
| |
Jack W. Aber, 9/9/37 • Trustee since 2000 • Oversees 36 Funds in Fund Complex | | Professor of Finance, Boston University School of Management (1972-Present); Trustee of Appleton Growth Fund (1 portfolio); Trustee of Third Avenue Trust (4 portfolios); Trustee of Third Avenue Variable Trust (1 portfolio) |
| |
William E. Chapman, II, 9/23/41 • Independent Chairman • Trustee since 2000 • Oversees 36 Funds in Fund Complex | | President and Owner, Longboat Retirement Planning Solutions (1998-Present); Hewitt Associates, LLC (part time) (provider of Retirement and Investment Education Seminars); Interim Executive Vice President, QuadraMed Corporation (2001); President, Retirement Plans Group, Kemper Funds (1990-1998); Trustee of Bowdoin College (2002-Present); Trustee of Third Avenue Trust (4 portfolios); Trustee of Third Avenue Variable Trust (1 portfolio) |
| |
Edward J. Kaier, 9/23/45 • Trustee since 2000 • Oversees 36 Funds in Fund Complex | | Attorney at Law and Partner, Hepburn Willcox Hamilton & Putnam, LLP (1977-Present); Trustee of Third Avenue Trust (4 portfolios); Trustee of Third Avenue Variable Trust (1 portfolio) |
33
Trustees and Officers (continued)
| | |
Richard E. Holmes, 5/14/43 • Trustee since 2005 • Oversees 11 Funds in Fund Complex | | Vice President and Director, BelMar Advisors, Inc. (1998-Present); Executive Director-Investment Management, Pacific Telesis Group (1983-1987); Managers Trust and Thrift Investments, Bechtel Power Corp. (1980-1983); Independent Director, Fremont Mutual Funds, Inc. (1988-2005) |
| |
Steven J. Paggioli, 4/3/50 • Trustee since 2000 • Oversees 36 Funds in Fund Complex | | Consultant (2001-Present); Formerly Executive Vice President and Director, The Wadsworth Group (1986-2001); Executive Vice President, Secretary and Director, Investment Company Administration, LLC (1990-2001); Vice President, Secretary and Director, First Fund Distributors, Inc. (1991-2001); Trustee, Professionally Managed Portfolios (21 portfolios); Advisory Board Member, Sustainable Growth Advisors, LP; Director, Guardian Mutual Funds (28 portfolios) |
| |
Eric Rakowski, 6/5/58 • Trustee since 2000 • Oversees 36 Funds in Fund Complex | | Professor, University of California at Berkeley School of Law (1990-Present); Visiting Professor, Harvard Law School (1998-1999); Trustee of Third Avenue Trust (4 portfolios); Trustee of Third Avenue Variable Trust (1 portfolio) |
| |
Thomas R. Schneeweis, 5/10/47 • Trustee since 2000 • Oversees 36 Funds in Fund Complex | | Professor of Finance, University of Massachusetts (1985-Present); Director, CISDM at the University of Massachusetts, (1996-Present); President, Alternative Investment Analytics, LLC, (formerly Schneeweis Partners, LLC) (2001- Present); Director of Research, Lyra/Starview Capital LLC, (2004-Present); Partner, Northampton Capital, LLC; Partner, Schneeweis Advisors and Massachusetts Finance Institute (both wholly owned subsidiaries of Alternative Investment Analytics). No other directorships held by Trustee. |
| * | The Fund Complex consists of Managers AMG Funds, The Managers Funds, Managers Trust I and Managers Trust II. |
Interested Trustees
The following Trustees are “interested persons” of the Trust within the meaning of the 1940 Act. Mr. Lebovitz is an interested person of the Trust within the meaning of the 1940 Act by virtue of his positions with Managers Investment Group LLC and Managers Distributors, Inc. Mr. Nutt is an interested person of the Trust within the meaning of the 1940 Act by virtue of his positions with, and interest in securities of, Affiliated Managers Group, Inc.
34
Trustees and Officers (continued)
| | |
Name, Date of Birth, Number of Funds
Overseen in Fund Complex*
| | Principal Occupation(s) During Past 5 Years and Other Directorships Held by Trustee
|
| |
Peter M. Lebovitz, 1/18/55 • Trustee since 2002 • President since 2000 • Oversees 36 Funds in Fund Complex | | Managing Partner, Managers Investment Group LLC (2005-Present); President and Chief Executive Officer, The Managers Funds LLC (1999-2004); President, Managers Distributors, Inc. (2000-Present); President, The Managers Funds (1999-Present); President, Managers AMG Funds (1999-Present); President, Managers Trust II (2000-Present); Director of Marketing, The Managers Funds, LP (1994-1999); Director of Marketing, Hyperion Capital Management, Inc. (1993-1994); Senior Vice President, Greenwich Asset Management, Inc. (1989-1993); No other directorships held by trustee. |
| |
William J. Nutt, 3/30/45 • Trustee since 2005 • Oversees 36 Funds in Fund Complex | | Chairman and Founder of Affiliated Managers Group, Inc., (1993-Present); Chief Executive Officer of Affiliated Managers Group, Inc. (1993-2004); Director, Affiliated Managers Group, Inc. (1993-Present); President of Affiliated Managers Group, Inc. (1993-1999); President and Chief Operating Officer, The Boston Company (1989-1993); Senior Executive Vice President, The Boston Company (1982-1989) |
| * | The Fund Complex consists of Managers AMG Funds, The Managers Funds, Managers Trust I and Managers Trust II. |
35
Trustees and Officers (continued)
Officers
| | |
Name, Date of Birth, Position(s) Held with
Fund and Length of Time Served
| | Principal Occupation(s) During Past 5 Years
|
| |
Bruce M. Aronow, 5/31/65 • Chief Financial Officer since 2005 | | Managing Partner, Managers Investment Group LLC (2005-Present); Executive Vice President and Chief Financial Officer and Principal, Rorer Asset Management (1999-2004); Chief Operating Officer, Rorer Asset Management (2001-2004); Staff Accountant, Manager and Partner, PricewaterhouseCoopers LLP (1987-1998) |
| |
Christine C. Carsman, 4/2/52 • Secretary since 2004 | | Vice President and Chief Regulatory Counsel, Affiliated Managers Group, Inc. (2004-Present); Secretary, The Managers Funds, Managers AMG Funds and Managers Trust II (2004-Present); Senior Counsel, Vice President and Director of Operational Risk Management and Compliance, Wellington Management Company, LLP (1995-2004); Deputy General Counsel, The Boston Company, Inc. (1993-1995); Associate General Counsel, The Boston Company Advisors, Inc. (1991-1993); Associate, Sullivan & Worcester LLP (1987-1991) |
| |
Donald S. Rumery, 5/29/58 • Treasurer since 2000 | | Senior Vice-President, Managers Investment Group LLC (2005-Present); Director, Finance and Planning, The Managers Funds LLC, (1994-2004); Treasurer and Chief Financial Officer, Managers Distributors, Inc. (2000-Present); Treasurer, The Managers Funds (1995-Pres-ent); Treasurer, Managers AMG Funds (1999-Present); Treasurer, Managers Trust II (2000-Present); Secretary, Managers Trust I and Managers Trust II (2000-2004) and Secretary, The Managers Funds (1997-2004) |
36
Investment Manager and Administrator
Managers Investment Group LLC
800 Connecticut Avenue
Norwalk, Connecticut 06854
(203) 299-3500 or (800) 835-3879
Distributor
Managers Distributors, Inc.
800 Connecticut Avenue
Norwalk, Connecticut 06854
(203) 299-3500 or (800) 835-3879
Subadvisor
Pacific Investment Management Co., LLC
840 Newport Center Drive, Suite 100
Newport Beach, CA 92660
Custodian
The Bank of New York
2 Hanson Place, 7th Floor
Brooklyn, New York 11217
Legal Counsel
Ropes & Gray LLP
One International Place
Boston, Massachusetts 02110-2624
Transfer Agent
PFPC, Inc.
Attn: Managers
P.O. Box 9769
Providence, Rhode Island 02940
(800) 358-7668
For ManagersChoice Only
The Managers Funds
PFPC, Inc. c/o Wrap Services
P.O. Box 9847
Providence, Rhode Island 02940
(800) 358-7668
MANAGERSAND MANAGERS AMG EQUITY FUNDS
CAPITAL APPRECIATION
Bramwell Capital Management, Inc.
Essex Investment Management Co., LLC
EMERGING MARKETS EQUITY
Rexiter Capital Management Limited
ESSEX AGGRESSIVE GROWTH
ESSEX LARGE CAP GROWTH
ESSEX SMALL/MICRO CAP GROWTH
Essex Investment Management Co., LLC
FIRST QUADRANT TAX-MANAGED EQUITY
First Quadrant, L.P.
INSTITUTIONAL MICRO-CAP
Kern Capital Management LLC
INTERNATIONAL EQUITY
Bernstein Investment Research and Management
Lazard Asset Management, LLC
Wellington Management Company, LLP
INTERNATIONAL GROWTH
Wellington Management Company, LLP
MICRO-CAP
Kern Capital Management LLC
MID-CAP
Chicago Equity Partners, LLC
REAL ESTATE SECURITIES
Urdang Securities Management, Inc.
RENAISSANCE LARGE-CAP EQUITY
Renaissance Investment Management
RORER MID-CAP
RORER LARGE-CAP
Rorer Asset Management, LLC
SMALL CAP
TimesSquare Capital Management, LLC
SMALL COMPANY
Kalmar Investment Advisers, Inc.
SPECIAL EQUITY
Donald Smith & Co., Inc.
Kern Capital Management LLC
Skyline Asset Management, L.P.
Veredus Asset Management LLC
Westport Asset Management, Inc.
STRUCTURED CORE
First Quadrant, L.P.
SYSTEMATIC VALUE
Systematic Financial Management, L.P.
TIMESSQUARE MID CAP GROWTH
TIMESSQUARE SMALL CAP GROWTH
TimesSquare Capital Management, LLC
VALUE
Armstrong Shaw Associates Inc.
Osprey Partners Investment Mgmt., LLC
20
Oak Associates, Ltd.
MANAGERS BALANCED FUNDS
BALANCED
Chicago Equity Partners, LLC
Loomis, Sayles & Company L.P.
GLOBAL
333 Global Advisers*
Armstrong Shaw Associates Inc.
Bernstein Investment Research and Management
First Quadrant, L.P.
Kern Capital Management LLC
Northstar Capital Management, Inc.
Wellington Management Company, LLP
MANAGERS FIXED INCOME FUNDS
BOND (MANAGERS)
Loomis, Sayles & Company L.P.
BOND (MANAGERS FREMONT)
Pacific Investment Management Co. LLC
CALIFORNIA INTERMEDIATE TAX-FREE
Evergreen Investment Management Company, LLC
FIXED INCOME
Loomis, Sayles & Company L.P.
GLOBAL BOND
Loomis, Sayles & Company L.P.
HIGH YIELD
J .P. Morgan Investment Management Inc.
INTERMEDIATE DURATION GOVERNMENT
Smith Breeden Associates, Inc.
MONEY MARKET (MANAGERS)
J PMorgan Investment Advisors Inc.
MONEY MARKET (FREMONT)
333 Global Advisers*
SHORT DURATION GOVERNMENT
Smith Breeden Associates, Inc.
| * | A division of Managers Investment Group LLC |
This report is prepared for the Fund’s shareholders. It is authorized for distribution to prospective investors only when preceded or accompanied by an effective prospectus. To receive a free copy of the prospectus or Statement of Additional Information, which includes additional information about Fund Trustees, please contact us by calling 1-800.835.3879. Distributed by Managers Distributors, Inc., member NASD.
A description of the policies and procedures each Fund uses to vote its proxies is available: (i) without charge, upon request, by calling 1-800.835.3879, or (ii) on the Securities and Exchange Commission’s (SEC) Web site at www. sec.gov. For information regarding each Fund’s proxy voting record for the 12-month period ended June 30, call 1-800.835.3879 or visit the SEC Web site atwww.sec.gov.
The Fund files its complete schedule of portfolio holdings with the SEC for the first and third quarters of each fiscal year on Form N-Q. The Fund’s Forms N-Q are available on the SEC’s website at www.sec.gov. A Fund’s Forms N-Q may be reviewed and copied at the SEC’s Public Reference Room in Washington, DC. Information on the operation of the Public Reference Room may be obtained by calling 1-800. SEC .0330. To review a complete list of the Fund’s portfolio holdings, or to view the most recent quarterly report, semi-annual report, or annual report, please visit www.managersinvest.com.
AR010c-1005
| | |
| www.managersinvest.com | |  |
ANNUAL REPORT
Managers Funds
October 31, 2005
| | • | | Managers Fremont Global Fund |
| | • | | Managers International Growth Fund |
| | • | | Managers Structured Core Fund |
| | • | | Managers Small Cap Fund |
| | • | | Managers Real Estate Securities Fund |
| | • | | Managers California Intermediate Tax-Free Fund |
| | • | | Fremont Money Market Fund |

Table of Contents
Nothing contained herein is to be considered an offer, sale, or solicitation of an offer to buy shares of Managers Funds. Such offering is made only by Prospectus, which includes details as to offering price and other material information.
Letter to Shareholders
Dear Fellow Shareholder:
Over the past 12 months the markets have been beset with a number of difficult and unpredictable challenges, including a massive tsunami in Southeast Asia; continuing strife in the Middle East; numerous terrorist incidents; multiple hurricanes in the Gulf of Mexico; and a significant rise in energy prices. We are fortunate that the stock and bond markets have continued to perform so well under these circumstances.
These events serve to remind us that no one can predict the events that are going to shape the markets in coming months. This reinforces our belief that to invest successfully in an uncertain world you have to diversify your investments and be patient.
Most people think of diversification as holding different types of stocks and bonds, but we believe that there is another type of diversification that receives too little notice, and that is diversification by investment manager and holdings. Simply put, no single approach is going to succeed in every kind of market—some growth stock managers will be successful in a rising market, and some will be more successful in a stagnant market. This can be an issue with some investment firms that adhere to only one method of looking at the markets.
That is a major benefit that we bring you at Managers Funds —since we hire subadvisors (outside investment managers) to run our portfolios, we offer you a wide selection of very different investment styles to choose from, sometimes within the same asset class. Invest in multiple Managers Funds, and you can get managers with very different approaches and holdings, helping you reduce the risks created by changing economic conditions and natural and man-made events, such as those of the past 12 months.
We also believe that once you have made your manager selection, you must be patient. On the home page of our Web site at www.managersinvest.com, you will find a short article entitled “Stay Invested for the Long Term” that highlights how important it is to consistently stay in the market rather than trying to time the market. We think the implication is clear: to be successful in the market over the long term, select a wide variety of investments giving you good diversification, invest regularly and stick with your investment plan no matter what events dominate the news.
We invite you to visit our Web site on an ongoing basis to stay in tune with your Managers Funds holdings. The Web site provides detailed profiles of our subadvisors and their investment styles, as well as quarterly commentary on each Fund. If you have any questions, please do call us at 800.835.3879. Thank you for investing with Managers Funds.
| | | | |
Sincerely, | | | | |
| | |
| | | | |
| Peter M. Lebovitz | | | | Thomas G. Hoffman |
| President | | | | Executive Vice President |
| Managers Funds | | | | Chief Investment Officer |
| | | | | Managers Investment Group LLC |
1
About Your Fund’s Expenses
As a shareholder of a Fund, you may incur two types of costs: (1) transaction costs, which may include sales charges (loads) on purchase payments; redemption fees; and exchange fees; and (2) ongoing costs, including management fees; distribution (12b-1) fees; and other Fund expenses. The Funds incur only ongoing costs. This example is intended to help you understand your ongoing costs (in dollars) of investing in a Fund and to compare these costs with the ongoing costs of investing in other mutual funds. The example is based on an investment of $1,000 invested at the beginning of the period and held for the entire period as indicated below.
Actual Fund return: This helps you to estimate the actual expenses that you paid over the period. The “Ending Account Value” shown is derived from the Fund’s actual return, and the fourth column shows the actual expenses paid by an investor who started with $1,000 in the Fund. You may use the information here, together with the amount you invested, to estimate the expenses that you paid over the period.
To do so, simply divide your account value by $1,000 (for example, an $8,600 account value divided by $1,000 = 8.6), then multiply the result by the number given for the Fund under the heading “Expenses Paid During Period.”
Hypothetical 5% annual return: This helps you compare the Fund’s costs with those of other mutual funds because the Securities and Exchange Commission requires all mutual funds to calculate expenses based on a 5% annual return less expenses. It assumes that the Fund had a return of 5% per year and that the expense ratio is unchanged. You can assess the Fund’s costs by comparing this hypothetical example with the hypothetical examples that appear in shareholder reports of other funds.
| | | | | | | | | |
Six Months Ended October 31, 2005
| | Beginning Account
Value 4/30/2005
| | Ending Account
Value
10/31/2005
| | Expenses Paid During
the Period*
|
Managers Fremont Global Fund | | | | | | | | | |
Based on Actual Fund Return | | $ | 1,000 | | $ | 1,061 | | $ | 5.66 |
Based on Hypothetical 5% Annual Return | | $ | 1,000 | | $ | 1,020 | | $ | 5.55 |
Managers International Growth Fund | | | | | | | | | |
Based on Actual Fund Return | | $ | 1,000 | | $ | 1,048 | | $ | 7.74 |
Based on Hypothetical 5% Annual Return | | $ | 1,000 | | $ | 1,018 | | $ | 7.63 |
Managers Structured Core Fund | | | | | | | | | |
Based on Actual Fund Return | | $ | 1,000 | | $ | 1,082 | | $ | 4.46 |
Based on Hypothetical 5% Annual Return | | $ | 1,000 | | $ | 1,021 | | $ | 4.33 |
Managers Small Cap Fund | | | | | | | | | |
Based on Actual Fund Return | | $ | 1,000 | | $ | 1,125 | | $ | 7.87 |
Based on Hypothetical 5% Annual Return | | $ | 1,000 | | $ | 1,018 | | $ | 7.48 |
Managers Real Estate Securities Fund | | | | | | | | | |
Based on Actual Fund Return | | $ | 1,000 | | $ | 1,101 | | $ | 7.52 |
Based on Hypothetical 5% Annual Return | | $ | 1,000 | | $ | 1,018 | | $ | 7.22 |
Managers California Intermediate Tax Free Fund | | | | | | | | | |
Based on Actual Fund Return | | $ | 1,000 | | $ | 997 | | $ | 2.77 |
Based on Hypothetical 5% Annual Return | | $ | 1,000 | | $ | 1,022 | | $ | 2.80 |
Fremont Money Market Fund | | | | | | | | | |
Based on Actual Fund Return | | $ | 1,000 | | $ | 1,015 | | $ | 2.44 |
Based on Hypothetical 5% Annual Return | | $ | 1,000 | | $ | 1,023 | | $ | 2.45 |
| * | Expenses are equal to the Fund’s annualized expense ratio multiplied by the average account value over the period, multiplied by the number of days in the most recent fiscal half-year (184 days), then divided by the number of days in the full fiscal year (365 days). |
You can find more information about each Fund’s expenses, including annual expense ratios for the past fiscal periods, in the Financial Statements section of this report. For additional information on operating expenses and other shareholder costs, please refer to the Fund’s prospectus.
2
Managers Fremont Global Fund
Portfolio Manager Comments
Managers Fremont Global Fund seeks to maximize total return while reducing risk by investing in U.S. and international stocks, bonds, and short-term securities (cash).
The Portfolio Managers
Northstar Capital Management
Northstar Capital Management’s investment team believes that investing in high quality, high earnings growth companies will generate superior investment returns over full market cycles. To find these companies, the portfolio management team performs fundamental, bottom-up research using a combination of quantitative and qualitative criteria.
The investment process begins with the universe of stocks with market capitalizations exceeding $5 billion. Stocks must also exhibit low volatility and high liquidity. The team then runs a screen to identify stocks that exhibit: (1) higher than market trailing EPS growth; (2) higher than market 5-year projected EPS growth; (3) higher earnings stability; (4) P/E to growth ratio lower than the market; and (5) return on equity higher than the market. This quantitative screen narrows the universe to approximately 100 stocks.
Fundamental, bottom-up analysis is then performed on each company, narrowing the candidate universe down to those with strong qualitative characteristics. Management looks for companies that have excellent businesses with unique characteristics deriving from superior products, niche markets, first-rate customer service, innovative approaches, creative skills, superior management, and high employee involvement. These companies are typically acknowledged leaders in their fields. This qualitative analysis then leads to a portfolio of approximately 25 - 30 names representing the best ideas of the portfolio management team. Stocks in the portfolio are generally equally weighted, and holdings are monitored to assure competitive advantage and growth characteristics.
Armstrong Shaw Associates, Inc.
Jeff Shaw and the investment management team at Armstrong Shaw take a disciplined absolute value approach to investing in the equity market. The team’s goal is to purchase companies that are selling at a substantial discount to intrinsic value. Armstrong Shaw defines intrinsic value as an estimate of what a company would be worth if it were sold as a continuing operation to a knowledgeable buyer. This approach permits price appreciation if the stock grows into its intrinsic value while limiting the risk of significant price depreciation.
The team begins by screening the universe of domestic stocks for those with market caps more than $2.5 billion, P/E ratios below the market average, EPS growth better than 10% and return on equity better than 15%. The team might also search for certain events or special situations such as restructurings, industry events, or legislative changes. After narrowing the universe to about 200 mid- and large-cap names, the investment team analyzes the companies by speaking with management, suppliers and customers and examining financial statements. Qualitatively, Armstrong Shaw prefers companies with discernable business franchises and a management team with a successful track record. Unlike a deep value manager where price is the main concern, Armstrong Shaw is willing to pay a bit more for a company with a strong business plan as long as the price is still below what the team estimates as the intrinsic value. Quantitatively, the team compares the stock prices to cash flows, EPS, sales, etc. The team will estimate the stock’s intrinsic value and purchase stocks only when they are selling for less than 70% of the estimated intrinsic value.
This results in a portfolio of 30-40 of the team’s best ideas. Another 100 stocks or so remain on a watch list for future consideration. Then team sets target prices on these stocks that reflect its expectation of 30-50% price appreciation over the next 2-3 years. Thus, turnover tends to be low. The portfolio’s performance is driven by each stock’s appreciation toward its intrinsic value along with rising intrinsic value in response to improved business or industry outlooks. Armstrong Shaw will sell a position when a price target is reached, the company’s fundamentals deteriorate, or if it reports below-expectation financial results. Additionally, a drop in price of 25% from average cost triggers an automatic review process for potential sale.
First Quadrant, L.P.
First Quadrant believes that there are significant and recurring market inefficiencies and that history can help identify which inefficiencies are profitable. Inefficiencies may be identified through on-going fundamental research conducted by First Quadrant’s research team. Incorporating this fundamental research into a quantitative model leads to a consistent, disciplined investment process.
Led by Chris Luck and Max Darnell, First Quadrant’s investment team uses a proprietary multi-factor quantitative model to construct portfolios that combine a top-down analysis of market and economic conditions with a bottom-up stock selection process. The top-down analysis consists of a review of market and economic data to identify those industries and sectors of the market that are likely to benefit from present and future economic conditions. The top-down analysis helps fund management determine how to tilt the portfolio relative to the benchmark in terms of style, market cap, and industry weightings. Individual stock selection, however, is driven by bottom-up models that focus primarily on market sentiment, valuation, and accounting fundamentals.
Kern Capital Management LLC
Kern Capital Management believes the U.S. micro-cap stock universe provides the opportunity to invest in innovative companies with exceptional growth prospects. With minimal research coverage by brokerage firms and low institutional ownership,
3
Managers Fremont Global Fund
Portfolio Manager Comments (continued)
KCM believes micro-cap stocks represent the least efficient sector of the market.
Bob Kern is one of the pioneers of small-cap and micro-cap investing. While focusing his attention on small companies, Bob Kern and his team direct their efforts toward finding companies that are succeeding through innovation of new products or services. Thus, the portfolio tends to be concentrated in the technology, healthcare, consumer goods and service sectors. The team seeks to earn returns from the appreciation of stocks as the companies’ products develop and penetrate new markets.
In most cases, the analysis of the product and judgments regarding its potential are the most important aspects of the decision to own a stock. In all cases, however, the operational and financial health of the company must be verified. Bob and the investment team at Kern Capital like to find companies in which margins will increase with revenue growth and that can finance much of their growth from operating cash flow. Although valuation is clearly important, the team is often willing to pay relatively high multiples when it sees compelling growth potential.
Wellington Management Company, LLP
Wellington Management’s portfolio is managed by its International Growth Team (“IGT”), comprised of portfolio managers Jean-Marc Berteaux and Andrew S. Offit. Jean-Marc and Andy are supported by Wellington Management’s global industry analysts and regional analysts as well as specialized fundamental, quantitative, and technical analysts, and traders. The IGT’s investment philosophy is built on the beliefs that industry is the dominant competitive factor for companies, that companies can dominate industries on a global basis, and that expectations about companies, specifically earnings, drive stock prices. Wellington’s focus is to identify industry leaders with earnings forecasts ahead of market expectations, and to identify the key drivers for the earnings.
The initial investable universe is comprised of companies in the MSCI EAFE Index with market capitalizations greater than US$1 billion. These companies are researched by Wellington Management’s specialist group of industry analysts who perform intensive ongoing fundamental analysis. Analysts provide assessments, financial models and fundamental research to the IGT. The focus of this research is to update an ongoing assessment of management, current business challenges and aggregate industry trends. Thorough analysis is done in preparation for and following company contacts to ensure that “the numbers support the story” — that the strategy and challenges outlined by management are coming through in financial results. The companies ultimately purchased for the portfolio will exhibit the following characteristics: industry leadership, identified earnings drivers, and above consensus earnings growth expectations. Companies in the portfolio are continually monitored to ensure their fundamental attractiveness based on the identified earnings drivers. Market expectations catching up to their earnings forecast and/or deterioration in earnings drivers will factor into the sell decision. The portfolio will generally hold 50 to 80 securities. Portfolio turnover is expected to be high, exceeding 150% on average per annum. While the portfolio’s holdings-based turnover is expected to be in the 100% range, the IGT will actively trade these positions as a result of significant near-term price movements and other factors.
Bernstein Investment Research and Management
Bernstein’s approach to investing is value-based and research driven. Bernstein’s thesis is that human nature leads investors to buy and sell financial assets based on an overreaction to near-term events as they confuse temporary or cyclical characteristics with structural change. Thus, short-term problems, which cause profits and stocks to decline, can create buying opportunities, as investors underestimate the potential for corrective strategies to restore long-term earnings power. The investment team, led by Kevin Simms, attempts to exploit this by using research to separate fact from emotion. Bernstein’s International Strategic Value discipline is designed to create a focused portfolio of companies with strong fundamentals and sound business prospects not yet reflected in their share price.
The investment process begins with a broad universe of several thousand companies. The investment team screens this universe with a proprietary return model to identify the companies with the most attractive valuations relative to their earnings power. The model derives an expected return for each company by assessing it both from a global industry-based perspective and from a country-based standpoint, including such factors as price to cash earnings, price to book, return on equity, and price momentum. A deep team of analysts perform extensive research, focusing on the most attractively valued stocks. These analysts dissect corporate financial statements and visit company management and also meet frequently with customers, suppliers, or other industry experts. They build spreadsheets of historical and projected balance-sheet and income-statement information in order to estimate normalized earnings power, cash flow and asset values for each company for the next five years, performing simulations to see the potential impact of changes in various components. Analysts then present their estimates and ratings for each security to the Research Review Committee of the Investment Policy Group (IPG). The Committee challenges the analyst’s assumptions and conclusions to ensure they are sound. The IPG uses this research to build a portfolio of approximately 40-60 of the best ideas, building on the combined convictions of Bernstein industry analysts and regional portfolio management teams. A stock is sold when it has achieved forecasted fair value target, or if a change in the earnings forecast reduces the price target to current levels.
333 Global Advisers
Sandie Kinchen of 333 Global Advisers manages the fixed income portion of the portfolio. The manager’s goal is to provide diversification within the global bond environment. The investment process begins with macro analysis of fundamentals
4
Managers Fremont Global Fund
Portfolio Manager Comments (continued)
that affect bond yields and monetary policies in the G7 countries. The majority of holdings in the portfolio are government bonds, although business cycle and credit research will identify value added opportunities in the investment grade corporate bond market. This portfolio also holds global inflation-linked bonds to reduce the inflation risk of a typical bond portfolio. The manager applies a macro forecast and interest rate sensitivity analysis to adjust portfolio duration between 4 to 6.5 years. Foreign currency exposures are typically hedged when management is neutral on its currency view. From time to time, the portfolio will have foreign currency exposure based on fundamental analysis of long-term currency trends.
The Year in Review
During the fiscal year ended October 31, 2005, equity markets performed quite well, outperforming bonds by a substantial margin. U.S. equities turned in strong results, with the large-cap S&P 500 Index returning 8.72% for the fiscal year ended October 31, 2005 and the small-cap Russell 2000 Index returning 12.08% during the same period. Non-U.S. equity markets performed even better, as the MSCI EAFE Index returned 18.09% while MSCI Emerging Markets Index returned an astounding 33.57%. The U.S. bond market, on the other hand, turned in returns that were just slightly positive as rising interest rates cut into bond prices. The Lehman Brother Aggregate Bond Index (LBAG) ended up a mere 1.13% for the fiscal year. The JP Morgan Global Government Bond Index (Hedged), however, returned 4.64% for the fiscal year, buoyed by strong performance from Canadian and Euroland bonds.
On an absolute basis, the Fund performed well, up 9.79% for the fiscal year ended October 31, 2005. On a relative basis, the Fund slightly underperformed its hypothetical benchmark consisting of 65% MSCI World and 35% JPM Global Government Bond Index (Hedged), which returned 10.26% All of the Fund’s domestic equity managers performed quite well during the fiscal year, outperforming the S&P 500 by a sizeable margin. In general, the solid performance on the domestic equity front was driven by strong stock selection.
The Asset Allocation Committee that oversees this Fund made some important changes to the foreign equity portion of the Fund during the year. More specifically, the Asset Allocation Committee made the decision to increase the Fund’s strategic allocation to foreign equity from 10% to 20% as of June 1, 2005. While this was a decision made with a long-term time horizon in mind, the decision was actually quite timely in the short run, as foreign stocks started a strong rally soon after June 1. Concurrent with this increase in the Fund’s allocation to foreign equity was a change to the Fund’s foreign equity subadvisors. Bernstein Investment Research and Management became a subadvisor to the Fund, and Wellington Management Company was hired as a subadvisor to replace Jarislowsky Fraser Limited (JFL). While the portion of the Fund managed by JFL and subsequently by Wellington performed very well on an absolute basis, it actually trailed the MSCI EAFE Index in part due to an overweight to technology and to stock selection issues primarily within the technology sector. Bernstein’s portfolio, however, outperformed EAFE from June 1, 2005 through the end of the fiscal year, driven largely by strong stock selection with the energy and financials sectors.
The fixed income portion of the portfolio performed right in line with its benchmark, the JP Morgan Global Government Bond Index (hedged). Strong returns from the portfolio’s superior regional global allocation were offset by its defensive duration in a surprisingly resilient bond market.
Looking Forward
Heading into the next fiscal year, the Fund’s long-term neutral allocation is 45% domestic equity, 20% foreign equity, 33% global bonds (both nominal and inflation linked), and 2% cash. On a tactical basis, the Fund’s asset allocation committee continues to believe that equities will outperform bonds, leading to a slight overweight to domestic and foreign equity and a slight underweight to global bonds.
5
Managers Fremont Global Fund
Portfolio Manager Comments (continued)
Cumulative Total Return Performance
Managers Fremont Global Fund’s cumulative total return is based on the daily change in net asset value (NAV), and assumes that all distributions were reinvested. The MSCI EAFE Index (“EAFE”) is compiled by Morgan Stanley Capital International. It consists of over 1,000 large, publicly traded stocks from 20 countries of Europe, Asia, Australia and the Far East. The S&P 500 Index is a capitalization-weighted index of 500 stocks. The S&P 500 Index is designed to measure performance of the broad domestic economy through changes in aggregate market value of 500 stocks representing all major industries. The Citigroup Non-U.S. Government Bond Index tracks the performance of the government bond markets in Australia, Austria, Belgium, Canada, Denmark, France, Germany, Italy, Japan, the Netherlands, Spain, Sweden, and the United Kingdom. The Lehman Brothers Intermediate U.S. Government/Credit Index is an index of all investment grade government and corporate bonds with a maturity between one and ten years. Unlike the Fund, the above stated indices are unmanaged, are not available for investment, and do not incur expenses. The chart illustrates the performance of a hypothetical $10,000 investment made in the Managers Fremont Global Fund on October 31,1995, to a $10,000 investment made in the above stated indices for the same time period. Performance for periods longer than one year is annualized. The graph and table do not reflect the deduction of taxes that a shareholder would pay on a Fund distribution or redemption of shares. Past performance is not indicative of future results. Total returns for the Fund would have been lower had certain expenses not been reduced.
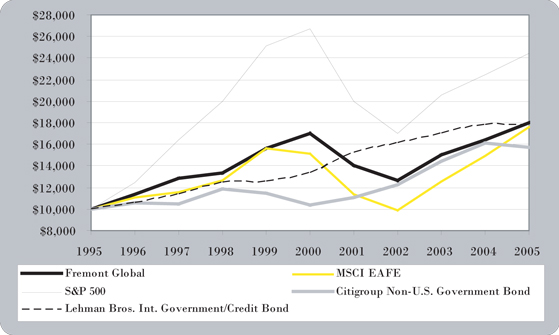
The table below shows the average annual total returns for Managers Fremont Global Fund, MSCI EAFE Index, S&P 500 Index, Citigroup Non-U.S. Government Bond Index, and the Lehman Brothers Intermediate Government/Credit Bond Index since October 31, 1995 through October 31, 2005.
| | | | | | | | | |
Average Annual Total Returns:
| | 1 Year
| | | 5 Years
| | | 10 Years
| |
Fremont Global | | 9.79 | % | | 1.13 | % | | 6.05 | % |
MSCI EAFE | | 18.09 | % | | 3.04 | % | | 5.81 | % |
S&P 500 | | 8.72 | % | | (1.74 | )% | | 9.34 | % |
Citigroup Non-U.S. Government Bond | | (2.45 | )% | | 8.69 | % | | 4.65 | % |
Lehman Bros. Int. Government/Credit Bond | | 0.72 | % | | 5.94 | % | | 5.94 | % |
The performance data shown represents past performance. Past performance is not a guarantee of future results. Current performance may be lower or higher than the performance data quoted. The investment return and the principal value of an investment will fluctuate so that an investor’s shares, when redeemed, may be worth more or less than their original cost. For performance information through the most recent month end please call (800) 835-3879 or visit our Web site at www.managersinvest.com.
Investments in foreign securities are subject to additional risks such as erratic market conditions, economic and political instability, and currency exchange rate fluctuations.
Changing interest rates may adversely affect the value of an investment. An increase in interest rates typically causes the value of bonds and other fixed-income securities to fall.
6
Managers Fremont Global Fund
Portfolio Manager Comments (continued)
The table displays a full breakdown of the top ten holdings of the Fund as well as the geographic diversification as of October 31, 2005.
| | | |
Top Ten Holdings (out of 378 securities)
| | % Net Assets
| |
France, Government of, 3.000%, 07/25/12* | | 1.6 | % |
Norwegian Government, 5.000%, 05/15/15 | | 1.4 | |
ConocoPhillips Co.* | | 1.3 | |
France Telecom SA, 7.000%, 12/23/09* | | 1.1 | |
Citigroup, Inc.* | | 1.1 | |
Pemex Project Funding Master Trust, 6.625%, 04/04/10* | | 1.1 | |
U.S. Treasury Inflation Indexed Bonds, 0.875%, 04/15/10* | | 1.1 | |
France, Government of, 3.400%, 07/25/29 | | 1.0 | |
U.K. Gilts, 4.750%, 03/04/20 | | 1.0 | |
France, Government of, 8.500%, 10/25/19 | | 1.0 | |
| | |
|
|
| | | 11.7 | % |
| | |
|
|
| * | Top Ten Holding at April 30, 2005 |
| | | |
Geographic Diversification
| | % Net Assets
| |
United States | | 52.7 | % |
Europe | | 30.8 | |
Japan | | 4.7 | |
Canada | | 3.3 | |
Asia (excluding Japan) | | 3.2 | |
Other | | 2.0 | |
Caribbean Islands | | 1.7 | |
Africa | | 0.6 | |
Latin America | | 0.6 | |
Middle East | | 0.4 | |
| | |
|
|
| | | 100.0 | % |
| | |
|
|
Any sectors, industries, or securities discussed should not be perceived as investment recommendations. Any securities discussed may no longer be held in the account’s portfolio. It should not be assumed that any of the securities transactions discussed were or will prove to be profitable, or that the investment recommendations we make in the future will be profitable.
7
Managers Fremont Global Fund
Schedule of Portfolio Investments
October 31, 2005
| | | | | | |
Security Description
| | Shares
| | | Value
|
Common Stocks - 66.6% | | | | | | |
Consumer Discretionary - 9.8% | | | | | | |
Adidas - Salomon AG (Germany) | | 1,992 | | | $ | 334,147 |
Alloy, Inc.* | | 31,100 | 4 | | | 143,060 |
American Eagle Outfitters, Inc. | | 5,800 | | | | 136,590 |
Ameristar Casinos, Inc. | | 2,800 | | | | 59,724 |
Best Buy Co., Inc. | | 1,600 | 4 | | | 70,816 |
Carphone Warehouse Group, The (United Kingdom) | | 105,533 | | | | 366,531 |
Celebrate Express, Inc.* | | 5,900 | | | | 80,358 |
Century Casinos, Inc.* | | 10,100 | | | | 75,952 |
Claire’s Stores, Inc. | | 2,800 | | | | 72,940 |
Coach, Inc.* | | 25,000 | | | | 804,500 |
Comcast Corp., Special Class A* | | 37,000 | 4 | | | 1,014,170 |
Continental AG (Germany) | | 6,900 | | | | 527,483 |
eBay, Inc.* | | 24,000 | 4 | | | 950,400 |
EMI Group PLC (United Kingdom) | | 121,528 | | | | 460,920 |
Federated Department Stores, Inc. | | 3,000 | 4 | | | 184,110 |
Ford Motor Co. | | 32,700 | 4 | | | 272,064 |
Gannett Co., Inc. | | 7,300 | 4 | | | 457,418 |
Getty Images, Inc.* | | 5,500 | 4 | | | 456,555 |
Grupo Televisa S.A., Sponsored ADR (Mexico) | | 5,900 | | | | 431,290 |
Gymboree Corp.* | | 18,500 | | | | 327,450 |
Harris Interactive, Inc.* | | 17,800 | 4 | | | 74,226 |
Honda Motor Co., Ltd. (Japan) | | 11,700 | | | | 650,727 |
Hyundai Motor Co., Sponsored GDR (South Korea)(a) | | 8,100 | | | | 298,080 |
IMAX Corp. (Canada)* | | 10,500 | 4 | | | 95,235 |
IMPCO Technologies, Inc.* | | 3,800 | | | | 19,722 |
Intercontinental Hotels Group, PLC (United Kingdom) | | 1 | | | | 8 |
J.C. Penney Co., Inc., Holding Co. | | 1,360 | 4 | | | 69,632 |
Koninklijke (Royal) Philips Electronics N.V. (Netherlands) | | 12,244 | | | | 320,016 |
Lakes Gaming, Inc.* | | 2,200 | 4 | | | 20,620 |
Lowe’s Co., Inc. | | 13,200 | 4 | | | 802,164 |
LVMH Moet Hennessy Louis Vuitton SA (France) | | 4,778 | | | | 386,765 |
Matsushita Electric Industrial Co., Ltd. (Japan) | | 17,000 | | | | 311,546 |
McDonald’s Corp. | | 2,200 | | | | 69,520 |
Nevada Gold & Casinos, Inc.* | | 3,600 | 4 | | | 37,620 |
Office Depot, Inc.* | | 15,460 | | | | 425,614 |
Pantry, Inc., The* | | 4,000 | 4 | | | 154,760 |
ParkerVision, Inc.* | | 3,500 | 4 | | | 25,515 |
Persimmon PLC (United Kingdom) | | 11,500 | | | | 175,547 |
Peugeot SA (France) | | 1,519 | | | | 92,255 |
Pinault-Printemps-Redoute SA (France) | | 982 | | | | 103,151 |
Publicis Groupe (France) | | 10,271 | | | $ | 339,493 |
Pulte Homes, Inc. | | 11,000 | 4 | | | 415,690 |
Renault SA (France) | | 6,800 | | | | 588,589 |
Rocky Shoes & Boots, Inc.* | | 2,900 | | | | 71,688 |
SES GLOBAL (France) | | 23,742 | | | | 375,256 |
Starbucks Corp.* | | 31,600 | 4 | | | 893,648 |
Swatch Group AG, The (Switzerland) | | 4,902 | | | | 139,113 |
Target Corp. | | 16,600 | 4 | | | 924,454 |
Time Warner Co., Inc.* | | 62,500 | | | | 1,114,375 |
Toyota Motor Corp. (Japan) | | 9,100 | | | | 421,989 |
Vivendi Universal SA (France)* | | 16,141 | | | | 507,763 |
Walt Disney Co., The | | 16,820 | | | | 409,903 |
Yum! Brands, Inc. | | 7,310 | 4 | | | 371,860 |
Total Consumer Discretionary | | | | | | 17,933,022 |
Consumer Staples - 2.4% | | | | | | |
CVS Corp. | | 24,040 | | | | 586,816 |
Delhaize Le Lion (Belgium) | | 7,600 | | | | 440,387 |
J Sainsbury PLC (United Kingdom) | | 61,500 | | | | 303,854 |
Japan Tobacco, Inc. (Japan) | | 60 | | | | 948,592 |
Kimberly-Clark Corp. | | 3,400 | | | | 193,256 |
Loews Corp. - Carolina Group | | 600 | | | | 24,690 |
Nestle SA, Registered (Switzerland) | | 1,832 | | | | 544,752 |
Pilgrim’s Pride Corp., Class B | | 5,000 | 4 | | | 157,400 |
Reckitt Benckiser PLC (United Kingdom) | | 16,251 | | | | 491,117 |
Royal Numico NV (Netherlands) | | 5,046 | | | | 204,259 |
Sanderson Farms, Inc. | | 1,800 | 4 | | | 62,118 |
Seven & I Holdings Co., Ltd. (Japan) | | 8,340 | | | | 272,256 |
Smithfield Foods Inc.* | | 1,400 | | | | 41,412 |
SUPERVALU, Inc. | | 2,000 | | | | 62,860 |
Total Consumer Staples | | | | | | 4,333,769 |
Energy - 6.1% | | | | | | |
Amerada Hess Corp. | | 1,400 | | | | 175,140 |
Anadarko Petroleum Corp. | | 1,800 | | | | 163,278 |
Apache Corp. | | 1,600 | 4 | | | 102,128 |
Baker Hughes, Inc. | | 15,400 | | | | 846,384 |
BP Amoco PLC (United Kingdom) | | 39,400 | | | | 436,529 |
Canadian Natural Resources, Ltd. (Canada) | | 10,000 | | | | 409,393 |
ChevronTexaco Corp. | | 17,500 | | | | 998,725 |
China Petroleum and Chemical Corp., Class H (China) | | 620,000 | | | | 250,359 |
ConocoPhillips Co. | | 37,610 | | | | 2,458,942 |
Devon Energy Corp. | | 14,600 | 4 | | | 881,548 |
Eni S.p.A. (Italy) | | 25,420 | | | | 680,052 |
Marathon Oil Corp. | | 1,200 | 4 | | | 72,192 |
MOL Magyar Olaj-és Gázipari Rt. (Hungary) | | 1,970 | | | | 181,179 |
Occidental Petroleum Corp. | | 1,600 | | | | 126,208 |
The accompanying notes are an integral part of these financial statements.
8
Managers Fremont Global Fund
Schedule of Portfolio Investments (continued)
| | | | | | |
Security Description
| | Shares
| | | Value
|
Energy (continued) | | | | | | |
Overseas Shipholding Group, Inc. | | 5,600 | 4 | | $ | 266,560 |
Petro-Canada (Canada) | | 9,300 | | | | 324,520 |
Petroleo Brasileiro S.A., ADR (Brazil) | | 8,200 | | | | 470,434 |
PTT Public Co., Ltd. (Thailand) | | 25,800 | | | | 132,810 |
Repsol YPF, S.A. (Spain) | | 14,900 | | | | 443,571 |
Sasol Ltd. (South Africa) | | 6,064 | | | | 191,665 |
Smith International, Inc. | | 26,000 | 4 | | | 842,400 |
Talisman Energy, Inc. (Canada) | | 4,700 | | | | 208,433 |
Total SA (France) | | 1,200 | | | | 301,817 |
Valero Energy Corp. | | 1,400 | | | | 147,336 |
Total Energy | | | | | | 11,111,603 |
Financials - 15.1% | | | | | | |
Allianz AG (Germany) | | 3,009 | | | | 425,467 |
Allstate Corp., The | | 11,300 | | | | 596,527 |
American Express Co. | | 16,900 | | | | 841,113 |
American Home Mortgage Investment Corp. | | 5,400 | 4 | | | 145,962 |
American International Group, Inc. | | 14,940 | | | | 968,112 |
Ameriprise Financial, Inc. | | 3,380 | | | | 125,804 |
Annaly Mortgage Management, Inc. | | 26,700 | 4 | | | 306,516 |
Assurances Generales de France (France) | | 4,500 | | | | 428,349 |
Astoria Finantial Corp. | | 7,000 | | | | 195,650 |
Aviva PLC (United Kingdom) | | 41,100 | | | | 485,441 |
Banco Bilbao Vizcaya Argentaria SA (Spain) | | 20,102 | 4 | | | 354,278 |
Bank of America Corp. | | 36,600 | | | | 1,600,884 |
Barclays PLC (United Kingdom) | | 43,200 | | | | 428,181 |
Bear Stearns Co., Inc., The | | 6,400 | 4 | | | 677,120 |
Capital One Financial Corp. | | 200 | 4 | | | 15,270 |
Cash Systems, Inc.* | | 27,800 | 4 | | | 161,518 |
Chicago Mercantile Exchange Holdings, Inc. | | 2,900 | | | | 1,058,935 |
Chubb Corp. | | 9,400 | 4 | | | 873,918 |
Citigroup, Inc. | | 44,700 | | | | 2,046,366 |
Credit Agricole SA (France) | | 13,400 | | | | 392,694 |
Credit Suisse Group (Switzerland) | | 23,635 | | | | 1,043,993 |
Fannie Mae Co. | | 3,119 | | | | 148,215 |
Fremont General Corp. | | 3,400 | 4 | | | 73,746 |
Friends Provident PLC (United Kingdom) | | 73,000 | | | | 227,803 |
Goldman Sachs Group, Inc. | | 1,000 | | | | 126,370 |
HBOS PLC (United Kingdom) | | 31,500 | | | | 465,397 |
ING Groep NV (Netherlands) | | 26,200 | | | | 755,221 |
Kookmin Bank, Sponsored ADR (South Korea) | | 5,000 | | | | 292,100 |
Legg Mason, Inc. | | 8,500 | 4 | | | 912,135 |
Lehman Brothers Holdings, Inc. | | 2,400 | | | | 287,208 |
MBNA Corp. | | 13,200 | 4 | | | 337,524 |
Merrill Lynch & Co., Inc. | | 15,600 | | | $ | 1,009,944 |
Mitsubishi Tokyo Financial Group, Inc. (Japan) | | 25 | | | | 314,225 |
Moody’s Corp. | | 20,100 | 4 | | | 1,070,526 |
Morgan Stanley Co. | | 16,300 | | | | 886,883 |
Muenchener Rueckversicherungs | | | | | | |
AG (Germany) | | 6,019 | | | | 706,248 |
National City Corp. | | 8,300 | 4 | | | 267,509 |
North Fork Bancorporation, Inc. | | 13,220 | | | | 334,995 |
ORIX Corp. (Japan) | | 3,000 | | | | 562,548 |
PMI Group, Inc. | | 13,600 | 4 | | | 542,368 |
Radian Group, Inc. | | 4,200 | 4 | | | 218,820 |
Royal Bank of Scotland Group PLC (United Kingdom) | | 19,600 | | | | 542,841 |
Shinhan Financial Group Co., Ltd., Sponsored ADR (South Korea) | | 4,300 | | | | 290,207 |
Shizuoka Bank Ltd., The (Japan) | | 5,000 | | | | 52,509 |
Societe Generale (France) | | 3,400 | | | | 388,120 |
Sovereign Bancorp, Inc. | | 3,400 | 4 | | | 73,338 |
Standard Chartered, PLC (United Kingdom) | | 27,106 | | | | 569,322 |
Sumitomo Mitsui Financial Group, Inc. (Japan) | | 68 | | | | 628,037 |
Thornburg Mortgage, Inc. | | 4,600 | 4 | | | 116,610 |
UBS AG (Switzerland) | | 5,000 | | | | 425,695 |
Unibail (France) | | 861 | | | | 113,664 |
UniCredito Italiano SpA (Italy) | | 66,955 | | | | 371,304 |
W Holding Co., Inc. | | 2,600 | 4 | | | 20,046 |
W.R. Berkley Corp. | | 10,700 | | | | 467,590 |
Washington Mutual, Inc. | | 24,600 | 4 | | | 974,160 |
Total Financials | | | | | | 27,745,326 |
Health Care - 9.3% | | | | | | |
Abbott Laboratories Co. | | 16,300 | | | | 701,715 |
Alcon, Inc. (Switzerland) | | 9,000 | 4 | | | 1,196,100 |
AmerisourceBergen Corp. | | 1,000 | | | | 76,270 |
Amgen, Inc.* | | 14,400 | | | | 1,090,944 |
AngioDynamics, Inc.* | | 6,100 | | | | 133,285 |
Applera Corp. - Applied Biosystems Group | | 16,000 | | | | 388,320 |
AstraZeneca PLC (United Kingdom) | | 6,860 | | | | 306,928 |
Atherogenics, Inc.* | | 2,900 | 4 | | | 43,500 |
Cepheid, Inc.* | | 6,500 | | | | 41,210 |
Conceptus, Inc.* | | 13,700 | 4 | | | 140,699 |
Coventry Health Care, Inc.* | | 25,050 | | | | 1,352,450 |
DexCom, Inc.* | | 5,400 | 4 | | | 70,254 |
Eclipsys Corp.* | | 3,400 | | | | 54,400 |
Eisai Co., Ltd. (Japan) | | 7,800 | | | | 305,486 |
Essilor International SA (France) | | 5,287 | | | | 435,088 |
Forest Laboratories, Inc.* | | 2,400 | | | | 90,984 |
The accompanying notes are an integral part of these financial statements.
9
Managers Fremont Global Fund
Schedule of Portfolio Investments (continued)
| | | | | | |
Security Description
| | Shares
| | | Value
|
Health Care (continued) | | | | | | |
GlaxoSmithKline PLC (United Kingdom) | | 9,300 | | | $ | 241,924 |
Harvard Bioscience, Inc.* | | 12,400 | | | | 39,804 |
HCA, Inc. | | 13,070 | 4 | | | 629,843 |
Hospira, Inc.* | | 1,800 | | | | 71,730 |
ICON PLC (Ireland)* | | 2,700 | | | | 108,621 |
Intuitive Surgical, Inc.* | | 1,200 | | | | 106,476 |
Isis Pharmaceuticals, Inc.* | | 7,600 | 4 | | | 32,984 |
Johnson & Johnson Co. | | 15,600 | | | | 976,872 |
Medco Health Solutions, Inc.* | | 17,500 | 4 | | | 988,750 |
Medtronic, Inc. | | 16,400 | | | | 929,224 |
Merck & Co., Inc. | | 16,400 | 4 | | | 462,808 |
Merck KGaA (Germany) | | 5,790 | | | | 478,839 |
Mylan Laboratories, Inc. | | 4,400 | 4 | | | 84,524 |
NeoPharm, Inc.* | | 29,062 | 4 | | | 279,286 |
NxStage Medical, Inc.* | | 3,300 | | | | 37,455 |
OraSure Technologies, Inc.* | | 9,600 | | | | 105,696 |
Perrigo Co. | | 8,600 | 4 | | | 114,982 |
Pfizer, Inc. | | 39,400 | | | | 856,556 |
Regeneration Technologies, Inc.* | | 40,900 | 4 | | | 295,707 |
Roche Holding AG (Switzerland)* | | 2,963 | | | | 442,084 |
Sanofi-Synthelabo SA (France) | | 6,500 | | | | 520,459 |
Shionogi & Co., Ltd. (Japan) | | 2,000 | | | | 24,322 |
Sierra Health Services* | | 3,400 | | | | 255,000 |
Sonosite, Inc.* | | 900 | | | | 26,451 |
Teva Pharmaceutical Industries, Ltd., Sponsored ADR (Israel) | | 8,200 | 4 | | | 312,584 |
UnitedHealth Group, Inc. | | 27,200 | | | | 1,574,608 |
Vital Images, Inc.* | | 5,700 | 4 | | | 132,525 |
WellPoint, Inc.* | | 6,160 | | | | 460,029 |
Total Health Care | | | | | | 17,017,776 |
Industrials - 6.9% | | | | | | |
Aaon, Inc.* | | 4,000 | | | | 68,800 |
Allied Defense Group, Inc., The* | | 3,000 | | | | 66,900 |
Atlas Copco AB (Sweden) | | 5,400 | | | | 98,690 |
BAE Systems PLC (United Kingdom) | | 36,800 | | | | 215,367 |
Briggs & Stratton Corp. | | 2,600 | 4 | | | 83,148 |
Canadian Pacific Railway Ltd. (Canada) | | 4,800 | | | | 197,567 |
Career Education Corp.* | | 13,370 | 4 | | | 475,838 |
Cendant Corp. | | 46,260 | | | | 805,849 |
Color Kinetics, Inc.* | | 8,300 | 4 | | | 126,492 |
CoStar Group, Inc.* | | 3,100 | | | | 148,645 |
Cummins, Inc. | | 4,400 | 4 | | | 375,628 |
Eaton Corp. | | 1,400 | | | | 82,362 |
Emerson Electric Co. | | 8,350 | | | | 580,743 |
European Aeronautic Defense and Space Co. (Netherlands) | | 16,382 | | | | 567,294 |
FANUC, Ltd. (Japan) | | 4,200 | | | | 330,995 |
General Electric Co. | | 43,700 | | | $ | 1,481,867 |
Gevity HR, Inc. | | 2,200 | 4 | | | 56,628 |
Honeywell International, Inc. | | 12,400 | | | | 424,080 |
Hutchison Whampoa, Ltd. (Hong Kong) | | 10,000 | | | | 95,151 |
Insituform Technologies, Inc.* | | 8,300 | 4 | | | 149,068 |
Komatsu Ltd. (Japan) | | 15,000 | | | | 199,879 |
Koyo Seiko Co., Ltd. (Japan) | | 8,000 | | | | 128,541 |
Kuehne & Nagel International AG (Switzerland) | | 910 | | | | 212,792 |
KVH Industries, Inc.* | | 17,500 | 4 | | | 161,700 |
L-3 Communications Holdings, Inc. | | 12,000 | | | | 933,840 |
Landstar System, Inc.* | | 2,400 | | | | 92,448 |
MAN AG (Germany) | | 5,300 | | | | 246,033 |
Masco Corp. | | 2,000 | | | | 57,000 |
Northrop Grumman Corp. | | 15,600 | | | | 836,940 |
Nuco2, Inc.* | | 1,100 | | | | 25,190 |
Parker Hannifin Corp. | | 3,400 | | | | 213,112 |
Pitney Bowes, Inc. | | 17,400 | | | | 732,192 |
Raytheon Co. | | 5,200 | | | | 192,140 |
Republic Airways Holdings, Inc.* | | 1,800 | | | | 28,080 |
Ryanair Holdings PLC (Ireland)* | | 3,600 | 4 | | | 178,452 |
Siemens AG (Germany) | | 3,092 | | | | 230,182 |
SNC-Lavalin Group, Inc. (Canada) | | 3,500 | | | | 221,059 |
TVI Corp.* | | 31,300 | | | | 116,436 |
Tyco International, Ltd. | | 20,700 | 4 | | | 546,273 |
United Technologies Corp. | | 11,200 | | | | 574,336 |
Yamato Transport Co., Ltd. (Japan) | | 14,000 | | | | 230,613 |
Total Industrials | | | | | | 12,588,350 |
Information Technology - 10.9% | | | | | | |
Actel Corp.* | | 9,900 | | | | 138,105 |
Airspan Networks, Inc.* | | 7,900 | 4 | | | 39,342 |
Aladdin Knowledge Systems, Ltd. (Israel)* | | 6,400 | | | | 112,576 |
Altran Technologies SA (France)* | | 14,493 | | | | 169,439 |
Anaren Microwave, Inc.* | | 19,600 | | | | 277,340 |
Apple Computer, Inc.* | | 26,300 | | | | 1,514,617 |
Applied Materials, Inc. | | 10,800 | 4 | | | 176,904 |
Arrow Electronics, Inc.* | | 13,400 | | | | 395,434 |
ASM International NV (Netherlands)* | | 5,400 | 4 | | | 71,712 |
ATMI, Inc.* | | 20,900 | 4 | | | 570,779 |
AudioCodes, Ltd. (Israel)* | | 17,600 | 4 | | | 198,352 |
Autodesk, Inc. | | 23,000 | | | | 1,037,990 |
Canon, Inc. (Japan) | | 10,800 | | | | 571,660 |
Cascade Microtech, Inc.* | | 3,500 | | | | 40,600 |
Centra Software, Inc.* | | 14,300 | | | | 25,740 |
Ceragon Networks, Ltd. (Israel)* | | 46,700 | | | | 180,729 |
Cisco Systems, Inc.* | | 13,400 | | | | 233,830 |
Cognizant Technology Solutions Corp.* | | 18,000 | | | | 791,640 |
The accompanying notes are an integral part of these financial statements.
10
Managers Fremont Global Fund
Schedule of Portfolio Investments (continued)
| | | | | | |
Security Description
| | Shares
| | | Value
|
Information Technology (continued) | | | | | | |
Computer Sciences Corp.* | | 1,544 | | | $ | 79,130 |
Comtech Group, Inc.* | | 11,500 | | | | 71,760 |
CyberOptics Corp.* | | 5,900 | | | | 78,116 |
Dassault Systemes SA (France) | | 8,702 | | | | 449,300 |
Equinix, Inc.* | | 5,000 | | | | 184,450 |
Ericsson (LM), Class B (Sweden) | | 119,400 | | | | 391,197 |
Exfo Electro-Optical Engineering, Inc. (Canada)* | | 33,500 | | | | 146,395 |
First Data Corp. | | 12,950 | | | | 523,828 |
Flextronics International, Ltd. (Singapore)* | | 18,100 | | | | 168,149 |
Google Inc.* | | 600 | | | | 223,284 |
Greenfield Online, Inc.* | | 7,700 | 4 | | | 38,654 |
Hewlett-Packard Co. | | 15,600 | | | | 437,424 |
Homestore, Inc.* | | 1 | | | | 3 |
Identix, Inc.* | | 52,812 | 4 | | | 233,957 |
Ingram Micro, Inc., Class A* | | 13,500 | | | | 244,350 |
Integral Systems, Inc. | | 12,700 | | | | 279,908 |
Intel Corp. | | 27,740 | | | | 651,890 |
Intergraph Corp.* | | 2,800 | | | | 135,464 |
International Business Machines Corp. | | 5,600 | | | | 458,528 |
Intevac, Inc.* | | 6,800 | | | | 62,152 |
Kanbay International, Inc.* | | 4,200 | | | | 61,236 |
Keyence Corp. (Japan) | | 1,300 | | | | 299,145 |
Marvell Technology Group Ltd.* (Bermuda) | | 21,600 | | | | 1,002,456 |
Motorola, Inc. | | 23,200 | | | | 514,112 |
MRO Software, Inc.* | | 9,100 | | | | 149,058 |
NCI, Inc., Class A* | | 4,100 | | | | 49,610 |
NCR Corp.* | | 4,004 | | | | 121,001 |
Netscout Systems, Inc.* | | 10,800 | | | | 60,912 |
Nippon Electric Glass Co., Ltd. (Japan) | | 22,000 | | | | 421,161 |
Nokia Oyj (Finland) | | 21,600 | | | | 361,731 |
Nvidia Corp.* | | 13,600 | | | | 456,280 |
OPNET Technologies, Inc.* | | 15,000 | | | | 124,950 |
Optibase Ltd.* | | 18,800 | | | | 92,872 |
Oracle Corp.* | | 18,000 | | | | 228,240 |
Pervasive Software, Inc.* | | 12,700 | | | | 53,340 |
PLX Technology, Inc.* | | 5,600 | 4 | | | 41,944 |
Quanta Computer, Inc., Registered GDR* | | 26,670 | | | | 184,018 |
Rae Systems, Inc.* | | 14,800 | 4 | | | 52,096 |
Research In Motion, Ltd. (Canada)* | | 4,900 | 4 | | | 301,301 |
Reynolds & Reynolds Co., The, Class A | | 2,600 | | | | 69,004 |
RightNow Technologies, Inc.* | | 6,800 | 4 | | | 103,496 |
RIT Technologies Ltd.* | | 21,200 | | | | 59,360 |
Sabre Holdings Corp. | | 4,800 | 4 | | | 93,744 |
Samsung Electronics Co., Ltd., GDR (South Korea)(a) | | 1,278 | | | $ | 339,096 |
Silicon Motion Technology Corp., ADR (Taiwan)* | | 5,700 | | | | 81,966 |
Sirenza Microdevices, Inc.* | | 28,500 | | | | 91,200 |
Softbank Corp. (Japan) | | 3,000 | | | | 170,092 |
Stratasys, Inc.* | | 4,000 | 4 | | | 94,880 |
Symantec Corp.* | | 1,000 | | | | 23,850 |
Taiwan Semiconductor Manufacturing Co., Ltd., Sponsored ADR (Taiwan) | | 39,479 | | | | 318,990 |
TechTeam Global, Inc.* | | 11,300 | | | | 105,316 |
Terayon Communication Systems, Inc.* | | 80,600 | | | | 216,814 |
Terremark Worldwide, Inc.* | | 19,620 | 4 | | | 54,740 |
TomTom NV (Netherlands)* | | 2,561 | | | | 98,600 |
Trident Microsystems, Inc.* | | 2,100 | | | | 63,546 |
Witness Systems, Inc.* | | 6,700 | 4 | | | 131,320 |
Woodhead Industries, Inc. | | 6,400 | | | | 80,576 |
Xerox Corp.* | | 61,570 | 4 | | | 835,505 |
Yahoo!, Inc.* | | 26,800 | 4 | | | 990,796 |
Total Information Technology | | | | | | 20,003,082 |
Materials - 2.4% | | | | | | |
Anglo American PLC (United Kingdom) | | 6,862 | | | | 203,143 |
Arcelor (Luxembourg) | | 24,900 | | | | 590,950 |
Calgon Carbon Corp. | | 18,400 | 4 | | | 100,280 |
Cameco Corp. (Canada) | | 4,100 | | | | 195,980 |
Compania Vale do Rio Doce – ADR (Brazil) | | 5,100 | 4 | | | 210,783 |
E.I. du Pont de Nemours & Co., Inc. | | 16,800 | 4 | | | 700,391 |
Inco, Ltd. (Canada) | | 2,400 | 4 | | | 96,528 |
JFE Holdings, Inc. (Japan) | | 18,800 | | | | 584,026 |
Japan Synthetic Rubber Corp. (Japan) | | 8,900 | | | | 209,807 |
Northern Technologies International Corp. | | 9,150 | | | | 49,227 |
Phelps Dodge Corp. | | 3,000 | 4 | | | 361,410 |
POSCO, Sponsored ADR (South Korea) | | 8,200 | | | | 420,578 |
Rio Tinto PLC (United Kingdom) | | 4,746 | | | | 180,850 |
The Valspar Corp. | | 2,200 | | | | 48,510 |
Xstrata PLC (United Kingdom) | | 22,195 | | | | 508,568 |
Total Materials | | | | | | 4,461,031 |
Metals - 0.1% | | | | | | |
Southern Copper Corp. | | 2,000 | 4 | | | 110,280 |
Telecommunication Services - 1.8% | | | | | | |
Centurytel, Inc. | | 22,000 | 4 | | | 720,060 |
NTT DoCoMo, Inc. (Japan) | | 60 | | | | 103,621 |
Singapore Telecommunications, Inc. (Singapore) | | 302,000 | | | | 415,646 |
The accompanying notes are an integral part of these financial statements.
11
Managers Fremont Global Fund
Schedule of Portfolio Investments (continued)
| | | | | | |
Security Description
| | Shares
| | | Value
|
Telecommunication Services (continued) | | | | | | |
Sprint Corp. | | 30,293 | | | $ | 706,130 |
Verizon Communications, Inc. | | 23,400 | | | | 737,334 |
Vodafone Group PLC (United Kingdom) | | 251,696 | | | | 660,925 |
Total Telecommunication Services | | | | | | 3,343,716 |
Utilities - 1.8% | | | | | | |
American Electric Power Co., Inc. | | 4,400 | | | | 167,024 |
E.ON AG (Germany) | | 4,500 | | | | 407,578 |
Endesa, S.A. (Spain) | | 15,800 | | | $ | 392,083 |
Energen Corp. | | 9,400 | 4 | | | 353,440 |
Exelon Corp. | | 13,200 | 4 | | | 686,796 |
PPL Corp. | | 22,200 | 4 | | | 695,748 |
TXU Corp. | | 2,800 | 4 | | | 282,100 |
Veolia Environment (France) | | 7,330 | 4 | | | 304,866 |
Total Utilities | | | | | | 3,289,635 |
Total Common Stocks (cost $109,713,635) | | | | | | 121,937,590 |
| | | | | | |
| | | | | Principal
Amount
| | |
Corporate Bonds -10.6% | | | | | | |
Banque De Tunisie, 3.300%, 08/02/10 | | JPY | | 100,000,000 | | 933,359 |
BAT International Finance PLC, 5.125%, 07/09/13 | | EUR | | 1,000,000 | | 1,281,484 |
Deutsche Bahn Finance BV, 5.000%, 06/10/08 | | EUR | | 2,000,000 | | 1,287,207 |
Fidelity International Ltd., 6.250%, 03/21/12 | | EUR | | 1,000,000 | | 1,368,872 |
Ford Credit of Canada Ltd., 7.250%, 12/07/07 | | GBP | | 500,000 | | 868,054 |
France Telecom SA, 7.000%, 12/23/09 | | EUR | | 1,500,000 | | 2,054,234 |
General Electric Capital Australia Funding Property Ltd., 7.000%, 09/15/09 | | AUD | | 2,000,000 | | 1,546,408 |
General Electric Capital Corp., 5.250%, 04/15/131 | | USD | | 1,000,000 | | 967,938 |
General Electric Capital Corp., Series A, 4.114%, 01/03/081 | | USD | | 1,000,000 | | 1,001,429 |
General Motors Acceptance Corp., 7.500%, 12/01/06 | | NZD | | 1,000,000 | | 670,360 |
Glencore Funding LLC, 6.000%, 04/15/14 (a) | | USD | | 500,000 | | 461,307 |
Kazkommerts International BV, 7.875%, 04/07/14 (a) | | USD | | 1,750,000 | | 1,760,938 |
Pacific Life Funding LLC, 6.500%, 04/15/08 | | AUD | | 1,000,000 | | 755,366 |
Pemex Project Funding Master Trust, 6.625%, 04/04/10 | | EUR | | 1,500,000 | | 2,004,406 |
Petroliam Nasional Berhad, 3.600%, 06/12/06 | | JPY | | 100,000,000 | | 877,013 |
TDC Group, 3.875%, 12/09/11 | | EUR | | 1,500,000 | | 1,590,798 |
Total Corporate (cost $18,899,510) | | | | | | 19,429,173 |
Foreign Government Obligations -15.1% | | | | | | |
Bonos Y Obligaciones Del Estado (Spain), 5.500%, 07/30/17 | | EUR | | 1,000,000 | | 1,428,863 |
Canada Government Real Return Bonds, 4.000%, 12/01/31 | | CAN | | 1,176,920 | | 1,512,121 |
Canada Government Real Return Bonds, 4.250%, 12/01/21 | | CAN | | 1,294,570 | | 1,521,020 |
Deutschland Republic, 3.250%, 07/04/15 | | EUR | | 1,000,000 | | 1,184,955 |
Development Bank of Japan, 1.700%, 09/20/22 | | JPY | | 100,000,000 | | 826,570 |
Eurofima, 6.000%, 01/28/14 | | AUD | | 2,000,000 | | 1,509,357 |
Finnish Government, 5.750%, 02/23/11 | | EUR | | 1,000,000 | | 1,356,098 |
France, Government of, 3.000%, 07/25/12 | | EUR | | 2,156,040 | | 2,919,657 |
France, Government of, 3.150%, 07/25/32 | | EUR | | 613,060 | | 997,169 |
France, Government of, 3.400%, 07/25/29 | | EUR | | 1,142,455 | | 1,873,443 |
France, Government of, 8.500%, 10/25/19 | | EUR | | 1,000,470 | | 1,845,683 |
International Finance Corp., 6.750%, 07/15/09 | | NZD | | 1,000,000 | | 692,357 |
Norwegian Government, 5.000%, 05/15/15 | | NOK | | 15,500,000 | | 2,600,753 |
Norwegian Government, 5.500%, 05/15/09 | | NOK | | 6,000,000 | | 985,690 |
Norwegian Government, 6.000%, 05/16/11 | | NOK | | 5,000,000 | | 860,560 |
Singapore, Government of, 3.500%, 07/01/12 | | SGD | | 1,600,000 | | 978,971 |
Singapore, Government of, 3.625%, 07/01/14 | | SGD | | 1,500,000 | | 927,002 |
U.K. Gilts, 4.000%, 03/07/09 | | GBP | | 1,000,000 | | 1,751,790 |
The accompanying notes are an integral part of these financial statements.
12
Managers Fremont Global Fund
Schedule of Portfolio Investments (continued)
| | | | | | | | | |
Security Description
| | | | Principal
Amount
| | | Value
| |
Foreign Government Obligations (continued) | | | | | | | | | |
U.K. Gilts, 4.750%, 03/04/20 | | GBP | | 1,000,000 | | | $ | 1,846,358 | |
Total Foreign Government Obligations (cost $24,181,829) | | | | | | | | 27,618,417 | |
U.S. Government Obligations - 3.2% | | | | | | | | | |
U.S. Treasury Bonds, 1.875%, 07/15/13 | | USD | | 1,069,170 | | | | 1,063,699 | |
U.S. Treasury Bonds, 2.000%, 01/15/14 | | USD | | 1,062,740 | | | | 1,066,020 | |
U.S. Treasury Bonds, 2.375%, 01/15/25 | | USD | | 1,770,992 | | | | 1,843,424 | |
U.S. Treasury Inflation Indexed Bonds, 0.875%, 04/15/10 | | USD | | 2,073,080 | 4 | | | 1,992,912 | |
Total U.S. Government Obligations (cost $6,167,111) | | | | | | | | 5,966,055 | |
| | | |
| | | | | Shares
| | | | |
Other Investment Companies -19.1%5 | | | | | | | | | |
Bank of New York Institutional Cash Reserves Fund, 3.97%3 | | | | 28,352,125 | | | | 28,352,125 | |
JPMorgan Prime Money Market Fund, Institutional Class Shares, 3.73% | | | | 6,659,399 | | | | 6,659,399 | |
Total Other Investment Companies (cost $35,011,524) | | | | | | | | 35,011,524 | |
Total Investments -114.6% (cost $193,973,609) | | | | | | | | 209,962,759 | |
Other Assets, less Liabilities - (14.6)% | | | | | | | | (26,765,857 | ) |
Net Assets -100.0% | | | | | | | $ | 183,196,902 | |
The accompanying notes are an integral part of these financial statements.
13
Managers International Growth Fund
Portfolio Manager Comments
Managers International Growth Fund (“International Growth”) seeks long-term capital appreciation through investment in non- U.S. equity securities. On June 1, 2005, Managers hired subadvisor Wellington Management Company, LLP (Wellington), led by Jean-Marc Berteaux and Andrew S. Offit, to manage the portfolio. Wellington was hired to replace subadvisor Jarislowsky Fraser Limited (JFL).
The Portfolio Managers
Wellington Management Company, LLP
Portfolio managers Jean-Marc Berteaux and Andrew S. Offit lead Wellington’s International Growth Team (“IGT”) in managing the portfolio. Jean-Marc and Andy are supported by Wellington’s global industry analysts and regional analysts as well as specialized fundamental, quantitative, and technical analysts, and traders. The IGT’s investment philosophy is built on the beliefs that industry is the dominant competitive factor for companies, that can dominate industries on a global basis, and that expectations about companies, specifically earnings, drive stock prices. Wellington’s focus is to identify industry leaders with earnings forecasts ahead of market expectations, and to identify the key drivers for the earnings.
The initial investable universe is comprised of companies in the MSCI EAFE Index with market capitalizations greater than US$1 billion. These companies are researched by Wellington Management’s specialist group of industry analysts who perform intensive ongoing fundamental analysis. Analysts provide assessments, financial models and fundamental research to the IGT. The focus of this research is to update an ongoing assessment of management, current business challenges and aggregate industry trends. Thorough analysis is done in preparation for and following company contacts to ensure that “the numbers support the story” – that the strategy and challenges outlined by management are coming through in financial results. The companies ultimately purchased for the portfolio will exhibit the following characteristics: industry leadership, identified earnings drivers, and above consensus earnings growth expectations. Companies in the portfolio are continually monitored to ensure their fundamental attractiveness based on the identified earnings drivers. Market expectations catching up to their earnings forecast and/or deterioration in earnings drivers will factor into the sell decision. The portfolio will generally hold 50 to 80 securities. Portfolio turnover is expected to be high, exceeding 150% on average per annum. While the portfolio’s holdings-based turnover is expected to be in the 100% range, the IGT will actively trade these positions as a result of significant near-term price movements and other factors.
The Year in Review
During the fiscal year ended October 31, 2005, non-U.S. developed equity markets performed extremely well; the MSCI EAFE Index (EAFE) returned 18.09%. The materials, industrials, energy, and financial sectors were the best performers during that time period, all turning in returns over 20%. On the other hand, the technology and telecommunication services sectors lagged. During the fiscal year, nearly all countries included in EAFE turned in positive results. Of particular note is Japan; after struggling through the first half of 2005, Japan’s performance surged toward the end of the fiscal year, driven by a significant improvement in investor sentiment.
On an absolute basis, the Fund’s performance was very strong, returning 12.99% for the fiscal year ended October 31, 2005. The Fund did not perform as well as EAFE, however, which returned 18.09% over the same time period. Several factors contributed to the Fund’s relative underperformance. First of all, the Fund’s stock selection within the technology sector was a drag on performance. Several of the Fund’s technology holdings within the flat panel display industry were hurt toward the end of the Fund’s fiscal year. More specifically, flat panel makers AU Optronics and Chi Mei Optoelectronics performed poorly as those stocks came under pressure due to concerns that the global consumer may be weakening and that margins would be lower than expected for many companies connected with the industry. Stock selection within consumer staples and industrials also negatively affected Fund performance. Within consumer staples, Netherlands-based Heineken and Koninklijke Ahold turned in weak results. From a sector allocation standpoint, the Fund’s overweighting to technology stocks as well as its underweighting to materials and financial stocks negatively affected relative performance. Given this Fund’s growth bias, however, it makes sense that it would typically be overweight technology and underweight materials and financials sectors. On the other hand, the Fund’s limited amount of exposure to the telecommunication services sector proved helpful as that sector struggled throughout the fiscal year.
On a positive note, strong stock selection within the financial and energy sectors contributed positively to performance. A standout performer for the year was financial stock Mitsubishi UFJ Financial Group, Inc.; the Japanese-based bank saw its shares increase sharply toward the end of the fiscal year as it is benefiting from synergies playing out from the merger with UFJ, a reduction in bad debt, and an improving Japanese economy. Within the energy sector, several Canadian energy stocks, including Nexen, Inc., Petro-Canada, and Encana Corp. performed very well as solid earnings growth was bolstered by strong commodity prices.
Looking Forward
Heading into the next fiscal year, the UK, France and Japan comprise nearly 50% of the Fund. The Fund has a significant underweight to the UK relative to EAFE, while it has a meaningful exposure to Canada (a country not included in EAFE). Subadvisor Wellington continues to see compelling growth opportunities in the emerging markets and therefore owns the stocks of companies in countries such as Mexico, Brazil, and South Africa, and South Korea. The Fund continues to have large exposures to the financial, information technology, and consumer discretionary sectors.
14
Managers International Growth Fund
Portfolio Manager Comments (continued)
Cumulative Total Return Performance
International Growth’s cumulative total return is based on the daily change in net asset value (NAV), and assumes that all distributions were reinvested. The MSCI EAFE Index (“EAFE”) is compiled by Morgan Stanley Capital International. It consists of over 1,000 large, publicly traded stocks from 20 countries of Europe, Asia, Australia and the Far East. Unlike the Fund, EAFE is unmanaged, is not available for investment, and does not incur expenses. The chart illustrates the performance of a hypothetical $10,000 investment made in the Fund on October 31, 1995, to a $10,000 investment made in the EAFE for the same time period. Performance for periods longer than one year is annualized. The graph and table do not reflect the deduction of taxes that a shareholder would pay on a Fund distribution or redemption of shares. Total returns for the Fund would have been lower had certain expenses not been reduced.
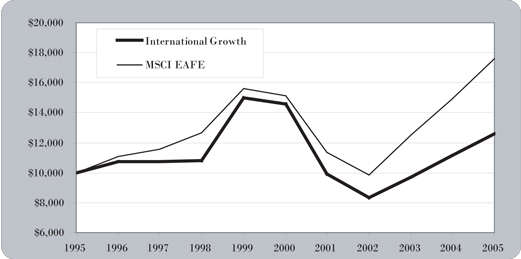
The table below shows the average annual total returns for Managers International Growth Fund and the MSCI EAFE Index since October 31, 1995 through October 31, 2005.
| | | | | | | | | |
Average Annual Total Returns:
| | 1Year
| | | 5 Years
| | | 10 Years
| |
International Growth | | 12.99 | % | | (2.87 | )% | | 2.35 | % |
MSCI EAFE | | 18.09 | % | | 3.04 | % | | 5.81 | % |
The performance data shown represents past performance. Past performance is not a guarantee of future results. Current performance may be lower or higher than the performance data quoted. The investment return and the principal value of an investment will fluctuate so that an investor’s shares, when redeemed, may be worth more or less than their original cost. For performance information through the most recent month end please call (800) 835-3879 or visit our Web site at www.managersinvest.com.
Investments in foreign securities are subject to additional risks such as erratic market conditions, economic and political instability, and currency exchange rate fluctuations.
The table displays a full breakdown of the top ten holdings of the Fund as well as the geographic diversification as of October 31, 2005.
| | | |
Top Ten Holdings (out of 57 securities)
| | % Net Assets
| |
Credit Suisse Group | | 3.2 | % |
Standard Chartered, PLC | | 2.7 | |
Nestle SA, Registered* | | 2.7 | |
Vivendi Universal SA | | 2.4 | |
Reckitt Benckiser PLC | | 2.4 | |
Merck KGaA | | 2.2 | |
EMI Group PLC | | 2.2 | |
Nippon Electric Glass Co., Ltd. | | 2.2 | |
Roche Holding AG | | 2.2 | |
Dassault Systemes SA | | 2.2 | |
| | |
|
|
Top Ten as a Group | | 24.4 | % |
| | |
|
|
| * | Top Ten Holding at April 30, 2005 |
| | | |
Geographic Diversification
| | % Net Assets
| |
Europe | | 64.0 | % |
Japan | | 20.8 | |
Canada | | 7.5 | |
Latin America | | 3.1 | |
Asia | | 2.4 | |
United States | | 1.3 | |
Africa | | 0.9 | |
| | |
|
|
| | | 100.0 | % |
| | |
|
|
Any sectors, industries, or securities discussed should not be perceived as investment recommendations. Any securities discussed may no longer be held in the account’s portfolio. It should not be assumed that any of the securities transactions discussed were or will prove to be profitable, or that the investment recommendations we make in the future will be profitable.
15
Managers International Growth Fund
Schedule of Portfolio Investments
October 31, 2005
| | | | | | |
Security Description
| | Shares
| | | Value
|
Common Stocks - 98.9% | | | | | | |
Consumer Discretionary - 22.3% | | | | | | |
Adidas - Salomon AG (Germany) | | 3,738 | | | $ | 627,029 |
Carphone Warehouse Group, The (United Kingdom) | | 198,162 | | | | 688,245 |
EMI Group PLC (United Kingdom) | | 228,538 | | | | 866,777 |
Grupo Televisa S.A. (Mexico) | | 11,300 | 4 | | | 826,030 |
Koninklijke (Royal) Philips Electronics N.V. (Netherlands) | | 23,582 | | | | 616,353 |
LVMH Moet Hennessy Louis Vuitton SA (France) | | 9,205 | 4 | | | 745,117 |
Matsushita Electric Industrial Co., Ltd. (Japan) | | 32,000 | | | | 586,440 |
Peugeot SA (France) | | 2,951 | | | | 179,225 |
Pinault-Printemps-Redoute SA (France) | | 1,908 | | | | 200,420 |
Publicis Groupe (France) | | 19,829 | | | | 655,419 |
SES GLOBAL (France) | | 46,219 | | | | 730,519 |
Swatch Group AG, The (Switzerland) | | 9,581 | | | | 271,897 |
Toyota Motor Corp. (Japan) | | 17,800 | | | | 825,430 |
Vivendi Universal SA (France)* | | 30,265 | | | | 952,076 |
Total Consumer Discretionary | | | | | | 8,770,977 |
Consumer Staples - 9.4% | | | | | | |
Japan Tobacco, Inc. (Japan) | | 49 | | | | 774,683 |
Nestle SA, Registered (Switzerland) | | 3,556 | | | | 1,057,390 |
Reckitt Benckiser PLC (United Kingdom) | | 31,306 | | | | 946,090 |
Royal Numico NV (Netherlands) | | 9,581 | | | | 387,834 |
Seven & I Holdings Co., Ltd. (Japan) | | 16,240 | | | | 530,149 |
Total Consumer Staples | | | | | | 3,696,146 |
Energy - 4.9% | | | | | | |
Eni S.p.A. (Italy) | | 20,395 | 4 | | | 545,620 |
Petro-Canada (Canada) | | 17,800 | | | | 621,125 |
Sasol Ltd. (South Africa) | | 11,714 | | | | 370,245 |
Talisman Energy, Inc. (Canada) | | 9,000 | | | | 399,127 |
Total Energy | | | | | | 1,936,117 |
Financials - 17.3% | | | | | | |
Allianz AG (Germany) | | 5,834 | | | | 824,916 |
Banco Bilbao Vizcaya Argentaria SA (Spain) | | 37,746 | 4 | | | 665,235 |
Credit Suisse Group (Switzerland) | | 28,754 | | | | 1,270,107 |
Mitsubishi Tokyo Financial Group, Inc. (Japan) | | 47 | | | | 590,743 |
Muenchener Rueckversicherungs AG (Germany) | | 5,045 | | | | 591,962 |
Shizuoka Bank Ltd., The (Japan) | | 9,000 | | | | 94,517 |
Standard Chartered, PLC (United Kingdom) | | 51,048 | | | | 1,072,189 |
UBS AG (Switzerland) | | 9,300 | | | | 791,793 |
Unibail (France) | | 1,615 | | | $ | 213,203 |
UniCredito Italiano SpA (Italy) | | 125,795 | | | | 697,606 |
Total Financials | | | | | | 6,812,271 |
Health Care - 11.2% | | | | | | |
AstraZeneca PLC (United Kingdom) | | 13,311 | | | | 595,556 |
Eisai Co., Ltd. (Japan) | | 15,100 | | | | 591,389 |
Essilor International SA (France) | | 9,959 | 4 | | | 819,565 |
Merck KGaA (Germany) | | 10,566 | | | | 873,819 |
Roche Holding AG (Switzerland)* | | 5,745 | | | | 857,162 |
Shionogi & Co., Ltd. (Japan) | | 6,000 | | | | 72,965 |
Teva Pharmaceutical Industries, Ltd., Sponsored ADR (Israel) | | 15,400 | 4 | | | 587,048 |
Total Health Care | | | | | | 4,397,504 |
Industrials - 11.2% | | | | | | |
Atlas Copco AB (Sweden) | | 10,600 | | | | 193,726 |
Canadian Pacific Railway Ltd. (Canada) | | 9,500 | 4 | | | 391,018 |
European Aeronautic Defense and Space Co. (Netherlands) | | 8,511 | | | | 294,728 |
FANUC, Ltd. (Japan) | | 8,100 | | | | 638,348 |
Hutchison Whampoa, Ltd. (Hong Kong) | | 19,000 | | | | 180,787 |
Komatsu Ltd. (Japan) | | 30,000 | | | | 399,758 |
Koyo Seiko Co., Ltd. (Japan) | | 16,000 | | | | 257,082 |
Kuehne & Nagel International AG (Switzerland) | | 1,709 | | | | 399,627 |
Ryanair Holdings PLC, Sponsored ADR (Ireland)* | | 6,700 | 4 | | | 332,119 |
Siemens AG (Germany) | | 5,824 | | | | 433,564 |
SNC-Lavalin Group, Inc. (Canada) | | 6,400 | | | | 404,222 |
Yamato Transport Co., Ltd. (Japan) | | 30,000 | | | | 494,171 |
Total Industrials | | | | | | 4,419,150 |
Information Technology - 13.5% | | | | | | |
Altran Technologies SA (France)* | | 28,110 | | | | 328,637 |
Dassault Systemes SA (France) | | 16,464 | | | | 850,065 |
Ericsson (LM), Class B (Sweden) | | 232,400 | | | | 761,425 |
Keyence Corp. (Japan) | | 2,400 | | | | 552,268 |
Nippon Electric Glass Co., Ltd. (Japan) | | 45,000 | | | | 861,466 |
Nokia Oyj (Finland) | | 41,950 | | | | 702,529 |
Research In Motion, Ltd. (Canada)* | | 9,400 | 4 | | | 578,006 |
Samsung Electronics Co., Ltd., GDR (South Korea) (a) | | 731 | | | | 193,959 |
Softbank Corp. (Japan) | | 5,900 | | | | 334,514 |
TomTom NV (Netherlands)* | | 4,673 | | | | 179,913 |
Total Information Technology | | | | | | 5,342,782 |
Materials - 6.2% | | | | | | |
Anglo American PLC (United Kingdom) | | 13,327 | | | | 394,533 |
The accompanying notes are an integral part of these financial statements.
16
Managers International Growth Fund
Schedule of Portfolio Investments (continued)
| | | | | | | |
Security Description
| | Shares
| | | Value
| |
Materials (continued) | | | | | | | |
Cameco Corp. (Canada) | | 8,000 | | | $ | 382,400 | |
Compania Vale do Rio Doce - ADR (Brazil) | | 9,900 | 4 | | | 409,168 | |
Inco, Ltd. (Canada) | | 4,600 | | | | 185,012 | |
Japan Synthetic Rubber Corp. (Japan) | | 17,300 | | | | 407,826 | |
Rio Tinto PLC (United Kingdom) | | 9,214 | | | | 351,106 | |
Xstrata PLC (United Kingdom) | | 13,913 | | | | 318,797 | |
Total Materials | | | | | | 2,448,842 | |
| | |
Telecommunication Services - 1.4% | | | | | | | |
NTT DoCoMo, Inc. (Japan) | | 115 | | | | 198,607 | |
Vodafone Group PLC (United Kingdom) | | 128,792 | | | | 338,193 | |
Total Telecommunication Services | | | | | | 536,800 | |
Utilities - 1.5% | | | | | | | |
Veolia Environment (France) | | 14,158 | 4 | | | 588,852 | |
Total Common Stocks (cost $37,010,206) | | | | | | 38,949,441 | |
Other Investment Companies - 13.6%5 | | | | | | | |
Bank of New York Institutional Cash Reserves Fund, 3.97%3 | | 4,842,534 | | | | 4,842,534 | |
JPMorgan Prime Money Market Fund, Institutional Class Shares, 3.73% | | 533,843 | | | | 533,843 | |
Total Other Investment Companies (cost $5,376,377) | | | | | | 5,376,377 | |
Total Investments - 112.5% (cost $42,386,583) | | | | | | 44,325,818 | |
Other Assets, less Liabilities - (12.5)% | | | | | | (4,937,293 | ) |
Net Assets - 100.0% | | | | | $ | 39,388,525 | |
| | | | | | |
| Summary of Investments by Country (unaudited) | | | | | | |
Country
| | Managers
International
Growth Fund*
| | | MSCI
EAFE
Index
| |
Australia | | 0.0 | % | | 5.3 | % |
Austria | | 0.0 | | | 0.4 | |
Belgium | | 0.0 | | | 1.3 | |
Bermuda | | 0.0 | | | 0.0 | |
Brazil | | 1.0 | | | 0.0 | |
Canada | | 7.5 | | | 0.0 | |
Cayman Islands | | 0.0 | | | 0.0 | |
China | | 0.0 | | | 0.0 | |
Denmark | | 0.0 | | | 0.8 | |
Egypt | | 0.0 | | | 0.0 | |
Finland | | 1.8 | | | 1.4 | |
France | | 15.9 | | | 9.4 | |
Germany | | 8.5 | | | 6.9 | |
Greece | | 0.0 | | | 0.6 | |
Hong Kong | | 0.5 | | | 1.7 | |
India | | 0.0 | | | 0.0 | |
Ireland | | 0.8 | | | 0.8 | |
Israel | | 1.5 | | | 0.0 | |
Italy | | 3.2 | | | 3.7 | |
Japan | | 20.8 | | | 24.1 | |
Malaysia | | 0.0 | | | 0.0 | |
Mexico | | 2.1 | | | 0.0 | |
Netherlands | | 3.7 | | | 3.3 | |
New Zealand | | 0.0 | | | 0.2 | |
Norway | | 0.0 | | | 0.7 | |
Panama | | 0.0 | | | 0.0 | |
Peru | | 0.0 | | | 0.0 | |
Portugal | | 0.0 | | | 0.3 | |
Russia | | 0.0 | | | 0.0 | |
Singapore | | 0.0 | | | 0.8 | |
South Africa | | 0.9 | | | 0.0 | |
South Korea | | 0.5 | | | 0.0 | |
Spain | | 1.7 | | | 3.9 | |
Supranational Bank | | 0.0 | | | 0.0 | |
Sweden | | 2.4 | | | 2.3 | |
Switzerland | | 11.8 | | | 7.0 | |
Taiwan | | 0.0 | | | 0.0 | |
Tunisia | | 0.0 | | | 0.0 | |
United Kingdom | | 14.1 | | | 25.1 | |
United States | | 1.3 | | | 0.0 | |
| | |
|
| |
|
|
| | | 100.0 | % | | 100.0 | % |
| | |
|
| |
|
|
| * | As a percent of total market value of common stocks at October 31, 2005. |
The accompanying notes are an integral part of these financial statements.
17
Managers Structured Core Fund
Portfolio Manager Comments
First Quadrant Philosophy and Process
First Quadrant believes that there are significant and recurring market inefficiencies, and that history can help identify which inefficiencies are profitable. Inefficiencies may be identified through on-going fundamental research conducted by First Quadrant’s research team. Incorporating this fundamental research into a quantitative model leads to a consistent, disciplined investment process.
First Quadrant uses a proprietary multi-factor quantitative model to construct portfolios that combine a top-down analysis of market and economic conditions with a bottom-up stock selection process. The top-down analysis consists of a review of market and economic data to identify those industries and sectors of the market that are likely to benefit from present and future economic conditions. The top-down analysis helps fund management determine how to tilt the portfolio relative to the benchmark in terms of style, market cap, and industry weightings. Individual stock selection, however, is driven by bottom-up models that focus primarily on:
| | • | | Market sentiment (Wall Street’s view of the security, management’s view of the security, investors’ view of the security) |
| | • | | Valuation (fund management is looking for stocks that are attractively priced), and |
| | • | | Accounting fundamentals (e.g., earnings quality, profitability, and growth). |
First Quadrant’s ideal investments exhibit some of the following traits at various times:
| | • | | Positive corporate earnings revisions and earnings surprises |
| | • | | Good corporate earnings momentum |
The investment team will sell a stock when:
| | • | | It has become unattractive based on the proprietary model |
| | • | | Portfolio management deems that news about a company is a fundamental change not captured by the model |
| | • | | The stock leaves the benchmark, although management may take several months to trade out of the stock |
Fiscal Year Review
In its first full fiscal year sub-advising the Structured Core Fund, First Quadrant outperformed the market in a solid year. For the 12 months ended 10/31/05 the Russell 3000 benchmark returned 10.60%, while the Fund returned 12.64%, as the Fund outperformed the market by 2.04%. The outperformance was driven by the Fund’s industry orientation primarily, along with specific stock selection within the industries. Leading the way on industries was the Fund’s overweight to Energy, to Medical Services, to Brokerage, and to Mining stocks. Energy stocks and Mining benefited from the extraordinary increase in commodity prices we have seen this past year, driven by global demand and supply constraints. Health Care stocks have done very well, as companies in that sector have very consistently delivered higher earnings. In addition, Brokerage Houses have benefited from the rising stock market and increased investment banking activity.
In the Energy sector the Fund profited handsomely from its holdings, where in general First Quadrant has avoided the large integrated majors in favor of the relatively smaller, more focused Energy companies. Stocks like Apache Corp., Conoco Phillips, Devon Energy, and Valero Energy have all done very well. United Health Group was the best performing single stock in terms of contribution to performance, as it made several accretive acquisitions and grew its earnings significantly above Street expectations. In Health Care the Fund also had strong performers in Coventry Health Care and Pacific Care, which was taken over earlier in the year by United Health. In Mining a recent acquisition of Phelps Dodge has done very well, as has a longer-term position in Southern Peru Copper. Another stock that helped considerably during the year was a position in Altria, which enjoyed very strong gains as earnings continue to rise, and as litigation fears receded. Finally, Apple Computer was one of the portfolio’s strongest performing individual stocks, as the Ipod continues to exhibit remarkable popularity, and as Apple continues to release new versions of the Ipod at a dizzying rate.
Despite the overall success, not everything worked out well during the year. First Quadrant stumbled with several stocks choices, including Ford Motor, which the investment team thought offered an attractive valuation. The Fund’s holding in Pfizer earlier in the year did not work, as the large pharmaceutical stocks have had their difficulties with litigation and lack of a strong drug pipeline. Overseas Shipholding stumbled on a drop in maritime rates – the Fund still holds the stock as First Quadrant believes that it remains significantly undervalued by the market. Annaly Mortgage Management stumbled on the increase in interest rates, which negatively impacted earnings.
As we move into the next fiscal year the management team is in the process of re-orienting the portfolio. First Quadrant’s signals have moved from favoring smaller-cap to a slight larger-cap exposure and from a preference for value stocks to a more neutral posture. In addition, the team has moderated the Fund’s Energy overweight. Some things remain the same – First Quadrant continues to favor Financial Services (with the exception of Banks in the flat yield curve environment we have currently) as well as Health Care.
18
Managers Structured Core Fund
Portfolio Manager Comments (continued)
Cumulative Total Return Performance
Managers Structured Core Fund’s cumulative total return is based on the daily change in net asset value (NAV), and assumes that all distributions were reinvested. The Russell 3000 Index is composed of the 3,000 largest U.S. companies as measured by market capitalization, and represent about 98% of the U.S. stock market. Unlike the Fund, the Russell 3000 Index is unmanaged, is not available for investment, and does not incur expenses. The chart illustrates the performance of a hypothetical $10,000 investment made in the Fund on October 31, 1995, to a $10,000 investment made in the Russell 3000 Index for the same time period. Performance for periods longer than one year is annualized. Figures include reinvestment of capital gains and dividends. The listed returns for the Fund are net of expenses and the returns for the index exclude expenses. The graph and table do not reflect the deduction of taxes that a shareholder would pay on a Fund distribution or redemption of shares. Total returns for the Fund would have been lower had certain expenses not been reduced.
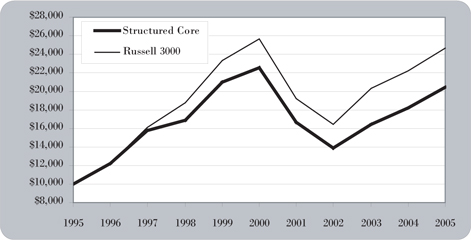
The table below shows the average annual total returns for Managers Structured Core Fund and the Russell 3000 Index since October 31, 1995 through October 31, 2005.
| | | | | | | | | |
Average Annual Total Returns:
| | 1 Year
| | | 5 Years
| | | 10 Years
| |
Structured Core | | 12.64 | % | | (1.91 | )% | | 7.43 | % |
Russell 3000 | | 10.60 | % | | (0.81 | )% | | 9.43 | % |
The performance data shown represents past performance. Past performance is not a guarantee of future results. Current performance may be lower or higher than the performance data quoted. The investment return and the principal value of an investment will fluctuate so that an investor’s shares, when redeemed, may be worth more or less than their original cost. For performance information through the most recent month end please call (800) 835-3879 or visit our Web site at www.managersinvest.com.
The table displays a full breakdown of the top ten holdings of the Fund as well as the industry weightings as of October 31, 2005.
| | | |
Top Ten Holdings (out of 115 securities)
| | % Net Assets
| |
Citigroup, Inc.* | | 4.6 | % |
ConocoPhillips Co.* | | 4.0 | |
Bank of America Corp.* | | 3.8 | |
Verizon Communications, Inc. | | 3.1 | |
UnitedHealth Group, Inc.* | | 2.7 | |
Bear Stearns Co., Inc., The | | 2.7 | |
PMI Group, Inc. | | 2.6 | |
PPL Corp. | | 2.4 | |
Northrop Grumman Corp.* | | 2.4 | |
Pfizer, Inc.* | | 2.4 | |
| | |
|
|
Top Ten as a Group | | 30.7 | % |
| | |
|
|
| * | Top Ten Holding at April 30, 2005 |
| | | |
Industry Weightings
| | % Net Assets
| |
Financials | | 29.2 | % |
Information Technology | | 17.0 | |
Health Care | | 14.0 | |
Energy | | 9.3 | |
Industrials | | 7.4 | |
Consumer Disretionary | | 5.8 | |
Utilities | | 5.4 | |
Telecommunication Services | | 5.4 | |
Materials | | 2.3 | |
Consumer Staples | | 2.2 | |
Other Assets and Liabilities | | 2.0 | |
| | |
|
|
| | | 100.0 | % |
| | |
|
|
Any sectors, industries, or securities discussed should not be perceived as investment recommendations. Any securities discussed may no longer be held in the account’s portfolio. It should not be assumed that any of the securities transactions discussed were or will prove to be profitable, or that the investment recommendations we make in the future will be profitable.
19
Managers Structured Core Fund
Schedule of Portfolio Investments
October 31, 2005
| | | | | | |
Security Description
| | Shares
| | | Value
|
Common Stocks - 99.0% | | | | | | |
Consumer Discretionary - 5.8% | | | | | | |
American Eagle Outfitters, Inc. | | 10,000 | 4 | | $ | 235,500 |
Ameristar Casinos, Inc. | | 4,400 | 4 | | | 93,852 |
Claire’s Stores, Inc. | | 4,200 | | | | 109,410 |
Federated Department Stores, Inc. | | 12,400 | | | | 760,988 |
Ford Motor Co. | | 49,400 | 4 | | | 411,008 |
J.C. Penney Co., Inc., Holding Co. | | 1,800 | 4 | | | 92,160 |
McDonald’s Corp. | | 12,000 | | | | 379,200 |
Pantry, Inc., The* | | 9,800 | | | | 379,162 |
Stage Stores, Inc.* | | 6,600 | 4 | | | 182,952 |
Talbots, Inc. | | 7,400 | | | | 193,066 |
Time Warner Co., Inc.* | | 37,800 | | | | 673,974 |
Walt Disney Co., The | | 28,600 | | | | 696,982 |
Total Consumer Discretionary | | | | | | 4,208,254 |
Consumer Staples - 2.2% | | | | | | |
Elizabeth Arden, Inc.* | | 2,600 | 4 | | | 56,342 |
Kimberly-Clark Corp. | | 12,500 | | | | 710,500 |
Loews Corp. - Carolina Group | | 1,600 | 4 | | | 65,840 |
Pilgrim’s Pride Corp., Class B | | 8,000 | 4 | | | 251,840 |
Sanderson Farms, Inc. | | 3,000 | 4 | | | 103,530 |
Smithfield Foods Inc.* | | 9,800 | 4 | | | 289,884 |
SUPERVALU, Inc. | | 3,600 | | | | 113,148 |
Total Consumer Staples | | | | | | 1,591,084 |
Energy - 9.3% | | | | | | |
Amerada Hess Corp. | | 2,400 | | | | 300,240 |
Anadarko Petroleum Corp. | | 2,800 | | | | 253,988 |
Apache Corp. | | 9,200 | 4 | | | 587,236 |
ChevronTexaco Corp. | | 7,800 | | | | 445,146 |
ConocoPhillips Co. | | 44,200 | | | | 2,889,796 |
Devon Energy Corp. | | 5,800 | | | | 350,204 |
Marathon Oil Corp. | | 2,200 | | | | 132,352 |
Occidental Petroleum Corp. | | 5,000 | | | | 394,400 |
Overseas Shipholding Group, Inc. | | 24,000 | 4 | | | 1,142,400 |
Valero Energy Corp. | | 2,400 | | | | 252,576 |
Total Energy | | | | | | 6,748,338 |
Financials - 29.2% | | | | | | |
Allstate Corp., The | | 8,800 | | | | 464,552 |
American Home Mortgage Investment Corp. | | 19,200 | 4 | | | 518,976 |
Annaly Mortgage Management, Inc. | | 58,000 | 4 | | | 665,840 |
Astoria Financial Corp. | | 12,200 | | | | 340,990 |
Bank of America Corp. | | 62,400 | | | | 2,729,376 |
Bear Stearns Co., Inc., The | | 18,400 | | | | 1,946,720 |
Capital One Financial Corp. | | 4,600 | 4 | | | 351,210 |
Chubb Corp. | | 9,600 | | | | 892,512 |
Citigroup, Inc. | | 73,000 | | | | 3,341,941 |
Fannie Mae Co. | | 5,200 | 4 | | | 247,104 |
Fremont General Corp. | | 12,200 | 4 | | | 264,618 |
Goldman Sachs Group, Inc. | | 3,800 | | | | 480,206 |
Hartford Financial Services Group, Inc. | | 600 | 4 | | $ | 47,850 |
Lehman Brothers Holdings, Inc. | | 3,600 | | | | 430,812 |
MBNA Corp. | | 29,200 | 4 | | | 746,644 |
Merrill Lynch & Co., Inc. | | 22,600 | | | | 1,463,124 |
Morgan Stanley Co. | | 14,600 | | | | 794,386 |
National City Corp. | | 13,000 | 4 | | | 418,990 |
Nationwide Financial Services, Inc. | | 2,400 | | | | 96,936 |
PMI Group, Inc. | | 46,800 | 4 | | | 1,866,384 |
Radian Group, Inc. | | 15,800 | | | | 823,180 |
Safeco Corp. | | 1,000 | | | | 55,700 |
Sovereign Bancorp, Inc. | | 6,400 | | | | 138,048 |
Thornburg Mortgage, Inc. | | 6,200 | 4 | | | 157,170 |
W Holding Co., Inc. | | 4,800 | 4 | | | 37,008 |
W.R. Berkley Corp. | | 14,200 | | | | 620,540 |
Wachovia Corp. | | 9,200 | | | | 464,784 |
Washington Mutual, Inc. | | 18,400 | 4 | | | 728,640 |
Total Financials | | | | | | 21,134,241 |
Health Care - 14.0% | | | | | | |
AmerisourceBergen Corp. | | 4,000 | | | | 305,080 |
Amgen, Inc.* | | 8,200 | | | | 621,232 |
Applera Corp. - Applied Biosystems Group | | 40,200 | 4 | | | 975,654 |
Coventry Health Care, Inc.* | | 24,600 | | | | 1,328,154 |
Dentsply International Inc. | | 6,300 | | | | 347,382 |
Forest Laboratories, Inc.* | | 7,400 | | | | 280,534 |
Hospira, Inc.* | | 2,400 | | | | 95,640 |
Merck & Co., Inc. | | 44,600 | 4 | | | 1,258,612 |
Mylan Laboratories, Inc. | | 9,400 | 4 | | | 180,574 |
PDI, Inc.* | | 4,800 | | | | 67,296 |
Perrigo Co. | | 16,600 | | | | 221,942 |
Pfizer, Inc. | | 79,200 | | | | 1,721,808 |
Sierra Health Services* | | 10,000 | 4 | | | 750,000 |
UnitedHealth Group, Inc. | | 34,200 | | | | 1,979,838 |
Total Health Care | | | | | | 10,133,746 |
Industrials - 7.4% | | | | | | |
Briggs & Stratton Corp. | | 10,800 | 4 | | | 345,384 |
Cummins, Inc. | | 8,400 | 4 | | | 717,108 |
Eaton Corp. | | 8,200 | | | | 482,406 |
Landstar System, Inc.* | | 8,600 | 4 | | | 331,272 |
Masco Corp. | | 3,000 | 4 | | | 85,500 |
Northrop Grumman Corp. | | 32,200 | | | | 1,727,530 |
Parker Hannifin Corp. | | 12,000 | | | | 752,160 |
Raytheon Co. | | 20,800 | | | | 768,560 |
Republic Airways Holdings, Inc.* | | 5,800 | | | | 90,480 |
Ryder System, Inc. | | 2,000 | | | | 79,340 |
Total Industrials | | | | | | 5,379,740 |
Information Technology - 17.0% | | | | | | |
Airspan Networks, Inc.* | | 13,400 | 4 | | | 66,732 |
Apple Computer, Inc.* | | 13,000 | | | | 748,670 |
Applied Materials, Inc. | | 34,000 | 4 | | | 556,920 |
The accompanying notes are an integral part of these financial statements.
20
Managers Structured Core Fund
Schedule of Portfolio Investments (continued)
| | | | | | | |
Security Description
| | Shares
| | | Value
| |
Information Technology (continued) | | | | | | | |
Arrow Electronics, Inc.* | | 30,000 | | | $ | 885,300 | |
Autodesk, Inc. | | 15,200 | | | | 685,976 | |
Cisco Systems, Inc.* | | 12,600 | | | | 219,870 | |
Computer Sciences Corp.* | | 2,600 | 4 | | | 133,250 | |
Freescale Semiconductor, Inc.* | | 8,399 | | | | 200,568 | |
Google, Inc.* | | 1,800 | | | | 669,852 | |
Hewlett-Packard Co. | | 45,200 | | | | 1,267,408 | |
Ingram Micro, Inc., Class A* | | 29,000 | | | | 524,900 | |
Intel Corp. | | 57,600 | 4 | | | 1,353,600 | |
Intergraph Corp.* | | 5,400 | 4 | | | 261,252 | |
International Business Machines Corp. | | 19,000 | | | | 1,555,720 | |
Motorola, Inc. | | 65,300 | | | | 1,447,048 | |
NCR Corp.* | | 7,200 | | | | 217,584 | |
Oracle Corp.* | | 22,200 | | | | 281,496 | |
Reynolds & Reynolds Co., The, Class A | | 6,600 | | | | 175,164 | |
Sabre Holdings Corp. | | 14,000 | 4 | | | 273,420 | |
Symantec Corp.* | | 4,000 | | | | 95,400 | |
Xerox Corp.* | | 53,200 | 4 | | | 721,924 | |
Total Information Technology | | | | | | 12,342,054 | |
Materials - 2.3% | | | | | | | |
Eastman Chemical Co. | | 800 | | | | 42,208 | |
Phelps Dodge Corp. | | 12,200 | 4 | | | 1,469,734 | |
The Valspar Corp. | | 5,000 | | | | 110,250 | |
Total Materials | | | | | | 1,622,192 | |
Metals - 1.0% | | | | | | | |
Southern Copper Corp. | | 13,400 | 4 | | | 738,876 | |
Telecommunication Services - 5.4% | | | | | | | |
Centurytel, Inc. | | 50,600 | 4 | | | 1,656,138 | |
Verizon Communications, Inc. | | 72,400 | | | | 2,281,324 | |
Total Telecommunication Services | | | | | | 3,937,462 | |
Utilities - 5.4% | | | | | | | |
American Electric Power Co., Inc. | | 10,400 | | | | 394,784 | |
Energen Corp. | | 22,800 | | | | 857,280 | |
Oneok, Inc. | | 15,600 | | | | 448,344 | |
PPL Corp. | | 56,000 | | | | 1,755,040 | |
TXU Corp. | | 4,800 | 4 | | | 483,600 | |
Total Utilities | | | | | | 3,939,048 | |
Total Common Stocks (cost $68,114,905) | | | | | | 71,775,035 | |
Other Investment Companies - 24.4%5 | | | | | | | |
Bank of New York Institutional Cash Reserves Fund, 3.97%3 | | 16,987,872 | | | | 16,987,872 | |
JPMorgan Prime Money Market Fund, Institutional Class Shares, 3.73% | | 666,068 | | | | 666,068 | |
Total Other Investment Companies (cost $17,653,940) | | | | | | 17,653,940 | |
Total Investments -123.4% (cost $85,768,845) | | | | | $ | 89,428,975 | |
Other Assets, less Liabilities - (23.4)% | | | | | | (16,958,592 | ) |
Net Assets -100.0% | | | | | $ | 72,470,383 | |
The accompanying notes are an integral part of these financial statements.
21
Managers Small Cap Fund
Portfolio Manager Comments
Managers Small Cap Fund (“Small Cap”) seeks to achieve long-term capital appreciation by investing primarily in the stocks of small-capitalization companies.
The Portfolio Managers
Times Square Capital Management, LLC
TimesSquare Capital Management, LLC’s (“TimesSquare”) utilizes a bottom-up fundamental approach to small cap investing. Led by co-managers Yvette Bockstein and Grant Babyak, the investment team at TimesSquare believes its proprietary fundamental research skills, which place a particular emphasis on the assessment of management quality and an in-depth understanding of superior business models, enable the team to build a diversified portfolio of small cap growth stocks designed to generate good risk-adjusted returns. When selecting small-cap growth stocks, Fund management utilizes a fundamental, bottom-up process to identify companies that demonstrate consistent and sustainable revenue and earnings growth, offer distinct and sustainable competitive advantages, have strong, experienced management teams, have stocks selling at reasonable valuations, and that Fund management believes have the potential to appreciate in price by 25-50% within the next 12-18 months.
The Year in Review
Following the presidential election, the last two months of 2004 witnessed a powerful rally that was quickly erased in early 2005. For the twelve months ended October 31, 2005 smaller stocks maintained a lead over the larger stocks, a lead that was garnered in late 2004 and chipped away at for most of 2005. Returns were good for the entire period; the Russell 2000 Index rose 12.1% while the Russell 1000 Index rose 10.5%. Though the growth style has been performing better lately, as of the end of October, value is still in the lead for the twelve months; the Russell 2000 Growth Index rose 10.9% vs. 13.0% for the Russell 2000 Value Index. Within the market internals, most of the period saw firming oil prices fuel the energy stocks while a late 2004 surge in technology stocks was reversed early in 2005. Financial services were held back by the rising interest rate environment.
The Fund’s outperformance was attributable to strong stock selection across almost every sector. Favorable results came from the Fund’s health care, energy, and consumer discretionary holdings. Commercial services companies within the industrials sector added tremendous value to results. Disappointments came from a couple of drug and biotech companies and a couple of information technology companies.
An excellent total contribution came from stock selection in the health care sector. Strong performance came from the service related businesses. Davita, the kidney dialysis services company and one of the Fund’s largest holdings, was the top contributor, returning 65%; TimesSquare trimmed the position slightly into the strength. Davita recently completed its acquisition of Gambro’s kidney dialysis business, which looks to have even greater potential cost synergies than was originally thought. Other health care services holdings also continued to add value, including Pediatrix, up 37%. The nation’s leading provider of neonatal and maternal-fetal physician services has been growing with acquisitions. On the negative side, poor contributions came from drug and biotech companies but fortunately the Fund was greatly underweighted in these two industries. Ligand Pharmaceuticals, returned -42%; it announced a failed test of its drug for lung cancer, Avastin. TimesSquare was disappointed and sold the position. Fund management lost confidence in the management of generic pharmaceutical manufacturer Bradley Pharmaceuticals and sold the stock; it returned -48%.
Strong stock selection in consumer discretionary also added value. Though the Fund continued to be underweight retailers, one of the Fund’s uniquely positioned companies was a top contributor. Advance Auto Parts, the second-largest specialty retailer of automotive aftermarket parts in the US, produced a great contribution to the portfolio. The company reported great earnings and raised forward expectations for most of the year. TimesSquare trimmed the position on the strength, which returned 43%. Fund management has been selling media company Getty Images into its recent strength as it approaches the upper band of TimesSquare’s market capitalization limit. The company has been successfully integrating acquisitions; it returned 42% over the entire period. Another top contributor from the sector was SCP Pool. The largest wholesale distributor of swimming pool products and one of the larger positions in the portfolio is closing another successful year. It completed a large acquisition of Automatic Rain, a distributor of irrigation and landscaping products for the back yard. The position returned 24%.
TimesSquare generally tends to overweight companies in the commercial services industry because they have business models that provide services that are unique and difficult to replicate. Once again, these companies made very favorable contributions to the portfolio. Corporate Executive Board, the leading provider of best practices research and analysis, focusing on corporate strategy, operations and general management issues, was one of the Fund’s top contributors in 2004 and resumed its strong performance this year. Positive business fundamentals, including increased earnings guidance for 2005 and strong cash flow growth, resulted in a strong contribution to the portfolio, up 29% for the twelve months. West Corporation, one of the largest independent providers of customer relationship management services, recently announced the acquisition of Sprint’s conferencing assets which management expects to immediately add to earnings. TimesSquare believes this is an attractive acquisition; business momentum remains strong and management is executing well. TimesSquare raised its price target on the holding, which returned 42% over the period. Resources Connection, which provides professional services including accounting, finance, and information technology to businesses on a project basis, surprised investors by continuing to report strong earnings; the position returned 35% for the period. Mobile Mini, which leases out portable steel storage containers and modular steel buildings for clients such as construction contractors, retailers and schools benefited from the construction cycle and returned 65% for the twelve months.
22
Managers Small Cap Fund
Portfolio Manager Comments (continued)
Strong industry fundamentals were the driving factor in the good performance from the Fund’s energy holdings.
TimesSquare’s approach to investing in oil & gas production companies has been to identify those companies with attractive asset bases, long life reserves, and attractive organic production and reserve growth opportunities. Earlier in 2005, Fund management purchased Quicksilver Resources, a Fort Worth-based exploration & production company, a company that has expertise developing low-cost, low-risk, unconventional gas reserves. The position returned 95%, one of the top contributors to the portfolio. Another top contributor was Denbury Resources, the largest oil and gas producer in the state of Mississippi; it returned 76%. Denbury Resources is focusing on growth in oil production through injection of carbon dioxide in mature Mississippi fields, a technique that can raise total company production at least 10% annually. For the Fund’s oil service company holdings, trends in day rates for drilling services drives earnings growth. Day rates took off sharply early this year, business is operating at high capacity and competition is currently very rational. TODCO, a leading provider of contract drilling services, with the largest fleet of drilling rigs in the U.S. Gulf Coast, saw rising earnings and cash flow projections; the position returned 172%.
It was not a good year for the information technology sector. Strength was found, however, in the telecom service sector. The Fund’s holdings in these sectors were helped by a couple of takeovers. A top contribution came from Spectrasite, the cell phone tower operator. American Tower announced that it would acquire Spectrasite; it returned 58%. Macromedia, the developer of software that helps designers and developers to efficiently create websites, received a takeover offer from Adobe. TimesSquare gradually scaled out of the position as Adobe is a large cap stock. It returned 38% in the portfolio. Informatica, which simplifies its customers’ IT infrastructure by providing a single platform to integrate enterprise data, reported much better than expected earnings in the most recent quarter. Its 52% return made a good contribution to the portfolio. Greenfield Online, which provides Internet surveys used in global marketing research, also disappointed Fund management and issued lower guidance; TimesSquare sold the stock which made a poor contribution, down -72%.
Within information technology, TimesSquare has historically tended to overweight financially related IT services companies; they were a bright spot to the portfolio once more. Global Payments, which provides electronics payment processing services, reported excellent results and raised its outlook as it expands into Asia; it returned 57%. This was partially offset with a poor contribution from Alliance Data, down -16%. Alliance Data, a leading provider of transaction services, credit services and marketing services, was one of the Fund’s top contributors in 2004. Worries that a slowdown in consumer spending would generate fewer transactions and impact earnings growth for this industry hurt the stock. TimesSquare believes that the marketing services side of the business can overcome a slowdown in the credit card side of the business. In fact, earnings have been good for the company in 2005 but the multiple has been compressing.
Last year’s strong contribution notwithstanding, the Fund’s financial services holdings produced lackluster results with headwinds provided by a tightening Federal Reserve and narrowing yield spreads. Nevertheless, they did outperform the GICS financial services sector. Exceptional strength was found within the overweighted insurance industry, with Argonaut Holdings up 57% and Assured Guaranty up 37% over the period.
Looking Forward
The markets appear to want to close 2005 on a positive note. The consensus is looking for an end to the Federal Reserve tightening cycle. With the Fed raising rates twelve times in the past year and a half, the economy has moderated but has remained resilient. Third quarter earnings were on the stronger side and recent economic statistics point to a rebound from the Katrina and Rita dips. Therefore, the Fed’s work does not look complete. Though the market can continue to make progress on good earnings, significant multiple expansion will have to wait for the Fed’s mission to be accomplished.
With small caps taking a breather recently in the relative performance game to large caps, many strategists are calling an end to the small cap outperformance cycle. TimesSquare disagrees and believes that there continues to be good investment opportunities within the small cap market. It is true that the length of the typical outperformance cycle of small caps vs. large caps has been exceeded, but the magnitude has not. In terms of the actual levels of outperformance, returns remain about half of the actual average ten year annualized outperformance levels for small vs. large caps.
The strength in small caps has actually been generated mostly from the value style. In fact, for the five years ended October 31, 2005, the Russell 2000 Index returned 6.8% annualized while the Russell 1000 Index returned -1.4% annualized. Within the small cap benchmark, the Russell 2000 Growth Index returned -1.6% annualized for the five years ended October 31, 2005 while the Russell 2000 Value Index returned an impressive 14.7% annualized over the same period. Currently valuation metrics support growth stocks over value; however, the path to leadership will be somewhat dependent on the Fed’s roadmap. If the Fed is truly close to the end of its rate hike road, we should see growth stocks do better sooner. In this moderating economy, TimesSquare believes that investing in high quality companies with disciplined and experienced management teams will yield successful long term results.
23
Managers Small Cap Fund
Portfolio Manager Comments (continued)
Cumulative Total Return Performance
Small Cap’s cumulative total return is based on the daily change in net asset value (NAV), and assumes that all distributions were reinvested. The Russell 2000 Growth Index measures the performance of those Russell 2000 companies with higher price-to-book ratios and higher forecasted growth values. Unlike the Fund, the Russell 2000 Growth Index is unmanaged, is not available for investment, and does not incur expenses. The chart illustrates the performance of a hypothetical $10,000 investment made in the Fund on September 24, 1997, to a $10,000 investment made in the Russell 2000 Growth Index for the same time period. Performance for periods longer than one year is annualized. Figures include reinvestment of capital gains and dividends. The listed returns for the Fund are net of expenses and the returns for the index exclude expenses. The graph and table do not reflect the deduction of taxes that a shareholder would pay on a Fund distribution or redemption of shares. Total returns for the Fund would have been lower had certain expenses not been reduced.
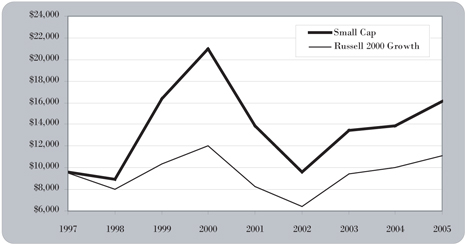
The table below shows the average annual total returns for Managers Small Cap Fund and the Russell 2000 Growth Index since inception through October 31, 2005.
| | | | | | | | | |
Average Annual Total Returns:
| | 1 Year
| | | 5 Years
| | | Since Inception*
| |
Small Cap | | 16.13 | % | | (5.12 | )% | | 6.08 | % |
Russell 2000 Growth | | 10.91 | % | | (1.62 | )% | | 1.27 | % |
| * | Commencement of operations was September 24, 1997. |
The performance data shown represents past performance. Past performance is not a guarantee of future results. Current performance may be lower or higher than the performance data quoted. The investment return and the principal value of an investment will fluctuate so that an investor’s shares, when redeemed, may be worth more or less than their original cost. For performance information through the most recent month end please call (800) 835-3879 or visit our Web site at www.managersinvest.com.
The returns shown were achieved during a period of generally rising market values, especially in the technology sector. In addition, a portion of the Fund’s performance can be attributed to investments in Initial Public Offerings (IPOs). Investors should not expect that such favorable returns can be consistently achieved. The Fund or Strategy is subject to risks associated with investments in small-capitalization companies, such as erratic earnings patterns, competitive conditions, limited earnings history, and a reliance on one or a limited number of products.
The table displays a full breakdown of the top ten holdings of the Fund as well as the industry weightings as of October 31, 2005.
| | | |
Top Ten Holdings (out of 119 securities)
| | % Net Assets
| |
Alliance Data Systems Corp.* | | 3.1 | % |
SCP Pool Corp.* | | 2.7 | |
DaVita, Inc.* | | 2.6 | |
Education Management Corp.* | | 2.6 | |
Corporate Executive Board Co.* | | 1.9 | |
Investors Financial Services Corp.* | | 1.8 | |
Global Payments, Inc.* | | 1.8 | |
Stericycle, Inc. | | 1.6 | |
West Corp. | | 1.6 | |
Resources Connection, Inc. | | 1.6 | |
| | |
|
|
Top Ten as a Group | | 21.3 | % |
| | |
|
|
| * | Top Ten Holding at April 30, 2005 |
| | | |
Industry Weightings
| | % Net Assets
| |
Industrials | | 23.4 | % |
Information Technology | | 22.1 | |
Health Care | | 18.1 | |
Financials | | 12.0 | |
Consumer Discretionary | | 9.0 | |
Energy | | 5.8 | |
Consumer Staples | | 3.2 | |
Telecommunication Services | | 1.0 | |
Other Assets and Liabilities | | 5.4 | |
| | |
|
|
| | | 100.0 | % |
| | |
|
|
Any sectors, industries, or securities discussed should not be perceived as investment recommendations. Any securities discussed may no longer be held in the account’s portfolio. It should not be assumed that any of the securities transactions discussed were or will prove to be profitable, or that the investment recommendations we make in the future will be profitable.
24
Managers Small Cap Fund
Schedule of Portfolio Investments
October 31, 2005
| | | | | | |
Security Description
| | Shares
| | | Value
|
Common Stocks - 94.6% | | | | | | |
Consumer Discretionary - 9.0% | | | | | | |
Advance Auto Parts, Inc.* | | 7,750 | | | $ | 290,625 |
Carmike Cinemas, Inc. | | 6,000 | 4 | | | 132,480 |
Entercom Communications Corp.* | | 17,300 | | | | 499,451 |
Kerzner International, Ltd.* | | 9,800 | 4 | | | 571,830 |
LodgeNet Entertainment Corp.* | | 15,815 | 4 | | | 205,595 |
Marvel Entertainment, Inc.* | | 22,100 | 4 | | | 388,960 |
Monroe Muffler Brake, Inc. | | 15,900 | | | | 476,205 |
Outdoor Channel Holdings, Inc.* | | 27,600 | | | | 444,360 |
Prestige Brands Holdings, Inc.* | | 23,100 | | | | 278,355 |
Radio One, Inc.* | | 37,600 | 4 | | | 443,680 |
SCP Pool Corp. | | 49,950 | | | | 1,796,701 |
Tempur-Pedic International, Inc.* | | 13,200 | 4 | | | 145,992 |
Williams Scotsman International, Inc.* | | 17,800 | 4 | | | 271,450 |
Total Consumer Discretionary | | | | | | 5,945,684 |
Consumer Staples - 3.2% | | | | | | |
Central Garden & Pet Co.* | | 15,600 | | | | 668,772 |
Herbalife Ltd.* | | 23,800 | 4 | | | 640,220 |
Inter Parfums, Inc. | | 19,400 | 4 | | | 293,910 |
United Natural Foods, Inc.* | | 19,000 | 4 | | | 534,090 |
Total Consumer Staples | | | | | | 2,136,992 |
Energy - 5.8% | | | | | | |
Denbury Resources, Inc.* | | 17,000 | 4 | | | 741,710 |
Hydril Co.* | | 6,300 | | | | 417,942 |
Pioneer Drilling Co.* | | 19,300 | | | | 330,609 |
Quicksilver Resources, Inc.* | | 15,750 | 4 | | | 609,998 |
TODCO* | | 22,900 | | | | 1,024,775 |
Universal Compression Holdings, Inc.* | | 20,300 | | | | 723,695 |
Total Energy | | | | | | 3,848,729 |
Financials - 12.0% | | | | | | |
Argonaut Group, Inc.* | | 23,500 | 4 | | | 685,260 |
Assured Guaranty, Ltd. | | 27,000 | | | | 604,260 |
Cardinal Financial Corp.* | | 34,700 | 4 | | | 350,817 |
Cohen & Steers, Inc. | | 23,500 | 4 | | | 434,280 |
CVB Financial Corp. | | 24,433 | 4 | | | 481,574 |
Investors Financial Services Corp. | | 31,700 | 4 | | | 1,210,306 |
Jefferies Group, Inc. | | 13,800 | 4 | | | 585,948 |
Markel Corp.* | | 2,900 | | | | 922,200 |
North Pointe Holdings Corp.* | | 31,200 | | | | 351,936 |
optionsXpress, Inc. | | 26,700 | 4 | | | 503,562 |
Primus Guaranty, Ltd.* | | 33,100 | 4 | | | 291,280 |
PrivateBancorp, Inc. | | 10,600 | 4 | | | 360,082 |
Texas Capital Bancshares, Inc.* | | 17,000 | 4 | | | 363,970 |
Trammell Crow Co.* | | 17,200 | 4 | | | 439,804 |
UCBH Holdings, Inc. | | 19,000 | 4 | | | 330,600 |
Total Financials | | | | | | 7,915,879 |
Health Care - 18.1% | | | | | | |
Adeza Biomedical Corp.* | | 20,400 | | | $ | 347,820 |
Advisory Board Co., The* | | 11,700 | 4 | | | 564,525 |
American Dental Partners, Inc.* | | 21,900 | | | | 464,280 |
BioMarin Pharmaceutical, Inc.* | | 43,500 | 4 | | | 365,400 |
Bio-Rad Laboratories, Inc.* | | 12,380 | | | | 724,478 |
China Medical Technologies, Inc.* | | 16,600 | 4 | | | 359,888 |
DaVita, Inc.* | | 35,450 | | | | 1,743,431 |
Eclipsys Corp.* | | 29,800 | 4 | | | 476,800 |
Emageon, Inc.* | | 31,400 | 4 | | | 411,654 |
Genesis HealthCare Corp.* | | 8,300 | | | | 336,814 |
Haemonetics Corp.* | | 7,500 | | | | 363,375 |
Integra LifeSciences Holdings Corp.* | | 9,900 | 4 | | | 341,550 |
Magellan Health Services, Inc.* | | 20,100 | 4 | | | 597,573 |
MWI Veterinary Supply, Inc.* | | 15,700 | | | | 351,994 |
Panacos Pharmaceuticals, Inc.* | | 17,000 | 4 | | | 134,300 |
Pediatrix Medical Group, Inc.* | | 11,600 | | | | 893,896 |
Pharmion Corp.* | | 16,300 | 4 | | | 307,907 |
PolyMedica Corp. | | 17,995 | 4 | | | 594,015 |
Radiation Therapy Services, Inc.* | | 5,400 | | | | 162,216 |
Respironics, Inc.* | | 25,400 | | | | 911,098 |
Shamir Optical Industry Ltd.* | | 14,900 | | | | 136,633 |
Stereotaxis, Inc.* | | 54,300 | 4 | | | 385,530 |
Tanox, Inc.* | | 11,300 | | | | 157,748 |
VCA Antech, Inc.* | | 33,600 | | | | 866,880 |
Total Health Care | | | | | | 11,999,805 |
Industrials - 23.4% | | | | | | |
American Reprographics Co.* | | 26,500 | | | | 446,525 |
Beacon Roofing Supply, Inc.* | | 17,400 | 4 | | | 474,324 |
Corinthian Colleges, Inc.* | | 19,900 | 4 | | | 247,556 |
Corporate Executive Board Co. | | 15,300 | | | | 1,264,392 |
CoStar Group, Inc.* | | 9,400 | 4 | | | 450,730 |
Dionex Corp.* | | 10,900 | | | | 527,887 |
Educate, Inc. | | 26,400 | | | | 310,992 |
Education Management Corp.* | | 55,400 | | | | 1,708,536 |
Huron Consulting Group, Inc. | | 14,700 | | | | 390,285 |
Jackson Hewitt Tax Service, Inc. | | 19,800 | | | | 489,456 |
Manitowoc Co., The | | 8,900 | | | | 473,569 |
Mobile Mini, Inc.* | | 20,800 | 4 | | | 970,944 |
MTC Technologies, Inc.* | | 16,000 | 4 | | | 516,960 |
On Assignment, Inc.* | | 51,300 | | | | 436,563 |
Orbital Sciences Corp.* | | 42,400 | 4 | | | 493,112 |
P.A.M. Transportation Services, Inc.* | | 6,319 | | | | 107,170 |
Pacer International, Inc.* | | 21,400 | 4 | | | 553,190 |
Portfolio Recovery Associates, Inc.* | | 11,600 | 4 | | | 451,240 |
RBC Bearings, Inc.* | | 24,200 | 4 | | | 378,004 |
Resources Connection, Inc.* | | 37,400 | 4 | | | 1,067,770 |
Ritchie Bros. Auctioneers, Inc. | | 8,900 | | | | 365,078 |
SI International, Inc.* | | 14,700 | 4 | | | 424,389 |
The accompanying notes are an integral part of these financial statements.
25
Managers Small Cap Fund
Schedule of Portfolio Investments (continued)
| | | | | | | |
Security Description
| | Shares
| | | Value
| |
Industrials (continued) | | | | | | | |
Stericycle, Inc.* | | 19,000 | 4 | | $ | 1,093,640 | |
UTI Worldwide, Inc. | | 9,000 | | | | 769,860 | |
West Corp.* | | 27,100 | | | | 1,069,095 | |
Total Industrials | | | | | | 15,481,267 | |
Information Technology - 22.1% | | | | | | | |
Advanced Energy Industries, Inc.* | | 40,800 | | | | 438,600 | |
Alliance Data Systems Corp.* | | 57,200 | | | | 2,034,032 | |
Alvarion, Ltd.* | | 40,700 | 4 | | | 317,053 | |
Anteon International Corp.* | | 12,300 | | | | 555,960 | |
Atheros Communications, Inc.* | | 55,000 | 4 | | | 476,850 | |
ATMI, Inc.* | | 18,300 | 4 | | | 499,773 | |
Cognex Corp. | | 20,600 | | | | 588,748 | |
CSG Systems International, Inc.* | | 28,400 | 4 | | | 667,684 | |
Cymer, Inc.* | | 10,200 | | | | 355,470 | |
Embarcadero Technologies, Inc.* | | 39,000 | | | | 303,420 | |
Filenet Corp.* | | 11,000 | 4 | | | 309,650 | |
Global Payments, Inc. | | 28,000 | | | | 1,199,800 | |
Henry (Jack) & Associates, Inc. | | 43,800 | | | | 787,524 | |
Informatica Corp.* | | 43,520 | | | | 517,888 | |
J2 Global Communications, Inc.* | | 9,700 | 4 | | | 428,837 | |
Littelfuse, Inc.* | | 4,100 | 4 | | | 100,491 | |
Microsemi Corp.* | | 21,500 | 4 | | | 498,155 | |
O2Micro International, Ltd.* | | 18,900 | | | | 247,590 | |
Photon Dynamics, Inc.* | | 21,400 | 4 | | | 372,574 | |
Power Integrations, Inc.* | | 6,500 | 4 | | | 137,215 | |
RADVision Ltd.* | | 17,000 | | | | 221,000 | |
SafeNet, Inc.* | | 10,500 | 4 | | | 348,285 | |
Sapient Corp.* | | 44,400 | 4 | | | 230,436 | |
Semtech Corp.* | | 30,400 | | | | 458,432 | |
SERENA Software, Inc.* | | 27,400 | | | | 599,786 | |
Tekelec* | | 25,400 | 4 | | | 348,488 | |
TIBCO Software, Inc.* | | 11,600 | | | | 88,044 | |
TRX, Inc.* | | 34,200 | | | | 292,752 | |
Wind River Systems, Inc.* | | 43,100 | | | | 564,610 | |
Wright Express Corp.* | | 31,600 | 4 | | | 681,928 | |
Total Information Technology | | | | | | 14,671,075 | |
Telecommunication Services - 1.0% | | | | | | | |
New Skies Satellites Holdings Ltd. | | 13,900 | | | | 312,611 | |
Premiere Global Services, Inc.* | | 43,800 | | | | 371,424 | |
Total Telecommunication Services | | | | | | 684,035 | |
Total Common Stocks (cost $47,545,584) | | | | | | 62,683,466 | |
Other Investment Companies - 33.9%5 | | | | | | | |
Bank of New York Institutional Cash Reserves Fund, 3.97%3 | | 18,317,019 | | | $ | 18,317,019 | |
JPMorgan Prime Money Market Fund, Institutional Class Shares, 3.73% | | 4,181,850 | | | | 4,181,850 | |
Total Other Investment Companies (cost $22,498,869) | | | | | | 22,498,869 | |
Total Investments - 128.5% (cost $70,044,453) | | | | | | 85,182,335 | |
Other Assets, less Liabilities - (28.5)% | | | | | | (18,881,097 | ) |
Net Assets - 100.0% | | | | | $ | 66,301,238 | |
The accompanying notes are an integral part of these financial statements.
26
Managers Real Estate Securities Fund
Portfolio Manager Comments
Managers Real Estate Securities Fund seeks a combination of income and long-term capital appreciation by investing in stocks of companies that are principally engaged in owning and operating commercial real estate properties for the benefit of their investors including Real Estate Investment Trusts (REIT’s). Managers utilizes an independent subadvisor to manage assets of the portfolio. Todd Briddell leads the investment team of Urdang Securities Management, Inc. (“Urdang”) in managing this Fund.
The Portfolio Manager
Urdang Securities Management, Inc.
Todd Briddell and the investment team at Urdang believe real estate securities play an important role in a multi-asset class investment portfolio. Urdang’s strategy recognizes that real estate securities are not simply stocks, or real estate. They are hybrid financial investments that must be valued on the basis of a number of meaningful factors, only one of which is the value of the firm’s property portfolio. To accurately assess the relative value of a REIT security, they take into account critical business and market factors, such as: the company’s capitalization, its position within public capital markets, and the quality of the management team.
Investment success is the result of the company’s ability to provide a consistently accurate answer to the question at the heart of its value-oriented investment strategy: Which REITs does Urdang believe will generate the highest risk-adjusted returns? Overall, Urdang believes:
A Diversified portfolio + Value orientation = Strong, risk-adjusted returns.
Urdang employs a value-oriented investment process with two distinct and complementary components: bottom-up real estate research and the company’s proprietary Relative Value Model (RVM) securities valuation process, which was designed to provide a uniform basis for evaluating the validity of a security’s trading price. Combining real estate research and the RVM process has been central to Urdang’s track record of delivering strong returns without incurring high levels of risk.
The Year in Review
For the 12 months ended October 31, 2005, the Fund returned 18.84% compared to a gain of 19.60% for the Dow Jones Wilshire REIT Index, marking the sixth straight fiscal year that the real estate securities market and the Fund have outperformed the broader equity markets.
Real estate securities have attracted investors for a number of reasons. First, this asset class has historically shown low correlations to the S&P 500 and to bonds. Real estate securities, therefore, have significant diversification benefits in a portfolio context. Second, after negative experiences in the early 2000’s with technology stocks and virtual products, many investors have come to appreciate hard assets owned by real estate companies. Finally, since REITs are required to distribute a significant portion of their income to shareholders in the form of a dividend, REITs provide significant income. More and more, real estate securities are becoming an integral part of portfolios for both retail and institutional investors. The flow of capital into real estate securities shows no sign of abating.
Fundamentally, the REIT market continues to be in solid shape. Nearly all real estate sectors are seeing improving market conditions. The hotel sector is seeing room rate and occupancy increases. The regional malls and strip center REITs are enjoying a voracious consumer and increased tenant demand. Industrial REITs are exploiting development opportunities while raising rents and occupancies in existing assets. Even the office sector, which peaked in 2001, has bottomed out and is seeing increased absorption (and higher occupancy). The private markets have been exceptionally active, with increased institutional and foreign demand. The value of REIT assets, therefore, has increased notably in the last few years.
Positive contributions to the Funds’ returns came from all asset classes. In the apartment sector, Avalon Bay Communities (AVB) delivered a 36.74% return during the fiscal year, exceeding the apartment sector mean by 13.22%. In the shopping center sector, Federal Realty Trust (FRT) was a standout during the period, delivering a 32.83% total return. In the regional mall sector, General Growth Properties (GGP) led all mall companies with a 33.92% return. In the office sector, Kilroy Realty Corporation (KRC), a southern California owner and developer of Class A office buildings, led the group with a 47.62% return. Finally, in the hotel sector, Starwood Hotels and Resorts (HOT) gained on positive operating trends, posting a 24.19% total return.
While the portfolio contained a number of stocks that delivered 25%+ returns, a few laggards offset these notable gains. United Dominion Realty (UDR), a Denver-based national apartment owner, delivered only 10.74% return for the fiscal year. Weingarten Realty Investment Trust (WRI), a Texas-based shopping center REIT, posted only a 2.88% return. Hilton Hotels Corp. (HLT) started off strong but sputtered toward the end of the fiscal year after the announcement of a large acquisition. Its total return was -1.83%.
At the beginning of the fiscal year, the portfolio design was guided by a few key themes. First, as we saw the increasing costs of public company compliance due to the enactment of the Sarbanes-Oxley legislation, we more heavily weighted the larger capitalization REITs that were in a better position to absorb these new G&A costs. Second, anticipating a rise in short-term interest rates, we favored stocks that had relatively low exposure to variable rate debt. Finally, we took an overweight position in the hotel sector, which was enjoying the perfect storm of increasing demand and limited supply. Over these three themes, the large-cap “bet” has proved the most beneficial to the portfolio. Smaller capitalization stocks struggled to meet earnings forecasts
27
Managers Real Estate Securities Fund
Portfolio Manager Comments (continued)
in the early stages of Sarbanes-Oxley implementation. Large cap stocks have outperformed, both from an earnings perspective and from a stock performance perspective.
Looking Forward
The portfolio strategy for this upcoming year will see some changes to that of last year. First, seeing that the large capitalization stocks have become relatively expensive, we are beginning to transition the portfolio toward smaller capitalization stocks. Second, as the Fed has already raised short-term rates by 200 basis points in the last fiscal year and is seen to be entering the last phases of tightening, the risk of increased variable rate debt costs has dissipated somewhat. While we are less concerned with a company’s short term variable rate debt level, however, we still have a bias toward companies financed with long term fixed rate debt. Finally, we are likely to maintain our bet in the hotel sector. In spite of outstanding market conditions, the hotel stocks underperformed the REIT market during the fiscal year. We believe that these stocks remain relatively cheap.
The portfolio management team is cautiously optimistic about the prospects for the REIT market. As more institutional and retail investors discover the value of REITs in their portfolios, demand for this asset class will grow. Meanwhile, market conditions remain solid, buoyed by an economy that continues to deliver GDP growth of 3-4%.
Cumulative Total Return Performance
Managers Real Estate Securities Fund’s cumulative total return is based on the daily change in net asset value (NAV), and assumes that all distributions were reinvested. The S&P 500 Index is a capitalization-weighted index of 500 stocks. The S&P 500 Index is designed to measure performance of the broad domestic economy through changes in aggregate market value of 500 stocks representing all major industries. The Dow Jones Wilshire REIT Index measures U.S. publicly traded Real Estate Investment Trusts. Unlike the Fund, the above stated indices are unmanaged, are not available for investment, and do not incur expenses. The chart illustrates the performance of a hypothetical $10,000 investment made in the Fund on December 31, 1997, to a $10,000 investment made in the above stated indices for the same time period. Performance for periods longer than one year is annualized. The graph and table do not reflect the deduction of taxes that a shareholder would pay on a Fund distribution or redemption of shares. Total returns for the Fund would have been lower had certain expenses not been reduced.
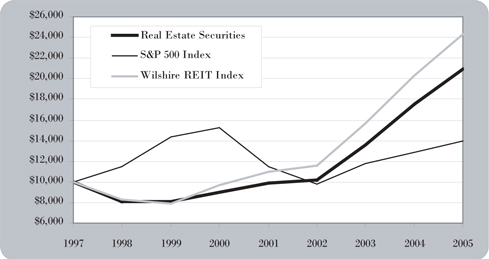
The table below shows the average annual total returns for Managers Real Estate Securities Fund, S&P 500 Index, and the Dow Jones Wilshire REIT Index since inception through October 31, 2005.
| | | | | | | | | |
Average Annual Total Returns:
| | 1 Year
| | | 5 Years
| | | Since
Inception*
| |
Real Estate Securities | | 18.84 | % | | 18.84 | % | | 9.86 | % |
S&P 500 | | 8.72 | % | | (1.74 | )% | | 4.39 | % |
Wilshire REIT | | 19.60 | % | | 20.21 | % | | 12.01 | % |
| * | Commencement of operations was December 31, 1997. |
The performance data shown represents past performance. Past performance is not a guarantee of future results. Current performance may be lower or higher than the performance data quoted. The investment return and the principal value of an investment will fluctuate so that an investor’s shares, when redeemed, may be worth more or less than their original cost. For performance information through the most recent month end please call (800) 835-3879 or visit our Web site at www.managersinvest.com.
The Fund is subject to special risk considerations similar to those associated with the direct ownership of real estate. Real estate valuations may be subject to factors such as changing general and local economic, financial, competitive and environmental conditions.
28
Managers Real Estate Securities Fund
Portfolio Manager Comments (continued)
The table displays a full breakdown of the top ten holdings of the Fund as well as the industry weightings as of October 31, 2005.
| | | |
Top Ten Holdings (out of 46 securities)
| | % Net Assets
| |
Simon Property Group, Inc.* | | 6.2 | % |
ProLogis* | | 4.2 | |
Camden Property Trust | | 4.1 | |
Liberty Property Trust | | 4.0 | |
AvalonBay Communities, Inc.* | | 3.9 | |
Essex Property Trust, Inc. | | 3.3 | |
Equity Residential* | | 3.1 | |
Alexandria Real Estate Equities, Inc. | | 3.1 | |
Ventas, Inc. | | 3.0 | |
Public Storage, Inc. | | 2.9 | |
| | |
|
|
Top Ten as a Group | | 37.8 | % |
| | |
|
|
| * | Top Ten Holding at April 30, 2005 |
| | | |
Industry Weightings
| | % Net Assets
| |
REITs (Office) | | 19.1 | % |
REITs (Apartment) | | 18.1 | |
REITs (Mall) | | 12.9 | |
REITs (Shopping Center) | | 10.0 | |
REITs (Office/Industrial) | | 7.9 | |
REITs (Industrial) | | 6.7 | |
REITs (Hotel) | | 5.6 | |
REOCs (Hotel) | | 4.3 | |
REITs (Self Storage) | | 4.2 | |
REITs (Health Care) | | 3.0 | |
REITs (Diversified) | | 2.9 | |
REOCs (Property Management) | | 2.4 | |
REITs (Specialty) | | 1.3 | |
Other Assets and Liabilities | | 1.6 | |
| | |
|
|
| | | 100.0 | % |
| | |
|
|
Any sectors, industries, or securities discussed should not be perceived as investment recommendations. Any securities discussed may no longer be held in the account’s portfolio. It should not be assumed that any of the securities transactions discussed were or will prove to be profitable, or that the investment recommendations we make in the future will be profitable.
29
Managers Real Estate Securities Fund
Schedule of Portfolio Investments
October 31, 2005
| | | | | | |
Security Description
| | Shares
| | Value
| |
Common Stocks - 99.3% | | | | | | |
REITs (Apartment) - 18.1% | | | | | | |
AvalonBay Communities, Inc. | | 11,290 | | $ | 973,763 | |
Camden Property Trust | | 18,300 | | | 1,031,205 | |
Equity Residential | | 19,900 | | | 781,075 | |
Essex Property Trust, Inc. | | 9,090 | | | 817,009 | |
Post Properties, Inc. | | 1,100 | | | 44,880 | |
Town & Country Trust, The | | 5,500 | | | 162,800 | |
United Dominion Realty Trust, Inc. | | 31,910 | | | 706,168 | |
Total REITs (Apartment) | | | | | 4,516,900 | |
REITs (Diversified) - 2.9% | | | | | | |
Vornado Realty Trust | | 8,780 | | | 711,180 | |
REITs (Finance) - 0.1% | | | | | | |
JER Investors Trust, Inc. | | 1,200 | | | 20,460 | |
REITs (Health Care) - 3.0% | | | | | | |
Ventas, Inc. | | 24,600 | | | 753,498 | |
REITs (Hotel) - 5.6% | | | | | | |
FelCor Lodging Trust, Inc.* | | 5,800 | | | 86,536 | |
Highland Hospitality Corp. | | 11,200 | | | 117,712 | |
Host Marriott Corp. | | 40,100 | | | 673,279 | |
Sunstone Hotel Investors, Inc. | | 23,000 | | | 515,200 | |
Total REITs (Hotel) | | | | | 1,392,727 | |
REITs (Industrial) - 6.7% | | | | | | |
AMB Property Corp. | | 14,200 | | | 627,356 | |
ProLogis | | 24,153 | | | 1,038,579 | |
Total REITs (Industrial) | | | | | 1,665,935 | |
REITs (Mall) - 12.9% | | | | | | |
General Growth Properties, Inc. | | 15,400 | | | 654,192 | |
Macerich Co., The | | 9,600 | | | 616,992 | |
Mills Corp., The | | 7,600 | | | 406,600 | |
Simon Property Group, Inc. | | 21,500 | | | 1,539,830 | |
Total REITs (Mall) | | | | | 3,217,614 | |
REITs (Office) - 19.1% | | | | | | |
Alexandria Real Estate Equities, Inc. | | 9,500 | | | 768,075 | |
Arden Realty, Inc. | | 12,540 | | | 566,056 | |
BioMed Realty Trust, Inc. | | 13,500 | | | 337,635 | |
Boston Properties, Inc. | | 10,260 | | | 710,197 | |
Brookfield Properties Corp. | | 21,050 | | | 616,765 | |
Columbia Equity Trust, Inc. | | 10,000 | | | 146,700 | |
Corporate Office Properties Trust | | 12,300 | | | 427,548 | |
Equity Office Properties Trust | | 18,200 | | | 560,560 | |
Trizec Properties, Inc. | | 27,700 | | | 616,325 | |
Total REITs (Office) | | | | | 4,749,861 | |
REITs (Office/Industrial) - 7.9% | | | | | | |
First Potomac Realty Trust | | 7,500 | | | 190,050 | |
Kilroy Realty Corp. | | 5,300 | | | 297,595 | |
Liberty Property Trust | | 23,600 | | | 983,884 | |
Reckson Associates Realty Corp. | | 14,300 | | | 501,930 | |
Total REITs (Office/Industrial) | | | | | 1,973,459 | |
REITs (Residential) - 0.8% | | | | | | |
Equity Lifestyle Properties, Inc. | | 4,700 | | $ | 198,951 | |
REITs (Self Storage) - 4.2% | | | | | | |
Public Storage, Inc. | | 10,900 | | | 721,580 | |
U-Store-It Trust | | 15,900 | | | 331,674 | |
Total REITs (Self Storage) | | | | | 1,053,254 | |
REITs (Shopping Center) - 10.0% | | | | | | |
Developers Diversified Realty Corp. | | 10,900 | | | 476,112 | |
Federal Realty Investment Trust | | 10,900 | | | 661,085 | |
Heritage Property Investment Trust | | 7,700 | | | 251,020 | |
Kimco Realty Corp. | | 17,800 | | | 527,236 | |
Pan Pacific Retail Properties, Inc. | | 900 | | | 57,150 | |
Weingarten Realty Investors | | 14,900 | | | 529,844 | |
Total REITs (Shopping Center) | | | | | 2,502,447 | |
REITs (Specialty) - 1.3% | | | | | | |
Realty Income Corp. | | 14,100 | | | 314,007 | |
REOCs (Hotel) - 4.3% | | | | | | |
Four Seasons Hotels, Inc. | | 2,500 | | | 134,075 | |
Hilton Hotels Corp. | | 24,700 | | | 480,415 | |
Starwood Hotels & Resorts Worldwide, Inc. | | 7,900 | | | 461,597 | |
Total REOCs (Hotel) | | | | | 1,076,087 | |
REOCs (Property Management) - 2.4% | | | | | | |
Plum Creek Timber Co., Inc. | | 15,200 | | | 591,280 | |
Total Common Stocks (cost $21,438,936) | | | | | 24,737,660 | |
Other Investment Companies -1.5%5 | | | | | | |
JPMorgan Prime Money Market Fund, Institutional Class Shares, 3.73% (cost $367,993) | | 367,993 | | | 367,993 | |
Total Investments - 100.8%(cost $21,806,929) | | | | | 25,105,653 | |
Other Assets, less Liabilities - (0.8)% | | | | | (202,923 | ) |
Net Assets - 100.0% | | | | $ | 24,902,730 | |
The accompanying notes are an integral part of these financial statements.
30
Managers California Intermediate Tax-Free Fund
Portfolio Manager Comments
Managers California Intermediate Tax-Free Fund (“California Intermediate Tax-Free”) seeks to achieve income free from Federal income taxes and California state income taxes, including alternative minimum tax.
California Intermediate Tax-Free invests in at least 80% of its total assets in intermediate-term California municipal bonds that are free from both Federal and California state income taxes, including alternative minimum tax. The Fund’s securities will have a quality rating comparable to the four highest ratings category of Moody’s or Standard & Poor’s. The dollar-weighted average maturity of these intermediate-term securities is normally 3 to 10 years. The Fund’s benchmark is the Lehman Brothers 5-Year Municipal Bond Index.
The Portfolio Manager
Evergreen Investment Management Company, LLC
Evergreen Investment Management Company, LLC (“Evergreen”), the subadvisor for the Managers California Intermediate Tax-Free Fund, was founded in 1932, and is a subsidiary of Wachovia Corporation. Evergreen is a broadly diversified asset management organization, with products and services distributed across several lines of business.
The investment team at Evergreen believes there are two key ways to add value when investing in municipal bonds:
| | • | | Positioning the portfolio appropriately in terms of duration position, yield curve position and sector exposure; and |
| | • | | Undertaking extensive credit research, focusing the portfolio only on attractive issues with limited credit risk. |
Evergreen utilizes a total return strategy that attempts to add value through its duration positioning, yield curve positioning, sector exposure, security selection, and credit research. The firm’s trading capabilities and vast network of approximately 90 broker-dealers has also helped to add value.
The portfolio management team at Evergreen meets weekly to discuss its macro-economic view and establish the target portfolio positioning in terms of interest rate exposure, yield curve positioning and sector allocation. A list of the securities approved for investment is used to implement the portfolio strategy. In selecting bonds, the portfolio manager must consider a comprehensive set of factors including liquidity, regional trends, coupon and legislative or legal developments.
The ideal bond exhibits many of the following traits:
| | • | | It is liquid and rated A or higher. The portfolio manager will not invest in bonds rated below investment grade |
| | • | | It has been thoroughly analyzed and approved for investment by the fund’s credit analyst. The credit analyst may believe that there is the potential for a credit upgrade |
| | • | | It will typically have a maturity of less than 15 years |
Fund management analyzes macroeconomic, political, and market forces to try to identify the trends for interest rates.
The portfolio manager then attempts to position the portfolio-by either lengthening average portfolio maturity when interest rates are expected to decline or by shortening it when rates are expected to rise-to take advantage of these interest rate changes Investments are concentrated in those sectors of the municipal securities universe believed to have the best risk/reward potential.
The portfolio management team strives to enhance yield and minimize credit and interest rate risk by:
| | • | | Positioning the portfolio advantageously on the yield curve, |
| | • | | Adjusting average credit quality within the investment grade category, |
| | • | | Exploiting pockets of inefficient pricing in the municipal bond market, and |
| | • | | Executing fundamental credit analysis focusing on identifying bonds with the potential for credit quality upgrades. |
The fund manager may sell a security when:
| | • | | A bond is deemed to be overpriced |
| | • | | The structure of the portfolio (management estimates that a large portion of the turnover in the portfolio is related to interest rate changes) changes |
| | • | | A more compelling security is identified |
| | • | | There is a problem with the security’s credit |
The Year in Review
For the twelve months ended October 31, 2005, the Managers Intermediate Tax Free California Municipal Bond Fund had a net return of .92%. This was marginally better than the .47% net return on the Fund’s benchmark, the Lehman Brothers Five Year Municipal Index.
The Fund’s out-performance relative to its index over the past year can be mainly attributed to its focus on underweighting municipals maturing in less than five years. Throughout most of 2005 so far, the Federal Reserve has raised the overnight Federal funds rate to combat against nascent inflation pressures within the United States. This has pressured yields higher on shorter term California Municipals relative to longer intermediate maturity bonds. This “flattening” of the yield curve has enabled the Fund to outperform in a difficult environment due to its overweight holdings in bonds maturing in more than ten years.
31
Managers California Intermediate Tax-Free Fund
Portfolio Manager Comments (continued)
The primary drag on overall performance over the last year has been the relentless move higher in energy costs. This has caused the Federal Reserve to be more outspoken about inflation pressures from energy spilling over into overall consumer inflation. In particular, the significant damage done by Hurricane Katrina to the Gulf Region in September only added more concern that energy prices would propel inflation higher. These inflation concerns caused a fairly strong move upwards in market yields during the September – October 2005 time period.
Looking Forward
Portfolio manager Mike Pietronico’s outlook moving forward for the Fund is a positive one. He believes that economically sensitive sectors of the economy such as housing and automobile sales are likely to be a drag on growth and inflation as we move through 2006. He expects Fixed-Income to marginally outperform equities in 2006. For that reason, he is also of the view that California Municipals will be in great demand as investors look to diversify away from their real estate holdings as the market begins to correct from its overvalued state.
Cumulative Total Return Performance
California Intermediate Tax-Free’s cumulative total return is based on the daily change in net asset value (NAV), and assumes that all distributions were reinvested. The Lehman Brothers Municipal Bond Index is a rules-based, market-value-weighted index engineered for the long-term tax-exempt bond market. The index has four main sectors: general obligation bonds, revenue bonds, insured bonds (including all insured bonds with a Aaa/AAA rating), and prerefunded bonds. This index is the 5 Year (4-6) component of the Municipal Bond index. Unlike the Fund, the Lehman Brothers Municipal Bond Index is unmanaged, is not available for investment, and does not incur expenses. The chart illustrates the performance of a hypothetical $10,000 investment made in the Fund on October 31, 1995, to a $10,000 investment made in the Lehman Brothers 5-Year Municipal Bond Index for the same time period. Performance for periods longer than one year is annualized. Figures include reinvestment of capital gains and dividends. The listed returns for the Fund are net of expenses and the returns for the index exclude expenses. The graph and table do not reflect the deduction of taxes that a shareholder would pay on a Fund distribution or redemption of shares. Total returns for the Fund would have been lower had certain expenses not been reduced.
The table below shows the average annual total returns for Managers California Intermediate Tax-Free Fund and the Lehman Brothers 5-Year Municipal Bond Index since October 31, 1995 through October 31, 2005.
| | | | | | | | | |
Average Annual Total Returns:
| | 1 Year
| | | 5 Years
| | | 10 Years
| |
California Intermediate Tax-Free | | 0.92 | % | | 4.54 | % | | 4.71 | % |
Lehman Brothers 5-Year Municipal Bond | | 0.47 | % | | 4.89 | % | | 4.86 | % |
The performance data shown represents past performance. Past performance is not a guarantee of future results. Current performance may be lower or higher than the performance data quoted. The investment return and the principal value of an investment will fluctuate so that an investor’s shares, when redeemed, may be worth more or less than their original cost. For performance information through the most recent month end please call (800) 835-3879 or visit our Web site at www.managersinvest.com.
The Fund is subject to risks associated from economic, political, geographic, and demographic conditions of California that could adversely affect the value of the Fund’s investment portfolio.
The Fund is subject to the risks associated with investments in debt securities, such as default risk and fluctuations in the perception of the debtor’s ability to pay its creditors.
Investment income may be subject to certain state and local taxes, and depending on your tax status, the federal alternative minimum tax. Capital gains are not exempt from federal income tax.
32
Managers California Intermediate Tax-Free Fund
Portfolio Manager Comments (continued)
Changing interest rates may adversely affect the value of an investment. An increase in interest rates typically causes the value of bonds and other fixed-income securities to fall.
The table displays a full breakdown of the top ten holdings of the Fund as well as the portfolio credit quality as of October 31, 2005.
| | | |
Top Ten Holdings (out of 66 securities)
| | % Net Assets
| |
California State University Systemwide Revenue, Series C, 5.000%, 11/01/17 (MBIA Insured) | | 5.6 | % |
Los Angeles County, CA Sanitation Districts Financing Authority, Series A, 5.00%, 10/01/17 (FSA Insured)* | | 4.4 | |
Los Angeles, CA Series A, 5.000%, 09/01/18 (MBIA Insured)* | | 4.4 | |
San Diego, CA Unified School District, Election of 1998, Series E, 5.250%, 07/01/17 (FSA Insured)* | | 3.7 | |
Los Angeles, CA Series A, 5.000%, 09/01/17 (MBIA Insured)* | | 3.4 | |
Contra Costa, CA Water District, Water Revenue, Series M, 5.000%, 10/01/16 (FSA Insured)* | | 3.4 | |
San Jose Evergreen, CA Community College District, Series A, 5.000%, 09/01/19 (AMBAC Insured)* | | 3.3 | |
Yosemite, CA Community College District, Election of 2004, Series A, 5.000%, 08/01/19 (FGIC Insured) | | 3.3 | |
Contra Costa, CA Water Authority, Water Treatment Revenue, Series A, 5.000%, 10/01/18 (FGIC Insured)* | | 2.7 | |
San Diego, CA Unified School District, Series C, 5.000%, 07/01/16 (FSA Insured) | | 2.3 | |
| | |
|
|
Top Ten as a Group | | 36.5 | % |
| | |
|
|
| * | Top Ten Holding at April 30, 2005 |
| | | |
Portfolio Credit Quality
| | % Net Assets
| |
Aaa | | 98.0 | % |
Aa | | 0.9 | |
A | | 1.1 | |
| | |
|
|
| | | 100.0 | % |
| | |
|
|
Any sectors, industries, or securities discussed should not be perceived as investment recommendations. Any securities discussed may no longer be held in the account’s portfolio. It should not be assumed that any of the securities transactions discussed were or will prove to be profitable, or that the investment recommendations we make in the future will be profitable.
33
Managers California Intermediate Tax-Free Fund
Schedule of Portfolio Investments
October 31, 2005
| | | | | | |
| | | Principal
Amount
| | Value
|
Municipal Bonds - 97.8% | | | | | | |
Anaheim, CA Unified High School District, 4.500%, 08/01/20 (FSA Insured) | | $ | 250,000 | | $ | 252,500 |
Bay Area Government Association, CA Revenue, 5.000%, 08/01/20 (AMBAC Insured) | | | 500,000 | | | 520,000 |
California Educational Facilities Authority Revenue, Santa Clara University, 5.250%, 09/01/2017 (AMBAC Insured) | | | 1,000,000 | | | 1,106,250 |
California Infrastructure & Economic Development Bank Revenue, Bay Area Toll Bridges - 1st Lien A, 5.250%, 07/01/18 (FSA Insured) | | | 1,000,000 | | | 1,077,500 |
California State Department of Water Resources, Central Valley Project Revenue, Water Systems Series Y, 5.250%, 12/01/18 (FGIC Insured) | | | 1,000,000 | | | 1,077,500 |
California State Department of Water Resources, Power Supply Revenue Series A, 5.000%, 05/01/17 (MBIA Insured) | | | 500,000 | | | 526,875 |
California State Department of Water Resources, Water Revenue Central Valley Project Series Z, 5.000%, 12/01/16 (FGIC Insured) | | | 1,000,000 | | | 1,062,500 |
California State Economic Recovery Bond, Series A, 5.250%, 07/01/14 (FGIC Insured) | | | 400,000 | | | 440,500 |
California State Public Works Board, Lease Revenue Department of General Services - Teale Data Center B, 5.250%, 03/01/19 (AMBAC Insured) | | | 200,000 | | | 213,250 |
California State Refunding Bond, 5.000%, 03/01/17 | | | 400,000 | | | 423,000 |
California State University Systemwide Revenue, Series C, 5.000%, 11/01/17 (MBIA Insured) | | | 2,500,000 | | | 2,671,874 |
Campbell, CA Union High School District, 4.300%, 08/01/19 (FSA Insured) | | | 270,000 | | | 270,000 |
Coast Community College District - CA, 5.000%, 08/01/16 (MBIA Insured) | | | 250,000 | | | 269,375 |
Contra Costa, CA Water Authority, Water Treatment Revenue, Series A, 5.000%, 10/01/18 (FGIC Insured) | | | 1,235,000 | | | 1,293,663 |
Contra Costa, CA Water District, Water Revenue, Series L, 5.000%, 10/01/19 (FSA Insured) | | | 1,000,000 | | | 1,050,000 |
Contra Costa, CA Water District, Water Revenue, Series M, 5.000%, 10/01/16 (FSA Insured) | | | 1,500,000 | | | 1,603,125 |
Cotati-Rohnert Park, CA Unified School District, 5.000%, 08/01/19 (FGIC Insured) | | | 500,000 | | | 529,375 |
East Bay, CA MUD, Water Systems Revenue, 5.000%, 06/01/18 (FSA Insured) | | | 340,000 | | | 358,275 |
East Bay, CA MUD, Water Systems Revenue, 5.250%, 06/01/18 (MBIA Insured) | | | 250,000 | | | 267,813 |
Fremont, CA Unified High School District of Santa Clara County, 5.000% 09/01/20 (FGIC Insured) | | | 400,000 | | | 422,000 |
Fremont, CA Unified School District of Alameda County, Election of 2002, Series B, 4.500%, 08/01/20 (FSA Insured) | | | 365,000 | | | 370,019 |
Fresno, CA Sewer Revenue, Series A-1, 5.250%, 09/01/19 | | | 1,000,000 | | | 1,107,500 |
Grossmont, CA Union High School District, Election of 2004, 5.000%, 08/01/15 (FSA Insured) | | | 250,000 | | | 267,500 |
La Mesa-Spring Valley, CA School District, 5.000%, 08/01/16 (FGIC Insured) | | | 300,000 | | | 323,250 |
Lincoln, CA Unified School District - San Joaquin County Election of 2004, 4.500% 08/01/19 (FGIC Insured) | | | 150,000 | | | 152,625 |
Lodi, CA Unified School District, 5.000%, 08/01/18 (MBIA Insured) | | | 800,000 | | | 843,000 |
Long Beach, CA Harbor Revenue Refunding - Series B, 5.000%, 05/15/18 (FGIC Insured) | | | 670,000 | | | 707,688 |
Los Angeles, CA Certificate Participation Real Property Program, 5.250%, 04/01/19 (AMBAC Insured) | | | 300,000 | | | 319,875 |
Los Angeles, CA Community College, Series B, 5.000%, 08/01/18 (FSA Insured) | | | 300,000 | | | 316,500 |
Los Angeles, CA Department of Water & Power, Waterworks Revenue, Series C, 5.250%, 07/01/18 (MBIA Insured) | | | 510,000 | | | 552,075 |
Los Angeles, CA Series A, 5.000%, 09/01/17 (MBIA Insured) | | | 1,565,000 | | | 1,645,205 |
Los Angeles, CA Series A, 5.000%, 09/01/18 (MBIA Insured) | | | 2,000,000 | | | 2,110,000 |
The accompanying notes are an integral part of these financial statements.
34
Managers California Intermediate Tax-Free Fund
Schedule of Portfolio Investments (continued)
| | | | | | |
| | | Principal
Amount
| | Value
|
Municipal Bonds (continued) | | | | | | |
Los Angeles, CA Series A, 5.000%, 09/01/18 (MBIA Insured) | | $ | 500,000 | | $ | 525,625 |
Los Angeles, CA Unified School District, Election of 1997 Series F, 5.000%, 07/01/16 (FSA Insured) | | | 1,000,000 | | | 1,063,750 |
Los Angeles, CA Water & Power Revenue, Power Systems Series A, Sub-series A-2, 5.000%, 07/01/16 (MBIA Insured) | | | 300,000 | | | 319,125 |
Los Angeles, CA Harbor Department Revenue, Series B, 5.000%, 08/01/20 (MBIA Insured) | | | 275,000 | | | 293,906 |
Los Angeles County, CA Metropolitan Transportation Authority, Sales Tax Revenue, Series B, 5.000%, 07/01/19 (MBIA Insured) | | | 250,000 | | | 262,813 |
Los Angeles County, CA Sanitation Districts Financing Authority, Series A, 5.000% 10/01/17 (FSA Insured) | | | 2,000,000 | | | 2,120,000 |
Los Osos, CA Community Service Wastewater Assessment District No. 1, 5.000% 09/02/17 (MBIA Insured) | | | 1,000,000 | | | 1,066,250 |
Metropolitan Water District of Southern California, Waterworks Revenue, Series A, 4.125%, 03/01/19 | | | 325,000 | | | 319,719 |
Moorpark, CA Unified School District, 5.000%, 08/01/18 (FSA Insured) | | | 390,000 | | | 415,838 |
Murrieta Valley, CA Unified School District, Election of 2002, Series B, 4.125% 09/01/20 (FSA Insured) | | | 345,000 | | | 333,788 |
Nevada Joint Union High School District, Series A, 5.000%, 08/01/19 (FSA Insured) | | | 400,000 | | | 419,500 |
Newark, CA Union School District, 4.000%, 08/01/19 (MBIA Insured) | | | 150,000 | | | 145,125 |
North Orange County, CA Community College District, 5.000%, 08/01/19 (MBIA Insured) | | | 340,000 | | | 361,250 |
North Orange County, CA Community College District, 5.000%, 08/01/16 (MBIA Insured) | | | 500,000 | | | 538,750 |
Oakland, CA Sewer Revenue, Series A, 5.000%, 06/15/17 (FSA Insured) | | | 150,000 | | | 159,750 |
Perris, CA Union High School District, Series A, 5.000%, 09/01/18 (FGIC Insured) | | | 300,000 | | | 319,875 |
Redwood City, CA School District, 5.000%, 07/15/19 (FGIC Insured) | | | 500,000 | | | 524,375 |
Sacramento County, CA Sanitation Districts Financing Authority, 4.750%, 12/01/20 (FGIC Insured) | | | 500,000 | | | 516,875 |
Saddleback Valley Unified School District of CA, 5.000%, 08/01/17 (FSA Insured) | | | 1,000,000 | | | 1,065,000 |
San Diego, CA Unified School District, Election of 1998, Series E, 5.250%, 07/01/17 (FSA Insured) | | | 1,615,000 | | | 1,770,443 |
San Diego, CA Unified School District, Series C, 5.000%, 07/01/16 (FSA Insured) | | | 1,030,000 | | | 1,113,688 |
San Diego, CA Unified School District, Series C, 5.000%, 07/01/19 (FSA Insured) | | | 500,000 | | | 540,625 |
San Jose, CA Library, Parks, & Public Safety Projects, 5.000%, 09/01/19 | | | 500,000 | | | 523,125 |
San Jose Evergreen, CA Community College District, 2010 Crossover Series C, 5.000%, 09/01/14 (AMBAC Insured) | | | 450,000 | | | 488,250 |
San Jose Evergreen, CA Community College District, 2010 Crossover Series C, 5.250%, 09/01/16 (AMBAC Insured) | | | 500,000 | | | 546,875 |
San Jose Evergreen, CA Community College District, Series A, 5.000%, 09/01/19 (AMBAC Insured) | | | 1,500,000 | | | 1,586,249 |
San Rafael, CA City High School District, Election of 2002, Series B, 5.000%, 08/01/16 (FGIC Insured) | | | 500,000 | | | 531,875 |
Santa Clara Valley, CA Water District, Certificates of Participation, Series A, 5.000%, 02/01/17 (FGIC Insured) | | | 490,000 | | | 520,625 |
Santa Clara Valley, CA Water District, Certificates of Participation, Series A, 5.000% 02/01/18 (FGIC Insured) | | | 655,000 | | | 691,025 |
Santa Clarita, CA Community College District, 5.000%, 08/01/2020 | | | 350,000 | | | 367,938 |
Santa Rosa, CA High School District, Election of 2002, 5.000%, 08/01/19 (MBIA Insured) | | | 730,000 | | | 767,413 |
Southwestern Community College District of CA, Election of 2000, 5.000%, 08/01/18 (FGIC Insured) | | | 305,000 | | | 332,450 |
University of California Revenues, Series B, 5.250%, 05/15/15 (AMBAC Insured) | | | 300,000 | | | 326,250 |
The accompanying notes are an integral part of these financial statements.
35
Managers California Intermediate Tax-Free Fund
Schedule of Portfolio Investments (continued)
| | | | | | |
| | | Principal
Amount
| | Value
|
Municipal Bonds (continued) | | | | | | |
University of California Revenues, Series F, 4.750%, 05/15/20 (FSA insured) | | $ | 200,000 | | $ | 205,750 |
Yosemite, CA Community College District, Election of 2004, Series A, 5.000%, 08/01/19 (FGIC Insured) | | | 1,475,000 | | | 1,567,187 |
Total Municipal Bonds (cost $46,431,438) | | | | | | 46,801,694 |
| | |
| | | Shares
| | |
Other Investment Companies -1.6%5 | | | | | | |
BlackRock Liquidity Funds, Institutional Shares - California Money Fund, 2.46% (cost $766,679) | | | 766,679 | | | 766,679 |
Total Investments - 99.4% (cost $47,198,117) | | | | | | 47,568,373 |
Other Assets, less Liabilities - 0.6% | | | | | | 279,061 |
Net Assets -100.0% | | | | | $ | 47,847,434 |
The accompanying notes are an integral part of these financial statements.
36
Fremont Money Market Fund
Portfolio Manager Comments
Fremont Money Market Fund seeks to maximize current income consistent with the preservation of capital and liquidity. Norman Gee leads the money market investment team of 333 Global Investment Advisors (“333 Global”) in managing the Fund.
The Portfolio Manager
333 Global Investment Advisors
Norman Gee and the team at 333 Global focus on identifying undervalued securities and creating active maturity management strategies to produce higher yields without greater interest rate or credit risk. The portfolio manager believes that through price-sensitive trading, prudent maturity management and independent research focusing on market inefficiencies, the Fund can deliver consistently superior performance.
The investment team monitors macroeconomic indicators to project short-term interest rate trends. Average portfolio maturity is adjusted consistent with interest rate forecasts—shortened if rates are projected to trend higher and lengthened if rates are projected to fall. The portfolio manager also seeks to enhance yield by uncovering opportunities presented by inefficient pricing in the money markets.
The Year in Review
For the 12 months ended October 31, 2005, the Fund returned 2.39% compared to a gain of 2.10% for the Money Fund Report Averages — First Tier Retail, and 2.77% for the 3-Month Treasury Bill. The Fed maintained its “measured” stance throughout the period, increasing interest rates 25 basis points in each of the eight meetings that coincided with the Fund’s fiscal year. The series of hikes marks eleven consecutive rate increases since the Fed began its tightening campaign in June 2004. The current target Fed Funds rate as of October 31, 2005 is 3.75%.
In determining monetary policy, the Fed will monitor and assess a wide array of economic data including inflation, wage growth, and GDP; however, of particular concern this past year was that of a potentially speculative housing market. The “conundrum” that Greenspan distinctively referred to whereby long-term rates actually decreased despite increasing short-term rates was largely a bi-product of continued foreign investment in US long bonds that drove prices up and yields down. Along with helping to finance the current account deficit, this kept mortgage rates favorable and became a significant driver in the Fed’s decision to continue ramping up short-term rates. Another factor that was addressed in the November statement by the Federal Open Market Committee (FOMC) was the impact and ramifications of hurricanes Katrina and Rita. The minutes cited Fed Chairman Allen Greenspan’s concern with the threat of inflation due to the large influx of fiscal stimulus as further support to continue raising rates.
Throughout the year, Norman has slowly increased the allocation to top tier commercial paper to just over 90%. At the same time, U.S. agency discounts were pared back somewhat as they are generally longer in maturity and become more valuable in times of flat or decreasing rates. The weighted average maturity trended down moderately during the year and is currently right around 40 days. The shorter average maturity enabled the Fund to take advantage of favorable rates that were appearing on the short end of the curve.
Looking Forward
Finishing out the final quarter of 2005 and heading into 2006, the Fund’s sector weights will continue to be heavily weighted in commercial paper. The weighted average maturity will likely remain on the shorter side as the portfolio is currently structured to take advantage of rate increases the Fed futures market is currently pricing in with a high degree of confidence over the next several meetings. There is also a minor allocation to the slightly longer-term U.S. agency discounts that enables the portfolio to capture some exposure to the long end while adding value out on the curve. Given the current market environment, it seems plausible that the Fed will peak in or around 4.75% and likely remain unchanged for at least the near-term that follows. Once the Fed begins to show indications of easing off on the upward moves, additional longer-term issues will be introduced into the portfolio, giving it a somewhat more laddered look. Concurrently, Norman will look to gradually and opportunistically extend the weighted average maturity beyond the current figure.
37
Fremont Money Market Fund
Portfolio Manager Comments (continued)
Cumulative Total Return Performance
Fremont Money Market Fund’s cumulative total return is based on the daily change in net asset value (NAV), and assumes that all distributions were reinvested. iMoneyNet, Inc.’s Money Fund Report Averages - First Tier (“Money Fund Report”) is based on the 30-day average percentage yield in highly rated taxable money market funds reported in the Money Fund Report, a service provided by iMoneyNet, Inc. (formerly IBC Financial Data). The chart illustrates the performance of a hypothetical $10,000 investment made in the Fund on October 31,1995, to a $10,000 investment made in the Money Fund Report for the same time period. Performance for periods longer than one year is annualized. The graph and table do not reflect the deduction of taxes that a shareholder would pay on a Fund distribution or redemption of shares. Total returns for the Fund would have been lower had certain expenses not been reduced.
The table below shows the average annual total returns for Managers Money Market Fund and the iMoneyNet, Inc.’s Money Fund Report Averages - First Tier since October 31, 1995 through October 31, 2005.
| | | | | | | | | |
Average Annual Total Returns:
| | 1 Year
| | | 5 Years
| | | 10 Years
| |
Fremont Money Market | | 2.39 | % | | 2.11 | % | | 3.75 | % |
iMoneyNet, Inc.’s Money Fund Report Averages - First Tier | | 2.10 | % | | 1.72 | % | | 3.31 | % |
The performance data shown represents past performance. Past performance is not a guarantee of future results. Current performance may be lower or higher than the performance data quoted. The investment return and the principal value of an investment will fluctuate so that an investor’s shares, when redeemed, may be worth more or less than their original cost. For performance information through the most recent month end please call (800) 835-3879 or visit our Web site at www.managersinvest.com.
An investment in a Money Market Fund is not insured or guaranteed by the Federal Deposit Insurance Corporation or any other government Agency. Although the Money Market Fund seeks to preserve the value of your investment at $1.00 per share, it is possible to lose money by investing in the Fund.
The table displays a full breakdown of the top ten holdings of the Fund as well as the portfolio credit quality as of October 31, 2005.
| | | |
Top Ten Holdings (out of 55 securities)
| | % Net Assets
| |
Hitachi America Capital, Ltd., 3.700%, 11/01/05 | | 2.0 | % |
Swedish National Housing Financial Management, 3.800%, 11/01/05 | | 2.0 | |
Centrica PLC, 3.581%, 11/02/05 | | 2.0 | |
General Electric Capital Services, Inc., 3.511%, 11/03/05 | | 2.0 | |
Sharp Electronics Corp., 3.702%, 11/04/05 | | 2.0 | |
Rabobank USA Financial Corp., 3.618%, 11/08/05 | | 2.0 | |
Sharp Electronics Corp., 3.754%, 11/09/05 | | 2.0 | |
Regents of the University of California, 3.744%, 11/10/05 | | 2.0 | |
Power Authority of the State of New York - Series 3, 3.864%, 11/10/05 | | 2.0 | |
FHLMC Discount Notes, 0.000%, 11/15/05 | | 2.0 | |
| | |
|
|
Top Ten as a Group | | 20.0 | % |
| | |
|
|
| | | |
Portfolio Credit Quality
| | % Net Assets
| |
P-1 | | 90.0 | % |
Aaa | | 10.0 | |
| | |
|
|
| | | 100.0 | % |
| | |
|
|
Any sectors, industries, or securities discussed should not be perceived as investment recommendations. Any securities discussed may no longer be held in the account’s portfolio. It should not be assumed that any of the securities transactions discussed were or will prove to be profitable, or that the investment recommendations we make in the future will be profitable.
38
Fremont Money Market Fund
Schedule of Portfolio Investments
October 31, 2005
| | | | | | |
| | | Principal
Amount
| | Value
|
Commercial Paper - 90.7% | | | | | | |
Capital Goods - 7.1% | | | | | | |
Hitachi America Capital, Ltd., 3.700%, 11/01/05 (a) | | $ | 10,000,000 | | $ | 10,000,000 |
Hitachi America Capital, Ltd., 3.716%, 11/15/05 (a) | | | 5,000,000 | | | 4,992,786 |
Sharp Electronics Corp., 3.702%, 11/04/05 | | | 10,000,000 | | | 9,996,917 |
Sharp Electronics Corp., 3.754%, 11/09/05 | | | 10,000,000 | | | 9,991,667 |
Total Capital Goods | | | | | | 34,981,370 |
Consumer Non-Durables - 2.0% | | | | | | |
Cargill, Inc., 3.893%, 12/02/05 (a) | | | 10,000,000 | | | 9,966,589 |
Conglomerate - 2.0% | | | | | | |
General Electric Co., 4.056%, 12/28/05 | | | 10,000,000 | | | 9,936,192 |
Education - 3.0% | | | | | | |
Regents of the University of California, 3.702%, 11/04/05 | | | 5,000,000 | | | 4,998,458 |
Regents of the University of California, 3.744%, 11/10/05 | | | 10,000,000 | | | 9,990,650 |
Total Education | | | | | | 14,989,108 |
Energy - 0.9% | | | | | | |
BP Capital Markets PLC, 4.040%, 11/01/05 | | | 4,400,000 | | | 4,400,000 |
Financial Services (Banks) - 26.2% | | | | | | |
Alliance & Leicester PLC, 4.246%, 02/21/06 (a) | | | 10,000,000 | | | 9,869,644 |
Allianz AG, 3.785%, 12/09/05 (a) | | | 10,000,000 | | | 9,960,206 |
Banque Et Caisse D’Espragne De L’Etat, 3.969%, 12/13/05 | | | 10,000,000 | | | 9,953,917 |
Caisse Centrale Desjardins du Quebec, 3.749%, 11/23/05 | | | 10,000,000 | | | 9,977,144 |
Caisse Centrale Desjardins du Quebec, 4.194%, 01/20/06 | | | 10,000,000 | | | 9,907,667 |
CBA (Delaware) Finance, Inc., 3.808%, 12/15/05 | | | 10,000,000 | | | 9,953,678 |
CBA (Delaware) Finance, Inc., 3.958%, 12/12/05 | | | 10,000,000 | | | 9,955,128 |
Danske Corp., Discount Notes, 3.723%, 11/07/05 | | | 5,000,000 | | | 4,996,900 |
DnB NOR Group, 3.683%, 10/12/05 | | | 5,000,000 | | | 4,996,933 |
HBOS Treasury Services PLC, 3.772%, 11/30/05 | | | 10,000,000 | | | 9,969,711 |
HSBC Finance Corp., 3.682%, 11/04/05 | | | 5,000,000 | | | 4,998,467 |
HSBC Finance Corp., 3.706%, 11/16/05 | | | 5,000,000 | | | 4,992,292 |
HSBC Finance Corp., 4.151%, 02/17/06 | | | 10,000,000 | | | 9,879,278 |
Rabobank USA Financial Corp., 3.618%, 11/08/05 | | | 10,000,000 | | | 9,992,971 |
Swedbank, 3.942%, 12/22/05 | | | 10,000,000 | | | 9,944,467 |
Total Financial Services (Banks) | | | | | | 129,348,402 |
Financial Services (Other) - 41.4% | | | | | | |
American Express Credit Corp., 3.829%, 11/21/05 | | | 10,000,000 | | | 9,978,778 |
American Express Credit Corp., 3.966%, 12/29/05 | | | 10,000,000 | | | 9,936,522 |
American General Finance Corp., 3.712%, 11/18/05 | | | 10,000,000 | | | 9,982,504 |
American General Finance Corp., 4.140%, 01/23/06 | | | 10,000,000 | | | 9,905,472 |
American Honda Finance Corp., 3.847%, 11/16/05 | | | 5,000,000 | | | 4,992,000 |
American Honda Finance Corp., 4.109%, 01/23/06 | | | 5,000,000 | | | 4,953,082 |
CIT Group, Inc., 4.056%, 12/21/05 | | | 10,000,000 | | | 9,937,311 |
CIT Group, Inc., 4.083%, 12/21/05 | | | 10,000,000 | | | 9,943,611 |
General Electric Capital Services, Inc., 3.511%, 11/03/05 | | | 10,000,000 | | | 9,998,050 |
Genworth Financial, Inc., 3.905%, 12/05/05 (a) | | | 10,000,000 | | | 9,963,261 |
Nordea North America, Inc., 3.799%, 11/22/05 | | | 10,000,000 | | | 9,977,892 |
PACCAR Financial Corp., 3.696%, 11/17/05 | | | 10,000,000 | | | 9,983,600 |
PACCAR Financial Corp., 3.704%, 12/08/05 | | | 5,100,000 | | | 5,080,658 |
Prudential PLC, 3.694%, 11/25/05 (a) | | | 10,000,000 | | | 9,975,433 |
The accompanying notes are an integral part of these financial statements.
39
Fremont Money Market Fund
Schedule of Portfolio Investments (continued)
| | | | | | | | |
| | | Principal
Amount
| | | Value
| |
Financial Services (Other) (continued) | | | | | | | | |
Prudential PLC, 3.864%, 11/29/05 (a) | | $ | 10,000,000 | | | $ | 9,970,056 | |
Siemens Capital Corp., 3.970%, 12/15/05 | | | 10,000,000 | | | | 9,951,722 | |
Societe General Group, N.A., 4.003%, 12/23/05 | | | 10,000,000 | | | | 9,942,511 | |
Swedish National Housing Financial Management, 3.800%, 11/01/05 (a) | | | 10,000,000 | | | | 10,000,000 | |
Total Capital S.A., 3.913%, 12/01/05 (a) | | | 10,000,000 | | | | 9,967,500 | |
Toyota Motor Credit Corp., 3.709%, 11/14/05 (a) | | | 10,000,000 | | | | 9,986,783 | |
UBS Finance (Delaware) LLC, 3.709%, 12/06/05 | | | 10,000,000 | | | | 9,964,076 | |
UBS Finance (Delaware) LLC, 3.862%, 11/28/05 | | | 10,000,000 | | | | 9,971,125 | |
Total Financial Services (Other) | | | | | | | 204,361,947 | |
Industrial - 4.1% | | | | | | | | |
E. I. du Pont de Nemours & Co., 4.031%, 12/16/05 | | | 10,000,000 | | | | 9,949,875 | |
Centrica PLC, 3.581%, 11/02/05 (a) | | | 10,000,000 | | | | 9,999,006 | |
Total Industrial | | | | | | | 19,948,880 | |
Sovereign Debt - 2.0% | | | | | | | | |
AWB Harvest Finance Ltd., 3.976%, 12/30/05 (a) | | | 10,000,000 | | | | 9,935,264 | |
Utilities - 2.0% | | | | | | | | |
Power Authority of the State of New York - Series 3, 3.864%, 11/10/05 | | | 10,000,000 | | | | 9,990,350 | |
Total Commercial Paper (cost $447,858,102) | | | | | | | 447,858,102 | |
U.S. Government Agency Obligations - 10.0%2 | | | | | | | | |
FHLMC Discount Notes, 0.000%, 11/15/05 to 02/28/06 | | | 30,000,000 | 4 | | | 29,819,661 | |
FNMA Discount Notes, 0.000%, 02/27/06 to 03/31/06 | | | 20,000,000 | | | | 19,744,114 | |
Total U.S. Government Agency Obligations (cost $49,563,775) | | | | | | | 49,563,775 | |
| | |
| | | Shares
| | | | |
Other Investment Companies - 3.3%5 | | | | | | | | |
Bank of New York Institutional Cash Reserves Fund, 3.97%3 | | | 16,064,771 | | | | 16,064,771 | |
JPMorgan Prime Money Market Fund, Institutional Class Shares, 3.73% | | | 83,833 | | | | 83,833 | |
Total Other Investment Companies (cost $16,148,604) | | | | | | | 16,148,604 | |
Total Investments - 104.0% (cost $513,570,481) | | | | | | | 513,570,481 | |
Other Assets, less Liabilities - (4.0)% | | | | | | | (19,674,642 | ) |
Net Assets - 100.0% | | | | | | $ | 493,895,839 | |
The accompanying notes are an integral part of these financial statements.
40
Notes to Schedules of Portfolio Investments
The following footnotes and abbreviations are to be read in conjunction with the Schedules of Portfolio Investments previously presented in the report.
At October 31, 2005 the cost of securities for Federal income tax purposes and the gross aggregate unrealized appreciation and/or depreciation based on tax cost were approximately as follows:
| | | | | | | | | | | | | |
Fund
| | Cost
| | Appreciation
| | Depreciation
| | | Net
|
Fremont Global | | $ | 194,517,190 | | $ | 20,103,881 | | $ | (4,658,312 | ) | | $ | 15,445,569 |
International Growth | | | 42,624,435 | | | 2,375,152 | | | (673,769 | ) | | | 1,701,383 |
Structured Core | | | 85,768,845 | | | 7,026,596 | | | (3,366,466 | ) | | | 3,660,130 |
Small Cap | | | 70,318,176 | | | 17,123,164 | | | (2,259,005 | ) | | | 14,864,159 |
Real Estate Securities | | | 22,207,703 | | | 3,080,048 | | | (182,098 | ) | | | 2,897,950 |
California Intermediate Tax-Free | | | 47,180,958 | | | 560,902 | | | (173,487 | ) | | | 387,415 |
| * | Non-income-producing security |
| (a) | Security exempt from registration under Rule 144A of the Securities Act of 1933. This security may be resold in transactions exempt from registration, normally to qualified buyers. At October 31, 2005, the value of these securities amounted to the following: |
| | | | | | |
Fund
| | Market Value
| | % of Net Assets
| |
Fremont Global | | $ | 2,859,421 | | 1.6 | % |
International Growth | | | 193,959 | | 0.5 | % |
Fremont Money Market | | | 124,586,528 | | 25.2 | % |
| 1 | Variable Rate Security. The rate listed is as of October 31, 2005. |
| 3 | Collateral received from brokers for securities lending was invested in this short-term investment. |
| 4 | Some or all of these shares were out on loan to various brokers as of October 31, 2005, amounting to: |
| | | | | | |
Fund
| | Market Value
| | % of Net Assets
| |
Fremont Global | | $ | 27,946,322 | | 15.3 | % |
International Growth | | | 4,741,156 | | 12.0 | % |
Structured Core | | | 16,789,146 | | 23.2 | % |
Small Cap | | | 18,101,125 | | 27.3 | % |
Fremont Money Market | | | 15,946,000 | | 3.2 | % |
| 5 | Yield shown for an investment company represents its October 31, 2005, seven-day average yield, which refers to the sum of the previous seven days’ dividends paid, expressed as an annual percentage. |
Investment Definitions and Abbreviations:
| | |
| ADR/GDR: | | ADR after the name of a holding stands for American Depositary Receipt, representing ownership of foreign securities on deposit with a domestic custodian bank; a GDR (Global Depositary Receipt) is comparable, but foreign securities are held on deposit in a non-U.S. bank. The value of the ADR/GDR securities is determined or significantly influenced by trading on exchanges not located in the United States or Canada. Sponsored ADR/GDRs are initiated by the underlying foreign company. |
| |
| FHLMC: | | Federal Home Loan Mortgage Corp. |
| |
| FNMA: | | Federal National Mortgage Association |
| |
| REIT: | | Real Estate Investment Trust |
| |
| REOC: | | Real Estate Operating Company |
| |
| FGIC: | | Financial Guaranty Insurance Corp. |
| |
| MUD: | | Municipal Utility District |
| |
| CD: | | Certificate of Deposit |
| |
| FHLB: | | Federal Home Loan Bank |
| |
| FSA: | | FSA Capital, Inc. |
| |
| AMBAC: | | American Municipal Bond Assurance Corp. |
| |
| MBIA: | | Municipal Bond Investor Assurance Corp. |
Registered shares: A security whose owner has been recorded with its issuer or issuer’s registrar.
Abbreviations have been used throughout the portfolios to indicate amounts shown in currencies other than the U.S. dollar (USD):
| | |
| AUD: | | Australian Dollar |
| |
| CAD: | | Canadian Dollar |
| |
| NZD: | | New Zealand Dollar |
| |
| GBP: | | British Pound |
| |
| SGD: | | Singapore Dollar |
| |
| EUR: | | Euro |
| |
| JPY: | | Japanese Yen |
| |
| NOK: | | Norwegian Krone |
41
Statements of Assets and Liabilities
October 31, 2005
| | | | | | | | |
| | | Managers
Fremont Global Fund
| | | Managers
International
Growth Fund
| |
Assets: | | | | | | | | |
Investments at value* (including securities on loan valued at $27,946,322, $4,741,156, $16,789,146, $18,101,125, $0, $0, $15,946,000, respectively) | | $ | 209,962,759 | | | $ | 44,325,818 | |
Cash | | | — | | | | 63,779 | |
Foreign currency** | | | 55,149 | | | | — | |
Margin on futures | | | — | | | | — | |
Receivable for investments sold | | | 1,254,923 | | | | 566,331 | |
Receivable for Fund shares sold | | | 2,791 | | | | — | |
Unrealized appreciation on foreign currency contracts | | | 858,970 | | | | 2,572 | |
Receivable for variation margin on futures | | | — | | | | — | |
Dividends, interest and other receivables | | | 1,014,303 | | | | 70,323 | |
Prepaid expenses | | | 3,868 | | | | 5,598 | |
| | |
|
|
| |
|
|
|
Total assets | | | 213,152,763 | | | | 45,034,421 | |
| | |
|
|
| |
|
|
|
Liabilities: | | | | | | | | |
Payable to Custodian | | | 223,322 | | | | — | |
Payable for Fund shares repurchased | | | 175,000 | | | | — | |
Payable upon return of securities loaned | | | 28,352,125 | | | | 4,842,534 | |
Payable for investments purchased | | | 914,614 | | | | 671,068 | |
Unrealized depreciation on foreign currency contracts | | | 22,591 | | | | 3,452 | |
Dividends payable to shareholders | | | — | | | | — | |
Accrued expenses: | | | | | | | | |
Investment advisory and management fees | | | 94,692 | | | | 33,518 | |
Administrative fees | | | 39,455 | | | | 8,416 | |
Other | | | 134,062 | | | | 86,908 | |
| | |
|
|
| |
|
|
|
Total liabilities | | | 29,955,861 | | | | 5,645,896 | |
| | |
|
|
| |
|
|
|
Net Assets | | $ | 183,196,902 | | | $ | 39,388,525 | |
Net Assets Represent: | | | | | | | | |
Paid-in capital | | $ | 236,074,548 | | | $ | 42,553,371 | |
Undistributed net investment income (loss) | | | 5,737,246 | | | | 1,417,317 | |
Accumulated net realized gain (loss) from investments, futures and foreign currency transactions | | | (75,429,238 | ) | | | (6,518,942 | ) |
Net unrealized appreciation of investments, futures and foreign currency contracts and translations | | | 16,814,346 | | | | 1,936,779 | |
| | |
|
|
| |
|
|
|
Net Assets | | $ | 183,196,902 | | | $ | 39,388,525 | |
| | |
|
|
| |
|
|
|
Shares Outstanding | | | 13,892,891 | | | | 4,250,027 | |
| | |
|
|
| |
|
|
|
Net asset value, offering and redemption price per share | | $ | 13.19 | | | $ | 9.27 | |
| | |
|
|
| |
|
|
|
* Investments at cost | | $ | 193,973,609 | | | $ | 42,386,583 | |
** Foreign currency at cost | | | 55,233 | | | | — | |
42
| | | | | | | | | | | | | | | |
Managers
Structured
Core Fund
| | Managers
Small Cap Fund
| | | Managers Real
Estate Securities Fund
| | Managers
California Int. Tax-FreeFund
| | Fremont
Money Market Fund
| |
| | | | | | | | | | | | | | | | |
| $ | 89,428,975 | | $ | 85,182,335 | | | $ | 25,105,653 | | $ | 47,568,373 | | $ | 513,570,481 | |
| | 20,629 | | | 55,670 | | | | 4,818 | | | — | | | — | |
| | — | | | — | | | | — | | | — | | | — | |
| | 20,000 | | | — | | | | — | | | — | | | — | |
| | — | | | 208,957 | | | | 111,818 | | | — | | | — | |
| | — | | | 24,932 | | | | — | | | — | | | 261,236 | |
| | — | | | — | | | | — | | | — | | | — | |
| | 2,525 | | | — | | | | — | | | — | | | — | |
| | 74,060 | | | 14,658 | | | | 11,994 | | | 509,753 | | | 4,350 | |
| | 5,007 | | | 7,211 | | | | 2,032 | | | 1,343 | | | 9,305 | |
|
| |
|
|
| |
|
| |
|
| |
|
|
|
| | 89,551,196 | | | 85,493,763 | | | | 25,236,315 | | | 48,079,469 | | | 513,845,372 | |
|
| |
|
|
| |
|
| |
|
| |
|
|
|
| | | | | | | | | | | | | | | | |
| | — | | | — | | | | — | | | 144,900 | | | — | |
| | — | | | 18,875 | | | | 5,100 | | | — | | | 3,422,601 | |
| | 16,987,872 | | | 18,317,019 | | | | — | | | — | | | 16,064,771 | |
| | — | | | 727,764 | | | | 251,782 | | | — | | | — | |
| | — | | | — | | | | — | | | — | | | — | |
| | — | | | — | | | | — | | | 24,714 | | | 219,932 | |
| | | | |
| | 21,332 | | | 55,777 | | | | 17,744 | | | 9,802 | | | 89,046 | |
| | 15,237 | | | 13,944 | | | | 5,219 | | | 10,246 | | | 63,600 | |
| | 56,372 | | | 59,146 | | | | 53,740 | | | 42,373 | | | 89,583 | |
|
| |
|
|
| |
|
| |
|
| |
|
|
|
| | 17,080,813 | | | 19,192,525 | | | | 333,585 | | | 232,035 | | | 19,949,533 | |
|
| |
|
|
| |
|
| |
|
| |
|
|
|
| $ | 72,470,383 | | $ | 66,301,238 | | | $ | 24,902,730 | | $ | 47,847,434 | | $ | 493,895,839 | |
| | | | | | | | | | | | | | | | |
| $ | 65,218,655 | | $ | 80,909,651 | | | $ | 18,209,828 | | $ | 46,753,984 | | $ | 494,009,350 | |
| | 774,674 | | | — | | | | — | | | 16,826 | | | 58,690 | |
| | 2,824,049 | | | (29,746,295 | ) | | | 3,417,245 | | | 706,368 | | | (172,201 | ) |
| | 3,653,005 | | | 15,137,882 | | | | 3,275,657 | | | 370,256 | | | — | |
|
| |
|
|
| |
|
| |
|
| |
|
|
|
| $ | 72,470,383 | | $ | 66,301,238 | | | $ | 24,902,730 | | $ | 47,847,434 | | $ | 493,895,839 | |
|
| |
|
|
| |
|
| |
|
| |
|
|
|
| | 5,604,159 | | | 5,140,284 | | | | 1,936,547 | | | 4,488,185 | | | 494,009,350 | |
|
| |
|
|
| |
|
| |
|
| |
|
|
|
| $ | 12.93 | | $ | 12.90 | | | $ | 12.86 | | $ | 10.66 | | $ | 1.00 | |
|
| |
|
|
| |
|
| |
|
| |
|
|
|
| $ | 85,768,845 | | $ | 70,044,453 | | | $ | 21,806,929 | | $ | 47,198,117 | | $ | 513,570,481 | |
| | — | | | — | | | | — | | | — | | | — | |
The accompanying notes are an integral part of these financial statements.
43
Statements of Operations
For the fiscal year ended October 31, 2005
| | | | | | | | |
| | | Managers
Fremont
Global Fund
| | | Managers
International
Growth Fund
| |
Investment Income: | | | | | | | | |
Dividend income | | $ | 2,524,008 | | | $ | 1,428,196 | |
Interest income | | | 3,216,435 | | | | — | |
Foreign withholding tax | | | (105,026 | ) | | | (196,375 | ) |
Securities lending fees | | | 87,105 | | | | 34,607 | |
| | |
|
|
| |
|
|
|
Total investment income | | | 5,722,522 | | | | 1,266,428 | |
| | |
|
|
| |
|
|
|
Expenses: | | | | | | | | |
Investment management fees | | | 1,304,143 | | | | 535,268 | |
Administrative fees | | | 492,745 | | | | 122,771 | |
Insurance | | | 103,720 | | | | 409 | |
Transfer agent | | | 112,432 | | | | 46,684 | |
Custodian | | | 215,173 | | | | 84,777 | |
Professional fees | | | 72,041 | | | | 50,464 | |
Registration fees | | | 28,412 | | | | 22,954 | |
Trustees fees and expenses | | | 15,879 | | | | 3,833 | |
Reports to shareholders | | | 10,947 | | | | 7,747 | |
Miscellaneous | | | 11,839 | | | | 9,624 | |
| | |
|
|
| |
|
|
|
Total expenses before offsets | | | 2,367,331 | | | | 884,531 | |
| | |
|
|
| |
|
|
|
Expense reimbursement | | | — | | | | (81,525 | ) |
Expense reductions | | | (7,488 | ) | | | (2,140 | ) |
| | |
|
|
| |
|
|
|
Net expenses | | | 2,359,843 | | | | 800,866 | |
| | |
|
|
| |
|
|
|
Net investment income (loss) | | | 3,362,679 | | | | 465,562 | |
| | |
|
|
| |
|
|
|
Net Realized and Unrealized Gain (Loss): | | | | | | | | |
Net realized gain on investments and futures | | | 27,854,253 | | | | 9,021,086 | |
Net realized gain on foreign currency contracts and translations | | | 3,430,345 | | | | 866,628 | |
Net unrealized appreciation (depreciation) of investments and futures | | | (17,964,830 | ) | | | (3,243,822 | ) |
Net unrealized appreciation (depreciation) of foreign currency contracts and translations | | | 4,338,289 | | | | (7,235 | ) |
| | |
|
|
| |
|
|
|
Net realized and unrealized gain (loss) | | | 17,658,057 | | | | 6,636,657 | |
| | |
|
|
| |
|
|
|
Net Increase in Net Assets Resulting from Operations | | $ | 21,020,736 | | | $ | 7,102,219 | |
| | |
|
|
| |
|
|
|
44
| | | | | | | | | | | | | | | | | |
Managers
Structured
Core Fund
| | | Managers Small
Cap Fund
| | | Managers
Real Estate
Securities Fund
| | | Managers
California Int. Tax-Free Fund
| | | Fremont
Money
Market Fund
|
| | | | | | | | | | | | | | | | | | |
| | $1,652,888 | | | $ | 145,162 | | | $ | 902,328 | | | $ | 21,166 | | | $ | |
| | 18,283 | | | | 70,020 | | | | 16,975 | | | | 2,064,144 | | | | 15,123,467 |
| | (89) | | | | (745 | ) | | | (2,107 | ) | | | — | | | | — |
| | 70,322 | | | | 15,912 | | | | — | | | | — | | | | 2,312 |
|
|
| |
|
|
| |
|
|
| |
|
|
| |
|
|
| | 1,741,404 | | | | 230,349 | | | | 917,196 | | | | 2,085,310 | | | | 15,125,779 |
|
|
| |
|
|
| |
|
|
| |
|
|
| |
|
|
| | | | | | | | | | | | | | | | | | |
| | 260,726 | | | | 632,489 | | | | 232,790 | | | | 182,754 | | | | 1,119,996 |
| | 170,580 | | | | 145,597 | | | | 62,280 | | | | 111,417 | | | | 802,490 |
| | 34,813 | | | | 8,502 | | | | 14,042 | | | | 7,169 | | | | 258,107 |
| | 56,325 | | | | 55,629 | | | | 20,535 | | | | 15,153 | | | | 109,068 |
| | 30,313 | | | | 43,540 | | | | 26,739 | | | | 21,148 | | | | 103,480 |
| | 40,315 | | | | 40,620 | | | | 37,757 | | | | 39,770 | | | | 88,577 |
| | 25,403 | | | | 27,546 | | | | 14,654 | | | | 9,339 | | | | 36,215 |
| | 4,879 | | | | 4,042 | | | | 2,713 | | | | 3,589 | | | | 41,355 |
| | 6,237 | | | | 6,441 | | | | 4,813 | | | | 1,786 | | | | 23,380 |
| | 2,649 | | | | 2,561 | | | | 4,759 | | | | 2,567 | | | | 7,875 |
|
|
| |
|
|
| |
|
|
| |
|
|
| |
|
|
| | 632,240 | | | | 966,967 | | | | 421,082 | | | | 394,692 | | | | 2,590,543 |
|
|
| |
|
|
| |
|
|
| |
|
|
| |
|
|
| | — | | | | (37,194) | | | | (29,248 | ) | | | (127,000 | ) | | | — |
| | — | | | | (2,487) | | | | (2,430 | ) | | | — | | | | — |
|
|
| |
|
|
| |
|
|
| |
|
|
| |
|
|
| | 632,240 | | | | 927,286 | | | | 389,404 | | | | 267,692 | | | | 2,590,543 |
|
|
| |
|
|
| |
|
|
| |
|
|
| |
|
|
| | 1,109,164 | | | | (696,937 | ) | | | 527,792 | | | | 1,817,618 | | | | 12,535,236 |
|
|
| |
|
|
| |
|
|
| |
|
|
| |
|
|
| | | | | | | | | | | | | | | | | | |
| | 11,924,709 | | | | 5,291,658 | | | | 4,560,437 | | | | 724,302 | | | | 743 |
| | — | | | | — | | | | — | | | | — | | | | — |
| | (4,129,513 | ) | | | 4,401,284 | | | | (408,525 | ) | | | (2,142,747 | ) | | | — |
| | — | | | | — | | | | — | | | | — | | | | — |
|
|
| |
|
|
| |
|
|
| |
|
|
| |
|
|
| | 7,795,196 | | | | 9,692,942 | | | | 4,151,912 | | | | (1,418,445 | ) | | | 743 |
|
|
| |
|
|
| |
|
|
| |
|
|
| |
|
|
| $ | 8,904,360 | | | $ | 8,996,005 | | | $ | 4,679,704 | | | $ | 399,173 | | | $ | 12,535,979 |
|
|
| |
|
|
| |
|
|
| |
|
|
| |
|
|
45
Statements of Changes in Net Assets
For the fiscal year ended October 31,
| | | | | | | | | | | | | | | | |
| | | Managers Fremont Global Fund
| | | Managers International Growth Fund
| |
| | | 2005
| | | 2004
| | | 2005
| | | 2004
| |
Increase (Decrease) in Net Assets | | | | | | | | | | | | | | | | |
From Operations: | | | | | | | | | | | | | | | | |
Net investment income (loss) | | $ | 3,362,679 | | | $ | 3,306,000 | | | $ | 465,562 | | | $ | 265,000 | |
Net realized gain (loss) on investments and foreign currency transactions | | | 31,284,598 | | | | 9,623,000 | | | | 9,887,714 | | | | 709,000 | |
Net unrealized appreciation (depreciation) of investments and foreign currency translations | | | (13,626,541 | ) | | | 8,276,000 | | | | (3,251,057 | ) | | | 5,207,000 | |
| | |
|
|
| |
|
|
| |
|
|
| |
|
|
|
Net increase in net assets resulting from operations | | | 21,020,736 | | | | 21,205,000 | | | | 7,102,219 | | | | 6,181,000 | |
| | |
|
|
| |
|
|
| |
|
|
| |
|
|
|
Distributions to Shareholders: | | | | | | | | | | | | | | | | |
From net investment income | | | (3,011,208 | ) | | | (302,000 | ) | | | (166,138 | ) | | | (402,000 | ) |
From net realized gain on investments | | | — | | | | — | | | | — | | | | — | |
| | |
|
|
| |
|
|
| |
|
|
| |
|
|
|
Total distributions to shareholders | | | (3,011,208 | ) | | | (302,000 | ) | | | (166,138 | ) | | | (402,000 | ) |
| | |
|
|
| |
|
|
| |
|
|
| |
|
|
|
From Capital Share Transactions: | | | | | | | | | | | | | | | | |
Proceeds from sale of shares | | | 19,866,719 | | | | 44,201,000 | | | | 13,809,293 | | | | 24,115,000 | |
Reinvestment of dividends and distributions | | | 1,304,421 | | | | 299,000 | | | | 120,755 | | | | 279,000 | |
Cost of shares repurchased | | | (94,420,068 | ) | | | (63,592,000 | ) | | | (32,522,011 | ) | | | (8,712,000 | ) |
| | |
|
|
| |
|
|
| |
|
|
| |
|
|
|
Net increase (decrease) from capital share transactions | | | (73,248,928 | ) | | | (19,092,000 | ) | | | (18,591,963 | ) | | | 15,682,000 | |
| | |
|
|
| |
|
|
| |
|
|
| |
|
|
|
Total increase (decrease) in net assets | | | (55,239,400 | ) | | | 1,811,000 | | | | (11,655,882 | ) | | | 21,461,000 | |
| | |
|
|
| |
|
|
| |
|
|
| |
|
|
|
Net Assets: | | | | | | | | | | | | | | | | |
Beginning of year | | | 238,436,302 | | | | 236,625,000 | | | | 51,044,407 | | | | 29,583,000 | |
| | |
|
|
| |
|
|
| |
|
|
| |
|
|
|
End of year | | $ | 183,196,902 | | | $ | 238,436,000 | | | $ | 39,388,525 | | | $ | 51,044,000 | |
| | |
|
|
| |
|
|
| |
|
|
| |
|
|
|
End of year undistributed net investment income | | $ | 5,737,246 | | | $ | 1,926,000 | | | $ | 1,417,317 | | | $ | 165,000 | |
| | |
|
|
| |
|
|
| |
|
|
| |
|
|
|
Share Transactions: | | | | | | | | | | | | | | | | |
Sale of shares | | | 1,510,279 | | | | 3,769,000 | | | | 1,586,246 | | | | 3,162,000 | |
Reinvestment of dividends and distributions | | | 100,313 | | | | 25,000 | | | | 13,992 | | | | 37,000 | |
Shares repurchased | | | (7,285,403 | ) | | | (5,403,000 | ) | | | (3,551,124 | ) | | | (1,103,000 | ) |
| | |
|
|
| |
|
|
| |
|
|
| |
|
|
|
Net increase (decrease) in shares | | | (5,674,811 | ) | | | (1,609,000 | ) | | | (1,950,886 | ) | | | 2,096,000 | |
| | |
|
|
| |
|
|
| |
|
|
| |
|
|
|
46
| | | | | | | | | | | | | | | | | | | | | | |
Managers Structured Core Fund
| | | Managers Small Cap Fund
| | | Managers Real Estate Securities Fund
| |
2005
| | | 2004
| | | 2005
| | | 2004
| | | 2005
| | | 2004
| |
| | | | | | | | | | | | | | | | | | | | | | | |
| $ | 1,109,164 | | | $ | 712,000 | | | $ | (696,937 | ) | | $ | (739,000 | ) | | $ | 527,792 | | | $ | 789,000 | |
| | 11,924,709 | | | | 9,540,000 | | | | 5,291,658 | | | | 464,000 | | | | 4,560,437 | | | | 5,943,000 | |
| | (4,129,513 | ) | | | (2,892,000 | ) | | | 4,401,284 | | | | 1,242,000 | | | | (408,525 | ) | | | 84,000 | |
|
|
| |
|
|
| |
|
|
| |
|
|
| |
|
|
| |
|
|
|
| | 8,904,360 | | | | 7,360,000 | | | | 8,996,005 | | | | 967,000 | | | | 4,679,704 | | | | 6,816,000 | |
|
|
| |
|
|
| |
|
|
| |
|
|
| |
|
|
| |
|
|
|
| | | | | | | | | | | | | | | | | | | | | | | |
| | (931,900 | ) | | | (532,000 | ) | | | — | | | | — | | | | (746,429 | ) | | | (789,000 | ) |
| | — | | | | — | | | | — | | | | — | | | | (4,065,837 | ) | | | (3,000 | ) |
|
|
| |
|
|
| |
|
|
| |
|
|
| |
|
|
| |
|
|
|
| | (931,900 | ) | | | (532,000 | ) | | | — | | | | — | | | | (4,812,266 | ) | | | (792,000 | ) |
|
|
| |
|
|
| |
|
|
| |
|
|
| |
|
|
| |
|
|
|
| | | | | | | | | | | | | | | | | | | | | | | |
| | 3,021,007 | | | | 5,039,000 | | | | 19,628,320 | | | | 34,391,000 | | | | 7,196,066 | | | | 17,688,000 | |
| | 913,866 | | | | 526,000 | | | | — | | | | — | | | | 4,738,722 | | | | 777,000 | |
| | (12,315,041 | ) | | | (10,780,000 | ) | | | (16,424,115 | ) | | | (19,995,000 | ) | | | (15,485,814 | ) | | | (25,470,000 | ) |
|
|
| |
|
|
| |
|
|
| |
|
|
| |
|
|
| |
|
|
|
| | (8,380,168 | ) | | | (5,215,000 | ) | | | 3,204,205 | | | | 14,396,000 | | | | (3,551,026 | ) | | | (7,005,000 | ) |
|
|
| |
|
|
| |
|
|
| |
|
|
| |
|
|
| |
|
|
|
| | (407,708 | ) | | | 1,613,000 | | | | 12,200,210 | | | | 15,363,000 | | | | (3,683,588 | ) | | | (981,000 | ) |
|
|
| |
|
|
| |
|
|
| |
|
|
| |
|
|
| |
|
|
|
| | | | | | | | | | | | | | | | | | | | | | | |
| | 72,878,091 | | | | 71,265,000 | | | | 54,101,028 | | | | 38,738,000 | | | | 28,586,318 | | | | 29,567,000 | |
|
|
| |
|
|
| |
|
|
| |
|
|
| |
|
|
| |
|
|
|
| $ | 72,470,383 | | | $ | 72,878,000 | | | $ | 66,301,238 | | | $ | 54,101,000 | | | $ | 24,902,730 | | | $ | 28,586,000 | |
|
|
| |
|
|
| |
|
|
| |
|
|
| |
|
|
| |
|
|
|
| $ | 774,674 | | | $ | 550,000 | | | $ | — | | | $ | — | | | $ | — | | | $ | — | |
|
|
| |
|
|
| |
|
|
| |
|
|
| |
|
|
| |
|
|
|
| | | | | | | | | | | | | | | | | | | | | | | |
| | 329,310 | | | | 457,000 | | | | 1,718,443 | | | | 3,082,000 | | | | 583,669 | | | | 1,554,000 | |
| | 74,622 | | | | 48,000 | | | | — | | | | — | | | | 387,553 | | | | 65,000 | |
| | (1,071,398 | ) | | | (966,000 | ) | | | (1,451,712 | ) | | | (1,808,000 | ) | | | (1,276,881 | ) | | | (2,308,000 | ) |
|
|
| |
|
|
| |
|
|
| |
|
|
| |
|
|
| |
|
|
|
| | (667,466 | ) | | | (461,000 | ) | | | 266,731 | | | | 1,274,000 | | | | (305,659 | ) | | | (689,000 | ) |
|
|
| |
|
|
| |
|
|
| |
|
|
| |
|
|
| |
|
|
|
47
Statements of Changes in Net Assets
For the fiscal year ended October 31,
| | | | | | | | | | | | | | | | |
| | | Managers California
Intermediate Tax-Free Fund
| | | Fremont Money Market Fund
| |
| | | 2005
| | | 2004
| | | 2005
| | | 2004
| |
Increase (Decrease) in Net Assets | | | | | | | | | | | | | | | | |
From Operations: | | | | | | | | | | | | | | | | |
Net investment income (loss) | | $ | 1,817,618 | | | $ | 1,948,000 | | | $ | 12,535,236 | | | $ | 5,198,000 | |
Net realized gain (loss) on investments and foreign currency transactions | | | 724,302 | | | | 840,000 | | | | 743 | | | | (150,000 | ) |
Net unrealized appreciation (depreciation) of investments and foreign currency translations | | | (2,142,747 | ) | | | 572,000 | | | | — | | | | — | |
| | |
|
|
| |
|
|
| |
|
|
| |
|
|
|
Net increase in net assets resulting from operations | | | 399,173 | | | | 3,360,000 | | | | 12,535,979 | | | | 5,048,000 | |
| | |
|
|
| |
|
|
| |
|
|
| |
|
|
|
Distributions to Shareholders: | | | | | | | | | | | | | | | | |
From net investment income | | | (1,890,087 | ) | | | (1,948,000 | ) | | | (12,476,544 | ) | | | (5,198,000 | ) |
From net realized gain on investments | | | (845,845 | ) | | | (1,055,000 | ) | | | — | | | | — | |
| | |
|
|
| |
|
|
| |
|
|
| |
|
|
|
Total distributions to shareholders | | | (2,735,932 | ) | | | (3,003,000 | ) | | | (12,476,544 | ) | | | (5,198,000 | ) |
| | |
|
|
| |
|
|
| |
|
|
| |
|
|
|
From Capital Share Transactions: | | | | | | | | | | | | | | | | |
Proceeds from sale of shares | | | 2,758,005 | | | | 3,660,000 | | | | 500,982,667 | | | | 508,586,000 | |
Reinvestment of dividends and distributions | | | 1,256,706 | | | | 1,303,000 | | | | 12,150,763 | | | | 5,575,000 | |
Cost of shares repurchased | | | (4,614,301 | ) | | | (13,548,000 | ) | | | (650,654,439 | ) | | | (584,241,000 | ) |
| | |
|
|
| |
|
|
| |
|
|
| |
|
|
|
Net increase (decrease) from capital share transactions | | | (599,590 | ) | | | (8,585,000 | ) | | | (137,521,009 | ) | | | (70,080,000 | ) |
| | |
|
|
| |
|
|
| |
|
|
| |
|
|
|
Total increase (decrease) in net assets | | | (2,936,349 | ) | | | (8,228,000 | ) | | | (137,461,574 | ) | | | (70,230,000 | ) |
| | |
|
|
| |
|
|
| |
|
|
| |
|
|
|
Net Assets: | | | | | | | | | | | | | | | | |
Beginning of year | | | 50,783,783 | | | | 59,012,000 | | | | 631,357,413 | | | | 701,587,000 | |
| | |
|
|
| |
|
|
| |
|
|
| |
|
|
|
End of year | | $ | 47,847,434 | | | $ | 50,784,000 | | | $ | 493,895,839 | | | $ | (631,357,000 | ) |
| | |
|
|
| |
|
|
| |
|
|
| |
|
|
|
End of year undistributed net investment income | | $ | 16,826 | | | $ | 79,000 | | | $ | 58,690 | | | $ | — | |
| | |
|
|
| |
|
|
| |
|
|
| |
|
|
|
Share Transactions: | | | | | | | | | | | | | | | | |
Sale of shares | | | 270,743 | | | | 331,000 | | | | 500,982,667 | | | | 508,586,000 | |
Reinvestment of dividends and distributions | | | 115,569 | | | | 119,000 | | | | 12,150,763 | | | | 5,575,000 | |
Shares repurchased | | | (442,633 | ) | | | (1,232,000 | ) | | | (650,654,439 | ) | | | (584,241,000 | ) |
| | |
|
|
| |
|
|
| |
|
|
| |
|
|
|
Net increase (decrease) in shares | | | (56,321 | ) | | | (782,000 | ) | | | (137,521,009 | ) | | | (70,080,000 | ) |
| | |
|
|
| |
|
|
| |
|
|
| |
|
|
|
48
Financial Highlights
For a share outstanding throughout each fiscal year
| | | | | | | | | | | | | | | | | | | | |
| | | For the fiscal year ended October 31,
| |
Managers Fremont Global Fund
| | 2005
| | | 2004
| | | 2003
| | | 2002
| | | 2001
| |
Net Asset Value, Beginning of Year | | $ | 12.19 | | | $ | 11.17 | | | $ | 9.50 | | | $ | 10.65 | | | $ | 13.52 | |
| | |
|
|
| |
|
|
| |
|
|
| |
|
|
| |
|
|
|
Income from Investment Operations: | | | | | | | | | | | | | | | | | | | | |
Net investment income | | | 0.46 | | | | 0.18 | | | | 0.27 | | | | 0.15 | | | | 0.24 | |
Net realized and unrealized gain (loss) on investments | | | 0.69 | | | | 0.86 | | | | 1.52 | | | | (1.18 | ) | | | (2.56 | ) |
| | |
|
|
| |
|
|
| |
|
|
| |
|
|
| |
|
|
|
Total from investment operations | | | 1.15 | | | | 1.04 | | | | 1.79 | | | | (1.03 | ) | | | (2.32 | ) |
| | |
|
|
| |
|
|
| |
|
|
| |
|
|
| |
|
|
|
Less Distributions to Shareholders from: | | | | | | | | | | | | | | | | | | | | |
Net investment income | | | (0.15 | ) | | | (0.02 | ) | | | (0.10 | ) | | | (0.12 | ) | | | (0.16 | ) |
Net realized gain on investments | | | — | | | | — | | | | — | | | | — | | | | (0.36 | ) |
Return of capital distribution | | | — | | | | — | | | | (0.02 | ) | | | — | | | | (0.03 | ) |
| | |
|
|
| |
|
|
| |
|
|
| |
|
|
| |
|
|
|
Total distributions to shareholders | | | (0.15 | ) | | | (0.02 | ) | | | (0.12 | ) | | | (0.12 | ) | | | (0.55 | ) |
| | |
|
|
| |
|
|
| |
|
|
| |
|
|
| |
|
|
|
Net Asset Value, End of Year | | $ | 13.19 | | | $ | 12.19 | | | $ | 11.17 | | | $ | 9.50 | | | $ | 10.65 | |
| | |
|
|
| |
|
|
| |
|
|
| |
|
|
| |
|
|
|
Total Return1 | | | 9.79 | % | | | 9.27 | % | | | 18.94 | % | | | (9.85 | )% | | | (17.77 | )% |
| | |
|
|
| |
|
|
| |
|
|
| |
|
|
| |
|
|
|
Ratio of net expenses to average net assets1 | | | 1.09 | % | | | 1.02 | % | | | 0.95 | % | | | 0.95 | % | | | 0.93 | % |
Ratio of net investment income to average net assets | | | 1.56 | % | | | 1.38 | % | | | 1.74 | % | | | 1.43 | % | | | 1.97 | % |
Portfolio turnover | | | 108 | % | | | 56 | % | | | 73 | % | | | 104 | % | | | 173 | % |
Net assets at end of year (000’s omitted) | | $ | 183,197 | | | $ | 238,436 | | | $ | 236,625 | | | $ | 508,214 | | | $ | 602,131 | |
| |
| | | For the fiscal year ended October 31,
| |
Managers International Growth Fund
| | 2005
| | | 2004
| | | 2003
| | | 2002
| | | 2001
| |
Net Asset Value, Beginning of Year | | $ | 8.23 | | | $ | 7.21 | | | $ | 6.32 | | | $ | 7.50 | | | $ | 12.13 | |
| | |
|
|
| |
|
|
| |
|
|
| |
|
|
| |
|
|
|
Income from Investment Operations: | | | | | | | | | | | | | | | | | | | | |
Net investment income | | | 0.34 | | | | 0.02 | | | | 0.05 | | | | 0.13 | | | | 0.16 | |
Net realized and unrealized gain (loss) on investments | | | 0.73 | | | | 1.07 | | | | 0.94 | | | | (1.42 | ) | | | (3.81 | ) |
| | |
|
|
| |
|
|
| |
|
|
| |
|
|
| |
|
|
|
Total from investment operations | | | 1.07 | | | | 1.09 | | | | 0.99 | | | | (1.29 | ) | | | (3.65 | ) |
| | |
|
|
| |
|
|
| |
|
|
| |
|
|
| |
|
|
|
Less Distributions to Shareholders from: | | | | | | | | | | | | | | | | | | | | |
Net investment income | | | (0.03 | ) | | | (0.07 | ) | | | (0.11 | ) | | | (0.00 | )# | | | (0.15 | ) |
Net realized gain on investments | | | — | | | | — | | | | — | | | | — | | | | (0.83 | ) |
| | |
|
|
| |
|
|
| |
|
|
| |
|
|
| |
|
|
|
Total distributions to shareholders | | | (0.03 | ) | | | (0.07 | ) | | | (0.11 | ) | | | (0.00 | )# | | | (0.98 | ) |
| | |
|
|
| |
|
|
| |
|
|
| |
|
|
| |
|
|
|
Redemption fee proceeds | | | 0.00 | # | | | 0.00 | # | | | 0.01 | | | | 0.11 | | | | N/A | |
| | |
|
|
| |
|
|
| |
|
|
| |
|
|
| |
|
|
|
Net Asset Value, End of Year | | $ | 9.27 | | | $ | 8.23 | | | $ | 7.21 | | | $ | 6.32 | | | $ | 7.50 | |
| | |
|
|
| |
|
|
| |
|
|
| |
|
|
| |
|
|
|
Total Return1 | | | 12.99 | % | | | 15.20 | % | | | 16.19 | % | | | (15.69 | )% | | | (32.21 | )% |
| | |
|
|
| |
|
|
| |
|
|
| |
|
|
| |
|
|
|
Ratio of net expenses to average net assets1 | | | 1.50 | % | | | 1.50 | % | | | 1.50 | % | | | 1.50 | % | | | 1.50 | % |
Ratio of total expenses to average net assets1 | | | 1.65 | %2 | | | 1.60 | % | | | 1.71 | % | | | 1.99 | % | | | 1.88 | % |
Ratio of net investment income to average net assets | | | 0.87 | % | | | 0.56 | % | | | 0.79 | % | | | 0.07 | % | | | 0.07 | % |
Portfolio turnover | | | 180 | % | | | 12 | % | | | 8 | % | | | 114 | % | | | 50 | % |
Net assets at end of year (000’s omitted) | | $ | 39,389 | | | $ | 51,044 | | | $ | 29,583 | | | $ | 23,086 | | | $ | 45,417 | |
49
Financial Highlights
For a share outstanding throughout each fiscal year
| | | | | | | | | | | | | | | | | | | | |
| | | For the fiscal year ended October 31,
| |
Managers Structured Core Fund
| | 2005
| | | 2004
| | | 2003
| | | 2002
| | | 2001
| |
Net Asset Value, Beginning of Year | | $ | 11.62 | | | $ | 10.59 | | | $ | 9.03 | | | $ | 10.90 | | | $ | 15.59 | |
| | |
|
|
| |
|
|
| |
|
|
| |
|
|
| |
|
|
|
Income from Investment Operations: | | | | | | | | | | | | | | | | | | | | |
Net investment income | | | 0.20 | | | | 0.11 | | | | 0.08 | | | | 0.07 | | | | 0.08 | |
Net realized and unrealized gain (loss) on investments | | | 1.26 | | | | 1.00 | | | | 1.56 | | | | (1.87 | ) | | | (4.00 | ) |
| | |
|
|
| |
|
|
| |
|
|
| |
|
|
| |
|
|
|
Total from investment operations | | | 1.46 | | | | 1.11 | | | | 1.64 | | | | (1.80 | ) | | | (3.92 | ) |
| | |
|
|
| |
|
|
| |
|
|
| |
|
|
| |
|
|
|
Less Distributions to Shareholders from: | | | | | | | | | | | | | | | | | | | | |
Net investment income | | | (0.15 | ) | | | (0.08 | ) | | | (0.08 | ) | | | (0.07 | ) | | | (0.02 | ) |
Net realized gain on investments | | | — | | | | — | | | | — | | | | — | | | | (0.75 | ) |
| | |
|
|
| |
|
|
| |
|
|
| |
|
|
| |
|
|
|
Total distributions to shareholders | | | (0.15 | ) | | | (0.08 | ) | | | (0.08 | ) | | | (0.07 | ) | | | (0.77 | ) |
| | |
|
|
| |
|
|
| |
|
|
| |
|
|
| |
|
|
|
Net Asset Value, End of Year | | $ | 12.93 | | | $ | 11.62 | | | $ | 10.59 | | | $ | 9.03 | | | $ | 10.90 | |
| | |
|
|
| |
|
|
| |
|
|
| |
|
|
| |
|
|
|
Total Return1 | | | 12.64 | % | | | 10.52 | % | | | 18.37 | % | | | (16.65 | )% | | | (26.07 | )% |
| | |
|
|
| |
|
|
| |
|
|
| |
|
|
| |
|
|
|
Ratio of net expenses to average net assets1 | | | 0.85 | % | | | 0.79 | % | | | 0.91 | % | | | 1.01 | % | | | 0.93 | % |
Ratio of net investment income to average net assets | | | 1.49 | % | | | 0.97 | % | | | 0.82 | % | | | 0.61 | % | | | 0.61 | % |
Portfolio turnover | | | 105 | % | | | 106 | % | | | 169 | % | | | 74 | % | | | 69 | % |
Net assets at end of year (000’s omitted) | | $ | 72,470 | | | $ | 72,878 | | | $ | 71,265 | | | $ | 63,676 | | | $ | 86,546 | |
| |
| | | For the fiscal year ended October 31,
| |
Managers Small Cap Fund
| | 2005
| | | 2004
| | | 2003
| | | 2002
| | | 2001
| |
Net Asset Value, Beginning of Year | | $ | 11.10 | | | $ | 10.76 | | | $ | 7.66 | | | $ | 11.11 | | | $ | 18.70 | |
Income from Investment Operations: | | | | | | | | | | | | | | | | | | | | |
Net investment loss | | | 0.14 | | | | (0.15 | ) | | | (0.14 | ) | | | (0.13 | ) | | | (0.07 | ) |
Net realized and unrealized gain (loss) on investments | | | 1.66 | | | | 0.49 | | | | 3.24 | | | | (3.32 | ) | | | (5.84 | ) |
| | |
|
|
| |
|
|
| |
|
|
| |
|
|
| |
|
|
|
Total from investment operations | | | 1.80 | | | | 0.34 | | | | 3.10 | | | | (3.45 | ) | | | (5.91 | ) |
| | |
|
|
| |
|
|
| |
|
|
| |
|
|
| |
|
|
|
Less Distributions to Shareholders from: | | | | | | | | | | | | | | | | | | | | |
Net realized gain on investments | | | — | | | | — | | | | — | | | | — | | | | (1.68 | ) |
| | |
|
|
| |
|
|
| |
|
|
| |
|
|
| |
|
|
|
Total distributions to shareholders | | | — | | | | — | | | | — | | | | — | | | | (1.68 | ) |
| | |
|
|
| |
|
|
| |
|
|
| |
|
|
| |
|
|
|
Net Asset Value, End of Year | | $ | 12.90 | | | $ | 11.10 | | | $ | 10.76 | | | $ | 7.66 | | | $ | 11.11 | |
| | |
|
|
| |
|
|
| |
|
|
| |
|
|
| |
|
|
|
Total Return1 | | | 16.13 | % | | | 3.16 | % | | | 40.47 | % | | | (31.05 | )% | | | (33.73 | )% |
Ratio of net expenses to average net assets1 | | | 1.47 | % | | | 1.60 | % | | | 1.60 | % | | | 1.56 | % | | | 1.50 | % |
Ratio of total expenses to average net assets1 | | | 1.53 | %2 | | | 1.63 | % | | | 1.72 | % | | | 1.88 | % | | | 1.89 | % |
Ratio of net investment income to average net assets | | | (1.10 | )% | | | (1.43 | )% | | | (1.42 | )% | | | (1.27 | )% | | | (0.52 | )% |
Portfolio turnover | | | 67 | % | | | 54 | % | | | 207 | % | | | 108 | % | | | 134 | % |
Net assets at end of year (000’s omitted) | | $ | 66,301 | | | $ | 54,101 | | | $ | 38,738 | | | $ | 31,563 | | | $ | 46,060 | |
50
Financial Highlights
For a share outstanding throughout each fiscal year
| | | | | | | | | | | | | | | | | | | | |
| | | For the fiscal year ended October 31,
| |
Managers Real Estate Securities Fund
| | 2005
| | | 2004
| | | 2003
| | | 2002
| | | 2001
| |
Net Asset Value, Beginning of Year | | $ | 12.75 | | | $ | 10.09 | | | $ | 8.12 | | | $ | 8.22 | | | $ | 7.79 | |
Income from Investment Operations: | | | | | | | | | | | | | | | | | | | | |
Net investment income | | | 0.35 | | | | 0.350 | | | | 0.46 | | | | 0.39 | | | | 0.21 | |
Net realized and unrealized gain (loss) on investments | | | 1.86 | | | | 2.66 | | | | 2.10 | | | | (0.11 | ) | | | 0.61 | |
| | |
|
|
| |
|
|
| |
|
|
| |
|
|
| |
|
|
|
Total from investment operations | | | 2.21 | | | | 2.96 | | | | 2.56 | | | | 0.28 | | | | 0.82 | |
| | |
|
|
| |
|
|
| |
|
|
| |
|
|
| |
|
|
|
Less Distributions to Shareholders from: | | | | | | | | | | | | | | | | | | | | |
Net investment income | | | (0.35 | ) | | | (0.30 | ) | | | (0.59 | ) | | | (0.38 | ) | | | (0.36 | ) |
Net realized gain on investments | | | (1.75 | ) | | | — | | | | — | | | | — | | | | (0.03 | ) |
| | |
|
|
| |
|
|
| |
|
|
| |
|
|
| |
|
|
|
Total distributions to shareholders | | | (2.10 | ) | | | (0.30 | ) | | | (0.59 | ) | | | (0.38 | ) | | | (0.39 | ) |
| | |
|
|
| |
|
|
| |
|
|
| |
|
|
| |
|
|
|
Net Asset Value, End of Year | | $ | 12.86 | | | $ | 12.75 | | | $ | 10.09 | | | $ | 8.12 | | | $ | 8.22 | |
| | |
|
|
| |
|
|
| |
|
|
| |
|
|
| |
|
|
|
Total Return1 | | | 18.84 | % | | | 29.56 | % | | | 32.75 | % | | | 3.12 | % | | | 10.43 | % |
| | |
|
|
| |
|
|
| |
|
|
| |
|
|
| |
|
|
|
Ratio of net expenses to average net assets1 | | | 1.42 | % | | | 1.50 | % | | | 1.50 | % | | | 1.50 | % | | | 1.50 | % |
Ratio of total expenses to average net assets1 | | | 1.54 | %2 | | | 1.67 | % | | | 1.74 | % | | | 1.62 | % | | | 2.06 | % |
Ratio of net investment income to average net assets | | | 1.93 | % | | | 2.68 | % | | | 4.89 | % | | | 4.19 | % | | | 4.14 | % |
Portfolio turnover | | | 70 | % | | | 136 | % | | | 60 | % | | | 79 | % | | | 122 | % |
Net assets at end of year (000’s omitted) | | $ | 24,903 | | | $ | 28,586 | | | $ | 29,567 | | | $ | 20,181 | | | $ | 18,443 | |
| |
| | | For the fiscal year ended October 31,
| |
Managers California Intermediate Tax-Free Fund
| | 2005
| | | 2004
| | | 2003
| | | 2002
| | | 2001
| |
Net Asset Value, Beginning of Year | | $ | 11.17 | | | $ | 11.08 | | | $ | 11.08 | | | $ | 11.16 | | | $ | 10.87 | |
| | |
|
|
| |
|
|
| |
|
|
| |
|
|
| |
|
|
|
Income from Investment Operations: | | | | | | | | | | | | | | | | | | | | |
Net investment income | | | 0.39 | | | | 0.40 | | | | 0.41 | | | | 0.48 | | | | 0.51 | |
Net realized and unrealized gain (loss) on investments | | | (0.31 | ) | | | 0.28 | | | | 0.07 | | | | (0.08 | ) | | | 0.29 | |
| | |
|
|
| |
|
|
| |
|
|
| |
|
|
| |
|
|
|
Total from investment operations | | | 0.08 | | | | 0.68 | | | | 0.48 | | | | 0.40 | | | | 0.80 | |
| | |
|
|
| |
|
|
| |
|
|
| |
|
|
| |
|
|
|
Less Distributions to Shareholders from: | | | | | | | | | | | | | | | | | | | | |
Net investment income | | | (0.40 | ) | | | (0.40 | ) | | | (0.41 | ) | | | (0.48 | ) | | | (0.48 | ) |
Net realized gain on investments | | | (0.19 | ) | | | (0.19 | ) | | | (0.07 | ) | | | — | | | | — | |
| | |
|
|
| |
|
|
| |
|
|
| |
|
|
| |
|
|
|
Total distributions to shareholders | | | (0.59 | ) | | | (0.59 | ) | | | (0.48 | ) | | | (0.48 | ) | | | (0.48 | ) |
| | |
|
|
| |
|
|
| |
|
|
| |
|
|
| |
|
|
|
Net Asset Value, End of Year | | $ | 10.66 | | | $ | 11.17 | | | $ | 11.08 | | | $ | 11.08 | | | $ | 11.16 | |
| | |
|
|
| |
|
|
| |
|
|
| |
|
|
| |
|
|
|
Total Return1 | | | 0.92 | % | | | 6.39 | % | | | 4.46 | % | | | 3.65 | % | | | 7.49 | % |
| | |
|
|
| |
|
|
| |
|
|
| |
|
|
| |
|
|
|
Ratio of net expenses to average net assets1 | | | 0.55 | % | | | 0.55 | % | | | 0.55 | % | | | 0.53 | % | | | 0.49 | % |
Ratio of total expenses to average net assets1 | | | 0.81 | %2 | | | 0.74 | % | | | 0.69 | % | | | 0.67 | % | | | 0.69 | % |
Ratio of net investment income to average net assets | | | 3.74 | % | | | 3.63 | % | | | 3.72 | % | | | 4.32 | % | | | 4.57 | % |
Portfolio turnover | | | 28 | % | | | 66 | % | | | 116 | % | | | 22 | % | | | 6 | % |
Net assets at end of year (000’s omitted) | | $ | 47,847 | | | $ | 50,784 | | | $ | 59,012 | | | $ | 60,570 | | | $ | 65,153 | |
51
Financial Highlights
For a share outstanding throughout each fiscal year
| | | | | | | | | | | | | | | | | | | | |
| | | For the fiscal year ended October 31,
| |
Fremont Money Market Fund
| | 2005
| | | 2004
| | | 2003
| | | 2002
| | | 2001
| |
Net Asset Value, Beginning of Year | | $ | 1.00 | | | $ | 1.00 | | | $ | 1.00 | | | $ | 1.00 | | | $ | 1.00 | |
| | |
|
|
| |
|
|
| |
|
|
| |
|
|
| |
|
|
|
Income from Investment Operations: | | | | | | | | | | | | | | | | | | | | |
Net investment income | | | 0.02 | | | | 0.01 | | | | 0.01 | | | | 0.02 | | | | 0.05 | |
| | |
|
|
| |
|
|
| |
|
|
| |
|
|
| |
|
|
|
Total from investment operations | | | 0.02 | | | | 0.01 | | | | 0.01 | | | | 0.02 | | | | 0.05 | |
| | |
|
|
| |
|
|
| |
|
|
| |
|
|
| |
|
|
|
Less Distributions to Shareholders from: | | | | | | | | | | | | | | | | | | | | |
Net investment income | | | (0.02 | ) | | | (0.01 | ) | | | (0.01 | ) | | | (0.02 | ) | | | (0.05 | ) |
| | |
|
|
| |
|
|
| |
|
|
| |
|
|
| |
|
|
|
Total distributions to shareholders | | | (0.02 | ) | | | (0.01 | ) | | | (0.01 | ) | | | (0.02 | ) | | | (0.05 | ) |
| | |
|
|
| |
|
|
| |
|
|
| |
|
|
| |
|
|
|
Net Asset Value, End of Year | | $ | 1.00 | | | $ | 1.00 | | | $ | 1.00 | | | $ | 1.00 | | | $ | 1.00 | |
| | |
|
|
| |
|
|
| |
|
|
| |
|
|
| |
|
|
|
Total Return1 | | | 2.39 | % | | | 0.84 | % | | | 0.93 | % | | | 1.77 | % | | | 4.67 | % |
Ratio of net expenses to average net assets1 | | | 0.48 | % | | | 0.43 | % | | | 0.42 | % | | | 0.42 | % | | | 0.42 | % |
Ratio of net investment income to average net assets | | | 2.34 | % | | | 0.83 | % | | | 0.95 | % | | | 1.75 | % | | | 4.54 | % |
Net assets at end of year (000’s omitted) | | $ | 493,896 | | | $ | 631,357 | | | $ | 701,587 | | | $ | 870,105 | | | $ | 777,523 | |
The following notes should be read in conjunction with the Financial Highlights of the Funds presented on the preceding pages.
| # | Rounds to less than $0.01 per share. |
| 1 | See Note 1(c) of “Notes to Financial Statements.” |
| 2 | Excludes the impact of expense reimbursement and expense offsets such as brokerage credits, but includes non-reimbursable expenses such as interest and taxes. (See Note 1(c) of “Notes to Financial Statements.”) |
52
Notes to Financial Statements
October 31, 2005
(1) Summary of Significant Accounting Policies
Managers Trust I (the “Trust”) is an open-end management investment company organized as a Massachusetts business trust and registered under the Investment Company Act of 1940, as amended (the “1940 Act”). Currently, the Trust is comprised of a number of investment series. Included in this report are the Managers Global Fund (“Fremont Global”), formerly Fremont Global Fund; Managers International Growth Fund (“International Growth”), formerly Fremont International Growth Fund; Managers Structured Core Fund (“Structured Core”), formerly Fremont Structured Core Fund; Managers Small Cap Fund (“Small Cap”), formerly Fremont U.S. Small Cap Fund; Managers Real Estate Securities Fund (“Real Estate Securities”), formerly Fremont Real Estate Securities Fund; Managers California Intermediate Tax-Free Fund (“California Intermediate Tax-Free”), formerly Fremont California Intermediate Tax-Free Fund; and Fremont Money Market Fund (“Fremont Money Market”), formerly Fremont Money Market Fund; collectively the “Funds.” The former Funds will be referred to herein collectively as “the former Fremont Funds.”
At the close of business on January 14, 2005, each of the former Fremont Funds were re-organized from a series of Fremont Mutual Funds, Inc. into a respective new series of Managers Trust I.
The Funds’ financial statements are prepared in accordance with accounting principles generally accepted in the United States of America, which require management to make estimates and assumptions that affect the reported amount of assets and liabilities and disclosure of contingent assets and liabilities at the date of the financial statements and the reported amounts of income and expenses during the reporting periods. Actual results could differ from those estimates. The following is a summary of significant accounting policies followed by the Funds in the preparation of their financial statements:
(a) Valuation of Investments
Equity securities traded on a domestic or international securities exchange are generally valued at the last quoted sale price, or, lacking any sales, at the last quoted bid price. Over-the-counter securities are valued at the Nasdaq Official Closing Price, if one is available. Lacking any sales, over-the-counter securities, are valued at the last quoted bid price. Under certain circumstances, the value of a Fund investment may be based on an evaluation of its fair value, pursuant to procedures established by and under the general supervision of the Board of Trustees of the Trust. A Fund may use the fair value of a portfolio security to calculate its NAV when, for example, (1) market quotations are not readily available because a portfolio security is not traded in a public market or the principal market in which the security trades is closed, (2) trading in a portfolio security is suspended and has not resumed prior to the time as of which the Fund calculates its NAV, (3) where a significant event affecting the value of a portfolio security is determined to have occurred between the time of the market quotation provided for a portfolio security and the time as of which the Fund calculates its NAV, (4) a security’s price has remained unchanged over an extended period of time (often referred to as a “stale price”), or (5) the Investment Manager determines that a market quotation is inaccurate. The Investment Manager monitors intervening events that may affect the value of securities held in each Fund’s portfolio and, in accordance with procedures adopted by the Funds’ Trustees, will adjust the prices of securities traded in foreign markets, as appropriate, to reflect the impact of events occurring subsequent to the close of such markets but prior to the time each Fund’s NAV is calculated. Fixed-income securities are valued based on valuations furnished by independent pricing services that utilize matrix systems, which reflect such factors as security prices, yields, maturities and ratings, and are supplemented by dealer and exchange quotations. Fremont Money Market and other short-term investments are valued at amortized cost which approximates market value. The amortized cost method of valuation values a security at its cost at the time of purchase and therefore assumes a constant amortization to maturity of any discount or premium, regardless of the impact of fluctuating interest rates on the market value of the instruments. Investments in other regulated investment companies are valued at their end of day net asset value per share except iShares or other ETF’s, which are valued the same as equity securities. Securities (including derivatives) for which market quotations are not readily available are valued at fair value, as determined in good faith, and pursuant to procedures adopted by the Board of Trustees of the Trust.
Investments in certain mortgage-backed, stripped mortgage-backed, preferred stocks, convertible securities and other debt securities not traded on an organized market, are valued on the basis of valuations provided by dealers or by a pricing service which uses information with respect to transactions in such securities, various relationships between securities and yield to maturity in determining value.
The values assigned to fair value investments are based on available information and do not necessarily represent amounts that might ultimately be realized, since such amounts depend on future developments inherent in long-term investments. Further, because of the inherent uncertainty of valuation, those estimated values may differ significantly from the values that would have been used had a ready market for the investments existed, and the differences could be material.
(b) Security Transactions
Security transactions are accounted for as of the trade date. Realized gains and losses on securities sold are determined on the basis of identified cost.
53
Notes to Financial Statements (continued)
(c) Investment Income and Expenses
Dividend income is recorded on the ex-dividend date except certain dividends from foreign securities where the ex-dividend date may have passed. These dividends are recorded as soon as the Trust is informed of the ex-dividend date. Dividend income on foreign securities is recorded net of any withholding tax. Interest income, which includes amortization of premium and accretion of discount on debt securities, is accrued as earned. Non-cash dividends included in dividend income, if any, are reported at the fair value of the securities received. Other income and expenses are recorded on an accrual basis. Expenses that cannot be directly attributed to a fund are apportioned among the Funds in the Trust and in some cases other affiliated funds based upon their relative average net assets or number of shareholders.
The following Funds had certain portfolio trades directed to various brokers who paid a portion of such Fund’s expenses. For the fiscal year ended October 31, 2005, the amount by which the Funds’ expenses were reduced under these arrangements and the impact on the expense ratios were as follows: Fremont Global - $7,488 or 0.003%; International Growth - $2,140 or 0.004%; Small Cap - $2,487 or 0.004%; and Real Estate Securities - $2,430 or 0.01%.
Each of the Funds has a “balance credit” arrangement with The Bank of New York (“BNY”), the Funds’ custodian, whereby each Fund is credited with an interest factor equal to 1 % below the effective 90-day T-Bill rate for account balances left uninvested overnight. These credits serve to reduce custody expenses that would otherwise be charged to each Fund. For the fiscal year ended October 31, 2005, the custodian expense was not reduced for any of the Funds. Prior to January 15, 2005, the former Fremont Funds participated in a similar program offered by State Street Bank. Overdrafts will cause a reduction of any earnings credits, computed at 2% above the effective Federal Funds rate on the day of the overdraft. For the fiscal year ended October 31, 2005, overdraft fees for International Growth, Structured Core, Small Cap, Real Estate Securities, and California Intermediate Tax-Free equaled $112, $301, $8, $2,325, and $8, respectively.
Managers Investment Group LLC (the “Investment Manager”), a subsidiary of Affiliated Managers Group, Inc. (“AMG”) and the Investment Manager for the Funds, has contractually agreed, through at least March 1, 2006, to waive fees and pay or reimburse expenses of International Growth, Small Cap, Real Estate Securities, and California Intermediate Tax-Free to the extent that the total annual operating expenses (exclusive of brokerage, interest, taxes and extraordinary expenses) of the Fund exceed 1.50%, 1.60%, 1.50%, and 0.55%, respectively, of each Fund’s average daily net assets.
Effective January 15, 2005, each Fund may be obligated to repay the Investment Manager such amounts waived, paid or reimbursed in future years provided that the repayment occurs within three (3) years after the waiver or reimbursement and that such repayment would not cause the Fund’s expenses in any such year to exceed the previously stated percentages of that Fund’s average daily net assets. [Prior to January 15, 2005, the former Fremont Funds had a similar expense reimbursement agreement with the former Investment Advisor, Fremont Investment Advisors, Inc. (“FIA”)]. For the fiscal year ended October 31, 2005, the Funds made no such repayments to the Investment Manager. At October 31, 2005, the cumulative amount of expense reimbursement by the Manager subject to repayment by International Growth, Small Cap, Real Estate Securities, and California Intermediate Tax-Free equaled $33,588, $0, $8,721, and $84,873, respectively.
(d) Dividends and Distributions
Dividends resulting from net investment income, if any, normally will be declared and paid annually for International Growth, Structured Core and Small Cap. Dividends resulting from net investment income, if any, normally will be declared and paid quarterly for Fremont Global and Real Estate Securities. Dividends resulting from net investment income, if any, normally will be declared daily and paid monthly for California Intermediate Tax-Free and Fremont Money Market. Distributions of capital gains, if any, will be made on an annual basis and when required for Federal excise tax purposes. Income and capital gain distributions are determined in accordance with Federal income tax regulations, which may differ from generally accepted accounting principles. These differences are primarily due to differing treatments for losses deferred due to wash sales, REITs, equalization accounting for tax purposes, foreign currency and market discount transactions. Permanent book and tax basis differences, if any, relating to shareholder distributions will result in reclassifications to paid-in capital. The tax character of distributions paid during 2005 was as follows:
| | | | | | | | | | | | | | | | | | | | | | | | |
| | | Fremont Global
| | International Growth
| | Structured Core
| | Small Cap
|
| | | 2005
| | 2004
| | 2005
| | 2004
| | 2005
| | 2004
| | 2005
| | 2004
|
Distributions paid from: | | | | | | | | | | | | | | | | | | | | | | | | |
Ordinary income | | $ | 3,011,208 | | $ | 302,000 | | $ | 166,138 | | $ | 402,000 | | $ | 931,900 | | $ | 532,000 | | $ | — | | $ | — |
Short-term capital gains | | | — | | | — | | | — | | | — | | | — | | | — | | | — | | | — |
Long-term capital gains | | | — | | | — | | | — | | | — | | | — | | | — | | | — | | | — |
| | |
|
| |
|
| |
|
| |
|
| |
|
| |
|
| |
|
| |
|
|
| | | $ | 3,011,208 | | $ | 302,000 | | $ | 166,138 | | $ | 402,000 | | $ | 931,900 | | $ | 532,000 | | $ | — | | $ | — |
| | |
|
| |
|
| |
|
| |
|
| |
|
| |
|
| |
|
| |
|
|
54
Notes to Financial Statements (continued)
| | | | | | | | | | | | | | | | | | |
| | | Real Estate Securities
| | California Intermediate Tax-Free
| | Fremont Money Market
|
| | | 2005
| | 2004
| | 2005
| | 2004
| | 2005
| | 2004
|
Distributions paid from: | | | | | | | | | | | | | | | | | | |
Ordinary income | | $ | 746,429 | | $ | 789,000 | | $ | 1,890,087 | | $ | 1,948,000 | | $ | 12,476,546 | | $ | 5,198,000 |
Short-term capital gains | | | 430,454 | | | 3,000 | | | 17,639 | | | — | | | — | | | — |
Long-term capital gains | | | 3,635,383 | | | — | | | 828,205 | | | 1,055,000 | | | — | | | — |
| | |
|
| |
|
| |
|
| |
|
| |
|
| |
|
|
| | | $ | 4,812,266 | | $ | 792,000 | | $ | 2,735,931 | | $ | 3,003,000 | | $ | 12,476,546 | | $ | 5,198,000 |
| | |
|
| |
|
| |
|
| |
|
| |
|
| |
|
|
As of October 31, 2005, the components of distributable earnings (excluding unrealized appreciation/depreciation) on a tax basis consisted of:
| | | | | | | | | | | | | | | | | | | | | |
| | | Fremont
Global
| | International
Growth
| | Structured
Core
| | Small Cap
| | Real Estate
Securities
| | California
Intermediate
Tax-Free
| | Fremont
Money Market
|
Capital loss carryforward | | $ | 74,885,657 | | $ | 6,281,090 | | $ | — | | $ | 29,472,572 | | $ | — | | $ | — | | $ | 172,201 |
Undistributed ordinary income | | | 5,737,236 | | | 1,417,317 | | | 774,674 | | | — | | | — | | | 16,826 | | | 58,690 |
Undistributed short-termcapital gains | | | — | | | — | | | — | | | — | | | 1,135,060 | | | — | | | — |
Undistributed long-termcapital gains | | | — | | | — | | | 2,816,924 | | | — | | | 2,682,959 | | | 706,368 | | | — |
| | |
|
| |
|
| |
|
| |
|
| |
|
| |
|
| |
|
|
| | | $ | 80,622,893 | | $ | 7,698,407 | | $ | 3,591,598 | | $ | 29,472,572 | | $ | 3,818,019 | | $ | 723,194 | | $ | 230,891 |
| | |
|
| |
|
| |
|
| |
|
| |
|
| |
|
| |
|
|
For the California Intermediate Tax-Free Fund, $1,890,087 of the distributed investment income is tax-exempt for Federal income tax purposes.
(e) Federal Taxes
Each Fund intends to comply with the requirements under Subchapter M of the Internal Revenue Code of 1986, as amended, to distribute substantially all of its taxable income and gains to its shareholders and to meet certain diversification and income requirements with respect to investment companies. Therefore, no provision for Federal income or excise tax is included in the accompanying financial statements.
Additionally, based on the Fund’s understanding of the tax rules and rates related to income, gains and transactions for the foreign jurisdictions in which it invests, the Fund will provide for foreign taxes, and where appropriate, deferred foreign taxes.
(f) Capital Loss Carryovers
As of October 31, 2005, the following Funds had accumulated net realized capital loss carryovers from securities transactions for Federal income tax purposes as shown in the following chart. These amounts may be used to offset realized capital gains, if any, through the expiration dates listed.
| | | | |
Fund
| | Capital Loss
Carryover Amount
| | Expires October 31,
|
Fremont Global | | 25,231,428 | | 2010 |
| | | 49,654,229 | | 2011 |
International Growth | | 5,718,063 | | 2009 |
| | | 122,656 | | 2010 |
| | | 440,371 | | 2012 |
Small Cap | | 3,526,364 | | 2008 |
| | | 13,467,588 | | 2009 |
| | | 12,478,620 | | 2010 |
Fremont Money Market | | 20,009 | | 2008 |
| | | 2,100 | | 2010 |
| | | 150,092 | | 2011 |
(g) Capital Stock
The Trust’s Declaration of Trust authorizes for each series the issuance of an unlimited number of shares of beneficial interest, without par value. Each Fund records sales and repurchases of its capital stock on the trade date. Dividends and distributions to shareholders are recorded on the ex-dividend date.
At October 31, 2005, certain unaffiliated shareholders, specifically omnibus accounts, individually held greater than 10% of the outstanding shares of the following Funds: International Growth - two collectively own 26%; Structured Core - one owns 14%; Small Cap - three collectively own 50%; Real Estate Securities - two collectively own 40%; California Intermediate Tax-Free - two collectively own 61%; Fremont Money Market - one owns 62%.
55
Notes to Financial Statements (continued)
(h) Repurchase Agreements
Each Fund may enter into repurchase agreements provided that the value of the underlying collateral, including accrued interest, will be equal to or exceed the value of the repurchase agreement during the term of the agreement. The underlying collateral for all repurchase agreements is held in safekeeping by the Fund’s custodian or at the Federal Reserve Bank.
If the seller defaults and the value of the collateral declines, or if bankruptcy proceedings commence with respect to the seller of the security, realization of the collateral by the Fund may be delayed or limited.
(i) Foreign Currency Translation
The books and records of the Funds are maintained in U.S. dollars. The value of investments, assets and liabilities denominated in currencies other than U.S. dollars are translated into U.S. dollars based upon current foreign exchange rates. Purchases and sales of foreign investments, income and expenses are converted into U.S. dollars based on currency exchange rates prevailing on the respective dates of such transactions. Net realized and unrealized gain (loss) on foreign currency transactions represent: (1) foreign exchange gains and losses from the sale and holdings of foreign currencies; (2) gains and losses between trade date and settlement date on investment securities transactions and forward foreign currency exchange contracts; and (3) gains and losses from the difference between amounts of interest and dividends recorded and the amounts actually received.
In addition, the Funds do not isolate the net realized and unrealized gain or loss resulting from changes in exchange rates from the fluctuations resulting from changes in market prices of securities held. Such fluctuations are included with the net realized and unrealized gain or loss on investments.
(2) Agreements and Transactions with Affiliates
The Trust has entered into an Investment Management Agreement under which the Investment Manager provides or oversees investment management services to the Funds. (Prior to January 15, 2005, the former Fremont Funds had a similar Investment Management Agreement with FIA). The Investment Manager selects subadvisors for each Fund (subject to Trustee approval), allocates assets among subadvisors and monitors the subadvisors’ investment programs and results. Each Fund’s investment portfolio is managed by portfolio managers who serve pursuant to Subadvisory Agreements with the Investment Manager.
Investment management fees are paid directly by each Fund to the Investment Manager based on average daily net assets. The annual investment management fee rates, as a percentage of average daily net assets for the fiscal year ended October 31, 2005, were as follows:
| | | |
Fund
| | Investment
Management Fee
| |
Fremont Global | | 0.60 | % |
International Growth | | 1.00 | % |
Structured Core | | 0.35 | % |
Small Cap | | 1.00 | % |
Real Estate Securities | | 0.85 | % |
California Intermediate Tax-Free | | | |
on first $25 million | | 0.40 | % |
on next $25 million | | 0.35 | % |
on next $50 million | | 0.30 | % |
on next $50 million | | 0.25 | % |
on balance over $150 million | | 0.20 | % |
Fremont Money Market | | | |
on first $50 million | | 0.30 | % |
on balance over $50 million | | 0.20 | % |
The Trust has entered into an Administration and Shareholder Servicing Agreement under which Managers Investment Group LLC serves as each Fund’s administrator (the “Administrator”) and is responsible for all aspects of managing the Funds’ operations, including administration and shareholder services to each Fund, its shareholders, and certain institutions, such as bank trust departments, broker-dealers and registered investment advisers, that advise or act as an intermediary with the Funds’ shareholders. For its services, the Administrator is paid a fee at a rate of 0.25% of average net assets per annum, except for Fremont Money Market Fund for which it is paid a fee of 0.15% per annum. Prior to January 15, 2005, the former Fremont Funds had a similar administration agreement with FIA at an annual rate of 0.20% per annum, except for Fremont Money Market Fund for which it paid a fee to FIA of 0.15% per annum.
56
Notes to Financial Statements (continued)
Prior to July 1, 2005, the aggregate annual retainer paid to each Independent Trustee for all Trusts in the Fund family was $52,000, plus $2,000 for each meeting attended. Effective July 1, 2005, the aggregate annual retainer paid to each Independent Trustee is $55,000, plus $4,000 for each meeting attended. The Trustees’ fees and expenses are allocated amongst all of the Funds for which Managers Investment Group LLC serves as the Investment Manager (the “Managers Funds”) based on the relative net assets of such Funds. The Trust has an additional Independent Trustee who is paid an annual retainer of $30,000 plus $4,000 for each meeting attended. The fee is allocated amongst the Funds in the Trust based on the relative net assets of each Fund. The Independent Chairman of the Trust receives an additional payment of $10,000 per year. (Prior to July 1, 2005, the Independent Chairman was paid an additional $5,000 per year). Effective July 1, 2005, the Chairman of the Audit Committee receives an additional $2,000 per year. The “Trustee fees and expenses” shown in the financial statements represents the Fund’s allocated portion of the total fees and expenses paid by the Fund and other affiliated funds in the Managers Funds complex since January 15, 2005 and the amount paid from the former Fremont Funds from November 1, 2004 through January 14, 2005 to the Trustees of the Fremont Mutual Funds, Inc.
The Funds are distributed by Managers Distributors, Inc. (the “Distributor”), a wholly-owned subsidiary of Managers Investment Group LLC. Certain Trustees and Officers of the Funds are Officers and/or Directors of the Investment Manager, AMG and/or the Distributor. The Distributor serves as the principal underwriter for each Fund. The Distributor is a registered broker-dealer and member of the National Association of Securities Dealers, Inc. Shares of each Fund will be continuously offered and will be sold by brokers, dealers or other financial intermediaries who have executed selling agreements with the Distributor. The Distributor bears all the expenses of providing services pursuant to an Underwriting Agreement, including the payment of the expenses relating to the distribution of Prospectuses for sales purposes and any advertising or sales literature. (Prior to January 15, 2005, the former Fremont Funds had a similar distribution agreement with Quasar Distributors, LLC).
(3) Purchases and Sales of Securities
Purchases and sales of securities, excluding short-term securities, for the fiscal year ended October 31, 2005, were as follows:
| | | | | | | | | | | | |
| | | Long-Term Securities
| | U.S. Government Securities
|
Fund
| | Purchases
| | Sales
| | Purchases
| | Sales
|
Fremont Global | | $ | 197,539,502 | | $ | 251,012,819 | | $ | 24,340,385 | | $ | 32,641,162 |
International Growth | | | 93,660,295 | | | 111,896,921 | | | N/A | | | N/A |
Structured Core | | | 77,189,735 | | | 73,803,997 | | | N/A | | | N/A |
Small Cap | | | 42,871,036 | | | 40,596,868 | | | N/A | | | N/A |
Real Estate Securities | | | 18,800,858 | | | 24,688,958 | | | N/A | | | N/A |
California Intermediate Tax-Free | | | 13,160,550 | | | 14,207,611 | | | N/A | | | N/A |
(4) Portfolio Securities Loaned
The Funds may participate in a securities lending program offered by BNY providing for the lending of equities, corporate bonds and government securities to qualified brokers. Collateral on all securities loaned is accepted in cash and/or government securities. Collateral is maintained at a minimum level of 102% of the market value, plus interest, if applicable, of investments on loan. Collateral received in the form of cash is invested temporarily in institutional money market funds or other short-term investments by BNY. Earnings (after any rebate) of such temporary cash investments are divided between BNY, as a fee for its services under the program, and the Fund loaning the security, according to agreed-upon rates.
(5) Commitments and Contingencies
In the normal course of business, the Funds may enter into contracts and agreements that contain a variety of representations and warranties, which provide general indemnifications. The maximum exposure to the Funds under these arrangements is unknown, as this would involve future claims that may be against the Funds that have not yet occurred. However, based on experience, the Funds expect the risks of loss to be remote.
(6) Forward Commitments
Certain transactions, such as futures and forward transactions, dollar roll agreements, or purchases of when-issued or delayed delivery securities may have a similar effect on a Fund’s net asset value as if the Fund had created a degree of leverage in its portfolio. However, if a Fund enters into such a transaction, the Fund will establish a segregated account with its custodian in which it will maintain cash, U.S. government securities or other liquid securities equal in value to its obligations in respect to such transaction. Securities and other assets held in the segregated account may not be sold while the transaction is outstanding, unless other suitable assets are substituted.
(7) Forward Foreign Currency Contracts
During the fiscal year ended October 31, 2005, Fremont Global and International Growth invested in forward foreign currency exchange contracts to manage currency exposure. These investments may involve greater market risk than the amounts disclosed in the Funds’ financial statements.
57
Notes to Financial Statements (continued)
A forward foreign currency exchange contract is an agreement between a Fund and another party to buy or sell a currency at a set price at a future date. The market value of the contract will fluctuate with changes in currency exchange rates. The contract is marked-to-market daily, and the change in market value is recorded as an unrealized gain or loss. Gain or loss on the purchase or sale of contracts having the same settlement date, amount and counter party is realized on the date of offset, otherwise gain or loss is realized on settlement date.
Fremont Global and International Growth may invest in non-U.S. dollar denominated instruments subject to limitations, and enter into forward foreign currency exchange contracts to facilitate transactions in foreign securities and to protect against a possible loss resulting from an adverse change in the relationship between the U.S. dollar and such foreign currency. Risks may arise upon entering into these contracts from the potential inability of counterparties to meet the terms of their contracts and from unanticipated movements in the value of a foreign currency relative to the U.S. dollar.
Open forward foreign currency exchange contracts (in U.S. Dollars) at October 31, 2005 were as follows:
| | | | | | | | | | | | | | | | |
Foreign Currency
| | | | Settlement
Date
| | Current Value
(Receivable
Amount)
| | | Contract Value
(Payable
Amount)
| | | Unrealized
Gain/Loss
| |
Fremont Global | | | | | | | | | | | | | | | | |
Canadian Dollar | | Short | | 11/17/05 | | $ | (1,494,061 | ) | | $ | (1,514,881 | ) | | $ | (20,820 | ) |
Euro | | Short | | 11/17/05 | | | (22,122,415 | ) | | | (21,403,302 | ) | | | 719,113 | |
Euro | | Long | | 11/03/05 | | | 92,903 | | | | 92,340 | | | | (563 | ) |
Pound Sterling | | Short | | 11/17/05 | | | (4,509,000 | ) | | | (4,424,764 | ) | | | 84,236 | |
Pound Sterling | | Long | | 11/02/05 | | | 96,499 | | | | 95,774 | | | | (725 | ) |
Hong Kong Dollar | | Short | | 11/01/05 | | | (8,140 | ) | | | (8,142 | ) | | | (2 | ) |
Japanese Yen | | Long | | 11/01/05 | | | 6,805 | | | | 6,739 | | | | (66 | ) |
Norwegian Krone | | Short | | 11/17/05 | | | (2,338,270 | ) | | | (2,309,448 | ) | | | 28,822 | |
Singapore Dollar | | Short | | 11/17/05 | | | (1,029,679 | ) | | | (1,003,295 | ) | | | 26,384 | |
| | | | | | |
|
|
| |
|
|
| |
|
|
|
Total | | | | | | $ | (31,305,358 | ) | | $ | (30,468,979 | ) | | $ | 836,379 | |
| | | | | | |
|
|
| |
|
|
| |
|
|
|
International Growth | | | | | | | | | | | | | | | | |
Canadian Dollar | | Short | | 11/01/05 | | $ | (284,135 | ) | | $ | (283,243 | ) | | $ | 892 | |
Canadian Dollar | | Long | | 11/01/05 | | | 142,067 | | | | 141,263 | | | | (804 | ) |
Euro | | Short | | 11/01/05 | | | (123,572 | ) | | | (121,892 | ) | | | 1,680 | |
Euro | | Long | | 11/03/05 | | | 181,299 | | | | 180,192 | | | | (1,107 | ) |
Pound Sterling | | Long | | 11/02/05 | | | 187,170 | | | | 185,765 | | | | (1,405 | ) |
Hong Kong Dollar | | Short | | 11/01/05 | | | (22,792 | ) | | | (22,797 | ) | | | (5 | ) |
Japanese Yen | | Long | | 11/01/05 | | | 13,609 | | | | 13,478 | | | | (131 | ) |
| | | | | | |
|
|
| |
|
|
| |
|
|
|
Total | | | | | | $ | 93,646 | | | $ | 92,766 | | | $ | (880 | ) |
| | | | | | |
|
|
| |
|
|
| |
|
|
|
(8) Futures Contracts Held or Issued for Purposes other than Trading
Fremont Global and Structured Core use Equity Index futures contracts to a limited extent, with the objective of maintaining exposure to equity stock markets while maintaining liquidity. The Fund may purchase or sell futures contracts to achieve a desired level of investment, whether to accommodate portfolio turnover or cash flows from capital shares transactions. There are certain risks associated with futures contracts. Prices may not move as expected or a Fund may not be able to close out the contract when it desires to do so, resulting in losses.
Futures are valued at their quoted daily settlement prices. The aggregate principal amounts of the contracts are not recorded in the financial statements. Fluctuations in the value of the contracts are recorded in the Statement of Assets and Liabilities as an asset (liability) and in the Statement of Operations as unrealized appreciation (depreciation) until the contracts are closed, when they are recorded as realized gains (losses) on futures or forward currency contracts. Structured Core had the following open futures contract as of October 31, 2005: S&P 500 Index Future, one contract, expiring December 2005 with an unrealized loss of $7,125.
(9) Line of Credit
Prior to January 15, 2005 the former Fremont Funds had a Line of Credit Arrangement (“LOC”) with State Street Bank and Trust Company (“SSB”). Under the terms of the LOC, each former Fremont Fund’s borrowings could not exceed 20% of each
58
Notes to Financial Statements (continued)
Fund’s net assets and the combined borrowings of all the former Fremont Funds could not exceed the $40 million cap on the total line of credit. The interest rate paid on the LOC equaled SSB’s overnight federal funds rate as determined on each day at 11:00 a.m. Boston time plus 0.50% per annum. The former Fremont Funds paid a commitment fee of 0.09% of the unused balance of the LOC and the former Fremont Fund’s portion for the period November 1, 2004 through January 14, 2005 was $639, $141, $197, $168, $76, $128, and $1,373, for the Fremont Global Fund, Fremont International Growth Fund, Fremont Structured Core Fund, Fremont U.S. Small Cap Fund, Fremont Real Estate Securities Fund, Fremont California Intermediate Tax-Free Fund, and Fremont Money Market Fund, respectively. The LOC was terminated at the close of business on January 14, 2005.
Tax Information (unaudited)
The Funds hereby designate the maximum amounts allowable of their net taxable income as qualified dividends as provided in the Jobs and Growth Tax Relief Reconciliation Act of 2003. The 2005 Form 1099-DIV you receive for each Fund, will show the tax status of all distributions paid to you during the year.
Pursuant to section 852 of the Internal Revenue Code, Fremont Global, International Growth, Structured Core, Small Cap, Real Estate Securities, California Intermediate Tax-Free, and Fremont Money Market designate $0, $0, $2,816,924, $0, $2,682,959, $706,368, and $0, respectively, as long-term capital gain for the taxable year ended October 31, 2005.
59
THIS PAGE INTENTIONALLY LEFT BLANK
60
Report of Independent Registered Public Accounting Firm
To the Board of Trustees of Managers Trust I and the Shareholders of Managers Fremont Global Fund, Managers International Growth Fund, Managers Structured Core Fund, Managers Small Cap Fund, Managers Real Estate Securities Fund, Managers California Intermediate Tax-Free Fund, and Fremont Money Market Fund:
In our opinion, the accompanying statements of assets and liabilities, including the schedules of portfolio investments, and the related statements of operations and of changes in net assets and the financial highlights present fairly, in all material respects, the financial positions of Managers Fremont Global Fund (formerly Fremont Global Fund), Managers International Growth Fund (formerly Fremont International Growth Fund), Managers Structured Core Fund (formerly Fremont Structured Core Fund), Managers Small Cap Fund (formerly Fremont U.S. Small Cap Fund), Managers Real Estate Securities Fund (formerly Fremont Real Estate Securities Fund), Managers California Intermediate Tax-Free Fund (formerly Fremont California Intermediate Tax-Free Fund), and Fremont Money Market Fund (seven of the series constituting Trust I, hereafter referred to as the “Funds”), at October 31, 2005, and the results of each of their operations, the changes in each of their net assets and the financial highlights for the periods indicated, in conformity with accounting principles generally accepted in the United States of America. These financial statements and financial highlights (hereafter referred to as “financial statements”) are the responsibility of the Funds’ management; our responsibility is to express an opinion on these financial statements based on our audits. We conducted our audits of these financial statements in accordance with the standards of the Public Company Accounting Oversight Board (United States). Those standards require that we plan and perform the audit to obtain reasonable assurance about whether the financial statements are free of material misstatement. An audit includes examining, on a test basis, evidence supporting the amounts and disclosures in the financial statements, assessing the accounting principles used and significant estimates made by management, and evaluating the overall financial statement presentation. We believe that our audits, which included confirmation of securities at October 31, 2005 by correspondence with the custodian and brokers, provide a reasonable basis for our opinion.
PricewaterhouseCoopers LLP
Boston, Massachusetts
December 23, 2005
61
THIS PAGE INTENTIONALLY LEFT BLANK
62
Trustees and Officers
The Trustees and Officers of the Trust, their business addresses, principal occupations for the past five years and dates of birth are listed below. The Trustees provide broad supervision over the affairs of the Trust and the Fund. The Trustees are experienced executives who meet periodically throughout the year to oversee the Fund’s activities, review contractual arrangements with companies that provide services to the Fund, and review the Fund’s performance. Unless otherwise noted, the address of each Trustee or Officer is the address of the Trust: 800 Connecticut Avenue, Norwalk, Connecticut 06854.
There is no stated term of office for Trustees. Trustees serve until their resignation, retirement or removal in accordance with the Trust’s organizational documents and policies adopted by the Board from time to time. The President, Treasurer and Secretary hold office until a successor has been duly elected and qualified. Other officers serve at the pleasure of the Trustees.
Independent Trustees
The following Trustees are not “interested persons” of the Trust within the meaning of the 1940 Act:
| | |
Name, Date of Birth, Number of Funds Overseen in Fund Complex*
| | Principal Occupation(s) During Past 5 Years and Other Directorships Held by Trustee
|
| |
Jack W. Aber, 9/9/37 • Trustee since 2000 • Oversees 36 Funds in Fund Complex | | Professor of Finance, Boston University School of Management (1972- Present); Trustee of Appleton Growth Fund (1 portfolio); Trustee of Third Avenue Trust (4 portfolios); Trustee of Third Avenue Variable Trust (1 portfolio) |
| |
| |
| | |
| |
William E. Chapman, II, 9/23/41 • Independent Chairman • Trustee since 2000 • Oversees 36 Funds in Fund Complex | | President and Owner, Longboat Retirement Planning Solutions (1998- Present); Hewitt Associates, LLC (part time) (provider of Retirement and Investment Education Seminars); Interim Executive Vice President, QuadraMed Corporation (2001); President, Retirement Plans Group, Kemper Funds (1990-1998); Trustee of Bowdoin College (2002-Present); Trustee of Third Avenue Trust (4 portfolios); Trustee of Third Avenue Variable Trust (1 portfolio) |
| |
| |
| |
| | |
| |
Edward J. Kaier, 9/23/45 • Trustee since 2000 • Oversees 36 Funds in Fund Complex | | Attorney at Law and Partner, Hepburn Willcox Hamilton & Putnam, LLP (1977-Present); Trustee of Third Avenue Trust (4 portfolios); Trustee of Third Avenue Variable Trust (1 portfolio) |
| |
| |
| |
Richard E. Holmes, 5/14/43 • Trustee since 2005 • Oversees 11 Funds in Fund Complex | | Vice President and Director, BelMar Advisors, Inc. (1998-Present); Executive Director-Investment Management, Pacific Telesis Group (1983-1987); Managers Trust and Thrift Investments, Bechtel Power Corp. (1980-1983); Independent Director, Fremont Mutual Funds, Inc. (1988-2005) |
| |
| |
| | |
| |
Steven J. Paggioli, 4/3/50 • Trustee since 2000 • Oversees 36 Funds in Fund Complex | | Consultant (2001-Present); Formerly Executive Vice President and Director, The Wadsworth Group (1986-2001); Executive Vice President, Secretary and Director, Investment Company Administration, LLC (1990-2001); Vice President, Secretary and Director, First Fund Distributors, Inc. (1991-2001); Trustee, Professionally Managed Portfolios (21 portfolios); Advisory Board Member, Sustainable Growth Advisors, LP; Director, Guardian Mutual Funds (28 portfolios) |
| |
| |
| | |
| |
Eric Rakowski, 6/5/58 • Trustee since 2000 • Oversees 36 Funds in Fund Complex | | Professor, University of California at Berkeley School of Law (1990- Present); Visiting Professor, Harvard Law School (1998-1999); Trustee of Third Avenue Trust (4 portfolios); Trustee of Third Avenue Variable Trust (1 portfolio) |
| |
| |
| | |
| |
Thomas R. Schneeweis, 5/10/47 • Trustee since 2000 • Oversees 36 Funds in Fund Complex | | Professor of Finance, University of Massachusetts (1985-Present); Director, CISDM at the University of Massachusetts, (1996-Present); President, Alternative Investment Analytics, LLC, (formerly Schneeweis Partners, LLC) (2001- Present); Director of Research, Lyra/Starview Capital LLC, (2004-Present); Partner, Northampton Capital, LLC; Partner, Schneeweis Advisors and Massachusetts Finance Institute (both wholly owned subsidiaries of Alternative Investment Analytics). No other directorships held by Trustee. |
| |
| |
| | |
| * | The Fund Complex consists of Managers AMG Funds, The Managers Funds, Managers Trust I and Managers Trust II. |
63
Trustees and Officers (continued)
Interested Trustees
The following Trustees are “interested persons” of the Trust within the meaning of the 1940 Act. Mr. Lebovitz is an interested person of the Trust within the meaning of the 1940 Act by virtue of his positions with Managers Investment Group LLC and Managers Distributors, Inc. Mr. Nutt is an interested person of the Trust within the meaning of the 1940 Act by virtue of his positions with, and interest in securities of, Affiliated Managers Group, Inc.
| | |
Name, Date of Birth, Number of Funds Overseen in Fund Complex*
| | Principal Occupation(s) During Past 5 Years and Other Directorships Held by Trustee
|
| |
Peter M. Lebovitz, 1/18/55 • Trustee since 2002 • President since 2000 • Oversees 36 Funds in Fund Complex | | Managing Partner, Managers Investment Group LLC (2005-Present); President and Chief Executive Officer, The Managers Funds LLC (1999-2004); President, Managers Distributors, Inc. (2000-Present); President, The Managers Funds (1999-Present); President, Managers AMG Funds (1999-Present); President, Managers Trust II (2000-Present); Director of Marketing, The Managers Funds, LP (1994-1999); Director of Marketing, Hyperion Capital Management, Inc. (1993-1994); Senior Vice President, Greenwich Asset Management, Inc. (1989-1993); No other directorships held by trustee. |
| |
| |
| |
| |
William J. Nutt, 3/30/45 • Trustee since 2005 • Oversees 36 Funds in Fund Complex | | Chairman and Founder of Affiliated Managers Group, Inc., (1993- Present); Chief Executive Officer of Affiliated Managers Group, Inc. (1993-2004); Director, Affiliated Managers Group, Inc. (1993-Present); President of Affiliated Managers Group, Inc. (1993-1999); President and Chief Operating Officer, The Boston Company (1989-1993); Senior Executive Vice President, The Boston Company (1982-1989) |
| |
| |
| | |
|
* The Fund Complex consists of Managers AMG Funds, The Managers Funds, Managers Trust I and Managers Trust II. |
| |
| Officers | | |
| |
Name, Date of Birth, Position(s) Held with Fund and Length of Time Served
| | Principal Occupation(s) During Past 5 Years
|
| |
Bruce M. Aronow, 5/31/65 • Chief Financial Officer since 2005 | | Managing Partner, Managers Investment Group LLC (2005-Present); Executive Vice President and Chief Financial Officer and Principal, Rorer Asset Management (1999-2004); Chief Operating Officer, Rorer Asset Management (2001-2004); Staff Accountant, Manager and Partner, PricewaterhouseCoopers LLP (1987-1998) |
| |
| | |
| |
Christine C. Carsman, 4/2/52 • Secretary since 2004 | | Vice President and Chief Regulatory Counsel, Affiliated Managers Group, Inc. (2004-Present); Secretary, The Managers Funds, Managers AMG Funds and Managers Trust II (2004-Present); Senior Counsel, Vice President and Director of Operational Risk Management and Compliance, Wellington Management Company, LLP (1995-2004); Deputy General Counsel, The Boston Company, Inc. (1993-1995); Associate General Counsel, The Boston Company Advisors, Inc. (1991-1993); Associate, Sullivan & Worcester LLP (1987-1991) |
| |
| | |
| |
Donald S. Rumery, 5/29/58 • Treasurer since 2000 | | Senior Vice-President, Managers Investment Group LLC (2005-Present); Director, Finance and Planning, The Managers Funds LLC, (1994-2004); Treasurer and Chief Financial Officer, Managers Distributors, Inc. (2000-Present); Treasurer, The Managers Funds (1995-Present); Treasurer, Managers AMG Funds (1999-Present); Treasurer, Managers Trust II (2000-Present); Secretary, Managers Trust I and Managers Trust II (2000-2004) and Secretary, The Managers Funds (1997-2004) |
| |
| | |
64
THIS PAGE INTENTIONALLY LEFT BLANK
THIS PAGE INTENTIONALLY LEFT BLANK
Investment Manager and Administrator
Managers Investment Group LLC
800 Connecticut Avenue
Norwalk, Connecticut 06854
(203) 299-3500 or (800) 835-3879
Distributor
Managers Distributors, Inc.
800 Connecticut Avenue
Norwalk, Connecticut 06854
(203) 299-3500 or (800) 835-3879
Custodian
The Bank of New York
2 Hanson Place, 7th Floor
Brooklyn, New York 11217
Legal Counsel
Ropes & Gray LLP
One International Place
Boston, Massachusetts 02110-2624
Transfer Agent
PFPC, Inc.
Attn: Managers
P.O. Box 9769
Providence, Rhode Island 02940
(800) 358-7668
MANAGERSAND MANAGERS AMG EQUITY FUNDS
CAPITAL APPRECIATION
Bramwell Capital Management, Inc.
Essex Investment Management Co., LLC
EMERGING MARKETS EQUITY
Rexiter Capital Management Limited
ESSEX AGGRESSIVE GROWTH
ESSEX LARGE CAP GROWTH
ESSEX SMALL/MICRO CAP GROWTH
Essex Investment Management Co., LLC
FIRST QUADRANT TAX-MANAGED EQUITY
First Quadrant, L.P.
INSTITUTIONAL MICRO-CAP
Kern Capital Management LLC
INTERNATIONAL EQUITY
Bernstein Investment Research and Management
Lazard Asset Management, LLC
Wellington Management Company, LLP
INTERNATIONAL GROWTH
Wellington Management Company, LLP
MICRO-CAP
Kern Capital Management LLC
MID-CAP
Chicago Equity Partners, LLC
REAL ESTATE SECURITIES
Urdang Securities Management, Inc.
RENAISSANCE LARGE-CAP EQUITY
Renaissance Investment Management
RORER MID-CAP
RORER LARGE-CAP
Rorer Asset Management, LLC
SMALL CAP
TimesSquare Capital Management, LLC
SMALL COMPANY
Kalmar Investment Advisers, Inc.
SPECIAL EQUITY
Donald Smith & Co., Inc.
Kern Capital Management LLC
Skyline Asset Management, L.P.
Veredus Asset Management LLC
Westport Asset Management, Inc.
STRUCTURED CORE
First Quadrant, L.P.
SYSTEMATIC VALUE
Systematic Financial Management, L.P.
TIMESSQUARE MID CAP GROWTH
TIMESSQUARE SMALL CAP GROWTH
TimesSquare Capital Management, LLC
VALUE
Armstrong Shaw Associates Inc.
Osprey Partners Investment Mgmt., LLC
20
Oak Associates, Ltd.
MANAGERS BALANCED FUNDS
BALANCED
Chicago Equity Partners, LLC
Loomis, Sayles & Company L.P.
GLOBAL
333 Global Advisers*
Armstrong Shaw Associates Inc.
Bernstein Investment Research and Management
First Quadrant, L.P.
Kern Capital Management LLC
Northstar Capital Management, Inc.
Wellington Management Company, LLP
MANAGERS FIXED INCOME FUNDS
BOND (MANAGERS)
Loomis, Sayles & Company L.P.
BOND (MANAGERS FREMONT)
Pacific Investment Management Co. LLC
CALIFORNIA INTERMEDIATE TAX-FREE
Evergreen Investment Management Company, LLC
FIXED INCOME
Loomis, Sayles & Company L.P.
GLOBAL BOND
Loomis, Sayles & Company L.P.
HIGH YIELD
J.P. Morgan Investment Management Inc.
INTERMEDIATE DURATION GOVERNMENT
Smith Breeden Associates, Inc.
MONEY MARKET (MANAGERS)
J.P. Morgan Investment Advisors Inc.
MONEY MARKET (FREMONT)
333 Global Advisers*
| * | A division of Managers Investment Group LLC |
This report is prepared for the Funds’ shareholders. It is authorized for distribution to prospective investors only when preceded or accompanied by an effective prospectus. To receive a free copy of the prospectus or Statement of Additional Information, which includes additional information about Fund Trustees, please contact us by calling 1-800.835.3879. Distributed by Managers Distributors, Inc., member NASD.
A description of the policies and procedures each Fund uses to vote its proxies is available: (i) without charge, upon request, by calling 1-800.835.3879, or (ii) on the Securities and Exchange Commission’s (SEC) Web site at www.sec.gov. For information regarding each Fund’s proxy voting record for the 12-month period ended June 30, call 1-800.835.3879 or visit the SEC Web site at www.sec.gov.
The Funds file their complete schedule of portfolio holdings with the SEC for the first and third quarters of each fiscal year on Form N-Q. The Funds’ Forms N-Q are available on the SEC’s website at www.sec.gov. A Funds’ Forms N-Q may be reviewed and copied at the SEC’s Public Reference Room in Washington, DC. Information on the operation of the Public Reference Room may be obtained by calling 1-800.SEC.0330. To review a complete list of the Funds’ portfolio holdings, or to view the most recent quarterly holdings report, semiannual report, or annual report, please visit www.managersinvest.com.
AR010d-1005
| | |
| www.managersinvest.com | | |
Registrant has adopted a Code of Ethics. See attached Exhibit (a)(1).
| Item 3. | AUDIT COMMITTEE FINANCIAL EXPERT |
Registrant’s Board of Trustees has determined that independent Trustees Mr. Jack W. Aber and Steven J. Paggioli each qualify as the Audit Committee Financial Expert. Mr. Aber and Mr. Paggioli are “independent” as such term is defined in Form N-CSR.
| Item 4. | PRINCIPAL ACCOUNTANT FEES AND SERVICES |
The aggregate fees billed by PwC to the Funds for the Funds’ two most recent fiscal years for professional services rendered for audits of annual financial statements, or services that are normally provided in connection with statutory and regulatory filings or engagements (“Audit Fees”) were as follows:
| | | | | |
| | | Fiscal 2005
| | Fiscal 2004 A
|
Managers Fremont Global Fund | | $ | 27,000 | | n/a |
Managers International Growth Fund | | $ | 26,400 | | n/a |
Managers Structured Core Fund | | $ | 15,600 | | n/a |
Managers Small Cap Fund | | $ | 17,000 | | n/a |
Managers Fremont Micro-Cap Fund | | $ | 14,400 | | n/a |
Managers Fremont Institutional Micro-Cap Fund | | $ | 14,000 | | n/a |
Managers Real Estate Securities Fund | | $ | 17,900 | | n/a |
Managers Fremont Bond Fund | | $ | 37,975 | | n/a |
Managers California Intermediate Tax-Free Fund | | $ | 18,700 | | n/a |
Fremont Money Market Fund | | $ | 14,000 | | n/a |
| A | All Funds were reorganized into Managers Trust I on January 14, 2005. |
Audit-Related Fees
There were no fees billed by PwC to the Funds in its two recent fiscal years for services rendered for assurance and related services that are reasonably related to the performance of the audit or review of the Funds’ financial statements, but are not reported as Audit Fees (“Audit-Related Fees”).
For the Funds’ two most recent fiscal years, there were no Audit-Related Fees billed by PwC for engagements related directly to the operations and financial reporting of one or more Funds by a Fund Service Provider. A Fund Service Provider is (a) any investment adviser to the Fund (not including any Subadvisor whose role is primarily portfolio management and is subcontracted with or overseen by another investment adviser) or (b) any entity that provides ongoing services to the Fund and is controlling, controlled by or under common control with a Fund investment adviser described in (a).
Tax Fees
The aggregate fees billed by PwC to the Funds for the two most recent fiscal years for professional services rendered for tax compliance, tax advice, and tax planning (“Tax Fees”) were as follows:
| | | | | |
| | | Fiscal 2005
| | Fiscal 2004 A
|
Managers Fremont Global Fund | | $ | 4,600 | | n/a |
Managers International Growth Fund | | $ | 4,100 | | n/a |
Managers Structured Core Fund | | $ | 4,100 | | n/a |
Managers Small Cap Fund | | $ | 4,100 | | n/a |
Managers Fremont Micro-Cap Fund | | $ | 4,100 | | n/a |
Managers Fremont Institutional Micro-Cap Fund | | $ | 4,100 | | n/a |
Managers Real Estate Securities Fund | | $ | 5,000 | | n/a |
Managers Fremont Bond Fund | | $ | 5,300 | | n/a |
Managers California Intermediate Tax-Free Fund | | $ | 4,500 | | n/a |
Fremont Money Market Fund | | $ | 3,300 | | n/a |
| A | All Funds were reorganized into Managers Trust I on January 14, 2005. |
For the Funds’ two most recent fiscal years, Tax Fees billed by PwC for engagements by Fund Service Providers that related directly to the operations and financial reporting of the Funds were $0 for fiscal 2005.
The services for which Tax Fees were charged comprise all services performed by professional staff in PwC’s tax division except those services related to the audit. Typically, this category would include fees for tax compliance, tax planning, and tax advice. Tax compliance, tax advice, and tax planning services include preparation of original and amended tax returns, claims for refund and tax payment-planning services, assistance with tax audits and appeals, tax advice related to mergers and acquisitions and requests for rulings or technical advice from taxing authorities.
All Other Fees
There were no other fees billed by PwC to the Funds for all other non-audit services (“Other Fees”) during the Funds’ two most recent fiscal years. During the same period, there were no Other Fees billed by PwC for engagements by Fund Service Providers that related directly to the operations and financial reporting of the Funds.
According to policies adopted by the Audit Committee, services provided by PwC to the Funds must be pre-approved by the Audit Committee. On an annual basis, the Audit Committee reviews and pre-approves various types of services that PwC may perform for the Funds without specific approval of each engagement, subject to specified budget limitations. As contemplated by the Sarbanes-Oxley Act of 2002 and related SEC rules, the Audit Committee also pre-approves non-audit services provided by PwC to any Fund Service Provider for any engagement that relates directly to the operations and financial reporting of the Funds. Any engagement that is not already pre-approved or that will
exceed a pre-approved budget must be submitted to the Audit Committee for pre-approval. The Chairman of the Audit Committee is authorized on behalf of the Board of Trustees and the Audit Committee to approve the engagement of PwC to perform non-audit services subject to certain conditions, including notification to the Audit Committee of such pre-approval not later than the next meeting of the Audit Committee following the date of such pre-approval.
There were no other fees billed by PwC for non-audit services rendered to the Funds and to Fund Service Providers for the Funds’ two most recent fiscal years.
The Audit Committee has considered whether the provision of non-audit services by PwC to Fund Service Providers that were not required to be pre-approved by the Audit Committee is compatible with maintaining PwC’s independence in its audit of the Funds, taking into account representations from PwC, in accordance with Independence Standards Board Standard No. 1, regarding its independence from the Funds and its related entities.
The following table sets forth the non-audit services provided by PwC to the Funds and its service affiliates defined as the Funds’ investment advisor and any entity controlling, controlled by or under common control with Managers Investment Group LLC that provides ongoing services to the Funds (“Control Affiliates”) for the last two fiscal years.
| | | | | | | | | | | | | | | | | | |
| | | Audit-related fees A
| | Tax fees A
| | All other fees A
|
| | | 2004
| | 2003
| | 2004
| | 2003
| | 2004
| | 2003
|
Control Affiliates | | $ | 155,040 | | $ | 0 | | $ | 260,600 | | $ | 16,350 | | $ | 0 | | $ | 0 |
| A | Aggregate amounts may reflect rounding. |
| Item 5. | AUDIT COMMITTEE OF LISTED REGISTRANTS |
Not applicable.
| Item 6. | SCHEDULE OF INVESTMENTS |
Not applicable.
| Item 7. | DISCLOSURE OF PROXY VOTING POLICIES AND PROCEDURES FOR CLOSED-END MANAGEMENT INVESTMENT COMPANIES |
Not applicable.
| Item 8. | PORTFOLIO MANAGERS OF CLOSED-END MANAGEMENT INVESTMENT COMPANIES |
Not applicable.
| Item 9. | PURCHASES OF EQUITY SECURITIES BY CLOSED-END MANAGEMENT INVESTMENT COMPANIES AND AFFILIATED PURCHASERS |
Not applicable.
| Item 10. | SUBMISSION OF MATTERS TO A VOTE OF SECURITY HOLDERS |
Not applicable.
| Item 11. | CONTROLS AND PROCEDURES |
(a) The Registrant’s principal executive and principal financial officers have concluded, based on their evaluation of the registrant’s disclosure controls and procedures as of a date within 90 days of the filing of this report, that the Registrant’s disclosure controls and procedures are reasonably designed to ensure that information required to be disclosed by the Registrant on Form N-CSR is recorded, processed, summarized and reported within the required time periods and that information required to be disclosed by the registrant in the reports that it files or submits on Form N-CSR is accumulated and communicated to the Registrant’s management, including its principal executive and principal financial officers, as appropriate to allow timely decisions regarding required disclosure.
(b) There were no changes in the Registrant’s internal control over financial reporting during the Registrant’s fourth fiscal quarter of the period covered by this report that have materially affected, or are reasonably likely to affect, the internal control over financial reporting.
| | |
| (a)(1) | | Any Code of Ethics or amendments hereto. Filed herewith. |
| |
| (a)(2) | | Certifications pursuant to Rule 30a-2(a) under the Investment Company Act of 1940 - Filed herewith. |
| |
| (a)(3) | | Not applicable. |
| |
| (b) | | Certifications pursuant to Rule 30a-2(b) under the Investment Company Act of 1940 - Filed herewith. |
SIGNATURES
Pursuant to the requirements of the Securities Exchange Act of 1934 and the Investment Company Act of 1940, the registrant has duly caused this report to be signed on its behalf by the undersigned, thereunto duly authorized.
| | |
| MANAGERS TRUST I |
| |
| By: | | /s/ PETER M. LEBOVITZ |
| | | Peter M. Lebovitz, President |
Date: January 3, 2006
Pursuant to the requirements of the Securities Exchange Act of 1934 and the Investment Company Act of 1940, this report has been signed below by the following persons on behalf of the registrant and in the capacities and on the dates indicated.
| | |
| |
| By: | | /s/ PETER M. LEBOVITZ |
| | | Peter M. Lebovitz, President |
Date: January 3, 2006
| | |
| |
| By: | | /s/ BRUCE M. ARONOW |
| | | Bruce M. Aronow, Chief Financial Officer |
Date: January 3, 2006