UNITED STATES
SECURITIES AND EXCHANGE COMMISSION
Washington, D.C. 20549
FORM N-CSR
CERTIFIED SHAREHOLDER REPORT OF
REGISTERED
MANAGEMENT INVESTMENT COMPANIES
Investment Company Act file number 811-06520
MANAGERS TRUST I
|
| (Exact name of registrant as specified in charter) |
| | |
| 800 Connecticut Avenue, Norwalk, Connecticut 06854 |
| (Address of principal executive offices) (Zip code) |
Managers Investment Group LLC
800 Connecticut Avenue, Norwalk, Connecticut 06854
|
| (Name and address of agent for service) |
Registrant’s telephone number, including area code: (203) 299-3500
Date of fiscal year end: OCTOBER 31
Date of reporting period: NOVEMBER 1, 2006 – OCTOBER 31, 2007
(Annual Shareholder Report)
| Item 1. | Reports to Shareholders |
ANNUAL REPORT
Managers AMG
October 31, 2007
FQ Tax-Managed U.S. Equity Fund
FQ U.S. Equity Fund
FQ Global Alternatives Fund

Managers AMG FQ Funds
FQ Tax-Managed U.S. Equity, FQ U.S. Equity, FQ Global Alternatives
Annual Report—October 31, 2007
TABLE OF CONTENTS
| | |
| | | Page |
| |
LETTER TO SHAREHOLDERS | | 1 |
| |
ABOUT YOUR FUND’S EXPENSES | | 3 |
| |
INVESTMENT MANAGER’S COMMENTS, FUND SNAPSHOTS, | | |
AND SCHEDULES OF PORTFOLIO INVESTMENTS | | |
| |
FQ Tax-Managed U.S. Equity Fund | | 4 |
| |
FQ U.S. Equity Fund | | 9 |
| |
FQ Global Alternatives Fund | | 14 |
| |
FINANCIAL STATEMENTS: | | |
| |
Statements of Assets and Liabilities | | 16 |
| |
FQ Tax-Managed U.S. Equity and FQ U.S. Equity | | |
Fund balance sheets, net asset value (NAV) per share computation and cumulative undistributed amounts | | |
| |
Statement of Net Assets | | 17 |
| |
FQ Global Alternatives | | |
Portfolio of Investments, Fund balance sheet, net asset value (NAV) per share computation and cumulative undistributed amounts | | |
| |
Statements of Operations | | 18 |
Detail of sources of income, Fund expenses, and realized and unrealized gains (losses) during the fiscal year | | |
| |
Statements of Changes in Net Assets | | 19 |
Detail of changes in Fund assets for the past two fiscal years | | |
| |
FINANCIAL HIGHLIGHTS | | 20 |
Historical net asset values per share, distributions, total returns, expense ratios, turnover ratios and net assets | | |
| |
NOTES TO FINANCIAL STATEMENTS | | 25 |
Accounting and distribution policies, details of agreements and transactions with Fund management and affiliates, and descriptions of certain investment risks | | |
| |
REPORT OF INDEPENDENT REGISTERED PUBLIC ACCOUNTING FIRM | | 33 |
| |
TRUSTEES AND OFFICERS | | 34 |
| |
ANNUAL RENEWAL OF INVESTMENT ADVISORY AGREEMENTS | | 35 |
Nothing contained herein is to be considered an offer, sale or solicitation of an offer to buy shares of The Managers Funds or Managers AMG Funds. Such offering is made only by Prospectus, which includes details as to offering price and other material information.
Letter to Shareholders
Dear Fellow Shareholder:
Financial markets have been increasingly unsettled this past year, particularly during the summer months and currently as we write this report. While the economy has continued to grow, a liquidity crisis initiated by spreading weakness in subprime mortgage loans increased uncertainty about its sustainability. Bonds of all credit quality became unusually volatile, and credit spreads, having been extremely slim, widened dramatically, raising the cost of capital for many borrowers. Naturally the equity markets followed suit and became more volatile as the rising cost of capital pressured corporate profitability, penalized leverage, and hindered merger and acquisition activity.
As has been well documented in the financial press, the continued weakness in residential housing prices, combined with gradually rising interest rates, has put severe stress on low credit-quality (subprime) borrowers. Rising defaults pushed several mortgage lenders and leveraged subprime mortgage investors toward bankruptcy and catalyzed a swift and broad flight from various forms of investment risk over the past few months. These revelations began creating serious liquidity problems in the credit markets late in the second quarter and have been the root of uncertainty and market volatility ever since.
A rapid and at times indiscriminate flight from risk created unusual patterns of volatility within the bond market. Credit spreads widened significantly throughout July, as Moody’s and S&P downgraded hundreds of securities, and price moves forced leveraged investors to raise cash any way they could. Since much of the leverage had been funded with short-term debt, the short end of the yield curve bore the brunt of the liquidity crisis. The typically docile commercial paper market seized as demand dried up, and short-term Treasury yields vacillated between 2.9% and 4.9% as investors raced to safety, causing a dislocation in prices. Since then, prices for credits have generally recovered, as the Federal Reserve pumped liquidity into the system and investors have had time to evaluate underlying fundamentals and adjust their portfolios in a more rational manner.
After rallying strongly off of a February trough, the stock market followed the lead of the credit markets by trading sharply down during the liquidity crisis in July, then recovering from late August through October. Here, too, there were interesting anomalies in the indiscriminate flight from risk. Not surprisingly, small-and mid-cap stocks reacted more during the price declines, and underperformed large-cap stocks during the period. Interestingly, however, growth indices, which would normally react poorly to a rise in interest rates or a liquidity squeeze, significantly outperformed value indices during the period. We believe there were two primary reasons for this. One, since value indices had outperformed growth indices for an extended period of time, a typical “reversion to the mean” took place. Two, the quick reduction of leverage from the markets in general forced many quantitatively based hedge fund managers to reverse their trades in a very quick fashion. As it turned out, many of these investors used similar value-biased models to guide their purchase and sale decisions. The result was that the same stocks were being sold off not for investment reasons, but because of liquidity needs. Stocks recovered in late August and throughout October, as a result of an infusion of liquidity by the Federal Reserve, increasing visibility about where the risks were residing, and a much anticipated reduction of the Fed Funds Rate in mid-September.
Within this environment, all three of the Funds represented in this report provided positive returns for the 12-months ended October 31, 2007 (the Funds’ fiscal year end). The Managers AMG FQ U.S. Equity Fund and the Managers AMG FQ Tax-Managed U.S. Equity Fund provided strong gains, exceeded the return of their primary benchmarks, and performed well relative to their peer groups. A detailed review of the performance and positioning of each of the Funds is included within this report.
Lingering credit problems and further revelations of losses from large financial institutions are hindering not only the financial markets, but the economy as well. In our opinion, it appears this will continue for some time, pushing the economy closer to the tipping point of recession. Uncertainty about whether it will tip has driven volatility higher, as the financial markets have traded sharply higher or lower depending upon the news each day. The Federal Reserve has been accommodating, and although we think the risk of recession has increased, we still believe that portions of the U.S. and global economies remain healthy. In sum, we continue to believe that investors should maintain their portfolios with allocations near their long-run targets, rebalance if necessary and take full advantage of opportunities to participate in the growth of the global economy.
One of our foremost goals at Managers Investment Group is to structure and manage mutual funds that will help our shareholders and clients become more successful in reaching their investment goals and objectives. Each of our Funds is geared to provide you with exposure to a specific asset class, combination of
1
Letter to Shareholders (continued)
asset classes, or segment of the market. Investors tend to use our Funds as part of their overall asset allocation in order to structure a well-diversified portfolio intended to meet individual needs. Most of our Funds, like the First Quadrant Funds detailed in this report, are therefore designed to be building blocks.
The following report covers the one-year period ending October 31, 2007. Should you have any questions about this report, or if you’d like to receive a Prospectus and additional information, including fees and expenses, for this or any of the other Funds in our family, please feel free to contact us at 1-800-835-3879, or visit our website at www.managersinvest.com. As always, please read the Prospectus carefully before you invest or send money.
If you are curious about how you can better diversify your investment program, visit the Knowledge Center on our Web site and view our articles in the investment strategies section. You can rest assured that under all market conditions our team is focused on delivering excellent investment management services for your benefit.
We thank you for your continued confidence and investment in the Managers AMG Funds.
Sincerely,
| | | | |
 | | | |  |
| John H. Streur | | | | Thomas G. Hoffman, CFA |
| Senior Managing Partner | | | | Executive Vice President |
| Managers Investment Group LLC | | | | Chief Investment Officer |
| | | | Managers Investment Group LLC |
2
About Your Fund’s Expenses
As a shareholder of a Fund, you may incur two types of costs: (1) transaction costs, which may include sales charges (loads) on purchase payments; redemption fees; and exchange fees; and (2) ongoing costs, including management fees; distribution (12b-1) fees; and other Fund expenses. This example is intended to help you understand your ongoing costs (in dollars) of investing in the Fund and to compare these costs with the ongoing costs of investing in other mutual funds. The example is based on an investment of $1,000 invested at the beginning of the period and held for the entire period as indicated below.
Actual Expenses
The first line of the table to the right provides information about the actual account values and actual expenses. You may use the information in this line, together with the amount you invested, to estimate the expenses that you paid over the period. Simply divide your account value by $1,000 (for example, an $8,600 account value divided by $1,000 = 8.6), then multiply the result by the number in the first line under the heading entitled “Expenses Paid During Period” to estimate the expenses you paid on your account during this period.
Hypothetical Example for Comparison Purposes
The second line of the table to the right provides information about hypothetical account values and hypothetical expenses based on the Fund’s actual expense ratio and an assumed annual rate of return of 5% before expenses, which is not the Fund’s actual return. The hypothetical account values and expenses may not be used to estimate the actual ending account balance or expenses you paid for the period. You may use this information to compare the ongoing costs of investing in the Fund and other funds by comparing this 5% hypothetical example with the 5% hypothetical examples that appear in the shareholder reports of other funds.
Please note that the expenses shown in the table are meant to highlight your ongoing costs only and do not reflect any transactional costs, such as sales charges (loads), redemption fees, or exchange fees. Therefore, the second line of the table is useful in comparing ongoing costs only, and will not help you determine the relative total costs of owning different funds.
| | | | | | | | | | | | |
Six Months Ended October 31, 2007 | | Expense
Ratio
for the
Period | | | Beginning
Account
Value
5/1/2007 | | Ending
Account
Value
10/31/2007 | | Expenses
Paid During
the Period* |
FQ Tax-Managed U.S. Equity Fund | | | | | | | | | | | | |
Class A Shares | | | | | | | | | | | | |
Based on Actual Fund Return | | 1.24 | % | | $ | 1,000 | | $ | 1,040 | | $ | 6.38 |
Hypothetical (5% return before expenses) | | 1.24 | % | | $ | 1,000 | | $ | 1,019 | | $ | 6.31 |
Class C Shares | | | | | | | | | | | | |
Based on Actual Fund Return | | 1.99 | % | | $ | 1,000 | | $ | 1,035 | | $ | 10.21 |
Hypothetical (5% return before expenses) | | 1.99 | % | | $ | 1,000 | | $ | 1,015 | | $ | 10.11 |
Institutional Class Shares | | | | | | | | | | | | |
Based on Actual Fund Return | | 0.99 | % | | $ | 1,000 | | $ | 1,040 | | $ | 5.09 |
Hypothetical (5% return before expenses) | | 0.99 | % | | $ | 1,000 | | $ | 1,020 | | $ | 5.04 |
FQ U.S. Equity Fund | | | | | | | | | | | | |
Class A Shares | | | | | | | | | | | | |
Based on Actual Fund Return | | 1.04 | % | | $ | 1,000 | | $ | 1,029 | | $ | 5.32 |
Hypothetical (5% return before expenses) | | 1.04 | % | | $ | 1,000 | | $ | 1,020 | | $ | 5.30 |
Class C Shares | | | | | | | | | | | | |
Based on Actual Fund Return | | 1.79 | % | | $ | 1,000 | | $ | 1,025 | | $ | 9.14 |
Hypothetical (5% return before expenses) | | 1.79 | % | | $ | 1,000 | | $ | 1,016 | | $ | 9.10 |
Institutional Class Shares | | | | | | | | | | | | |
Based on Actual Fund Return | | 0.79 | % | | $ | 1,000 | | $ | 1,030 | | $ | 4.04 |
Hypothetical (5% return before expenses) | | 0.79 | % | | $ | 1,000 | | $ | 1,021 | | $ | 4.02 |
FQ Global Alternatives Fund | | | | | | | | | | | | |
Class A Shares | | | | | | | | | | | | |
Based on Actual Fund Return | | 2.50 | % | | $ | 1,000 | | $ | 975 | | $ | 12.45 |
Hypothetical (5% return before expenses) | | 2.50 | % | | $ | 1,000 | | $ | 1,013 | | $ | 12.68 |
Class C Shares | | | | | | | | | | | | |
Based on Actual Fund Return | | 3.25 | % | | $ | 1,000 | | $ | 970 | | $ | 16.14 |
Hypothetical (5% return before expenses) | | 3.25 | % | | $ | 1,000 | | $ | 1,009 | | $ | 16.46 |
| * | Expenses are equal to the Fund’s annualized expense ratio multiplied by the average account value over the period, multiplied by the number of days in the most recent fiscal half-year (184), then divided by 365. |
3
FQ Tax-Managed U.S. Equity Fund
Portfolio Manager’s Comments
The fiscal year ending October 31, 2007 was another very solid year. The Fund returned 20.68% on a pre-tax basis, while the benchmark Russell 3000® Index returned 14.53%. Please refer to the table on page 5 for returns for various classes of shares and for after-tax returns. It was another good twelve months for the market, with a significant portion of the gains occurring in the early half of 2007.
The past year continued to feature a market environment characterized by relatively strong corporate profit growth despite the overhang of the subprime mess in the mortgage markets and the subsequent credit crunch. From a style perspective, the tide finally began to turn over the past year with growth stocks handily beating their value counterparts after a long period of underperformance. Meanwhile, larger capitalization securities began to outperform their smaller capitalization counterparts, especially later in the fiscal year, as investors perceived more value in these holdings amidst the recent economic turmoil.
The Fund handily outperformed the market over this time period. The most significant driver of performance was very strong stock selection across a number of different sectors while portfolio positioning yielded relatively neutral results. From a stock selection perspective, strong performance was achieved in the consumer (both discretionary and staples), energy, materials, and utilities sectors during the past year. The top contributors to Fund performance exhibit the breadth of strong stock selection with significant results from holdings such as Tesoro (Energy, 91%), Apple (Information Technology, 58%), Kinetic Concepts Inc. (Health Care, 53%), Mirant (Utilities, 43%), and Phelps Dodge Corporation (Materials, 30%).
On a positioning basis, the move towards large capitalization stocks in the Fund was beneficial through the course of the year as was the shift away from value stocks to those stocks with more of a growth orientation. The solid performance generated by that positioning was tempered by weak relative sector positioning versus the index which included an underweight to the outperforming energy sector and an overweight to the underperforming consumer discretionary sector.
On the tax management side we continue to operate with a tax loss carry forward, and, once again, will not be delivering a capital gain distribution to our fellow shareholders for 2007. In fact we have never delivered a capital gain distribution over the entire history of the Fund, while significantly outperforming the market.
We remain worried about several things in the market. One is that the recent interest rate cuts run the risk of igniting inflationary pressure in the economy as a whole. The second is that the euphoria of the market reaction to the cuts poses its own risk. We recognize that rate cuts, particularly those that are larger than expected, have generally been a positive signal for the stock market, but rate cuts are also not a panacea. The rate cuts themselves do not solve the problems of the housing crisis, subprime crisis, and slowing economic growth. Those remain real problems facing the economy and the stock market. Given that, we continue to move toward larger capitalization stocks, in recognition of both the risks to the economy and recognizing that the larger capitalization stocks will benefit the most from the falling dollar, given their export focus. We are adding positions, and keeping positions, that serve as potential inflation hedges – commodity producers and suppliers in particular. We continue to worry about the subprime and housing crisis and continue to avoid the homebuilding and banking stocks. Although we have grown more cautious and more cognizant of the risks in the market, we remain optimistic that the market will continue to generate a solid return for investors going forward.
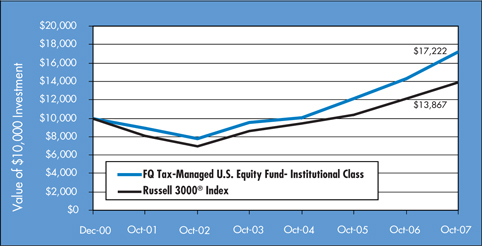
Cumulative Total Return Performance
Managers AMG FQ Tax-Managed U.S. Equity Fund’s cumulative total return is based on the daily change in net asset value (NAV), and assumes that all distributions were reinvested. The Russell 3000® Index is composed of the 3000 largest U.S. companies as measured by market capitalization, and represents about 98% of the U.S. stock market. Unlike the Fund, the Russell 3000® Index is unmanaged, is not available for investment, and does not incur expenses. The chart illustrates the performance of a hypothetical $10,000 investment made in the Institutional Class Shares of the Fund on December 18, 2000 (commencement of operations) to a $10,000 investment made in the Russell 3000® Index for the same time periods. Performance for periods longer than one year is annualized. Figures include reinvestment of capital gains and dividends. The listed returns for the Fund are net of expenses and the returns for the indices exclude expenses. Total returns for the Fund would have been lower had certain expenses not been reduced.
4
FQ Tax-Managed U.S. Equity Fund
Portfolio Manager’s Comments (continued)
Cumulative Total Return Performance
The table below shows the average annualized total returns for the Managers AMG FQ Tax- Managed U.S. Equity Fund and the Russell 3000® Index since inception through October 31, 2007.
| | | | | | | | | | | |
Average Annual Total Returns | | One Year | | | Five Years | | | Since
Inception | | | Inception
Date |
Managers AMG FQ Tax- Managed U.S. Equity Fund 1 | | | | | | | | | | | |
No Load Before Tax: | | | | | | | | | | | |
Institutional Class | | 20.68 | % | | 17.35 | % | | 8.24 | % | | 12/18/00 |
Class A* | | 20.42 | % | | | | | 16.35 | % | | 03/01/06 |
Class C* | | 19.45 | % | | | | | 15.39 | % | | 03/01/06 |
Russell 3000® Index | | 14.53 | % | | 14.83 | % | | | | | |
No Load After Tax on Distributions2 | | | | | | | | | | | |
Institutional Class | | 20.65 | % | | 17.14 | % | | 8.10 | % | | 12/18/00 |
Class A* | | 20.42 | % | | | | | 16.35 | % | | 03/01/06 |
Class C* | | 19.45 | % | | | | | 15.39 | % | | 03/01/06 |
No Load After Tax on Distributions & sale of shares2 | | | | | | | | | | | |
Institutional Class | | 13.44 | % | | 15.18 | % | | 7.11 | % | | 12/18/00 |
Class A* | | 13.27 | % | | | | | 14.00 | % | | 03/01/06 |
Class C* | | 12.64 | % | | | | | 13.17 | % | | 03/01/06 |
With Load Before Tax: | | | | | | | | | | | |
Class A* | | 13.48 | % | | | | | 12.31 | % | | 03/01/06 |
Class C* | | 18.45 | % | | | | | 15.39 | % | | 03/01/06 |
With Load After Tax on Distributions2 | | | | | | | | | | | |
Class A* | | 13.48 | % | | | | | 12.31 | % | | 03/01/06 |
Class C* | | 18.45 | % | | | | | 15.39 | % | | 03/01/06 |
With Load After Tax on Distributions & sale of shares2 | | | | | | | | | | | |
Class A* | | 8.76 | % | | | | | 10.52 | % | | 03/01/06 |
Class C* | | 11.99 | % | | | | | 13.17 | % | | 03/01/06 |
| * | Class A and Class C shares commenced operations on March 1, 2006. |
1 | Performance based on published NAV as of October 31, 2007. |
2 | After-tax returns are calculated using the historical highest individual federal marginal income tax rates and do not reflect the impact of state and local taxes. Actual after-tax returns depend on an investor’s tax situation and may differ from those shown, and after-tax returns are not relevant to investors who hold their Fund shares through tax-deferred arrangements, such as 401(k) plans or individual retirement accounts. |
The performance data shown represents past performance, which is not a guarantee of future results. Current performance may be lower or higher than the performance data quoted. The investment return and principal value of an investment in the Funds will fluctuate so that an investor’s shares, when redeemed, may be worth more or less than their original cost.
For performance information through the most recent month end please call (800) 835-3879 or visit our website at www.managersinvest.com.
In choosing a Fund, investors should carefully consider the amount they plan to invest, their investment objectives, the Fund’s investment objectives, risks, charges and expenses before investing. For this and other information, please call 800.835.3879 or visit www.managersinvest.com for a free prospectus. Read it carefully before investing or sending money. Distributed by Managers Distributors, Inc., member FINRA.
The Russell 3000® Index is a trademark of the Frank Russell Company. Russell® is a trademark of the Frank Russell Company. An investment cannot be made directly into an Index.
5
FQ Tax-Managed U.S. Equity Fund
Fund Snapshots
October 31, 2007
Portfolio Breakdown
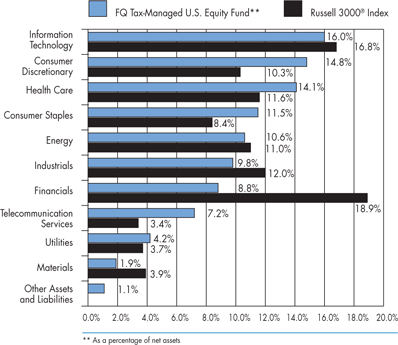
| | | | | | |
Industry | | FQ Tax-Managed
U.S. Equity
Fund** | | | Russell 3000®
Index | |
Information | | | | | | |
Technology | | 16.0 | % | | 16.8 | % |
Consumer | | | | | | |
Discretionary | | 14.8 | % | | 10.3 | % |
Health Care | | 14.1 | % | | 11.6 | % |
Consumer Staples | | 11.5 | % | | 8.4 | % |
Energy | | 10.6 | % | | 11.0 | % |
Industrials | | 9.8 | % | | 12.0 | % |
Financials | | 8.8 | % | | 18.9 | % |
Telecommunication | | | | | | |
Services | | 7.2 | % | | 3.4 | % |
Utilities | | 4.2 | % | | 3.7 | % |
Materials | | 1.9 | % | | 3.9 | % |
Other Assets and | | | | | | |
Liabilities | | 1.1 | % | | 0.0 | % |
Top Ten Holdings
| | | |
Security Name | | Percentage
of Net Assets | |
Cisco Systems, Inc. | | 4.2 | % |
Humana, Inc. | | 3.4 | |
Tesoro Corp.* | | 3.4 | |
Goldman Sachs Group, Inc.* | | 3.3 | |
General Electric Co. | | 3.3 | |
Frontline, Ltd. | | 3.1 | |
Apple, Inc. | | 2.9 | |
Microsoft Corp. | | 2.9 | |
Aetna, Inc. | | 2.9 | |
Loews Corp. | | 2.7 | |
| | | |
Top Ten as a Group | | 32.1 | % |
| | | |
| * | Top Ten Holding at April 30, 2007 |
Any sectors, industries, or securities discussed should not be perceived as investment recommendations. Mention of a specific security should not be considered a recommendation to buy or solicitation to sell that security.
6
FQ Tax-Managed U.S. Equity Fund
Schedule of Portfolio Investments
October 31, 2007
| | | | | | |
| | | Shares | | | Value |
Common Stocks - 98.9% | | | | | | |
Consumer Discretionary - 14.8% | | | | | | |
1-800-FLOWERS.COM, Inc.* | | 76,300 | | | $ | 914,837 |
AutoZone, Inc.* | | 7,600 | | | | 945,516 |
EchoStar Communications Corp.* | | 68,000 | | | | 3,329,280 |
Expedia, Inc.* | | 75,600 | 2 | | | 2,469,096 |
J.C. Penney Co., Inc. | | 38,600 | | | | 2,170,864 |
Las Vegas Sands Corp.* | | 15,200 | 2 | | | 2,022,816 |
Playboy Enterprises, Inc. | | 27,400 | | | | 306,880 |
Service Corp. International | | 63,000 | | | | 911,610 |
Shaw Communications, Inc. | | 58,880 | | | | 1,643,930 |
Target Corp. | | 47,200 | | | | 2,896,192 |
Walt Disney Co., The | | 34,000 | | | | 1,177,420 |
Wynn Resorts Ltd.* | | 1,600 | 2 | | | 258,288 |
Total Consumer Discretionary | | | | | | 19,046,729 |
Consumer Staples - 11.5% | | | | | | |
Archer-Daniels-Midland Co. | | 85,000 | | | | 3,041,300 |
Energizer Holdings, Inc.* | | 21,000 | 2 | | | 2,190,300 |
Hormel Foods Corp. | | 5,000 | 2 | | | 182,400 |
Kellogg Co. | | 18,400 | 2 | | | 971,336 |
Kroger Co. | | 112,800 | | | | 3,315,192 |
Loews Corp. - Carolina Group | | 40,200 | | | | 3,448,356 |
Pantry, Inc., The* | | 3,400 | | | | 95,268 |
PepsiAmericas, Inc. | | 6,000 | 2 | | | 214,320 |
Seaboard Corp. | | 300 | | | | 489,600 |
Smithfield Foods, Inc.* | | 29,000 | | | | 831,430 |
Total Consumer Staples | | | | | | 14,779,502 |
Energy - 10.6% | | | | | | |
Callon Petroleum Co. | | 21,400 | | | | 312,012 |
ConocoPhillips | | 29,200 | | | | 2,480,832 |
Exxon Mobil Corp. | | 20,600 | | | | 1,894,994 |
Frontline, Ltd. | | 89,000 | 2 | | | 4,040,600 |
Pioneer Drilling Co.* | | 6,000 | | | | 73,080 |
Seacor Holdings, Inc.* | | 1,000 | 2 | | | 91,650 |
Tesoro Corp. | | 72,200 | 2 | | | 4,370,266 |
Valero Energy Corp. | | 6,200 | | | | 436,666 |
Total Energy | | | | | | 13,700,100 |
Financials - 8.8% | | | | | | |
Bank of America Corp. | | 5,000 | | | | 241,400 |
Center Financial Corp. | | 5,600 | | | | 71,624 |
Chubb Corp., The | | 11,200 | | | | 597,520 |
CIT Group, Inc. | | 4,000 | 2 | | | 140,960 |
Community Bancorp | | 3,200 | 2 | | | 64,864 |
Fannie Mae Co. | | 48,200 | | | | 2,749,328 |
Goldman Sachs Group, Inc. | | 17,400 | 2 | | | 4,313,808 |
JPMorgan Chase & Co. | | 2,400 | | | | 112,800 |
Lehman Brothers Holdings, Inc. | | 5,800 | 2 | | | 367,372 |
Loews Corp. | | 4,000 | | | | 196,360 |
National City Corp. | | 14,074 | | | | 341,294 |
PFF Bancorp, Inc. | | 3,800 | 2 | | | 40,470 |
PNC Financial Services Group, Inc., The | | 5,400 | | | | 389,664 |
Safeco Corp. | | 18,000 | | | | 1,042,200 |
Security Bank Corp. | | 9,000 | | | | 93,780 |
Southwest Bancorp, Inc. | | 7,000 | | | | 132,510 |
Transatlantic Holdings, Inc. | | 1,200 | | | | 89,436 |
Wachovia Corp. | | 7,894 | | | | 360,993 |
Total Financials | | | | | | 11,346,383 |
Health Care - 14.1% | | | | | | |
Aetna, Inc. | | 65,600 | | | | 3,684,752 |
Allergan, Inc. | | 4,600 | | | | 310,868 |
AmerisourceBergen Corp. | | 57,200 | | | | 2,694,692 |
Amgen, Inc.* | | 25,200 | | | | 1,464,372 |
CIGNA Corp. | | 8,400 | | | | 440,916 |
Cubist Pharmaceuticals, Inc.* | | 4,400 | | | | 102,960 |
Forest Laboratories, Inc.* | | 14,800 | | | | 578,236 |
Gilead Sciences, Inc.* | | 2,400 | | | | 110,856 |
Henry Schein, Inc. | | 7,600 | | | | 455,240 |
Humana, Inc.* | | 58,400 | | | | 4,377,080 |
Kinetic Concepts, Inc.* | | 36,000 | | | | 2,163,600 |
PharMerica Corp.* | | 4,769 | | | | 76,066 |
Sepracor, Inc.* | | 36,000 | | | | 991,440 |
Thermo Fisher Scientific, Inc.* | | 3,200 | | | | 188,192 |
WellPoint, Inc.* | | 7,000 | | | | 554,610 |
Total Health Care | | | | | | 18,193,880 |
Industrials - 9.8% | | | | | | |
Cummins, Inc. | | 3,400 | | | | 407,864 |
Delta Air Lines, Inc. | | 61,400 | 2 | | | 1,277,120 |
Dun & Bradstreet Corp., The | | 31,800 | | | | 3,079,830 |
FedEx Corp. | | 4,700 | 2 | | | 485,698 |
General Electric Co. | | 103,600 | | | | 4,264,176 |
Lockheed Martin Corp. | | 8,000 | | | | 880,320 |
Parker Hannifin Corp. | | 27,000 | | | | 2,169,990 |
Total Industrials | | | | | | 12,564,998 |
Information Technology - 16.0% | | | | | | |
Apple, Inc.* | | 19,800 | | | | 3,761,010 |
Cisco Systems, Inc.* | | 164,100 | | | | 5,425,145 |
Dell, Inc.* | | 16,000 | | | | 489,600 |
Google, Inc.* | | 2,000 | | | | 1,414,000 |
Hewlett-Packard Co. | | 19,200 | 2 | | | 992,256 |
iMergent, Inc. | | 38,200 | | | | 921,384 |
The accompanying notes are an integral part of these financial statements.
7
FQ Tax-Managed U.S. Equity Fund
Schedule of Portfolio Investments (continued)
| | | | | | | |
| | | Shares | | | Value | |
Information Technology - 16.0% (continued) | | | | | | | |
International Business Machines Corp. | | 10,200 | | | $ | 1,184,424 | |
Microsoft Corp. | | 100,400 | | | | 3,695,724 | |
NCR Corp.* | | 23,600 | | | | 651,124 | |
Oracle Corp.* | | 32,600 | | | | 722,742 | |
RF Micro Devices, Inc.* | | 112,200 | 2 | | | 697,884 | |
Teradata Corp. | | 23,600 | 2 | | | 673,308 | |
Total Information Technology | | | | | | 20,628,601 | |
Materials - 1.9% | | | | | | | |
Freeport-McMoRan Copper & Gold, Inc. | | 11,800 | | | | 1,388,624 | |
Reliance Steel & Aluminum Co. | | 18,600 | | | | 1,085,310 | |
Total Materials | | | | | | 2,473,934 | |
Telecommunication Services - 7.2% | | | | | | | |
AT&T, Inc. | | 65,800 | | | | 2,749,782 | |
Centennial Communications Corp.* | | 167,200 | | | | 1,712,128 | |
CenturyTel, Inc. | | 47,400 | 2 | | | 2,087,970 | |
Qwest Communications International, Inc.* | | 376,600 | 2 | | | 2,703,988 | |
Total Telecommunication Services | | | | | | 9,253,868 | |
Utilities - 4.2% | | | | | | | |
AES Corp., The* | | 25,800 | | | | 552,378 | |
Energen Corp. | | 25,600 | | | | 1,638,400 | |
Mirant Corp.* | | 42,300 | | | | 1,791,828 | |
NRG Energy, Inc.* | | 30,400 | 2 | | | 1,388,064 | |
Total Utilities | | | | | | 5,370,670 | |
Total Common Stocks
(cost $100,811,992) | | | | | | 127,358,665 | |
Other Investment Companies - 26.3%1 | | | | | | | |
Bank of New York Institutional Cash Reserves Fund, 5.09%3 | | 26,777,326 | | | | 26,777,326 | |
Dreyfus Cash Management Fund, Institutional Class Shares, 4.94% | | 7,118,085 | | | | 7,118,085 | |
Total Other Investment Companies
(cost $33,895,411) | | | | | | 33,895,411 | |
Total Investments - 125.2%
(cost $134,707,403) | | | | | | 161,254,076 | |
Other Assets, less Liabilities - (25.2)% | | | | | | (32,451,432 | ) |
Net Assets - 100.0% | | | | | $ | 128,802,644 | |
Note: Based on the cost of investments of $134,706,178 for Federal income tax purposes at October 31, 2007, the aggregate gross unrealized appreciation and depreciation were $27,123,289 and $575,391, respectively, resulting in net unrealized appreciation of investments of $26,547,898.
| * | Non-income-producing securities. |
1 | Yield shown for an investment company represents the October 31, 2007, seven-day average yield, which refers to the sum of the previous seven days’ dividends paid, expressed as an annual percentage. |
2 | Some or all of these shares, amounting to a market value of $26,487,281, or 20.6% of net assets, were out on loan to various brokers. |
3 | Collateral received from brokers for securities lending was invested in this short-term investment. |
The accompanying notes are an integral part of these financial statements.
8
FQ U.S. Equity Fund
Portfolio Manager’s Comments
The fiscal year ending October 31, 2007 was a good year. The Fund returned 16.54% while the benchmark Russell 3000® Index returned 14.53%. Please refer to the table on page 10 for returns for various classes of shares. It was another good twelve months for the market, with a significant portion of the gains occurring in the early half of 2007.
The past year continued to feature a market environment characterized by relatively strong corporate profit growth despite the overhang of the subprime mess in the mortgage markets and the subsequent credit crunch. From a style perspective, the tide finally began to turn over the past year with growth stocks handily beating their value counterparts after a long period of underperformance. Meanwhile, larger capitalization securities began to outperform their smaller capitalization counterparts, especially later in the fiscal year, as investors perceived more value in these holdings amidst the recent economic turmoil.
The Fund nicely outperformed the market over this time period. The most significant driver of performance was strong stock selection, a good portion of which was concentrated in the consumer discretionary and utilities sectors. The top performing stock in the Fund for the year was a new holding of Apple which continued its impressive multi-year performance by returning 77% during the last twelve months. Other big contributors, particularly towards the end of the fiscal year, include holdings of Vegas Sands and Wynn Resorts, two Las Vegas casino owners that have benefitted from recent forays into Asia via casinos in Macau. Vegas Sands and Wynn Resorts are also new portfolio holdings and each returned 71% during this period.
On a positioning basis, the move towards large capitalization stocks in the Fund was beneficial throughout the course of the year as was the shift away from value stocks to those stocks with more of a growth orientation. The solid performance generated by that positioning was also aided by strong sector positioning relative to the benchmark Russell 3000® Index. More specifically, overweights to the outperforming information technology and telecommunication sectors were the main drivers of this successful positioning.
We remain worried about several things in the market. One is that the recent interest rate cuts run the risk of igniting inflationary pressure in the economy as a whole. The second is that the euphoria of the market reaction to the cuts poses its own risk. We recognize that rate cuts, particularly those that are larger than expected, have generally been a positive signal for the stock market, but rate cuts are also not a panacea. The rate cuts themselves do not solve the problems of the housing crisis, subprime crisis, and slowing economic growth. Those remain real problems facing the economy and the stock market. Given that, we continue to move toward larger capitalization stocks, in recognition of both the risks to the economy and recognizing that the larger capitalization stocks will benefit the most from the falling dollar, given their export focus. We are adding positions, and keeping positions, that serve as potential inflation hedges – commodity producers and suppliers in particular. We continue to worry about the subprime and housing crisis and continue to avoid the homebuilding and banking stocks. Although we have grown more cautious and more cognizant of the risks in the market, we remain optimistic that the market will continue to generate a solid return for investors going forward.
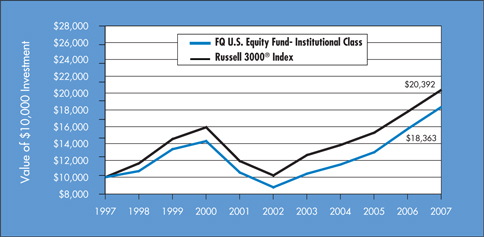
Cumulative Total Return Performance
Managers AMG FQ U.S. Equity Fund’s cumulative total return is based on the daily change in net asset value (NAV), and assumes that all distributions were reinvested. The Russell 3000® Index is composed of the 3000 largest U.S. companies as measured by market capitalization, and represents about 98% of the U.S. stock market. Unlike the Fund, the Russell 3000® Index is unmanaged, is not available for investment, and does not incur expenses. The chart illustrates the performance of a hypothetical $10,000 investment made in the Institutional Class Shares of the Fund on October 31, 1997 to a $10,000 investment made in the Russell 3000® Index for the same time periods. Performance for periods longer than one year is annualized. Figures include reinvestment of capital gains and dividends. The listed returns for the Fund are net of expenses and the returns for the indices exclude expenses. Total returns for the Fund would have been lower had certain expenses not been reduced.
9
FQ U.S. Equity Fund
Portfolio Manager’s Comments (continued)
Cumulative Total Return Performance
The table below shows the average annualized total returns for the Managers AMG FQ U.S. Equity Fund and the Russell 3000® Index since October 31, 1997 through October 31, 2007.
| | | | | | | | | | | | | | |
Average Annual Total Returns | | One Year | | | Five Years | | | Ten Years | | | Since
Inception | | | Inception
Date |
Managers AMG FQ U.S. Equity Fund | | | | | | | | | | | | | | |
No Load: | | | | | | | | | | | | | | |
Institutional Class | | 16.54 | % | | 15.84 | % | | 6.27 | % | | 10.14 | % | | 08/14/92 |
Class A* | | 16.28 | % | | | | | | | | 15.88 | % | | 03/01/06 |
Class C* | | 15.35 | % | | | | | | | | 15.18 | % | | 03/01/06 |
Russell 3000® Index | | 14.53 | % | | 14.83 | % | | 7.39 | % | | | | | |
With Load: | | | | | | | | | | | | | | |
Class A* | | 9.57 | % | | | | | | | | 11.82 | % | | 03/01/06 |
Class C* | | 14.35 | % | | | | | | | | 15.18 | % | | 03/01/06 |
| * | Class A and Class C shares commenced operations on March 1, 2006. |
The performance data shown represents past performance, which is not a guarantee of future results. Current performance may be lower or higher than the performance data quoted. The investment return and principal value of an investment in the Funds will fluctuate so that an investor’s shares, when redeemed, may be worth more or less than their original cost. For performance information through the most recent month end please call (800) 835-3879 or visit our website at www.managersinvest.com.
In choosing a Fund, investors should carefully consider the amount they plan to invest, their investment objectives, the Fund’s investment objectives, risks, charges and expenses before investing. For this and other information, please call 800.835.3879 or visit www.managersinvest.com for a free prospectus. Read it carefully before investing or sending money. Distributed by Managers Distributors, Inc., member FINRA.
The Russell 3000® Index is a trademark of the Frank Russell Company. Russell® is a trademark of the Frank Russell Company. An investment cannot be made directly into an Index.
10
FQ U.S. Equity Fund
Fund Snapshots
October 31, 2007
Portfolio Breakdown
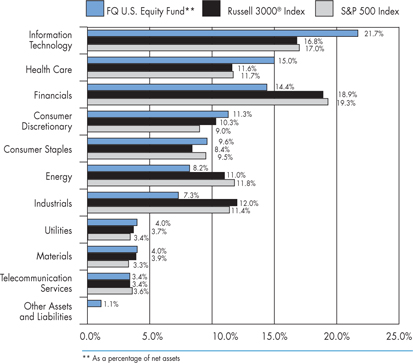
| | | | | | | | | |
Industry | | FQ U.S.
Equity** | | | Russell 3000®
Index | | | S&P 500
Index | |
Information Technology | | 21.7 | % | | 16.8 | % | | 17.0 | % |
Health Care | | 15.0 | % | | 11.6 | % | | 11.7 | % |
Financials | | 14.4 | % | | 18.9 | % | | 19.3 | % |
Consumer Discretionary | | 11.3 | % | | 10.3 | % | | 9.0 | % |
Consumer Staples | | 9.6 | % | | 8.4 | % | | 9.5 | % |
Energy | | 8.2 | % | | 11.0 | % | | 11.8 | % |
Industrials | | 7.3 | % | | 12.0 | % | | 11.4 | % |
Utilities | | 4.0 | % | | 3.7 | % | | 3.4 | % |
Materials | | 4.0 | % | | 3.9 | % | | 3.3 | % |
Telecommunication Services | | 3.4 | % | | 3.4 | % | | 3.6 | % |
Other Assets and Liabilities | | 1.1 | % | | 0.0 | % | | 0.0 | % |
Top Ten Holdings
| | | |
Security Name | | Percentage of Net Assets | |
Microsoft Corp. | | 4.0 | % |
Apple, Inc. | | 3.8 | % |
Cisco Systems, Inc. | | 3.2 | % |
Kroger Co.* | | 3.2 | % |
Bank of America Corp.* | | 3.1 | % |
JPMorgan Chase & Co. | | 2.9 | % |
ConocoPhillips | | 2.8 | % |
Amgen, Inc.* | | 2.8 | % |
Northrop Grumman Corp. | | 2.7 | % |
Archer-Daniels-Midland Co. | | 2.1 | % |
| | | |
Top Ten as a Group | | 30.6 | % |
| | | |
| * | Top Ten Holding at April 30, 2007 |
Any sectors, industries, or securities discussed should not be perceived as investment recommendations. Mention of a specific security should not be considered a recommendation to buy or solicitation to sell that security.
11
FQ U.S. Equity Fund
Schedule of Portfolio Investments
October 31, 2007
| | | | | | |
| | | Shares | | | Value |
Common Stocks - 98.9% | | | | | | |
Consumer Discretionary - 11.3% | | | | | | |
1-800-FLOWERS.COM, Inc.* | | 25,000 | | | $ | 299,750 |
Amazon.com, Inc.* | | 800 | 2 | | | 71,320 |
American Eagles Outfitters, Inc. | | 3,400 | | | | 80,852 |
Big Lots, Inc.* | | 8,800 | | | | 211,024 |
Borders Group, Inc. | | 37,800 | 2 | | | 582,876 |
Coach, Inc.* | | 22,000 | | | | 804,320 |
Expedia, Inc.* | | 52,200 | 2 | | | 1,704,852 |
Great Wolf Resorts, Inc.* | | 17,800 | | | | 232,468 |
Guess?, Inc. | | 1,800 | 2 | | | 92,502 |
Harrah’s Entertainment, Inc. | | 2,000 | | | | 176,500 |
Idearc, Inc. | | 28,955 | | | | 781,206 |
J.C. Penney Co., Inc. | | 4,800 | | | | 269,952 |
Las Vegas Sands Corp.* | | 15,200 | 2 | | | 2,022,816 |
Liberty Global, Inc.* | | 26,000 | 2 | | | 1,020,500 |
Overstock.com, Inc.* | | 11,200 | | | | 438,256 |
Station Casinos, Inc. | | 2,100 | | | | 188,580 |
Washington Post Co., The | | 200 | | | | 169,800 |
Whirlpool Corp. | | 16,400 | 2 | | | 1,298,552 |
Wynn Resorts Ltd.* | | 5,200 | 2 | | | 839,436 |
XM Satellite Radio Holdings, Inc.* | | 60,000 | 2 | | | 796,800 |
Total Consumer Discretionary | | | | | | 12,082,362 |
Consumer Staples - 9.6% | | | | | | |
Altria Group, Inc. | | 14,600 | | | | 1,064,778 |
Anheuser-Busch Companies, Inc. | | 13,100 | | | | 671,768 |
Archer-Daniels-Midland Co. | | 63,600 | | | | 2,275,608 |
Del Monte Foods Co. | | 15,400 | | | | 159,236 |
Kroger Co. | | 115,200 | 2 | | | 3,385,728 |
Loews Corp. - Carolina Group | | 20,000 | | | | 1,715,600 |
Reynolds American, Inc. | | 1,200 | 2 | | | 77,316 |
Rite Aid Corp.* | | 231,000 | 2 | | | 903,210 |
Total Consumer Staples | | | | | | 10,253,244 |
Energy - 8.2% | | | | | | |
Bronco Drilling Co., Inc. | | 7,800 | | | | 106,080 |
Callon Petroleum Co. | | 9,000 | | | | 131,220 |
ConocoPhillips | | 35,800 | | | | 3,041,568 |
EL Paso Corp. | | 25,600 | | | | 452,096 |
Grey Wolf, Inc.* | | 95,400 | 2 | | | 537,102 |
Helmerich & Payne, Inc. | | 10,800 | 2 | | | 341,496 |
Marathon Oil Corp. | | 5,600 | | | | 331,128 |
Patterson-UTI Energy, Inc. | | 11,400 | 2 | | | 227,316 |
Pioneer Drilling Co.* | | 18,800 | | | | 228,984 |
Tesoro Corp. | | 30,800 | 2 | | | 1,864,324 |
Transocean, Inc. | | 4,200 | 2 | | | 501,354 |
VAALCO Energy, Inc.* | | 58,400 | 2 | | | 296,672 |
Valero Energy Corp. | | 9,600 | | | | 676,128 |
Total Energy | | | | | | 8,735,468 |
Financials - 14.4% | | | | | | |
Axis Capital Holdings Ltd. | | 25,600 | | | | 1,017,344 |
Bank of America Corp. | | 69,001 | | | | 3,331,368 |
Bear, Stearns & Co., Inc. | | 4,300 | 2 | | | 488,480 |
Capital One Financial Corp. | | 10,000 | 2 | | | 655,900 |
Central Pacific Financial Corp. | | 4,000 | | | | 89,720 |
Chubb Corp., The | | 17,400 | | | | 928,290 |
Corus Bankshares, Inc. | | 20,000 | | | | 220,400 |
Discover Financial Services | | 5,000 | | | | 96,500 |
Goldman Sachs Group, Inc. | | 5,800 | 2 | | | 1,437,936 |
JPMorgan Chase & Co. | | 65,800 | | | | 3,092,600 |
Merrill Lynch & Co., Inc. | | 3,000 | 2 | | | 198,060 |
Safeco Corp. | | 20,000 | 2 | | | 1,158,000 |
Travelers Companies, Inc., The | | 39,400 | | | | 2,057,074 |
Wachovia Corp. | | 4,400 | | | | 201,212 |
Washington Mutual, Inc. | | 5,800 | 2 | | | 161,704 |
XL Capital Ltd. | | 4,600 | | | | 330,970 |
Total Financials | | | | | | 15,465,558 |
Health Care - 15.0% | | | | | | |
Abbott Laboratories | | 8,400 | | | | 458,808 |
Aetna, Inc. | | 27,000 | | | | 1,516,590 |
Allergan, Inc. | | 14,400 | | | | 973,152 |
AmerisourceBergen Corp. | | 9,000 | | | | 423,990 |
Amgen, Inc.* | | 52,000 | | | | 3,021,720 |
AmSurg Corp.* | | 6,400 | | | | 169,280 |
Applera Corp. | | 3,600 | | | | 133,704 |
CIGNA Corp. | | 2,800 | | | | 146,972 |
Forest Laboratories, Inc.* | | 23,400 | | | | 914,238 |
Gilead Sciences, Inc.* | | 3,000 | 2 | | | 138,570 |
Humana, Inc.* | | 2,800 | | | | 209,860 |
Johnson & Johnson | | 21,600 | | | | 1,407,672 |
Kinetic Concepts, Inc.* | | 7,400 | | | | 444,740 |
Medtronic, Inc. | | 41,600 | | | | 1,973,504 |
Merck & Co., Inc. | | 29,800 | | | | 1,736,148 |
OSI Pharmaceuticals, Inc.* | | 15,800 | 2 | | | 656,806 |
RehabCare Group, Inc.* | | 5,600 | | | | 116,144 |
Sierra Health Services, Inc.* | | 16,200 | | | | 685,260 |
Tenet Healthcare Corp.* | | 50,000 | 2 | | | 175,500 |
Thermo Fisher Scientific, Inc.* | | 12,000 | | | | 705,720 |
WellCare Health Plans, Inc.* | | 2,000 | 2 | | | 48,380 |
Total Health Care | | | | | | 16,056,758 |
The accompanying notes are an integral part of these financial statements.
12
FQ U.S. Equity Fund
Schedule of Portfolio Investments (continued)
| | | | | | | |
| | | Shares | | | Value | |
Industrials - 7.3% | | | | | | | |
Cummins, Inc. | | 800 | | | $ | 95,968 | |
Encore Wire Corp. | | 8,000 | | | | 168,000 | |
General Electric Co. | | 31,100 | | | | 1,280,076 | |
W.W. Grainger, Inc. | | 1,800 | | | | 161,856 | |
L-3 Communications Holdings, Inc. | | 1,200 | 2 | | | 131,568 | |
Lockheed Martin Corp. | | 17,800 | | | | 1,958,712 | |
Northrop Grumman Corp. | | 35,000 | | | | 2,926,700 | |
On Assignment, Inc.* | | 11,800 | | | | 98,412 | |
PACCAR, Inc. | | 13,350 | 2 | | | 741,726 | |
Parker Hannifin Corp. | | 1,500 | | | | 120,555 | |
Tredegar Corp. | | 6,400 | | | | 111,488 | |
Total Industrials | | | | | | 7,795,061 | |
Information Technology - 21.7% | | | | | | | |
Accenture Ltd. | | 53,600 | 2 | | | 2,093,080 | |
Adobe Systems, Inc.* | | 9,600 | | | | 459,840 | |
Advanced Micro Devices, Inc.* | | 27,800 | 2 | | | 363,624 | |
Apple, Inc.* | | 21,500 | | | | 4,083,925 | |
Applied Materials, Inc. | | 48,000 | | | | 932,160 | |
Automatic Data Processing, Inc. | | 4,800 | | | | 237,888 | |
Cisco Systems, Inc.* | | 105,200 | | | | 3,477,912 | |
Credence Systems Corp.* | | 26,400 | | | | 80,520 | |
Dell, Inc.* | | 4,800 | | | | 146,880 | |
eBay, Inc.* | | 2,600 | | | | 93,860 | |
EMC Corp.* | | 22,400 | | | | 568,736 | |
Google, Inc.* | | 2,600 | | | | 1,838,200 | |
International Business Machines Corp. | | 9,400 | | | | 1,091,528 | |
MasterCard, Inc. | | 1,800 | 2 | | | 341,190 | |
Microsoft Corp. | | 116,800 | | | | 4,299,408 | |
NCR Corp.* | | 5,000 | | | | 137,950 | |
Oracle Corp.* | | 34,600 | | | | 767,082 | |
Paychex, Inc. | | 10,800 | 2 | | | 451,224 | |
QUALCOMM, Inc. | | 4,000 | | | | 170,920 | |
RF Micro Devices, Inc.* | | 21,000 | | | | 130,620 | |
Safeguard Scientifics, Inc.* | | 53,800 | | | | 126,430 | |
Salesforce.com, Inc.* | | 5,200 | 2 | | | 293,124 | |
Teradata Corp. | | 5,000 | 2 | | | 142,650 | |
Teradyne, Inc.* | | 55,000 | | | | 678,700 | |
Xerox Corp.* | | 13,400 | | | | 233,696 | |
Total Information Technology | | | | | | 23,241,147 | |
Materials - 4.0% | | | | | | | |
Ecolab, Inc. | | 22,400 | 2 | | | 1,056,608 | |
Monsanto Co. | | 13,600 | 2 | | | 1,327,768 | |
Southern Copper Corp. | | 13,400 | 2 | | | 1,871,980 | |
Total Materials | | | | | | 4,256,356 | |
Telecommunication Services - 3.4% | | | | | | | |
AT&T, Inc. | | 24,800 | | | | 1,036,392 | |
CenturyTel, Inc. | | 22,400 | 2 | | | 986,720 | |
Qwest Communications International, Inc.* | | 227,800 | 2 | | | 1,635,604 | |
Total Telecommunication Services | | | | | | 3,658,716 | |
Utilities - 4.0% | | | | | | | |
AES Corp., The* | | 18,600 | | | | 398,226 | |
American Electric Power Co., Inc. | | 23,000 | 2 | | | 1,108,830 | |
CenterPoint Energy, Inc. | | 27,600 | 2 | | | 462,576 | |
CMS Energy Corp. | | 10,000 | 2 | | | 169,700 | |
Dynegy, Inc.* | | 49,242 | 2 | | | 453,519 | |
ONEOK, Inc. | | 4,000 | | | | 199,760 | |
Pepco Holdings, Inc. | | 22,800 | 2 | | | 649,572 | |
Sempra Energy | | 14,200 | 2 | | | 873,442 | |
Total Utilities | | | | | | 4,315,625 | |
Total Common Stocks
(cost $94,912,411) | | | | | | 105,860,295 | |
Other Investment Companies - 26.0%1 | | | | | | | |
Bank of New York Institutional Cash Reserves Fund, 5.09%3 | | 26,608,254 | | | | 26,608,254 | |
Dreyfus Cash Management Fund, Institutional Class Shares, 4.94% | | 1,170,163 | | | | 1,170,163 | |
Total Other Investment Companies
(cost $27,778,417) | | | | | | 27,778,417 | |
Total Investments - 124.9%
(cost $122,690,828) | | | | | | 133,638,712 | |
Other Assets, less Liabilities - (24.9)% | | | | | | (26,625,028 | ) |
Net Assets - 100.0% | | | | | $ | 107,013,684 | |
Note: Based on the cost of investments of $122,690,828 for Federal income tax purposes at October 31, 2007, the aggregate gross unrealized appreciation and depreciation were $13,971,073 and $3,023,189, respectively, resulting in net unrealized appreciation of investments of $10,947,884.
| * | Non-income-producing securities. |
1 | Yield shown for an investment company represents the October 31, 2007, seven-day average yield, which refers to the sum of the previous seven days’ dividends paid, expressed as an annual percentage. |
2 | Some or all of these shares, amounting to a market value of $26,229,500 or 24.5% of net assets, were out on loan to various brokers. |
3 | Collateral received from brokers for securities lending was invested in this short-term investment. |
The accompanying notes are an integral part of these financial statements.
13
FQ Global Alternatives Fund
Portfolio Manager’s Comments
The Managers AMG FQ Global Alternatives Fund delivered positive absolute returns for the past fiscal year but modestly under-performed its benchmark, the 30-Day T-Bill, during this time. The Fund returned 4.02% while the benchmark returned 4.80%. Please refer to the table on page 15 for returns for various classes of shares. It was another good twelve months for the global equity and global fixed income markets with global equities leading the surge amidst increased volatility, particularly towards the latter half of 2007.
The strong market performance over the last year was achieved despite increasing social and economic woes in the global economy ranging from war in the Middle East, a stagnant housing market in the U.S., the credit debacle caused by subprime lending, and alarming negative market movements in February and July/August. The resiliency of the global economy has been a little bit perplexing considering all of these issues. Risk has returned in force and, with it, opportunity, as shown by the increasing disparity of relative returns across both stock and bond markets.
The Fund modestly underperformed the benchmark during the past year but did add positive absolute performance. The most successful positioning during the fiscal year was within the asset class strategy, particularly during the third quarter of 2007 when a number of factors turned bearish for global equities and the Fund took a relatively large short position in global equities relative to global bonds. This had a very strong positive impact on performance during the early to mid stages of the third quarter and the strategy eased towards a neutral position by the end of that quarter as global equities rallied. Earlier in the fiscal year, the largest allocation of risk in the Fund was directed towards the currency strategy as relative valuation (purchasing power parity) indicated a number of currencies were significantly over or undervalued. This strategy in general, and the purchasing power parity specifically, were not particularly successful although we remain confident in the long term efficacy of this strategy and factor. The equity and bond country selection factors had mixed results throughout the course of the past year marginally contributing to the positive performance of the Fund.
Asset class positioning has essentially neutralized, especially from several months ago, as the stronger drivers of relative performance have unwound. For global stocks, the bearish cost of capital factor has disappeared, as falling interest rates tend to have a sustained impact. In addition, the relative return reversal strategy has similarly defused. For global bonds, a mildly bearish wealth effect strategy offsets a mildly bullish bond yield momentum indicator.
Currency positions have continued to feel an increasing impact from the fixed income flow strategies, due to the continued fluctuations in bond and cash yields. The Japanese yen remains the strongest long position, well ahead of the New Zealand dollar. The Australian and Canadian dollars are the strongest short positions, with Australia surpassing Canada as a result of reduced bearishness in the Canadian dollar with fixed income flow pressures diffusing and increased bearishness in the Australian dollar due to prospective bond flow and relative valuation pressures. Other notable changes include a bearish move away from neutral for the UK pound, a reduction of the short U.S. dollar position, and a bullish shift away from neutral for the New Zealand dollar.
The positioning in the stock country selection strategy remains well-diversified via a broad set of long and short positions. Stock country selection allocations include strong U.S., Japanese, and Swiss long positions, and strong short positions in Canada, Spain, and Australia. The factors that contribute to current positioning in the stock selection strategy are quite diverse.
The opportunity in the bond market selection strategy has expanded recently. Japan, Canada, and the U.S. comprise the long positions while the UK and the EMU are the major positions on the short side. While substantial opportunity has been created by recent interest rate movements, currency movements and macroeconomics have also played a notable role. A tightening in the money supply has contributed toward the decision to short bonds in Australia. Overall, the higher cross-sectional volatility experienced in the global capital markets gives the Fund increasing opportunities across the four major strategies used by the Fund.
Cumulative Total Return Performance
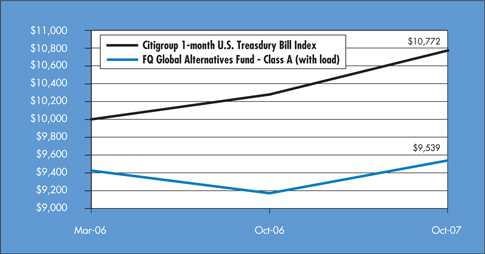
Managers AMG FQ Global Alternatives Fund’s cumulative total return is based on the daily change in net asset value (NAV), and assumes that all distributions were reinvested. The Citigroup 1-Month U.S. Treasury Bill Index (“1-Month Treasury Index”) measures returns of 1-month treasury bills. Unlike the Fund, the 1-Month Treasury Index is unmanaged, is not available for investment, and does not incur expenses. The chart illustrates the performance of a hypothetical $10,000 investment made in the Class A shares (with load) of the Fund on March 30, 2006 (commencement of operations), to a $10,000 investment made in the 1-Month Treasury Index for the same time period. Figures include reinvestment of capital gains and dividends. The listed returns for the Fund are net of expenses and the returns for the index exclude expenses. The graph and table do not reflect the deduction of taxes that a shareholder would pay on a Fund distribution or redemption of shares. Total returns for the Fund would have been lower had certain expenses not been reduced.
14
FQ Global Alternatives Fund
Portfolio Manager’s Comments (continued)
Cumulative Total Return Performance
The table below shows the average annualized total returns for the Managers AMG FQ Global Alternatives Fund and the Citigroup 1-Month U.S. Treasury Bill Index since inception through October 31, 2007.
| | | | | | | | |
Average Total Returns | | One Year | | | Since
Inception | | | Inception
Date |
Managers AMG FQ Global Alternatives Equity Fund* 1,2,3,4,5 | | | | | | | | |
No Load: | | | | | | | | |
Class A | | 4.02 | % | | 0.76 | % | | 3/30/06 |
Class C | | 3.20 | % | | 0.00 | % | | 3/30/06 |
Citigroup 1-Month U.S. Treasury Bill Index 1 | | 4.80 | % | | 4.80 | % | | 3/31/06 |
With Load: | | | | | | | | |
Class A | | (1.93 | )% | | (2.92 | )% | | 3/30/06 |
Class C | | 2.20 | % | | 0.00 | % | | 3/30/06 |
| * | Commencement of operations was March 30, 2006. |
The performance data shown represents past performance, which is not a guarantee of future results. Current performance may be lower or higher than the performance data quoted. The investment return and principal value of an investment in the Funds will fluctuate so that an investor’s shares, when redeemed, may be worth more or less than their original cost. For performance information through the most recent month end please call (800) 835-3879 or visit our website at www.managersinvest.com.
In choosing a Fund, investors should carefully consider the amount they plan to invest, their investment objectives, the Fund’s investment objectives, risks, charges and expenses before investing. For this and other information, please call 800.835.3879 or visit www.managersinvest.com for a free prospectus. Read it carefully before investing or sending money. Distributed by Managers Distributors, Inc., member FINRA
1 | Performance for the Citigroup 1-Month U.S. Treasury Bill Index reflects an inception date of March 31, 2006. |
2 | Performance based on published NAV as of October 31, 2007. |
3 | Fixed-income funds are subject to the risks associated with investments in debt securities, such as default risk, fluctuations in debtor’s perceived ability to pay its creditors, and changing interest rate risk. An increase in interest rates typically cause the value of bonds and other fixed-income securities to fall. |
4 | The Fund may use derivative instruments for hedging purposes or as part of its investment strategy. There is a risk that a derivative intended as a hedge may not perform as expected. The main risk with derivatives is that some types can amplify a gain or loss, potentially earning or losing substantially more money than the actual cost of the derivative or that the counterparty may fail to honor its contract terms, causing a loss for the Fund. Use of these instruments may also involve certain costs and risks such as liquidity risk, interest rate risk, market risk, credit risk, management risk, and the risk that a fund could not close out a position when it would be most advantageous to do so. |
5 | Investments in foreign securities and currency instruments are subject to additional risks such as erratic market conditions, economic and political instability, and currency exchange rate fluctuations. |
15
Managers AMG FQ Funds
Statements of Assets and Liabilities
October 31, 2007
| | | | | | | |
| | | FQ Tax-Managed
U.S. Equity | | | FQ U.S.
Equity |
Assets: | | | | | | | |
Investments at value (including securities on loan valued at $26,487,281 and $26,229,500, respectively)* | | $ | 161,254,076 | | | $ | 133,638,712 |
Cash | | | 45,700 | | | | 26,622 |
Receivable for Fund shares sold | | | 243,601 | | | | 14,262 |
Dividends and other receivables | | | 96,056 | | | | 82,531 |
Receivable for variation margin on futures | | | — | | | | 14,175 |
Prepaid expenses | | | 19,584 | | | | 17,135 |
| | | | | | | |
Total assets | | | 161,659,017 | | | | 133,793,437 |
| | | | | | | |
Liabilities: | | | | | | | |
Payable upon return of securities loaned | | | 26,777,326 | | | | 26,608,254 |
Payable for Fund shares repurchased | | | 106,518 | | | | 48,058 |
Payable for investments purchased | | | 5,817,062 | | | | — |
Accrued expenses: | | | | | | | |
Investment advisory and management fees | | | 78,450 | | | | 31,571 |
Administrative fees | | | — | | | | 22,559 |
Distribution fees | | | 10,666 | | | | 6,572 |
Professional fees | | | 35,674 | | | | 37,037 |
Other | | | 30,677 | | | | 25,702 |
| | | | | | | |
Total liabilities | | | 32,856,373 | | | | 26,779,753 |
| | | | | | | |
Net Assets | | $ | 128,802,644 | | | $ | 107,013,684 |
| | | | | | | |
Net Assets Represent: | | | | | | | |
Paid-in capital | | $ | 148,617,941 | | | $ | 84,389,035 |
Undistributed net investment income | | | 349,337 | | | | 686,021 |
Accumulated net realized gain (loss) from investments and futures contracts | | | (46,711,307 | ) | | | 10,988,063 |
Net unrealized appreciation of investments and futures contracts | | | 26,546,673 | | | | 10,950,565 |
| | | | | | | |
Net Assets | | $ | 128,802,644 | | | $ | 107,013,684 |
| | | | | | | |
Class A Shares - Net Assets | | $ | 23,803,351 | | | $ | 21,773,357 |
Shares outstanding | | | 1,421,282 | | | | 1,411,129 |
| | | | | | | |
Net asset value, offering and redemption price per share | | $ | 16.75 | | | $ | 15.43 |
| | | | | | | |
Public offering price per share based on a maximum sales charge of 5.75% | | $ | 17.77 | | | $ | 16.37 |
Class C Shares - Net Assets | | $ | 9,489,699 | | | $ | 2,325,556 |
Shares outstanding | | | 574,253 | | | | 152,295 |
| | | | | | | |
Net asset value, offering and redemption price per share | | $ | 16.53 | | | $ | 15.27 |
| | | | | | | |
Institutional Class Shares - Net Assets | | $ | 95,509,594 | | | $ | 82,914,771 |
Shares outstanding | | | 5,684,248 | | | | 5,352,002 |
| | | | | | | |
Net asset value, offering and redemption price per share | | $ | 16.80 | | | $ | 15.49 |
| | | | | | | |
| | $ | 134,707,403 | | | $ | 122,690,828 |
The accompanying notes are an integral part of these financial statements.
16
Managers AMG FQ Global Alternatives Fund
Statement of Net Assets
October 31, 2007
| | | | | | | |
| | | Principal Amount | | Value | |
Assets: | | | | | | | |
Investments in Securities - 103.3% | | | | | | | |
U.S. Government Obligations- 13.2%1,2 | | | | | | | |
U.S. Treasury Bills, 3.510%, 11/01/07 | | $ | 703,000 | | $ | 703,000 | |
U.S. Treasury Bills, 3.680%, 11/08/07 | | | 1,038,000 | | | 1,037,128 | |
U.S. Treasury Bills, 3.820%, 12/27/07 | | | 750,000 | | | 745,456 | |
U.S. Treasury Bills, 3.930%, 12/06/07 | | | 3,504,000 | | | 3,490,720 | |
Total U.S. Government Obligations (cost $5,975,388) | | | | | | 5,976,304 | |
| | |
| | | Shares | | | |
Short-Term Investments - 90.1% | | | | | | | |
S&P 500 Depositary Receipts | | | 68,206 | | | 10,548,058 | |
Dreyfus Cash Management Fund, Institutional Class Shares, 4.94%3 | | | 30,158,668 | | | 30,158,668 | |
Total Short-Term Investments (cost $39,601,344) | | | | | | 40,706,726 | |
| | | | | | | |
Total Investments in securities (cost $45,576,732) | | | | | | 46,683,030 | |
| | | | | | | |
Cash | | | | | | 308,946 | |
Cash held as collateral4 | | | | | | 1,400,000 | |
Receivable for investments sold | | | | | | 18,838 | |
Receivable for Fund shares sold | | | | | | 190,983 | |
Interest and other receivables | | | | | | 161,076 | |
Receivable for variation margin on futures contracts | | | | | | 943,766 | |
Unrealized gains on forward foreign currency contracts | | | | | | 9,432,923 | |
Prepaid expenses | | | | | | 11,597 | |
| | | | | | | |
Total assets | | | | | | 59,151,159 | |
| | | | | | | |
Liabilities: | | | | | | | |
Payable for foreign currency contracts | | | | | | 106,971 | |
Payable for Fund shares repurchased | | | | | | 14,615 | |
Payable for investments purchased | | | | | | 18,822 | |
Unrealized losses on forward foreign currency contracts | | | | | | 12,500,834 | |
Payable for variation margin on futures contracts | | | | | | 1,152,251 | |
Accrued expenses: | | | | | | | |
Investment advisory and management fees | | | | | | 76,564 | |
Administrative fees | | | | | | 11,259 | |
Distribution fees | | | | | | 15,840 | |
Professional fees | | | | | | 42,305 | |
Other | | | | | | 31,795 | |
| | | | | | | |
Total liabilities | | | | | | 13,971,256 | |
| | | | | | | |
Net Assets | | | | | $ | 45,179,903 | |
| | | | | | | |
Net Assets Represent: | | | | | | | |
Paid-in capital | | | | | $ | 43,241,076 | |
Undistributed net investment income | | | | | | 3,073,916 | |
Accumulated net realized loss from investments and futures contracts | | | | | | 303,012 | |
Accumulated net realized gain from currency contracts | | | | | | 1,053,675 | |
Net unrealized depreciation of investments, futures and foreign currency contracts | | | | | | (2,491,776 | ) |
| | | | | | | |
Net Assets | | | | | $ | 45,179,903 | |
| | | | | | | |
Class A Shares - Net Assets | | | | | $ | 37,715,591 | |
Shares outstanding | | | | | | 3,794,098 | |
| | | | | | | |
Net asset value, offering and redemption price per share | | | | | $ | 9.94 | |
| | | | | | | |
Public offering price per share based on a maximum sales charge of 5.75% | | | | | $ | 10.55 | |
Class C Shares - Net Assets | | | | | $ | 7,464,312 | |
Shares outstanding | | | | | | 760,047 | |
| | | | | | | |
Net asset value, offering and redemption price per share | | | | | $ | 9.82 | |
| | | | | | | |
Note: Based on the cost of investments of $45,576,732 for Federal income tax purposes at October 31, 2007, the aggregate gross unrealized appreciation and depreciation were $1,106,461 and $163, respectively, resulting in net unrealized appreciation of investments of $1,106,298.
1 | Security held as collateral for futures contracts, amounting to a market value of $5,976,304, or 13%. |
2 | Represents yield to maturity at October 31, 2007. |
3 | Yield shown for an investment company represents the October 31, 2007, seven-day average yield, which refers to the sum of the previous seven days’ dividends paid, expressed as an annual percentage. |
4 | Cash held as collateral for forward contracts in a segregated account at The Bank of New York. |
The accompanying notes are an integral part of these financial statements.
17
Managers AMG FQ Funds
Statements of Operations
For the fiscal year ended October 31, 2007
| | | | | | | | | | | | |
| | | FQ Tax-Managed
U.S. Equity | | | FQ U.S. Equity | | | FQ Global
Alternatives | |
Investment Income: | | | | | | | | | | | | |
Dividend income | | $ | 1,403,631 | | | $ | 1,535,046 | | | $ | 101,475 | |
Interest income | | | — | | | | — | | | | 1,444,197 | |
Securities lending fees | | | 65,921 | | | | 29,603 | | | | — | |
Foreign withholding tax | | | (7,290 | ) | | | (25 | ) | | | — | |
| | | | | | | | | | | | |
Total investment income | | | 1,462,262 | | | | 1,564,624 | | | | 1,545,672 | |
| | | | | | | | | | | | |
Expenses: | | | | | | | | | | | | |
Investment advisory and management fees | | | 895,205 | | | | 315,787 | | | | 621,415 | |
Administrative fees | | | — | | | | 225,562 | | | | 91,385 | |
Distribution fees Class A | | | 20,173 | | | | 16,836 | | | | 85,214 | |
Distribution fees Class C | | | 44,700 | | | | 13,199 | | | | 24,682 | |
Transfer agent | | | 65,122 | | | | 50,138 | | | | 23,354 | |
Professional fees | | | 46,505 | | | | 44,992 | | | | 47,152 | |
Registration fees | | | 46,425 | | | | 42,120 | | | | 45,112 | |
Custodian | | | 33,073 | | | | 37,946 | | | | 11,029 | |
Reports to shareholders | | | 29,406 | | | | 18,108 | | | | 3,024 | |
Trustees fees and expenses | | | 4,300 | | | | 4,506 | | | | 1,010 | |
Miscellaneous | | | 5,982 | | | | 7,986 | | | | 1,749 | |
| | | | | | | | | | | | |
Total expenses before offsets | | | 1,190,891 | | | | 777,180 | | | | 955,126 | |
| | | | | | | | | | | | |
Less: Expense reimbursement | | | (82,277 | ) | | | (32,297 | ) | | | (18,181 | ) |
Expense reductions | | | (1,092 | ) | | | (4,790 | ) | | | (4,588 | ) |
| | | | | | | | | | | | |
Net expenses | | | 1,107,522 | | | | 740,093 | | | | 932,357 | |
| | | | | | | | | | | | |
Net investment income | | | 354,740 | | | | 824,531 | | | | 613,315 | |
| | | | | | | | | | | | |
Net Realized and Unrealized Gain (Loss): | | | | | | | | | | | | |
Net realized gain on investment transactions | | | 5,137,603 | | | | 10,927,818 | | | | 188 | |
Net realized gain on futures contracts | | | — | | | | 99,374 | | | | 439,499 | |
Net realized gain on foreign currency contracts | | | — | | | | — | | | | 1,032,691 | |
Net unrealized appreciation of investments | | | 13,324,156 | | | | 1,501,517 | | | | 874,635 | |
Net unrealized depreciation of futures contracts | | | — | | | | (25,929 | ) | | | (182,940 | ) |
Net unrealized depreciation of foreign currency contracts | | | — | | | | — | | | | (2,864,338 | ) |
| | | | | | | | | | | | |
Net realized and unrealized gain (loss) | | | 18,461,759 | | | | 12,502,780 | | | | (700,265 | ) |
| | | | | | | | | | | | |
Net Increase (Decrease) in Net Assets Resulting from Operations | | $ | 18,816,499 | | | $ | 13,327,311 | | | | ($86,950 | ) |
| | | | | | | | | | | | |
The accompanying notes are an integral part of these financial statements.
18
Managers AMG FQ Funds
Statements of Changes in Net Assets
For the fiscal year ended October 31,
| | | | | | | | | | | | | | | | | | | | | | | | |
| | | FQ Tax-Managed U.S. Equity | | | FQ U.S. Equity | | | FQ Global Alternatives | |
| | | 2007 | | | 2006 | | | 2007 | | | 2006 | | | 2007 | | | 2006* | |
Increase (Decrease) in Net Assets From Operations: | | | | | | | | | | | | | | | | | | | | | | | | |
Net investment income | | $ | 354,740 | | | $ | 164,233 | | | $ | 824,531 | | | $ | 928,078 | | | $ | 613,315 | | | $ | 155,605 | |
Net realized gain (loss) on investments, futures and foreign currency transactions | | | 5,137,603 | | | | 6,163,511 | | | | 11,027,192 | | | | 7,928,499 | | | | 1,472,378 | | | | (401,267 | ) |
Net unrealized appreciation (depreciation) of investments, futures and foreign currency translations | | | 13,324,156 | | | | 4,777,717 | | | | 1,475,588 | | | | 5,821,972 | | | | (2,172,643 | ) | | | (319,133 | ) |
| | | | | | | | | | | | | | | | | | | | | | | | |
Net increase (decrease) in net assets resulting from operations | | | 18,816,499 | | | | 11,105,461 | | | | 13,327,311 | | | | 14,678,549 | | | | (86,950 | ) | | | (564,795 | ) |
| | | | | | | | | | | | | | | | | | | | | | | | |
Distributions to Shareholders: | | | | | | | | | | | | | | | | | | | | | | | | |
From net investment income | | | (63,118 | ) | | | (111,569 | ) | | | (826,430 | ) | | | (1,014,832 | ) | | | (428,312 | ) | | | — | |
From net realized gain on investments | | | — | | | | — | | | | (7,967,797 | ) | | | (2,823,880 | ) | | | — | | | | — | |
| | | | | | | | | | | | | | | | | | | | | | | | |
Total distributions to shareholders | | | (63,118 | ) | | | (111,569 | ) | | | (8,794,227 | ) | | | (3,838,712 | ) | | | (428,312 | ) | | | — | |
| | | | | | | | | | | | | | | | | | | | | | | | |
From Capital Share Transactions: | | | | | | | | | | | | | | | | | | | | | | | | |
Proceeds from the sale of shares | | | 51,835,490 | | | | 30,799,963 | | | | 33,962,254 | | | | 4,809,087 | | | | 46,376,569 | | | | 23,584,230 | |
Reinvestment of dividends and distributions | | | 58,882 | | | | 103,866 | | | | 8,561,477 | | | | 3,770,801 | | | | 425,858 | | | | — | |
Cost of shares repurchased | | | (26,335,187 | ) | | | (12,784,257 | ) | | | (18,579,846 | ) | | | (13,353,393 | ) | | | (22,463,071 | ) | | | (1,663,626 | ) |
| | | | | | | | | | | | | | | | | | | | | | | | |
Net increase (decrease) from capital share transactions | | | 25,559,185 | | | | 18,119,572 | | | | 23,943,885 | | | | (4,773,505 | ) | | | 24,339,356 | | | | 21,920,604 | |
| | | | | | | | | | | | | | | | | | | | | | | | |
Total increase in net assets | | | 44,312,566 | | | | 29,113,464 | | | | 28,476,969 | | | | 6,066,332 | | | | 23,824,094 | | | | 21,355,809 | |
| | | | | | | | | | | | | | | | | | | | | | | | |
Net Assets: | | | | | | | | | | | | | | | | | | | | | | | | |
Beginning of year | | | 84,490,078 | | | | 55,376,614 | | | | 78,536,715 | | | | 72,470,383 | | | | 21,355,809 | | | | — | |
| | | | | | | | | | | | | | | | | | | | | | | | |
End of year | | $ | 128,802,644 | | | $ | 84,490,078 | | | $ | 107,013,684 | | | $ | 78,536,715 | | | $ | 45,179,903 | | | $ | 21,355,809 | |
| | | | | | | | | | | | | | | | | | | | | | | | |
End of year undistributed net investment income | | $ | 349,337 | | | $ | 61,925 | | | $ | 686,021 | | | $ | 687,920 | | | $ | 3,073,916 | | | $ | 348,385 | |
Share Transactions: | | | | | | | | | | | | | | | | | | | | | | | | |
Sale of shares | | | 3,273,716 | | | | 2,389,184 | | | | 2,282,565 | | | | 350,267 | | | | 4,509,114 | | | | 2,363,264 | |
Reinvestment of dividends and distributions | | | 3,711 | | | | 8,296 | | | | 619,547 | | | | 291,839 | | | | 43,154 | | | | — | |
Shares repurchased | | | (1,665,406 | ) | | | (986,692 | ) | | | (1,256,742 | ) | | | (976,209 | ) | | | (2,193,872 | ) | | | (167,515 | ) |
| | | | | | | | | | | | | | | | | | | | | | | | |
Net increase (decrease) in shares | | | 1,612,021 | | | | 1,410,788 | | | | 1,645,370 | | | | (334,103 | ) | | | 2,358,396 | | | | 2,195,749 | |
| | | | | | | | | | | | | | | | | | | | | | | | |
| * | Commencement of operations was March 30, 2006. |
The accompanying notes are an integral part of these financial statements.
19
Managers AMG FQ Tax-Managed U.S. Equity Fund
Financial Highlights
For a share outstanding throughout each fiscal year
| | | | | | | | | | | | | | | | | | | | |
| | | For the fiscal year ended October 31, | |
Institutional Class Shares | | 2007 | | | 2006 | | | 2005 | | | 2004 | | | 2003 | |
Net Asset Value, Beginning of Year | | $ | 13.93 | | | $ | 11.89 | | | $ | 9.94 | | | $ | 9.39 | | | $ | 7.74 | |
| | | | | | | | | | | | | | | | | | | | |
Income from Investment Operations: | | | | | | | | | | | | | | | | | | | | |
Net investment income | | | 0.06 | | | | 0.03 | | | | 0.01 | | | | 0.11 | | | | 0.06 | |
Net realized and unrealized gain on investments | | | 2.82 | | | | 2.03 | | | | 2.04 | | | | 0.44 | | | | 1.69 | |
| | | | | | | | | | | | | | | | | | | | |
Total from investment operations | | | 2.88 | | | | 2.06 | | | | 2.05 | | | | 0.55 | | | | 1.75 | |
| | | | | | | | | | | | | | | | | | | | |
Less Distributions to Shareholders from: | | | | | | | | | | | | | | | | | | | | |
Net investment income | | | (0.01 | ) | | | (0.02 | ) | | | (0.10 | ) | | | — | | | | (0.10 | ) |
| | | | | | | | | | | | | | | | | | | | |
Net Asset Value, End of Year | | $ | 16.80 | | | $ | 13.93 | | | $ | 11.89 | | | $ | 9.94 | | | $ | 9.39 | |
| | | | | | | | | | | | | | | | | | | | |
Total Return1 | | | 20.68 | % | | | 17.37 | % | | | 20.75 | % | | | 5.86 | % | | | 22.90 | % |
| | | | | | | | | | | | | | | | | | | | |
Ratio of net expenses to average net assets | | | 0.99 | % | | | 0.99 | % | | | 0.99 | % | | | 0.99 | % | | | 0.99 | % |
Ratio of net investment income to average net assets1 | | | 0.37 | % | | | 0.23 | % | | | 0.04 | % | | | 0.99 | % | | | 0.68 | % |
Portfolio turnover | | | 65 | % | | | 98 | % | | | 105 | % | | | 131 | % | | | 143 | % |
Net assets at end of year (000’s omitted) | | $ | 95,510 | | | $ | 82,975 | | | $ | 55,377 | | | $ | 45,321 | | | $ | 53,538 | |
| | | | | | | | | | | | | | | | | | | | |
Expense Offsets:2 | | | | | | | | | | | | | | | | | | | | |
Ratio of total expenses to average net assets | | | 1.07 | % | | | 1.11 | % | | | 1.21 | % | | | 1.20 | % | | | 1.62 | % |
Ratio of net investment income (loss) to average net assets | | | 0.29 | % | | | 0.12 | % | | | (0.17 | )% | | | 0.79 | % | | | 0.06 | % |
| | | | | | | | | | | | | | | | | | | | |
1 | Total returns and net investment income would have been lower had certain expenses not been reduced. (See Note 1(c) of Notes to Financial Statements.) |
2 | Excludes the impact of expense reimbursements and expense offsets such as brokerage credits, but includes non-reimbursable expenses such as interest and taxes. (See Note 1(c) of Notes to Financial Statements.) |
20
Managers AMG FQ Tax-Managed U.S. Equity Fund
Financial Highlights
For a share outstanding throughout each fiscal period
| | | | | | | | |
Class A Shares | | For the fiscal
year ended
October 31, 2007 | | | For the fiscal
period ended
October 31, 2006* | |
Net Asset Value, Beginning of Period | | $ | 13.91 | | | $ | 13.01 | |
| | | | | | | | |
Income from Investment Operations: | | | | | | | | |
Net investment income | | | 0.02 | | | | 0.00 | 5 |
Net realized and unrealized gain on investments | | | 2.82 | | | | 0.90 | |
| | | | | | | | |
Total from investment operations | | | 2.84 | | | | 0.90 | |
| | | | | | | | |
Net Asset Value, End of Period | | $ | 16.75 | | | $ | 13.91 | |
| | | | | | | | |
Total Return1 | | | 20.42 | % | | | 6.92 | %2 |
| | | | | | | | |
Ratio of net expenses to average net assets | | | 1.24 | % | | | 1.24 | %3 |
Ratio of net investment income (loss) to average net assets1 | | | 0.30 | % | | | (0.11 | )%3 |
Portfolio turnover | | | 65 | % | | | 98 | %2 |
Net assets at end of period (000’s omitted) | | $ | 23,803 | | | $ | 574 | |
| | | | | | | | |
Expense Offsets:4 | | | | | | | | |
Ratio of total expenses to average net assets | | | 1.32 | % | | | 1.40 | %3 |
Ratio of net investment income (loss) to average net assets | | | 0.22 | % | | | (0.27 | )%3 |
| | | | | | | | |
| | |
Class C Shares | | For the fiscal
year ended
October 31, 2007 | | | For the fiscal
period ended
October 31, 2006* | |
Net Asset Value, Beginning of Period | | $ | 13.83 | | | $ | 13.01 | |
| | | | | | | | |
Income from Investment Operations: | | | | | | | | |
Net investment income (loss) | | | 0.00 | 5 | | | (0.03 | ) |
Net realized and unrealized gain on investments | | | 2.70 | | | | 0.85 | |
| | | | | | | | |
Total from investment operations | | | 2.70 | | | | 0.82 | |
| | | | | | | | |
Net Asset Value, End of Period | | $ | 16.53 | | | $ | 13.83 | |
| | | | | | | | |
Total Return1 | | | 19.52 | %6 | | | 6.30 | %2 |
| | | | | | | | |
Ratio of net expenses to average net assets | | | 1.99 | % | | | 1.99 | %3 |
Ratio of net investment loss to average net assets1 | | | (0.36 | )% | | | (0.91 | )%3 |
Portfolio turnover | | | 65 | % | | | 98 | %2 |
Net assets at end of period (000’s omitted) | | $ | 9,490 | | | $ | 941 | |
| | | | | | | | |
Expense Offsets:4 | | | | | | | | |
Ratio of total expenses to average net assets | | | 2.07 | % | | | 2.15 | %3 |
Ratio of net investment loss to average net assets | | | (0.44 | )% | | | (1.06 | )%3 |
| | | | | | | | |
| * | Class A and Class C shares commenced operations on March 1, 2006. (See Notes to Financial Statements.) |
1 | Total returns and net investment income would have been lower had certain expenses not been reduced. (See Note 1(c) of Notes to Financial Statements.) |
4 | Excludes the impact of expense reimbursements and expense offsets such as brokerage credits, but includes non-reimbursable expenses such as interest and taxes. (See Note 1(c) of Notes to Financial Statements.) |
5 | Rounds to less than $0.01. |
6 | The Total Return is based on the Financial Statement Net Asset Values as shown above. |
21
Managers AMG FQ U.S. Equity Fund
Financial Highlights
For a share outstanding throughout each fiscal year
| | | | | | | | | | | | | | | | | | | | |
| | | For the fiscal year ended October 31, | |
Institutional Class Shares | | 2007 | | | 2006 | | | 2005 | | | 2004 | | | 2003 | |
Net Asset Value, Beginning of Year | | $ | 14.90 | | | $ | 12.93 | | | $ | 11.62 | | | $ | 10.59 | | | $ | 9.03 | |
| | | | | | | | | | | | | | | | | | | | |
Income from Investment Operations: | | | | | | | | | | | | | | | | | | | | |
Net investment income | | | 0.15 | | | | 0.17 | | | | 0.20 | | | | 0.11 | | | | 0.08 | |
Net realized and unrealized gain on investments | | | 2.11 | | | | 2.49 | | | | 1.26 | | | | 1.00 | | | | 1.56 | |
| | | | | | | | | | | | | | | | | | | | |
Total from investment operations | | | 2.26 | | | | 2.66 | | | | 1.46 | | | | 1.11 | | | | 1.64 | |
| | | | | | | | | | | | | | | | | | | | |
Less Distributions to Shareholders from: | | | | | | | | | | | | | | | | | | | | |
Net investment income | | | (0.16 | ) | | | (0.18 | ) | | | (0.15 | ) | | | (0.08 | ) | | | (0.08 | ) |
Net realized gain on investments | | | (1.51 | ) | | | (0.51 | ) | | | — | | | | — | | | | — | |
| | | | | | | | | | | | | | | | | | | | |
Total distributions to shareholders | | | (1.67 | ) | | | (0.69 | ) | | | (0.15 | ) | | | (0.08 | ) | | | (0.08 | ) |
| | | | | | | | | | | | | | | | | | | | |
Net Asset Value, End of Year | | $ | 15.49 | | | $ | 14.90 | | | $ | 12.93 | | | $ | 11.62 | | | $ | 10.59 | |
| | | | | | | | | | | | | | | | | | | | |
Total Return1 | | | 16.54 | % | | | 21.44 | % | | | 12.64 | % | | | 10.52 | % | | | 18.37 | % |
| | | | | | | | | | | | | | | | | | | | |
Ratio of net expenses to average net assets | | | 0.79 | % | | | 0.79 | % | | | 0.85 | % | | | 0.79 | % | | | 0.91 | % |
Ratio of net investment income to average net assets1 | | | 0.96 | % | | | 1.23 | % | | | 1.49 | % | | | 0.97 | % | | | 0.82 | % |
Portfolio turnover | | | 106 | % | | | 89 | % | | | 105 | % | | | 106 | % | | | 169 | % |
Net assets at end of year (000’s omitted) | | $ | 82,915 | | | $ | 78,068 | | | $ | 72,470 | | | $ | 72,878 | | | $ | 71,265 | |
| | | | | | | | | | | | | | | | | | | | |
Expense Offsets:2 | | | | | | | | | | | | | | | | | | | | |
Ratio of total expenses to average net assets | | | 0.83 | % | | | 0.82 | % | | | — | | | | — | | | | — | |
Ratio of net investment income to average net assets | | | 0.92 | % | | | 1.19 | % | | | — | | | | — | | | | — | |
| | | | | | | | | | | | | | | | | | | | |
1 | Total returns and net investment income would have been lower had certain expenses not been reduced. (See Note 1(c) of Notes to Financial Statements.) |
2 | Excludes the impact of expense reimbursements and expense offsets such as brokerage credits, but includes non-reimbursable expenses such as interest and taxes. (See Note 1(c) of Notes to Financial Statements.) |
22
Managers AMG FQ U.S. Equity Fund
Financial Highlights
For a share outstanding throughout each fiscal period
| | | | | | | | |
Class A Shares | | For the fiscal
year ended
October 31, 2007 | | | For the fiscal
period ended
October 31, 2006* | |
Net Asset Value, Beginning of Period | | $ | 14.88 | | | $ | 13.53 | |
| | | | | | | | |
Income from Investment Operations: | | | | | | | | |
Net investment income | | | 0.17 | | | | 0.01 | |
Net realized and unrealized gain on investments | | | 2.05 | | | | 1.34 | |
| | | | | | | | |
Total from investment operations | | | 2.22 | | | | 1.35 | |
| | | | | | | | |
Less Distributions to Shareholders from: | | | | | | | | |
Net investment income | | | (0.16 | ) | | | — | |
Net realized gain on investments | | | (1.51 | ) | | | — | |
| | | | | | | | |
Total distributions to shareholders | | | (1.67 | ) | | | — | |
| | | | | | | | |
Net Asset Value, End of Period | | $ | 15.43 | | | $ | 14.88 | |
| | | | | | | | |
Total Return1 | | | 16.28 | % | | | 9.98 | %2 |
| | | | | | | | |
Ratio of net expenses to average net assets | | | 1.04 | % | | | 1.04 | %3 |
Ratio of net investment income to average net assets 1 | | | 0.56 | % | | | 0.63 | %3 |
Portfolio turnover | | | 106 | % | | | 89 | %2 |
Net assets at end of period (000’s omitted) | | $ | 21,773 | | | $ | 371 | |
| | | | | | | | |
Expense Offsets: 4 | | | | | | | | |
Ratio of total expenses to average net assets | | | 1.08 | % | | | 1.13 | %3 |
Ratio of net investment income to average net assets | | | 0.52 | % | | | 0.54 | %3 |
| | | | | | | | |
| | |
Class C Shares | | For the fiscal
year ended
October 31, 2007 | | | For the fiscal
period ended
October 31, 2006* | |
Net Asset Value, Beginning of Period | | $ | 14.85 | | | $ | 13.53 | |
| | | | | | | | |
Income from Investment Operations: | | | | | | | | |
Net investment income | | | 0.13 | | | | 0.00 5 | |
Net realized and unrealized gain on investments | | | 1.96 | | | | 1.32 | |
| | | | | | | | |
Total from investment operations | | | 2.09 | | | | 1.32 | |
| | | | | | | | |
Less Distributions to Shareholders from: | | | | | | | | |
Net investment income | | | (0.16 | ) | | | — | |
Net realized gain on investments | | | (1.51 | ) | | | — | |
| | | | | | | | |
Total distributions to shareholders | | | (1.67 | ) | | | — | |
| | | | | | | | |
Net Asset Value, End of Period | | $ | 15.27 | | | $ | 14.85 | |
| | | | | | | | |
Total Return 1 | | | 15.35 | % | | | 9.76 | %2 |
| | | | | | | | |
Ratio of net expenses to average net assets | | | 1.79 | % | | | 1.79 | %3 |
Ratio of net investment income (loss) to average net assets 1 | | | (0.13 | )% | | | 0.16 | %3 |
Portfolio turnover | | | 106 | % | | | 89 | %2 |
Net assets at end of period (000’s omitted) | | $ | 2,326 | | | $ | 97 | |
| | | | | | | | |
Expense Offsets: 4 | | | | | | | | |
Ratio of total expenses to average net assets | | | 1.83 | % | | | 1.88 | %3 |
Ratio of net investment loss to average net assets | | | (0.17 | )% | | | (0.07 | )%3 |
| | | | | | | | |
| * | Class A and Class C shares commenced operations on March 1, 2006. (See Notes to Financial Statements.) |
1 | Total returns and net investment income would have been lower had certain expenses not been reduced. (See Note 1(c) of Notes to Financial Statements.) |
4 | Excludes the impact of expense reimbursements and expense offsets such as brokerage credits, but includes non-reimbursable expenses such as interest and taxes. (See Note 1(c) of Notes to Financial Statements.) |
5 | Rounds to less than $0.01. |
23
Managers AMG FQ Global Alternatives Fund
Financial Highlights
For a share outstanding throughout each fiscal period
| | | | | | | | |
Class A Shares | | For the fiscal
year ended
October 31, 2007 | | | For the fiscal
period ended
October 31, 2006* | |
Net Asset Value, Beginning of Period | | $ | 9.73 | | | $ | 10.00 | |
| | | | | | | | |
Income from Investment Operations: | | | | | | | | |
Net investment income | | | 0.18 | 6 | | | 0.16 | |
Net realized and unrealized gain (loss) on investments | | | 0.22 | 6 | | | (0.43 | ) |
| | | | | | | | |
Total from investment operations | | | 0.40 | | | | (0.27 | ) |
| | | | | | | | |
Less Distributions to Shareholders from: | | | | | | | | |
Net investment income | | | (0.19 | ) | | | — | |
| | | | | | | | |
Net Asset Value, End of Period | | $ | 9.94 | | | $ | 9.73 | |
| | | | | | | | |
Total Return 1 | | | 4.11 | %5 | | | (2.70 | )%2 |
| | | | | | | | |
Ratio of net expenses to average net assets | | | 2.50 | % | | | 2.50 | %3 |
Ratio of net investment income to average net assets 1 | | | 1.72 | % | | | 1.38 | %3 |
Portfolio turnover | | | 104 | % | | | 48 | %2 |
Net assets at end of period (000’s omitted) | | $ | 37,716 | | | $ | 20,661 | |
| | | | | | | | |
Expense Offsets: 4 | | | | | | | | |
Ratio of total expenses to average net assets | | | 2.56 | % | | | 3.20 | %3 |
Ratio of net investment income to average net assets | | | 1.66 | % | | | 0.68 | %3 |
| | | | | | | | |
| | | | | | | | |
Class C Shares | | For the fiscal
year ended
October 31, 2007 | | | For the fiscal
period ended
October 31, 2006* | |
Net Asset Value, Beginning of Period | | $ | 9.69 | | | $ | 10.00 | |
| | | | | | | | |
Income from Investment Operations: | | | | | | | | |
Net investment income | | | 0.11 | 6 | | | 0.02 | |
Net realized and unrealized gain (loss) on investments | | | 0.21 | 6 | | | (0.33 | ) |
| | | | | | | | |
Total from investment operations | | | 0.32 | | | | (0.31 | ) |
| | | | | | | | |
Less Distributions to Shareholders from: | | | | | | | | |
Net investment income | | | (0.19 | ) | | | — | |
| | | | | | | | |
Net Asset Value, End of Period | | $ | 9.82 | | | $ | 9.69 | |
| | | | | | | | |
Total Return 1 | | | 3.30 | %5 | | | (3.10 | )%2 |
| | | | | | | | |
Ratio of net expenses to average net assets | | | 3.25 | % | | | 3.25 | %3 |
Ratio of net investment income to average net assets 1 | | | 1.03 | % | | | 1.03 | %3 |
Portfolio turnover | | | 104 | % | | | 48 | %2 |
Net assets at end of period (000’s omitted) | | $ | 7,464 | | | $ | 695 | |
| | | | | | | | |
Expense Offsets: 4 | | | | | | | | |
Ratio of total expenses to average net assets | | | 3.31 | % | | | 3.52 | %3 |
Ratio of net investment income to average net assets | | | 0.97 | % | | | 0.76 | %3 |
| | | | | | | | |
| * | Commencement of operations was on March 30, 2006. |
1 | Total returns and net investment income would have been lower had certain expenses not been reduced. (See Note 1(c) of Notes to Financial Statements.) |
4 | Excludes the impact of expense reimbursements and expense offsets such as brokerage credits, but includes non-reimbursable expenses such as interest and taxes. (See Note 1(c) of Notes to Financial Statements.) |
5 | The Total Return is based on the Financial Statement Net Asset Values as shown above. |
6 | Per share numbers have been calculated using average shares. |
24
Managers AMG FQ Funds
Notes to Financial Statements
October 31, 2007
| 1. | Summary of Significant Accounting Policies |
Managers Trust I (the “Trust”) is an open-end management investment company, organized as a Massachusetts business trust, and registered under the Investment Company Act of 1940, as amended (the “1940 Act”). Currently, the Trust is comprised of a number of different funds, each having distinct investment management objectives, strategies, risks, and policies. Included in this report are: Managers AMG FQ Tax-Managed U.S. Equity Fund, formerly First Quadrant Tax-Managed Equity Fund (“Tax-Managed”), Managers AMG FQ U.S. Equity Fund, formerly Managers Structured Core (“U.S. Equity”), and Managers AMG FQ Global Alternatives Fund (“Global Alternatives”), collectively the “Funds.”
On March 1, 2006, two new classes were added to Tax-Managed and U.S. Equity, Class A and Class C, in addition to the existing Institutional Class. Initial investments of $1,500 were made in each new class by Managers Investment Group LLC. Global Alternatives commenced operations on March 30, 2006 with an initial investment of $100 into Class A and $1,500 into Class C by Managers Investment Group LLC. Each class represents an interest in the same assets of the Fund and the classes are identical except for class specific expenses related to shareholder activity. Investment income, realized and unrealized capital gains and losses, the common expenses of the Fund, and certain Fund level expense reductions, if any, are allocated on a pro rata basis to each class based on the relative net assets of each class to the total net assets of the Fund. All classes have equal voting privileges except that each class has exclusive voting rights with respect to its services and/or distribution plan. Sales of Class A shares may be subject to a front-end sales charge of up to 5.75%. Redemptions of Class C shares may be subject to a contingent-deferred sales charge (as a percentage of the original offering price or the net asset value at the time of sale, whichever is less). Tax-Managed and U.S. Equity Institutional Class shares are available, with no sales charge, to certain institutional investors and qualifying individual investors. Please refer to a current prospectus for additional information on each share class.
The Funds’ financial statements are prepared in accordance with accounting principles generally accepted in the United States of America, which require management to make estimates and assumptions that affect the reported amount of assets and liabilities and disclosure of contingent assets and liabilities at the date of the financial statements and the reported amounts of income and expenses during the reporting period. Actual results could differ from those estimates. The following is a summary of significant accounting policies followed by the Funds in the preparation of their financial statements:
| a. | Valuation of Investments |
Equity securities traded on a domestic or international securities exchange are valued at the last quoted sale price, or, lacking any sales, at the last quoted bid price. Over-the-counter securities are valued at the NASDAQ Official Closing Price, if one is available. Lacking any sales, over-the counter securities are valued at the last quoted bid price. Under certain circumstances, the value of each Fund’s investment may be based on an evaluation of its fair value, pursuant to procedures established by and under the general supervision of the Board of Trustees of the Trust. A Fund may use the fair value of a portfolio security to calculate its NAV when, for example, (1) market quotations are not readily available because a portfolio security is not traded in a public market or the principal market in which the security trades is closed, (2) trading in a portfolio security is suspended and has not resumed before the Fund calculates its NAV, (3) a significant event affecting the value of a portfolio security is determined to have occurred between the time of the market quotation provided for a portfolio security and the time as of which the Fund calculates its NAV, (4) a security’s price has remained unchanged over a period of time (often referred to as a “stale price”), or (5) Managers Investment Group LLC (“the Investment Manager”) determines that a market quotation is inaccurate. The Investment Manager monitors intervening events that may affect the value of securities held in a Fund’s portfolio and, in accordance with procedures adopted by the Fund’s Trustees, will adjust the prices of securities traded in foreign markets, as appropriate, to reflect the impact of events occurring subsequent to the close of such markets but prior to the time each Fund’s NAV is calculated. Fixed income securities are valued based on valuations furnished by independent pricing services that utilize matrix systems, which reflect such factors as security prices, yields, maturities, and ratings, and are supplemented by dealer and exchange quotations. Futures contracts for which market quotations are readily available are valued at the settlement price as of the close of the futures exchange. Short-term investments having a remaining maturity of 60 days or less are valued at amortized cost, which approximates market value. Investments in other regulated investment companies are valued at their end of day net asset value per share. Investments in certain mortgage-backed, stripped mortgage-backed, preferred stocks, convertible securities, derivatives and other debt securities not traded on an organized securities market are valued on the basis of valuations provided by dealers or by a pricing service which uses information with respect to transactions in such securities and various relationships between securities and yield to maturity in determining value. Securities (including derivatives) for which market quotations are not readily available are valued at fair value, as determined in good faith, and pursuant to procedures adopted by the Board of Trustees of the Trust. The values assigned to fair value investments are based on available information and do not necessarily represent amounts that might ultimately be realized, since such amounts depend on future developments inherent in long-term investments. Further, because of the inherent uncertainty of valuation, those estimated values may differ significantly from the values that would have been used had a ready market for the investments existed, and the differences could be material.
Security transactions are accounted for as of trade date. Realized gains and losses on securities sold are determined on the basis of identified cost.
| c. | Investment Income and Expenses |
Dividend income is recorded on the ex-dividend date, except certain dividends from foreign securities where the ex-dividend date may have passed. These dividends are recorded as soon as the Trust is informed of the ex-dividend date. Dividend income on foreign securities is recorded net of any withholding tax. Interest income, which includes amortization of premium and accretion of discount on
25
Managers AMG FQ Funds
Notes to Financial Statements (continued)
debt securities, is accrued as earned. Non-cash dividends included in dividend income, if any, are reported at the fair market value of the securities received. Other income and expenses are recorded on an accrual basis. Expenses which cannot be directly attributed to a fund are apportioned among the Funds in the Trust and in some cases other affiliated funds based upon their relative average net assets or number of shareholders.
U.S. Equity had certain portfolio trades directed to various brokers who paid a portion of the Fund’s expenses. For the fiscal year ended October 31, 2007, under this arrangement the amount by which the Fund’s expenses were reduced and the impact on the expense ratio was $3,872 or 0.003%.
The Funds have a “balance credit” agreement with The Bank of New York (“BNY”), the Funds’ custodian, whereby each Fund is credited with an interest factor equal to 0.75% below the effective 90-day T-Bill rate for account balances left uninvested overnight. These credits serve to reduce custody expenses that would otherwise be charged to each Fund. For the fiscal year ended October 31, 2007, the custodian expense was reduced as follows: Tax-Managed - $175, U.S. Equity - $144 and Global Alternatives by $4,256.
Overdrafts will cause a reduction of any earnings credits, computed at 2% above the effective Federal funds rate on the day of the overdraft. For the fiscal year ended October 31, 2007, overdraft fees for U.S. Equity amounted to $1,153.
The Trust also has a balance credit arrangement with its Transfer Agent, PFPC, Inc., whereby earnings credits are used to offset banking charges. For the fiscal year ended October, 31, 2007, the transfer agent expense was reduced as follows: Tax-Managed - $917, U.S. Equity - $774, and Global Alternatives - $332.
The Investment Manager for Tax-Managed and Global Alternatives, has contractually agreed, through at least March 1, 2008, subject to later reimbursement by the Funds in certain circumstances, that the total annual operating expenses (exclusive of taxes, interest, brokerage costs, acquired fund expenses, and extraordinary expenses) will be limited to the following amounts of the Fund’s average daily net assets.
| | | | | | | | | |
Fund | | Class A | | | Class C | | | Institutional
Class | |
Tax-Managed | | 1.24 | % | | 1.99 | % | | 0.99 | % |
Global Alternatives | | 2.50 | % | | 3.25 | % | | N/A | |
In general, for a period of up to three years from the time of any waiver or payment pursuant to the Fund’s contractual expense limitation, the Investment Manager may recover from the Fund fees waived and expenses paid to the extent that the Fund’s total operating expenses do not exceed the contractual expense limitation amount. At October 31, 2007, the twelve month and cumulative amounts of reimbursable expenses for the Funds were as follows:
| | | | | | |
Fund | | Fiscal year
ended October 31,
2007 | | Cumulative
Reimbursement
Amount |
Tax-Managed | | $ | 82,277 | | $ | 266,811 |
Global Alternatives | | | 18,181 | | | 97,248 |
The Investment Manager of U.S. Equity, has voluntarily agreed through March 1, 2008 to limit the total annual operating expenses (exclusive of taxes, interest, brokerage costs, acquired fund expenses, and extraordinary expenses) to 0.79% of the Fund’s average daily net assets allocable to the Institutional Class shares. This arrangement may be modified or terminated by the Investment Manager at any time. For the fiscal year ended October 31, 2007, under this arrangement the amount by which the Fund’s expenses were reduced was $32,297.
Total returns and net investment income for the Funds would have been lower had certain expenses not been offset. Total expenses before offsets exclude the impact of expense reimbursements and expense offsets such as brokerage recapture credits but include non-reimbursable expenses such as interest and taxes, if any.
| d. | Dividends and Distributions |
Dividends resulting from net investment income, if any, normally will be declared and paid annually in December. Distributions of capital gains, if any, will also be made annually in December and when required for Federal excise tax purposes. Income and capital gain distributions are determined in accordance with Federal income tax regulations, which may differ from generally accepted accounting principles. These differences are primarily due to differing treatments for losses deferred due to wash sales, contributed securities, and possibly equalization accounting for tax purposes. Permanent book and tax basis differences, if any, relating to shareholder distributions will result in reclassifications to paid-in capital.
26
Managers AMG FQ Funds
Notes to Financial Statements (continued)
The tax character of distributions paid during the fiscal years ended October 31, 2007 and 2006 was as follows:
| | | | | | | | | | | | | | | | | |
| | | FQ Tax-Managed
Equity | | FQ US Equity | | FQ Global
Alternatives |
| | | 2007 | | 2006 | | 2007 | | 2006 | | 2007 | | 2006 |
Distributions paid from: | | | | | | | | | | | | | | | | | |
Ordinary income | | $ | 63,118 | | $ | 111,569 | | $ | 826,430 | | $ | 1,014,832 | | $ | 438,312 | | — |
Short-term capital gains | | | — | | | — | | | 3,556,489 | | | — | | | — | | — |
Long-term capital gains | | | — | | | — | | | 4,411,308 | | | 2,823,880 | | | — | | — |
| | | | | | | | | | | | | | | | | |
| | $ | 63,118 | | $ | 111,569 | | $ | 8,794,227 | | $ | 3,838,712 | | $ | 438,312 | | — |
| | | | | | | | | | | | | | | | | |
As of October 31, 2007, the components of distributable earnings (excluding unrealized appreciation/depreciation) on a tax basis consisted of:
| | | | | | | | | |
| | | FQ Tax-Managed
Equity | | FQ US Equity | | FQ Global
Alternatives |
Capital loss carryforward | | $ | 46,712,532 | | | — | | | — |
Undistributed ordinary income | | | 349,337 | | $ | 686,021 | | | — |
Undistributed short-term capital gains | | | — | | | 3,270,181 | | | — |
Undistributed long-term capital gains | | | — | | | 7,720,562 | | $ | 523,268 |
The Funds intend to comply with the requirements under Subchapter M of the Internal Revenue Code of 1986, as amended, to distribute substantially all of their taxable income and gains to their shareholders and to meet certain diversification and income requirements with respect to investment companies. Therefore, no provision for Federal income or excise tax is included in the accompanying financial statements.
| f. | Capital Loss Carryovers |
As of October 31, 2007 the following Funds had accumulated net realized capital loss carryovers from securities transactions for Federal income tax purposes as shown in the following chart. These amounts may be used to offset realized capital gains, if any, through the expiration dates listed.
| | | | | |
Fund | | Capital Loss
Carryover Amount | | Expires
October 31, |
Tax-Managed | | $ | 62,547 | | 2011 |
| | | 18,367,213 | | 2010 |
| | | 28,282,772 | | 2009 |
For the fiscal year ended October 31, 2007, Tax-Managed and Global Alternatives utilized capital loss carryovers in the amounts of $5,132,689 and $737,147, respectively.
The Trust’s Declaration of Trust authorizes for each series the issuance of an unlimited number of shares of beneficial interest, without par value. Each Fund records sales and repurchases of its capital stock on the trade date. Dividends and distributions to shareholders are recorded on the ex-dividend date.
27
Managers AMG FQ Funds
Notes to Financial Statements (continued)
For the fiscal year ended October 31, 2007, the capital stock transactions in the Funds by class were:
| | | | | | | | | | | | | | | | | | | | | | | | | | | | |
| | | Tax-Managed | | | U.S. Equity | |
| | | 2007 | | | 2006* | | | 2007 | | | 2006* | |
| | | Shares | | | Amount | | | Shares | | | Amount | | | Shares | | | Amount | | | Shares | | | Amount | |
Class A Shares | | | | | | | | | | | | | | | | | | | | | | | | | | | | |
Sale of shares | | 1,714,462 | | | $ | 27,420,567 | | | 43,397 | | | $ | 558,178 | | | 1,823,106 | | | $ | 27,198,907 | | | 31,004 | | | $ | 441,439 | |
Reinvestment of dividends and distributions | | — | | | | — | | | — | | | | — | | | 3,541 | | | | 48,285 | | | — | | | | — | |
Shares repurchased | | (334,458 | ) | | | (5,373,188 | ) | | (2,119 | ) | | | (26,927 | ) | | (440,449 | ) | | | (6,632,355 | ) | | (6,073 | ) | | | (89,217 | ) |
| | | | | | | | | | | | | | | | | | | | | | | | | | | | |
Net increase | | 1,380,004 | | | $ | 22,047,379 | | | 41,278 | | | $ | 531,251 | | | 1,386,198 | | | $ | 20,614,837 | | | 24,931 | | | $ | 352,222 | |
| | | | | | | | | | | | | | | | | | | | | | | | | | | | |
Class C Shares | | | | | | | | | | | | | | | | | | | | | | | | | | | | |
Sale of shares | | 527,386 | | | $ | 8,233,271 | | | 68,090 | | | $ | 875,865 | | | 162,315 | | | $ | 2,397,014 | | | 6,778 | | | $ | 99,470 | |
Reinvestment of dividends and distributions | | — | | | | — | | | — | | | | — | | | 81 | | | | 1,109 | | | — | | | | — | |
Shares repurchased | | (21,223 | ) | | | (329,547 | ) | | — | | | | — | | | (16,663 | ) | | | (252,257 | ) | | (216 | ) | | | (2,881 | ) |
| | | | | | | | | | | | | | | | | | | | | | | | | | | | |
Net increase | | 506,163 | | | $ | 7,903,724 | | | 68,090 | | | $ | 875,865 | | | 145,733 | | | $ | 2,145,866 | | | 6,562 | | | $ | 96,589 | |
| | | | | | | | | | | | | | | | | | | | | | | | | | | | |
Institutional Class | | | | | | | | | | | | | | | | | | | | | | | | | | | | |
Sale of shares | | 1,031,868 | | | $ | 16,181,652 | | | 2,277,697 | | | $ | 29,365,920 | | | 297,144 | | | $ | 4,366,333 | | | 312,485 | | | $ | 4,268,178 | |
Reinvestment of dividends and distributions | | 3,711 | | | | 58,882 | | | 8,296 | | | | 103,866 | | | 615,925 | | | | 8,512,083 | | | 291,839 | | | | 3,770,801 | |
Shares repurchased | | (1,309,725 | ) | | | (20,632,452 | ) | | (984,573 | ) | | | (12,757,330 | ) | | (799,630 | ) | | | (11,695,234 | ) | | (969,920 | ) | | | (13,261,295 | ) |
| | | | | | | | | | | | | | | | | | | | | | | | | | | | |
Net increase (decrease) | | (274,146 | ) | | | ($4,391,918 | ) | | 1,301,420 | | | $ | 16,712,456 | | | 113,439 | | | $ | 1,183,182 | | | (365,596 | ) | | | ($5,222,316 | ) |
| | | | | | | | | | | | | | | | | | | | | | | | | | | | |
| * | Class A and Class C shares commenced operations on March 1, 2006. |
| | | | | | | | | | | | | | |
| | | Global Alternatives | |
| | | 2007 | | | 2006** | |
| | | Shares | | | Amount | | | Shares | | | Amount | |
Class A Shares | | | | | | | | | | | | | | |
Sale of shares | | 3,750,168 | | | $ | 38,528,654 | | | 2,291,554 | | | $ | 22,875,480 | |
Reinvestment of dividends and distributions | | 41,696 | | | | 411,541 | | | — | | | | — | |
Shares repurchased | | (2,121,805 | ) | | | (21,737,119 | ) | | (167,515 | ) | | | (1,663,626 | ) |
| | | | | | | | | | | | | | |
Net increase | | 1,670,059 | | | $ | 17,203,076 | | | 2,124,039 | | | $ | 21,211,854 | |
| | | | | | | | | | | | | | |
Class C Shares | | | | | | | | | | | | | | |
Sale of shares | | 758,946 | | | $ | 7,847,915 | | | 71,710 | | | $ | 708,750 | |
Reinvestment of dividends and distributions | | 1,458 | | | | 14,317 | | | — | | | | — | |
Shares repurchased | | (72,067 | ) | | | (725,952 | ) | | — | | | | — | |
| | | | | | | | | | | | | | |
Net increase | | 688,337 | | | $ | 7,136,280 | | | 71,710 | | | $ | 708,750 | |
| | | | | | | | | | | | | | |
| ** | Commenced operations on March 30, 2006. |
At October 31, 2007, certain unaffiliated shareholders of record, specifically omnibus accounts, individually or collectively held greater than 10% of the outstanding shares of the following Funds:
| | | | | | |
Fund | | Class A | | Class C | | Institutional Class |
Tax-Managed | | 2 collectively own 73% | | 1 owns 72% | | 3 collectively own 45% |
U.S. Equity | | None | | 1 owns 42% | | 1 owns 17% |
Global Alternatives | | 1 owns 14% | | 1 owns 36% | | N/A |
28
Managers AMG FQ Funds
Notes to Financial Statements (continued)
| h. | Foreign Currency Translation |
The books and records of the Funds are maintained in U.S. dollars. The value of investments, assets and liabilities denominated in currencies other than U.S. dollars are translated into U.S. dollars based upon current foreign exchange rates. Purchases and sales of foreign investments, income and expenses are converted into U.S. dollars based on currency exchange rates prevailing on the respective dates of such transactions. Net realized and unrealized gain (loss) on foreign currency transactions represent: (1) foreign exchange gains and losses from the sale and holdings of foreign currencies; (2) gains and losses between trade date and settlement date on investment securities transactions and forward foreign currency exchange contracts; and (3) gains and losses from the difference between amounts of interest and dividends recorded and the amounts actually received.
In addition, the Funds do not isolate the net realized and unrealized gain or loss resulting from changes in exchange rates from the fluctuations resulting from changes in market prices of securities held. Such fluctuations are included with the net realized and unrealized gain or loss on investments.
| 2. | Agreements and Transactions with Affiliates |
The Trust has entered into an Investment Management Agreement under which Managers Investment Group LLC (the “Investment Manager”), an independently-managed subsidiary of Affiliated Managers Group, Inc. (“AMG”), serves as investment manager to the Funds and is responsible for the Funds’ overall administration. The Funds’ investment portfolios are managed by First Quadrant, L.P. (“First Quadrant” or the “Subadvisor”), which serves pursuant to a Subadvisory Agreement between the Investment Manager and First Quadrant with respect to each of the Funds. AMG indirectly owns a majority interest in First Quadrant.
Tax-Managed is obligated by the Investment Management Agreement to pay an annual management fee to the Investment Manager of 0.85% of the average daily net assets of the Fund. The Investment Manager, in turn, pays First Quadrant 0.85% of the average daily net assets of the Fund for its services as subadvisor. Under the Investment Management Agreement with the Fund, the Investment Manager provides a variety of administrative services to the Fund. The Investment Manager receives no additional compensation from the Fund for these services. Pursuant to a Reimbursement Agreement between the Investment Manager and First Quadrant, First Quadrant reimburses the Investment Manager for the costs the Investment Manager bears in providing such services to the Fund.
U.S. Equity and Global Alternatives are obligated by the Investment Management Agreement to pay an annual management fee to the Investment Manager of 0.35% and 1.70%, respectively, of the average daily net assets of the Fund. The Investment Manager, in turn, pays First Quadrant 0.35% and 1.40% of the average daily net assets of the Fund for its services as subadvisor. U.S. Equity and Global Alternatives have entered into an Administration and Shareholder Servicing Agreement under which Managers Investment Group LLC serves as the Funds’ administrator (the “Administrator”) and is responsible for all aspects of managing the Funds’ operations, including administration and shareholder services to each Fund, its shareholders, and certain institutions, such as bank trust departments, broker-dealers and registered investment advisers, that advise or act as an intermediary with the Funds’ shareholders. For its services, the Administrator is paid a fee at a rate of 0.25% of the average daily net assets of each Fund.
Prior to July 1, 2007, the aggregate annual retainer paid to each Independent Trustee was $55,000, plus $4,000 or $2,000 for each regular or special meeting attended, respectively. Effective July 1, 2007, the aggregate annual retainer paid to each Independent Trustee is $65,000, plus $4,000 or $2,500 for each regular or special meeting attended, respectively. The Trustees’ fees and expenses are allocated amongst all of the Funds for which the Investment Manager serves as the advisor (the “Managers Funds”) based on the relative net assets of such Funds. The Independent Chairman of the Trusts receives an additional payment of $15,000 per year. (Prior to July 1, 2007, the Independent Chairman received an additional payment of $10,000 per year). The Chairman of the Audit Committee receives an additional payment of $5,000 per year. (Prior to July 1, 2007, the Chairman of the Audit Committee received an additional payment of $2,000 per year). The “Trustee fees and expenses” shown in the financial statements represents each Fund’s allocated portion of the total fees and expenses paid by the Managers Funds.
The Funds are distributed by Managers Distributors, Inc. (“MDI” or the “Distributor”) a wholly-owned subsidiary of the Investment Manager. The Distributor serves as the principal underwriter for each Fund. The Distributor is a registered broker-dealer and member of the Financial Industry Regulatory Authority (“FINRA”). Shares of each Fund will be continuously offered and will be sold by brokers, dealers or other financial intermediaries who have executed selling agreements with the Distributor. The Distributor bears all the expenses of providing services pursuant to the Underwriting Agreement, including the payment of the expenses relating to the distribution of Prospectuses for sales purposes and any advertising or sales literature. Certain Trustees and Officers of the Funds are Officers and/or Directors of the Investment Manager, AMG and/or the Distributor.
Effective March 1, 2006, Tax-Managed and U.S. Equity adopted a distribution and service plan (the “Plan”) and effective March 30, 2006, Global Alternatives adopted the Plan with respect to the Class A and Class C shares of each Fund, in accordance with the requirements of Rule 12b-1 under the 1940 Act and the requirements of the applicable rules of the FINRA regarding asset-based sales charges.
Pursuant to the Plan, the Funds may compensate the Distributor for its expenditures in financing any activity primarily intended to result in the sale of each such class of the Fund’s shares and for maintenance and personal service provided to existing shareholders of that class. The Plan authorizes payments to the Distributor up to 0.25% and 1.00% annually of the Fund’s average daily net assets attributable to Class A and Class C shares, respectively.
The Plan further provides for periodic payments by MDI to brokers, dealers and other financial intermediaries for providing shareholder services and for promotional and other sales related costs. The portion of payments by Class A or Class C shares of U.S. Equity and Global Alternatives for shareholder servicing may not exceed an annual rate of 0.25% of the average daily net asset value of the Fund’s shares of that class owned by clients of such broker, dealer or financial intermediary.
29
Managers AMG FQ Funds
Notes to Financial Statements (continued)
| 3. | Purchases and Sales of Securities |
Purchases and sales of securities, excluding short-term securities, for the fiscal year ended October 31, 2007, were as follows:
| | | | | | | | | | | | |
| | | Long-Term Securities | | U.S. Government Securities |
Fund | | Purchases | | Sales | | Purchases | | Sales |
Tax-Managed | | $ | 97,850,254 | | $ | 72,490,979 | | | N/A | | | N/A |
U.S. Equity | | | 117,470,628 | | | 101,523,517 | | | N/A | | | N/A |
Global Alternatives | | | 5,540,926 | | | 188 | | $ | 15,600,765 | | $ | 11,776,000 |
| 4. | Portfolio Securities Loaned |
The Funds may participate in a securities lending program offered by BNY, providing for the lending of equities, corporate bonds and government securities to qualified brokers. Collateral on all securities loaned is accepted in cash and/or government securities. Collateral is maintained at a minimum level of 102% of the market value, plus interest, if applicable, of the investments on loan. Collateral received in the form of cash is invested temporarily in institutional money market funds or other short-term investments by BNY. Securities lending fees include earnings of such temporary cash investments, plus or minus any rebate to a borrower. These earnings (after any rebate) are then divided between BNY, as a fee for its services under the program, and the Fund according to agreed-upon rates.
| 5. | Commitments and contingencies |
In the normal course of business, the Funds may enter into contracts and agreements that contain a variety of representations and warranties, which provide general indemnifications. The maximum exposure to the Funds under these arrangements is unknown, as this would involve future claims that may be made against a Fund that have not yet occurred. However, based on experience, the Funds expect the risks of loss to be remote.
Certain transactions, such as futures and forward transactions, dollar roll agreements, or purchases of when-issued or delayed delivery securities may have a similar effect on a Fund’s net asset value as if the Fund had created a degree of leverage in its portfolio. However, if a Fund enters into such a transaction, the Fund will establish a segregated account with its custodian in which it will maintain cash, U.S. government securities or other liquid securities equal in value to its obligations in respect to such transaction. Securities and other assets held in the segregated account may not be sold while the transaction is outstanding, unless other suitable assets are substituted.
| 7. | Forward Foreign Currency Contracts |
Global Alternatives invests in forward foreign currency exchange contracts to manage currency exposure. These investments may involve greater market risk than the amounts disclosed in the Fund’s financial statements.
A forward foreign currency exchange contract is an agreement between a Fund and another party to buy or sell a currency at a set price at a future date. The market value of the contract will fluctuate with changes in currency exchange rates. The contract is marked-to-market daily, and the change in market value is recorded as an unrealized gain or loss. Gain or loss on the purchase or sale of contracts having the same settlement date, amount and counter party is realized on the date of offset, otherwise gain or loss is realized on the settlement date.
The Fund may invest in non-U.S. dollar denominated instruments subject to limitations, and enter into forward foreign currency exchange contracts to facilitate transactions in foreign securities and to protect against a possible loss resulting from an adverse change in the relationship between the U.S. dollar and such foreign currency. Risks may arise upon entering into these contracts from the potential inability of counterparties to meet the terms of their contracts and from unanticipated movements in the value of a foreign currency relative to the U.S. dollar.
30
Managers AMG FQ Funds
Notes to Financial Statements (continued)
Cash pledged to cover margin requirements for open forward positions in Global Alternatives at October 31, 2007 is $1,400,000. Open forward foreign currency exchange contracts (in U.S. Dollars) at October 31, 2007 were as follows:
Global Alternatives - Foreign Currency
| | | | | | | | | | | | | | |
Type | | Position | | Settlement Date | | Receivable Amount | | | Payable Amount | | | Unrealized Gain/Loss | |
Australian Dollar | | Short | | 12/19/2007 | | ($36,700,945 | ) | | | ($34,600,384 | ) | | ($2,100,561 | ) |
Canadian Dollar | | Short | | 12/19/2007 | | (52,545,497 | ) | | | (48,575,877 | ) | | (3,969,620 | ) |
Swiss Franc | | Short | | 12/19/2007 | | (62,316,685 | ) | | | (60,852,638 | ) | | (1,464,047 | ) |
Euro-dollar | | Short | | 12/19/2007 | | (34,933,308 | ) | | | (33,977,155 | ) | | (956,153 | ) |
Pound Sterling | | Short | | 12/19/2007 | | (33,219,084 | ) | | | (32,369,373 | ) | | (849,711 | ) |
Japanese Yen | | Short | | 12/19/2007 | | (3,967,159 | ) | | | (3,986,016 | ) | | 18,857 | |
New Zealand Dollar | | Short | | 12/19/2007 | | (39,743,753 | ) | | | (37,270,935 | ) | | (2,472,818 | ) |
Swedish Krona | | Short | | 12/19/2007 | | (16,006,350 | ) | | | (15,495,166 | ) | | (511,184 | ) |
Australian Dollar | | Long | | 12/19/2007 | | 19,744,182 | | | | 18,293,051 | | | 1,451,131 | |
Canadian Dollar | | Long | | 12/19/2007 | | 35,577,404 | | | | 33,765,589 | | | 1,811,815 | |
Swiss Franc | | Long | | 12/19/2007 | | 54,305,159 | | | | 53,373,762 | | | 931,397 | |
Euro-dollar | | Long | | 12/19/2007 | | 41,437,429 | | | | 40,073,917 | | | 1,363,512 | |
Pound Sterling | | Long | | 12/19/2007 | | 21,474,426 | | | | 20,885,401 | | | 589,025 | |
Japanese Yen | | Long | | 12/19/2007 | | 32,222,051 | | | | 32,384,337 | | | (162,286 | ) |
New Zealand Dollar | | Long | | 12/19/2007 | | 51,758,949 | | | | 49,164,335 | | | 2,594,614 | |
Swedish Krona | | Long | | 12/19/2007 | | 20,388,041 | | | | 19,729,923 | | | 658,118 | |
| | | | | | | | | | | | | | |
Total | | | | | | ($2,525,140 | ) | | $ | 542,771 | | | ($3,067,911 | ) |
| | | | | | | | | | | | | | |
| 8. | Futures Contracts Held or Issued for Purposes other than Trading |
U.S. Equity uses Equity Index futures contracts to a limited extent, with the objective of maintaining exposure to equity stock markets while maintaining liquidity. Global Alternatives may use futures contracts, including futures contracts on global equity and fixed income securities, interest rate futures contracts, foreign currency futures contracts and future contracts on security indices (including broad-based security indices), for any purpose. The Funds may purchase or sell futures contracts to achieve a desired level of investment, whether to accommodate portfolio turnover or cash flows from capital shares transactions. There are certain risks associated with futures contracts. Prices may not move as expected or a Fund may not be able to close out the contract when it desires to do so, resulting in losses.
On entering into a futures contract, either cash or securities in an amount equal to a certain percentage of the contract value (initial margin) must be deposited with the futures broker. Subsequent payments (variation margin) are made or received each day. The variation margin payments equal the daily changes in the contract value and are recorded as unrealized gains or losses. The Fund recognizes a realized gain or loss when the contract is closed or expires equal to the difference between the value of the contract at the time it was opened and the value at the time it was closed. Futures are valued at their quoted daily settlement prices. The aggregate principal amounts of the contracts are not recorded in the financial statements. Fluctuations in the value of the contracts are recorded in the Statement of Assets and Liabilities as an asset (liability) and in the Statement of Operations as unrealized appreciation (depreciation) until the contracts are closed, when they are recorded as realized gains (losses) on futures or forward currency contracts.
Assets pledged to cover margin requirements for the open futures positions at October 31, 2007 amounted to $47,250 for U.S. Equity and Global Alternatives has a market value of securities pledged of $5,976,304. Each Fund had the following open futures contracts as of October 31, 2007:
FQ U.S. Equity
| | | | | | | | | |
Type | | Number of
Contracts | | Position | | Expiration
Month | | Unrealized
Gain/(Loss) |
3 Month S&P 500 | | 3 | | Long | | 12/20/2007 | | $ | 2,681 |
31
Managers AMG FQ Funds
Notes to Financial Statements (continued)
FQ Global Alternatives
| | | | | | | | | | | |
Type | | Currency | | Number of
Contracts | | Position | | Expiration Month | | Unrealized Gain/
(Loss) | |
10-Year Bond | | AUD | | 159 | | Short | | 12/17/2007 | | ($21,191 | ) |
SPI 200 Index | | AUD | | 73 | | Short | | 12/20/2007 | | (612,440 | ) |
10- Year Bond | | CAD | | 215 | | Long | | 12/18/2007 | | 110,323 | |
S&P/TSE 60 Index | | CAD | | 66 | | Short | | 12/20/2007 | | (615,444 | ) |
CAC40 10 | | EUR | | 26 | | Long | | 11/16/2007 | | 13,913 | |
Amsterdam Index | | EUR | | 5 | | Short | | 11/16/2007 | | 11,130 | |
Month DAX Index | | EUR | | 10 | | Long | | 12/21/2007 | | 81,979 | |
Month IBEX 35 Index | | EUR | | 51 | | Short | | 11/17/2007 | | (397,728 | ) |
Euro Bond | | EUR | | 210 | | Short | | 12/6/2007 | | (79,214 | ) |
S&P/MIB Index | | EUR | | 24 | | Long | | 12/21/2007 | | 51,609 | |
Gilt | | GBP | | 162 | | Short | | 12/27/2007 | | (161,244 | ) |
FTSE 100 Index | | GBP | | 4 | | Long | | 12/21/2007 | | 3,680 | |
Hang Seng Index | | HKD | | 13 | | Long | | 11/29/2007 | | 93,762 | |
10- Year Bond | | JPY | | 31 | | Long | | 12/20/2007 | | 184,669 | |
TOPIX Index | | JPY | | 82 | | Long | | 12/13/2007 | | 591,782 | |
S&P 500 Index | | USD | | 3 | | Long | | 12/20/2007 | | 12,100 | |
U.S. Long Bond | | USD | | 176 | | Long | | 12/19/2007 | | 208,156 | |
| | | | | | | | | | | |
Total | | | | | | | | | | ($524,158 | ) |
| | | | | | | | | | | |
| 9. | New Accounting Pronouncements |
In June 2006, the Financial Accounting Standards Board (“FASB”) issued Interpretation No. 48, “Accounting for Uncertainty in Income Taxes - an Interpretation of FASB Statement No. 109 (“FIN 48”).” FIN 48 applies to all registered investment companies and establishes the minimum threshold for recognizing, and a system for measuring, the benefits of tax-return positions in the financial statements. FIN 48 is effective for fiscal years beginning after December 15, 2006. Management has analyzed the FQ Tax- Managed U.S Equity and FQ U.S. Equity Funds’ tax positions taken on federal income tax returns for all open tax years (tax years ended October 31, 2004-2007) and has concluded that as of October 31, 2007, no provision for income tax would be required in the Funds’ financial statements. Additionally, Fund Management is not aware of any events that are reasonably possible to occur in the next twelve months that would result in the amounts of any unrecognized tax benefits significantly increasing or decreasing for the Funds. Management has not yet completed their analysis of the Interpretation as it relates to the FQ Global Alternatives Fund, and is not currently in a position to estimate the significance, if any, that the impact of adoption will have on the financial statements.
In addition, in September 2006, Statement of Financial Accounting Standards No. 157, Fair Value Measurements (“SFAS 157”), was issued and is effective for fiscal years beginning after November 15, 2007. SFAS 157 defines fair value, establishes a framework for measuring fair value and expands disclosures about fair value measurements. Management is currently evaluating the impact, if any, the adoption of SFAS 157 will have on the Funds’ financial statements.
Tax Information (unaudited)
The Fund hereby designates the maximum amount allowable of its net taxable income as qualified dividends as provided in the Jobs and Growth Tax Relief Reconciliation Act of 2003. The 2007 Form 1099-DIV you receive for the Fund will show the tax status of all distributions paid to you during the year.
Pursuant to section 852 of the Internal Revenue Code, Tax-Managed, U.S. Equity and Global Alternatives designate $0, $7,725,694, and $523,258, respectively, as long-term capital gains for the taxable year ended October 31, 2007.
32
Report of Independent Registered Public Accounting Firm
To the Board of Trustees of Managers Trust I and the Shareholders of Managers AMG FQ Tax-Managed U.S. Equity Fund, Managers AMG FQ U.S. Equity Fund, and Managers AMG FQ Global Alternatives Fund:
In our opinion, the accompanying statements of assets and liabilities for Managers AMG FQ Tax-Managed U.S. Equity Fund and Managers AMG FQ U.S. Equity Fund, including the schedules of portfolio investments, the statement of net assets for Managers AMG FQ Global Alternatives Fund, and the related statements of operations and of changes in net assets and financial highlights present fairly, in all material respects, the financial position of Managers AMG FQ Tax-Managed U.S. Equity Fund, Managers AMG FQ U.S. Equity Fund and Managers AMG FQ Global Alternatives Fund (the “Funds”) at October 31, 2007, the results of each of their operations for the year then ended, the changes in each of their net assets for each of two years in the period then ended, and the financial highlights for each of the periods indicated, in conformity with accounting principles generally accepted in the United States of America. These financial statements and financial highlights (hereafter referred to as “financial statements”) are the responsibility of the Funds’ management; our responsibility is to express an opinion on these financial statements based on our audits. We conducted our audits of these financial statements in accordance with the standards of the Public Company Accounting Oversight Board (United States). Those standards require that we plan and perform the audit to obtain reasonable assurance about whether the financial statements are free of material misstatement. An audit includes examining, on a test basis, evidence supporting the amounts and disclosures in the financial statements, assessing the accounting principles used and significant estimates made by management, and evaluating the overall financial statement presentation. We believe that our audits, which included confirmation of securities at October 31, 2007 by correspondence with the custodian and brokers, provide a reasonable basis for our opinion.
PricewaterhouseCoopers LLP
Philadelphia, Pennsylvania
December 21, 2007
33
Trustees and Officers
The Trustees and Officers of the Trust, their business addresses, principal occupations for the past five years and dates of birth are listed below. The Trustees provide broad supervision over the affairs of the Trust and the Funds. The Trustees are experienced executives who meet periodically throughout the year to oversee the Funds’ activities, review contractual arrangements with companies that provide services to the Funds, and review the Funds’ performance. Unless otherwise noted, the address of each Trustee or Officer is the address of the Trust: 800 Connecticut Avenue, Norwalk, Connecticut 06854.
There is no stated term of office for Trustees. Trustees serve until their resignation, retirement or removal in accordance with the Trust’s organizational documents and policies adopted by the Board from time to time. The Chairman of the Trustees, President, Treasurer and Secretary of the Trust are elected by the Trustees annually. Other Officers hold office at the pleasure of the Trustees.
Independent Trustees
The following Trustees are not “interested persons” of the Trust within the meaning of the 1940 Act:
| | |
Name, Date of Birth, Number
of Funds Overseen in Fund
Complex* | | Principal Occupation(s) During Past 5 Years and Other Directorships Held by Trustee |
Jack W. Aber, 9/9/37 • Trustee since 2000 • Oversees 31 Funds in Fund Complex | | Professor of Finance, Boston University School of Management (1972-Present); Trustee of Appleton Growth Fund (1 portfolio); Trustee of Third Avenue Trust (4 portfolios); Trustee of Third Avenue Variable Trust (1 portfolio). |
| |
William E. Chapman, II, 9/23/41 • Independent Chairman • Trustee since 2000 • Oversees 31 Funds in Fund Complex | | President and Owner, Longboat Retirement Planning Solutions (1998-Present); Hewitt Associates, LLC (part time) (provider of Retirement and Investment Education Seminars); Trustee of Bowdoin College (2002-Present); Trustee of Third Avenue Trust (4 portfolios); Trustee of Third Avenue Variable Trust (1 portfolio). |
| |
Edward J. Kaier, 9/23/45 • Trustee since 2000 • Oversees 31 Funds in Fund Complex | | Attorney at Law and Partner, Teeters Harvey Kilboy & Kaier LLP (2007-Present); Attorney at Law and Partner, Hepburn Willcox Hamilton & Putnam, LLP (1977-2007); Trustee of Third Avenue Trust (4 portfolios); Trustee of Third Avenue Variable Trust (1 portfolio). |
| |
Steven J. Paggioli, 4/3/50 • Trustee since 2000 • Oversees 31 Funds in Fund Complex | | Consultant (2001-Present); Formerly Executive Vice President and Director, The Wadsworth Group (1986-2001); Executive Vice President, Secretary and Director, Investment Company Administration, LLC (1990-2001); Vice President, Secretary and Director, First Fund Distributors, Inc. (1991-2001); Trustee, Professionally Managed Portfolios (22 portfolios); Advisory Board Member, Sustainable Growth Advisors, LP. |
| |
Eric Rakowski, 6/5/58 • Trustee since 2000 • Oversees 31 Funds in Fund Complex | | Professor, University of California at Berkeley School of Law (1990-Present); Trustee of Third Avenue Trust (4 portfolios); Trustee of Third Avenue Variable Trust (1 portfolio). |
| |
Thomas R. Schneeweis, 5/10/47 • Trustee since 2000 • Oversees 31 Funds in Fund Complex | | Professor of Finance, University of Massachusetts (1977-Present); Director, CISDM at the University of Massachusetts, (1996-Present); President, Alternative Investment Analytics, LLC, (formerly Schneeweis Partners, LLC) (2001-Present); Partner, White Bear Partners, LLC (2007-Present); Partner, Schneeweis Capital Management, LLC (2007-Present); Partner, Schneeweis Associates, LLC (2007-Present); Partner, Northampton Capital Management, LLC (2004-Present); Partner, TRS Associates (2007-Present). |
| * | The Fund Complex consists of Managers AMG Funds, The Managers Funds, Managers Trust I and Managers Trust II. |
Interested Trustee
The following Trustee is an “interested person” of the Trust within the meaning of the 1940 Act by virtue of his positions with, and interest in securities of, Affiliated Managers Group, Inc.
| | |
Name, Date of Birth, Number
of Funds Overseen in Fund
Complex* | | Principal Occupation(s) During Past 5 Years and Other Directorships Held by Trustee |
William J. Nutt, 3/30/45 • Trustee since 2005 • President since 2007 • Oversees 31 Funds in Fund Complex | | Chairman and Founder of Affiliated Managers Group, Inc., (1993-Present); Chief Executive Officer of Affiliated Managers Group, Inc. (1993-2004); Director, Affiliated Managers Group, Inc. (1993-Present); President of Affiliated Managers Group, Inc. (1993-1999); President and Chief Operating Officer, The Boston Company (1989-1993); Senior Executive Vice President, The Boston Company (1982-1989). |
Officers
| | |
Name, Date of Birth,
Position(s) Held with Fund
and Length of Time Served | | Principal Occupation(s) During Past 5 Years |
Christine C. Carsman, 4/2/52 • Secretary since 2004 | | Senior Vice President and Chief Regulatory Counsel, Affiliated Managers Group, Inc. (2004-Present); Secretary, The Managers Funds, Managers AMG Funds and Managers Trust II (2004-Present); Senior Counsel, Vice President and Director of Operational Risk Management and Compliance, Wellington Management Company, LLP (1995-2004); Deputy General Counsel, The Boston Company, Inc. (1993-1995); Associate General Counsel, The Boston Company Advisors, Inc. (1991-1993); Associate, Sullivan & Worcester LLP (1987-1991). |
| |
Donald S. Rumery, 5/29/58 • Chief Financial Officer since 2007 • Treasurer since 2000 | | Senior Vice President, Managers Investment Group LLC (2005-Present); Director, Finance and Planning, The Managers Funds LLC, (1994-2004); Treasurer and Chief Financial Officer, Managers Distributors, Inc. (2000-Present); Treasurer, The Managers Funds (1995-Present); Treasurer, Managers AMG Funds (1999-Present); Treasurer, Managers Trust II (2000-Present); Secretary, Managers Trust I and Managers Trust II (2000-2004) and Secretary, The Managers Funds (1997-2004); Chief Financial Officer, The Managers Funds, Managers Trust II and Managers AMG Funds (2007-Present). |
| |
Keitha L. Kinne, 5/16/58 • Chief Operating Officer since 2007 | | Managing Partner and Chief Operating Officer, Managers Investment Group LLC (2007-Present); Chief Operating Officer, The Managers Funds, Managers AMG Funds and Managers Trust II (2007-Present); Managing Director, Legg Mason & Co., LLC (2006-2007); Managing Director, Citigroup Asset Management (2004-2006); Senior Vice President, Prudential Investments (1999-2004). |
34
Annual Renewal of Investment Advisory Agreements
On June 8, 2007, the Board of Trustees, including a majority of the Trustees who are not “interested persons” of the Trust (the “Independent Trustees”), approved the Investment Management Agreement with the Investment Manager for each of the Managers AMG FQ U.S. Equity Fund, Managers AMG FQ Tax-Managed U.S. Equity Fund and Managers AMG FQ Global Alternatives Fund (each, a “Fund”) and the Subadvisory Agreement with respect to each Fund. The Independent Trustees were separately represented by independent counsel in connection with their consideration of the approval of these agreements. In considering the Investment Management and Subadvisory Agreements, the Trustees reviewed a variety of materials relating to each Fund, the Investment Manager and the Subadvisor, including comparative performance, fee and expense information for an appropriate peer group of similar mutual funds for each Fund (each, a “Peer Group”), performance information for the relevant benchmark index for each Fund (each, a “Fund Benchmark”) and other information regarding the nature, extent and quality of services provided by the Investment Manager and the Subadvisor under their respective agreements. The Trustees also took into account performance, fee and expense information regarding the Funds provided to them on a quarterly basis throughout the year. Prior to voting, the Independent Trustees: (a) reviewed the foregoing information with their independent legal counsel and with management; (b) received materials from their independent legal counsel discussing the legal standards applicable to their consideration of the Investment Management and Subadvisory Agreements; and (c) met with their independent legal counsel in private sessions at which no representatives of management were present.
Nature, extent and quality of services. In considering the nature, extent and quality of the services provided by the Investment Manager, the Trustees reviewed information relating to the Investment Manager’s operations and personnel. Among other things, the Investment Manager provided financial information, biographical information on its supervisory and professional staff and descriptions of its organizational and management structure. The Trustees also took into account information provided periodically throughout the previous year by the Investment Manager relating to the performance of its duties with respect to the Funds and the Trustees’ familiarity with the Investment Manager’s management through Board meetings, discussions and reports. In the course of their deliberations regarding the Investment Management Agreement, the Trustees evaluated, among other things: (a) the quality of the Investment Manager’s oversight of the performance by the Subadvisor of its portfolio management duties; (b) the Investment Manager’s ability to supervise the Funds’ other service providers; and (c) the Investment Manager’s compliance programs. The Trustees also took into account the financial condition of the Investment Manager with respect to its ability to provide the services required under the Investment Management Agreement and the Investment Manager’s undertaking to implement an expense limitation for certain of the Funds.
The Trustees also reviewed information relating to the Subadvisor’s financial condition, operations and personnel and the investment philosophy, strategies and techniques (its “Investment Strategy”) used in managing each Fund. Among other things, the Trustees reviewed biographical information on portfolio management and other professional staff, information regarding the Subadvisor’s organizational and management structure and the Subadvisor’s brokerage policies and practices. The Trustees considered specific information provided regarding the experience of the individuals at the Subadvisor with portfolio management responsibility for the Funds, including the information set forth in each Fund’s prospectus and statement of additional information. In the course of their deliberations, the Trustees evaluated, among other things: (a) the services rendered by the Subadvisor in the past; (b) the qualifications and experience of the Subadvisor’s personnel; and (c) the Subadvisor’s compliance programs. The Trustees also took into account the financial condition of the Subadvisor with respect to its ability to provide the services required under each Subadvisory Agreement.
Performance. With respect to the Managers AMG FQ U.S. Equity Fund, among other information related to the Fund’s performance, the Trustees noted that the Fund’s performance for the 1-year, 3-year, 5-year and 10-year periods ended March 31, 2007 was above, above, above and below, respectively, the median performance of its Peer Group and above, above, below and below, respectively, the performance of the Russell 3000® Index, which is the Fund Benchmark. They also noted that the Fund’s current Subadvisor was engaged in 2004. The Trustees concluded that the Fund’s performance has been satisfactory.
With respect to the Managers AMG FQ Tax-Managed U.S. Equity Fund, among other information related to the Fund’s performance, the Trustees noted that the Fund’s performance for the 1-year, 3-year and 5-year periods ended March 31, 2007 was above the median performance of its Peer Group and above the performance of the Russell 3000® Index, the Fund Benchmark, for all such periods. The Trustees concluded that the Fund’s performance has been satisfactory.
With respect to the Managers AMG FQ Global Alternatives Fund, among other information related to the Fund’s performance, the Trustees noted that the Fund’s performance for the 1-year period ended March 31, 2007 was below the median performance of its Peer Group and below the performance of the Citigroup 1-Month T-Bill Index, which is the Fund’s Benchmark. Because the Fund commenced operations on March 30, 2006, the Trustees noted that the performance history was too brief to warrant the drawing of any conclusions.
As noted above, the Board considered each Fund’s performance during relevant time periods as compared to the Fund’s Peer Group and noted that the Board reviews on a quarterly basis detailed information about each Fund’s performance results and portfolio composition as well as the Subadvisor’s Investment Strategy. The Board noted the Investment Manager’s expertise and resources in monitoring the performance, investment style and risk adjusted performance of the Subadvisor.
Advisory and Subadvisory Fees and Profitability. In considering the reasonableness of the advisory fee payable to the Investment Manager and the subadvisory fee payable by the Investment Manager to the Subadvisor, the Trustees reviewed information provided by the Investment Manager setting forth all revenues and other benefits, both direct and indirect, received by the Investment Manager and its affiliates attributable to managing each Fund and all the mutual funds in the Managers Family of Funds, the cost of providing such services and the resulting profitability to the Investment Manager and its affiliates from these relationships. The Trustees noted that the Investment Manager and the Subadvisor are affiliated and that, in the case of the Managers AMG FQ Tax-Managed U.S. Equity Fund and the Managers AMG FQ Global Alternatives Fund, the Investment Manager pays the Subadvisor a subadvisory fee that is equal to the advisory fee that it receives from the Fund. The Trustees also noted the current asset levels of the Funds and the impact on profitability of any future growth of assets of the Funds.
35
Annual Renewal of Investment Advisory Agreements (continued)
In considering the cost of services to be provided by the Investment Manager under the Investment Management Agreement and the profitability to the Investment Manager of its relationship with the Funds, the Trustees noted the current asset level of the Funds and the undertaking by the Investment Manager to maintain contractual expense limitations for the Managers AMG FQ Tax-Managed U.S. Equity Fund and the Managers AMG FQ Global Alternatives Fund and a voluntary expense limitation for the AMG FQ U.S. Equity Fund. Based on the foregoing, the Trustees concluded that the profitability to the Investment Manager is reasonable and that the Investment Manager is not realizing material benefits from economies of scale that would warrant adjustments to the advisory fee at this time. Also with respect to economies of scale, the Trustees noted that as a Fund’s assets increase over time, the Fund may realize other economies of scale to the extent the increase in assets is proportionally greater than the increase in certain other expenses.
In considering the reasonableness of the subadvisory fees payable by the Investment Manager to the Subadvisor, the Trustees reviewed information provided by the Subadvisor regarding the cost of providing subadvisory services to each of the Funds and the resulting profitability to the Subadvisor from these relationships. In considering the cost of services to be provided by the Subadvisor under the Subadvisory Agreements and the profitability to the Subadvisor of its relationship with the Funds, the Trustees noted the current asset level of the Funds and the undertaking by the Investment Manager to maintain a contractual expense limitation for the Managers AMG FQ Tax-Managed U.S. Equity Fund and the Managers AMG FQ Global Alternatives Fund and a voluntary expense limitation for the AMG FQ U.S. Equity Fund.
With respect to the Managers AMG FQ U.S. Equity Fund, the Trustees noted that the Fund’s advisory fee and total expenses (net of applicable expense waivers/reimbursements) as of October 31, 2006 were lower than the average for the Fund’s Peer Group. The Trustees took into account the fact that the Investment Manager has voluntarily agreed through March 1, 2008 to limit the net annual operating expenses of the Fund’s Institutional Class shares to 0.79% and also noted that such arrangement may be modified or terminated by the Investment Manager at anytime. The Trustees concluded that, in light of the nature, extent and quality of the services provided by the Investment Manager and the Subadvisor, the Fund’s performance, and the considerations noted above with respect to the Subadvisor and the Investment Manager, the Fund’s advisory fees are reasonable.
With respect to the Managers AMG FQ Tax-Managed U.S. Equity Fund, the Trustees noted that the Fund’s advisory fee and total expenses (net of applicable expense waivers/reimbursements) as of October 31, 2006 were higher and lower, respectively, than the average for the Fund’s Peer Group. The Trustees took into account the fact that the Investment Manager has contractually agreed through March 1, 2008 to limit the Fund’s net annual operating expenses to 0.99%, 1.24%, and 1.99% for Institutional Class Shares, Class A Shares, and Class C Shares, respectively. The Trustees concluded that, in light of the nature, extent and quality of the services provided by the Investment Manager and the Subadvisor, the Fund’s performance, the Investment Manager’s undertaking to limit the total expenses of the Fund and the considerations noted above with respect to the Subadvisor and the Investment Manager, the Fund’s advisory fees are reasonable.
With respect to the Managers AMG FQ Global Alternatives Fund, the Trustees noted that the Fund’s advisory fee and total expenses (net of applicable expense waivers/reimbursements) as of October 31, 2006 were higher than the average for the Fund’s Peer Group. In this regard, the Trustees noted that because of the Investment Strategy of the Fund, the Peer Group contains a small group of funds, some of which pursue an investment strategy considerably different from that of the Fund. The Trustees took into account the fact that the Investment Manager has contractually agreed through March 1, 2008 to limit the Fund’s net annual operating expenses to 2.50% for Class A shares and 3.25% for Class C Shares. The Trustees concluded that, in light of the nature, extent and quality of the services to be provided by the Investment Manager and the Subadvisor, the Investment Manager’s undertaking to limit the total expenses of the Fund and the considerations noted above with respect to the Subadvisor and the Investment Manager, the Fund’s advisory fees are reasonable.
* * * *
After consideration of the foregoing, the Trustees also reached the following conclusions regarding the Investment Management and Subadvisory Agreements in addition to the conclusions discussed above: (a) the Investment Manager has demonstrated that it possesses the resources and capability to perform its duties under the Investment Management Agreement; (b) the Subadvisor has the resources to perform its duties under the Subadvisory Agreements and is qualified to manage each Fund’s assets in accordance with its investment objectives and policies; and (c) the Investment Manager and Subadvisor maintain appropriate compliance programs.
Based on all of the above-mentioned factors and their related conclusions, with no single factor or conclusion being determinative and with each Trustee not necessarily attributing the same weight to each factor, the Trustees concluded that approval of the Investment Management Agreement and each Subadvisory Agreement (as applicable) would be in the interests of each Fund and its shareholders. Accordingly, on June 8, 2007, the Trustees, including a majority of the Independent Trustees, voted to approve the Investment Management and Subadvisory Agreements for each Fund.
36
THIS PAGE INTENTIONALLY LEFT BLANK
THIS PAGE INTENTIONALLY LEFT BLANK
Investment Manager and Administrator
Managers Investment Group LLC
800 Connecticut Avenue
Norwalk, Connecticut 06854
(203) 299-3500 or (800) 835-3879
Distributor
Managers Distributors, Inc.
800 Connecticut Avenue
Norwalk, Connecticut 06854
(203) 299-3500 or (800) 835-3879
Subadvisor
First Quadrant, L.P.
800 E. Colorado Boulevard, Suite 900
Pasadena, CA 91101
Custodian
The Bank of New York
2 Hanson Place
Brooklyn, New York 11217
Legal Counsel
Ropes & Gray LLP
One International Place
Boston, Massachusetts 02110-2624
Transfer Agent
PFPC, Inc.
Attn: Managers
P.O. Box 9769
Providence, Rhode Island 02940
(800) 548-4539
For Managers Choice Only
Managers
P.O. Box 61204
King of Prussia, Pennsylvania 19406-0851
(800) 358-7668

MANAGERSAND MANAGERS AMG EQUITY FUNDS
EMERGING MARKETS EQUITY
Rexiter Capital Management Limited
ESSEX GROWTH
ESSEX LARGE CAP GROWTH
ESSEX SMALL/MICRO CAP GROWTH
Essex Investment Management Co., LLC
FQ TAX-MANAGED U.S. EQUITY
FQ U.S. EQUITY
First Quadrant, L.P.
INSTITUTIONAL MICRO-CAP
MICRO-CAP
Lord, Abbett & Co. LLC
WEDGE Capital Management L.L.P.
OFI Institutional Asset Management
Next Century Growth Investors, LLC
INTERNATIONAL EQUITY
Alliance Bernstein L.P.
Lazard Asset Management, LLC
Wellington Management Company, LLP
CHICAGO EQUITY PARTNERS
MID-CAP
Chicago Equity Partners, LLC
REAL ESTATE SECURITIES
Urdang Securities Management, Inc.
SMALL CAP
TIMESSQUARE MID CAP GROWTH
TIMESSQUARE SMALL CAP GROWTH
TimesSquare Capital Management, LLC
SMALL COMPANY
Epoch Investment Partners, Inc.
Kalmar Investment Advisers, Inc.
SPECIAL EQUITY
Donald Smith & Co., Inc.
Lord, Abbett & Co. LLC
Skyline Asset Management, L.P.
Smith Asset Management Group, LP
Veredus Asset Management LLC
Westport Asset Management, Inc.
SYSTEMATIC VALUE
SYSTEMATIC MID CAP VALUE
Systematic Financial Management, L.P.
VALUE
Armstrong Shaw Associates Inc.
Osprey Partners Investment Mgmt., LLC
MANAGERS AND MANAGERS AMG
BALANCED FUNDS
CHICAGO EQUITY PARTNERS BALANCED
Chicago Equity Partners, LLC
GLOBAL
Armstrong Shaw Associates Inc.
Alliance Bernstein L.P.
First Quadrant, L.P.
Northstar Capital Management, Inc.
Wellington Management Company, LLP
ALTERNATIVE FUNDS
FQ GLOBAL ALTERNATIVES
First Quadrant, L.P.
MANAGERS
FIXED INCOME FUNDS
BOND (MANAGERS)
FIXED INCOME
GLOBAL BOND
Loomis, Sayles & Company L.P.
BOND (MANAGERS FREMONT)
Pacific Investment Management Co. LLC
CALIFORNIA INTERMEDIATE TAX-FREE
Evergreen Investment Management Co., LLC
HIGH YIELD
J.P. Morgan Investment Management Inc.
INTERMEDIATE DURATION GOVERNMENT
SHORT DURATION GOVERNMENT
Smith Breeden Associates, Inc.
MONEY MARKET
JPMorgan Investment Advisors Inc.
This report is prepared for the Funds’ shareholders. It is authorized for distribution to prospective investors only when preceded or accompanied by an effective prospectus. To receive a free copy of the prospectus or Statement of Additional Information, which includes additional information about Fund Trustees, please contact us by calling 800.835.3879. Distributed by Managers Distributors, Inc., member FINRA.
A description of the policies and procedures each Fund uses to vote its proxies is available: (i) without charge, upon request, by calling 800.835.3879, or (ii) on the Securities and Exchange Commission’s (SEC) Web site at www.sec.gov. For information regarding each Fund’s proxy voting record for the 12-month period ended June 30, call 800.835.3879 or visit the SEC Web site at www.sec.gov.
The Funds file their complete schedule of portfolio holdings with the SEC for the first and third quarters of each fiscal year on Form N-Q. The Funds’ Forms N-Q are available on the SEC’s website at www.sec.gov. A Fund’s Forms N-Q may be reviewed and copied at the SEC’s Public Reference Room in Washington, DC. Information on the operation of the Public Reference Room may be obtained by calling 800.SEC.0330. To review a complete list of the Funds’ portfolio holdings, or to view the most recent quarterly holdings report, semiannual report, or annual report, please visit www.managersinvest.com.

www.managersinvest.com
ANNUAL REPORT
Managers Funds
October 31, 2007
Managers Fremont Bond Fund
Managers Fremont Bond Fund
Annual Report — October 31, 2007
TABLE OF CONTENTS
| | |
| | | Page |
LETTER TO SHAREHOLDERS | | 1 |
| |
ABOUT YOUR FUND’S EXPENSES | | 3 |
| |
PORTFOLIO MANAGER COMMENTS | | 4 |
| |
FUND SNAPSHOTS | | 7 |
Summary of portfolio credit quality and top ten holdings at October 31, 2007 | | |
| |
SCHEDULE OF PORTFOLIO INVESTMENTS | | 8 |
| |
FINANCIAL STATEMENTS: | | |
| |
Statement of Assets and Liabilities | | 18 |
Fund balance sheet, net assSummary of portfolio credit quality and top ten holdings at October 31, 2007 et value (NAV) per share computation and cumulative undistributed amount | | |
| |
Statement of Operations | | 19 |
Detail of sources of income, Fund expenses, and realized and unrealized gains (losses) during the fiscal year | | |
| |
Statement of Changes in Net Assets | | 20 |
Detail of changes in Fund assets for the past two fiscal years | | |
| |
FINANCIAL HIGHLIGHTS | | 21 |
Historical net asset values per share, distributions, total returns, expense ratios, turnover ratios and net assets | | |
| |
NOTES TO FINANCIAL STATEMENTS | | 22 |
Accounting and distribution policies, details of agreements and transactions with Fund management and affiliates, and descriptions of certain investment risks | | |
| |
REPORT OF INDEPENDENT REGISTERED PUBLIC ACCOUNTING FIRM | | 30 |
| |
TRUSTEES AND OFFICERS | | 31 |
| |
ANNUAL RENEWAL OF INVESTMENT ADVISORY AGREEMENT | | 32 |
Nothing contained herein is to be considered an offer, sale or solicitation of an offer to buy shares of The Managers Funds or Managers AMG Funds. Such offering is made only by Prospectus, which includes details as to offering price and other material information.
Letter to Shareholders
Dear Fellow Shareholder:
Financial markets have been increasingly unsettled this past year, particularly during the summer months and currently as we write this report. While the economy has continued to grow, a liquidity crisis initiated by spreading weakness in subprime mortgage loans increased uncertainty about its sustainability. Bonds of all credit quality became unusually volatile, and credit spreads, having been extremely slim, widened dramatically, raising the cost of capital for many borrowers. Naturally the equity markets followed suit and became more volatile as the rising cost of capital pressured corporate profitability, penalized leverage, and hindered merger and acquisition activity.
As has been well documented in the financial press, the continued weakness in residential housing prices, combined with gradually rising interest rates, has put severe stress on low credit-quality (subprime) borrowers. Rising defaults pushed several mortgage lenders and leveraged subprime mortgage investors toward bankruptcy and catalyzed a swift and broad flight from various forms of investment risk over the past few months. These revelations began creating serious liquidity problems in the credit markets late in the second quarter and have been the root of uncertainty and market volatility ever since.
A rapid and at times indiscriminate flight from risk created unusual patterns of volatility within the bond market. Credit spreads widened significantly throughout July, as Moody’s and S&P downgraded hundreds of securities, and price moves forced leveraged investors to raise cash any way they could. Since much of the leverage had been funded with short-term debt, the short end of the yield curve bore the brunt of the liquidity crisis. The typically docile commercial paper market seized as demand dried up, and short-term Treasury yields vacillated between 2.9% and 4.9% as investors raced to safety, causing a dislocation in prices. Since then, prices for credits have generally recovered, as the Federal Reserve pumped liquidity into the system and investors have had time to evaluate underlying fundamentals and adjust their portfolios in a more rational manner.
After rallying strongly off of a February trough, the stock market followed the lead of the credit markets by trading sharply down during the liquidity crisis in July, then recovering from late August through October. Here, too, there were interesting anomalies in the indiscriminate flight from risk. Not surprisingly, small- and mid-cap stocks reacted more during the price declines, and underperformed large-cap stocks during the period. Interestingly however, growth indices, which would normally react poorly to a rise in interest rates or a liquidity squeeze, significantly outperformed value indices during the period. We believe there were two primary reasons for this. One, since value indices had outperformed growth indices for an extended period of time, a typical “reversion to the mean” took place. Two, the quick reduction of leverage from the markets in general forced many quantitatively based hedge fund managers to reverse their trades in a very quick fashion. As it turned out, many of these investors used similar value-biased models to guide their purchase and sale decisions. The result was that the same stocks were being sold off not only for investment reasons, but also because of liquidity needs. Stocks recovered in late August and throughout October, as a result of an infusion of liquidity by the Federal Reserve, increasing visibility about where the risks were residing, and a well-received reduction of the Fed Funds Rate in mid-September.
Despite these market forces, the Managers Fremont Bond Fund provided a positive return, exceeded the return of its primary benchmark, and performed well relative to its peer group during the 12-months ended October 31, 2007 (the Fund’s fiscal year end). While it had generally lagged its peers and benchmark during the first six months of the period because of generally conservative positioning with respect to credit exposure, the Fund was rewarded during the latter half of the year as investors fled from credit risk and complex collateral structures. This serves as another example of the fact that investment decisions most often cannot be precisely timed and that investment management requires discipline and fortitude in the face of both rising and falling markets. Overall, we are pleased with the manager’s actions and portfolio positioning in this challenging environment. A more detailed review of the performance and positioning of the Fund is included within this report.
Lingering credit problems and further revelations of losses from large financial institutions are hindering not only the financial markets, but the economy as well. In our opinion, it appears this will continue for some time, pushing the economy closer to the tipping point of recession. Uncertainty about whether it will tip has driven volatility higher, as the financial markets have traded sharply higher or lower depending upon the news each day. The Federal Reserve has been accommodating, and although we think the risk of recession has increased, we still believe that portions of the U.S. and global economies remain healthy. In sum, we continue to believe that investors should maintain their portfolios with allocations near their long-run targets, rebalance if necessary and take full advantage of opportunities to participate in the growth of the global economy.
1
Letter to Shareholders (continued)
One of our foremost goals at Managers Investment Group is to structure and manage mutual funds that will help our shareholders and clients become more successful in reaching their investment goals and objectives. Each of our Funds is geared to provide you with exposure to a specific asset class, combination of asset classes, or segment of the market. Investors tend to use our Funds as part of their overall asset allocation in order to structure a well-diversified portfolio intended to meet individual needs. Most of our Funds, like the Managers Fremont Bond Fund, are therefore designed to be building blocks.
The following report covers the one-year period ending October 31, 2007. Should you have any questions about this report, or if you’d like to receive a Prospectus and additional information, including fees and expenses, for this or any of the other Funds in our family, please feel free to contact us at 1-800-835-3879, or visit our website at www.managersinvest.com. As always, please read the Prospectus carefully before you invest or send money.
If you are curious about how you can better diversify your investment program, visit the Knowledge Center on our Web site and view our articles in the investment strategies section. You can rest assured that under all market conditions our team is focused on delivering excellent investment management services for your benefit.
We thank you for your continued confidence and investment in The Managers Funds.
| | | | |
| Sincerely, | | | | |
| | |
| | | | |
| John H. Streur | | | | Thomas G. Hoffman, CFA |
| Senior Managing Partner | | | | Executive Vice President |
| Managers Investment Group LLC | | | | Chief Investment Officer |
| | | | Managers Investment Group LLC |
2
About Your Fund’s Expenses
As a shareholder of the Fund, you may incur two types of costs: (1) transaction costs, which may include sales charges (loads) on purchase payments; redemption fees; and exchange fees; and (2) ongoing costs, including management fees; distribution (12b-1) fees; and other Fund expenses. This Fund incurs only ongoing costs. This example is intended to help you understand your ongoing costs (in dollars) of investing in the Fund and to compare these costs with the ongoing costs of investing in other mutual funds. The example is based on an investment of $1,000 invested at the beginning of the period and held for the entire period as indicated below.
Actual Expenses
The first line of the table below provides information about the actual account values and actual expenses. You may use the information in this line, together with the amount you invested, to estimate the expenses that you paid over the period. Simply divide your account value by $1,000 (for example, an $8,600 account value divided by $1,000 = 8.6), then multiply the result by the number in the first line under the heading entitled “Expenses Paid During Period” to estimate the expenses you paid on your account during this period.
Hypothetical Example for Comparison Purposes
The second line of the table below provides information about hypothetical account values and hypothetical expenses based on the Fund’s actual expense ratio and an assumed annual rate of return of 5% before expenses, which is not the Fund’s actual return. The hypothetical account values and expenses may not be used to estimate the actual ending account balance or expenses you paid for the period. You may use this information to compare the ongoing costs of investing in the Fund and other funds by comparing this 5% hypothetical example with the 5% hypothetical examples that appear in the shareholder reports of other funds.
Please note that the expenses shown in the table are meant to highlight your ongoing costs only and do not reflect any transactional costs, such as sales charges (loads), redemption fees, or exchange fees. Therefore, the second line of the table is useful in comparing ongoing costs only, and will not help you determine the relative total costs of owning different funds.
| | | | | | | | | | | | |
Six Months Ended October 31, 2007 | | Expense
Ratio | | | Beginning
Account Value
5/1/07 | | Ending
Account Value
10/31/07 | | Expenses Paid
During the
Period* |
Managers Fremont Bond Fund | | | | | | | | | | | | |
Actual | | 0.60 | % | | $ | 1,000 | | $ | 1,021 | | $ | 3.06 |
Hypothetical (5% return before expenses) | | 0.60 | % | | $ | 1,000 | | $ | 1,022 | | $ | 3.06 |
| * | Expenses are equal to the Fund’s annualized expense ratio multiplied by the average account value over the period, multiplied by the number of days in the most recent fiscal half-year (184), then divided by 365. |
3
Managers Fremont Bond Fund
Portfolio Managers’ Comments
Managers Fremont Bond Fund seeks to maximize total return consistent with the preservation of capital by investing in debt securities such as corporate, mortgage-backed, international and government bonds. Normally, the Fund will invest at least 80% of its total assets in these types of bonds.
The Portfolio Manager
Pacific Investment Management Company, LLC (“PIMCO”), the subadvisor for the Managers Fremont Bond Fund was founded in 1971. PIMCO is one of the world’s leading fixed income managers with expertise and significant resources committed to virtually every sector of the global bond market.
Managers Fremont Bond Fund (‘the Fund”) is an actively managed, diversified bond fund that focuses on intermediate-term, investment-grade bonds. The universe for the Fund includes all sectors of the bond market: governments, corporate bonds, mortgages, asset-backed securities, money market instruments and international bonds. The Fund seeks total return consistent with preservation of capital by employing PIMCO’s “Total Return” fixed investment philosophy. This philosophy follows three key principles:
| | • | | Major shifts in portfolio strategy are driven by longer-term, or secular, trends as opposed to short-term interest rate fluctuations. |
| | • | | Consistent investment performance is achieved by avoiding extreme swings in maturity/duration of a portfolio. |
| | • | | Emphasis is placed on adding value through state-of-the-art tools such as futures, options and volatility analysis. |
Economic analysis serves as the base for PIMCO’s portfolio strategy. Annually, PIMCO investment professionals conduct a 3-day secular forum, where long-term economic and market forces are evaluated and portfolio strategies are set. Each quarter, the team meets to evaluate the current business cycle and develop shorter-term forecasts which are used to fine-tune investment strategy. PIMCO’s fixed income research efforts focus on identifying relative value and understanding the risks inherent in different portfolio structures, strategies and bond market sectors. Using proprietary analytics and bottom-up credit analysis, the portfolio managers select individual bonds based on recommendations from sector analysts (who specialize in corporate, mortgage, high yield, government and international bonds).
The ideal investment exhibits many of the following traits:
| | • | | It allows management to meet its overall portfolio positioning targets. Management typically invests in investment grade securities but may invest up to 10% of the portfolio in securities that are below investment grade. |
| | • | | The investment has been independently analyzed by PIMCO. PIMCO does not rely solely on the credit ratings assigned by outside credit agencies. |
| | • | | Fund management deems that the security provides value relative to other securities within the same sector. |
The portfolio management team:
| | • | | Is committed to seeking value across all bond market sectors. |
| | • | | Actively manages duration exposure, yield curve position, volatility, sector allocation and security selection and takes only modest exposures in each of these areas relative to the market. |
| | • | | Normally hedges at least 75% of its foreign currency exposure. |
| | • | | Utilizes derivatives (futures, options, swap agreements) as substitutes for physical securities as a means of gaining more cost-effective exposure. |
The investment team may sell securities when:
| | • | | Securities individually no longer represent relative value. |
| | • | | Fund management makes a shift in its portfolio strategy (change in duration, yield curve positioning, sector strategy, etc.) |
The Year in Review
The U.S. bond market was headlined by the subprime fallout in the fiscal year ended October 31, 2007. As a result, volatility ultimately returned to financial markets with a vengeance, especially during the latter half of the year, with sentiment about the dimensions of the subprime problem shifting almost daily. In this setting, Treasuries began outperforming most fixed income sectors. The Federal Reserve eventually moved to lower interest rates after August news that included a weak jobs report, a decline in retail sales, and no sign of a bottom in the beleaguered housing market in an effort to stave off any harm brought to the broader economy by these issues. Yield curves had steepened in the U.S., U.K., and Europe even before the interest rate cuts by the Fed in anticipation of such a move. Credit markets were slightly calmer by the end of the fiscal year as expectations rose that the Fed would continue to ease as needed.
For the fiscal year ended October 31, 2007, the Managers Fremont Bond Fund returned 5.96%, compared to a return of 5.38% for its benchmark, the Lehman Brothers Aggregate Bond Index. The positive relative performance was driven by various sources and was primarily concentrated in the first and third calendar quarters of 2007. The portfolio has primarily benefited over the previous fiscal year from its focus on higher quality assets with shorter maturities. This emphasis on shorter maturities, particularly in the U.S. and U.K., was beneficial as these yield curves began to steepen. In addition, the non-U.S. dollar exposure of the portfolio has also helped performance as the dollar continued to weaken relative to foreign currencies over the previous 12 months. The above-index duration of the portfolio was a positive contributor to performance as interest rates fell towards the end of the year as PIMCO had long anticipated. The portfolio was also positioned well from a sector perspective over the last year maintaining an underweight to corporate bonds which lagged Treasuries, particularly as investors became more concerned about the credit situation in global capital markets.
Looking Forward
The portfolio management team at PIMCO believes that the most likely outcome for the global economy over the next year is a soft landing with modest disinflation. Central banks will help avert a recession in developed economies beset by the subprime-induced credit crisis, though the restructuring process brought on by this crisis could have at least another 18 months to run. The U.S. economy should continue to decelerate into “stall speed’ growth in the 1-2 percent range. The key elements of PIMCO’s outlook include:
| | • | | Contagion – In contrast to 1997-1998, when financial market turmoil started in emerging markets and spread to developed economies, this time contagion began in the U.S., the U.K., |
4
Managers Fremont Bond Fund
Portfolio Managers’ Comments (continued)
| | Australia, and Europe. Contrary to expectations of many investors and even the Federal Reserve, the effects of a weak U.S. property market and the subprime debacle were not contained within the U.S. mortgage market but spread more broadly, dampening global risk appetites and contracting liquidity. |
| | • | | Decoupling – Over a cyclical time frame, subprime contagion should mute the decoupling of global growth across regions that was in evidence prior to the crisis. Over the longer run, however, PIMCO remains an advocate of the decoupling thesis, which holds that growth in global economies, especially rapidly expanding emerging markets, will move ahead even as U.S. growth cools. |
| | • | | Re-intermediation – Avoiding a global recession will depend on how smoothly assets from subprime-related financing vehicles can be re-intermediated back into the traditional banking system. Overall credit availability is likely to tighten as traditional banks are forced to honor financing commitments to non-bank and off-balance sheet entities in the “shadow” banking system. The percentage of banks tightening has already jumped. |
| | • | | Normalization – Central banks will try to ease re-intermediation and create a more normalized financial environment. PIMCO expects the Fed to take the federal funds rate into the high 3 percent range to achieve this aim. Other central banks are likely to ease or shelve plans to raise rates, implying steeper yield curves worldwide. Relatively low U.S. rates point to a soft U.S. dollar. |
| | • | | Financial Turmoil to Crimp Growth in Europe, Japan – Robust capital spending and exports should keep Europe’s growth higher than the U.S. Still, financial market turmoil will mitigate this decoupling, as European businesses find bank financing harder to get. Capital spending has also spurred growth in Japan, but heightened global risk aversion could reduce the incentive to borrow cheaply in yen to buy risky assets. Resulting upward pressure on the yen could hurt corporate profits and discourage investment. |
| | • | | Resilient Emerging Economies – Emerging economies, including China, are contributing greater shares of global GDP and consumption growth. Even so, they will not be unaffected by slower growth in the developed world since they will be reliant on external demand for years to come. A positive for many emerging markets will be their low debt to GDP ratios, which should allow them to use fiscal stimulus to counter weakening demand from the developed world. |
PIMCO believes that financial restructuring and an expected economic slowdown brought on by the subprime crisis are likely to extend throughout its cyclical timeframe. Therefore, PIMCO is expected to retain an emphasis on higher quality assets as well as strategies that take advantage of expected monetary easing and a weakening U.S. dollar. At the same time, the manager will seek to add holdings of credit-related assets where valuations are compelling. This positioning includes:
| | • | | Interest Rate Strategies �� A focus on the front end of the yield curve in the U.S. and U.K. to exploit expected curve steepening will be the centerpiece of PIMCO’s interest rate strategies. The team remains bullish with respect to the direction of interest rates but believes the yield curve effects will be the most powerful. The Fund’s duration position is expected to be neutral to slightly overweight and represent a smaller contribution to overall risk exposure. |
| | • | | Mortgage and Asset Backed Bonds – Mortgage yield premiums, which reflect the market’s expectation of future volatility, are more attractive now that volatility has spiked upwards from historically low levels. As a result, PIMCO will overweight high quality, agency-sponsored mortgages to capture this incremental yield. PIMCO will continue to insulate portfolios from the subprime crisis by holding only modest levels of short duration, high quality asset-backed bonds with solid collateral protection. |
| | • | | Credit – The significant widening in credit spreads in the third quarter has made certain corporate bonds and bank loans more attractive. PIMCO will trim its corporate underweight in this environment, employing bottom-up credit analysis to select corporate credits with compelling valuations. The auto and financial sectors offer especially good potential. |
| | • | | Currency – PIMCO will continue to take advantage of expected weakness in the U.S. dollar with currency positions comprised largely of emerging market currencies. Preferred currencies will include those of countries with substantial trade surpluses and strong economic fundamentals, such as the Brazilian real, the Mexican peso, and the Russian ruble. |
| | • | | Emerging Market Bonds – The EM asset class has the potential to add significant value to portfolios over the next several years. High quality credits such as Mexico, Russia, and Brazil could see upgrades given large and growing currency reserves and strong fiscal positions. Locally issued EM bonds are an efficient way to take this exposure since they offer currency as well as interest rate/credit exposure. |
| | • | | TIPS and Municipals – With its forecast of relatively benign inflation amid a weakening economy, PIMCO does not expect to increase holdings of TIPS in the near term. There is still value, however, in modest TIPS allocations to help offset the risk of a spike in inflation. Municipal bonds have fared poorly recently amid the downturn in credit-related assets and the Treasury rally. PIMCO may add to these currently modest holdings in light of more attractive valuations. |
Cumulative Total Return Performance
The Fund’s cumulative total return is based on the daily change in net asset value (NAV), and assumes that all distributions were reinvested. The Lehman Brothers Aggregate Bond Index is an index of the U.S. investment grade fixed-rate bond market, including both government and corporate bonds. Unlike the Fund, the Lehman Brothers Aggregate Bond Index is unmanaged, is not available to investment, and does not incur expenses. The chart illustrates the performance of a hypothetical $10,000 investment made in the Managers Fremont Bond Fund on October 31, 1997, to a $10,000 investment made in the Lehman Brothers Aggregate Bond Index for the same period. Performance for periods longer than one year is annualized. The graph and table do not reflect the deduction of taxes that a shareholder would pay on a Fund distribution or redemption of shares. The listed returns for the Fund are net of
5
Managers Fremont Bond Fund
Portfolio Managers’ Comments (continued)
expenses and the returns for the index exclude expenses. Total returns for the Fund would have been lower had certain expenses not been reduced.
The table below shows the average annual total returns for the Managers Fremont Bond Fund and the Lehman Brothers Aggregate Bond Index from October 31, 1997 through October 31, 2007.
| | | | | | | | | |
Average Annualized Total Returns1 | | One Year | | | Five Years | | | Ten Years | |
Fremont Bond2,3,4,5 | | 5.96 | % | | 5.06 | % | | 6.43 | % |
Lehman Brothers Aggregate Bond Index | | 5.38 | % | | 4.41 | % | | 5.91 | % |
The performance data shown represents past performance. Past performance is not a guarantee of future results. Current performance may be lower or higher than the performance data quoted. The investment return and principal value of an investment in the Fund will fluctuate so that an investor’s shares, when redeemed, may be worth more or less than their original cost. For performance information through the most recent month end, please call (800) 835-3879 or visit our website at www.managersinvest.com.
In choosing a Fund, investors should carefully consider the amount they plan to invest, their investment objectives, the Fund’s investment objectives, risks, charges and expenses before investing. For this and other information, please call 800.835.3879 or visit www.managersinvest.com for a free prospectus. Read it carefully before investing or sending money. Distributed by Managers Distributors, Inc., member FINRA.
1 | Total return equals income yield plus share price change and assumes reinvestment of all dividends and capital gain distributions. Returns are net of fees and may reflect offsets of Fund expenses as described in the Prospectus. No adjustment has been made for taxes payable by shareholders on their reinvested dividends and capital gain distributions. Returns for periods greater than one year are annualized. The listed returns on the Fund are net of expenses. All returns are in U.S. dollars($). |
2 | Fund for which, from time to time, the Fund’s advisor has waived its fees and/or absorbed Fund expenses, which has resulted in higher returns. |
3 | Fixed-income funds are subject to the risks associated with investments in debt securities, such as default risk, fluctuations in debtor’s perceived ability to pay its creditors, and changing interest rate risk. An increase in interest rates typically causes the value of bonds and other fixed-income securities to fall. |
4 | The Fund may use derivative instruments for hedging purposes or as part of its investment strategy. There is a risk that a derivative intended as a hedge may not perform as expected. The main risk with derivatives is that some types can amplify a gain or loss, potentially earning or losing substantially more money than the actual cost of the derivative; or that the counterparty may fail to honor its contract terms, causing a loss for the Fund. Use of these instruments may also involve certain costs and risks such as liquidity risk, interest rate risk, market risk, credit risk, management risk, and the risk that a fund could not close out a position when it would be most advantageous to do so. |
5 | Investments in international securities are subject to certain risks of overseas investing including currency fluctuations and changes in political and economic conditions, which could result in significant market fluctuations. These risks are magnified in emerging markets. |
6
Managers Fremont Bond Fund
Fund Snapshots
October 31, 2007
Portfolio Breakdown
| | | | | | |
Rating | | Managers
Fremont Bond** | | | Lehman Brothers
Aggregate Bond
Index | |
U.S. Treasury & Agency | | 13.0 | % | | 70.9 | % |
Aaa | | 50.0 | % | | 8.8 | % |
Aa | | 20.0 | % | | 4.8 | % |
A | | 8.0 | % | | 8.1 | % |
Baa | | 5.0 | % | | 7.4 | % |
Ba & lower | | 4.0 | % | | 0.0 | % |
Top Ten Holdings
| | | |
Security Name | | Percentage
of Net Assets | |
FNMA, 5.500%, TBA | | 11.0 | % |
FNMA, 5.000%, TBA | | 5.5 | |
U.S. Treasury Inflation Indexed Notes, 3.500%, 01/15/11 | | 3.9 | |
FNMA, 6.000%, TBA | | 3.9 | |
FNMA, 5.500%, 02/01/35* | | 3.0 | |
U.S. Treasury Inflation Indexed Notes, 0.875%, 04/15/10 | | 2.4 | |
Bear Stearns Adjustable Rate Mortgage Trust,
Series 2005-5, Class A2, 4.550%, 08/25/35 | | 2.1 | |
FHLMC Gold Pool, 5.500%, 09/01/37 | | 2.0 | |
Bear Stearns Adjustable Rate Mortgage Trust,
Series 2005-2, Class A1, 4.125%, 03/25/35 | | 1.9 | |
Bear Stearns Adjustable Rate Mortgage Trust,
Series 2005-2, Class A2, 4.125%, 03/25/35 | | 1.8 | |
| | | |
Top Ten as a Group | | 37.5 | % |
| | | |
| * | Top Ten Holding at April 30, 2007. |
Any sectors, industries, or securities discussed should not be perceived as investment recommendations. Mention of a specific security should not be considered a recommendation to buy or solicitation to sell that security.
7
Managers Fremont Bond Fund
Schedule of Portfolio Investments
October 31, 2007
| | | | | | |
Security Description | | Principal Amount | | Value |
Corporate Bonds - 52.5% | | | | | | |
Asset-Backed Securities - 5.1% | | | | | | |
Asset Backed Funding Certificates, Series 2006-OPT3, Class A3A, 4.933%, 11/25/36, (11/25/07)4 | | $ | 1,867,813 | | $ | 1,844,397 |
Amortizing Residential Collateral Trust, 5.162%, 07/25/32, (11/25/07)4 | | | 77,398 | | | 74,343 |
Argent Securities, Inc., 4.923%, 09/25/36, (11/25/07)4 | | | 722,536 | | | 717,300 |
Asset Backed Securities Corp. Home Equity, 4.923%, 11/25/36, (11/25/07)4 | | | 1,420,421 | | | 1,409,412 |
Bear Stearns Asset Backed Securities, Inc., 4.952%, 10/25/36 (11/25/07)4 | | | 1,188,803 | | | 1,172,433 |
Chase Credit Card Master Trust, 5.201%, 02/15/11, (11/15/07)4 | | | 3,600,000 | | | 3,598,810 |
Citigroup Mortgage Loan Trust, Inc., 4.923%, 11/25/36, (11/25/07)4 | | | 780,731 | | | 773,667 |
Countrywide Asset-Backed Certificates, 4.923%, 11/25/37, (11/25/07)4 | | | 1,462,095 | | | 1,444,998 |
EMC Mortgage Loan Trust, Class A, 5.242%, 05/25/40, (11/25/07) (a)4 | | | 1,429,565 | | | 1,417,613 |
First Franklin Mortgage Loan Asset Backed Certificates, Series 2006-FF15, Class A3, 4.923%, 11/25/36, (11/25/07)4 | | | 2,756,634 | | | 2,702,058 |
First NLC Trust, 4.942%, 08/25/37, (11/25/07) (a)4 | | | 2,152,064 | | | 2,136,932 |
First USA Credit Card Master Trust, 5.195%, 04/18/11, (11/18/07)4 | | | 5,100,000 | | | 5,101,953 |
Fremont Home Loan Trust, 4.933%, 01/25/37, (11/25/07)4 | | | 1,470,435 | | | 1,447,655 |
GSAMP Trust, Series 2006-HE7, Class A2A, 4.912%, 11/25/46, (11/25/07)4 | | | 2,673,118 | | | 2,644,577 |
HSI Asset Securitization Corp. Trust, 4.923%, 12/25/36, (11/25/07)4 | | | 1,160,640 | | | 1,141,006 |
Indymac Residential Asset Backed Trust, 4.933%, 01/25/37, (11/25/07)4 | | | 1,291,110 | | | 1,279,409 |
JPMorgan Acquisition Corp., Class A, 4.923%, 08/25/36, (11/25/07)4 | | | 847,588 | | | 840,232 |
Lehman XS Trust, 4.942%, 05/25/46, (11/25/07)4 | | | 661,482 | | | 660,259 |
Lehman XS Trust, 4.952%, 11/25/46, (11/25/07)4 | | | 2,410,240 | | | 2,366,348 |
Long Beach Mortgage Loan Trust, 5.152%, 10/25/34, (11/25/07)4 | | | 52,021 | | | 50,786 |
Morgan Stanley ABS Capital I, Inc., 4.912%, 10/25/36, (11/25/07)4 | | | 856,180 | | | 848,020 |
Morgan Stanley ABS Capital I, Inc., 4.923%, 10/25/36, (11/25/07)4 | | | 815,003 | | | 805,948 |
Morgan Stanley IXIC Real Estate Capital Trust, 4.923%, 11/25/36, (11/25/07)4 | | | 1,608,297 | | | 1,592,484 |
Nelnet Student Loan Trust, 5.183%, 09/25/12, (12/25/07)4 | | | 762,827 | | | 761,993 |
Option One Mortgage Loan Trust, 4.923%, 01/25/37, (11/25/07)4 | | | 1,941,024 | | | 1,920,348 |
Park Place Securities, Inc., Series 2005-WCW1, Class A1B, 5.133%, 09/25/35, (11/25/07)4 | | | 1,942,996 | | | 1,928,305 |
Residential Asset Mortgage Products, Inc., 4.942%, 11/25/36, (11/25/07)4 | | | 3,329,741 | | | 3,310,059 |
Residential Asset Securities Corp., 4.942%, 11/25/36, (11/25/07)4 | | | 3,682,611 | | | 3,642,407 |
Residential Asset Securities Corp., 4.942%, 11/25/36, (11/25/07)4 | | | 2,031,762 | | | 2,009,393 |
Saxon Asset Securities Trust, 4.933%, 11/25/36, (11/25/07)4 | | | 861,195 | | | 851,059 |
Securitized Asset Backed Receivables LLC Trust, 4.933%, 12/25/36, (11/25/07)4 | | | 2,980,328 | | | 2,868,441 |
Securitized Asset Backed Receivables LLC Trust, Series 2007-NC2, Class A2A, 4.912%, 01/25/37, (11/25/07)4 | | | 2,727,315 | | | 2,686,070 |
Structured Asset Securities Corp., 4.923%, 10/25/36, (11/25/07)4 | | | 2,255,029 | | | 2,223,419 |
Structured Asset Securities Corp., 5.162%, 01/25/33, (11/25/07)4 | | | 77,557 | | | 75,044 |
U.S. Small Business Administration Participation Certificates, 5.130%, 09/01/23 | | | 142,689 | | | 143,093 |
U.S. Small Business Administration Surety Bonds, 6.344%, 08/01/11 | | | 1,462,531 | | | 1,493,035 |
U.S. Small Business Administration Surety Bonds, 7.449%, 08/01/10 | | | 27,066 | | | 27,590 |
Wells Fargo Home Equity Trust, 4.992%, 12/25/35, (11/25/07) (a)4 | | | 1,239,137 | | | 1,233,215 |
Total Asset-Backed Securities | | | | | | 61,244,111 |
The accompanying notes are an integral part of these financial statements.
8
Managers Fremont Bond Fund
Schedule of Portfolio Investments (continued)
| | | | | | | |
Security Description | | Principal Amount | | | Value |
Finance - 28.2% | | | | | | | |
American Express Bank Ltd., 5.058%, 10/20/09, (11/20/07)4 | | $ | 2,300,000 | | | $ | 2,289,388 |
American Express Bank Ltd., 5.070%, 10/16/08, (11/16/07)4 | | | 3,100,000 | | | | 3,092,482 |
American Express Centurion Bank, 4.668%, 05/07/08, (12/07/07)4 | | | 2,200,000 | | | | 2,197,026 |
American Express Centurion Bank, 5.130%, 06/12/09, (11/13/07)4 | | | 1,500,000 | | | | 1,494,272 |
American Express Credit Co., 5.182%, 11/09/09, (11/09/07)4 | | | 2,400,000 | | | | 2,381,988 |
American International Group, Inc., 5.050%, 10/01/15 | | | 400,000 | | | | 388,412 |
American International Group, Inc., 5.110%, 06/15/09, (11/16/07) (a)4 | | | 3,100,000 | 2 | | | 3,099,504 |
ANX National Bank, Ltd., 4.915%, 08/07/09, (02/08/08) (a)4 | | | 2,500,000 | | | | 2,492,438 |
Bank of America Corp., 5.607%, 6/19/2009, (12/19/07)4 | | | 10,500,000 | | | | 10,467,860 |
Bank of America Corp., 6.000%,10/15/36, (12/19/07) | | | 900,000 | | | | 876,476 |
Bank of Ireland, 5.282%, 01/15/10, (01/15/08)4 | | | 7,400,000 | | | | 7,414,785 |
Bank of Ireland, 5.607%, 12/19/08, (12/19/07)4 | | | 4,200,000 | | | | 4,198,916 |
Barclays Bank PLC, 5.450%, 09/12/12 | | | 17,300,000 | | | | 17,471,495 |
Bear Stearns Co., Inc., 5.284%, 01/30/09, (01/30/08)4 | | | 2,700,000 | | | | 2,675,457 |
Bear Stearns Co., Inc., 5.288%, 03/30/09, (12/31/07)4 | | | 2,400,000 | | | | 2,380,054 |
Bear Stearns Co., Inc., 5.494%, 07/16/094 | | | 1,600,000 | | | | 1,583,323 |
Bear Stearns Co., Inc., 5.590, 08/21/09, (11/21/07)4 | | | 4,800,000 | | | | 4,690,334 |
Bear Stearns Co., Inc., 6.950%, 08/10/12 | | | 5,800,000 | | | | 6,042,104 |
C10 Capital SPV, Ltd., 6.722%, 12/31/49 (a)5,6 | | | 1,500,000 | 2 | | | 1,450,473 |
Calyon NY, 5.204%, 01/16/09, (01/16/08)4 | | | 3,500,000 | | | | 3,496,136 |
China Development Bank, 5.000%, 10/15/15 | | | 300,000 | | | | 291,681 |
Chrysler FINCO Term Loan, 9.360%, 08/03/125 | | | 6,000,000 | | | | 5,999,424 |
CIT Group, Inc., 5.134%, 01/30/09, (01/30/08)4 | | | 5,400,000 | | | | 5,254,011 |
CIT Group, Inc., 5.640%, 08/17/09, (11/19/07)4 | | | 2,400,000 | | | | 2,306,671 |
Citigroup Funding, Inc., 5.200%, 06/26/09, (12/27/07)4 | | | 1,600,000 | | | | 1,593,974 |
Citigroup Global Markets Holdings, Inc., 5.794%, 03/17/09, (12/17/07)4 | | | 2,200,000 | | | | 2,202,358 |
Citigroup, Inc., 5.024%, 1/30/09, (01/30/08)4 | | | 2,500,000 | | | | 2,499,305 |
Citigroup, Inc., 5.228%, 12/28/09, (12/28/07)4 | | | 300,000 | | | | 299,196 |
Citigroup, Inc., 5.240%, 12/26/08, (12/27/07)4 | | | 5,000,000 | | | | 5,001,050 |
Citigroup, Inc., 5.300%, 10/17/12 | | | 300,000 | | | | 301,208 |
Citigroup, Inc., 5.500%, 08/27/12 | | | 500,000 | | | | 506,674 |
Citigroup, Inc., 5.714%, 12/28/08, (12/10/07)4 | | | 400,000 | | | | 399,349 |
Citigroup, Inc., 6.000%, 08/15/17 | | | 4,200,000 | | | | 4,288,582 |
Citigroup, Inc., 6.125%, 08/25/36 | | | 4,900,000 | | | | 4,795,689 |
Credit Agricole (London), 5.505%, 05/28/09, (11/28/07) (a)4 | | | 1,900,000 | | | | 1,902,101 |
Credit Agricole (London), 5.555%, 05/28/10, (11/28/07) (a)4 | | | 2,200,000 | | | | 2,203,194 |
Deutsche Bank AG London, 6.000%, 09/01/17 | | | 5,000,000 | | | | 5,124,270 |
Ford Motor Credit Co., 5.800%, 01/12/09 | | | 6,200,000 | | | | 5,983,143 |
Ford Motor Credit Co., 7.875%, 6/15/10 | | | 2,000,000 | | | | 1,929,176 |
Ford Motor Credit Company LLC., 6.375%, 11/05/08 | | | 6,100,000 | | | | 6,035,627 |
Fortis Bank NY, 4.697%, 06/30/08, (11/30/07)4 | | | 4,500,000 | | | | 4,493,848 |
Fortis Bank NY, 5.148%, 09/30/08, (12/31/07)4 | | | 3,100,000 | | | | 3,093,952 |
The accompanying notes are an integral part of these financial statements.
9
Managers Fremont Bond Fund
Schedule of Portfolio Investments (continued)
| | | | | | | |
Security Description | | Principal Amount | | | Value |
Finance - 28.2% (continued) | | | | | | | |
GAZ Capital, 6.212%, 11/22/16 (a) | | $ | 400,000 | | | $ | 395,400 |
General Electric Capital Corp., 5.095%, 10/26/09, (01/28/08)4 | | | 6,000,000 | | | | 5,986,218 |
General Electric Capital Corp., 5.250%, 1/20/10, (01/22/08)4 | | | 3,900,000 | | | | 3,893,647 |
General Electric Capital Corp., 5.280%, 10/21/10, (01/22/08)4 | | | 5,000,000 | 2 | | | 4,985,490 |
General Electric Capital Corp., 5.284%, 01/05/09, (01/07/08)4 | | | 2,500,000 | | | | 2,498,288 |
General Electric Capital Corp., 5.500%, 09/15/67 (a)5 | | | 5,500,000 | | | | 7,998,781 |
General Electric Capital Corp., 5.628%, 08/15/11, (11/15/07)4 | | | 3,600,000 | | | | 3,581,082 |
GMAC LLC, 6.808%, 05/15/09, (11/15/07)4 | | | 3,200,000 | | | | 3,011,904 |
GMAC LLC, 6.000%, 12/15/11 | | | 400,000 | | | | 355,214 |
Goldman Sachs Group, Inc., 5.250%, 12/23/08, (12/24/07)4 | | | 100,000 | | | | 99,783 |
Goldman Sachs Group, Inc., 5.300%, 12/22/08, (12/24/07)4 | | | 8,800,000 | | | | 8,782,057 |
Goldman Sachs Group, Inc., 5.300%, 06/23/09, (12/24/07)4 | | | 4,300,000 | | | | 4,290,213 |
Goldman Sachs Group, Inc., 5.610%, 11/16/09, (11/16/07)4 | | | 1,300,000 | | | | 1,297,769 |
Goldman Sachs Group, Inc., 6.250%, 09/01/17 | | | 3,200,000 | | | | 3,260,678 |
Goodyear Tire & Rubber 2nd Lien Term B Loan, 6.430%, 04/20/145 | | | 2,000,000 | | | | 1,947,916 |
HBOS PLC, 5.920%, 09/01/49 (a)5,6 | | | 400,000 | | | | 364,092 |
HBOS Treasury Services PLC, 5.254% 7/17/09, (01/17/08) (a)4 | | | 3,600,000 | | | | 3,596,216 |
HSBC Finance Corp., 5.240%, 10/21/09, (01/22/08)4 | | | 1,600,000 | | | | 1,591,742 |
HSBC Finance Corp., 5.824%, 09/15/08, (12/17/07)4 | | | 5,900,000 | | | | 5,898,525 |
HSBC Holdings PLC, 6.500%, 05/02/36 | | | 800,000 | | | | 792,312 |
HSBC Holdings PLC, 6.500%, 09/15/37 | | | 900,000 | | | | 894,611 |
ICICI Bank, Ltd., 5.787%, 01/12/10, (01/14/08) (a)4 | | | 3,400,000 | | | | 3,361,859 |
JP Morgan Chase & Co., 4.906%, 06/26/09, (11/26/07)4 | | | 1,800,000 | | | | 1,793,950 |
JP Morgan Chase Capital XX, 6.550%, 09/29/36 | | | 400,000 | | | | 376,213 |
JPMorgan Chase Bank NA, 6.000%, 10/01/17 | | | 3,200,000 | | | | 3,251,229 |
KBC Bank Fund Trust II, 6.875%, 06/30/495,6 | | € | 1,900,000 | | | | 2,814,290 |
Korea Development Bank, 5.370%, 04/03/10, (01/03/08)4 | | | 7,100,000 | | | | 7,081,377 |
Lehman Brothers Holdings, Inc., 5.260%, 12/23/08, (12/24/07)4 | | | 200,000 | | | | 198,300 |
Lehman Brothers Holdings, Inc., 5.270%, 10/22/08, (01/22/08)4 | | | 3,900,000 | | | | 3,881,097 |
Lehman Brothers Holdings, Inc., 5.320%, 04/03/09, (01/03/08)4 | | | 4,700,000 | | | | 4,640,728 |
Lehman Brothers Holdings, Inc., 5.429%, 7/18/11, (01/18/08)4 | | | 1,700,000 | | | | 1,652,922 |
Lehman Brothers Holdings, Inc., 5.630%, 11/16/09, (11/16/07)4 | | | 1,200,000 | | | | 1,183,789 |
Lehman Brothers Holdings, Inc., 5.645%, 05/25/10, (11/26/07)4 | | | 1,000,000 | | | | 985,300 |
Lloyds TSB Capital, 7.375%, 02/07/495,6 | | € | 1,800,000 | | | | 2,783,579 |
Merrill Lynch & Co., Inc., 5.191%, 10/23/08, (01/23/08)4 | | | 4,300,000 | | | | 4,282,976 |
Merrill Lynch & Co., Inc., 5.284%, 7/25/11, (01/25/08)4 | | | 3,000,000 | | | | 2,923,581 |
Merrill Lynch & Co., Inc., 5.665%, 08/14/09, (11/14/07)4 | | | 2,200,000 | | | | 2,175,105 |
Merrill Lynch & Co., Inc., 5.701%, 12/04/09, (12/04/07)4 | | | 2,100,000 | | | | 2,072,832 |
Merrill Lynch & Co., Inc., 6.400%, 08/28/17 | | | 2,300,000 | | | | 2,324,214 |
Met Life Glob Funding I, 5.560%, 05/17/10, (11/19/07) (a)4 | | | 4,100,000 | | | | 4,069,594 |
Metlife, Inc., 6.400%, 12/15/36 | | | 800,000 | | | | 760,263 |
Morgan Stanley & Co., Inc., 5.037%, 11/21/08, (11/21/07)4 | | | 1,800,000 | | | | 1,792,528 |
Morgan Stanley & Co., Inc., 5.332%, 01/15/10, (01/15/08)4 | | | 4,600,000 | | | | 4,557,317 |
The accompanying notes are an integral part of these financial statements.
10
Managers Fremont Bond Fund
Schedule of Portfolio Investments (continued)
| | | | | | | |
Security Description | | Principal Amount | | | Value |
Finance - 28.2% (continued) | | | | | | | |
Morgan Stanley & Co., Inc., 5.470% 2/9/09, (11/09/07)4 | | $ | 1,400,000 | | | $ | 1,396,020 |
MUFG Capital Finance 1, Ltd., 6.346%, 7/29/495,6 | | | 400,000 | | | | 382,002 |
Nordea Bank Finland PLC, 4.695%, 03/31/08, (11/30/07)4 | | | 1,800,000 | | | | 1,799,309 |
Nordea Bank Finland PLC, 5.109%, 04/09/09, (11/09/07)4 | | | 4,700,000 | | | | 4,694,134 |
Nordea Bank Finland PLC, 5.442%, 05/28/08, (11/28/07)4 | | | 1,800,000 | | | | 1,800,038 |
Petroleum Export Ltd. (Cayman), 5.265%, 06/15/11 (a) | | | 239,434 | | | | 238,800 |
Residential Capital LLC, 8.095%, 05/22/09, (11/23/07)4 | | | 2,500,000 | | | | 1,953,125 |
Resona Bank Ltd., 5.850%, 04/15/49 (a)5,6 | | | 500,000 | | | | 463,964 |
Royal Bank of Scotland Group PLC, 4.801%, 03/26/08, (11/26/07)4 | | | 900,000 | | | | 899,368 |
Royal Bank of Scotland Group PLC, 5.230%, 07/21/08, (01/22/08) (a)4 | | | 1,800,000 | | | | 1,799,847 |
Royal Bank of Scotland Group PLC, 9.118%, 03/31/496 | | | 1,000,000 | 2 | | | 1,070,161 |
Santander, 6.671%, 10/29/49 (a)5,6 | | | 2,100,000 | 2 | | | 2,094,916 |
Santander US Debt SA Unipersonal, 5.298%, 9/19/08, (12/21/07) (a)4 | | | 11,600,000 | | | | 11,595,638 |
Skandinav Enskilda Bank/NY, 5.490%, 02/13/09, (11/13/07)4 | | | 400,000 | | | | 399,499 |
SLM Corp. Bridge Term Loan, 6.000%, 06/30/085 | | | 2,500,000 | | | | 2,490,229 |
SMFG Preffered Capital, Ltd., 6.078%, 01/29/49 (a)5,6 | | | 1,100,000 | | | | 1,034,451 |
Societe Generale N.A., 4.768%, 06/30/08, (11/29/07)4 | | | 2,000,000 | | | | 2,000,748 |
State Street Capital Trust IV, 6.694%, 06/15/37, (12/15/07)4 | | | 300,000 | | | | 271,995 |
TNK- BP Finance SA, 6.125%, 03/20/12 (a) | | | 400,000 | | | | 380,040 |
Unicredito Italiano, 4.855%, 05/06/08, (02/06/08)4 | | | 800,000 | | | | 799,118 |
Unicredito Italiano, 5.506%, 05/29/08, (11/29/07)4 | | | 2,300,000 | | | | 2,298,790 |
Unicredito Luxembourg Finance SA, 5.143%, 10/24/08, (01/24/08) (a)4 | | | 10,900,000 | | | | 10,876,979 |
USB Capital IX, 6.189%, 3/29/495,6 | | | 300,000 | | | | 302,693 |
Verizon Idearc, Inc. Term B Loan, 6.875%, 11/17/145 | | | 5,260,250 | | | | 5,194,223 |
Wachovia Corp., 5.200%, 10/03/08, (01/03/08)4 | | | 7,200,000 | | | | 7,187,400 |
Wachovia Corp., 5.671%, 12/01/09, (12/03/07)4 | | | 4,500,000 | | | | 4,480,798 |
Westpac Banking Corp., 4.638%, 06/06/08, (12/06/07)4 | | | 1,400,000 | | | | 1,399,055 |
Total Finance | | | | | | | 340,475,727 |
Industrial - 6.4% | | | | | | | |
Amgen, Inc., 5.585%, 11/28/08, (11/28/07) (a)4 | | | 4,400,000 | | | | 4,393,422 |
AstraZeneca PLC, 5.900%, 09/15/17 | | | 800,000 | | | | 819,516 |
AstraZeneca PLC, 6.450%, 09/15/37 | | | 700,000 | | | | 740,116 |
AT&T, Inc., 4.978%, 02/05/10, (02/05/08)4 | | | 1,200,000 | | | | 1,193,126 |
BellSouth Corp., 5.657%, 08/15/08, (11/15/07)4 | | | 3,600,000 | | | | 3,597,354 |
Codelco, Inc., 6.150%, 10/24/36 (a) | | | 300,000 | | | | 300,679 |
Comcast Corp., 5.875%, 02/15/18 | | | 600,000 | | | | 599,983 |
Comcast Corp., 6.450%, 03/15/37 | | | 600,000 | | | | 606,839 |
DaimlerChrysler N.A. Holdings Corp., 5.327%, 08/03/09, (02/04/08)4 | | | 2,200,000 | | | | 2,202,959 |
DaimlerChrysler N.A. Holdings Corp., 6.053%, 03/13/09, (12/13/07)4 | | | 2,900,000 | | | | 2,897,813 |
DnB NOR Bank ASA, 5.313%, 10/13/09, (01/14/08) (a)4 | | | 13,100,000 | | | | 13,116,440 |
General Electric Capital Corp., 5.443%, 01/08/16, (01/08/08)4 | | | 1,000,000 | | | | 983,437 |
Heinz (H.J.) Co., 6.428%, 12/01/08 (a) | | | 400,000 | | | | 407,077 |
IBM Corp., 5.700%, 09/14/17 | | | 16,100,000 | | | | 16,371,913 |
The accompanying notes are an integral part of these financial statements.
11
Managers Fremont Bond Fund
Schedule of Portfolio Investments (continued)
| | | | | | | |
Security Description | | Principal Amount | | | Value |
Industrial - 6.4% (continued) | | | | | | | |
Peabody Energy Corp., 7.875%, 11/01/26 | | $ | 800,000 | | | $ | 840,000 |
Qwest Capital Funding, Inc., 7.250%, 02/15/11 | | | 1,813,000 | 2 | | | 1,831,130 |
Ras Laffan Liquefied Natural Gas Co., Ltd, 5.298%, 09/30/20 (a) | | | 900,000 | | | | 871,110 |
Rohm & Haas Holdings Co., 6.000%, 09/15/17 | | | 1,100,000 | | | | 1,116,646 |
GazProm OAO, 10.500%, 10/21/09 | | | 2,100,000 | | | | 2,295,369 |
Sonat Inc., 7.625%, 07/15/11 | | | 1,300,000 | | | | 1,346,716 |
Telefonica Emisiones SAU, 5.888%, 6/19/09, (12/20/07) 4 | | | 3,000,000 | | | | 3,002,691 |
Tennessee Gas Pipeline Co., 7.000%, 10/15/28 | | | 6,145,000 | | | | 6,306,030 |
Time Warner, Inc., 5.730%, 11/13/09, (11/13/07) 4 | | | 2,000,000 | | | | 1,989,290 |
Time Warner, Inc., 5.875%, 11/15/16 | | | 1,200,000 | | | | 1,194,252 |
Vale Overseas, Ltd., 6.250%, 01/23/17 | | | 500,000 | | | | 508,057 |
Vale Overseas, Ltd., 6.875%, 11/01/36 | | | 500,000 | | | | 522,272 |
VTB Capital SA, 5.511%, 08/01/08, (02/01/08) (a) 4 | | | 2,200,000 | | | | 2,180,750 |
Wal-Mart Stores, Inc., 5.594%, 06/16/08, (12/16/07) 4 | | | 5,100,000 | | | | 5,103,126 |
Total Industrial | | | | | | | 77,338,113 |
Mortgage-Backed Securities - 12.1% | | | | | | | |
American Home Mortgage Investment Trust, 4.390%, 02/25/45, (11/25/09) 4 | | | 1,133,058 | | | | 1,116,330 |
Arkle Master Issuer PLC, Series 2006-1A, Class 1A, 5.025%, 11/19/07, (11/17/07) (a) 4 | | | 5,800,000 | | | | 5,797,245 |
Bank of America Funding Corp., 4.111%, 05/25/355 | | | 1,578,956 | | | | 1,553,533 |
Bear Stearns Adjustable Rate Mortgage Trust, 5.038%, 04/25/335 | | | 916,561 | | | | 913,687 |
Bear Stearns Adjustable Rate Mortgage Trust, 5.605%, 02/25/335 | | | 220,801 | | | | 219,928 |
Bear Stearns Adjustable Rate Mortgage Trust, 6.255%, 11/25/305 | | | 55,369 | | | | 55,183 |
Bear Stearns Adjustable Rate Mortgage Trust, Series 2005-2, Class A2, 4.125%, 03/25/35, (12/25/08) 4 | | | 22,327,225 | | | | 21,932,033 |
Bear Stearns Adjustable Rate Mortgage Trust, Series 2005-2, Class A1, 4.125%, 03/25/35, (01/25/09) 4 | | | 22,610,098 | | | | 22,396,354 |
Bear Stearns Adjustable Rate Mortgage Trust, Series 2005-5, Class A2, 4.550%, 08/25/35, (10/25/09) 4 | | | 25,732,482 | | | | 25,864,909 |
Bear Stearns Alt-A Trust, 5.373%, 05/25/355 | | | 2,210,957 | | | | 2,218,440 |
Bear Stearns Alt-A Trust, Series 2005-7, Class 22A1, 5.520%, 09/25/355 | | | 1,046,573 | | | | 1,047,260 |
Bear Stearns Mortgage Funding Trust, 4.942%, 02/25/37, (11/25/07)4 | | | 3,791,759 | | | | 3,747,137 |
Citigroup Mortgage Loan Trust, Inc., 4.700%, 12/25/35, (07/25/10)4 | | | 650,858 | | | | 641,231 |
Citigroup Mortgage Loan Trust, Inc., 4.747%, 08/25/35, (10/25/08)4 | | | 16,226,020 | | | | 16,102,415 |
Citigroup Commercial Mortgage Trust, 5.161%, 11/15/36, (11/15/07) (a)4 | | | 924,883 | | | | 923,119 |
Countrywide Alternative Loan Trust, 5.053%, 04/25/07, (11/25/07)4 | | | 1,836,861 | | | | 1,777,495 |
Countrywide Home Loans, Inc., 5.250%, 02/20/36, (09/20/10)4 | | | 672,834 | | | | 672,836 |
Greenpoint Mortgage Funding Trust, 4.952%, 12/25/36, (11/25/07)4 | | | 2,254,239 | | | | 2,241,076 |
Greenpoint Mortgage Funding Trust, 4.952%, 10/25/46, (11/25/07)4 | | | 2,244,874 | | | | 2,226,179 |
GS Mortgage Securities Corp. II, 5.212%, 03/06/20, (11/06/07) (a)4 | | | 2,605,688 | | | | 2,583,715 |
GSR Mortgage Loan Trust, Series 2005-AR7, Class 6A1, 5.250%, 11/25/355 | | | 2,466,946 | | | | 2,366,078 |
IMPAC Secured Assets Corp, 4.952%, 01/25/37, (11/25/07)4 | | | 1,466,612 | | | | 1,451,017 |
Indymac Index Mortgage Loan Trust, 4.963%, 11/25/46, (11/25/07)4 | | | 1,314,781 | | | | 1,308,405 |
Indymac Index Mortgage Loan Trust, Series 2005-AR31, Class 1A1, 5.171%. 01/25/365 | | | 3,124,158 | | | | 3,117,009 |
JP Morgan Mortgage Trust, Series 2005-A1, Class 6T1, 5.023%, 02/25/355 | | | 1,801,882 | | | | 1,750,202 |
Lehman Brothers Floating Rate Commercial Mortgage Trust, 5.171%, 09/15/21, (11/15/07) (a)4 | | | 425,960 | | | | 425,908 |
The accompanying notes are an integral part of these financial statements.
12
Managers Fremont Bond Fund
Schedule of Portfolio Investments (continued)
| | | | | | |
Security Description | | Principal Amount | | Value |
Mortgage-Backed Securities - 12.1% (continued) | | | | | | |
Merrill Lynch Mortgage Investors, Inc., Series 2005-A10, Class A, 5.082%, 02/25/36, (11/25/07) 4 | | $ | 1,168,928 | | $ | 1,156,933 |
MLCC Mortgage Investors, Inc., Series 2005-3, Class 4A, 5.122%, 11/25/35, (11/25/07)4 | | | 408,929 | | | 407,413 |
Prime Mortgage Trust, 5.272%, 02/25/19, (11/25/07)4 | | | 90,316 | | | 90,251 |
Prime Mortgage Trust, 5.272%, 02/25/34, (11/25/07)4 | | | 437,223 | | | 432,134 |
Prudential Home Mortgage Securities, 7.000%, 06/25/08 | | | 735 | | | 733 |
Structured Asset Mortgage Investments, Inc., 5.351%, 09/19/32, (11/19/07)4 | | | 619,115 | | | 618,431 |
Structured Asset Mortgage Investments, Inc., Series 2005-AR5, Class A2, 5.271%, 07/19/35, (11/19/07)4 | | | 1,416,304 | | | 1,410,215 |
Structured Asset Securities Corp., 5.322%, 10/25/35 (a)5 | | | 2,232,479 | | | 2,221,027 |
Structured Asset Securities Corp., 7.188%, 01/25/325 | | | 31,996 | | | 31,886 |
Thornburg Mortgage Securities Trust, 4.982%, 12/25/36, (11/25/07)4 | | | 1,916,006 | | | 1,893,851 |
Wachovia Bank Commercial Mortgage Trust, 5.171%, 06/15/20, (11/25/07) (a)4 | | | 3,282,389 | | | 3,278,801 |
Wachovia Bank Commercial Mortgage Trust, Series 2006-WL7A Class A1, | | | | | | |
5.181%, 09/15/21, (11/15/07) (a)4 | | | 6,187,603 | | | 6,168,157 |
Washington Mutual MSC Mortgage Pass-Through, 6.925%, 02/25/315 | | | 128,510 | | | 128,034 |
Washington Mutual Mortgage Pass-Through Certificates, 6.133%, 11/25/42, (11/25/07)4 | | | 361,261 | | | 362,401 |
Washington Mutual, Series 2005-AR13, Class A1A1, 5.162%, 10/25/45, (11/25/07)4 | | | 478,597 | | | 470,476 |
Wells Fargo Mortgage Backed Securities, 4.950%, 03/25/365 | | | 2,859,901 | | | 2,831,656 |
Total Mortgage-Backed Securities | | | | | | 145,951,123 |
Utilities - 0.7% | | | | | | |
Enel Finance International SA, 6.800%, 09/15/37 (a) | | | 5,800,000 | | | 6,096,241 |
Transocean, Inc., 5.869%, 09/05/08, (12/05/07)4 | | | 2,200,000 | | | 2,196,306 |
Total Utilities | | | | | | 8,292,547 |
Total Corporate Bonds
(cost $629,129,323) | | | | | | 633,301,621 |
Foreign Government and Agency Obligations - 0.3% | | | | | | |
Republic of Brazil, 10.250%, 01/10/28 | | | 1,250,000 | | | 729,495 |
Export-Import Bank of China, The, 4.875%, 07/21/15 (a) | | | 300,000 | | | 289,526 |
Export-Import Bank of Korea, 5.711%, 06/01/09, (12/03/07)4 | | | 2,700,000 | | | 2,704,328 |
Total Foreign Government and Agency Obligations (cost $ 3,717,181) | | | | | | 3,723,349 |
U.S. Government and Agency Obligations - 74.4% | | | | | | |
Federal Home Loan Mortgage Corporation - 10.9% | | | | | | |
FHLMC, 4.903%, 11/01/35, (09/01/09)4 | | | 4,423,691 | | | 4,459,079 |
FHLMC, 5.000%, 10/01/18 to 11/01/18 | | | 1,944,430 | | | 1,922,360 |
FHLMC, 5.241%, 07/15/19 to 10/15/20, (11/15/07) 4 | | | 39,178,391 | | | 39,057,278 |
FHLMC, 5.321%, 02/15/19, (11/15/07)4 | | | 13,783,900 | | | 13,742,044 |
FHLMC, 5.391%, 05/15/36, (11/15/07)4 | | | 1,739,971 | | | 1,741,000 |
FHLMC, 5.591%, 09/15/30, (11/15/07)4 | | | 70,848 | | | 70,972 |
FHLMC, 6.000%, 02/01/16 to 09/01/16 | | | 271,767 | | | 276,909 |
FHLMC, 6.500%, 01/01/26 | | | 13,538,829 | | | 14,105,187 |
FHLMC, 7.000%, 11/15/20 | | | 36,698 | | | 36,626 |
FHLMC, 7.364%, 07/01/30, (07/01/08)4 | | | 3,746 | | | 3,828 |
FHLMC, 7.500%, 08/15/30 | | | 482,166 | | | 507,123 |
FHLMC Gold Pool, 4.500%, 02/01/14 | | | 297,743 | | | 294,726 |
FHLMC Gold Pool, 5.500%, 09/01/37 | | | 23,935,971 | | | 23,568,665 |
The accompanying notes are an integral part of these financial statements.
13
Managers Fremont Bond Fund
Schedule of Portfolio Investments (continued)
| | | | | | |
Security Description | | Principal Amount | | Value |
Federal Home Loan Mortgage Corporation - 10.9% (continued) | | | | | | |
FHLMC Gold Pool, 5.500%, TBA | | $ | 9,000,000 | | $ | 8,859,375 |
FHLMC Gold Pool, 6.000%, 05/01/16 to 01/01/37 | | | 4,032,809 | | | 4,060,595 |
FHLMC Gold Pool, 6.000%, TBA | | | 18,000,000 | | | 18,112,500 |
FHLMC Structured Pass Through Securities, 6.183%, 02/25/45, (11/25/07) 4 | | | 266,686 | | | 267,562 |
Total Federal Home Loan Mortgage Corporation | | | | | | 131,085,829 |
Federal National Mortgage Association - 50.4% | | | | | | |
FNMA, 3.500%, 07/01/11 | | | 497,710 | | | 479,051 |
FNMA, 4.000%, 05/01/14 | | | 384,338 | | | 375,072 |
FNMA, 4.500%, 05/01/21 | | | 161,777 | | | 156,547 |
FNMA, 4.672%, 5/25/355 | | | 500,000 | | | 497,840 |
FNMA, 4.673%, 09/01/35, (08/01/10) 4 | | | 4,359,704 | | | 4,338,699 |
FNMA, 4.832%, 06/01/35, (06/01/10) 4 | | | 7,178,211 | | | 7,153,329 |
FNMA, 4.933%, 12/25/36, (11/25/07) 4 | | | 1,258,168 | | | 1,248,775 |
FNMA, 5.000%, 05/01/14 to 09/01/37 | | | 76,669,990 | | | 71,712,486 |
FNMA, 5.000%, TBA | | | 65,653,438 | | | 66,229,236 |
FNMA, 5.500%, 12/01/16 to 07/01/37 | | | 218,894,349 | | | 214,150,692 |
FNMA, 5.500%, TBA | | | 158,023,594 | | | 157,655,665 |
FNMA, 5.549%, 05/01/36, (11/01/07) 4 | | | 1,228,575 | | | 1,243,062 |
FNMA, 5.557%, 05/01/36, (11/01/07) 4 | | | 2,172,965 | | | 2,198,606 |
FNMA, 6.000%, 04/01/16 to 10/01/37 | | | 22,346,634 | | | 22,941,443 |
FNMA, 6.000%, TBA | | | 47,384,843 | | | 47,345,168 |
FNMA, 6.183%, 07/01/44, (11/01/07) 4 | | | 482,721 | | | 489,344 |
FNMA, 6.500%, 07/01/36 | | | 312,194 | | | 319,628 |
FNMA, 6.500%, TBA | | | 7,600,000 | | | 7,779,314 |
FNMA Whole Loan, Series 2003-W1, Class 1A1, 6.500%, 12/25/42 | | | 415,088 | | | 427,057 |
FNMA, 7.200%, 05/25/23 | | | 1,026,778 | | | 1,086,294 |
FNMA, 7.500%, 02/25/08 | | | 9,157 | | | 9,155 |
Total Federal National Mortgage Association | | | | | | 607,836,463 |
Government National Mortgage Association - 1.1% | | | | | | |
GNMA, 5.750%, 08/20/25, (10/01/08) 4 | | | 37,827 | | | 38,156 |
GNMA, 6.000%, 05/15/37 to 06/15/37 | | | 2,985,820 | | | 3,024,175 |
GNMA, 6.125%, 11/20/24 to 11/20/29, (01/01/08) 4 | | | 487,004 | | | 492,497 |
GNMA, 6.375%, 04/20/21, (07/01/08) 4 | | | 11,677 | | | 11,816 |
GNMA, 6.375%, 03/20/24, (04/01/08) 4 | | | 57,686 | | | 58,306 |
GNMA, 6.500%, 06/20/28 | | | 1,263,874 | | | 1,304,748 |
GNMA, 6.750%, 10/16/405 | | | 8,089,302 | | | 8,342,228 |
Total Government National Mortgage Association | | | | | | 13,271,926 |
United States Treasury Securities - 12.0% | | | | | | |
U.S. Treasury Bills, 3.828%, 12/13/077 | | | 7,070,000 | | | 7,038,242 |
U.S. Treasury Inflation Indexed Notes, 0.875%, 04/15/10 | | | 29,923,536 | | | 29,245,588 |
U.S. Treasury Inflation Indexed Notes, 1.875%, 07/15/13 | | | 11,547,522 | | | 11,517,752 |
U.S. Treasury Inflation Indexed Notes, 2.000%, 04/15/12 | | | 3,893,784 | | | 3,904,434 |
The accompanying notes are an integral part of these financial statements.
14
Managers Fremont Bond Fund
Schedule of Portfolio Investments (continued)
| | | | | | |
Security Description | | Principal Amount | | Value |
United States Treasury Securities - 12.0% (continued) | | | | | | |
U.S. Treasury Inflation Indexed Notes, 2.000%, 01/15/14 | | $ | 1,240,844 | | $ | 1,240,263 |
U.S. Treasury Inflation Indexed Notes, 2.000%, 07/15/14 | | | 20,958,7102 | | | 20,958,731 |
U.S. Treasury Inflation Indexed Notes, 2.375%, 04/15/11 | | | 2,618,9252 | | | 2,660,461 |
U.S. Treasury Inflation Indexed Notes, 2.625%, 07/15/17 | | | 3,922,503 | | | 4,099,326 |
U.S. Treasury Inflation Indexed Notes, 3.500%, 01/15/11 | | | 45,264,366 | | | 47,654,913 |
U.S. Treasury Notes, 4.500%, 05/15/17 | | | 8,379,148 | | | 8,326,593 |
U.S. Treasury Inflation Indexed Bonds, 2.000%, 01/15/26 | | | 2,625,625 | | | 2,536,805 |
U.S. Treasury Inflation Indexed Bonds, 2.375%, 01/15/25 | | | 4,976,370 | | | 5,082,899 |
U.S. Treasury Inflation Indexed Bonds, 3.625%, 04/15/28 | | | 644,405 | | | 793,777 |
Total U.S. Treasury Securities | | | | | | 145,059,784 |
Total U.S. Government and Agency Obligations
(cost $897,818,487) | | | | | | 897,254,002 |
Municipal Bonds - 0.3% | | | | | | |
Badger Tobacco Asset Securitization Corp. (WI), 6.000%, 06/01/17 | | | 2,600,000 | | | 2,721,186 |
State of Texas, Transportation Commission-Mobility Fund, Series A, 4.750%, 04/01/35 | | | 1,200,000 | | | 1,200,696 |
Truckee Meadows, NV Water Authority Revenue, Series A, 5.000%, 07/01/36 (MBIA Insured) 5 | | | 67,000 | | | 73,963 |
Total Municipal Bonds
(cost $3,814,235) | | | | | | 3,995,845 |
| | |
| | | Shares | | |
Municipal Funds - 0.5% | | | | | | |
Dreyfus Municipal Income, Inc. | | | 37,500 | | | 320,625 |
DWS Municipal Income Trust | | | 55,000 | | | 584,650 |
MFS Municipal Income Trust | | | 53,800 | | | 393,278 |
Nuveen Performance Plus Municipal Fund | | | 55,000 | | | 747,450 |
Nuveen Premium Income Municipal Fund II | | | 55,000 | | | 728,750 |
Nuveen Premium Income Municipal Fund IV | | | 55,000 | | | 647,900 |
Nuveen Quality Income Municipal Fund | | | 55,000 | | | 750,200 |
Putnam Municipal Bond Fund | | | 32,257 | | | 378,697 |
Van Kampen Advantage Municipal Income Trust II | | | 61,796 | | | 746,496 |
Van Kampen Trust for Investment Grade Municipals | | | 55,000 | | | 776,050 |
Total Municipal Funds
(cost $6,544,620) | | | | | | 6,074,096 |
Preferred Stock - 0.5% | | | | | | |
DG Funding Trust, 7.448%, 12/31/07 (a) 4
(cost $6,037,773) | | | 573 | | | 6,043,359 |
Options and Swaptions - 0.4% | | | | | | |
3-Month USD-JPY (Call), $105.40, 03/31/10 | | | 3,000,000 | | | 141,171 |
3-Month USD-JPY (Put), $105.40, 03/31/10 | | | 3,000,000 | | | 128,997 |
3-Month USD-LIBOR-BBA (Call), 4.750%, 02/01/08 | | | 32,000,000 | | | 99,044 |
3-Month USD-LIBOR-BBA (Call), 4.750%, 03/31/08 | | | 81,200,000 | | | 567,864 |
3-Month USD-LIBOR-BBA (Call), 4.750%, 03/31/08 | | | 97,600,000 | | | 682,556 |
3-Month USD-LIBOR-BBA (Call), 4.750%, 09/26/08 | | | 9,000,000 | | | 73,169 |
3-Month USD-LIBOR-BBA (Call), 5.000%, 02/01/08 | | | 77,500,000 | | | 735,115 |
3-Month USD-LIBOR-BBA (Call), 5.250%, 12/15/08 | | | 197,000,000 | | | 2,142,158 |
3-Month USD-LIBOR-BBA (Call), 4.750%, 12/15/08 | | | 64,300,000 | | | 528,906 |
3-Month USD-LIBOR-BBA (Call), 5.200%, 02/01/11 | | | 5,000,000 | | | 65,245 |
Total Options and Swaptions
(cost $2,763,639) | | | | | | 5,164,225 |
The accompanying notes are an integral part of these financial statements.
15
Managers Fremont Bond Fund
Schedule of Portfolio Investments (continued)
| | | | | | | |
Security Description | | Principal Amount | | Value | |
Short-Term Investments - 3.2% | | | | | | | |
Commercial Paper - 0.2% | | | | | | | |
UniCredito Italiano Bank (Ireland) p.l.c., Discount Notes, 5.180%, 11/27/07 | | $ | 2,600,000 | | $ | 2,590,848 | |
| | |
| | | Shares | | | |
Other Investment Companies - 3.0%1 | | | | | | | |
Bank of New York Institutional Cash Reserves Fund, 5.09%3 | | | 17,452,382 | | | 17,452,382 | |
Dreyfus Cash Management Fund, Institutional Class Shares, 4.94% | | | 18,944,151 | | | 18,944,151 | |
Total Other Investment Companies | | | | | | 36,396,533 | |
Total Short-Term Investments
(cost $38,986,797) | | | | | | 38,987,381 | |
Total Investments - 132.1%
(cost $1,588,812,055) | | | | | | 1,594,543,878 | |
Other Assets, less Liabilities - (32.1)% | | | | | | (387,471,581 | ) |
Net Assets - 100.0% | | | | | $ | 1,207,072,297 | |
Note: Based on the cost of investments of $1,588,845,711 for Federal income tax purposes at October 31, 2007, the aggregate gross unrealized appreciation and depreciation were $14,769,134 and $9,070,967, respectively, resulting in net unrealized appreciation of investments of $5,698,167.
(a) | Security exempt from registration under Rule 144A of the Securities Act of 1933. This security may be resold in transactions exempt from registration, normally to qualified buyers. At October 31, 2007, the value of these securities amounted to $119,302,623, or 9.9% of net assets. |
1 | Yield shown for an investment company represents the October 31, 2007, seven-day average yield, which refers to the sum of the previous seven days’ dividends paid, expressed as an annual percentage. |
2 | Some or all of these shares, amounting to a market value of $17,011,349, or 1.4% of net assets, were out on loan to various brokers. |
3 | Collateral received from brokers for securities lending was invested in this short-term investment. |
4 | Floating Rate Security. The rate listed is as of October 31, 2007. Date in parenthesis represents the security’s next coupon rate reset. |
5 | Variable Rate Security. The rate listed is as of October 31, 2007 and is periodically reset subject to terms and conditions set forth in the debenture. |
6 | Perpetuity Bond. The date shown is the final call date. |
7 | Security held as collateral for futures contracts, amounting to a market value of $7,038,242, or 0.6% of net assets. |
Investment Definitions and Abbreviations:
| | |
| BBA: | | British Banker’s Association |
| EURIBOR: | | Euro Inter-Bank Offered Rate |
| FHLMC: | | Federal Home Loan Mortgage Corp. |
| FNMA: | | Federal National Mortgage Association |
| GBP: | | British Pound |
| GNMA: | | Government National Mortgage Association |
| JPY: | | Japanese Yen |
| LIBOR: | | London Inter-Bank Offered Rate |
| TBA: | | To Be Announced |
| USD: | | United States Dollar |
Abbreviations have been used throughout the portfolio to indicate amounts shown in currencies other than the U.S. dollar
(USD): € : Euro
The accompanying notes are an integral part of these financial statements.
16
THIS PAGE INTENTIONALLY LEFT BLANK
Managers Fremont Bond Fund
Statement of Assets and Liabilities
October 31, 2007
| | | | |
Assets: | | | | |
Investments at value* (including securities on loan valued at $17,011,349) | | $ | 1,594,543,878 | |
Cash | | | 4,074,488 | |
Foreign currency** | | | 7,109,573 | |
Receivable for investments sold | | | 220,445,944 | |
Receivable for delayed delivery securities sold | | | 24,832,613 | |
Receivable for Fund shares sold | | | 1,494,592 | |
Swaps at value, long (premiums paid $321,515,283) | | | 405,556,255 | |
Unrealized appreciation on foreign currency contracts | | | 8,723,378 | |
Dividends, interest and other receivables | | | 7,403,184 | |
Prepaid expenses | | | 10,829 | |
| | | | |
Total assets | | | 2,274,194,734 | |
| | | | |
Liabilities: | | | | |
Payable for investments purchased | | | 612,340,306 | |
Payable for Fund shares repurchased | | | 1,167,046 | |
Payable upon return of securities loaned | | | 17,452,382 | |
Payable for delayed delivery securities purchased | | | 24,779,139 | |
Options written (premiums received $2,676,498) | | | 3,646,302 | |
Variation margin payable | | | 2,457,404 | |
Swaps at value, short (premiums received $320,653,699) | | | 403,131,714 | |
Unrealized depreciation on foreign currency contracts | | | 687,416 | |
Dividends payable to shareholders | | | 489,265 | |
Accrued expenses: | | | | |
Investment advisory and management fees | | | 325,194 | |
Administrative fees | | | 201,668 | |
Other | | | 444,601 | |
| | | | |
Total liabilities | | | 1,067,122,437 | |
| | | | |
Net Assets | | $ | 1,207,072,297 | |
| | | | |
Shares outstanding | | | 115,941,033 | |
| | | | |
Net asset value, offering and redemption price per share | | $ | 10.41 | |
| | | | |
Net Assets Represent: | | | | |
Paid-in capital | | $ | 1,194,781,831 | |
Undistributed net investment loss | | | (1,709,097 | ) |
Accumulated net realized loss from investments, options, futures, swaps, foreign currency contracts and transactions | | | (7,295,410 | ) |
Net unrealized appreciation of investments, options, futures, swaps, foreign currency contracts and translations | | | 21,294,973 | |
| | | | |
Net Assets | | $ | 1,207,072,297 | |
| | | | |
* Investments at cost | | $ | 1,588,812,055 | |
** Foreign currency at cost | | $ | 6,983,837 | |
The accompanying notes are an integral part of these financial statements.
18
Managers Fremont Bond Fund
Statement of Operations
For the fiscal year ended October 31, 2007
| | | | |
Investment Income: | | | | |
Interest income | | $ | 62,295,684 | |
Dividend income | | | 1,036,332 | |
Securities lending fees | | | 34,508 | |
| | | | |
Total investment income | | | 63,366,524 | |
| | | | |
Expenses: | | | | |
Investment advisory and management fees | | | 4,642,137 | |
Administrative fees | | | 2,901,336 | |
Custodian fees | | | 439,652 | |
Transfer agent fees | | | 355,498 | |
Professional fees | | | 300,235 | |
Reports to shareholders | | | 92,950 | |
Trustees fees and expenses | | | 61,880 | |
Registration fees | | | 45,575 | |
Insurance | | | 45,430 | |
Miscellaneous | | | 8,481 | |
| | | | |
Total expenses before offsets | | | 8,893,174 | |
| | | | |
Expense reimbursements | | | (1,329,458 | ) |
Fee waivers | | | (580,267 | ) |
Expense reductions | | | (20,243 | ) |
| | | | |
Net expenses | | | 6,963,206 | |
| | | | |
Net investment income | | | 56,403,318 | |
| | | | |
Net Realized and Unrealized Gain (Loss): | | | | |
Net realized loss on investments, options, futures, and swap transactions | | | (7,202,361 | ) |
Net realized gain on foreign currency contracts and transactions | | | 281,987 | |
Net unrealized appreciation of investments, options, futures, swaps, foreign currency contracts and translations | | | 17,679,216 | |
| | | | |
Net realized and unrealized gain | | | 10,758,842 | |
| | | | |
Net increase in net assets resulting from operations | | $ | 67,162,160 | |
| | | | |
The accompanying notes are an integral part of these financial statements.
19
Managers Fremont Bond Fund
Statement of Changes in Net Assets
For the fiscal year ended October 31,
| | | | | | | | |
| | | 2007 | | | 2006 | |
Increase (Decrease) in Net Assets From Operations: | | | | | | | | |
Net investment income | | $ | 56,403,318 | | | $ | 49,429,933 | |
Net realized loss on investments, options, futures, swaps, foreign currency contracts and transactions | | | (6,920,374 | ) | | | (7,544,958 | ) |
Net unrealized appreciation of investments, options, futures, swaps, foreign currency contracts and translations | | | 17,679,216 | | | | 7,507,079 | |
| | | | | | | | |
Net increase in net assets resulting from operations | | | 67,162,160 | | | | 49,392,054 | |
| | | | | | | | |
Distributions to Shareholders: | | | | | | | | |
From net investment income | | | (56,156,859 | ) | | | (48,914,309 | ) |
| | | | | | | | |
From Capital Share Transactions: | | | | | | | | |
Proceeds from the sale of shares | | | 226,861,632 | | | | 369,012,726 | |
Reinvestment of dividends | | | 52,581,882 | | | | 44,650,870 | |
Cost of shares repurchased | | | (246,627,792 | ) | | | (222,019,862 | ) |
| | | | | | | | |
Net increase from capital share transactions | | | 32,815,721 | | | | 191,643,734 | |
| | | | | | | | |
Total increase in net assets | | | 43,821,022 | | | | 192,121,479 | |
| | | | | | | | |
Net Assets: | | | | | | | | |
Beginning of year | | | 1,163,251,275 | | | | 971,129,796 | |
| | | | | | | | |
End of year | | $ | 1,207,072,297 | | | $ | 1,163,251,275 | |
| | | | | | | | |
End of year undistributed net investment income (loss) | | | ($1,709,097 | ) | | $ | 1,389,898 | |
| | | | | | | | |
Share Transactions: | | | | | | | | |
Sale of shares | | | 22,117,028 | | | | 35,957,793 | |
Shares issued in connection with reinvestment of dividends | | | 5,134,152 | | | | 4,364,095 | |
Shares repurchased | | | (24,153,549 | ) | | | (21,686,576 | ) |
| | | | | | | | |
Net increase in shares | | | 3,097,631 | | | | 18,635,312 | |
| | | | | | | | |
The accompanying notes are an integral part of these financial statements.
20
Managers Fremont Bond Fund
Financial Highlights
For a share outstanding throughout each fiscal year
| | | | | | | | | | | | | | | | | | | | |
| | | For the fiscal year ended October 31, | |
| | | 2007 | | | 2006 | | | 2005 | | | 2004 | | | 2003 | |
Net Asset Value, Beginning of Year | | $ | 10.31 | | | $ | 10.31 | | | $ | 10.79 | | | $ | 10.43 | | | $ | 10.51 | |
Income from Investment Operations: | | | | | | | | | | | | | | | | | | | | |
Net investment income | | | 0.47 | | | | 0.47 | | | | 0.37 | | | | 0.24 | | | | 0.27 | |
Net realized and unrealized gain (loss) on investments | | | 0.13 | | | | (0.00 | )3 | | | (0.17 | ) | | | 0.42 | | | | 0.36 | |
Total from investment operations | | | 0.60 | | | | 0.47 | | | | 0.20 | | | | 0.66 | | | | 0.63 | |
Less Distributions to Shareholders from: | | | | | | | | | | | | | | | | | | | | |
Net investment income | | | (0.50 | ) | | | (0.47 | ) | | | (0.35 | ) | | | (0.25 | ) | | | (0.37 | ) |
Net realized gain on investments | | | — | | | | — | | | | (0.33 | ) | | | (0.05 | ) | | | (0.34 | ) |
Total distributions to shareholders | | | (0.50 | ) | | | (0.47 | ) | | | (0.68 | ) | | | (0.30 | ) | | | (0.71 | ) |
Net Asset Value, End of Year | | $ | 10.41 | | | $ | 10.31 | | | $ | 10.31 | | | $ | 10.79 | | | $ | 10.43 | |
Total Return1 | | | 5.96 | % | | | 4.75 | % | | | 2.00 | % | | | 6.45 | % | | | 6.20 | % |
Ratio of net operating expenses to average net assets | | | 0.60 | % | | | 0.60 | % | | | 0.60 | % | | | 0.60 | % | | | 0.61 | % |
Ratio of net investment income to average net assets1 | | | 4.86 | % | | | 4.72 | % | | | 3.43 | % | | | 2.24 | % | | | 2.81 | % |
Portfolio turnover | | | 249 | % | | | 244 | % | | | 392 | % | | | 113 | % | | | 85 | % |
Net assets at end of year (000’s omitted) | | $ | 1,207,072 | | | $ | 1,163,251 | | | $ | 971,130 | | | $ | 852,799 | | | $ | 852,076 | |
Ratios absent expense offsets:2 | | | | | | | | | | | | | | | | | | | | |
Ratio of total expenses to average net assets | | | 0.77 | % | | | 0.77 | % | | | 0.72 | % | | | 0.69 | % | | | 0.66 | % |
Ratio of net investment income to average net assets | | | 4.69 | % | | | 4.55 | % | | | 3.31 | % | | | 2.15 | % | | | 2.76 | % |
1 | Total returns and net investment income would have been lower had certain expenses not been reduced. (See Note 1c of Notes to Financial Statements.) |
2 | Excludes the impact of expense reimbursements and expense offsets such as brokerage recapture credits, but includes non-reimbursable expenses such as interest and taxes. (See Note 1c of Notes to Financial Statements.) |
3 | Rounds to less than ($0.01) per share. |
21
Managers Fremont Bond Fund
Notes to Financial Statements
October 31, 2007
| 1. | Summary of Significant Accounting Policies |
Managers Trust I (the “Trust”) is an open-end management investment company organized as a Massachusetts business trust and registered under the Investment Company Act of 1940, as amended (the “1940 Act”). Currently, the Trust is comprised of a number of investment series. Included in this report is the Managers Fremont Bond Fund (the “Fund”).
The Fund’s financial statements are prepared in accordance with accounting principles generally accepted in the United States of America, which require management to make estimates and assumptions that affect the reported amount of assets and liabilities and disclosure of contingent assets and liabilities at the date of the financial statements and the reported amounts of income and expenses during the reporting periods. Actual results could differ from those estimates. The following is a summary of significant accounting policies followed by the Fund in the preparation of its financial statements:
| a. | Valuation of Investments |
Equity securities traded on a domestic or international securities exchange are valued at the last quoted sale price, or, lacking any sales, at the last quoted bid price. Over-the-counter securities are valued at the NASDAQ Official Closing Price, if one is available. Lacking any sales, over-the counter securities are valued at the last quoted bid price. Under certain circumstances, the value of each Fund’s investment may be based on an evaluation of its fair value, pursuant to procedures established by and under the general supervision of the Board of Trustees of the Trust. A Fund may use the fair value of a portfolio security to calculate its NAV when, for example, (1) market quotations are not readily available because a portfolio security is not traded in a public market or the principal market in which the security trades is closed, (2) trading in a portfolio security is suspended and has not resumed before the Fund calculates its NAV, (3) a significant event affecting the value of a portfolio security is determined to have occurred between the time of the market quotation provided for a portfolio security and the time as of which the Fund calculates its NAV, (4) a security’s price has remained unchanged over a period of time (often referred to as a “stale price”), or (5) Managers Investment Group LLC (the “Investment Manager”) determines that a market quotation is inaccurate. The Investment Manager monitors intervening events that may affect the value of securities held in a Fund’s portfolio and, in accordance with procedures adopted by the Fund’s Trustees, will adjust the prices of securities traded in foreign markets, as appropriate, to reflect the impact of events occurring subsequent to the close of such markets but prior to the time each Fund’s NAV is calculated.
Fixed income securities are valued based on valuations furnished by independent pricing services that utilize matrix systems, which reflect such factors as security prices, yields, maturities, and ratings, and are supplemented by dealer and exchange quotations. Futures contracts for which market quotations are readily available are valued at the settlement price as of the close of the futures exchange. Short-term investments having a remaining maturity of 60 days or less are valued at amortized cost, which approximates market value. Investments in other regulated investment companies are valued at their end of day net asset value per share. Investments in certain mortgage-backed, stripped mortgage-backed, preferred stocks, convertible securities, derivatives and other debt securities not traded on an organized securities market are valued on the basis of valuations provided by dealers or by a pricing service which uses information with respect to transactions in such securities and various relationships between securities and yield to maturity in determining value. Securities (including derivatives) for which market quotations are not readily available are valued at fair value, as determined in good faith, and pursuant to procedures adopted by the Board of Trustees of the Trust. The values assigned to fair value investments are based on available information and do not necessarily represent amounts that might ultimately be realized, since such amounts depend on future developments inherent in long-term investments. Further, because of the inherent uncertainty of valuation, those estimated values may differ significantly from the values that would have been used had a ready market for the investments existed, and the differences could be material.
Security transactions are accounted for as of the trade date. Realized gains and losses on securities sold are determined on the basis of identified cost.
| c. | Investment Income and Expenses |
Dividend income is recorded on the ex-dividend date except certain dividends from foreign securities where the ex-dividend date may have passed. These dividends are recorded as soon as the Trust is informed of the ex-dividend date. Dividend income on foreign securities is recorded net of any withholding tax. Interest income, which includes amortization of premium and accretion of discount on debt securities, as required, is accrued as earned. Non-cash dividends included in dividend income, if any, are reported at the fair market value of the securities received. Other income and expenses are recorded on an accrual basis. Expenses that cannot be directly attributed to a fund are apportioned among the Funds in the Trust and in some cases other affiliated funds based upon their relative average net assets or number of shareholders.
The Fund has a “balance credit” arrangement with The Bank of New York (“BNY”), the Fund’s custodian, whereby the Fund is credited with an interest factor equal to 0.75% below the effective 90-day T-Bill rate for account balances left uninvested overnight. These credits serve to reduce custody expenses that would otherwise be charged to the Fund. For the fiscal year ended October 31, 2007, the custodian expense was reduced by $10,510.
Overdrafts will cause a reduction of any earnings credits, computed at 2% above the Federal funds rate on the day of the overdraft. For the fiscal year ended October 31, 2007, the Fund had no overdraft fees.
The Trust also has a balance credit arrangement with its Transfer Agent, PFPC, Inc., whereby earnings credits are used to offset banking charges. For the fiscal year end October, 31, 2007, the transfer agent expense was reduced by $9,733.
The Investment Manager, an independently-managed subsidiary of Affiliated Managers Group, Inc. (“AMG”) and the investment manager for the Fund, has contractually agreed, through at least March 1, 2008, to waive fees and pay or reimburse expenses to the extent that the total annual operating expenses (exclusive of brokerage costs, acquired fund fees and expenses, interest, taxes and extraordinary expenses) of the Fund exceed 0.60% of the Fund’s average daily net assets.
22
Managers Fremont Bond Fund
Notes to Financial Statements (continued)
As of January 15, 2005, the Fund is obligated to repay the Investment Manager such amounts waived, paid or reimbursed in future years provided that the repayment occurs within three (3) years after the waiver or reimbursement and that such repayment would not cause the Fund’s expenses in any such year to exceed the previously stated contractual expense limitation percentages of that Fund’s average daily net assets. For the fiscal year ended October 31, 2007, the Fund made no such repayments to the Investment Manager. For the period January 15, 2005 through October 31, 2007, the cumulative amount of expense reimbursement by the Investment Manager subject to repayment by the Fund equaled $3,211,690.
| d. | Dividends and Distributions |
Dividends resulting from net investment income, if any, normally will be declared daily and paid monthly. Distributions of capital gains, if any, will be made on an annual basis and when required for Federal excise tax purposes. Income and capital gain distributions are determined in accordance with Federal income tax regulations, which may differ from generally accepted accounting principles. These differences are primarily due to differing treatments for losses deferred due to wash sales, equalization accounting for tax purposes, foreign currency, options, futures and market discount transactions. Permanent book and tax basis differences, if any, relating to shareholder distributions will result in reclassifications to paid-in capital. The tax character of distributions paid during the fiscal years 2007 and 2006 were as follows:
| | | | | | |
Distributions paid from: | | 2007 | | 2006 |
Ordinary income | | $ | 56,156,859 | | $ | 48,914,309 |
Short-term capital gains | | | — | | | — |
Long-term capital gains | | | — | | | — |
| | | | | | |
| | $ | 56,156,859 | | $ | 48,914,309 |
| | | | | | |
As of October 31, 2007, the components of distributable earnings (excluding unrealized appreciation/depreciation) on a tax basis consisted of:
| | | |
Capital loss carryforward | | $ | 151,009 |
Undistributed ordinary income | | | 6,406,160 |
The Fund intends to comply with the requirements under Subchapter M of the Internal Revenue Code of 1986, as amended, to distribute substantially all of its taxable income and gains to its shareholders and to meet certain diversification and income requirements with respect to investment companies. Therefore, no provision for Federal income or excise tax is included in the accompanying financial statements.
Additionally, based on the Fund’s understanding of the tax rules and rates related to income, gains and transactions for the foreign jurisdictions in which it invests, the Fund will provide for foreign taxes, and where appropriate, deferred foreign taxes.
| f. | Capital Loss Carryovers |
As of October 31, 2007, the Fund had accumulated net realized capital loss carryovers of $151,009. This amount may be used for Federal income tax purposes to offset future realized capital gains, if any, through October 31, 2014.
The Trust’s Declaration of Trust authorizes for each series the issuance of an unlimited number of shares of beneficial interest, without par value. The Fund records sales and repurchases of its capital stock on the trade date. Dividends and distributions to shareholders are recorded on the ex-dividend date.
At October 31, 2007, certain unaffiliated shareholders of record, specifically omnibus accounts, individually held greater than 10% of the outstanding shares of the Fund as follows: 3 own collectively 47%. Transactions by these shareholders may have a material impact on the Fund.
The Fund may enter into repurchase agreements provided that the value of the underlying collateral, including accrued interest, will be equal to or exceed the value of the repurchase agreement during the term of the agreement. The underlying collateral for all repurchase agreements is held in safekeeping by the Fund’s custodian or at the Federal Reserve Bank. If the seller defaults and the value of the collateral declines, or if bankruptcy proceedings commence with respect to the seller of the security, realization of the collateral by the Fund may be delayed or limited. At October 31, 2007, the Fund had no repurchase agreements.
| i. | Foreign Currency Translation |
The books and records of the Fund are maintained in U.S. dollars. The value of investments, assets and liabilities denominated in currencies other than U.S. dollars are translated into U.S. dollars based upon current foreign exchange rates. Purchases and sales of foreign investments, income and expenses are converted into U.S. dollars based on currency exchange rates prevailing on the respective dates of such transactions. Net realized and unrealized gain (loss) on foreign currency transactions represent: (1) foreign exchange gains and losses from the sale and holdings of foreign currencies; (2) gains and losses between trade date and settlement date on investment securities transactions and forward foreign currency exchange contracts; and (3) gains and losses from the difference between amounts of interest and dividends recorded and the amounts actually received.
In addition, the Fund does not isolate the net realized and unrealized gain or loss resulting from changes in exchange rates from the fluctuations in market prices of securities held. Such fluctuations are included with the net realized and unrealized gain or loss on investments.
| j. | Securities Transacted on a When Issued Basis |
The Fund may enter into To Be Announced (“TBA”) sale commitments to hedge its portfolio positions or to sell mortgage-backed securities it owns under delayed delivery arrangements. Proceeds of TBA sale commitments are not received until the contractual settlement date. During the time a TBA sale commitment is outstanding, equivalent deliverable securities, or an offsetting TBA purchase commitment deliverable on or before the sale commitment date, are held as “cover” for the transaction. Unsettled TBA sale commitments are valued at the current market value of the underlying securities, generally according to the procedures described under “Valuation of Investments,” in footnote 1a above. Each contract is marked-to-market daily and the change in market value is recorded by the Fund as an unrealized gain or
23
Managers Fremont Bond Fund
Notes to Financial Statements (continued)
loss. If the TBA sale commitment is closed through the acquisition of an offsetting purchase commitment, the Fund realizes a gain or loss. If the Fund delivers securities under the commitment, the Fund realizes a gain or a loss from the sale of the securities based upon the unit price established at the date the commitment was entered into. The Fund had no TBA sale commitments outstanding as of October 31, 2007.
| 2. | Agreements and Transactions with Affiliates |
The Trust has entered into an Investment Management Agreement dated January 15, 2005 under which the Investment Manager provides or oversees investment management services to the Fund. The Investment Manager selects subadvisors for the Fund (subject to Trustee approval) and monitors each subadvisor’s investment programs and results. The Fund’s investment portfolio is managed by a portfolio manager who serves pursuant to a subadvisory agreement with the Investment Manager.
Investment management fees are paid directly by the Fund to the Investment Manager based on average daily net assets. The annual investment management fee rate, as a percentage of average daily net assets for the fiscal year ended October 31, 2007, was 0.40%.
The Trust has entered into an Administration and Shareholder Servicing Agreement under which the Investment Manager serves as the Fund’s administrator (the “Administrator”) and is responsible for all aspects of managing the Fund’s operations, including administration and shareholder services to the Fund, its shareholders, and certain institutions, such as bank trust departments, broker-dealers and registered investment advisers, that advise or act as an intermediary with the Fund’s shareholders. For its services, the Administrator is paid a fee at a rate of 0.25% per annum. For the fiscal year ended October 31, 2007, the Administrator voluntarily agreed to waive 0.05% of its fee amounting to $580,267. During the fiscal year ended October 31, 2007, the Fund paid administration fees of $2,321,069, net of waivers.
Prior to July 1, 2007, the aggregate annual retainer paid to each Independent Trustee was $55,000, plus $4,000 or $2,000 for each regular or special meeting attended, respectively. Effective July 1, 2007, the aggregate annual retainer paid to each Independent Trustee is $65,000, plus $4,000 or $2,500 for each regular or special meeting attended, respectively. The Trustees’ fees and expenses are allocated amongst all of the Funds for which the Investment Manager serves as the advisor (the “Managers Funds”) based on the relative net assets of such Funds. The Independent Chairman of the Trusts receives an additional payment of $15,000 per year. (Prior to July 1, 2007, the Independent Chairman received an additional payment of $10,000 per year). The Chairman of the Audit Committee receives an additional payment of $5,000 per year. (Prior to July 1, 2007, the Chairman of the Audit Committee received an additional payment of $2,000 per year). The “Trustee fees and expenses” shown in the financial statements represents the Fund’s allocated portion of the total fees and expenses paid by the Fund and other affiliated funds in the Managers Funds.
The Funds are distributed by Managers Distributors, Inc. (the “Distributor”) a wholly-owned subsidiary of the Investment Manager. The Distributor serves as the principal underwriter for each Fund. The Distributor is a registered broker-dealer and member of the Financial Industry Regulatory Authority (“FINRA”). Shares of each Fund will be continuously offered and will be sold by brokers, dealers or other financial intermediaries who have executed selling agreements with the Distributor. The Distributor bears all the expenses of providing services pursuant to the Underwriting Agreement, including the payment of the expenses relating to the distribution of Prospectuses for sales purposes and any advertising or sales literature. Certain Trustees and Officers of the Funds are Officers and/or Directors of the Investment Manager, AMG and/or the Distributor.
| 3. | Purchases and Sales of Securities |
Purchases and sales of securities, excluding short-term securities, for the fiscal year ended October 31, 2007, were $3,746,126,719 and $3,147,859,293, respectively. Purchases and sales of U.S. Government securities for the fiscal year ended October 31, 2007, were $3,232,538,398 and $2,920,526,315, respectively.
| 4. | Portfolio Securities Loaned |
The Fund may participate in a securities lending program offered by BNY providing for the lending of equities, corporate bonds and government securities to qualified brokers. Collateral on all securities loaned is accepted in cash and/or government securities. Collateral is maintained at a minimum level of 102% of the market value, plus interest, if applicable, of investments on loan. Collateral received in the form of cash is invested temporarily in institutional money market funds or other short-term investments by BNY. Security lending fees include earnings of such temporary cash investments, plus or minus any rebate. Earnings (after any rebate) then are divided between BNY, as a fee for its services under the program, and the Fund loaning the security, according to agreed-upon rates.
| 5. | Commitments and Contingencies |
In the normal course of business, the Fund may enter into contracts and agreements that contain a variety of representations and warranties, which provide general indemnifications. The maximum exposure to the Fund under these arrangements is unknown, as this would involve future claims that may be made against the Fund that have not yet occurred. However, based on experience, the Fund expects the risk of loss to be remote.
Certain transactions, such as futures and forward transactions, dollar roll agreements, or purchases of when-issued or delayed delivery securities may have a similar effect on the Fund’s net asset value as if the Fund had created a degree of leverage in its portfolio. However, if the Fund enters into such a transaction, the Fund will establish a segregated account with its custodian in which it will maintain cash, U.S. government securities or other liquid securities equal in value to its obligations in respect to such transaction. Securities and other assets held in the segregated account may not be sold while the transaction is outstanding, unless other suitable assets are substituted.
| 7. | Futures Contracts Held or Issued |
The Fund may purchase or sell futures contracts to achieve a desired level of investment, whether to accommodate portfolio turnover or cash flows from capital shares transactions. There are certain risks associated with futures contracts. Prices may not move as expected or the Fund may not be able to close out the contract when it desires to do so, resulting in losses.
24
Managers Fremont Bond Fund
Notes to Financial Statements (continued)
Futures are valued at their quoted daily settlement prices. The aggregate principal amounts of the contracts are not recorded in the financial statements. Fluctuations in the value of the contracts are recorded in the Statement of Assets and Liabilities as an asset (liability) and in the Statement of Operations as unrealized appreciation (depreciation) until the contracts are closed, when they are recorded as realized gains (losses) on futures or forward currency contracts.
At October 31, 2007, the Fund had the following open futures contracts:
| | | | | | | | | |
Type | | Number of
Contracts | | Position | | Expiration Month | | Unrealized
Gain/(Loss) |
3-Month Pound Sterling | | 1,714 | | Long | | 03/08 - 6/09 | | $ | 898,826 |
3-Month Eurodollar | | 6,491 | | Long | | 09/08 - 9/09 | | | 6,951,087 |
10-Year U.S. Treasury Note | | 35 | | Long | | 12/07 | | | 37,188 |
| | | | | | | | | |
| | | | | | | | $ | 7,887,101 |
| | | | | | | | | |
| 8. | Interest Rate Caps, Swap Contracts and Options |
The Fund may enter into over-the-counter transactions involving interest rate caps, swap contracts, or purchase and write (sell) options to enter into such contracts, in order to manage interest rate risk. In an interest rate cap agreement, one party agrees to make payments only under specified circumstances, usually in return for payment of a fee by the other party. An interest rate cap entitles the purchaser, to the extent that a specified index exceeds a predetermined interest rate, to receive payments of interest on a notional principal amount from the party selling such interest rate cap. Swap contracts represent an agreement between counter parties to exchange cash flows based on the difference between two rates applied to a notional principal amount for a specified period. The most common type of interest rate swap involves the exchange of fixed-rate cash flows for variable-rate cash flows. Swaps do not involve the exchange of principal between the parties. Purchased options on swap contracts (“swaptions”) give the holder the right, but not the obligation, to enter into a swap contract with the counter party which has written the option on a date, at an interest rate, and with a notional amount as specified in the swaption agreement. If the counter party to the swap transaction defaults, the Fund will be limited to contractual remedies pursuant to the agreements governing the transaction. There is no assurance that swap or swaption contract counter parties will be able to meet their obligations under the contracts or that, in the event of default, the Fund will succeed in pursuing contractual remedies. The Fund may thus assume the risk that payments owed the Fund under a swap or swaption contract will be delayed, or not received at all. During the term of the swap agreement or swaption, unrealized gains or losses are recorded as a result of “marking to market.” When the swap agreement or swaption is terminated, the Fund will record a realized gain or loss equal to the difference between the proceeds from (or cost of) the closing transaction and the Fund’s basis in the contract, if any. Accrued interest and interest paid are recognized as unrealized and realized gain (loss), respectively. In each of the contracts, the Fund pays a premium, to the counterparty, in return for the swaption. These swaptions may be exercised by entering into a swap contract with the counterparty only on the date specified in each contract.
25
Managers Fremont Bond Fund
Notes to Financial Statements (continued)
At October 31, 2007, the Fund had the following open swap contracts:
| | | | | | | | | | |
Pay | | Receive | | Maturity | | Notional Amount | | Unrealized
Gain/
(Loss) | |
Interest Rate Swaps | | | | | | | | | | |
6-Month EUR-EURIBOR | | Fixed Rate 4.000% | | 03/20/09 | | € | 3,300,000 | | ($25,586 | ) |
6-Month EUR-EURIBOR | | Fixed Rate 5.000% | | 12/19/09 | | € | 8,500,000 | | 100,324 | |
6-Month France CPI Excl. Tobacco Index | | Fixed Rate 1.950% | | 03/30/12 | | € | 1,200,000 | | (9,397 | ) |
6-Month France CPI Excl. Tobacco Index | | Fixed Rate 1.955% | | 03/28/12 | | € | 1,000,000 | | (7,278 | ) |
6-Month France CPI Excl. Tobacco Index | | Fixed Rate 1.960% | | 03/30/12 | | € | 800,000 | | (5,019 | ) |
6-Month France CPI Excl. Tobacco Index | | Fixed Rate 1.960% | | 04/05/12 | | € | 400,000 | | (2,989 | ) |
6-Month France CPI Excl. Tobacco Index | | Fixed Rate 2.103% | | 10/15/10 | | € | 3,900,000 | | 77,014 | |
6-Month France CPI Excl. Tobacco Index | | Fixed Rate 2.146% | | 10/15/10 | | € | 1,000,000 | | 21,800 | |
Mexican Interbank Equilibrium Interest Rate | | Fixed Rate 7.780% | | 04/03/12 | | M$ | 15,200,000 | | (17,904 | ) |
6-Month GBP-LIBOR-BBA | | Fixed Rate 6.000% | | 03/20/09 | | £ | 4,400,000 | | 26,471 | |
6-Month GBP-LIBOR-BBA | | Fixed Rate 5.000% | | 06/15/09 | | £ | 1,000,000 | | (24,589 | ) |
6-Month GBP-LIBOR-BBA | | Fixed Rate 5.000% | | 06/15/09 | | £ | 5,000,000 | | (123,178 | ) |
6-Month GBP-LIBOR-BBA | | Fixed Rate 5.000% | | 06/15/09 | | £ | 9,800,000 | | (241,428 | ) |
6-Month GBP-LIBOR-BBA | | Fixed Rate 6.000% | | 12/20/08 | | £ | 8,300,000 | | 22,700 | |
6-Month GBP-LIBOR-BBA | | Fixed Rate 6.000% | | 12/20/08 | | £ | 5,000,000 | | 13,675 | |
6-Month GBP-LIBOR-BBA | | Fixed Rate 6.000% | | 03/20/09 | | £ | 4,700,000 | | 28,276 | |
6-Month GBP-LIBOR-BBA | | Fixed Rate 6.000% | | 06/19/09 | | £ | 6,600,000 | | 52,478 | |
6-Month GBP-LIBOR-BBA | | Fixed Rate 6.000% | | 06/19/09 | | £ | 23,400,000 | | 186,058 | |
6-Month GBP-LIBOR-BBA | | Fixed Rate 6.000% | | 12/19/09 | | £ | 2,400,000 | | 27,677 | |
Fixed Rate 4.000% | | 6-Month GBP-LIBOR-BBA | | 12/15/35 | | £ | 1,100,000 | | 85,025 | |
Fixed Rate 4.000% | | 6-Month GBP-LIBOR-BBA | | 12/15/36 | | £ | 1,200,000 | | 327,275 | |
Fixed Rate 4.000% | | 6-Month GBP-LIBOR-BBA | | 12/15/36 | | £ | 3,500,000 | | 954,550 | |
Fixed Rate 4.000% | | 6-Month GBP-LIBOR-BBA | | 12/15/36 | | £ | 1,900,000 | | 518,185 | |
Fixed Rate 4.000% | | 6-Month GBP-LIBOR-BBA | | 12/15/36 | | £ | 1,300,000 | | 354,547 | |
Fixed Rate 5.000% | | 6-Month GBP-LIBOR-BBA | | 12/19/37 | | £ | 300,000 | | (15,280 | ) |
Fixed Rate 5.500% | | 6-Month GBP-LIBOR-BBA | | 12/15/36 | | £ | 1,600,000 | | (318,325 | ) |
Fixed Rate 5.500% | | 6-Month GBP-LIBOR-BBA | | 12/15/36 | | £ | 400,000 | | (79,581 | ) |
6-Month JPY-LIBOR-BBA | | Fixed Rate 2.000% | | 12/19/17 | | ¥ | 150,000,000 | | 22,934 | |
6-Month JPY-LIBOR-BBA | | Fixed Rate 2.000% | | 12/19/17 | | ¥ | 300,000,000 | | 45,868 | |
Mexican Interbank Equilibrium Interest Rate | | Fixed Rate 8.170% | | 11/04/16 | | M$ | 4,300,000 | | (2,002 | ) |
3-Month USD-LIBOR-BBA | | Fixed Rate 5.000% | | 12/19/09 | | $ | 15,300,000 | | 136,038 | |
3-Month USD-LIBOR-BBA | | Fixed Rate 5.000% | | 12/19/09 | | $ | 39,000,000 | | 346,763 | |
Fixed Rate 5.000% | | 3-Month USD-LIBOR-BBA | | 12/19/12 | | $ | 17,000,000 | | (132,952 | ) |
Fixed Rate 6.500% | | 6-Month Australian Bank Bill Rate | | 03/20/18 | | A$ | 5,200,000 | | (5,218 | ) |
3-Month Australian Bank Bill Rate | | Fixed Rate 7.000% | | 09/15/09 | | A$ | 35,700,000 | | (102,397 | ) |
6-Month Australian Bank Bill Rate | | Fixed Rate 7.000% | | 03/20/13 | | A$ | 3,800,000 | | (29,114 | ) |
Credit Default Swaps | | | | | | | | | | |
Anadarko Petroleum Corp. Bond | | Fixed Rate 0.150% | | 03/20/08 | | $ | 900,000 | | 211 | |
Federative Republic of Brazil Bond | | Fixed Rate 1.520% | | 01/20/17 | | $ | 3,000,000 | | 81,605 | |
Federative Republic of Brazil Bond | | Fixed Rate 1.950% | | 08/20/16 | | $ | 3,500,000 | | 200,032 | |
Petroleos Mexicanos, 9.500%, 09/15/27 | | Fixed Rate 0.620% | | 08/20/11 | | $ | 3,500,000 | | 15,105 | |
Republic of Indonesia Bond | | Fixed Rate 0.400% | | 12/20/08 | | $ | 800,000 | | (885 | ) |
26
Managers Fremont Bond Fund
Notes to Financial Statements (continued)
| | | | | | | | | | | | |
Pay | | Receive | | | Maturity | | Notional
Amount | | Unrealized
Gain/(Loss) | |
Republic of Panama Bond | | Fixed Rate 1.250 | % | | 01/20/17 | | $ | 200,000 | | | ($820 | ) |
Russian Federation Bond | | Fixed Rate 0.495 | % | | 08/20/11 | | $ | 3,500,000 | | | (16,588 | ) |
Ukraine Government Bond | | Fixed Rate 0.710 | % | | 12/20/08 | | $ | 2,000,000 | | | (3,187 | ) |
Ukraine Government Bond | | Fixed Rate 0.700 | % | | 12/20/08 | | $ | 2,000,000 | | | (3,410 | ) |
United Mexican States Bond | | Fixed Rate 0.650 | % | | 01/20/17 | | $ | 1,000,000 | | | 3,411 | |
Zero Coupon Swaps | | | | | | | | | | | | |
Brazil Interbank Deposit Rate | | Fixed Rate 11.980 | % | | 01/02/12 | | R$ | 5,800,000 | | | 30,179 | |
Brazil Interbank Deposit Rate | | Fixed Rate 10.575 | % | | 01/02/12 | | R$ | 8,200,000 | | | (129,338 | ) |
Brazil Interbank Deposit Rate | | Fixed Rate 11.360 | % | | 01/04/10 | | R$ | 5,500,000 | | | (19,799 | ) |
Brazil Interbank Deposit Rate | | Fixed Rate 11.430 | % | | 01/04/10 | | R$ | 3,600,000 | | | (10,267 | ) |
Brazil Interbank Deposit Rate | | Fixed Rate 11.465 | % | | 01/04/10 | | R$ | 1,400,000 | | | (3,444 | ) |
Brazil Interbank Deposit Rate | | Fixed Rate 12.780 | % | | 01/04/10 | | R$ | 5,000,000 | | | 50,589 | |
Brazil Interbank Deposit Rate | | Fixed Rate 12.948 | % | | 01/04/10 | | R$ | 2,100,000 | | | 25,726 | |
| | | | | | | | | | | | |
| | | | | | | | | | $ | 2,424,541 | |
| | | | | | | | | | | | |
| | | | |
| $: U.S. Dollar | | €: Euro | | R$: Brazilian Real |
| £: British Pound | | ¥: Japanese Yen | | M$: Mexican Dollar |
| A$: Australian Dollar | | | | |
For the fiscal year ended October 31, 2007, the Fund paid and received premiums of $321,515,283 and $320,653,699, respectively, on swap contracts. At October 31, 2007, the unrealized appreciation (net of premiums) on open swap contracts was $1,562,957.
A written option contract is a contract in which the writer of the option grants the buyer of the option the right to purchase from (call option) or sell to (put option) the writer a designated instrument at a specified price within a specified period of time. Options written (sold) are recorded as liabilities. When an option expires, the premium (original option value) is realized as a gain if the option was written or as a loss if the option was purchased. When the exercise of an option results in a cash settlement, the difference between the premium and the settlement proceeds is recognized as realized gain or loss. When securities are acquired or delivered upon exercise of an option, the acquisition cost or sale proceeds are adjusted by the amount of the premium. When an option is closed, the difference between the premium and the cost to close the position is realized as a gain or loss.
At October 31, 2007, the following written options were outstanding:
| | | | | | | | | | | |
Name | | Number of
Contracts | | Exercise
Price | | | Expiration
Month | | Unrealized
Gain/(Loss) | |
5-Year U.S. Treasury Note (Call) | | 100 | | 108.00 | | | 11/20/07 | | $ | 24,675 | |
10-Year U.S. Treasury Note (Call) | | 303 | | 111.00 | | | 11/20/07 | | | 71,436 | |
10-Year U.S. Treasury Note (Put) | | 202 | | 107.00 | | | 11/20/07 | | | 26,359 | |
FNMA 5.50% TBA (Call) | | 1,000,000 | | 99.11 | | | 11/20/07 | | | 3,253 | |
FNMA 5.50% TBA (Call) | | 1,000,000 | | 99.11 | | | 11/20/07 | | | 2,474 | |
3-Month USD-LIBOR (Call) | | 7,000,000 | | 4.90 | % | | 02/01/08 | | | 20,522 | |
3-Month USD-LIBOR (Call) | | 35,000,000 | | 4.90 | % | | 03/31/08 | | | 13,629 | |
3-Month USD-LIBOR (Call) | | 20,400,000 | | 4.90 | % | | 03/31/08 | | | 39,057 | |
3-Month USD-LIBOR (Call) | | 22,000,000 | | 4.95 | % | | 03/01/08 | | | (5,929 | ) |
3-Month USD-LIBOR (Call) | | 4,000,000 | | 4.95 | % | | 09/26/08 | | | (14,377 | ) |
3-Month USD-LIBOR (Call) | | 21,600,000 | | 5.00 | % | | 12/15/08 | | | (170,677 | ) |
3-Month USD-LIBOR (Call) | | 34,000,000 | | 5.10 | % | | 02/01/08 | | | (103,521 | ) |
3-Month USD-LIBOR (Call) | | 65,700,000 | | 5.20 | % | | 12/15/08 | | | (855,762 | ) |
3-Month USD-LIBOR (Call) | | 2,000,000 | | 5.45 | % | | 02/02/09 | | | (20,943 | ) |
| | | | | | | | | | | |
| | | | | | | Total | | | ($969,804 | ) |
| | | | | | | | | | | |
27
Managers Fremont Bond Fund
Notes to Financial Statements (continued)
Transactions in written put and call options for the fiscal year ended October 31, 2007, were as follows:
| | | | | | | |
| | | Number of
Contracts | | | Amounts of
Premiums | |
Options outstanding at October 31, 2006 | | 316,901,997 | | | $ | 4,604,411 | |
Options written | | 334,704,409 | | | | 4,835,365 | |
Options exercised/expired | | (437,905,801 | ) | | | (6,763,278 | ) |
| | | | | | | |
Options outstanding at October 31, 2007 | | 213,700,605 | | | $ | 2,676,498 | |
| | | | | | | |
| 9. | Forward Foreign Currency Contracts |
During the fiscal year ended October 31, 2007, the Fund invested in forward foreign currency exchange contracts to manage currency exposure. These investments may involve greater market risk than the amounts disclosed in the Fund’s financial statements.
A forward foreign currency exchange contract is an agreement between a Fund and another party to buy or sell a currency at a set price at a future date. The market value of the contract will fluctuate with changes in currency exchange rates. The contract is marked-to-market daily, and the change in market value is recorded as an unrealized gain or loss. Gain or loss on the purchase or sale of contracts having the same settlement date, amount and counter party is realized on the date of offset, otherwise gain or loss is realized on the settlement date.
The Fund may invest in non-U.S. dollar denominated instruments subject to limitations, and enter into forward foreign currency exchange contracts to facilitate transactions in foreign securities and to protect against a possible loss resulting from an adverse change in the relationship between the U.S. dollar and such foreign currency. Risks may arise upon entering into these contracts from the potential inability of counterparties to meet the terms of their contracts and from unanticipated movements in the value of a foreign currency relative to the U.S. dollar.
Open forward foreign currency exchange contracts (in U.S. Dollars) at October 31, 2007, were as follows:
| | | | | | | | | | | | | | | | |
Foreign Currency | | | | Settlement Date | | Contract Value
(Receivable) | | | Contract Value
(Payable) | | | Unrealized
Gain/Loss | |
Australian Dollar | | Long | | 11/08/07 - 11/21/07 | | $ | 4,241,922 | | | $ | 4,078,340 | | | $ | 163,582 | |
Brazilian Real | | Long | | 03/04/08 - 08/02/08 | | | 44,847,111 | | | | 38,788,684 | | | | 6,058,427 | |
Canadian Dollar | | Long | | 11/01/07 - 12/20/07 | | | 8,429,416 | | | | 8,147,316 | | | | 282,100 | |
Chilean Peso | | Long | | 03/13/08 | | | 533,010 | | | | 498,865 | | | | 34,145 | |
Chinese Yuan Renminbi | | Short | | 11/07/07 - 01/10/08 | | | (3,474,134 | ) | | | (3,447,321 | ) | | | (26,813 | ) |
Chinese Yuan Renminbi | | Long | | 11/07/07 - 01/10/08 | | | 3,474,134 | | | | 3,439,377 | | | | 34,757 | |
Euro | | Short | | 11/01/07 - 11/05/07 | | | (11,899,027 | ) | | | (11,721,329 | ) | | | (177,698 | ) |
Euro | | Long | | 11/05/07 | | | 140,520 | | | | 137,336 | | | | 3,184 | |
Indonesian Rupiah | | Long | | 05/27/08 | | | 831,625 | | | | 870,000 | | | | (38,375 | ) |
Indian Rupee | | Long | | 11/29/07 - 08/12/08 | | | 4,312,578 | | | | 4,160,737 | | | | 151,841 | |
Japanese Yen | | Short | | 12/13/07 | | | (250,020 | ) | | | (251,456 | ) | | | 1,436 | |
Malaysian Ringgitt | | Long | | 05/21/08 | | | 3,096,794 | | | | 3,065,000 | | | | 31,794 | |
Mexican Nuevo Peso | | Long | | 03/13/08 - 07/10/08 | | | 7,692,036 | | | | 7,493,915 | | | | 198,121 | |
New Zealand Dollar | | Long | | 11/01/07 - 11/29/07 | | | 916,364 | | | | 912,411 | | | | 3,953 | |
Phillipine Peso | | Long | | 05/19/08 | | | 2,699,091 | | | | 2,585,000 | | | | 114,091 | |
Polish Zloty | | Long | | 03/13/08 - 07/10/08 | | | 6,382,041 | | | | 5,863,339 | | | | 518,702 | |
Pound Sterling | | Short | | 11/01/07 - 12/20/07 | | | (20,481,192 | ) | | | (20,092,363 | ) | | | (388,829 | ) |
Russian Ruble | | Short | | 11/02/07 - 12/07/07 | | | (4,179,523 | ) | | | (4,127,893 | ) | | | (51,630 | ) |
Russian Ruble | | Long | | 11/02/07 - 07/10/08 | | | 16,217,107 | | | | 15,659,081 | | | | 558,026 | |
Singapore Dollar | | Long | | 02/20/08 - 08/22/08 | | | 9,347,284 | | | | 9,003,328 | | | | 343,956 | |
South African Rand | | Long | | 03/13/08 - 07/10/08 | | | 52,995 | | | | 47,336 | | | | 5,659 | |
South Korean Won | | Long | | 01/30/08 - 08/04/08 | | | 6,518,971 | | | | 6,359,750 | | | | 159,221 | |
Swedish Krona | | Long | | 12/06/07 | | | 720,994 | | | | 664,682 | | | | 56,312 | |
| | | | | | | | | | | | | | | | |
Total | | | | | | $ | 80,170,097 | | | $ | 72,134,135 | | | $ | 8,035,962 | |
| | | | | | | | | | | | | | | | |
28
Managers Fremont Bond Fund
Notes to Financial Statements (continued)
| 10. | Risks Associated with Collateralized Mortgage Obligations (“CMOs”) |
The net asset value of the Fund may be sensitive to interest rate fluctuations because the Fund may hold several instruments, including CMOs and other derivatives, whose values can be significantly impacted by interest rate movements. CMOs are obligations collateralized by a portfolio of mortgages or mortgage-related securities. Payments of principal and interest on the mortgage are passed through to the holder of the CMOs on the same schedule as they are received, although certain classes of CMOs have priority over others with respect to the receipt of prepayments on the mortgages.
Therefore, the investment in CMOs may be subject to a greater or lesser risk of prepayment than other types of mortgage-related securities. CMOs may have a fixed or variable rate of interest.
| 11. | Dollar Roll Transactions |
The Fund may enter into dollar rolls in which they sell debt securities for delivery currently and simultaneously contract to repurchase similar, but not identical, securities at the same price or a lower price on an agreed date. The Fund receives compensation as consideration for entering into the commitment to repurchase. The compensation is the difference between the current sale price and the forward price for the future price (often referred to as the “drop”) as well as by the interest earned on the cash proceeds of the initial sale. A Fund may also be compensated by the receipt of a commitment fee. As the holder, the counterparty receives all principal and interest payments, including prepayments, made with respect to the similar security. Dollar rolls may be renewed with a new sale and repurchase price with a cash settlement made at renewal without physical delivery of the securities subject to the contract.
Certain risks may arise upon entering into dollar rolls from the potential inability of counterparties to meet the terms of their commitments. Additionally, the value of such securities may change adversely before the Fund is able to repurchase them. There can be no assurance that the Fund’s use of the cash that it receives from a dollar roll will provide a return that exceeds its costs.
| 12. | New Accounting Pronouncements |
In June 2006, the Financial Accounting Standards Board (“FASB”) issued Interpretation No. 48, “Accounting for Uncertainty in Income Taxes - an Interpretation of FASB Statement No. 109 (the “FIN 48”), which applies to all registered investment companies, clarifies the accounting for uncertain tax positions. FIN 48 is effective for financial statements for fiscal years beginning after December 15, 2006. Management has not yet completed their analysis of the Interpretation, and is not currently in a position to estimate the significance, if any, that the impact of adoption will have on the financial statements.
In addition, in September 2006, Statement of Financial Accounting Standards No. 157, Fair Value Measurements (“SFAS 157”), was issued and is effective for fiscal years beginning after November 15, 2007. SFAS 157 defines fair value, establishes a framework for measuring fair value and expands disclosures about fair value measurements. Management is currently evaluating the impact, if any, the adoption of SFAS 157 will have on the Funds’ financial statements.
Tax Information (unaudited)
The Fund hereby designates the maximum amount allowable of its net taxable income as qualified dividends as provided in the Jobs and Growth Tax Relief Reconciliation Act of 2003. The 2007 Form 1099-DIV you receive for the Fund will show the tax status of all distributions paid to you during the year.
Pursuant to section 852 of the Internal Revenue Code, Managers Fremont Bond designates $0, as long-term capital gains for the taxable year ended October 31, 2007.
29
Report of Independent Registered Public Accounting Firm
To the Board of Trustees of Managers Trust I and the Shareholders of Managers Fremont Bond Fund:
In our opinion, the accompanying statements of assets and liabilities, including the schedule of portfolio investments, and the related statement of operations and of changes in net assets and the financial highlights present fairly, in all material respects, the financial position of Managers Fremont Bond Fund (hereafter referred to as the “Fund”), at October 31, 2007, the results of operations for the year then ended, the changes in net assets for each of two years in the period then ended, and the financial highlights for five years in the period then ended, in conformity with accounting principles generally accepted in the United States of America. These financial statements and financial highlights (hereafter referred to as “financial statements”) are the responsibility of the Fund’s management; our responsibility is to express an opinion on these financial statements based on our audits. We conducted our audits of these financial statements in accordance with the standards of the Public Company Accounting Oversight Board (United States). Those standards require that we plan and perform the audit to obtain reasonable assurance about whether the financial statements are free of material misstatement. An audit includes examining, on a test basis, evidence supporting the amounts and disclosures in the financial statements, assessing the accounting principles used and significant estimates made by management, and evaluating the overall financial statement presentation. We believe that our audits, which included confirmation of securities at October 31, 2007 by correspondence with the custodian and brokers, provide a reasonable basis for our opinion.
PricewaterhouseCoopers, LLP
Philadelphia, Pennsylvania
December 21, 2007
30
Trustees and Officers
The Trustees and Officers of the Trust, their business addresses, principal occupations for the past five years and dates of birth are listed below. The Trustees provide broad supervision over the affairs of the Trust and the Funds. The Trustees are experienced executives who meet periodically throughout the year to oversee the Funds’ activities, review contractual arrangements with companies that provide services to the Funds, and review the Funds’ performance. Unless otherwise noted, the address of each Trustee or Officer is the address of the Trust: 800 Connecticut Avenue, Norwalk, Connecticut 06854.
There is no stated term of office for Trustees. Trustees serve until their resignation, retirement or removal in accordance with the Trust’s organizational documents and policies adopted by the Board from time to time. The Chairman of the Trustees, President, Treasurer and Secretary of the Trust are elected by the Trustees annually. Other officers hold office at the pleasure of the Trustees.
Independent Trustees
The following Trustees are not “interested persons” of the Trust within the meaning of the 1940 Act:
| | |
Name, Date of Birth, Number of Funds Overseen in Fund Complex* | | Principal Occupation(s) During Past 5 Years and Other Directorships Held by Trustee |
Jack W. Aber, 9/9/37 • Trustee since 2000 • Oversees 31 Funds in Fund Complex | | Professor of Finance, Boston University School of Management (1972-Present); Trustee of Appleton Growth Fund (1 portfolio); Trustee of Third Avenue Trust (4 portfolios); Trustee of Third Avenue Variable Trust (1 portfolio). |
| |
William E. Chapman, II, 9/23/41 • Independent Chairman • Trustee since 2000 • Oversees 31 Funds in Fund Complex | | President and Owner, Longboat Retirement Planning Solutions (1998-Present); Hewitt Associates, LLC (part time) (provider of Retirement and Investment Education Seminars); Trustee of Bowdoin College (2002-Present); Trustee of Third Avenue Trust (4 portfolios); Trustee of Third Avenue Variable Trust (1 portfolio). |
| |
Edward J. Kaier, 9/23/45 • Trustee since 2000 • Oversees 31 Funds in Fund Complex | | Attorney at Law and Partner, Teeters Harvey Kilboy & Kaier LLP (2007-Present); Attorney at Law and Partner, Hepburn Willcox Hamilton & Putnam, LLP (1977-2007); Trustee of Third Avenue Trust (4 portfolios); Trustee of Third Avenue Variable Trust (1 portfolio). |
| |
Steven J. Paggioli, 4/3/50 • Trustee since 2000 • Oversees 31 Funds in Fund Complex | | Consultant (2001-Present); Formerly Executive Vice President and Director, The Wadsworth Group (1986-2001); Executive Vice President, Secretary and Director, Investment Company Administration, LLC (1990-2001); Vice President, Secretary and Director, First Fund Distributors, Inc. (1991-2001); Trustee, Professionally Managed Portfolios (22 portfolios); Advisory Board Member, Sustainable Growth Advisors, LP. |
| |
Eric Rakowski, 6/5/58 • Trustee since 2000 • Oversees 31 Funds in Fund Complex | | Professor, University of California at Berkeley School of Law (1990-Present); Trustee of Third Avenue Trust (4 portfolios); Trustee of Third Avenue Variable Trust (1 portfolio). |
| |
Thomas R. Schneeweis, 5/10/47 • Trustee since 2000 • Oversees 31 Funds in Fund Complex | | Professor of Finance, University of Massachusetts (1977-Present); Director, CISDM at the University of Massachusetts, (1996-Present); President, Alternative Investment Analytics, LLC, (formerly Schneeweis Partners, LLC) (2001-Present); Partner, White Bear Partners, LLC (2007-Present); Partner, Schneeweis Capital Management, LLC (2007-Present); Partner, Schneeweis Associates, LLC (2007-Present); Partner, Northampton Capital Management, LLC (2004-Present); Partner, TRS Associates (2007-Present). |
| * | The Fund Complex consists of Managers AMG Funds, The Managers Funds, Managers Trust I and Managers Trust II. |
Interested Trustee
The following Trustee is an “interested person” of the Trust within the meaning of the 1940 Act by virtue of his positions with, and interest in securities of, Affiliated Managers Group, Inc.
| | |
Name, Date of Birth, Number of Funds Overseen in Fund Complex* | | Principal Occupation(s) During Past 5 Years and Other Directorships Held by Trustee |
William J. Nutt, 3/30/45 • Trustee since 2005 • President since 2007 • Oversees 31 Funds in Fund Complex | | Chairman and Founder of Affiliated Managers Group, Inc., (1993-Present); Chief Executive Officer of Affiliated Managers Group, Inc. (1993-2004); Director, Affiliated Managers Group, Inc. (1993-Present); President of Affiliated Managers Group, Inc. (1993-1999); President and Chief Operating Officer, The Boston Company (1989-1993); Senior Executive Vice President, The Boston Company (1982-1989). |
| |
| Officers | | |
| |
Name, Date of Birth, Position(s) Held with Fund and Length of Time Served | | Principal Occupation(s) During Past 5 Years |
Christine C. Carsman, 4/2/52 • Secretary since 2004 | | Senior Vice President and Chief Regulatory Counsel, Affiliated Managers Group, Inc. (2004-Present); Secretary, The Managers Funds, Managers AMG Funds and Managers Trust II (2004-Present); Senior Counsel, Vice President and Director of Operational Risk Management and Compliance, Wellington Management Company, LLP (1995-2004); Deputy General Counsel, The Boston Company, Inc. (1993-1995); Associate General Counsel, The Boston Company Advisors, Inc. (1991-1993); Associate, Sullivan & Worcester LLP (1987-1991). |
| |
Donald S. Rumery, 5/29/58 • Chief Financial Officer since 2007 • Treasurer since 2000 | | Senior Vice President, Managers Investment Group LLC (2005-Present); Director, Finance and Planning, The Managers Funds LLC, (1994-2004); Treasurer and Chief Financial Officer, Managers Distributors, Inc. (2000-Present); Treasurer, The Managers Funds (1995-Present); Treasurer, Managers AMG Funds (1999-Present); Treasurer, Managers Trust II (2000-Present); Secretary, Managers Trust I and Managers Trust II (2000-2004) and Secretary, The Managers Funds (1997-2004); Chief Financial Officer, The Managers Funds, Managers Trust II and Managers AMG Funds (2007-Present). |
| |
Keitha L. Kinne, 5/16/58 • Chief Operating Officer since 2007 | | Managing Partner and Chief Operating Officer, Managers Investment Group LLC (2007-Present); Chief Operating Officer, The Managers Funds, Managers AMG Funds and Managers Trust II (2007-Present); Managing Director, Legg Mason & Co., LLC (2006-2007); Managing Director, Citigroup Asset Management (2004-2006); Senior Vice President, Prudential Investments (1999-2004). |
31
Annual Renewal of Investment Advisory Agreements
On June 8, 2007, the Board of Trustees, including a majority of the Trustees who are not “interested persons” of the Trust (the “Independent Trustees”), approved the Investment Management Agreement with the Investment Manager for the Fremont Bond Fund (the “Fund”) and the Subadvisory Agreement for the Subadvisor. The Independent Trustees were separately represented by independent counsel in connection with their consideration of the approval of these agreements. In considering the Investment Management and Subadvisory Agreements, the Trustees reviewed a variety of materials relating to the Fund, the Investment Manager and the Subadvisor, including comparative performance, fee and expense information for an appropriate peer group of similar mutual funds (the “Peer Group”), performance information for the relevant benchmark index (the “Fund Benchmark”) and other information regarding the nature, extent and quality of services provided by the Investment Manager and the Subadvisor under their respective agreements. The Trustees also took into account performance, fee and expense information regarding the Fund provided to them on a quarterly basis throughout the year. Prior to voting, the Independent Trustees: (a) reviewed the foregoing information with their independent legal counsel and with management; (b) received materials from their independent legal counsel discussing the legal standards applicable to their consideration of the Investment Management Agreement and the Subadvisory Agreement; and (c) met with their independent legal counsel in private sessions at which no representatives of management were present.
Nature, extent and quality of services. In considering the nature, extent and quality of the services provided by the Investment Manager, the Trustees reviewed information relating to the Investment Manager’s operations and personnel. Among other things, the Investment Manager provided financial information, biographical information on its supervisory and professional staff and descriptions of its organizational and management structure. The Trustees also took into account information provided periodically throughout the previous year by the Investment Manager relating to the performance of its duties with respect to the Fund and the Trustees’ familiarity with the Investment Manager’s management through Board meetings, discussions and reports. In the course of their deliberations regarding the Investment Management Agreement, the Trustees evaluated, among other things: (a) the quality of the search, selection and monitoring services performed by the Investment Manager in overseeing the portfolio management responsibilities of the Subadvisor; (b) the Investment Manager’s ability to supervise the Fund’s other service providers; and (c) the Investment Manager’s compliance programs. The Trustees also took into account the financial condition of the Investment Manager with respect to its ability to provide the services required under the Investment Management Agreement and to maintain contractual expense limitations for the Fund.
The Trustees also reviewed information relating to the Subadvisor’s operations and personnel and the investment philosophy, strategies and techniques (the “Investment Strategy”) used in managing the Fund. Among other things, the Trustees reviewed biographical information on portfolio management and other professional staff, information regarding the Subadvisor’s organizational and management structure and the Subadvisor’s brokerage policies and practices. The Trustees considered specific information provided regarding the experience of the individual or individuals at the Subadvisor with portfolio management responsibility for the Fund, including the information set forth in the Fund’s prospectus and statement of additional information. In the course of their deliberations, the Trustees evaluated, among other things: (a) the services rendered by the Subadvisor in the past; (b) the qualifications and experience of the Subadvisor’s personnel; and (c) the Subadvisor’s compliance programs. The Trustees also took into account the financial condition of the Subadvisor with respect to its ability to provide the services required under the Subadvisory Agreement.
Performance. Among other information relating to the Fund’s performance, the Trustees noted that the Fund’s performance for the 1-year, 3-year, 5-year and 10-year periods ended March 31, 2007 was below, above, above and above, respectively, the median performance of the Peer Group and the performance of the Fund Benchmark, which is the Lehman Brothers Aggregate Bond Index. The Trustees concluded that the Fund’s performance has been satisfactory.
As noted above, the Board considered the Fund’s performance during relevant time periods as compared to the Fund’s Peer Group and noted that the Board reviews on a quarterly basis detailed information about the Fund’s performance results, portfolio composition and Investment Strategies. The Board noted the Investment Manager’s expertise and resources in monitoring the performance, investment style and risk adjusted performance of the Subadvisor.
Advisory Fees and Profitability. In considering the reasonableness of the advisory fee charged by the Investment Manager for managing the Fund, the Trustees noted that the Investment Manager, and not the Fund, is responsible for paying the fees charged by the Fund’s Subadvisor and, therefore, that the fees paid to the Investment Manager cover the cost of providing portfolio management services as well as the cost of providing search, selection and monitoring services in operating a “manager-of-managers” complex of mutual funds. The Trustees concluded that, in light of the additional high quality supervisory services provided by the Investment Manager and the fact that the subadvisory fees are paid out of the advisory fee, the advisory fee payable by the Fund to the Investment Manager can reasonably be expected to exceed the median advisory fee for the Peer Group, which consists mostly of funds that do not operate with a manager-of-managers structure.
In considering the reasonableness of the advisory fee payable to the Investment Manager, the Trustees also reviewed information provided by the Investment Manager setting forth all revenues and other benefits, both direct and indirect, received by the Investment Manager and its affiliates attributable to managing the Fund and all the mutual funds in the Managers Family of Funds, the cost of providing such services and the resulting profitability to the Investment Manager and its affiliates from these relationships. The Trustees also noted the current and potential asset levels of the Fund and the willingness of the Investment Manager to waive fees and pay expenses for the Fund from time to time as a means of limiting the total expenses of the Fund. In this regard, the Trustees noted that, unlike a mutual fund that is managed by a single investment adviser, the Fund operates in a manager-of-managers structure and, as the Fund grows in size, it is common practice for the Investment Manager to recommend the selection of an additional Subadvisor to manage a portion of the Fund’s portfolio. The Trustees also noted that the subadvisory fees are paid by the Investment Manager out
32
Annual Renewal of Investment Advisory Agreements (continued)
of its advisory fee. The Trustees further noted that, because of this practice, the Investment Manager’s oversight and supervisory responsibilities with respect to the Fund can be expected to increase with the size of the Fund. Based on the foregoing, the Trustees concluded that the profitability to the Investment Manager is reasonable and that the Investment Manager is not realizing material benefits from economies of scale that would warrant adjustments to the advisory fees for the Fund at this time. With respect to economies of scale, the Trustees also noted that as the Fund’s assets increase over time, the Fund may realize other economies of scale to the extent that the increase in assets is proportionally greater than the increase in certain other expenses.
The Trustees noted that the Fund’s advisory fee and total expenses (net of applicable expense waivers/reimbursements) as of October 31, 2006 were higher and lower, respectively, than the average for the Peer Group. The Trustees took into account the fact that the Investment Manager has contractually agreed through March 1, 2008 to limit the Fund’s net annual operating expenses to 0.60%. The Trustees concluded that, in light of the nature, extent and quality of the services provided by the Investment Manager and the Subadvisor, the Fund’s performance, the foregoing expense limitation and the considerations noted above with respect to the Subadvisor and the Investment Manager, the Fund’s advisory fees are reasonable.
Subadvisory Fees and Profitability. In considering the reasonableness of the fee payable by the Investment Manager to the Subadvisor, the Trustees relied on the ability of the Investment Manager to negotiate the terms of the Subadvisory Agreement at arm’s length as part of the manager-of-managers structure, noting that the Subadvisor is not affiliated with the Investment Manager. In addition, the Trustees noted that the subadvisory fees are paid by the Investment Manager out of its advisory fee. Accordingly, the cost of services to be provided by the Subadvisor and the profitability to the Subadvisor of its relationship with the Fund were not material factors in the Trustees’ deliberations. For similar reasons, and based on the current size of the portion of the Fund managed by the Subadvisor, the Trustees concluded that any economies of scale being realized by the Subadvisor was not a material factor in the Trustees’ deliberations at this time.
* * * *
After consideration of the foregoing, the Trustees also reached the following conclusions regarding the Investment Management Agreement and the Subadvisory Agreement, in addition to those conclusions discussed above: (a) the Investment Manager and the Subadvisor have demonstrated that they possess the capability and resources to perform the duties required of them under the Investment Management Agreement and the Subadvisory Agreement; (b) the Subadvisor’s Investment Strategy is appropriate for pursuing the Fund’s investment objectives; (c) the Subadvisor is reasonably likely to execute its Investment Strategy consistently over time; and (d) the Investment Manager and the Subadvisor maintain appropriate compliance programs.
Based on all of the above-mentioned factors and related conclusions, with no single factor or conclusion being determinative and with each Trustee not necessarily attributing the same weight to each factor, the Trustees concluded that approval of the Investment Management Agreement and the Subadvisory Agreement would be in the interests of the Fund and its shareholders. Accordingly, on June 8, 2007, the Trustees, including a majority of the Independent Trustees, voted to approve the Investment Management Agreement and the Subadvisory Agreement for the Fund’s Subadvisor.
33
THIS PAGE INTENTIONALLY LEFT BLANK
THIS PAGE INTENTIONALLY LEFT BLANK
Investment Manager and Administrator
Managers Investment Group LLC
800 Connecticut Avenue
Norwalk, Connecticut 06854
(203) 299-3500 or (800) 835-3879
Distributor
Managers Distributors, Inc.
800 Connecticut Avenue
Norwalk, Connecticut 06854
(203) 299-3500 or (800) 835-3879
Custodian
The Bank of New York Mellon
2 Hanson Place
Brooklyn, New York 11217
Legal Counsel
Ropes & Gray LLP
One International Place
Boston, Massachusetts 02110-2624
Transfer Agent
PFPC, Inc.
Attn: Managers
P.O. Box 9769
Providence, Rhode Island 02940
(800) 548-4539
For Managers Choice Only
Managers
c/o PFPC, Inc.
P.O. Box 61204
King of Prussia, Pennsylvania 19406-0851
(800) 358-7668
MANAGERSAND MANAGERS AMG EQUITY FUNDS
EMERGING MARKETS EQUITY
Rexiter Capital Management Limited
ESSEX GROWTH
ESSEX LARGE CAP GROWTH
ESSEX SMALL/MICRO CAP GROWTH
Essex Investment Management Co., LLC
FQ TAX-MANAGED U.S. EQUITY
FQ U.S. EQUITY
First Quadrant, L.P.
INSTITUTIONAL MICRO-CAP
MICRO-CAP
Lord, Abbett & Co. LLC
WEDGE Capital Management L.L.P.
OFI Institutional Asset Management
Next Century Growth Investors, LLC
INTERNATIONAL EQUITY
Alliance Bernstein L.P.
Lazard Asset Management, LLC
Wellington Management Company, LLP
CHICAGO EQUITY PARTNERS
MID-CAP
Chicago Equity Partners, LLC
REAL ESTATE SECURITIES
Urdang Securities Management, Inc.
SMALL CAP
TIMESSQUARE MID CAP GROWTH
TIMESSQUARE SMALL CAP GROWTH
TimesSquare Capital Management, LLC
SMALL COMPANY
Epoch Investment Partners, Inc.
Kalmar Investment Advisers, Inc.
SPECIAL EQUITY
Donald Smith & Co., Inc.
Lord, Abbett & Co. LLC
Skyline Asset Management, L.P.
Smith Asset Management Group, LP
Veredus Asset Management LLC
Westport Asset Management, Inc.
SYSTEMATIC VALUE
SYSTEMATIC MID CAP VALUE
Systematic Financial Management, L.P.
VALUE
Armstrong Shaw Associates Inc.
Osprey Partners Investment Mgmt., LLC
MANAGERSAND MANAGERS AMG BALANCED FUNDS
CHICAGO EQUITY PARTNERS BALANCED
Chicago Equity Partners, LLC
GLOBAL
Armstrong Shaw Associates Inc.
Alliance Bernstein L.P.
First Quadrant, L.P.
Northstar Capital Management, Inc.
Wellington Management Company, LLP
ALTERNATIVE FUNDS
FQ Global Alternatives
First Quadrant, L.P.
MANAGERS FIXED INCOME FUNDS
BOND (MANAGERS)
FIXED INCOME GLOBAL BOND
Loomis, Sayles & Company L.P.
BOND (MANAGERS FREMONT)
Pacific Investment Management Co. LLC
CALIFORNIA INTERMEDIATE TAX-FREE
Evergreen Investment Management Co., LLC
HIGH YIELD
J.P. Morgan Investment Management Inc.
INTERMEDIATE DURATION GOVERNMENT
SHORT DURATION GOVERNMENT
Smith Breeden Associates, Inc.
MONEY MARKET
JPMorgan Investment Advisors Inc.
This report is prepared for the Fund’s shareholders. It is authorized for distribution to prospective investors only when preceded or accompanied by an effective prospectus. To receive a free copy of the prospectus or Statement of Additional Information, which includes additional information about Fund Trustees, please contact us by calling 800.835.3879. Distributed by Managers Distributors, Inc., member FINRA.
A description of the policies and procedures each Fund uses to vote its proxies is available: (i) without charge, upon request, by calling 800.835.3879, or (ii) on the Securities and Exchange Commission’s (SEC) Web site at www.sec.gov. For information regarding each Fund’s proxy voting record for the 12-month period ended June 30, call 800.835.3879 or visit the SEC Web site at www.sec.gov.
The Fund files its complete schedule of portfolio holdings with the SEC for the first and third quarters of each fiscal year on Form N-Q. The Fund’s Forms N-Q are available on the SEC’s website at www.sec.gov. A Fund’s Forms N-Q may be reviewed and copied at the SEC’s Public Reference Room in Washington, DC. Information on the operation of the Public Reference Room may be obtained by calling 1-800-SEC-0330. To review a complete list of the Fund’s portfolio holdings, or to view the most recent quarterly holdings report, semiannual report, or annual report, please visit www.managersinvest.com.
www.managersinvest.com
ANNUAL REPORT
Managers Funds
October 31, 2007
Managers Fremont Micro-Cap Fund
Managers Fremont Institutional Micro-Cap Fund
Managers Fremont Funds
Annual Report—October 31, 2007
TABLE OF CONTENTS
| | |
| | | Page |
LETTER TO SHAREHOLDERS | | 1 |
| |
ABOUT YOUR FUND’S EXPENSES | | 3 |
| |
| INVESTMENT MANAGER’S COMMENTS, FUND SNAPSHOTS, AND SCHEDULES OF PORTFOLIO INVESTMENTS | | |
| |
Fremont Micro-Cap Fund | | 5 |
| |
Fremont Institutional Micro-Cap Fund | | 10 |
| |
NOTES TO SCHEDULES OF PORTFOLIO INVESTMENTS | | 16 |
| |
FINANCIAL STATEMENTS | | |
| |
Statements of Assets and Liabilities | | 17 |
Funds’ balance sheets, net asset value (NAV) per share computation and cumulative undistributed amounts | | |
| |
Statements of Operations | | 18 |
Detail of sources of income, Fund expenses, and realized and unrealized gains (losses) during the fiscal year | | |
| |
Statements of Changes in Net Assets | | 19 |
Detail of changes in Fund assets for the past two fiscal years | | |
| |
FINANCIAL HIGHLIGHTS | | 20 |
Historical net asset values per share, distributions, total returns, expense ratios, turnover ratios and net assets | | |
| |
NOTES TO FINANCIAL STATEMENTS | | 21 |
Accounting and distribution policies, details of agreements and transactions with Fund management and affiliates, and descriptions of certain investment risks | | |
| |
REPORT OF INDEPENDENT REGISTERED PUBLIC ACCOUNTING FIRM | | 26 |
| |
TRUSTEES AND OFFICERS | | 27 |
| |
ANNUAL RENEWAL OF INVESTMENT ADVISORY AGREEMENTS | | 28 |
Nothing contained herein is to be considered an offer, sale or solicitation of an offer to buy shares of The Managers Funds or Managers AMG Funds. Such offering is made only by Prospectus, which includes details as to offering price and other material information.
Letter to Shareholders
Dear Fellow Shareholder:
Financial markets have been increasingly unsettled this past year, particularly during the summer months and currently as we write this report. While the economy has continued to grow, a liquidity crisis initiated by spreading weakness in subprime mortgage loans increased uncertainty about its sustainability. Bonds of all credit quality became unusually volatile, and credit spreads, having been extremely slim, widened dramatically, raising the cost of capital for many borrowers. Naturally the equity markets followed suit and became more volatile as the rising cost of capital pressured corporate profitability, penalized leverage, and hindered merger and acquisition activity.
As has been well documented in the financial press, the continued weakness in residential housing prices, combined with gradually rising interest rates, has put severe stress on low credit-quality (subprime) borrowers. Rising defaults pushed several mortgage lenders and leveraged subprime mortgage investors toward bankruptcy and catalyzed a swift and broad flight from various forms of investment risk over the past few months. These revelations began creating serious liquidity problems in the credit markets late in the second quarter and have been the root of uncertainty and market volatility ever since.
A rapid and at times indiscriminate flight from risk created unusual patterns of volatility within the bond market. Credit spreads widened significantly throughout July, as Moody’s and S&P downgraded hundreds of securities, and price moves forced leveraged investors to raise cash any way they could. Since much of the leverage had been funded with short-term debt, the short end of the yield curve bore the brunt of the liquidity crisis. The typically docile commercial paper market seized as demand dried up, and short-term Treasury yields vacillated between 2.9% and 4.9% as investors raced to safety, causing a dislocation in prices. Since then, prices for credits have generally recovered, as the Federal Reserve pumped liquidity into the system and investors have had time to evaluate underlying fundamentals and adjust their portfolios in a more rational manner.
After rallying strongly off of a February trough, the stock market followed the lead of the credit markets by trading sharply down during the liquidity crisis in July, then recovering from late August through October. Here, too, there were interesting anomalies in the indiscriminate flight from risk. Not surprisingly, small- and mid-cap stocks reacted more during the price declines, and underperformed large-cap stocks during the period. Interestingly however, growth indices, which would normally react poorly to a rise in interest rates or a liquidity squeeze, significantly outperformed value indices during the period. We believe there were two primary reasons for this. One, since value indices had outperformed growth indices for an extended period of time, a typical “reversion to the mean” took place. Two, the quick reduction of leverage from the markets in general forced many quantitatively based hedge fund managers to reverse their trades in a very quick fashion. As it turned out, many of these investors used similar value-biased models to guide their purchase and sale decisions. The result was that the same stocks were being sold off not for investment reasons, but because of liquidity needs. Stocks recovered in late August and throughout October, as a result of an infusion of liquidity by the Federal Reserve, increasing visibility about where the risks were residing, and a much anticipated reduction of the Fed Funds Rate in mid-September.
Within this environment, the Managers Fremont Micro-Cap Funds provided strong gains, exceeded the return of their primary benchmark, and performed well relative to their peer group during the 12-months ended October 31, 2007 (the Funds’ fiscal year). The portfolio manager’s emphasis on innovation, which has typically led it to significant allocations in technology and healthcare companies, along with a general avoidance of financial companies was beneficial throughout the year. A more detailed review of the performance and positioning of the Fund is included within this report.
Lingering credit problems and further revelations of losses from large financial institutions are hindering not only the financial markets, but the economy as well. In our opinion, it appears this will continue for some time, pushing the economy closer to the tipping point of recession. Uncertainty about whether will tip has driven volatility higher, as the financial markets have traded sharply higher or lower depending upon the news each day. The Federal Reserve has been accommodating, and although we think the risk of recession has increased, we still believe that portions of the U.S. and global economies remain healthy. In sum, we continue to believe that investors should maintain their portfolios with allocations near their long-run targets, rebalance if necessary and take full advantage of opportunities to participate in the growth of the global economy.
One of our foremost goals at Managers Investment Group is to structure and manage mutual funds that will help our shareholders and clients become more successful in reaching their investment goals and objectives. Each of our Funds is geared to provide you with exposure to a specific asset class, combination of
1
Letter to Shareholders (continued)
asset classes, or segment of the market. Investors tend to use our Funds as part of their overall asset allocation in order to structure a well-diversified portfolio intended to meet individual needs. Most of our Funds, like the Managers Fremont Micro-Cap Funds, are therefore designed to be building blocks.
The following report covers the one-year period ending October 31, 2007. Should you have any questions about this report, or if you’d like to receive a Prospectus and additional information, including fees and expenses, for this or any of the other Funds in our family, please feel free to contact us at 1-800-835-3879, or visit our website at www.managersinvest.com. As always, please read the Prospectus carefully before you invest or send money.
If you are curious about how you can better diversify your investment program, visit the Knowledge Center on our Web site and view our articles in the investment strategies section. You can rest assured that under all market conditions our team is focused on delivering excellent investment management services for your benefit.
We thank you for your continued confidence and investment in The Managers Funds.
Sincerely,
| | | | |
| | |
| | | | |
| John H. Streur | | | | Thomas G. Hoffman, CFA |
| Senior Managing Partner | | | | Executive Vice President |
| Managers Investment Group LLC | | | | Chief Investment Officer |
| | | | Managers Investment Group LLC |
2
About Your Fund’s Expenses
As a shareholder of a Fund, you may incur two types of costs: (1) transaction costs, which may include sales charges (loads) on purchase payments; redemption fees; and exchange fees; and (2) ongoing costs, including management fees; distribution (12b-1) fees; and other Fund expenses. These Funds incur only ongoing costs. This example is intended to help you understand your ongoing costs (in dollars) of investing in the Fund and to compare these costs with the ongoing costs of investing in other mutual funds. The example is based on an investment of $1,000 invested at the beginning of the period and held for the entire period as indicated below.
Actual Expenses
The first line of the table below provides information about the actual account values and actual expenses. You may use the information in this line, together with the amount you invested, to estimate the expenses that you paid over the period. Simply divide your account value by $1,000 (for example, an $8,600 account value divided by $1,000 = 8.6), then multiply the result by the number in the first line under the heading entitled “Expenses Paid During Period” to estimate the expenses you paid on your account during this period.
Hypothetical Example for Comparison Purposes
The second line of the table below provides information about hypothetical account values and hypothetical expenses based on the Fund’s actual expense ratio and an assumed annual rate of return of 5% before expenses, which is not the Fund’s actual return. The hypothetical account values and expenses may not be used to estimate the actual ending account balance or expenses you paid for the period. You may use this information to compare the ongoing costs of investing in the Fund and other funds by comparing this 5% hypothetical example with the 5% hypothetical examples that appear in the shareholder reports of other funds.
Please note that the expenses shown in the table are meant to highlight your on-going costs only and do not reflect any transactional costs, such as sales charges (loads), redemption fees, or exchange fees. Therefore, the second line of the table is useful in comparing ongoing costs only, and will not help you determine the relative total costs of owning different funds.
| | | | | | | | | | | | |
Six Months Ended October 31, 2007 | | Expense
Ratio for
the period | | | Beginning
Account Value
5/1/2007 | | Ending
Account Value
10/31/2007 | | Expenses
Paid During
Period* |
Managers Fremont Micro-Cap Fund | | | | | | | | | | | | |
Based on Actual Fund Return | | 1.49 | % | | $ | 1,000 | | $ | 1,114 | | $ | 7.94 |
Based on Hypothetical 5% Annual Return | | 1.49 | % | | $ | 1,000 | | $ | 1,018 | | $ | 7.58 |
Managers Fremont Institutional Micro-Cap Fund | | | | | | | | | | | | |
Based on Actual Fund Return | | 1.35 | % | | $ | 1,000 | | $ | 1,113 | | $ | 7.19 |
Based on Hypothetical 5% Annual Return | | 1.35 | % | | $ | 1,000 | | $ | 1,018 | | $ | 6.87 |
| * | Expenses are equal to the Fund’s annualized expense ratio multiplied by the average account value over the period, multiplied by the number of days in the most recent fiscal half-year (184), then divided by 365. |
3
Managers Fremont Micro-Cap Fund
Portfolio Manager’s Comments
The Managers Fremont Micro-Cap Fund primarily invests in the stocks of U.S. micro-capitalization companies. These companies have market capitalizations that, at the time of initial purchase, place them among the smallest 5% of companies listed on U.S. stock markets. Normally, the Fund will invest at least 80% of its assets in U.S. micro-cap stocks. The Russell 2000® Growth Index is the benchmark for the Fund. While Kern Capital Management LLC was the sole subadvisor of the Fund throughout the fiscal year ended October 31, 2007, please read below for changes to the structure of the Fund that have been implemented since the fiscal year-end.
The Portfolio Manager
Kern Capital Management LLC
Kern Capital Management LLC (“KCM”), subadvisor for the Fremont Micro-Cap Fund was founded in 1997 by Robert (Bob) E. Kern, Jr. and David G. Kern. KCM is an employee owned investment advisory firm dedicated to researching and investing in innovative micro-cap and small-cap growth companies.
KCM believes the U.S. smaller company stock universe provides the opportunity to invest in innovative companies with exceptional growth prospects. With minimal research coverage by brokerage firms and low institutional ownership, KCM believes small and micro-cap stocks represent the least efficient sector of the market and its investment process is designed to capitalize on this inefficiency.
KCM’s fundamental research is dedicated to uncovering innovative small companies early in their growth cycle while they are still relatively undiscovered. With a huge universe of investment opportunity, KCM’s investment process focuses on the most innovative sectors in the U.S. economy (technology, healthcare, services and consumer sectors). Research specialization by economic sector provides the depth of knowledge necessary to make high quality investment decisions and minimize fundamental investment mistakes.
KCM builds portfolios one company at a time with investment research focused on the most innovative sectors of the economy (technology, health care, services and consumer). The team’s hands-on approach to fundamental investment research and financial analysis seeks to answer three basic questions to determine an investment’s attractiveness.
| | • | | How attractive is the business? Companies that are pioneering new markets or revolutionizing existing ones can often sustain rapid growth as they establish leading positions in their targeted markets. |
| | • | | How strong is the management? Successful companies require management capable of capitalizing on attractive growth opportunities. Management’s vision and ability to execute the business plan represent key elements in determining how successful a company will be. |
| | • | | How much is the company worth? The team’s process is valuation sensitive. Depending on the economic sector, different criteria are used to determine a company’s enterprise value, which determines if KCM would buy the entire company at the current market value of its equity. |
Given that KCM is focused on investing in innovative growth companies, the first two questions are answered before determining if the valuation is attractive. In fact, the answers to the first two questions will help determine the appropriate valuation for the company.
The ideal company exhibits many of the following traits:
| | • | | Leading market position in a rapidly growing market with high barriers to entry |
| | • | | Entrepreneurial management team with experience managing a growth business |
| | • | | Focused business plan with tight internal controls |
Portfolio management:
| | • | | Invests in between 70 and 90 companies which have market capitalizations that, at the time of initial purchase, place them among the smallest 5% of companies listed in the U.S. stock markets |
| | • | | Builds portfolios from the bottom up and seeks to identify companies early in their growth cycle |
| | • | | Utilizes a team approach to cover approximately 600 stocks through an extensive network of contact and other information sources: |
| | • | | Brokerage firm and industry analysts |
| | • | | Corporate management contacts |
| | • | | Trade shows and trade journals |
| | • | | Focuses on business sectors where KCM believes the level of innovation is greatest, such as technology, health care, services and consumer |
| | • | | Uses fundamental analysis to identify small, relatively unknown companies that exhibit the potential to become much larger and more successful |
| | • | | Meets with corporate management to discuss business plans and strategies |
The investment team will make a sell decision when:
| | • | | An investment’s growth prospects deteriorate |
| | • | | Investments achieve excessive valuation relative to the growth opportunities and/or addressable markets. |
| | • | | There is a negative change in fundamental confidence and/or investment time horizon |
The Year in Review
In the face of a severe reversal in U.S. residential real estate, rising concerns about the strength of the U.S. economy and a sharp draw-down of liquidity in the credit markets, stocks produced healthy returns for fiscal 2007. At first glance this might suggest a continuance of market preferences; however there were significant shifts in the U.S. equity market during the past fiscal year. Specifically, for the first time since fiscal 2000, growth biased indices outperformed their value biased counterparts (Russell 3000® Growth Index +19.0%; Russell 3000® Value Index +10.1%) as more innovative sectors started to represent a greater percentage of market returns. Similarly, the market favored larger capitalization firms as the
4
Managers Fremont Micro-Cap Fund
Portfolio Manager’s Comments (continued)
Russell 1000® Index (+15.0%) beat the Russell 2000® Index (+9.3%) for the first time since fiscal year 1999. The market cap shift is probably a result of investor uncertainty about future economic growth, concerns about how riskier assets will perform going forward, and the perception that small cap stocks are inherently riskier.
The small cap universe and Managers Fremont Micro-Cap Fund were not immune to the aforementioned market shifts. Fiscal 2007, saw the largest market cap constituents of the Russell 2000® Index outperform their smaller brethren and the Russell 2000® Growth greatly outpace the Russell 2000® Value, as the more innovative sectors started to represent a greater percentage of returns. During the twelvemonth period ending 10/31/2007, the Managers Fremont Micro-Cap Fund increased 21.6%, solidly outpacing its primary benchmark, the Russell 2000® Growth Index, which returned 16.7%. Fund performance was driven by an overweight to technology, an avoidance of the worst sectors within the Index, strong stock selection, and a continued focus on the most attractive growth opportunities.
Kern Capital Management invests in small-cap and micro-cap growth companies and focuses its fundamental approach to investment research on the most innovative sectors in the U.S. economy. As a result, information technology securities represent a drastic overweight and were nearly 60% of the Fund’s assets through most of fiscal 2007. The Fund’s tech overweight was a result of Fund Management’s investment approach, not a top-down decision. Nevertheless, this overweight was additive since this sector appreciated the most of those representing a meaningful weight in the Index (>10%) and only trailed the performance of the Index’s less significant allocations to utilities and materials. Overall, stock selection in tech slightly offset the sector overweight, but ten different holdings appreciated more than 60% and the sector contributed nearly 65% of the Fund’s absolute return. Also, six of the Fund’s top ten absolute contributors were from this economic sector, while appreciating, on average, over 100% each.
Consistent with KCM’s focus on the most innovative sectors is a relatively low allocation to the consumer discretionary and financials sectors. The past fiscal year was no exception, as the Fund held very few positions in the financials sector and exhibited a 10% underweight to consumer discretionary. KCM’s underweights were advantageous as these two sectors were the worst performing sectors in the Index during the trailing twelve-months. Consumer discretionary struggled as investors continue to be skittish about the negative impact the housing market might have on consumer spending. Similarly, financials were hurt by further issues in the credit markets and lasting worries about additional sub prime fall-out.
Different market cycles may help or hinder portfolio performance, as economic sectors go in and out of favor. However, as KCM’s investment process indirectly drives sector weights, its bottom-up approach will always make stock selection a key determinant of relative performance. This was the case in fiscal 2007, as strong stock selection was most beneficial in health care, where the Fund’s positions greatly outpaced the Index. Seven Fund positions in this sector appreciated more than 60% during the trailing twelve-month period and contributed 16% of absolute performance. Positive stock selection was also evident in the materials and industrials sectors as both Fund sectors outperformed their Index counterparts. Neither sector is known for offering a wealth of innovative investment options, but the performance of several individual securities confirms that there are a few opportunities.
Lastly, the Fund’s strong performance during fiscal 2007 is particularly gratifying, since the small cap growth universe favored the larger firms. This is illustrated by the meaningful difference in performance of the Russell 2000® Growth constituents below $500 million and those above $500 million (>$500M +20.3%; <$500M +12.9%). As of fiscal year-end, more than 55% of the Fund was invested in companies with market caps below $500 million and the performance differential was a hindrance.
Over the longer term the Fund has achieved high absolute rates of return and significantly outperformed the Russell 2000® Growth Index. For the ten year period ended 10/31/07, the Managers Fremont Micro-Cap Fund’s average annual total return was 12.1%. The comparable return for the Russell 2000® Growth Index was 4.8%.
Looking Forward
While the Fund has served its shareholders well over the years, we believe it can be improved by moving it from its current single-subadvisor, single-style structure to a multi-subadvisor, multi-style structure. On December 6, 2007 the Fund’s Board of Trustees approved the replacement of Kern Capital Management with four new subadvisors for the Fund. This will allow the Fund to participate in a much broader range of micro-cap stocks, which we expect will improve the risk-adjusted performance in the future. The new managers are Lord, Abbett & Co., LLC; Next Century Growth Investors, LLC; OFI Institutional Asset Management; and WEDGE Capital Management L.L.P. Consistent with these changes we have revised the primary benchmark for the Fund to be the Russell Microcap® Index, which we believe to be a better representation of the opportunity set of companies in which the Fund invests. Following is a brief description of the investment philosophy and process for each subadvisor.
Lord, Abbett & Co. LLC
Investment Philosophy
The goal of the team is to invest in a portfolio of well-diversified quality growth stocks with reasonable valuations via an investment approach that focuses on fundamental research and experienced judgment.
Investment Process Highlights
The team focuses its stock selection effort by focusing on companies that have revenue growth of at least 15%, are experiencing year-to-year operating margin improvement and are experiencing earnings growth that is driven by top-line growth rather than being driven by one time events or simple cost cutting measures. The focus is also on identifying companies with higher quality balance sheets (often captured by finding companies with manageable debt-to-total capital ratios) and that are already profitable. Once this process is completed, the focus for the team is on forecasting both revenue and earnings growth over the next several years. To achieve this goal, and to find companies that will be growing considerably faster than their industry average, members of the team spend an extensive amount of time understanding the competitive advantages of a firm, the industry dynamics within which they operate and the strength of management.
The sell discipline is enacted if there is a fundamental change in the business, a more attractive alternative is found or if a holding reaches a 5% weight in the overall portfolio.
5
Managers Fremont Micro-Cap Fund
Portfolio Manager’s Comments (continued)
The portfolio typically holds between 75 and 100 stocks with no individual holding exceeding 5%. There is a risk constraint that prevents any individual industry from being greater than 25% of the total portfolio weight. The approximate annual turnover in the portfolio is 200% although this is not an explicit target as part of either the stock selection or the portfolio construction processes.
Next Century Growth Investors, LLC
Investment Philosophy
Next Century’s goal is to invest in high quality and fast growing companies in order to achieve compounding of portfolio value over time.
Investment Process Highlights
The team requires historical revenue growth of at least 15% for a company before conducting further research. Other key factors considered initially by the team are strong historical revenue growth, low debt and high ROE. Quantitative screening is done on a regular basis to see which stocks over the past year are experiencing significant growth. The next stage of this process involves intensive first-hand research to determine the growth prospects of a company with the team choosing a stock only when it has become convinced a company has an extraordinary opportunity to grow their business. The uniqueness of this process lies in the fact that the team seeks these companies regardless of their short-term prospects and\or current valuation. The team is looking for “home runs” and companies that will grow to the point that they will eventually reside in their small cap portfolio.
The sell discipline is enacted if there is a change in the original investment thesis or a fundamental disappointment in the company. In addition, a holding will become a candidate for sale if it reaches an extreme valuation, becomes larger than 5% of the overall portfolio or as it approaches $1 billion in market capitalization. Typically companies are sold out of the micro cap portfolio because they have approached $1 billion in market capitalization, and are bought for their small cap portfolio.
The portfolio is concentrated and typically has 40-60 holdings which can create a high level of volatility. The only risk constraints are that sector weights can not exceed two times the Russell 2000® Growth sector weights and no individual holding can be greater than 5% of the portfolio.
OFI Institutional Asset Management
Investment Philosophy
The goal of the team is to invest in companies that have a sustainable competitive advantage, strong company management, a long product cycle and pricing flexibility. The team believes that consistently identifying these types of companies will produce superior absolute and risk-adjusted returns over time.
Investment Process Highlights
The team relies on both quantitative and qualitative tools to help with their stock selection process. The team quantitatively screens on both quality and value characteristics such as high return on equity and assets for quality and low Price/Earnings and Price/ Book ratios for valuation. The quality and valuation screen leaves the team with a strong, focused universe with which to conduct its fundamental analysis where the team spends time meeting with company management as well as customers and suppliers in an effort to better understand the dynamics of the industry within which a company operates. The analysts then use a discounted cash flow analysis to arrive at a price target for each security using a static discount rate over a 1- year rolling time horizon.
The sell discipline is enacted if a stock achieves peak profitability or valuation, or the fundamentals of the original investment thesis deteriorate. In addition, a stock may be sold if a more attractive opportunity is found for the portfolio or if a stock reaches a 5% total position.
The portfolio typically holds between 40-70 securities with position sizes generally ranging from 1% to 3% with a maximum of 5% allowed in any one holding. In addition, there is a constraint that limits the maximum exposure to any sector at 30%.
WEDGE Capital Management, L.L.P.
Investment Philosophy
The team believes philosophically that the use of quantitative tolls can increase the probability and consistency of success. The investment process is focused on identifying value opportunities because of the belief that these will produce investment returns over all significant time periods.
Investment Process Highlights
The investment process is a combination of both quantitative and fundamental research insights. The quantitative portion of the investment process uses commonly found factors and characteristics that can be accessed via any number of commercial databases. The value-added portion of the process, therefore, comes from the use of a number of different factors across five major categories: valuation, earnings quality, operating efficiency, capital usage and momentum, whose efficacy has been verified via long-term regression analysis. This is the Fundamental Value model. The top results of this model are combined with the best resulting stocks from the Financial Quality model, which measures stocks across categories such as multiple earnings growth, profitability, leverage and liquidity. The top stocks that appear in both models are eligible for fundamental research. The fundamental research portion of the investment process is exclusionary in nature and meant to eliminate stocks that are not strong in earnings forecasts, valuation metrics, sector\industry outlook or any factor that can not be easily captured quantitatively.
A stock is scrutinized for possible sale if it falls below the top four deciles in the Fundamental Value model. Stocks are sold when they become fairly valued, an upgrade opportunity develops or the original investment thesis materially deteriorates.
The portfolio is confined to plus or minus 10% in any given sector although sector positions tend to be much closer to the sector weighting than this. (It should be noted that these self-imposed sector weighting constraints are based on a proprietary liquidity analysis conducted on an ongoing basis by the micro cap team and is NOT driven by the sector weightings of any micro cap benchmark). The final portfolio tends to be well diversified and holds approximately 150 securities and consistently maintains a value bias relative to the benchmark. The portfolio tends to hold securities within the $40 million to $400 million market capitalization range although does not require a sale of a holding until it reaches $800 million in market capitalization.
6
Managers Fremont Micro-Cap Fund
Portfolio Manager’s Comments (continued)
Cumulative Total Return Performance
Managers Fremont Micro-Cap Fund’s cumulative total return is based on the daily change in net asset value (NAV), and assumes that all distributions were reinvested. The Russell 2000® Growth Index measures the performance of those Russell 2000® companies with higher price-to-book ratios and higher forecasted growth values. This chart compares a hypothetical $10,000 investment made in the Managers Fremont Micro-Cap Fund on 10/31/97 to a $10,000 investment made in the Russell 2000® Growth Index for the same time period. The graph and table do not reflect the deduction of taxes that a shareholder would pay on a Fund distribution or redemption of shares. Past performance is not indicative of future results.
The table below shows the average annualized total returns for the Managers Fremont Micro-Cap Fund and the Russell 2000® Growth Index for the one-year, five-year and ten-year periods ending October 31, 2007.
| | | | | | | | | |
Average Annual Total Returns* | | One Year | | | Five Years | | | Ten Years | |
Managers Fremont Micro-Cap | | 21.58 | % | | 17.85 | % | | 12.07 | % |
Russell 2000® Growth Index | | 16.73 | % | | 18.57 | % | | 4.75 | % |
| * | Performance based on published NAV as of 10/31/07. |
The performance data shown represents past performance. Past performance is not a guarantee of future results. Current performance may be lower or higher than the performance data quoted. The investment return and the principal value of an investment will fluctuate so that an investor’s shares, when redeemed, may be worth more or less than their original cost. For performance information through the most recent month end please call (800) 835-3879 or visit our Web site at www.managersinvest.com.
The Funds are subject to risks associated with investments in small-capitalization companies, such as erratic earnings patterns, competitive conditions, limited earnings history, and a reliance on one or a limited number of products.
The Russell 2000® Growth Index measures the performance of the Russell 2000® companies with higher price-to-book ratios and higher forecasted growth values. Unlike the Funds, the Russell 2000® Growth Index is unmanaged, is not available for investment and does not incur expenses.
The Russell 2000® Index and the Russell 2000® Growth Index are registered trademarks of the Frank Russell Company. Russell® is a trademark of the Frank Russell Company.
In choosing a Fund, investors should carefully consider the amount they plan to invest, their investment objectives, the Fund’s investment objectives, risks, charges and expenses before investing. For this and other information, please call 800.835.3879 or visit www.managersinvest.com for a free prospectus. Read it carefully before investing or sending money. Distributed by Managers Distributors, Inc., member FINRA.
Not FDIC insured, nor bank guaranteed. May lose value.
7
Managers Fremont Micro-Cap Fund
Fund Snapshots
October 31, 2007
Portfolio Breakdown
| | | | | | |
Industry | | Managers
Fremont
Micro Cap** | | | Russell 2000®
Growth | |
Information Technology | | 61.9 | % | | 23.6 | % |
Health Care | | 19.3 | % | | 21.0 | % |
Industrials | | 6.7 | % | | 16.2 | % |
Materials | | 4.6 | % | | 3.7 | % |
Consumer Discretionary | | 3.7 | % | | 16.3 | % |
Energy | | 0.8 | % | | 6.7 | % |
Telecommunication Services | | 0.0 | % | | 1.6 | % |
Financials | | 0.0 | % | | 8.1 | % |
Consumer Staples | | 0.0 | % | | 2.3 | % |
Utilities | | 0.0 | % | | 0.5 | % |
Other Assets and Liabilities | | 3.0 | % | | 0.0 | % |
Top Ten Holdings
| | | |
Security Name | | Percentage
of Net Assets | |
Equinix, Inc.* | | 5.6 | % |
Power Integrations, Inc.* | | 4.7 | |
Regeneration Technologies, Inc.* | | 3.9 | |
FEI Co.* | | 3.8 | |
Conceptus, Inc.* | | 3.6 | |
Calgon Carbon Corp.* | | 3.6 | |
Cepheid, Inc. | | 3.1 | |
Eagle Test Systems, Inc. | | 2.7 | |
Authorize.Net Holdings, Inc. | | 2.7 | |
Double-Take Software, Inc. | | 2.3 | |
| | | |
Top Ten as a Group | | 36.0 | % |
| | | |
| * | Top Ten Holding at April 30, 2007. |
Any sectors, industries, or securities discussed should not be perceived as investment recommendations. Mention of a specific security should not be considered a recommendation to buy or solicitation to sell that security.
8
Managers Fremont Micro-Cap Fund
Schedule of Portfolio Investments
October 31, 2007
| | | | | | | |
| | | Shares | | | Value | |
Common Stocks - 97.0% | | | | | | | |
Consumer Discretionary - 3.7% | | | | | | | |
A.T. Cross Co., Class A* | | 332,200 | | | $ | 3,803,690 | |
Century Casinos, Inc.* | | 458,760 | | | | 3,280,134 | |
IMAX Corp.* | | 581,900 | | | | 2,996,785 | |
Total Consumer Discretionary | | | | | | 10,080,609 | |
Energy - 0.8% | | | | | | | |
SulphCo, Inc.* | | 337,100 | | | | 2,150,698 | |
Health Care - 19.3% | | | | | | | |
American Medical Systems Holdings, Inc.* | | 145,700 | | | | 1,863,503 | |
Cepheid, Inc.* | | 322,600 | | | | 8,348,888 | |
Conceptus, Inc.* | | 445,000 | | | | 9,758,850 | |
HMS Holdings Corp.* | | 106,800 | | | | 3,040,596 | |
ICON PLC.* | | 31,600 | | | | 1,832,800 | |
Insulet Corp.* | | 33,041 | | | | 827,347 | |
Masimo Corp.* | | 58,800 | | | | 2,012,136 | |
NxStage Medical, Inc.* | | 148,000 | | | | 2,183,000 | |
Omnicell, Inc.* | | 192,200 | | | | 5,074,080 | |
Phase Forward, Inc.* | | 129,000 | | | | 3,068,910 | |
Regeneration Technologies, Inc.* | | 996,018 | | | | 10,567,751 | |
SXC Health Solutions Corp.* | | 111,800 | | | | 1,782,092 | |
TranS1, Inc. | | 58,201 | 2 | | | 1,455,025 | |
Vital Images, Inc.* | | 48,400 | | | | 849,420 | |
Total Health Care | | | | | | 52,664,398 | |
Industrials - 6.7% | | | | | | | |
Ceco Environmental Corp.* | | 240,500 | | | | 3,501,680 | |
Global Traffic Network, Inc.* | | 707,500 | | | | 4,994,950 | |
Solar Power, Inc. | | 335,800 | | | | 1,343,200 | |
Stanley, Inc.* | | 97,400 | | | | 2,579,152 | |
Ultralife Batteries, Inc.* | | 431,332 | | | | 5,788,475 | |
Total Industrials | | | | | | 18,207,457 | |
Information Technology - 61.9% | | | | | | | |
Acacia Research Corp.* | | 98,800 | | | | 1,631,188 | |
Advanced Analogic Technologies, Inc.* | | 422,800 | | | | 5,107,424 | |
Airspan Networks, Inc.* | | 603,400 | | | | 1,430,058 | |
Anaren Microwave, Inc.* | | 86,400 | | | | 1,353,888 | |
Astro-Med, Inc. | | 148,271 | | | | 1,497,538 | |
ATMI, Inc.* | | 125,700 | | | | 4,039,998 | |
Authorize.Net Holdings, Inc.* | | 315,300 | | | | 7,368,561 | |
Bottomline Technologies, Inc.* | | 207,400 | | | | 3,330,844 | |
CommVault Systems, Inc.* | | 210,201 | | | | 4,275,488 | |
CyberSource Corp.* | | 110,400 | | | | 1,805,040 | |
Double-Take Software, Inc.* | | 265,100 | | | | 6,317,333 | |
Eagle Test Systems, Inc.* | | 588,800 | | | | 7,442,432 | |
EDGAR Online, Inc.* | | 455,000 | | | | 1,456,000 | |
Equinix, Inc.* | | 130,600 | | | | 15,235,796 | |
Exar Corp.* | | 348,900 | | | | 4,242,624 | |
Exfo Electro-Optical Engineering, Inc.* | | 603,545 | | | | 3,880,794 | |
Falconstor Software, Inc.* | | 229,300 | | | | 3,217,079 | |
FEI Co.* | | 356,900 | | | | 10,353,669 | |
Forrester Research, Inc.* | | 87,900 | | | | 2,084,988 | |
GigaMedia Ltd.* | | 126,500 | | | | 3,096,720 | |
hi/fn, Inc.* | | 408,500 | | | | 2,867,670 | |
Keynote Systems, Inc.* | | 283,400 | | | | 4,163,146 | |
L-1 Identity Solutions, Inc.* | | 339,269 | 2 | | | 6,300,225 | |
NCI, Inc., Class A* | | 196,200 | | | | 3,755,268 | |
Omniture, Inc.* | | 175,900 | | | | 6,008,744 | |
Online Resources Corp.* | | 167,429 | | | | 1,548,718 | |
Photon Dynamics, Inc.* | | 528,400 | | | | 5,431,952 | |
PLX Technology, Inc.* | | 157,700 | | | | 1,646,388 | |
Points International, Ltd.* | | 1,954,202 | | | | 4,103,824 | |
Power Integrations, Inc.* | | 389,800 | | | | 12,680,194 | |
Rainmaker Systems, Inc.* | | 293,500 | | | | 2,491,815 | |
Rimage Corp.* | | 138,700 | | | | 3,625,618 | |
Scopus Video Neworks, Ltd.* | | 524,579 | | | | 2,785,514 | |
SkillSoft PLC* | | 140,800 | | | | 1,260,160 | |
Smith Micro Software, Inc.* | | 178,700 | | | | 2,753,767 | |
SRS Labs, Inc.* | | 516,849 | | | | 3,328,508 | |
Stratasys, Inc.* | | 87,024 | | | | 2,265,235 | |
SupportSoft, Inc.* | | 416,400 | | | | 1,998,720 | |
Techwell, Inc.* | | 366,500 | | | | 4,551,930 | |
Volterra Semiconductor Corp.* | | 216,400 | | | | 2,659,556 | |
WJ Communications, Inc.* | | 2,678,600 | | | | 2,839,316 | |
Total Information Technology | | | | | | 168,233,730 | |
Materials - 4.6% | | | | | | | |
Calgon Carbon Corp.* | | 653,000 | | | | 9,729,700 | |
Northern Technologies International Corp.*4 | | 247,635 | | | | 2,785,894 | |
Total Materials | | | | | | 12,515,594 | |
Total Common Stocks
(cost $189,605,878) | | | | | | 263,852,486 | |
Other Investment Companies - 5.9%1 | | | | | | | |
Bank of New York Institutional Cash Reserves Fund, 5.09%3 | | 7,770,286 | | | | 7,770,286 | |
Dreyfus Cash Management Fund, Institutional Class Shares, 4.94% | | 5,024,329 | | | | 5,024,329 | |
Vanguard Prime Money Market Fund, Institutional Class Shares, 5.00% | | 3,331,851 | | | | 3,331,851 | |
Total Other Investment Companies
(cost $16,126,466) | | | | | | 16,126,466 | |
Total Investments - 102.9%
(cost $205,732,344) | | | | | | 279,978,952 | |
Other Assets, less Liabilities - (2.9)% | | | | | | (8,044,483 | ) |
Net Assets - 100.0% | | | | | $ | 271,934,469 | |
The accompanying notes are an integral part of these financial statements.
9
Managers Fremont Institutional Micro-Cap Fund
Portfolio Manager’s Comments
The Managers Fremont Institutional Micro-Cap Fund primarily invests in the stocks of U.S. micro-capitalization companies. These companies have market capitalizations that, at the time of initial purchase, place them among the smallest 5% of companies listed on U.S. stock markets. Normally, the Fund will invest at least 80% of its assets in U.S. micro-cap stocks. The Russell 2000® Growth Index is the benchmark for the Fund. While Kern Capital Management LLC was the sole subadvisor of the Fund throughout the fiscal year ended October 31, 2007, please read below for changes to the structure of the Fund that have been implemented since the fiscal year-end.
The Portfolio Manager
Kern Capital Management LLC
Kern Capital Management LLC (“KCM”), subadvisor for the Fre-mont Institutional Micro-Cap Fund was founded in 1997 by Robert (Bob) E. Kern, Jr. and David G. Kern. KCM is an employee owned investment advisory firm dedicated to researching and investing in innovative micro-cap and small-cap growth companies.
KCM believes the U.S. smaller company stock universe provides the opportunity to invest in innovative companies with exceptional growth prospects. With minimal research coverage by brokerage firms and low institutional ownership, KCM believes small and micro-cap stocks represent the least efficient sector of the market and its investment process is designed to capitalize on this inefficiency.
KCM’s fundamental research is dedicated to uncovering innovative small companies early in their growth cycle while they are still relatively undiscovered. With a huge universe of investment opportunity, KCM’s investment process focuses on the most innovative sectors in the U.S. economy (technology, healthcare, services and consumer sectors). Research specialization by economic sector provides the depth of knowledge necessary to make high quality investment decisions and minimize fundamental investment mistakes.
KCM builds portfolios one company at a time with investment research focused on the most innovative sectors of the economy (technology, health care, services and consumer). The team’s hands-on approach to fundamental investment research and financial analysis seeks to answer three basic questions to determine an investment’s attractiveness.
| | • | | How attractive is the business? Companies that are pioneering new markets or revolutionizing existing ones can often sustain rapid growth as they establish leading positions in their targeted markets. |
| | • | | How strong is the management? Successful companies require management capable of capitalizing on attractive growth opportunities. Management’s vision and ability to execute the business plan represent key elements in determining how successful a company will be. |
| | • | | How much is the company worth? The team’s process is valuation sensitive. Depending on the economic sector, different criteria are used to determine a company’s enterprise value, which determines if KCM would buy the entire company at the current market value of its equity. |
Given that KCM is focused on investing in innovative growth companies, the first two questions are answered before determining if the valuation is attractive. In fact, the answers to the first two questions will help determine the appropriate valuation for the company.
The ideal company exhibits many of the following traits:
| | • | | Leading market position in a rapidly growing market with high barriers to entry |
| | • | | Entrepreneurial management team with experience managing a growth business |
| | • | | Focused business plan with tight internal controls |
Portfolio management:
| | • | | Invests in between 70 and 90 companies which have market capitalizations that, at the time of initial purchase, place them among the smallest 5% of companies listed in the U.S. stock markets |
| | • | | Builds portfolios from the bottom up and seeks to identify companies early in their growth cycle |
| | • | | Utilizes a team approach to cover approximately 600 stocks through an extensive network of contact and other information sources: |
| | • | | Brokerage firm and industry analysts |
| | • | | Corporate management contacts |
| | • | | Trade shows and trade journals |
| | • | | Focuses on business sectors where KCM believes the level of innovation is greatest, such as technology, health care, services and consumer |
| | • | | Uses fundamental analysis to identify small, relatively unknown companies that exhibit the potential to become much larger and more successful |
| | • | | Meets with corporate management to discuss business plans and strategies |
The investment team will make a sell decision when:
| | • | | An investment’s growth prospects deteriorate |
| | • | | Investments achieve excessive valuation relative to the growth opportunities and/or addressable markets. |
| | • | | There is a negative change in fundamental confidence and/or investment time horizon |
The Year in Review
In the face of a severe reversal in U.S. residential real estate, rising concerns about the strength of the U.S. economy and a sharp drawdown of liquidity in the credit markets, stocks produced healthy returns for fiscal 2007. At first glance this might suggest a continuance of market preferences; however there were significant shifts in the U.S. equity market during the past fiscal year. Specifically, for the first time since fiscal 2000, growth biased indices outperformed their value biased counterparts (Russell 3000® Growth Index +19.0%; Russell 3000® Value Index +10.1%) as more innovative sectors started to represent a greater percentage of market returns. Similarly, the market favored larger capitalization firms as the Russell 1000® Index (+15.0%) beat the Russell 2000® Index (+9.3%) for the first time since fiscal year 1999. The market cap shift is probably a result of investor uncertainty about future economic growth, concerns about how riskier assets will perform going forward, and the perception that small cap stocks are inherently riskier.
The small cap universe and Managers Fremont Institutional Micro-Cap Fund were not immune to the aforementioned market shifts. Fiscal 2007, saw the largest market cap constituents of the Russell 2000® Index outperform their smaller brethren and the Russell 2000® Growth
10
Managers Fremont Institutional Micro-Cap Fund
Portfolio Manager’s Comments (continued)
greatly outpace the Russell 2000® Value, as the more innovative sectors started to represent a greater percentage of returns. During the twelve-month period ending 10/31/2007, the Managers Fremont Institutional Micro-Cap Fund increased 20.5%, solidly outpacing its primary benchmark, the Russell 2000® Growth Index, which returned 16.7%. Fund performance was driven by an overweight to technology, an avoidance of the worst sectors within the Index, strong stock selection, and a continued focus on the most attractive growth opportunities.
Kern Capital Management invests in small-cap and micro-cap growth companies and focuses its fundamental approach to investment research on the most innovative sectors in the U.S. economy. As a result, information technology securities represent a drastic overweight and were nearly 60% of the Fund’s assets through most of fiscal 2007. The Fund’s tech overweight was a result of Fund Management’s investment approach, not a top-down decision. Nevertheless, this overweight was additive since this sector appreciated the most of those representing a meaningful weight in the Index (>10%) and only trailed the performance of the Index’s less significant allocations to utilities and materials. Overall, stock selection in tech slightly offset the sector overweight, but ten different holdings appreciated more than 60% and the sector contributed nearly 65% of the Fund’s absolute return. Also, six of the Fund’s top ten absolute contributors were from this economic sector, while appreciating, on average, over 100% each.
Consistent with KCM’s focus on the most innovative sectors is a relatively low allocation to the consumer discretionary and financials sectors. The past fiscal year was no exception, as the Fund held very few positions in the financials sector and exhibited a 10% underweight to consumer discretionary. KCM’s underweights were advantageous as these two sectors were the worst performing sectors in the Index during the trailing twelve-months. Consumer discretionary struggled as investors continue to be skittish about the negative impact the housing market might have on consumer spending. Similarly, financials were hurt by further issues in the credit markets and lasting worries about additional sub prime fall-out.
Different market cycles may help or hinder portfolio performance, as economic sectors go in and out of favor. However, as KCM’s investment process indirectly drives sector weights, its bottom-up approach will always make stock selection a key determinant of relative performance. This was the case in fiscal 2007, as strong stock selection was most beneficial in health care, where the Fund’s positions greatly outpaced the Index. Seven Fund positions in this sector appreciated more than 60% during the trailing twelve-month period and contributed 16% of absolute performance. Positive stock selection was also evident in the materials and industrials sectors as both Fund sectors outperformed their Index counterparts. Neither sector is known for offering a wealth of innovative investment options, but the performance of several individual securities confirms that there are a few opportunities.
Lastly, the Fund’s strong performance during fiscal 2007 is particularly gratifying, since the small cap growth universe favored the larger firms. This is illustrated by the meaningful difference in performance of the Russell 2000® Growth constituents below $500 million and those above $500 million (>$500M +20.3%; <$500M +12.9%). As of fiscal year-end, more than 55% of the Fund was invested in companies with market caps below $500 million and the performance differential was a hindrance.
Over the longer term the Fund has achieved high absolute rates of return and significantly outperformed the Russell 2000® Growth Index. For the ten year period ended 10/31/07, the Managers Fremont Institutional Micro-Cap Fund’s average annual total return was 14.2%. The comparable return for the Russell 2000® Growth Index was 4.8%.
Looking Forward
While the Fund has served its shareholders well over the years, we believe it can be improved by moving it from its current single-subadvisor, single-style structure to a multi-subadvisor, multi-style structure. On December 6, 2007 the Fund’s Board of Trustees approved the replacement of Kern Capital Management with four new subadvisors for the Fund. This will allow the Fund to participate in a much broader range of micro-cap stocks, which we expect will improve the risk-adjusted performance in the future. The new managers are Lord, Abbett & Co., LLC; Next Century Growth Investors, LLC; OFI Institutional Asset Management; and WEDGE Capital Management L.L.P. Consistent with these changes we have revised the primary benchmark for the Fund to be the Russell Microcap® Index, which we believe to be a better representation of the opportunity set of companies in which the Fund invests. Following is a brief description of the investment philosophy and process for each subadvisor.
Lord, Abbett & Co. LLC
Investment Philosophy
The goal of the team is to invest in a portfolio of well-diversified quality growth stocks with reasonable valuations via an investment approach that focuses on fundamental research and experienced judgment.
Investment Process Highlights
The team focuses its stock selection effort by focusing on companies that have revenue growth of at least 15%, are experiencing year-to-year operating margin improvement and are experiencing earnings growth that is driven by top-line growth rather than being driven by one time events or simple cost cutting measures. The focus is also on identifying companies with higher quality balance sheets (often captured by finding companies with manageable debt-to-total capital ratios) and that are already profitable. Once this process is completed, the focus for the team is on forecasting both revenue and earnings growth over the next several years. To achieve this goal, and to find companies that will be growing considerably faster than their industry average, members of the team spend an extensive amount of time understanding the competitive advantages of a firm, the industry dynamics within which they operate and the strength of management.
The sell discipline is enacted if there is a fundamental change in the business, a more attractive alternative is found or if a holding reaches a 5% weight in the overall portfolio.
The portfolio typically holds between 75 and 100 stocks with no individual holding exceeding 5%. There is a risk constraint that prevents any individual industry from being greater than 25% of the total portfolio weight. The approximate annual turnover in the portfolio is 200% although this is not an explicit target as part of either the stock selection or the portfolio construction processes.
11
Managers Fremont Institutional Micro-Cap Fund
Portfolio Manager’s Comments (continued)
Next Century Growth Investors, LLC
Investment Philosophy
Next Century’s goal is to invest in high quality and fast growing companies in order to achieve compounding of portfolio value over time.
Investment Process Highlights
The team requires historical revenue growth of at least 15% for a company before conducting further research. Other key factors considered initially by the team are strong historical revenue growth, low debt and high ROE. Quantitative screening is done on a regular basis to see which stocks over the past year are experiencing significant growth. The next stage of this process involves intensive first-hand research to determine the growth prospects of a company with the team choosing a stock only when it has become convinced a company has an extraordinary opportunity to grow their business. The uniqueness of this process lies in the fact that the team seeks these companies regardless of their short-term prospects and\or current valuation. The team is looking for “home runs” and companies that will grow to the point that they will eventually reside in their small cap portfolio.
The sell discipline is enacted if there is a change in the original investment thesis or a fundamental disappointment in the company. In addition, a holding will become a candidate for sale if it reaches an extreme valuation, becomes larger than 5% of the overall portfolio or as it approaches $1 billion in market capitalization. Typically companies are sold out of the micro cap portfolio because they have approached $1 billion in market capitalization, and are bought for their small cap portfolio.
The portfolio is concentrated and typically has 40-60 holdings which can create a high level of volatility. The only risk constraints are that sector weights can not exceed two times the Russell 2000® Growth sector weights and no individual holding can be greater than 5% of the portfolio.
OFI Institutional Asset Management
Investment Philosophy
The goal of the team is to invest in companies that have a sustainable competitive advantage, strong company management, a long product cycle and pricing flexibility. The team believes that consistently identifying these types of companies will produce superior absolute and risk-adjusted returns over time.
Investment Process Highlights
The team relies on both quantitative and qualitative tools to help with their stock selection process. The team quantitatively screens on both quality and value characteristics such as high return on equity and assets for quality and low Price/Earnings and Price/ Book ratios for valuation. The quality and valuation screen leaves the team with a strong, focused universe with which to conduct its fundamental analysis where the team spends time meeting with company management as well as customers and suppliers in an effort to better understand the dynamics of the industry within which a company operates. The analysts then use a discounted cash flow analysis to arrive at a price target for each security using a static discount rate over a 1- year rolling time horizon.
The sell discipline is enacted if a stock achieves peak profitability or valuation, or the fundamentals of the original investment thesis deteriorate. In addition, a stock may be sold if a more attractive opportunity is found for the portfolio or if a stock reaches a 5% total position.
The portfolio typically holds between 40-70 securities with position sizes generally ranging from 1% to 3% with a maximum of 5% allowed in any one holding. In addition, there is a constraint that limits the maximum exposure to any sector at 30%.
WEDGE Capital Management, L.L.P.
Investment Philosophy
The team believes philosophically that the use of quantitative tolls can increase the probability and consistency of success. The investment process is focused on identifying value opportunities because of the belief that these will produce investment returns over all significant time periods.
Investment Process Highlights
The investment process is a combination of both quantitative and fundamental research insights. The quantitative portion of the investment process uses commonly found factors and characteristics that can be accessed via any number of commercial databases. The value-added portion of the process, therefore, comes from the use of a number of different factors across five major categories: valuation, earnings quality, operating efficiency, capital usage and momentum, whose efficacy has been verified via long-term regression analysis. This is the Fundamental Value model. The top results of this model are combined with the best resulting stocks from the Financial Quality model, which measures stocks across categories such as multiple earnings growth, profitability, leverage and liquidity. The top stocks that appear in both models are eligible for fundamental research. The fundamental research portion of the investment process is exclusionary in nature and meant to eliminate stocks that are not strong in earnings forecasts, valuation metrics, sector\industry outlook or any factor that can not be easily captured quantitatively.
A stock is scrutinized for possible sale if it falls below the top four deciles in the Fundamental Value model. Stocks are sold when they become fairly valued, an upgrade opportunity develops or the original investment thesis materially deteriorates.
The portfolio is confined to plus or minus 10% in any given sector although sector positions tend to be much closer to the sector weighting than this. (It should be noted that these self-imposed sector weighting constraints are based on a proprietary liquidity analysis conducted on an ongoing basis by the micro cap team and is NOT driven by the sector weightings of any micro cap benchmark). The final portfolio tends to be well diversified and holds approximately 150 securities and consistently maintains a value bias relative to the benchmark. The portfolio tends to hold securities within the $40 million to $400 million market capitalization range although does not require a sale of a holding until it reaches $800 million in market capitalization.
Cumulative Total Return Performance
Managers Fremont Institutional Micro-Cap Fund’s cumulative total return is based on the daily change in net asset value (NAV), and assumes that all distributions were reinvested. The Russell 2000® Growth Index measures the performance of those Russell 2000® companies with higher price-to-book ratios and higher forecasted growth values. This chart compares a hypothetical $10,000 investment made in the Managers Fremont Institutional Micro-Cap Fund on 10/31/97 to a $10,000 investment made in the Russell 2000® Growth Index for the same time period. The graph and table do not reflect the deduction of taxes that a shareholder would pay on a Fund distribution or redemption of shares. Past performance is not indicative of future results.
12
Managers Fremont Institutional Micro-Cap Fund
Portfolio Manager’s Comments (continued)
Cumulative Total Return Performance
The table below shows the average annualized total returns for the Managers Fremont Institutional Micro-Cap Fund and the Russell 2000® Growth Index for the one-year, five-year and ten-year periods ending October 31, 2007.
| | | | | | | | | |
Average Annual Total Returns | | One Year | | | Five Years | | | Ten Years | |
Managers Fremont Institutional Micro-Cap | | 20.48 | % | | 17.90 | % | | 14.19 | % |
Russell 2000® Growth Index | | 16.73 | % | | 18.57 | % | | 4.75 | % |
The performance data shown represents past performance. Past performance is not a guarantee of future results. Current performance may be lower or higher than the performance data quoted. The investment return and the principal value of an investment will fluctuate so that an investor’s shares, when redeemed, may be worth more or less than their original cost. For performance information through the most recent month end please call (800) 835-3879 or visit our Web site at www.managersinvest.com.
The Funds are subject to risks associated with investments in small-capitalization companies, such as erratic earnings patterns, competitive conditions, limited earnings history, and a reliance on one or a limited number of products.
The Russell 2000® Growth Index measures the performance of the Russell 2000 companies with higher price-to-book ratios and higher forecasted growth values. Unlike the Funds, the Russell 2000® Growth Index is unmanaged, is not available for investment and does not incur expenses.
The Russell 2000® Index and the Russell 2000® Growth Index are registered trademarks of the Frank Russell Company. Russell® is a trademark of the Frank Russell Company.
From time to time the Institutional Micro-Cap Fund’s advisor has waived fees or reimbursed expenses, which may have resulted in higher returns.
In choosing a Fund, investors should carefully consider the amount they plan to invest, their investment objectives, the Fund’s investment objectives, risks, charges and expenses before investing. For this and other information, please call 800.835.3879 or visit www.managersinvest. com for a free prospectus. Read it carefully before investing or sending money. Distributed by Managers Distributors, Inc., member FINRA.
Not FDIC insured, nor bank guaranteed. May lose value.
13
Managers Fremont Institutional Micro-Cap Fund
Fund Snapshots
October 31, 2007
Portfolio Breakdown
| | | | | | |
Industry | | Managers
Fremont
Institutional
Micro-Cap** | | | Russell
2000®
Growth | |
Information Technology | | 60.3 | % | | 23.6 | % |
Health Care | | 18.8 | % | | 21.0 | % |
Industrials | | 6.5 | % | | 16.2 | % |
Materials | | 4.5 | % | | 3.7 | % |
Consumer Discretionary | | 3.6 | % | | 16.3 | % |
Energy | | 0.8 | % | | 6.7 | % |
Telecommunication Services | | 0.0 | % | | 1.6 | % |
Utilities | | 0.0 | % | | 0.5 | % |
Consumer Staples | | 0.0 | % | | 2.3 | % |
Financials | | 0.0 | % | | 8.1 | % |
Other Assets and Liabilities | | 5.5 | % | | 0.0 | % |
Top Ten Holdings
| | | |
Security Name | | Percentage of
Net Assets | |
Equinix, Inc.* | | 5.3 | % |
Power Integrations, Inc.* | | 4.5 | |
Regeneration Technologies, Inc.* | | 3.8 | |
FEI Co.* | | 3.6 | |
Calgon Carbon Corp.* | | 3.6 | |
Conceptus, Inc.* | | 3.4 | |
Cepheid, Inc. | | 3.1 | |
Eagle Test Systems, Inc. | | 2.7 | |
Authorize.Net Holdings, Inc. | | 2.6 | |
Double-Take Software, Inc. | | 2.3 | |
| | | |
Top Ten as a Group | | 34.9 | % |
| | | |
| * | Top Ten Holding at April 30, 2007 |
Any sectors, industries, or securities discussed should not be perceived as investment recommendations. Mention of a specific security should not be considered a recommendation to buy or solicitation to sell that security.
14
Managers Fremont Institutional Micro-Cap Fund
Schedule of Portfolio Investments
October 31, 2007
| | | | | | | |
| | | Shares | | | Value | |
Common Stocks - 94.5% | | | | | | | |
Consumer Discretionary - 3.6% | | | | | | | |
A.T. Cross Co., Class A* | | 161,600 | | | $ | 1,850,320 | |
Century Casinos, Inc.* | | 237,600 | | | | 1,698,840 | |
IMAX Corp.* | | 284,900 | | | | 1,467,234 | |
Total Consumer Discretionary | | | | | | 5,016,394 | |
Energy - 0.8% | | | | | | | |
SulphCo, Inc.* | | 169,900 | | | | 1,083,962 | |
Health Care - 18.8% | | | | | | | |
American Medical Systems Holdings, Inc.* | | 75,400 | | | | 964,366 | |
Cepheid, Inc.* | | 166,600 | | | | 4,311,608 | |
Conceptus, Inc.* | | 220,400 | | | | 4,833,372 | |
HMS Holdings Corp.* | | 53,800 | | | | 1,531,686 | |
ICON PLC.* | | 15,400 | | | | 893,200 | |
Insulet Corp.* | | 15,972 | | | | 399,939 | |
Masimo Corp.* | | 29,400 | | | | 1,006,068 | |
NxStage Medical, Inc.* | | 76,100 | | | | 1,122,475 | |
Omnicell, Inc.* | | 93,100 | | | | 2,457,840 | |
Phase Forward, Inc.* | | 65,500 | | | | 1,558,245 | |
Regeneration Technologies, Inc.* | | 505,400 | | | | 5,362,294 | |
SXC Health Solutions Corp.* | | 56,300 | | | | 897,422 | |
Trans1, Inc. | | 30,080 | 2 | | | 752,000 | |
Vital Images, Inc.* | | 23,500 | | | | 412,425 | |
Total Health Care | | | | | | 26,502,940 | |
Industrials - 6.5% | | | | | | | |
Ceco Environmental Corp.* | | 124,500 | | | | 1,812,720 | |
Global Traffic Network, Inc.* | | 348,100 | | | | 2,457,586 | |
Solar Power, Inc. | | 173,300 | | | | 693,200 | |
Stanley, Inc.* | | 49,700 | | | | 1,316,056 | |
Ultralife Batteries, Inc.* | | 219,900 | | | | 2,951,058 | |
Total Industrials | | | | | | 9,230,620 | |
Information Technology - 60.3% | | | | | | | |
Acacia Research Corp.* | | 48,100 | | | | 794,131 | |
Advanced Analogic Technologies, Inc.* | | 212,500 | | | | 2,567,000 | |
Airspan Networks, Inc.* | | 295,900 | | | | 701,283 | |
Anaren Microwave, Inc.* | | 44,100 | | | | 691,047 | |
Astro-Med, Inc. | | 74,408 | | | | 751,521 | |
ATMI, Inc.* | | 63,200 | | | | 2,031,248 | |
Authorize.Net Holdings, Inc.* | | 154,700 | | | | 3,615,339 | |
Bottomline Technologies, Inc.* | | 103,400 | | | | 1,660,604 | |
CommVault Systems, Inc.* | | 108,823 | | | | 2,213,460 | |
CyberSource Corp.* | | 53,500 | | | | 874,725 | |
Double-Take Software, Inc.* | | 137,100 | | | | 3,267,093 | |
Eagle Test Systems, Inc.* | | 298,100 | | | | 3,767,984 | |
EDGAR Online, Inc.* | | 233,700 | | | | 747,840 | |
Equinix, Inc.* | | 64,100 | | | | 7,477,906 | |
Exar Corp.* | | 193,400 | | | | 2,351,744 | |
Exfo Electro-Optical Engineering, Inc.* | | 304,765 | | | | 1,959,639 | |
Falconstor Software, Inc.* | | 115,000 | | | | 1,613,450 | |
FEI Co.* | | 176,200 | | | | 5,111,562 | |
Forrester Research, Inc.* | | 44,200 | | | | 1,048,424 | |
GigaMedia Ltd.* | | 65,500 | | | | 1,603,440 | |
hi/fn, Inc.* | | 256,300 | | | | 1,799,226 | |
Keynote Systems, Inc.* | | 139,600 | | | | 2,050,724 | |
L-1 Identity Solutions, Inc.* | | 165,696 | 2 | | | 3,076,975 | |
NCI, Inc., Class A* | | 102,200 | | | | 1,956,108 | |
Omniture, Inc.* | | 85,200 | | | | 2,910,432 | |
Online Resources Corp.* | | 84,511 | | | | 781,727 | |
Photon Dynamics, Inc.* | | 266,200 | | | | 2,736,536 | |
PLX Technology, Inc.* | | 79,300 | | | | 827,892 | |
Points International, Ltd.* | | 955,952 | | | | 2,007,499 | |
Power Integrations, Inc.* | | 195,900 | | | | 6,372,627 | |
Rainmaker Systems, Inc.* | | 143,600 | | | | 1,219,164 | |
Rimage Corp.* | | 71,500 | | | | 1,869,010 | |
Scopus Video Neworks, Ltd.* | | 267,254 | | | | 1,419,119 | |
SkillSoft PLC* | | 71,900 | | | | 643,505 | |
Smith Micro Software, Inc.* | | 92,200 | 2 | | | 1,420,802 | |
SRS Labs, Inc.* | | 254,400 | | | | 1,638,336 | |
Stratasys, Inc.* | | 42,720 | | | | 1,112,002 | |
SupportSoft, Inc.* | | 215,000 | | | | 1,032,000 | |
Techwell, Inc.* | | 189,500 | | | | 2,353,590 | |
Volterra Semiconductor Corp.* | | 136,500 | | | | 1,677,584 | |
WJ Communications, Inc.* | | 1,375,000 | | | | 1,457,500 | |
Total Information Technology | | | | | | 85,211,798 | |
Materials - 4.5% | | | | | | | |
Calgon Carbon Corp.* | | 338,200 | | | | 5,039,180 | |
Northern Technologies International Corp.* | | 120,600 | | | | 1,356,750 | |
Total Materials | | | | | | 6,395,930 | |
Total Common Stocks | | | | | | | |
(cost $93,918,042) | | | | | | 133,441,644 | |
Other Investment Companies - 7.4%1 | | | | | | | |
Bank of New York Institutional Cash Reserves Fund, 5.09%3 | | 1,858,786 | | | | 1,858,786 | |
Dreyfus Cash Management Fund, Institutional Class Shares, 4.94% | | 8,646,950 | | | | 8,646,950 | |
Total Other Investment Companies | | | | | | | |
(cost $10,505,736) | | | | | | 10,505,736 | |
Total Investments - 101.9% | | | | | | | |
(cost $104,423,778) | | | | | | 143,947,380 | |
Other Assets, less Liabilities - (1.9)% | | | | | | (2,724,812 | ) |
Net Assets - 100.0% | | | | | $ | 141,222,568 | |
The accompanying notes are an integral part of these financial statements.
15
Notes to Schedules of Portfolio Investments
The following footnotes and abbreviations should be read in conjunction with each of the Schedules of Portfolio Investments previously presented in this report.
At October 31, 2007, the cost of securities for Federal income tax purposes and the gross aggregate unrealized appreciation and/or depreciation based on tax cost were approximately:
| | | | | | | | | | | | |
Fund | | Cost | | Appreciation | | Depreciation | | | Net |
Fremont Micro-Cap | | $ | 208,366,017 | | $ | 78,033,795 | | ($6,420,860 | ) | | $ | 71,612,935 |
Fremont Institutional Micro-Cap | | | 105,693,686 | | | 41,169,339 | | (2,915,645 | ) | | | 38,253,694 |
| * | Non-income-producing security. |
1 | Yield shown for an investment company represents its October 31, 2007, seven-day average yield, which refers to the sum of the previous seven days’ dividends paid, expressed as an annual percentage. |
2 | Some or all of these shares were out on loan to various brokers as of October 31, 2007, amounting to: |
| | | | | | |
Fund | | Market Value | | % of Net Assets | |
Fremont Micro-Cap | | $ | 7,730,250 | | 2.8 | % |
Fremont Institutional Micro-Cap | | | 1,823,594 | | 1.3 | % |
3 | Collateral received from brokers for securities lending was invested in this short-term investment. |
4 | Affiliated Company – See Note 6 in the Notes to Financial Statements. |
The accompanying notes are an integral part of these financial statements.
16
Statements of Assets and Liabilities
October 31, 2007
| | | | | | | |
| | | Managers
Fremont
Micro-Cap
Fund | | | Managers
Fremont
Institutional
Micro-Cap Fund |
Assets: | | | | | | | |
Investments at value* (including securities on loan valued at $7,730,250 and $1,823,594, respectively) | | $ | 279,978,952 | | | $ | 143,947,380 |
Receivable for investments sold | | | 4,684,006 | | | | 1,694,688 |
Receivable for Fund shares sold | | | 41,299 | | | | 109,632 |
Dividends and other receivables | | | 67,164 | | | | 48,693 |
Prepaid expenses | | | 13,252 | | | | 13,246 |
| | | | | | | |
Total assets | | | 284,784,673 | | | | 145,813,639 |
| | | | | | | |
Liabilities: | | | | | | | |
Payable for Fund shares repurchased | | | 436,607 | | | | 114,240 |
Payable upon return of securities loaned | | | 7,770,286 | | | | 1,858,786 |
Payable for investments purchased | | | 4,161,880 | | | | 2,379,624 |
Accrued expenses: | | | | | | | |
Investment advisory and management fees | | | 228,135 | | | | 117,477 |
Administrative fees | | | 57,034 | | | | 29,369 |
Other | | | 196,262 | | | | 91,575 |
| | | | | | | |
Total liabilities | | | 12,850,204 | | | | 4,591,071 |
| | | | | | | |
Net Assets | | $ | 271,934,469 | | | $ | 141,222,568 |
| | | | | | | |
Shares outstanding | | | 6,489,310 | | | | 8,481,100 |
| | | | | | | |
Net asset value, offering and redemption price per share | | $ | 41.90 | | | $ | 16.65 |
| | | | | | | |
Net Assets Represent: | | | | | | | |
Paid-in capital | | $ | 203,711,129 | | | $ | 89,896,993 |
Accumulated net realized gain (loss) from investments | | | (6,023,268 | ) | | | 11,801,973 |
Net unrealized appreciation of investments | | | 74,246,608 | | | | 39,523,602 |
| | | | | | | |
Net Assets | | $ | 271,934,469 | | | $ | 141,222,568 |
| | | | | | | |
* Investments at cost | | $ | 205,732,344 | | | $ | 104,423,778 |
The accompanying notes are an integral part of these financial statements.
17
Statements of Operations
For the fiscal year ended October 31, 2007
| | | | | | | | |
| | | Managers Fremont
Micro-Cap Fund | | | Managers Fremont
Institutional
Micro-Cap Fund | |
Investment Income: | | | | | | | | |
Dividend income | | $ | 1,464,234 | | | $ | 876,797 | |
Securities lending fees | | | 29,840 | | | | 26,456 | |
| | | | | | | | |
Total investment income | | | 1,494,074 | | | | 903,253 | |
| | | | | | | | |
Expenses: | | | | | | | | |
Investment management fees | | | 2,840,375 | | | | 1,755,732 | |
Administrative fees | | | 710,094 | | | | 438,933 | |
Transfer agent | | | 563,858 | | | | 52,623 | |
Professional fees | | | 72,452 | | | | 52,129 | |
Reports to shareholders | | | 62,839 | | | | 49,336 | |
Custodian | | | 58,479 | | | | 45,797 | |
Registration fees | | | 20,330 | | | | 18,471 | |
Trustees fees and expenses | | | 14,524 | | | | 6,160 | |
Insurance | | | 12,193 | | | | 12,397 | |
Miscellaneous | | | 3,951 | | | | 2,486 | |
| | | | | | | | |
Total expenses before offsets | | | 4,359,095 | | | | 2,434,064 | |
| | | | | | | | |
Expense reimbursement | | | — | | | | (62,393 | ) |
Expense reductions | | | (2,626 | ) | | | (1,432 | ) |
| | | | | | | | |
Net expenses | | | 4,356,469 | | | | 2,370,239 | |
| | | | | | | | |
Net investment loss | | | (2,862,395 | ) | | | (1,466,986 | ) |
| | | | | | | | |
Net Realized and Unrealized Gain: | | | | | | | | |
Net realized gain on investment transactions | | | 12,362,253 | | | | 16,552,417 | |
Net unrealized appreciation of investments | | | 45,248,831 | | | | 16,404,048 | |
| | | | | | | | |
Net realized and unrealized gain | | | 57,611,084 | | | | 32,956,465 | |
| | | | | | | | |
Net Increase in Net Assets Resulting from Operations | | $ | 54,748,689 | | | $ | 31,489,479 | |
| | | | | | | | |
The accompanying notes are an integral part of these financial statements.
18
Statements of Changes in Net Assets
For the fiscal year ended October 31,
| | | | | | | | | | | | | | | | |
| | | Managers Fremont Micro-Cap | | | Managers Fremont Institutional Micro-Cap | |
| | | 2007 | | | 2006 | | | 2007 | | | 2006 | |
Increase (Decrease) in Net Assets From Operations: | | | | | | | | | | | | | | | | |
Net investment loss | | | ($2,862,395 | ) | | | ($3,015,611 | ) | | | ($1,466,986 | ) | | | ($1,787,223 | ) |
Net realized gain on investments | | | 12,362,253 | | | | 20,083,106 | | | | 16,552,417 | | | | 22,660,485 | |
Net unrealized appreciation of investments | | | 45,248,831 | | | | 36,118,248 | | | | 16,404,048 | | | | 24,049,420 | |
| | | | | | | | | | | | | | | | |
Net increase in net assets resulting from operations | | | 54,748,689 | | | | 53,185,743 | | | | 31,489,479 | | | | 44,922,682 | |
| | | | | | | | | | | | | | | | |
Distributions to Shareholders: | | | | | | | | | | | | | | | | |
From net realized gain on investments | | | — | | | | — | | | | (21,312,721 | ) | | | (40,148,337 | ) |
| | | | | | | | | | | | | | | | |
Total distributions to shareholders | | | — | | | | — | | | | (21,312,721 | ) | | | (40,148,337 | ) |
| | | | | | | | | | | | | | | | |
From Capital Share Transactions: | | | | | | | | | | | | | | | | |
Proceeds from sale of shares | | | 11,063,517 | | | | 21,520,857 | | | | 14,208,603 | | | | 44,149,235 | |
Reinvestment of distributions | | | — | | | | — | | | | 20,832,879 | | | | 38,621,555 | |
Cost of shares repurchased | | | (97,351,781 | ) | | | (168,861,323 | ) | | | (163,391,112 | ) | | | (123,850,684 | ) |
| | | | | | | | | | | | | | | | |
Net decrease from capital share transactions | | | (86,288,264 | ) | | | (147,340,466 | ) | | | (128,349,630 | ) | | | (41,079,894 | ) |
| | | | | | | | | | | | | | | | |
Total decrease in net assets | | | (31,539,575 | ) | | | (94,154,723 | ) | | | (118,172,872 | ) | | | (36,305,549 | ) |
| | | | | | | | | | | | | | | | |
Net Assets: | | | | | | | | | | | | | | | | |
Beginning of year | | | 303,474,044 | | | | 397,628,767 | | | | 259,395,440 | | | | 295,700,989 | |
| | | | | | | | | | | | | | | | |
End of year | | $ | 271,934,469 | | | $ | 303,474,044 | | | $ | 141,222,568 | | | $ | 259,395,440 | |
| | | | | | | | | | | | | | | | |
End of year undistributed net investment income | | | — | | | | — | | | | — | | | | — | |
Share Transactions: | | | | | | | | | | | | | | | | |
Sale of shares | | | 298,464 | | | | 643,893 | | | | 941,852 | | | | 2,957,002 | |
Reinvested shares | | | — | | | | — | | | | 1,475,416 | | | | 2,766,703 | |
Shares repurchased | | | (2,611,430 | ) | | | (5,253,627 | ) | | | (11,144,890 | ) | | | (8,304,374 | ) |
| | | | | | | | | | | | | | | | |
Net decrease in shares | | | (2,312,966 | ) | | | (4,609,734 | ) | | | (8,727,622 | ) | | | (2,580,669 | ) |
| | | | | | | | | | | | | | | | |
The accompanying notes are an integral part of these financial statements.
19
Financial Highlights
For a share outstanding throughout each fiscal year
| | | | | | | | | | | | | | | | | | | | |
| | | For the fiscal year ended October 31, | |
Managers Fremont Micro-Cap Fund | | 2007 | | | 2006 | | | 2005 | | | 2004 | | | 2003 | |
Net Asset Value, Beginning of Year | | $ | 34.48 | | | $ | 29.65 | | | $ | 27.86 | | | $ | 28.14 | | | $ | 18.43 | |
| | | | | | | | | | | | | | | | | | | | |
Income from Investment Operations: | | | | | | | | | | | | | | | | | | | | |
Net investment loss | | | (0.37 | )4 | | | (0.26 | )4 | | | (0.38 | ) | | | (0.44 | ) | | | (0.33 | ) |
Net realized and unrealized gain on investments | | | 7.79 | 4 | | | 5.09 | 4 | | | 2.17 | | | | 0.16 | | | | 10.04 | |
| | | | | | | | | | | | | | | | | | | | |
Total from investment operations | | | 7.42 | | | | 4.83 | | | | 1.79 | | | | (0.28 | ) | | | 9.71 | |
| | | | | | | | | | | | | | | | | | | | |
Net Asset Value End of Year | | $ | 41.90 | | | $ | 34.48 | | | $ | 29.65 | | | $ | 27.86 | | | $ | 28.14 | |
| | | | | | | | | | | | | | | | | | | | |
Total Return1 | | | 21.52 | %5 | | | 16.29 | % | | | 6.42 | % | | | (1.00 | )% | | | 52.69 | % |
| | | | | | | | | | | | | | | | | | | | |
Ratio of net expenses to average net assets | | | 1.53 | %2 | | | 1.54 | %2 | | | 1.56 | %2 | | | 1.62 | % | | | 1.64 | % |
Ratio of net investment loss to average net assets1 | | | (1.01 | )% | | | (0.79 | )% | | | (1.11 | )% | | | (1.41 | )% | | | (1.47 | )% |
Portfolio turnover | | | 76 | % | | | 82 | % | | | 68 | % | | | 83 | % | | | 105 | % |
Net assets at end of year (000’s omitted) | | $ | 271,934 | | | $ | 303,474 | | | $ | 397,629 | | | $ | 490,527 | | | $ | 573,677 | |
| | | | | | | | | | | | | | | | | | | | |
| |
| | | For the fiscal year ended October 31, | |
Managers Fremont Institutional Micro-Cap Fund | | 2007 | | | 2006 | | | 2005 | | | 2004 | | | 2003 | |
Net Asset Value, Beginning of Year | | $ | 15.07 | | | $ | 14.94 | | | $ | 14.49 | | | $ | 14.52 | | | $ | 9.50 | |
Income from Investment Operations: | | | | | | | | | | | | | | | | | | | | |
Net investment loss | | | (0.13 | )4 | | | (0.09 | )4 | | | — | | | | (0.17 | ) | | | (0.13 | ) |
Net realized and unrealized gain on investments | | | 2.99 | 4 | | | 2.36 | 4 | | | 0.97 | | | | 0.14 | | | | 5.15 | |
| | | | | | | | | | | | | | | | | | | | |
Total from investment operations | | | 2.86 | | | | 2.27 | | | | 0.97 | | | | (0.03 | ) | | | 5.02 | |
| | | | | | | | | | | | | | | | | | | | |
Less Distributions to Shareholders from: | | | | | | | | | | | | | | | | | | | | |
Net investment income | | | — | | | | — | | | | (0.00 | )# | | | — | | | | — | |
Net realized gain on investments | | | (1.28 | ) | | | (2.14 | ) | | | (0.52 | ) | | | — | | | | — | |
| | | | | | | | | | | | | | | | | | | | |
Total distribution to shareholders | | | (1.28 | ) | | | (2.14 | ) | | | (0.52 | ) | | | — | | | | — | |
| | | | | | | | | | | | | | | | | | | | |
Net Asset Value End of Year | | $ | 16.65 | | | $ | 15.07 | | | $ | 14.94 | | | $ | 14.49 | | | $ | 14.52 | |
| | | | | | | | | | | | | | | | | | | | |
Total Return1 | | | 20.48 | % | | | 16.33 | % | | | 6.54 | % | | | (0.21 | )% | | | 52.84 | % |
| | | | | | | | | | | | | | | | | | | | |
Ratio of net expenses to average net assets2 | | | 1.35 | % | | | 1.35 | % | | | 1.35 | % | | | 1.30 | % | | | 1.30 | % |
Ratio of net investment loss to average net assets1 | | | (0.83 | )% | | | (0.63 | )% | | | (0.89 | )% | | | (1.09 | )% | | | (1.12 | )% |
Portfolio turnover | | | 129 | % | | | 78 | % | | | 73 | % | | | 87 | % | | | 119 | % |
Net assets at end of year (000’s omitted) | | $ | 141,223 | | | $ | 259,395 | | | $ | 295,701 | | | $ | 358,011 | | | $ | 391,662 | |
| | | | | | | | | | | | | | | | | | | | |
Ratios absent expense offsets:3 | | | | | | | | | | | | | | | | | | | | |
Ratio of total expenses to average net assets | | | 1.39 | % | | | 1.37 | % | | | 1.39 | % | | | 1.30 | % | | | 1.30 | % |
Ratio of net investment loss to average net assets | | | (0.87 | )% | | | (0.65 | )% | | | (0.93 | )% | | | (1.09 | )% | | | (1.12 | )% |
| | | | | | | | | | | | | | | | | | | | |
# | Rounds to less than $0.01 per share. |
1 | Total returns and net investment loss would have been greater had certain expenses not been reduced. |
2 | Excludes the impact of expense reimbursement and expense reductions on page 18 such as brokerage credits, but includes non-reimbursable expenses, if any, such as interest and taxes. (See Note 1(c) of “Notes to Financial Statements.”) |
3 | Ratio information assuming no reduction of Fund expenses. (See Notes to Financial Statements.) |
4 | Per share numbers have been calculated using average shares. |
5 | The Total Return is based on the Financial Statement Net Asset Values as shown above. |
20
Notes to Financial Statements
October 31, 2007
| 1. | Summary of Significant Accounting Policies |
Managers Trust I (the “Trust”) is an open-end management investment company organized as a Massachusetts business trust and registered under the Investment Company Act of 1940, as amended (the “1940 Act”). Currently, the Trust is comprised of a number of different funds, each having distinct investment management objectives, strategies, risks and policies. Included in this report are two equity funds, Managers Fremont Micro-Cap Fund (“Micro-Cap”) and Managers Fremont Institutional Micro-Cap Fund (“Institutional Micro-Cap”). The financial statements of Micro-Cap and Institutional Micro-Cap (each a “Fund” and collectively the “Funds”) are prepared in accordance with accounting principles generally accepted in the United States of America, which require management to make estimates and assumptions that affect the reported amounts of assets and liabilities and disclosure of contingent assets and liabilities at the date of the financial statements and the reported amounts of income and expenses during the reporting periods. Actual results could differ from those estimates. The following is a summary of significant accounting policies followed by the Funds in the preparation of their financial statements:
| a. | Valuation of Investments |
Equity securities traded on a domestic or international securities exchange are valued at the last quoted sale price, or, lacking any sales, at the last quoted bid price. Over-the-counter securities are valued at the NASDAQ Official Closing Price, if one is available. Lacking any sales, over-the counter securities are valued at the last quoted bid price. Under certain circumstances, the value of each Fund’s investment may be based on an evaluation of its fair value, pursuant to procedures established by and under the general supervision of the Board of Trustees of the Trust. A Fund may use the fair value of a portfolio security to calculate its NAV when, for example, (1) market quotations are not readily available because a portfolio security is not traded in a public market or the principal market in which the security trades is closed, (2) trading in a portfolio security is suspended and has not resumed before the Fund calculates its NAV, (3) a significant event affecting the value of a portfolio security is determined to have occurred between the time of the market quotation provided for a portfolio security and the time as of which the Fund calculates its NAV, (4) a security’s price has remained unchanged over a period of time (often referred to as a “stale price”), or (5) Managers Investment Group LLC (the “Investment Manager”) determines that a market quotation is inaccurate. The Investment Manager monitors intervening events that may affect the value of securities held in a Fund’s portfolio and, in accordance with procedures adopted by the Fund’s Trustees, will adjust the prices of securities traded in foreign markets, as appropriate, to reflect the impact of events occurring subsequent to the close of such markets but prior to the time each Fund’s NAV is calculated. Fixed income securities are valued based on valuations furnished by independent pricing services that utilize matrix systems, which reflect such factors as security prices, yields, maturities, and ratings, and are supplemented by dealer and exchange quotations. Futures contracts for which market quotations are readily available are valued at the settlement price as of the close of the futures exchange. Short-term investments having a remaining maturity of 60 days or less are valued at amortized cost, which approximates market value. Investments in other regulated investment companies are valued at their end of day net asset value per share. Investments in certain mortgage-backed, stripped mortgage-backed, preferred stocks, convertible securities, derivatives and other debt securities not traded on an organized securities market are valued on the basis of valuations provided by dealers or by a pricing service which uses information with respect to transactions in such securities and various relationships between securities and yield to maturity in determining value. Securities (including derivatives) for which market quotations are not readily available are valued at fair value, as determined in good faith, and pursuant to procedures adopted by the Board of Trustees of the Trust. The values assigned to fair value investments are based on available information and do not necessarily represent amounts that might ultimately be realized, since such amounts depend on future developments inherent in long-term investments. Further, because of the inherent uncertainty of valuation, those estimated values may differ significantly from the values that would have been used had a ready market for the investments existed, and the differences could be material.
Security transactions are accounted for as of the trade date. Realized gains and losses on securities sold are determined on the basis of identified cost.
| c. | Investment Income and Expenses |
Dividend income is recorded on the ex-dividend date except certain dividends from foreign securities where the ex-dividend date may have passed. These dividends are recorded as soon as the Trust is informed of the ex-dividend date. Dividend income on foreign securities is recorded net of any withholding tax. Interest income, which includes amortization of premium and accretion of discount on debt securities, is accrued as earned. Non-cash dividends included in dividend income, if any, are reported at the fair market value of the securities received. Other income and expenses are recorded on an accrual basis. Expenses that cannot be directly attributed to a fund are apportioned among the Funds in the Trust and in some cases other affiliated funds based upon their relative average net assets or number of shareholders.
The Funds may participate in a directed brokerage program whereby certain portfolio trades are directed to various brokers who pay a portion of the Funds expenses. For the fiscal year ended October 31, 2007, no trades were directed under this program.
The Funds have a “balance credit” arrangement with The Bank of New York (“BNY”), the Funds’ custodian, whereby each Fund is credited with an interest factor equal to 0.75% below the effective 90-day T-Bill rate for account balances left uninvested overnight. These credits serve to reduce custody expenses that would otherwise be charged to each Fund. For the fiscal year ended October 31, 2007, the custodian expense was reduced as follows: Micro-Cap - $279 and Institutional Micro-Cap - $103. Overdrafts will cause a reduction of any earnings credits, computed at 2% above the effective Federal Funds rate on the day of the overdraft. For the fiscal year ended October 31, 2007, neither Fund incurred any overdraft charges.
The Trust also has a balance credit arrangement with its Transfer Agent, PFPC, Inc., whereby earnings credits are used to offset banking charges. For the fiscal year ended October 31, 2007, the transfer agent expense was reduced as follows: Micro-Cap - $2,347 and Institutional Micro-Cap - $1,329.
21
Managers Fremont Funds
Notes to Financial Statements (continued)
The Investment Manager, an independently-managed subsidiary of Affiliated Managers Group, Inc. (“AMG”) and the investment manager for the Funds, has contractually agreed, through at least March 1, 2008, to waive its fees and pay or reimburse expenses of Institutional Micro-Cap to the extent that the total annual operating expenses (exclusive of taxes, interest, brokerage costs, acquired fund fees and expenses, and extraordinary expenses) of the Fund exceed 1.35% of the Fund’s average daily net assets. Prior to March 1, 2007, the Micro Cap Fund’s annual operating expenses were limited to 1.98% of the Fund’s average daily net assets. No reimbursements were paid by the Investment Manager under this expense limitation agreement. Since March 1, 2007, the Micro Cap Fund has operated without an expense limitation agreement.
Effective January 15, 2005, the Institutional Micro-Cap Fund is obligated to repay the Investment Manager such amounts waived, paid or reimbursed in future years provided that the repayment occurs within three (3) years after the waiver or reimbursement and that such repayment would not cause the Fund’s expenses in any such year to exceed the previously stated contractual expense limitation percentages of the Fund’s average daily net assets. For the fiscal year ended October 31, 2007, the cumulative amount of expense reimbursement by the Investment Manager subject to repayment by the Institutional Micro-Cap Fund equaled $138,064.
| d. | Dividends and Distributions |
Dividends resulting from net investment income and distributions of capital gains, if any, normally will be declared and paid annually in December and when required for Federal excise tax purposes. Distributions are recorded on the ex-dividend date. Income and capital gain distributions are determined in accordance with Federal income tax regulations, which may differ from generally accepted accounting principles. These differences are primarily due to differing treatments for losses deferred due to wash sales, equalization accounting for tax purposes, foreign currency and market discount transactions. Permanent book and tax basis differences, if any, relating to shareholder distributions will result in reclassifications to paid-in capital. The tax character of distributions paid during fiscal years ended 2007 and 2006 for the Institutional Micro-Cap Fund was as follows:
| | | | | | |
| | | 2007 | | 2006 |
Distributions paid from: | | | | | | |
Ordinary income | | | — | | | — |
Short-term capital gains | | $ | 742,109 | | | — |
Long-term capital gains | | | 20,570,612 | | $ | 40,148,337 |
| | | | | | |
| | $ | 21,312,721 | | $ | 40,148,337 |
| | | | | | |
As of October 31, 2007, the components of distributable earnings (excluding unrealized appreciation/depreciation) on a tax basis consisted of:
| | | |
| | | 2007 |
Capital loss carryforward | | | — |
Undistributed ordinary income | | | — |
Undistributed short-term capital gains | | $ | 7,769,291 |
Undistributed long-term capital gains | | | 5,302,591 |
The Micro-Cap Fund paid no distributions during 2007 or 2006.
Each Fund intends to comply with the requirements under Subchapter M of the Internal Revenue Code of 1986, as amended, to distribute substantially all of its taxable income and gains to its shareholders and to meet certain diversification and income requirements with respect to investment companies. Therefore, no provision for Federal income or excise tax is included in the accompanying financial statements.
Additionally, based on the Fund’s understanding of the tax rules and rates related to income, gains and transactions for the foreign jurisdictions in which it invests, the Fund will provide for foreign taxes, and where appropriate, deferred foreign taxes.
| f. | Capital Loss Carryovers |
As of October 31, 2007, the Micro-Cap Fund had utilized capital losses during the year of $10,522,871 and had an accumulated net realized capital loss carryover of $3,389,595. This amount may be used to offset realized capital gains, if any, through October 31, 2010. The Institutional Micro-Cap Fund had no accumulated net realized capital loss carryover from securities transactions for Federal income tax purposes.
The Trust’s Declaration of Trust authorizes for each series the issuance of an unlimited number of shares of beneficial interest, without par value. Each Fund records sales and repurchases of its capital stock on the trade date. Dividends and distributions to shareholders are recorded on the ex-dividend date.
At October 31, 2007, certain unaffiliated shareholders, specifically omnibus accounts, individually held greater than 10% of the outstanding shares of the Funds as follows: Micro-Cap - 2 own collectively 50% and Institutional Micro-Cap - 2 own collectively 58%. Transactions by these shareholders may have a material impact on their respective Fund.
| 2. | Agreements and Transactions with Affiliates |
The Trust has entered into an Investment Management Agreement under which the Investment Manager provides or oversees investment management services to the Funds. The Investment Manager selects subadvisors for each Fund (subject to Trustee approval), allocates assets among subadvisors and monitors the subadvisors’ investment programs and results. Each Fund’s investment portfolio is managed by portfolio managers who serve pursuant to subadvisory agreements with the Investment Manager.
Investment management fees are paid directly by each Fund to the Investment Manager based on average daily net assets. The annual investment management fee rate, as a percentage of average daily net assets for the fiscal year ended October 31, 2007 was 1.00% for both Micro-Cap and Institutional Micro-Cap.
The Trust has entered into an Administration and Shareholder Servicing Agreement under which the Investment Manager serves as each Fund’s administrator (the “Administrator”) and is responsible for all aspects of managing the Funds’ operations, including administration and shareholder services to each Fund, its shareholders, and certain institutions, such as bank trust departments, broker-dealers and
22
Managers Fremont Funds
Notes to Financial Statements (continued)
registered investment advisers, that advise or act as an intermediary with the Funds’ shareholders. For its services, the Administrator is paid a fee at a rate of 0.25% of average net assets per annum.
Prior to July 1, 2007, the aggregate annual retainer paid to each Independent Trustee was $55,000, plus $4,000 or $2,000 for each regular or special meeting attended, respectively. Effective July 1, 2007, the aggregate annual retainer paid to each Independent Trustee is $65,000, plus $4,000 or $2,500 for each regular or special meeting attended, respectively. The Trustees’ fees and expenses are allocated amongst all of the Funds for which the Investment Manager serves as the advisor (the “Managers Funds”) based on the relative net assets of such Funds. The Independent Chairman of the Trusts receives an additional payment of $15,000 per year. (Prior to July 1, 2007, the Independent Chairman received an additional payment of $10,000 per year). The Chairman of the Audit Committee receives an additional payment of $5,000 per year. (Prior to July 1, 2007, the Chairman of the Audit Committee received an additional $2,000 per year). The “Trustee fees and expenses” shown in the financial statements represents each Fund’s allocated portion of the total fees and expenses paid by the Managers Funds.
The Funds are distributed by Managers Distributors, Inc. (the “Distributor”) a wholly-owned subsidiary of the Investment Manager. The Distributor serves as the principal underwriter for each Fund. The Distributor is a registered broker-dealer and member of the Financial Industry Regulatory Authority (“FINRA”). Shares of each Fund will be continuously offered and will be sold by brokers, dealers or other financial intermediaries who have executed selling agreements with the Distributor. The Distributor bears all the expenses of providing services pursuant to the Underwriting Agreement, including the payment of the expenses relating to the distribution of Prospectuses for sales purposes and any advertising or sales literature. Certain Trustees and Officers of the Funds are Officers and/or Directors of the Investment Manager, AMG and/or the Distributor.
| 3. | Purchases and Sales of Securities |
Purchases and sales of securities, excluding short-term securities, for the fiscal year ended October 31, 2007, for Micro-Cap were $199,188,195 and $264,907,556; and for Institutional Micro-Cap were $206,338,098 and $337,548,919, respectively. There were no purchases or sales of U.S. Government securities.
| 4. | Portfolio Securities Loaned |
The Funds may participate in a securities lending program offered by BNY providing for the lending of equities, corporate bonds and government securities to qualified brokers. Collateral on all securities loaned is accepted in cash and/or government securities. Collateral is maintained at a minimum level of 102% of the market value, plus interest, if applicable, of investments on loan. Collateral received in the form of cash is invested temporarily in institutional money market funds or other short-term investments by BNY. Securities lending fees include earnings of such temporary cash investments, plus or minus any rebate to a borrower. These earnings (after rebate) are then divided between BNY, as a fee for its services under the program, and the Fund according to agreed-upon rates.
| 5. | Commitments and Contingencies |
In the normal course of business, the Funds may enter into contracts and agreements that contain a variety of representations and warranties, which provide general indemnifications. The maximum exposure to the Funds under these arrangements is unknown, as this would involve future claims that may be against the Funds that have not yet occurred. However, based on experience, each Fund expects the risk of loss to be remote.
23
Managers Fremont Funds
Notes to Financial Statements (continued)
| 6. | Transactions with Affiliated Companies |
An affiliated company is a company that is directly or indirectly controlled by a related party or a company in which a fund has ownership of at least 5% of the voting securities. Transactions during the fiscal year ended October 31, 2007, with companies which are or were affiliates of the Micro-Cap Fund are as follows:
SUMMARY OF TRANSACTIONS WITH AFFILIATED COMPANIES:
| | | | | | | | | | | | | | | | | |
Affiliate | | Purchase
Cost | | Sales
Cost | | Dividend
Income | | Market
Value | | Gains/
(Losses) | | | % Ownership
of Affiliate | |
Northern Technologies International Corp. | | $ | 191,276 | | $ | 279,265 | | — | | $ | 2,785,894 | | ($288 | ) | | 6.7 | % |
| 7. | New Accounting Pronouncements |
In June 2006, the Financial Accounting Standards Board (“FASB”) issued Interpretation No. 48, “Accounting for Uncertainty in Income Taxes - an Interpretation of FASB Statement No. 109 (“FIN 48”).” FIN 48 applies to all registered investment companies and establishes the minimum threshold for recognizing, and a system for measuring, the benefits of tax-return positions in the financial statements. FIN 48 is effective for fiscal years beginning after December 15, 2006. Management has analyzed the Funds’ tax positions taken on federal income tax returns for all open tax years (tax years ended October 31, 2004-2007) and has concluded that as of October 31, 2007, no provision for income tax would be required in the funds’ financial statements. Additionally, Fund Management is not aware of any events that are reasonably possible to occur in the next twelve months that would result in the amounts of any unrecognized tax benefits significantly increasing or decreasing for the Funds.
In addition, in September 2006, Statement of Financial Accounting Standards No. 157, Fair Value Measurements (“SFAS 157”), was issued and is effective for fiscal years beginning after November 15, 2007. SFAS 157 defines fair value, establishes a framework for measuring fair value and expands disclosures about fair value measurements. Management is currently evaluating the impact, if any, the adoption of SFAS 157 will have on the Funds’ financial statements.
At a meeting held on December 5-6, 2007, the Trust’s Board of Trustees approved the termination of the subadvisory agreements with respect to the Micro-Cap and Institutional Micro-Cap between Kern Capital Management LLC (“Kern”) and the Funds’ Investment Manager. The Trust’s Board of Trustees also approved the appointment of Next Century Growth Investors LLC (“Next Century”), Lord, Abbett & Co., LLC (“Lord Abbett”), WEDGE Capital Management L.L.P. (“WEDGE Capital”), and OFI Institutional Asset Management, Inc. (“OFI”) as new subadvisors (the “Subadvisors”) to each of the Funds effective December 10, 2007. Therefore, effective December 10, 2007, Kern will no longer be subadvisor to the Funds, and each Fund’s portfolio will be subadvised by Next Century, Lord Abbett, WEDGE Capital, and OFI, each managing a portion of each Fund’s portfolio previously managed entirely by Kern. Next Century will manage its portion of each Fund focusing on micro-cap and small-cap growth investments. Lord Abbett will manage its portion of each Fund focusing on micro-cap growth investments. WEDGE Capital will manage its portion of each Fund focusing on micro-cap value investments, and OFI will manage its portion focusing on micro-cap core investments.
In addition, effective January 1, 2008, the Investment Manager has contractually agreed through March 1, 2009, to waive its fees and pay or reimburse expenses of Micro-Cap to the extent that the total annual operating expenses (exclusive of taxes, interest, brokerage costs, acquired fund fees and extraordinary expenses) of the Fund exceed 1.56% of the Fund’s average daily net assets.
24
Managers Fremont Funds
Notes to Financial Statements (continued)
Tax Information (unaudited)
Each Fund hereby designates the maximum amount allowable of its net taxable income as qualified dividends as provided in the Jobs and Growth Tax Relief Reconciliation Act of 2003. The 2007 Form 1099-DIV you receive for each Fund will show the tax status of all distributions paid to you during the year.
Pursuant to section 852 of the Internal Revenue Code, Managers Fremont Micro-Cap and Institutional Micro-Cap designate $0, and $5,312,443, respectively, as long-term capital gains for the taxable year ended October 31, 2007.
25
Report of Independent Registered Public Accounting Firm
To the Board of Trustees of Managers Trust I and the Shareholders of Managers Fremont Micro-Cap Fund and Managers Fremont Institutional Micro-Cap Fund:
In our opinion, the accompanying statements of assets and liabilities, including the schedules of portfolio investments and the related statements of operations and of changes in net assets and the financial highlights present fairly, in all material respects, the financial position of Managers Fremont Micro-Cap Fund and Managers Fremont Institutional Micro-Cap Fund, (two of the series constituting Managers Trust I, hereafter referred to as the “Funds”), at October 31, 2007, the results of each of their operations for the year then ended, the changes in each of their net assets for each of the two years in the period then ended, and the financial highlights for each of the five years in the period then ended, in conformity with accounting principles generally accepted in the United States of America. These financial statements and financial highlights (hereafter referred to as “financial statements”) are the responsibility of the Funds’ management; our responsibility is to express an opinion on these financial statements based on our audits. We conducted our audits of these financial statements in accordance with the standards of the Public Company Accounting Oversight Board (United States). Those standards require that we plan and perform the audit to obtain reasonable assurance about whether the financial statements are free of material misstatement. An audit includes examining, on a test basis, evidence supporting the amounts and disclosures in the financial statements, assessing the accounting principles used and significant estimates made by management, and evaluating the overall financial statement presentation. We believe that our audits, which included confirmation of securities at October 31, 2007 by correspondence with the custodian, provide a reasonable basis for our opinion.
PricewaterhouseCoopers LLP
Philadelphia, Pennsylvania
December 21, 2007
26
Trustees and Officers
The Trustees and Officers of the Trust, their business addresses, principal occupations for the past five years and dates of birth are listed below. The Trustees provide broad supervision over the affairs of the Trust and the Funds. The Trustees are experienced executives who meet periodically throughout the year to oversee the Funds’ activities, review contractual arrangements with companies that provide services to the Funds, and review the Funds’ performance. Unless otherwise noted, the address of each Trustee or Officer is the address of the Trust: 800 Connecticut Avenue, Norwalk, Connecticut 06854.
There is no stated term of office for Trustees. Trustees serve until their resignation, retirement or removal in accordance with the Trust’s organizational documents and policies adopted by the Board from time to time. The Chairman of the Trustees, President, Treasurer and Secretary of the Trust are elected by the Trustees annually. Other officers hold office at the pleasure of the Trustees.
Independent Trustees
The following Trustees are not “interested persons” of the Trust within the meaning of the 1940 Act:
| | |
Name, Date of Birth, Number of Funds Overseen in Fund Complex* | | Principal Occupation(s) During Past 5 Years and Other Directorships Held by Trustee |
Jack W. Aber, 9/9/37 • Trustee since 2000 • Oversees 31 Funds in Fund Complex | | Professor of Finance, Boston University School of Management (1972-Present); Trustee of Appleton Growth Fund (1 portfolio); Trustee of Third Avenue Trust (4 portfolios); Trustee of Third Avenue Variable Trust (1 portfolio). |
| |
William E. Chapman, II, 9/23/41 • Independent Chairman • Trustee since 2000 • Oversees 31 Funds in Fund Complex | | President and Owner, Longboat Retirement Planning Solutions (1998-Present); Hewitt Associates, LLC (part time) (provider of Retirement and Investment Education Seminars); Trustee of Bowdoin College (2002-Present); Trustee of Third Avenue Trust (4 portfolios); Trustee of Third Avenue Variable Trust (1 portfolio). |
| |
Edward J. Kaier, 9/23/45 • Trustee since 2000 • Oversees 31 Funds in Fund Complex | | Attorney at Law and Partner, Teeters Harvey Kilboy & Kaier LLP (2007-Present); Attorney at Law and Partner, Hepburn Willcox Hamilton & Putnam, LLP (1977-2007); Trustee of Third Avenue Trust (4 portfolios); Trustee of Third Avenue Variable Trust (1 portfolio). |
| |
Steven J. Paggioli, 4/3/50 • Trustee since 2000 • Oversees 31 Funds in Fund Complex | | Consultant (2001-Present); Formerly Executive Vice President and Director, The Wadsworth Group (1986-2001); Executive Vice President, Secretary and Director, Investment Company Administration, LLC (1990-2001); Vice President, Secretary and Director, First Fund Distributors, Inc. (1991-2001); Trustee, Professionally Managed Portfolios (22 portfolios); Advisory Board Member, Sustainable Growth Advisors, LP. |
| |
Eric Rakowski, 6/5/58 • Trustee since 2000 • Oversees 31 Funds in Fund Complex | | Professor, University of California at Berkeley School of Law (1990-Present); Trustee of Third Avenue Trust (4 portfolios); Trustee of Third Avenue Variable Trust (1 portfolio). |
| |
Thomas R. Schneeweis, 5/10/47 • Trustee since 2000 • Oversees 31 Funds in Fund Complex | | Professor of Finance, University of Massachusetts (1977-Present); Director, CISDM at the University of Massachusetts, (1996-Present); President, Alternative Investment Analytics, LLC, (formerly Schneeweis Partners, LLC) (2001-Present); Partner, White Bear Partners, LLC (2007-Present); Partner, Schneeweis Capital Management, LLC (2007-Present); Partner, Schneeweis Associates, LLC (2007-Present); Partner, Northampton Capital Management, LLC (2004-Present); Partner, TRS Associates (2007-Present). |
| * | The Fund Complex consists of Managers AMG Funds, The Managers Funds, Managers Trust I and Managers Trust II. |
Interested Trustee
The following Trustee is an “interested person” of the Trust within the meaning of the 1940 Act by virtue of his positions with, and interest in securities of, Affiliated Managers Group, Inc.
| | |
Name, Date of Birth, Number of Funds Overseen in Fund Complex* | | Principal Occupation(s) During Past 5 Years and Other Directorships Held by Trustee |
William J. Nutt, 3/30/45 • Trustee since 2005 • President since 2007 • Oversees 31 Funds in Fund Complex | | Chairman and Founder of Affiliated Managers Group, Inc., (1993-Present); Chief Executive Officer of Affiliated Managers Group, Inc. (1993-2004); Director, Affiliated Managers Group, Inc. (1993-Present); President of Affiliated Managers Group, Inc. (1993-1999); President and Chief Operating Officer, The Boston Company (1989-1993); Senior Executive Vice President, The Boston Company (1982-1989). |
| |
| Officers | | |
| |
Name, Date of Birth, Position(s) Held with Fund and Length of Time Served | | Principal Occupation(s) During Past 5 Years |
Christine C. Carsman, 4/2/52 • Secretary since 2004 | | Senior Vice President and Chief Regulatory Counsel, Affiliated Managers Group, Inc. (2004-Present); Secretary, The Managers Funds, Managers AMG Funds and Managers Trust II (2004-Present); Senior Counsel, Vice President and Director of Operational Risk Management and Compliance, Wellington Management Company, LLP (1995-2004); Deputy General Counsel, The Boston Company, Inc. (1993-1995); Associate General Counsel, The Boston Company Advisors, Inc. (1991-1993); Associate, Sullivan & Worcester LLP (1987-1991). |
| |
Donald S. Rumery, 5/29/58 • Chief Financial Officer since 2007 • Treasurer since 2000 | | Senior Vice President, Managers Investment Group LLC (2005-Present); Director, Finance and Planning, The Managers Funds LLC, (1994-2004); Treasurer and Chief Financial Officer, Managers Distributors, Inc. (2000-Present); Treasurer, The Managers Funds (1995-Present); Treasurer, Managers AMG Funds (1999-Present); Treasurer, Managers Trust II (2000-Present); Secretary, Managers Trust I and Managers Trust II (2000-2004) and Secretary, The Managers Funds (1997-2004); Chief Financial Officer, The Managers Funds, Managers Trust II and Managers AMG Funds (2007-Present). |
| |
Keitha L. Kinne, 5/16/58 • Chief Operating Officer since 2007 | | Managing Partner and Chief Operating Officer, Managers Investment Group LLC (2007-Present); Chief Operating Officer, The Managers Funds, Managers AMG Funds and Managers Trust II (2007-Present); Managing Director, Legg Mason & Co., LLC (2006-2007); Managing Director, Citigroup Asset Management (2004-2006); Senior Vice President, Prudential Investments (1999-2004). |
27
Annual Renewal of Investment Advisory Agreements
MANAGERS FREMONT MICRO-CAP FUND
On June 8, 2007, the Board of Trustees, including a majority of the Trustees who are not “interested persons” of the Trust (the “Independent Trustees”), approved the Investment Management Agreement with the Investment Manager for the Managers Fremont Micro-Cap Fund (the “Fund”) and the Subadvisory Agreement for the Subadvisor. The Independent Trustees were separately represented by independent counsel in connection with their consideration of the approval of these agreements. In considering the Investment Management and Subadvisory Agreements, the Trustees reviewed a variety of materials relating to the Fund, the Investment Manager and the Subadvisor, including comparative performance, fee and expense information for an appropriate peer group of similar mutual funds (the “Peer Group”), performance information for the relevant benchmark index (the “Fund Benchmark”) and other information regarding the nature, extent and quality of services provided by the Investment Manager and the Subadvisor under their respective agreements. The Trustees also took into account performance, fee and expense information regarding the Fund provided to them on a quarterly basis throughout the year. Prior to voting, the Independent Trustees: (a) reviewed the foregoing information with their independent legal counsel and with management; (b) received materials from their independent legal counsel discussing the legal standards applicable to their consideration of the Investment Management Agreement and the Subadvisory Agreement; and (c) met with their independent legal counsel in private sessions at which no representatives of management were present.
Nature, extent and quality of services. In considering the nature, extent and quality of the services provided by the Investment Manager, the Trustees reviewed information relating to the Investment Manager’s operations and personnel. Among other things, the Investment Manager provided financial information, biographical information on its supervisory and professional staff and descriptions of its organizational and management structure. The Trustees also took into account information provided periodically throughout the previous year by the Investment Manager relating to the performance of its duties with respect to the Fund and the Trustees’ familiarity with the Investment Manager’s management through Board meetings, discussions and reports. In the course of their deliberations regarding the Investment Management Agreement, the Trustees evaluated, among other things: (a) the quality of the search, selection and monitoring services performed by the Investment Manager in overseeing the portfolio management responsibilities of the Subadvisor; (b) the Investment Manager’s ability to supervise the Fund’s other service providers; and (c) the Investment Manager’s compliance programs. The Trustees also took into account the financial condition of the Investment Manager with respect to its ability to provide the services required under the Investment Management Agreement and to maintain contractual expense limitations for the Fund.
The Trustees also reviewed information relating to the Subadvisor’s operations and personnel and the investment philosophy, strategies and techniques (the “Investment Strategy”) used in managing the Fund. Among other things, the Trustees reviewed biographical information on portfolio management and other professional staff, information regarding the Subadvisor’s organizational and management structure and the Subadvisor’s brokerage policies and practices. The Trustees considered specific information provided regarding the experience of the individuals at the Subadvisor with portfolio management responsibility for the Fund, including the information set forth in the Fund’s prospectus and statement of additional information. In the course of their deliberations, the Trustees evaluated, among other things: (a) the services rendered by the Subadvisor in the past; (b) the qualifications and experience of the Subadvisor’s personnel; and (c) the Subadvisor’s compliance programs. The Trustees also took into account the financial condition of the Subadvisor with respect to its ability to provide the services required under the Subadvisory Agreement.
Performance. Among other information relating to the Fund’s performance, the Trustees noted that the Fund’s performance for the 1-year, 3-year, 5-year and 10-year periods ended March 31, 2007 was above, below, below and above, respectively, the median performance of the Peer Group and the performance of the Fund Benchmark, which is the Russell 2000® Growth Index. The Trustees noted the longer-term performance of the Fund. They further noted management’s discussion of the Fund’s performance. The Trustees concluded that the Fund’s performance has been satisfactory in light of all factors considered.
As noted above, the Board considered the Fund’s performance during relevant time periods as compared to the Fund’s Peer Group and noted that the Board reviews on a quarterly basis detailed information about the Fund’s performance results, portfolio composition and Investment Strategies. The Board noted the Investment Manager’s expertise and resources in monitoring the performance, investment style and risk adjusted performance of the Subadvisor. The Board also noted the Subadvisor’s performance record with respect to the Fund. The Board was mindful of the Investment Manager’s focus on the Subadvisor’s performance with respect to the Fund and the explanations of management regarding the factors that contributed to the performance of the Fund.
Advisory Fees and Profitability. In considering the reasonableness of the advisory fee charged by the Investment Manager for managing the Fund, the Trustees noted that the Investment Manager, and not the Fund, is responsible for paying the fees charged by the Fund’s Subadvisor and, therefore, that the fees paid to the Investment Manager cover the cost of providing portfolio management services as well as the cost of providing search, selection and monitoring services in operating a “manager-of-managers” complex of mutual funds. The Trustees concluded that, in light of the additional high quality supervisory services provided by the Investment Manager and the fact that the subadvisory fees are paid out of the advisory fee, the advisory fee payable by the Fund to the Investment Manager can reasonably be expected to exceed the median advisory fee for the Peer Group, which consists mostly of funds that do not operate with a manager-of-managers structure.
In considering the reasonableness of the advisory fee payable to the Investment Manager, the Trustees also reviewed information provided by the Investment Manager setting forth all revenues and other benefits, both direct and indirect, received by the Investment Manager and its affiliates attributable to managing the Fund and all the mutual funds in the Managers Family of Funds, the cost of providing such services and the resulting profitability to the Investment Manager and its affiliates from these relationships. The Trustees also noted the current and potential asset levels of the
28
Annual Renewal of Investment Advisory Agreements (continued)
Fund. In this regard, the Trustees noted that, unlike a mutual fund that is managed by a single investment adviser, the Fund operates in a manager-of-managers structure and, as the Fund grows in size, it is common practice for the Investment Manager to recommend the selection of an additional Subadvisor to manage a portion of the Fund’s portfolio. The Trustees also noted that the subadvisory fees are paid by the Investment Manager out of its advisory fee. The Trustees further noted that, because of this practice, the Investment Manager’s oversight and supervisory responsibilities with respect to the Fund can be expected to increase with the size of the Fund. Based on the foregoing, the Trustees concluded that the profitability to the Investment Manager is reasonable and that the Investment Manager is not realizing material benefits from economies of scale that would warrant adjustments to the advisory fees for the Fund at this time. With respect to economies of scale, the Trustees also noted that as the Fund’s assets increase over time, the Fund may realize other economies of scale to the extent that the increase in assets is proportionally greater than the increase in certain other expenses.
The Trustees noted that the Fund’s advisory fee and total expenses (net of applicable expense waivers/reimbursements) as of October 31, 2006 were higher and lower, respectively, than the average for the Peer Group. The Trustees concluded that, in light of the nature, extent and quality of the services provided by the Investment Manager and the Subadvisor, the Fund’s performance, and the considerations noted above with respect to the Subadvisor and the Investment Manager, the Fund’s advisory fees are reasonable.
Subadvisory Fees and Profitability. In considering the reasonableness of the fee payable by the Investment Manager to the Subadvisor, the Trustees relied on the ability of the Investment Manager to negotiate the terms of the Subadvisory Agreement at arm’s length as part of the manager-of-managers structure, noting that the Subadvisor is not affiliated with the Investment Manager. In addition, the Trustees noted that the subadvisory fees are paid by the Investment Manager out of its advisory fee. Accordingly, the cost of services to be provided by the Subadvisor and the profitability to the Subadvisor of its relationship with the Fund were not material factors in the Trustees’ deliberations. For similar reasons, and based on the current size of the portion of the Fund managed by the Subadvisor, the Trustees concluded that any economies of scale being realized by the Subadvisor was not a material factor in the Trustees’ deliberations at this time.
* * * *
After consideration of the foregoing, the Trustees also reached the following conclusions regarding the Investment Management Agreement and the Subadvisory Agreement, in addition to those conclusions discussed above: (a) the Investment Manager and the Subadvisor have demonstrated that they possess the capability and resources to perform the duties required of them under the Investment Management Agreement and the Subadvisory Agreement; (b) the Subadvisor’s Investment Strategy is appropriate for pursuing the Fund’s investment objectives; (c) the Subadvisor is reasonably likely to execute its Investment Strategy consistently over time; and (d) the Investment Manager and the Subadvisor maintain appropriate compliance programs.
Based on all of the above-mentioned factors and related conclusions, with no single factor or conclusion being determinative and with each Trustee not necessarily attributing the same weight to each factor, the Trustees concluded that approval of the Investment Management Agreement and the Subadvisory Agreement would be in the interests of the Fund and its shareholders. Accordingly, on June 8, 2007, the Trustees, including a majority of the Independent Trustees, voted to approve the Investment Management Agreement and the Subadvisory Agreement for the Fund’s Subadvisor.
MANAGERS FREMONT INSTITUTIONAL MICRO-CAP FUND
On June 8, 2007, the Board of Trustees, including a majority of the Trustees who are not “interested persons” of the Trust (the “Independent Trustees”), approved the Investment Management Agreement with the Investment Manager for the Managers Fremont Institutional Micro-Cap Fund (the “Fund”) and the Subadvisory Agreement for the Subadvisor. The Independent Trustees were separately represented by independent counsel in connection with their consideration of the approval of these agreements. In considering the Investment Management and Subadvisory Agreements, the Trustees reviewed a variety of materials relating to the Fund, the Investment Manager and the Subadvisor, including comparative performance, fee and expense information for an appropriate peer group of similar mutual funds (the “Peer Group”), performance information for the relevant benchmark index (the “Fund Benchmark”) and other information regarding the nature, extent and quality of services provided by the Investment Manager and the Subadvisor under their respective agreements. The Trustees also took into account performance, fee and expense information regarding the Fund provided to them on a quarterly basis throughout the year. Prior to voting, the Independent Trustees: (a) reviewed the foregoing information with their independent legal counsel and with management; (b) received materials from their independent legal counsel discussing the legal standards applicable to their consideration of the Investment Management Agreement and the Subadvisory Agreement; and (c) met with their independent legal counsel in private sessions at which no representatives of management were present.
Nature, extent and quality of services. In considering the nature, extent and quality of the services provided by the Investment Manager, the Trustees reviewed information relating to the Investment Manager’s operations and personnel. Among other things, the Investment Manager provided financial information, biographical information on its supervisory and professional staff and descriptions of its organizational and management structure. The Trustees also took into account information provided periodically throughout the previous year by the Investment Manager relating to the performance of its duties with respect to the Fund and the Trustees’ familiarity with the Investment Manager’s management through Board meetings, discussions and reports. In the course of their deliberations regarding the Investment Management Agreement, the Trustees evaluated, among other things: (a) the quality of the search, selection and monitoring services performed by the Investment Manager in overseeing the portfolio management responsibilities of the Subadvisor; (b) the Investment Manager’s ability to supervise the Fund’s other service providers; and (c) the Investment Manager’s compliance programs. The Trustees also took into account the financial condition of the Investment Manager with respect to its ability to provide the services required under the Investment Management Agreement and to maintain contractual expense limitations for the Fund.
29
Annual Renewal of Investment Advisory Agreements (continued)
The Trustees also reviewed information relating to the Subadvisor’s operations and personnel and the investment philosophy, strategies and techniques (the “Investment Strategy”) used in managing the Fund. Among other things, the Trustees reviewed biographical information on portfolio management and other professional staff, information regarding the Subadvisor’s organizational and management structure and the Subadvisor’s brokerage policies and practices. The Trustees considered specific information provided regarding the experience of the individuals at the Subadvisor with portfolio management responsibility for the Fund, including the information set forth in the Fund’s prospectus and statement of additional information. In the course of their deliberations, the Trustees evaluated, among other things: (a) the services rendered by the Subadvisor in the past; (b) the qualifications and experience of the Subadvisor’s personnel; and (c) the Subadvisor’s compliance programs. The Trustees also took into account the financial condition of the Subadvisor with respect to its ability to provide the services required under the Subadvisory Agreement.
Performance. Among other information relating to the Fund’s performance, the Trustees noted that the Fund’s performance for the 1-year, 3-year, 5-year and 10-year periods ended March 31, 2007 was below, below, below and above, respectively, the median performance of the Peer Group and the performance of the Fund Benchmark, which is the Russell 2000® Growth Index. The Trustees noted the 10-year performance of the Fund. They further noted management’s discussion of the Fund’s performance. The Trustees concluded that the Fund’s performance has been satisfactory in light of all factors considered.
As noted above, the Board considered the Fund’s performance during relevant time periods as compared to the Fund’s Peer Group and noted that the Board reviews on a quarterly basis detailed information about the Fund’s performance results, portfolio composition and Investment Strategies. The Board noted the Investment Manager’s expertise and resources in monitoring the performance, investment style and risk adjusted performance of the Subadvisor. The Board also noted the Subadvisor’s performance record with respect to the Fund. The Board was mindful of the Investment Manager’s focus on the Subadvisor’s performance with respect to the Fund and the explanations of management regarding the factors that contributed to the performance of the Fund.
Advisory Fees and Profitability. In considering the reasonableness of the advisory fee charged by the Investment Manager for managing the Fund, the Trustees noted that the Investment Manager, and not the Fund, is responsible for paying the fees charged by the Fund’s Subadvisor and, therefore, that the fees paid to the Investment Manager cover the cost of providing portfolio management services as well as the cost of providing search, selection and monitoring services in operating a “manager-of-managers” complex of mutual funds. The Trustees concluded that, in light of the additional high quality supervisory services provided by the Investment Manager and the fact that the subadvisory fees are paid out of the advisory fee, the advisory fee payable by the Fund to the Investment Manager can reasonably be expected to exceed the median advisory fee for the Peer Group, which consists mostly of funds that do not operate with a manager-of-managers structure.
In considering the reasonableness of the advisory fee payable to the Investment Manager, the Trustees also reviewed information provided by the Investment Manager setting forth all revenues and other benefits, both direct and indirect, received by the Investment Manager and its affiliates attributable to managing the Fund and all the mutual funds in the Managers Family of Funds, the cost of providing such services and the resulting profitability to the Investment Manager and its affiliates from these relationships. The Trustees also noted the current and potential asset levels of the Fund and the willingness of the Investment Manager to waive fees and pay expenses for the Fund from time to time as a means of limiting the total expenses of the Fund. In this regard, the Trustees noted that, unlike a mutual fund that is managed by a single investment adviser, the Fund operates in a manager-of-managers structure and, as the Fund grows in size, it is common practice for the Investment Manager to recommend the selection of an additional Subadvisor to manage a portion of the Fund’s portfolio. The Trustees also noted that the subadvisory fees are paid by the Investment Manager out of its advisory fee. The Trustees further noted that, because of this practice, the Investment Manager’s oversight and supervisory responsibilities with respect to the Fund can be expected to increase with the size of the Fund. Based on the foregoing, the Trustees concluded that the profitability to the Investment Manager is reasonable and that the Investment Manager is not realizing material benefits from economies of scale that would warrant adjustments to the advisory fees for the Fund at this time. With respect to economies of scale, the Trustees also noted that as the Fund’s assets increase over time, the Fund may realize other economies of scale to the extent that the increase in assets is proportionally greater than the increase in certain other expenses.
The Trustees noted that the Fund’s advisory fee and total expenses (net of applicable expense waivers/reimbursements) as of October 31, 2006 were higher and lower, respectively, than the average for the Peer Group. The Trustees took into account the fact that the Investment Manager has contractually agreed through March 1, 2008 to limit the Fund’s net annual operating expenses to 1.35%. The Trustees concluded that, in light of the nature, extent and quality of the services provided by the Investment Manager and the Subadvisor, the Fund’s performance, the foregoing expense limitation and the considerations noted above with respect to the Subadvisor and the Investment Manager, the Fund’s advisory fees are reasonable.
Subadvisory Fees and Profitability. In considering the reasonableness of the fee payable by the Investment Manager to the Subadvisor, the Trustees relied on the ability of the Investment Manager to negotiate the terms of the Subadvisory Agreement at arm’s length as part of the manager-of-managers structure, noting that the Subadvisor is not affiliated with the Investment Manager. In addition, the Trustees noted that the subadvisory fees are paid by the Investment Manager out of its advisory fee. Accordingly, the cost of services to be provided by the Subadvisor and the profitability to the Subadvisor of its relationship with the Fund were not material factors in the Trustees’ deliberations. For similar reasons, and based on the current size of the portion of the Fund managed by the Subadvisor, the Trustees concluded that any economies of scale being realized by the Subadvisor was not a material factor in the Trustees’ deliberations at this time.
* * * *
After consideration of the foregoing, the Trustees also reached the following conclusions regarding the Investment Management Agreement and the Subadvisory Agreement, in addition to those
30
Annual Renewal of Investment Advisory Agreements (continued)
conclusions discussed above: (a) the Investment Manager and the Subadvisor have demonstrated that they possess the capability and resources to perform the duties required of them under the Investment Management Agreement and the Subadvisory Agreement; (b) the Subadvisor’s Investment Strategy is appropriate for pursuing the Fund’s investment objectives; (c) the Subadvisor is reasonably likely to execute its Investment Strategy consistently over time; and (d) the Investment Manager and the Subadvisor maintain appropriate compliance programs.
Based on all of the above-mentioned factors and related conclusions, with no single factor or conclusion being determinative and with each Trustee not necessarily attributing the same weight to each factor, the Trustees concluded that approval of the Investment Management Agreement and the Subadvisory Agreement would be in the interests of the Fund and its shareholders. Accordingly, on June 8, 2007, the Trustees, including a majority of the Independent Trustees, voted to approve the Investment Management Agreement and the Subadvisory Agreement for the Fund’s Subadvisor.
31
Investment Manager and Administrator
Managers Investment Group LLC
800 Connecticut Avenue
Norwalk, Connecticut 06854
(203) 299-3500 or (800) 835-3879
Distributor
Managers Distributors, Inc.
800 Connecticut Avenue
Norwalk, Connecticut 06854
(203) 299-3500 or (800) 835-3879
Subadvisors
Lord, Abbett & Co. LLC
90 Hudson Street
Jersey City, NJ 07302
Next Century Growth Investors, LLC
5500 Wayzata Boulevard, Suite 1275
Minneapolis, MN 55416
OFI Institutional Asset Management
470 Atlantic Avenue, 11th Floor
Boston, MA 02210
WEDGE Capital Management L.L.P
301 S. College Street, #2920
Charlotte, NC 28202
Custodian
The Bank of New York
2 Hanson Place
Brooklyn, New York 11217
Legal Counsel
Ropes & Gray LLP
One International Place
Boston, Massachusetts 02110-2624
Transfer Agent
PFPC, Inc.
Attn: Managers
P.O. Box 9769
Providence, Rhode Island 02940
(800) 548-4539
MANAGERSAND MANAGERS AMG EQUITY FUNDS
EMERGING MARKETS EQUITY
Rexiter Capital Management Limited
ESSEX GROWTH
ESSEX LARGE CAP GROWTH
ESSEX SMALL/MICRO CAP GROWTH
Essex Investment Management Co., LLC
FQ TAX-MANAGED U.S. EQUITY
FQ U.S. EQUITY
First Quadrant, L.P.
INSTITUTIONAL MICRO-CAP
MICRO-CAP
Lord, Abbett & Co. LLC
WEDGE Capital Management L.L.P.
OFI Institutional Asset Management
Next Century Growth Investors, LLC
INTERNATIONAL EQUITY
Alliance Bernstein L.P.
Lazard Asset Management, LLC
Wellington Management Company, LLP
CHICAGO EQUITY PARTNERS
MID-CAP
Chicago Equity Partners, LLC
REAL ESTATE SECURITIES
Urdang Securities Management, Inc.
SMALL CAP
TIMESSQUARE MID CAP GROWTH
TIMESSQUARE SMALL CAP GROWTH
TimesSquare Capital Management, LLC
SMALL COMPANY
Epoch Investment Partners, Inc.
Kalmar Investment Advisers, Inc.
SPECIAL EQUITY
Donald Smith & Co., Inc.
Lord, Abbett & Co. LLC
Skyline Asset Management, L.P.
Smith Asset Management Group, LP
Veredus Asset Management LLC
Westport Asset Management, Inc.
SYSTEMATIC VALUE
SYSTEMATIC MID CAP VALUE
Systematic Financial Management, L.P.
VALUE
Armstrong Shaw Associates Inc.
Osprey Partners Investment Mgmt., LLC
MANAGERS AND MANAGERS AMG
BALANCED FUNDS
CHICAGO EQUITY PARTNERS BALANCED
Chicago Equity Partners, LLC
GLOBAL
Armstrong Shaw Associates Inc. Alliance Bernstein L.P. First Quadrant, L.P.
Northstar Capital Management, Inc. Wellington Management Company, LLP
ALTERNATIVE FUNDS
FQ GLOBAL ALTERNATIVES
First Quadrant, L.P.
MANAGERS FIXED INCOME FUNDS
BOND (MANAGERS)
FIXED INCOME GLOBAL BOND
Loomis, Sayles & Company L.P.
BOND (MANAGERS FREMONT)
Pacific Investment Management Co. LLC
CALIFORNIA INTERMEDIATE TAX-FREE
Evergreen Investment Management Co., LLC
HIGH YIELD
J.P. Morgan Investment Management Inc.
INTERMEDIATE DURATION GOVERNMENT
SHORT DURATION GOVERNMENT
Smith Breeden Associates, Inc.
MONEY MARKET
JPMorgan Investment Advisors Inc.
This report is prepared for the Funds’ shareholders. It is authorized for distribution to prospective investors only when preceded or accompanied by an effective prospectus. To receive a free copy of the prospectus or Statement of Additional Information, which includes additional information about Fund Trustees, please contact us by calling 800.835.3879. Distributed by Managers Distributors, Inc., member FINRA.
A description of the policies and procedures each Fund uses to vote its proxies is available: (i) without charge, upon request, by calling 800.835.3879, or (ii) on the Securities and Exchange Commission’s (SEC) Web site at www.sec.gov. For information regarding each Fund’s proxy voting record for the 12-month period ended June 30, call 800.835.3879 or visit the SEC Web site at www.sec.gov.
The Funds file their complete schedule of portfolio holdings with the SEC for the first and third quarters of each fiscal year on Form N-Q. The Funds’ Forms N-Q are available on the SEC’s website at www.sec.gov. A Fund’s Forms N-Q may be reviewed and copied at the SEC’s Public Reference Room in Washington, DC. Information on the operation of the Public Reference Room may be obtained by calling 800.SEC.0330. To review a complete list of the Funds’ portfolio holdings, or to view the most recent quarterly holdings report, semiannual report, or annual report, please visit www.managersinvest.com.
www.managersinvest.com
ANNUAL REPORT
Managers Funds
October 31, 2007
Managers Fremont Global Fund
Managers Small Cap Fund
Managers Real Estate Securities Fund
Managers California Intermediate Tax-Free Fund
The Managers Funds
Annual Report — October 31, 2007
TABLE OF CONTENTS
| | |
| | | Page |
LETTER TO SHAREHOLDERS | | 1 |
| |
ABOUT YOUR FUNDS’ EXPENSES | | 3 |
| |
| INVESTMENT MANAGERS’ COMMENTS, FUND SNAPSHOTS, AND SCHEDULES OF PORTFOLIO INVESTMENTS | | |
| |
Managers Fremont Global Fund | | 4 |
| |
Managers Small Cap Fund | | 14 |
| |
Managers Real Estate Securities Fund | | 20 |
| |
Managers California Intermediate Tax-Free Fund | | 25 |
| |
NOTES TO SCHEDULES OF PORTFOLIO INVESTMENTS | | 30 |
| |
FINANCIAL STATEMENTS: | | |
| |
Statements of Assets and Liabilities | | 31 |
Funds’ balance sheets, net asset value (NAV) per share computations and cumulative undistributed amounts | | |
| |
Statements of Operations | | 32 |
Detail of sources of income, Fund expenses, and realized and unrealized gains (losses) during the fiscal year | | |
| |
Statements of Changes in Net Assets | | 33 |
Detail of changes in Fund assets for the past two fiscal years | | |
| |
FINANCIAL HIGHLIGHTS | | 35 |
Historical net asset values per share, distributions, total returns, expense ratios, turnover ratios and net assets | | |
| |
NOTES TO FINANCIAL STATEMENTS | | 37 |
Accounting and distribution policies, details of agreements and transactions with Fund management and affiliates, and descriptions of certain investment risks | | |
| |
REPORT OF INDEPENDENT REGISTERED PUBLIC ACCOUNTING FIRM | | 42 |
| |
TRUSTEES AND OFFICERS | | 43 |
| |
ANNUAL RENEWAL OF INVESTMENT ADVISORY AGREEMENTS | | 44 |
Nothing contained herein is to be considered an offer, sale or solicitation of an offer to buy shares of The Managers Funds or Managers AMG Funds. Such offering is made only by Prospectus, which includes details as to offering price and other material information.
Letter to Shareholders
Dear Fellow Shareholder:
Financial markets have been increasingly unsettled this past year, particularly during the summer months and currently as we write this report. While the economy has continued to grow, a liquidity crisis initiated by spreading weakness in subprime mortgage loans increased uncertainty about its sustainability. Bonds of all credit quality became unusually volatile, and credit spreads, having been extremely slim, widened dramatically, raising the cost of capital for many borrowers. Naturally the equity markets followed suit and became more volatile as the rising cost of capital pressured corporate profitability, penalized leverage, and hindered merger and acquisition activity.
As has been well documented in the financial press, the continued weakness in residential housing prices, combined with gradually rising interest rates, has put severe stress on low credit-quality (subprime) borrowers. Rising defaults pushed several mortgage lenders and leveraged subprime mortgage investors toward bankruptcy and catalyzed a swift and broad flight from various forms of investment risk over the past few months. These revelations began creating serious liquidity problems in the credit markets late in the second quarter and have been the root of uncertainty and market volatility ever since.
A rapid and at times indiscriminate flight from risk created unusual patterns of volatility within the bond market. Credit spreads widened significantly throughout July, as Moody’s and S&P downgraded hundreds of securities, and price moves forced leveraged investors to raise cash any way they could. Since much of the leverage had been funded with short-term debt, the short end of the yield curve bore the brunt of the liquidity crisis. The typically docile commercial paper market seized as demand dried up, and short-term Treasury yields vacillated between 2.9% and 4.9% as investors raced to safety, causing a dislocation in prices. Since then, prices for credits have generally recovered, as the Federal Reserve pumped liquidity into the system and investors have had time to evaluate underlying fundamentals and adjust their portfolios in a more rational manner.
After rallying strongly off of a February trough, the stock market followed the lead of the credit markets by trading sharply down during the liquidity crisis in July, then recovering from late August through October. Here, too, there were interesting anomalies in the indiscriminate flight from risk. Not surprisingly, small-and mid-cap stocks reacted more during the price declines, and underperformed large-cap stocks during the period. Interestingly however, growth indices, which would normally react poorly to a rise in interest rates or a liquidity squeeze, significantly outperformed value indices during the period. We believe there were two primary reasons for this. One, since value indices had outperformed growth indices for an extended period of time, a typical “reversion to the mean” took place. Two, the quick reduction of leverage from the markets in general forced many quantitatively based hedge fund managers to reverse their trades in a very quick fashion. As it turned out, many of these investors used similar value-biased models to guide their purchase and sale decisions. The result was that the same stocks were being sold off not for investment reasons, but because of liquidity needs. Stocks recovered in late August and throughout October, as a result of an infusion of liquidity by the Federal Reserve, increasing visibility about where the risks were residing, and a much anticipated reduction of the Fed Funds Rate in mid-September.
Within this environment, all four of the Funds represented in this report provided positive returns for the 12-months ended October 31, 2007 (the Funds’ fiscal year). A detailed review of the performance and positioning of each of the Funds is included within this report.
Lingering credit problems and further revelations of losses from large financial institutions are hindering not only the financial markets, but the economy as well. In our opinion, it appears this will continue for some time, pushing the economy closer to the tipping point of recession. Uncertainty about whether it will tip has driven volatility higher, as the financial markets have traded sharply higher or lower depending upon the news each day. The Federal Reserve has been accommodating, and although we think the risk of recession has increased, we still believe that portions of the U.S. and global economies remain healthy. In sum, we continue to believe that investors should maintain their portfolios with allocations near their long-run targets, rebalance if necessary and take full advantage of opportunities to participate in the growth of the global economy.
One of our foremost goals at Managers Investment Group is to structure and manage mutual funds that will help our shareholders and clients become more successful in reaching their investment goals and objectives.
1
Letter to Shareholders (continued)
Each of our Funds is geared to provide you with exposure to a specific asset class, combination of asset classes, or segment of the market. Investors tend to use our Funds as part of their overall asset allocation in order to structure a well-diversified portfolio intended to meet individual needs. Most of our Funds, like the Managers Small Cap Fund, and Managers Real Estate Securities Fund, are therefore designed to be building blocks.
The following report covers the one-year period ending October 31, 2007. Should you have any questions about this report, or if you’d like to receive a Prospectus and additional information, including fees and expenses, for this or any of the other Funds in our family, please feel free to contact us at 1-800-835-3879, or visit our website at www.managersinvest.com. As always, please read the Prospectus carefully before you invest or send money.
If you are curious about how you can better diversify your investment program, visit the Knowledge Center on our Web site and view our articles in the investment strategies section. You can rest assured that under all market conditions our team is focused on delivering excellent investment management services for your benefit.
We thank you for your continued confidence and investment in The Managers Funds.
| | | | |
| Sincerely, | | | | |
| | |
| | | | |
| John H. Streur | | | | Thomas G. Hoffman, CFA |
| Senior Managing Partner | | | | Executive Vice President |
| Managers Investment Group LLC | | | | Chief Investment Officer |
| | | | Managers Investment Group LLC |
2
About Your Fund’s Expenses
As a shareholder of a Fund, you may incur two types of costs: (1) transaction costs, which may include sales charges (loads) on purchase payments; redemption fees; and exchange fees; and (2) ongoing costs, including management fees; distribution (12b-1) fees; and other Fund expenses. This example is intended to help you understand your ongoing costs (in dollars) of investing in the Fund and to compare these costs with the ongoing costs of investing in other mutual funds. The example is based on an investment of $1,000 invested at the beginning of the period and held for the entire period as indicated below.
Actual Expenses
The first line of the table below provides information about the actual account values and actual expenses. You may use the information in this line, together with the amount you invested, to estimate the expenses that you paid over the period. Simply divide your account value by $1,000 (for example, an $8,600 account value divided by $1,000 = 8.6), then multiply the result by the number in the first line under the heading entitled “Expenses Paid During Period” to estimate the expenses you paid on your account during this period.
Hypothetical Example for Comparison Purposes
The second line of the table below provides information about hypothetical account values and hypothetical expenses based on the Fund’s actual expense ratio and an assumed annual rate of return of 5% before expenses, which is not the Fund’s actual return. The hypothetical account values and expenses may not be used to estimate the actual ending account balance or expenses you paid for the period. You may use this information to compare the ongoing costs of investing in the Fund and other funds by comparing this 5% hypothetical example with the 5% hypothetical examples that appear in the shareholder reports of other funds.
Please note that the expenses shown in the table are meant to highlight your ongoing costs only and do not reflect any transactional costs, such as sales charges (loads), redemption fees, or exchange fees. Therefore, the second line of the table is useful in comparing ongoing costs only, and will not help you determine the relative total costs of owning different funds.
| | | | | | | | | | | | |
Six Months Ended October 31, 2007 | | Expense
Ratio for
the period | | | Beginning
Account Value
5/1/2007 | | Ending
Account Value
10/31/2007 | | Expenses Paid
During the
Period* |
Managers Fremont Global Fund | | | | | | | | | | | | |
Based on Actual Fund Return | | 0.82 | % | | $ | 1,000 | | $ | 1,082 | | $ | 4.30 |
Based on Hypothetical 5% Annual Return | | 0.82 | % | | $ | 1,000 | | $ | 1,021 | | $ | 4.18 |
Managers Small Cap Fund | | | | | | | | | | | | |
Based on Actual Fund Return | | 1.39 | % | | $ | 1,000 | | $ | 1,090 | | $ | 7.32 |
Based on Hypothetical 5% Annual Return | | 1.39 | % | | $ | 1,000 | | $ | 1,018 | | $ | 7.07 |
Managers Real Estate Securities Fund | | | | | | | | | | | | |
Based on Actual Fund Return | | 1.42 | % | | $ | 1,000 | | $ | 951 | | $ | 6.98 |
Based on Hypothetical 5% Annual Return | | 1.42 | % | | $ | 1,000 | | $ | 1,018 | | $ | 7.22 |
Managers California Intermediate Tax Free Fund | | | | | | | | | | | | |
Based on Actual Fund Return | | 0.57 | % | | $ | 1,000 | | $ | 1,011 | | $ | 2.89 |
Based on Hypothetical 5% Annual Return | | 0.57 | % | | $ | 1,000 | | $ | 1,022 | | $ | 2.91 |
| * | Expenses are equal to the Fund’s annualized expense ratio multiplied by the average account value over the period, multiplied by the number of days in the most recent fiscal half-year (184), then divided by 365. |
3
Fremont Global Fund
Portfolio Manager’s Comments
The Managers Fremont Global Fund seeks to maximize total return while reducing risk by investing in U.S. and international stocks, bonds, and short-term securities (cash).
The Portfolio Manager
Northstar Capital Management’s investment team believes that investing in high quality, high earnings growth companies will generate superior investment returns over full market cycles. To find these companies, the portfolio management team performs fundamental, bottom-up research using a combination of quantitative and qualitative criteria.
The investment process begins with a universe of stocks with market capitalizations exceeding $5 billion. Stocks must also exhibit low volatility and high liquidity. The team then runs a screen to identify stocks that exhibit: (1) higher than market trailing EPS growth; (2) higher than market 5-year projected EPS growth; (3) higher earnings stability; (4) P/E to growth ratio lower than the market; and (5) return on equity higher than the market. This quantitative screen narrows the universe to approximately 100 stocks.
Fundamental, bottom-up analysis is then performed on each company, narrowing the candidate universe down to those with strong qualitative characteristics. Management looks for companies that have excellent businesses with unique characteristics deriving from superior products, niche markets, first-rate customer service, innovative approaches, creative skills, superior management, and high employee involvement. These companies are typically acknowledged leaders in their fields. This qualitative analysis then leads to a portfolio of approximately 25-30 names representing the best ideas of the portfolio management team. Stocks in the portfolio are generally equally weighted, and holdings are monitored to assure competitive advantage and growth characteristics.
Armstrong Shaw Associates, Inc.
Jeff Shaw and the investment management team at Armstrong Shaw take a disciplined absolute value approach to investing in the equity market. The team’s goal is to purchase companies that are selling at a substantial discount to intrinsic value. Armstrong Shaw defines intrinsic value as an estimate of what a company would be worth if it were sold as a continuing operation to a knowledgeable buyer. This approach permits price appreciation if the stock grows into its intrinsic value while limiting the risk of significant price depreciation.
The team begins by screening the universe of domestic stocks for those with market caps more than $2.5 billion, P/E ratios below the market average, EPS growth better than 10% and return on equity better than 15%. The team might also search for certain events or special situations such as restructurings, industry events, or legislative changes. After narrowing the universe to about 200 mid- and large-cap names, the investment team analyzes the companies by speaking with management, suppliers and customers and examining financial statements. Qualitatively, Armstrong Shaw prefers companies with discernable business franchises and a management team with a successful track record. Unlike a deep value manager where price is the main concern, Armstrong Shaw is willing to pay a bit more for a company with a strong business plan as long as the price is still below what the team estimates as the intrinsic value. Quantitatively, the team compares the stock prices to cash flows, EPS, sales, etc. The team will estimate the stock’s intrinsic value and purchase stocks only when they are selling for less than 70% of the estimated intrinsic value.
This results in a portfolio of 30-40 of the team’s best ideas. Another 100 stocks or so remain on a watch list for future consideration. Then the team sets target prices on these stocks that reflect its expectation of 30-50% price appreciation over the next 2-3 years. Thus, turnover tends to be low. The portfolio’s performance is driven by each stock’s appreciation toward its intrinsic value along with rising intrinsic value in response to improved business or industry outlooks. Armstrong Shaw will sell a position when a price target is reached, the company’s fundamentals deteriorate, or if it reports below-expectation financial results. Additionally, a drop in price of 25% from average cost triggers an automatic review process for potential sale.
First Quadrant, L.P.
First Quadrant believes that there are significant and recurring market inefficiencies and that history can help identify which inefficiencies are profitable. Inefficiencies may be identified through ongoing fundamental research conducted by First Quadrant’s research team. Incorporating this fundamental research into a quantitative model leads to a consistent, disciplined investment process.
Led by Chris Luck and Max Darnell, First Quadrant’s investment team uses a proprietary multi-factor quantitative model to construct portfolios that combine a top-down analysis of market and economic conditions with a bottom-up stock selection process. The top-down analysis consists of a review of market and economic data to identify those industries and sectors of the market that are likely to benefit from present and future economic conditions. The top-down analysis helps fund management determine how to tilt the portfolio relative to the benchmark in terms of style, market cap, and industry weightings. Individual stock selection, however, is driven by bottom-up models that focus primarily on market sentiment, valuation, and accounting fundamentals.
Kern Capital Management LLC
Kern Capital Management believes the U.S. micro-cap stock universe provides the opportunity to invest in innovative companies with exceptional growth prospects. With minimal research coverage by brokerage firms and low institutional ownership, KCM believes micro-cap stocks represent the least efficient sector of the market.
Bob Kern is one of the pioneers of small-cap and micro-cap investing. While focusing his attention on small companies, Bob Kern and his team direct their efforts toward finding companies that are succeeding through innovation of new products or services. Thus, the portfolio tends to be concentrated in the technology, health-care, consumer goods and service sectors. The team seeks to earn returns from the appreciation of stocks as the companies’ products develop and penetrate new markets.
In most cases, the analysis of the product and judgments regarding its potential are the most important aspects of the decision to own a stock. In all cases, however, the operational and financial health of the company must be verified. Bob and the investment team at Kern Capital likes to find companies in which margins will increase with revenue growth and that can finance much of their growth from operating cash flow. Although valuation is clearly important, the team is often willing to pay relatively high multiples when it sees compelling growth potential.
Wellington Management Company, LLP
Wellington Management’s portfolio is managed by its International Growth Team (“IGT”), comprised of portfolio managers Jean-Marc Berteaux and Andrew S. Offit. Jean-Marc and Andy are supported
4
Fremont Global Fund
Portfolio Manager’s Comments (continued)
by Wellington Management’s global industry analysts and regional analysts as well as specialized fundamental, quantitative, and technical analysts, and traders. The IGT’s investment philosophy is built on the beliefs that industry is the dominant competitive factor for companies, that companies can dominate industries on a global basis, and that expectations about companies, specifically earnings, drive stock prices. Wellington’s focus is to identify industry leaders with earnings forecasts ahead of market expectations, and to identify the key drivers for the earnings.
The initial investable universe is comprised of companies in the MSCI EAFE Index with market capitalizations greater than US$1 billion. These companies are researched by Wellington Management’s specialist group of industry analysts who perform intensive ongoing fundamental analysis. Analysts provide assessments, financial models and fundamental research to the IGT. The focus of this research is to update an ongoing assessment of management, current business challenges and aggregate industry trends. Thorough analysis is done in preparation for and following company contacts to ensure that “the numbers support the story” – that the strategy and challenges outlined by management are coming through in financial results. The companies ultimately purchased for the portfolio will exhibit the following characteristics:industry leadership, identified earnings drivers, and above consensus earnings growth expectations. Companies in the portfolio are continually monitored to ensure their fundamental attractiveness based on the identified earnings drivers. Market expectations catching up to their earnings forecast and/or deterioration in earnings drivers will factor into the sell decision. The portfolio will generally hold 50 to 80 securities. Portfolio turnover is expected to be high, exceeding 150% on average per annum. While the portfolio’s holdings-based turnover is expected to be in the 100% range, the IGT will actively trade these positions as a result of significant near-term price movements and other factors.
Bernstein Investment Research and Management
Bernstein’s approach to investing is value-based and research driven. Bernstein’s thesis is that human nature leads investors to buy and sell financial assets based on an overreaction to near-term events as they confuse temporary or cyclical characteristics with structural change. Thus, short-term problems, which cause profits and stocks to decline, can create buying opportunities, as investors underestimate the potential for corrective strategies to restore long-term earnings power. The investment team, led by Kevin Simms, attempts to exploit this by using research to separate fact from emotion. Bernstein’s International Strategic Value discipline is designed to create a focused portfolio of companies with strong fundamentals and sound business prospects not yet reflected in their share price.
The investment process begins with a broad universe of several thousand companies. The investment team screens this universe with a proprietary return model to identify the companies with the most attractive valuations relative to their earnings power. The model derives an expected return for each company by assessing it both from a global industry-based perspective and from a country-based standpoint, including such factors as price to cash earnings, price to book, return on equity, and price momentum. A deep team of analysts perform extensive research, focusing on the most attractively valued stocks. These analysts dissect corporate financial statements and visit company management and also meet frequently with customers, suppliers, or other industry experts.
They build spreadsheets of historical and projected balance-sheet and income-statement information in order to estimate normalized earnings power, cash flow and asset values for each company for the next five years, performing simulations to see the potential impact of changes in various components. Analysts then present their estimates and ratings for each security to the Research Review Committee of the Investment Policy Group (IPG). The Committee challenges the analyst’s assumptions and conclusions to ensure they are sound. The IPG uses this research to build a portfolio of approximately 40-60 of the best ideas, building on the combined convictions of Bernstein industry analysts and regional portfolio management teams. A stock is sold when it has achieved forecasted fair value target, or if a change in the earnings forecast reduces the price target to current levels.
Loomis Sayles & Company, L.P.
The Fund accesses the global bond management services of Loomis Sayles & Company, L.P. (“Loomis”) through an investment in the Managers Global Bond Fund, which is subadvised by Loomis. The investment team at Loomis believes that there are inefficiencies inherent in bond markets, hence the greatest opportunities to add value reside in the pricing of credit risk. Their philosophy is to identify attractively valued issues through fundamental research. The investment team and analysts at Loomis generally seek fixed income securities of issuers whose credit profiles it believes are improving. The investment team also analyzes political, economic, and other fundamental factors and combines this analysis with a comparison of the yield spreads of various fixed income securities throughout the world in an effort to find securities that they believe may produce attractive returns in comparison to their risk. Finally, if a security that is believed to be attractive is denominated in a foreign currency, Loomis analyzes whether to accept or to hedge the currency risk.
Portfolio managers Kenneth Buntrock and David Rolley and their team of credit analysts at Loomis research debt offerings in the same way equity analysts research stocks, looking for undervalued bonds where they see a yield premium, the potential for price appreciation, or both. They analyze in detail the financial condition of individual countries and companies, as well as the terms of specific bond offerings. They believe price appreciation can come from a variety of catalysts including improving country or company fundamentals which would lead to credit upgrades, changing market supply and demand forces, improving sector or economic trends.
The Year in Review
Financial markets became increasingly volatile throughout the fiscal year, but ultimately provided ample gains for the period. The Fund returned 16.94% during the period, keeping pace with its custom benchmark* which returned 16.45%.
As has been well documented in the financial press, the continued weakness in residential housing prices, combined with gradually rising interest rates, has put severe stress on low credit-quality (subprime) borrowers. These revelations began creating serious liquidity problems in the credit markets late in the second quarter and have been the root of uncertainty and market volatility ever since. Credit spreads widened significantly throughout the summer as Moody’s and S&P downgraded hundreds of securities, and price moves forced leveraged investors to raise cash any way they could. Since much of the leverage had been funded with short-term debt, the short end of the yield curve bore the brunt of the liquidity crisis.
5
Fremont Global Fund
Portfolio Manager’s Comments (continued)
Since then, credit spreads have come in somewhat, but remain sensitive to continuing revelations of subprime losses from major institutions. Meanwhile, the Federal Reserve eased rates twice during the period, in order to prevent the liquidity crisis from pushing the economy into recession. As reported, the U.S. economy remains robust, but most economists expect softening in the months to come. The rate cuts and perceived slowing have taken a toll on the strength of the U.S. dollar which fell relative to most foreign currencies.
An initial scare from the subprime mortgage industry, along with perceived weakening in China sent stocks sharply lower in February. Prices recovered and advanced over the next few months until the credit crisis sent them sharply lower again in July. The Fed’s actions among other things helped the stock market recover again in the fall and it reached all time highs in mid October. Foreign markets showed similar patterns but ultimately provided stronger returns for U.S. investors as foreign currencies appreciated and emerging markets in particular, remained quite strong.
Most of the Fund’s gains were driven by strong performance from the growth style investment managers and international equity allocations. As noted last year, we entered the year with a moderate bias toward the growth style managers, and having increased the Fund’s international equity and foreign currency exposure. Each of these decisions provided marginal value added throughout the year. Wellington’s international growth portfolio appreciated more than 42% throughout the fiscal year, propelled by strong gains in the technology sector. In particular, Research in Motion (Canada) and Nokia (Finland) were among the largest positive contributors. Similarly, Northstar’s technology holdings, such as Apple, Cisco, and Google, provided solid gains. In addition, a few modest positions within the consumer discretionary sector bucked the negative consumer trend and provided strong gains. The domestic value-oriented portfolio earned gains with its energy and utility holdings but was hindered throughout the year by its financials and consumer holdings. The global bond portion of the Fund provided satisfactory gains driven by currency appreciation and exposure to emerging markets. Its ample exposure to corporate credits was not additive during the period.
Looking Forward
As we progress into fiscal 2008, the Fund will be eliminating the Fund’s allocation to domestic microcap stocks, and increasing exposure to foreign stock markets. Although we have some concerns about the strength of the global economy, relatively low bond yields and reasonable stock valuations have induced us to remain slightly underweight bond investments relative to equities, and continue with our moderate tilt toward growth styles.
| * | The custom benchmark for the Fund is and index comprised of 65% MSCI World Index and 35% Lehman Brothers Global Aggregate Index. |
Cumulative Total Return Performance
Managers Fremont Global Fund’s cumulative total return is based on the daily change in net asset value (NAV), and assumes that all distributions were reinvested. The S&P 500 Index is designed to measure performance of the broad domestic economy through changes in aggregate market value of 500 stocks representing all major industries. The Managers Fremont Global Fund Composite Index is a hypothetical representation of the performance of the Fund’s stock and bond asset classes according to their respective weightings in the Fund’s neutral mix (65% MSCI World Index and 35% Lehman Brothers Global Aggregate Index). The MSCI World Index is an unmanaged index composed of more than 1,400 stocks listed on exchanges in the US, Europe, Canada, Australia, New Zealand and the Far East. It assumes the reinvestment of dividends. The Lehman Brothers Global Aggregate Index provides a broad-based measure of the global investment-grade fixed income markets. The three major components of this index are the U.S. Aggregate, the Pan-European Aggregate, and the Asian-Pacific Aggregate Indices. The index also includes Eurodollar and Euro-Yen corporate bonds, Canadian government, agency and corporate securities, and USD investment grade 144A securities. Unlike the Fund, the above stated indices are unmanaged, are not available to investment, and do not incur expenses. This chart compares a hypothetical $10,000 investment made in the Managers Fremont Global Fund on October 31, 1997, to a $10,000 investment made in the above stated indices for the same period.
6
Fremont Global Fund
Portfolio Manager’s Comments (continued)
The graph and table do not reflect the deduction of taxes that a shareholder would pay on a Fund distribution or redemption of shares. The listed returns for the Fund are net of expenses and the returns for the indices exclude expenses. Total returns for the Fund would have been lower had certain expenses not been reduced.
The table below shows the average annual total returns for Managers Fremont Global Fund, S&P 500 Index, and the Managers Fremont Global Fund Composite Index (before taxes) since October 31, 1997 through October 31, 2007.
| | | | | | | | | |
Average Annualized Total Returns1 | | One Year | | | Five Years | | | Ten Years | |
Fremont Global2,3 | | 16.94 | % | | 13.66 | % | | 6.41 | % |
S&P 500 Index | | 14.56 | % | | 13.88 | % | | 7.10 | % |
Managers Fremont Global Fund Composite Index | | 16.45 | % | | 14.44 | % | | 7.49 | % |
The performance data shown represents past performance. Past performance is not a guarantee of future results. Current performance may be lower or higher than the performance data quoted. The investment return and principal value of an investment in the Fund will fluctuate so that an investor’s shares, when redeemed, may be worth more or less than their original cost. For performance information through the most recent month end, please call (800) 835-3879 or visit our website at www.managersinvest.com.
1 | Total return equals income yield plus share price change and assumes reinvestment of all dividends and capital gain distributions. Returns are net of fees and may reflect offsets of Fund expenses as described in the Prospectus. No adjustment has been made for taxes payable by shareholders on their reinvested dividends and capital gain distributions. Returns for periods greater than one year are annualized. The listed returns on the Fund are net of expenses. All returns are in U.S. dollars($). |
2 | Investments in foreign securities are subject to additional risks such as changing market conditions, economic and political instability, and currency exchange rate fluctuations. |
3 | Changing interest rates may adversely affect the value of an investment. An increase in interest rates typically causes the value of bonds and other fixed-income securities to fall. |
7
Managers Fremont Global Fund
Fund Snapshots
October 31, 2007
Portfolio Breakdown
| | | | | | | | | |
Geographic Diversification | | Managers Fremont Global Fund** | | | MSCI World Index | | | Lehman Global Aggregate Index | |
United States | | 73.3 | % | | 47.0 | % | | 35.5 | % |
Europe | | 17.0 | % | | 33.9 | % | | 39.2 | % |
Japan | | 3.1 | % | | 9.8 | % | | 16.4 | % |
Asia (excluding Japan) | | 2.0 | % | | 1.4 | % | | 2.5 | % |
Caribbean Islands | | 1.7 | % | | 0.3 | % | | 0.1 | % |
Latin America | | 1.2 | % | | 0.0 | % | | 0.7 | % |
Canada | | 0.9 | % | | 4.2 | % | | 3.1 | % |
Africa & Middle East | | 0.2 | % | | 0.0 | % | | 0.4 | % |
Other | | 0.6 | % | | 3.4 | % | | 2.1 | % |
Top Ten Holdings
| | | |
Security Name | | Percentage of Net Assets | |
Managers Global Bond Fund* | | 29.8 | % |
Cisco Systems, Inc.* | | 1.4 | |
Apple, Inc. | | 1.2 | |
Microsoft Corp. | | 1.2 | |
General Electric Co.* | | 1.1 | |
United Technologies Corp.* | | 1.0 | |
Oracle Corp. | | 1.0 | |
Google, Inc. | | 0.9 | |
Lockheed Martin Corp. | | 0.9 | |
American Express Co. | | 0.8 | |
| | | |
Top Ten as a Group | | 39.3 | % |
| | | |
| * | Top Ten Holding at April 30, 2007 |
Any sectors, industries, or securities discussed should not be perceived as investment recommendations. Mention of a specific security should not be considered a recommendation to buy or solicitation to sell that security.
8
Managers Fremont Global Fund
Schedule of Portfolio Investments
October 31, 2007
| | | | | | |
| | | Shares | | | Value |
Common Stocks - 68.0% | | | | | | |
Consumer Discretionary - 7.0% | | | | | | |
1-800-FLOWERS.COM, Inc. * | | 6,400 | | | $ | 76,736 |
Alibaba.com, Ltd. (China) (a) | | 2,800 | | | | 4,878 |
Amazon.com, Inc. * | | 200 | 2 | | | 17,830 |
American Eagle Outfitters, Inc. | | 1,200 | | | | 28,536 |
Big Lots, Inc. * | | 2,400 | | | | 57,552 |
Borders Group, Inc. | | 7,400 | 2 | | | 114,108 |
Burberry Group PLC (United Kingdom) | | 28,547 | | | | 366,283 |
Cache, Inc. * | | 1,200 | 2 | | | 18,792 |
Carphone Warehouse Group, PLC, The (United Kingdom) | | 50,488 | | | | 370,047 |
Century Casinos, Inc. * | | 14,700 | | | | 105,105 |
China Resources Enterprises, Ltd. (Hong Kong) | | 30,000 | | | | 131,592 |
Coach, Inc. * | | 21,500 | | | | 786,040 |
Comcast Corp., Special Class A * | | 23,220 | | | | 484,601 |
Compagnie Generale des Etablissements Michelin (France) | | 1,650 | | | | 222,218 |
DaimlerChrylser Ag (Germany) | | 5,460 | | | | 597,335 |
Expedia, Inc. * | | 11,000 | | | | 359,260 |
Garmin, Ltd. (Cayman Islands)* | | 9,400 | 2 | | | 1,009,560 |
Global Traffic Network, Inc. * | | 21,900 | | | | 154,614 |
Great Wolf Resorts, Inc. * | | 3,000 | | | | 39,180 |
Guess?, Inc. | | 400 | 2 | | | 20,556 |
Hyundai Motor Co. - Sponsored GDR (South Korea) (a) | | 5,900 | | | | 233,935 |
Idearc, Inc. | | 6,936 | | | | 187,133 |
IMAX Corp. (Canada)* | | 17,900 | | | | 92,185 |
J.C. Penney Co., Inc. | | 1,000 | | | | 56,240 |
KarstadtQuelle AG (Germany)* | | 18,590 | | | | 598,505 |
Las Vegas Sands Corp. * | | 1,400 | 2 | | | 186,312 |
LG Electronics, Inc. (South Korea) | | 1,618 | | | | 170,133 |
Liberty Global, Inc. * | | 6,000 | 2 | | | 235,500 |
Lowe’s Co., Inc. | | 21,100 | | | | 567,379 |
Luxottica Group S.p.A. (Italy)* | | 2,747 | | | | 96,779 |
News Corp., Inc., Class A | | 43,000 | | | | 931,810 |
Nissan Motor Co., Ltd. (Japan) | | 32,400 | | | | 371,718 |
Overstock.com, Inc. * | | 2,600 | | | | 101,738 |
Publicis Groupe (France) | | 2,544 | | | | 103,670 |
Renault SA (France) | | 3,500 | | | | 591,148 |
SES GLOBAL (France) | | 3,014 | | | | 74,570 |
Sharp Corp. (Japan) | | 18,000 | | | | 283,930 |
Station Casinos, Inc. | | 1,000 | 2 | | | 89,800 |
Suntech Power Holdings Co., Ltd. (China)* | | 3,700 | 2 | | | 217,893 |
The Wet Seal, Inc., Class A * | | 8,400 | | | | 22,260 |
Time Warner Co., Inc. | | 30,000 | | | | 547,800 |
Volkswagen AG (Germany) | | 757 | | | | 216,393 |
Whirlpool Corp. | | 3,700 | 2 | | | 292,966 |
Wyndham Worldwide Corp. * | | 14,816 | | | | 486,409 |
Wynn Resorts Ltd. * | | 1,200 | | | | 193,716 |
XM Satellite Radio Holdings, Inc. * | | 12,600 | 2 | | | 167,328 |
Yamada Denki Co., Ltd. (Japan) | | 990 | | | | 102,071 |
Total Consumer Discretionary | | | | | | 12,184,144 |
Consumer Staples - 3.4% | | | | | | |
Altria Group, Inc. | | 4,000 | | | | 291,720 |
Anheuser-Busch Companies, Inc. | | 3,200 | | | | 164,096 |
Archer-Daniels-Midland Co. | | 14,200 | | | | 508,076 |
CVS Corp. | | 17,890 | | | | 747,265 |
Del Monte Foods Co. | | 5,100 | | | | 52,735 |
Japan Tobacco, Inc. (Japan) | | 37 | | | | 215,660 |
Koninklijke Ahold N.V. (Netherlands)* | | 10,800 | | | | 162,724 |
Kraft Foods, Inc. | | 17,930 | | | | 599,041 |
Kroger Co. | | 27,000 | | | | 793,530 |
Loews Corp. - Carolina Group | | 4,600 | | | | 394,588 |
Nestle SA, Registered (Switzerland) | | 244 | | | | 112,699 |
Procter & Gamble Co. | | 8,100 | | | | 563,112 |
Reckitt Benckiser Group PLC (United Kingdom) | | 7,753 | | | | 450,375 |
Rite Aid Corp. * | | 50,800 | 2 | | | 198,628 |
Tesco PLC (United Kingdom) | | 69,736 | | | | 709,399 |
Total Consumer Staples | | | | | | 5,963,648 |
Energy - 5.9% | | | | | | |
Baker Hughes, Inc. | | 4,370 | | | | 378,966 |
Callon Petroleum Co.* | | 2,000 | | | | 29,160 |
ChevronTexaco Corp. | | 7,700 | | | | 704,627 |
China Petroleum and Chemical Corp., Class H (Hong Kong) | | 148,000 | | | | 235,651 |
ConocoPhillips Co. | | 15,510 | | | | 1,317,730 |
Devon Energy Corp. | | 6,050 | | | | 565,070 |
EL Paso Corp. | | 5,800 | | | | 102,428 |
Eni S.p.A. (Italy) | | 11,000 | | | | 401,644 |
Grey Wolf, Inc. * | | 21,000 | | | | 118,230 |
Helmerich & Payne, Inc. | | 2,600 | | | | 82,212 |
LUKOIL Holdings, ADR (Russia) | | 2,350 | 2 | | | 212,675 |
Marathon Oil Corp. | | 1,400 | | | | 82,782 |
OAO Gazprom - Sponsored ADR (Russia) | | 5,800 | | | | 289,972 |
The accompanying notes are an integral part of these financial statements.
9
Managers Fremont Global Fund
Schedule of Portfolio Investments (continued)
| | | | | | |
| | | Shares | | | Value |
Energy - 5.9% (continued) | | | | | | |
Patterson-UTI Energy, Inc. | | 2,600 | | | $ | 51,844 |
Petroleo Brasileiro S.A. (Brazil) | | 3,500 | 2 | | | 291,165 |
Petroleo Brasileiro S.A., Sponsored ADR (Brazil) | | 1,500 | | | | 143,445 |
Pioneer Drilling Co. * | | 9,200 | | | | 112,056 |
Pride International, Inc. * | | 1,000 | | | | 36,900 |
Repsol YPF, S.A. (Spain) | | 6,200 | | | | 244,944 |
Royal Dutch Shell PLC, Class A (United Kingdom) | | 12,000 | | | | 526,503 |
Saipem S.p.A. (Italy) | | 6,309 | | | | 280,006 |
Schlumberger, Ltd. | | 10,000 | | | | 965,700 |
Seadrill Ltd. (Bermuda) | | 9,300 | | | | 221,375 |
Smith International, Inc. | | 15,000 | | | | 990,750 |
SulphCo, Inc. * | | 10,400 | | | | 66,352 |
Suncor Energy, Inc. (Canada) | | 2,100 | | | | 229,974 |
Tesoro Corp. | | 6,400 | 2 | | | 387,392 |
Total SA (France) | | 2,600 | | | | 209,810 |
Transocean, Inc. | | 7,800 | 2 | | | 931,086 |
Trico Marine Services, Inc. * | | 800 | | | | 25,960 |
Vaalco Energy, Inc. * | | 2,600 | | | | 13,208 |
Valero Energy Corp. | | 2,200 | | | | 154,946 |
Total Energy | | | | | | 10,404,563 |
Financials - 12.2% | | | | | | |
Allianz AG (Germany) | | 2,400 | | | | 540,427 |
American Express Co. | | 23,070 | | | | 1,406,116 |
American International Group, Inc. | | 17,740 | | | | 1,119,749 |
Amvescap PLC (United Kingdom) | | 43,842 | | | | 671,087 |
Aviva PLC (United Kingdom) | | 22,300 | | | | 351,347 |
Axis Capital Holdings, Ltd. (Bermuda) | | 5,800 | | | | 230,492 |
Bank of America Corp. | | 27,978 | | | | 1,350,778 |
Barclays PLC (United Kingdom) | | 30,500 | | | | 386,022 |
Bear, Stearns & Co., Inc. | | 1,800 | 2 | | | 204,480 |
Blackrock, Inc. | | 4,400 | | | | 910,580 |
BNP Paribas SA (France) | | 5,000 | | | | 554,157 |
Capital One Financial Corp. | | 12,642 | | | | 829,189 |
China Merchants Bank Co., Ltd. (China) | | 46,000 | | | | 237,189 |
Chubb Corp., The | | 3,800 | | | | 202,730 |
Citigroup, Inc. | | 17,000 | | | | 712,300 |
CME Group, Inc. | | 1,750 | 2 | | | 1,165,938 |
Corus Bankshares, Inc. | | 4,400 | | | | 48,488 |
Credit Agricole SA (France)* | | 7,340 | | | | 290,800 |
Credit Saison Co., Ltd. (Japan) | | 1,500 | | | | 47,830 |
Credit Suisse Group (Switzerland)* | | 5,400 | | | | 364,916 |
Deutsche Bank AG (Germany) | | 2,300 | | | | 305,812 |
Deutsche Boerse AG (Germany) | | 850 | | | | 133,900 |
Discover Financial Services | | 3,200 | | | | 61,760 |
Fondiaria-Sai S.p.A. (Italy) | | 4,800 | | | | 224,969 |
Fortis (Belgium) | | 12,500 | | | | 401,440 |
Fortis-Strip VVPR (Belgium) | | 5,000 | | | | 73 |
Franklin Resources, Inc. | | 6,200 | | | | 804,016 |
HBOS PLC (United Kingdom) | | 26,300 | | | | 479,399 |
ING Groep NV (Netherlands) | | 13,800 | | | | 623,742 |
JPMorgan Chase & Co. | | 15,600 | | | | 733,200 |
Julias Baer Holding, Ltd. (Switzerland) | | 3,827 | | | | 331,030 |
Kookmin Bank, Sponsored ADR (South Korea) | | 2,400 | | | | 196,056 |
Man Group PLC (United Kingdom) | | 59,656 | | | | 733,120 |
Mitsubishi Tokyo Financial Group, Inc. (Japan) | | 40,000 | | | | 400,246 |
Muenchener Rueckversicherungs AG (Germany) | | 2,100 | | | | 401,838 |
National Bank of Greece S.A. (Greece) | | 3,075 | | | | 214,870 |
ORIX Corp. (Japan) | | 1,990 | | | | 408,201 |
Royal Bank of Scotland Group PLC (United Kingdom) | | 46,653 | | | | 503,853 |
Safeco Corp. | | 4,800 | | | | 277,920 |
Schroders PLC (United Kingdom) | | 9,300 | | | | 298,890 |
Societe Generale (France) | | 2,230 | | | | 376,737 |
Sumitomo Mitsui Financial Group, Inc. (Japan) | | 56 | | | | 458,714 |
Sun Hung Kai Properties, Ltd. (Hong Kong) | | 11,000 | | | | 210,220 |
Technology Investment Capital Corp. | | 1,400 | 2 | | | 18,270 |
Travelers Companies, Inc., The | | 9,000 | | | | 469,890 |
Wachovia Corp. | | 10,500 | | | | 480,165 |
Washington Mutual, Inc. | | 600 | | | | 16,728 |
XL Capital, Ltd. (Bermuda) | | 1,200 | | | | 86,340 |
Total Financials | | | | | | 21,276,014 |
Health Care - 7.5% | | | | | | |
Abbott Laboratories Co. | | 11,640 | | | | 635,777 |
Aetna, Inc. | | 6,000 | | | | 337,020 |
Allergan, Inc. | | 2,800 | | | | 189,224 |
American Medical Systems Holdings, Inc. * | | 4,600 | | | | 58,834 |
AmerisourceBergen Corp. | | 2,000 | | | | 94,220 |
Amgen, Inc. * | | 11,400 | | | | 662,454 |
Applera Corp. | | 1,400 | | | | 51,996 |
AstraZeneca PLC (United Kingdom) | | 3,800 | | | | 187,132 |
Cepheid, Inc. * | | 10,300 | | | | 266,564 |
The accompanying notes are an integral part of these financial statements.
10
Managers Fremont Global Fund
Schedule of Portfolio Investments (continued)
| | | | | | |
| | | Shares | | | Value |
Health Care - 7.5% (continued) | | | | | | |
CIGNA Corp. | | 800 | | | $ | 41,992 |
Conceptus, Inc. * | | 13,500 | | | | 296,055 |
Covidien Ltd. (Bermuda) | | 9,900 | | | | 411,840 |
CSL Ltd. (Australia) | | 5,457 | | | | 187,473 |
Elan Corp., PLC - Sponsored ADR (Ireland)* | | 5,200 | 2 | | | 123,760 |
Essilor International SA (France) | | 3,257 | | | | 208,116 |
Forest Laboratories, Inc. * | | 5,000 | | | | 195,350 |
Genentech, Inc. * | | 11,600 | | | | 859,908 |
Gilead Sciences, Inc. * | | 22,800 | | | | 1,053,131 |
GlaxoSmithKline PLC (United Kingdom) | | 3,500 | | | | 89,901 |
HMS Holdings Corp. * | | 3,300 | | | | 93,951 |
Humana, Inc. * | | 800 | | | | 59,960 |
ICON PLC. (Ireland)* | | 1,000 | | | | 58,000 |
Insulet Corp. * | | 987 | | | | 24,714 |
Johnson & Johnson Co. | | 11,150 | | | | 726,646 |
Kinetic Concepts, Inc. * | | 1,800 | | | | 108,180 |
King Pharmaceuticals, Inc. * | | 11,900 | | | | 126,140 |
Magellan Health Services, Inc. * | | 2,200 | | | | 92,620 |
Masimo Corp. * | | 2,000 | | | | 68,440 |
McKesson Corp. | | 7,580 | | | | 501,038 |
Medtronic, Inc. | | 26,000 | | | | 1,233,440 |
Merck & Co., Inc. | | 6,400 | | | | 372,864 |
Noven Pharmaceuticals, Inc. * | | 4,000 | | | | 61,840 |
NxStage Medical, Inc. * | | 4,300 | | | | 63,425 |
Omnicell, Inc. * | | 5,800 | | | | 153,120 |
OSI Pharmaceuticals, Inc. * | | 3,600 | 2 | | | 149,652 |
Phase Forward, Inc. * | | 4,000 | | | | 95,160 |
Phonak Holding AG (Switzerland) | | 3,864 | | | | 434,970 |
Regeneration Technologies, Inc. * | | 30,800 | | | | 326,788 |
RehabCare Group, Inc. * | | 1,200 | | | | 24,888 |
Sanofi -Synthelabo SA (France) | | 4,800 | | | | 422,227 |
Sierra Health Services, Inc. * | | 4,400 | | | | 186,120 |
Stryker Corp. * | | 12,200 | | | | 866,200 |
SXC Health Solutions Corp. (Canada)* | | 3,500 | | | | 55,790 |
Tenet Healthcare Corp. * | | 12,600 | 2 | | | 44,226 |
Thermo Fisher Scientific, Inc. * | | 2,600 | | | | 152,906 |
Trans1, Inc.* | | 1,819 | | | | 45,475 |
UnitedHealth Group, Inc. | | 10,020 | | | | 492,483 |
Vertex Pharmaceuticals, Inc. * | | 600 | | | | 19,404 |
Vital Images, Inc. * | | 1,400 | | | | 24,570 |
WellCare Health Plans, Inc. * | | 600 | 2 | | | 14,514 |
Total Health Care | | | | | | 13,050,498 |
Industrials - 7.9% | | | | | | |
A.T. Cross Co., Class A * | | 10,100 | | | | 115,645 |
Air France-KLM (France) | | 6,200 | | | | 236,586 |
Alstom (France) | | 2,534 | | | | 600,977 |
BAE Systems PLC (United Kingdom) | | 24,500 | | | | 254,533 |
Brambles, Ltd. (Australia) | | 22,258 | | | | 296,278 |
Ceco Environmental Corp. * | | 7,700 | | | | 112,112 |
China Communications Construction Co., Ltd. (China) | | 74,000 | | | | 234,803 |
Deutsche Lufthansa AG (Germany) | | 9,800 | | | | 289,330 |
Diamond Management & Technology Consultants, Inc. | | 2,200 | | | | 23,496 |
Emerson Electric Co. | | 5,660 | | | | 295,848 |
Encore Wire Corp. | | 2,800 | | | | 58,800 |
FANUC, Ltd. (Japan) | | 1,400 | | | | 153,467 |
Gamesa Corporacion Tecnologica, S.A. (Spain) | | 4,350 | | | | 221,391 |
General Electric Co. | | 46,700 | | | | 1,922,172 |
L-3 Communications Holdings, Inc. | | 400 | | | | 43,856 |
Lockheed Martin Corp. | | 13,900 | | | | 1,529,556 |
Manitowoc Co., The | | 8,000 | | | | 394,080 |
McDermott International, Inc. * | | 5,400 | | | | 329,724 |
Mitsui O.S.K. Lines, Ltd. (Japan) | | 33,000 | | | | 545,409 |
Nippon Yusen Kabushiki Kaisha (Japan) | | 23,000 | | | | 237,456 |
Northrop Grumman Corp. | | 8,000 | | | | 668,960 |
On Assignment, Inc. * | | 2,600 | | | | 21,684 |
PACCAR, Inc. | | 3,000 | | | | 166,680 |
Parker Hannifin Corp. | | 600 | | | | 48,222 |
Precision Castparts Corp. | | 7,000 | | | | 1,048,670 |
Ryanair Holdings PLC (Ireland)* | | 4,600 | 2 | | | 226,274 |
Solar Power, Inc. | | 10,700 | | | | 42,800 |
Stanley, Inc. * | | 2,900 | | | | 76,792 |
Tredegar Corp. | | 1,800 | | | | 31,356 |
Tyco International Ltd. (Bermuda) | | 11,750 | | | | 483,748 |
Ultralife Batteries, Inc. * | | 13,592 | | | | 182,405 |
United Parcel Service, Inc., Class B | | 7,700 | 2 | | | 578,270 |
United Technologies Corp. | | 21,900 | | | | 1,677,321 |
Vestas Wind Systems A/S (Denmark)* | | 5,600 | | | | 502,395 |
Wright Express Corp. (France) | | 725 | | | | 211,120 |
Total Industrials | | | | | | 13,862,216 |
Information Technology - 14.6% | | | | | | |
Acacia Research Corp. * | | 3,000 | | | | 49,530 |
Accenture Ltd. (Bermuda) | | 11,900 | | | | 464,695 |
The accompanying notes are an integral part of these financial statements.
11
Managers Fremont Global Fund
Schedule of Portfolio Investments (continued)
| | | | | | |
| | | Shares | | | Value |
Information Technology - 14.6% (continued) | | | | | | |
Adobe Systems, Inc. * | | 1,600 | | | $ | 76,640 |
Advanced Analogic Technologies, Inc. * | | 13,100 | | | | 158,248 |
Advanced Micro Devices, Inc. * | | 1,600 | 2 | | | 20,928 |
Airspan Networks, Inc. * | | 18,600 | | | | 44,082 |
Anaren Microwave, Inc. * | | 2,700 | | | | 42,309 |
Apple, Inc. * | | 11,000 | | | | 2,089,450 |
Applied Materials, Inc. | | 8,800 | | | | 170,896 |
ARM Holdings PLC (United Kingdom) | | 78,543 | | | | 242,357 |
ASML Holding N.V. (Netherlands)* | | 15,895 | | | | 553,449 |
Astro-Med, Inc. | | 4,525 | | | | 45,702 |
ATMI, Inc. * | | 3,900 | | | | 125,346 |
Authorize.Net Holdings, Inc. * | | 9,800 | | | | 229,026 |
Autodesk, Inc. * | | 400 | 2 | | | 19,560 |
Automatic Data Processing, Inc. | | 1,200 | | | | 59,472 |
Bottomline Technologies, Inc. * | | 6,200 | | | | 99,572 |
Cisco Systems, Inc. * | | 74,400 | | | | 2,459,664 |
Cognizant Technology Solutions Corp. * | | 19,800 | | | | 820,908 |
CommVault Systems, Inc. * | | 6,773 | | | | 137,763 |
Credence Systems Corp. * | | 5,200 | | | | 15,860 |
CyberSource Corp. * | | 3,300 | | | | 53,955 |
Dell, Inc. * | | 800 | | | | 24,480 |
Double-Take Software, Inc. * | | 8,500 | | | | 202,555 |
Eagle Test Systems, Inc. * | | 18,700 | | | | 236,368 |
eBay, Inc. * | | 800 | | | | 28,880 |
EDGAR Online, Inc. * | | 11,700 | | | | 37,440 |
EMC Corp. * | | 24,300 | 2 | | | 616,977 |
Equinix, Inc. * | | 4,000 | | | | 466,640 |
Exar Corp. * | | 15,400 | | | | 187,264 |
Exfo Electro-Optical Engineering, Inc. (Canada)* | | 18,765 | | | | 120,659 |
Factset Research Systems, Inc. | | 200 | 2 | | | 14,104 |
FalconStor Software, Inc. * | | 7,300 | | | | 102,419 |
FEI Co. * | | 11,100 | | | | 322,011 |
Forrester Research, Inc. * | | 2,700 | | | | 64,044 |
GigaMedia Ltd. (Taiwan)* | | 4,000 | | | | 97,920 |
Google, Inc. * | | 2,300 | | | | 1,626,100 |
Harris Corp. | | 13,200 | | | | 799,392 |
hi/fn, Inc. * | | 12,800 | | | | 89,856 |
High Tech Computer Corp. (Taiwan) | | 10,000 | | | | 206,029 |
HON HAI Precision Industry Co., Ltd. (Taiwan) | | 14,526 | | | | 220,580 |
Hynix Semiconductor, Inc. (South Korea) (a)* | | 5,500 | | | | 152,659 |
Ibiden Co., Ltd. (Japan) | | 1,300 | | | | 110,195 |
International Business Machines Corp. | | 7,200 | | | | 836,064 |
Keynote Systems, Inc. * | | 8,800 | | | | 129,272 |
L-1 Identity Solutions, Inc. * | | 10,692 | 2 | | | 198,550 |
Logitech International SA (Switzerland) | | 11,137 | | | | 387,805 |
Mastercard, Inc. | | 600 | 2 | | | 113,730 |
Microsoft Corp. | | 55,400 | | | | 2,039,273 |
NCI, Inc., Class A * | | 6,300 | | | | 120,582 |
NCR Corp. * | | 1,200 | 2 | | | 33,108 |
Nintendo Co., Ltd. (Japan) | | 500 | | | | 317,539 |
Nokia Oyj (Finland) | | 22,481 | | | | 892,838 |
Omniture, Inc. * | | 5,300 | | | | 181,048 |
Online Resources Corp. * | | 5,259 | | | | 48,646 |
Oracle Corp. * | | 75,100 | | | | 1,664,967 |
Paychex, Inc. | | 2,400 | | | | 100,272 |
Photon Dynamics, Inc. * | | 16,500 | | | | 169,620 |
Photronics, Inc. * | | 5,200 | | | | 56,888 |
PLX Technology, Inc. * | | 4,900 | | | | 51,156 |
Points International, Ltd. (Canada)* | | 60,346 | | | | 126,727 |
Power Integrations, Inc. * | | 12,100 | | | | 393,613 |
QUALCOMM, Inc. | | 10,800 | | | | 461,484 |
Rainmaker Systems, Inc. * | | 9,000 | | | | 76,410 |
Research In Motion, Ltd. (Canada)* | | 4,000 | | | | 498,040 |
RF Micro Devices, Inc. * | | 4,800 | | | | 29,856 |
Rimage Corp. * | | 4,400 | | | | 115,016 |
Safeguard Scientifics, Inc. * | | 7,200 | | | | 16,920 |
Salesforce.com, Inc. * | | 1,000 | 2 | | | 56,370 |
Samsung Electronics Co., Ltd., GDR (South Korea) (a) | | 700 | | | | 213,723 |
Scopus Video Networks, Ltd. (Israel)* | | 16,900 | | | | 89,739 |
SkillSoft PLC (Ireland)* | | 6,500 | | | | 58,175 |
Smith Micro Software, Inc. * | | 5,700 | 2 | | | 87,837 |
Spansion, Inc., Class A * | | 14,600 | 2 | | | 102,930 |
SRS Labs, Inc. * | | 16,100 | | | | 103,684 |
Stratasys, Inc. * | | 2,656 | | | | 69,136 |
SupportSoft, Inc. * | | 13,200 | | | | 63,360 |
Symantec Corp. * | | 20,460 | | | | 384,239 |
Techwell, Inc. * | | 11,700 | | | | 145,314 |
Teradata Corp. | | 2,200 | | | | 62,766 |
Teradyne, Inc. * | | 12,000 | | | | 148,080 |
Toshiba Corp. (Japan) | | 40,000 | | | | 338,731 |
Volterra Semiconductor Corp. * | | 6,700 | | | | 82,343 |
WJ Communications, Inc. * | | 85,200 | | | | 90,312 |
The accompanying notes are an integral part of these financial statements.
12
Managers Fremont Global Fund
Schedule of Portfolio Investments (continued)
| | | | | | | |
| | | Shares | | | Value | |
Information Technology - 14.6% (continued) | | | | | | | |
Xerox Corp. * | | 31,800 | | | $ | 554,592 | |
Yahoo Japan Corp. (Japan) | | 273 | | | | 121,526 | |
Total Information Technology | | | | | | 25,538,265 | |
Materials - 4.3% | | | | | | | |
Alcoa, Inc. | | 14,960 | | | | 592,266 | |
Antofagasta PLC (United Kingdom) | | 8,900 | | | | 155,702 | |
Arcelor Mittal (Luxembourg) | | 5,079 | | | | 404,643 | |
BASF AG (Germany) | | 4,500 | | | | 622,960 | |
BHP Billiton PLC (United Kingdom) | | 9,035 | | | | 346,990 | |
Buzzi Unicem S.p.A. (Italy) | | 6,400 | | | | 181,959 | |
Calgon Carbon Corp. * | | 20,900 | | | | 311,410 | |
Cemex SAB de C.V. (Mexico)* | | 15,306 | | | | 469,435 | |
Compania Vale do Rio Doce - ADR (Brazil) | | 10,800 | | | | 406,944 | |
Ecolab, Inc. | | 5,000 | 2 | | | 235,850 | |
JFE Holdings, Inc. (Japan) | | 7,500 | | | | 439,038 | |
Kazakmys PLC (United Kingdom) | | 6,800 | | | | 209,203 | |
Mitsubishi Chemical Holdings Corp. (Japan) | | 26,500 | | | | 219,262 | |
Mitsui Petrochemical (Japan) | | 27,000 | | | | 253,948 | |
Monsanto Co. | | 3,000 | 2 | | | 292,890 | |
Northern Technologies International Corp. * | | 7,350 | | | | 82,688 | |
Pacific Metals Co., Ltd. (Japan) | | 2,000 | | | | 25,335 | |
POSCO, Sponsored ADR (South Korea) | | 1,500 | 2 | | | 275,625 | |
Potash Corp. of Saskatchewan (Canada) | | 1,800 | 2 | | | 221,076 | |
Rio Tinto PLC (United Kingdom) | | 3,841 | | | | 360,190 | |
Salzgitter AG (Germany) | | 1,506 | | | | 296,516 | |
Southern Copper Corp. | | 3,000 | | | | 419,100 | |
Stora Enso Oyj (Finland) | | 5,300 | | | | 97,765 | |
Xstrata PLC (United Kingdom) | | 9,624 | | | | 693,947 | |
Total Materials | | | | | | 7,614,742 | |
Telecommunication Services - 3.0% | | | | | | | |
America Movil , S.A. de C.V. (Mexico) | | 11,400 | | | | 745,446 | |
AT&T, Inc. | | 5,800 | | | | 242,382 | |
Centurytel, Inc. | | 5,000 | | | | 220,250 | |
China Mobile Ltd. (Hong Kong) | | 15,500 | | | | 320,439 | |
China Netcom Group Corp. (Hong Kong) | | 83,500 | | | | 256,626 | |
France Telecom SA (France) | | 9,474 | | | | 350,349 | |
Millicom International Cellular S.A. (Luxembourg)* | | 5,400 | 2 | | | 634,392 | |
MTN Group Ltd. (South Africa) | | 12,088 | | | | 235,609 | |
Nippon Telegraph & Tel Corp. (Japan) | | 43 | | | | 196,796 | |
Qwest Communications International, Inc. * | | 62,200 | 2 | | | 446,596 | |
Rogers Communications, Inc., Class B (Canada) | | 5,100 | | | | 259,899 | |
Telefonica SA (Spain) | | 11,222 | | | | 371,573 | |
Turkcell Iletisim Hizmetleri Sponsored ADR (Turkey) | | 4,800 | | | | 115,393 | |
Vodafone Group PLC (United Kingdom) | | 240,197 | | | | 946,505 | |
Total Telecommunication Services | | | | | | 5,342,255 | |
Utilities - 2.2% | | | | | | | |
AES Corp., The * | | 4,800 | | | | 102,768 | |
American Electric Power Co., Inc. | | 5,400 | | | | 260,334 | |
Centerpoint Energy, Inc. | | 11,600 | 2 | | | 194,416 | |
CMS Energy Corp. | | 2,400 | | | | 40,728 | |
Dynegy, Inc. * | | 12,000 | 2 | | | 110,520 | |
E.ON AG (Germany) | | 2,300 | | | | 449,649 | |
Exelon Corp. | | 8,520 | | | | 705,286 | |
Iberdrola S.A. (Spain) | | 27,460 | | | | 442,976 | |
Oneok, Inc. | | 1,000 | | | | 49,940 | |
Pepco Holdings, Inc. | | 5,500 | | | | 156,695 | |
RWE AG (Germany) | | 1,720 | | | | 234,967 | |
Sempra Energy | | 2,900 | 2 | | | 178,379 | |
Tokyo Electric Power Co., Inc., The (Japan) | | 7,000 | | | | 177,624 | |
Veolia Environment (France) | | 9,041 | | | | 809,425 | |
Total Utilities | | | | | | 3,913,707 | |
Total Common Stocks
(cost $ 94,681,743) | | | | | | 119,150,052 | |
Warrants - 0.4% | | | | | | | |
AU Optronics Corp.
(Luxembourg), 01/17/12 | | 149,260 | | | | 316,133 | |
United Microelectronics Corp.
(Luxembourg), 01/24/17 (a) | | 505,827 | | | | 331,822 | |
Total Warrants
(cost $536,216) | | | | | | 647,955 | |
Other Investment Companies - 29.8% | | | | | | | |
Managers Global Bond Fund 4
(cost $48,391,065) | | 2,309,270 | | | | 52,189,513 | |
Short-Term Investments - 7.1%1 | | | | | | | |
Bank of New York Institutional Cash Reserves Fund, 5.09%3 | | 9,819,153 | | | | 9,819,153 | |
Dreyfus Cash Management Fund, Institutional Class Shares, 4.94% | | 2,645,290 | | | | 2,645,290 | |
Total Short-Term Investments
(cost $12,464,443) | | | | | | 12,464,443 | |
Total Investments - 105.3%
(cost $156,073,467) | | | | | | 184,451,963 | |
Other Assets, less Liabilities - (5.3)% | | | | | | (9,347,142 | ) |
Net Assets - 100.0% | | | | | $ | 175,104,821 | |
The accompanying notes are an integral part of these financial statements.
13
Managers Small Cap Fund
Portfolio Manager’s Comments
The Managers Small Cap Fund seeks to achieve long-term capital appreciation by investing primarily in the stocks of small-capitalization companies.
The Portfolio Manager
TimesSquare Capital Management LLC’s (“TimesSquare”) utilizes a bottom-up fundamental approach to small cap investing. Led by co-managers Yvette Bockstein and Grant Babyak, the investment team at TimesSquare believes its proprietary fundamental research skills, which place a particular emphasis on the assessment of management quality and an in-depth understanding of superior business models, enable the team to build a diversified portfolio of small cap growth stocks designed to generate good risk-adjusted returns. When selecting small-cap growth stocks, the portfolio manager utilizes a fundamental, bottom-up process to identify companies that demonstrate consistent and sustainable revenue and earnings growth, offer distinct and sustainable competitive advantages, have strong, experienced management teams, have stocks selling at reasonable valuations, and that the investment team believes have the potential to appreciate in price by 25-50% within the next 12-18 months.
The Year in Review
Though small caps lagged large caps over the twelve months ended October 31, 2007, small cap growth stocks made a strong showing. The growth style came to life this past year in the small, mid, and large capitalization spaces thanks to the favorable impact of the technology sector on the growth benchmarks and the underperformance of the financial services sector in the value benchmarks. The Russell 2000® Index rose 9.3% for the period vs. 15.0% for the Russell 1000® Index. Growth stocks led value stocks in all size categories. The Russell 2000® Growth Index rose 16.7% while the Russell 2000® Value Index was up only 2.1%.
Within the portfolio, excellent stock selection in healthcare, energy, and very strong relative performance in financial services was offset by weakness in the Fund’s consumer discretionary and materials and processing holdings.
The energy sector had a strong year and the Fund’s energy holdings delivered exceptional performance. Stronger than expected production growth helped fuel the Fund’s oil and gas exploration companies. Denbury Resources and Quicksilver Resources made excellent contributions, up 27% and 21%, respectively. M&A activity also contributed to the Fund’s strong performance. Universal Compression, which provides compression services to the domestic and international natural gas industry, merged with Hanover Compressor and changed its name to Exterran Holdings; the position was up approximately 40% for this twelve month period.
The Fund’s Healthcare stocks put in an excellent twelve months as well, far outperforming the benchmark. Pharmion, one of the top contributors, up 95%, is a specialty pharmaceutical company with a track record of successfully in-licensing, developing, and commercializing oncology drugs. After reporting better than expected revenues at the end of July, the company released favorable statistically significant results on survival benefits of its lead product Vidaza for treating myelodysplastic syndrome (MDS). A good contribution also came from BioMarin Pharmaceuticals, a biotechnology company focused on enzyme replacement therapies for rare genetic diseases, a niche market with low clinical and regulatory risks and high barriers to entry. It returned almost 72% over the period. The FDA granted priority review status to its new drug application for Kuvan for treating PKU, a rare genetic metabolic disorder. Respironics is the global leader in respiratory devices with a 50% share of the approximate $1.1 billion worldwide obstructive sleep apnea therapy market, which is only 15-20% penetrated and growing at 15-20% per year, benefited from new product launches and a reacceleration of growth in 2007. It was a good contributor with its 42% gain. Following a string of better than expected quarterly earnings reports, the portfolio manager took some profits in medical waste management company, Stericycle; the stock was up 65% for the period, favorably impacting results.
Within the financial services sector, M&A activity contributed to the Fund’s strong relative results. Alliance Data Systems, which provides transaction services, credit services, and marketing services in North America, was the portfolio’s top contributor, up 27% after the company agreed to a $6.43 billion cash takeover by private equity firm Blackstone Group. A top contributor to the portfolio was Investors Financial Services, up 77%. State Street agreed and completed its acquisition of the provider of asset administration services to financial services organizations, in a stock transaction valued at approximately $4.5 billion. Huron Consulting Group, which provides financial and operational consulting services, reported several quarters of better than expected revenues and earnings; the position was among the top contributors, up 72%. On the negative side, Clayton Holdings was sold. The company provides outsourced services, mortgage-related analytics, and specialized consulting services for buyers and sellers of, and investors in, mortgage-related loans and securities and other debt instruments; it was down 66%.
The consumer discretionary sector has been challenged by the economic environment and the Fund’s holdings were detractors as a group. The portfolio’s bottom contributor was Pool Corporation, down 42%. The distributor of swimming pool supplies is experiencing tougher industry conditions than was anticipated. Though sixty five to seventy percent of its revenues are recurring in nature, new pool construction is down 20%. That led to lowered earning expectations for 2007 and 2008. The Fund’s position in the stock was pared back, but the portfolio manager still believes this is a very attractive business model over the long term. Corporate Executive Board which provides research, decision support tools, and executive education focusing on corporate strategy, operations, and general management issues was down 19% as revenue growth decelerated. TimesSquare still looks for greater than 15% growth over the long term and finds the valuation reasonable at current prices. On a positive note, Capella Education was purchased over
14
Managers Small Cap Fund
Portfolio Manager’s Comments (continued)
the course of the year; it was up about 95%. The provider of online post-secondary education services (Capella University) targeting adults reported several strong quarters and raised forward guidance. A combination of demographic trends and secular changes in America’s workforce continues to stimulate end demand for these education services. Growth opportunities exist as the company focuses on niche markets and specializations, and a targeted marketing strategy which should thus increase enrollment over time.
The Fund’s holdings in the materials and processing sector made a negative contribution to results. Mobile Mini was one of the larger culprits, off 44%. The company, which provides portable storage solutions including refurbished and modified storage units, has been experiencing weakness in some of its more mature markets. The team at TimesSquare is encouraged that the company is buying back stock and that their international business continues to experience good growth.
Relative results in the technology sector were held back by a couple of poor contributors. PDF Solutions, which makes process design solutions for semiconductors had weak performance due to a negative earnings pre-announcement; it was down 44% over the period. The portfolio manager reduced the Fund’s position in American Reprographics, which provides document management services to the architectural, engineering, and construction industry. The company reported disappointing revenues. Though most of their business is dependent on the commercial construction cycle, the downturn in residential construction affected them more than had been anticipated and the position was among the poorer contributors, down 43%. The team at TimesSquare believes the stock is inexpensive at the current levels. On the positive side, Synaptics, which develops and makes custom-designed user interface solutions that enable people to interact with various mobile computing, communications, entertainment, and other electronic devices benefited from the interest the technology garnered due to the success of the i-phone. The stock rose 93%, making a good contribution to performance.
Looking Forward
The economy has shown more signs of slowing with continued weakness in the housing and related consumer sectors. The Federal Reserve’s recently released minutes showed that it expects the economy to be soft into 2008 but it also considers the risks to growth and inflation about equal. Volatility is on the upswing as the economy is teetering on a tightrope between signs of too much weakness on one hand and inflation pressures on the other. Credit concerns are back in the spotlight with new write-off announcements surfacing frequently. The portfolio management team at TimesSquare expects that the fallout from the sub-prime and housing slowdown will take longer to stabilize than the markets had hoped.
Growth stocks are having a good year thus far and the portfolio management team at TimesSquare continues to find solid businesses that are benefiting from global growth opportunities. The portfolio management team’s emphasis remains on identifying top tier management teams operating companies deemed to have attractive business models that are diversified and selling at reasonable valuations.
15
Managers Small Cap Fund
Portfolio Manager’s Comments (continued)
Cumulative Total Return Performance
Managers Small Cap’s cumulative total return is based on the daily change in net asset value (NAV), and assumes that all distributions were reinvested. The Russell 2000® Growth Index measures the performance of those Russell 2000® companies with higher price-to-book ratios and higher forecasted growth values. Unlike the Fund, the above stated index is unmanaged, is not available for investment, and does not incur expenses. This chart compares a hypothetical $10,000 investment made in the Managers Small Cap Fund on October 31, 1997 to a $10,000 investment made in the Russell 2000® Growth Index for the same time period. Performance for periods longer than one year is annualized. The graph and table do not reflect the deduction of taxes that a shareholder would pay on a Fund distribution or redemption of shares. The listed returns for the Fund are net of expenses and the returns for the index exclude expenses. Total returns for the Fund would have been lower had certain expenses not been reduced.
The table below shows the average annual total returns for the Managers Small Cap Fund and the Russell 2000® Growth Index since inception through October 31, 2007.
| | | | | | | | | |
Average Annualized Total Returns 1 | | One Year | | | Five Years | | | Ten Years | |
Small Cap 2,3 | | 15.51 | % | | 18.46 | % | | 8.83 | % |
Russell 2000® Growth Index | | 16.73 | % | | 18.57 | % | | 4.75 | % |
The performance data shown represents past performance. Past performance is not a guarantee of future results. Current performance may be lower or higher than the performance data quoted. The investment return and principal value of an investment in the Fund will fluctuate so that an investor’s shares, when redeemed, may be worth more or less than their original cost. For performance information through the most recent month end, please call (800) 835-3879 or visit our website at www.managersinvest.com.
1 | Total return equals income yield plus share price change and assumes reinvestment of all dividends and capital gain distributions. Returns are net of fees and may reflect offsets of Fund expenses as described in the Prospectus. No adjustment has been made for taxes payable by shareholders on their reinvested dividends and capital gain distributions. Returns for periods greater than one year are annualized. The listed returns on the Fund are net of expenses. All returns are in U.S. dollars($). |
2 | Fund for which, from time to time, the Fund’s advisor has waived its fees and/or absorbed Fund expenses, which has resulted in higher returns. |
3 | The Fund is subject to risks associated with investments in small-capitalization companies, such as erratic earnings patterns, competitive conditions, limited earnings history, and a reliance on one or a limited number of products. |
16
Managers Small Cap Fund
Fund Snapshots
October 31, 2007
Portfolio Breakdown
| | | | | | |
Industry | | Small Cap** | | | Russell 2000® Growth Index | |
Information Technology | | 25.4 | % | | 23.5 | % |
Health Care | | 21.0 | % | | 21.0 | % |
Industrials | | 15.1 | % | | 16.2 | % |
Financials | | 11.4 | % | | 8.1 | % |
Consumer Discretionary | | 9.4 | % | | 16.4 | % |
Energy | | 9.0 | % | | 6.7 | % |
Consumer Staples | | 3.7 | % | | 2.3 | % |
Telecommunication Services | | 1.8 | % | | 1.6 | % |
Utilities | | 1.0 | % | | 0.5 | % |
Materials | | 0.0 | % | | 3.7 | % |
Other Assets and Liabilities | | 2.2 | % | | 0.0 | % |
Top Ten Holdings
| | | |
Security Name | | Percentage of Net Assets | |
Global Payments, Inc.* | | 2.4 | % |
Magellan Health Services, Inc.* | | 1.9 | |
Exterran Holdings, Inc. | | 1.9 | |
Respironics, Inc.* | | 1.8 | |
DealerTrack Holdings, Inc. | | 1.8 | |
Wright Express Corp. | | 1.7 | |
Solera Holdings, Inc. | | 1.7 | |
Bio-Rad Laboratories, Inc. | | 1.5 | |
Henry (Jack) & Associates, Inc. | | 1.5 | |
Denbury Resources, Inc. | | 1.5 | |
| | | |
Top Ten as a Group | | 17.7 | % |
| | | |
* Top Ten Holding at April 30, 2007 | | | |
Any sectors, industries, or securities discussed should not be perceived as investment recommendations. Mention of a specific security should not be considered a recommendation to buy or solicitation to sell that security.
17
Managers Small Cap Fund
Schedule of Portfolio Investments
October 31, 2007
| | | | | | |
| | | Shares | | | Value |
Common Stocks - 97.8% | | | | | | |
Consumer Discretionary - 9.4% | | | | | | |
Capella Education Co.* | | 16,600 | | | $ | 1,029,200 |
Corinthian Colleges, Inc.* | | 33,200 | 2 | | | 544,148 |
Dolan Media Co.* | | 20,900 | | | | 564,300 |
Gaylord Entertainment Co., Class A* | | 19,300 | | | | 1,051,464 |
Hibbett Sports, Inc.* | | 25,300 | | | | 596,827 |
Iconix Brand Group, Inc.* | | 27,700 | | | | 632,945 |
Monro Muffler Brake, Inc. | | 25,500 | | | | 580,890 |
Movado Group, Inc. | | 16,300 | | | | 490,467 |
Orient-Express Hotels, Ltd. | | 17,600 | | | | 1,140,480 |
Pool Corp. | | 36,650 | | | | 864,207 |
RC2 Corp.* | | 6,500 | | | | 193,830 |
RRSat Global Communications Network, Ltd.* | | 22,200 | | | | 497,058 |
Total Consumer Discretionary | | | | | | 8,185,816 |
Consumer Staples - 3.7% | | | | | | |
Central Garden & Pet Co., Class A* | | 33,600 | | | | 279,552 |
Chattem, Inc.* | | 7,600 | 2 | | | 564,680 |
Herbalife Ltd. | | 25,100 | | | | 1,106,659 |
Smart Balance, Inc.* | | 35,000 | | | | 422,100 |
United Natural Foods, Inc.* | | 29,200 | 2 | | | 845,048 |
Total Consumer Staples | | | | | | 3,218,039 |
Energy - 90% | | | | | | |
Arena Resources, Inc.* | | 21,800 | | | | 795,918 |
Bolt Technology Corp.* | | 11,200 | | | | 484,400 |
Cal Dive International, Inc.* | | 44,700 | | | | 591,381 |
Denbury Resources, Inc.* | | 22,600 | | | | 1,279,160 |
Exterran Holdings, Inc.* | | 19,200 | 2 | | | 1,616,640 |
Hercules Offshore, Inc.* | | 21,270 | | | | 575,141 |
NATCO Group, Inc.* | | 10,800 | | | | 575,748 |
Quicksilver Resources, Inc.* | | 19,350 | | | | 1,102,950 |
T-3 Energy Services, Inc.* | | 16,100 | | | | 765,072 |
Total Energy | | | | | | 7,786,410 |
Financials - 11.4% | | | | | | |
Argo Group International Holdings, Ltd.* | | 19,774 | | | | 842,570 |
Assured Guaranty, Ltd. | | 36,400 | | | | 839,748 |
Bank of Florida Corp.* | | 28,000 | | | | 384,440 |
Clayton Holdings, Inc.* | | 6,700 | | | | 32,161 |
Cohen & Steers, Inc. | | 12,700 | | | | 477,520 |
Duff & Phelps Corp., Class A* | | 11,700 | | | | 248,040 |
DuPont Fabros Technology, Inc.* | | 19,800 | 2 | | | 425,304 |
Evercore Partners, Inc., Class A | | 21,000 | | | | 544,530 |
FirstService Corp.* | | 14,500 | | | | 550,710 |
Information Services Group, Inc.* | | 76,000 | | | | 573,040 |
Jefferies Group, Inc. | | 32,500 | 2 | | | 868,725 |
Markel Corp.* | | 1,525 | | | | 828,410 |
optionsXpress, Inc. | | 32,900 | | | | 979,104 |
Portfolio Recovery Associates, Inc. | | 20,900 | | | | 942,799 |
Primus Guaranty, Ltd.* | | 64,800 | | | | 593,568 |
Pzena Investment Management, Inc., Class A | | 6,700 | 2 | | | 129,846 |
Resource America, Inc. | | 20,900 | | | | 323,323 |
Resource Capital Corp. | | 31,500 | | | | 325,080 |
Total Financials | | | | | | 9,908,918 |
Health Care - 21.0% | | | | | | |
American Dental Partners, Inc.* | | 23,150 | | | | 573,888 |
Aspreva Pharmaceuticals Corp.* | | 22,300 | | | | 568,204 |
AtriCure, Inc.* | | 41,400 | | | | 471,132 |
BioMarin Pharmaceutical, Inc.* | | 23,600 | | | | 654,428 |
Bio-Rad Laboratories, Inc.* | | 13,480 | 2 | | | 1,301,898 |
Dionex Corp.* | | 10,700 | | | | 941,600 |
DJ Orthopedics, Inc.* | | 24,800 | | | | 1,238,760 |
ev3, Inc.* | | 33,858 | | | | 497,035 |
FGX International Holdings, Ltd. | | 23,400 | | | | 400,142 |
Haemonetics Corp.* | | 23,000 | | | | 1,181,970 |
LHC Group, Inc.* | | 22,100 | | | | 507,858 |
Magellan Health Services, Inc.* | | 38,500 | | | | 1,620,850 |
MWI Veterinary Supply, Inc.* | | 21,300 | | | | 889,275 |
Nighthawk Radiology Holdings, Inc.* | | 18,700 | | | | 440,198 |
Pediatrix Medical Group, Inc.* | | 6,600 | | | | 432,300 |
Pharmion Corp.* | | 16,800 | | | | 808,416 |
PolyMedica Corp. | | 17,295 | | | | 915,943 |
Qiagen N.V.* | | 36,695 | 2 | | | 863,800 |
Respironics, Inc.* | | 31,600 | | | | 1,581,896 |
Stereotaxis, Inc.* | | 26,600 | | | | 409,640 |
Syneron Medical Ltd.* | | 30,600 | | | | 559,674 |
VCA Antech, Inc.* | | 20,600 | | | | 948,630 |
Volcano Corp.* | | 26,400 | | | | 451,176 |
Total Health Care | | | | | | 18,258,713 |
Industrials - 15.1% | | | | | | |
Advisory Board Co., The* | | 17,200 | | | | 1,104,412 |
American Reprographics Co.* | | 21,900 | | | | 444,132 |
Corporate Executive Board Co. | | 16,700 | | | | 1,189,875 |
CoStar Group, Inc.* | | 15,000 | | | | 862,500 |
Hub Group, Inc.* | | 23,600 | | | | 598,732 |
The accompanying notes are an integral part of these financial statements.
18
Managers Small Cap Fund
Schedule of Portfolio Investments (continued)
| | | | | | | |
| | | Shares | | | Value | |
Industrials - 15.1% (continued) | | | | | | | |
Huron Consulting Group, Inc.* | | 13,500 | | | $ | 943,380 | |
Kenexa Corp.* | | 27,700 | | | | 812,164 | |
Mobile Mini, Inc.* | | 53,200 | | | | 953,876 | |
Nuco2, Inc.* | | 17,300 | | | | 446,167 | |
On Assignment, Inc.* | | 79,700 | | | | 664,698 | |
Orbital Sciences Corp.* | | 37,000 | | | | 944,610 | |
RBC Bearings, Inc.* | | 20,100 | | | | 807,819 | |
Resources Connection, Inc. | | 43,100 | | | | 981,387 | |
Ritchie Bros. Auctioneers, Inc. | | 8,000 | | | | 598,640 | |
Stericycle, Inc.* | | 15,200 | | | | 886,616 | |
UTI Worldwide, Inc. | | 36,700 | | | | 936,217 | |
Total Industrials | | | | | | 13,175,225 | |
Information Technology - 25.4% | | | | | | | |
Advanced Analogic Technologies, Inc.* | | 58,800 | | | | 710,304 | |
Alvarion, Ltd.* | | 60,000 | | | | 754,800 | |
Applied Micro Circuits Corp.* | | 139,400 | | | | 448,868 | |
Authorize.Net Holdings, Inc.* | | 28,800 | | | | 673,056 | |
Cognex Corp. | | 25,200 | | | | 453,096 | |
CommVault Systems, Inc.* | | 25,900 | | | | 526,806 | |
CPI International, Inc.* | | 30,500 | | | | 619,760 | |
DealerTrack Holdings, Inc.* | | 31,700 | | | | 1,556,153 | |
Dice Holdings, Inc.* | | 41,600 | | | | 532,896 | |
Global Payments, Inc. | | 43,300 | | | | 2,059,347 | |
Henry (Jack) & Associates, Inc. | | 44,000 | | | | 1,285,680 | |
Informatica Corp.* | | 41,300 | 2 | | | 705,404 | |
J2 Global Communications, Inc.* | | 18,400 | | | | 619,896 | |
Mellanox Technologies, Ltd.* | | 21,400 | | | | 505,254 | |
MICROS Systems, Inc.* | | 10,000 | 2 | | | 718,200 | |
Orbcomm, Inc.* | | 32,200 | | | | 265,650 | |
PDF Solutions, Inc.* | | 51,200 | | | | 404,480 | |
RADVision Ltd.* | | 30,000 | | | | 391,800 | |
Semtech Corp.* | | 31,000 | | | | 530,410 | |
Si International, Inc.* | | 23,900 | | | | 674,219 | |
SkillSoft PLC* | | 65,000 | | | | 581,750 | |
Solera Holdings, Inc.* | | 67,900 | 2 | | | 1,460,529 | |
Synaptics, Inc.* | | 13,000 | | | | 706,550 | |
The Knot, Inc.* | | 24,900 | | | | 482,811 | |
THQ, Inc.* | | 23,300 | 2 | | | 631,197 | |
Ultimate Software Group, Inc., The* | | 28,800 | | | | 993,888 | |
Varian Semiconductor Equipment Associates, Inc.* | | 3,800 | 2 | | | 174,876 | |
ViaSat, Inc.* | | 26,500 | | | | 808,250 | |
Voltaire Ltd.* | | 51,200 | | | | 363,520 | |
Wright Express Corp.* | | 38,300 | | | | 1,482,210 | |
Total Information Technology | | | | | | 22,121,660 | |
Telecommunication Services - 1.8% | | | | | | | |
General Communication, Inc., Class A* | | 47,300 | | | | 554,829 | |
NTELOS Holdings Corp. | | 33,600 | | | | 1,014,384 | |
Total Telecommunication Services | | | | | | 1,569,213 | |
Utilities - 1.0% | | | | | | | |
ITC Holdings Corp. | | 15,600 | | | | 892,944 | |
Total Common Stocks
(cost $59,920,775) | | | | | | 85,116,938 | |
Preferred Stock - 0.1% | | | | | | | |
Firstservice Corp., 7.000%
(cost $76,035) | | 4,660 | | | | 97,394 | |
Other Investment Companies - 12.0%1 | | | | | | | |
Bank of New York Institutional Cash Reserves Fund, 5.09% 3 | | 7,614,220 | | | | 7,614,220 | |
Dreyfus Cash Management Fund, Institutional Class Shares, 4.94% | | 2,791,659 | | | | 2,791,659 | |
Total Other Investment Companies
(cost $10,405,879) | | | | | | 10,405,879 | |
Total Investments - 109.9%
(cost $70,402,689) | | | | | | 95,620,211 | |
Other Assets, less Liabilities - (9.9)% | | | | | | (8,604,859 | ) |
Net Assets - 100.0% | | | | | $ | 87,015,352 | |
The accompanying notes are an integral part of these financial statements.
19
Managers Real Estate Securities Fund
Portfolio Manager’s Comments
Managers Real Estate Securities Fund seeks a combination of income and long-term capital appreciation by investing in stocks of companies that are principally engaged in owning and operating commercial real estate properties for the benefit of their investors including Real Estate Investment Trusts (REIT’s). Managers utilizes an independent subadvisor to manage assets of the portfolio. Todd Briddell leads the investment team of Urdang Securities Management, Inc (“Urdang”) in managing this Fund.
The Portfolio Manager
Urdang Securities Management, Inc.
Todd Briddell and the investment team at Urdang believe real estate securities play an important role in a multi-asset class investment portfolio. Urdang’s strategy recognizes that real estate securities are not simply stocks, or real estate. They are hybrid financial investments that must be valued on the basis of a number of meaningful factors, only one of which is the value of the firm’s property portfolio. To accurately assess the relative value of a REIT security, they take into account critical business and market factors, such as: the company’s capitalization, its position within public capital markets, and the quality of the management team.
Investment success is the result of the company’s ability to provide a consistently accurate answer to the question at the heart of its value-oriented investment strategy: Which REITs does Urdang believe will generate the highest risk-adjusted returns? Overall, Urdang believes:
A Diversified portfolio + Value orientation = Strong, risk-adjusted returns.
Urdang employs a value-oriented investment process with two distinct and complementary components: bottom-up real estate research and the company’s proprietary Relative Value Model (RVM) securities valuation process, which was designed to provide a uniform basis for evaluating the validity of a security’s trading price. Combining real estate research and the RVM process has been central to Urdang’s track record of delivering strong returns without incurring high levels of risk.
The Year in Review
For the 12 month period ended October 31, 2007, the Fund returned a positive 2.10% compared to a decline of 1.24% for the Dow Jones Wilshire REIT Index (Float-Adjusted) during the same period. The Dow Jones Industrial Average returned 17.93% and the S&P 500 Index returned 14.56%.
After seven years of significantly outperforming the broader equity markets, the REIT market underperformed most asset classes during the year ended October 31, 2007. The frenetic merger and privatization activity that drove the REIT market during 2006 and early 2007 came to an abrupt halt when the subprime-induced capital crunch afflicted the financial markets.
Real estate fundamentals remain healthy with limited supply growth and demand growth at or above historical trend levels.
Demand for space exceeds new construction in most markets and for property types. Rents may rise less rapidly in a slowing demand environment, but with commercial real estate vacancies near historic lows and limited new construction, landlords’ pricing power is unlikely to erode too much. Quality properties located in high barrier-to-entry, supply-constrained markets typically experience the strongest relative rent growth and occupancy throughout the cycle. REIT asset quality is generally high, which should allow them to outperform the broader real estate markets at all points in the cycle.
The difficult single-family home market should benefit apartment owners. Owning had been an attractive alternative to renting thanks to record low interest rates. However, a lower availability of mortgage capital for lower credit buyers combined with much more stringent underwriting standards for all borrowers will make home ownership more difficult for some. The rent versus own dynamic has shifted increasing demand for apartments at the expense of single-family homes benefiting landlords.
The slowdown in consumer spending has not affected retailer demand for space. Bolstered by retailers’ desire to expand store counts and grow top-line revenue, tenants continue to covet quality space in the best shopping centers and regional malls in the nation’s best and largest urban markets. The national vacancy rate is less than 10% thanks to several years of below average new supply and above average demand. Regional malls, which have seen scant new supply over the past decade, are enjoying strong rent growth today. Retail fundamentals have started to decelerate as retailer optimism has dimmed in the face of slower consumer spending growth. The projected increase in new supply of shopping center space, particularly if demand were to slow considerably, is cause for concern.
The portfolio is constantly repositioned to exploit the best risk-adjusted opportunities. The portfolio management team at Urdang made several significant portfolio changes over the course of the past year. Several months ago the portfolio manager reduced exposure to REITs with above average financial leverage in order to insulate the portfolio from rising capitalization rates and increased volatility in the debt market. Additionally Urdang increased exposure to more defensive sectors—shopping centers, triple net, and healthcare—and moved the portfolio away from economically sensitive sectors like hotels, apartments, and offices. This move was gradual earlier in the year but occurred at an accelerated pace in the second half of the year. Early in 2007 hotel REITs strongly outperformed as valuations were buoyed by the crest of the privatization wave. However, disruption in the debt markets and concern over a weakening economy’s effect on industry fundamentals put an abrupt end to this phenomenon in August and hotel REIT valuations rapidly began to reverse. Urdang reallocated away from hotels at the start of the credit crisis in favor of neighborhood and community shopping center REITs. The long-term leases of shopping centers offer more stable cash flow and the properties are less sensitive to the economy given the everyday-necessity-goods-nature of the tenants’ sales.
20
Managers Real Estate Securities Fund
Portfolio Manager’s Comments (continued)
Positive contributions to the Funds’ performance relative to the benchmark were generated by all property sectors. The Fund’s overweight to the healthcare sector and relative underweight to the office sector were well rewarded. An underweight to the industrial sector, which strongly outperformed the REIT market as a whole, did not work quite as well.
Hilton Hotels, which was acquired by The Blackstone Group LP, contributed significantly to the Fund’s performance. Two health-care REITs in which the Fund held a substantial weight, Ven-tas, Inc. (VTR) and Nationwide Health Properties, Inc. (NHP), delivered total returns to the Fund of approximately 15%. Lastly, the Fund benefited from exposure to free-standing net lease retail owner National Retail Properties Trust (NNN) which returned 10.4% for the Fund.
While the portfolio contained nineteen positions that delivered total returns exceeding 10% to the Fund, eleven positions delivered total returns to the fund of negative 10% or greater. Cash drag negatively impacted performance by roughly 4 basis points.
Looking Forward
The portfolio management team at Urdang continuously scrutinizes and adjusts portfolio strategy. The team’s initial 2008 strategy will favor those REITs with low financial leverage, a preponderance of high quality properties located in the most desirable urban markets, diversified business models, global exposure, and those that build shareholder value through fund management and joint ventures.
The team at Urdang is cautiously optimistic for 2008. Real estate demand and supply are in balance. Sound operating fundamentals, mid- to high-single digit earnings growth, and capital flows from institutional, foreign, and private investors should support REIT valuations in the near-term. The Federal Reserve’s recent rate cuts should help hold overall borrowing relatively constant. At the same time greater lender scrutiny and vigilance should staunch the virtually unrestricted flow of cheap capital to the least creditworthy borrowers in favor of more rational allocation to better capitalized owners, primarily REITs.
Real estate has been a beneficiary of the low inflation, moderate growth environment of the past few years. This environment has led to falling capitalization rates and rising values. Dislocation in the debt markets could cause required returns for all asset classes—including real estate capitalization rates (the required yield on initial investment for real estate)—to rise. Given the deterioration in the macro environment and debt markets a modest increase in cap rates relative to their nadir earlier this year is to be expected, particularly with respect to non-core properties located in tertiary markets. However, the team at Urdang believes the REIT market correction reflects an unrealistically high expectation for an increase in cap rates.
The diversification, correlation, and current income benefits of REITs and real estate are present irrespective of short-term volatility or the vagaries of the capital cycle. Urdang believes real estate securities remain capable of generating 7% to 9% long-term total returns which is in-line with the historical average for the asset class.
21
Managers Real Estate Securities Fund
Portfolio Manager’s Comments (continued)
Cumulative Total Return Performance
The Fund’s cumulative total return is based on the daily change in net asset value (NAV), and assumes that all distributions were reinvested. The Dow Jones Wilshire REIT Index measures U.S. publicly traded Real Estate Investment Trusts. Unlike the Fund, the Dow Jones Wilshire REIT Index is unmanaged, is not available to investment, and does not incur expenses. The chart illustrates the performance of a hypothetical $10,000 investment made in the Managers Real Estate Securities Fund on October 31, 1997, to a $10,000 investment made in the Dow Jones Wilshire REIT Index for the same period. Performance for periods longer than one year is annualized. The graph and table do not reflect the deduction of taxes that a shareholder would pay on a Fund distribution or redemption of shares. The listed returns for the Fund are net of expenses and the returns for the index exclude expenses. Total returns for the Fund would have been lower had certain expenses not been reduced.

The table below shows the average annual total returns for the Managers Real Estate Securities Fund and the Dow Jones Wilshire REIT Index since inception through October 31, 2007.
| | | | | | | | | |
Average Annualized Total Returns 1 | | One Year | | | Five Years | | | Since Inception* | |
Real Estate Securities 2,3 | | 2.10 | % | | 23.27 | % | | 11.48 | % |
Dow Jones Wilshire REIT Index | | (1.24 | )% | | 23.52 | % | | 13.03 | % |
| * | Commencement of operations was December 31, 1997. |
The performance data shown represents past performance. Past performance is not a guarantee of future results. Current performance may be lower or higher than the performance data quoted. The investment return and principal value of an investment in the Fund will fluctuate so that an investor’s shares, when redeemed, may be worth more or less than their original cost. For performance information through the most recent month end, please call (800) 835-3879 or visit our website at www.managersinvest.com.
1 | Total return equals income yield plus share price change and assumes reinvestment of all dividends and capital gain distributions. Returns are net of fees and may reflect offsets of Fund expenses as described in the Prospectus. No adjustment has been made for taxes payable by shareholders on their reinvested dividends and capital gain distributions. Returns for periods greater than one year are annualized. The listed returns on the Fund are net of expenses. All returns are in U.S. dollars($). |
2 | Fund for which, from time to time, the Fund’s advisor has waived its fees and/or absorbed Fund expenses, which has resulted in higher returns. |
3 | The Fund is subject to special risk considerations similar to those associated with the direct ownership of real estate. Real estate valuations may be subject to factors such as changing general and local economic, financial, competitive, and environmental conditions. |
22
Managers Real Estate Securities Fund
Fund Snapshots
October 31, 2007
Portfolio Breakdown
| | | |
Industry | | Real Estate
Securities** | |
REITs (Apartments) | | 16.2 | % |
REITs (Regional Malls) | | 15.3 | % |
REITs (Shopping Centers) | | 14.5 | % |
REITs (Office Property) | | 13.3 | % |
REITs (Warehouse/Industrial) | | 8.8 | % |
REITs (Diversified) | | 7.5 | % |
REITs (Health Care) | | 6.0 | % |
REITs (Hotels) | | 5.2 | % |
REITs (Single Tenant) | | 3.6 | % |
REITs (Storage) | | 2.1 | % |
Other Assets and Liabilities | | 7.5 | % |
Top Ten Holdings
| | | |
Security Name | | Percentage
of Net Assets | |
Simon Property Group, Inc.* | | 7.9 | % |
General Growth Properties, Inc. | | 5.5 | |
Vornado Realty Trust* | | 5.2 | |
Kimco Realty Corp.* | | 5.1 | |
ProLogis* | | 4.7 | |
UDR, Inc. | | 4.3 | |
Boston Properties, Inc. | | 3.9 | |
National Retail Properties, Inc. | | 3.4 | |
AMB Property Corp. | | 3.0 | |
Essex Property Trust, Inc.* | | 3.0 | |
| | | |
Top Ten as a Group | | 46.0 | % |
| | | |
| * | Top Ten Holding at April 30, 2007 |
Any sectors, industries, or securities discussed should not be perceived as investment recommendations. Mention of a specific security should not be considered a recommendation to buy or solicitation to sell that security.
23
Managers Real Estate Securities Fund
Schedule of Portfolio Investments
October 31, 2007
| | | | | | |
| | | Shares | | Value | |
REITs - 92.5% | | | | | | |
Apartments - 16.2% | | | | | | |
American Campus Communities, Inc. | | 4,931 | | $ | 140,238 | |
AvalonBay Communities, Inc. | | 5,260 | | | 645,139 | |
BRE Properties, Inc. | | 10,920 | | | 598,416 | |
Education Realty Trust, Inc. | | 5,170 | | | 66,900 | |
Equity Residential | | 12,410 | | | 518,490 | |
Essex Property Trust, Inc. | | 6,540 | | | 807,232 | |
Home Properties of NY, Inc. | | 4,940 | | | 254,015 | |
Post Properties, Inc. | | 3,160 | | | 129,560 | |
UDR, Inc. | | 48,380 | | | 1,148,540 | |
Total Apartments | | | | | 4,308,530 | |
Diversified - 7.5% | | | | | | |
Cousins Properties, Inc. | | 7,580 | | | 218,228 | |
Digital Realty Trust, Inc. | | 3,601 | | | 158,408 | |
Liberty Property Trust | | 6,860 | | | 258,073 | |
Vornado Realty Trust | | 12,250 | | | 1,368,570 | |
Total Diversified | | | | | 2,003,279 | |
Health Care - 6.0% | | | | | | |
HCP, Inc. | | 12,130 | | | 412,905 | |
Health Care REIT, Inc. | | 4,810 | | | 213,035 | |
Healthcare Realty Trust, Inc. | | 5,740 | | | 151,766 | |
Nationwide Health Properties, Inc. | | 22,390 | | | 699,016 | |
Ventas, Inc. | | 2,450 | | | 105,080 | |
Total Health Care | | | | | 1,581,802 | |
Hotels - 5.2% | | | | | | |
Ashford Hospitality Trust | | 28,450 | | | 279,948 | |
Diamondrock Hospitality Co. | | 7,320 | | | 140,251 | |
Host Marriott Corp. | | 28,490 | | | 631,338 | |
Sunstone Hotel Investors, Inc. | | 11,649 | | | 323,959 | |
Total Hotels | | | | | 1,375,496 | |
Office Property - 13.3% | | | | | | |
Alexandria Real Estate Equities, Inc. | | 7,310 | | | 753,953 | |
American Financial Realty Trust | | 8,610 | | | 58,032 | |
Boston Properties, Inc. | | 9,590 | | | 1,038,981 | |
Brandywine Realty Trust | | 4,030 | | | 104,256 | |
Highwoods Properties, Inc. | | 12,240 | | | 440,150 | |
Kilroy Realty Corp. | | 2,050 | | | 133,332 | |
Mack-Cali Realty Corp. | | 8,040 | | | 318,304 | |
SL Green Realty Corp. | | 5,620 | | | 678,109 | |
Total Office Property | | | | | 3,525,117 | |
Regional Malls - 15.3% | | | | | | |
CBL & Associates Properties, Inc. | | 5,368 | | | 177,734 | |
General Growth Properties, Inc. | | 26,650 | | $ | 1,448,694 | |
Macerich Co., The | | 3,970 | | | 340,269 | |
Simon Property Group, Inc. | | 20,260 | | | 2,109,269 | |
Total Regional Malls | | | | | 4,075,966 | |
Shopping Centers - 14.5% | | | | | | |
Acadia Realty Trust | | 10,090 | | | 267,385 | |
Developers Diversified Realty Corp. | | 10,768 | | | 542,707 | |
Federal Realty Investment Trust | | 8,990 | | | 793,098 | |
Inland Real Estate Corp. | | 10,150 | | | 151,235 | |
Kimco Realty Corp. | | 32,730 | | | 1,358,950 | |
Regency Centers Corp. | | 10,350 | | | 739,818 | |
Total Shopping Centers | | | | | 3,853,193 | |
Single Tenant - 3.6% | | | | | | |
National Retail Properties, Inc. | | 35,467 | | | 899,088 | |
Realty Income Corp. | | 2,120 | | | 62,625 | |
Total Single Tenant | | | | | 961,713 | |
Storage - 2.1% | | | | | | |
Public Storage, Inc. | | 6,730 | | | 544,928 | |
Warehouse/Industrials - 8.8% | | | | | | |
AMB Property Corp. | | 12,380 | | | 809,033 | |
First Industrial Realty Trust, Inc. | | 6,940 | | | 282,805 | |
ProLogis | | 17,220 | | | 1,235,363 | |
Total Warehouse/Industrials | | | | | 2,327,201 | |
Total REITs
(cost $23,868,608) | | | | | 24,557,225 | |
REOCs - 6.4% | | | | | | |
Hotels & Motels - 2.0% | | | | | | |
Starwood Hotels & Resorts Worldwide, Inc. | | 9,390 | | | 533,915 | |
Real Estate Operations and | | | | | | |
Development - 2.9% | | | | | | |
Brookfield Properties Corp. | | 29,755 | | | 742,982 | |
Forest City Enterprises, Inc., Class A | | 590 | | | 33,583 | |
Total Real Estate Operations and Development | | | | | 776,565 | |
Wireless Equipment - 1.5% | | | | | | |
American Tower Corp., Class A | | 9,130 | | $ | 403,364 | |
Total REOCs
(cost $1,888,296) | | | | | 1,713,844 | |
Other Investment Companies - 1.3%1 | | | | | | |
Dreyfus Cash Management Fund, Institutional Class Shares, 4.94%
(cost $335,332) | | 335,332 | | | 335,332 | |
Total Investments - 100.2%
(cost $26,092,236) | | | | | 26,606,401 | |
Other Assets, less Liabilities - (0.2)% | | | | | (45,735 | ) |
Net Assets - 100.0% | | | | $ | 26,560,666 | |
The accompanying notes are an integral part of these financial statements.
24
Managers California Intermediate Tax-Free Fund
Portfolio Manager’s Comments
The Managers California Intermediate Tax-Free Fund’s objective is to achieve income free from Federal income taxes and California state income taxes, including alternative minimum tax.
The Managers California Intermediate Tax-Free Fund invests at least 80% of its total assets in intermediate-term California municipal bonds that are free from both Federal and California state income taxes, including alternative minimum tax. The Fund’s securities will have a quality ratings comparable to the four highest ratings category of Moody’s or Standard & Poor’s. The dollar-weighted average maturity of these intermediate-term securities is normally 3 to 10 years. The Fund’s benchmark is the Lehman Brothers 5-Year Municipal Bond Index.
The Portfolio Manager
Evergreen Investment Management Company, LLC (“Evergreen”), the subadvisor for the Managers California Intermediate Tax-Free Fund, was founded in 1932, and is a subsidiary of Wachovia Corporation. Evergreen is a broadly diversified asset management organization, with products and services distributed across several lines of business.
The investment team at Evergreen believes there are two key ways to add value when investing in municipal bonds:
| | • | | Positioning the portfolio appropriately in terms of duration position, yield curve position and sector exposure; and |
| | • | | Undertaking extensive credit research, focusing the portfolio only on attractive issues with limited credit risk. |
Evergreen utilizes a total return strategy that attempts to add value through its duration positioning, yield curve positioning, sector exposure, security selection, and credit research. The firm’s trading capabilities and vast network of approximately 90 broker-dealers has also helped to add value.
The portfolio management team at Evergreen meets weekly to discuss its macro-economic view and establish the target portfolio positioning in terms of interest rate exposure, yield curve positioning and sector allocation. A list of the securities approved for investment is used to implement the portfolio strategy. In selecting bonds, the portfolio manager must consider a comprehensive set of factors including liquidity, regional trends, coupon and legislative or legal developments.
The ideal bond exhibits many of the following traits:
| | • | | It is liquid and rated A or higher. The portfolio manager will not invest in bonds rated below investment grade |
| | • | | It has been thoroughly analyzed and approved for investment by the fund’s credit analyst. The credit analyst may believe that there is the potential for a credit upgrade |
| | • | | It will typically have a maturity of less than 15 years |
Portfolio management:
Fund management analyzes macroeconomic, political, and market forces to try to identify the trends for interest rates
The portfolio manager then attempts to position the portfolio-by either lengthening average portfolio maturity when interest rates are expected to decline or by shortening it when rates are expected to rise-to take advantage of these interest rate changes
Investments are concentrated in those sectors of the municipal securities universe believed to have the best risk/reward potential.
The portfolio management team strives to enhance yield and minimize credit and interest rate risk by:
| | • | | Positioning the portfolio advantageously on the yield curve; |
| | • | | Adjusting average credit quality within the investment grade category; |
| | • | | Exploiting pockets of inefficient pricing in the municipal bond market; and |
| | • | | Executing fundamental credit analysis focusing on identifying bonds with the potential for credit quality upgrades. |
The fund manager may sell a security when:
| | • | | A bond is deemed to be overpriced |
| | • | | The structure of the portfolio (management estimates that a large portion of the turnover in the portfolio is related to interest rate changes) changes |
| | • | | A more compelling security is identified |
| | • | | There is a problem with the security’s credit |
The Year in Review
For the twelve months ended October 31, 2007, the Managers California Intermediate Tax-Free Fund returned 2.23%. The Fund’s benchmark, the Lehman Brothers Five-Year Municipal Bond Index, returned 3.79% during the same time period.
The Fund’s underperformance relative to its benchmark can be directly attributed to its overweight position in municipals maturing longer than ten years. Shorter-term municipals, such as those maturing between three and five years, reacted more favorably to the Federal Reserve lowering the overnight Federal Funds Rate by seventy-five basis points (0.75%) during the Fund’s fiscal year. This interest rate reduction by the Fed, which is meant to stimulate the economy, caused municipals further out on the yield curve to underperform as the potential for greater inflation weighed on investor sentiment.
During the past twelve months the Fund’s relative performance has been assisted by its overall high-credit quality. California municipal credit spreads have been volatile as perceptions of the health of the California real estate market has caused some weakening of speculative-grade issuers’ outstanding bonds. The Fund’s average credit quality of “AA” should benefit relative performance moving forward should the overall U.S. economy fall into recession.
Looking Forward
Moving forward, portfolio management believes that California-exempt municipals with stronger overall credit characteristics will notably outperform as the U.S. economy slows and access to credit gets tighter. The portfolio manager expects the relative outperformance of the five-year area of the municipal yield curve should abate somewhat as investors looking for greater yield begin to embrace investing in longer maturities beyond ten years. Portfolio management therefore believes remaining overweight in the 12-15 year area of the municipal yield curve should foster better relative performance versus the Lehman index in the days and months ahead.
Cumulative Total Return Performance
Managers California Intermediate Tax-Free Fund’s cumulative total return is based on the daily change in net asset value (NAV) and assumes that all distributions were reinvested. The Lehman Brothers Municipal Bond Index is a rules-based, market-value-weighted index engineered for the long-term tax-exempt bond market. The
25
Managers California Intermediate Tax-Free Fund
Portfolio Manager’s Comments (continued)
index has four main sectors: general obligation bonds, revenue bonds, insured bonds (including all insured bonds with a Aaa/AAA rating), and prerefunded bonds. This index is the 5 Year (4-6) component of the Municipal Bond index. Unlike the Fund, the Lehman Brothers Municipal Bond Index is unmanaged, is not available to investment, and does not incur expenses. This chart compares a hypothetical $10,000 investment made in the Managers Fremont Bond Fund on October 31, 1997 to a $10,000 investment made in the Lehman Brothers 5-Year Municipal Bond Index for the same time period. Performance for periods longer than one year is annualized. The graph and table do not reflect the deduction of taxes that a shareholder would pay on a Fund distribution or redemption of shares. The listed returns for the Fund are net of expenses and the returns for the index exclude expenses. Total returns for the Fund would have been lower had certain expenses not been reduced.
The table below shows the average annual total returns for the Managers California Intermediate Tax-Free Fund and the Lehman Brothers 5-Year Municipal Bond Index from October 31, 1997 through October 31, 2007.
| | | | | | | | | |
Average Annualized Total Returns1 | | One Year | | | Five Years | | | Ten Years | |
California Intermediate Tax Free2,3,4,5 | | 2.23 | % | | 4.02 | % | | 4.42 | % |
Lehman Brothers 5-Year Municipal Bond Index | | 3.79 | % | | 3.32 | % | | 4.54 | % |
The performance data shown represents past performance. Past performance is not a guarantee of future results. Current performance may be lower or higher than the performance data quoted. The investment return and principal value of an investment in the Fund will fluctuate so that an investor’s shares, when redeemed, may be worth more or less than their original cost. For performance information through the most recent month end, please call (800) 835-3879 or visit our website at www.managersinvest.com.
1 | Total return equals income yield plus share price change and assumes reinvestment of all dividends and capital gain distributions. Returns are net of fees and may reflect offsets of Fund expenses as described in the Prospectus. No adjustment has been made for taxes payable by shareholders on their reinvested dividends and capital gain distributions. Returns for periods greater than one year are annualized. The listed returns on the Fund are net of expenses. All returns are in U.S. dollars($). |
2 | Fund for which, from time to time, the Fund’s advisor has waived its fees and/or absorbed Fund expenses, which has resulted in higher returns. |
3 | Fixed-income funds are subject to the risks associated with investments in debt securities, such as default risk, fluctuations in debtor’s perceived ability to pay its creditors, and changing interest rate risk. An increase in interest rates typically causes the value of bonds and other fixed-income securities to fall. |
4 | The Fund is subject to risks associated with economic, political, geographic, and demographic conditions of California that could adversely affect the value of the Fund’s investment portfolio. |
5 | The Fund is subject to the risks associated with investments in debt securities, such as default risk and fluctuations in the perception of the debtor’s ability to pay its creditors. Changing interest rates may adversely affect the value of an investment. An increase in interest rates typically cause the value of bonds and other fixed-income securities to fall. Investment income may be subject to certain state and local taxes, and depending on your tax status, the federal alternative minimum tax. Capital gains are not exempt from federal income tax. |
26
Managers California Intermediate Tax-Free Fund
Fund Snapshots
October 31, 2007
Portfolio Breakdown
| | | |
Portfolio Credit Quality | | California Intermediate Tax-Free** | |
Aaa | | 80.5 | % |
Aa | | 12.6 | % |
A | | 6.9 | % |
Top Ten Holdings
| | | |
Security Name | | Percentage
of Net Assets | |
Los Angeles, CA Unified School District, Series B, 4.750%, 07/01/19 | | 5.3 | % |
Bay Area Toll Authority of San Francisco, CA Toll Bridge Revenue, Series F, 5.000%, 04/01/21* | | 5.1 | |
Sonoma County, CA Junior College District Election of 2002, Series C, 5.000%, 08/01/22 | | 5.0 | |
Novato, CA Unified School District Election, 5.000%, 08/01/20 (MBIA Insured)* | | 4.1 | |
East Bay, CA Municipal Utility District, 4.750%, 06/01/20 (FSA Insured)* | | 3.7 | |
California State Public Works Board, 5.000%, 01/01/21 | | 3.6 | |
Kern, CA High School District, 5.000%, 08/01/21 (FSA Insured)* | | 3.3 | |
California Educational Facilities Authority Revenue, Santa Clara University, 5.250%, 09/01/17 (AMBAC Insured)* | | 3.1 | |
Fresno, CA Sewer Revenue, Series A-1, 5.250%, 09/01/19 (AMBAC Insured)* | | 3.0 | |
Bay Area Toll Authority, CA Toll Bridge Revenue, Series F, 5.000%, 04/01/19* | | 3.0 | |
| | | |
Top Ten as a Group | | 39.2 | % |
| | | |
| * | Top Ten Holding at April 30, 2007 |
Any sectors, industries, or securities discussed should not be perceived as investment recommendations. Mention of a specific security should not be considered a recommendation to buy or solicitation to sell that security.
27
Managers California Intermediate Tax-Free Fund
Schedule of Portfolio Investments
October 31, 2007
| | | | | | |
Security Description | | Principal Amount | | Value |
Municipal Bonds - 95.1% | | | | | | |
Anaheim, CA Unified High School District, 4.500%, 08/01/20 (FSA Insured) | | $ | 250,000 | | $ | 254,898 |
Bay Area Government Association CA Revenue, 5.000%, 08/01/20 (AMBAC Insured) | | | 500,000 | | | 521,580 |
Bay Area Toll Authority of San Francisco, CA Toll Bridge Revenue, Series F, 5.000%, 04/01/21 | | | 1,750,000 | | | 1,848,228 |
Bay Area Toll Authority, CA Toll Bridge Revenue, Series F, 5.000%, 04/01/19 | | | 1,000,000 | | | 1,065,610 |
California Educational Facilities Authority Revenue, Santa Clara University, 5.250%, 09/01/17 (AMBAC Insured) | | | 1,000,000 | | | 1,109,230 |
California Infrastructure & Economic Development Bank Revenue, 5.000%, 10/01/20 | | | 455,000 | | | 481,076 |
California State Department Veteran Affairs, 4.400%, 12/01/21 | | | 400,000 | | | 398,864 |
California State Public Works Board, 5.000%, 01/01/21 | | | 1,250,000 | | | 1,294,788 |
California State Public Works Board, Lease Revenue Department of General Services - Teale Data Center B, 5.250%, 03/01/19 (AMBAC Insured) | | | 200,000 | | | 211,284 |
Campbell, CA Union High School District, 4.300%, 08/01/19 (FSA Insured) | | | 270,000 | | | 274,090 |
Clovis, CA Unified School District, 5.000%, 08/01/21 (MBIA Insured) | | | 540,000 | | | 573,323 |
Desert Sands, CA University School District, 5.000%, 06/01/22 (AMBAC Insured) | | | 500,000 | | | 527,060 |
East Bay, CA Municipal Utility District, 4.750%, 06/01/20 (FSA Insured) | | | 1,300,000 | | | 1,342,328 |
Eastern Municipal Water District of California, Water & Sewer Revenue, Certificates of Participation, 5.000%, 07/01/17 (MBIA Insured) | | | 100,000 | | | 107,250 |
Eastern Municipal Water District, Water & Sewer Revenue, Certificates of Participation, Series A, 5.000%, 07/01/21 | | | 330,000 | | | 346,530 |
El Monte, CA City School District, Election of 2004, Series A, 5.000%, 05/01/19 (FGIC Insured) | | | 225,000 | | | 239,886 |
Fremont, CA Unified High School District of Santa Clara County, 5.000%, 09/01/20 (FGIC Insured) | | | 400,000 | | | 425,512 |
Fremont, CA Unified School District of Alameda County, Election of 2002, Series B, 4.500%, 08/01/20 (FSA Insured) | | | 365,000 | | | 372,150 |
Fresno, CA Sewer Revenue, Series A-1, 5.250%, 09/01/19 (AMBAC Insured) | | | 1,000,000 | | | 1,091,240 |
Kern, CA High School District, 5.000%, 08/01/21 (FSA Insured) | | | 1,100,000 | | | 1,175,361 |
Lincoln, CA Unified School District - San Joaquin County Election of 2004, 4.500%, 08/01/19 (FGIC Insured) | | | 150,000 | | | 154,204 |
Long Beach, CA Harbor Revenue Refunding - Series B, 5.000%, 05/15/18 (FGIC Insured) | | | 670,000 | | | 714,495 |
Los Angeles, CA Unified School District, Series B, 4.750%, 07/01/19 | | | 1,810,000 | | | 1,898,943 |
Los Angeles, CA Certificate Participation Real Property Program, 5.250%, 04/01/19 (AMBAC Insured) | | | 300,000 | | | 318,483 |
Los Angeles, CA Department of Water & Power, Waterworks Revenue, Series C, 5.250%, 07/01/18 (MBIA Insured) | | | 510,000 | | | 553,411 |
Los Angeles, CA Harbor Department Revenue, Series B, 5.000%, 08/01/20 (MBIA Insured) | | | 275,000 | | | 294,236 |
Los Angeles, CA Harbor Department Revenue, Series C, 5.000%, 08/01/22 (FGIC Insured) | | | 565,000 | | | 599,194 |
Los Angeles, CA Unified School District, 5.000%, 07/01/20 (AMBAC Insured) | | | 800,000 | | | 852,576 |
Los Osos, CA Community Service, Wastewater Assessment District No. 1, 5.000%, 09/02/17 (MBIA Insured) | | | 1,000,000 | | | 1,057,310 |
Metropolitan Water District of Southern California, Waterworks Revenue, Series A, 4.125%, 03/01/19 | | | 325,000 | | | 326,310 |
Moorpark, CA Unified School District, 5.000%, 08/01/18 (FSA Insured) | | | 390,000 | | | 418,669 |
Murrieta Valley, CA Unified School District Election of 2002, Series B, 4.125%, 09/01/20 (FSA Insured) | | | 345,000 | | | 342,437 |
North Orange County, CA Community College District, 5.000%, 08/01/19 (MBIA Insured) | | | 340,000 | | | 363,117 |
Novato, CA Unified School District Election, 5.000%, 08/01/20 (MBIA Insured) | | | 1,385,000 | | | 1,471,507 |
Novato, CA Unified School District, 5.000%, 08/01/21 (MBIA Insured) | | | 465,000 | | | 491,947 |
Palomar, CA Community College, Election of 2006, Series A, 5.000%, 05/01/22 (FSA Insured) | | | 1,000,000 | | | 1,058,860 |
The accompanying notes are an integral part of these financial statements.
28
Managers California Intermediate Tax-Free Fund
Schedule of Portfolio Investments (continued)
| | | | | | |
Security Description | | Principal Amount | | Value |
Municipal Bonds - 95.1% (continued) | | | | | | |
Perris, CA Union High School District, Series A, 5.000%, 09/01/18 (FGIC Insured) | | $ | 300,000 | | $ | 321,213 |
Port of Oakland California, Series B, 5.000%, 11/01/21 | | | 1,000,000 | | | 1,064,720 |
Rancho Santiago California Community College District, Election 2002, Series C, 5.000%, 09/01/20 | | | 460,000 | | | 490,714 |
Riverside, CA Community College District, 5.000%, 08/01/21 (FSA Insured) | | | 250,000 | | | 264,775 |
Riverside, CA Unified School District, Election of 2001, Series B, 4.250%, 08/01/21 (MBIA Insured) | | | 300,000 | | | 298,746 |
Sacramento County, CA Sanitation Districts Financing Authority, 4.750%, 12/01/20 (FGIC Insured) | | | 500,000 | | | 520,735 |
San Diego, CA Unified School District, Series C, 5.000%, 07/01/19 (FSA Insured) | | | 200,000 | | | 213,296 |
San Jose, CA Library, Parks, & Public Safety Projects, 5.000%, 09/01/19 | | | 500,000 | | | 525,735 |
San Jose-Evergreen, CA Community College District, 2010 Crossover Series C, 5.250%, 09/01/16 (AMBAC Insured) | | | 500,000 | | | 547,585 |
Santa Clara Valley, CA Water District, Certificates of Participation, Series A, 5.000%, 02/01/17 (FGIC Insured) | | | 490,000 | | | 523,766 |
Santa Clara Valley, CA Water District, Certificates of Participation, Series A, 5.000%, 02/01/18 (FGIC Insured) | | | 655,000 | | | 694,896 |
Santa Clarita, CA Community College District, 5.000%, 08/01/20 (AMBAC Insured) | | | 350,000 | | | 369,736 |
Santa Rosa, CA High School District, Election of 2002, 5.000%, 08/01/19 (MBIA Insured) | | | 100,000 | | | 105,496 |
Sonoma County, CA Junior College District Election of 2002, Series C, 5.000%, 08/01/22 | | | 1,700,000 | | | 1,802,102 |
Southwestern Community College, 5.000%, 08/01/18 (MBIA Insured) | | | 600,000 | | | 650,904 |
State of California, 5.250%, 02/01/25 | | | 1,000,000 | | | 1,051,430 |
University of California Revenues, Series F, 4.750%, 05/15/20 (FSA insured) | | | 200,000 | | | 207,494 |
Total Municipal Bonds
(cost $33,988,715) | | | | | | 34,229,330 |
| | |
| | | Shares | | |
Other Investment Companies - 4.0%1 | | | | | | |
BlackRock Liquidity Funds, Institutional Class Shares - California Money Fund, 3.29% | | | 1,441,016 | | | 1,441,016 |
Fidelity California AMT Tax-Free Money Market Fund, 3.18% | | | 1,080 | | | 1,080 |
Total Other Investment Companies (cost $1,442,096) | | | | | | 1,442,096 |
Total Investments - 99.1% (cost $35,430,811) | | | | | | 35,671,426 |
Other Assets, less Liabilities - 0.9% | | | | | | 310,233 |
Net Assets - 100.0% | | | | | $ | 35,981,659 |
The accompanying notes are an integral part of these financial statements.
29
Notes to Schedules of Portfolio Investments
The following footnotes and abbreviations are to be read in conjunction with the Schedules of Portfolio Investments previously presented in the report.
At October 31, 2007 the cost of securities for Federal income tax purposes and the gross aggregate unrealized appreciation and/or depreciation based on tax cost were approximately as follows:
| | | | | | | | | | | | |
Fund | | Cost | | Appreciation | | Depreciation | | | Net |
Fremont Global | | $ | 156,301,092 | | $ | 29,969,859 | | ($1,818,988 | ) | | $ | 28,150,871 |
Small Cap | | | 70,547,559 | | | 27,615,465 | | (2,542,813 | ) | | | 25,072,652 |
Real Estate Securities | | | 26,299,545 | | | 1,322,927 | | (1,016,071 | ) | | | 306,856 |
California Intermediate Tax-Free | | | 35,430,811 | | | 331,068 | | (90,453 | ) | | | 240,615 |
| * | Non-income-producing security. |
(a) Security exempt from registration under Rule 144A of the Securities Act of 1933. This security may be resold in transactions exempt from registration, normally to qualified buyers. At October 31, 2007, the value of these securities amounted to the following:
| | | | | | |
Fund | | Market Value | | % of Net Assets | |
Fremont Global | | $ | 937,017 | | 0.5 | % |
1 | Yield shown for an investment company represents its October 31, 2007, seven-day average yield, which refers to the sum of the previous seven days’ dividends paid, expressed as an annual percentage. |
2 | Some or all of these shares were out on loan to various brokers as of October 31, 2007, amounting to: |
| | | | | | |
Fund | | Market Value | | % of Net Assets | |
Fremont Global | | $ | 9,633,604 | | 5.5 | % |
Small Cap | | | 7,430,352 | | 8.5 | % |
3 | Collateral received from brokers for securities lending was invested in this short-term investment. |
Investment Definitions and Abbreviations:
| | |
| ADR/GDR: | | ADR after the name of a holding stands for American Depositary Receipt, representing ownership of foreign securities on deposit with a domestic custodian bank; a GDR (Global Depositary Receipt) is comparable, but foreign securities are held on deposit in a non-U.S. bank. The value of the ADR/GDR securities is determined or significantly influenced by trading on exchanges not located in the United States or Canada. Sponsored ADR/GDRs are initiated by the underlying foreign company. |
| |
| MBIA: | | Municipal Bond Investor Assurance Corp. |
| AMBAC: | | American Municipal Bond Assurance Corp. |
| FGIC: | | Financial Guaranty Insurance Corp. |
| FSA: | | FSA Capital, Inc |
| REIT: | | Real Estate Investment Trust |
| REOC: | | Real Estate Operating Company |
30
Statements of Assets and Liabilities
October 31, 2007
| | | | | | | | | | | | | | |
| | | Managers
Fremont Global
Fund | | | Managers Small
Cap Fund | | | Managers Real Estate
Securities Fund | | Managers
California
Intermediate
Tax- Free Fund |
Assets: | | | | | | | | | | | | | | |
Investments at value* (including securities on loan valued at $9,633,604, $7,430,352, $0, $0, respectively) | | $ | 184,451,963 | | | $ | 95,620,211 | | | $ | 26,606,401 | | $ | 35,671,426 |
Cash | | | 30,747 | | | | — | | | | 24,418 | | | 685 |
Foreign currency** | | | 234,947 | | | | — | | | | — | | | — |
Receivable for investments sold | | | 1,923,264 | | | | 754,490 | | | | 238,404 | | | — |
Receivable for Fund shares sold | | | — | | | | 2,592 | | | | 1,439 | | | — |
Unrealized appreciation of foreign currency contracts | | | 193 | | | | — | | | | — | | | — |
Dividends, interest and other receivables | | | 160,059 | | | | 22,606 | | | | 22,900 | | | 395,840 |
Prepaid expenses | | | 5,859 | | | | 12,771 | | | | 4,718 | | | 1,745 |
| | | | | | | | | | | | | | |
Total assets | | | 186,807,032 | | | | 96,412,670 | | | | 26,898,280 | | | 36,069,696 |
| | | | | | | | | | | | | | |
Liabilities: | | | | | | | | | | | | | | |
Payable for Fund shares repurchased | | | 647 | | | | 1,436,688 | | | | 69 | | | 16 |
Payable upon return of securities loaned | | | 9,819,153 | | | | 7,614,220 | | | | — | | | — |
Payable for investments purchased | | | 1,597,372 | | | | 195,158 | | | | 264,444 | | | — |
Unrealized depreciation of foreign currency contracts | | | 725 | | | | — | | | | — | | | — |
Dividends payable to shareholders | | | — | | | | — | | | | — | | | 10,774 |
Accrued expenses: | | | | | | | | | | | | | | |
Investment advisory and management fees | | | 61,439 | | | | 74,921 | | | | 19,337 | | | 7,720 |
Administrative fees | | | 27,795 | | | | 18,730 | | | | 5,687 | | | 7,592 |
Other | | | 195,080 | | | | 57,601 | | | | 48,077 | | | 61,935 |
| | | | | | | | | | | | | | |
Total liabilities | | | 11,702,211 | | | | 9,397,318 | | | | 337,614 | | | 88,037 |
| | | | | | | | | | | | | | |
Net Assets | | $ | 175,104,821 | | | $ | 87,015,352 | | | $ | 26,560,666 | | $ | 35,981,659 |
| | | | | | | | | | | | | | |
Net Assets Represent: | | | | | | | | | | | | | | |
Paid-in capital | | $ | 186,866,723 | | | $ | 73,956,483 | | | $ | 20,647,791 | | $ | 35,199,030 |
Undistributed net investment income | | | 1,264,047 | | | | — | | | | 104,603 | | | 208 |
Accumulated net realized gain (loss) from investments, futures and foreign currency transactions | | | (41,413,161 | ) | | | (12,158,653 | ) | | | 5,294,107 | | | 541,806 |
Net unrealized appreciation of investments, futures, and foreign currency contracts and translations | | | 28,387,212 | | | | 25,217,522 | | | | 514,165 | | | 240,615 |
| | | | | | | | | | | | | | |
Net Assets | | $ | 175,104,821 | | | $ | 87,015,352 | | | $ | 26,560,666 | | $ | 35,981,659 |
| | | | | | | | | | | | | | |
Shares Outstanding | | | 10,615,966 | | | | 4,869,969 | | | | 2,113,539 | | | 3,408,511 |
| | | | | | | | | | | | | | |
Net asset value, offering and redemption price per share | | $ | 16.49 | | | $ | 17.87 | | | $ | 12.57 | | $ | 10.56 |
| | | | | | | | | | | | | | |
* Investments at cost | | $ | 156,073,467 | | | $ | 70,402,689 | | | $ | 26,000,790 | | $ | 35,430,811 |
** Foreign currency at cost | | $ | 234,078 | | | | — | | | | — | | | — |
The accompanying notes are an integral part of these financial statements.
31
Statements of Operations
For the fiscal year ended October 31, 2007
| | | | | | | | | | | | | | | | |
| | | Managers
Fremont Global
Fund | | | Managers Small
Cap Fund | | | Managers
Real Estate
Securities Fund | | | Managers
California
Intermediate
Tax-Free Fund | |
Investment Income: | | | | | | | | | | | | | | | | |
Interest income | | $ | 677,452 | | | | — | | | | — | | | $ | 1,774,265 | |
Dividend income | | | 1,742,980 | | | $ | 589,805 | | | $ | 649,409 | | | | 50,168 | |
Foreign withholding tax | | | (32,491 | ) | | | (1,395 | ) | | | (2,670 | ) | | | — | |
Securities lending fees | | | 37,922 | | | | 58,927 | | | | — | | | | — | |
| | | | | | | | | | | | | | | | |
Total investment income | | | 2,425,863 | | | | 647,337 | | | | 646,739 | | | | 1,824,433 | |
| | | | | | | | | | | | | | | | |
Expenses: | | | | | | | | | | | | | | | | |
Investment management fees | | | 1,025,734 | | | | 916,308 | | | | 246,742 | | | | 159,763 | |
Administrative fees | | | 427,389 | | | | 229,077 | | | | 72,571 | | | | 105,881 | |
Custodian | | | 215,015 | | | | 30,850 | | | | 19,253 | | | | 26,440 | |
Transfer agent | | | 78,848 | | | | 35,151 | | | | 12,869 | | | | 10,254 | |
Professional fees | | | 73,607 | | | | 40,914 | | | | 36,086 | | | | 35,910 | |
Registration fees | | | 19,953 | | | | 17,053 | | | | 17,785 | | | | 3,315 | |
Reports to shareholders | | | 18,267 | | | | 8,028 | | | | 1,170 | | | | — | |
Trustees fees and expenses | | | 9,201 | | | | 5,116 | | | | 1,636 | | | | 2,684 | |
Miscellaneous | | | 18,348 | | | | 4,610 | | | | 1,753 | | | | 2,938 | |
| | | | | | | | | | | | | | | | |
Total expenses before offsets | | | 1,886,362 | | | | 1,287,107 | | | | 409,865 | | | | 347,185 | |
| | | | | | | | | | | | | | | | |
Fee waivers | | | (321,042 | ) | | | — | | | | — | | | | — | |
Expense (reimbursement)/recoupment | | | — | | | | — | | | | 746 | | | | (109,438 | ) |
Expense reductions | | | (26,072 | ) | | | (15,427 | ) | | | (2,889 | ) | | | (1,295 | ) |
| | | | | | | | | | | | | | | | |
Net expenses | | | 1,539,248 | | | | 1,271,680 | | | | 407,722 | | | | 236,452 | |
| | | | | | | | | | | | | | | | |
Net investment income (loss) | | | 886,615 | | | | (624,343 | ) | | | 239,017 | | | | 1,587,981 | |
| | | | | | | | | | | | | | | | |
Net Realized and Unrealized Gain (Loss): | | | | | | | | | | | | | | | | |
Net realized gain on investments and futures | | | 21,875,141 | | | | 13,262,018 | | | | 5,467,457 | | | | 546,277 | |
Net realized loss on foreign currency contracts and transactions | | | (279,547 | ) | | | — | | | | — | | | | — | |
Net unrealized appreciation (depreciation) of investments and futures | | | 3,931,541 | | | | 185,638 | | | | (5,762,676 | ) | | | (1,167,644 | ) |
Net unrealized appreciation of foreign currency contracts and translations | | | 48,370 | | | | — | | | | — | | | | — | |
| | | | | | | | | | | | | | | | |
Net realized and unrealized gain (loss) | | | 25,575,505 | | | | 13,447,656 | | | | (295,219 | ) | | | (621,367 | ) |
| | | | | | | | | | | | | | | | |
Net increase (decrease) in net assets resulting from operations | | $ | 26,462,120 | | | $ | 12,823,313 | | | | ($56,202 | ) | | $ | 966,614 | |
| | | | | | | | | | | | | | | | |
The accompanying notes are an integral part of these financial statements.
32
Statements of Changes in Net Assets
For the fiscal year ended October 31,
| | | | | | | | | | | | | | | | |
| | | Managers Fremont Global Fund | | | Managers Small Cap Fund | |
| | | 2007 | | | 2006 | | | 2007 | | | 2006 | |
Increase (Decrease) in Net Assets From Operations: | | | | | | | | | | | | | | | | |
Net investment income (loss) | | $ | 886,615 | | | $ | 3,102,452 | | | | ($624,343 | ) | | | ($688,729 | ) |
Net realized gain on investments and foreign currency transactions | | | 21,595,594 | | | | 12,845,641 | | | | 13,262,018 | | | | 4,325,624 | |
Net unrealized appreciation (depreciation) of investments and foreign currency translations | | | 3,979,911 | | | | 7,592,955 | | | | 185,638 | | | | 9,894,002 | |
| | | | | | | | | | | | | | | | |
Net increase (decrease) in net assets resulting from operations | | | 26,462,120 | | | | 23,541,048 | | | | 12,823,313 | | | | 13,530,897 | |
| | | | | | | | | | | | | | | | |
Distributions to Shareholders: | | | | | | | | | | | | | | | | |
From net investment income | | | (1,566,989 | ) | | | (9,462,057 | ) | | | — | | | | — | |
From net realized gain on investments | | | — | | | | — | | | | — | | | | — | |
| | | | | | | | | | | | | | | | |
Total distributions to shareholders | | | (1,566,989 | ) | | | (9,462,057 | ) | | | — | | | | — | |
| | | | | | | | | | | | | | | | |
From Capital Share Transactions: | | | | | | | | | | | | | | | | |
Proceeds from sale of shares | | | 9,201,522 | | | | 8,714,063 | | | | 14,102,109 | | | | 24,549,330 | |
Reinvestment of dividends and distributions | | | 1,546,508 | | | | 9,372,373 | | | | — | | | | — | |
Cost of shares repurchased | | | (42,925,589 | ) | | | (32,975,080 | ) | | | (29,084,600 | ) | | | (15,206,935 | ) |
| | | | | | | | | | | | | | | | |
Net increase (decrease) from capital share transactions | | | (32,177,559 | ) | | | (14,888,644 | ) | | | (14,982,491 | ) | | | 9,342,395 | |
| | | | | | | | | | | | | | | | |
Total increase (decrease) in net assets | | | (7,282,428 | ) | | | (809,653 | ) | | | (2,159,178 | ) | | | 22,873,292 | |
| | | | | | | | | | | | | | | | |
Net Assets: | | | | | | | | | | | | | | | | |
Beginning of year | | | 182,387,249 | | | | 183,196,902 | | | | 89,174,530 | | | | 66,301,238 | |
| | | | | | | | | | | | | | | | |
End of year | | $ | 175,104,821 | | | $ | 182,387,249 | | | $ | 87,015,352 | | | $ | 89,174,530 | |
| | | | | | | | | | | | | | | | |
End of year undistributed net investment income (loss) | | $ | 1,264,047 | | | | ($215,461 | ) | | | — | | | | — | |
| | | | | | | | | | | | | | | | |
Share Transactions: | | | | | | | | | | | | | | | | |
Sale of shares | | | 604,188 | | | | 630,051 | | | | 857,366 | | | | 1,670,203 | |
Reinvestment of dividends and distributions | | | 101,795 | | | | 698,358 | | | | — | | | | — | |
Shares repurchased | | | (2,899,643 | ) | | | (2,411,674 | ) | | | (1,752,454 | ) | | | (1,045,430 | ) |
| | | | | | | | | | | | | | | | |
Net increase (decrease) in shares | | | (2,193,660 | ) | | | (1,083,265 | ) | | | (895,088 | ) | | | 624,773 | |
| | | | | | | | | | | | | | | | |
The accompanying notes are an integral part of these financial statements.
33
| | | | | | | | | | | | |
Managers Real Estate Securities Fund | | | Managers California Intermediate Tax-Free Fund | |
2007 | | 2006 | | | 2007 | | | 2006 | |
| $239,017 | | $ | 247,465 | | | $ | 1,587,981 | | | $ | 1,906,967 | |
| 5,467,457 | | | 4,509,798 | | | | 546,277 | | | | 124,779 | |
| (5,762,676) | | | 3,066,846 | | | | (1,167,644 | ) | | | 1,038,003 | |
| (56,202) | | | 7,824,109 | | | | 966,614 | | | | 3,069,749 | |
| (218,890) | | | (183,846 | ) | | | (1,587,981 | ) | | | (1,906,973 | ) |
| (4,343,649) | | | (3,922,812 | ) | | | (129,154 | ) | | | (706,464 | ) |
| (4,562,539) | | | (4,106,658 | ) | | | (1,717,135 | ) | | | (2,613,437 | ) |
| 10,672,920 | | | 3,149,594 | | | | 9,294,908 | | | | 7,383,255 | |
| 4,393,797 | | | 4,049,920 | | | | 1,353,390 | | | | 2,077,415 | |
| (11,511,748) | | | (8,195,257 | ) | | | (28,060,226 | ) | | | (3,620,308 | ) |
| 3,554,969 | | | (995,743 | ) | | | (17,411,928 | ) | | | 5,840,362 | |
| (1,063,772) | | | 2,721,708 | | | | (18,162,449 | ) | | | 6,296,674 | |
| 27,624,438 | | | 24,902,730 | | | | 54,144,108 | | | | 47,847,434 | |
| $26,560,666 | | $ | 27,624,438 | | | | 35,981,659 | | | $ | 54,144,108 | |
| $104,603 | | $ | 163,139 | | | $ | 208 | | | $ | 208 | |
| 792,155 | | | 237,272 | | | | 875,926 | | | | 695,945 | |
| 349,756 | | | 352,981 | | | | 127,495 | | | | 196,086 | |
| (902,548) | | | (652,624 | ) | | | (2,632,539 | ) | | | (342,587 | ) |
| 239,363 | | | (62,371 | ) | | | (1,629,118 | ) | | | 549,444 | |
The accompanying notes are an integral part of these financial statements.
34
Financial Highlights
For a share outstanding throughout each fiscal year
| | | | | | | | | | | | | | | | | | | | |
| | | For the fiscal year ended October 31, | |
Managers Fremont Global Fund | | 2007 | | | 2006 | | | 2005 | | | 2004 | | | 2003 | |
Net Asset Value, Beginning of Year | | $ | 14.24 | | | $ | 13.19 | | | $ | 12.19 | | | $ | 11.17 | | | $ | 9.50 | |
| | | | | | | | | | | | | | | | | | | | |
Income from Investment Operations: | | | | | | | | | | | | | | | | | | | | |
Net investment income | | | 0.08 | 3 | | | 0.27 | | | | 0.46 | | | | 0.18 | | | | 0.27 | |
Net realized and unrealized gain on investments | | | 2.31 | 3 | | | 1.48 | | | | 0.69 | | | | 0.86 | | | | 1.52 | |
| | | | | | | | | | | | | | | | | | | | |
Total from investment operations | | | 2.39 | | | | 1.75 | | | | 1.15 | | | | 1.04 | | | | 1.79 | |
| | | | | | | | | | | | | | | | | | | | |
Less Distributions to Shareholders from: | | | | | | | | | | | | | | | | | | | | |
Net investment income | | | (0.14 | ) | | | (0.70 | ) | | | (0.15 | ) | | | (0.02 | ) | | | (0.10 | ) |
Return of capital distribution | | | — | | | | — | | | | — | | | | — | | | | (0.02 | ) |
| | | | | | | | | | | | | | | | | | | | |
Total distributions to shareholders | | | (0.14 | ) | | | (0.70 | ) | | | (0.15 | ) | | | (0.02 | ) | | | (0.12 | ) |
| | | | | | | | | | | | | | | | | | | | |
Net Asset Value, End of Year | | $ | 16.49 | | | $ | 14.24 | | | $ | 13.19 | | | $ | 12.19 | | | $ | 11.17 | |
| | | | | | | | | | | | | | | | | | | | |
Total Return1 | | | 16.94 | % | | | 13.67 | % | | | 9.79 | % | | | 9.27 | % | | | 18.94 | % |
| | | | | | | | | | | | | | | | | | | | |
Ratio of net expenses to average net assets | | | 0.90 | % | | | 1.11 | % | | | 1.09 | % | | | 1.02 | % | | | 0.95 | % |
Ratio of total expenses to average net assets2 | | | 1.10 | % | | | 1.13 | % | | | 1.10 | % | | | 1.02 | % | | | 0.95 | % |
Ratio of net investment income to average net assets1 | | | 0.52 | % | | | 1.68 | % | | | 1.56 | % | | | 1.38 | % | | | 1.74 | % |
Portfolio turnover | | | 123 | % | | | 60 | % | | | 108 | % | | | 56 | % | | | 73 | % |
Net assets at end of year (000’s omitted) | | $ | 175,105 | | | $ | 182,387 | | | $ | 183,197 | | | $ | 238,436 | | | $ | 236,625 | |
| | | | | | | | | | | | | | | | | | | | |
| | | For the fiscal year ended October 31, | |
Managers Small Cap Fund | | 2007 | | | 2006 | | | 2005 | | | 2004 | | | 2003 | |
Net Asset Value, Beginning of Year | | $ | 15.47 | | | $ | 12.90 | | | $ | 11.10 | | | $ | 10.76 | | | $ | 7.66 | |
| | | | | | | | | | | | | | | | | | | | |
Income from Investment Operations: | | | | | | | | | | | | | | | | | | | | |
Net investment income (loss) | | | (0.11 | )3 | | | (0.12 | )3 | | | (0.14 | )3 | | | (0.15 | ) | | | (0.14 | ) |
Net realized and unrealized gain on investments | | | 2.51 | 3 | | | 2.69 | 3 | | | 1.94 | | | | 0.49 | | | | 3.24 | |
| | | | | | | | | | | | | | | | | | | | |
Total from investment operations | | | 2.40 | | | | 2.57 | | | | 1.80 | | | | 0.34 | | | | 3.10 | |
| | | | | | | | | | | | | | | | | | | | |
Net Asset Value, End of Year | | $ | 17.87 | | | $ | 15.47 | | | $ | 12.90 | | | $ | 11.10 | | | $ | 10.76 | |
| | | | | | | | | | | | | | | | | | | | |
Total Return1 | | | 15.51 | % | | | 19.92 | % | | | 16.13 | % | | | 3.16 | % | | | 40.47 | % |
| | | | | | | | | | | | | | | | | | | | |
Ratio of net expenses to average net assets | | | 1.39 | % | | | 1.38 | % | | | 1.47 | % | | | 1.60 | % | | | 1.60 | % |
Ratio of total expenses to average net assets2 | | | 1.41 | % | | | 1.42 | % | | | 1.53 | % | | | 1.63 | % | | | 1.72 | % |
Ratio of net investment loss to average net assets1 | | | (0.68 | )% | | | (0.84 | )% | | | (1.10 | )% | | | (1.43 | )% | | | (1.42 | )% |
Portfolio turnover | | | 49 | % | | | 49 | % | | | 67 | % | | | 54 | % | | | 207 | % |
Net assets at end of year (000’s omitted) | | $ | 87,015 | | | $ | 89,175 | | | $ | 66,301 | | | $ | 54,101 | | | $ | 38,738 | |
35
Financial Highlights
For a share outstanding throughout each fiscal year
| | | | | | | | | | | | | | | | | | | | |
| | | For the fiscal year ended October 31, | |
Managers Real Estate Securities Fund | | 2007 | | | 2006 | | | 2005 | | | 2004 | | | 2003 | |
Net Asset Value, Beginning of Year | | $ | 14.74 | | | $ | 12.86 | | | $ | 12.75 | | | $ | 10.09 | | | $ | 8.12 | |
| | | | | | | | | | | | | | | | | | | | |
Income from Investment Operations: | | | | | | | | | | | | | | | | | | | | |
Net investment income | | | 0.06 | | | | 0.18 | | | | 0.35 | | | | 0.30 | | | | 0.46 | |
Net realized and unrealized gain (loss) on investments | | | 0.22 | | | | 3.87 | | | | 1.86 | | | | 2.66 | | | | 2.10 | |
| | | | | | | | | | | | | | | | | | | | |
Total from investment operations | | | 0.28 | | | | 4.05 | | | | 2.21 | | | | 2.96 | | | | 2.56 | |
| | | | | | | | | | | | | | | | | | | | |
Less Distributions to Shareholders from: | | | | | | | | | | | | | | | | | | | | |
Net investment income | | | (0.10 | ) | | | (0.10 | ) | | | (0.35 | ) | | | (0.30 | ) | | | (0.59 | ) |
Net realized gain on investments | | | (2.35 | ) | | | (2.07 | ) | | | (1.75 | ) | | | — | | | | — | |
| | | | | | | | | | | | | | | | | | | | |
Total distributions to shareholders | | | (2.45 | ) | | | (2.17 | ) | | | (2.10 | ) | | | (0.30 | ) | | | (0.59 | ) |
| | | | | | | | | | | | | | | | | | | | |
Net Asset Value, End of Year | | $ | 12.57 | | | $ | 14.74 | | | $ | 12.86 | | | $ | 12.75 | | | $ | 10.09 | |
| | | | | | | | | | | | | | | | | | | | |
Total Return1 | | | 2.10 | % | | | 36.43 | % | | | 18.84 | % | | | 29.56 | % | | | 32.75 | % |
| | | | | | | | | | | | | | | | | | | | |
Ratio of net expenses to average net assets | | | 1.40 | % | | | 1.46 | % | | | 1.42 | % | | | 1.50 | % | | | 1.50 | % |
Ratio of total expenses to average net assets2 | | | 1.41 | % | | | 1.46 | % | | | 1.54 | % | | | 1.67 | % | | | 1.74 | % |
Ratio of net investment income to average net assets1 | | | 0.82 | % | | | 0.97 | % | | | 1.93 | % | | | 2.68 | % | | | 4.89 | % |
Portfolio turnover | | | 126 | % | | | 69 | % | | | 70 | % | | | 136 | % | | | 60 | % |
Net assets at end of year (000’s omitted) | | $ | 26,561 | | | $ | 27,624 | | | $ | 24,903 | | | $ | 28,586 | | | $ | 29,567 | |
| | | | | | | | | | | | | | | | | | | | |
| | | For the fiscal year ended October 31, | |
Managers California Intermediate Tax-Free Fund | | 2007 | | | 2006 | | | 2005 | | | 2004 | | | 2003 | |
Net Asset Value, Beginning of Year | | $ | 10.75 | | | $ | 10.66 | | | $ | 11.17 | | | $ | 11.08 | | | $ | 11.08 | |
| | | | | | | | | | | | | | | | | | | | |
Income from Investment Operations: | | | | | | | | | | | | | | | | | | | | |
Net investment income | | | 0.40 | | | | 0.39 | | | | 0.39 | | | | 0.40 | | | | 0.41 | |
Net realized and unrealized gain (loss) on investments | | | (0.16 | ) | | | 0.25 | | | | (0.31 | ) | | | 0.28 | | | | 0.07 | |
| | | | | | | | | | | | | | | | | | | | |
Total from investment operations | | | 0.24 | | | | 0.64 | | | | 0.08 | | | | 0.68 | | | | 0.48 | |
| | | | | | | | | | | | | | | | | | | | |
Less Distributions to Shareholders from: | | | | | | | | | | | | | | | | | | | | |
Net investment income | | | (0.40 | ) | | | (0.40 | ) | | | (0.40 | ) | | | (0.40 | ) | | | (0.41 | ) |
Net realized gain on investments | | | (0.03 | ) | | | (0.15 | ) | | | (0.19 | ) | | | (0.19 | ) | | | (0.07 | ) |
| | | | | | | | | | | | | | | | | | | | |
Total distributions to shareholders | | | (0.43 | ) | | | (0.55 | ) | | | (0.59 | ) | | | (0.59 | ) | | | (0.48 | ) |
| | | | | | | | | | | | | | | | | | | | |
Net Asset Value, End of Year | | $ | 10.56 | | | $ | 10.75 | | | $ | 10.66 | | | $ | 11.17 | | | $ | 11.08 | |
| | | | | | | | | | | | | | | | | | | | |
Total Return1 | | | 2.23 | % | | | 6.21 | % | | | 0.92 | % | | | 6.39 | % | | | 4.46 | % |
| | | | | | | | | | | | | | | | | | | | |
Ratio of net expenses to average net assets | | | 0.56 | % | | | 0.55 | % | | | 0.55 | % | | | 0.55 | % | | | 0.55 | % |
Ratio of total expenses to average net assets2 | | | 0.82 | % | | | 0.82 | % | | | 0.81 | % | | | 0.74 | % | | | 0.69 | % |
Ratio of net investment income to average net assets1 | | | 3.75 | % | | | 3.76 | % | | | 3.74 | % | | | 3.63 | % | | | 3.72 | % |
Portfolio turnover | | | 35 | % | | | 22 | % | | | 28 | % | | | 66 | % | | | 116 | % |
Net assets at end of year (000’s omitted) | | $ | 35,982 | | | $ | 54,144 | | | $ | 47,847 | | | $ | 50,784 | | | $ | 59,012 | |
The following notes should be read in conjunction with the Financial Highlights of the Funds presented on this and the proceeding page.
1 | Total returns and net investment income would have been lower had certain expenses not been reduced. (See Note 1c of Notes to Financial Statements.) |
2 | Excludes the impact of expense (reimbursement)/recoupment and expense offsets such as brokerage recapture credits, but includes non-reimbursable expenses, if any, such as interest and taxes. (See Note 1c of Notes to Financial Statements.) |
3 | Per share numbers have been calculated using average shares. |
36
Notes to Financial Statements
October 31, 2007
| 1. | Summary of Significant Accounting Policies |
Managers Trust I (the “Trust”) is an open-end management investment company organized as a Massachusetts business trust and registered under the Investment Company Act of 1940, as amended (the “1940 Act”). Currently, the Trust is comprised of a number of investment series. Included in this report are the Managers Fremont Global Fund (“Managers Fremont Global”), Managers Small Cap Fund (“Small Cap”), Managers Real Estate Securities Fund (“Real Estate Securities”), and Managers California Intermediate Tax-Free Fund (“California Intermediate Tax-Free”), collectively the “Funds.”
The Funds’ financial statements are prepared in accordance with accounting principles generally accepted in the United States of America, which require management to make estimates and assumptions that affect the reported amount of assets and liabilities and disclosure of contingent assets and liabilities at the date of the financial statements and the reported amounts of income and expenses during the reporting periods. Actual results could differ from those estimates. The following is a summary of significant accounting policies followed by the Funds in the preparation of their financial statements:
| a. | Valuation of Investments |
Equity securities traded on a domestic or international securities exchange are valued at the last quoted sale price, or, lacking any sales, at the last quoted bid price. Over-the-counter securities are valued at the NASDAQ Official Closing Price, if one is available. Lacking any sales, over-the counter securities are valued at the last quoted bid price. Under certain circumstances, the value of each Fund’s investment may be based on an evaluation of its fair value, pursuant to procedures established by and under the general supervision of the Board of Trustees of the Trust. A Fund may use the fair value of a portfolio security to calculate its NAV when, for example, (1) market quotations are not readily available because a portfolio security is not traded in a public market or the principal market in which the security trades is closed, (2) trading in a portfolio security is suspended and has not resumed before the Fund calculates its NAV, (3) a significant event affecting the value of a portfolio security is determined to have occurred between the time of the market quotation provided for a portfolio security and the time as of which the Fund calculates its NAV, (4) a security’s price has remained unchanged over a period of time (often referred to as a “stale price”), or (5) the Investment Manager determines that a market quotation is inaccurate. The Investment Manager monitors intervening events that may affect the value of securities held in a Fund’s portfolio and, in accordance with procedures adopted by the Fund’s Trustees, will adjust the prices of securities traded in foreign markets, as appropriate, to reflect the impact of events occurring subsequent to the close of such markets but prior to the time each Fund’s NAV is calculated. Fixed income securities are valued based on valuations furnished by independent pricing services that utilize matrix systems, which reflect such factors as security prices, yields, maturities, and ratings, and are supplemented by dealer and exchange quotations. Futures contracts for which market quotations are readily available are valued at the settlement price as of the close of the futures exchange. Short-term investments having a remaining maturity of 60 days or less are valued at amortized cost, which approximates market value. Investments in other regulated investment companies are valued at their end of day net asset value per share. Investments in certain mortgage-backed, stripped mortgage-backed, preferred stocks, convertible securities, derivatives and other debt securities not traded on an organized securities market are valued on the basis of valuations provided by dealers or by a pricing service which uses information with respect to transactions in such securities and various relationships between securities and yield to maturity in determining value. Securities (including derivatives) for which market quotations are not readily available are valued at fair value, as determined in good faith, and pursuant to procedures adopted by the Board of Trustees of the Trust. The values assigned to fair value investments are based on available information and do not necessarily represent amounts that might ultimately be realized, since such amounts depend on future developments inherent in long-term investments. Further, because of the inherent uncertainty of valuation, those estimated values may differ significantly from the values that would have been used had a ready market for the investments existed, and the differences could be material.
Security transactions are accounted for as of the trade date. Realized gains and losses on securities sold are determined on the basis of identified cost.
| c. | Investment Income and Expenses |
Dividend income is recorded on the ex-dividend date except certain dividends from foreign securities where the ex-dividend date may have passed. These dividends are recorded as soon as the Trust is informed of the ex-dividend date. Dividend income on foreign securities is recorded net of any withholding tax. Interest income, which includes amortization of premium and accretion of discount on debt securities, as required, is accrued as earned. Non-cash dividends included in dividend income, if any, are reported at the fair value of the securities received. Other income and expenses are recorded on an accrual basis. Expenses that cannot be directly attributed to a fund are apportioned among the Funds in the Trust and in some cases other affiliated funds based upon their relative average net assets or number of shareholders.
The following Funds had certain portfolio trades directed to various brokers who paid a portion of such Fund’s expenses. For the fiscal year ended October 31, 2007, under these arrangements the amount by which the Funds’ expenses were reduced and the impact on the expense ratios were as follows: Managers Fremont Global - $24,143 or 0.01%, Small Cap - $14,395 or 0.02%, and Real Estate Securities - $ 2,587 or 0.01%.
The Funds have a “balance credit” arrangement with The Bank of New York (“BNY”), the Funds’ custodian, whereby each Fund is credited with an interest factor equal to 0.75% below the effective 90-day T-Bill rate for account balances left uninvested overnight. These credits serve to reduce custody expenses that would otherwise be charged to each Fund. For the fiscal year ended October 31, 2007, the custodian expense was reduced as follows: Managers Fremont Global - $502, Small Cap - $262, Real Estate Securities - $56 and California Intermediate Tax-Free - $960. Overdrafts will cause a reduction of any earnings credits, computed at 2% above the effective Federal funds rate on the day of the overdraft. For the fiscal year ended October 31, 2007, overdraft fees for Real Estate Securities and California Intermediate Tax-Free equaled $107 and $3,512, respectively.
The Trust also has a balance credit arrangement with its Transfer Agent, PFPC, Inc., whereby earnings credits are used to offset banking charges. For the fiscal year ended October, 31, 2007, the transfer agent expense was reduced as follows: Managers Fremont Global - $1,427, Small Cap - $770, Real Estate Securities - $246 and California Intermediate Tax-Free - $335.
The Investment Manager, an independently-managed subsidiary of Affiliated Managers Group, Inc. (“AMG”) and the investment manager for the Funds, has contractually agreed, through at least March 1, 2008, to waive fees and pay or reimburse expenses of Real Estate Securities and California Intermediate Tax-Free to the extent that the total annual operating expenses (exclusive of taxes, interest,
37
Notes to Financial Statements (continued)
brokerage costs, acquired fund fees and expenses, and extraordinary expenses) of the Fund exceed 1.50% and 0.55%, respectively, of each Fund’s average daily net assets.
Effective January 15, 2005, each of Real Estate Securities and California Intermediate Tax-Free is obligated to repay the Investment Manager such amounts waived, paid or reimbursed in future years provided that the repayment occurs within three (3) years after the waiver or reimbursement and that such repayment would not cause the Fund’s expenses in any such year to exceed the previously stated percentages of that Fund’s average daily net assets. For the fiscal year ended October 31, 2007, Real Estate Securities made such repayments to the Investment Manager in the amount of $746. For the fiscal year ended October 31, 2007, the cumulative amount of expense reimbursement by the Manager subject to repayment by Real Estate Securities and California Intermediate Tax-Free equaled $0 and $328,852, respectively.
| d. | Dividends and Distributions |
Dividends resulting from net investment income, if any, normally will be declared and paid as follows:
Annually - Small Cap
Quarterly - Fremont Global and Real Estate Securities
Declared daily, paid monthly - California Intermediate Tax-Free
Distributions of capital gains, if any, will be made on an annual basis and when required for Federal excise tax purposes. Income and capital gain distributions are determined in accordance with Federal income tax regulations, which may differ from generally accepted accounting principles. These differences are primarily due to differing treatments for losses deferred due to wash sales, REITs, equalization accounting for tax purposes, foreign currency, futures and market discount transactions. Permanent book and tax basis differences, if any, relating to shareholder distributions will result in reclassifications to paid-in capital. The tax character of distributions paid during the fiscal years ended 2007 and 2006 were as follows:
| | | | | | | | | | |
| | | Managers Fremont Global | | Small Cap |
| | | 2007 | | 2006 | | 2007 | | 2006 |
Distributions paid from: | | | | | | | | | | |
Ordinary income | | 1,566,989 | | $ | 9,462,057 | | — | | | — |
Short-term capital gains | | — | | | — | | — | | | — |
Long-term capital gains | | — | | | — | | — | | | — |
| | | | | | | | | | |
| | 1,566,989 | | $ | 9,462,057 | | — | | | — |
| | | | | | | | | | |
| | |
| | | Real Estate Securities | | California Intermediate Tax-Free |
| | | 2007 | | 2006 | | 2007 | | 2006 |
Distributions paid from: | | | | | | | | | | |
Ordinary income | | 218,890 | | $ | 183,846 | | 1,587,981 | | $ | 1,906,973 |
Short-term capital gains | | 611,939 | | | 1,239,381 | | 12,813 | | | — |
Long-term capital gains | | 3,731,710 | | | 2,683,431 | | 116,341 | | | 706,464 |
| | | | | | | | | | |
| | 4,562,539 | | $ | 4,106,658 | | 1,717,135 | | $ | 2,613,437 |
| | | | | | | | | | |
As of October 31, 2007, the components of distributable earnings (excluding unrealized appreciation/ depreciation) on a tax basis consisted of:
| | | | | | | | | | | | |
| | | Managers
Fremont
Global | | Small Cap | | Real Estate
Securities | | California
Intermediate
Tax-Free |
Capital loss carryforward | | $ | 43,288,254 | | $ | 12,013,783 | | | — | | | — |
Undistributed ordinary income | | | 1,366,232 | | | — | | $ | 28,757 | | $ | 10,982 |
Undistributed short-term capital gains | | | — | | | — | | | 826,670 | | | 13,343 |
Undistributed long-term capital gains | | | — | | | — | | | 4,750,592 | | | 528,463 |
Each Fund intends to comply with the requirements under Subchapter M of the Internal Revenue Code of 1986, as amended, to distribute substantially all of its taxable income and gains to
38
Notes to Financial Statements (continued)
its shareholders and to meet certain diversification and income requirements with respect to investment companies. Therefore, no provision for Federal income or excise tax is included in the accompanying financial statements.
Additionally, based on the Fund’s understanding of the tax rules and rates related to income, gains and transactions for the foreign jurisdictions in which it invests, the Fund will provide for foreign taxes, and where appropriate, deferred foreign taxes.
| f. | Capital Loss Carryovers |
As of October 31, 2007, the following Funds had accumulated net realized capital loss carryovers from securities transactions for Federal income tax purposes as shown in the following chart. These amounts may be used to offset realized capital gains, if any, through the expiration dates listed.
| | | | | |
Fund | | Capital Loss
Carryover Amount | | Expires October 31, |
Managers Fremont Global | | $ | 43,288,254 | | 2011 |
Small Cap | | | 12,013,783 | | 2010 |
For the fiscal year ended October 31, 2007, Managers Fremont Global and Small Cap utilized capital loss carryovers in the amounts of $19,283,254 and $13,208,567, respectively.
The Trust’s Declaration of Trust authorizes for each series the issuance of an unlimited number of shares of beneficial interest, without par value. Each Fund records sales and repurchases of its capital stock on the trade date. Dividends and distributions to shareholders are recorded on the ex-dividend date.
At October 31, 2007, certain unaffiliated shareholders, specifically omnibus accounts, individually held greater than 10% of the outstanding shares of the following Funds: Small Cap - 4 collectively own 66%; Real Estate Securities - 3 collectively own 55%; California Intermediate Tax-Free - 2 collectively own 51%. Transactions by these shareholders may have a material impact on the Funds.
| h. | Foreign Currency Translation |
The books and records of the Funds are maintained in U.S. dollars. The value of investments, assets and liabilities denominated in currencies other than U.S. dollars are translated into U.S. dollars based upon current foreign exchange rates. Purchases and sales of foreign investments, income and expenses are converted into U.S. dollars based on currency exchange rates prevailing on the respective dates of such transactions. Net realized and unrealized gain (loss) on foreign currency transactions represent: (1) foreign exchange gains and losses from the sale and holdings of foreign currencies; (2) gains and losses between trade date and settlement date on investment securities transactions and forward foreign currency exchange contracts; and (3) gains and losses from the difference between amounts of interest and dividends recorded and the amounts actually received.
In addition, the Funds do not isolate the net realized and unrealized gain or loss resulting from changes in exchange rates from the fluctuations resulting from changes in market prices of securities held. Such fluctuations are included with the net realized and unrealized gain or loss on investments.
| 2. | Agreements and Transactions with Affiliates |
The Trust has entered into an Investment Management Agreement under which the Investment Manager provides or oversees investment management services to the Funds. The Investment Manager selects subadvisors for each Fund (subject to Trustee approval), allocates assets among subadvisors and monitors the subadvisors’ investment programs and results. Each Fund’s investment portfolio is managed by portfolio managers who serve pursuant to subadvisory agreements with the Investment Manager.
Investment management fees are paid directly by each Fund to the Investment Manager based on average daily net assets. The annual investment management fee rates, as a percentage of average daily net assets for the fiscal year ended October 31, 2007, were as follows:
| | | | | |
Fund | | | | Investment
Management Fee | |
Managers Fremont Global | | | | 0.60 | % |
Small Cap | | | | 1.00 | % |
Real Estate Securities | | | | 0.85 | % |
California Intermediate Tax-Free | | | | | |
| | on first $25 million | | 0.40 | % |
| | on next $25 million | | 0.35 | % |
| | on next $50 million | | 0.30 | % |
| | on next $50 million | | 0.25 | % |
on balance over $150 million | | 0.20 | % |
Effective January 10, 2007, the Investment Manager contractually agreed to waive its entire management fee for Managers Fremont Global with respect to those assets of the Fund invested in Managers Global Bond Fund until March 1, 2008. The amount waived for the fiscal year ended October 31, 2007 was $240,782, or 0.14% of Managers Fremont Global Fund’s average net assets. The net management fee for the fiscal year ended October 31, 2007 was 0.46%.
The Trust has entered into an Administration and Shareholder Servicing Agreement under which the Investment Manager serves as each Fund’s administrator (the “Administrator”) and is responsible for all aspects of managing the Funds’ operations, including administration and shareholder services to each Fund, its shareholders, and certain institutions, such as bank trust departments, broker-dealers and registered investment advisers, that advise or act as an intermediary with the Funds’ shareholders. For its services, the Administrator is paid a fee at a rate of 0.25% of average net assets per annum.
Effective January 10, 2007, the Investment Manager agreed to waive a portion of its administrative fee for Managers Fremont Global with respect to those assets of the Fund invested in the Managers Global Bond Fund such that its administrative fee will be 0.05% of the average daily net assets invested in the Managers Global Bond Fund. The amount waived for the fiscal year ended October 31, 2007 was $80,260 or 0.047% of the Managers Fremont Global Fund’s average net assets.
Prior to July 1, 2007, the aggregate annual retainer paid to each Independent Trustee was $55,000, plus $4,000 or $2,000 for each regular or special meeting attended, respectively. Effective July 1, 2007, the aggregate annual retainer paid to each Independent Trustee is $65,000, plus $4,000 or $2,500 for each regular or special
39
Notes to Financial Statements (continued)
meeting attended, respectively. The Trustees’ fees and expenses are allocated amongst all of the Funds for which the Investment Manager serves as the advisor (the “Managers Funds”) based on the relative net assets of such Funds. The Independent Chairman of the Trusts receives an additional payment of $15,000 per year. (Prior to July 1, 2007, the Independent Chairman received an additional payment of $10,000 per year). The Chairman of the Audit Committee receives an additional payment of $5,000 per year. (Prior to July 1, 2007, the Chairman of the Audit Committee received an additional payment of $2,000 per year). The “Trustee fees and expenses” shown in the financial statements represents the Fund’s allocated portion of the total fees and expenses paid by the Managers Funds.
The Funds are distributed by Managers Distributors, Inc. (the “Distributor”) a wholly-owned subsidiary of the Investment Manager. The Distributor serves as the principal underwriter for each Fund. The Distributor is a registered broker-dealer and member of the Financial Industry Regulatory Authority (“FINRA”). Shares of each Fund will be continuously offered and will be sold by brokers, dealers or other financial intermediaries who have executed selling agreements with the Distributor. The Distributor bears all the expenses of providing services pursuant to the Underwriting Agreement, including the payment of the expenses relating to the distribution of Prospectuses for sales purposes and any advertising or sales literature. Certain Trustees and Officers of the Funds are Officers and/or Directors of the Investment Manager, AMG and/or the Distributor.
| 3. | Purchases and Sales of Securities |
Purchases and sales of securities, excluding short-term securities, for the fiscal year ended October 31, 2007, for Managers Fremont Global were $206,094,276 and $246,492,460; Small Cap were $46,144,656 and $58,787,469; Real Estate Securities were $35,733,341 and $35,821,711; and California Intermediate Tax-Free were $15,273,047 and $32,695,659, respectively. Purchase and sales of U.S.
Government securities for the fiscal year ended October 31, 2007 for Managers Fremont Global were $200 and $6,662,279, respectively.
| 4. | Portfolio Securities Loaned |
The Funds may participate in a securities lending program offered by BNY, providing for the lending of equities, corporate bonds and government securities to qualified brokers. Collateral on all securities loaned is accepted in cash and/or government securities. Collateral is maintained at a minimum level of 102% of the market value, plus interest, if applicable, of investments on loan. Collateral received in the form of cash is invested temporarily in institutional money market funds or other short-term investments by BNY. Security lending fees include earnings of such temporary cash investments, plus or minus any rebate to a borrower. These earnings (after rebate) are then divided between BNY, as a fee for its services under the program, and the Fund loaning the security, according to agreed-upon rates.
| 5. | Commitments and Contingencies |
In the normal course of business, the Funds may enter into contracts and agreements that contain a variety of representations and warranties, which provide general indemnifications. The maximum exposure to the Funds under these arrangements is unknown, as this would involve future claims that may be against the Funds that have not yet occurred. However, based on experience, the Funds expect the risks of loss to be remote.
Certain transactions, such as futures and forward transactions, dollar roll agreements, or purchases of when-issued or delayed delivery securities may have a similar effect on a Fund’s net asset value as if the Fund had created a degree of leverage in its portfolio. However, if a Fund enters into such a transaction, the Fund will establish a segregated account with its custodian in which it will maintain cash, U.S. government securities or other liquid securities equal in value to its obligations in respect to such transaction. Securities and other assets held in the segregated account may not be sold while the transaction is outstanding, unless other suitable assets are substituted.
| 7. | Futures Contracts Held or Issued for Purposes other than Trading |
Managers Fremont Global uses Equity Index futures contracts to a limited extent, with the objective of maintaining exposure to equity stock markets while maintaining liquidity. The Fund may purchase or sell futures contracts to achieve a desired level of investment, whether to accommodate portfolio turnover or cash flows from capital shares transactions. There are certain risks associated with futures contracts. Prices may not move as expected or the Fund may not be able to close out the contract when it desires to do so, resulting in losses.
Futures are valued at their quoted daily settlement prices. The aggregate principal amounts of the contracts are not recorded in the financial statements. Fluctuations in the value of the contracts are recorded in the Statement of Assets and Liabilities as an asset (liability) and in the Statement of Operations as unrealized appreciation (depreciation) until the contracts are closed, when they are recorded as realized gains (losses) on futures or forward currency contracts. The Fund had no open futures contracts at October 31, 2007.
| 8. | Forward Foreign Currency Contracts |
During the fiscal year ended October 31, 2007, Managers Fremont Global invested in forward foreign currency exchange contracts to manage currency exposure. These investments may involve greater market risk than the amounts disclosed in the Fund’s financial statements.
A forward foreign currency exchange contract is an agreement between a Fund and another party to buy or sell a currency at a set price at a future date. The market value of the contract will fluctuate with changes in currency exchange rates. The contract is marked-to-market daily, and the change in market value is recorded as an unrealized gain or loss. Gain or loss on the purchase or sale of contracts having the same settlement date, amount and counterparty is realized on the date of offset, otherwise gain or loss is realized on settlement date.
Managers Fremont Global may invest in non-U.S. dollar denominated instruments subject to limitations, and enter into forward foreign currency exchange contracts to facilitate transactions in foreign securities and to protect against a possible loss resulting from an adverse change in the relationship between the U.S. dollar and such foreign currency. Risks may arise upon entering into these contracts from the potential inability of counterparties to meet the terms of their contracts and from unanticipated movements in the value of a foreign currency relative to the U.S. dollar.
40
Notes to Financial Statements (continued)
Managers Fremont Global had the following open forward currency contracts as of October 31, 2007:
| | | | | | | | | | |
Foreign Currency | | | | Settlement Date | | Current Value (Receivable) | | Contract Value (Payable) | | Unrealized Gain/Loss |
| | | | | |
Managers Fremont Global | | | | | | | | | | |
Australian Dollar | | Short | | 11/05/07 | | ($9,811) | | ($9,730) | | ($81) |
Hong Kong Dollar | | Long | | 11/06/07 | | 4,927 | | 4,927 | | — |
Japanese Yen | | Short | | 11/01/07-11/05/07 | | (54,640) | | (54,833) | | 193 |
Japanese Yen | | Long | | 11/02/07 -11/05/07 | | 179,474 | | 180,077 | | (603) |
South African Rand | | Short | | 11/06/07 | | (7,670) | | (7,629) | | (41) |
| | | | | | | | | | |
| | | | Total: | | $ 112,280 | | $ 112,812 | | ($532) |
| | | | | | | | | | |
| 9. | New Accounting Pronouncements |
In June 2006, the Financial Accounting Standards Board (“FASB”) issued Interpretation No. 48, “Accounting for Uncertainty in Income Taxes - an Interpretation of FASB Statement No. 109 (“FIN 48”)”. FIN 48 applies to all registered investment companies and establishes the minimum threshold for recognizing, and a system for measuring, the benefits of tax-return positions in the financial statements. FIN 48 is effective for fiscal years beginning after December 15, 2006. Management has analyzed the funds’ tax positions taken on federal income tax returns for all open tax years (tax years ended October 31, 2004-2007) and has concluded that as of October 31, 2007, no provision for income tax would be required in the funds’ financial statements. Additionally, Fund Management is not aware of any events that are reasonably possible to occur in the next twelve months that would result in the amounts of any unrecognized tax benefits significantly increasing or decreasing for the Funds.”
In addition, in September 2006, Statement of Financial Accounting Standards No. 157, Fair Value Measurements (“SFAS 157”), was issued and is effective for fiscal years beginning after November 15, 2007. SFAS 157 defines fair value, establishes a framework for measuring fair value and expands disclosures about fair value measurements. Management is currently evaluating the impact, if any, the adoption of SFAS 157 will have on the Funds’ financial statements.
The Board of Trustees at the meeting to be held on December 5, 2007, approved a change to Managers Fremont Global’s dividend declaration procedures, such that it will declare and pay dividends resulting from net investment income annually in December.
Tax Information (unaudited)
Each Fund hereby designates the maximum amount allowable of its net taxable income as qualified dividends as provided in the Jobs and Growth Tax Relief Reconciliation Act of 2003. The 2007 Form 1099-DIV you receive for each Fund will show the tax status of all distributions paid to you during the year.
Pursuant to section 852 of the Internal Revenue Code, Managers Fremont Global, Small Cap, Real Estate Securities and California Intermediate Tax-Free designate $0, $0, $4,861,197, and $530,403, respectively, as long-term capital gains for the taxable year ended October 31, 2007.
41
Report of Independent Registered Public Accounting Firm
To the Board of Trustees of Managers Trust I and the Shareholders of Managers Fremont Global Fund, Managers Small Cap Fund, Managers Real Estate Securities Fund and Managers California Intermediate Tax-Free Fund:
In our opinion, the accompanying statements of assets and liabilities, including the schedules of portfolio investments, and the related statements of operations and of changes in net assets and the financial highlights present fairly, in all material respects, the financial position of Managers Fremont Global Fund, Managers Small Cap Fund, Managers Real Estate Securities Fund and Managers California Intermediate Tax-Free Fund, (four of the series constituting Managers Trust I, hereafter referred to as the “Funds”), at October 31, 2007, the results of each of their operations for the year then ended, the changes in each of their net assets for each of two years in the period then ended, and the financial highlights for each of the five years in the period then ended, in conformity with accounting principles generally accepted in the United States of America. These financial statements and financial highlights (hereafter referred to as “financial statements”) are the responsibility of the Funds’ management; our responsibility is to express an opinion on these financial statements based on our audits. We conducted our audits of these financial statements in accordance with the standards of the Public Company Accounting Oversight Board (United States). Those standards require that we plan and perform the audit to obtain reasonable assurance about whether the financial statements are free of material misstatement. An audit includes examining, on a test basis, evidence supporting the amounts and disclosures in the financial statements, assessing the accounting principles used and significant estimates made by management, and evaluating the overall financial statement presentation. We believe that our audits, which included confirmation of securities at October 31, 2007 by correspondence with the custodian and brokers, provide a reasonable basis for our opinion.
PricewaterhouseCoopers, LLP
Philadelphia, Pennsylvania
December 21, 2007
42
Trustees and Officers
The Trustees and Officers of the Trust, their business addresses, principal occupations for the past five years and dates of birth are listed below. The Trustees provide broad supervision over the affairs of the Trust and the Funds. The Trustees are experienced executives who meet periodically throughout the year to oversee the Funds’ activities, review contractual arrangements with companies that provide services to the Funds, and review the Funds’ performance. Unless otherwise noted, the address of each Trustee or Officer is the address of the Trust: 800 Connecticut Avenue, Norwalk, Connecticut 06854.
There is no stated term of office for Trustees. Trustees serve until their resignation, retirement or removal in accordance with the Trust’s organizational documents and policies adopted by the Board from time to time. The Chairman of the Trustees, President, Treasurer and Secretary of the Trust are elected by the Trustees annually. Other officers hold office at the pleasure of the Trustees.
Independent Trustees
The following Trustees are not “interested persons” of the Trust within the meaning of the 1940 Act:
| | |
Name, Date of Birth, Number of Funds Overseen in Fund Complex* | | Principal Occupation(s) During Past 5 Years and Other Directorships Held by Trustee |
| Jack W. Aber, 9/9/37 | | Professor of Finance, Boston University School of |
• Trustee since 2000 • Oversees 31 Funds in Fund Complex | | Management (1972-Present); Trustee of Appleton Growth Fund (1 portfolio); Trustee of Third Avenue Trust (4 portfolios); Trustee of Third Avenue Variable Trust (1 portfolio). |
| |
William E. Chapman, II, 9/23/41 • Independent Chairman • Trustee since 2000 • Oversees 31 Funds in Fund Complex | | President and Owner, Longboat Retirement Planning Solutions (1998-Present); Hewitt Associates, LLC (part time) (provider of Retirement and Investment Education Seminars); Trustee of Bowdoin College (2002-Present); Trustee of Third Avenue Trust (4 portfolios); Trustee of Third Avenue Variable Trust (1 portfolio). |
| |
Edward J. Kaier, 9/23/45 • Trustee since 2000 • Oversees 31 Funds in Fund Complex | | Attorney at Law and Partner, Teeters Harvey Kilboy & Kaier LLP (2007-Present); Attorney at Law and Partner, Hepburn Willcox Hamilton & Putnam, LLP (1977-2007); Trustee of Third Avenue Trust (4 portfolios); Trustee of Third Avenue Variable Trust (1 portfolio). |
| |
Steven J. Paggioli, 4/3/50 • Trustee since 2000 • Oversees 31 Funds in Fund Complex | | Consultant (2001-Present); Formerly Executive Vice President and Director, The Wadsworth Group (1986-2001); Executive Vice President, Secretary and Director, Investment Company Administration, LLC (1990-2001); Vice President, Secretary and Director, First Fund Distributors, Inc. (1991-2001); Trustee, Professionally Managed Portfolios (22 portfolios); Advisory Board Member, Sustainable Growth Advisors, LP. |
| |
Eric Rakowski, 6/5/58 • Trustee since 2000 • Oversees 31 Funds in Fund Complex | | Professor, University of California at Berkeley School of Law (1990-Present); Trustee of Third Avenue Trust (4 portfolios); Trustee of Third Avenue Variable Trust (1 portfolio). |
| |
Thomas R. Schneeweis, 5/10/47 • Trustee since 2000 • Oversees 31 Funds in Fund Complex | | Professor of Finance, University of Massachusetts (1977-Present); Director, CISDM at the University of Massachusetts, (1996-Present); President, Alternative Investment Analytics, LLC, (formerly Schneeweis Partners, LLC) (2001-Present); Partner, White Bear Partners, LLC (2007-Present); Partner, Schneeweis Capital Management, LLC (2007-Present); Partner, Schneeweis Associates, LLC (2007-Present); Partner, Northampton Capital Management, LLC (2004-Present); Partner, TRS Associates (2007-Present). |
Interested Trustee
The following Trustee is an “interested person” of the Trust within the meaning of the 1940 Act by virtue of his positions with, and interest in securities of, Affiliated Managers Group, Inc.
| | |
Name, Date of Birth, Number of Funds Overseen in Fund Complex* | | Principal Occupation(s) During Past 5 Years and Other Directorships Held by Trustee |
| |
William J. Nutt, 3/30/45 • Trustee since 2005 • President since 2007 • Oversees 31 Funds in Fund Complex | | Chairman and Founder of Affiliated Managers Group, Inc., (1993-Present); Chief Executive Officer of Affiliated Managers Group, Inc. (1993-2004); Director, Affiliated Managers Group, Inc. (1993-Present); President of Affiliated Managers Group, Inc. (1993-1999); President and Chief Operating Officer, The Boston Company (1989-1993); Senior Executive Vice President, The Boston Company (1982-1989). |
Officers
| | |
Name, Date of Birth, Position(s) Held with Fund and Length of Time Served | | Principal Occupation(s) During Past 5 Years |
Christine C. Carsman, 4/2/52 • Secretary since 2004 | | Senior Vice President and Chief Regulatory Counsel, Affiliated Managers Group, Inc. (2004-Present); Secretary, The Managers Funds, Managers AMG Funds and Managers Trust II (2004-Present); Senior Counsel, Vice President and Director of Operational Risk Management and Compliance, Wellington Management Company, LLP (1995-2004); Deputy General Counsel, The Boston Company, Inc. (1993-1995); Associate General Counsel, The Boston Company Advisors, Inc. (1991-1993); Associate, Sullivan & Worcester LLP (1987-1991). |
| |
Donald S. Rumery, 5/29/58 • Chief Financial Officer since 2007 • Treasurer since 2000 | | Senior Vice President, Managers Investment Group LLC (2005-Present); Director, Finance and Planning, The Managers Funds LLC, (1994-2004); Treasurer and Chief Financial Officer, Managers Distributors, Inc. (2000-Present); Treasurer, The Managers Funds (1995-Present); Treasurer, Managers AMG Funds (1999-Present); Treasurer, Managers Trust II (2000-Present); Secretary, Managers Trust I and Managers Trust II (2000-2004) and Secretary, The Managers Funds (1997-2004); Chief Financial Officer, The Managers Funds, Managers Trust II and Managers AMG Funds (2007-Present). |
| |
Keitha L. Kinne, 5/16/58 • Chief Operating Officer since 2007 | | Managing Partner and Chief Operating Officer, Managers Investment Group LLC (2007-Present); Chief Operating Officer, The Managers Funds, Managers AMG Funds and Managers Trust II (2007-Present); Managing Director, Legg Mason & Co., LLC (2006-2007); Managing Director, Citigroup Asset Management (2004-2006); Senior Vice President, Prudential Investments (1999-2004). |
| * | The Fund Complex consists of Managers AMG Funds, The Managers Funds, Managers Trust I and Managers Trust II. |
43
Annual Renewal of Investment Advisory Agreements
On June 8, 2007, the Board of Trustees, including a majority of the Trustees who are not “interested persons” of the Trust (the “Independent Trustees”), approved the Investment Management Agreement with the Investment Manager for each of the Funds identified below and the Subadvisory Agreement for each of the Subadvisors. The Independent Trustees were separately represented by independent counsel in connection with their consideration of the approval of these agreements. In considering the Investment Management and Subadvisory Agreements, the Trustees reviewed a variety of materials relating to each Fund, the Investment Manager and each Subadvisor, including comparative performance, fee and expense information for an appropriate peer group of similar mutual funds (each, a “Peer Group”), performance information for relevant benchmark indices (each, a “Fund Benchmark”) and other information regarding the nature, extent and quality of services provided by the Investment Manager and the Subadvisors under their respective agreements. The Trustees also took into account performance, fee and expense information regarding each Fund provided to them on a quarterly basis throughout the year. Prior to voting, the Independent Trustees: (a) reviewed the foregoing information with their independent legal counsel and with management; (b) received materials from their independent legal counsel discussing the legal standards applicable to their consideration of the Investment Management Agreement and the Subadvisory Agreements; and (c) met with their independent legal counsel in private sessions at which no representatives of management were present.
Nature, extent and quality of services.
In considering the nature, extent and quality of the services provided by the Investment Manager, the Trustees reviewed information relating to the Investment Manager’s operations and personnel. Among other things, the Investment Manager provided financial information, biographical information on its supervisory and professional staff and descriptions of its organizational and management structure. The Trustees also took into account information provided periodically throughout the previous year by the Investment Manager relating to the performance of its duties with respect to the Funds and the Trustees’ familiarity with the Investment Manager’s management through Board meetings, discussions and reports. In the course of their deliberations regarding the Investment Management Agreement, the Trustees evaluated, among other things: (a) the quality of the search, selection and monitoring services performed by the Investment Manager in overseeing the portfolio management responsibilities of the Subadvisors; (b) the Investment Manager’s ability to supervise the Funds’ other service providers; and (c) the Investment Manager’s compliance programs. The Trustees also took into account the financial condition of the Investment Manager with respect to its ability to provide the services required under the Investment Management Agreement and to maintain contractual expense limitations for certain of the Funds.
For each Fund, the Trustees also reviewed information relating to each Subadvisor’s operations and personnel and the investment philosophy, strategies and techniques (for each Subadvisor, its
“Investment Strategy”) used in managing the Fund or the portion of the Fund for which the Subadvisor has portfolio management responsibility. Among other things, the Trustees reviewed biographical information on portfolio management and other professional staff, information regarding each Subadvisor’s organizational and management structure and each Subadvisor’s brokerage policies and practices. The Trustees considered specific information provided regarding the experience of the individual or individuals at each Subadvisor with portfolio management responsibility for the portion of the Fund managed by the Subadvisor, including the information set forth in the Fund’s prospectus and statement of additional information. With respect to those Funds managed with multiple Subadvisors, the Trustees also noted information provided by the Investment Manager regarding the manner in which each Subadvisor’s Investment Strategy complements those utilized by the Fund’s other Subadvisors. In the course of their deliberations, the Trustees evaluated, among other things: (a) the services rendered by each Subadvisor in the past; (b) the qualifications and experience of the Subadvisor’s personnel; and (c) the Subadvisor’s compliance programs. The Trustees also took into account the financial condition of each Subadvisor with respect to its ability to provide the services required under its Subadvisory Agreement.
Performance.
As noted above, the Board considered each Fund’s performance during relevant time periods as compared to each Fund’s Peer Group and noted that the Board reviews on a quarterly basis detailed information about each Fund’s performance results, portfolio composition and Investment Strategies, including with respect to the portion of the Fund managed by each Subadvisor. The Board noted the Investment Manager’s expertise and resources in monitoring the performance, investment style and risk adjusted performance of each Subadvisor. The Board also noted each Subadvisor’s performance record with respect to the Funds. The Board was mindful of the Investment Manager’s focus on each Subadvisor’s performance with respect to the Funds and the explanations of management regarding the factors that contributed to the performance of the Funds.
Advisory Fees and Profitability.
In considering the reasonableness of the advisory fee charged by the Investment Manager for managing each Fund, the Trustees noted that the Investment Manager, and not the Fund, is responsible for paying the fees charged by the Fund’s Subadvisors and, therefore, that the fees paid to the Investment Manager cover the cost of providing portfolio management services as well as the cost of providing search, selection and monitoring services in operating a “manager-of-managers” complex of mutual funds. The Trustees concluded that, in light of the additional high quality supervisory services provided by the Investment Manager and the fact that the subadvisory fees are paid out of the advisory fee, the advisory fee payable by each Fund to the Investment Manager can reasonably be expected to exceed the median advisory fee for the Peer Group, which consists mostly of funds that do not operate with a manager-of-managers structure.
44
Annual Renewal of Investment Advisory Agreements (continued)
In considering the reasonableness of the advisory fee payable to the Investment Manager, the Trustees also reviewed information provided by the Investment Manager setting forth all revenues and other benefits, both direct and indirect, received by the Investment Manager and its affiliates attributable to managing each Fund and all the mutual funds in the Managers Family of Funds, the cost of providing such services and the resulting profitability to the Investment Manager and its affiliates from these relationships. The Trustees also noted the current and potential asset levels of each Fund and the willingness of the Investment Manager to waive fees and pay expenses for certain of the Funds from time to time as a means of limiting the total expenses of the smaller Funds. In this regard, the Trustees noted that, unlike a mutual fund that is managed by a single investment adviser, the Funds operate in a manager-of-managers structure and, as a Fund grows in size, it is common practice for the Investment Manager to recommend the selection of an additional Subadvisor to manage a portion of the Fund’s portfolio. The Trustees also noted that the subadvisory fees are paid by the Investment Manager out of its advisory fee. The Trustees further noted that, because of this practice, the Investment Manager’s oversight and supervisory responsibilities with respect to the Funds can be expected to increase with the size of the Funds. Based on the foregoing, the Trustees concluded that the profitability to the Investment Manager is reasonable and that the Investment Manager is not realizing material benefits from economies of scale that would warrant adjustments to the advisory fees for any Fund at this time. With respect to economies of scale, the Trustees also noted that as a Fund’s assets increase over time, the Fund may realize other economies of scale to the extent that the increase in assets is proportionally greater than the increase in certain other expenses.
Subadvisory Fees and Profitability.
In considering the reasonableness of the fee payable by the Investment Manager to each Subadvisor (other than First Quadrant L.P. (“FQ”), which is an affiliate of the Investment Manager), the Trustees relied on the ability of the Investment Manager to negotiate the terms of the Subadvisory Agreement at arm’s length as part of the manager-of-managers structure, noting that the Subadvisor is not affiliated with the Investment Manager (other than FQ). In addition, the Trustees noted that the subadvisory fees are paid by the Investment Manager out of its advisory fee. Accordingly, the cost of services to be provided by the Subadvisor and the profitability to the Subadvisor of its relationship with a Fund were not material factors in the Trustees’ deliberations. For similar reasons, and based on the current size of the portion of a Fund managed by the Subadvisor, the Trustees concluded that any economies of scale being realized by the Subadvisor was not a material factor in the Trustees’ deliberations at this time.
In considering the reasonableness of the fee payable by the Investment Manager to FQ, a Subadvisor to the Fremont Global Fund, the Trustees noted that FQ is an affiliate of the Investment Manager and reviewed information provided by FQ regarding the cost to FQ of providing subadvisory services to the Fund and the resulting profitability from such relationship. The Trustees also noted that the subadvisory fee is paid by the Investment Manager out of the advisory fee. Based on the current size of the portion of the Fund managed by each Subadvisor, the Trustees concluded that the effect of any economies of scale being realized by FQ was not a material factor in the Trustees’ deliberations at this time.
In addition to the foregoing, the Trustees considered the specific factors and related conclusions set forth below with respect to each Fund.
CALIFORNIA INTERMEDIATE TAX-FREE FUND
Fund Performance.
Among the other information relating to the Fund’s performance, the Trustees noted that the Fund’s performance for the 1-year, 3-year, 5-year and 10-year periods ended March 31, 2007 was above the median performance of the Peer Group and above the performance of the Fund Benchmark, which is the Lehman Brothers 5-Year Municipal Bond Index, for all such periods. The Trustees concluded that the Fund’s performance has been satisfactory.
Advisory Fees.
The Trustees noted that the Fund’s advisory fee and total expenses (net of applicable expense waivers/reimbursements) as of October 31, 2006 were higher and lower, respectively, than the average for the Peer Group. The Trustees took into account the fact that the Investment Manager has contractually agreed through March 1, 2008 to limit the Fund’s net annual operating expenses to 0.55%. The Trustees concluded that, in light of the nature, extent and quality of the services provided by the Investment Manager and the Subadvisor, the Fund’s performance, the foregoing expense limitation and the considerations noted above with respect to the Subadvisor and the Investment Manager, the Fund’s advisory fees are reasonable.
FREMONT GLOBAL FUND
Fund Performance.
Among the other information relating to the Fund’s performance, the Trustees noted that the Fund’s performance for the 1-year, 3-year, 5-year and 10-year periods ended March 31, 2007 was below the median performance of the Peer Group and below the performance of the Fund Benchmark, which is a Composite Index (65% MSCI World Index and 35% J.P. Morgan Global Government Bond Index (Hedged)), for all such periods. The Trustees noted management’s discussion of the Fund’s performance, and that the performance of new Subadvisors engaged in 2004 and 2005 has generally been strong. The Trustees concluded that appropriate action has been taken to address the Fund’s performance, and that overall it is satisfactory in light of all factors considered.
Advisory Fees.
The Trustees noted that the Fund’s advisory fee and total expenses (net of applicable expense waivers/reimbursements) as of October 31, 2006 were higher and lower, respectively, than the average for the Peer Group. The Trustees concluded that, in light of the nature, extent and quality of the services provided by the Investment Manager and the Subadvisors, the Fund’s performance and the considerations noted above with respect to the Subadvisors and the Investment Manager, the Fund’s advisory fees are reasonable.
45
Annual Renewal of Investment Advisory Agreements (continued)
REAL ESTATE SECURITIES FUND
Fund Performance.
Among the other information relating to the Fund’s performance, the Trustees noted that the Fund’s performance for the 1-year, 3-year and 5-year periods ended March 31, 2007 was above, above and below, respectively, the median performance of the Peer Group and below the performance of the Fund Benchmark, which is the Dow Jones Wilshire REIT Index, for all such periods. The Trustees further noted management’s discussion of the Fund’s performance, and that the Fund’s relative performance has improved since the engagement of a new Subadvisor in 2004. The Trustees concluded that the Fund’s performance has been satisfactory in light of all factors considered.
Advisory Fees.
The Trustees noted that the Fund’s advisory fee and total expenses (net of applicable expense waivers/reimbursements) as of October 31, 2006 were higher than the average for the Peer Group. The Trustees took into account the fact that the Investment Manager has contractually agreed through March 1, 2008 to limit the Fund’s net annual operating expenses to 1.50%. The Trustees concluded that, in light of the nature, extent and quality of the services provided by the Investment Manager and the Subadvisor, the Fund’s performance, the foregoing expense limitation and the considerations noted above with respect to the Subadvisor and the Investment Manager, the Fund’s advisory fees are reasonable.
SMALL CAP FUND
Fund Performance.
Among other information relating to the Fund’s performance, the Trustees noted that the Fund’s performance for the 1-year, 3-year and 5-year periods ended March 31, 2007 was above, above and below, respectively, the median performance of the Peer Group and above, above and below, respectively, the performance of the Fund Benchmark, which is the Russell 2000® Growth Index. The Trustees concluded that the Fund’s performance has been satisfactory.
Advisory Fees.
The Trustees noted that the Fund’s advisory fee and total expenses (net of applicable expense waivers/reimbursements) as of October 31, 2006 were higher and lower, respectively, than the average for the Peer Group. The Trustees concluded that, in light of the nature, extent and quality of the services provided by the Investment Manager and the Subadvisor, the Fund’s performance, the foregoing expense limitation and the considerations noted above with respect to the Subadvisor and the Investment Manager, the Fund’s advisory fees are reasonable.
* * * *
After consideration of the foregoing, the Trustees also reached the following conclusions regarding the Investment Management Agreement and each Subadvisory Agreement, in addition to those conclusions discussed above: (a) the Investment Manager and each Subadvisor have demonstrated that they possess the capability and resources to perform the duties required of them under the Investment Management Agreement and the applicable Subadvisory Agreements; (b) each Subadvisor’s Investment Strategy is appropriate for pursuing the applicable Fund’s investment objectives; (c) each Subadvisor is reasonably likely to execute its Investment Strategy consistently over time; and (d) the Investment Manager and each Subadvisor maintain appropriate compliance programs.
Based on all of the above-mentioned factors and related conclusions, with no single factor or conclusion being determinative and with each Trustee not necessarily attributing the same weight to each factor, the Trustees concluded that approval of each Investment Management Agreement and each Subadvisory Agreement (as applicable) would be in the interests of each Fund and its shareholders. Accordingly, on June 8, 2007, the Trustees, including a majority of the Independent Trustees, voted to approve the Investment Management Agreement and the Subadvisory Agreements for each of the Fund’s Subadvisors.
46
THIS PAGE INTENTIONALLY LEFT BLANK
Investment Manager and Administrator
Managers Investment Group LLC
800 Connecticut Avenue
Norwalk, Connecticut 06854
(203) 299-3500 or (800) 835-3879
Distributor
Managers Distributors, Inc.
800 Connecticut Avenue
Norwalk, Connecticut 06854
(203) 299-3500 or (800) 835-3879
Custodian
The Bank of New York
2 Hanson Place
Brooklyn, New York 11217
Legal Counsel
Ropes & Gray LLP
One International Place
Boston, Massachusetts 02110-2624
Transfer Agent
PFPC, Inc.
Attn: Managers
P.O. Box 9769
Providence, Rhode Island 02940
(800) 548-4539
MANAGERSAND MANAGERS AMG EQUITY FUNDS
EMERGING MARKETS EQUITY
Rexiter Capital Management Limited
ESSEX GROWTH
ESSEX LARGE CAP GROWTH
ESSEX SMALL/MICRO CAP GROWTH
Essex Investment Management Co., LLC
FQ TAX-MANAGED U.S. EQUITY
FQ U.S. EQUITY
First Quadrant, L.P.
INSTITUTIONAL MICRO-CAP
MICRO-CAP
Lord, Abbett & Co. LLC
WEDGE Capital Management L.L.P.
OFI Institutional Asset Management
Next Century Growth Investors, LLC
INTERNATIONAL EQUITY
Alliance Bernstein L.P.
Lazard Asset Management, LLC
Wellington Management Company, LLP
CHICAGO EQUITY PARTNERS
MID-CAP
Chicago Equity Partners, LLC
REAL ESTATE SECURITIES
Urdang Securities Management, Inc.
SMALL CAP
TIMESSQUARE MID CAP GROWTH
TIMESSQUARE SMALL CAP GROWTH
TimesSquare Capital Management, LLC
SMALL COMPANY
Epoch Investment Partners, Inc. Kalmar Investment Advisers, Inc.
SPECIAL EQUITY
Donald Smith & Co., Inc.
Lord, Abbett & Co. LLC
Skyline Asset Management, L.P.
Smith Asset Management Group, LP
Veredus Asset Management LLC
Westport Asset Management, Inc.
SYSTEMATIC VALUE
SYSTEMATIC MID CAP VALUE
Systematic Financial Management, L.P.
VALUE
Armstrong Shaw Associates Inc.
Osprey Partners Investment Mgmt., LLC
MANAGERSAND MANAGERS AMG
BALANCED FUNDS
CHICAGO EQUITY PARTNERS BALANCED
Chicago Equity Partners, LLC
GLOBAL
Armstrong Shaw Associates Inc.
Alliance Bernstein L.P.
First Quadrant, L.P.
Northstar Capital Management, Inc.
Wellington Management Company, LLP
ALTERNATIVE FUNDS
FQ GLOBAL ALTERNATIVES
First Quadrant, L.P.
MANAGERS
FIXED INCOME FUNDS
BOND (MANAGERS)
FIXED INCOME
GLOBAL BOND
Loomis, Sayles & Company L.P.
BOND (MANAGERS FREMONT)
Pacific Investment Management Co. LLC
CALIFORNIA INTERMEDIATE TAX-FREE
Evergreen Investment Management Co., LLC
HIGH YIELD
J.P. Morgan Investment Management Inc.
INTERMEDIATE DURATION GOVERNMENT
SHORT DURATION GOVERNMENT
Smith Breeden Associates, Inc.
MONEY MARKET
JPMorgan Investment Advisors Inc.
This report is prepared for the Funds’ shareholders. It is authorized for distribution to prospective investors only when preceded or accompanied by an effective prospectus. To receive a free copy of the prospectus or Statement of Additional Information, which includes additional information about Fund Trustees, please contact us by calling 800.835.3879. Distributed by Managers Distributors, Inc., member FINRA.
A description of the policies and procedures each Fund uses to vote its proxies is available: (i) without charge, upon request, by calling 800.835.3879, or (ii) on the Securities and Exchange Commission’s (SEC) Web site at www.sec.gov. For information regarding each Fund’s proxy voting record for the 12-month period ended June 30, call 800.835.3879 or visit the SEC Web site at www.sec.gov.
The Funds file their complete schedule of portfolio holdings with the SEC for the first and third quarters of each fiscal year on Form N-Q. The Funds’ Forms N-Q are available on the SEC’s website at www.sec.gov. A Fund’s Forms N-Q may be reviewed and copied at the SEC’s Public Reference Room in Washington, DC. Information on the operation of the Public Reference Room may be obtained by calling 800.SEC.0330. To review a complete list of the Funds’ portfolio holdings, or to view the most recent quarterly holdings report, semiannual report, or annual report, please visit www.managersinvest.com.
www.managersinvest.com
Registrant has adopted a Code of Ethics. See attached Exhibit (a)(1).
| Item 3. | AUDIT COMMITTEE FINANCIAL EXPERT |
Registrant’s Board of Trustees has determined that independent Trustees Mr. Jack W. Aber and Mr. Steven J. Paggioli each qualify as the Audit Committee Financial Expert. Mr. Aber and Mr. Paggioli are “independent” as such term is defined in Form N-CSR.
| Item 4. | PRINCIPAL ACCOUNTANT FEES AND SERVICES |
The aggregate fees billed by PwC to the Fund for the Funds’ two most recent fiscal years for professional services rendered for audits of annual financial statements, or services that are normally provided in connection with statutory and regulatory filings or engagements (“Audit Fees”) were as follows:
| | | | | | |
| | | Fiscal 2007 | | Fiscal 2006 |
Managers AMG FQ Tax-Managed U.S. Equity Fund | | $ | 23,519 | | $ | 16,506 |
Managers AMG FQ U.S. Equity Fund | | $ | 23,387 | | $ | 16,380 |
Managers AMG FQ Global Alternatives Fund 1 | | $ | 29,260 | | $ | 28,000 |
Managers Fremont Global Fund | | $ | 29,626 | | $ | 28,350 |
Managers Small Cap Fund | | $ | 17,619 | | $ | 16,860 |
Managers Fremont Micro-Cap Fund | | $ | 16,333 | | $ | 15,630 |
Managers Fremont Institutional Micro-Cap Fund | | $ | 16,417 | | $ | 15,710 |
Managers Real Estate Securities Fund | | $ | 20,799 | | $ | 19,903 |
Managers Fremont Bond Fund | | $ | 45,122 | | $ | 43,179 |
Managers CA Intermediate Tax-Free Fund | | $ | 20,519 | | $ | 19,635 |
1 – Fund commenced operations on March 30, 2006
Audit-Related Fees
There were no fees billed by PwC to the Fund in its two recent fiscal years for services rendered for assurance and related services that are reasonably related to the performance of the audit or review of the Fund’s financial statements, but are not reported as Audit Fees (“Audit-Related Fees”).
For the Funds’ two most recent fiscal years, there were no Audit-Related Fees billed by PwC for engagements related directly to the operations and financial reporting of one or more Funds by a Fund Service Provider. A Fund Service Provider is (a) any investment adviser to the Fund (not including any Subadvisor whose role is primarily portfolio management and is subcontracted with or overseen by another investment adviser) or (b) any entity that provides ongoing services to the Fund and is controlling, controlled by or under common control with a Fund investment adviser described in (a).
Tax Fees
The aggregate fees billed by PwC to the Funds for the two most recent fiscal years for professional services rendered for tax compliance, tax advice, and tax planning (“Tax Fees”) were as follows:
| | | | | | |
| | | Fiscal 2007 | | Fiscal 2006 |
Managers AMG FQ Tax-Managed U.S. Equity Fund | | $ | 6,900 | | $ | 7,370 |
Managers AMG FQ U.S. Equity Fund | | $ | 7,200 | | $ | 7,810 |
Managers AMG FQ Global Alternatives Fund 1 | | $ | 11,000 | | $ | 9,500 |
Managers Fremont Global Fund | | $ | 9,200 | | $ | 9,240 |
Managers Small Cap Fund | | $ | 6,400 | | $ | 7,810 |
Managers Fremont Micro-Cap Fund | | $ | 6,400 | | $ | 7,810 |
Managers Fremont Institutional Micro-Cap Fund | | $ | 6,400 | | $ | 7,810 |
Managers Real Estate Securities Fund | | $ | 9,500 | | $ | 9,350 |
Managers Fremont Bond Fund | | $ | 11,100 | | $ | 10,560 |
Managers CA Intermediate Tax-Free Fund | | $ | 8,400 | | $ | 8,250 |
1 – Fund commenced operations on March 30, 2006
For the Funds’ two most recent fiscal years, Tax Fees billed by PwC for engagements by Fund Service Providers that related directly to the operations and financial reporting of the Funds were $0 for fiscal 2007 and $0 for fiscal 2006, respectively.
The services for which Tax Fees were charged comprise all services performed by professional staff in PwC’s tax division except those services related to the audit. Typically, this category would include fees for tax compliance, tax planning, and tax advice. Tax compliance, tax advice, and tax planning services include preparation of original and amended tax returns, claims for refund and tax payment-planning services, assistance with tax audits and appeals, tax advice related to mergers and acquisitions and requests for rulings or technical advice from taxing authorities.
All Other Fees
There were no other fees billed by PwC to the Funds for all other non-audit services (“Other Fees”) during the Funds’ two most recent fiscal years. During the same period, there were no Other Fees billed by PwC for engagements by Fund Service Providers that related directly to the operations and financial reporting of the Funds.
According to policies adopted by the Audit Committee, services provided by PwC to the Funds must be pre-approved by the Audit Committee. On an annual basis, the Audit Committee reviews and pre-approves various types of services that PwC may perform for the Funds without specific approval of each engagement, subject to specified budget limitations. As contemplated by the Sarbanes-Oxley Act of 2002 and related SEC rules, the Audit Committee also pre-approves non-audit services provided by PwC to any Fund Service Provider for any engagement that relates directly to the operations and financial reporting of the Funds. Any engagement that is not already pre-approved or that will
exceed a pre-approved budget must be submitted to the Audit Committee for pre-approval. The Chairman of the Audit Committee is authorized on behalf of the Board of Trustees and the Audit Committee to approve the engagement of PwC to perform non-audit services subject to certain conditions, including notification to the Audit Committee of such pre-approval not later than the next meeting of the Audit Committee following the date of such pre-approval.
There were no other fees billed by PwC for non-audit services rendered to the Funds and to Fund Service Providers for the Funds’ two most recent fiscal years.
The Audit Committee has considered whether the provision of non-audit services by PwC to Fund Service Providers that were not required to be pre-approved by the Audit Committee is compatible with maintaining PwC’s independence in its audit of the Funds, taking into account representations from PwC, in accordance with Independence Standards Board Standard No. 1, regarding its independence from the Funds and its related entities.
The following table sets forth the non-audit services provided by PwC to the Funds and its service affiliates defined as the Funds’ investment advisor and any entity controlling, controlled by or under common control with Managers Investment Group LLC that provides ongoing services to the Funds (“Control Affiliates”) for the last two fiscal years.
| | | | | | | | | | | | | | | | | | |
| | | Audit-related fees A | | Tax fees A | | All other fees A |
| | | 2006 | | 2005 | | 2006 | | 2005 | | 2006 | | 2005 |
Control Affiliates | | $ | 357,120 | | $ | 0 | | $ | 839,245 | | $ | 98,304 | | $ | 0 | | $ | 0 |
A | Aggregate amounts may reflect rounding. |
| Item 5. | AUDIT COMMITTEE OF LISTED REGISTRANTS |
Not applicable.
| Item 6. | SCHEDULE OF INVESTMENTS |
The schedule of investments in unaffiliated issuers as of the close of the reporting period is included as part of the shareholder report contained in Item 1 hereof.
| Item 7. | DISCLOSURE OF PROXY VOTING POLICIES AND PROCEDURES FOR CLOSED-END MANAGEMENT INVESTMENT COMPANIES |
Not applicable.
| Item 8. | PORTFOLIO MANAGERS OF CLOSED-END MANAGEMENT INVESTMENT COMPANIES |
Not applicable.
| Item 9. | PURCHASES OF EQUITY SECURITIES BY CLOSED-END MANAGEMENT INVESTMENT COMPANIES AND AFFILIATED PURCHASERS |
Not applicable.
| Item 10. | SUBMISSION OF MATTERS TO A VOTE OF SECURITY HOLDERS |
Not applicable.
| Item 11. | CONTROLS AND PROCEDURES |
(a) The Registrant’s principal executive and principal financial officers have concluded, based on their evaluation of the registrant’s disclosure controls and procedures as of a date within 90 days of the filing of this report, that the Registrant’s disclosure controls and procedures are reasonably designed to ensure that information required to be disclosed by the Registrant on Form N-CSR is recorded, processed, summarized and reported within the required time periods and that information required to be disclosed by the registrant in the reports that it files or submits on Form N-CSR is accumulated and communicated to the Registrant’s management, including its principal executive and principal financial officers, as appropriate to allow timely decisions regarding required disclosure.
(b) There were no changes in the Registrant’s internal control over financial reporting during the Registrant’s fourth fiscal quarter of the period covered by this report that have materially affected, or are reasonably likely to affect, the internal control over financial reporting.
| | |
| |
| (a)(1) | | Any Code of Ethics or amendments hereto. Filed herewith. |
| |
| (a)(2) | | Certifications pursuant to Rule 30a-2(a) under the Investment Company Act of 1940 - Filed herewith. |
| |
| (a)(3) | | Not applicable. |
| |
| (b) | | Certifications pursuant to Rule 30a-2(b) under the Investment Company Act of 1940 - Filed herewith. |
SIGNATURES
Pursuant to the requirements of the Securities Exchange Act of 1934 and the Investment Company Act of 1940, the registrant has duly caused this report to be signed on its behalf by the undersigned, thereunto duly authorized.
| | |
| MANAGERS TRUST I |
| |
| By: | | /s/ William J. Nutt |
| | William J. Nutt, President |
| |
| Date: | | January 4, 2008 |
Pursuant to the requirements of the Securities Exchange Act of 1934 and the Investment Company Act of 1940, this report has been signed below by the following persons on behalf of the registrant and in the capacities and on the dates indicated.
| | |
| By: | | /s/ William J. Nutt |
| | William J. Nutt, President |
| |
| Date: | | January 4, 2008 |
| |
| By: | | /s/ Donald S. Rumery |
| | Donald S. Rumery, Chief Financial Officer |
| |
| Date: | | January 4, 2008 |