UNITED STATES
SECURITIES AND EXCHANGE COMMISSION
Washington, D.C. 20549
FORM N-CSR
CERTIFIED SHAREHOLDER REPORT OF REGISTERED
MANAGEMENT INVESTMENT COMPANIES
Investment Company Act file number: 811-06520
MANAGERS TRUST I
(Exact name of registrant as specified in charter)
800 Connecticut Avenue, Norwalk, Connecticut 06854
(Address of principal executive offices) (Zip code)
Managers Investment Group LLC
800 Connecticut Avenue, Norwalk, Connecticut 06854
(Name and address of agent for service)
Registrant’s telephone number, including area code: (203) 299-3500
| | |
| Date of fiscal year end: | | OCTOBER 31 |
| |
| Date of reporting period: | | NOVEMBER 1, 2008 – OCTOBER 31, 2009 |
| | (Annual Shareholder Report) |
| Item 1. | Reports to Shareholders |
ANNUAL REPORT
Managers Funds
October 31, 2009
Managers Small Cap Fund
Managers Fremont Micro-Cap Fund
Managers Fremont Institutional Micro-Cap Fund
Managers Real Estate Securities Fund
Managers California Intermediate Tax-Free Fund

AR022-1009
Managers Funds
Annual Report – October 31, 2009
TABLE OF CONTENTS
| | |
| | | Page |
| |
LETTER TO SHAREHOLDERS | | 1 |
| |
ABOUT YOUR FUND’S EXPENSES | | 4 |
| |
INVESTMENT MANAGERS’ COMMENTS, FUND SNAPSHOTS, AND SCHEDULES OF PORTFOLIO INVESTMENTS | | |
| |
Managers Small Cap Fund | | 5 |
| |
Managers Fremont Micro-Cap Fund | | 11 |
| |
Managers Fremont Institutional Micro-Cap Fund | | 20 |
| |
Managers Real Estate Securities Fund | | 29 |
| |
Managers California Intermediate Tax-Free Fund | | 33 |
| |
NOTES TO SCHEDULES OF PORTFOLIO INVESTMENTS | | 45 |
| |
FINANCIAL STATEMENTS: | | |
| |
Statements of Assets and Liabilities | | 46 |
Funds’ balance sheets, net asset value (NAV) per share computations and cumulative undistributed amounts | | |
| |
Statements of Operations | | 47 |
Detail of sources of income, Fund expenses, and realized and unrealized gains (losses) during the fiscal year | | |
| |
Statements of Changes in Net Assets | | 48 |
Detail of changes in Fund assets for the past two fiscal years | | |
| |
FINANCIAL HIGHLIGHTS | | 50 |
Historical net asset values per share, distributions, total returns, expense ratios, turnover ratios and net assets | | |
| |
NOTES TO FINANCIAL STATEMENTS | | 54 |
Accounting and distribution policies, details of agreements and transactions with Fund management and affiliates, and descriptions of certain investment risks | | |
| |
REPORT OF INDEPENDENT REGISTERED PUBLIC ACCOUNTING FIRM | | 61 |
| |
TRUSTEES AND OFFICERS | | 62 |
| |
ANNUAL RENEWAL OF INVESTMENT ADVISORY AGREEMENTS | | 63 |
Nothing contained herein is to be considered an offer, sale or solicitation of an offer to buy shares of any series of the Managers Family of Funds. Such offering is made only by Prospectus, which includes details as to offering price and other material information.
Letter to Shareholders
Dear Shareholder:
The past twelve months will go down in the history books as one of the wildest rides in the history of Wall Street. Early in the period, securities markets were under severe pressure as the credit crisis which began in the summer of 2007, accelerated in the fourth quarter of last year amid ongoing concerns about deteriorating economic conditions and the health of some of the most prominent financial institutions. Banks of all sizes remained under pressure, which led to continued consolidation within the industry. Wachovia agreed to sell itself to Wells Fargo & Co. while PNC agreed to acquire the troubled National City. Meanwhile, the U.S. Government attempted to stabilize the system by formally bailing out companies like Citigroup and by providing injections of capital into hundreds of other financial institutions. Like a sprawling fire, the crises extended to other industries with the automakers finding themselves on the verge of collapse. Once again, the U.S. Government stepped in and in late December President Bush approved an emergency bailout of the U.S. auto industry, offering $17.4 billion in rescue loans to Chrysler and General Motors with the expectation that the companies would move quickly to develop acceptable plans for long-term viability.
Consumer and investor confidence continued to sink in the early part of 2009 despite the U.S. Government’s aggressive efforts to restore the economy and stabilize the financial markets. During January, February and early March, stocks plunged, sending broad indexes to levels not seen since the mid to late 1990s. From peak (October 10, 2007) to trough (March 9, 2009), stocks, as measured by the S&P 500 Index, lost 55.5%, the Index’s steepest decline since the Great Depression. Then, on March 10, a very sharp recovery began amid preliminary signs that the Government’s efforts might be starting to bear fruit. More specifically, Citigroup, which had been under extreme pressure and was essentially bailed out by the Government, reported that it returned to profitability in the months of January and February. Citigroup’s surprising news seemed to ignite the markets, contributing to a more than 6% gain for the S&P 500 Index and set the stage for a sharp recovery in equities and extended the rally in credit sensitive fixed income securities.
For the entire one-year period, large-cap stocks outperformed their smaller-cap brethren with the Russell 1000® (large cap), Russell 2000® (small cap), Russell 3000® (all cap), and the Russell Microcap® Indexes returning 11.2%, 6.5%, 10.8% and 5.1%, respectively. International stocks outperformed their domestic counterparts by a wide margin as the MSCI EAFE Index returned 27.7%, thanks partly to weakness in the U.S. Dollar during this period. Over the same time period, REITs underperformed domestic U.S. equities as the Dow Jones U.S. Select REIT Index returned -0.3%. Fixed-income securities in the U.S. and abroad moved substantially higher during the period as investors capitalized on opportunities in various fixed-income segments, with the broad high-quality indexes such as the Barclays Capital U.S. Aggregate Bond and the Barclays Capital Global Aggregate ex US Indexes, returning 13.8% and 21.3%, respectively. Within the fixed-income markets, lower-quality securities posted the best results as investors took advantage of extraordinarily wide credit spreads. This is best exemplified by the 48.1% and 6.3% returns generated by the Barclays Capital US Corporate High Yield Index and the Barclays Capital U.S. Government –Treasury Index, respectively.
Against this backdrop, the, Managers Small Cap Fund, Managers Fremont Micro-Cap Fund, Managers Fremont Institutional Micro-Cap Fund, Managers Real Estate Securities Fund, and the Managers California Intermediate Tax-Free Fund (each a “Fund” and collectively the “Funds”), generally posted solid absolute and relative returns in this volatile environment, as detailed below.
1
Letter to Shareholders (continued)
| | | | | | | | | | | | | | | | | |
Periods Ended 10/31/09 | | 6 Months | | | 1 Year | | | 3 Years | | | 5 Years | | | 10 Years | | | Inception
Date |
| | | | | | |
Managers Small Cap Fund | | 17.31 | % | | 14.80 | % | | (4.63 | )% | | 3.87 | % | | 0.22 | % | | 9/24/1997 |
| | | | | | |
Russell 2000® Growth Index | | 15.70 | % | | 11.34 | % | | (6.88 | )% | | 0.95 | % | | 0.12 | % | | |
| | | | | | |
Managers Fremont Micro-Cap Fund | | 15.25 | % | | 11.34 | % | | (6.37 | )% | | 0.31 | % | | 2.74 | % | | 6/30/1994 |
| | | | | | |
Russell Microcap® Index | | 18.17 | % | | 5.06 | % | | (12.50 | )% | | (2.57 | )% | | — | | | |
| | | | | | |
Managers Fremont Institutional Micro-Cap Fund | | 14.86 | % | | 11.44 | % | | (7.19 | )% | | (0.18 | )% | | 3.80 | % | | 12/31/1986 |
| | | | | | |
Russell Microcap® Index | | 18.17 | % | | 5.06 | % | | (12.50 | )% | | (2.57 | )% | | — | | | |
| | | | | | |
Managers Real Estate Securities Fund | | 29.40 | % | | 5.77 | % | | (12.96 | )% | | 1.34 | % | | 8.76 | % | | 12/31/1997 |
| | | | | | |
Dow Jones U.S. Select REIT Index | | 27.98 | % | | (0.26 | )% | | (16.77 | )% | | (0.87 | )% | | 9.44 | % | | |
| | | | | | |
Managers California Intermediate Tax-Free Fund | | 2.42 | % | | 8.97 | % | | 3.03 | % | | 3.23 | % | | 4.47 | % | | 11/16/1990 |
| | | | | | |
Barclays Capital U.S. Municipal Bond: 5 Year Index | | 2.22 | % | | 9.70 | % | | 5.57 | % | | 4.19 | % | | 5.08 | % | | |
For the fiscal year that ended October 31, 2009, the Managers Small Cap Fund returned 14.80%, outperforming the Russell 2000® Growth Index, which returned 11.34%. As detailed in the above table, the Fund’s returns also exceed those of the benchmark on a three-, five- and ten-year basis as well as since inception. The primary driver of the Fund’s outperformance for the past year was strong relative stock performance in the health care, energy and financial services sectors of the market. In health care, Mentor Corp. a manufacturer, developer, and marketer of products for the aesthetic medicine market, was a top contributor. In December, Johnson & Johnson announced plans to acquire Mentor in all cash deal valued at $31 per share, which represented a substantial premium to its share price. In energy, the Fund’s top contributor was Natco Group Inc. which benefitted from the June announcement that the company would be acquired by Cameron International Corporation. On an organizational note, in September, Frontier Capital Management replaced TimesSquare Capital Management as the subadvisor for the Fund. Frontier will serve as the Fund’s interim subadvisor, pending shareholder approval of a new subadvisory agreement.
For the 12 months that ended October 31, 2009, the Managers Fremont Micro-Cap Fund returned 11.34% and the Managers Fremont Institutional Micro-Cap Fund returned 11.44%, compared with 5.06% for its benchmark, the Russell Microcap® Index. Performance remains strong relative to both the Index and peers since the Fund was converted to a multi-manager, multi-style approach in early 2008. Solid outperformance over the last year has been driven by positive stock selection in several sectors including financials and information technology. In addition, the Fund has benefited from relative sector weightings versus the benchmark including a large underweight to the struggling financials sector and an overweight to the recovering consumer discretionary sector. The Fund’s growth subadvisors, in particular, performed well during this period as growth micro-cap stocks outperformed their value counterparts significantly.
For the 12 months that ended October 31, 2009, the Managers Real Estate Securities Fund returned 5.77%, compared with -0.26% for its benchmark, the Dow Jones U.S. Select REIT Index. This solid relative performance has helped to contribute to solid longer-term results
2
Letter to Shareholders (continued)
including performance over the last five years that places the Fund in the top decile amongst peers. The strong relative performance over the past fiscal year has been primarily driven by good stock selection in several areas of the REIT market. Early on, the primary contributors were within the office, shopping center, and healthcare sectors. In the latter half of the fiscal year, the Fund was able to keep pace with the benchmark as the REIT market rallied. The rally was led by low-quality issues while the Fund tends to focus on their high-quality counterparts. However, the solid stock selection exhibited earlier in the year helped after the market turned and enabled the Fund to overcome the headwinds of the lower-quality rally.
For the 12 months that ended October 31, 2009, the Managers California Intermediate Tax-Free Fund returned 8.97%, compared with 9.70% for its benchmark, the Barclays Capital 5-Year Municipal Bond Index. The Fund’s relative underperformance for the fiscal year can be mostly attributed to three key factors. First, the Fund focuses exclusively on California municipal bonds, while its benchmark is a national index that includes bonds from all states. Since California had the largest budget deficit and its general obligation debt was downgraded, the focus on California debt hurt relative performance. Second, the Fund had a shorter duration than its index and investors favored the long-end of the curve in search of higher yield. Third, A- and BBB-rated bonds led the way and the Fund generally has an average credit rating of AA. These biases all contributed to the Fund’s modest underperformance. Nevertheless, the Fund did generate strong absolute returns and still compares well to peers over longer time periods.
Looking forward, we expect that the economy will continue to recover but at a relatively slow pace. While there are certainly indications that economic conditions are improving on a number of fronts, the key metric, the unemployment rate, continues to deteriorate. While the pace of job losses has slowed considerably over the past few months, jobs are still being lost, and as a result, consumers remain concerned about the environment. Historically, consumer spending, which has accounted for up to 70% of all economic activity, has been a key driver of growth. If a high percentage of consumers remain unemployed or are concerned about job security, then spending and, therefore, economic growth may be subdued.
The following report covers the one year period that ended October 31, 2009. Should you have any questions about this report, or if you’d like to receive a prospectus and additional information, including fees and expenses for these or any of the other Funds in our family, please feel free to contact us at 1-800-835-3879, or visit our Web site at www.managersinvest.com. As always, please read the prospectus carefully before you invest or send money.
If you are curious about how you can better diversify your investment program, visit the Knowledge Center on our Web site and view our articles in the investment strategies section. You can rest assured that under all market conditions our team is focused on delivering excellent investment management services for your benefit.
We thank you for your continued confidence and investment in The Managers Funds.
|
Respectfully, |
|
 |
John H. Streur |
Senior Managing Partner |
Managers Investment Group LLC |
3
About Your Fund’s Expenses
As a shareholder of a Fund, you may incur two types of costs: (1) transaction costs, which may include sales charges (loads) on purchase payments; redemption fees; and exchange fees; and (2) ongoing costs, including management fees; distribution (12b-1) fees; and other Fund expenses. This example is intended to help you understand your ongoing costs (in dollars) of investing in the Fund and to compare these costs with the ongoing costs of investing in other mutual funds. The example is based on $1,000 invested at the beginning of the period and held for the entire period as indicated below.
Actual Expenses
The first line of the following table provides information about the actual account values and actual expenses. You may use the information in this line, together with the amount you invested, to estimate the expenses that you paid over the period. Simply divide your account value by $1,000 (for example, an $8,600 account value divided by $1,000 = 8.6), then multiply the result by the number in the first line under the heading entitled “Expenses Paid During Period” to estimate the expenses you paid on your account during this period.
Hypothetical Example for Comparison Purposes
The second line of the following table provides information about hypothetical account values and hypothetical expenses based on the Fund’s actual expense ratio and an assumed annual rate of return of 5% before expenses, which is not the Fund’s actual return. The hypothetical account values and expenses may not be used to estimate the actual ending account balance or expenses you paid for the period. You may use this information to compare the ongoing costs of investing in the Fund and other funds by comparing this 5% hypothetical example with the 5% hypothetical examples that appear in the shareholder reports of other funds.
Please note that the expenses shown in the table are meant to highlight your ongoing costs only and do not reflect any transactional costs, such as sales charges (loads), redemption fees, or exchange fees. Therefore, the second line of the table is useful in comparing ongoing costs only, and will not help you determine the relative total costs of owning different funds.
| | | | | | | | | | | | |
Six Months Ended October 31, 2009 | | Expense
Ratio for
the Period | | | Beginning
Account Value
05/01/2009 | | Ending
Account Value
10/31/2009 | | Expenses Paid
During the
Period* |
| | | | |
Managers Small Cap Fund | | | | | | | | | | | | |
| | | | |
Based on Actual Fund Return | | 1.44 | % | | $ | 1,000 | | $ | 1,173 | | $ | 7.89 |
| | | | |
Based on Hypothetical 5% Annual Return | | 1.44 | % | | $ | 1,000 | | $ | 1,018 | | $ | 7.32 |
| | | | |
Managers Fremont Micro-Cap Fund | | | | | | | | | | | | |
| | | | |
Based on Actual Fund Return | | 1.56 | % | | $ | 1,000 | | $ | 1,153 | | $ | 8.46 |
| | | | |
Based on Hypothetical 5% Annual Return | | 1.56 | % | | $ | 1,000 | | $ | 1,017 | | $ | 7.93 |
| | | | |
Managers Fremont Institutional Micro-Cap Fund | | | | | | | | | | | | |
| | | | |
Based on Actual Fund Return | | 1.35 | % | | $ | 1,000 | | $ | 1,149 | | $ | 7.31 |
| | | | |
Based on Hypothetical 5% Annual Return | | 1.35 | % | | $ | 1,000 | | $ | 1,018 | | $ | 6.87 |
| | | | |
Managers Real Estate Securities Fund | | | | | | | | | | | | |
| | | | |
Based on Actual Fund Return | | 1.50 | % | | $ | 1,000 | | $ | 1,294 | | $ | 8.67 |
| | | | |
Based on Hypothetical 5% Annual Return | | 1.50 | % | | $ | 1,000 | | $ | 1,018 | | $ | 7.63 |
| | | | |
Managers California Intermediate Tax-Free Fund | | | | | | | | | | | | |
| | | | |
Based on Actual Fund Return | | 0.55 | % | | $ | 1,000 | | $ | 1,024 | | $ | 2.81 |
| | | | |
Based on Hypothetical 5% Annual Return | | 0.55 | % | | $ | 1,000 | | $ | 1,022 | | $ | 2.80 |
| * | Expenses are equal to the Fund’s annualized expense ratio multiplied by the average account value over the period, multiplied by the number of days in the most recent fiscal half-year (184), then divided by 365. |
4
Managers Small Cap Fund
Portfolio Manager’s Comments
The Managers Small Cap Fund seeks to achieve long-term capital appreciation by investing primarily in the stocks of small-capitalization companies.
In September 2009, Frontier Capital Management Co., LLC (“Frontier”) replaced TimesSquare Capital Management, LLC (“TimesSquare”) as the subadvisor for the Managers Small Cap Fund. Frontier will serve as the Fund’s interim subadvisor, pending shareholder approval of a new subadvisory agreement. In addition, the Fund, which had been closed to new investors since June of 2006, has been reopened. Separately, Managers Investment Group filed with the SEC at the end of October 2009, to change the name of the Fund from Managers Small Cap Fund to Managers Frontier Small Cap Growth Fund which we anticipate launching in January 2010 assuming shareholder approval of the new subadvisory agreement with Frontier.
The Portfolio Manager
Frontier manages client assets in small-, small/mid-, mid- and large-cap U.S. equity strategies. The Managers Small Cap Fund follows a small-cap growth discipline as Frontier implements its “GARP” investment approach to select attractive small-cap stocks.
Frontier believes:
| | • | | Fundamental research is the cornerstone to adding value |
| | • | | Stock prices ultimately are linked to sales and earnings growth |
| | • | | Growth must be purchased at a reasonable price |
| | • | | Research is a continuous process |
Frontier utilizes and draws support from its entire team of 16 investment professionals to identify opportunities and conduct fundamental research. Through fundamental bottom-up research, Frontier seeks long-term capital appreciation by investing in small-capitalization companies that it believes have above-average earnings growth potential and are available at reasonable valuations.
Frontier looks for companies it believes can generate long-term, sustainable earnings, managed by qualified professionals capable of executing a well-conceived strategic plan. Frontier seeks businesses that can generate superior rates of return on capital in excess of their cost of capital over a business cycle due to above average secular growth prospects or a competitive advantage.
The Year in Review
For the fiscal year ending October 31, 2009, the Managers Small Cap Fund (the “Fund”) returned 14.8%, outperforming the Russell 2000® Growth Index, which returned 11.3%.
During the fiscal year ending October 31, 2009, it was determined by the National Bureau of Economic Research that the U.S. had been in a recession since December 2007. The fiscal year also saw rising unemployment levels and the increased usage of new financial acronyms from TARP (Troubled Asset Relief Program) to TALF (Term Asset-Backed Securities Loan Facility) to PPIP (Public-Private Investment Program). President Obama was sworn into office and new Secretary of the Treasury Geithner found himself immersed in economic turmoil and increased public backlash over government aid to troubled financial institutions such as AIG. After the U.S. equity markets fell to a twelve year low in March, the subsequent market rally, albeit driven mostly by higher beta and lower quality stocks, helped the period end with the Dow Jones Industrial Average crossing the 10,000 level for the first time since October 2008. Mixed signals of economic recovery gave the public the optimistic “green shoots” observations from Federal Reserve Chairman Bernanke, who was reappointed to his post. The $3 billion “cash for clunkers” program concluded well before the anticipated end date of November 1. The allocated federal proceeds to fund the program were quickly exhausted with car owners rushing to trade in their less fuel efficient vehicles, consequently boosting both new car sales and manufacturing activity expansion for the first time since January 2008. Access to credit appears to have stabilized, and the U.S. economy grew at a 3.5% annual rate for the third quarter of 2009, likely calling an end to the recession. Employment prospects, however, continued to remain weak and may impact the psyche of consumers leading into the holiday season, as disappointing consumer confidence data marked the end of the period.
U.S. equities, as measured by the Russell indices, finished the twelve months ending October 31 in positive territory across the size spectrum. Mid-caps outperformed their large- and small-cap counterparts as the Russell Midcap® Index rose 18.8%, followed by
11.2% and 6.5% returns for the Russell 1000® Index and Russell 2000® Index, respectively. From a style perspective, the Russell 2000® Growth Index and its 11.3% return handily outperformed the 2.0% return of the Russell 2000® Value Index.
5
Managers Small Cap Fund
Portfolio Manager’s Comments (continued)
In this volatile but generally positive environment for stocks, the Fund outperformed its benchmark on a relative basis. The primary driver of the outperformance was strong relative stock selection in the health care, energy and financial services sectors. The Fund also benefited from an overweight to the surging technology sector and an underweight to the lagging health care sector. Partially offsetting the aforementioned contributors was weak results in the consumer discretionary space.
Among the Fund’s financially focused stocks, Wright Express Corporation, a provider of payment processing and information management services to the U.S. commercial and government vehicle fleet industry, was a top contributor. Wright Express shares soared 124%, with much of the rise coming after management reported a better than expected fourth quarter. Evercore Partners Inc., a leading advisory and merchant banking boutique, benefited from emerging signs of merger & acquisition activity as well as a shakeout among large investment banks. Evercore rose 117% during the period, which prompted TimesSquare to sell the stock on this strength. TimesSquare exited Webster Financial Corporation, a bank holding company focused on providing financial services to customers in southern New England and eastern New York, at a loss upon learning that loan losses and investment portfolio write-downs were much worse than anticipated; their shares fell 84%.
In the energy sector, NATCO Group Inc. appreciated by 114% during the period. This was driven by the June announcement that the company would be acquired by Cameron International Corporation. NATCO is a leading provider of equipment, systems, and services used in the production of oil and natural gas, and they possess a proprietary technology to separate oil, gas, and water while removing contaminants.
In the technology-oriented space, SBA Communications Corporation, an independent owner and operator of wireless communications towers, was a top contributor with its 117% return. This was a result of management continuing to reduce outstanding debt levels, and the company continuing to be aided by a stable environment for wireless communication tower companies. Atheros Communications, Inc., a designer of radio frequency chips for wired and wireless network equipment, was also a key contributor. Atheros rose 91%, capped by a strong quarterly report during the third quarter with better than expected revenues and strong forward guidance.
The industrials sector was home to the Fund’s most significant detractor during the period, Huron Consulting Group Inc. This consulting firm, for accounting and other professional services, announced that accounting irregularities on the earn-out payments for prior acquisitions would force it to restate several years of results. As a result, the CEO and CFO resigned. TimesSquare sold the position but after a 75% decline.
Within the consumer discretionary sector, the for-profit education industry was under pressure on concerns about debt loads for all schools (not solely regarding the for-profits), and some degree of investor rotation within the sector towards higher beta names. American Public Education Inc., a provider of online post-secondary education for the military and public service communities, depreciated 22% during the period despite increasing forward guidance and reporting solid quarterly results during the second quarter due in part to growth in civilian student enrollments.
Looking Forward
Looking forward, the Fund’s new subadvisor Frontier continues to believe the economic recovery will be muted by the dampening effects of increased personal savings, deleveraging of the banking system, and the likelihood of higher taxes. Imbalances that caused the global recession took years to develop and will take time to mend. On a positive note, corporate earnings have improved dramatically over the last three quarters on strong cost management and stabilizing revenues, and largely exceeded consensus expectations. Frontier believes that companies that show sustained earnings growth in a slow growth environment will be awarded premium valuations. As a result, its focus remains on identifying high quality, secular growth businesses.
Cumulative Total Return Performance
Managers Small Cap’s cumulative total return is based on the daily change in net asset value (NAV), and assumes that all distributions were reinvested. The Russell 2000® Growth Index measures the performance of those Russell 2000® companies with higher price-to-book ratios and higher forecasted growth values. Unlike the Fund, the above stated index is unmanaged, is not available for investment, and does not incur expenses. This chart compares a hypothetical $10,000 investment made in the Managers Small Cap Fund on October 31, 1999 to a $10,000 investment made in the
6
Managers Small Cap Fund
Portfolio Manager’s Comments (continued)
Cumulative Total Return Performance
Russell 2000® Growth Index for the same time period. Performance for periods longer than one year is annualized. The graph and table do not reflect the deduction of taxes that a shareholder would pay on a Fund distribution or redemption of shares. The listed returns for the Fund are net of expenses and the returns for the index exclude expenses. Total returns for the Fund would have been lower had certain expenses not been reduced.
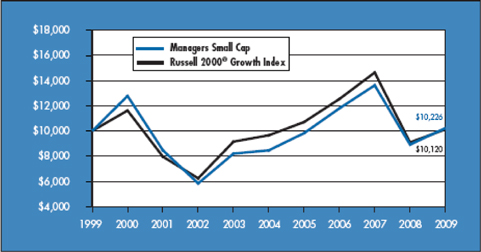
The table below shows the average annual total returns for the Managers Small Cap Fund and the Russell 2000® Growth Index for the one-year, five-year and ten-year periods ended October 31, 2009.
| | | | | | | | | |
Average Annualized Total Returns 1 | | One Year | | | Five Years | | | Ten Years | |
Managers Small Cap2,3 | | 14.80 | % | | 3.87 | % | | 0.22 | % |
Russell 2000® Growth Index | | 11.34 | % | | 0.95 | % | | 0.12 | % |
The performance data shown represents past performance. Past performance is not a guarantee of future results. Current performance may be lower or higher than the performance data quoted. The investment return and principal value of an investment in the Fund will fluctuate so that an investor’s shares, when redeemed, may be worth more or less than their original cost. For performance information through the most recent month end, please call (800) 835-3879 or visit our Web site at www.managersinvest.com.
In choosing a Fund, investors should carefully consider the amount they plan to invest, their investment objectives, the Fund’s investment objectives, risks, charges and expenses before investing. For this and other information, please call (800) 835-3879 or visit www.managersinvest.com for a free prospectus. Read it carefully before investing or sending money. Distributed by Managers Distributors, Inc., member FINRA.
| 1 | Total return equals income yield plus share price change and assumes reinvestment of all dividends and capital gain distributions. Returns are net of fees and may reflect offsets of Fund expenses as described in the Prospectus. No adjustment has been made for taxes payable by shareholders on their reinvested dividends and capital gain distributions. Returns for periods greater than one year are annualized. The listed returns on the Fund are net of expenses and based on the published NAV as of October 31, 2009. All returns are in U.S. dollars($). |
| 2 | Fund for which, from time to time, the advisor has waived its fees and/or absorbed Fund expenses, which has resulted in higher returns. |
| 3 | The Fund is subject to risks associated with investments in small-capitalization companies, such as erratic earnings patterns, competitive conditions, limited earnings history, and a reliance on one or a limited number of products. |
The Russell 2000® Growth Index is a trademark of Russell Investments. Russell® is a trademark of Russell Investments. An investment cannot be made directly into an index.
Not FDIC insured, nor bank guaranteed. May lose value.
7
Managers Small Cap Fund
Funds Snapshots
October 31, 2009
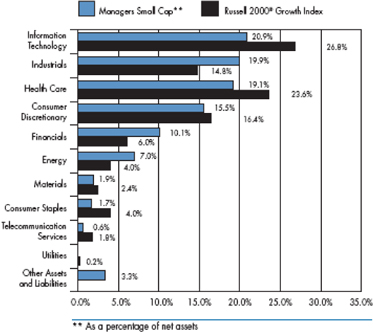
Portfolio Breakdown
| | | | | | |
Industry | | Managers
Small Cap** | | | Russell 2000®
Growth Index | |
Information Technology | | 20.9 | % | | 26.8 | % |
Industrials | | 19.9 | % | | 14.8 | % |
Health Care | | 19.1 | % | | 23.6 | % |
Consumer Discretionary | | 15.5 | % | | 16.4 | % |
Financials | | 10.1 | % | | 6.0 | % |
Energy | | 7.0 | % | | 4.0 | % |
Materials | | 1.9 | % | | 2.4 | % |
Consumer Staples | | 1.7 | % | | 4.0 | % |
Telecommunication Services | | 0.6 | % | | 1.8 | % |
Utilities | | 0.0 | % | | 0.2 | % |
Other Assets and Liabilities | | 3.3 | % | | 0.0 | % |
Top Ten Holdings
| | | |
Security Name | | Percentage
of Net Assets | |
Raymond James Financial, Inc. | | 2.9 | % |
Millipore Corp. | | 2.7 | |
Chico’s FAS, Inc. | | 2.5 | |
Mednax, Inc. | | 2.3 | |
Waddell & Reed Financial, Inc. | | 2.1 | |
Skyworks Solutions, Inc. | | 2.1 | |
Factset Research Systems, Inc. | | 2.0 | |
Watsco, Inc. | | 2.0 | |
Pall Corp. | | 2.0 | |
Tractor Supply Co. | | 1.8 | |
| | | |
Top Ten as a Group | | 22.4 | % |
| | | |
Any sectors, industries, or securities discussed should not be perceived as investment recommendations. Mention of a specific security should not be considered a recommendation to buy or solicitation to sell that security. Specific securities mentioned in this report may have been sold from the Fund’s portfolio of investments by the time you receive this report.
8
Managers Small Cap Fund
Schedule of Portfolio Investments
October 31, 2009
| | | | | | |
| | | Shares | | | Value |
Common Stocks - 96.7% | | | | | | |
Consumer Discretionary - 15.5% | | | | | | |
1-800-FLOWERS.COM, Inc.* | | 24,700 | | | $ | 94,848 |
Bebe Stores, Inc. | | 12,500 | | | | 78,250 |
Cheesecake Factory, Inc., The* | | 21,500 | 2 | | | 390,870 |
Chico’s FAS, Inc.* | | 81,800 | | | | 977,510 |
Corinthian Colleges, Inc.* | | 18,800 | | | | 298,168 |
Dollar Tree, Inc.* | | 14,000 | | | | 631,820 |
Harman International Industries, Inc. | | 13,100 | | | | 492,691 |
hhgregg, Inc.* | | 12,800 | | | | 211,072 |
LKQ Corp.* | | 20,300 | | | | 350,581 |
P.F. Chang’s China Bistro, Inc.* | | 4,800 | 2 | | | 140,112 |
Panera Bread Co., Class A* | | 3,100 | | | | 185,938 |
Polaris Industries, Inc. | | 10,600 | | | | 445,942 |
Regis Corp. | | 13,100 | | | | 212,744 |
Tractor Supply Co.* | | 15,800 | | | | 706,260 |
WABCO Holdings, Inc. | | 20,800 | | | | 493,376 |
WMS Industries, Inc.* | | 10,400 | | | | 415,792 |
Total Consumer Discretionary | | | | | | 6,125,974 |
Consumer Staples - 1.7% | | | | | | |
Nu Skin Enterprises, Inc., Class A | | 28,800 | | | | 655,488 |
Energy - 7.0% | | | | | | |
Arena Resources, Inc.* | | 8,000 | | | | 298,080 |
Carrizo Oil & Gas, Inc.* | | 11,500 | 2 | | | 266,570 |
Core Laboratories, N.V. | | 4,000 | 2 | | | 417,200 |
Denbury Resources, Inc.* | | 42,300 | | | | 617,580 |
Rex Energy Corp.* | | 5,500 | | | | 44,495 |
St. Mary Land & Exploration Co. | | 15,800 | | | | 538,780 |
World Fuel Services Corp. | | 11,900 | | | | 605,115 |
Total Energy | | | | | | 2,787,820 |
Financials - 10.1% | | | | | | |
Argo Group International Holdings, Ltd.* | | 15,000 | | | | 509,400 |
Investment Technology Group, Inc.* | | 11,500 | | | | 248,055 |
Jefferies Group, Inc.* | | 24,600 | | | | 642,060 |
Penson Worldwide, Inc.* | | 16,500 | 2 | | | 160,875 |
Raymond James Financial, Inc. | | 48,500 | | | | 1,145,085 |
Thomas Weisel Partners Group, Inc.* | | 7,500 | | | | 33,975 |
W.R. Berkley Corp. | | 17,600 | | | | 435,072 |
Waddell & Reed Financial, Inc. | | 29,400 | | | | 824,964 |
Total Financials | | | | | | 3,999,486 |
Health Care - 19.1% | | | | | | |
American Medical Systems Holdings, Inc.* | | 31,900 | | | | 491,898 |
Beckman Coulter, Inc. | | 9,300 | | | | 598,269 |
Catalyst Health Solutions, Inc.* | | 20,400 | | | | 639,948 |
Charles River Laboratories International, Inc.* | | 16,900 | | | | 617,188 |
CONMED Corp.* | | 9,500 | | | | 201,305 |
Cumberland Pharmaceuticals, Inc.* | | 11,100 | | | | 132,090 |
Eclipsys Corp.* | | 20,700 | | | | 388,125 |
ev3, Inc.* | | 14,700 | | | | 173,166 |
Mednax, Inc.* | | 17,800 | | | | 924,176 |
Millipore Corp.* | | 15,900 | | | | 1,065,459 |
PAREXEL International Corp.* | | 18,400 | | | | 230,368 |
PSS World Medical, Inc.* | | 25,100 | | | | 507,522 |
Valeant Pharmaceuticals International* | | 4,900 | | | | 144,060 |
VCA Antech, Inc.* | | 24,900 | | | | 593,118 |
West Pharmaceutical Services, Inc. | | 14,200 | 2 | | | 560,474 |
Wright Medical Group, Inc.* | | 16,500 | | | | 268,125 |
Total Health Care | | | | | | 7,535,291 |
Industrials - 19.9% | | | | | | |
Advisory Board Co., The* | | 9,800 | | | | 241,472 |
Aecom Technology Corp.* | | 17,400 | | | | 439,176 |
A.O. Smith Corp. | | 14,500 | | | | 574,635 |
Brady Corp. | | 19,100 | | | | 517,228 |
CLARCOR, Inc. | | 12,400 | | | | 364,932 |
Comfort Systems USA, Inc. | | 9,800 | | | | 106,820 |
EnPro Industries, Inc.* | | 6,900 | | | | 155,802 |
Hub Group, Inc.* | | 17,400 | | | | 432,564 |
II-VI, Inc.* | | 9,000 | | | | 238,230 |
Kaydon Corp. | | 11,300 | | | | 395,387 |
Ladish Co., Inc.* | | 6,700 | | | | 86,832 |
Landstar System, Inc. | | 17,000 | | | | 599,080 |
MasTec, Inc.* | | 59,700 | 2 | | | 704,460 |
Navistar International Corp.* | | 6,900 | | | | 228,666 |
Pall Corp. | | 24,400 | | | | 774,456 |
Quanta Services, Inc.* | | 27,100 | | | | 574,520 |
Waste Connections, Inc.* | | 13,700 | | | | 430,591 |
Watsco, Inc. | | 15,400 | | | | 788,788 |
Wesco International, Inc.* | | 8,700 | | | | 222,372 |
Total Industrials | | | | | | 7,876,011 |
The accompanying notes are an integral part of these financial statements.
9
Managers Small Cap Fund
Schedule of Portfolio Investments (continued)
| | | | | | | |
| | | Shares | | | Value | |
Information Technology - 20.9% | | | | | | | |
Advanced Analogic Technologies, Inc.* | | 36,600 | | | $ | 115,290 | |
Ariba, Inc.* | | 32,600 | | | | 385,332 | |
ATMI, Inc.* | | 10,300 | | | | 156,045 | |
Blackboard, Inc.* | | 8,500 | | | | 301,495 | |
Cogent, Inc.* | | 12,100 | | | | 116,765 | |
Equinix, Inc.* | | 7,900 | 2 | | | 674,028 | |
Factset Research Systems, Inc. | | 12,400 | | | | 794,220 | |
iGATE Corp.* | | 32,800 | | | | 289,624 | |
Insight Enterprises, Inc.* | | 17,900 | | | | 188,308 | |
International Rectifier Corp.* | | 3,300 | | | | 60,324 | |
Jabil Circuit, Inc. | | 41,600 | | | | 556,608 | |
Loop Net, Inc.* | | 24,900 | | | | 217,377 | |
Monolithic Power Systems, Inc.* | | 14,800 | | | | 295,852 | |
Ness Technologies, Inc.* | | 18,500 | | | | 121,915 | |
QLogic Corp.* | | 22,700 | | | | 398,158 | |
Radisys Corp.* | | 15,500 | | | | 131,905 | |
RightNow Technologies, Inc.* | | 23,300 | | | | 355,558 | |
Rogers Corp.* | | 5,900 | | | | 153,105 | |
SAVVIS, Inc.* | | 24,800 | | | | 366,792 | |
Semtech Corp.* | | 19,700 | | | | 304,759 | |
Skyworks Solutions, Inc.* | | 77,800 | | | | 811,454 | |
Tech Data Corp.* | | 15,300 | | | | 587,979 | |
ValueClick, Inc.* | | 42,200 | | | | 415,248 | |
Verint Systems, Inc.* | | 12,400 | | | | 190,960 | |
Volterra Semiconductor Corp.* | | 20,200 | | | | 279,770 | |
Total Information Technology | | | | | | 8,268,871 | |
Materials - 1.9% | | | | | | | |
Albemarle Corp. | | 10,300 | | | | 325,274 | |
Brush Engineered Materials, Inc.* | | 7,500 | | | | 138,375 | |
Cabot Corp. | | 13,200 | | | | 289,476 | |
Total Materials | | | | | | 753,125 | |
Telecommunication Services - 0.6% | | | | | | | |
Premiere Global Services, Inc.* | | 33,100 | | | | 247,257 | |
Total Common Stocks
(cost $38,983,613) | | | | | | 38,249,323 | |
Short-Term Investments - 9.4% 1 | | | | | | | |
BNY Institutional Cash Reserves Fund,
Series A, 0.07% 3 | | 1,990,007 | | | | 1,990,007 | |
BNY Institutional Cash Reserves Fund,
Series B* 3,4 | | 118,432 | | | | 18,653 | |
Dreyfus Cash Management Fund, Institutional
Class Shares, 0.13% | | 1,696,817 | | | | 1,696,817 | |
Total Short-Term Investments
(cost $3,805,256) | | | | | | 3,705,477 | |
Total Investments - 106.1%
(cost $42,788,869) | | | | | | 41,954,800 | |
Other Assets, less Liabilities - (6.1)% | | | | | | (2,418,394 | ) |
Net Assets - 100.0% | | | | | $ | 39,536,406 | |
The accompanying notes are an integral part of these financial statements.
10
Managers Fremont Micro-Cap Fund
Portfolio Manager’s Comments
The Managers Fremont Micro-Cap Fund primarily invests in the stocks of U.S. micro-capitalization companies. These companies have market capitalizations that, at the time of initial purchase, place them among the smallest 5% of companies listed on U.S. stock markets. Normally the Fund will invest at least 80% of its assets in U.S. micro-cap stocks. The Fund employs multiple portfolio managers who specialize in distinct investment approaches. This “intelligence diversification” not only serves to manage risk, but also seeks to incorporate into the portfolio the breadth of the micro-cap market by focusing different analytical insights on micro-cap investing. The Fund’s team of subadvisors strive to achieve this performance and diversification while ensuring that the Fund operates within the framework of its investment objective and principal investment strategies. The Russell Microcap® Index is the benchmark for the Fund.
The Portfolio Managers
Lord, Abbett & Co., LLC (“Lord Abbett”)
The team focuses its stock selection effort by focusing on companies that have revenue growth of at least 15%, are experiencing year-to-year operating margin improvement and are experiencing earnings growth that is driven by top-line growth rather than being driven by one time events or simple cost-cutting measures. The focus is also on identifying companies with higher-quality balance sheets (often captured by finding companies with manageable debt-to-total-capital ratios) and that are already profitable. Once this process is completed, the focus for the team is on forecasting both revenue and earnings growth over the next several years. To achieve this goal, and to find companies that are expected to grow faster than their industry average, members of the team spend an extensive amount of time understanding the competitive advantages of a firm, the industry dynamics within which they operate, and the strength of management.
The sell discipline is enacted if there is a fundamental change in the business, a more attractive alternative is found, or if a holding reaches a 5% weight in the overall portfolio. The Lord Abbett portfolio typically holds between 75 and 100 stocks with no individual holding exceeding 5%. There is a risk constraint that prevents any individual industry from being greater than 25% of the total portfolio weight. The annual turnover of the portfolio is expected to be relatively high although there is no explicit target as part of either the stock selection or the portfolio-construction process.
Next Century Growth Investors, LLC (“Next Century”)
The team requires historical revenue growth of at least 15% for a company before conducting further research. Other key factors considered initially by the team are strong historical revenue growth, low debt and high ROE. Quantitative screening is done on a regular basis to see which stocks over the past year are experiencing significant growth. The next stage of this process involves intensive first-hand research to determine the growth prospects of a company with the team choosing a stock only when it has become convinced a company has an extraordinary opportunity to grow its business. The uniqueness of this process lies in the fact that the team seeks out these companies regardless of their short-term prospects and\ or current valuation. The team is looking for “home runs” and companies that will grow to the point that they will eventually reach a small market capitalization.
The sell discipline is enacted if there is a change in the original investment thesis or a fundamental change in business of the company. In addition, a holding will become a candidate for sale if it reaches an extreme valuation, becomes larger than 5% of the overall portfolio or as it approaches $1 billion in market capitalization. Typically companies are sold out of the micro-cap portfolio because they have approached $1 billion in market capitalization.
The Next Century portfolio is concentrated and typically has 40-60 holdings, which can create a high level of volatility. The only risk constraints are that sector weights can not exceed two times the Russell 2000® Growth sector weights, and no individual holding can be greater than 5% of the portfolio.
Managers Investment Group LLC (“MIG”)
Effective August 31, 2009, the subadvisory agreement with respect to the Fund between the Fund’s investment manager, Managers Investment Group LLC (“MIG”), and OFI Institutional Asset Management, Inc. (“OFII”) was terminated. The portion of the Fund previously managed by the OFII portfolio management team of Daniel Goldfarb, Christopher Crooks, and Steven Dray (collectively, the “OFII Team”), who were jointly and primarily responsible for the day-to-day management of the portion of the Fund managed by OFII since December 10, 2007, is currently managed by MIG in its capacity as the investment manager to the Fund. MIG is employing a transition manager to assist with the management of assets formerly managed by the OFII Team. Keitha L. Kinne is primarily responsible for overseeing the transition manager and is primarily responsible for day-to-day management of the portfolio managed directly by MIG. The OFI Team joined AlphaOne on September 1, 2009 and acts as a consultant to MIG with respect to the portion of the Fund previously managed by the AlphaOne team at OFII. AlphaOne retains no authority over the Fund, and Ms. Kinne, on behalf of MIG, retains full discretion over the purchase and sale of investments for the portion of the Fund managed directly by MIG.
WEDGE Capital Management L.L.P. (“WEDGE”)
The investment process is a combination of both quantitative and fundamental research insights. The quantitative portion of the investment process uses commonly found factors and characteristics that can be accessed via any number of commercial databases. The value-added portion of the process, therefore, uses a number of different factors across five major categories: valuation, earnings quality, operating efficiency, capital usage and momentum, whose efficacy has been verified via long-term regression analysis. This is the Fundamental Value model. The top results of this model are combined with the best resulting stocks from the Financial Quality model, which
11
Managers Fremont Micro-Cap Fund
Portfolio Manager’s Comments (continued)
measures stocks across categories such as multiple earnings growth, profitability, leverage and liquidity. The top stocks that appear in both models are eligible for fundamental research. The fundamental research portion of the investment process is exclusionary in nature and meant to eliminate stocks that are not strong in earnings forecasts, valuation metrics, sector\industry outlook or any factor that can not be easily captured quantitatively.
A stock is scrutinized for possible sale if it falls below the top four deciles in the Fundamental Value model. Stocks are sold when they become fairly valued, an upgrade opportunity develops or the original investment thesis materially deteriorates. The portfolio managed by WEDGE is confined to plus or minus 10% in any given sector although sector positions tend to be much closer to the index weight than this (it should be noted that these self-imposed sector weighting constraints are based on a proprietary liquidity analysis conducted on an ongoing basis by the micro-cap team and is NOT driven by the sector weightings of any micro-cap benchmark). The final portfolio is a well diversified micro-cap portfolio holding approximately 150 securities and consistently maintaining a value bias relative to the benchmark. The portfolio tends to hold securities within the $40 million to $400 million market capitalization range, although does not require a sale of a holding until it reaches $800 million in market capitalization.
The Year in Review
The past twelve months will go down in the history books as one of the wildest rides in the history of Wall Street. Early in the period, securities markets were under severe pressure as the credit crises which began in the summer of 2007, accelerated in the fourth quarter of last year amid ongoing concerns about deteriorating economic conditions and the health of some of our most prominent financial institutions. Banks of all sizes remained under pressure, which led to continued consolidation within the industry. Wachovia agreed to sell itself to Wells Fargo & Co. while PNC agreed to acquire the troubled National City. Meanwhile, the U.S. Government attempted to stabilize the system by formally bailing out companies like Citi-group and by providing injections of capital into hundreds of other financial institutions. Like a sprawling fire, the crises extended to other industries with the automakers finding themselves on the verge of collapse. Once again, the U.S. Government stepped in and in late December President Bush approved an emergency bailout of the U.S. auto industry, offering $17.4 billion in rescue loans to Chrysler and General Motors with the expectation that the companies would move quickly to develop acceptable plans for long-term viability. Consumer and investor confidence continued to sink in the early part of 2009 despite the U.S. Government’s aggressive efforts to restore the economy and stabilize the financial markets. During January, February, and early March, stocks plunged, sending broad indexes to levels not seen since the mid to late 1990s. From peak (October 10, 2007) to trough (March 9, 2009), stocks, as measured by the S&P 500 Index, lost 55.5%, marking this Index’s steepest decline since the Great Depression. Then, on March 10, a very sharp recovery began amid preliminary signs that the Government’s efforts might be starting to bear fruit. More specifically, Citigroup, which had been under extreme pressure and was essentially bailed out by the Government, reported that it returned to profitability in the months of January and February. Citigroup’s surprising news seemed to ignite the markets, contributing to a more than 6% gain for the S&P 500 Index and set the stage for a sharp recovery in equities and extended the rally in credit sensitive fixed income securities.
For the 12 months that ended October 31, 2009, the Managers Fremont Micro-Cap Fund returned 11.3%, compared with 5.1% for its benchmark, the Russell Microcap® Index. Performance remains strong relative to both the Index and peers since the Fund was converted to a multi-manager, multi-style approach in early 2008. Solid outperformance over the last year has been driven by positive stock selection in several sectors including financials and information technology. In addition, the Fund has benefited from relative sector weightings versus the benchmark including a large underweight to the struggling financials sector and an overweight to the recovering consumer discretionary sector. The Fund’s growth subadvisors, in particular, performed well during this period as growth micro-cap stocks outperformed their value counterparts significantly.
Looking Forward
The portfolio managers are cautiously optimistic about the prospects of a recovery and are seeking to take advantage of further consolidation within several sectors by tilting the Fund towards those companies the portfolio managers believe are best positioned to increase market share. Although the Fund’s subadvisors remain fairly active, relative sector positioning has remained fairly consistent throughout the course of the last fiscal year with the major exception being the information technology sector where strong performance resulted in the overweight position being reduced to a near neutral weight by the end of the period. Within the Fund, the largest overweight remains to the industrials sector and the largest underweight continues to remain to the financials sector.
Cumulative Total Return Performance
Managers Fremont Micro-Cap Fund’s cumulative total return is based on the daily change in net asset value (NAV), and assumes that all distributions were reinvested. The Russell 2000 ® Index is composed of the 2,000 smallest stocks in the Russell 3000® Index and is widely regarded in the industry as the premier measure of small-cap stock performance. This chart compares a hypothetical $10,000 investment made in the Managers Fremont Micro-Cap Fund on October 31,
12
Managers Fremont Micro-Cap Fund
Portfolio Manager’s Comments (continued)
Cumulative Total Return Performance
1999, to a $10,000 investment made in the Russell 2000® Index for the same time period. Performance for periods longer than one year is annualized. The graph and table do not reflect the deduction of taxes that a shareholder would pay on a Fund distribution or redemption of shares. The listed returns for the Fund are net of expenses and the returns for the index exclude expenses. Total returns for the Fund would have been lower had certain expenses not been reduced.
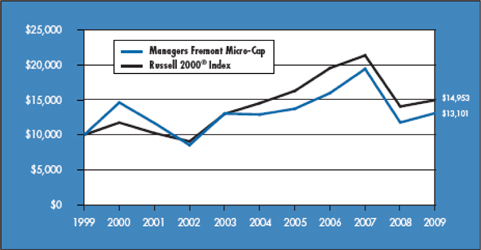
The table below shows the average annualized total returns for the Managers Fremont Micro-Cap Fund, the Russell Microcap® Index and the Russell 2000® Index for the one-year, five-year and ten-year periods ended October 31, 2009.
| | | | | | | | | |
Average Annual Total Returns1,2 | | One Year | | | Five Years | | | Ten Years | |
Managers Fremont Micro-Cap4 | | 11.34 | % | | 0.31 | % | | 2.74 | % |
Russell Microcap® Index3 | | 5.06 | % | | (2.57 | )% | | — | 5 |
Russell 2000® Index6 | | 6.46 | % | | 0.59 | % | | 4.11 | % |
The performance data shown represents past performance. Past performance is not a guarantee of future results. Current performance may be lower or higher than the performance data quoted. The investment return and principal value of an investment in the Fund will fluctuate so that an investor’s shares, when redeemed, may be worth more or less than their original cost. For performance information through the most recent month end, please call (800) 835-3879 or visit our Web site at www.managersinvest.com.
In choosing a Fund, investors should carefully consider the amount they plan to invest, their investment objectives, the Fund’s investment objectives, risks, charges and expenses before investing. For this and other information, please call (800) 835-3879 or visit www.managersinvest.com for a free prospectus. Read it carefully before investing or sending money. Distributed by Managers Distributors, Inc., member FINRA.
| 1 | Total return equals income yield plus share price change and assumes reinvestment of all dividends and capital gain distributions. Returns are net of fees and may reflect offsets of Fund expenses as described in the Prospectus. No adjustment has been made for taxes payable by shareholders on their reinvested dividends and capital gain distributions. Returns for periods greater than one year are annualized. The listed returns on the Fund are net of expenses and based on the published NAV as of October 31, 2009. All returns are in U.S. dollars($). |
| 2 | The Funds are subject to the special risks associated with investments in micro-cap companies, such as relatively short earnings histories, competitive conditions, less publicly available corporate information, and reliance on a limited number of products. |
| 3 | The Russell Microcap® Index tracks the micro-cap segment of the U.S. equity market. It makes up less than 3% of the U.S. Equity market and is represented by the smallest 1,000 securities in the small-cap Russell 2000® Index plus the next 1,000 securities. The Index reflects no deduction of fees, expenses, or taxes. |
| 4 | Fund for which, from time to time, the advisor has waived its fees and/or absorbed Fund expenses, which has resulted in higher returns. |
| 5 | Since the Russell Microcap® Index’s inception date of June 30, 2000, the average annual total return for the Index was 2.45%. |
| 6 | The Russell 2000® Index is composed of the 2,000 smallest stocks in the Russell 3000® Index and is widely regarded in the industry as the premier measure of small-cap stock performance. The Index reflects no deduction of fees, expenses, or taxes. |
The Russell Microcap® Index and the Russell 2000® Index are registered trademarks of Russell Investments. Russell® is a trademark of Russell Investments.
Not FDIC insured, nor bank guaranteed. May lose value.
13
Managers Fremont Micro-Cap Fund
Fund Snapshots
October 31, 2009
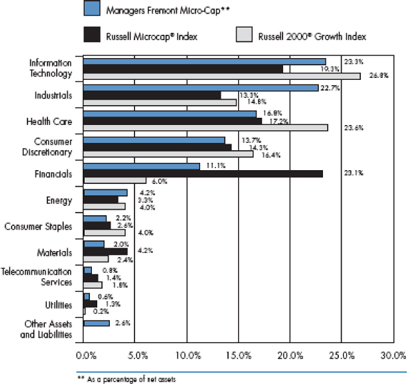
Portfolio Breakdown
| | | | | | | | | |
Industry | | Managers
Fremont
Micro Cap** | | | Russell
Microcap®
Index | | | Russell 2000®
Growth
Index | |
Information Technology | | 23.3 | % | | 19.3 | % | | 26.8 | % |
Industrials | | 22.7 | % | | 13.3 | % | | 14.8 | % |
Health Care | | 16.8 | % | | 17.2 | % | | 23.6 | % |
Consumer Discretionary | | 13.7 | % | | 14.3 | % | | 16.4 | % |
Financials | | 11.1 | % | | 23.1 | % | | 6.0 | % |
Energy | | 4.2 | % | | 3.3 | % | | 4.0 | % |
Consumer Staples | | 2.2 | % | | 2.6 | % | | 4.0 | % |
Materials | | 2.0 | % | | 4.2 | % | | 2.4 | % |
Telecommunication Services | | 0.8 | % | | 1.4 | % | | 1.8 | % |
Utilities | | 0.6 | % | | 1.3 | % | | 0.2 | % |
Other Assets and Liabilities | | 2.6 | % | | 0.0 | % | | 0.0 | % |
Top Ten Holdings
| | | |
Security Name | | Percentage of Net
Assets | |
LaBarge, Inc.* | | 1.2 | % |
Bio-Reference Laboratories, Inc.* | | 1.2 | |
U.S. Physical Therapy, Inc.* | | 1.0 | |
Forrester Research, Inc. | | 1.0 | |
Great Lakes Dredge & Dock Corp. | | 1.0 | |
HMS Holdings Corp.* | | 0.9 | |
Carrizo Oil & Gas, Inc. | | 0.9 | |
CyberSource Corp.* | | 0.9 | |
MWI Veterinary Supply, Inc.* | | 0.9 | |
Standard Parking Corp. | | 0.9 | |
| | | |
Top Ten as a Group | | 9.9 | % |
| | | |
| * | Top Ten Holding at April 30, 2009 |
Any sectors, industries, or securities discussed should not be perceived as investment recommendations. Mention of a specific security should not be considered a recommendation to buy or solicitation to sell that security. Specific securities mentioned in this report may have been sold from the Fund’s portfolio of investments by the time you receive this report.
14
Managers Fremont Micro-Cap Fund
Schedule of Portfolio Investments
October 31, 2009
| | | | | |
| | | Shares | | Value |
Common Stocks - 97.4% | | | | | |
Consumer Discretionary - 13.7% | | | | | |
Ambassadors Group, Inc. | | 61,513 | | $ | 781,830 |
America’s Car-Mart, Inc.* | | 20,700 | | | 429,111 |
Amerigon, Inc.* | | 29,200 | | | 187,756 |
BJ’s Restaurants, Inc.* | | 39,467 | | | 629,893 |
Bridgepoint Education, Inc.* | | 18,195 | | | 258,005 |
Buffalo Wild Wings, Inc.* | | 20,615 | | | 845,421 |
Cache, Inc.* | | 60,773 | | | 292,318 |
California Pizza Kitchen, Inc.* | | 29,500 | | | 383,205 |
Chinacast Education Corp.* | | 35,000 | | | 217,700 |
Citi Trends, Inc.* | | 14,688 | | | 386,735 |
CKE Restaurants, Inc. | | 15,600 | | | 136,500 |
Core-Mark Holding Co., Inc.* | | 5,600 | | | 153,272 |
CSS Industries, Inc. | | 12,400 | | | 251,720 |
FGX International Holdings, Ltd.* | | 32,671 | | | 430,931 |
Grand Canyon Education, Inc.* | | 12,895 | | | 209,157 |
Hawk Corp., Class A* | | 11,545 | | | 160,707 |
hhgregg, Inc.* | | 63,700 | | | 1,050,413 |
Hibbett Sports, Inc.* | | 21,561 | | | 404,053 |
Home Inns & Hotels Management, Inc., (ADR)* | | 9,002 | | | 239,273 |
Hooker Furniture Corp. | | 11,588 | | | 148,442 |
IMAX Corp.* | | 39,377 | | | 405,583 |
Jo-Ann Stores, Inc.* | | 6,500 | | | 173,030 |
K12, Inc.* | | 4,600 | | | 73,784 |
Kenneth Cole Productions, Inc. | | 26,107 | | | 248,278 |
Learning Tree International, Inc.* | | 13,600 | | | 147,968 |
Lincoln Educational Services Corp.* | | 7,300 | | | 144,686 |
Lumber Liquidators, Inc.* | | 45,460 | | | 966,025 |
Maidenform Brands, Inc.* | | 19,800 | | | 277,992 |
Marcus Corp., The | | 12,500 | | | 146,250 |
McCormick & Schmick’s Seafood Restaurants, Inc.* | | 58,979 | | | 355,054 |
Midas, Inc.* | | 17,500 | | | 141,050 |
Monro Muffler Brake, Inc. | | 23,900 | | | 740,661 |
Morton’s Restaurant Group, Inc.* | | 19,000 | | | 71,060 |
Movado Group, Inc. | | 34,796 | | | 364,662 |
New York & Company, Inc.* | | 48,000 | | | 211,200 |
Peet’s Coffee & Tea, Inc.* | | 13,100 | | | 445,400 |
Pinnacle Entertainment, Inc.* | | 59,033 | | | 498,829 |
RC2 Corp.* | | 5,125 | | | 66,932 |
Rentrak Corp.* | | 4,600 | | | 70,702 |
Shutterfly, Inc.* | | 45,850 | | | 646,485 |
Steiner Leisure, Ltd.* | | 16,020 | | | 592,099 |
Summer Infant, Inc.* | | 48,915 | | | 243,597 |
The Finish Line, Inc., Class A | | 18,500 | | | 187,590 |
True Religion Apparel, Inc.* | | 16,485 | | | 424,818 |
Universal Electronics, Inc.* | | 16,363 | | | 337,078 |
Vitacost.com, Inc.* | | 37,200 | | | 369,024 |
Volcom, Inc.* | | 32,000 | | | 531,520 |
Westport Innovations, Inc.* | | 43,500 | | | 425,430 |
Wonder Auto Technology, Inc.* | | 18,500 | | | 239,390 |
Zumiez, Inc.* | | 23,500 | | | 316,545 |
Total Consumer Discretionary | | | | | 17,459,164 |
Consumer Staples - 2.2% | | | | | |
Andersons, Inc., The | | 4,900 | | | 152,047 |
Boston Beer Co., Inc.* | | 4,800 | | | 182,400 |
China-Biotics, Inc.* | | 20,800 | | | 241,280 |
Diedrich Coffee, Inc.* | | 17,340 | | | 378,012 |
Elizabeth Arden, Inc.* | | 24,900 | | | 265,185 |
Inter Parfums, Inc. | | 8,708 | | | 106,934 |
J&J Snack Foods Corp. | | 5,500 | | | 215,435 |
Medifast, Inc.* | | 11,215 | | | 246,955 |
Nutraceutical International Corp.* | | 7,400 | | | 80,512 |
Pantry, Inc., The* | | 10,300 | | | 145,333 |
Rocky Mountain Chocolate Factory, Inc. | | 9,400 | | | 80,088 |
Smart Balance, Inc.* | | 93,132 | | | 491,737 |
Susser Holdings Corp.* | | 13,600 | | | 161,704 |
Total Consumer Staples | | | | | 2,747,622 |
Energy - 4.2% | | | | | |
Bolt Technology Corp.* | | 6,400 | | | 65,088 |
Carrizo Oil & Gas, Inc.* | | 48,945 | | | 1,134,545 |
Clean Energy Fuels Corp.* | | 48,100 | | | 557,960 |
Dawson Geophysical Co.* | | 6,400 | | | 154,560 |
Gulf Island Fabrication, Inc. | | 18,100 | | | 346,072 |
Natural Gas Services Group, Inc.* | | 18,600 | | | 313,782 |
Northern Oil & Gas, Inc.* | | 93,780 | | | 855,274 |
Panhandle Oil and Gas, Inc. | | 7,700 | | | 151,382 |
PetroQuest Energy, Inc.* | | 36,420 | | | 223,255 |
RPC, Inc. | | 86,609 | | | 809,794 |
Tetra Technologies, Inc.* | | 33,700 | | | 318,802 |
The accompanying notes are an integral part of these financial statements.
15
Managers Fremont Micro-Cap Fund
Schedule of Portfolio Investments (continued)
| | | | | |
| | | Shares | | Value |
Energy - 4.2% (continued) | | | | | |
TGC Industries, Inc. | | 39,543 | | $ | 172,012 |
Union Drilling, Inc.* | | 34,730 | | | 265,337 |
Total Energy | | | | | 5,367,863 |
Financials - 11.1% | | | | | |
Alliance Financial Corp. | | 3,100 | | | 80,724 |
American Physicians Capital, Inc. | | 10,000 | | | 282,800 |
American Safety Insurance Holdings, Ltd.* | | 4,900 | | | 72,618 |
Amerisafe, Inc.* | | 22,206 | | | 411,699 |
Associated Estates Realty Corp. | | 18,500 | | | 168,720 |
Baldwin & Lyons, Inc. | | 3,700 | | | 84,397 |
Bancorp Rhode Island, Inc. | | 20,397 | | | 520,531 |
Bank of Marin Bancorp | | 8,200 | | | 270,682 |
Bar Harbor Bankshares | | 2,500 | | | 71,000 |
Broadpoint Gleacher Securities Group, Inc.* | | 54,312 | | | 345,968 |
Bryn Mawr Bank Corp. | | 22,652 | | | 362,432 |
Columbia Banking System, Inc. | | 31,034 | | | 456,200 |
Community Trust Bancorp, Inc. | | 11,000 | | | 270,820 |
Cowen Group, Inc.* | | 88,382 | | | 667,284 |
Danvers Bancorp, Inc. | | 58,609 | | | 804,702 |
Donegal Group, Inc. | | 33,160 | | | 484,136 |
Eastern Insurance Holdings, Inc. | | 16,136 | | | 113,920 |
ESB Financial Corp. | | 5,600 | | | 65,296 |
ESSA Bancorp, Inc. | | 6,500 | | | 77,805 |
Evercore Partners, Inc., Class A | | 9,600 | | | 313,344 |
Financial Institutions, Inc. | | 46,755 | | | 493,733 |
First Cash Financial Services, Inc.* | | 17,000 | | | 292,060 |
First Community Bancshares, Inc. | | 25,575 | | | 297,693 |
First Mercury Financial Corp. | | 12,000 | | | 152,400 |
First of Long Island Corp., The | | 6,300 | | | 152,271 |
Hallmark Financial Services, Inc.* | | 22,200 | | | 170,274 |
Iberia Bank Corp. | | 15,403 | | | 667,104 |
Independent Bank Corp. (MA) | | 11,200 | | | 238,224 |
JMP Group, Inc. | | 26,100 | | | 219,762 |
Legacy Bancorp, Inc. | | 54,193 | | | 518,085 |
Meadowbrook Insurance Group, Inc. | | 55,100 | | | 370,823 |
Mercer Insurance Group, Inc. | | 9,200 | | | 170,936 |
Mission West Properties, Inc. | | 11,700 | | | 77,805 |
National Bankshares, Inc. | | 9,900 | | | 268,389 |
National Interstate Corp. | | 4,700 | | | 85,117 |
OceanFirst Financial Corp., Inc. | | 63,192 | | | 600,324 |
Penson Worldwide, Inc.* | | 85,312 | | | 831,792 |
Ramco-Gershenson Properties Trust | | 7,900 | | | 69,836 |
S.Y. Bancorp, Inc. | | 13,300 | | | 297,255 |
SCBT Financial Corp. | | 5,866 | | | 151,753 |
Shore Bancshares, Inc. | | 4,400 | | | 71,764 |
Simmons First National Corp., Class A | | 8,300 | | | 242,858 |
Smithtown Bancorp, Inc. | | 14,446 | | | 149,516 |
Southside Bancshares, Inc. | | 13,283 | | | 276,154 |
Texas Capital Bancshares, Inc.* | | 20,900 | | | 304,513 |
Urstadt Biddle Properties, Inc., Class A | | 10,700 | | | 158,039 |
ViewPoint Financial Group | | 6,000 | | | 80,400 |
Washington Trust Bancorp, Inc. | | 8,400 | | | 126,168 |
Webster Financial Corp. | | 42,500 | | | 480,675 |
WSFS Financial Corp. | | 9,100 | | | 251,160 |
Total Financials | | | | | 14,191,961 |
Health Care - 16.8% | | | | | |
Addus HomeCare Corp.* | | 34,600 | | | 316,590 |
Allos Therapeutics, Inc.* | | 27,700 | | | 156,505 |
ATS Medical, Inc.* | | 57,800 | | | 155,482 |
Bio-Reference Laboratories, Inc.* | | 47,438 | | | 1,533,671 |
Cardiovascular Systems, Inc.* | | 38,000 | | | 185,820 |
Clarient, Inc.* | | 81,565 | | | 264,271 |
Conceptus, Inc.* | | 31,565 | | | 553,650 |
Cyberonics, Inc.* | | 20,100 | | | 290,646 |
Cypress Bioscience, Inc.* | | 30,700 | | | 188,498 |
DexCom, Inc.* | | 84,100 | | | 576,926 |
Endologix, Inc.* | | 224,035 | | | 1,066,407 |
Ensign Group, Inc.,The | | 10,700 | | | 158,146 |
eResearch Technology, Inc.* | | 37,000 | | | 273,800 |
Eurand N.V.* | | 33,903 | | | 448,198 |
Exactech, Inc.* | | 45,967 | | | 689,505 |
Genomic Health, Inc.* | | 12,800 | | | 237,696 |
Genoptix, Inc.* | | 10,520 | | | 365,991 |
Hanger Orthopedic Group, Inc.* | | 69,658 | | | 964,067 |
Harvard Bioscience, Inc.* | | 114,400 | | | 414,128 |
HMS Holdings Corp.* | | 27,750 | | | 1,191,308 |
Home Diagnostics, Inc.* | | 12,830 | | | 80,187 |
Insulet Corp.* | | 64,600 | | | 717,060 |
IPC The Hospitalist Co., Inc.* | | 14,300 | | | 433,290 |
Kensey Nash Corp.* | | 5,900 | | | 141,069 |
Landauer, Inc. | | 4,400 | | | 227,876 |
LHC Group, Inc.* | | 6,400 | | | 178,624 |
MAKO Surgical Corp.* | | 39,700 | | | 359,285 |
The accompanying notes are an integral part of these financial statements.
16
Managers Fremont Micro-Cap Fund
Schedule of Portfolio Investments (continued)
| | | | | |
| | | Shares | | Value |
Health Care - 16.8% (continued) | | | | | |
Medical Action Industries, Inc.* | | 19,800 | | $ | 216,612 |
MEDTOX Scientific, Inc.* | | 95,340 | | | 951,493 |
Merit Medical Systems, Inc.* | | 47,933 | | | 813,902 |
MWI Veterinary Supply, Inc.* | | 31,200 | | | 1,104,480 |
Neogen Corp.* | | 24,999 | | | 792,468 |
NxStage Medical, Inc.* | | 82,600 | | | 460,908 |
Obagi Medical Products, Inc.* | | 16,100 | | | 164,542 |
Odyssey HealthCare, Inc.* | | 6,100 | | | 85,034 |
Optimer Pharmaceuticals, Inc.* | | 26,500 | | | 306,340 |
Orthovita, Inc.* | | 54,100 | | | 189,350 |
Phase Forward, Inc.* | | 13,000 | | | 170,430 |
Psychemedics Corp. | | 44,047 | | | 238,294 |
Questcor Pharmaceuticals, Inc.* | | 31,100 | | | 141,194 |
Res-Care, Inc.* | | 21,600 | | | 259,848 |
Somanetics Corp.* | | 28,000 | | | 418,600 |
SXC Health Solutions Corp.* | | 12,465 | | | 569,401 |
U.S. Physical Therapy, Inc.* | | 91,785 | | | 1,288,661 |
Vanda Pharmaceuticals, Inc.* | | 27,922 | | | 284,804 |
Viropharma, Inc.* | | 30,100 | | | 226,954 |
Volcano Corp.* | | 2,946 | | | 42,275 |
Young Innovations, Inc. | | 5,985 | | | 141,545 |
Zoll Medical Corp.* | | 15,600 | | | 302,952 |
Total Health Care | | | | | 21,338,783 |
Industrials - 22.7% | | | | | |
51job, Inc., (ADR)* | | 32,200 | | | 479,780 |
AAON, Inc. | | 8,100 | | | 145,881 |
AeroVironment, Inc.* | | 7,752 | | | 206,668 |
Alamo Group, Inc. | | 10,600 | | | 145,220 |
Altra Holdings, Inc.* | | 61,092 | | | 535,777 |
American Ecology Corp. | | 39,700 | | | 659,814 |
Ameron International Corp. | | 4,700 | | | 277,206 |
Ampco-Pittsburgh Corp. | | 9,300 | | | 250,170 |
Apogee Enterprises, Inc. | | 11,000 | | | 145,640 |
Applied Signal Technology, Inc. | | 6,400 | | | 131,136 |
AZZ, Inc.* | | 11,995 | | | 410,949 |
Barrett Business Services, Inc. | | 22,637 | | | 262,589 |
Cascade Corp. | | 9,400 | | | 233,496 |
CBIZ, Inc.* | | 126,900 | | | 893,376 |
Celadon Group, Inc.* | | 24,400 | | | 238,144 |
Chart Industries, Inc.* | | 36,465 | | | 720,913 |
Colfax Corp.* | | 26,200 | | | 285,056 |
Columbus McKinnon Corp.* | | 18,300 | | | 302,865 |
Comfort Systems USA, Inc. | | 13,000 | | | 141,700 |
Courier Corp. | | 16,300 | | | 241,729 |
CRA International, Inc.* | | 21,200 | | | 524,700 |
Ducommun, Inc. | | 15,500 | | | 263,810 |
Duoyuan Global Water, Inc., (ADR)* | | 10,400 | | | 340,912 |
DXP Enterprises, Inc.* | | 62,626 | | | 718,947 |
Dynamex, Inc.* | | 13,600 | | | 252,008 |
Dynamic Materials Corp. | | 11,350 | | | 218,828 |
Energy Recovery, Inc.* | | 16,700 | | | 93,186 |
EnerNOC, Inc.* | | 23,471 | | | 674,322 |
Ennis, Inc. | | 11,400 | | | 172,710 |
EnPro Industries, Inc.* | | 11,400 | | | 257,412 |
Exponent, Inc.* | | 37,781 | | | 982,684 |
Furmanite Corp.* | | 53,800 | | | 192,604 |
GP Strategies Corp.* | | 108,533 | | | 764,072 |
Great Lakes Dredge & Dock Corp. | | 198,815 | | | 1,218,736 |
Harbin Electric, Inc.* | | 20,100 | | | 320,193 |
Hill International, Inc.* | | 105,963 | | | 712,071 |
ICF International, Inc.* | | 12,585 | | | 360,560 |
II-VI, Inc.* | | 30,604 | | | 810,088 |
Kforce, Inc.* | | 33,100 | | | 388,263 |
Kimball International, Inc., Class B | | 10,700 | | | 80,250 |
Knight Transportation, Inc. | | 31,350 | | | 502,854 |
Knoll, Inc. | | 32,600 | | | 319,480 |
LaBarge, Inc.* | | 138,932 | | | 1,542,145 |
LB Foster Co., Class A* | | 4,800 | | | 134,784 |
LMI Aerospace, Inc.* | | 42,494 | | | 457,660 |
LSI Industries, Inc. | | 42,597 | | | 297,753 |
Marten Transport, Ltd.* | | 45,817 | | | 803,630 |
Met-Pro Corp. | | 24,600 | | | 226,320 |
Michael Baker Corp.* | | 9,300 | | | 332,010 |
Multi-Color Corp. | | 67,329 | | | 893,456 |
MYR Group, Inc.* | | 20,800 | | | 357,344 |
Old Dominion Freight Line, Inc.* | | 11,950 | | | 310,580 |
On Assignment, Inc.* | | 54,200 | | | 327,368 |
Orion Marine Group, Inc.* | | 48,710 | | | 927,438 |
Raven Industries, Inc. | | 18,718 | | | 462,335 |
RBC Bearings, Inc.* | | 10,100 | | | 217,251 |
Saia, Inc.* | | 22,200 | | | 325,452 |
SmartHeat, Inc.* | | 38,700 | | | 345,978 |
Spherion Corp.* | | 12,800 | | | 63,360 |
The accompanying notes are an integral part of these financial statements.
17
Managers Fremont Micro-Cap Fund
Schedule of Portfolio Investments (continued)
| | | | | |
| | | Shares | | Value |
Industrials - 22.7% (continued) | | | | | |
Standard Parking Corp.* | | 62,581 | | $ | 1,101,426 |
Sterling Construction, Inc.* | | 39,290 | | | 633,748 |
Titan Machinery, Inc.* | | 45,046 | | | 483,344 |
TrueBlue, Inc. | | 26,800 | | | 324,280 |
Universal Truckload Services, Inc. | | 9,100 | | | 149,604 |
UQM Technologies, Inc.* | | 53,120 | | | 249,664 |
Vitran Corp., Inc., Class A* | | 102,763 | | | 879,651 |
Volt Information Sciences, Inc.* | | 15,800 | | | 128,138 |
Total Industrials | | | | | 28,851,518 |
Information Technology - 23.3% | | | | | |
3PAR, Inc.* | | 31,200 | | | 293,592 |
Actuate Corp.* | | 39,800 | | | 199,398 |
Anadigics, Inc.* | | 66,700 | | | 214,107 |
Anaren Microwave, Inc.* | | 18,100 | | | 264,622 |
Applied Micro Circuits Corp.* | | 40,900 | | | 319,838 |
Aruba Networks, Inc.* | | 44,830 | | | 350,571 |
Bel Fuse, Inc. | | 13,100 | | | 237,110 |
Cavium Networks, Inc.* | | 14,100 | | | 267,336 |
CommVault Systems, Inc.* | | 15,900 | | | 313,230 |
Compellent Technologies, Inc.* | | 56,515 | | | 1,036,485 |
Computer Task Group, Inc.* | | 12,000 | | | 83,640 |
Constant Contact, Inc.* | | 25,557 | | | 423,479 |
CTS Corp. | | 35,195 | | | 315,347 |
CyberSource Corp.* | | 68,233 | | | 1,117,656 |
DealerTrack Holdings, Inc.* | | 22,990 | | | 378,875 |
DemandTec, Inc.* | | 70,041 | | | 615,660 |
DG FastChannel, Inc.* | | 35,490 | | | 744,225 |
Digi International, Inc.* | | 31,428 | | | 249,853 |
Double-Take Software, Inc.* | | 24,300 | | | 225,261 |
DragonWave, Inc.* | | 16,800 | | | 133,896 |
DTS, Inc.* | | 16,890 | | | 477,142 |
Dynamics Research Corp.* | | 10,500 | | | 134,505 |
Ebix, Inc.* | | 7,335 | | | 451,836 |
EMS Technologies, Inc.* | | 60,520 | | | 1,054,864 |
Entegris, Inc.* | | 56,640 | | | 212,966 |
Forrester Research, Inc.* | | 50,264 | | | 1,273,187 |
Hackett Group, Inc., The* | | 30,500 | | | 95,160 |
iGATE Corp.* | | 52,320 | | | 461,986 |
Interactive Intelligence, Inc.* | | 23,800 | | | 399,126 |
IPG Photonics Corp.* | | 19,200 | | | 262,272 |
IXYS Corp.* | | 22,900 | | | 153,430 |
Knot, Inc., The* | | 48,000 | | | 512,160 |
Kulicke & Soffa Industries, Inc.* | | 66,600 | | | 309,690 |
LogMeIn, Inc.* | | 15,035 | | | 302,204 |
Maxwell Technologies, Inc.* | | 41,280 | | | 740,150 |
Mellanox Technologies, Ltd.* | | 48,613 | | | 848,297 |
Methode Electronics, Inc. | | 8,800 | | | 63,800 |
Mindspeed Technologies, Inc. | | 83,545 | | | 291,572 |
MIPS Technologies, Inc.* | | 60,375 | | | 238,481 |
Monolithic Power Systems, Inc.* | | 9,900 | | | 197,901 |
MTS Systems Corp. | | 14,000 | | | 371,000 |
Multi-Fineline Electronix, Inc.* | | 3,000 | | | 81,750 |
NCI, Inc., Class A* | | 27,714 | | | 745,784 |
Netezza Corp.* | | 45,600 | | | 421,344 |
NetLogic Microsystems, Inc.* | | 12,725 | | | 483,677 |
O2Micro International, Ltd.* | | 61,020 | | | 267,878 |
Online Resources Corp.* | | 93,740 | | | 492,135 |
OpenTable, Inc.* | | 17,000 | | | 419,220 |
OSI Systems, Inc.* | | 9,100 | | | 178,633 |
PC Connection, Inc.* | | 31,500 | | | 185,220 |
PDF Solutions, Inc.* | | 184,800 | | | 654,192 |
Perficient, Inc.* | | 37,200 | | | 302,808 |
Power Integrations, Inc. | | 6,645 | | | 207,324 |
PROS Holdings, Inc.* | | 63,900 | | | 574,461 |
Radiant Systems, Inc.* | | 71,800 | | | 706,512 |
Renaissance Learning, Inc. | | 8,300 | | | 75,364 |
Renesola, Ltd., (ADR)* | | 108,100 | | | 397,808 |
RightNow Technologies, Inc.* | | 18,100 | | | 276,206 |
S1 Corp.* | | 11,300 | | | 67,800 |
ShoreTel, Inc.* | | 51,200 | | | 336,384 |
SonicWALL, Inc.* | | 30,700 | | | 243,758 |
Sourcefire, Inc.* | | 15,285 | | | 310,286 |
Spectrum Control, Inc.* | | 28,100 | | | 237,445 |
Super Micro Computer, Inc.* | | 9,600 | | | 77,376 |
Supertex, Inc.* | | 29,550 | | | 716,588 |
Switch & Data Facilities Co., Inc.* | | 49,040 | | | 820,439 |
Symmetricom, Inc.* | | 27,292 | | | 130,729 |
Synchronoss Technologies, Inc.* | | 37,800 | | | 431,298 |
Taleo Corp.* | | 23,600 | | | 513,064 |
Terremark Worldwide, Inc.* | | 33,815 | | | 216,078 |
TESSCO Technologies, Inc. | | 5,000 | | | 84,750 |
The accompanying notes are an integral part of these financial statements.
18
Managers Fremont Micro-Cap Fund
Schedule of Portfolio Investments (continued)
| | | | | | |
| | | Shares | | Value | |
Information Technology - 23.3% (continued) | | | | | | |
Ultimate Software Group, Inc., The* | | 15,100 | | $ | 385,201 | |
VanceInfo Technologies, Inc., (ADR)* | | 20,800 | | | 314,080 | |
Veeco Instruments, Inc.* | | 16,100 | | | 392,035 | |
Virtusa Corp.* | | 71,910 | | | 645,752 | |
Volterra Semiconductor Corp.* | | 39,100 | | | 541,535 | |
White Electronic Designs Corp.* | | 31,200 | | | 136,968 | |
Total Information Technology | | | | | 29,707,792 | |
Materials - 2.0% | | | | | | |
Balchem Corp.* | | 32,795 | | | 904,814 | |
Brush Engineered Materials, Inc.* | | 3,500 | | | 64,575 | |
Buckeye Technologies, Inc.* | | 34,100 | | | 305,536 | |
Chemspec International, Ltd., (ADR)* | | 25,900 | | | 189,847 | |
ICO, Inc.* | | 35,900 | | | 137,856 | |
Koppers Holdings, Inc. | | 10,100 | | | 263,812 | |
Landec Corp.* | | 38,500 | | | 251,790 | |
Myers Industries, Inc. | | 15,400 | | | 135,058 | |
Quaker Chemical Corp. | | 7,500 | | | 154,500 | |
Universal Stainless & Alloy Products, Inc.* | | 9,000 | | | 135,810 | |
Zagg, Inc.* | | 7,190 | | | 40,264 | |
Total Materials | | | | | 2,583,862 | |
Telecommunication Services - 0.8% | | | | | | |
Cbeyond, Inc.* | | 20,605 | | | 275,077 | |
Neutral Tandem, Inc.* | | 23,855 | | | 503,102 | |
Shenandoah Telecommunications Co.* | | 11,949 | | | 199,429 | |
Total Telecommunication Services | | | | | 977,608 | |
Utilities - 0.6% | | | | | | |
American States Water Co. | | 7,200 | | | 238,680 | |
China Natural Gas, Inc.* | | 41,600 | | | 488,800 | |
Total Utilities | | | | | 727,480 | |
Total Common Stocks
(cost $119,600,731) | | | | | 123,953,653 | |
Short-Term Investments - 3.0%1 | | | | | | |
Dreyfus Cash Management Fund, Institutional Class Shares, 0.13% (cost $3,824,791) | | 3,824,791 | | | 3,824,791 | |
Total Investments - 100.4%
(cost $123,425,522) | | | | | 127,778,444 | |
Other Assets, less Liabilities - (0.4)% | | | | | (456,339 | ) |
Net Assets - 100.0% | | | | $ | 127,322,105 | |
The accompanying notes are an integral part of these financial statements.
19
Managers Fremont Institutional Micro-Cap Fund
Portfolio Manager’s Comments
The Managers Fremont Institutional Micro-Cap Fund primarily invests in the stocks of U.S. micro-capitalization companies. These companies have market capitalizations that, at the time of initial purchase, place them among the smallest 5% of companies listed on U.S. stock markets. Normally, the Fund will invest at least 80% of its assets in U.S. micro-cap stocks. The Fund employs multiple portfolio managers who specialize in distinct investment approaches. This “intelligence diversification” not only serves to manage risk, but also seeks to incorporate into the portfolio the breadth of the micro-cap market by focusing different analytical insights on micro-cap investing. The Fund’s team of subadvisors strive to achieve this performance and diversification while ensuring that the Fund operates within the framework of its investment objective and principal investment strategies. The Russell Micro-cap® Index is the benchmark for the Fund.
The Portfolio Managers
Lord, Abbett & Co., LLC (“Lord Abbett”)
The team focuses its stock selection effort by focusing on companies that have revenue growth of at least 15%, are experiencing year-to-year operating margin improvement and are experiencing earnings growth that is driven by top-line growth rather than being driven by one time events or simple cost-cutting measures. The focus is also on identifying companies with higher-quality balance sheets (often captured by finding companies with manageable debt-to-total-capital ratios) and that are already profitable. Once this process is completed, the focus for the team is on forecasting both revenue and earnings growth over the next several years. To achieve this goal, and to find companies that are expected to grow faster than their industry average, members of the team spend an extensive amount of time understanding the competitive advantages of a firm, the industry dynamics within which they operate, and the strength of management.
The sell discipline is enacted if there is a fundamental change in the business, a more attractive alternative is found, or if a holding reaches a 5% weight in the overall portfolio. The Lord Abbett portfolio typically holds between 75 and 100 stocks with no individual holding exceeding 5%. There is a risk constraint that prevents any individual industry from being greater than 25% of the total portfolio weight. The annual turnover of the portfolio is expected to be relatively high although there is no explicit target as part of either the stock selection or the portfolio-construction process.
Next Century Growth Investors, LLC (“Next Century”)
The team requires historical revenue growth of at least 15% for a company before conducting further research. Other key factors considered initially by the team are strong historical revenue growth, low debt and high ROE. Quantitative screening is done on a regular basis to see which stocks over the past year are experiencing significant growth. The next stage of this process involves intensive first-hand research to determine the growth prospects of a company with the team choosing a stock only when it has become convinced a company has an extraordinary opportunity to grow its business. The uniqueness of this process lies in the fact that the team seeks out these companies regardless of their short-term prospects and\or current valuation. The team is looking for “home runs” and companies that will grow to the point that they will eventually reach a small market capitalization.
The sell discipline is enacted if there is a change in the original investment thesis or a fundamental change in business of the company. In addition, a holding will become a candidate for sale if it reaches an extreme valuation, becomes larger than 5% of the overall portfolio or as it approaches $1 billion in market capitalization. Typically companies are sold out of the micro-cap portfolio because they have approached $1 billion in market capitalization.
The Next Century portfolio is concentrated and typically has 40-60 holdings, which can create a high level of volatility. The only risk constraints are that sector weights can not exceed two times the Russell 2000® Growth sector weights, and no individual holding can be greater than 5% of the portfolio.
Managers Investment Group LLC (“MIG”)
Effective August 31, 2009, the subadvisory agreement with respect to the Fund between the Fund’s investment manager, Managers Investment Group LLC (“MIG”), and OFI Institutional Asset Management, Inc. (“OFII”) was terminated. The portion of the Fund previously managed by the OFII portfolio management team of Daniel Goldfarb, Christopher Crooks, and Steven Dray (collectively, the “OFII Team”), who were jointly and primarily responsible for the day-to-day management of the portion of the Fund managed by OFII since December 10, 2007, is currently managed by MIG in its capacity as the investment manager to the Fund. MIG is employing a transition manager to assist with the management of assets formerly managed by the OFII Team. Keitha L. Kinne is primarily responsible for overseeing the transition manager and is primarily responsible for day-to-day management of the portfolio managed directly by MIG. The OFI Team joined AlphaOne on September 1, 2009 and acts as a consultant to MIG with respect to the portion of the Fund previously managed by the AlphaOne team at OFII. AlphaOne retains no authority over the Fund, and Ms. Kinne, on behalf of MIG, retains full discretion over the purchase and sale of investments for the portion of the Fund managed directly by MIG.
WEDGE Capital Management L.L.P. (“WEDGE”)
The investment process is a combination of both quantitative and fundamental research insights. The quantitative portion of the investment process uses commonly found factors and characteristics that can be accessed via any number of commercial databases. The value-added portion of the process, therefore, uses a number of different factors across five major categories: valuation, earnings quality, operating efficiency, capital usage and momentum, whose efficacy has been verified via long-term regression analysis. This is the Fundamental Value model. The top results of this model are combined with the best resulting stocks from the Financial Quality model, which measures stocks across categories such as multiple earnings growth, profitability, leverage and liquidity. The top stocks that appear in both models are eligible for fundamental research. The fundamental research portion of the investment process is exclusionary in nature and meant to eliminate stocks that are not strong in earnings forecasts, valuation metrics, sector\industry outlook or any factor that can not be easily captured quantitatively.
A stock is scrutinized for possible sale if it falls below the top four deciles in the Fundamental Value model. Stocks are sold when they become fairly valued, an upgrade opportunity develops or the original investment thesis materially deteriorates. The portfolio
20
Managers Fremont Institutional Micro-Cap Fund
Portfolio Manager’s Comments (continued)
managed by WEDGE is confined to plus or minus 10% in any given sector although sector positions tend to be much closer to the index weight than this (it should be noted that these self-imposed sector weighting constraints are based on a proprietary liquidity analysis conducted on an ongoing basis by the micro-cap team and is NOT driven by the sector weightings of any micro-cap benchmark). The final portfolio is a well diversified micro-cap portfolio holding approximately 150 securities and consistently maintaining a value bias relative to the benchmark. The portfolio tends to hold securities within the $40 million to $400 million market capitalization range, although does not require a sale of a holding until it reaches $800 million in market capitalization.
The Year in Review
The past twelve months will go down in the history books as one of the wildest rides in the history of Wall Street. Early in the period, securities markets were under severe pressure as the credit crises which began in the summer of 2007, accelerated in the fourth quarter of last year amid ongoing concerns about deteriorating economic conditions and the health of some of our most prominent financial institutions. Banks of all sizes remained under pressure, which led to continued consolidation within the industry. Wachovia agreed to sell itself to Wells Fargo & Co. while PNC agreed to acquire the troubled National City. Meanwhile, the U.S. Government attempted to stabilize the system by formally bailing out companies like Citigroup and by providing injections of capital into hundreds of other financial institutions. Like a sprawling fire, the crises extended to other industries with the automakers finding themselves on the verge of collapse. Once again, the U.S. Government stepped in and in late December President Bush approved an emergency bailout of the U.S. auto industry, offering $17.4 billion in rescue loans to Chrysler and General Motors with the expectation that the companies would move quickly to develop acceptable plans for long-term viability. Consumer and investor confidence continued to sink in the early part of 2009 despite the U.S. Government’s aggressive efforts to restore the economy and stabilize the financial markets. During January, February, and early March, stocks plunged, sending broad indexes to levels not seen since the mid to late 1990s. From peak (October 10, 2007) to trough (March 9, 2009), stocks, as measured by the S&P 500 Index, lost 55.5%, marking this Index’s steepest decline since the Great Depression. Then, on March 10, a very sharp recovery began amid preliminary signs that the Government’s efforts might be starting to bear fruit. More specifically, Citigroup, which had been under extreme pressure and was essentially bailed out by the Government, reported that it returned to profitability in the months of January and February. Citigroup’s surprising news seemed to ignite the markets, contributing to a more than 6% gain for the S&P 500 Index and set the stage for a sharp recovery in equities and extended the rally in credit sensitive fixed income securities.
For the 12 months that ended October 31, 2009, the Managers Fremont Institutional Micro-Cap Fund returned 11.4%, compared with 5.1% for its benchmark, the Russell Microcap® Index. Performance remains strong relative to both the Index and peers since the Fund was converted to a multi-manager, multi-style approach in early 2008. Solid outperformance over the last year has been driven by positive stock selection in several sectors including financials and information technology. In addition, the Fund has benefited from relative sector weightings versus the benchmark including a large underweight to the struggling financials sector and an overweight to the recovering consumer discretionary sector. The Fund’s growth subadvisors, in particular, performed well during this period as growth micro-cap stocks outperformed their value counterparts significantly.
Looking Forward
The portfolio managers are cautiously optimistic about the prospects of a recovery and are seeking to take advantage of further consolidation within several sectors by tilting the Fund towards those companies the portfolio managers believe are best positioned to increase market share. Although the Fund’s subadvisors remain fairly active, relative sector positioning has remained fairly consistent throughout the course of the last fiscal year with the major exception being the information technology sector, where strong performance resulted in the overweight position being reduced to a near neutral weight by the end of the period. Within the Fund, the largest overweight remains to the industrials sector and the largest underweight continues to remain to the financials sector.
Cumulative Total Return Performance
Managers Fremont Institutional Micro-Cap Fund’s cumulative total return is based on the daily change in net asset value (NAV), and assumes that all distributions were reinvested. The Russell 2000® Index is composed of the 2,000 smallest stocks in the Russell 3000® Index and is widely regarded in the industry as the premier measure of small-cap stock performance. This chart compares a
21
Managers Fremont Institutional Micro-Cap Fund
Portfolio Manager’s Comments (continued)
Cumulative Total Return Performance
hypothetical $10,000 investment made in the Managers Fremont Institutional Micro-Cap Fund on October 31, 1999, to a $10,000 investment made in the Russell 2000® Growth Index for the same time period. Performance for periods longer than one year is annualized. The graph and table do not reflect the deduction of taxes that a shareholder would pay on a Fund distribution or redemption of shares. The listed returns for the Fund are net of expenses and the returns for the index exclude expenses. Total returns for the Fund would have been lower had certain expenses not been reduced.
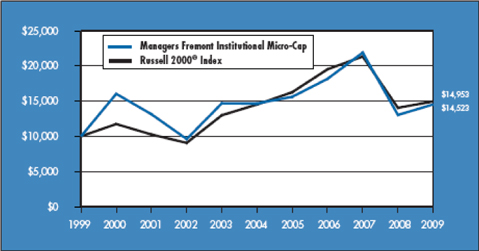
The table below shows the average annualized total returns for the Managers Fremont Institutional Micro-Cap Fund, the Russell Microcap® Index and the Russell 2000® Index for the one-year, five-year and ten-year periods ended October 31, 2009.
| | | | | | | | | |
Average Annual Total Returns 1,2 | | One Year | | | Five Years | | | Ten Years | |
Managers Fremont Institutional Micro-Cap 4 | | 11.44 | % | | (0.18 | )% | | 3.80 | % |
Russell Microcap® Index 3 | | 5.06 | % | | (2.57 | )% | | — | 5 |
Russell 2000® Index 6 | | 6.46 | % | | 0.59 | % | | 4.11 | % |
The performance data shown represents past performance. Past performance is not a guarantee of future results. Current performance may be lower or higher than the performance data quoted. The investment return and principal value of an investment in the Fund will fluctuate so that an investor’s shares, when redeemed, may be worth more or less than their original cost. For performance information through the most recent month end, please call (800) 835-3879 or visit our Web site at www.managersinvest.com.
In choosing a Fund, investors should carefully consider the amount they plan to invest, their investment objectives, the Fund’s investment objectives, risks, charges and expenses before investing. For this and other information, please call (800) 835-3879 or visit www.managersinvest.com for a free prospectus. Read it carefully before investing or sending money. Distributed by Managers Distributors, Inc., member FINRA.
| 1 | Total return equals income yield plus share price change and assumes reinvestment of all dividends and capital gain distributions. Returns are net of fees and may reflect offsets of Fund expenses as described in the Prospectus. No adjustment has been made for taxes payable by shareholders on their reinvested dividends and capital gain distributions. Returns for periods greater than one year are annualized. The listed returns on the Fund are net of expenses and based on the published NAV as of October 31, 2009. All returns are in U.S. dollars($). |
| 2 | The Funds are subject to the special risks associated with investments in micro-cap companies, such as relatively short earnings histories, competitive conditions, less publicly available corporate information, and reliance on a limited number of products. |
| 3 | Russell Microcap® Index tracks the micro-cap segment of the U.S. equity market. It makes up less than 3% of the U.S. Equity market and is represented by the smallest 1,000 securities in the small-cap Russell 2000® Index plus the next 1,000 securities. The Index reflects no deduction of fees, expenses, or taxes. |
| 4 | Fund for which, from time to time, the advisor has waived its fees and/or absorbed Fund expenses, which has resulted in higher returns. |
| 5 | Since the Russell Microcap® Index’s inception date of June 30, 2000, the average annual total return for the Index was 2.45%. |
| 6 | Russell 2000® Index is composed of the 2,000 smallest stocks in the Russell 3000® Index and is widely regarded in the industry as the premier measure of small-cap stock performance. The Index reflects no deduction of fees, expenses, or taxes. |
The Russell Microcap® Index and the Russell 2000® Index are registered trademarks of Russell Investments. Russell® is a trademark of Russell Investments.
Not FDIC insured, nor bank guaranteed. May lose value.
22
Managers Fremont Institutional Micro-Cap Fund
Fund Snapshots
October 31, 2009
Portfolio Breakdown
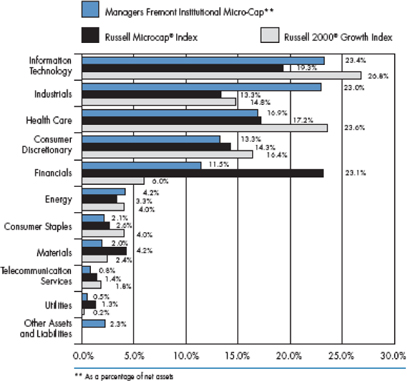
| | | | | | | | | |
Industry | | Managers Fremont
Institutional
Micro-Cap** | | | Russell
Microcap®
Index | | | Russell 2000®
Growth
Index | |
Information Technology | | 23.4 | % | | 19.3 | % | | 26.8 | % |
Industrials | | 23.0 | % | | 13.3 | % | | 14.8 | % |
Health Care | | 16.9 | % | | 17.2 | % | | 23.6 | % |
Consumer Discretionary | | 13.3 | % | | 14.3 | % | | 16.4 | % |
Financials | | 11.5 | % | | 23.1 | % | | 6.0 | % |
Energy | | 4.2 | % | | 3.3 | % | | 4.0 | % |
Consumer Staples | | 2.1 | % | | 2.6 | % | | 4.0 | % |
Materials | | 2.0 | % | | 4.2 | % | | 2.4 | % |
Telecommunication Services | | 0.8 | % | | 1.4 | % | | 1.8 | % |
Utilities | | 0.5 | % | | 1.3 | % | | 0.2 | % |
Other Assets and Liabilities | | 2.3 | % | | 0.0 | % | | 0.0 | % |
Top Ten Holdings
| | | |
Security Name | | Percentage of Net
Assets | |
LaBarge, Inc.* | | 1.2 | % |
Bio-Reference Laboratories, Inc.* | | 1.2 | |
Great Lakes Dredge & Dock Corp. | | 1.1 | |
U.S. Physical Therapy, Inc.* | | 1.0 | |
Forrester Research, Inc. | | 1.0 | |
HMS Holdings Corp.* | | 1.0 | |
CyberSource Corp.* | | 0.9 | |
Standard Parking Corp. | | 0.9 | |
MWI Veterinary Supply, Inc.* | | 0.9 | |
Carrizo Oil & Gas, Inc. | | 0.9 | |
| | | |
Top Ten as a Group | | 10.1 | % |
| | | |
| * | Top Ten at April 30, 2009 |
Any sectors, industries, or securities discussed should not be perceived as investment recommendations. Mention of a specific security should not be considered a recommendation to buy or solicitation to sell that security. Specific securities mentioned in this report may have been sold from the Fund’s portfolio of investments by the time you receive this report.
23
Managers Fremont Institutional Micro-Cap Fund
Schedule of Portfolio Investments
October 31, 2009
| | | | | |
| | | Shares | | Value |
Common Stocks - 97.7% | | | | | |
Consumer Discretionary - 13.3% | | | | | |
Ambassadors Group, Inc. | | 12,280 | | $ | 156,079 |
America’s Car-Mart, Inc.* | | 3,800 | | | 78,774 |
Amerigon, Inc.* | | 5,540 | | | 35,622 |
BJ’s Restaurants, Inc.* | | 7,295 | | | 116,428 |
Bridgepoint Education, Inc.* | | 3,450 | | | 48,921 |
Buffalo Wild Wings, Inc.* | | 3,675 | | | 150,712 |
Cache, Inc.* | | 10,531 | | | 50,654 |
California Pizza Kitchen, Inc.* | | 5,550 | | | 72,094 |
Chinacast Education Corp.* | | 5,700 | | | 35,454 |
Citi Trends, Inc.* | | 3,031 | | | 79,806 |
CKE Restaurants, Inc. | | 2,750 | | | 24,062 |
Core-Mark Holding Co., Inc.* | | 983 | | | 26,905 |
CSS Industries, Inc. | | 1,838 | | | 37,311 |
FGX International Holdings, Ltd.* | | 7,063 | | | 93,161 |
Grand Canyon Education, Inc.* | | 2,445 | | | 39,658 |
Hawk Corp., Class A* | | 2,000 | | | 27,840 |
hhgregg, Inc.* | | 12,325 | | | 203,239 |
Hibbett Sports, Inc.* | | 4,089 | | | 76,628 |
Home Inns & Hotels Management Inc., (ADR)* | | 1,500 | | | 39,870 |
Hooker Furniture Corp. | | 2,097 | | | 26,863 |
IMAX Corp.* | | 6,644 | | | 68,433 |
Jo-Ann Stores, Inc.* | | 1,225 | | | 32,610 |
K12, Inc.* | | 800 | | | 12,832 |
Kenneth Cole Productions, Inc. | | 4,528 | | | 43,061 |
Learning Tree International, Inc.* | | 2,300 | | | 25,024 |
Lincoln Educational Services Corp.* | | 1,360 | | | 26,955 |
Lumber Liquidators, Inc.* | | 7,880 | | | 167,450 |
Maidenform Brands, Inc.* | | 3,425 | | | 48,087 |
Marcus Corp., The | | 2,150 | | | 25,155 |
McCormick & Schmick’s Seafood Restaurants, Inc.* | | 9,345 | | | 56,257 |
Midas, Inc.* | | 3,004 | | | 24,212 |
Monro Muffler Brake, Inc. | | 3,926 | | | 121,667 |
Morton’s Restaurant Group, Inc.* | | 3,300 | | | 12,342 |
Movado Group, Inc. | | 6,972 | | | 73,067 |
New York & Company, Inc.* | | 8,300 | | | 36,520 |
Peet’s Coffee & Tea, Inc.* | | 2,225 | | | 75,650 |
Pinnacle Entertainment, Inc.* | | 12,138 | | | 102,566 |
RC2 Corp.* | | 930 | | | 12,146 |
Rentrak Corp.* | | 895 | | | 13,756 |
Shutterfly, Inc.* | | 7,950 | | | 112,095 |
Steiner Leisure, Ltd.* | | 3,233 | | | 119,492 |
Summer Infant, Inc.* | | 9,255 | | | 46,090 |
The Finish Line, Inc., Class A | | 2,750 | | | 27,885 |
True Religion Apparel, Inc.* | | 3,125 | | | 80,531 |
Universal Electronics, Inc.* | | 2,458 | | | 50,635 |
Vitacost.com, Inc.* | | 6,300 | | | 62,496 |
Volcom, Inc.* | | 5,400 | | | 89,694 |
Westport Innovations, Inc.* | | 7,400 | | | 72,372 |
Wonder Auto Technology, Inc.* | | 3,200 | | | 41,408 |
Zumiez, Inc.* | | 5,200 | | | 70,044 |
Total Consumer Discretionary | | | | | 3,170,613 |
Consumer Staples - 2.1% | | | | | |
Andersons, Inc., The | | 875 | | | 27,151 |
Boston Beer Co., Inc.* | | 800 | | | 30,400 |
China-Biotics, Inc.* | | 3,500 | | | 40,600 |
Diedrich Coffee, Inc.* | | 3,290 | | | 71,722 |
Elizabeth Arden, Inc.* | | 4,312 | | | 45,923 |
Inter Parfums, Inc. | | 1,211 | | | 14,871 |
J&J Snack Foods Corp. | | 1,079 | | | 42,264 |
Medifast, Inc.* | | 2,130 | | | 46,903 |
Nutraceutical International Corp.* | | 1,283 | | | 13,959 |
Pantry, Inc., The* | | 1,800 | | | 25,398 |
Rocky Mountain Chocolate Factory, Inc. | | 1,654 | | | 14,092 |
Smart Balance, Inc.* | | 19,168 | | | 101,207 |
Susser Holdings Corp.* | | 2,350 | | | 27,942 |
Total Consumer Staples | | | | | 502,432 |
Energy - 4.2% | | | | | |
Bolt Technology Corp.* | | 1,200 | | | 12,204 |
Carrizo Oil & Gas, Inc.* | | 9,070 | | | 210,243 |
Clean Energy Fuels Corp.* | | 8,200 | | | 95,120 |
Dawson Geophysical Co.* | | 1,105 | | | 26,686 |
Gulf Island Fabrication, Inc. | | 3,196 | | | 61,108 |
Natural Gas Services Group, Inc.* | | 3,200 | | | 53,984 |
Northern Oil & Gas, Inc.* | | 17,770 | | | 162,062 |
Panhandle Oil and Gas, Inc. | | 1,350 | | | 26,541 |
PetroQuest Energy, Inc.* | | 6,905 | | | 42,328 |
RPC, Inc. | | 18,275 | | | 170,871 |
Tetra Technologies, Inc.* | | 6,625 | | | 62,672 |
TGC Industries, Inc. | | 6,838 | | | 29,745 |
The accompanying notes are an integral part of these financial statements.
24
Managers Fremont Institutional Micro-Cap Fund
Schedule of Portfolio Investments (continued)
| | | | | |
| | | Shares | | Value |
Energy - 4.2% (continued) | | | | | |
Union Drilling, Inc.* | | 6,103 | | $ | 46,627 |
Total Energy | | | | | 1,000,191 |
Financials - 11.5% | | | | | |
Alliance Financial Corp. | | 550 | | | 14,322 |
American Physicians Capital, Inc. | | 1,773 | | | 50,140 |
American Safety Insurance Holdings, Ltd.* | | 850 | | | 12,597 |
Amerisafe, Inc.* | | 3,940 | | | 73,048 |
Associated Estates Realty Corp. | | 2,843 | | | 25,928 |
Baldwin & Lyons, Inc. | | 609 | | | 13,891 |
Bancorp Rhode Island, Inc. | | 4,610 | | | 117,647 |
Bank of Marin Bancorp | | 1,400 | | | 46,214 |
Bar Harbor Bankshares | | 450 | | | 12,780 |
Broadpoint Gleacher Securities Group, Inc.* | | 9,360 | | | 59,623 |
Bryn Mawr Bank Corp. | | 4,550 | | | 72,800 |
Columbia Banking System, Inc. | | 6,473 | | | 95,153 |
Community Trust Bancorp, Inc. | | 1,961 | | | 48,280 |
Cowen Group, Inc.* | | 17,117 | | | 129,233 |
Danvers Bancorp, Inc. | | 11,233 | | | 154,230 |
Donegal Group, Inc. | | 6,956 | | | 101,559 |
Eastern Insurance Holdings, Inc. | | 2,620 | | | 18,497 |
ESB Financial Corp. | | 950 | | | 11,077 |
ESSA Bancorp, Inc. | | 1,100 | | | 13,167 |
Evercore Partners, Inc., Class A | | 1,600 | | | 52,224 |
Financial Institutions, Inc. | | 11,315 | | | 119,486 |
First Cash Financial Services, Inc.* | | 2,803 | | | 48,156 |
First Community Bancshares, Inc. | | 4,430 | | | 51,565 |
First Mercury Financial Corp. | | 2,100 | | | 26,670 |
First of Long Island Corp., The | | 1,100 | | | 26,587 |
Hallmark Financial Services, Inc.* | | 3,825 | | | 29,338 |
Iberia Bank Corp. | | 3,259 | | | 141,147 |
Independent Bank Corp. (MA) | | 1,990 | | | 42,327 |
JMP Group, Inc. | | 4,300 | | | 36,206 |
Legacy Bancorp, Inc. | | 13,620 | | | 130,207 |
Meadowbrook Insurance Group, Inc. | | 9,983 | | | 67,186 |
Mercer Insurance Group, Inc. | | 1,600 | | | 29,728 |
Mission West Properties, Inc. | | 2,044 | | | 13,593 |
National Bankshares, Inc. | | 1,700 | | | 46,087 |
National Interstate Corp. | | 800 | | | 14,488 |
OceanFirst Financial Corp., Inc. | | 12,575 | | | 119,462 |
Penson Worldwide, Inc.* | | 18,615 | | | 181,497 |
Ramco-Gershenson Properties Trust | | 1,650 | | | 14,586 |
S.Y. Bancorp, Inc. | | 2,390 | | | 53,416 |
SCBT Financial Corp. | | 1,040 | | | 26,905 |
Shore Bancshares, Inc. | | 750 | | | 12,232 |
Simmons First National Corp., Class A | | 1,450 | | | 42,427 |
Smithtown Bancorp, Inc. | | 2,652 | | | 27,448 |
Southside Bancshares, Inc. | | 2,276 | | | 47,318 |
Texas Capital Bancshares, Inc.* | | 3,400 | | | 49,538 |
Urstadt Biddle Properties, Inc., Class A | | 1,850 | | | 27,324 |
ViewPoint Financial Group | | 1,050 | | | 14,070 |
Washington Trust Bancorp, Inc. | | 1,400 | | | 21,028 |
Webster Financial Corp. | | 8,600 | | | 97,266 |
WSFS Financial Corp. | | 1,700 | | | 46,920 |
Total Financials | | | | | 2,726,618 |
Health Care - 16.9% | | | | | |
Addus HomeCare Corp.* | | 6,000 | | | 54,900 |
Allos Therapeutics, Inc.* | | 4,700 | | | 26,555 |
ATS Medical, Inc.* | | 9,800 | | | 26,362 |
Bio-Reference Laboratories, Inc.* | | 9,036 | | | 292,134 |
Cardiovascular Systems, Inc.* | | 6,100 | | | 29,829 |
Clarient, Inc.* | | 15,480 | | | 50,155 |
Conceptus, Inc.* | | 5,730 | | | 100,504 |
Cyberonics, Inc.* | | 3,400 | | | 49,164 |
Cypress Bioscience, Inc.* | | 6,000 | | | 36,840 |
DexCom, Inc.* | | 14,500 | | | 99,470 |
Endologix, Inc.* | | 40,305 | | | 191,852 |
Ensign Group, Inc., The | | 1,975 | | | 29,190 |
eResearch Technology, Inc.* | | 6,550 | | | 48,470 |
Eurand N.V.* | | 5,788 | | | 76,517 |
Exactech, Inc.* | | 9,528 | | | 142,920 |
Genomic Health, Inc.* | | 2,100 | | | 38,997 |
Genoptix, Inc.* | | 1,997 | | | 69,476 |
Hanger Orthopedic Group, Inc.* | | 13,842 | | | 191,573 |
Harvard Bioscience, Inc.* | | 21,200 | | | 76,744 |
HMS Holdings Corp.* | | 5,575 | | | 239,335 |
Home Diagnostics, Inc.* | | 1,892 | | | 11,825 |
Insulet Corp.* | | 13,300 | | | 147,630 |
IPC The Hospitalist Co., Inc.* | | 2,400 | | | 72,720 |
Kensey Nash Corp.* | | 1,050 | | | 25,106 |
Landauer, Inc. | | 771 | | | 39,930 |
LHC Group, Inc.* | | 937 | | | 26,152 |
The accompanying notes are an integral part of these financial statements.
25
Managers Fremont Institutional Micro-Cap Fund
Schedule of Portfolio Investments (continued)
| | | | | |
| | | Shares | | Value |
Health Care - 16.9% (continued) | | | | | |
MAKO Surgical Corp.* | | 6,600 | | $ | 59,730 |
Medical Action Industries, Inc.* | | 3,511 | | | 38,410 |
MEDTOX Scientific, Inc.* | | 20,500 | | | 204,590 |
Merit Medical Systems, Inc.* | | 9,903 | | | 168,153 |
MWI Veterinary Supply, Inc.* | | 6,200 | | | 219,480 |
Neogen Corp.* | | 5,141 | | | 162,970 |
NxStage Medical, Inc.* | | 14,200 | | | 79,236 |
Obagi Medical Products, Inc.* | | 2,800 | | | 28,616 |
Odyssey HealthCare, Inc.* | | 1,050 | | | 14,637 |
Optimer Pharmaceuticals, Inc.* | | 4,300 | | | 49,708 |
Orthovita, Inc.* | | 8,600 | | | 30,100 |
Phase Forward, Inc.* | | 2,100 | | | 27,531 |
Psychemedics Corp. | | 11,182 | | | 60,495 |
Questcor Pharmaceuticals, Inc.* | | 5,400 | | | 24,516 |
Res-Care, Inc.* | | 3,740 | | | 44,992 |
Somanetics Corp.* | | 4,800 | | | 71,760 |
SXC Health Solutions Corp.* | | 2,365 | | | 108,032 |
U.S. Physical Therapy, Inc.* | | 17,542 | | | 246,290 |
Vanda Pharmaceuticals, Inc.* | | 4,528 | | | 46,186 |
Viropharma, Inc.* | | 5,100 | | | 38,454 |
Volcano Corp.* | | 568 | | | 8,151 |
Young Innovations, Inc. | | 1,037 | | | 24,525 |
Zoll Medical Corp.* | | 2,700 | | | 52,434 |
Total Health Care | | | | | 4,003,346 |
Industrials - 23.0% | | | | | |
51job, Inc., (ADR)* | | 5,600 | | | 83,440 |
AAON, Inc. | | 1,400 | | | 25,214 |
AeroVironment, Inc.* | | 1,614 | | | 43,029 |
Alamo Group, Inc. | | 1,709 | | | 23,413 |
Altra Holdings, Inc.* | | 12,842 | | | 112,624 |
American Ecology Corp. | | 7,646 | | | 127,077 |
Ameron International Corp. | | 925 | | | 54,556 |
Ampco-Pittsburgh Corp. | | 1,600 | | | 43,040 |
Apogee Enterprises, Inc. | | 1,920 | | | 25,421 |
Applied Signal Technology, Inc. | | 1,043 | | | 21,371 |
AZZ, Inc.* | | 2,357 | | | 80,751 |
Barrett Business Services, Inc. | | 3,910 | | | 45,356 |
Cascade Corp. | | 1,675 | | | 41,607 |
CBIZ, Inc.* | | 25,257 | | | 177,809 |
Celadon Group, Inc.* | | 3,557 | | | 34,716 |
Chart Industries, Inc.* | | 6,660 | | | 131,668 |
Colfax Corp.* | | 4,600 | | | 50,048 |
Columbus McKinnon Corp.* | | 3,050 | | | 50,478 |
Comfort Systems USA, Inc. | | 2,250 | | | 24,525 |
Courier Corp. | | 2,572 | | | 38,143 |
CRA International, Inc.* | | 3,650 | | | 90,338 |
Ducommun, Inc. | | 2,925 | | | 49,784 |
Duoyuan Global Water, Inc., (ADR)* | | 1,800 | | | 59,004 |
DXP Enterprises, Inc.* | | 12,515 | | | 143,672 |
Dynamex, Inc.* | | 2,694 | | | 49,920 |
Dynamic Materials Corp. | | 2,155 | | | 41,548 |
Energy Recovery, Inc.* | | 2,100 | | | 11,718 |
EnerNOC, Inc.* | | 4,000 | | | 114,920 |
Ennis, Inc. | | 1,900 | | | 28,785 |
EnPro Industries, Inc.* | | 2,000 | | | 45,160 |
Exponent, Inc.* | | 7,390 | | | 192,214 |
Furmanite Corp.* | | 10,625 | | | 38,038 |
GP Strategies Corp.* | | 21,091 | | | 148,481 |
Great Lakes Dredge & Dock Corp. | | 41,892 | | | 256,798 |
Harbin Electric, Inc.* | | 3,500 | | | 55,755 |
Hill International, Inc.* | | 21,600 | | | 145,152 |
ICF International, Inc.* | | 2,385 | | | 68,330 |
II-VI, Inc.* | | 6,166 | | | 163,214 |
Kforce, Inc.* | | 6,500 | | | 76,245 |
Kimball International, Inc., Class B | | 1,850 | | | 13,875 |
Knight Transportation, Inc. | | 6,558 | | | 105,190 |
Knoll, Inc. | | 5,650 | | | 55,370 |
LaBarge, Inc.* | | 26,728 | | | 296,681 |
LB Foster Co., Class A* | | 850 | | | 23,868 |
LMI Aerospace, Inc.* | | 8,677 | | | 93,451 |
LSI Industries, Inc. | | 7,257 | | | 50,726 |
Marten Transport, Ltd.* | | 8,574 | | | 150,388 |
Met-Pro Corp. | | 3,675 | | | 33,810 |
Michael Baker Corp.* | | 1,600 | | | 57,120 |
Multi-Color Corp. | | 13,896 | | | 184,400 |
MYR Group, Inc.* | | 3,700 | | | 63,566 |
Old Dominion Freight Line, Inc.* | | 2,499 | | | 64,949 |
On Assignment, Inc.* | | 10,939 | | | 66,072 |
Orion Marine Group, Inc.* | | 8,865 | | | 168,790 |
Raven Industries, Inc. | | 3,850 | | | 95,095 |
RBC Bearings, Inc.* | | 1,700 | | | 36,567 |
Saia, Inc.* | | 3,591 | | | 52,644 |
SmartHeat, Inc.* | | 6,500 | | | 58,110 |
The accompanying notes are an integral part of these financial statements.
26
Managers Fremont Institutional Micro-Cap Fund
Schedule of Portfolio Investments (continued)
| | | | | |
| | | Shares | | Value |
Industrials - 23.0% (continued) | | | | | |
Spherion Corp.* | | 2,225 | | $ | 11,014 |
Standard Parking Corp.* | | 12,482 | | | 219,683 |
Sterling Construction, Inc.* | | 7,860 | | | 126,782 |
Titan Machinery, Inc.* | | 9,513 | | | 102,074 |
TrueBlue, Inc. | | 4,400 | | | 53,240 |
Universal Truckload Services, Inc. | | 1,450 | | | 23,838 |
UQM Technologies, Inc.* | | 10,075 | | | 47,352 |
Vitran Corp., Inc., Class A* | | 20,441 | | | 174,975 |
Volt Information Sciences, Inc.* | | 2,625 | | | 21,289 |
Total Industrials | | | | | 5,464,281 |
Information Technology - 23.4% | | | | | |
3PAR, Inc.* | | 6,200 | | | 58,342 |
Actuate Corp.* | | 6,888 | | | 34,509 |
Anadigics, Inc.* | | 11,500 | | | 36,915 |
Anaren Microwave, Inc.* | | 3,100 | | | 45,322 |
Applied Micro Circuits Corp.* | | 7,755 | | | 60,644 |
Aruba Networks, Inc.* | | 8,495 | | | 66,431 |
Bel Fuse, Inc. | | 2,259 | | | 40,888 |
Cavium Networks, Inc.* | | 2,500 | | | 47,400 |
CommVault Systems, Inc.* | | 2,600 | | | 51,220 |
Compellent Technologies, Inc.* | | 10,210 | | | 187,251 |
Computer Task Group, Inc.* | | 2,100 | | | 14,637 |
Constant Contact, Inc.* | | 4,605 | | | 76,305 |
CTS Corp. | | 5,920 | | | 53,043 |
CyberSource Corp.* | | 13,465 | | | 220,557 |
DealerTrack Holdings, Inc.* | | 4,360 | | | 71,853 |
DemandTec, Inc.* | | 13,906 | | | 122,234 |
DG FastChannel, Inc.* | | 6,725 | | | 141,023 |
Digi International, Inc.* | | 6,105 | | | 48,535 |
Double-Take Software, Inc.* | | 4,650 | | | 43,106 |
DragonWave, Inc.* | | 2,900 | | | 23,113 |
DTS, Inc.* | | 3,205 | | | 90,541 |
Dynamics Research Corp.* | | 2,100 | | | 26,901 |
Ebix, Inc.* | | 1,395 | | | 85,932 |
EMS Technologies, Inc.* | | 11,793 | | | 205,552 |
Entegris, Inc.* | | 10,740 | | | 40,382 |
Forrester Research, Inc.* | | 9,622 | | | 243,726 |
Hackett Group, Inc.* | | 5,300 | | | 16,536 |
iGATE Corp.* | | 9,914 | | | 87,541 |
Interactive Intelligence, Inc.* | | 4,000 | | | 67,080 |
IPG Photonics Corp.* | | 6,300 | | | 86,058 |
IXYS Corp.* | | 3,937 | | | 26,378 |
Knot, Inc., The* | | 8,100 | | | 86,427 |
Kulicke & Soffa Industries, Inc.* | | 10,900 | | | 50,685 |
LogMeIn, Inc.* | | 2,850 | | | 57,285 |
Maxwell Technologies, Inc.* | | 7,395 | | | 132,592 |
Mellanox Technologies, Ltd.* | | 9,734 | | | 169,858 |
Methode Electronics, Inc. | | 1,543 | | | 11,187 |
Mindspeed Technologies, Inc. | | 15,835 | | | 55,264 |
MIPS Technologies, Inc.* | | 11,450 | | | 45,228 |
Monolithic Power Systems, Inc.* | | 1,800 | | | 35,982 |
MTS Systems Corp. | | 2,876 | | | 76,214 |
Multi-Fineline Electronix, Inc.* | | 500 | | | 13,625 |
NCI, Inc., Class A* | | 5,534 | | | 148,920 |
Netezza Corp.* | | 7,500 | | | 69,300 |
NetLogic Microsystems, Inc.* | | 2,415 | | | 91,794 |
O2Micro International, Ltd.* | | 11,570 | | | 50,792 |
Online Resources Corp.* | | 20,345 | | | 106,811 |
OpenTable, Inc.* | | 3,000 | | | 73,980 |
OSI Systems, Inc.* | | 1,550 | | | 30,426 |
PC Connection, Inc.* | | 4,746 | | | 27,906 |
PDF Solutions, Inc.* | | 40,653 | | | 143,912 |
Perficient, Inc.* | | 6,000 | | | 48,840 |
Power Integrations, Inc. | | 1,260 | | | 39,312 |
PROS Holdings, Inc.* | | 10,500 | | | 94,395 |
Radiant Systems, Inc.* | | 14,800 | | | 145,632 |
Renaissance Learning, Inc. | | 1,242 | | | 11,277 |
Renesola, Ltd., (ADR)* | | 18,400 | | | 67,712 |
RightNow Technologies, Inc.* | | 4,100 | | | 62,566 |
S1 Corp.* | | 1,950 | | | 11,700 |
ShoreTel, Inc.* | | 8,400 | | | 55,188 |
SonicWALL, Inc.* | | 5,975 | | | 47,442 |
Sourcefire, Inc.* | | 2,900 | | | 58,870 |
Spectrum Control, Inc.* | | 5,014 | | | 42,368 |
Super Micro Computer, Inc.* | | 1,961 | | | 15,806 |
Supertex, Inc.* | | 5,880 | | | 142,590 |
Switch & Data Facilities Co., Inc.* | | 9,302 | | | 155,622 |
Symmetricom, Inc.* | | 5,300 | | | 25,387 |
Synchronoss Technologies, Inc.* | | 6,200 | | | 70,742 |
Taleo Corp.* | | 4,000 | | | 86,960 |
Terremark Worldwide, Inc.* | | 6,410 | | | 40,960 |
TESSCO Technologies, Inc. | | 875 | | | 14,831 |
Ultimate Software Group, Inc., The* | | 2,600 | | | 66,326 |
The accompanying notes are an integral part of these financial statements.
27
Managers Fremont Institutional Micro-Cap Fund
Schedule of Portfolio Investments (continued)
| | | | | | |
| | | Shares | | Value | |
Information Technology - 23.4% (continued) | | | | | | |
VanceInfo Technologies, Inc., (ADR)* | | 3,600 | | $ | 54,360 | |
Veeco Instruments, Inc.* | | 2,700 | | | 65,745 | |
Virtusa Corp.* | | 13,385 | | | 120,197 | |
Volterra Semiconductor Corp.* | | 7,415 | | | 102,698 | |
White Electronic Designs Corp.* | | 5,494 | | | 24,119 | |
Total Information Technology | | | | | 5,569,788 | |
Materials - 2.0% | | | | | | |
Balchem Corp.* | | 6,528 | | | 180,108 | |
Brush Engineered Materials, Inc.* | | 625 | | | 11,531 | |
Buckeye Technologies, Inc.* | | 5,389 | | | 48,285 | |
Chemspec International, Ltd., (ADR)* | | 4,700 | | | 34,451 | |
ICO, Inc.* | | 6,225 | | | 23,904 | |
Koppers Holdings, Inc. | | 1,600 | | | 41,792 | |
Landec Corp.* | | 6,650 | | | 43,491 | |
Myers Industries, Inc. | | 2,650 | | | 23,240 | |
Quaker Chemical Corp. | | 1,250 | | | 25,750 | |
Universal Stainless & Alloy Products, Inc.* | | 1,575 | | | 23,767 | |
Zagg, Inc.* | | 1,430 | | | 8,008 | |
Total Materials | | | | | 464,327 | |
Telecommunication Services - 0.8% | | | | | | |
Cbeyond, Inc.* | | 3,910 | | | 52,198 | |
Neutral Tandem, Inc.* | | 4,520 | | | 95,328 | |
Shenandoah Telecommunications Co.* | | 2,363 | | | 39,438 | |
Total Telecommunication Services | | | | | 186,964 | |
Utilities - 0.5% | | | | | | |
American States Water Co. | | 1,234 | | | 40,907 | |
China Natural Gas, Inc.* | | 7,000 | | | 82,250 | |
Total Utilities | | | | | 123,157 | |
Total Common Stocks
(cost $22,860,494) | | | | | 23,211,717 | |
Short-Term Investments - 4.5%1 | | | | | | |
Dreyfus Cash Management Fund, Institutional Class Shares, 0.13% (cost $1,063,910) | | 1,063,910 | | | 1,063,910 | |
Total Investments - 102.2%
(cost $23,924,404) | | | | | 24,275,627 | |
Other Assets, less Liabilities - (2.2)% | | | | | (513,203 | ) |
Net Assets - 100.0% | | | | $ | 23,762,424 | |
The accompanying notes are an integral part of these financial statements.
28
Managers Real Estate Securities Fund
Portfolio Manager’s Comments
Managers Real Estate Securities Fund seeks a combination of income and long-term capital appreciation by investing in stocks of companies that are principally engaged in owning and operating commercial real estate properties for the benefit of their investors, including Real Estate Investment Trusts (REIT’s). Managers utilizes an independent subadvisor, Urdang Securities Management, Inc (“Urdang”), to manage the assets of this portfolio.
The Portfolio Manager
Urdang Securities Management, Inc.
The investment team at Urdang believes real estate securities play an important role in a multi-asset class investment portfolio. Urdang’s strategy recognizes that real estate securities are not simply stocks, or real estate. They are hybrid financial investments that must be valued on the basis of a number of meaningful factors, only one of which is the value of the firm’s property portfolio. To accurately assess the relative value of a REIT security, Urdang takes into account critical business and market factors, such as: the company’s capitalization, its position within public capital markets, and the quality of the management team.
Urdang believes that investment success is the result of the company’s ability to provide a consistently accurate answer to the question at the heart of its value-oriented investment strategy: Which REITs do they believe will generate the highest risk-adjusted returns? Urdang believes that a diversified portfolio with a value orientation will result in strong risk-adjusted returns.
Urdang employs a value-oriented investment process with two distinct and complementary components: bottom-up real estate research and the company’s proprietary Relative Value Model (RVM) securities valuation process, which was designed to provide a uniform basis for evaluating the validity of a security’s trading price. Combining real estate research and the RVM process has been central to Urdang’s track record of delivering strong returns without incurring high levels of risk.
The Year in Review
For the 12 months that ended October 31, 2009, the Managers Real Estate Securities Fund returned 5.8%, compared with -0.3% for its benchmark, the Dow Jones U.S. Select REIT Index.
The solid relative performance has helped to contribute to solid longer-term results including performance over the last five years that places the Fund in the top decile amongst peers. The strong relative performance over the past fiscal year has been primarily driven by good stock selection in several areas of the REIT market. Early on, the primary contributors were within the office, shopping center, and healthcare sectors. In the latter half of the fiscal year, the Fund was able to keep pace with the benchmark as the REIT market rallied. The rally was led by low-quality issues while the Fund tends to focus on their high-quality counterparts; however, the solid stock selection exhibited earlier in the year helped after the market turn and enabled the Fund to overcome the headwinds of the lower-quality rally.
Urdang believes that investors have extended their investment horizons beyond near-term earnings weakness when valuing stocks. Equity and debt capital has become plentiful for the REITs, leaving Urdang with little doubt that REITs will survive the credit crisis and will remain a preferred vehicle for real estate investment. Urdang believes that stress in the private real estate market on both the capital and operating side will continue to be significant and that REITs will potentially be well positioned to profit from the inevitable fallout through acquisitions of quality assets at attractive prices from distressed private owners. Considering the strong recovery REIT share prices have experienced this past year, it is clear to Urdang that investors expect significant external growth resulting from the fallout. Urdang anticipates flat to only modest total returns for the remainder of calendar year 2009 and into early 2010 with the majority of the return anticipated to be from the low 4% current cash dividend yield. Beyond this short horizon, Urdang expects REITs to generate total returns consistent with their long-run historical average in the high-single to low-double digit range.
Looking Forward
The Fund is overweight high-quality REITs with low leverage, limited near-term maturities, and well-located real estate leased on a long-term basis. The Fund remains very cautious in light of the global credit crunch and the dampened global growth outlook. REIT prices have, however, been hit pretty hard already, reflecting a higher equity risk premium. Urdang believes they are trading at a significant discount to replacement cost. While multiples appear to be reasonable for REITs, the possibility remains that growth may turn negative due to weakening fundamentals and higher future debt costs. Therefore, Urdang will continue to take a conservative approach in choosing REITs and focus on the long-term merits of these securities in managing the Fund.
Cumulative Total Return Performance
The Fund’s cumulative total return is based on the daily change in net asset value (NAV), and assumes that all distributions were reinvested. The Dow Jones U.S. Select REIT Index measures U.S. publicly traded Real Estate Investment Trusts. Unlike the Fund, the Dow Jones U.S. Select REIT Index is unmanaged, is not
29
Managers Real Estate Securities Fund
Portfolio Manager’s Comments (continued)
Cumulative Total Return Performance
available to investment, and does not incur expenses. The chart illustrates the performance of a hypothetical $10,000 investment made in the Managers Real Estate Securities Fund on October 31, 1999, to a $10,000 investment made in the Dow Jones U.S. Select REIT Index for the same time period. Performance for periods longer than one year is annualized. The graph and table do not reflect the deduction of taxes that a shareholder would pay on a Fund distribution or redemption of shares. The listed returns for the Fund are net of expenses and the returns for the index exclude expenses. Total returns for the Fund would have been lower had certain expenses not been reduced.
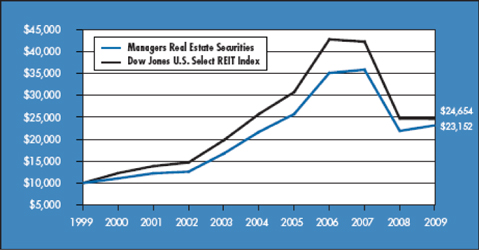
The table below shows the average annual total returns for the Managers Real Estate Securities Fund and the Dow Jones U.S. Select REIT Index for the one-year, five-year and ten-year periods ended October 31, 2009.
| | | | | | | | | |
Average Annualized Total Returns 1 | | One Year | | | Five Years | | | Ten Years | |
Managers Real Estate Securities 2,3 | | 5.77 | % | | 1.34 | % | | 8.76 | % |
Dow Jones U.S. Select REIT Index | | (0.26 | )% | | (0.87 | )% | | 9.44 | % |
The performance data shown represents past performance. Past performance is not a guarantee of future results. Current performance may be lower or higher than the performance data quoted. The investment return and principal value of an investment in the Fund will fluctuate so that an investor’s shares, when redeemed, may be worth more or less than their original cost. For performance information through the most recent month end, please call (800) 835-3879 or visit our Web site at www.managersinvest.com.
In choosing a Fund, investors should carefully consider the amount they plan to invest, their investment objectives, the Fund’s investment objectives, risks, charges and expenses before investing. For this and other information, please call (800) 835-3879 or visit www.managersinvest.com for a free prospectus. Read it carefully before investing or sending money. Distributed by Managers Distributors, Inc., member FINRA.
| 1 | Total return equals income yield plus share price change and assumes reinvestment of all dividends and capital gain distributions. Returns are net of fees and may reflect offsets of Fund expenses as described in the Prospectus. No adjustment has been made for taxes payable by shareholders on their reinvested dividends and capital gain distributions. Returns for periods greater than one year are annualized. The listed returns on the Fund are net of expenses and based on the published NAV as of October 31, 2009. All returns are in U.S. dollars($). |
| 2 | Fund for which, from time to time, the advisor has waived its fees and/or absorbed Fund expenses, which has resulted in higher returns. |
| 3 | The Fund is subject to special risk considerations similar to those associated with the direct ownership of real estate. Real estate valuations may be subject to factors such as changing general and local economic, financial, competitive, and environmental conditions. |
Not FDIC insured, nor bank guaranteed. May lose value.
30
Managers Real Estate Securities Fund
Fund Snapshots
October 31, 2009
Portfolio Breakdown
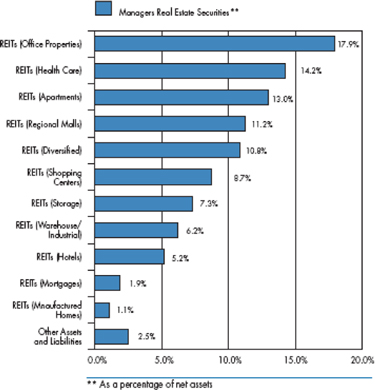
| | | |
Industry | | Managers
Real Estate
Securities** | |
REITs (Office Properties) | | 17.9 | % |
REITs (Health Care) | | 14.2 | % |
REITs (Apartments) | | 13.0 | % |
REITs (Regional Malls) | | 11.2 | % |
REITs (Diversified) | | 10.8 | % |
REITs (Shopping Centers) | | 8.7 | % |
REITs (Storage) | | 7.3 | % |
REITs (Warehouse/Industrial) | | 6.2 | % |
REITs (Hotels) | | 5.2 | % |
REITs (Mortgages) | | 1.9 | % |
REITs (Manufactured Homes) | | 1.1 | % |
Other Assets and Liabilities | | 2.5 | % |
Top Ten Holdings
| | | |
Security Name | | Percentage
of Net
Assets | |
Simon Property Group, Inc.* | | 7.7 | % |
Public Storage, Inc.* | | 6.8 | |
Boston Properties, Inc.* | | 5.9 | |
Vornado Realty Trust* | | 5.3 | |
Equity Residential* | | 4.7 | |
Ventas, Inc.* | | 3.7 | |
ProLogis | | 3.6 | |
HCP, Inc. | | 3.3 | |
Brandywine Realty Trust | | 3.2 | |
Essex Property Trust, Inc. | | 3.2 | |
| | | |
Top Ten as a Group | | 47.4 | % |
| | | |
| * | Top Ten Holding at April 30, 2009 |
Any sectors, industries, or securities discussed should not be perceived as investment recommendations. Mention of a specific security should not be considered a recommendation to buy or solicitation to sell that security. Specific securities mentioned in this report may have been sold from the Fund’s portfolio of investments by the time you receive this report.
31
Managers Real Estate Securities Fund
Schedule of Portfolio Investments
October 31, 2009
| | | | | | |
| | | Shares | | Value | |
REITs - 97.5% | | | | | | |
Apartments - 13.0% | | | | | | |
Apartment Investment & Management Co. | | 9,960 | | $ | 123,006 | |
Camden Property Trust | | 6,510 | | | 235,988 | |
Education Realty Trust, Inc. | | 16,900 | | | 84,669 | |
Equity Residential | | 23,860 | | | 689,077 | |
Essex Property Trust, Inc. | | 6,220 | | | 467,620 | |
Home Properties of NY, Inc. | | 4,200 | | | 164,556 | |
UDR, Inc. | | 9,270 | | | 133,303 | |
Total Apartments | | | | | 1,898,219 | |
Diversified - 10.8% | | | | | | |
Cousins Properties, Inc. | | 7,520 | | | 55,046 | |
Digital Realty Trust, Inc. | | 5,600 | | | 252,728 | |
Duke Realty Corp. | | 32,880 | | | 369,571 | |
PS Business Parks, Inc. | | 2,460 | | | 120,466 | |
Vornado Realty Trust | | 12,920 | | | 769,515 | |
Total Diversified | | | | | 1,567,326 | |
Health Care - 14.2% | | | | | | |
Cogdell Spencer, Inc. | | 21,430 | | | 99,435 | |
HCP, Inc. | | 16,000 | | | 473,440 | |
Healthcare Realty Trust, Inc. | | 6,290 | | | 131,021 | |
Nationwide Health Properties, Inc. | | 11,790 | | | 380,228 | |
Senior Housing Properties Trust | | 22,600 | | | 435,728 | |
Ventas, Inc. | | 13,450 | | | 539,748 | |
Total Health Care | | | | | 2,059,600 | |
Hotels - 5.2% | | | | | | |
DiamondRock Hospitality Co.* | | 18,190 | | | 138,426 | |
Host Hotels & Resorts, Inc. | | 36,840 | | | 372,452 | |
LaSalle Hotel Properties | | 6,760 | | | 116,002 | |
Sunstone Hotel Investors, Inc.* | | 16,680 | | | 125,934 | |
Total Hotels | | | | | 752,814 | |
Manufactured Homes - 1.1% | | | | | | |
Equity Lifestyle Properties, Inc. | | 3,350 | | | 155,608 | |
Mortgages - 1.9% | | | | | | |
Apollo Commercial Real Estate Finance, Inc.* | | 4,930 | | | 88,296 | |
CreXus Investment Corp.* | | 2,890 | | | 40,980 | |
Starwood Property Trust, Inc. | | 7,230 | | | 145,540 | |
Total Mortgages | | | | | 274,816 | |
Office Properties - 17.9% | | | | | | |
Alexandria Real Estate Equities, Inc. | | 2,711 | | | 146,855 | |
Boston Properties, Inc. | | 14,010 | | | 851,388 | |
Brandywine Realty Trust | | 49,140 | | | 469,778 | |
Kilroy Realty Corp. | | 15,510 | | | 428,386 | |
Mack-Cali Realty Corp. | | 9,970 | | | 308,572 | |
SL Green Realty Corp. | | 10,070 | | | 390,313 | |
Total Office Properties | | | | | 2,595,292 | |
Regional Malls - 11.2% | | | | | | |
Macerich Co., The | | 6,441 | | | 191,942 | |
Simon Property Group, Inc. | | 16,506 | | | 1,120,592 | |
Taubman Centers, Inc. | | 10,340 | | | 315,473 | |
Total Regional Malls | | | | | 1,628,007 | |
Shopping Centers - 8.7% | | | | | | |
Federal Realty Investment Trust | | 3,950 | | | 233,168 | |
Kimco Realty Corp. | | 25,260 | | | 319,286 | |
Regency Centers Corp. | | 9,690 | | | 325,100 | |
Tanger Factory Outlet Center | | 3,050 | | | 116,114 | |
Weingarten Realty Investors | | 14,410 | | | 266,585 | |
Total Shopping Centers | | | | | 1,260,253 | |
Storage - 7.3% | | | | | | |
Extra Space Storage, Inc. | | 7,990 | | | 76,464 | |
Public Storage, Inc. | | 13,480 | | | 992,128 | |
Total Storage | | | | | 1,068,592 | |
Warehouse/Industrials - 6.2% | | | | | | |
AMB Property Corp. | | 15,320 | | | 336,734 | |
DCT Industrial Trust, Inc. | | 9,860 | | | 44,666 | |
ProLogis | | 46,350 | | | 525,145 | |
Total Warehouse/Industrials | | | | | 906,545 | |
Total REITs
(cost $12,457,312) | | | | | 14,167,072 | |
REOCs - 2.1% | | | | | | |
Wireless Equipment | | | | | | |
American Tower Corp., Class A*
(cost $267,036) | | 8,320 | | | 306,342 | |
Short-Term Investments - 1.1%1 | | | | | | |
Dreyfus Cash Management Fund, Institutional Class Shares, 0.13%
(cost $156,131) | | 156,131 | | | 156,131 | |
Total Investments - 100.7%
(cost $12,880,479) | | | | | 14,629,545 | |
Other Assets, less Liabilities - (0.7)% | | | | | (103,178 | ) |
Net Assets - 100.0% | | | | $ | 14,526,367 | |
The accompanying notes are an integral part of these financial statements.
32
Managers California Intermediate Tax-Free Fund
Portfolio Manager’s Comments
The Managers California Intermediate Tax-Free Fund’s (the “Fund”) objective is to achieve income free from Federal income taxes and California state income taxes, including alternative minimum tax.
The Fund invests at least 80% of its total assets in intermediate-term California municipal bonds that are free from both Federal and California state income taxes, including the Alternative Minimum Tax. The Fund’s securities will have quality ratings comparable to the four highest rating categories of Moody’s or Standard & Poor’s. The dollar-weighted average maturity of these intermediate-term securities is normally 3 to 10 years. The Fund’s benchmark is the Barclays Capital U.S. Municipal Bond: 5 Year Index.
The Portfolio Manager
Miller Tabak Asset Management (“MTAM”), the subadvisor for the Fund, was founded in early 2008, and is a division of Miller Tabak + Co. LLC (“Miller Tabak”). Miller Tabak is a 26 year-old institutional trading firm that specializes in the discrete handling of stock purchases and sales, portfolio rebalancing, and listed options. MTAM focuses exclusively on managing municipal bond portfolios and is based in New York City. As previously described in the Information Statement sent to shareholders, on September 15, 2008, MTAM took over the subadvisory duties previously performed by Evergreen Investment Management Company, LLC (“Evergreen”) with respect to the Fund. As of that date, MTAM has managed the Fund’s entire portfolio of investments.
Philosophy
The MTAM team focuses on purchasing municipal credits exhibiting improving credit characteristics while maintaining geographic and economic diversity as key elements in the portfolio-construction process. MTAM believes proactive total-return portfolio management offers greater potential rewards in an increasingly inefficient municipal bond market. Achieving reasonable and consistent growth of clients’ capital without taking elevated levels of principal risk is MTAM’s objective.
The municipal bond market is a unique sector within the domestic fixed-income universe, consisting of over 48,000 issuers with distinct security structures and varying credit risks. MTAM seeks to exploit these nuances through a disciplined risk-controlled, relative-value investment management process.
Process
| | • | | Active total-return portfolio management is MTAM’s central theme for achieving objectives that benefit the Fund |
| | • | | MTAM is committed to extensive, proprietary, and original research and analysis |
| | • | | MTAM follows a disciplined and well-defined investment process |
MTAM’s portfolio management starts by setting income and return objectives, the time horizon, liquidity and cash flow needs, and tax considerations. After client needs have been assessed, MTAM establishes specific investment guidelines for each account. They focus on maturity, duration, minimum acceptable credit quality, sector limitations, selection of the benchmark, and risk tolerance. Lastly, MTAM creates a detailed investment policy statement for each account and begins implementing its investment process.
MTAM’s investment process can be divided into two distinct parts. The first part focuses on risk analysis. MTAM’s risk analysis has two components, interest-rate analysis and credit-risk analysis. MTAM strives to control interest-rate volatility by defining the appropriate ranges for duration and maturity based on the fund’s predetermined liquidity requirements, the specific risk profile, and the given market environment. Daniel Greenhaus, Miller Tabak’s Chief Bond Strategist, helps mold MTAM’s macro perspective. He is a valuable resource in shaping MTAM’s market perspective and is often tapped by other investment firms for his well-respected insight. His input is particularly important in shaping the Fund’s duration and maturity targets.
The second component of MTAM’s risk analysis focuses on credit risk. MTAM applies rigorous standards for tax-exempt issuers, continually reviews financial statements, and closely monitors rating agency commentary and relative trading spreads in the secondary market. Michael Pietronico, the Fund’s portfolio manager, has 15 years managing municipal bond portfolios, which gives him excellent knowledge of the key factors influencing the municipal bond market and an experienced eye to identify high-quality California municipal bonds.
The second major part of MTAM’s investment process assesses relative value. MTAM starts by creating expectations for the slope of the yield curve and yield spreads going forward. Once forecasts are finalized, MTAM assesses how its forecast and other potential outcomes may affect market prices. This ultimately helps MTAM identify what securities are most attractively valued and offer the best risk-adjusted return. MTAM also uses its market outlook to determine what sectors of the municipal market will add to and detract from performance and adjust weightings accordingly. Lastly, credit research at the security level is undertaken to analyze credit quality, yield, duration, structure, and call protection in order to assess a security’s potential contribution to the Fund.
33
Managers California Intermediate Tax-Free Fund
Portfolio Manager’s Comments (continued)
Buy Discipline
There are three parts to MTAM’s buy discipline:
Macro View
Aggregate Municipal Supply
Secondary Market Supply
Dealer Inventories
Micro View
Supply/Demand Per State
Macro View
Major Economic Trends in Place
Micro View
Legal Structure of Securities
Service-Area Economic Performance
Project and System Operations
| | • | | Individual Bond Structure Analysis |
Prepayment Risk
Original Issue Discount
Reinvestment Risk
Municipal Bond Credit Research – Credit Review Process
| | 1. | Comprehensive bottom-up analysis of issuer, pledged security, and historical economic performance |
| | 2. | Site visits and conference calls with key public officials |
| | 3. | Comprehensive financial statement review with feasibility analysis |
| | 4. | Negotiate with underwriters to strengthen key security covenants and secure optimal pricing |
| | 5. | Limits are implemented upon credit approval exposure |
Credit Surveillance
| | • | | Database is maintained for holdings by issuer and Fund exposure |
| | • | | The relevant performance statistics are tracked on a monthly, quarterly, and annual basis to help capture meaningful trends, for example trading spreads |
| | • | | Outside resources are utilized; for example financial statement repositories, industry publications, internet search engines, and rating agencies |
Sell Discipline
An individual security may become a candidate for sale for any of the following reasons:
| | • | | The issuers investment fundamentals begin to deteriorate |
| | • | | To take advantage of more attractive yield opportunities |
| | • | | The individual security no longer appears to meet the portfolio’s investment objective(s) |
| | • | | To meet liquidity needs |
| | • | | To help shorten or lengthen the overall duration of the portfolio |
The Year in Review
For the 12-months that ended October 31, 2009, the Managers California Intermediate Tax-Free Fund returned 9.0%. The Fund’s benchmark, the Barclays Capital U.S. Municipal Bond: 5 Year Index, returned 9.7% during the same time period.
The fiscal year began on shaky footing as the Lehman bankruptcy and other notable negative credit events kept risk aversion high and municipal bonds suffered as a consequence. However, as the specifics of the Federal Stimulus package became clearer to market participants, municipal bond prices recovered strongly as a significant portion of the stimulus money was earmarked to assist states with their large budget deficits. Tax-free bonds continued to see high demand as the drop in the Federal Funds Rate to almost 0% kept money market yields painfully low. This caused a significant upturn in the amount of cash moving out of money markets into longer-term bond structures and kept price performance positive for most of 2009. October of 2009 saw another reversal in municipal bond risk tolerance as the perception that states (California in particular) were experiencing more revenue shortfalls kept credit spreads moving wider once again. Long-term maturities outperformed shorter-term debt during the fiscal year as the Federal Reserve showed it was in no hurry to raise short-term interest rates, encouraging investors to reach for yield. Low-quality bonds also performed better during the trailing 12-months that ended October 31, 2009. The better performance of A- and BBB-rated bonds is another example of investors searching for higher returns after confidence increased that credit markets had avoided a historic collapse.
The Fund’s underperformance relative to its benchmark can be attributed to three key factors. First, the Fund focuses exclusively on the state of California and is being compared to a national benchmark with bonds from all states. California had the most extreme budget deficit in the country and faced both rating agency downgrades in the state’s general obligation debt, and the perception that its way of governing was dysfunctional due to the super majority needed to pass a budget. Some issuers from states such as Texas, which are included in
34
Managers California Intermediate Tax-Free Fund
Portfolio Manager’s Comments (continued)
the Index, are on much stronger financial footing and, therefore, skew the returns relative to a California specific Fund. Also many of the issuers within the Index come from states with no income tax (such as Washington) which distorts the income component of the Index higher relative to California issuers which come to market with lower yields.
The second key component is the Fund’s shorter duration. The Fund’s shorter overall duration was a drag on relative performance during the fiscal year as longer maturity municipal bonds rallied more strongly than shorter bonds when it became apparent that the BAB (Build America Bond) program would dampen traditional tax-free supply of longer term debt. The third key component was the Fund’s high quality bias. A-rated and BBB-rated bonds performed the best during the just completed fiscal year. The Fund emphasizes high-quality bonds and generally maintains an average credit rating of AA. As a result, its relative performance was hurt because lower rated, investment grade bonds outperformed AAA and AA bonds.
The Fund generated strong absolute returns during the trailing 12-month period and there were several positives during the quarter. In particular, the Fund benefitted from a generous allocation to school districts located throughout the State. Most of the school district holdings were well undervalued by the market because of concerns that the State of California’s poor cash flow would impede on the school districts’ ability to repay their debt. In fact, it is written in the State’s constitution that proceeds for education are senior to even the State’s General Obligation debt and as such are more “secure.” This began to be recognized by many institutional accounts and as a result, contributed to a fair degree of spread tightening in this sector which was a positive for the Fund relative to the Index.
As of October 31, 2009 the Fund is positioned with a shorter duration relative to the Benchmark as excessive U.S. Dollar weakness could cause a spike in longer term interest rates as higher commodity prices, specifically oil and gold, could cause inflation expectations to become somewhat “unhinged” for a time until the Federal Reserve becomes more convinced that higher short-term rates are warranted. MTAM’s expectation is within this environment a bearish “steepening” of the municipal yield curve and they believe that this will be the predominant theme in the market. The month of October (2009) began showing that trend, and MTAM views that this should remain the dominant trend until at least the spring of 2010 when short-term rate hikes by the Federal Reserve are most likely to occur. MTAM also continued to slowly raise the Fund’s allocation to pre-refunded bonds during the fiscal year as they remain concerned that once the Federal Reserve and the Treasury remove excess emergency stimulus from the financial system, local California credits could widen due to credit quality concerns. It is MTAM’s belief that any tightening of credit conditions will undermine California credits to an unusually large degree relative to the rest of the nation due to the structural budget deficits that exist as far as the eye can see.
Looking Forward
Looking ahead, MTAM expects the municipal bond market will perform in tandem with the tone of the overall economic data. This entails better relative performance by the municipal market as economic data has generally improved. MTAM views the economy as “out of recession” but not “out of the woods” due to the very weak labor market and unemployment’s effect on consumer confidence and spending. MTAM feels comfortable that the elevated amount of stimulus in the system will keep growth positive, but the current overreach of government involvement will keep small business employment growth subdued. Unfortunately, it may not be until the results of the 2010 mid-term congressional elections are upon us that investors can gather a more decisive outlook into what role the government will have in the “real” economy. MTAM envisions more of the same for the economy until then and expects positive growth, high unemployment, substantial deficits, ultra-easy monetary policy, a weakening dollar, and a greater fear of inflation in the longer-term. As a result, municipal bond demand should remain strong as expected future tax rates on the Federal and State level move higher, while inflation fears keep investors more comfortable with short maturity bonds. This will keep the municipal yield curve “steep” until macro policy changes from the Federal Reserve and the Treasury are imminent, which likely won’t occur until the second half of 2010.
Cumulative Total Return Performance
Managers California Intermediate Tax-Free Fund’s cumulative total return is based on the daily change in net asset value (NAV) and assumes that all distributions were reinvested. The Barclays Capital U.S. Municipal Bond: 5 Year Index is a rules-based, market-value-weighted index engineered for the long-term tax-exempt bond market. The index has four main sectors: general obligation bonds, revenue bonds, insured bonds (including all insured bonds with a Aaa/AAA rating), and prerefunded bonds. This index is the
35
Managers California Intermediate Tax-Free Fund
Portfolio Manager’s Comments (continued)
Cumulative Total Return Performance
5 Year (4-6) component of the Municipal Bond index. Unlike the Fund, the Barclays Capital U.S. Municipal Bond: 5 Year Index is unmanaged, is not available to investment, and does not incur expenses. This chart compares a hypothetical $10,000 investment made in the Managers California Intermediate Tax-Free Fund on October 31, 1999 to a $10,000 investment made in the Barclays Capital U.S. Municipal Bond: 5 Year Index for the same time period. Performance for periods longer than one year is annualized. The graph and table do not reflect the deduction of taxes that a shareholder would pay on a Fund distribution or redemption of shares. The listed returns for the Fund are net of expenses and the returns for the index exclude expenses. Total returns for the Fund would have been lower had certain expenses not been reduced.
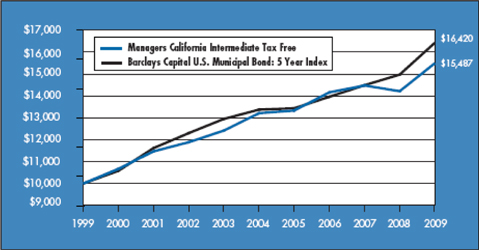
The table below shows the average annual total returns for the Managers California Intermediate Tax-Free Fund and the Barclays Capital U.S. Municipal Bond: 5 Year Index for the one-year, five-year and ten-year periods ended October 31, 2009.
| | | | | | | | | |
Average Annualized Total Returns 1 | | One Year | | | Five Years | | | Ten Years | |
Managers California Intermediate Tax Free 2,3,4,5 | | 8.97 | % | | 3.23 | % | | 4.47 | % |
Barclays Capital U.S. Municipal Bond: 5 Year Index 6 | | 9.70 | % | | 4.19 | % | | 5.08 | % |
The performance data shown represents past performance. Past performance is not a guarantee of future results. Current performance may be lower or higher than the performance data quoted. The investment return and principal value of an investment in the Fund will fluctuate so that an investor’s shares, when redeemed, may be worth more or less than their original cost. For performance information through the most recent month end, please call (800) 835-3879 or visit our Web site at www.managersinvest.com.
In choosing a Fund, investors should carefully consider the amount they plan to invest, their investment objectives, the Fund’s investment objectives, risks, charges and expenses before investing. For this and other information, please call (800) 835-3879 or visit www.managersinvest.com for a free prospectus. Read it carefully before investing or sending money. Distributed by Managers Distributors, Inc., member FINRA.
| 1 | Total return equals income yield plus share price change and assumes reinvestment of all dividends and capital gain distributions. Returns are net of fees and may reflect offsets of Fund expenses as described in the Prospectus. No adjustment has been made for taxes payable by shareholders on their reinvested dividends and capital gain distributions. Returns for periods greater than one year are annualized. The listed returns on the Fund are net of expenses and based on the published NAV as of October 31, 2009. All returns are in U.S. dollars($). |
| 2 | Fund for which, from time to time, the advisor has waived its fees and/or absorbed Fund expenses, which has resulted in higher returns. |
| 3 | The Fund is subject to the risks associated with investments in debt securities, such as default risk and fluctuations in the perception of the debtors’ ability to pay their creditors. |
| 4 | Changing interest rates may adversely affect the value of an investment. An increase in interest rates typically causes the value of bonds and other fixed income securities to fall. |
| 5 | The Fund is subject to risks associated from economic, political, geographic, and demographic conditions of California that could adversely affect the value of the Fund’s investment portfolio. |
| 6 | Prior to October 31, 2008, the Index was known as the Lehman Brothers 5-Year Municipal Bond Index. |
Not FDIC insured, nor bank guaranteed. May lose value.
36
Managers California Intermediate Tax-Free Fund
Fund Snapshots
October 31, 2009
Portfolio Breakdown
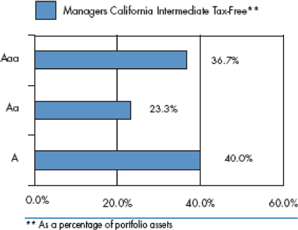
| | | |
Portfolio Credit Quality | | Managers California
Intermediate Tax-Free** | |
Aaa | | 36.7 | % |
Aa | | 23.3 | % |
A | | 40.0 | % |
Top Ten Holdings
| | | |
Security Name | | Percentage
of Net Assets | |
Vacaville, CA Unified School District General Obligation, 5.250%, 08/01/28 (FSA Insured) | | 9.2 | % |
| |
California State Department of Water Resources, Series A, 5.875%, 05/01/16 | | 8.7 | |
| |
City of Vernon, CA Series A, 3.000%, 08/01/10 | | 2.6 | |
| |
Long Beach, CA Unified School District, Series B, 5.250%, 08/01/24 | | 1.9 | |
| |
Puerto Rico Aqueduct & Sewer Authority Revenue, Series 1995, 6.250%, 07/01/12 (National Insured) | | 1.8 | |
| |
State of California, 6.600%, 02/01/10 (National Insured) | | 1.8 | |
| |
Port of Oakland, CA Revenue, Series M, 5.250%, 11/01/16 (FGIC Insured) | | 1.8 | |
| |
San Bernardino, CA Community College District, Election 2002, Series A, 6.375%, 08/01/26 | | 1.8 | |
| |
California State Public Works Board, Series A, 6.000%, 04/01/24 | | 1.7 | |
| |
San Diego, CA Public Facilities Financing Authority, Series C, 4.000%, 05/15/12 | | 1.6 | |
| | | |
| |
Top Ten as a Group | | 32.9 | % |
| | | |
Any sectors, industries, or securities discussed should not be perceived as investment recommendations. Mention of a specific security should not be considered a recommendation to buy or solicitation to sell that security. Specific securities mentioned in this report may have been sold from the Fund’s portfolio of investments by the time you receive this report.
37
Managers California Intermediate Tax-Free Fund
Schedule of Portfolio Investments
October 31, 2009
| | | | | | |
| | | Principal Amount | | Value |
| | |
Municipal Bonds - 95.6% | | | | | | |
Anaheim, CA Union High School District General Obligation, 5.375%, 08/01/20 (FSA Insured) | | $ | 35,000 | | $ | 39,130 |
Bakersfield, CA City School District, Series A, 5.250%, 11/01/21 (FSA Insured) | | | 110,000 | | | 118,752 |
Bay Area, CA Toll Authority, Series D, 4.300%, 04/01/10 | | | 75,000 | | | 76,164 |
Bay Area, CA Toll Authority, Series D, 5.000%, 04/01/10 | | | 25,000 | | | 25,459 |
Bay Area, CA Toll Authority, Series F, 5.000%, 04/01/13 | | | 50,000 | | | 55,108 |
Bay Area, CA Toll Authority, Series F, 5.000%, 04/01/17 | | | 20,000 | | | 22,371 |
Bonita, CA Unified School District, Election 2004, Series B, 5.000%, 08/01/16 (FGIC Insured) | | | 50,000 | | | 53,752 |
Brentwood, CA Union School District General Obligation, Series B, 5.000%, 08/01/11 (National Insured) | | | 45,000 | | | 47,577 |
Byron, CA Unified School District, Series A, 5.000%, 08/01/14 (FGIC Insured) | | | 35,000 | | | 38,888 |
Cabrillo, CA Community College District, Election 2004, Series B, 4.000%, 08/01/11 (National Insured) | | | 50,000 | | | 52,583 |
California Educational Facilities Authority, Series A, 5.000%, 10/01/32 | | | 40,000 | | | 43,294 |
California Infrastructure & Economic Development Bank Revenue, 5.000%, 10/01/10 | | | 25,000 | | | 25,939 |
California State, Economic National, Series A, 5.000%, 07/01/10 (National Insured) | | | 25,000 | | | 25,680 |
California State, 6.500%, 11/01/09 | | | 75,000 | | | 75,000 |
California State Department of Water Resources, Series A, 5.250%, 05/01/11 (FSA Insured) | | | 45,000 | | | 47,617 |
California State Department of Water Resources, Series A, 5.500%, 05/01/14 (AMBAC Insured) | | | 200,000 | | | 217,302 |
California State Department of Water Resources, Series A, 5.500%, 05/01/15 (AMBAC Insured) | | | 200,000 | | | 214,876 |
California State Department of Water Resources, Series A, 5.875%, 05/01/16 | | | 2,400,000 | | | 2,710,632 |
California State Department of Water Resources, Series A, 6.000%, 05/01/15 | | | 125,000 | | | 141,561 |
California State Department of Water Resources Power Supply Revenue, Series A, 5.500%, 05/01/16 (AMBAC Insured) | | | 50,000 | | | 56,011 |
California State Department of Water Resources Power Supply Revenue, Series A, 5.750%, 05/01/17 | | | 110,000 | | | 123,900 |
California State Department of Water Resources Power Supply Revenue, Series A, 5.750%, 05/01/17 (National Insured) | | | 35,000 | | | 39,423 |
California State Department of Water Resources Revenue, Series A, 5.000%, 05/01/13 (FSA Insured) | | | 40,000 | | | 43,293 |
California State Public Works Board, Series G, 3.450%, 11/01/09 | | | 50,000 | | | 50,000 |
California State Public Works Board, Series A, 3.700%, 12/01/12 (AMBAC Insured) | | | 35,000 | | | 36,026 |
California State Public Works Board, Series G, 4.000%, 11/01/11 | | | 100,000 | | | 103,687 |
California State Public Works Board, Series A, 5.000%, 03/01/10 | | | 400,000 | | | 404,708 |
California State Public Works Board, Series A, 5.000%, 06/01/10 | | | 100,000 | | | 102,024 |
California State Public Works Board, Series C, 5.000%, 06/01/10 | | | 250,000 | | | 255,060 |
California State Public Works Board, Series A, 5.000%, 12/01/11 | | | 50,000 | | | 52,772 |
California State Public Works Board, Series C, 5.000%, 06/01/12 | | | 10,000 | | | 10,568 |
California State Public Works Board, Series A, 5.150%, 12/01/11 (AMBAC Insured) | | | 50,000 | | | 50,136 |
California State Public Works Board, Series A, 5.250%, 06/01/11 (AMBAC Insured) | | | 5,000 | | | 5,315 |
California State Public Works Board, Series B, 5.250%, 03/01/19 (AMBAC Insured) | | | 200,000 | | | 200,940 |
California State Public Works Board, Series A, 5.500%, 10/01/10 | | | 75,000 | | | 77,391 |
California State Public Works Board, Series A, 6.000%, 04/01/24 | | | 500,000 | | | 519,260 |
California State University, Series A, 4.000%, 11/01/10 | | | 45,000 | | | 46,479 |
Carlsbad, CA Unified School District, General Obligation, Series A, 5.000%, 08/01/21 (National Insured) | | | 20,000 | | | 21,374 |
The accompanying notes are an integral part of these financial statements.
38
Managers California Intermediate Tax-Free Fund
Schedule of Portfolio Investments (continued)
| | | | | | |
| | | Principal Amount | | Value |
| | |
Municipal Bonds - 95.6% (continued) | | | | | | |
Central Basin Municipal Water District Revenue, 4.000%, 08/01/11 (AMBAC Insured) | | $ | 250,000 | | $ | 260,700 |
Chino Valley, CA Unified School District COP, Series A, 5.375%, 08/01/14 (FSA Insured) | | | 70,000 | | | 76,735 |
City of Bakersfield, CA Series A, 5.000%, 09/15/19 (FSA Insured) | | | 150,000 | | | 162,873 |
City of El Paso De Robles, CA General Obligation, 5.000%, 08/01/23 (National Insured) | | | 100,000 | | | 102,574 |
City of Escondido, CA General Obligation, Series A, 4.000%, 09/01/13 (National Insured) | | | 50,000 | | | 51,994 |
City of Escondido, CA General Obligation, Series A, 5.000%, 09/01/14 (National Insured) | | | 90,000 | | | 96,894 |
City of Los Angeles, CA Series A, 4.000%, 09/01/10 (National Insured) | | | 75,000 | | | 77,152 |
City of Los Angeles, CA General Obligation, Series A, 4.000%, 09/01/10 (National Insured) | | | 20,000 | | | 20,574 |
City of Los Angeles, CA General Obligation, Series A, 5.250% 09/01/11 (National Insured) | | | 40,000 | | | 42,990 |
City of Los Angeles, CA Sanitation Equipment Charge Revenue, Series A, 5.000%, 02/01/13 (FGIC Insured) | | | 25,000 | | | 27,350 |
City of San Jose, CA 5.000%, 09/01/12 | | | 10,000 | | | 11,052 |
City of Vernon, CA Series A, 3.000%, 08/01/10 | | | 800,000 | | | 807,208 |
Clovis, CA Unified School District, Election 2004, Series B, 4.000%, 08/01/11 (National Insured) | | | 20,000 | | | 20,909 |
Clovis, CA Unified School District General Obligation, Series B, 5.000%, 08/01/23 (National Insured) | | | 50,000 | | | 52,175 |
Contra Costa County, CA Water District, Series L, 4.000%, 10/01/13 (FSA Insured) | | | 75,000 | | | 79,456 |
Corona-Norco, CA Unified School District, Election 2006, Series A, 5.500%, 08/01/15 (FSA Insured) | | | 50,000 | | | 57,169 |
Corona-Norca, CA Unified School District General Obligation, 5.000%, 09/01/12 (FSA Insured) | | | 45,000 | | | 49,366 |
Cotati-Rohnert Park, CA Unified School District, Series B, 4.000%, 08/01/13 (FGIC Insured) | | | 50,000 | | | 52,134 |
County of Sacramento, CA Airport System Revenue, Series A, 5.000%, 07/01/32 (FSA Insured) | | | 430,000 | | | 474,406 |
County of Santa Clara, CA East Side Union High School District General Obligation, Series C, 3.300%, 08/01/11 (FGIC Insured) | | | 25,000 | | | 25,792 |
Covina-Valley, CA Unified School District, Election 2006, Series A, 4.000%, 08/01/13 (National Insured) | | | 115,000 | | | 121,164 |
Desert Sands, CA University School District, Election 2001, 5.000%, 06/01/22 (AMBAC Insured) | | | 40,000 | | | 42,220 |
Desert Sands, CA Unified School District General Obligation, 5.000%, 08/01/16 | | | 50,000 | | | 55,162 |
Desert Sands, CA Unified School District General Obligation, 5.000%, 06/01/23 (AMBAC Insured) | | | 205,000 | | | 214,930 |
Desert Sands, CA Unified School District General Obligation, 5.500%, 08/01/28 | | | 25,000 | | | 26,957 |
Dublin, CA Unified School District General Obligation, Series A, 3.125%, 08/01/11 (FSA Insured) | | | 100,000 | | | 103,483 |
East Bay, CA Regional Park District, Series E, 4.150%, 09/01/10 | | | 50,000 | | | 51,580 |
East Side, CA Union High School District-Santa Clara County, Election 2002, Series C, 5.000%, 08/01/14 (FSA Insured) | | | 60,000 | | | 64,736 |
Eastern, CA Municipal Water District, Water & Sewer Revenue, Series C, 4.000%, 07/01/11 (FGIC Insured) | | | 50,000 | | | 51,997 |
Eastern, CA Municipal Water District, Water & Sewer Revenue, Series A, 5.000%, 07/01/21 (National Insured) | | | 330,000 | | | 349,899 |
El Monte, CA Union High School District Election 2002, Series B, 4.250%, 03/01/10 (National Insured) | | | 150,000 | | | 151,674 |
El Monte, CA City School District General Obligation, Series A, 3.750%, 05/01/11 (FGIC Insured) | | | 50,000 | | | 51,842 |
El Monte, CA City School District General Obligation, Series A, 4.250%, 05/01/15 (FGIC Insured) | | | 300,000 | | | 316,833 |
El Monte, CA Union High School District General Obligation, Series C, 5.000%, 06/01/21 (FSA Insured) | | | 40,000 | | | 41,814 |
El Segundo, CA Unified School District General Obligation, 5.375%, 09/01/21 (FGIC Insured) | | | 150,000 | | | 168,009 |
Fairfield-Suisun, CA Unified School District, Election 2002, 5.250%, 01/01/16 (National Insured) | | | 125,000 | | | 136,876 |
Fresno County, CA Central Unified School District General Obligation, 5.000%, 07/01/21 (National Insured) | | | 50,000 | | | 51,248 |
Fresno County, CA Central Unified School District General Obligation, Series A, 5.000%, 08/01/22 (Assured Guaranty) | | | 25,000 | | | 26,625 |
The accompanying notes are an integral part of these financial statements.
39
Managers California Intermediate Tax-Free Fund
Schedule of Portfolio Investments (continued)
| | | | | | |
| | | Principal Amount | | Value |
| | |
Municipal Bonds - 95.6% (continued) | | | | | | |
Hacienda La Puente, CA Unified School District General Obligation, 4.000%, 08/01/11 (FGIC Insured) | | $ | 25,000 | | $ | 26,092 |
Hemet, CA Unified School District General Obligation, Series A, 5.000%, 08/01/22 (FSA Insured) | | | 125,000 | | | 127,932 |
Imperial, CA Community College District General Obligation, Series B, 4.250%, 08/01/14 (AMBAC Insured) | | | 150,000 | | | 157,884 |
Inglewood, CA Unified School District General Obligation, Series B, 4.000%, 10/01/14 (FSA Insured) | | | 135,000 | | | 146,376 |
Jurupa, CA Unified School District, Election 2001, 5.000%, 08/01/14 (FGIC Insured) | | | 225,000 | | | 241,216 |
Kings Canyon, CA Joint Unified School District, 3.750%, 08/01/10 (FGIC Insured) | | | 60,000 | | | 61,198 |
La Mesa-Spring Valley, CA School District General Obligation, 3.250%, 08/01/11 (FGIC Insured) | | | 25,000 | | | 25,902 |
La Mesa-Spring Valley, CA School District General Obligation, Series A, 3.625%, 08/01/10 (FGIC Insured) | | | 20,000 | | | 20,492 |
Larkspur, CA School District, Series A, 5.250%, 08/01/10 | | | 40,000 | | | 41,392 |
Lincoln, CA Unified School District, Election 2004, 4.000%, 08/01/14 (FGIC Insured) | | | 75,000 | | | 77,953 |
Long Beach, CA Unified School District, Series B, 5.250%, 08/01/24 | | | 550,000 | | | 601,728 |
Long Beach, CA Unified School District General Obligation, Series A, 5.500%, 08/01/26 | | | 85,000 | | | 93,969 |
Los Angeles County, CA Metropolitan Transportation Authority Revenue, Series A, 5.000%, 07/01/14 (FSA Insured) | | | 50,000 | | | 50,513 |
Los Angeles County, CA Public Works Financing Authority Revenue, Series A, 5.000%, 03/01/10 (National Insured) | | | 30,000 | | | 30,411 |
Los Angeles County, CA Public Works Financing Authority Revenue, Series A, 5.250%, 10/01/16 (FSA Insured) | | | 25,000 | | | 28,519 |
Los Angeles, CA Community College District General Obligation, Series A, 5.500%, 08/01/21 (National Insured) | | | 50,000 | | | 54,238 |
Los Angeles, CA County Metropolitan Transportation Authority, Series A, 5.000%, 07/01/10 (FSA Insured) | | | 50,000 | | | 51,544 |
Los Angeles, CA County Metropolitan Transportation Authority, Series B, 5.000%, 07/01/10 | | | 25,000 | | | 25,735 |
Los Angeles, CA County Metropolitan Transportation Authority, Series A, 5.000%, 07/01/13 (FSA Insured) | | | 55,000 | | | 61,120 |
Los Angeles, CA County Public Works Financing Authority, Series A, 5.000%, 03/01/12 (National Insured) | | | 100,000 | | | 108,085 |
Los Angeles, CA County Sanitation Districts Financing Authority, Series A, 5.000%, 10/01/11 (FSA Insured) | | | 105,000 | | | 113,022 |
Los Angeles, CA County Public Works Financing Authority, Series A, 5.000%, 10/01/15 (National Insured) | | | 15,000 | | | 17,021 |
Los Angeles, CA Department of Water & Power, Series A-1, 5.000%, 07/01/11 (National Insured) | | | 15,000 | | | 15,984 |
Los Angeles, CA Department of Water & Power, Series A-A-1, 5.250%, 07/01/10 (National Insured) | | | 50,000 | | | 51,636 |
Los Angeles, CA Department of Water, Series A-A-1, 4.000%, 07/01/10 (National Insured) | | | 40,000 | | | 40,980 |
Los Angeles, CA Department of Water & Power Revenue, Series A-1, 5.000%, 07/01/13 (AMBAC Insured) | | | 50,000 | | | 55,846 |
Los Angeles, CA Department of Water & Power System Revenue, Series A, 4.300%, 07/01/12 (National Insured) | | | 75,000 | | | 78,552 |
Los Angeles, CA Harbor Department Revenue, Series A, 4.000%, 08/01/17 | | | 25,000 | | | 25,601 |
Los Angeles, CA Harbor Department Revenue, Series B, 5.000%, 08/01/20 (National Insured) | | | 275,000 | | | 294,671 |
Los Angeles, CA Municipal Improvement Corp. Revenue, Series B1, 5.000%, 08/01/21 (FGIC Insured) | | | 125,000 | | | 129,196 |
Los Angeles, CA Municipal Improvement Corp. Revenue, Series B1, 5.000%, 08/01/23 (FGIC Insured) | | | 50,000 | | | 51,268 |
Los Angeles, CA Unified School District General Obligation, Series E, 5.125%, 07/01/22 (National Insured) | | | 100,000 | | | 110,654 |
Los Angeles, CA Unified School District General Obligation, Series E, 5.500%, 07/01/16 (National Insured) | | | 230,000 | | | 256,758 |
Los Nietos, CA School District General Obligation, 5.000%, 08/01/12 (Assured Guaranty) | | | 25,000 | | | 26,984 |
Manteca, CA Unified School District General Obligation, 3.750%, 08/01/10 (FGIC Insured) | | | 50,000 | | | 51,036 |
Metropolitan Water District of Southern California, Series A, 4.500%, 03/01/10 | | | 70,000 | | | 70,965 |
Metropolitan Water District of Southern California, Series B, 5.000%, 07/01/10 | | | 300,000 | | | 308,982 |
The accompanying notes are an integral part of these financial statements.
40
Managers California Intermediate Tax-Free Fund
Schedule of Portfolio Investments (continued)
| | | | | | |
| | | Principal Amount | | Value |
| | |
Municipal Bonds - 95.6% (continued) | | | | | | |
Metropolitan Water District of Southern California, Series A, 5.000%, 03/01/12 | | $ | 25,000 | | $ | 27,232 |
Moorpark, CA Unified School District General Obligation, Series A, 5.375%, 08/01/18 (FSA Insured) | | | 50,000 | | | 55,828 |
Moreno Valley, CA Unified School District, 4.000%, 08/01/13 (National Insured) | | | 200,000 | | | 209,624 |
Moreno Valley, CA Unified School District, 4.000%, 08/01/14 (National Insured) | | | 75,000 | | | 78,121 |
Moreno Valley, CA Unified School District, 5.000%, 08/01/17 (National Insured) | | | 50,000 | | | 53,161 |
Moreno Valley, CA Unified School District General Obligation, 5.000%, 08/01/15 (National Insured) | | | 420,000 | | | 454,079 |
Moulton Niguel, CA Water District, 4.000%, 09/01/10 (AMBAC Insured) | | | 100,000 | | | 102,391 |
Mount Diablo, CA Unified School District, Election 2002, 4.125%, 07/01/14 (FGIC Insured) | | | 50,000 | | | 52,376 |
Mount Diablo, CA Unified School District General Obligation, 4.250%, 08/01/13 (FSA Insured) | | | 115,000 | | | 120,030 |
Mount Diablo, CA Unified School District Special Tax Refund, 3.750%, 08/01/10 (National Insured) | | | 50,000 | | | 51,130 |
Murrieta Valley, CA Unified School District Public Financing Authority, Election 2002, Series B, 3.500%, 09/01/10 (FSA Insured) | | | 25,000 | | | 25,625 |
Natomas, CA Unified School District General Obligation, Series B, 5.000%, 09/01/12 (FGIC Insured) | | | 350,000 | | | 379,194 |
Natomas, CA Unified School District General Obligation, Series B, 5.000%, 09/01/23 (FGIC Insured) | | | 30,000 | | | 30,577 |
Newhall, CA School District, Series A, 5.250%, 05/01/10 (FSA Insured) | | | 50,000 | | | 51,215 |
Orange County, CA Coast Community College District General Obligation, 4.500%, 08/01/11 (National Insured) | | | 20,000 | | | 21,209 |
Peralta, CA Community College District General Obligation, Series A, 5.000%, 08/01/24 (National Insured) | | | 50,000 | | | 52,564 |
Perris, CA Union High School District General Obligation, Series B, 4.000%, 09/01/13 (FGIC Insured) | | | 50,000 | | | 54,094 |
Placentia-Yorba Linda, CA Unified School District General Obligation, Series B, 5.500%, 08/01/27 (FGIC Insured) | | | 65,000 | | | 69,837 |
Port of Oakland, CA Series M, 3.500%, 11/01/10 (FGIC Insured) | | | 50,000 | | | 51,300 |
Port of Oakland, CA Series C, 5.000%, 11/01/15 (National Insured) | | | 310,000 | | | 335,287 |
Port of Oakland, CA Series B, 5.000%, 11/01/16 (National Insured) | | | 255,000 | | | 273,957 |
Port of Oakland, CA Series C, 5.000%, 11/01/17 (National Insured) | | | 275,000 | | | 293,846 |
Port of Oakland, CA Revenue, Series M, 5.000%, 11/01/11 (FGIC Insured) | | | 25,000 | | | 26,726 |
Port of Oakland, CA Revenue, 5.250%, 11/01/15 (FGIC Insured) | | | 100,000 | | | 112,023 |
Port of Oakland, CA Revenue, Series M, 5.250%, 11/01/16 (FGIC Insured) | | | 500,000 | | | 560,115 |
Puerto Rico Aqueduct & Sewer Authority Revenue, Series 1995, 6.250%, 07/01/12 (National Insured) | | | 500,000 | | | 567,270 |
Rancho Santiago, CA Community College District, Election 2002, Series C, 5.000%, 09/01/20 (FSA Insured) | | | 460,000 | | | 495,466 |
Riverside, CA Community College District, 5.000%, 08/01/24 (FSA Insured) | | | 35,000 | | | 36,741 |
Riverside County, CA Perris Union High School District, Series B, 3.750%, 09/01/11 (National Insured) | | | 50,000 | | | 51,742 |
Sacramento, CA City Unified School District, Series D, 4.000%, 07/01/10 (FSA Insured) | | | 40,000 | | | 40,940 |
Sacramento, CA County Sanitation District, Series A, 5.200%, 12/01/11 | | | 150,000 | | | 158,120 |
Sacramento, CA County Sanitation District, Series A, 5.250%, 12/01/12 | | | 100,000 | | | 105,078 |
Sacramento, CA Municipal Utility District, Series S, 5.000%, 11/15/10 (FSA Insured) | | | 25,000 | | | 25,933 |
Sacramento, CA Municipal Utility District, Series R, 5.000%, 08/15/18 (National Insured) | | | 40,000 | | | 41,918 |
Sacramento, CA Municipal Utility District, Series O, 5.250%, 08/15/10 (National Insured) | | | 45,000 | | | 46,623 |
Sacramento, CA Municipal Utility District Revenue, Series S, 5.000%, 11/15/11 (National Insured) | | | 25,000 | | | 26,822 |
Sacramento, CA Regional County Sanitation District No. 1, 5.000%, 12/01/13 (AMBAC Insured) | | | 115,000 | | | 121,787 |
San Bernardino, CA Community College District, Election 2002, Series A, 6.250%, 08/01/23 | | | 420,000 | | | 492,488 |
San Bernardino, CA Community College District, Election 2002, Series A, 6.375%, 08/01/26 | | | 480,000 | | | 558,744 |
The accompanying notes are an integral part of these financial statements.
41
Managers California Intermediate Tax-Free Fund
Schedule of Portfolio Investments (continued)
| | | | | | |
| | | Principal Amount | | Value |
| | |
Municipal Bonds - 95.6% (continued) | | | | | | |
San Bernardino, CA County Transportation Authority, Series B, 4.000%, 03/01/10 (FSA Insured) | | $ | 50,000 | | $ | 50,592 |
San Bernardino, CA County Transportation Authority, Series A, 5.000%, 03/01/10 (AMBAC Insured) | | | 100,000 | | | 101,204 |
San Bernardino, CA County Transportation Authority, Series A, 6.250%, 03/01/10 (National Insured) | | | 25,000 | | | 25,399 |
San Diego County, CA Southwestern Community College District General Obligation, 4.625%, 08/01/11 (AMBAC Insured) | | | 50,000 | | | 53,481 |
San Diego, CA Public Facilities Financing Authority, Series C, 4.000%, 05/15/12 | | | 475,000 | | | 500,736 |
San Diego, CA Unified School District, Series C, 5.000%, 07/01/19 (FSA Insured) | | | 200,000 | | | 215,528 |
San Francisco, CA City & County Airport Commission Revenue, Second Series, Issue 28B, 4.000%, 05/01/11 (National Insured) | | | 20,000 | | | 20,615 |
San Francisco, CA City & County Airport Commission Revenue, Second Series, Issue 28C, 4.000%, 05/01/11 (National Insured) | | | 100,000 | | | 103,509 |
San Francisco, CA City & County Airport Commission Revenue, Second Series, Issue 29B, 4.000%, 05/01/11 (FGIC Insured) | | | 30,000 | | | 31,102 |
San Francisco, CA City & County Airport Commission Revenue, Second Series, Issue 28C, 4.000%, 05/01/12 (National Insured) | | | 250,000 | | | 262,092 |
San Francisco, CA City & County Airport Commission Revenue, Second Series, Issue 27B, 4.125%, 05/01/11 (FGIC Insured) | | | 75,000 | | | 77,825 |
San Francisco, CA City & County Airport Commission Revenue, Second Series, Issue 20, 4.500%, 05/01/10 (National Insured) | | | 50,000 | | | 50,269 |
San Francisco, CA City & County Airport Commission Revenue, Second Series, Issue 29B, 5.000%, 05/01/10 (FGIC Insured) | | | 50,000 | | | 51,061 |
San Francisco, CA City & County Airport Commission Revenue, Second Series, Issue 32F, 5.000%, 05/01/16 (FGIC Insured) | | | 45,000 | | | 49,080 |
San Francisco, CA City & County Airport Commission Revenue, Second Series, Issue 27B, 5.250%, 05/01/12 (FGIC Insured) | | | 170,000 | | | 178,388 |
San Francisco, CA City & County Airport Commission Revenue, Second Series, Issue 30, 5.250%, 05/01/15 (XLCA Insured) | | | 75,000 | | | 81,038 |
San Francisco, CA City & County Airport Commission Revenue, Second Series, Issue 32F, 5.250%, 05/01/17 (FGIC Insured) | | | 345,000 | | | 381,135 |
San Francisco, CA City & County Public Utilities Commission Revenue, Series A, 3.250%, 10/01/10 (National Insured) | | | 25,000 | | | 25,473 |
San Francisco, CA City & County Public Utilities Commission Revenue, Series A, 4.000%, 10/01/11 (National Insured) | | | 180,000 | | | 188,397 |
San Francisco, CA City & County Public Utilities Commission Revenue, Series B, 4.000%, 11/01/12 (National Insured) | | | 40,000 | | | 42,672 |
San Francisco, CA City & County Unified School District, 5.000%, 06/15/13 (FSA Insured) | | | 250,000 | | | 274,832 |
San Francisco, CA Community College District, Series B, 5.000%, 06/15/10 (AMBAC Insured) | | | 50,000 | | | 51,446 |
San Francisco, CA Community College District, Series B, 5.000%, 06/15/14 (AMBAC Insured) | | | 120,000 | | | 130,753 |
San Francisco, CA Unified School District General Obligation, Series B, 5.000%, 06/15/12 (FSA Insured) | | | 100,000 | | | 109,207 |
San Jose-Santa Clara, CA Water Financing Authority, Series A, 3.250%, 11/15/10 (FSA Insured) | | | 75,000 | | | 77,102 |
San Juan, CA Unified School District, Election 2002, Series A, 5.000%, 08/01/10 (National Insured) | | | 40,000 | | | 41,334 |
San Juan, CA Unified School District General Obligation, Series A, 5.000%, 08/01/16 (National Insured) | | | 150,000 | | | 160,557 |
Santa Barbara, CA Community College District, Election 2008, Series A, 4.000%, 08/01/10 | | | 125,000 | | | 128,244 |
Santa Clara County, CA Alum Rock Union Elementary School District General Obligation Refunding, 3.500%, 09/01/12 (FGIC Insured) | | | 15,000 | | | 15,531 |
The accompanying notes are an integral part of these financial statements.
42
Managers California Intermediate Tax-Free Fund
Schedule of Portfolio Investments (continued)
| | | | | | |
| | | Principal Amount | | Value |
| | |
Municipal Bonds - 95.6% (continued) | | | | | | |
Santa Clara County, CA East Side Union High School District, Series B, 5.000%, 08/01/12 (FGIC Insured) | | $ | 30,000 | | $ | 32,058 |
Santa Clara County, CA East Side Union High School District, Election 2002, Series D, 4.000%, 08/01/14 (XLCA Insured) | | | 40,000 | | | 41,754 |
Santa Clara County, CA East Side Union High School District General Obligation, Series F, 4.250%, 08/01/11 (FSA Insured) | | | 75,000 | | | 78,598 |
Santa Clara County, CA East Side Union High School District General Obligation, Series B, 5.250%, 02/01/24 (National Insured) | | | 40,000 | | | 41,965 |
Santa Clara, CA Unified School District General Obligation, 5.000%, 07/01/10 | | | 20,000 | | | 20,491 |
Santa Clara, CA Valley Transportation Authority, Series A, 5.000%, 06/01/23 (National Insured) | | | 60,000 | | | 64,132 |
Santa Rosa, CA High School District, Election of 2002, 5.000%, 08/01/19 (National Insured) | | | 100,000 | | | 103,507 |
Sierra Sands, CA Unified School District General Obligation, Series A, 5.000%, 11/01/22 (FGIC Insured) | | | 10,000 | �� | | 10,159 |
Solano County, CA Community College District, 4.000%, 08/01/15 (National Insured) | | | 25,000 | | | 26,608 |
Solano County, CA Community College District, 5.000%, 08/01/16 (National Insured) | | | 40,000 | | | 43,901 |
Sonoma County, CA Junior College District General Obligation, Series D, 5.000%, 08/01/16 | | | 15,000 | | | 16,886 |
Sonoma Valley, CA Unified School District, 5.125%, 08/01/25 (FGIC Insured) | | | 15,000 | | | 15,674 |
State of California, 4.750%, 11/01/10 | | | 30,000 | | | 30,044 |
State of California, 5.000%, 04/01/14 | | | 15,000 | | | 16,243 |
State of California, 5.000%, 11/01/30 | | | 330,000 | | | 358,360 |
State of California, 5.200%, 06/01/10 | | | 50,000 | | | 50,162 |
State of California, 5.250%, 10/01/18 (FGIC Insured) | | | 40,000 | | | 41,768 |
State of California, 5.500%, 02/01/10 (FGIC Insured) | | | 25,000 | | | 25,224 |
State of California, 6.600%, 02/01/10 (National Insured) | | | 560,000 | | | 566,703 |
State of California General Obligation, 5.000%, 02/01/29 | | | 15,000 | | | 16,362 |
State of California General Obligation, 5.000%, 02/01/32 | | | 50,000 | | | 54,538 |
State of California General Obligation, 5.000%, 02/01/32 (CIFG Insured) | | | 25,000 | | | 27,153 |
State of California General Obligation, 5.250%, 04/01/30 | | | 105,000 | | | 115,857 |
Sweetwater Authority, San Diego County, CA Water Revenue, Series 2005, 5.000%, 04/01/17 (AMBAC Insured) | | | 50,000 | | | 54,203 |
University of California, Revenue Bonds, Series Q, 5.000%, 09/01/11(FSA Insured) | | | 55,000 | | | 58,813 |
University of California, Revenue Bonds, Series Q, 5.000%, 09/01/18 (FSA Insured) | | | 100,000 | | | 108,963 |
University of California, Series O, 5.000%, 09/01/25 (FGIC Insured) | | | 50,000 | | | 52,434 |
University of California, Series Q, 5.000%, 09/01/33 (FSA Insured) | | | 20,000 | | | 21,793 |
Vacaville, CA Unified School District, Election 2001, 5.000%, 08/01/16 (National Insured) | | | 105,000 | | | 110,168 |
Vacaville, CA Unified School District General Obligation, 5.000%, 08/01/22 (FSA Insured) | | | 20,000 | | | 22,324 |
Vacaville, CA Unified School District General Obligation, 5.000%, 08/01/26 (National Insured) | | | 55,000 | | | 55,213 |
Vacaville, CA Unified School District General Obligation, 5.250%, 08/01/28 (FSA Insured) | | | 2,565,000 | | | 2,880,291 |
Vacaville, CA Unified School District General Obligation, Series 2003, 4.600%, 08/01/17 (FSA Insured) | | | 25,000 | | | 27,635 |
Ventura, CA Unified School District, Election 1997, Series F, 4.000%, 08/01/11 (FSA Insured) | | | 75,000 | | | 77,888 |
Wiseburn, CA School District General Obligation Refunding, Series A, 3.250%, 08/01/10 (National Insured) | | | 25,000 | | | 25,491 |
Wiseburn, CA School District, Series A, 5.000%, 08/01/16 (National Insured) | | | 75,000 | | | 79,480 |
Yuba, CA Community College District General Obligation, Series A, 5.000%, 08/01/23 (AMBAC Insured) | | | 90,000 | | | 93,206 |
Total Municipal Bonds (cost $29,447,648) | | | | | | 29,793,923 |
The accompanying notes are an integral part of these financial statements.
43
Managers California Intermediate Tax-Free Fund
Schedule of Portfolio Investments (continued)
| | | | | |
| | | Shares | | Value |
Short-Term Investments - 3.2% 1 | | | | | |
BlackRock Liquidity Funds, Institutional Class Shares - California Money Fund, 0.15% (cost $1,001,987) | | 1,001,987 | | $ | 1,001,987 |
Fidelity California AMT Tax-Free Money Market Fund, Institutional Class Shares, 0.12% (cost $67) | | 67 | | | 67 |
Total Short-Term Investments
(cost $1,002,054) | | | | | 1,002,054 |
Total Investments - 98.8%
(cost $30,449,702) 5 | | | | | 30,795,977 |
Other Assets, less Liabilities - 1.2% | | | | | 384,879 |
Net Assets - 100.0% | | | | $ | 31,180,856 |
The accompanying notes are an integral part of these financial statements.
44
Notes to Schedules of Portfolio Investments
The following footnotes and abbreviations are to be read in conjunction with the Schedules of Portfolio Investments previously presented in the report.
At October 31, 2009, the cost of securities for Federal income tax purposes and the gross aggregate unrealized appreciation and/or depreciation based on tax cost were:
| | | | | | | | | | | | | | |
Fund | | Cost | | Appreciation | | Depreciation | | | Net | |
| | | | |
Managers Small Cap | | $ | 42,914,936 | | $ | 1,647,361 | | $ | (2,607,497 | ) | | $ | (960,136 | ) |
| | | | |
Managers Micro-Cap | | | 127,301,087 | | | 17,802,077 | | | (17,324,720 | ) | | | 477,357 | |
| | | | |
Managers Institutional Micro-Cap | | | 24,892,367 | | | 3,261,267 | | | (3,878,007 | ) | | | (616,740 | ) |
| | | | |
Managers Real Estate Securities | | | 15,584,672 | | | 1,936,078 | | | (2,891,205 | ) | | | (955,127 | ) |
| | | | |
Managers California Intermediate Tax-Free | | | 30,449,702 | | | 415,292 | | | (69,017 | ) | | | 346,275 | |
| * | Non-income-producing security. |
| 1 | Yield shown for each investment company represents the October 31, 2009, seven-day average yield, which refers to the sum of the previous seven days’ dividends paid, expressed as an annual percentage. |
| 2 | Some or all of these shares were out on loan to various brokers as of October 31, 2009, amounting to: |
| | | | | | |
Fund | | Market Value | | % of Net Assets | |
| | |
Managers Small Cap | | $ | 2,007,344 | | 5.1 | % |
| 3 | Collateral received from brokers for securities lending was invested in this short-term investment. |
| 4 | On September 12, 2008, The Bank of New York Mellon established a separate sleeve of the BNY Institutional Cash Reserves Fund (Series B) to hold certain Lehman Brothers floating rate notes. The Fund’s position in Series B is being marked to market daily. |
| 5 | At October 31, 2009, the concentration of the Fund’s investments by state or territory determined as a percentage of net assets was as follows: California 98.8%. At October 31, 2009, 64.5% of the securities in the portfolio were backed by insurance of financial institutions and financial guaranty assurance agencies. Insurers with a concentration greater than 10% of net assets were as follows: National Insured 22.8%, FSA 21.8%, and FGIC 12.1%. |
Investment Definitions and Abbreviations:
| | |
| ADR/GDR: | | ADR after the name of a holding stands for American Depositary Receipt, representing ownership of foreign securities on deposit with a domestic custodian bank; a GDR (Global Depositary Receipt) is comparable, but foreign securities are held on deposit in a non-U.S. bank. The value of the ADR/GDR securities is determined or significantly influenced by trading on exchanges not located in the United States or Canada. Sponsored ADR/GDRs are initiated by the underlying foreign company. |
| |
| AMBAC: | | American Municipal Bond Assurance Corp. |
| |
| CIFG: | | CIFG, NA |
| |
| FGIC: | | Financial Guaranty Insurance Corp. |
| |
| FSA: | | FSA Capital, Inc |
| |
| National: | | National Public Finance Guarantee Corp. |
| |
| REIT: | | Real Estate Investment Trust |
| |
| REOC: | | Real Estate Operating Company |
45
Statements of Assets and Liabilities
October 31, 2009
| | | | | | | | | | | | | | | | | | | | |
| | | Managers Small
Cap Fund | | | Managers
Fremont
Micro-Cap Fund | | | Managers
Fremont
Institutional
Micro-Cap Fund | | | Managers
Real Estate
Securities Fund | | | Managers
California
Intermediate
Tax-Free Fund | |
Assets: | | | | | | | | | | | | | | | | | | | | |
Investments at value* (including securities on loan valued at $2,007,344, $0, $0, $0, $0, respectively) | | $ | 41,954,800 | | | $ | 127,778,444 | | | $ | 24,275,627 | | | $ | 14,629,545 | | | $ | 30,795,977 | |
Receivable for investments sold | | | 124,140 | | | | 254,842 | | | | 46,125 | | | | 174,443 | | | | — | |
Receivable for Fund shares sold | | | 8,099 | | | | 21,735 | | | | 57,125 | | | | 43,366 | | | | — | |
Dividends, interest and other receivables | | | 17,012 | | | | 32,374 | | | | 6,009 | | | | 11,955 | | | | 447,539 | |
Receivable from affiliate | | | — | | | | 352,721 | | | | — | | | | — | | | | — | |
Prepaid expenses | | | 14,320 | | | | 12,349 | | | | 11,325 | | | | 6,610 | | | | 2,302 | |
Total assets | | | 42,118,371 | | | | 128,452,465 | | | | 24,396,211 | | | | 14,865,919 | | | | 31,245,818 | |
Liabilities: | | | | | | | | | | | | | | | | | | | | |
Payable for Fund shares repurchased | | | 43,626 | | | | 95,778 | | | | 63,379 | | | | 8,126 | | | | 2,920 | |
Payable upon return of securities loaned | | | 2,108,439 | | | | — | | | | — | | | | — | | | | — | |
Payable for investments purchased | | | 332,818 | | | | 772,080 | | | | 144,924 | | | | 278,243 | | | | — | |
Payable to affiliate | | | — | | | | — | | | | 352,721 | | | | — | | | | — | |
Dividends payable to shareholders | | | — | | | | — | | | | — | | | | — | | | | 9,419 | |
Accrued expenses: | | | | | | | | | | | | | | | | | | | | |
Investment advisory and management fees | | | 37,801 | | | | 101,257 | | | | 15,978 | | | | — | | | | — | |
Administrative fees | | | 9,450 | | | | 28,945 | | | | 5,465 | | | | 727 | | | | 6,658 | |
Other | | | 49,831 | | | | 132,300 | | | | 51,320 | | | | 52,456 | | | | 45,965 | |
Total liabilities | | | 2,581,965 | | | | 1,130,360 | | | | 633,787 | | | | 339,552 | | | | 64,962 | |
Net Assets | | $ | 39,536,406 | | | $ | 127,322,105 | | | $ | 23,762,424 | | | $ | 14,526,367 | | | $ | 31,180,856 | |
Net Assets Represent: | | | | | | | | | | | | | | | | | | | | |
Paid-in capital | | $ | 48,906,830 | | | $ | 148,519,242 | | | $ | 28,653,613 | | | $ | 22,501,975 | | | $ | 31,284,455 | |
Undistributed net investment income (loss) | | | — | | | | 2,839 | | | | 371 | | | | 45,121 | | | | (1,581 | ) |
Accumulated net realized loss from investments | | | (8,536,355 | ) | | | (25,552,898 | ) | | | (5,242,783 | ) | | | (9,769,795 | ) | | | (448,293 | ) |
Net unrealized appreciation (depreciation) of investments | | | (834,069 | ) | | | 4,352,922 | | | | 351,223 | | | | 1,749,066 | | | | 346,275 | |
Net Assets | | $ | 39,536,406 | | | $ | 127,322,105 | | | $ | 23,762,424 | | | $ | 14,526,367 | | | $ | 31,180,856 | |
Shares outstanding | | | 2,945,384 | | | | 4,828,806 | | | | 2,871,837 | | | | 2,556,160 | | | | 2,996,878 | |
Net asset value, offering and redemption price per share | | $ | 13.42 | | | $ | 26.37 | | | $ | 8.27 | | | $ | 5.68 | | | $ | 10.40 | |
* Investments at cost | | $ | 42,788,869 | | | $ | 123,425,522 | | | $ | 23,924,404 | | | $ | 12,880,479 | | | $ | 30,449,702 | |
The accompanying notes are an integral part of these financial statements.
46
Statements of Operations
For the fiscal year ended October 31, 2009
| | | | | | | | | | | | | | | | | | | | |
| | | Managers Small
Cap Fund | | | Managers
Fremont
Micro-Cap Fund | | | Managers
Fremont
Institutional
Micro-Cap
Fund | | | Managers
Real Estate
Securities Fund | | | Managers
California
Intermediate
Tax-Free Fund | |
Investment Income: | | | | | | | | | | | | | | | | | | | | |
Dividend income | | $ | 240,135 | | | $ | 762,596 | | | $ | 149,038 | | | $ | 411,784 | | | $ | 16,415 | |
Interest income | | | — | | | | 121 | | | | — | | | | — | | | | 1,144,296 | |
Foreign withholding tax | | | (2,942 | ) | | | — | | | | — | | | | — | | | | — | |
Securities lending fees | | | 2,030 | | | | — | | | | — | | | | — | | | | — | |
Total investment income | | | 239,223 | | | | 762,717 | | | | 149,038 | | | | 411,784 | | | | 1,160,711 | |
Expenses: | | | | | | | | | | | | | | | | | | | | |
Investment management fees | | | 428,351 | | | | 1,196,644 | | | | 229,601 | | | | 86,594 | | | | 124,247 | |
Administrative fees | | | 107,088 | | | | 299,161 | | | | 57,400 | | | | 25,469 | | | | 79,819 | |
Transfer agent | | | 21,124 | | | | 390,177 | | | | 11,700 | | | | 32,938 | | | | 6,660 | |
Custodian | | | 17,328 | | | | 48,908 | | | | 29,366 | | | | 15,427 | | | | 18,280 | |
Professional fees | | | 36,187 | | | | 61,838 | | | | 37,021 | | | | 57,279 | | | | 34,364 | |
Registration fees | | | 18,998 | | | | 16,720 | | | | 17,715 | | | | 17,638 | | | | 4,023 | |
Reports to shareholders | | | 7,449 | | | | 65,644 | | | | — | | | | 15,034 | | | | 1,960 | |
Trustees fees and expenses | | | 4,911 | | | | 10,938 | | | | 1,290 | | | | 742 | | | | 3,370 | |
Miscellaneous | | | 3,438 | | | | 8,932 | | | | 13 | | | | 976 | | | | 2,392 | |
Total expenses before offsets | | | 644,874 | | | | 2,098,962 | | | | 384,106 | | | | 252,097 | | | | 275,115 | |
Expense reimbursements | | | — | | | | (231,265 | ) | | | (73,957 | ) | | | (98,692 | ) | | | (98,893 | ) |
Expense reductions | | | (19,081 | ) | | | (33,193 | ) | | | (8,448 | ) | | | (2,163 | ) | | | (220 | ) |
Net expenses | | | 625,793 | | | | 1,834,504 | | | | 301,701 | | | | 151,242 | | | | 176,002 | |
Net investment income (loss) | | | (386,570 | ) | | | (1,071,787 | ) | | | (152,663 | ) | | | 260,542 | | | | 984,709 | |
Net Realized and Unrealized Gain (Loss): | | | | | | | | | | | | | | | | | | | | |
Net realized gain (loss) on investments | | | 697,620 | | | | (21,757,590 | ) | | | (3,953,858 | ) | | | (7,061,780 | ) | | | 250,408 | |
Net unrealized appreciation of investments | | | 4,928,468 | | | | 34,913,102 | | | | 6,146,351 | | | | 7,821,113 | | | | 1,516,580 | |
Net realized and unrealized gain | | | 5,626,088 | | | | 13,155,512 | | | | 2,192,493 | | | | 759,333 | | | | 1,766,988 | |
Net increase in net assets resulting from operations | | $ | 5,239,518 | | | $ | 12,083,725 | | | $ | 2,039,830 | | | $ | 1,019,875 | | | $ | 2,751,697 | |
The accompanying notes are an integral part of these financial statements.
47
Statements of Changes in Net Assets
For the fiscal year ended October 31,
| | | | | | | | | | | | | | | | | | | | | | | | |
| | | Managers Small Cap Fund | | | Managers Fremont
Micro-Cap Fund | | | Managers Fremont
Institutional Micro-Cap Fund | |
| | | 2009 | | | 2008 | | | 2009 | | | 2008 | | | 2009 | | | 2008 | |
Increase (Decrease) in Net Assets From Operations: | | | | | | | | | | | | | | | | | | | | | | | | |
Net investment loss | | $ | (386,570 | ) | | $ | (605,290 | ) | | $ | (1,071,787 | ) | | $ | (1,800,037 | ) | | $ | (152,663 | ) | | $ | (450,002 | ) |
Net realized gain (loss) on investments | | | 697,620 | | | | 2,924,678 | | | | (21,757,590 | ) | | | 10,110,817 | | | | (3,953,858 | ) | | | 12,333,780 | |
Net unrealized appreciation (depreciation) of investments | | | 4,928,468 | | | | (30,980,059 | ) | | | 34,913,102 | | | | (104,806,788 | ) | | | 6,146,351 | | | | (45,318,730 | ) |
Net increase (decrease) in net assets resulting from operations | | | 5,239,518 | | | | (28,660,671 | ) | | | 12,083,725 | | | | (96,496,008 | ) | | | 2,039,830 | | | | (33,434,952 | ) |
Distributions to Shareholders: | | | | | | | | | | | | | | | | | | | | | | | | |
From net investment income | | | — | | | | — | | | | — | | | | — | | | | — | | | | — | |
From net realized gain on investments | | | — | | | | — | | | | (7,917,520 | ) | | | — | | | | (3,256,607 | ) | | | (13,276,494 | ) |
Total distributions to shareholders | | | — | | | | — | | | | (7,917,520 | ) | | | — | | | | (3,256,607 | ) | | | (13,276,494 | ) |
From Capital Share Transactions: | | | | | | | | | | | | | | | | | | | | | | | | |
Proceeds from sale of shares1 | | | 7,633,128 | | | | 14,957,611 | | | | 3,765,447 | | | | 6,372,989 | | | | 5,097,840 | | | | 8,195,763 | |
Reinvestment of dividends and distributions | | | — | | | | — | | | | 7,785,548 | | | | — | | | | 3,131,896 | | | | 12,682,280 | |
Cost of shares repurchased | | | (24,393,560 | ) | | | (22,254,972 | ) | | | (20,818,945 | ) | | | (49,387,600 | ) | | | (10,009,632 | ) | | | (88,630,068 | ) |
Net decrease from capital share transactions | | | (16,760,432 | ) | | | (7,297,361 | ) | | | (9,267,950 | ) | | | (43,014,611 | ) | | | (1,779,896 | ) | | | (67,752,025 | ) |
Total decrease in net assets | | | (11,520,914 | ) | | | (35,958,032 | ) | | | (5,101,745 | ) | | | (139,510,619 | ) | | | (2,996,673 | ) | | | (114,463,471 | ) |
Net Assets: | | | | | | | | | | | | | | | | | | | | | | | | |
Beginning of year | | | 51,057,320 | | | | 87,015,352 | | | | 132,423,850 | | | | 271,934,469 | | | | 26,759,097 | | | | 141,222,568 | |
End of year | | $ | 39,536,406 | | | $ | 51,057,320 | | | $ | 127,322,105 | | | $ | 132,423,850 | | | $ | 23,762,424 | | | $ | 26,759,097 | |
End of year undistributed net investment income | | | — | | | | — | | | $ | 2,839 | | | $ | 7,752 | | | $ | 371 | | | $ | 981 | |
| | | | | | | | | | | | | | | | | | | | | | | | |
Share Transactions: | | | | | | | | | | | | | | | | | | | | | | | | |
Sale of shares | | | 695,597 | | | | 987,049 | | | | 161,725 | | | | 184,730 | | | | 686,426 | | | | 699,547 | |
Reinvestment of dividends and distributions | | | — | | | | — | | | | 362,624 | | | | — | | | | 463,985 | | | | 918,613 | |
Shares repurchased | | | (2,116,995 | ) | | | (1,490,236 | ) | | | (907,457 | ) | | | (1,462,126 | ) | | | (1,376,996 | ) | | | (7,000,838 | ) |
Net decrease in shares | | | (1,421,398 | ) | | | (503,187 | ) | | | (383,108 | ) | | | (1,277,396 | ) | | | (226,585 | ) | | | (5,382,678 | ) |
| 1 | For the fiscal year ended October 31, 2009, the proceeds from the sale of shares for Small Cap includes the receipt of a market timing settlement of $25,018. |
The accompanying notes are an integral part of these financial statements.
48
Statements of Changes in Net Assets
For the fiscal year ended October 31,
| | | | | | | | | | | | | | | | |
| | | Managers Real Estate Securities Fund | | | Managers California Intermediate
Tax-Free Fund | |
| | | 2009 | | | 2008 | | | 2009 | | | 2008 | |
Increase (Decrease) in Net Assets From Operations: | | | | | | | | | | | | | | | | |
Net investment income | | $ | 260,542 | | | $ | 280,479 | | | $ | 984,709 | | | $ | 1,422,001 | |
Net realized gain (loss) on investments | | | (7,061,780 | ) | | | (2,478,209 | ) | | | 250,408 | | | | (698,701 | ) |
Net unrealized appreciation (depreciation) of investments | | | 7,821,113 | | | | (6,586,212 | ) | | | 1,516,580 | | | | (1,410,920 | ) |
Net increase (decrease) in net assets resulting from operations | | | 1,019,875 | | | | (8,783,942 | ) | | | 2,751,697 | | | | (687,620 | ) |
Distributions to Shareholders: | | | | | | | | | | | | | | | | |
From net investment income | | | (299,371 | ) | | | (233,497 | ) | | | (984,686 | ) | | | (1,422,039 | ) |
From net realized gain on investments | | | — | | | | (5,615,212 | ) | | | — | | | | (543,580 | ) |
Total distributions to shareholders | | | (299,371 | ) | | | (5,848,709 | ) | | | (984,686 | ) | | | (1,965,619 | ) |
From Capital Share Transactions: | | | | | | | | | | | | | | | | |
Proceeds from sale of shares | | | 4,960,375 | | | | 7,348,008 | | | | 3,316,692 | | | | 9,476,529 | |
Reinvestment of dividends and distributions | | | 294,105 | | | | 5,743,504 | | | | 807,882 | | | | 1,550,014 | |
Cost of shares repurchased | | | (3,814,439 | ) | | | (12,653,705 | ) | | | (7,665,822 | ) | | | (11,399,870 | ) |
Net increase (decrease) from capital share transactions | | | 1,440,041 | | | | 437,807 | | | | (3,541,248 | ) | | | (373,327 | ) |
Total increase (decrease) in net assets | | | 2,160,545 | | | | (14,194,844 | ) | | | (1,774,237 | ) | | | (3,026,566 | ) |
Net Assets: | | | | | | | | | | | | | | | | |
Beginning of year | | | 12,365,822 | | | | 26,560,666 | | | | 32,955,093 | | | | 35,981,659 | |
End of year | | $ | 14,526,367 | | | $ | 12,365,822 | | | $ | 31,180,856 | | | $ | 32,955,093 | |
End of year undistributed net investment income (loss) | | $ | 45,121 | | | $ | 41,849 | | | $ | (1,581 | ) | | $ | (1,604 | ) |
| | | | | | | | | | | | | | | | |
Share Transactions: | | | | | | | | | | | | | | | | |
Sale of shares | | | 1,139,096 | | | | 917,276 | | | | 326,236 | | | | 906,817 | |
Reinvestment of dividends and distributions | | | 64,678 | | | | 707,023 | | | | 78,990 | | | | 149,744 | |
Shares repurchased | | | (875,731 | ) | | | (1,509,721 | ) | | | (757,169 | ) | | | (1,116,251 | ) |
Net increase (decrease) in shares | | | 328,043 | | | | 114,578 | | | | (351,943 | ) | | | (59,690 | ) |
The accompanying notes are an integral part of these financial statements.
49
Financial Highlights
For a share outstanding throughout each fiscal year
| | | | | | | | | | | | | | | | | | | | |
| | | For the fiscal year ended October 31, | |
Managers Small Cap Fund | | 2009 | | | 2008 | | | 2007 | | | 2006 | | | 2005 | |
Net Asset Value, Beginning of Year | | $ | 11.69 | | | $ | 17.87 | | | $ | 15.47 | | | $ | 12.90 | | | $ | 11.10 | |
Income from Investment Operations: | | | | | | | | | | | | | | | | | | | | |
Net investment loss | | | (0.10 | )3 | | | (0.12 | )3 | | | (0.11 | )3 | | | (0.12 | )3 | | | (0.14 | )3 |
Net realized and unrealized gain (loss) on investments | | | 1.83 | 3 | | | (6.06 | )3 | | | 2.51 | 3 | | | 2.69 | 3 | | | 1.94 | 3 |
Total from investment operations | | | 1.73 | | | | (6.18 | ) | | | 2.40 | | | | 2.57 | | | | 1.80 | |
Net Asset Value, End of Year | | $ | 13.42 | | | $ | 11.69 | | | $ | 17.87 | | | $ | 15.47 | | | $ | 12.90 | |
Total Return 1 | | | 14.80 | % | | | (34.58 | )% | | | 15.51 | % | | | 19.92 | % | | | 16.13 | % |
Ratio of net expenses to average net assets | | | 1.46 | % | | | 1.41 | % | | | 1.39 | % | | | 1.38 | % | | | 1.47 | % |
Ratio of net investment loss to average net assets 1 | | | (0.90 | )% | | | (0.79 | )% | | | (0.68 | )% | | | (0.84 | )% | | | (1.10 | )% |
Portfolio turnover | | | 136 | % | | | 59 | % | | | 49 | % | | | 49 | % | | | 67 | % |
Net assets at end of year (000’s omitted) | | $ | 39,536 | | | $ | 51,057 | | | $ | 87,015 | | | $ | 89,175 | | | $ | 66,301 | |
| | | | | | | | | | | | | | | | | | | | |
Ratios absent expense offsets: 2 | | | | | | | | | | | | | | | | | | | | |
Ratio of total expenses to average net assets | | | 1.50 | % | | | 1.43 | % | | | 1.41 | % | | | 1.42 | % | | | 1.53 | % |
Ratio of net investment loss to average net assets | | | (0.94 | )% | | | (0.80 | )% | | | (0.70 | )% | | | (0.88 | )% | | | (1.16 | )% |
| | | | | | | | | | | | | | | | | | | | |
| |
| | | For the fiscal year ended October 31, | |
Managers Fremont Micro-Cap Fund | | 2009 | | | 2008 | | | 2007 | | | 2006 | | | 2005 | |
Net Asset Value, Beginning of Year | | $ | 25.41 | | | $ | 41.90 | | | $ | 34.48 | | | $ | 29.65 | | | $ | 27.86 | |
Income from Investment Operations: | | | | | | | | | | | | | | | | | | | | |
Net investment loss | | | (0.21 | )3 | | | (0.31 | )3 | | | (0.37 | )3 | | | (0.26 | )3 | | | (0.38 | ) |
Net realized and unrealized gain (loss) on investments | | | 2.73 | 3 | | | (16.18 | )3 | | | 7.79 | 3 | | | 5.09 | 3 | | | 2.17 | |
Total from investment operations | | | 2.52 | | | | (16.49 | ) | | | 7.42 | | | | 4.83 | | | | 1.79 | |
Less Distribution to Shareholders from: | | | | | | | | | | | | | | | | | | | | |
Net realized gain on investments | | | (1.56 | ) | | | — | | | | — | | | | — | | | | — | |
Total distributions to shareholders | | | (1.56 | ) | | | — | | | | — | | | | — | | | | — | |
Net Asset Value End of Year | | $ | 26.37 | | | $ | 25.41 | | | $ | 41.90 | | | $ | 34.48 | | | $ | 29.65 | |
Total Return 1 | | | 11.34 | %4 | | | (39.37 | )% | | | 21.52 | %4 | | | 16.29 | % | | | 6.42 | % |
Ratio of net expenses to average net assets | | | 1.53 | % | | | 1.54 | % | | | 1.53 | % | | | 1.54 | % | | | 1.56 | % |
Ratio of net investment loss to average net assets 1 | | | (0.90 | )% | | | (0.92 | )% | | | (1.01 | )% | | | (0.79 | )% | | | (1.11 | )% |
Portfolio turnover | | | 82 | % | | | 193 | % | | | 76 | % | | | 82 | % | | | 68 | % |
Net assets at end of year (000’s omitted) | | $ | 127,322 | | | $ | 132,424 | | | $ | 271,934 | | | $ | 303,474 | | | $ | 397,629 | |
| | | | | | | | | | | | | | | | | | | | |
Ratios absent expense offsets: 2 | | | | | | | | | | | | | | | | | | | | |
Ratio of net expenses to average net assets | | | 1.75 | % | | | 1.66 | % | | | 1.53 | % | | | 1.54 | % | | | 1.56 | % |
Ratio of net investment loss to average net assets | | | (1.12 | )% | | | (1.04 | )% | | | (1.01 | )% | | | (0.79 | )% | | | (1.11 | )% |
| | | | | | | | | | | | | | | | | | | | |
50
Financial Highlights
For a share outstanding throughout each fiscal year
| | | | | | | | | | | | | | | | | | | | |
| | | For the fiscal year ended October 31, | |
Managers Fremont Institutional Micro-Cap Fund | | 2009 | | | 2008 | | | 2007 | | | 2006 | | | 2005 | |
Net Asset Value, Beginning of Year | | $ | 8.64 | | | $ | 16.65 | | | $ | 15.07 | | | $ | 14.94 | | | $ | 14.49 | |
Income from Investment Operations: | | | | | | | | | | | | | | | | | | | | |
Net investment loss | | | (0.05 | )3 | | | (0.10 | )3 | | | (0.13 | )3 | | | (0.09 | )3 | | | — | |
Net realized and unrealized gain (loss) on investments | | | 0.79 | 3 | | | (5.87 | )3 | | | 2.99 | 3 | | | 2.36 | 3 | | | 0.97 | |
Total from investment operations | | | 0.74 | | | | (5.97 | ) | | | 2.86 | | | | 2.27 | | | | 0.97 | |
Less Distributions to Shareholders from: | | | | | | | | | | | | | | | | | | | | |
Net investment income | | | — | | | | — | | | | — | | | | — | | | | (0.00 | )# |
Net realized gain on investments | | | (1.11 | ) | | | (2.04 | ) | | | (1.28 | ) | | | (2.14 | ) | | | (0.52 | ) |
Total distribution to shareholders | | | (1.11 | ) | | | (2.04 | ) | | | (1.28 | ) | | | (2.14 | ) | | | (0.52 | ) |
Net Asset Value End of Year | | $ | 8.27 | | | $ | 8.64 | | | $ | 16.65 | | | $ | 15.07 | | | $ | 14.94 | |
Total Return 1 | | | 11.44 | %4 | | | (40.45 | )% | | | 20.48 | % | | | 16.33 | % | | | 6.54 | % |
Ratio of net expenses to average net assets | | | 1.31 | % | | | 1.30 | % | | | 1.35 | % | | | 1.35 | % | | | 1.35 | % |
Ratio of net investment loss to average net assets 1 | | | (0.66 | )% | | | (0.74 | )% | | | (0.83 | )% | | | (0.63 | )% | | | (0.89 | )% |
Portfolio turnover | | | 81 | % | | | 198 | % | | | 129 | % | | | 78 | % | | | 73 | % |
Net assets at end of year (000’s omitted) | | $ | 23,762 | | | $ | 26,759 | | | $ | 141,223 | | | $ | 259,395 | | | $ | 295,701 | |
| | | | | | | | | | | | | | | | | | | | |
Ratios absent expense offsets: 2 | | | | | | | | | | | | | | | | | | | | |
Ratio of total expenses to average net assets | | | 1.67 | % | | | 1.55 | % | | | 1.39 | % | | | 1.37 | % | | | 1.39 | % |
Ratio of net investment loss to average net assets | | | (1.02 | )% | | | (0.99 | )% | | | (0.87 | )% | | | (0.65 | )% | | | (0.93 | )% |
| | | | | | | | | | | | | | | | | | | | |
51
Financial Highlights
For a share outstanding throughout each fiscal year
| | | | | | | | | | | | | | | | | | | | |
| | | For the fiscal year ended October 31, | |
Managers Real Estate Securities Fund | | 2009 | | | 2008 | | | 2007 | | | 2006 | | | 2005 | |
Net Asset Value, Beginning of Year | | $ | 5.55 | | | $ | 12.57 | | | $ | 14.74 | | | $ | 12.86 | | | $ | 12.75 | |
Income from Investment Operations: | | | | | | | | | | | | | | | | | | | | |
Net investment income | | | 0.12 | 3 | | | 0.13 | 3 | | | 0.06 | | | | 0.18 | | | | 0.35 | |
Net realized and unrealized gain (loss) on investments | | | 0.16 | 3 | | | (4.06 | )3 | | | 0.22 | | | | 3.87 | | | | 1.86 | |
Total from investment operations | | | 0.28 | | | | (3.93 | ) | | | 0.28 | | | | 4.05 | | | | 2.21 | |
Less Distributions to Shareholders from: | | | | | | | | | | | | | | | | | | | | |
Net investment income | | | (0.15 | ) | | | (0.12 | ) | | | (0.10 | ) | | | (0.10 | ) | | | (0.35 | ) |
Net realized gain on investments | | | — | | | | (2.97 | ) | | | (2.35 | ) | | | (2.07 | ) | | | (1.75 | ) |
Total distributions to shareholders | | | (0.15 | ) | | | (3.09 | ) | | | (2.45 | ) | | | (2.17 | ) | | | (2.10 | ) |
Net Asset Value, End of Year | | $ | 5.68 | | | $ | 5.55 | | | $ | 12.57 | | | $ | 14.74 | | | $ | 12.86 | |
Total Return 1 | | | 5.77 | % | | | (38.95 | )% | | | 2.10 | % | | | 36.43 | % | | | 18.84 | % |
Ratio of net expenses to average net assets | | | 1.48 | % | | | 1.48 | % | | | 1.40 | % | | | 1.46 | % | | | 1.42 | % |
Ratio of net investment income to average net assets 1 | | | 2.56 | % | | | 1.63 | % | | | 0.82 | % | | | 0.97 | % | | | 1.93 | % |
Portfolio turnover | | | 107 | % | | | 127 | % | | | 126 | % | | | 69 | % | | | 70 | % |
Net assets at end of year (000’s omitted) | | $ | 14,526 | | | $ | 12,366 | | | $ | 26,561 | | | $ | 27,624 | | | $ | 24,903 | |
| | | | | | | | | | | | | | | | | | | | |
Ratios absent expense offsets: 2 | | | | | | | | | | | | | | | | | | | | |
Ratio of total expenses to average net assets | | | 2.47 | % | | | 1.80 | % | | | 1.41 | % | | | 1.46 | % | | | 1.54 | % |
Ratio of net investment income to average net assets | | | 1.57 | % | | | 1.31 | % | | | 0.83 | % | | | 0.97 | % | | | 1.81 | % |
| | | | | | | | | | | | | | | | | | | | |
52
Financial Highlights
For a share outstanding throughout each fiscal year
| | | | | | | | | | | | | | | | | | | | |
| | | For the fiscal year ended October 31, | |
Managers California Intermediate Tax-Free Fund | | 2009 | | | 2008 | | | 2007 | | | 2006 | | | 2005 | |
Net Asset Value, Beginning of Year | | $ | 9.84 | | | $ | 10.56 | | | $ | 10.75 | | | $ | 10.66 | | | $ | 11.17 | |
Income from Investment Operations: | | | | | | | | | | | | | | | | | | | | |
Net investment income | | | 0.32 | | | | 0.38 | | | | 0.40 | | | | 0.39 | | | | 0.39 | |
Net realized and unrealized gain (loss) on investments | | | 0.55 | | | | (0.56 | ) | | | (0.16 | ) | | | 0.25 | | | | (0.31 | ) |
Total from investment operations | | | 0.87 | | | | (0.18 | ) | | | 0.24 | | | | 0.64 | | | | 0.08 | |
Less Distributions to Shareholders from: | | | | | | | | | | | | | | | | | | | | |
Net investment income | | | (0.31 | ) | | | (0.38 | ) | | | (0.40 | ) | | | (0.40 | ) | | | (0.40 | ) |
Net realized gain on investments | | | — | | | | (0.16 | ) | | | (0.03 | ) | | | (0.15 | ) | | | (0.19 | ) |
Total distributions to shareholders | | | (0.31 | ) | | | (0.54 | ) | | | (0.43 | ) | | | (0.55 | ) | | | (0.59 | ) |
Net Asset Value, End of Year | | $ | 10.40 | | | $ | 9.84 | | | $ | 10.56 | | | $ | 10.75 | | | $ | 10.66 | |
Total Return 1 | | | 8.97 | % | | | (1.82 | )% | | | 2.23 | % | | | 6.21 | % | | | 0.92 | % |
Ratio of net expenses to average net assets | | | 0.55 | % | | | 0.55 | % | | | 0.56 | % | | | 0.55 | % | | | 0.55 | % |
Ratio of net investment income to average net assets 1 | | | 3.08 | % | | | 3.71 | % | | | 3.75 | % | | | 3.76 | % | | | 3.74 | % |
Portfolio turnover | | | 152 | % | | | 33 | % | | | 35 | % | | | 22 | % | | | 28 | % |
Net assets at end of year (000’s omitted) | | $ | 31,181 | | | $ | 32,955 | | | $ | 35,982 | | | $ | 54,144 | | | $ | 47,847 | |
| | | | | | | | | | | | | | | | | | | | |
Ratios absent expense offsets: 2 | | | | | | | | | | | | | | | | | | | | |
Ratio of total expenses to average net assets | | | 0.86 | % | | | 0.80 | % | | | 0.82 | % | | | 0.82 | % | | | 0.81 | % |
Ratio of net investment income to average net assets | | | 2.77 | % | | | 3.46 | % | | | 3.49 | % | | | 3.49 | % | | | 3.48 | % |
| | | | | | | | | | | | | | | | | | | | |
| # | Rounds to less than $0.01 per share. |
| 1 | Total returns and net investment income would have been lower had certain expenses not been reduced. (See Note 1(c) of Notes to Financial Statements.) |
| 2 | Excludes the impact of expense reimbursements or fee waivers and expense reductions such as brokerage credits, but includes non-reimbursable expenses, if any, such as interest and taxes. (See Note 1(c) of Notes to Financial Statements.) |
| 3 | Per share numbers have been calculated using average shares. |
| 4 | The Total Return is based on the Financial Statement Net Asset Values as shown above. |
53
Notes to Financial Statements
October 31, 2009
1. Summary of Significant Accounting Policies
Managers Trust I (the “Trust”) is an open-end management investment company organized as a Massachusetts business trust and registered under the Investment Company Act of 1940, as amended (the “1940 Act”). Currently, the Trust is comprised of a number of investment series. Included in this report are the Managers Small Cap Fund (“Small Cap”), Managers Fremont Micro-Cap Fund (“Micro-Cap”), Managers Fremont Institutional Micro-Cap Fund (“Institutional Micro-Cap”), Managers Real Estate Securities Fund (“Real Estate Securities”), and Managers California Intermediate Tax-Free Fund (“California Intermediate Tax-Free”), collectively the “Funds.”
The Funds’ financial statements are prepared in accordance with accounting principles generally accepted in the United States of America, which require management to make estimates and assumptions that affect the reported amounts of assets and liabilities and disclosure of contingent assets and liabilities at the date of the financial statements and the reported amounts of income and expenses during the reporting periods. Actual results could differ from those estimates and such differences may be material. The following is a summary of significant accounting policies followed by the Funds in the preparation of their financial statements:
a. Valuation of Investments
Equity securities traded on a domestic or international securities exchange are valued at the last quoted sale price, or, lacking any sales, at the last quoted bid price. Over-the-counter securities are valued at the Nasdaq Official Closing Price, if one is available. Lacking any sales, over-the-counter securities are valued at the last quoted bid price. The Funds’ investments are generally valued based on market quotations provided by third party pricing services approved by the Board of Trustees of the Funds. Under certain circumstances, the value of certain investments may be based on an evaluation of fair value, pursuant to procedures established by and under the general supervision of the Board of Trustees of the Trust. Each Fund may use the fair value of a portfolio security to calculate its NAV when, for example, (1) market quotations are not readily available because a portfolio security is not traded in a public market or the principal market in which the security trades is closed, (2) trading in a portfolio security is suspended and has not resumed before the Fund calculates its NAV, (3) a significant event affecting the value of a portfolio security is determined to have occurred between the time of the market quotation provided for a portfolio security and the time as of which the Fund calculates its NAV, (4) a security’s price has remained unchanged over a period of time (often referred to as a “stale price”), or (5) the Investment Manager determines that a market quotation is inaccurate. The Investment Manager monitors intervening events that may affect the value of securities held in each Fund’s portfolio and, in accordance with procedures adopted by the Funds’ Trustees, will adjust the prices of securities traded in foreign markets, as appropriate, to reflect the impact of events occurring subsequent to the close of such markets but prior to the time each Fund’s NAV is calculated. Fixed-income securities are valued based on valuations furnished by independent pricing services that utilize matrix systems, which reflect such factors as security prices, yields, maturities, and ratings, and are supplemented by dealer and exchange quotations. Futures contracts for which market quotations are readily available are valued at the settlement price as of the close of the futures exchange. Short-term investments having a remaining maturity of 60 days or less are valued at amortized cost, which approximates market value. Investments in other open-end regulated investment companies are valued at their end of day net asset value per share. Investments in certain mortgage-backed and stripped mortgage-backed securities, preferred stocks, convertible securities, derivatives and other debt securities not traded on an organized securities market are valued on the basis of valuations provided by dealers or by a pricing service which uses information with respect to transactions in such securities and various relationships between securities and yield to maturity in determining value. Securities (including derivatives) for which market quotations are not readily available are valued at fair value, as determined in good faith, and pursuant to procedures adopted by the Board of Trustees of the Trust. The values assigned to fair value investments are based on available information and do not necessarily represent amounts that might ultimately be realized, since such amounts depend on future developments inherent in long-term investments. Further, because of the inherent uncertainty of valuation, those estimated values may differ significantly from the values that would have been used had a ready market for the investments existed, and the differences could be material.
Generally Accepted Accounting Principles (GAAP) define fair value as the price that a Fund would receive to sell an asset or pay to transfer a liability in an orderly transaction between market participants at the measurement date. GAAP also establishes a framework for measuring fair value, and a three-level hierarchy for fair value measurements based upon the transparency of inputs to the valuation of an asset or liability. Inputs may be observable or unobservable and refer broadly to the assumptions that market participants would use in pricing the asset or liability. Observable inputs reflect the assumptions market participants would use in pricing the asset or liability based on market data obtained from sources independent of the Funds. Unobservable inputs reflect the Funds’ own assumptions about the assumptions that market participants would use in pricing the asset or liability developed based on the best information available in the circumstances. Each investment is assigned a level based upon the observability of the inputs which are significant to the overall valuation.
The three-tier hierarchy of inputs is summarized below:
Level 1 – quoted prices in active markets for identical investments
Level 2 – other significant observable inputs (including quoted prices for similar investments, interest rates, prepayment speeds, credit risk)
Level 3 – significant unobservable inputs (including the Funds’ own assumptions in determining the fair value of investments)
54
Notes to Financial Statements (continued)
The inputs or methodologies used for valuing investments are not necessarily an indication of the risk associated with investing in those investments. The following table summarizes the inputs used to value the Funds’ net assets by the above fair value hierarchy levels as of October 31, 2009:
| | | | | | | | | | | |
| | | Level 1 | | Level 2 | | Level 3 | | Total |
Small Cap | | | | | | | | | | | |
Investments in Securities | | | | | | | | | | | |
Common Stocks 1 | | $ | 38,249,323 | | | — | | — | | $ | 38,249,323 |
Short-Term Investments | | | 3,686,824 | | $ | 18,653 | | — | | | 3,705,477 |
| | | | | | | | | | | |
Total Investments in Securities | | | 41,936,147 | | | 18,653 | | — | | | 41,954,800 |
Other Financial Instruments 2 | | | — | | | — | | — | | | — |
| | | | | | | | | | | |
Totals | | $ | 41,936,147 | | $ | 18,653 | | — | | $ | 41,954,800 |
| | | | | | | | | | | |
| | | | |
| | | Level 1 | | Level 2 | | Level 3 | | Total |
Micro-Cap | | | | | | | | | | | |
Investments in Securities | | | | | | | | | | | |
Common Stocks 1 | | $ | 123,953,653 | | | — | | — | | $ | 123,953,653 |
Short-Term Investments | | | 3,824,791 | | | — | | — | | | 3,824,791 |
| | | | | | | | | | | |
Total Investments in Securities | | | 127,778,444 | | | — | | — | | | 127,778,444 |
Other Financial Instruments 2 | | | — | | | — | | — | | | — |
| | | | | | | | | | | |
Totals | | $ | 127,778,444 | | | — | | — | | $ | 127,778,444 |
| | | | | | | | | | | |
| | | | |
| | | Level 1 | | Level 2 | | Level 3 | | Total |
Institutional Micro-Cap | | | | | | | | | | | |
Investments in Securities | | | | | | | | | | | |
Common Stocks 1 | | $ | 23,211,717 | | | — | | — | | $ | 23,211,717 |
Short-Term Investments | | | 1,063,910 | | | — | | — | | | 1,063,910 |
| | | | | | | | | | | |
Total Investments in Securities | | | 24,275,627 | | | — | | — | | | 24,275,627 |
Other Financial Instruments 2 | | | — | | | — | | — | | | — |
| | | | | | | | | | | |
Totals | | $ | 24,275,627 | | | — | | — | | $ | 24,275,627 |
| | | | | | | | | | | |
55
Notes to Financial Statements (continued)
| | | | | | | | | | | |
| | | Level 1 | | Level 2 | | Level 3 | | Total |
Real Estate Securities | | | | | | | | | | | |
Investments in Securities | | | | | | | | | | | |
Common Stocks 1 | | $ | 14,473,414 | | | — | | — | | $ | 14,473,414 |
Short-Term Investments | | | 156,131 | | | — | | — | | | 156,131 |
| | | | | | | | | | | |
Total Investments in Securities | | | 14,629,545 | | | — | | — | | | 14,629,545 |
Other Financial Instruments 2 | | | — | | | — | | — | | | — |
| | | | | | | | | | | |
Totals | | $ | 14,629,545 | | | — | | — | | $ | 14,629,545 |
| | | | | | | | | | | |
| | | | |
| | | Level 1 | | Level 2 | | Level 3 | | Total |
California Intermediate Tax-Free | | | | | | | | | | | |
Investments in Securities | | | | | | | | | | | |
Municipal Bonds | | | — | | $ | 29,793,923 | | — | | $ | 29,793,923 |
Short-Term Investments | | $ | 1,002,054 | | | — | | — | | | 1,002,054 |
| | | | | | | | | | | |
Total Investments in Securities | | | 1,002,054 | | | 29,793,923 | | — | | | 30,795,977 |
Other Financial Instruments 2 | | | — | | | — | | — | | | — |
| | | | | | | | | | | |
Totals | | $ | 1,002,054 | | $ | 29,793,923 | | — | | $ | 30,795,977 |
| | | | | | | | | | | |
| 1 | All common stocks held in the Fund are Level 1 securities. For a detailed break-out of the common stocks by major industry classification, please refer to the Schedule of Portfolio Investments. |
| 2 | Other financial instruments are derivative instruments not reflected in the Schedule of Portfolio Investments, such as futures, forwards and swap contracts, which are valued at the unrealized appreciation/depreciation of the instrument. |
b. Security Transactions
Security transactions are accounted for as of the trade date. Realized gains and losses on securities sold are determined on the basis of identified cost.
c. Investment Income and Expenses
Dividend income is recorded on the ex-dividend date except certain dividends from foreign securities where the ex-dividend date may have passed. These dividends are recorded as soon as the Trust is informed of the ex-dividend date. Dividend income on foreign securities is recorded net of any withholding tax. Interest income, which includes amortization of premium and accretion of discount on debt securities, as required, is accrued as earned. Non-cash dividends included in dividend income, if any, are reported at the fair value of the securities received. Other income and expenses are recorded on an accrual basis. Expenses that cannot be directly attributed to a fund are apportioned among the Funds in the Trust and in some cases other affiliated funds based upon their relative average net assets or number of shareholders.
The following Funds had certain portfolio trades directed to various brokers, under a brokerage recapture program, which paid a portion of the Fund’s expenses. For the fiscal year ended October 31, 2009, under these arrangements the amount by which the Funds’ expenses were reduced and the impact on the expense ratios were as follows: Small Cap - $18,792 or 0.04%, Micro-Cap - $32,407 or 0.03%, Institutional Micro-Cap - $8,295 or 0.04% and Real Estate Securities - $2,101 or 0.02%.
The Funds have a “balance credit” arrangement with The Bank of New York Mellon (“BNYM”), the Funds’ custodian, whereby each Fund is credited with an interest factor equal to 0.75% below the effective 90-day T-Bill rate for account balances left uninvested overnight. If the T-Bill rate falls below 0.75%, no credits will be earned. These credits serve to reduce custody expenses that would otherwise be charged to each Fund. For the fiscal year ended October 31, 2009, the custodian expense was not reduced for any of the Funds.
56
Notes to Financial Statements (continued)
Overdrafts will cause a reduction of any earnings credits, computed at 2% above the effective Federal Funds rate on the day of the overdraft. For the fiscal year ended October 31, 2009, overdraft fees and the impact on the expense ratios, if any, for Small Cap, Micro-Cap, Institutional Micro-Cap, Real Estate Securities and California Intermediate Tax-Free equaled $226, $143, $35, $530, and $401, respectively.
The Trust also has a balance credit arrangement with its Transfer Agent, PNC Global Investment Servicing (U.S.) Inc., whereby earnings credits are used to offset banking charges and other out-of-pocket expenses. For the fiscal year ended October 31, 2009, the transfer agent expense was reduced as follows: Small Cap - $289, Micro-Cap - $786, Institutional Micro-Cap - $153, Real Estate Securities - $62 and California Intermediate Tax-Free - $220.
Total returns and net investment income for the Funds would have been lower had certain expenses not been offset. Total expenses before offsets exclude the impact of expense reimbursements or fee waivers and expense reductions such as brokerage recapture credits, but include non-reimburseable expenses, if any, such as interest and taxes.
d. Dividends and Distributions
Dividends resulting from net investment income, if any, normally will be declared and paid as follows:
Annually - Small Cap, Micro-Cap and Institutional Micro-Cap
Quarterly - Real Estate Securities
Declared daily, paid monthly - California Intermediate Tax-Free
Distributions of capital gains, if any, will be made on an annual basis and when required for Federal excise tax purposes. Income and capital gain distributions are determined in accordance with Federal income tax regulations, which may differ from generally accepted accounting principles. These differences are primarily due to differing treatments for losses deferred due to wash sales, REITs, equalization accounting for tax purposes, foreign currency, futures and market discount transactions. Permanent book and tax basis differences, if any, relating to shareholder distributions will result in reclassifications to paid-in capital. The tax character of distributions paid during the fiscal years ended October 31, 2009 and October 31, 2008 were as follows:
| | | | | | | | | | | | | | | |
| | | Small Cap | | Micro-Cap | | Institutional Micro-Cap |
| | | 2009 | | 2008 | | 2009 | | 2008 | | 2009 | | 2008 |
Distributions paid from: | | | | | | | | | | | | | | | |
Ordinary income | | — | | — | | | — | | — | | | — | | | — |
Short-term capital gains | | — | | — | | | — | | — | | | — | | $ | 7,971,110 |
Long-term capital gains | | — | | — | | $ | 7,917,520 | | — | | $ | 3,256,607 | | | 5,305,384 |
| | | | | | | | | | | | | | | |
Totals | | — | | — | | $ | 7,917,520 | | — | | $ | 3,256,607 | | $ | 13,276,494 |
| | | | | | | | | | | | | | | |
| | | | | | | | | | | | |
| | | Real Estate Securities | | California
Intermediate Tax-Free |
| | | 2009 | | 2008 | | 2009 | | 2008 |
Distributions paid from: | | | | | | | | | | | | |
Ordinary income | | $ | 299,371 | | $ | 233,497 | | $ | 984,686 | | $ | 1,422,039 |
Short-term capital gains | | | — | | | 827,608 | | | — | | | 13,965 |
Long-term capital gains | | | — | | | 4,787,604 | | | — | | | 529,615 |
| | | | | | | | | | | | |
Totals | | $ | 299,371 | | $ | 5,848,709 | | $ | 984,686 | | $ | 1,965,619 |
| | | | | | | | | | | | |
As of October 31, 2009, the components of distributable earnings (excluding unrealized appreciation/ depreciation) on a tax basis consisted of:
| | | | | | | | | | | | | | | |
| | | Small Cap | | Micro-Cap | | Institutional
Micro-Cap | | Real Estate
Securities | | California
Intermediate
Tax-Free |
Capital loss carryforward | | $ | 8,410,288 | | $ | 21,674,494 | | $ | 4,274,449 | | $ | 7,065,602 | | $ | 448,293 |
Undistributed ordinary income | | | — | | | — | | | — | | | 45,121 | | | 7,838 |
Undistributed short-term capital gains | | | — | | | — | | | — | | | — | | | — |
Undistributed long-term capital gains | | | — | | | — | | | — | | | — | | | — |
57
Notes to Financial Statements (continued)
e. Federal Taxes
Each Fund intends to comply with the requirements under Subchapter M of the Internal Revenue Code of 1986, as amended, to distribute substantially all of their taxable income and gains to their shareholders and to meet certain diversification and income requirements with respect to investment companies. Therefore, no provision for Federal income or excise tax is included in the accompanying financial statements.
Additionally, based on each Fund’s understanding of the tax rules and rates related to income, gains and transactions for the foreign jurisdictions in which it invests, each Fund will provide for foreign taxes, and where appropriate, deferred foreign taxes.
Management has analyzed the Funds’ tax positions taken on federal income tax returns for all open tax years (tax years ended October 31, 2006-2009), and has concluded that no provision for federal income tax is required in the Funds’ financial statements. The Funds are not aware of any tax position for which it is reasonably possible that the total amounts of unrecognized tax benefits will change materially in the next twelve months.
f. Capital Loss Carryovers
As of October 31, 2009 the following Funds had accumulated net realized capital loss carryovers from securities transactions for Federal income tax purposes as shown in the following chart. These amounts may be used to offset realized capital gains, if any, through the expiration dates listed.
| | | | | |
Fund | | Capital Loss
Carryover Amount | | Expires
October 31, |
Small Cap | | $ | 8,410,288 | | 2010 |
| | |
Micro-Cap | | | 21,674,494 | | 2017 |
| | |
Institutional Micro-Cap | | | 4,274,449 | | 2017 |
| | |
Real Estate Securities | | | 5,614,390 | | 2017 |
| | |
| | | 1,451,212 | | 2016 |
| | |
California Intermediate Tax-Free | | | 448,293 | | 2016 |
For the fiscal year ended October 31, 2009, Small Cap, Micro-Cap, Institutional Micro-Cap, Real Estate Securities, and California Intermediate Tax-Free utilized capital loss carryovers in the amounts of $613,164, $0, $0, $0 and $250,408, respectively.
g. Capital Stock
The Trust’s Declaration of Trust authorizes for each series the issuance of an unlimited number of shares of beneficial interest, without par value. Each Fund records sales and repurchases of its capital stock on the trade date. The cost of securities contributed to the Funds in connection with the issuance of shares is based on the valuation of those securities in accordance with the Funds’ policy on investment valuation. Dividends and distributions to shareholders are recorded on the ex-dividend date.
At October 31, 2009, certain unaffiliated shareholders, specifically omnibus accounts, individually held greater than 10% of the outstanding shares of the following Funds: Small Cap - 3 collectively own 69%; Micro-Cap - 2 collectively own 50%; Institutional Micro-Cap - 3 collectively own 43%; Real Estate Securities - 3 collectively own 68%; California Intermediate Tax-Free - 3 collectively own 68%. Transactions by these shareholders may have a material impact on their respective Funds.
2. Agreements and Transactions with Affiliates
The Trust has entered into an Investment Management Agreement under which Managers Investment Group LLC (the “Investment Manager”), an independently managed subsidiary of Affiliated Managers Group, Inc. (“AMG”), provides or oversees investment management services to the Funds. The Investment Manager selects subadvisors for each Fund (subject to Trustee approval), allocates assets among subadvisors and monitors the subadvisors’ investment programs and results. Each Fund’s investment portfolio is managed by portfolio managers who serve pursuant to subadvisory agreements with the Investment Manager.
Investment management fees are paid directly by each Fund to the Investment Manager based on average daily net assets. The annual investment management fee rates, as a percentage of average daily net assets, for the fiscal year ended October 31, 2009, were as follows:
| | | | |
Fund | | | | Investment
Management Fee |
Small Cap | | | | 1.00% |
| | |
Micro-Cap | | | | 1.00% |
| | |
Institutional Micro-Cap | | | | 1.00% |
| | |
Real Estate Securities | | | | 0.85% |
| | |
California Intermediate Tax-Free | | on first $25 million | | 0.40% |
| | |
| | on next $25 million | | 0.35% |
| | |
| | on next $50 million | | 0.30% |
| | |
| | on next $50 million | | 0.25% |
| | |
| | on balance over $150 million | | 0.20% |
The Trust has entered into an Administration and Shareholder Servicing Agreement under which the Investment Manager serves as each Fund’s administrator (the “Administrator”) and is responsible for all aspects of managing the Funds’ operations, including administration and shareholder services to each Fund, its shareholders, and certain institutions, such as bank trust departments, broker-dealers and registered investment advisers, that advise or act as an intermediary with the Funds’ shareholders. For its services, the Administrator is paid a fee at a rate of 0.25% of average net assets per annum.
The Investment Manager has contractually agreed, through at least March 1, 2010, to waive fees and pay or reimburse expenses of Micro-Cap, Institutional Micro-Cap, Real Estate Securities and
58
Notes to Financial Statements (continued)
California Intermediate Tax-Free to the extent that the total annual operating expenses (exclusive of taxes, interest, brokerage costs, acquired fund expenses and extraordinary expenses) of each Fund exceed 1.56%, 1.35%, 1.50% and 0.55%, respectively, of each Fund’s average daily net assets. Micro-Cap’s expense cap became effective January 1, 2008.
Each of Micro-Cap, Institutional Micro-Cap, Real Estate Securities and California Intermediate Tax-Free is obligated to repay the Investment Manager such amounts waived, paid or reimbursed in future years provided that the repayment occurs within thirty-six (36) months after the waiver or reimbursement and that such repayment would not cause the Funds’ expenses in any such year to exceed the previously stated expense limitation percentages of that Fund’s average daily net assets. For the fiscal year ended October 31, 2009, the cumulative amount of expense reimbursement by the Investment Manager subject to repayment by Micro-Cap, Institutional Micro-Cap, Real Estate Securities and California Intermediate Tax-Free equaled $447,014, $245,420, $148,428 and $303,313, respectively.
The aggregate annual retainer paid to each Independent Trustee is $65,000, plus $4,000 or $2,500 for each regular or special meeting attended, respectively. The Trustees’ fees and expenses are allocated among all of the Funds for which the Investment Manager serves as the advisor (the “Managers Funds”) based on the relative net assets of such Funds. The Independent Chairman of the Trusts receives an additional payment of $15,000 per year. The Chairman of the Audit Committee receives an additional payment of $5,000 per year. The “Trustees fees and expenses” shown in the financial statements represents the Funds’ allocated portion of the total fees and expenses paid by the Managers Funds.
The Funds are distributed by Managers Distributors, Inc. (“MDI”), a wholly-owned subsidiary of the Investment Manager. MDI serves as the principal underwriter for each Fund and is a registered broker-dealer and member of the Financial Industry Regulatory Authority, Inc. (“FINRA”). Shares of each Fund will be continuously offered and will be sold by brokers, dealers or other financial intermediaries who have executed selling agreements with MDI. MDI bears all the expenses of providing services pursuant to the Underwriting Agreement, including payment of the expenses relating to the distribution of Prospectuses for sales purposes and any advertising or sales literature. Certain Trustees and Officers of the Funds are Officers and/or Directors of the Investment Manager, AMG and/or MDI.
On June 23, 2009, the Securities and Exchange Commission granted an exemptive order that permits the Funds to lend and borrow money for certain temporary purposes directly to and from other eligible Funds in the Managers Family of Funds (the “Fund Family”). Participation in this interfund lending program is voluntary for both borrowing and lending Funds, and an interfund loan is only made if it benefits each participating Fund. The Investment Manager administers the program according to procedures approved by the Funds’ Board of Trustees (the “Board”), and the Board monitors the operation of the program. An interfund loan must comply with certain conditions set out in the exemptive order, which are designed to assure fairness and protect all participating Funds. For the period from June 23, 2009 through October 31, 2009, the following Funds either borrowed from or lent to other Funds in the Fund family. Micro-Cap borrowed $102,300 for 1 day paying interest of $3; Micro-Cap lent varying amounts up to $2,780,077 for 3 days earning interest of $121; Small Cap borrowed varying amounts up to $6,060,264 for 6 days paying interest of $218. The interest amounts can be found in the Statement of Operations in interest income or as miscellaneous expense.
3. Purchases and Sales of Securities
Purchases and sales of securities, excluding short-term securities, for the fiscal year ended October 31, 2009, were as follows:
| | | | | | |
Fund | | Purchases | | Sales |
Small Cap | | $ | 57,888,187 | | $ | 75,555,092 |
| | |
Micro-Cap | | | 96,654,436 | | | 109,068,608 |
| | |
Institutional Micro-Cap | | | 18,043,251 | | | 21,890,678 |
| | |
Real Estate Securities | | | 12,632,093 | | | 10,968,716 |
| | |
California Intermediate Tax-Free | | | 44,263,114 | | | 43,490,603 |
The Funds had no purchases or sales of U.S. Government securities for the fiscal year ended October 31, 2009.
4. Portfolio Securities Loaned
The Funds may participate in a securities lending program offered by BNYM, providing for the lending of securities to qualified brokers. Securities lending fees include earnings of such temporary cash investments, plus or minus any rebate to a borrower. These earnings (after any rebate) are then divided between BNYM, as a fee for its services under the program, and the Fund, according to agreed-upon rates. Collateral on all securities loaned is accepted in cash and/or government securities and is maintained at a minimum level of 102% (105% in the case of certain foreign securities) of the market value, plus interest, if applicable, of investments on loan. It is the Funds’ policy to obtain additional collateral from or return excess collateral to the borrower by the end of the next business day, following the valuation date of the securities loaned. Therefore, the value of the collateral held may be temporarily less than the value of the securities on loan. Lending securities entails a risk of loss to the Funds if and to the extent that the market value of the securities loaned were to increase and the borrower did not increase the collateral accordingly, and the borrower fails to return the securities. The Funds bear the risk of any deficiency in the amount of the collateral available for return to the borrower due to any loss on the collateral invested. Collateral received in the form of cash is invested temporarily in the BNY Institutional Cash Reserves Fund (the “ICRF”), or other short-term investments as defined in the Securities Lending Agreement with BNYM.
59
Notes to Financial Statements (continued)
In September of 2008, BNYM advised the Investment Manager that the ICRF had exposure to certain defaulted debt obligations, and that BNYM had established a separate sleeve of the ICRF to hold these securities. The net impact of these positions is not material to each Fund. Each Fund’s position, if any, in the separate sleeve of the ICRF is included in the Schedule of Portfolio Investments and the unrealized loss on such investment is included in Net Unrealized Depreciation on the Statement of Assets and Liabilities and Statement of Operations.
5. Commitments and Contingencies
In the normal course of business, the Funds may enter into contracts and agreements that contain a variety of representations and warranties, which provide general indemnifications. The maximum exposure to the Funds under these arrangements is unknown, as this would involve future claims that may be against the Funds that have not yet occurred. However, based on experience, the Funds expect the risks of loss to be remote.
6. Subsequent Events
At an in-person meeting held on September 10-11, 2009, the Trust’s Board of Trustees approved the appointment of Frontier Capital Management Co., LLC (“Frontier” or the “Subadvisor”) as the new Subadvisor of Small Cap (the “Fund”), effective September 14, 2009, and approved a new subadvisory agreement (the “New Subadvisory Agreement”) and the submission of the New Subadvisory Agreement to fund shareholders for approval. In addition, effective September 14, 2009, the Fund re-opened to new investors.
The New Subadvisory Agreement between Managers and Frontier was contingent upon approval by the Fund’s shareholders. At a special shareholders’ meeting held on December 11, 2009, the shareholders approved the New Subadvisory Agreement. In addition, in connection with shareholder approval of the New Subadvisory Agreement, the Fund will be renamed Managers Frontier Small Cap Growth Fund effective January 1, 2010.
In addition, at the Trust’s Board of Trustees meeting on September 11, 2009, the Board approved the filing of a registration statement with the Securities and Exchange Commission to establish a new share class structure for the Fund (the “Conversion”). Under the Conversion, the Fund will: (i) offer three new classes of shares called Investor Class, Service Class, and Institutional Class; (ii) redesignate the existing shares of the Fund as Service Class shares; (iii) on or around January 1, 2010 (the “Conversion Date”), transfer shareholders of the Fund to either the Institutional Class or Service Class, which will have minimum initial investment amounts of $100,000 and $25,000, respectively, depending on whether the value of shares in a shareholder’s account meets the minimum initial investment amount of the Institutional Class; and (iv) implement a new contractual expense limitation to limit total operating expenses of the Fund, subject to the exclusions described below (the “Expense Limitation”). The Conversion will not increase the Fund’s investment management fee paid or increase the annual operating expenses that shareholders currently bear, as Institutional Class and Service Class shares are expected to have lower annual operating expenses than the current shares of the Fund. Under the Expense Limitation, Institutional Class and Service Class shares’ total annual operating expenses are not expected to exceed 1.05% and 1.30%, respectively, of average daily net assets (exclusive of taxes, interest, shareholder servicing fees, distribution and service (12b-1) fees, brokerage commissions, acquired fund fees and expenses, and extraordinary items), subject to reimbursement by the Fund under certain circumstances. There will be no change in the overall value of a shareholder’s shares resulting from the Conversion, as shareholders will receive Service or Institutional Class Shares with the same net asset value as the shares currently held. Each of the three new share classes will have its own investment minimum and class specific expense structure. Shareholders of the Fund will receive a new prospectus describing the new share classes on or around the Conversion Date.
At an in-person meeting held on December 3-4, 2009, the Trust’s Board of Trustees also approved a name change for each Micro-Cap Fund. Effective January 1, 2010, the Managers Fremont Micro-Cap Fund will change its name to the Managers Micro-Cap Fund and the Managers Fremont Institutional Micro-Cap Fund will change its name to the Managers Institutional Micro-Cap Fund.
The Funds have determined that no additional material events or transactions occurred subsequent to October 31, 2009, and through December 22, 2009, the date of issuance of the Funds’ financial statements, which require additional disclosure in the Funds’ financial statements.
Tax Information (unaudited)
Each Fund hereby designates the maximum amount allowable of its net taxable income as qualified dividends as provided in the Jobs and Growth Tax Relief Reconciliation Act of 2003. The 2009 Form 1099-DIVs you receive for each Fund will show the tax status of all distributions paid to you during the respective calendar year.
Pursuant to section 852 of the Internal Revenue Code, Small Cap, Micro-Cap, Institutional Micro-Cap, Real Estate Securities and California Intermediate Tax-Free hereby designate as a capital gain distribution with respect to the taxable year ended October 31, 2009,$0, $0, $0, $0 and $0, respectively, or, if subsequently determined to be different, the net capital gains of such year.
60
Report of Independent Registered Public Accounting Firm
To the Board of Trustees of Managers Trust I and the Shareholders of Managers Small Cap Fund, Managers Fremont Micro-Cap Fund, Managers Fremont Institutional Micro-Cap Fund, Managers Real Estate Securities Fund and Managers California Intermediate Tax-Free Fund:
In our opinion, the accompanying statements of assets and liabilities, including the schedules of portfolio investments, and the related statements of operations and of changes in net assets and the financial highlights present fairly, in all material respects, the financial position of Managers Small Cap Fund, Managers Fremont Micro-Cap Fund, Managers Fremont Institutional Micro-Cap Fund, Managers Real Estate Securities Fund and Managers California Intermediate Tax-Free Fund (five of the series constituting Managers Trust I, hereafter referred to as the “Funds”) at October 31, 2009, the results of each of their operations for the year then ended, the changes in each of their net assets for each of two years in the period then ended and the financial highlights for each of the five years in the period then ended, in conformity with accounting principles generally accepted in the United States of America. These financial statements and financial highlights (hereafter referred to as “financial statements”) are the responsibility of the Funds’ management; our responsibility is to express an opinion on these financial statements based on our audits. We conducted our audits of these financial statements in accordance with the standards of the Public Company Accounting Oversight Board (United States). Those standards require that we plan and perform the audit to obtain reasonable assurance about whether the financial statements are free of material misstatement. An audit includes examining, on a test basis, evidence supporting the amounts and disclosures in the financial statements, assessing the accounting principles used and significant estimates made by management, and evaluating the overall financial statement presentation. We believe that our audits, which included confirmation of securities at October 31, 2009 by correspondence with the custodian and brokers, provide a reasonable basis for our opinion.
PricewaterhouseCoopers LLP
Philadelphia, Pennsylvania
December 22, 2009
61
Trustees and Officers
The Trustees and Officers of the Trust, their business addresses, principal occupations for the past five years and dates of birth are listed below. The Trustees provide broad supervision over the affairs of the Trust and the Funds. The Trustees are experienced executives who meet periodically throughout the year to oversee the Funds’ activities, review contractual arrangements with companies that provide services to the Funds, and review the Funds’ performance. Unless otherwise noted, the address of each Trustee or Officer is the address of the Trust: 800 Connecticut Avenue, Norwalk, Connecticut 06854.
There is no stated term of office for Trustees. Trustees serve until their resignation, retirement or removal in accordance with the Trust’s organizational documents and policies adopted by the Board from time to time. The Chairman of the Trustees, President, Treasurer and Secretary of the Trust are elected by the Trustees annually. Other officers hold office at the pleasure of the Trustees.
Independent Trustees
The following Trustees are not “interested persons” of the Trust within the meaning of the 1940 Act:
| | |
Name, Date of Birth, Number of Funds
Overseen in Fund Complex* | | Principal Occupation(s) During Past 5 Years and Other Directorships Held by Trustee |
Jack W. Aber, 9/9/37 • Trustee since 2000 • Oversees 34 Funds in Fund Complex | | Professor of Finance, Boston University School of Management (1972-Present); Trustee of Appleton Growth Fund (1 portfolio); Trustee of Third Avenue Trust (5 portfolios); Trustee of Third Avenue Variable Trust (1 portfolio). |
| |
William E. Chapman, II, 9/23/41 • Independent Chairman • Trustee since 2000 • Oversees 34 Funds in Fund Complex | | President and Owner, Longboat Retirement Planning Solutions (1998-Present); Hewitt Associates, LLC (part time) (provider of Retirement and Investment Education Seminars); Trustee of Bowdoin College (2002-Present); Director of Harding, Loevner Funds, Inc. (6 portfolios); Trustee of Third Avenue Trust (5 portfolios); Trustee of Third Avenue Variable Trust (1 portfolio). |
| |
Edward J. Kaier, 9/23/45 • Trustee since 2000 • Oversees 34 Funds in Fund Complex | | Attorney at Law and Partner, Teeters Harvey Gilboy & Kaier LLP (2007-Present); Attorney at Law and Partner, Hepburn Willcox Hamilton & Putnam, LLP (1977-2007); Trustee of Third Avenue Trust (5 portfolios); Trustee of Third Avenue Variable Trust (1 portfolio). |
| |
Steven J. Paggioli, 4/3/50 • Trustee since 2000 • Oversees 34 Funds in Fund Complex | | Consultant (2001-Present); Formerly Executive Vice President and Director, The Wadsworth Group (1986- 2001); Executive Vice President, Secretary and Director, Investment Company Administration, LLC (1990-2001); Vice President, Secretary and Director, First Fund Distributors, Inc. (1991-2001); Trustee, Professionally Managed Portfolios (22 portfolios); Advisory Board Member, Sustainable Growth Advisors, LP; Independent Director, Chase Investment Counsel (2008 – Present). |
| |
Eric Rakowski, 6/5/58 • Trustee since 2000 • Oversees 34 Funds in Fund Complex | | Professor, University of California at Berkeley School of Law (1990-Present); Director of Harding, Loevner Funds, Inc. (6 portfolios); Trustee of Third Avenue Trust (5 portfolios); Trustee of Third Avenue Variable Trust (1 portfolio). |
| |
Thomas R. Schneeweis, 5/10/47 • Trustee since 2000 • Oversees 34 Funds in Fund Complex | | Professor of Finance, University of Massachusetts (1977-Present); Director, CISDM at the University of Massachusetts, (1996-Present); President, Alternative Investment Analytics, LLC, (formerly Schneeweis Partners, LLC) (2001-Present); Partner, White Bear Partners, LLC (2007-Present); Partner, Schneeweis Capital Management, LLC (2007-Present); Partner, Schneeweis Associates, LLC (2007-Present); Partner, Northampton Capital Management, LLC (2004-Present); Partner, TRS Associates (2007-Present). |
| * | The Fund Complex consists of Managers AMG Funds, The Managers Funds, Managers Trust I and Managers Trust II. |
Interested Trustees
The following Trustees are “interested persons” of the Trust within the meaning of the 1940 Act. Mr. Dalton is an interested person by virtue of his positions with, and interest in securities of, Affiliated Managers Group, Inc. and his position with Managers Distributors, Inc. Mr. Streur is an interested person by virtue of his positions with Managers Investment Group LLC.
| | |
Name, Date of Birth, Number of Funds
Overseen in Fund Complex* | | Principal Occupation(s) During Past 5 Years and Other Directorships Held by Trustee |
Nathaniel Dalton, 9/29/66 • Trustee since 2008 • Oversees 34 Funds in Fund Complex | | Executive Vice President and Chief Operating Officer, Affiliated Managers Group, Inc., (2006-Present); Executive Vice President, Affiliated Managers Group, Inc., (2002 -2006); Executive Vice President and General Counsel, Affiliated Managers Group, Inc. (2001-2002); Senior Vice President and General Counsel, Affiliated Managers Group, Inc. (1996-2001). Director, Managers Distributors, Inc. (2000-Present). |
| |
John H. Streur, 2/6/60 • Trustee since 2008 • President since 2008 • Oversees 34 Funds in Fund Complex | | Senior Managing Partner, Managers Investment Group LLC (2006-Present); President, Managers Distributors, Inc. (2006-Present); Managing Partner, Managers Investment Group LLC (2005-2006); Chief Executive Officer, President and Chief Operating Officer, The Burridge Group LLC (1996-2004). |
Officers
| | |
Name, Date of Birth, Position(s) Held with
Fund and Length of Time Served | | Principal Occupation(s) During Past 5 Years |
Christine C. Carsman, 4/2/52 • Secretary since 2004 | | Senior Vice President and Chief Regulatory Counsel, Affiliated Managers Group, Inc. (2004-Present); Secretary, The Managers Funds, Managers AMG Funds and Managers Trust II (2004-Present); Senior Counsel, Vice President and Director of Operational Risk Management and Compliance, Wellington Management Company, LLP (1995-2004); Deputy General Counsel, The Boston Company, Inc. (1993-1995); Associate General Counsel, The Boston Company Advisors, Inc. (1991-1993); Associate, Sullivan & Worcester LLP (1987-1991). |
| |
Donald S. Rumery, 5/29/58 • Chief Financial Officer since 2007 • Treasurer since 2000 | | Senior Vice President, Managers Investment Group LLC (2005-Present); Director, Finance and Planning, The Managers Funds LLC, (1994-2004); Treasurer and Chief Financial Officer, Managers Distributors, Inc. (2000-Present); Treasurer, The Managers Funds (1995-Present); Treasurer, Managers AMG Funds (1999-Present); Treasurer, Managers Trust II (2000-Present); Secretary, Managers Trust I and Managers Trust II (2000-2004) and Secretary, The Managers Funds (1997-2004); Chief Financial Officer, The Managers Funds, Managers AMG Funds and Managers Trust II (2007-Present). |
| |
Keitha L. Kinne, 5/16/58 • Chief Operating Officer since 2007 | | Managing Partner and Chief Operating Officer, Managers Investment Group LLC (2007-Present); Chief Operating Officer, The Managers Funds, Managers AMG Funds and Managers Trust II (2007-Present); Chief Investment Officer, Managers Investment Group LLC (2008-Present); Managing Director, Legg Mason & Co., LLC (2006-2007); Managing Director, Citigroup Asset Management (2004- 2006); Senior Vice President, Prudential Investments (1999-2004). |
| |
David Kurzweil, 6/22/74 • Assistant Secretary since 2008 | | Senior Vice President and Associate Counsel, Managers Investment Group LLC (2008-Present); Assistant Secretary, The Managers Funds, Managers Trust I, Managers Trust II, and Managers AMG Funds (2008-Present); Counsel and Senior Vice President, Lazard Asset Management LLC (2003-2008). |
62
Annual Renewal of Investment Advisory Agreements
On June 4-5, 2009, the Board of Trustees, including a majority of the Trustees who are not “interested persons” of the Trust (the “Independent Trustees”), approved the Investment Management Agreement with the Investment Manager for each of the Funds identified below and the Subadvisory Agreement for each of the Subadvisors. The Independent Trustees were separately represented by independent counsel in connection with their consideration of the approval of these agreements. In considering the Investment Management and Subadvisory Agreements, the Trustees reviewed a variety of materials relating to each Fund, the Investment Manager and each Subadvisor, including comparative performance, fee and expense information for an appropriate peer group of similar mutual funds (each a “Peer Group”), performance information for relevant benchmark indices (each a “Fund Benchmark”) and, with respect to each Subadvisor, comparative performance information for an appropriate peer group of managed accounts, and, as to all other matters, other information provided to them on a periodic basis throughout the year, as well as information provided in connection with the meetings of June 4-5, 2009, regarding the nature, extent and quality of services provided by the Investment Manager and the Subadvisors under their respective agreements. Prior to voting, the Independent Trustees: (a) reviewed the foregoing information with their independent legal counsel and with management; (b) received materials from their independent legal counsel discussing the legal standards applicable to their consideration of the Investment Management Agreement and the Subadvisory Agreements; and (c) met with their independent legal counsel in private sessions at which no representatives of management were present.
Nature, extent and quality of services.
In considering the nature, extent and quality of the services provided by the Investment Manager, the Trustees reviewed information relating to the Investment Manager’s operations and personnel. Among other things, the Investment Manager provided financial information, biographical information on its supervisory and professional staff and descriptions of its organizational and management structure. The Trustees also took into account information provided periodically throughout the previous year by the Investment Manager relating to the performance of its duties with respect to the Funds and the Trustees’ familiarity with the Investment Manager’s management through Board meetings, discussions and reports. In the course of their deliberations regarding the Investment Management Agreement, the Trustees evaluated, among other things: (a) the extent and quality of the Investment Manager’s oversight of the operation and management of the Funds; (b) the quality of the search, selection and monitoring services performed by the Investment Manager in overseeing the portfolio management responsibilities of the Subadvisors; (c) the Investment Manager’s ability to supervise the Funds’ other service providers; and (d) the Investment Manager’s compliance programs. The Trustees also took into account the financial condition of the Investment Manager with respect to its ability to provide the services required under the Investment Management Agreement and to maintain contractual expense limitations for certain of the Funds.
For each Fund, the Trustees also reviewed information relating to each Subadvisor’s operations and personnel and the investment philosophy, strategies and techniques (for each Subadvisor, its “Investment Strategy”) used in managing the Fund or the portion of the Fund for which the Subadvisor has portfolio management responsibility. Among other things, the Trustees reviewed biographical information on portfolio management and other professional staff, information regarding each Subadvisor’s organizational and management structure and each Subadvisor’s brokerage policies and practices. The Trustees considered specific information provided regarding the experience of the individual or individuals at each Subadvisor with portfolio management responsibility for the portion of a Fund managed by the Subadvisor, including the information set forth in the Fund’s prospectus and statement of additional information. With respect to those Funds managed with multiple Subadvisors, the Trustees also noted information provided by the Investment Manager regarding the manner in which each Subadvisor’s Investment Strategy complements those utilized by the Fund’s other Subadvisors. In the course of their deliberations, the Trustees evaluated, among other things: (a) the services rendered by each Subadvisor in the past; (b) the qualifications and experience of the Subadvisor’s personnel; and (c) the Subadvisor’s compliance programs. The Trustees also took into account the financial condition of each Subadvisor with respect to its ability to provide the services required under its Subadvisory Agreement.
Performance.
As noted above, the Board considered each Fund’s performance during relevant time periods as compared to each Fund’s Peer Group and considered each Subadvisor’s performance as compared to an appropriate peer group of managed accounts and noted that the Board reviews on a quarterly basis detailed information about each Fund’s performance results, portfolio composition and Investment Strategies, including with respect to the portion of the Fund managed by each Subadvisor. The Board noted the Investment Manager’s expertise and resources in monitoring the performance, investment style and risk-adjusted performance of each Subadvisor. The Board also noted each Subadvisor’s performance record with respect to the Funds. The Board was mindful of the Investment Manager’s attention to monitoring each Subadvisor’s performance with respect to the Funds and its discussions with management regarding the factors that contributed to the performance of the Funds.
Advisory Fees and Profitability.
In considering the reasonableness of the advisory fee charged by the Investment Manager for managing each Fund, the Trustees noted that the Investment Manager, and not the Fund, is responsible for paying the fees charged by the Fund’s Subadvisors and, therefore, that the fees paid to the Investment Manager cover the cost of providing portfolio management services as well as the cost of providing search, selection and monitoring services in operating a “manager-of-managers” complex of mutual funds. The Trustees concluded that, in light of the additional high quality supervisory
63
Annual Renewal of Investment Advisory Agreements (continued)
services provided by the Investment Manager and the fact that the subadvisory fees are paid out of the advisory fee, the advisory fee payable by each Fund to the Investment Manager can reasonably be expected to exceed the median advisory fee for the Peer Group, which consists of many funds that do not operate with a manager-of-managers structure. In this regard, the Trustees also noted that the Investment Manager has undertaken to maintain expense limitations for certain of the Funds.
In considering the reasonableness of the advisory fee payable to the Investment Manager, the Trustees also reviewed information provided by the Investment Manager setting forth all revenues and other benefits, both direct and indirect, received by the Investment Manager and its affiliates attributable to managing each Fund and all the mutual funds in the Managers Family of Funds, the cost of providing such services and the resulting profitability to the Investment Manager and its affiliates from these relationships. The Trustees also noted the current and potential asset levels of each Fund and the willingness of the Investment Manager to waive fees and pay expenses for certain of the Funds from time to time as a means of limiting total expenses. The Trustees also considered the current asset levels of the Funds, including the effect on assets attributable to the economic and market conditions over the past year, and considered the impact on profitability of the current asset levels and any future growth of assets of the Funds. The Board took into account management’s discussion of the current advisory fee structure. In this regard, the Trustees noted that, unlike a mutual fund that is managed by a single investment adviser, the Funds operate in a manager-of-managers structure. The Trustees also noted that the subadvisory fees are paid by the Investment Manager out of its advisory fee. Based on the foregoing, the Trustees concluded that the profitability to the Investment Manager is reasonable and that the Investment Manager is not realizing material benefits from economies of scale that would warrant adjustments to the advisory fees for any Fund at this time. With respect to economies of scale, the Trustees also noted that as a Fund’s assets increase over time, the Fund may realize other economies of scale to the extent that the increase in assets is proportionally greater than the increase in certain other expenses.
Subadvisory Fees and Profitability.
In considering the reasonableness of the fee payable by the Investment Manager to each Subadvisor (other than TimesSquare Capital Management, LLC (“TimesSquare”), which is an affiliate of the Investment Manager), the Trustees relied on the ability of the Investment Manager to negotiate the terms of the Subadvisory Agreement at arm’s length as part of the manager-of-managers structure, noting that the Subadvisor is not affiliated with the Investment Manager (other than TimesSquare). In addition, the Trustees noted that the subadvisory fees are paid by the Investment Manager out of its advisory fee. Accordingly, the cost of services to be provided by the Subadvisor and the profitability to the Subadvisor of its relationship with a Fund were not material factors in the Trustees’ deliberations. For similar reasons, and based on the current size of the portion of a Fund managed by a Subadvisor, the Trustees concluded that any economies of scale being realized by the Subadvisor was not a material factor in the Trustees’ deliberations at this time.
In considering the reasonableness of the fee payable by the Investment Manager to TimesSquare, a Subadvisor to the Managers Small Cap Fund, the Trustees noted that TimesSquare is an affiliate of the Investment Manager and reviewed information provided by TimesSquare regarding the cost to TimesSquare of providing subadvisory services to the Fund and the resulting profitability from such relationship. The Trustees also noted that the subadvisory fee is paid by the Investment Manager out of the advisory fee. Based on the current size of the portion of the Fund managed by TimesSquare, the Trustees concluded that the effect of any economies of scale being realized by TimesSquare was not a material factor in the Trustees’ deliberations at this time.
In addition to the foregoing, the Trustees considered the specific factors and related conclusions set forth below with respect to each Fund.
MANAGERS REAL ESTATE SECURITIES FUND
Fund Performance.
Among other information relating to the Fund’s performance, the Trustees noted that the Fund’s performance for the 1-year, 3-year, 5-year and 10-year periods ended March 31, 2009 was above the median performance of the Peer Group for each period and above, above, above and below, respectively, the performance of the Fund Benchmark, the Dow Jones Wilshire REIT Index. The Trustees concluded that the Fund’s performance has been satisfactory.
Advisory Fees.
The Trustees noted that the Fund’s advisory fee and total expenses (net of applicable expense waivers/reimbursements) as of March 31, 2009 were both higher than the average for the Peer Group. The Trustees took into account the fact that the Investment Manager has contractually agreed, through March 1, 2010, to limit the Fund’s net annual operating expenses to 1.50%. The Board also took into account the current size of the Fund. The Trustees concluded that, in light of the nature, extent and quality of the services provided by the Investment Manager and the Subadvisor, the Fund’s performance, the foregoing expense limitation and the considerations noted above with respect to the Subadvisor and the Investment Manager, the Fund’s advisory fees are reasonable.
64
Annual Renewal of Investment Advisory Agreements (continued)
MANAGERS SMALL CAP FUND
Fund Performance.
Among other information relating to the Fund’s performance, the Trustees noted that the Fund’s performance for the 1-year, 3-year, 5-year and 10-year periods ended March 31, 2009 was above, above, above and below, respectively, the median performance of the Peer Group and above the performance of the Fund Benchmark, the Russell 2000 Growth Index, for each period. The Trustees concluded that the Fund’s performance has been satisfactory.
Advisory Fees.
The Trustees noted that the Fund’s advisory fee and total expenses (net of applicable expense waivers/reimbursements) as of March 31, 2009 were higher and lower, respectively, than the average for the Peer Group. The Trustees concluded that, in light of the nature, extent and quality of the services provided by the Investment Manager and the Subadvisor, the Fund’s performance and the considerations noted above with respect to the Subadvisor and the Investment Manager, the Fund’s advisory fees are reasonable.
MANAGERS FREMONT INSTITUTIONAL MICRO-CAP FUND
Fund Performance.
Among other information relating to the Fund’s performance, the Trustees noted that the Fund’s performance for the 1-year, 3-year, 5-year and 10-year periods ended March 31, 2009 was above the median performance of the Peer Group for each period and for the 1-year, 3-year and 5-year periods ended March 31, 2009 was above the performance of the Fund Benchmark, the Russell Microcap Index, for each period. The Trustees concluded that the Fund’s performance has been satisfactory.
Advisory Fees.
The Trustees noted that the Fund’s advisory fee and total expenses (net of applicable expense waivers/reimbursements) as of March 31, 2009 were higher and lower, respectively, than the average for the Peer Group. The Trustees took into account the fact that the Investment Manager has contractually agreed, through March 1, 2010, to limit the Fund’s net annual operating expenses to 1.35%. The Trustees concluded that, in light of the nature, extent and quality of the services provided by the Investment Manager and the Subadvisors, the Fund’s performance, the foregoing expense limitation and the considerations noted above with respect to the Subadvisors and the Investment Manager, the Fund’s advisory fees are reasonable.
MANAGERS FREMONT MICRO-CAP FUND
Fund Performance.
Among other information relating to the Fund’s performance, the Trustees noted that the Fund’s performance for the 1-year, 3-year, 5-year and 10-year periods ended March 31, 2009 was above, above, above and below, respectively, the median performance of the Peer Group and for the 1-year, 3-year and 5-year periods ended March 31, 2009 was above the performance of the Fund Benchmark, the Russell Microcap Index, for each period. The Trustees concluded that the Fund’s performance has been satisfactory.
Advisory Fees.
The Trustees noted that the Fund’s advisory fee and total expenses (net of applicable expense waivers/reimbursements) as of March 31, 2009 were both higher than the average for the Peer Group. The Trustees took into account the fact that the Investment Manager has contractually agreed, through March 1, 2010, to limit the Fund’s net annual operating expenses to 1.56%. The Board took into account the current size of the Fund. The Trustees concluded that, in light of the nature, extent and quality of the services provided by the Investment Manager and the Subadvisors, the Fund’s performance, the foregoing expense limitation and the considerations noted above with respect to the Subadvisors and the Investment Manager, the Fund’s advisory fees are reasonable.
* * * *
After consideration of the foregoing, the Trustees also reached the following conclusions regarding the Investment Management Agreement and each Subadvisory Agreement, in addition to those conclusions discussed above: (a) the Investment Manager and each Subadvisor have demonstrated that they possess the capability and resources to perform the duties required of them under the Investment Management Agreement and the applicable Subadvisory Agreements; (b) each Subadvisor’s Investment Strategy is appropriate for pursuing the applicable Fund’s investment objectives; (c) each Subadvisor is reasonably likely to execute its Investment Strategy consistently over time; and (d) the Investment Manager and each Subadvisor maintain appropriate compliance programs.
Based on all of the above-mentioned factors and their related conclusions, with no single factor or conclusion being determinative and with each Trustee not necessarily attributing the same weight to each factor, the Trustees concluded that approval of each Investment Management Agreement and each Subadvisory Agreement (as applicable) would be in the best interests of each Fund and its shareholders. Accordingly, on June 4-5, 2009, the Trustees, including a majority of the Independent Trustees, voted to approve the Investment Management Agreement and the Subadvisory Agreements (as applicable) for each Fund.
65
Annual Renewal of Investment Advisory Agreements (continued)
MANAGERS CALIFORNIA INTERMEDIATE TAX-FREE FUND
On June 4-5, 2009, the Board of Trustees, including a majority of the Trustees who are not “interested persons” of the Trust (the “Independent Trustees”), approved the Investment Management Agreement with the Investment Manager for the Managers California Intermediate Tax-Free Fund (the “Fund”). The Independent Trustees were separately represented by independent counsel in connection with their consideration of the approval of this agreement. In considering the Investment Management Agreement, the Trustees reviewed a variety of materials relating to the Fund, the Investment Manager and the Subadvisor, including performance, fee and expense information, performance information for the relevant benchmark index (the “Fund Benchmark”) and other information provided to them on a periodic basis throughout the year, as well as information provided in connection with the meetings of June 4-5, 2009, regarding the nature, extent and quality of services provided by the Investment Manager under its agreement. Prior to voting, the Independent Trustees: (a) reviewed the foregoing information with their independent legal counsel and with management; (b) received materials from their independent legal counsel discussing the legal standards applicable to their consideration of the Investment Management Agreement; and (c) met with their independent legal counsel in private sessions at which no representatives of management were present.
Nature, extent and quality of services.
In considering the nature, extent and quality of the services provided by the Investment Manager, the Trustees reviewed information relating to the Investment Manager’s operations and personnel. Among other things, the Investment Manager provided financial information, biographical information on its supervisory and professional staff and descriptions of its organizational and management structure. The Trustees also took into account information provided periodically throughout the previous year by the Investment Manager relating to the performance of its duties with respect to the Fund and the Trustees’ familiarity with the Investment Manager’s management through Board meetings, discussions and reports. In the course of their deliberations regarding the Investment Management Agreement, the Trustees evaluated, among other things: (a) the extent and quality of the Investment Manager’s oversight of the operation and management of the Fund; (b) the quality of the search, selection and monitoring services performed by the Investment Manager in overseeing the portfolio management responsibilities of the Subadvisor; (c) the Investment Manager’s ability to supervise the Fund’s other service providers; and (d) the Investment Manager’s compliance programs. The Trustees also took into account the financial condition of the Investment Manager with respect to its ability to provide the services required under the Investment Management Agreement and to maintain a contractual expense limitation for the Fund.
Performance.
Among other information relating to the Fund’s performance, the Trustees reviewed materials provided in connection with a meeting held on May 20, 2009 and noted that the Fund’s performance for the 1-year, 3-year, 5-year and 10-year periods ended March 31, 2009 was above the median performance of the Peer Group and below the performance of the Fund Benchmark, the Barclays Capital 5-Year Municipal Bond Index, for each period. The Trustees noted the fact that at meetings held on September 11-12, 2008, the Investment Manager replaced the Fund’s previous Subadvisor with a new Subadvisor, and also, previously noted that the 3-year, 5-year and 10-year performance of the new Subadvisor’s portfolio manager was strong. The Trustees concluded that management had taken appropriate steps to address the Fund’s performance.
Furthermore, the Board reviews on a quarterly basis detailed information about the Fund’s performance results, portfolio composition and the Subadvisor’s investment philosophy, strategies and techniques in managing the Fund. The Board noted the Investment Manager’s expertise and resources in monitoring the performance, investment style and risk-adjusted performance of the Subadvisor. The Board was mindful of the Investment Manager’s attention to monitoring the Subadvisor’s performance with respect to the Fund and its discussions with management regarding the factors that contributed to the performance of the Fund.
Advisory Fees and Profitability.
In considering the reasonableness of the advisory fee charged by the Investment Manager for managing the Fund, the Trustees noted that the Investment Manager, and not the Fund, is responsible for paying the fees charged by the Fund’s Subadvisor and, therefore, that the fees paid to the Investment Manager cover the cost of providing portfolio management services as well as the cost of providing search, selection and monitoring services in operating a “manager-of-managers” complex of mutual funds. The Trustees concluded that, in light of the additional high quality supervisory services provided by the Investment Manager and the fact that the subadvisory fees are paid out of the advisory fee, the advisory fee payable by the Fund to the Investment Manager can reasonably be expected to exceed the median advisory fee for an appropriate peer group of similar mutual funds, which consists of many funds that do not operate with a manager-of-managers structure. In this regard, the Trustees also noted that the Investment Manager has undertaken to maintain an expense limitation for the Fund.
In considering the reasonableness of the advisory fee payable to the Investment Manager, the Trustees also reviewed information provided by the Investment Manager setting forth all revenues and other benefits, both direct and indirect, received by the Investment Manager and its affiliates attributable to managing the Fund
66
Annual Renewal of Investment Advisory Agreements (continued)
and all the mutual funds in the Managers Family of Funds, the cost of providing such services and the resulting profitability to the Investment Manager and its affiliates from these relationships. The Trustees also noted the current and potential asset levels of the Fund and the willingness of the Investment Manager to waive fees and pay expenses for the Fund from time to time as a means of limiting the total expenses of the Fund. The Trustees also considered the current asset level of the Fund, including the effect on assets attributable to the economic and market conditions over the past year, and considered the impact on profitability of the current asset level and any future growth of assets of the Fund. The Board took into account management’s discussion of the current advisory fee structure. The Trustees also noted that the subadvisory fees are paid by the Investment Manager out of its advisory fee. Based on the foregoing, the Trustees concluded that the profitability to the Investment Manager is reasonable and that the Investment Manager is not realizing material benefits from economies of scale that would warrant adjustments to the advisory fees for the Fund at this time. With respect to economies of scale, the Trustees also noted that as the Fund’s assets increase over time, the Fund may realize other economies of scale to the extent that the increase in assets is proportionally greater than the increase in certain other expenses.
The Trustees took into account the fact that the Investment Manager has contractually agreed, through March 1, 2010, to limit the Fund’s net annual operating expenses to 0.55%. The Trustees concluded that, in light of the nature, extent and quality of the services provided by the Investment Manager and the Subadvisor, the foregoing expense limitation and the considerations noted above with respect to the Subadvisor and the Investment Manager, the Fund’s advisory fees are reasonable.
* * * *
After consideration of the foregoing, the Trustees also reached the following conclusions regarding the Investment Management Agreement, in addition to those conclusions discussed above: (a) the Investment Manager has demonstrated that it possesses the capability and resources to perform the duties required of it under the Investment Management Agreement; and (b) the Investment Manager maintains an appropriate compliance program.
Based on all of the above-mentioned factors and related conclusions, with no single factor or conclusion being determinative and with each Trustee not necessarily attributing the same weight to each factor, the Trustees concluded that approval of the Investment Management Agreement would be in the best interests of the Fund and its shareholders. Accordingly, on June 4-5, 2009, the Trustees, including a majority of the Independent Trustees, voted to approve the Investment Management Agreement for the Fund.
67
Investment Manager and Administrator
Managers Investment Group LLC
333 W. Wacker Drive
Suite 1200
Chicago, IL 60606
(800) 835-3879
Distributor
Managers Investment Group LLC
333 W. Wacker Drive
Suite 1200
Chicago, IL 60606
(800) 835-3879
Custodian
The Bank of New York Mellon
2 Hanson Place
Brooklyn, New York 11217
Legal Counsel
Ropes & Gray LLP
One International Place
Boston, Massachusetts 02110-2624
Transfer Agent
PNC Global Investment Servicing (U.S.) Inc.
Attn: Managers
P.O. Box 9769
Providence, Rhode Island 02940
(800) 548-4539

MANAGERSAND MANAGERS AMG FUNDS
| | | | |
EQUITY FUNDS | | BALANCED FUNDS |
| EMERGING MARKETS EQUITY | | CHICAGO EQUITY PARTNERS MID-CAP | | CHICAGO EQUITY PARTNERS BALANCED |
| Rexiter Capital Management Limited | | Chicago Equity Partners, LLC | | Chicago Equity Partners, LLC |
Schroder Investment Management North America Inc. | | REAL ESTATE SECURITIES | | ALTERNATIVE FUNDS |
| | Urdang Securities Management, Inc. | | FQ GLOBAL ALTERNATIVES |
| ESSEX GROWTH | | | | FQ GLOBAL ESSENTIALS |
| ESSEX LARGE CAP GROWTH | | RENAISSANCE LARGE CAP GROWTH | | First Quadrant, L.P. |
| ESSEX SMALL/MICRO CAP GROWTH | | Renaissance Group LLC | | |
| Essex Investment Management Co., LLC | | | | INCOME FUNDS |
| | SKYLINE SPECIAL EQUITIES PORTFOLIO | | BOND (MANAGERS) |
| FQ TAX-MANAGED U.S. EQUITY | | Skyline Asset Management, L.P. | | FIXED INCOME |
| FQ U.S. EQUITY | | | | GLOBAL BOND |
| First Quadrant, L.P. | | SMALL CAP | | Loomis, Sayles & Co., L.P. |
| | Frontier Capital Management Company, LLC | | |
| GW&K SMALL CAP EQUITY | | | | BOND (MANAGERS FREMONT) |
| Gannett Welsh & Kotler, LLC | | SPECIAL EQUITY | | Pacific Investment Management Co. LLC |
| | Ranger Investment Management, L.P. | | |
| INSTITUTIONAL MICRO-CAP | | Lord, Abbett & Co. LLC | | CALIFORNIA INTERMEDIATE TAX-FREE |
| MICRO-CAP | | Smith Asset Management Group, L.P. | | Miller Tabak Asset Management LLC |
| Lord, Abbett & Co. LLC | | Federated MDTA LLC | | |
| WEDGE Capital Management L.L.P. | | | | GW&K MUNICIPAL BOND |
| Next Century Growth Investors LLC | | SYSTEMATIC VALUE | | GW&K MUNICIPAL ENHANCED YIELD |
| Voyageur Asset Management Inc. | | SYSTEMATIC MID CAP VALUE | | Gannett Welsh & Kotler, LLC |
| | Systematic Financial Management, L.P. | | |
| INTERNATIONAL EQUITY | | | | HIGH YIELD |
| AllianceBernstein L.P. | | TIMESSQUARE MID CAP GROWTH | | J.P. Morgan Investment Management LLC |
| Lazard Asset Management, LLC | | TIMESSQUARE SMALL CAP GROWTH | | |
| Martin Currie Inc. | | TimesSquare Capital Management, LLC | | INTERMEDIATE DURATION GOVERNMENT |
| | | | SHORT DURATION GOVERNMENT |
| | | | Smith Breeden Associates, Inc. |
| | | | |
This report is prepared for the Funds’ shareholders. It is authorized for distribution to prospective investors only when preceded or accompanied by an effective prospectus. To receive a free copy of the prospectus or Statement of Additional Information, which includes additional information about Fund Trustees, please contact us by calling 800.835.3879. Distributed by Managers Distributors, Inc., member FINRA. A description of the policies and procedures each Fund uses to vote its proxies is available: (i) without charge, upon request, by calling 800.835.3879, or (ii) on the Securities and Exchange Commission’s (SEC) Web site at www.sec.gov. For information regarding each Fund’s proxy voting record for the 12-month period ended October 31, call 800.835.3879 or visit the SEC Web site at www.sec.gov. The Funds file their complete schedule of portfolio holdings with the SEC for the first and third quarters of each fiscal year on Form N-Q. The Funds’ Forms N-Q are available on the SEC’s website at www.sec.gov. A Fund’s Forms N-Q may be reviewed and copied at the SEC’s Public Reference Room in Washington, DC. Information on the operation of the Public Reference Room may be obtained by calling 800.SEC.0330. To review a complete list of the Funds’ portfolio holdings, or to view the most recent quarterly holdings report, semiannual report, or annual report, please visit www.managersinvest.com. www.managersinvest.com 
| | MONEY MARKET |
| | JPMorgan Investment Advisors Inc. |
| | |
| | |
| | |
| | |
| | |
| | |
| | |
| | |
| | |
| | |
| | |
| | |
| | |
| | |
| | |
| | |
| | |
| | |
| | |
| |  |
| | |
| | |
| | |
ANNUAL REPORT
Managers AMG
October 31, 2009
FQ Tax-Managed U.S. Equity Fund
FQ U.S. Equity Fund
FQ Global Alternatives Fund
FQ Global Essentials Fund
(formerly known as Managers Fremont Global Fund)

AR014-1009
Managers AMG FQ Funds
FQ Tax-Managed U.S. Equity, FQ U.S. Equity, FQ Global Alternatives, FQ Global Essentials
Annual Report—October 31, 2009
| | |
TABLE OF CONTENTS | | Page |
| |
LETTER TO SHAREHOLDERS | | 1 |
| |
ABOUT YOUR FUND’S EXPENSES | | 4 |
| |
INVESTMENT MANAGER’S COMMENTS, FUND SNAPSHOTS, AND SCHEDULES OF PORTFOLIO INVESTMENTS | | |
| |
FQ Tax-Managed U.S. Equity Fund | | 5 |
| |
FQ U.S. Equity Fund | | 12 |
| |
FQ Global Alternatives Fund | | 19 |
| |
FQ Global Essentials Fund | | 21 |
| |
FINANCIAL STATEMENTS: | | |
| |
Statements of Assets and Liabilities | | 23 |
| |
FQ Tax-Managed U.S. Equity and FQ U.S. Equity | | |
Fund balance sheets, net asset value (NAV) per share computations and cumulative undistributed amounts | | |
| |
Statement of Net Assets | | 24 |
| |
FQ Global Alternatives and FQ Global Essentials | | |
Portfolio of Investments, Fund balance sheet, net asset value (NAV) per share computation and cumulative undistributed amounts | | |
| |
Statements of Operations | | 26 |
Detail of sources of income, Fund expenses, and realized and unrealized gains (losses) during the fiscal year | | |
| |
Statements of Changes in Net Assets | | 27 |
Detail of changes in Fund assets for the past two fiscal years | | |
| |
FINANCIAL HIGHLIGHTS | | 29 |
Historical net asset values per share, distributions, total returns, expense ratios, turnover ratios and net assets | | |
| |
NOTES TO FINANCIAL STATEMENTS | | 35 |
Accounting and distribution policies, details of agreements and transactions with Fund management and affiliates, and descriptions of certain investment risks | | |
| |
REPORT OF INDEPENDENT REGISTERED PUBLIC ACCOUNTING FIRM | | 48 |
| |
TRUSTEES AND OFFICERS | | 49 |
| |
ANNUAL RENEWAL OF INVESTMENT ADVISORY AGREEMENTS | | 50 |
Nothing contained herein is to be considered an offer, sale or solicitation of an offer to buy shares of any series of the Managers Family of Funds. Such offering is made only by Prospectus, which includes details as to offering price and other material information.
Letter to Shareholders
Dear Shareholders:
The past twelve months will go down in the history books as one of the wildest rides in the history of Wall Street. Early in the period, securities markets were under severe pressure as the credit crisis, which began in the summer of 2007, accelerated in the fourth quarter of last year amid ongoing concerns about deteriorating economic conditions and the health of some of the most prominent financial institutions. Banks of all sizes remained under pressure, which led to continued consolidation within the industry. Wachovia agreed to sell itself to Wells Fargo & Co. while PNC agreed to acquire the troubled National City. Meanwhile, the U.S. Government attempted to stabilize the system by formally bailing out companies like Citigroup and by providing injections of capital into hundreds of other financial institutions. Like a sprawling fire, the crises extended to other industries with the automakers finding themselves on the verge of collapse. Once again, the U.S. Government stepped in and in late December 2008, President Bush approved an emergency bailout of the U.S. auto industry, offering $17.4 billion in rescue loans to Chrysler and General Motors with the expectation that the companies would move quickly to develop acceptable plans for long-term viability.
Consumer and investor confidence continued to sink in the early part of 2009 despite the U.S. Government’s aggressive efforts to restore the economy and stabilize the financial markets. During January, February, and early March, stocks plunged, sending broad indexes to levels not seen since the mid to late 1990s. From peak (October 10, 2007) to trough (March 9, 2009), stocks, as measured by the S&P 500 Index, lost 55.5%, the Index’s steepest decline since the Great Depression. Then, on March 10, a very sharp recovery began amid preliminary signs that the Government’s efforts might be starting to bear fruit. More specifically, Citigroup, which had been under extreme pressure and was essentially bailed out by the Government, reported that it returned to profitability in the months of January and February. Citigroup’s surprising news seemed to ignite the markets, contributing to a more than 6% gain for the S&P 500 Index and set the stage for a sharp recovery in equities and extended the rally in credit sensitive fixed income securities.
For the entire one-year period ended October 31, 2009, large-cap stocks outperformed their smaller-cap brethren with the Russell 1000® (large cap), Russell 2000® (small cap), Russell 3000® (all cap), and the Russell Microcap® Indexes returning 11.2%, 6.5%, 10.8%, and 5.1%, respectively. International stocks outperformed their domestic counterparts by a wide margin as the MSCI EAFE Index returned 27.7%, thanks partly to weakness in the U.S. Dollar during this period. Over the same time period, REITs underperformed domestic U.S. equities as the Dow Jones U.S. Select REIT Index returned -0.3%. Fixed income securities in the U.S. and abroad moved substantially higher during the period as investors capitalized on opportunities in various fixed income segments, with the broad high-quality indexes such as the Barclays Capital U.S. Aggregate Bond and the Barclays Capital Global Aggregate ex US Indexes, returning 13.8% and 21.3%, respectively. Within the fixed income markets, lower-quality securities posted the best results as investors took advantage of extraordinarily wide spreads. This is best exemplified by the 48.1% and 6.3% returns generated by the Barclays Capital US Corporate High Yield Index and the Barclays Capital U.S. Government –Treasury Index, respectively.
Against this backdrop, for the one-year period ended October 31, 2009, the Managers AMG FQ U.S. Equity Fund (“U.S. Equity Fund”) returned 5.56% and the Managers AMG FQ Tax-Managed U.S. Equity Fund (“Tax-Managed Fund”) returned 1.65% compared to 10.83% for the benchmark Russell 3000® Index. The Managers AMG FQ Global Alternatives Fund (“Global Alternatives Fund”) returned -3.15% compared to a return of
1
Letter to Shareholders (continued)
0.10% for the benchmark, Citigroup 1-Month U.S. Treasury Bill Index for the one-year period ended October 31, 2009. Finally, the Managers AMG FQ Global Essentials Fund (“Global Essentials Fund”) returned 19.67%, compared with 8.96% for its benchmark, which consists of 60% of the return of MSCI World (hedged) Index and 40% of the return of the Citigroup World Government Bond (hedged) Index for this same one-year period.
| | | | | | | | | | | | | | | | | |
Periods Ended 10/31/09 | | 6 Months | | | 1 Year | | | 3 Years | | | 5 Years | | | 10 Years | | | Inception
Date |
FQ Tax-Managed U.S. Equity, Institutional Class | | 15.24 | % | | 1.65 | % | | (9.84 | )% | | 0.76 | % | | — | | | 12/18/2000 |
Russell 3000® Index | | 19.77 | % | | 10.83 | % | | (6.98 | )% | | 0.71 | % | | (0.14 | )% | | 12/18/2000 |
FQ U.S. Equity, Institutional Class | | 17.82 | % | | 5.56 | % | | (7.87 | )% | | 1.36 | % | | (0.78 | )% | | 8/14/1992 |
Russell 3000® Index | | 19.77 | % | | 10.83 | % | | (6.98 | )% | | 0.71 | % | | (0.14 | )% | | 8/14/1992 |
FQ Global Alternatives, Class A (No Load) | | 2.47 | % | | (3.15 | )% | | 4.13 | % | | — | | | — | | | 3/30/2006 |
Citigroup 1-Month U.S. Treasury Bill Index1 | | 0.05 | % | | 0.10 | % | | 2.27 | % | | — | | | — | | | 3/31/2006 |
FQ Global Essentials Fund | | 22.37 | % | | 19.67 | % | | (4.96 | )% | | 1.39 | % | | 1.17 | % | | 11/18/1988 |
60% MSCI World Index (hedged) & 40% Citigroup World Government Bond Index (hedged) | | 11.05 | % | | 8.96 | % | | (3.10 | )% | | 2.46 | % | | 1.27 | % | | 11/18/1988 |
| 1 | Performance for the Citigroup 1-Month U.S. Treasury Bill Index reflects an inception date of March 31, 2006. |
Performance for all share classes and detailed Fund positioning reviews are included within this report.
Both the U.S. Equity and Tax-Managed Funds delivered positive absolute returns for the year but failed to keep pace with their benchmark. Both Funds experienced negative stock selection impact from holdings within the energy, health care, and information technology sectors. Although the style positioning of the Funds remains somewhat neutral versus the benchmark, the Tax-Managed Fund benefited from a mild tilt towards smaller-capitalization securities which rallied more sharply than their larger-capitalization counterparts since the market turn in early March.
The Funds’ subadvisor, First Quadrant L.P. (“First Quadrant”), continues to have concerns about the sustainability of the recovery being driven as it is by government intervention. First Quadrant expects the economy to potentially be adversely impacted as government support begins to be withdrawn and expects slower growth to become the “new normal.” On a positive note, First Quadrant continues to see many companies in the U.S. increasingly able to capture growth from outside the country, particularly in the emerging markets. Overall, the Funds continue to tilt towards higher-quality holdings and are well diversified on a broader portfolio and sector level with only modest active weights on a sector by sector basis relative to the benchmark Russell 3000® Index.
For the 12 months ending October 31, 2009, the Managers AMG FQ Global Alternatives Fund returned -3.15%, compared with 0.10% for its benchmark, the Citigroup 1-Month U.S. Treasury Bill Index. The Global Alternatives Fund delivered modestly negative performance during this time but continued to provide a good, low correlation alternative to broader portfolios. Within the Fund, solid performance within the asset class selection strategy was counteracted by neutral to negative performance within the Fund’s other three strategies; equity country selection, bond country selection, and currency.
2
Letter to Shareholders (continued)
The tactical risk allocation in the Global Alternatives Fund has recently found its most compelling opportunities within the currency selection strategy where the largest active positions are long positions to the U.S. Dollar and Japanese Yen and short positions to the Canadian Dollar and Swiss Franc. The largest active equity country selection position is the short to the Australian equity market while the largest active bond country selection position is the long to the U.S. bond market. Finally, although a successful strategy for the Fund throughout the course of 2009, the asset class strategy finds little compelling opportunity currently in the comparison of global equities to global bonds and, therefore, maintains just a modest tilt towards global equities.
For the 12 months ended October 31, 2009, the Managers AMG FQ Global Essentials Fund returned 19.67%, compared with 8.96% for its benchmark, which consists of 60% of the return of MSCI World (hedged) Index and 40% of the return of the Citigroup World Government Bond (hedged) Index. The solid absolute and relative performance during this period was led by both the asset allocation within the Fund (overweight to global equities) and strong positioning within the asset classes as well. In addition, towards the end of the fiscal year, the Fund’s Board of Trustees approved a change from the existing multi-manager subadvisor structure, which included First Quadrant as one of its subadvisors, to a single subadvisor structure with First Quadrant as the sole subadvisor. Utilizing a comprehensive global balanced investment discipline, First Quadrant has developed what we believe will improve results to our historic structure. We believe that the changes made will result in a Fund that will provide investors with a unique and innovative investment approach that will continue to meet the needs of a global balanced investor.
One of our foremost goals at Managers Investment Group is to structure and manage mutual funds that will help our shareholders and clients become more successful in reaching their investment goals and objectives. Each of our Funds is geared to provide investors with exposure to a specific asset class, combination of asset classes, or segment of the market. Investors tend to use our Funds as part of their overall asset allocation in order to structure a well-diversified portfolio intended to meet individual needs. Most of our Funds, like the Managers AMG FQ U.S. Equity Fund, Managers AMG FQ Tax-Managed U.S. Equity Fund, Managers AMG FQ Global Alternatives Fund, and the Managers AMG FQ Global Essentials Fund are therefore designed to be building blocks.
The following report covers the one-year period ended October 31, 2009. Should you have any questions about this report, or if you’d like to receive a prospectus and additional information, including fees and expenses for these or any of the other Funds in our family, please feel free to contact us at 1-800-835-3879, or visit our Web site at www.managersinvest.com. As always, please read the prospectus carefully before you invest or send money.
If you are curious about how you can better diversify your investment program, visit the Knowledge Center on our Web site and view our articles in the investment strategies section. You can rest assured that under all market conditions our team is focused on delivering excellent investment management services for your benefit.
We thank you for your continued confidence and investment in The Managers Funds.
Respectfully,
|
 |
| John H. Streur |
Senior Managing Partner Managers Investment Group LLC |
3
About Your Fund’s Expenses
As a shareholder of a Fund, you may incur two types of costs: (1) transaction costs, which may include sales charges (loads) on purchase payments; redemption fees; and exchange fees; and (2) ongoing costs, including management fees; distribution (12b-1) fees; and other Fund expenses. This example is intended to help you understand your ongoing costs (in dollars) of investing in the Fund and to compare these costs with the ongoing costs of investing in other mutual funds. The example is based on $1,000 invested at the beginning of the period and held for the entire period as indicated below.
Actual Expenses
The first line of the following table provides information about the actual account values and actual expenses. You may use the information in this line, together with the amount you invested, to estimate the expenses that you paid over the period. Simply divide your account value by $1,000 (for example, an $8,600 account value divided by $1,000 = 8.6), then multiply the result by the number in the first line under the heading entitled “Expenses Paid During Period” to estimate the expenses you paid on your account during this period.
Hypothetical Example for Comparison Purposes
The second line of the following table provides information about hypothetical account values and hypothetical expenses based on the Fund’s actual expense ratio and an assumed annual rate of return of 5% before expenses, which is not the Fund’s actual return. The hypothetical account values and expenses may not be used to estimate the actual ending account balance or expenses you paid for the period. You may use this information to compare the ongoing costs of investing in the Fund and other funds by comparing this 5% hypothetical example with the 5% hypothetical examples that appear in the shareholder reports of other funds.
Please note that the expenses shown in the table are meant to highlight your ongoing costs only and do not reflect any transactional costs, such as sales charges (loads), redemption fees, or exchange fees. Therefore, the second line of the table is useful in comparing ongoing costs only, and will not help you determine the relative total costs of owning different funds.
| | | | | | | | | | | | |
Six Months Ended October 31, 2009 | | Expense
Ratio for
the Period | | | Beginning
Account Value
05/01/09 | | Ending
Account Value
10/31/09 | | Expenses
Paid During
the Period* |
FQ Tax-Managed U.S. Equity Fund | | | | | | | | | | | | |
Class A Shares | | | | | | | | | | | | |
Based on Actual Fund Return | | 1.24 | % | | $ | 1,000 | | $ | 1,015 | | $ | 6.30 |
Hypothetical (5% return before expenses) | | 1.24 | % | | $ | 1,000 | | $ | 1,019 | | $ | 6.31 |
Class C Shares | | | | | | | | | | | | |
Based on Actual Fund Return | | 1.99 | % | | $ | 1,000 | | $ | 1,007 | | $ | 10.06 |
Hypothetical (5% return before expenses) | | 1.99 | % | | $ | 1,000 | | $ | 1,015 | | $ | 10.11 |
Institutional Class Shares | | | | | | | | | | | | |
Based on Actual Fund Return | | 0.99 | % | | $ | 1,000 | | $ | 1,017 | | $ | 5.03 |
Hypothetical (5% return before expenses) | | 0.99 | % | | $ | 1,000 | | $ | 1,020 | | $ | 5.04 |
| | | | |
FQ U.S. Equity Fund | | | | | | | | | | | | |
Class A Shares | | | | | | | | | | | | |
Based on Actual Fund Return | | 1.04 | % | | $ | 1,000 | | $ | 1,052 | | $ | 5.38 |
Hypothetical (5% return before expenses) | | 1.04 | % | | $ | 1,000 | | $ | 1,020 | | $ | 5.30 |
Class C Shares | | | | | | | | | | | | |
Based on Actual Fund Return | | 1.79 | % | | $ | 1,000 | | $ | 1,044 | | $ | 9.22 |
Hypothetical (5% return before expenses) | | 1.79 | % | | $ | 1,000 | | $ | 1,016 | | $ | 9.10 |
Institutional Class Shares | | | | | | | | | | | | |
Based on Actual Fund Return | | 0.79 | % | | $ | 1,000 | | $ | 1,056 | | $ | 4.09 |
Hypothetical (5% return before expenses) | | 0.79 | % | | $ | 1,000 | | $ | 1,021 | | $ | 4.02 |
| | | | |
FQ Global Alternatives Fund | | | | | | | | | | | | |
Class A Shares | | | | | | | | | | | | |
Based on Actual Fund Return | | 1.99 | % | | $ | 1,000 | | $ | 969 | | $ | 9.87 |
Hypothetical (5% return before expenses) | | 1.99 | % | | $ | 1,000 | | $ | 1,015 | | $ | 10.11 |
Class C Shares | | | | | | | | | | | | |
Based on Actual Fund Return | | 2.74 | % | | $ | 1,000 | | $ | 961 | | $ | 13.55 |
Hypothetical (5% return before expenses) | | 2.74 | % | | $ | 1,000 | | $ | 1,011 | | $ | 13.89 |
| | | | |
FQ Global Essentials Fund | | | | | | | | | | | | |
Based on Actual Fund Return | | 0.99 | % | | $ | 1,000 | | $ | 1,197 | | $ | 5.48 |
Hypothetical (5% return before expenses) | | 0.99 | % | | $ | 1,000 | | $ | 1,020 | | $ | 5.04 |
| * | Expenses are equal to the Fund’s annualized expense ratio multiplied by the average account value over the period, multiplied by the number of days in the most recent fiscal half-year (184), then divided by 365. |
4
Managers AMG FQ Tax-Managed U.S. Equity Fund
Portfolio Manager’s Comments
For the fiscal year ended October 31, 2009, the Fund’s Institutional class returned 1.65% compared to 10.83% for its benchmark Russell 3000® Index. Please refer to the table on page 6 for returns for various classes of shares.
The past twelve months will go down in the history books as one of the wildest rides in the history of Wall Street. Early in the period, securities markets were under severe pressure as the credit crises, which began in the summer of 2007, accelerated in the fourth quarter of last year amid ongoing concerns about deteriorating economic conditions and the health of some of our most prominent financial institutions. Banks of all sizes remained under pressure, which led to continued consolidation within the industry. Wachovia agreed to sell itself to Wells Fargo & Co. while PNC agreed to acquire the troubled National City. Meanwhile, the U.S. Government attempted to stabilize the system by formally bailing out companies like Citigroup and by providing injections of capital into hundreds of other financial institutions. Like a sprawling fire, the crisis extended to other industries with the automakers finding themselves on the verge of collapse. Once again, the U.S. Government stepped in and in late December 2008, President Bush approved an emergency bailout of the U.S. auto industry. Consumer and investor confidence continued to sink in the early part of 2009 despite the U.S. Government’s aggressive efforts to restore the economy and stabilize the financial markets. During January, February, and early March, stocks plunged, sending broad indexes to levels not seen since the mid to late 1990s. From peak (October 10, 2007) to trough (March 9, 2009), stocks, as measured by the S&P 500 Index, lost 55.5%, marking this Index’s steepest decline since the Great Depression. Then, on March 10, a very sharp recovery began amid preliminary signs that the Government’s efforts might be starting to bear fruit. More specifically, Citigroup, which had been under extreme pressure and was essentially bailed out by the Government, reported that it returned to profitability in the months of January and February. Citigroup’s surprising news seemed to ignite the markets and set the stage for a sharp recovery in equities.
The Fund delivered positive absolute returns for the year but failed to keep pace with its benchmark. Relative to the benchmark, the Fund experienced negative stock selection within several sectors including consumer staples, financials, and information technology which was not mitigated by positive results within the consumer discretionary and health care sectors. Relative sector positioning did not add or detract significant value, mainly due to the mostly neutral benchmark sector and style positioning the Fund maintained throughout the year. However, an overweight to the recovering consumer discretionary sector did add modest value. The Fund also benefited from a mild tilt towards smaller-capitalization securities which rallied more sharply than their larger capitalization counterparts since the market turn in early March.
The Fund’s subadvisor, First Quadrant L.P. (“First Quadrant”), continues to have concerns about the sustainability of the recovery being driven as it is by government intervention. First Quadrant expects the economy to potentially be adversely impacted as government support begins to be withdrawn and expects slower growth to become the “new normal.” One of the positives First Quadrant continues to see in that regard is many companies in the U.S. have been increasingly able to capture growth from outside the country, particularly in the emerging markets. Overall, the Fund continues to tilt towards higher quality holdings and is well diversified on a broader portfolio and sector level with only modest active weights on a sector by sector basis relative to the benchmark Russell 3000® Index.
Cumulative Total Return Performance
Managers AMG FQ Tax-Managed U.S. Equity Fund’s cumulative total return is based on the daily change in net asset value (NAV), and assumes that all distributions were reinvested. The Russell 3000® Index is composed of the 3000 largest U.S. companies as measured by market capitalization, and represents about 98% of the U.S. stock market. Unlike the Fund, the Russell 3000® Index is unmanaged, is not available for investment, and does not incur expenses. The chart on page 6 illustrates the performance of a hypothetical $10,000 investment made in the Institutional Class Shares of the Fund on December 18, 2000 (commencement of operations) to a $10,000 investment made in the Russell 3000® Index for the same time periods. Performance for periods longer than one year is annualized. Figures include reinvestment of capital gains and dividends. The listed returns for the Fund are net of expenses and the returns for the indices exclude expenses. Total returns for the Fund would have been lower had certain expenses not been reduced.
5
Managers AMG FQ Tax-Managed U.S. Equity Fund
Portfolio Manager’s Comments (continued)
Cumulative Total Return Performance
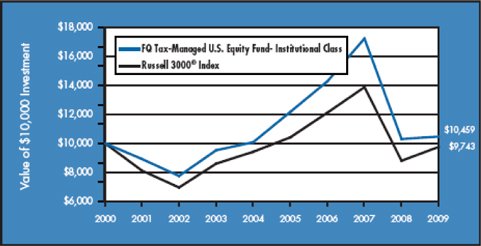
The table below shows the average annualized total returns for the Managers AMG FQ Tax-Managed U.S. Equity Fund since inception and the Russell 3000® Index from December 18, 2000 to October 31, 2009.
| | | | | | | | | | | |
Average Annual Total Returns 1 | | One Year | | | Five Years | | | Since Inception | | | Inception Date |
Managers AMG FQ Tax- Managed U.S. Equity Fund 2,5,6 | | | | | | | | | | | |
No Load Before Tax: | | | | | | | | | | | |
Institutional Class | | 1.65 | % | | 0.76 | % | | 0.51 | % | | 12/18/00 |
Class A* | | 1.53 | % | | — | | | (6.50 | )% | | 03/01/06 |
Class C* | | 0.66 | % | | — | | | (7.22 | )% | | 03/01/06 |
Russell 3000® Index 4 | | 10.83 | % | | 0.71 | % | | (0.29 | )% | | |
| | | | |
No Load After Tax on Distributions3 | | | | | | | | | | | |
Institutional Class | | 1.36 | % | | 0.65 | % | | 0.40 | % | | 12/18/00 |
Class A* | | 1.32 | % | | — | | | (6.57 | )% | | 03/01/06 |
Class C* | | 0.63 | % | | — | | | (7.22 | )% | | 03/01/06 |
No Load After Tax on Distributions & sale of shares3 | | | | | | | | | | | |
Institutional Class | | 1.33 | % | | 0.64 | % | | 0.41 | % | | 12/18/00 |
Class A* | | 1.17 | % | | — | | | (5.45 | )% | | 03/01/06 |
Class C* | | 0.45 | % | | — | | | (6.04 | )% | | 03/01/06 |
With Load Before Tax: | | | | | | | | | | | |
Class A* | | (4.32 | )% | | — | | | (7.99 | )% | | 03/01/06 |
Class C* | | (0.34 | )% | | — | | | (7.22 | )% | | 03/01/06 |
| | | | |
With Load After Tax on Distributions3 | | | | | | | | | | | |
Class A* | | (4.51 | )% | | — | | | (8.05 | )% | | 03/01/06 |
Class C* | | (0.37 | )% | | — | | | (7.22 | )% | | 03/01/06 |
With Load After Tax on Distributions & sale of shares3 | | | | | | | | | | | |
Class A* | | (2.64 | )% | | — | | | (6.68 | )% | | 03/01/06 |
Class C* | | (0.20 | )% | | — | | | (6.04 | )% | | 03/01/06 |
| * | Class A and Class C shares commenced operations on March 1, 2006. |
The performance data shown represents past performance, which is not a guarantee of future results. Current performance may be lower or higher than the performance data quoted. The investment return and principal value of an investment in the Funds will fluctuate so that an investor’s shares, when redeemed, may be worth more or less than their original cost. For performance information through the most recent month end please call (800) 835-3879 or visit our website at www.managersinvest.com.
In choosing a Fund, investors should carefully consider the amount they plan to invest, their investment objectives, the Fund’s investment objectives, risks, charges and expenses before investing. For this and other information, please call (800) 835-3879 or visit www.managersinvest.com for a free prospectus. Read it carefully before investing or sending money. Distributed by Managers Distributors, Inc., member FINRA.
| 1 | Total return equals income yield plus share price change and assumes reinvestment of all dividends and capital gain distributions. Returns are net of fees and may reflect offsets of Fund expenses as described in the Prospectus. No adjustment has been made for taxes payable by shareholders on their reinvested dividends and capital gain distributions. Returns for periods greater than one year are annualized. The listed returns on the Fund are net of expenses and based on the published NAV as of October 31, 2009. All returns are in U.S. dollars($). |
| 2 | From time to time, the Fund’s advisor has waived its fees and/or absorbed Fund expenses, which has resulted in higher returns. |
| 3 | After-tax returns are calculated using the historical highest individual federal marginal income tax rates and do not reflect the impact of state and local taxes. Actual after-tax returns depend on an investor’s tax situation and may differ from those shown, and after-tax returns are not relevant to investors who hold their Fund shares through tax-deferred arrangements, such as 401(K) plans or individual retirement accounts. |
| 4 | The Russell 3000® Index is a market-capitalization weighted index that measures the performance of the largest 3,000 U.S. companies representing approximately 98% of the investable U.S. equity market. The returns shown for the Index reflect no deduction for fees, expenses, or taxes. |
| 5 | The Fund invests in large-capitalization companies that may underperform other stock funds (such as funds that focus on small and medium capitalization companies) when stocks of large-capitalization companies are out of favor. Although the Fund is managed to minimize taxable distributions, it may not be able to avoid taxable distributions. |
| 6 | Class C shares convert to an equal dollar value of Class A shares at the end of the tenth year after purchase. |
The Russell 3000® Index is a trademark of Russell Investments. Russell® is a trademark of Russell Investments.
Not FDIC insured, nor bank guaranteed. May lose value.
6
Managers AMG FQ Tax-Managed U.S. Equity Fund
Fund Snapshots
October 31, 2009
Portfolio Breakdown
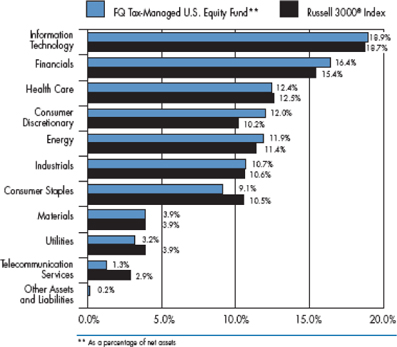
| | | | | | |
Industry | | FQ Tax-Managed
U.S. Equity Fund** | | | Russell 3000®
Index | |
Information Technology | | 18.9 | % | | 18.7 | % |
Financials | | 16.4 | % | | 15.4 | % |
Health Care | | 12.4 | % | | 12.5 | % |
Consumer Discretionary | | 12.0 | % | | 10.2 | % |
Energy | | 11.9 | % | | 11.4 | % |
Industrials | | 10.7 | % | | 10.6 | % |
Consumer Staples | | 9.1 | % | | 10.5 | % |
Materials | | 3.9 | % | | 3.9 | % |
Utilities | | 3.2 | % | | 3.9 | % |
Telecommunication Services | | 1.3 | % | | 2.9 | % |
Other Assets and Liabilities | | 0.2 | % | | 0.0 | % |
Top Ten Holdings
| | | |
Security Name | | Percentage
of Net Assets | |
Exxon Mobil Corp.* | | 2.9 | % |
International Business Machines Corp.* | | 2.5 | |
JPMorgan Chase & Co. | | 2.3 | |
Chevron Corp.* | | 2.3 | |
Apple, Inc.* | | 1.9 | |
Google, Inc. | | 1.9 | |
Hewlett-Packard Co. | | 1.9 | |
Johnson & Johnson* | | 1.6 | |
Goldman Sachs Group, Inc. | | 1.5 | |
Intel Corp. | | 1.4 | |
| | | |
Top Ten as a Group | | 20.2 | % |
| | | |
| * | Top Ten Holding at April 30, 2009 |
Any sectors, industries, or securities discussed should not be perceived as investment recommendations. Mention of a specific security should not be considered a recommendation to buy or solicitation to sell that security. Specific securities mentioned in this report may have been sold from the Fund’s portfolio of investments by the time you receive this report.
7
Managers AMG FQ Tax-Managed U.S. Equity Fund
Schedule of Portfolio Investments
October 31, 2009
| | | | | | |
| | | Shares | | | Value |
Common Stocks - 99.8% | | | | | | |
Consumer Discretionary - 12.0% | | | | | | |
Apollo Group, Inc., Class A* | | 5,000 | | | $ | 285,500 |
Autonation, Inc.* | | 27,000 | 2 | | | 465,480 |
AutoZone, Inc.* | | 3,200 | | | | 432,992 |
Chipotle Mexican Grill, Inc.* | | 3,800 | 2 | | | 309,662 |
Core-Mark Holding Co., Inc.* | | 2,000 | | | | 54,740 |
Destination Maternity Corp.* | | 1,400 | | | | 28,070 |
DirecTV Group, Inc., The* | | 3,800 | 2 | | | 99,940 |
Discovery Communications, Inc., Class C* | | 4,800 | | | | 115,296 |
Domino’s Pizza, Inc.* | | 41,000 | | | | 300,940 |
Group 1 Automotive, Inc. | | 5,600 | | | | 142,352 |
Gymboree Corp.* | | 6,600 | | | | 280,962 |
Jarden Corp. | | 6,000 | | | | 164,340 |
Knology, Inc.* | | 40,000 | | | | 402,000 |
Liberty Global, Inc., Class A* | | 21,800 | | | | 447,554 |
Lithia Motors, Inc., Class A | | 36,800 | | | | 306,912 |
McDonald’s Corp. | | 5,200 | | | | 304,772 |
Mediacom Communications Corp.* | | 30,600 | | | | 146,268 |
News Corp., Inc., Class A | | 24,000 | | | | 276,480 |
Polo Ralph Lauren Corp. | | 7,000 | 2 | | | 520,940 |
Rent-A-Center, Inc.* | | 13,600 | | | | 249,696 |
Target Corp. | | 7,600 | | | | 368,068 |
Time Warner Cable, Inc. | | 6,342 | | | | 250,128 |
Time Warner, Inc. | | 6,000 | | | | 180,720 |
West Marine, Inc.* | | 1,000 | | | | 7,620 |
Total Consumer Discretionary | | | | | | 6,141,432 |
Consumer Staples - 9.1% | | | | | | |
Alliance One International, Inc.* | | 15,800 | | | | 69,678 |
American Italian Pasta Co.* | | 15,200 | 2 | | | 412,984 |
Bare Escentuals, Inc.* | | 12,400 | | | | 156,612 |
Bunge, Ltd. | | 600 | 2 | | | 34,236 |
Central Garden & Pet Co., Class A* | | 34,400 | | | | 325,424 |
Church & Dwight Co., Inc. | | 9,000 | | | | 511,920 |
Coca-Cola Co., The | | 1,000 | | | | 53,310 |
CVS Caremark Corp. | | 6,800 | | | | 240,040 |
Del Monte Foods Co. | | 16,800 | | | | 181,440 |
Fresh Del Monte Produce, Inc.* | | 7,400 | | | | 160,654 |
General Mills, Inc. | | 2,000 | | | | 131,840 |
Kimberly-Clark Corp. | | 7,000 | | | | 428,120 |
Kroger Co., The | | 25,600 | | | | 592,128 |
Lancaster Colony Corp. | | 2,400 | | | | 116,592 |
Mead Johnson Nutrition Co., Class A | | 4,400 | 2 | | | 184,976 |
Orthofix International NV* | | 3,200 | | | | 102,400 |
Overhill Farms, Inc.* | | 15,600 | | | | 85,176 |
Prestige Brands Holdings, Inc.* | | 8,000 | | | | 54,080 |
Procter & Gamble Co., The | | 7,800 | | | | 452,400 |
Ralcorp Holdings, Inc.* | | 2,600 | | | | 139,620 |
Reynolds American, Inc. | | 1,000 | | | | 48,480 |
Seneca Foods Corp., Class A* | | 2,200 | | | | 60,918 |
Susser Holdings Corp.* | | 2,200 | | | | 26,158 |
Wal-Mart Stores, Inc. | | 1,800 | | | | 89,424 |
Total Consumer Staples | | | | | | 4,658,610 |
Energy - 11.9% | | | | | | |
Anadarko Petroleum Corp. | | 10,600 | | | | 645,858 |
Chevron Corp. | | 15,000 | | | | 1,148,100 |
CVR Energy, Inc.* | | 25,000 | | | | 263,000 |
Encore Acquisition Co.* | | 5,000 | | | | 185,350 |
Exxon Mobil Corp. | | 20,600 | | | | 1,476,402 |
Geokinetics, Inc.* | | 8,600 | | | | 138,288 |
Marathon Oil Corp. | | 400 | | | | 12,788 |
National-Oilwell Varco, Inc.* | | 6,600 | | | | 270,534 |
Occidental Petroleum Corp. | | 4,800 | | | | 364,224 |
Oil States International, Inc.* | | 14,600 | | | | 502,824 |
Rowan Cos., Inc. | | 5,400 | | | | 125,550 |
Schlumberger, Ltd. | | 7,000 | | | | 435,400 |
XTO Energy, Inc. | | 12,600 | | | | 523,656 |
Total Energy | | | | | | 6,091,974 |
Financials - 16.4% | | | | | | |
American Express Co. | | 5,000 | | | | 174,200 |
American Financial Group, Inc. | | 6,400 | | | | 157,440 |
Aon Corp. | | 13,800 | | | | 531,438 |
Arch Capital Group, Ltd.* | | 4,400 | | | | 296,428 |
Banco Latinoamericano de Comercio | | | | | | |
Exterior S.A., ADR | | 11,200 | | | | 158,032 |
Bank of America Corp. | | 10,200 | | | | 148,716 |
Bank of the Ozarks, Inc. | | 11,000 | | | | 250,250 |
Banner Corp. | | 30,200 | | | | 92,714 |
Bar Harbor Bankshares | | 200 | | | | 5,680 |
Blackrock, Inc. | | 1,200 | | | | 259,788 |
Cedar Shopping Centers, Inc. | | 2,200 | | | | 13,354 |
Century Bancorp, Inc. | | 1,200 | | | | 29,196 |
Chubb Corp., The | | 1,600 | | | | 77,632 |
Citigroup, Inc. | | 17,400 | | | | 71,166 |
Delphi Financial Group, Inc., Class A | | 4,600 | | | | 99,820 |
Discover Financial Services | | 15,800 | | | | 223,412 |
Doral Financial Corp.* | | 28,800 | | | | 81,792 |
FBL Financial Group, Inc., Class A | | 6,800 | | | | 137,020 |
The accompanying notes are an integral part of these financial statements.
8
Managers AMG FQ Tax-Managed U.S. Equity Fund
Schedule of Portfolio Investments (continued)
| | | | | | |
| | | Shares | | | Value |
Financials - 16.4% (continued) | | | | | | |
FelCor Lodging Trust, Inc.* | | 25,600 | | | $ | 80,640 |
Financial Institutions, Inc. | | 1,600 | | | | 16,896 |
First Cash Financial Services, Inc.* | | 5,200 | | | | 89,336 |
First of Long Island Corp., The | | 2,000 | | | | 48,340 |
Goldman Sachs Group, Inc. | | 4,600 | | | | 782,782 |
Investment Technology Group, Inc.* | | 3,000 | | | | 64,710 |
JPMorgan Chase & Co. | | 27,500 | | | | 1,148,676 |
Knight Capital Group, Inc., Class A* | | 13,400 | | | | 225,790 |
Lazard, Ltd., Class A | | 4,600 | | | | 173,650 |
Loews Corp. | | 4,000 | | | | 132,400 |
Metlife, Inc. | | 3,000 | | | | 102,090 |
Nelnet, Inc.* | | 9,200 | | | | 129,076 |
Northern Trust Corp. | | 6,600 | | | | 331,650 |
Northrim Bancorp, Inc. | | 1,400 | | | | 21,056 |
Oriental Financial Group, Inc. | | 8,000 | | | | 85,200 |
Platinum Underwriter Holdings, Ltd. | | 3,600 | | | | 128,772 |
Provident New York Bancorp | | 13,600 | | | | 116,008 |
Public Storage, Inc. | | 2,000 | | | | 147,200 |
Reinsurance Group of America, Inc. | | 2,600 | | | | 119,860 |
Resource Capital Corp. | | 33,000 | | | | 159,720 |
Santander BanCorp* | | 23,600 | | | | 271,400 |
Simmons First National Corp., Class A | | 2,200 | | | | 64,372 |
Southside Bancshares, Inc. | | 741 | | | | 15,405 |
StanCorp Financial Group, Inc. | | 2,600 | | | | 95,446 |
TD Ameritrade Holding Corp.* | | 9,800 | | | | 189,140 |
Transcontinental Realty Investors, Inc.* | | 200 | | | | 2,174 |
Travelers Companies, Inc., The | | 11,000 | | | | 547,690 |
UnumProvident Corp. | | 9,400 | | | | 187,530 |
Wilber Corp. | | 400 | | | | 2,688 |
World Acceptance Corp.* | | 4,400 | 2 | | | 110,396 |
Total Financials | | | | | | 8,398,171 |
Health Care - 12.4% | | | | | | |
Allergan, Inc. | | 1,000 | | | | 56,250 |
Amedisys, Inc.* | | 2,600 | 2 | | | 103,454 |
American Medical Systems Holdings, Inc.* | | 6,800 | | | | 104,856 |
Amgen, Inc.* | | 6,400 | | | | 343,872 |
AMN Healthcare Services, Inc.* | | 7,200 | | | | 59,904 |
Atrion Corp. | | 400 | | | | 47,364 |
Chemed Corp. | | 6,200 | | | | 280,984 |
Eli Lilly and Co. | | 5,000 | | | | 170,050 |
Emergent BioSolutions, Inc.* | | 2,800 | | | | 40,376 |
Endo Pharmaceuticals Holdings, Inc.* | | 2,600 | | | | 58,240 |
Forest Laboratories, Inc.* | | 8,800 | | | | 243,496 |
Gentiva Health Services, Inc.* | | 5,200 | | | | 124,800 |
IMS Health, Inc. | | 12,600 | | | | 206,514 |
Invacare Corp. | | 13,400 | | | | 300,562 |
Johnson & Johnson | | 14,000 | | | | 826,700 |
Kensey Nash Corp.* | | 9,200 | | | | 219,972 |
Lincare Holdings, Inc.* | | 7,000 | 2 | | | 219,870 |
McKesson Corp. | | 4,200 | | | | 246,666 |
Medco Health Solutions, Inc.* | | 10,200 | | | | 572,424 |
Medical Action Industries, Inc.* | | 4,600 | | | | 50,324 |
Medicis Pharmaceutical Corp., Class A | | 6,400 | | | | 135,488 |
Par Pharmaceutical Co., Inc.* | | 11,000 | | | | 230,670 |
Pfizer, Inc. | | 7,200 | | | | 122,616 |
PSS World Medical, Inc.* | | 16,400 | | | | 331,608 |
ResMed, Inc.* | | 5,000 | | | | 246,050 |
Sun Healthcare Group, Inc.* | | 12,800 | | | | 116,224 |
Symmetry Medical, Inc.* | | 52,600 | | | | 419,222 |
UnitedHealth Group, Inc. | | 1,000 | | | | 25,950 |
Universal Health Services, Inc., Class B | | 4,000 | | | | 222,600 |
Watson Pharmaceuticals, Inc.* | | 5,400 | | | | 185,868 |
Total Health Care | | | | | | 6,312,974 |
Industrials - 10.7% | | | | | | |
Alaska Airgroup, Inc.* | | 5,800 | | | | 149,176 |
American Railcar Industries, Inc. | | 10,800 | | | | 108,000 |
AO Smith Corp. | | 2,200 | | | | 87,186 |
Avis Budget Group, Inc.* | | 13,800 | | | | 115,920 |
Burlington Northern Santa Fe Corp. | | 1,600 | | | | 120,512 |
Chart Industries, Inc.* | | 5,400 | | | | 106,758 |
CSX Corp. | | 2,200 | | | | 92,796 |
Dollar Thrifty Automotive Group, Inc.* | | 8,800 | 2 | | | 162,888 |
EMCOR Group, Inc.* | | 12,098 | | | | 285,755 |
Encore Wire Corp. | | 12,200 | | | | 253,150 |
EnerSys* | | 11,000 | | | | 243,100 |
Esterline Technologies Corp.* | | 1,600 | | | | 67,376 |
Flowserve Corp. | | 2,000 | | | | 196,420 |
Gencorp, Inc.* | | 58,000 | | | | 431,520 |
Hawaiian Holdings, Inc.* | | 56,200 | | | | 398,458 |
Jacobs Engineering Group, Inc.* | | 2,400 | | | | 101,496 |
KBR, Inc. | | 11,800 | | | | 241,546 |
M&F Worldwide Corp.* | | 15,000 | | | | 319,200 |
Mueller Water Products, Inc., Class A | | 29,800 | | | | 133,504 |
Powell Industries, Inc.* | | 3,400 | | | | 125,052 |
Timken Co. | | 8,600 | | | | 189,458 |
Transdigm Group, Inc.* | | 10,600 | | | | 415,308 |
Trinity Industries, Inc. | | 7,400 | | | | 124,912 |
Union Pacific Corp. | | 3,000 | | | | 165,420 |
United Technologies Corp. | | 9,000 | | | | 553,050 |
The accompanying notes are an integral part of these financial statements.
9
Managers AMG FQ Tax-Managed U.S. Equity Fund
Schedule of Portfolio Investments (continued)
| | | | | |
| | | Shares | | Value |
Industrials - 10.7% (continued) | | | | | |
Watts Water Technologies, Inc. | | 4,000 | | $ | 113,000 |
Wesco International, Inc.* | | 5,600 | | | 143,136 |
Total Industrials | | | | | 5,444,097 |
Information Technology - 18.9% | | | | | |
Amphenol Corp., Class A | | 5,600 | | | 224,672 |
Apple, Inc.* | | 5,200 | | | 980,200 |
Avnet, Inc.* | | 7,400 | | | 183,372 |
Benchmark Electronics, Inc.* | | 17,200 | | | 288,960 |
BMC Software, Inc.* | | 1,000 | | | 37,160 |
Cisco Systems, Inc.* | | 4,500 | | | 102,825 |
Convergys Corp.* | | 10,400 | | | 112,840 |
CPI International, Inc.* | | 8,200 | | | 81,180 |
Dell, Inc.* | | 2,000 | | | 28,980 |
Dolby Laboratories, Inc.* | | 8,200 | | | 343,908 |
EMC Corp.* | | 25,000 | | | 411,750 |
Google, Inc.* | | 1,800 | | | 965,016 |
Harris Corp. | | 5,400 | | | 225,288 |
Harris Stratex Networks, Inc., Class A* | | 16,400 | | | 103,320 |
Hewlett-Packard Co. | | 20,200 | | | 958,692 |
i2 Technologies, Inc.* | | 18,200 | | | 286,468 |
Intel Corp. | | 36,600 | | | 699,426 |
International Business Machines Corp. | | 10,600 | | | 1,278,465 |
Microsoft Corp. | | 17,600 | | | 488,048 |
NVE Corp.* | | 3,000 | | | 112,200 |
Oracle Corp. | | 25,800 | | | 544,380 |
Sybase, Inc.* | | 3,000 | | | 118,680 |
Tech Data Corp.* | | 5,000 | | | 192,150 |
Texas Instruments, Inc. | | 2,400 | | | 56,280 |
TIBCO Software, Inc.* | | 20,600 | | | 180,250 |
VMware, Inc. Class A* | | 6,400 | | | 245,952 |
WebMD Health Corp.* | | 6,200 | | | 211,172 |
Western Union Co., The | | 9,600 | | | 174,432 |
Total Information Technology | | | | | 9,636,066 |
Materials - 3.9% | | | | | |
Ball Corp. | | 2,800 | | | 138,124 |
Boise, Inc.* | | 600 | | | 2,868 |
Commercial Metals Co. | | 10,400 | | | 154,336 |
Crown Holdings, Inc.* | | 7,000 | | | 186,550 |
FMC Corp. | | 2,600 | | | 132,860 |
Graphic Packaging Holding Co.* | | 46,700 | | | 106,943 |
Huntsman Corp. | | 24,000 | | | 190,800 |
International Paper Co. | | 10,200 | | | 227,562 |
KapStone Paper and Packaging Corp.* | | 12,200 | | | 84,668 |
Stepan Co. | | 3,000 | | | 171,720 |
Walter Industries, Inc. | | 3,200 | | | 187,200 |
W.R. Grace & Co.* | | 18,200 | | | 398,398 |
Total Materials | | | | | 1,982,029 |
Telecommunication Services - 1.3% | | | | | |
AT&T, Inc. | | 10,800 | | | 277,236 |
U.S. Cellular Corp.* | | 4,600 | | | 168,406 |
Verizon Communications, Inc. | | 200 | | | 5,918 |
Virgin Mobile USA, Inc., Class A* | | 54,400 | | | 217,600 |
Total Telecommunication Services | | | | | 669,160 |
Utilities - 3.2% | | | | | |
Centerpoint Energy, Inc. | | 2,800 | | | 35,280 |
Chesapeake Utilities Corp. | | 405 | | | 12,830 |
Constellation Energy Group, Inc. | | 6,400 | | | 197,888 |
El Paso Electric Co.* | | 24,200 | | | 453,750 |
Exelon Corp. | | 3,800 | | | 178,448 |
PG&E Corp. | | 2,000 | | | 81,780 |
Southwest Gas Corp. | | 15,400 | | | 384,846 |
UGI Corp. | | 6,400 | | | 152,832 |
UniSource Energy Corp. | | 4,000 | | | 115,520 |
Total Utilities | | | | | 1,613,174 |
Total Common Stocks
(cost $45,681,178) | | | | | 50,947,687 |
The accompanying notes are an integral part of these financial statements.
10
Managers AMG FQ Tax-Managed U.S. Equity Fund
Schedule of Portfolio Investments (continued)
| | | | | | |
| | | Shares | | Value | |
Short-Term Investments - 5.7%1 | | | | | | |
BNY Institutional Cash Reserves Fund, Series A, 0.07%3 | | 1,569,006 | | $ | 1,569,006 | |
BNY Institutional Cash Reserves Fund, Series B*3,4 | | 320,520 | | | 50,482 | |
Dreyfus Cash Management Fund, Institutional Class Shares, 0.13% | | 1,284,133 | | | 1,284,133 | |
Total Short-Term Investments
(cost $3,173,658) | | | | | 2,903,621 | |
Total Investments - 105.5%
(cost $48,854,836) | | | | | 53,851,308 | |
Other Assets, less Liabilities - (5.5)% | | | | | (2,796,826 | ) |
Net Assets - 100.0% | | | | $ | 51,054,482 | |
Note: Based on the cost of investments of $48,854,837 for Federal income tax purposes at October 31, 2009, the aggregate gross unrealized appreciation and depreciation were $6,308,317 and $1,311,846, respectively, resulting in net unrealized appreciation of investments of $4,996,471.
| * | Non-income-producing securities. |
| 1 | Yield shown for each investment company below represents the October 31, 2009, seven-day average yield, which refers to the sum of the previous seven days’ dividends paid, expressed as an annual percentage. |
| 2 | Some or all of these shares, amounting to a market value of $1,799,064, or 3.5% of net assets, were out on loan to various brokers. |
| 3 | Collateral received from brokers for securities lending was invested in these short-term investments. |
| 4 | On September 12, 2008, The Bank of New York Mellon established a separate sleeve of the BNY Institutional Cash Reserves Fund (Series B) to hold certain Lehman Brothers floating rate notes. The Fund’s position in Series B is being marked to market daily. |
| | |
| ADR: | | ADR after the name of a holding stands for American Depositary Receipt, representing ownership of foreign securities on deposit with a domestic custodian bank. The value of the ADR securities is determined or significantly influenced by trading on exchanges not located in the United States or Canada. |
The accompanying notes are an integral part of these financial statements.
11
Managers AMG FQ U.S. Equity Fund
Portfolio Manager’s Comments
For the fiscal year ended October 31, 2009, the Fund’s Institutional class returned 5.56% compared to 10.83% for its benchmark the Russell 3000® Index. Please refer to the table on page 13 for returns for various classes of shares.
The past twelve months will go down in the history books as one of the wildest rides in the history of Wall Street. Early in the period, securities markets were under severe pressure as the credit crisis, which began in the summer of 2007, accelerated in the fourth quarter of last year amid ongoing concerns about deteriorating economic conditions and the health of some of the most prominent financial institutions. Banks of all sizes remained under pressure, which led to continued consolidation within the industry. Wachovia agreed to sell itself to Wells Fargo & Co. while PNC agreed to acquire the troubled National City. Meanwhile, the U.S. Government attempted to stabilize the system by formally bailing out companies like Citigroup and by providing injections of capital into hundreds of other financial institutions. Like a sprawling fire, the crisis extended to other industries with the automakers finding themselves on the verge of collapse. Once again, the U.S. Government stepped in and in late December 2008, President Bush approved an emergency bailout of the U.S. auto industry. Consumer and investor confidence continued to sink in the early part of 2009 despite the U.S. Government’s aggressive efforts to restore the economy and stabilize the financial markets. During January, February, and early March, stocks plunged, sending broad indexes to levels not seen since the mid to late 1990s. From peak (October 10, 2007) to trough (March 9, 2009), stocks, as measured by the S&P 500 Index, lost 55.5%, the Index’s steepest decline since the Great Depression. Then, on March 10, a very sharp recovery began amid preliminary signs that the Government’s efforts might be starting to bear fruit. More specifically, Citigroup, which had been under extreme pressure and was essentially bailed out by the Government, reported that it returned to profitability in the months of January and February. Citigroup’s surprising news seemed to ignite the markets and set the stage for a sharp recovery in equities.
The Fund delivered positive absolute returns for the year but failed to keep pace with its benchmark. Relative to the benchmark, the Fund experienced negative stock selection within several sectors including energy, health care, and information technology. Relative sector positioning did not add or detract significant value, mainly due to the mostly neutral benchmark sector and style positioning the Fund maintained throughout the year. However, a modest underweight to the underperforming industrials sector did add modest value.
The Fund’s subadvisor, First Quadrant L.P. (“First Quadrant”), continues to have concerns about the sustainability of the recovery being driven as it is by government intervention. First Quadrant expects the economy to potentially be adversely impacted as government support begins to be withdrawn and expects slower growth to become the “new normal.” One of the positives First Quadrant continues to see in that regard is many companies in the U.S. have been increasingly able to capture growth from outside the country, particularly in the emerging markets. Overall, the Fund continues to tilt towards higher quality holdings and is well diversified on a broader portfolio and sector level with only modest active weights on a sector by sector basis relative to the benchmark Russell 3000® Index.
Cumulative Total Return Performance
Managers AMG FQ U.S. Equity Fund’s cumulative total return is based on the daily change in net asset value (NAV), and assumes that all distributions were reinvested. The Russell 3000® Index is composed of the 3000 largest U.S. companies as measured by market capitalization, and represents about 98% of the U.S. stock market. Unlike the Fund, the Russell 3000® Index is unmanaged, is not available for investment, and does not incur expenses. The chart on page 13 illustrates the performance of a hypothetical $10,000 investment made in the Institutional Class Shares of the Fund on October 31, 1999 to a $10,000 investment made in the Russell 3000® Index for the same time periods. Performance for periods longer than one year is annualized. Figures include reinvestment of capital gains and dividends. The listed returns for the Fund are net of expenses and the returns for the indices exclude expenses. Total returns for the Fund would have been lower had certain expenses not been reduced.
12
Managers AMG FQ U.S. Equity Fund
Portfolio Manager’s Comments (continued)
Cumulative Total Return Performance
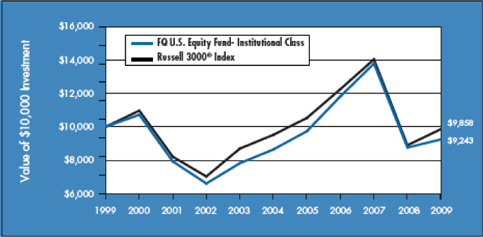
The table below shows the average annualized total returns for the Managers AMG FQ U.S. Equity Fund since inception and the Russell 3000® Index from October 31, 1999 to October 31, 2009.
| | | | | | | | | | | | | | |
Average Annual Total Returns 1 | | One Year | | | Five Years | | | Ten Years | | | Since Inception | | | Inception Date |
Managers AMG FQ U.S. Equity Fund 2,4,5 | | | | | | | | | | | | | | |
No Load: | | | | | | | | | | | | | | |
Institutional Class | | 5.56 | % | | 1.36 | % | | (0.78 | )% | | 6.41 | % | | 08/14/92 |
Class A* | | 5.21 | % | | — | | | — | | | (4.26 | )% | | 03/01/06 |
Class C* | | 4.42 | % | | — | | | — | | | (4.91 | )% | | 03/01/06 |
| | | | | |
Russell 3000® Index 3 | | 10.83 | % | | 0.71 | % | | (0.14 | )% | | | | | |
With Load: | | | | | | | | | | | | | | |
Class A* | | (0.88 | )% | | — | | | — | | | (5.80 | )% | | 03/01/06 |
Class C* | | 3.42 | % | | — | | | — | | | (4.91 | )% | | 03/01/06 |
| * | Class A and Class C shares commenced operations on March 1, 2006. |
The performance data shown represents past performance, which is not a guarantee of future results. Current performance may be lower or higher than the performance data quoted. The investment return and principal value of an investment in the Funds will fluctuate so that an investor’s shares, when redeemed, may be worth more or less than their original cost. For performance information through the most recent month end please call (800) 835-3879 or visit our website at www.managersinvest.com.
In choosing a Fund, investors should carefully consider the amount they plan to invest, their investment objectives, the Fund’s investment objectives, risks, charges and expenses before investing. For this and other information, please call (800) 835-3879 or visit www.managersinvest.com for a free prospectus. Read it carefully before investing or sending money. Distributed by Managers Distributors, Inc., member FINRA.
| 1 | Total return equals income yield plus share price change and assumes reinvestment of all dividends and capital gain distributions. Returns are net of fees and may reflect offsets of Fund expenses as described in the Prospectus. No adjustment has been made for taxes payable by shareholders on their reinvested dividends and capital gain distributions. Returns for periods greater than one year are annualized. The listed returns on the Fund are net of expenses and based on the published NAV as of October 31, 2009. All returns are in U.S. dollars($). |
| 2 | From time to time, the Fund’s advisor has waived its fees and/or absorbed Fund expenses, which has resulted in higher returns. |
| 3 | The Russell 3000® Index is a market-capitalization weighted index that measures the performance of the largest 3,000 U.S. companies representing approximately 98% of the investable U.S. equity market. The returns shown for the Index reflect no deduction for fees, expenses, or taxes. |
| 4 | The Fund invests in large-capitalization companies that may underperform other stock funds (such as funds that focus on small and medium capitalization companies) when stocks of large-capitalization companies are out of favor. |
| 5 | Class C shares convert to an equal dollar value of Class A shares at the end of the tenth year after purchase. |
The Russell 3000® Index is a trademark of Russell Investments. Russell® is a trademark of Russell Investments.
Not FDIC insured, nor bank guaranteed. May lose value.
13
Managers AMG FQ U.S. Equity Fund
Fund Snapshots
October 31, 2009
Portfolio Breakdown
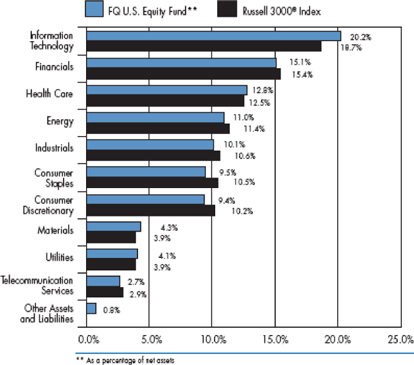
| | | | | | |
Industry | | FQ U.S.
Equity Fund** | | | Russell 3000®
Index | |
Information Technology | | 20.2 | % | | 18.7 | % |
Financials | | 15.1 | % | | 15.4 | % |
Health Care | | 12.8 | % | | 12.5 | % |
Energy | | 11.0 | % | | 11.4 | % |
Industrials | | 10.1 | % | | 10.6 | % |
Consumer Staples | | 9.5 | % | | 10.5 | % |
Consumer Discretionary | | 9.4 | % | | 10.2 | % |
Materials | | 4.3 | % | | 3.9 | % |
Utilities | | 4.1 | % | | 3.9 | % |
Telecommunication Services | | 2.7 | % | | 2.9 | % |
Other Assets and Liabilities | | 0.8 | % | | 0.0 | % |
Top Ten Holdings
| | | |
Security Name | | Percentage
of Net Assets | |
Exxon Mobil Corp.* | | 3.1 | % |
International Business Machines Corp.* | | 2.1 | |
JPMorgan Chase & Co.* | | 2.0 | |
Procter & Gamble Co., The* | | 1.6 | |
Johnson & Johnson* | | 1.4 | |
AT&T, Inc.* | | 1.4 | |
Pfizer, Inc. | | 1.3 | |
Chevron Corp.* | | 1.3 | |
Google, Inc. | | 1.3 | |
Microsoft Corp.* | | 1.3 | |
| | | |
Top Ten as a Group | | 16.8 | % |
| | | |
| * | Top Ten Holding at April 30, 2009 |
Any sectors, industries, or securities discussed should not be perceived as investment recommendations. Mention of a specific security should not be considered a recommendation to buy or solicitation to sell that security. Specific securities mentioned in this report may have been sold from the Fund’s portfolio of investments by the time you receive this report.
14
Managers AMG FQ U.S. Equity Fund
Schedule of Portfolio Investments
October 31, 2009
| | | | | | |
| | | Shares | | | Value |
Common Stocks - 99.2% | | | | | | |
Consumer Discretionary - 9.4% | | | | | | |
Cablevision Systems Corp., Class A | | 14,000 | | | $ | 321,440 |
Comcast Corp., Class A | | 34,000 | | | | 493,000 |
DISH Network Corp., Class A* | | 10,400 | | | | 180,960 |
Ford Motor Co.* | | 27,600 | | | | 193,200 |
Gap, Inc., The | | 11,400 | | | | 243,276 |
Garmin, Ltd. | | 7,400 | 2 | | | 223,924 |
Genuine Parts Co. | | 4,800 | | | | 167,952 |
Group 1 Automotive, Inc. | | 6,800 | | | | 172,856 |
Home Depot, Inc., The | | 8,800 | | | | 220,792 |
Isle of Capri Casinos, Inc.* | | 2,800 | | | | 21,700 |
Liberty Global, Inc., Class A* | | 6,400 | 2 | | | 131,392 |
Liberty Media Corp., Interactive Group* | | 19,000 | | | | 215,460 |
Lithia Motors, Inc., Class A | | 14,400 | | | | 120,096 |
Lowe’s Companies, Inc. | | 7,200 | | | | 140,904 |
McDonald’s Corp. | | 400 | | | | 23,444 |
News Corp., Inc., Class A | | 11,000 | | | | 126,720 |
Pre-Paid Legal Services, Inc.* | | 800 | | | | 31,632 |
Rent-A-Center, Inc.* | | 6,800 | | | | 124,848 |
Ross Stores, Inc. | | 4,600 | | | | 202,446 |
Sally Beauty Holdings, Inc.* | | 19,000 | | | | 128,250 |
Target Corp. | | 6,000 | | | | 290,580 |
The Finish Line, Inc., Class A | | 12,800 | | | | 129,792 |
Time Warner Cable, Inc. | | 2,660 | | | | 104,910 |
Time Warner, Inc. | | 5,600 | | | | 168,672 |
TJX Cos., Inc., The | | 7,400 | | | | 276,390 |
UniFirst Corp. | | 1,000 | | | | 42,070 |
Wonder Auto Technology, Inc.* | | 2,400 | | | | 31,056 |
Wyndham Worldwide Corp. | | 12,200 | | | | 208,010 |
Total Consumer Discretionary | | | | | | 4,735,772 |
Consumer Staples - 9.5% | | | | | | |
American Italian Pasta Co.* | | 9,400 | | | | 255,398 |
Andersons, Inc., The | | 4,600 | | | | 142,738 |
Campbell Soup Co. | | 6,600 | | | | 209,550 |
Central Garden & Pet Co., Class A* | | 21,600 | | | | 204,336 |
Church & Dwight Co., Inc. | | 3,600 | | | | 204,768 |
Coca-Cola Co., The | | 5,000 | | | | 266,550 |
Colgate-Palmolive Co. | | 600 | | | | 47,178 |
CVS Caremark Corp. | | 7,000 | | | | 247,100 |
Del Monte Foods Co. | | 25,400 | | | | 274,320 |
General Mills, Inc. | | 1,400 | | | | 92,288 |
Kimberly-Clark Corp. | | 3,600 | | | | 220,176 |
Kraft Foods, Inc. | | 10,600 | | | | 291,712 |
Kroger Co., The | | 10,400 | | | | 240,552 |
PepsiCo, Inc. | | 600 | | | | 36,330 |
Philip Morris International, Inc. | | 2,600 | | | | 123,136 |
Procter & Gamble Co., The | | 14,200 | | | | 823,600 |
Reynolds American, Inc. | | 3,800 | | | | 184,224 |
Sanderson Farms, Inc. | | 5,000 | | | | 182,950 |
Walgreen Co. | | 5,200 | | | | 196,716 |
Wal-Mart Stores, Inc. | | 12,000 | | | | 596,160 |
Total Consumer Staples | | | | | | 4,839,782 |
Energy - 11.0% | | | | | | |
Anadarko Petroleum Corp. | | 4,600 | | | | 280,278 |
Cal Dive International, Inc.* | | 20,200 | | | | 155,136 |
Chevron Corp. | | 8,600 | | | | 658,244 |
Complete Production Services, Inc.* | | 10,200 | | | | 97,206 |
ConocoPhillips Co. | | 7,200 | | | | 361,296 |
CVR Energy, Inc.* | | 13,000 | | | | 136,760 |
Exxon Mobil Corp. | | 22,000 | | | | 1,576,740 |
Geokinetics, Inc.* | | 3,600 | | | | 57,888 |
Hess Corp. | | 1,200 | | | | 65,688 |
Marathon Oil Corp. | | 9,000 | | | | 287,730 |
Nabors Industries, Ltd.* | | 9,600 | | | | 199,968 |
National-Oilwell Varco, Inc.* | | 6,200 | | | | 254,138 |
Occidental Petroleum Corp. | | 3,800 | | | | 288,344 |
Oil States International, Inc.* | | 5,400 | | | | 185,976 |
Pride International, Inc.* | | 7,800 | | | | 230,568 |
Schlumberger, Ltd. | | 4,200 | | | | 261,240 |
Stone Energy Corp.* | | 4,000 | | | | 61,320 |
T-3 Energy Services, Inc.* | | 2,000 | | | | 40,040 |
Williams Cos., Inc. | | 3,000 | | | | 56,550 |
World Fuel Services Corp. | | 3,200 | | | | 162,720 |
XTO Energy, Inc. | | 3,200 | | | | 132,992 |
Total Energy | | | | | | 5,550,822 |
Financials - 15.1% | | | | | | |
Advance America, Cash Advance Centers, Inc. | | 7,800 | | | | 38,532 |
Aflac, Inc. | | 5,200 | | | | 215,748 |
American Express Co. | | 4,800 | | | | 167,232 |
American Financial Group, Inc. | | 7,400 | | | | 182,040 |
American Physicians Capital, Inc. | | 800 | | | | 22,624 |
Annaly Capital Management, Inc. | | 5,400 | | | | 91,314 |
Anworth Mortgage Asset Corp. | | 18,000 | | | | 128,340 |
Aon Corp. | | 5,000 | | | | 192,550 |
The accompanying notes are an integral part of these financial statements.
15
Managers AMG FQ U.S. Equity Fund
Schedule of Portfolio Investments (continued)
| | | | | | |
| | | Shares | | | Value |
Financials - 15.1% (continued) | | | | | | |
Arch Capital Group, Ltd.* | | 3,400 | | | $ | 229,058 |
Argo Group International Holdings, Ltd.* | | 4,200 | | | | 142,632 |
Bank of America Corp. | | 21,200 | | | | 309,096 |
Bank of New York Mellon Corp. | | 5,600 | | | | 149,296 |
Blackrock, Inc. | | 1,400 | | | | 303,086 |
Chubb Corp., The | | 5,200 | | | | 252,304 |
Citigroup, Inc. | | 27,200 | | | | 111,248 |
Community Bank System, Inc. | | 3,400 | | | | 63,274 |
Delphi Financial Group, Inc., Class A | | 5,200 | | | | 112,840 |
Dime Community Bancshares | | 6,200 | | | | 68,138 |
Discover Financial Services | | 16,200 | | | | 229,068 |
Doral Financial Corp.* | | 7,800 | | | | 22,152 |
First American Corp. | | 6,800 | | | | 206,652 |
Goldman Sachs Group, Inc. | | 2,000 | | | | 340,340 |
Hudson City Bancorp, Inc. | | 15,200 | | | | 199,728 |
JPMorgan Chase & Co. | | 24,600 | | | | 1,027,542 |
MFA Financial, Inc. | | 24,800 | | | | 184,016 |
Morgan Stanley Co. | | 5,400 | | | | 173,448 |
NASB Financial, Inc. | | 1,400 | | | | 34,440 |
Northern Trust Corp. | | 4,800 | | | | 241,200 |
Oriental Financial Group, Inc. | | 24,400 | | | | 259,860 |
PHH Corp.* | | 14,200 | | | | 229,472 |
Public Storage, Inc. | | 1,400 | | | | 103,040 |
Reinsurance Group of America, Inc. | | 3,200 | | | | 147,520 |
Republic Bancorp, Inc., Class A | | 2,000 | | | | 36,780 |
Santander BanCorp* | | 8,700 | | | | 100,050 |
StanCorp Financial Group, Inc. | | 4,200 | | | | 154,182 |
TD Ameritrade Holding Corp.* | | 10,600 | | | | 204,580 |
Travelers Companies, Inc., The | | 9,200 | | | | 458,068 |
UnumProvident Corp. | | 11,000 | | | | 219,450 |
Wells Fargo & Co. | | 10,600 | | | | 291,712 |
Total Financials | | | | | | 7,642,652 |
Health Care - 12.8% | | | | | | |
American Medical Systems Holdings, Inc.* | | 8,200 | | | | 126,444 |
Amgen, Inc.* | | 9,400 | | | | 505,062 |
Baxter International, Inc. | | 2,800 | | | | 151,368 |
Boston Scientific Corp.* | | 4,400 | | | | 35,728 |
Cantel Medical Corp.* | | 9,200 | | | | 147,752 |
Cardinal Health, Inc. | | 6,000 | | | | 170,040 |
CareFusion Corp.* | | 3,000 | | | | 67,110 |
DaVita, Inc.* | | 600 | | | | 31,818 |
Eli Lilly and Co. | | 4,800 | | | | 163,248 |
Emergency Medical Services Corp., Class A* | | 6,400 | | | | 307,328 |
Forest Laboratories, Inc.* | | 8,000 | | | | 221,360 |
Gentiva Health Services, Inc.* | | 4,600 | | | | 110,400 |
Hi-Tech Pharmacal Co., Inc.* | | 10,200 | | | | 186,048 |
Immunomedics, Inc.* | | 8,800 | | | | 31,328 |
Johnson & Johnson | | 12,200 | | | | 720,410 |
Kinetic Concepts, Inc.* | | 8,800 | | | | 292,072 |
Matrixx Initiatives, Inc.* | | 11,800 | 2 | | | 53,100 |
McKesson Corp. | | 4,000 | | | | 234,920 |
Medco Health Solutions, Inc.* | | 8,000 | | | | 448,960 |
Odyssey HealthCare, Inc.* | | 2,800 | | | | 39,032 |
PDL BioPharma, Inc. | | 40,000 | 2 | | | 336,400 |
Pfizer, Inc. | | 39,095 | | | | 665,788 |
Pharmerica Corp.* | | 2,000 | 2 | | | 30,860 |
RehabCare Group, Inc.* | | 1,800 | | | | 33,750 |
Schering-Plough Corp. | | 8,400 | | | | 236,880 |
Sirona Dental Systems, Inc.* | | 5,200 | | | | 139,932 |
Steris Corp. | | 5,600 | | | | 163,856 |
Symmetry Medical, Inc.* | | 9,400 | | | | 74,918 |
Thermo Fisher Scientific, Inc.* | | 2,000 | | | | 90,000 |
UnitedHealth Group, Inc. | | 9,400 | | | | 243,930 |
Universal Health Services, Inc., Class B | | 3,400 | | | | 189,210 |
Valeant Pharmaceuticals International* | | 7,800 | 2 | | | 229,320 |
Total Health Care | | | | | | 6,478,372 |
Industrials - 10.1% | | | | | | |
3M Co. | | 2,000 | | | | 147,140 |
Acco Brands Corp.* | | 16,000 | | | | 96,960 |
Aircastle, Ltd. | | 7,800 | | | | 61,776 |
Apogee Enterprises, Inc. | | 7,200 | | | | 95,328 |
Boeing Co., The | | 1,800 | | | | 86,040 |
Burlington Northern Santa Fe Corp. | | 1,200 | | | | 90,384 |
Chart Industries, Inc.* | | 7,200 | | | | 142,344 |
CSX Corp. | | 1,800 | | | | 75,924 |
Deluxe Corp. | | 6,800 | | | | 96,764 |
Dollar Thrifty Automotive Group, Inc.* | | 13,600 | | | | 251,736 |
EnerSys* | | 14,800 | | | | 327,080 |
Flowserve Corp. | | 2,400 | | | | 235,704 |
Gencorp, Inc.* | | 10,400 | | | | 77,376 |
General Electric Co. | | 29,400 | | | | 419,244 |
Hawaiian Holdings, Inc.* | | 14,200 | | | | 100,678 |
Honeywell International, Inc. | | 3,600 | | | | 129,204 |
International Shipholding Corp. | | 800 | | | | 26,520 |
KBR, Inc. | | 7,600 | | | | 155,572 |
The accompanying notes are an integral part of these financial statements.
16
Managers AMG FQ U.S. Equity Fund
Schedule of Portfolio Investments (continued)
| | | | | | |
| | | Shares | | | Value |
Industrials - 10.1% (continued) | | | | | | |
Lockheed Martin Corp. | | 3,000 | | | $ | 206,370 |
M&F Worldwide Corp.* | | 1,600 | | | | 34,048 |
Powell Industries, Inc.* | | 3,400 | | | | 125,052 |
R.R. Donnelley & Sons Co. | | 12,600 | | | | 253,008 |
Raytheon Co. | | 5,000 | | | | 226,400 |
Shaw Group, Inc., The* | | 9,800 | | | | 251,468 |
Sterling Construction, Inc.* | | 2,000 | | | | 32,260 |
Timken Co. | | 5,400 | | | | 118,962 |
Trinity Industries, Inc. | | 8,200 | | | | 138,416 |
Union Pacific Corp. | | 3,600 | | | | 198,504 |
United Parcel Service, Inc., Class B | | 3,600 | | | | 193,248 |
United Technologies Corp. | | 7,300 | | | | 448,585 |
URS Corp.* | | 3,400 | | | | 132,124 |
Watson Wyatt & Co. | | 3,600 | | | | 156,888 |
Total Industrials | | | | | | 5,131,107 |
Information Technology - 20.2% | | | | | | |
3Com Corp.* | | 39,000 | | | | 200,460 |
Acxiom Corp. | | 7,000 | | | | 80,360 |
Apple, Inc.* | | 2,600 | | | | 490,100 |
Arris Group, Inc.* | | 26,400 | | | | 270,864 |
Arrow Electronics, Inc.* | | 7,400 | | | | 187,516 |
Avnet, Inc.* | | 7,400 | | | | 183,372 |
Benchmark Electronics, Inc.* | | 1,600 | | | | 26,880 |
Broadridge Financial Solutions, Inc. | | 7,800 | | | | 162,318 |
CA, Inc. | | 15,800 | | | | 330,536 |
Cirrus Logic, Inc.* | | 5,800 | | | | 28,072 |
Cisco Systems, Inc.* | | 13,000 | | | | 297,050 |
Compuware Corp.* | | 21,600 | | | | 152,496 |
Dell, Inc.* | | 15,400 | | | | 223,146 |
EarthLink, Inc.* | | 34,000 | | | | 275,400 |
EMC Corp.* | | 17,000 | | | | 279,990 |
Fidelity National Information Services, Inc. | | 9,200 | | | | 200,192 |
Google, Inc.* | | 1,200 | | | | 643,344 |
Harris Corp. | | 5,600 | | | | 233,632 |
Harris Stratex Networks, Inc., Class A* | | 35,000 | | | | 220,500 |
Hewlett-Packard Co. | | 12,800 | | | | 607,488 |
i2 Technologies, Inc.* | | 8,400 | 2 | | | 132,216 |
Intel Corp. | | 32,200 | | | | 615,342 |
International Business Machines Corp. | | 8,600 | | | | 1,037,246 |
MasterCard, Inc., Class A | | 800 | | | | 175,216 |
Microsoft Corp. | | 23,200 | | | | 643,336 |
Multi-Fineline Electronix, Inc.* | | 1,600 | | | | 43,600 |
Oracle Corp. | | 23,200 | | | | 489,520 |
Radiant Systems, Inc.* | | 3,200 | | | | 31,488 |
SeaChange International, Inc.* | | 4,600 | | | | 31,142 |
STEC, Inc.* | | 6,000 | 2 | | | 127,920 |
Sybase, Inc.* | | 6,000 | | | | 237,360 |
Symantec Corp.* | | 12,600 | | | | 221,508 |
Synaptics, Inc.* | | 1,200 | 2 | | | 27,000 |
Tech Data Corp.* | | 7,600 | | | | 292,068 |
Texas Instruments, Inc. | | 6,200 | | | | 145,390 |
Visa, Inc., Class A | | 3,600 | | | | 272,736 |
Western Digital Corp.* | | 5,800 | | | | 195,344 |
Western Union Co., The | | 12,200 | | | | 221,674 |
Xerox Corp. | | 22,400 | 2 | | | 168,448 |
Total Information Technology | | | | | | 10,202,270 |
Materials - 4.3% | | | | | | |
Crown Holdings, Inc.* | | 7,400 | | | | 197,210 |
Innophos Holdings, Inc. | | 5,400 | | | | 104,490 |
International Paper Co. | | 11,400 | | | | 254,334 |
KapStone Paper and Packaging Corp.* | | 7,600 | | | | 52,744 |
NewMarket Corp. | | 1,600 | | | | 149,600 |
Omnova Solutions, Inc.* | | 10,200 | | | | 65,382 |
Owens-Illinois, Inc.* | | 6,000 | | | | 191,280 |
P.H. Glatfelter Co. | | 6,200 | | | | 65,534 |
Pactiv Corp.* | | 10,800 | | | | 249,372 |
Praxair, Inc. | | 1,400 | | | | 111,216 |
Rock-Tenn Co., Class A | | 4,200 | | | | 183,960 |
Schweitzer-Mauduit International, Inc. | | 400 | | | | 20,660 |
Stepan Co. | | 4,200 | | | | 240,408 |
Walter Industries, Inc. | | 4,600 | | | | 269,100 |
Total Materials | | | | | | 2,155,290 |
Telecommunication Services - 2.7% | | | | | | |
AT&T, Inc. | | 27,600 | | | | 708,492 |
iPCS, Inc.* | | 3,800 | | | | 90,706 |
Qwest Communications International, Inc. | | 46,000 | 2 | | | 165,140 |
Verizon Communications, Inc. | | 13,400 | | | | 396,506 |
Total Telecommunication Services | | | | | | 1,360,844 |
Utilities - 4.1% | | | | | | |
Atmos Energy Corp. | | 5,000 | | | | 139,250 |
Avista Corp. | | 5,200 | | | | 98,592 |
Centerpoint Energy, Inc. | | 12,400 | | | | 156,240 |
CMS Energy Corp. | | 24,800 | | | | 329,840 |
Energen Corp. | | 7,400 | | | | 324,712 |
Exelon Corp. | | 3,400 | | | | 159,664 |
The accompanying notes are an integral part of these financial statements.
17
Managers AMG FQ U.S. Equity Fund
Schedule of Portfolio Investments (continued)
| | | | | | | |
| | | Shares | | | Value | |
Utilities - 4.1% (continued) | | | | | | | |
FirstEnergy Corp. | | 1,400 | | | $ | 60,592 | |
FPL Group, Inc. | | 1,800 | | | | 88,380 | |
Mirant Corp.* | | 12,200 | 2 | | | 170,556 | |
NRG Energy, Inc.* | | 5,200 | | | | 119,548 | |
Public Service Enterprise Group, Inc. | | 6,800 | | | | 202,640 | |
Sempra Energy | | 1,000 | | | | 51,450 | |
UGI Corp. | | 7,600 | | | | 181,488 | |
Total Utilities | | | | | | 2,082,952 | |
Total Common Stocks
(cost $49,400,470) | | | | | | 50,179,863 | |
Short-Term Investments - 3.1%1 | | | | | | | |
BNY Institutional Cash Reserves Fund, Series A, 0.07%3 | | 996,004 | | | | 996,004 | |
BNY Institutional Cash Reserves Fund, Series B*3,4 | | 201,100 | | | | 31,673 | |
Dreyfus Cash Management Fund, Institutional Class Shares, 0.13% | | 560,074 | | | | 560,074 | |
Total Short-Term Investments
(cost $1,757,178) | | | | | | 1,587,751 | |
Total Investments - 102.3%
(cost $51,157,648) | | | | | | 51,767,614 | |
Other Assets, less Liabilities - (2.3)% | | | | | | (1,165,016 | ) |
Net Assets - 100.0% | | | | | $ | 50,602,598 | |
Note: Based on the cost of investments of $52,567,746 for Federal income tax purposes at October 31, 2009, the aggregate gross unrealized appreciation and depreciation were $4,193,247 and $4,993,379, respectively, resulting in net unrealized depreciation of investments of $800,132.
| * | Non-income-producing securities. |
| 1 | Yield shown for each investment company below represents the October 31, 2009, seven-day average yield, which refers to the sum of the previous seven days’ dividends paid, expressed as an annual percentage. |
| 2 | Some or all of these shares, amounting to a market value of $1,134,103 or 2.2% of net assets, were out on loan to various brokers. |
| 3 | Collateral received from brokers for securities lending was invested in these short-term investments. |
| 4 | On September 12, 2008, The Bank of New York Mellon established a separate sleeve of the BNY Institutional Cash Reserves Fund (Series B) to hold certain Lehman Brothers floating rate notes. The Fund’s position in Series B is being marked to market daily. |
The accompanying notes are an integral part of these financial statements.
18
Managers AMG FQ Global Alternatives Fund
Portfolio Manager’s Comments
The Managers AMG FQ Global Alternatives Fund delivered modestly negative returns for the past fiscal year ended October 31, 2009. The Fund’s Class A shares returned -3.15% while the benchmark, Citigroup 1-Month U.S. Treasury Bill Index, returned 0.10% during this time. Please refer to the table on page 20 for returns of various share classes.
Global capital markets rebounded sharply after March 9th as the combination of coordinated government actions across the globe and near-zero short-term interest rates combined to slow the crisis. For the entire one-year period ended October 31, 2009, large-cap stocks outperformed their smaller-cap brethren with the Russell 1000® (large cap), Russell 2000® (small cap), Russell 3000® (all cap), and the Russell Microcap® Indexes returning 11.2%, 6.5%, 10.8%, and 5.1%, respectively. International stocks outperformed their domestic counterparts by a wide margin as the MSCI EAFE Index returned 27.7% thanks partly to weakness in the U.S. Dollar during this period. Over the same time period, REITs underperformed domestic U.S. equities as the Dow Jones U.S. Select REIT Index returned -0.3%. Fixed-income securities in the U.S. and abroad moved substantially higher during the period as investors capitalized on opportunities in various fixed-income segments, with the broad high quality indexes such as the Barclays Capital U.S. Aggregate Bond and the Barclays Capital Global Aggregate ex-US Indexes, returning 13.8% and 21.3%, respectively. Within the fixed-income markets, lower-quality securities posted the best results as investors took advantage of extraordinarily wide yield spreads. This is best exemplified by the 48.1% and 6.3% returns generated by the Barclays Capital US Corporate High Yield Index and the Barclays Capital U.S. Government –Treasury Index, respectively.
During this period, the Global Alternatives Fund delivered modestly negative performance but continued to provide a good, low correlation alternative to broader portfolios. Within the Fund, solid performance within the asset class and currency selection strategies was counteracted by neutral to negative performance within the Fund’s other two strategies; equity country selection and bond country selection. The asset class selection strategy was modestly tilted long to global equities throughout the fiscal year and while that strategy did not work effectively early on, the tilt has certainly been beneficial since the global equity rally began in early March. Most of the modestly negative performance within the equity country selection strategy was concentrated in the fourth quarter of 2008 and continued into the early part of this year where a short allocation to Canada and long positions to the Australian and Italian equity markets detracted from returns. The bond country selection strategy rallied nicely towards the latter portion of the fiscal year but not enough to completely overcome earlier losses due to a long position in U.S. Treasuries and short positions to the Canadian and U.K. sovereign debt markets. Despite the unsuccessful long position to the U.S. Dollar position over the last year, the currency strategy did add positive value by virtue of a number of other positions including gains coming late in the year from a long position to the New Zealand Dollar and a short position to the U.K. pound sterling.
The tactical risk allocation in the Fund has begun to fund its most compelling opportunities within the currency strategy and there have been some notable changes recently in currency positioning. For example, a long-held, mild short position to the Canadian Dollar recently had a significant move and is now the strongest short position within the currency strategy. All three currencies on the long side — Japanese Yen, New Zealand Dollars and U.S. Dollars — extended over the quarter, while a significant long position in Australian Dollars reversed into a slightly short position. Meanwhile, the risk budget in the stock country selection strategy sleeve increased modestly over the last several months. On the long side, positioning has broadened out in Hong Kong and the U.K. The Fund continues to hold a strong short position to the Swiss equity market. Within the bond country selection strategy, positioning remains largely consistent compared to earlier in the fiscal year and the risk allocation to this sleeve remains strong. However, short bond positions in Japan and Canada have recently expanded further. Finally, as previously noted, the Fund retains a modest long position in global equities relative to global bonds within its asset class selection strategy.
Cumulative Total Return Performance
Managers AMG FQ Global Alternatives Fund’s cumulative total return is based on the daily change in net asset value (NAV), and assumes that all distributions were reinvested. The Citigroup 1-Month U.S. Treasury Bill Index (“1-Month Treasury Index”) measures returns of 1-month treasury bills. Unlike the Fund, the 1-Month Treasury Index is unmanaged, is not available for investment, and does not incur expenses. The chart on page 20 illustrates the performance of a hypothetical $10,000 investment made in the Class A shares (with load) of the Fund on March 30, 2006 (commencement of operations), to a $10,000 investment made in the 1-Month Treasury Index for the same time period. Figures include reinvestment of capital gains and dividends. The listed returns for the Fund are net of expenses and the returns for the index exclude expenses. The graph and table do not reflect the deduction of taxes that a shareholder would pay on a Fund distribution or redemption of shares. Total returns for the Fund would have been lower had certain expenses not been reduced.
19
Managers AMG FQ Global Alternatives Fund
Portfolio Manager’s Comments (continued)
Cumulative Total Return Performance
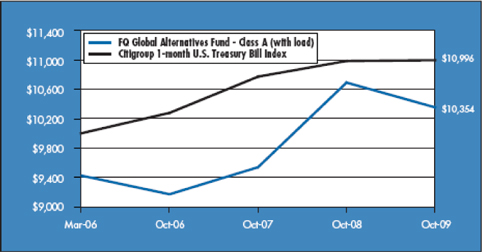
The table below shows the average annualized total returns for the Managers AMG FQ Global Alternatives Fund and the Citigroup 1-Month U.S. Treasury Bill Index since inception through October 31, 2009.
| | | | | | | | |
Average Total Returns 1 | | One Year | | | Since
Inception | | | Inception
Date |
Managers AMG FQ Global Alternatives Fund* 3,4,5,6,7 | | | | | | | | |
No Load: | | | | | | | | |
Class A | | (3.15 | )% | | 2.65 | % | | 3/30/06 |
Class C | | (3.86 | )% | | 1.88 | % | | 3/30/06 |
Citigroup 1-Month U.S. Treasury Bill Index 2 | | 0.10 | % | | 2.68 | % | | 3/31/06 |
With Load: | | | | | | | | |
Class A | | (8.72 | )% | | 0.97 | % | | 3/30/06 |
Class C | | (4.76 | )% | | 1.88 | % | | 3/30/06 |
| * | Commencement of operations was March 30, 2006. |
The performance data shown represents past performance, which is not a guarantee of future results. Current performance may be lower or higher than the performance data quoted. The investment return and principal value of an investment in the Funds will fluctuate so that an investor’s shares, when redeemed, may be worth more or less than their original cost. For performance information through the most recent month end please call (800) 835-3879 or visit our website at www.managersinvest.com.
In choosing a Fund, investors should carefully consider the amount they plan to invest, their investment objectives, the Fund’s investment objectives, risks, charges and expenses before investing. For this and other information, please call (800) 835-3879 or visit www.managersinvest.com for a free prospectus. Read it carefully before investing or sending money. Distributed by Managers Distributors, Inc., member FINRA.
| 1 | Total return equals income yield plus share price change and assumes reinvestment of all dividends and capital gain distributions. Returns are net of fees and may reflect offsets of Fund expenses as described in the Prospectus. No adjustment has been made for taxes payable by shareholders on their reinvested dividends and capital gain distributions. Returns for periods greater than one year are annualized. The listed returns on the Fund are net of expenses and based on the published NAV as of October 31, 2009. All returns are in U.S. dollars($). |
| 2 | Performance for the Citigroup 1-Month U.S. Treasury Bill Index reflects an inception date of March 31, 2006. The Citigroup 1-Month Treasury Bill Index is a market value-weighted index of public obligations of the U.S. Treasury with maturities of one month. Unlike the Fund, the Citigroup 1-Month T-Bill Index is unmanaged, is not available for investment, and does not incur expenses. |
| 3 | From time to time, the Fund’s advisor has waived its fees and/or absorbed Fund expenses, which has resulted in higher returns. |
| 4 | Fixed-income funds are subject to the risks associated with investments in debt securities, such as default risk, fluctuations in debtors’ perceived ability to pay their creditors, and changing interest rate risk. An increase in interest rates typically causes the value of bonds and other fixed-income securities to fall. |
| 5 | The Fund may use derivative instruments for hedging purposes or as part of its investment strategy. There is a risk that a derivative intended as a hedge may not perform as expected. The main risk with derivatives is that some types can amplify a gain or loss, potentially earning or losing substantially more money than the actual cost of the derivative or that the counterparty may fail to honor its contract terms, causing a loss for the Fund. Use of these instruments may also involve certain costs and risks such as liquidity risk, interest rate risk, market risk, credit risk, management risk, and the risk that a fund could not close out a position when it would be most advantageous to do so. |
| 6 | Investments in foreign securities and currency instruments are subject to additional risks such as erratic market conditions, economic and political instability, and currency exchange rate fluctuations. |
| 7 | Class C Shares convert to an equal dollar value of Class A Shares at the end of the tenth year after purchase. |
Not FDIC insured, nor bank guaranteed. May lose value.
20
Managers AMG FQ Global Essentials Fund
Portfolio Manager’s Comments
The Managers AMG FQ Global Essentials Fund delivered strong positive absolute and relative returns for the past fiscal year. The Fund returned 19.67% while its benchmark, which consists of 60% of the return of MSCI World (hedged) Index and 40% of the return of the Citigroup World Government Bond (hedged) Index, returned 8.96% during this time.
Global capital markets rebounded sharply after March 10 as the combination of coordinated government actions across the globe and near-zero short-term interest rates combined to slow the crisis. For the entire one-year period, large-cap stocks outperformed their smaller-cap brethren with the Russell 1000® (large cap), Russell 2000® (small cap), Russell 3000® (all cap), and the Russell Microcap® Indexes returning 11.2%, 6.5%, 10.8%, and 5.1%, respectively. International stocks outperformed their domestic counterparts by a wide margin as the MSCI EAFE Index returned 27.7% thanks partly to weakness in the U.S. Dollar during this period. Over the same time period, REITs underperformed domestic U.S. equities as the Dow Jones U.S. Select REIT Index returned -0.3%. Fixed-income securities in the U.S. and abroad moved substantially higher during the period as investors capitalized on opportunities in various fixed-income segments, with the broad high-quality indexes such as the Barclays Capital U.S. Aggregate Bond and the Barclays Capital Global Aggregate ex-US Indexes, returning 13.8% and 21.3%, respectively. Within the fixed-income markets, lower-quality securities posted the best results as investors took advantage of extraordinarily wide spreads. This is best exemplified by the 48.1% and 6.3% returns generated by the Barclays Capital US Corporate High Yield Index and the Barclays Capital U.S. Government –Treasury Index, respectively.
The solid absolute and relative performance generated by the Fund during this period was led by both the asset allocation within the Fund (overweight to global equities) and strong positioning within the asset classes as well. In addition, towards the end of the fiscal year, the Fund’s Board of Trustees approved a change from the existing multi-manager subadvisor structure, which included First Quadrant L.P. (“First Quadrant”) as one of its subadvisors, to a single subadvisor structure with First Quadrant as the sole subadvisor. Utilizing a comprehensive global balanced investment discipline, First Quadrant has developed what we believe will improve results to our historic structure. The Fund will employ First Quadrant’s innovative “Essential Beta” investment strategy to provide a diversified, risk-balanced global market portfolio. We believe that the changes made will result in a Fund that will provide investors with a unique and innovative investment approach that will continue to meet the needs of a global balanced investor.
The Fund maintains an underweight to global equities relative to global fixed income as a result of the heightened risk environment in which we currently remain. Volatility has begun to fall, however, and a fall in volatility will lead to a rise in the equity allocation relative to the global fixed income allocation within the Fund.
Cumulative Total Return Performance
Managers AMG FQ Global Essentials Fund’s cumulative total return is based on the daily change in net asset value (NAV), and assumes that all distributions were reinvested. The Managers Global Essentials Fund Composite Hedged Index (“Hedged Index”) and the Managers Global Essentials Fund Composite Unhedged Index (“Unhedged Index”) are comprised of 60% MSCI World Index and 40% Citigroup World Government Bond Index. The MSCI World Index is a free float-adjusted market capitalization weighted index that is designed to measure the equity market performance of developed and emerging markets. As of June 2009 the MSCI World Index consisted of 23 developed country indices. The Citigroup World Government Bond Index is a market capitalization weighted index consisting of the government bond markets. Country eligibility is determined based on market capitalization and investability criteria. All issues have a remaining maturity of at least one year. The returns shown for the Composite Index reflect no deduction of fees, expenses, or taxes. Unlike the Fund, these Indexes are unmanaged, are not available for investment, and do not incur expenses. The chart on page 22 illustrates the performance of a hypothetical $10,000 investment made in the Managers AMG FQ Global Essentials Fund on October 31, 1999, to a $10,000 investment made in the Hedged Index and the Unhedged Index for the same time period. Figures include reinvestment of capital gains and dividends. The listed returns for the Fund are net of expenses and the returns for the index exclude expenses. The graph and table do not reflect the deduction of taxes that a shareholder would pay on a Fund distribution or redemption of shares. Total returns for the Fund would have been lower had certain expenses not been reduced.
21
Managers AMG FQ Global Essentials Fund
Portfolio Manager’s Comments (continued)
Cumulative Total Return Performance
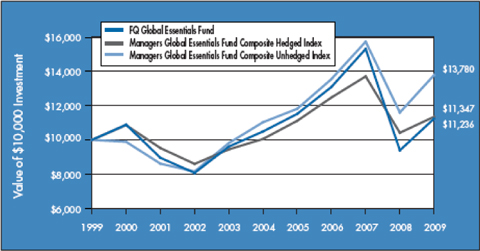
The table below shows the average annualized total returns for the Managers AMG FQ Global Essentials Fund and the Managers Global Essentials Fund Composite Hedged Index from October 31, 1999 to October 31, 2009.
| | | | | | | | | |
Average Annual Total Returns 1 | | One Year | | | Five Years | | | Ten Years | |
Managers AMG FQ Global Essentials Fund 2,3,4,5 | | 19.67 | % | | 1.39 | % | | 1.17 | % |
Managers Global Essentials Fund Composite Hedged Index 6 | | 8.96 | % | | 2.46 | % | | 1.27 | % |
Managers Global Essentials Fund Composite Unhedged Index 6 | | 18.81 | % | | 4.56 | % | | 3.26 | % |
S&P 500 Index (former benchmark) 7 | | 9.80 | % | | 0.33 | % | | (0.95 | )% |
Managers Fremont Global Fund Composite Index (former benchmark) 7 | | 19.55 | % | | 4.19 | % | | 2.79 | % |
The performance data shown represents past performance, which is not a guarantee of future results. Current performance may be lower or higher than the performance data quoted. The investment return and principal value of an investment in the Funds will fluctuate so that an investor’s shares, when redeemed, may be worth more or less than their original cost. For performance information through the most recent month end please call (800) 835-3879 or visit our website at www.managersinvest.com.
In choosing a Fund, investors should carefully consider the amount they plan to invest, their investment objectives, the Fund’s investment objectives, risks, charges and expenses before investing. For this and other information, please call (800) 835-3879 or visit www.managersinvest.com for a free prospectus. Read it carefully before investing or sending money. Distributed by Managers Distributors, Inc., member FINRA.
| 1 | Total return equals income yield plus share price change and assumes reinvestment of all dividends and capital gain distributions. Returns are net of fees and may reflect offsets of Fund expenses as described in the Prospectus. No adjustment has been made for taxes payable by shareholders on their reinvested dividends and capital gain distributions. Returns for periods greater than one year are annualized. The listed returns on the Fund are net of expenses and based on the published NAV as of October 31, 2009. All returns are in U.S. dollars($). |
| 2 | Investments in foreign securities and currency instruments are subject to additional risks such as erratic market conditions, economic and political instability, and currency exchange rate fluctuations. |
| 3 | The Fund is subject to special risk considerations similar to those associated with the direct ownership of real estate. Real estate valuations may be subject to factors such as changing general and local economic, financial, competitive and environmental conditions. |
| 4 | Because the Fund invests in exchange-traded funds (ETFs) which incur their own costs, investing in them could result in a higher cost to the investor. Additionally, the Fund will be indirectly exposed to all the risks of securities held by the ETFs. |
| 5 | Obligations of certain government agencies are not backed by the full faith and credit of the U.S. Government. If one of these agencies defaulted on a loan, there is no guarantee that the U.S. Government will provide financial support. Additionally, debt securities of the U.S. Government may be affected by changing interest rates and subject to prepayment risk. |
| 6 | The Composite Index is comprised of 60% MSCI World Index and 40% Citigroup World Government Bond Index. The MSCI World Index is a free float-adjusted market capitalization weighted index that is designed to measure the equity market performance of developed and emerging markets. As of June 2009 the MSCI World Index consisted of 23 developed country indices. The Citigroup World Government Bond Index is a market capitalization weighted index consisting of the government bond markets. Country eligibility is determined based on market capitalization and investability criteria. All issues have a remaining maturity of at least one year. The returns shown for the Composite Index reflect no deduction of fees, expenses, or taxes. |
| 7 | Prior to September 28, 2009, the former benchmark was a Composite Index comprised of 65% of the MSCI World Index and 35% of the Barclays Capital Global Aggregate Index (formerly the Lehman Brothers Global Aggregate Index). The MSCI World Index is a free float-adjusted market capitalization weighted index that is designed to measure global developed markets equity performance. The Barclays Capital Global Aggregate Index provides a broad-based measure of the global investment-grade fixed-rate debt markets. The returns shown for the former Composite Index reflect no deduction of fees, expenses, or taxes. The S&P 500 Index is a market capitalization weighted index of 500 U.S. common stocks. The returns shown for the S&P 500 Index reflect no deduction of fees, expenses, or taxes. |
Not FDIC insured, nor bank guaranteed. May lose value.
22
Managers AMG FQ Funds
Statements of Assets and Liabilities
October 31, 2009
| | | | | | | | |
| | | FQ Tax-Managed
U.S. Equity | | | FQ U.S.
Equity | |
Assets: | | | | | | | | |
Investments at value (including securities on loan valued at $1,799,064 and $1,134,103, respectively)* | | $ | 53,851,308 | | | $ | 51,767,614 | |
Cash | | | — | | | | 5,750 | |
Cash collateral for futures | | | — | | | | 77,000 | |
Receivable for investments sold | | | 145,339 | | | | — | |
Receivable for Fund shares sold | | | 1,937 | | | | 8,475 | |
Dividends and other receivables | | | 31,876 | | | | 48,155 | |
Prepaid expenses | | | 13,248 | | | | 16,627 | |
Total assets | | | 54,043,708 | | | | 51,923,621 | |
Liabilities: | | | | | | | | |
Payable upon return of securities loaned | | | 1,889,526 | | | | 1,197,104 | |
Payable for Fund shares repurchased | | | 89,492 | | | | 23,309 | |
Payable for investments purchased | | | 908,964 | | | | — | |
Payable for variation margin on futures | | | — | | | | 7,150 | |
Accrued expenses: | | | | | | | | |
Investment advisory and management fees | | | 33,836 | | | | 4,840 | |
Administrative fees | | | — | | | | 11,277 | |
Distribution fees | | | 5,788 | | | | 4,883 | |
Professional fees | | | 39,758 | | | | 40,201 | |
Other | | | 21,862 | | | | 32,259 | |
Total liabilities | | | 2,989,226 | | | | 1,321,023 | |
Net Assets | | $ | 51,054,482 | | | $ | 50,602,598 | |
Net Assets Represent: | | | | | | | | |
Paid-in capital | | $ | 96,074,292 | | | $ | 75,338,287 | |
Undistributed net investment income | | | 123,985 | | | | 502,886 | |
Accumulated net realized loss from investments and futures contracts | | | (50,140,267 | ) | | | (25,845,325 | ) |
Net unrealized appreciation of investments and futures contracts | | | 4,996,472 | | | | 606,750 | |
Net Assets | | $ | 51,054,482 | | | $ | 50,602,598 | |
Class A Shares - Net Assets | | $ | 7,175,363 | | | $ | 18,587,613 | |
Shares outstanding | | | 716,715 | | | | 2,081,504 | |
Net asset value, offering and redemption price per share | | $ | 10.01 | | | $ | 8.93 | |
Offering price per share based on a maximum sales charge of 5.75%
(Net asset value per share/(100% - maximum sales charge)) | | $ | 10.62 | | | $ | 9.47 | |
Class C Shares - Net Assets | | $ | 4,513,437 | | | $ | 840,275 | |
Shares outstanding | | | 457,112 | | | | 95,119 | |
Net asset value, offering and redemption price per share | | $ | 9.87 | | | $ | 8.83 | |
Institutional Class Shares - Net Assets | | $ | 39,365,682 | | | $ | 31,174,710 | |
Shares outstanding | | | 3,942,497 | | | | 3,468,149 | |
Net asset value, offering and redemption price per share | | $ | 9.98 | | | $ | 8.99 | |
* Investments at cost | | $ | 48,854,836 | | | $ | 51,157,648 | |
The accompanying notes are an integral part of these financial statements.
23
Managers AMG FQ Global Alternatives Fund
Statement of Net Assets
October 31, 2009
| | | | | | | |
| | | Principal Amount | | Value | |
Assets: | | | | | | | |
Investments in Securities - 97.1% | | | | | | | |
U.S. Government Obligations - 7.5%1,2 | | | | | | | |
U.S. Treasury Bills, 0.010%, 11/05/09 | | $ | 6,380,000 | | $ | 6,379,994 | |
U.S. Treasury Bills, 0.030%, 01/07/10 | | | 1,100,000 | | | 1,099,959 | |
U.S. Treasury Bills, 0.050%, 01/28/10 | | | 10,225,000 | | | 10,223,763 | |
| | | | | | | |
Total U.S. Government Obligations
(cost $17,703,091) | | | | | | 17,703,716 | |
| | |
| | | Shares | | | |
Exchange Traded Fund - 19.6% | | | | | | | |
S&P 500 SPDR Trust Series I (cost $39,230,480) | | | 448,130 | | | 46,408,343 | |
Short-Term Investments - 70.0%3 | | | | | | | |
Dreyfus Cash Management Fund, Institutional Class Shares, 0.13%4 | | | 72,334,686 | | | 72,334,686 | |
JPMorgan Liquid Assets Money Market Fund, Capital Shares, 0.25% | | | 92,988,983 | | | 92,988,983 | |
| | | | | | | |
Total Short-Term Investments
(cost $165,323,669) | | | | | | 165,323,669 | |
Total Investments in Securities
(cost $222,257,240) | | | | | | 229,435,728 | |
Receivable for Fund shares sold | | | | | | 3,818,916 | |
Interest and other receivables | | | | | | 29,536 | |
Receivable for variation margin on futures contracts | | | | | | 6,392,266 | |
Unrealized gains on forward foreign currency contracts | | | | | | 9,766,347 | |
Prepaid expenses | | | | | | 28,986 | |
Total assets | | | | | | 249,471,779 | |
Liabilities: | | | | | | | |
Payable for Fund shares repurchased | | | | | | 870,913 | |
Payable for foreign currency contracts | | | | | | 41,977 | |
Unrealized losses on forward foreign currency contracts | | | | | | 8,135,250 | |
Payable for variation margin on futures contracts | | | | | | 3,731,055 | |
Accrued expenses: | | | | | | | |
Investment advisory and management fees | | | | | | 230,943 | |
Administrative fees | | | | | | 48,044 | |
Distribution fees | | | | | | 67,047 | |
Professional fees | | | | | | 67,647 | |
Other | | | | | | 58,668 | |
Total liabilities | | | | | | 13,251,544 | |
Net Assets | | | | | $ | 236,220,235 | |
Net Assets Represent: | | | | | | | |
Paid-in capital | | | | | $ | 236,392,412 | |
Undistributed net investment loss | | | | | | (1,589,131 | ) |
Accumulated net realized loss from investments, futures and foreign currency contracts | | | | | | (10,392,804 | ) |
Net unrealized appreciation of investments, futures and foreign currency contracts and translations | | | | | | 11,809,758 | |
Net Assets | | | | | $ | 236,220,235 | |
Class A Shares - Net Assets | | | | | $ | 206,153,169 | |
Shares outstanding | | | | | | 20,697,044 | |
Net asset value and redemption price per share | | | | | $ | 9.96 | |
Offering price per share based on a maximum sales charge of 5.75%
(Net asset value per share/(100% - maximum sales charge)) | | | | | $ | 10.57 | |
Class C Shares - Net Assets | | | | | $ | 30,067,066 | |
Shares outstanding | | | | | | 3,077,261 | |
Net asset value and redemption price per share | | | | | $ | 9.77 | |
Note: Based on the cost of investments of $222,257,240 for Federal income tax purposes at October 31, 2009, the aggregate gross unrealized appreciation and depreciation were $7,178,488 and $0, respectively, resulting in net unrealized appreciation of investments of $7,178,488.
| 1 | Securities held as collateral for futures contracts, amounting to a market value of $17,703,716, or 7.5% of net assets. |
| 2 | Yield shown represents yield to maturity at October 31, 2009. |
| 3 | Yield shown for each investment company listed below represents October 31, 2009, seven-day average yield, which refers to the sum of the previous seven days’ dividends paid, expressed as an annual percentage. |
| 4 | A portion of this investment is held in a segregated account as collateral for forward currency contracts, amounting to a market value of $780,000, or 0.3% of net assets. |
The accompanying notes are an integral part of these financial statements.
24
Managers AMG FQ Global Essentials Fund
Statement of Net Assets
October 31, 2009
| | | | | | | |
| | | Principal Amount | | Value | |
Assets: | | | | | | | |
Investments in Securities - 104.7% | | | | | | | |
U.S. Government Obligations - 32.8% | | | | | | | |
U.S. Treasury Bills, 0.19%, 01/07/10 1,2 | | $ | 9,000,000 | | $ | 8,999,838 | |
U.S. Treasury Inflation Indexed Notes, 2.000%, 07/15/14 | | | 2,970,912 | | | 3,137,330 | |
U.S. Treasury Inflation Indexed Notes, 2.375%, 04/15/11 | | | 1,635,209 | | | 1,693,081 | |
U.S. Treasury Inflation Indexed Notes, 2.375%, 01/15/17 | | | 2,758,743 | | | 2,978,364 | |
U.S. Treasury Inflation Indexed Notes, 2.500%, 07/15/16 | | | 2,499,432 | | | 2,719,110 | |
U.S. Treasury Inflation Indexed Notes, 3.000%, 07/15/12 | | | 1,219,444 | | | 1,310,807 | |
U.S. Treasury Inflation Indexed Bonds, 1.750%, 01/15/28 | | | 554,194 | | | 534,710 | |
U.S. Treasury Inflation Indexed Bonds, 2.375%, 01/15/25 | | | 3,150,655 | | | 3,355,693 | |
U.S. Treasury Inflation Indexed Bonds, 3.375%, 04/15/32 | | | 1,392,079 | | | 1,727,702 | |
| | | | | | | |
Total U.S. Government Obligations
(cost $26,201,187) | | | | | | 26,456,635 | |
| | |
| | | Shares | | | |
Exchange Traded Funds - 7.8% | | | | | | | |
SPDR DB International Government Inflation-Protected Bond 3 | | | 58,318 | | | 3,304,881 | |
Vanguard REIT 3 | | | 74,500 | | | 2,948,710 | |
| | | | | | | |
Total Exchange Traded Funds
(cost $6,333,809) | | | | | | 6,253,591 | |
Short-Term Investments - 64.1%4 | | | | | | | |
BNY Institutional Cash Reserves Fund, Series A, 0.07%5 | | | 3,385,012 | | | 3,385,012 | |
BNY Institutional Cash Reserves Fund, Series B*5, 6 | | | 103,687 | | | 16,331 | |
Dreyfus Cash Management Fund, Institutional Class Shares, 0.13% | | | 48,289,648 | | | 48,289,648 | |
| | | | | | | |
Total Short-Term Investments
(cost $51,778,347) | | | | | | 51,690,991 | |
Total Investments
(cost $84,313,343) | | | | | | 84,401,217 | |
Receivable for investments sold | | | | | | 2,786 | |
Receivable for Fund shares sold | | | | | | 625 | |
Interest and other receivables | | | | | | 177,333 | |
Receivable for variation margin on futures contracts | | | | | | 452,811 | |
Prepaid expenses | | | | | | 10,833 | |
Total assets | | | | | | 85,045,605 | |
Liabilities: | | | | | | | |
Payable for Fund shares repurchased | | | | | | 50,486 | |
Payable upon return of securities loaned | | | | | | 3,488,699 | |
Payable for variation margin on futures contracts | | | | | | 764,684 | |
Accrued expenses: | | | | | | | |
Investment advisory and management fees | | | | | | 38,012 | |
Administrative fees | | | | | | 17,449 | |
Professional fees | | | | | | 47,266 | |
Other | | | | | | 54,581 | |
Total liabilities | | | | | | 4,461,177 | |
Net Assets | | | | | $ | 80,584,428 | |
Net Assets Represent: | | | | | | | |
Paid-in capital | | | | | $ | 148,703,298 | |
Undistributed net investment income | | | | | | 710,456 | |
Accumulated net realized loss from investments, futures and foreign currency contracts | | | | | | (67,666,587 | ) |
Net unrealized depreciation of investments, futures and translations | | | | | | (1,162,739 | ) |
Net Assets | | | | | $ | 80,584,428 | |
Shares outstanding | | | | | | 7,219,012 | |
Net asset value and redemption price per share | | | | | $ | 11.16 | |
Note: Based on the cost of investments of $84,313,347 for Federal income tax purposes at October 31, 2009, the aggregate gross unrealized appreciation and depreciation were $168,092 and $80,222, respectively, resulting in net unrealized appreciation of investments of $87,870.
| * | Non-income-producing securities. |
| 1 | Security held as collateral for futures contracts, amounting to a market value of $8,999,838, or 11.2% of net assets. |
| 2 | Yield shown represents yield to maturity at October 31, 2009. |
| 3 | Some or all of these shares, amounting to a market value of $3,354,879, or 4.2% of net assets, were out on loan to various brokers. |
| 4 | Yield shown for each investment company listed below represents October 31, 2009, seven-day average yield, which refers to the sum of the previous seven days’ dividends paid, expressed as an annual percentage. |
| 5 | Collateral received from brokers for securities lending was invested in these short-term investments. |
| 6 | On September 12, 2008, The Bank of New York Mellon established a separate sleeve of the BNY Institutional Cash Reserves Fund (Series B) to hold certain Lehman Brothers floating rate notes. The Fund’s position in Series B is being marked to market daily. |
The accompanying notes are an integral part of these financial statements.
25
Managers AMG FQ Funds
Statements of Operations
For the fiscal year ended October 31, 2009
| | | | | | | | | | | | | | | | |
| | | FQ Tax-Managed
U.S. Equity | | | FQ U.S. Equity | | | FQ Global
Alternatives | | | FQ Global
Essentials | |
Investment Income: | | | | | | | | | | | | | | | | |
Dividend income | | $ | 883,596 | | | $ | 1,163,638 | | | $ | 2,122,129 | | | $ | 1,274,056 | |
Dividend income from affiliate | | | — | | | | — | | | | — | | | | 2,830,865 | |
Interest income | | | — | | | | — | | | | — | | | | 83,687 | |
Securities lending fees | | | 15,506 | | | | 27,658 | | | | — | | | | 15,693 | |
Foreign withholding tax | | | (118 | ) | | | (78 | ) | | | — | | | | (95,309 | ) |
Total investment income | | | 898,984 | | | | 1,191,218 | | | | 2,122,129 | | | | 4,108,992 | |
Expenses: | | | | | | | | | | | | | | | | |
Investment advisory and management fees | | | 452,805 | | | | 174,948 | | | | 3,241,548 | | | | 429,572 | |
Administrative fees | | | — | | | | 124,963 | | | | 476,698 | | | | 178,988 | |
Distribution fees Class A | | | 22,759 | | | | 48,071 | | | | 419,266 | | | | — | |
Distribution fees Class C | | | 52,565 | | | | 10,289 | | | | 229,729 | | | | — | |
Interest expense on futures | | | — | | | | — | | | | 63,305 | | | | — | |
Transfer agent | | | 45,788 | | | | 86,931 | | | | 145,158 | | | | 54,561 | |
Professional fees | | | 42,869 | | | | 43,248 | | | | 90,637 | | | | 42,395 | |
Registration fees | | | 38,972 | | | | 35,266 | | | | 43,648 | | | | 18,203 | |
Custodian | | | 22,350 | | | | 38,361 | | | | 35,108 | | | | 94,874 | |
Reports to shareholders | | | 15,777 | | | | 6,265 | | | | 57,687 | | | | 8,134 | |
Trustees fees and expenses | | | 5,820 | | | | 4,644 | | | | 19,586 | | | | 6,964 | |
Miscellaneous | | | 7,386 | | | | 6,365 | | | | 9,326 | | | | 5,920 | |
Total expenses before offsets | | | 707,091 | | | | 579,351 | | | | 4,831,696 | | | | 839,611 | |
Fee waivers | | | — | | | | — | | | | (41,520 | ) | | | (162,979 | ) |
Expense reimbursements | | | (101,952 | ) | | | (124,476 | ) | | | (797,699 | ) | | | (4,809 | ) |
Expense reductions | | | (369 | ) | | | (526 | ) | | | (3,878 | ) | | | (13,879 | ) |
Net expenses | | | 604,770 | | | | 454,349 | | | | 3,988,599 | | | | 657,944 | |
Net investment income (loss) | | | 294,214 | | | | 736,869 | | | | (1,866,470 | ) | | | 3,451,048 | |
Net Realized and Unrealized Gain (Loss): | | | | | | | | | | | | | | | | |
Net realized loss on investment transactions | | | (22,958,298 | ) | | | (15,696,334 | ) | | | (3,333,106 | ) | | | (15,906,860 | ) |
Net realized gain (loss) on futures contracts | | | — | | | | (48,484 | ) | | | (18,006,514 | ) | | | 73,018 | |
Net realized gain (loss) on foreign currency contracts and translations | | | — | | | | — | | | | 7,743,396 | | | | (103,201 | ) |
Net unrealized appreciation of investments | | | 21,787,050 | | | | 16,587,102 | | | | 10,588,232 | | | | 25,749,761 | |
Net unrealized appreciation (depreciation) of futures contracts | | | — | | | | 67,978 | | | | 5,490,007 | | | | (1,259,814 | ) |
Net unrealized appreciation (depreciation) of foreign currency contracts and translations | | | — | | | | — | | | | (4,555,555 | ) | | | 9,346 | |
Net realized and unrealized gain (loss) | | | (1,171,248 | ) | | | 910,262 | | | | (2,073,540 | ) | | | 8,562,250 | |
Net Increase (Decrease) in Net Assets Resulting from Operations | | $ | (877,034 | ) | | $ | 1,647,131 | | | $ | (3,940,010 | ) | | $ | 12,013,298 | |
The accompanying notes are an integral part of these financial statements.
26
Managers AMG FQ Funds
Statements of Changes in Net Assets
For the fiscal year ended October 31,
| | | | | | | | | | | | | | | | |
| | | FQ Tax-Managed U.S. Equity | | | FQ U.S. Equity | |
| | | 2009 | | | 2008 | | | 2009 | | | 2008 | |
Increase (Decrease) in Net Assets | | | | | | | | | | | | | | | | |
From Operations: | | | | | | | | | | | | | | | | |
Net investment income | | $ | 294,214 | | | $ | 877,114 | | | $ | 736,869 | | | $ | 1,077,680 | |
Net realized loss on investments, futures, foreign currency contracts and translations | | | (22,958,298 | ) | | | (9,642,674 | ) | | | (15,744,818 | ) | | | (10,174,159 | ) |
Net unrealized appreciation (depreciation) of investments, futures, foreign currency contracts and translations | | | 21,787,050 | | | | (43,337,251 | ) | | | 16,655,080 | | | | (26,998,895 | ) |
Net increase (decrease) in net assets resulting from operations | | | (877,034 | ) | | | (52,102,811 | ) | | | 1,647,131 | | | | (36,095,374 | ) |
Distributions to Shareholders: | | | | | | | | | | | | | | | | |
From net investment income | | | (842,465 | ) | | | (537,697 | ) | | | (912,255 | ) | | | (1,004,699 | ) |
From net realized gain on investments | | | — | | | | — | | | | — | | | | (10,995,141 | ) |
Total distributions to shareholders | | | (842,465 | ) | | | (537,697 | ) | | | (912,255 | ) | | | (11,999,840 | ) |
From Capital Share Transactions: | | | | | | | | | | | | | | | | |
Proceeds from the sale of shares | | | 7,327,541 | | | | 35,754,385 | | | | 5,551,496 | | | | 18,968,205 | |
Reinvestment of dividends and distributions | | | 744,847 | | | | 454,409 | | | | 890,957 | | | | 11,587,804 | |
Cost of shares repurchased | | | (26,207,210 | ) | | | (41,462,127 | ) | | | (15,833,671 | ) | | | (30,215,539 | ) |
Net increase (decrease) from capital share transactions | | | (18,134,822 | ) | | | (5,253,333 | ) | | | (9,391,218 | ) | | | 340,470 | |
Total decrease in net assets | | | (19,854,321 | ) | | | (57,893,841 | ) | | | (8,656,342 | ) | | | (47,754,744 | ) |
Net Assets: | | | | | | | | | | | | | | | | |
Beginning of year | | | 70,908,803 | | | | 128,802,644 | | | | 59,258,940 | | | | 107,013,684 | |
End of year | | $ | 51,054,482 | | | $ | 70,908,803 | | | $ | 50,602,598 | | | $ | 59,258,940 | |
End of year undistributed net investment income | | $ | 123,985 | | | $ | 675,684 | | | $ | 502,886 | | | $ | 677,554 | |
| | | | | | | | | | | | | | | | |
Share Transactions: | | | | | | | | | | | | | | | | |
Sale of shares | | | 845,794 | | | | 2,517,854 | | | | 723,380 | | | | 1,781,746 | |
Reinvestment of dividends and distributions | | | 85,675 | | | | 28,638 | | | | 116,028 | | | | 881,812 | |
Shares repurchased | | | (2,927,306 | ) | | | (3,114,114 | ) | | | (2,040,442 | ) | | | (2,733,178 | ) |
Net decrease in shares | | | (1,995,837 | ) | | | (567,622 | ) | | | (1,201,034 | ) | | | (69,620 | ) |
The accompanying notes are an integral part of these financial statements.
27
Managers AMG FQ Funds
Statements of Changes in Net Assets
For the fiscal year ended October 31,
| | | | | | | | | | | | | | | | |
| | | FQ Global Alternatives | | | FQ Global Essentials | |
| | | 2009 | | | 2008 | | | 2009 | | | 2008 | |
Increase (Decrease) in Net Assets | | | | | | | | | | | | | | | | |
From Operations: | | | | | | | | | | | | | | | | |
Net investment income (loss) | | $ | (1,866,470 | ) | | $ | 142,091 | | | $ | 3,451,048 | | | $ | 4,426,224 | |
Net realized gain (loss) on investments, futures and foreign currency transactions | | | (13,596,224 | ) | | | 3,888,830 | | | | (15,937,043 | ) | | | (8,505,421 | ) |
Net unrealized appreciation (depreciation) of investments, futures and foreign currency translations | | | 11,522,684 | | | | 2,778,850 | | | | 24,499,293 | | | | (54,049,244 | ) |
Net increase (decrease) in net assets resulting from operations | | | (3,940,010 | ) | | | 6,809,771 | | | | 12,013,298 | | | | (58,128,441 | ) |
Distributions to Shareholders: | | | | | | | | | | | | | | | | |
From net investment income | | | (11,141,269 | ) | | | (121,939 | ) | | | (3,637,680 | ) | | | (4,898,251 | ) |
From net realized gain on investments | | | — | | | | (447,105 | ) | | | — | | | | — | |
Total distributions to shareholders | | | (11,141,269 | ) | | | (569,044 | ) | | | (3,637,680 | ) | | | (4,898,251 | ) |
From Capital Share Transactions: | | | | | | | | | | | | | | | | |
Proceeds from the sale of shares1 | | | 281,611,581 | | | | 81,169,035 | | | | 5,118,790 | | | | 4,188,647 | |
Reinvestment of dividends and distributions | | | 7,669,693 | | | | 354,090 | | | | 3,606,451 | | | | 4,836,471 | |
Cost of shares repurchased | | | (139,340,041 | ) | | | (31,583,474 | ) | | | (14,854,983 | ) | | | (42,764,695 | ) |
Net increase (decrease) from capital share transactions | | | 149,941,233 | | | | 49,939,651 | | | | (6,129,742 | ) | | | (33,739,577 | ) |
Total increase (decrease) in net assets | | | 134,859,954 | | | | 56,180,378 | | | | 2,245,876 | | | | (96,766,269 | ) |
Net Assets: | | | | | | | | | | | | | | | | |
Beginning of year | | | 101,360,281 | | | | 45,179,903 | | | | 78,338,552 | | | | 175,104,821 | |
End of year | | $ | 236,220,235 | | | $ | 101,360,281 | | | $ | 80,584,428 | | | $ | 78,338,552 | |
End of year undistributed net investment income (loss) | | $ | (1,589,131 | ) | | $ | 4,977,692 | | | $ | 710,456 | | | $ | 716,819 | |
| | | | | | | | | | | | | | | | |
Share Transactions: | | | | | | | | | | | | | | | | |
Sale of shares | | | 28,043,294 | | | | 7,747,805 | | | | 465,056 | | | | 305,414 | |
Reinvestment of dividends and distributions | | | 771,498 | | | | 35,643 | | | | 398,063 | | | | 312,116 | |
Shares repurchased | | | (14,277,061 | ) | | | (3,101,019 | ) | | | (1,621,368 | ) | | | (3,256,235 | ) |
Net increase (decrease) in shares | | | 14,537,731 | | | | 4,682,429 | | | | (758,249 | ) | | | (2,638,705 | ) |
| 1 | For the fiscal year ended October 31, 2009, the proceeds from the sale of shares for FQ Global Essentials includes the receipt of a market timing settlement of $288,873. |
The accompanying notes are an integral part of these financial statements.
28
Managers AMG FQ Tax-Managed U.S. Equity Fund
Financial Highlights
For a share outstanding throughout each fiscal year
| | | | | | | | | | | | | | | | | | | | |
| | | For the fiscal year ended October 31, | |
Institutional Class Shares | | 2009 | | | 2008 | | | 2007 | | | 2006 | | | 2005 | |
Net Asset Value, Beginning of Year | | $ | 9.99 | | | $ | 16.80 | | | $ | 13.93 | | | $ | 11.89 | | | $ | 9.94 | |
Income from Investment Operations: | | | | | | | | | | | | | | | | | | | | |
Net investment income | | | 0.07 | | | | 0.13 | | | | 0.06 | | | | 0.03 | | | | 0.01 | |
Net realized and unrealized gain (loss) on investments | | | 0.07 | | | | (6.87 | ) | | | 2.82 | | | | 2.03 | | | | 2.04 | |
Total from investment operations | | | 0.14 | | | | (6.74 | ) | | | 2.88 | | | | 2.06 | | | | 2.05 | |
Less Distributions to Shareholders from: | | | | | | | | | | | | | | | | | | | | |
Net investment income | | | (0.15 | ) | | | (0.07 | ) | | | (0.01 | ) | | | (0.02 | ) | | | (0.10 | ) |
Net Asset Value, End of Year | | $ | 9.98 | | | $ | 9.99 | | | $ | 16.80 | | | $ | 13.93 | | | $ | 11.89 | |
Total Return1 | | | 1.65 | % | | | (40.26 | )% | | | 20.68 | % | | | 17.37 | % | | | 20.75 | % |
Ratio of net expenses to average net assets | | | 0.99 | % | | | 0.99 | % | | | 0.99 | % | | | 0.99 | % | | | 0.99 | % |
Ratio of net investment income to average net assets1 | | | 0.69 | % | | | 0.92 | % | | | 0.37 | % | | | 0.23 | % | | | 0.04 | % |
Portfolio turnover | | | 147 | % | | | 136 | % | | | 65 | % | | | 98 | % | | | 105 | % |
Net assets at end of year (000’s omitted) | | $ | 39,366 | | | $ | 48,882 | | | $ | 95,510 | | | $ | 82,975 | | | $ | 55,377 | |
| | | | | | | | | | | | | | | | | | | | |
Expense Offsets:2 | | | | | | | | | | | | | | | | | | | | |
Ratio of total expenses to average net assets | | | 1.18 | % | | | 1.03 | % | | | 1.07 | % | | | 1.11 | % | | | 1.21 | % |
Ratio of net investment income (loss) to average net assets | | | 0.50 | % | | | 0.88 | % | | | 0.29 | % | | | 0.12 | % | | | (0.17 | )% |
| | | | | | | | | | | | | | | | | | | | |
| 1 | Total returns and net investment income would have been lower had certain expenses not been reduced. (See Note 1(c) of Notes to Financial Statements.) |
| 2 | Excludes the impact of expense reimbursements, fee waivers and expense reductions such as brokerage credits, but include non-reimbursable expenses, if any, such as interest and taxes. (See Note 1(c) of Notes to Financial Statements.) |
29
Managers AMG FQ Tax-Managed U.S. Equity Fund
Financial Highlights
For a share outstanding throughout each fiscal period year
| | | | | | | | | | | | | | | | |
| | | For the fiscal year ended October 31, | | | For the fiscal period
ended October 31,
2006 * | |
Class A Shares | | 2009 | | | 2008 | | | 2007 | | |
Net Asset Value, Beginning of Period | | $ | 9.99 | | | $ | 16.75 | | | $ | 13.91 | | | $ | 13.01 | |
Income from Investment Operations: | | | | | | | | | | | | | | | | |
Net investment income | | | 0.09 | | | | 0.10 | | | | 0.02 | | | | 0.00 | 5 |
Net realized and unrealized gain (loss) on investments | | | 0.04 | | | | (6.81 | ) | | | 2.82 | | | | 0.90 | |
Total from investment operations | | | 0.13 | | | | (6.71 | ) | | | 2.84 | | | | 0.90 | |
Less Distributions to Shareholders from: | | | | | | | | | | | | | | | | |
Net investment income | | | (0.11 | ) | | | (0.05 | ) | | | — | | | | — | |
Net Asset Value, End of Period | | $ | 10.01 | | | $ | 9.99 | | | $ | 16.75 | | | $ | 13.91 | |
Total Return1 | | | 1.53 | % | | | (40.15 | )%6 | | | 20.42 | % | | | 6.92 | %2 |
Ratio of net expenses to average net assets | | | 1.24 | % | | | 1.24 | % | | | 1.24 | % | | | 1.24 | %3 |
Ratio of net investment income (loss) to average net assets1 | | | 0.45 | % | | | 0.67 | % | | | 0.30 | % | | | (0.11 | )%3 |
Portfolio turnover | | | 147 | % | | | 136 | % | | | 65 | % | | | 98 | %2 |
Net assets at end of period (000’s omitted) | | $ | 7,175 | | | $ | 15,334 | | | $ | 23,803 | | | $ | 574 | |
| | | | | | | | | | | | | | | | |
Expense Offsets:4 | | | | | | | | | | | | | | | | |
Ratio of total expenses to average net assets | | | 1.43 | % | | | 1.28 | % | | | 1.32 | % | | | 1.40 | %3 |
Ratio of net investment income (loss) to average net assets | | | 0.26 | % | | | 0.63 | % | | | 0.22 | % | | | (0.27 | )%3 |
| | | | | | | | | | | | | | | | |
| | |
| | | For the fiscal year ended October 31, | | | For the fiscal period
ended October 31,
2006 * | |
Class C Shares | | 2009 | | | 2008 | | | 2007 | | |
Net Asset Value, Beginning of Period | | $ | 9.82 | | | $ | 16.53 | | | $ | 13.83 | | | $ | 13.01 | |
Income from Investment Operations: | | | | | | | | | | | | | | | | |
Net investment income (loss) | | | (0.03 | ) | | | (0.02 | ) | | | 0.00 | 5 | | | (0.03 | ) |
Net realized and unrealized gain (loss) on Investments | | | 0.09 | | | | (6.69 | ) | | | 2.70 | | | | 0.85 | |
Total from investment operations | | | 0.06 | | | | (6.71 | ) | | | 2.70 | | | | 0.82 | |
Less Distributions to Shareholders from: | | | | | | | | | | | | | | | | |
Net investment income | | | (0.01 | ) | | | — | | | | — | | | | — | |
Net Asset Value, End of Period | | $ | 9.87 | | | $ | 9.82 | | | $ | 16.53 | | | $ | 13.83 | |
Total Return1 | | | 0.66 | % | | | (40.56 | )% | | | 19.52 | %6 | | | 6.30 | %2 |
Ratio of net expenses to average net assets | | | 1.99 | % | | | 1.99 | % | | | 1.99 | % | | | 1.99 | %3 |
Ratio of net investment loss to average net assets1 | | | (0.31 | )% | | | (0.09 | )% | | | (0.36 | )% | | | (0.91 | )%3 |
Portfolio turnover | | | 147 | % | | | 136 | % | | | 65 | % | | | 98 | %2 |
Net assets at end of period (000’s omitted) | | $ | 4,513 | | | $ | 6,693 | | | $ | 9,490 | | | $ | 941 | |
| | | | | | | | | | | | | | | | |
Expense Offsets:4 | | | | | | | | | | | | | | | | |
Ratio of total expenses to average net assets | | | 2.18 | % | | | 2.03 | % | | | 2.07 | % | | | 2.15 | %3 |
Ratio of net investment loss to average net assets | | | (0.50 | )% | | | (0.13 | )% | | | (0.44 | )% | | | (1.06 | )%3 |
| | | | | | | | | | | | | | | | |
| * | Class A and Class C shares commenced operations on March 1, 2006. (See Notes to Financial Statements.) |
| 1 | Total returns and net investment income would have been lower had certain expenses not been reduced. (See Note 1(c) of Notes to Financial Statements.) |
| 4 | Excludes the impact of expense reimbursements or fee waivers and expense reductions such as brokerage credits, but includes non-reimbursable expenses, if any, such as interest and taxes. (See Note 1(c) of Notes to Financial Statements.) |
| 5 | Rounds to less than $0.01. |
| 6 | The Total Return is based on the Financial Statement Net Asset Value as shown above. |
30
Managers AMG FQ U.S. Equity Fund
Financial Highlights
For a share outstanding throughout each fiscal year
| | | | | | | | | | | | | | | | | | | | |
| | | For the fiscal year ended October 31, | |
Institutional Class Shares | | 2009 | | | 2008 | | | 2007 | | | 2006 | | | 2005 | |
Net Asset Value, Beginning of Year | | $ | 8.68 | | | $ | 15.49 | | | $ | 14.90 | | | $ | 12.93 | | | $ | 11.62 | |
Income from Investment Operations: | | | | | | | | | | | | | | | | | | | | |
Net investment income | | | 0.14 | | | | 0.19 | | | | 0.15 | | | | 0.17 | | | | 0.20 | |
Net realized and unrealized gain (loss) on investments | | | 0.32 | | | | (5.23 | ) | | | 2.11 | | | | 2.49 | | | | 1.26 | |
Total from investment operations | | | 0.46 | | | | (5.04 | ) | | | 2.26 | | | | 2.66 | | | | 1.46 | |
Less Distributions to Shareholders from: | | | | | | | | | | | | | | | | | | | | |
Net investment income | | | (0.15 | ) | | | (0.16 | ) | | | (0.16 | ) | | | (0.18 | ) | | | (0.15 | ) |
Net realized gain on investments | | | — | | | | (1.61 | ) | | | (1.51 | ) | | | (0.51 | ) | | | — | |
Total distributions to shareholders | | | (0.15 | ) | | | (1.77 | ) | | | (1.67 | ) | | | (0.69 | ) | | | (0.15 | ) |
Net Asset Value, End of Year | | $ | 8.99 | | | $ | 8.68 | | | $ | 15.49 | | | $ | 14.90 | | | $ | 12.93 | |
Total Return1 | | | 5.56 | % | | | (36.43 | )% | | | 16.54 | % | | | 21.44 | % | | | 12.64 | % |
Ratio of net expenses to average net assets | | | 0.79 | % | | | 0.79 | % | | | 0.79 | % | | | 0.79 | % | | | 0.85 | % |
Ratio of net investment income to average net assets1 | | | 1.58 | % | | | 1.36 | % | | | 0.96 | % | | | 1.23 | % | | | 1.49 | % |
Portfolio turnover | | | 151 | % | | | 227 | % | | | 106 | % | | | 89 | % | | | 105 | % |
Net assets at end of year (000’s omitted) | | $ | 31,175 | | | $ | 35,135 | | | $ | 82,915 | | | $ | 78,068 | | | $ | 72,470 | |
| | | | | | | | | | | | | | | | | | | | |
Expense Offsets:2 | | | | | | | | | | | | | | | | | | | | |
Ratio of total expenses to average net assets | | | 1.04 | % | | | 0.91 | % | | | 0.83 | % | | | 0.82 | % | | | — | |
Ratio of net investment income to average net assets | | | 1.33 | % | | | 1.24 | % | | | 0.92 | % | | | 1.19 | % | | | — | |
| | | | | | | | | | | | | | | | | | | | |
| 1 | Total returns and net investment income would have been lower had certain expenses not been reduced. (See Note 1(c) of Notes to Financial Statements.) |
| 2 | Excludes the impact of expense reimbursements, fee waivers and expense reductions such as brokerage credits, but include non-reimbursable expenses, if any, such as interest and taxes. (See Note 1(c) of Notes to Financial Statements.) |
31
Managers AMG FQ U.S. Equity Fund
Financial Highlights
For a share outstanding throughout each fiscal year period
| | | | | | | | | | | | | | | | |
| | | For the fiscal year ended October 31, | | | For the fiscal period
ended October 31,
2006* | |
Class A Shares | | 2009 | | | 2008 | | | 2007 | | |
Net Asset Value, Beginning of Period | | $ | 8.63 | | | $ | 15.43 | | | $ | 14.88 | | | $ | 13.53 | |
Income from Investment Operations: | | | | | | | | | | | | | | | | |
Net investment income | | | 0.11 | | | | 0.09 | | | | 0.17 | | | | 0.01 | |
Net realized and unrealized gain (loss) on investments | | | 0.32 | | | | (5.14 | ) | | | 2.05 | | | | 1.34 | |
Total from investment operations | | | 0.43 | | | | (5.05 | ) | | | 2.22 | | | | 1.35 | |
Less Distributions to Shareholders from: | | | | | | | | | | | | | | | | |
Net investment income | | | (0.13 | ) | | | (0.14 | ) | | | (0.16 | ) | | | — | |
Net realized gain on investments | | | — | | | | (1.61 | ) | | | (1.51 | ) | | | — | |
Total distributions to shareholders | | | (0.13 | ) | | | (1.75 | ) | | | (1.67 | ) | | | — | |
Net Asset Value, End of Period | | $ | 8.93 | | | $ | 8.63 | | | $ | 15.43 | | | $ | 14.88 | |
Total Return1 | | | 5.21 | % | | | (36.64 | )% | | | 16.28 | % | | | 9.98 | %2 |
Ratio of net expenses to average net assets | | | 1.04 | % | | | 1.04 | % | | | 1.04 | % | | | 1.04 | %3 |
Ratio of net investment income to average net assets1 | | | 1.35 | % | | | 1.07 | % | | | 0.56 | % | | | 0.63 | %3 |
Portfolio turnover | | | 151 | % | | | 227 | % | | | 106 | % | | | 89 | %2 |
Net assets at end of period (000’s omitted) | | $ | 18,588 | | | $ | 22,966 | | | $ | 21,773 | | | $ | 371 | |
| | | | | | | | | | | | | | | | |
Expense Offsets:4 | | | | | | | | | | | | | | | | |
Ratio of total expenses to average net assets | | | 1.29 | % | | | 1.16 | % | | | 1.08 | % | | | 1.13 | %3 |
Ratio of net investment income to average net assets | | | 1.10 | % | | | 0.95 | % | | | 0.52 | % | | | 0.54 | %3 |
| | | | | | | | | | | | | | | | |
| | |
| | | For the fiscal year ended October 31, | | | For the fiscal period
ended October 31,
2006* | |
Class C Shares | | 2009 | | | 2008 | | | 2007 | | |
Net Asset Value, Beginning of Period | | $ | 8.52 | | | $ | 15.27 | | | $ | 14.85 | | | $ | 13.53 | |
Income from Investment Operations: | | | | | | | | | | | | | | | | |
Net investment income | | | 0.06 | | | | 0.04 | | | | 0.13 | | | | 0.00 | 5 |
Net realized and unrealized gain (loss) on investments | | | 0.31 | | | | (5.13 | ) | | | 1.96 | | | | 1.32 | |
Total from investment operations | | | 0.37 | | | | (5.09 | ) | | | 2.09 | | | | 1.32 | |
Less Distributions to Shareholders from: | | | | | | | | | | | | | | | | |
Net investment income | | | (0.06 | ) | | | (0.05 | ) | | | (0.16 | ) | | | — | |
Net realized gain on investments | | | — | | | | (1.61 | ) | | | (1.51 | ) | | | — | |
Total distributions to shareholders | | | (0.06 | ) | | | (1.66 | ) | | | (1.67 | ) | | | — | |
Net Asset Value, End of Period | | $ | 8.83 | | | $ | 8.52 | | | $ | 15.27 | | | $ | 14.85 | |
Total Return1 | | | 4.42 | % | | | (37.12 | )% | | | 15.35 | % | | | 9.76 | %2 |
Ratio of net expenses to average net assets | | | 1.79 | % | | | 1.79 | % | | | 1.79 | % | | | 1.79 | %3 |
Ratio of net investment income (loss) to average net assets1 | | | 0.67 | % | | | 0.37 | % | | | (0.13 | )% | | | 0.16 | %3 |
Portfolio turnover | | | 151 | % | | | 227 | % | | | 106 | % | | | 89 | %2 |
Net assets at end of period (000’s omitted) | | $ | 840 | | | $ | 1,158 | | | $ | 2,326 | | | $ | 97 | |
| | | | | | | | | | | | | | | | |
Expense Offsets:4 | | | | | | | | | | | | | | | | |
Ratio of total expenses to average net assets | | | 2.04 | % | | | 1.91 | % | | | 1.83 | % | | | 1.88 | %3 |
Ratio of net investment income (loss) to average net assets | | | 0.42 | % | | | 0.25 | % | | | (0.17 | )% | | | (0.07 | )%3 |
| | | | | | | | | | | | | | | | |
| * | Class A and Class C shares commenced operations on March 1, 2006. (See Notes to Financial Statements.) |
| 1 | Total returns and net investment income would have been lower had certain expenses not been reduced. (See Note 1(c) of Notes to Financial Statements.) |
| 4 | Excludes the impact of expense reimbursements or fee waivers and expense reductions such as brokerage credits, but includes non-reimbursable expenses, if any, such as interest and taxes. (See Note 1(c) of Notes to Financial Statements.) |
| 5 | Rounds to less than $0.01. |
32
Managers AMG FQ Global Alternatives Fund
Financial Highlights
For a share outstanding throughout each fiscal period
| | | | | | | | | | | | | | | | |
| | | For the fiscal year ended October 31, | | | For the fiscal period
ended October 31,
2006 * | |
Class A Shares | | 2009 | | | 2008 | | | 2007 | | |
Net Asset Value, Beginning of Period | | $ | 11.00 | | | $ | 9.94 | | | $ | 9.73 | | | $ | 10.00 | |
Income from Investment Operations: | | | | | | | | | | | | | | | | |
Net investment income (loss) | | | (0.09 | )6 | | | 0.04 | 6 | | | 0.18 | 6 | | | 0.16 | |
Net realized and unrealized gain (loss) on investments | | | (0.27 | )6 | | | 1.15 | 6 | | | 0.22 | 6 | | | (0.43 | ) |
Total from investment operations | | | (0.36 | ) | | | 1.19 | | | | 0.40 | | | | (0.27 | ) |
Less Distributions to Shareholders from: | | | | | | | | | | | | | | | | |
Net investment income | | | (0.68 | )7 | | | (0.03 | ) | | | (0.19 | ) | | | — | |
Net realized gain on investments | | | — | | | | (0.10 | ) | | | — | | | | — | |
Total distributions to shareholders | | | (0.68 | ) | | | (0.13 | ) | | | (0.19 | ) | | | — | |
Net Asset Value, End of Period | | $ | 9.96 | | | $ | 11.00 | | | $ | 9.94 | | | $ | 9.73 | |
Total Return1 | | | (3.15 | )% | | | 12.17 | %5 | | | 4.11 | %5 | | | (2.70 | )%2 |
Ratio of net expenses to average net assets | | | 2.00 | % | | | 2.26 | % | | | 2.50 | % | | | 2.50 | %3 |
Ratio of net investment income (loss) to average net assets1 | | | (0.88 | )% | | | 0.36 | % | | | 1.72 | % | | | 1.38 | %3 |
Portfolio turnover | | | 77 | % | | | 133 | % | | | 104 | % | | | 48 | %2 |
Net assets at end of period (000’s omitted) | | $ | 206,153 | | | $ | 89,232 | | | $ | 37,716 | | | $ | 20,661 | |
| | | | | | | | | | | | | | | | |
Expense Offsets:4 | | | | | | | | | | | | | | | | |
Ratio of total expenses to average net assets | | | 2.44 | % | | | 2.45 | % | | | 2.56 | % | | | 3.20 | %3 |
Ratio of net investment income (loss) to average net assets | | | (1.32 | )% | | | 0.17 | % | | | 1.66 | % | | | 0.68 | %3 |
| | | | | | | | | | | | | | | | |
| | |
| | | For the fiscal year ended October 31, | | | For the fiscal period
ended October 31,
2006 * | |
Class C Shares | | 2009 | | | 2008 | | | 2007 | | |
Net Asset Value, Beginning of Period | | $ | 10.81 | | | $ | 9.82 | | | $ | 9.69 | | | $ | 10.00 | |
Income from Investment Operations: | | | | | | | | | | | | | | | | |
Net investment income (loss) | | | (0.16 | )6 | | | (0.04 | )6 | | | 0.11 | 6 | | | 0.02 | |
Net realized and unrealized gain (loss) on investments | | | (0.26 | )6 | | | 1.13 | 6 | | | 0.21 | 6 | | | (0.33 | ) |
Total from investment operations | | | (0.42 | ) | | | 1.09 | | | | 0.32 | | | | (0.31 | ) |
Less Distributions to Shareholders from: | | | | | | | | | | | | | | | | |
Net investment income | | | (0.62 | )7 | | | (0.01 | ) | | | (0.19 | ) | | | — | |
Net realized gain on investments | | | — | | | | (0.09 | ) | | | — | | | | — | |
Total distributions to shareholders | | | (0.62 | ) | | | (0.10 | ) | | | (0.19 | ) | | | — | |
Net Asset Value, End of Period | | $ | 9.77 | | | $ | 10.81 | | | $ | 9.82 | | | $ | 9.69 | |
Total Return1 | | | (3.86 | )% | | | 11.31 | %5 | | | 3.30 | %5 | | | (3.10 | )%2 |
Ratio of net expenses to average net assets | | | 2.75 | % | | | 3.02 | % | | | 3.25 | % | | | 3.25 | %3 |
Ratio of net investment income (loss) to average net assets1 | | | (1.68 | )% | | | (0.38 | )% | | | 1.03 | % | | | 1.03 | %3 |
Portfolio turnover | | | 77 | % | | | 133 | % | | | 104 | % | | | 48 | %2 |
Net assets at end of period (000’s omitted) | | $ | 30,067 | | | $ | 12,128 | | | $ | 7,464 | | | $ | 695 | |
| | | | | | | | | | | | | | | | |
Expense Offsets:4 | | | | | | | | | | | | | | | | |
Ratio of total expenses to average net assets | | | 3.19 | % | | | 3.21 | % | | | 3.31 | % | | | 3.52 | %3 |
Ratio of net investment income (loss) to average net assets | | | (2.12 | )% | | | (0.57 | )% | | | 0.97 | % | | | 0.76 | %3 |
| | | | | | | | | | | | | | | | |
| * | Commencement of operations was on March 30, 2006. |
| 1 | Total returns and net investment income would have been lower had certain expenses not been reduced. (See Note 1(c) of Notes to Financial Statements.) |
| 4 | Excludes the impact of expense reimbursements/ recoupments or fee waivers and expense reductions such as brokerage credits, but include non-reimbursable expenses, if any, such as interest and taxes. (See Note 1(c) of Notes to Financial Statements.) |
| 5 | The Total Return is based on the Financial Statement Net Asset Values as shown above. |
| 6 | Per share numbers have been calculated using average shares. |
| 7 | The per share net investment income distribution shown for Class A shares and Class C shares includes $0.67 and $0.61, respectively, of distributions from foreign currency gains. (See Note 1(d) of Notes to Financial Statements.) |
33
Managers AMG FQ Global Essentials Fund
Financial Highlights
For a share outstanding throughout each fiscal year
| | | | | | | | | | | | | | | | | | | | |
| | | For the fiscal year ended October 31, | |
Managers Global Essentials Fund | | 2009 | | | 2008 | | | 2007 | | | 2006 | | | 2005 | |
Net Asset Value, Beginning of Year | | $ | 9.82 | | | $ | 16.49 | | | $ | 14.24 | | | $ | 13.19 | | | $ | 12.19 | |
Income from Investment Operations: | | | | | | | | | | | | | | | | | | | | |
Net investment income | | | 0.47 | 3 | | | 0.45 | 3 | | | 0.08 | | | | 0.27 | | | | 0.46 | |
Net realized and unrealized gain (loss) on investments | | | 1.35 | 3 | | | (6.65 | )3 | | | 2.31 | | | | 1.48 | | | | 0.69 | |
Total from investment operations | | | 1.82 | | | | (6.20 | ) | | | 2.39 | | | | 1.75 | | | | 1.15 | |
Less Distributions to Shareholders from: | | | | | | | | | | | | | | | | | | | | |
Net investment income | | | (0.48 | ) | | | (0.47 | ) | | | (0.14 | ) | | | (0.70 | ) | | | (0.15 | ) |
Net Asset Value, End of Year | | $ | 11.16 | | | $ | 9.82 | | | $ | 16.49 | | | $ | 14.24 | | | $ | 13.19 | |
Total Return 1 | | | 19.67 | % | | | (38.66 | )% | | | 16.94 | % | | | 13.67 | % | | | 9.79 | % |
Ratio of net expenses to average net assets | | | 0.92 | % | | | 0.80 | % | | | 0.90 | % | | | 1.11 | % | | | 1.09 | % |
Ratio of net investment income to average net assets 1 | | | 4.82 | % | | | 3.18 | % | | | 0.52 | % | | | 1.68 | % | | | 1.56 | % |
Portfolio turnover | | | 213 | % | | | 143 | % | | | 123 | % | | | 60 | % | | | 108 | % |
Net assets at end of year (000’s omitted) | | $ | 80,584 | | | $ | 78,339 | | | $ | 175,105 | | | $ | 182,387 | | | $ | 183,197 | |
| | | | | | | | | | | | | | | | | | | | |
Ratios absent expense offsets: 2 | | | | | | | | | | | | | | | | | | | | |
Ratio of total expenses to average net assets | | | 1.17 | % | | | 1.08 | % | | | 1.10 | % | | | 1.13 | % | | | 1.10 | % |
Ratio of net investment income to average net assets | | | 4.57 | % | | | 2.90 | % | | | 0.32 | % | | | 1.67 | % | | | 1.56 | % |
| | | | | | | | | | | | | | | | | | | | |
| 1 | Total returns and net investment income would have been lower had certain expenses not been reduced. (See Note 1(c) of Notes to Financial Statements.) |
| 2 | Excludes the impact of expense reimbursements or fee waivers and expense reductions such as brokerage recapture credits, but includes non-reimbursable expenses, if any, such as interest and taxes. (See Note 1(c) of Notes to Financial Statements.) |
| 3 | Per share numbers have been calculated using average shares. |
34
Managers AMG FQ Funds
Notes to Financial Statements
October 31, 2009
1. Summary of Significant Accounting Policies
Managers Trust I (the “Trust”) is an open-end management investment company, organized as a Massachusetts business trust, and registered under the Investment Company Act of 1940, as amended (the “1940 Act”). Currently, the Trust is comprised of a number of different funds, each having distinct investment management objectives, strategies, risks, and policies. Included in this report are: Managers AMG FQ Tax-Managed U.S. Equity Fund (“Tax-Managed”), Managers AMG FQ U.S. Equity Fund (“U.S. Equity”), Managers AMG FQ Global Alternatives Fund (“Global Alternatives”) and Managers AMG FQ Global Essentials Fund (“Global Essentials”) (formerly Managers Fremont Global Fund), collectively the “Funds.”
Each Fund except Global Essentials offers Class A and Class C shares. In addition, Tax-Managed and U.S. Equity offer an Institutional Class. Sales of Class A shares may be subject to a front-end sales charge of up to 5.75%. Redemptions of Class A and Class C shares may be subject to a contingent-deferred sales charge (as a percentage of the original offering price or the net asset value at the time of sale, whichever is less). Tax-Managed and U.S. Equity Institutional Class shares are available, with no sales charge, to certain institutional investors and qualifying individual investors. Each class represents an interest in the same assets of the Fund and the classes are identical except for class specific expenses related to shareholder activity. Each class has equal voting privileges except that each class has exclusive voting rights with respect to its services and/or distribution plan. Please refer to a current prospectus for additional information on each share class.
At a meeting held September 10-11, 2009, the Board of Trustees approved the following changes effective September 28, 2009, for Global Essentials: (1) a name change from Managers Fremont Global Fund to Managers AMG FQ Global Essentials Fund; (2) the implementation of a new investment strategy and a change in the Fund’s benchmark; and (3) implementation of a new contractual expense limitation to limit total annual operating expenses of the Fund (exclusive of taxes, interest, brokerage commissions, acquired fund fees and extraordinary expenses) to 0.99% of the Fund’s average daily net assets.
The Funds’ financial statements are prepared in accordance with accounting principles generally accepted in the United States of America, which require management to make estimates and assumptions that affect the reported amounts of assets and liabilities and disclosure of contingent assets and liabilities at the date of the financial statements and the reported amounts of income and expenses during the reporting period. Actual results could differ from those estimates and such differences could be material. The following is a summary of significant accounting policies followed by the Funds in the preparation of their financial statements:
a. Valuation of Investments
Equity securities traded on a domestic or international securities exchange are valued at the last quoted sale price, or, lacking any sales, at the last quoted bid price. Over-the-counter securities are valued at the Nasdaq Official Closing Price, if one is available. Lacking any sales, over-the-counter securities are valued at the last quoted bid price. The Funds’ investments are generally valued based on market quotations provided by third-party pricing services approved by the Board of Trustees of the Funds. Under certain circumstances, the value of certain Fund investments may be based on an evaluation of fair value, pursuant to procedures established by and under the general supervision of the Board of Trustees of the Trust. Each Fund may use the fair value of a portfolio security to calculate its NAV when, for example, (1) market quotations are not readily available because a portfolio security is not traded in a public market or the principal market in which the security trades is closed, (2) trading in a portfolio security is suspended and has not resumed before the Fund calculates its NAV, (3) a significant event affecting the value of a portfolio security is determined to have occurred between the time of the market quotation provided for a portfolio security and the time as of which the Fund calculates its NAV, (4) a security’s price has remained unchanged over a period of time (often referred to as a “stale price”), or (5) Managers Investment Group LLC (“the Investment Manager”) determines that a market quotation is inaccurate. Portfolio investments that trade primarily on foreign markets are priced based upon the market quotation of such securities as of the close of their respective principal markets, as adjusted to reflect the Investment Manager’s determination of the impact of events occurring subsequent to the close of such markets but prior to the time as of which the Funds calculate their NAV. In accordance with procedures approved by the Board of Trustees, the Investment Manager relies upon recommendations of a third-party fair valuation service in adjusting the prices of such foreign portfolio investments. The Funds may invest in securities that may be thinly traded. The Board of Trustees has adopted procedures to adjust prices of thinly traded securities that are judged to be stale so that they reflect fair value. An investment valued on the basis of its fair value may be valued at a price higher or lower than available market quotations. An investment’s valuation may differ depending on the method used and the factors considered in determining value according to the Fund’s fair value procedures.
Fixed-income securities are valued based on valuations furnished by independent pricing services that utilize matrix systems, which reflect such factors as security prices, yields, maturities, and ratings, and are supplemented by dealer and exchange quotations. Futures contracts for which market quotations are readily available are valued at the settlement price as of the close of the futures exchange. Short-term investments having a remaining maturity of 60 days or less are valued at amortized cost, which approximates market value. Investments in other open-end regulated investment companies are valued at their end of day net asset value per share. Investments in certain mortgage-backed and stripped mortgage-backed securities, preferred stocks, convertible securities, derivatives and other debt securities not traded on an organized securities market are valued on the basis of valuations provided by dealers or by a pricing service which uses information with respect to transactions in such securities and various relationships between securities
35
Managers AMG FQ Funds
Notes to Financial Statements (continued)
and yield to maturity in determining value. Securities (including derivatives) for which market quotations are not readily available are valued at fair value, as determined in good faith, and pursuant to procedures adopted by the Board of Trustees of the Trust. The values assigned to fair value investments are based on available information and do not necessarily represent amounts that might ultimately be realized, since such amounts depend on future developments inherent in long-term investments. Further, because of the inherent uncertainty of valuation, those estimated values may differ significantly from the values that would have been used had a ready market for the investments existed, and the differences could be material.
Generally Accepted Accounting Principles (GAAP) define fair value as the price that a Fund would receive to sell an asset or pay to transfer a liability in an orderly transaction between market participants at the measurement date. GAAP also establishes a framework for measuring fair value, and a three-level hierarchy for fair value measurements based upon the transparency of inputs to the valuation of an asset or liability. Inputs may be observable or unobservable and refer broadly to the assumptions that market participants would use in pricing the asset or liability. Observable inputs reflect the assumptions market participants would use in pricing the asset or liability based on market data obtained from sources independent of the Funds. Unobservable inputs reflect the Funds’ own assumptions about the assumptions that market participants would use in pricing the asset or liability developed based on the best information available in the circumstances. Each investment is assigned a level based upon the observability of the inputs which are significant to the overall valuation.
The three-tier hierarchy of inputs is summarized below:
Level 1 – quoted prices in active markets for identical investments
Level 2 – other significant observable inputs (including quoted prices for similar investments, interest rates, prepayment speeds, credit risk)
Level 3 – significant unobservable inputs (including the Funds’ own assumptions in determining the fair value of investments)
The inputs or methodologies used for valuing investments are not necessarily an indication of the risk associated with investing in those investments. The following table summarizes the inputs used to value the Funds’ net assets by the above fair value hierarchy levels as of October 31, 2009:
| | | | | | | | | | | | | |
| | | Level 1 | | Level 2 | | | Level 3 | | Total | |
Tax-Managed | |
Investments in Securities | | | | | | | | | | | | | |
Common Stocks 1 | | $ | 50,947,687 | | | — | | | — | | $ | 50,947,687 | |
Short-Term Investments | | | 2,853,139 | | $ | 50,482 | | | — | | | 2,903,621 | |
| | | | | | | | | | | | | |
Total Investments in Securities | | $ | 53,800,826 | | $ | 50,482 | | | — | | $ | 53,851,308 | |
| | | | | | | | | | | | | |
| | | | |
| | | Level 1 | | Level 2 | | | Level 3 | | Total | |
U.S. Equity | | | | | | | | | | | | | |
Investments in Securities | | | | | | | | | | | | | |
Common Stocks 1 | | $ | 50,179,863 | | | — | | | — | | $ | 50,179,863 | |
Short-Term Investments | | | 1,556,078 | | $ | 31,673 | | | — | | | 1,587,751 | |
| | | | | | | | | | | | | |
Total Investments in Securities | | | 51,735,941 | | | 31,673 | | | — | | | 51,767,614 | |
Other Financial Instruments 2 | | | — | | | (3,216 | ) | | — | | | (3,216 | ) |
| | | | | | | | | | | | | |
Totals | | $ | 51,735,941 | | $ | 28,457 | | | — | | $ | 51,764,398 | |
| | | | | | | | | | | | | |
36
Managers AMG FQ Funds
Notes to Financial Statements (continued)
| | | | | | | | | | | | | |
| | | Level 1 | | | Level 2 | | Level 3 | | Total | |
Global Alternatives | | | | | | | | | | | | | |
Investments in Securities | | | | | | | | | | | | | |
US Government Obligations | | | — | | | $ | 17,703,716 | | — | | $ | 17,703,716 | |
Exchange Traded Funds | | $ | 46,408,343 | | | | — | | — | | | 46,408,343 | |
Short-Term Investments | | | 165,323,669 | | | | — | | — | | | 165,323,669 | |
| | | | | | | | | | | | | |
Total Investments in Securities | | | 211,732,012 | | | | 17,703,716 | | — | | | 229,435,728 | |
Other Financial Instruments 2 | | | 3,043,368 | | | | 1,631,097 | | — | | | 4,674,465 | |
| | | | | | | | | | | | | |
Totals | | $ | 214,775,380 | | | $ | 19,334,813 | | — | | $ | 234,110,193 | |
| | | | | | | | | | | | | |
| | | | |
| | | Level 1 | | | Level 2 | | Level 3 | | Total | |
Global Essentials | | | | | | | | | | | | | |
Investments in Securities | | | | | | | | | | | | | |
US Government Obligations | | | — | | | $ | 26,456,635 | | — | | $ | 26,456,635 | |
Exchange Traded Funds | | $ | 6,253,591 | | | | — | | — | | | 6,253,591 | |
Short-Term Investments | | | 48,289,648 | | | | 16,331 | | — | | | 48,305,979 | |
| | | | | | | | | | | | | |
Total Investments in Securities | | | 54,543,239 | | | | 26,472,966 | | — | | | 81,016,205 | |
Other Financial Instruments 2 | | | (1,259,814 | ) | | | — | | — | | | (1,259,814 | ) |
| | | | | | | | | | | | | |
Totals | | $ | 53,283,425 | | | $ | 26,472,966 | | — | | $ | 79,756,391 | |
| | | | | | | | | | | | | |
| 1 | All common stocks held in the Funds are Level 1 securities. For a detailed break-out of the common stocks by major industry classification, please refer to the Schedule of Portfolio Investments. |
| 2 | Other financial instruments are derivative instruments not reflected in the Schedule of Portfolio Investments, such as futures, forwards and swap contracts, which are valued at the unrealized appreciation/depreciation of the instrument. |
The fair values of derivative instruments at October 31, 2009 for U.S. Equity, Global Alternatives and Global Essentials were as follows:
| | | | | | | | | | | | |
| | | | | Asset Derivatives | | Liability Derivatives |
Fund | | Derivatives not accounted for as hedging instruments | | Statement of Assets and
Liabilities Location | | Fair Value | | Statement of Assets and
Liabilities Location | | Fair Value |
| | | | | |
| U.S. Equity | | Equity contracts | | Receivable for variation margin on futures* | | | — | | Payable for variation margin on futures* | | $ | 7,150 |
| | | | | | | | | | | | |
| | | | | |
| Global Alternatives | | Equity contracts | | Receivable for variation margin on futures* | | $ | 2,153,581 | | Payable for variation margin on futures* | | $ | 1,638,597 |
| | | | | |
| | Interest Rate Contracts | | Receivable for variation margin on futures* | | | 4,238,685 | | Payable for variation margin on futures* | | | 2,092,458 |
| | | | | |
| | Foreign exchange contracts | | Unrealized appreciation of foreign currency contracts | | | 9,766,347 | | Unrealized depreciation of foreign currency contracts | | | 8,135,250 |
| | | | | | | | | | | | |
| | | | Totals | | $ | 16,158,613 | | | | $ | 11,866,305 |
| | | | | | | | | | | | |
| | | | | |
| Global Essentials | | Equity contracts | | Receivable for variation margin on futures* | | $ | 65,437 | | Payable for variation margin on futures* | | $ | 728,043 |
| | | | | |
| | Interest Rate Contracts | | Receivable for variation margin on futures* | | | 387,374 | | Payable for variation margin on futures* | | | 36,641 |
| | | | | | | | | | | | |
| | | | Totals | | $ | 452,811 | | | | $ | 764,684 |
| | | | | | | | | | | | |
| * | Includes only the current day’s variation margin for fixed futures. For non-fixed futures, the variation margin includes the unrealized appreciation/depreciation of the future. Prior variation margin movements have been reflected in cash on the Statement of Assets and Liabilities upon receipt or payment. |
37
Managers AMG FQ Funds
Notes to Financial Statements (continued)
For the fiscal year ended October 31, 2009, the effect of derivative instruments on the Statement of Operations for U.S. Equity, Global Alternatives and Global Essentials and the amount of realized gain/(loss) on derivatives recognized in income were as follows:
| | | | | | | | | | | | | | |
Fund | | Derivatives not accounted for as hedging instruments | | Futures | | | Forward Currency
Contracts | | | Total | |
U.S. Equity | | Equity contracts | | $ | (48,484 | ) | | | — | | | $ | (48,484 | ) |
| | | | | | | | | | | | | | |
| | | | |
Global Alternatives | | Equity contracts | | $ | (12,660,472 | ) | | | — | | | $ | (12,660,472 | ) |
| | Interest rate contracts | | | (5,346,042 | ) | | | — | | | | (5,346,042 | ) |
| | Foreign exchange contracts | | | — | | | $ | 9,057,383 | | | | 9,057,383 | |
| | | | | | | | | | | | | | |
| | Totals | | $ | (18,006,514 | ) | | $ | 9,057,383 | | | $ | (8,949,131 | ) |
| | | | | | | | | | | | | | |
| | | | |
Global Essentials | | Equity contracts | | $ | 145,468 | | | | — | | | $ | 145,468 | |
| | Interest rate contracts | | | (72,450 | ) | | | — | | | | (72,450 | ) |
| | Foreign exchange contracts | | | — | | | $ | (140,194 | ) | | | (140,194 | ) |
| | | | | | | | | | | | | | |
| | Totals | | $ | 73,018 | | | $ | (140,194 | ) | | $ | (67,176 | ) |
| | | | | | | | | | | | | | |
The change in unrealized gain/(loss) on derivatives recognized in income were as follows:
| | | | | | | | | | | | | | |
Fund | | Derivatives not accounted for as hedging instruments | | Futures | | | Forward Currency
Contracts | | | Total | |
U.S. Equity | | Equity contracts | | $ | 67,978 | | | | — | | | $ | 67,978 | |
| | | | | | | | | | | | | | |
| | | | |
Global Alternatives | | Equity contracts | | $ | 925,412 | | | | — | | | $ | 925,412 | |
| | Interest rate contracts | | | 4,564,595 | | | | — | | | | 4,564,595 | |
| | Foreign exchange contracts | | | — | | | $ | (4,527,315 | ) | | | (4,527,315 | ) |
| | | | | | | | | | | | | | |
| | Totals | | $ | 5,490,007 | | | $ | (4,527,315 | ) | | $ | 962,692 | |
| | | | | | | | | | | | | | |
| | | | |
Global Essentials | | Equity contracts | | $ | (998,160 | ) | | | — | | | $ | (998,160 | ) |
| | Interest rate contracts | | | (261,654 | ) | | | — | | | | (261,654 | ) |
| | Foreign exchange contracts | | | — | | | $ | 8,576 | | | | 8,576 | |
| | | | | | | | | | | | | | |
| | Totals | | $ | (1,259,814 | ) | | $ | 8,576 | | | $ | (1,251,238 | ) |
| | | | | | | | | | | | | | |
38
Managers AMG FQ Funds
Notes to Financial Statements (continued)
b. Security Transactions
Security transactions are accounted for as of trade date. Realized gains and losses on securities sold are determined on the basis of identified cost.
c. Investment Income and Expenses
Dividend income is recorded on the ex-dividend date, except certain dividends from foreign securities where the ex-dividend date may have passed. These dividends are recorded as soon as the Trust is informed of the ex-dividend date. Dividend income on foreign securities is recorded net of any withholding tax. Interest income, which includes amortization of premium and accretion of discount on debt securities, is accrued as earned. Non-cash dividends included in dividend income, if any, are reported at the fair market value of the securities received. Other income and expenses are recorded on an accrual basis. Expenses that cannot be directly attributed to a Fund are apportioned among the Funds in the Trust and in some cases other affiliated funds based upon their relative average net assets or number of shareholders. Investment income, realized and unrealized capital gains and losses, the common expenses of each Fund, and certain Fund level expense reductions, if any, are allocated on a pro rata basis to each class based on the relative net assets of each class to the total net assets of each Fund.
The following Funds had certain portfolio trades directed to various brokers, under a brokerage recapture program, which paid a portion of the Fund’s expenses. For the fiscal year ended October 31, 2009, under these arrangements the amount by which the Funds’ expenses were reduced and the impact on the expense ratios, if any, were as follows: US Equity - $150 and Global Essentials - $13,267 or 0.02%.
The Funds have a “balance credit” agreement with The Bank of New York Mellon (“BNYM”), the Funds’ custodian, whereby each Fund is credited with an interest factor equal to 0.75% below the effective 90-day T-Bill rate for account balances left uninvested overnight. If the T-Bill rate falls below 0.75%, no credits will be earned. These credits serve to reduce custody expenses that would otherwise be charged to each Fund. For the fiscal year ended October 31, 2009, the custodian expense was reduced as follows: Tax-Managed - $0, U.S. Equity - $35, Global Alternatives - $2,615, and Global Essentials - $132.
Overdrafts will cause a reduction of any earnings credits, computed at 2% above the effective Federal funds rate on the day of the overdraft. For the fiscal year ended October 31, 2009, overdraft fees for Tax-Managed, U.S. Equity, Global Alternatives and Global Essentials equaled $1,972, $1,252, $0 and $223, respectively.
The Trust also has a balance credit arrangement with its Transfer Agent, PNC Global Investment Servicing (U.S.) Inc., whereby earnings credits are used to offset banking charges and other out-of-pocket expenses. For the fiscal year ended October 31, 2009, the transfer agent expense was reduced as follows: Tax-Managed - $369, U.S. Equity - $341, Global Alternatives - $1,263 and Global Essentials - $480.
The Investment Manager has agreed to waive a portion of its management fee in consideration of shareholder servicing fees that it has received from JPMorgan Distribution Services, Inc., with respect to short-term cash investments each Fund may have made in the JPMorgan Liquid Assets Portfolio- Capital Share Class. For the fiscal year ended October 31, 2009, the management fee was reduced as follows: Tax-Managed - $0, U.S. Equity -$0, Global Alternatives - $41,520 and Global Essentials - $0.
Total returns and net investment income for the Funds would have been lower had certain expenses not been offset. Total expenses before offsets exclude the impact of expense reimbursements or fee waivers and expense reductions such as brokerage recapture credits, but include non-reimbursable expenses, if any, such as interest and taxes.
39
Managers AMG FQ Funds
Notes to Financial Statements (continued)
d. Dividends and Distributions
Dividends resulting from net investment income and distributions of capital gains, if any, normally will be declared and paid annually in December and when required for Federal excise tax purposes. Distributions are recorded on the ex-dividend date and are declared separately for each class. Income and capital gain distributions are determined in accordance with Federal income tax regulations, which may differ from GAAP. These differences are primarily due to differing treatments for losses deferred due to wash sales, REITs, equalization accounting for tax purposes, foreign currency, options, futures, and market discount transactions. Permanent book and tax basis differences, if any, relating to shareholder distributions will result in reclassifications to paid-in capital. The tax character of distributions paid during the fiscal years ended October 31, 2009 and 2008 were as follows:
| | | | | | | | | | | | | | | | | | | | | | | | |
| | | Tax-Managed Equity | | U.S. Equity | | Global Alternatives | | Global Essentials |
| | | 2009 | | 2008 | | 2009 | | 2008 | | 2009 | | 2008 | | 2009 | | 2008 |
Distributions paid from: | | | | | | | | | | | | | | | | | | | | | | | | |
Ordinary income | | $ | 842,465 | | $ | 537,697 | | $ | 912,255 | | $ | 1,004,699 | | $ | 11,141,269 | | $ | 121,939 | | $ | 3,637,680 | | $ | 4,898,251 |
Short-term capital gains | | | — | | | — | | | — | | | 3,272,050 | | | — | | | — | | | — | | | — |
Long-term capital gains | | | — | | | — | | | — | | | 7,723,091 | | | — | | | 447,105 | | | — | | | — |
| | | | | | | | | | | | | | | | | | | | | | | | |
Totals | | $ | 842,465 | | $ | 537,697 | | $ | 912,255 | | $ | 11,999,840 | | $ | 11,141,269 | | $ | 569,044 | | $ | 3,637,680 | | $ | 4,898,251 |
| | | | | | | | | | | | | | | | | | | | | | | | |
As of October 31, 2009, the components of distributable earnings (excluding unrealized appreciation/depreciation) on a tax basis consisted of:
| | | | | | | | | | | | |
| | | Tax-Managed
Equity | | U.S. Equity | | Global
Alternatives | | Global
Essentials |
Capital loss carryforward | | $ | 50,140,266 | | $ | 24,444,445 | | $ | 8,472,046 | | $ | 68,021,939 |
Undistributed ordinary income | | | 123,985 | | | 508,888 | | | — | | | 710,456 |
Undistributed short-term capital gains | | | — | | | — | | | — | | | — |
Undistributed long-term capital gains | | | — | | | — | | | — | | | — |
e. Federal Taxes
Each Fund intends to comply with the requirements under Subchapter M of the Internal Revenue Code of 1986, as amended, to distribute substantially all of its taxable income and gains to its shareholders and to meet certain diversification and income requirements with respect to investment companies. Therefore, no provision for Federal income or excise tax is included in the accompanying financial statements.
Additionally, based on each Fund’s understanding of the tax rules and rates related to income, gains and transactions for the foreign jurisdictions in which it invests, each Fund will provide for foreign taxes, and where appropriate, deferred foreign taxes.
Management has analyzed the Funds’ tax positions taken on federal income tax returns for all open tax years (tax years ended October 31, 2006-2009), and has concluded that no provision for federal income tax is required in the Funds’ financial statements. Additionally, the Funds are not aware of any tax position for which it is reasonably possible that the total amounts of unrecognized tax benefits will change materially in the next twelve months.
f. Capital Loss Carryovers
As of October 31, 2009, the following Funds had accumulated net realized capital loss carryovers from securities transactions for Federal income tax purposes as shown in the following chart. These amounts may be used to offset realized capital gains, if any, through the expiration dates listed.
| | | | | |
Fund | | Capital Loss
Carryover Amount | | Expires
October 31, |
Tax-Managed | | $ | 22,952,633 | | 2017 |
| | | 9,627,945 | | 2016 |
| | | 17,559,688 | | 2010 |
| | | | | |
Total | | $ | 50,140,266 | | |
| | | | | |
U.S. Equity | | $ | 16,764,174 | | 2017 |
| | | 7,680,271 | | 2016 |
| | | | | |
Total | | $ | 24,444,445 | | |
| | | | | |
Global Alternatives | | $ | 8,295,120 | | 2017 |
| | | 176,926 | | 2016 |
| | | | | |
Total | | $ | 8,472,046 | | |
| | | | | |
Global Essentials | | $ | 19,440,810 | | 2017 |
| | | 5,312,619 | | 2016 |
| | | 43,268,510 | | 2011 |
| | | | | |
Total | | $ | 68,021,939 | | |
| | | | | |
For the fiscal year ended October 31, 2009, Tax-Managed, U.S. Equity, Global Alternatives and Global Essentials utilized capital loss carryovers in the amounts of $0, $0, $0 and $0, respectively.
40
Managers AMG FQ Funds
Notes to Financial Statements (continued)
g. Capital Stock
The Trust’s Declaration of Trust authorizes for each series the issuance of an unlimited number of shares of beneficial interest, without par value. Each Fund records sales and repurchases of its capital stock on the trade date. The cost of securities contributed to the Funds in connection with the issuance of shares is based on the valuation of those securities in accordance with the Funds’ policy on investment valuation. Dividends and distributions to shareholders are recorded on the ex-dividend date.
The capital stock transactions by class for Tax-Managed, U.S. Equity, and Global Alternatives for the fiscal years ended October 31, 2009 and 2008 were as follows:
| | | | | | | | | | | | | | | | | | | | | | | | | | | | |
| | | Tax-Managed | | | U.S. Equity | |
| | | 2009 | | | 2008 | | | 2009 | | | 2008 | |
| | | Shares | | | Amount | | | Shares | | | Amount | | | Shares | | | Amount | | | Shares | | | Amount | |
Class A Shares | | | | | | | | | | | | | | | | | | | | | | | | | | | | |
Sale of shares | | 395,887 | | | $ | 3,454,064 | | | 1,083,470 | | | $ | 15,075,982 | | | 585,836 | | | $ | 4,439,785 | | | 1,566,421 | | | $ | 16,619,942 | |
Reinvestment of dividends and distributions | | 8,544 | | | | 74,589 | | | 1,904 | | | | 30,137 | | | 41,408 | | | | 317,181 | | | 174,679 | | | | 2,290,036 | |
Shares repurchased | | (1,223,343 | ) | | | (11,130,161 | ) | | (971,029 | ) | | | (12,672,266 | ) | | (1,208,396 | ) | | | (9,460,890 | ) | | (489,573 | ) | | | (5,432,086 | ) |
| | | | | | | | | | | | | | | | | | | | | | | | | | | | |
Net increase (decrease) | | (818,912 | ) | | $ | (7,601,508 | ) | | 114,345 | | | $ | 2,433,853 | | | (581,152 | ) | | $ | (4,703,924 | ) | | 1,251,527 | | | $ | 13,477,892 | |
| | | | | | | | | | | | | | | | | | | | | | | | | | | | |
Class C Shares | | | | | | | | | | | | | | | | | | | | | | | | | | | | |
Sale of shares | | 84,469 | | | $ | 726,778 | | | 344,329 | | | $ | 4,887,814 | | | 71,446 | | | $ | 571,849 | | | 28,722 | | | $ | 347,005 | |
Reinvestment of dividends and distributions | | 482 | | | | 4,176 | | | — | | | | — | | | 766 | | | | 5,838 | | | 8,512 | | | | 110,908 | |
Shares repurchased | | (309,608 | ) | | | (2,785,487 | ) | | (236,813 | ) | | | (3,098,613 | ) | | (113,020 | ) | | | (857,531 | ) | | (53,602 | ) | | | (642,435 | ) |
| | | | | | | | | | | | | | | | | | | | | | | | | | | | |
Net increase (decrease) | | (224,657 | ) | | $ | (2,054,533 | ) | | 107,516 | | | $ | 1,789,201 | | | (40,808 | ) | | $ | (279,844 | ) | | (16,368 | ) | | $ | (184,522 | ) |
| | | | | | | | | | | | | | | | | | | | | | | | | | | | |
Institutional Class | | | | | | | | | | | | | | | | | | | | | | | | | | | | |
Sale of shares | | 365,438 | | | $ | 3,146,699 | | | 1,090,055 | | | $ | 15,790,589 | | | 66,098 | | | $ | 539,862 | | | 186,603 | | | $ | 2,001,258 | |
Reinvestment of dividends and distributions | | 76,649 | | | | 666,082 | | | 26,734 | �� | | | 424,272 | | | 73,854 | | | | 567,938 | | | 698,621 | | | | 9,186,860 | |
Shares repurchased | | (1,394,355 | ) | | | (12,291,562 | ) | | (1,906,272 | ) | | | (25,691,248 | ) | | (719,026 | ) | | | (5,515,250 | ) | | (2,190,003 | ) | | | (24,141,018 | ) |
| | | | | | | | | | | | | | | | | | | | | | | | | | | | |
Net decrease | | (952,268 | ) | | $ | (8,478,781 | ) | | (789,483 | ) | | $ | (9,476,387 | ) | | (579,074 | ) | | $ | (4,407,450 | ) | | (1,304,779 | ) | | $ | (12,952,900 | ) |
| | | | | | | | | | | | | | | | | | | | | | | | | | | | |
| | | | | | | | | | | | | | |
| | | Global Alternatives | |
| | | 2009 | | | 2008 | |
| | | Shares | | | Amount | | | Shares | | | Amount | |
Class A Shares | | | | | | | | | | | | | | |
Sale of shares | | 25,672,311 | | | $ | 258,404,171 | | | 6,997,102 | | | $ | 73,521,698 | |
Reinvestment of dividends and distributions | | 719,845 | | | | 7,162,463 | | | 30,757 | | | | 306,011 | |
Shares repurchased | | (13,809,688 | ) | | | (134,816,815 | ) | | (2,707,381 | ) | | | (27,611,339 | ) |
| | | | | | | | | | | | | | |
Net increase | | 12,582,468 | | | $ | 130,749,819 | | | 4,320,478 | | | $ | 46,216,370 | |
| | | | | | | | | | | | | | |
Class C Shares | | | | | | | | | | | | | | |
Sale of shares | | 2,370,983 | | | $ | 23,207,410 | | | 750,703 | | | $ | 7,647,337 | |
Reinvestment of dividends and distributions | | 51,653 | | | | 507,230 | | | 4,886 | | | | 48,079 | |
Shares repurchased | | (467,373 | ) | | | (4,523,226 | ) | | (393,638 | ) | | | (3,972,135 | ) |
| | | | | | | | | | | | | | |
Net increase | | 1,955,263 | | | $ | 19,191,414 | | | 361,951 | | | $ | 3,723,281 | |
| | | | | | | | | | | | | | |
41
Managers AMG FQ Funds
Notes to Financial Statements (continued)
At October 31, 2009, certain unaffiliated shareholders of record, specifically omnibus accounts, individually or collectively held greater than 10% of the outstanding shares as follows:
| | | | | | |
Fund | | Class A | | Class C | | Institutional Class |
Tax-Managed | | 2 collectively own 39% | | 3 collectively own 74% | | 2 collectively own 35% |
U.S. Equity | | None | | 4 collectively own 59% | | None |
Global Alternatives | | 2 collectively own 31% | | 3 collectively own 85% | | N/A |
At October 31, 2009, Global Essentials had no shareholders of record that held greater than 10% of the outstanding shares.
h. Foreign Currency Translation
The books and records of the Funds are maintained in U.S. dollars. The value of investments, assets and liabilities denominated in currencies other than U.S. dollars are translated into U.S. dollars based upon current foreign exchange rates. Purchases and sales of foreign investments, income and expenses are converted into U.S. dollars based on currency exchange rates prevailing on the respective dates of such transactions. Net realized and unrealized gain (loss) on foreign currency transactions represent: (1) foreign exchange gains and losses from the sale and holdings of foreign currencies; (2) gains and losses between trade date and settlement date on investment securities transactions and forward foreign currency exchange contracts; and (3) gains and losses from the difference between amounts of interest and dividends recorded and the amounts actually received.
The Funds do not isolate the net realized and unrealized gain or loss resulting from changes in exchange rates from the fluctuations in market prices of securities held. Such fluctuations are included with the net realized and unrealized gain or loss on investments.
2. Agreements and Transactions with Affiliates
The Trust has entered into an Investment Management Agreement under which the Investment Manager, an independently managed subsidiary of Affiliated Managers Group, Inc. (“AMG”), serves as investment manager to the Funds and is responsible for the Funds’ overall administration. The Funds’ investment portfolios are managed by First Quadrant, L.P. (“First Quadrant” or the “Subadvisor”), which serves pursuant to a Subadvisory Agreement between the Investment Manager and First Quadrant with respect to each of the Funds. AMG indirectly owns a majority interest in First Quadrant.
Tax-Managed is obligated by the Investment Management Agreement to pay an annual management fee to the Investment Manager of 0.85% of the average daily net assets of the Fund. Under the Investment Management Agreement with the Fund, the Investment Manager provides a variety of administrative services to the Fund. The Investment Manager receives no additional compensation from the Fund for these services. Pursuant to a Reimbursement Agreement between the Investment Manager and First Quadrant, First Quadrant reimburses the Investment Manager for the costs the Investment Manager bears in providing such services to the Fund.
U.S. Equity, Global Alternatives and Global Essentials are obligated by the Investment Management Agreement to pay an annual management fee to the Investment Manager of 0.35%, 1.70% and 0.60%, respectively, of the average daily net assets of the Fund. The Investment Manager, in turn, pays a portion of this fee to First Quadrant for its services as subadvisor. Effective September 28, 2009, Managers Fremont Global redeemed its position in the Managers Global Bond Fund. As a result, the Investment Manager stopped waiving its entire management fee with respect to those assets invested in Managers Global Bond Fund. The amount waived for the period November 1, 2008 to September 27, 2009 was $122,234.
The Investment Manager has contractually agreed, through at least March 1, 2010, to waive fees and pay or reimburse expenses to the extent that the total annual operating expenses (exclusive of taxes, interest, brokerage costs, acquired fund expenses, and extraordinary expenses) will be limited to the following amounts of the Funds’ average daily net assets:
| | | | | | | | | |
Fund | | Class A | | | Class C | | | Institutional
Class | |
Tax-Managed | | 1.24 | % | | 1.99 | % | | 0.99 | % |
U.S. Equity | | 1.04 | % | | 1.79 | % | | 0.79 | % |
Global Alternatives | | 1.99 | % | | 2.74 | % | | N/A | |
At a meeting held on September 10-11, 2009, the Trust’s Board of Trustees approved a contractual expense limitation with respect to Global Essentials. Effective September 28, 2009, the Investment Manager contractually agreed, through at least March 1, 2011, to waive management fees and or/reimburse Fund expenses in order to limit net annual Fund operating expenses (exclusive of taxes, interest, brokerage commissions, acquired fund fees and expenses, and extraordinary items) to 0.99% of the Fund’s average daily net assets. Prior to September 28, 2009, the Fund had no expense limitation.
42
Managers AMG FQ Funds
Notes to Financial Statements (continued)
Each Fund is obligated to repay the Investment Manager such amounts waived, paid, or reimbursed in future years provided that the repayment occurs within thirty-six (36) months after the waiver or reimbursement occurs and that such repayment would not cause the Funds’ total operating expenses in any such future year to exceed that Fund’s respective expense cap. At October 31, 2009, the twelve-month and cumulative amounts of reimbursable expenses for the Funds were as follows:
| | | | | | |
Fund | | Fiscal Year ended
October 31, 2009 | | Cumulative
Reimbursement
Amount |
Tax-Managed | | $ | 101,952 | | $ | 232,124 |
U.S. Equity | | | 124,476 | | | 92,834 |
Global Alternatives | | | 797,699 | | | 858,632 |
Global Essentials | | | 4,809 | | | 4,809 |
The aggregate annual retainer paid to each Independent Trustee is $65,000, plus $4,000 or $2,500 for each regular or special meeting attended, respectively. The Trustees’ fees and expenses are allocated amongst all of the Funds for which the Investment Manager serves as the advisor (the “Managers Funds”) based on the relative net assets of such Funds. The Independent Chairman of the Trusts receives an additional payment of $15,000 per year. The Chairman of the Audit Committee receives an additional payment of $5,000 per year. The “Trustee fees and expenses” shown in the financial statements represents each Fund’s allocated portion of the total fees and expenses paid by the Managers Funds.
The Funds are distributed by Managers Distributors, Inc. (the “Distributor” or “MDI”), a wholly-owned subsidiary of the Investment Manager. MDI serves as the principal underwriter for each Fund and is a registered broker-dealer and member of the Financial Industry Regulatory Authority, Inc. (“FINRA”). Shares of each Fund will be continuously offered and will be sold by brokers, dealers or other financial intermediaries who have executed selling agreements with MDI. MDI bears all the expenses of providing services pursuant to the Underwriting Agreement, including payment of the expenses relating to the distribution of Prospectuses for sales purposes and any advertising or sales literature. Certain Trustees and Officers of the Funds are Officers and/or Directors of the Investment Manager, AMG and/or Distributor.
All Funds except Global Essentials have adopted a distribution and service plan (the “Plan”) with respect to the Class A and Class C shares of each Fund, in accordance with the requirements of Rule 12b-1 under the 1940 Act and the requirements of the applicable rules of FINRA regarding asset-based sales charges. Pursuant to the Plan, the Funds may compensate the Distributor for its expenditures in financing any activity primarily intended to result in the sale of each such class of the Fund’s shares and for maintenance and personal service provided to existing shareholders of that class. The Plan authorizes payments to the Distributor up to 0.25% and 1.00% annually of the Fund’s average daily net assets attributable to Class A and Class C shares, respectively. The Plan further provides for periodic payments by MDI to brokers, dealers and other financial intermediaries for providing shareholder services and for promotional and other sales related costs. The portion of payments by Class A or Class C shares of U.S. Equity, Tax-Managed and Global Alternatives for shareholder servicing may not exceed an annual rate of 0.25% of the average daily net asset value of the Fund’s shares of that class owned by clients of such broker, dealer or financial intermediary.
Global Essentials has entered into an Administration and Shareholder Servicing Agreement under which the Investment Manager serves as the Funds’ administrator (the “Administrator”) and is responsible for all aspects of managing the Funds’ operations, including administration and shareholder services to each Fund, its shareholders, and certain institutions, such as bank trust departments, broker-dealers and registered investment advisers, that advise or act as an intermediary with the Funds’ shareholders. For its services, the Administrator is paid a fee at a rate of 0.25% of the average daily net assets of each Fund. Prior to September 28, 2009, the Investment Manager agreed to waive a portion of its administrative fee for Managers Fremont Global Fund with respect to those assets of the Fund invested in the Managers Global Bond Fund such that its administrative fee would be 0.05% of the average net assets invested in the Managers Global Bond Fund. For the period November 1, 2008 to September 27, 2009, the amount waived was $40,745.
On June 23, 2009, the Securities and Exchange Commission granted an exemptive order that permits the Funds to lend and borrow money for certain temporary purposes directly to and from other eligible Funds in the Managers Family of Funds (the “Fund Family”). Participation in this interfund lending program is voluntary for both borrowing and lending Funds, and an interfund loan is only made if it benefits each participating Fund. The Investment Manager administers the program according to procedures approved by the Funds’ Board of Trustees (the “Board”), and the Board monitors the operation of the program. An interfund loan must comply with certain conditions set out in the exemptive order, which are designed to assure fairness and protect all participating Funds. For the period from June 23, 2009 through October 31, 2009, the following Funds either borrowed from or lent to other Funds in the Fund Family: Tax-Managed borrowed varying amounts up to $575,274 for 6 days paying interest of $90; U.S. Equity borrowed $144,478 for 1 day paying interest of $4; Global Alternatives lent varying amounts up to $321,093 for 2 days earning interest of $17; Global Essentials lent varying amounts up to $122,043 for 2 days earning interest of $4. The interest amounts can be found in the Statement of Operations in interest income or as miscellaneous expense.
43
Managers AMG FQ Funds
Notes to Financial Statements (continued)
3. Purchases and Sales of Securities
Purchases and sales of securities, excluding short-term securities, for the fiscal year ended October 31, 2009, were as follows:
| | | | | | | | | | | | |
| | | Long-Term Securities | | U.S. Government Securities |
Fund | | Purchases | | Sales | | Purchases | | Sales |
Tax-Managed | | $ | 79,392,634 | | $ | 97,891,557 | | | N/A | | | N/A |
U.S. Equity | | | 75,606,621 | | | 85,417,135 | | | N/A | | | N/A |
Global Alternatives | | | 26,271,249 | | | 5,393,069 | | $ | 44,344,698 | | $ | 36,115,000 |
Global Essentials | | | 106,944,211 | | | 188,036,338 | | | 27,728,456 | | | 1,514,278 |
4. Portfolio Securities Loaned
The Funds may participate in a securities lending program offered by BNYM, providing for the lending of securities to qualified brokers. Securities lending fees include earnings of such temporary cash investments, plus or minus any rebate to a borrower. These earnings (after any rebate) are then divided between BNYM, as a fee for its services under the program, and the Fund, according to agreed-upon rates. Collateral on all securities loaned is accepted in cash and/or government securities and is maintained at a minimum level of 102% (105% in the case of certain foreign securities) of the market value, plus interest, if applicable, of investments on loan. It is the Funds’ policy to obtain additional collateral from or return excess collateral to the borrower by the end of the next business day, following the valuation date of the securities loaned. Therefore, the value of the collateral held may be temporarily less than the value of the securities on loan. Lending securities entails a risk of loss to the Funds if and to the extent that the market value of the securities loaned were to increase and the borrower did not increase the collateral accordingly, and the borrower fails to return the securities. The Funds bear the risk of any deficiency in the amount of the collateral available for return to the borrower due to any loss on the collateral invested. Collateral received in the form of cash is invested temporarily in the BNY Institutional Cash Reserves Fund (the “ICRF”), or other short-term investments as defined in the Securities Lending Agreement with BNYM.
In September of 2008, BNYM advised the Investment Manager that the ICRF had exposure to certain defaulted debt obligations, and that BNYM had established a separate sleeve of the ICRF to hold these securities. The net impact of these positions is not material to each Fund. Tax-Managed and U.S. Equity’s position in the separate sleeve of the ICRF is included in the Schedule of Portfolio Investments and Global Essentials’ position is included in the Statement of Assets and Liabilities. The unrealized loss on such investment is included in Net Unrealized Depreciation on the Statement of Assets and Liabilities and Statement of Operations.
5. Commitments and Contingencies
In the normal course of business, the Funds may enter into contracts and agreements that contain a variety of representations and warranties, which provide general indemnifications. The maximum exposure to the Funds under these arrangements is unknown, as this would involve future claims that may be made against a Fund that have not yet occurred. However, based on experience, the Funds expect the risks of loss to be remote.
6. Forward Commitments
Certain transactions, such as futures and forward transactions, dollar roll agreements, or purchases of when-issued or delayed delivery securities may have a similar effect on a Fund’s net asset value as if the Fund had created a degree of leverage in its portfolio. However, if a Fund enters into such a transaction, the Fund will establish a segregated account with its custodian in which it will maintain cash, U.S. government securities or other liquid securities equal in value to its obligations in respect to such transaction. Securities and other assets held in the segregated account may not be sold while the transaction is outstanding, unless other suitable assets are substituted.
7. Forward Foreign Currency Contracts
During the fiscal year ended October 31, 2009, Global Alternatives invested in forward foreign currency exchange contracts to manage currency exposure. These investments may involve greater market risk than the amounts disclosed in the Fund’s financial statements.
A forward foreign currency exchange contract is an agreement between a Fund and another party to buy or sell a currency at a set price at a future date. The market value of the contract will fluctuate with changes in currency exchange rates. The contract is marked-to-market daily, and the change in market value is recorded as an unrealized gain or loss. Gain or loss on the purchase or sale of contracts having the same settlement date, amount and counterparty is realized on the date of offset, otherwise gain or loss is realized on the settlement date.
The Fund may invest in non-U.S. dollar denominated instruments subject to limitations, and enter into forward foreign currency exchange contracts to facilitate transactions in foreign securities and to hedge against foreign currency exchange rate risk on its non-U.S. dollar denominated investment securities. Risks may arise upon entering into these contracts from the potential inability of counterparties to meet the terms of their contracts and from unanticipated movements in the value of a foreign currency relative to the U.S. dollar.
44
Managers AMG FQ Funds
Notes to Financial Statements (continued)
Cash pledged to cover margin requirements for open forward positions in Global Alternatives at October 31, 2009 was $780,000. The open forward foreign currency exchange contracts (in U.S. Dollars) at October 31, 2009 were as follows:
Global Alternatives - Foreign Currency
| | | | | | | | | | | | | | |
Type | | Position | | Settlement Date | | Receivable Amount | | Payable Amount | | Unrealized Gain/(Loss) | |
Australian Dollar | | Short | | 12/16/2009 | | $ | 38,453,205 | | $ | 39,494,222 | | $ | (1,041,017 | ) |
Canadian Dollar | | Short | | 12/16/2009 | | | 95,244,465 | | | 94,394,968 | | | 849,497 | |
Swiss Franc | | Short | | 12/16/2009 | | | 95,020,196 | | | 96,873,829 | | | (1,853,633 | ) |
Euro | | Short | | 12/16/2009 | | | 71,058,756 | | | 71,998,392 | | | (939,636 | ) |
Pound Sterling | | Short | | 12/16/2009 | | | 57,608,746 | | | 58,026,784 | | | (418,038 | ) |
Japanese Yen | | Short | | 12/16/2009 | | | 12,579,297 | | | 12,625,021 | | | (45,724 | ) |
New Zealand Dollar | | Short | | 12/16/2009 | | | 21,466,087 | | | 21,066,649 | | | 399,438 | |
Swedish Krona | | Short | | 12/16/2009 | | | 59,989,540 | | | 58,892,493 | | | 1,097,047 | |
Australian Dollar | | Long | | 12/16/2009 | | | 53,772,593 | | | 53,149,173 | | | 623,420 | |
Canadian Dollar | | Long | | 12/16/2009 | | | 28,331,407 | | | 29,102,909 | | | (771,502 | ) |
Swiss Franc | | Long | | 12/16/2009 | | | 37,674,426 | | | 37,595,730 | | | 78,696 | |
Euro | | Long | | 12/16/2009 | | | 26,974,161 | | | 27,067,299 | | | (93,138 | ) |
Pound Sterling | | Long | | 12/16/2009 | | | 37,248,026 | | | 37,118,175 | | | 129,851 | |
Japanese Yen | | Long | | 12/16/2009 | | | 87,017,134 | | | 85,573,884 | | | 1,443,250 | |
New Zealand Dollar | | Long | | 12/16/2009 | | | 89,013,295 | | | 86,755,482 | | | 2,257,813 | |
Swedish Krona | | Long | | 12/16/2009 | | | 9,118,587 | | | 9,203,814 | | | (85,227 | ) |
| | | | | | | | | | | | | | |
Totals | | | | | | $ | 820,569,921 | | $ | 818,938,824 | | $ | 1,631,097 | |
| | | | | | | | | | | | | | |
8. Futures Contracts
U.S. Equity uses Equity Index futures contracts with the objective of maintaining exposure to equity stock markets while maintaining liquidity. Global Essentials and Global Alternatives may use futures contracts, including futures contracts on global equity and fixed-income securities, interest rate futures contracts, foreign currency futures contracts and futures contracts on security indices (including broad-based security indices), for any purpose. The Funds may purchase or sell futures contracts to achieve a desired level of investment, whether to accommodate portfolio turnover or cash flows from capital shares transactions. There are certain risks associated with futures contracts. Prices may not move as expected or a Fund may not be able to close out the contract when it desires to do so, resulting in losses.
On entering into a futures contract, either cash or securities in an amount equal to a certain percentage of the contract value (initial margin) must be deposited with the futures broker. Subsequent payments (variation margin) are made or received each day. The variation margin payments equal the daily changes in the contract value and are recorded as unrealized gains or losses. The Funds recognize a realized gain or loss when the contract is closed or expires equal to the difference between the value of the contract at the time it was opened and the value at the time it was closed. Futures are valued at their quoted daily settlement prices. The aggregate principal amounts of the contracts are not recorded in the financial statements. Fluctuations in the value of the contracts are recorded in the Statement of Assets and Liabilities as an asset (liability) and in the Statement of Operations as unrealized appreciation (depreciation) until the contracts are closed, when they are recorded as realized gains (losses) on futures or forward currency contracts.
45
Managers AMG FQ Funds
Notes to Financial Statements (continued)
Assets pledged to cover margin requirements for the open futures positions at October 31, 2009 amounted to $77,000, $17,703,716 and $8,999,838 for U.S. Equity, Global Alternatives and Global Essentials, respectively. Each Fund had the following open futures contracts as of October 31, 2009:
U.S. Equity
| | | | | | | | | | |
Type | | Number of
Contracts | | Position | | Expiration
Date | | Unrealized
Gain/(Loss) | |
S&P 500 Index | | 1 | | Long | | 12/17/2009 | | $ | (3,216 | ) |
| | | | | | | | | | | | |
Global Alternatives | |
Type | | Currency | | Number of
Contracts | | Position | | Expiration Date | | Unrealized Gain/
(Loss) | |
Australian 10-Year Bond | | AUD | | 376 | | Long | | 12/15/2009 | | $ | (745,992 | ) |
Australian SPI 200 | | AUD | | 383 | | Short | | 12/17/2009 | | | 75,057 | |
Canadian 10-Year Bond | | CAD | | 1287 | | Short | | 12/18/2009 | | | (680,429 | ) |
S&P/TSE 60 Index | | CAD | | 14 | | Long | | 12/17/2009 | | | (54,077 | ) |
CAC40 10 Euro | | EUR | | 225 | | Short | | 11/20/2009 | | | 741,326 | |
Amsterdam Index | | EUR | | 220 | | Short | | 11/20/2009 | | | 1,152,169 | |
DAX Index | | EUR | | 19 | | Short | | 12/18/2009 | | | 80,581 | |
IBEX 35 Index | | EUR | | 10 | | Short | | 11/20/2009 | | | 30,952 | |
Euro-Bund 10-Year | | EUR | | 821 | | Long | | 12/8/2009 | | | 552,196 | |
FTSE/MIB Index | | EUR | | 52 | | Long | | 12/18/2009 | | | (315,460 | ) |
U.K. 10-Year Gilt | | GBP | | 551 | | Short | | 12/29/2009 | | | 695,932 | |
FTSE 100 Index | | GBP | | 432 | | Long | | 12/18/2009 | | | (456,630 | ) |
Hang Seng Index | | HKD | | 141 | | Long | | 11/27/2009 | | | (469,816 | ) |
Japanese 10-Year Bond | | JPY | | 567 | | Short | | 12/9/2009 | | | 523,898 | |
TOPIX Index | | JPY | | 17 | | Long | | 12/10/2009 | | | (7,097 | ) |
S&P 500 Index | | USD | | 114 | | Short | | 12/17/2009 | | | 219,055 | |
U.S. Treasury 10-Year Note | | USD | | 1253 | | Long | | 12/21/2009 | | | 1,701,703 | |
Total | | | | | | | | | | $ | 3,043,368 | |
| | | | | | | | | | | | |
46
Managers AMG FQ Funds
Notes to Financial Statements (continued)
Global Essentials
| | | | | | | | | | | | |
Type | | Currency | | Number of
Contracts | | Position | | Expiration Date | | Unrealized Gain/
(Loss) | |
Australian 10-Year Bond | | AUD | | 184 | | Long | | 12/15/2009 | | $ | (396,263 | ) |
Australian SPI 200 | | AUD | | 13 | | Long | | 12/17/2009 | | | (27,627 | ) |
Canadian 10-Year Bond | | CAD | | 142 | | Long | | 12/18/2009 | | | (44,512 | ) |
S&P/TSE 60 Index | | CAD | | 11 | | Long | | 12/17/2009 | | | (51,605 | ) |
CAC40 10 Euro | | EUR | | 24 | | Long | | 11/20/2009 | | | (81,493 | ) |
Amsterdam Index | | EUR | | 15 | | Long | | 11/20/2009 | | | (80,933 | ) |
DAX Index | | EUR | | 7 | | Long | | 12/18/2009 | | | (62,900 | ) |
IBEX 35 Index | | EUR | | 8 | | Long | | 11/20/2009 | | | (22,636 | ) |
Euro-Bund 10-Year | | EUR | | 91 | | Long | | 12/8/2009 | | | 81,041 | |
FTSE/MIB Index | | EUR | | 8 | | Long | | 12/18/2009 | | | (64,306 | ) |
U.K. 10-Year Gilt | | GBP | | 87 | | Long | | 12/29/2009 | | | 100,614 | |
FTSE 100 Index | | GBP | | 17 | | Long | | 12/18/2009 | | | (27,115 | ) |
Hang Seng Index | | HKD | | 10 | | Long | | 11/27/2009 | | | (33,696 | ) |
Japanese 10-Year Bond | | JPY | | 110 | | Long | | 12/9/2009 | | | (151,364 | ) |
TOPIX Index | | JPY | | 14 | | Long | | 12/10/2009 | | | (41,663 | ) |
S&P 500 Index | | USD | | 26 | | Long | | 12/18/2009 | | | (18,637 | ) |
E-Mini MSCI | | USD | | 135 | | Long | | 12/18/2009 | | | (79,595 | ) |
Russell 2000 Mini | | USD | | 102 | | Long | | 12/18/2009 | | | (405,954 | ) |
U.S. Treasury 10-Year Note | | USD | | 139 | | Long | | 12/21/2009 | | | 148,830 | |
Total | | | | | | | | | | $ | (1,259,814 | ) |
| | | | | | | | | | | | |
Investments Definitions and Abbreviations:
Abbreviations have been used throughout this table to indicate the underlying currencies:
| | | | | | | | | | | | | | |
| AUD: | | Australian Dollar | | EUR: | | Euro | | HKD: | | Hong Kong Dollar | | USD: | | U.S. Dollar |
| CAD: | | Canadian Dollar | | GBP: | | British Pound | | JPY: | | Japanese Yen | | | | |
9. Subsequent Events
The Funds have determined that no additional material events or transactions occurred subsequent to October 31, 2009, and through December 22, 2009, the date of issuance of the Funds’ financial statements, which require additional disclosure in the Funds’ financial statements.
Pending approval by the Securities and Exchange Commission, effective January 1, 2010, Global Essentials and Global Alternatives will have a new class structure. They will offer three classes of shares, Institutional Class shares, Service Class shares and Investor Class Shares, each offering varying levels of shareholder servicing and/or 12b-1 fees. Global Essentials shareholders will become shareholders in the Institutional Class and also offer a new Investor Class and Service Class. Global Alternatives will have a new Institutional Class and Service Class added to the existing A and C share classes.
Tax Information (unaudited)
Each Fund hereby designates the maximum amounts allowable of its net taxable income as qualified dividends as provided in the Jobs and Growth Tax Relief Reconciliation Act of 2003. The 2009 Form 1099-DIVs you receive for the Funds will show the tax status of all distributions paid to you during the respective calendar year.
Pursuant to section 852 of the Internal Revenue Code, Tax-Managed, U.S. Equity, Global Essentials and Global Alternatives hereby designate as a capital gain distribution with respect to the taxable year ended October 31, 2009, $0, $0, $0 and $0, respectively or, if subsequently determined to be different, the net capital gains of such year.
47
Report of Independent Registered Public Accounting Firm
To the Board of Trustees of Managers Trust I and the Shareholders of
Managers AMG FQ Tax-Managed U.S. Equity Fund, Managers AMG FQ U.S. Equity Fund,
Managers AMG FQ Global Alternatives Fund and Managers AMG FQ Global Essentials Fund
(formerly Managers Fremont Global Fund):
In our opinion, the accompanying statements of assets and liabilities for Managers AMG FQ Tax-Managed U.S. Equity Fund and Managers AMG FQ U.S. Equity Fund, including the schedules of portfolio investments, the statements of net assets for Managers AMG FQ Global Alternatives Fund and Managers AMG FQ Global Essentials Fund (formally Managers Fremont Global Fund), and the related statements of operations and of changes in net assets and financial highlights present fairly, in all material respects, the financial position of Managers AMG FQ Tax-Managed U.S. Equity Fund, Managers AMG FQ U.S. Equity Fund, Managers AMG FQ Global Alternatives Fund and Managers AMG FQ Global Essentials Fund (four of the series constituting Managers Trust I, hereafter referred to as the “Funds”) at October 31, 2009, the results of each of their operations for the year then ended, the changes in each of their net assets for each of two years in the period then ended and the financial highlights for each of the periods indicated, in conformity with accounting principles generally accepted in the United States of America. These financial statements and financial highlights (hereafter referred to as “financial statements”) are the responsibility of the Funds’ management; our responsibility is to express an opinion on these financial statements based on our audits. We conducted our audits of these financial statements in accordance with the standards of the Public Company Accounting Oversight Board (United States). Those standards require that we plan and perform the audit to obtain reasonable assurance about whether the financial statements are free of material misstatement. An audit includes examining, on a test basis, evidence supporting the amounts and disclosures in the financial statements, assessing the accounting principles used and significant estimates made by management, and evaluating the overall financial statement presentation. We believe that our audits, which included confirmation of securities at October 31, 2009 by correspondence with the custodian and brokers, provide a reasonable basis for our opinion.
PricewaterhouseCoopers LLP
Philadelphia, Pennsylvania
December 22, 2009
48
Trustees and Officers
The Trustees and Officers of the Trust, their business addresses, principal occupations for the past five years and dates of birth are listed below. The Trustees provide broad supervision over the affairs of the Trust and the Funds. The Trustees are experienced executives who meet periodically throughout the year to oversee the Funds’ activities, review contractual arrangements with companies that provide services to the Funds, and review the Funds’ performance. Unless otherwise noted, the address of each Trustee or Officer is the address of the Trust: 800 Connecticut Avenue, Norwalk, Connecticut 06854.
There is no stated term of office for Trustees. Trustees serve until their resignation, retirement or removal in accordance with the Trust’s organizational documents and policies adopted by the Board from time to time. The Chairman of the Trustees, President, Treasurer and Secretary of the Trust are elected by the Trustees annually. Other officers hold office at the pleasure of the Trustees.
Independent Trustees
The following Trustees are not “interested persons” of the Trust within the meaning of the 1940 Act:
| | |
Name, Date of Birth, Number of Funds
Overseen in Fund Complex* | | Principal Occupation(s) During Past 5 Years and Other Directorships Held by Trustee |
Jack W. Aber, 9/9/37 • Trustee since 2000 • Oversees 34 Funds in Fund Complex | | Professor of Finance, Boston University School of Management (1972-Present); Trustee of Appleton Growth Fund (1 portfolio); Trustee of Third Avenue Trust (5 portfolios); Trustee of Third Avenue Variable Trust (1 portfolio). |
| |
William E. Chapman, II, 9/23/41 • Independent Chairman • Trustee since 2000 • Oversees 34 Funds in Fund Complex | | President and Owner, Longboat Retirement Planning Solutions (1998-Present); Hewitt Associates, LLC (part time) (provider of Retirement and Investment Education Seminars); Trustee of Bowdoin College (2002-Present); Director of Harding, Loevner Funds, Inc. (6 portfolios); Trustee of Third Avenue Trust (5 portfolios); Trustee of Third Avenue Variable Trust (1 portfolio). |
| |
Edward J. Kaier, 9/23/45 • Trustee since 2000 • Oversees 34 Funds in Fund Complex | | Attorney at Law and Partner, Teeters Harvey Gilboy & Kaier LLP (2007-Present); Attorney at Law and Partner, Hepburn Willcox Hamilton & Putnam, LLP (1977-2007); Trustee of Third Avenue Trust (5 portfolios); Trustee of Third Avenue Variable Trust (1 portfolio). |
| |
Steven J. Paggioli, 4/3/50 • Trustee since 2000 • Oversees 34 Funds in Fund Complex | | Consultant (2001-Present); Formerly Executive Vice President and Director, The Wadsworth Group (1986- 2001); Executive Vice President, Secretary and Director, Investment Company Administration, LLC (1990-2001); Vice President, Secretary and Director, First Fund Distributors, Inc. (1991-2001); Trustee, Professionally Managed Portfolios (22 portfolios); Advisory Board Member, Sustainable Growth Advisors, LP; Independent Director, Chase Investment Counsel (2008 – Present). |
| |
Eric Rakowski, 6/5/58 • Trustee since 2000 • Oversees 34 Funds in Fund Complex | | Professor, University of California at Berkeley School of Law (1990-Present); Director of Harding, Loevner Funds, Inc. (6 portfolios); Trustee of Third Avenue Trust (5 portfolios); Trustee of Third Avenue Variable Trust (1 portfolio). |
| |
Thomas R. Schneeweis, 5/10/47 • Trustee since 2000 • Oversees 34 Funds in Fund Complex | | Professor of Finance, University of Massachusetts (1977-Present); Director, CISDM at the University of Massachusetts, (1996-Present); President, Alternative Investment Analytics, LLC, (formerly Schneeweis Partners, LLC) (2001-Present); Partner, White Bear Partners, LLC (2007-Present); Partner, Schneeweis Capital Management, LLC (2007-Present); Partner, Schneeweis Associates, LLC (2007-Present); Partner, Northampton Capital Management, LLC (2004-Present); Partner, TRS Associates (2007-Present). |
| * | The Fund Complex consists of Managers AMG Funds, The Managers Funds, Managers Trust I and Managers Trust II. |
Interested Trustees
The following Trustees are “interested persons” of the Trust within the meaning of the 1940 Act. Mr. Dalton is an interested person by virtue of his positions with, and interest in securities of, Affiliated Managers Group, Inc. and his position with Managers Distributors, Inc. Mr. Streur is an interested person by virtue of his positions with Managers Investment Group LLC.
| | |
Name, Date of Birth, Number of Funds
Overseen in Fund Complex* | | Principal Occupation(s) During Past 5 Years and Other Directorships Held by Trustee |
Nathaniel Dalton, 9/29/66 • Trustee since 2008 • Oversees 34 Funds in Fund Complex | | Executive Vice President and Chief Operating Officer, Affiliated Managers Group, Inc., (2006-Present); Executive Vice President, Affiliated Managers Group, Inc., (2002 -2006); Executive Vice President and General Counsel, Affiliated Managers Group, Inc. (2001-2002); Senior Vice President and General Counsel, Affiliated Managers Group, Inc. (1996-2001). Director, Managers Distributors, Inc. (2000-Present). |
| |
John H. Streur, 2/6/60 • Trustee since 2008 • President since 2008 • Oversees 34 Funds in Fund Complex | | Senior Managing Partner, Managers Investment Group LLC (2006-Present); President, Managers Distributors, Inc. (2006-Present); Managing Partner, Managers Investment Group LLC (2005-2006); Chief Executive Officer, President and Chief Operating Officer, The Burridge Group LLC (1996-2004). |
Officers
| | |
Name, Date of Birth, Position(s) Held with
Fund and Length of Time Served | | Principal Occupation(s) During Past 5 Years |
Christine C. Carsman, 4/2/52 • Secretary since 2004 | | Senior Vice President and Chief Regulatory Counsel, Affiliated Managers Group, Inc. (2004-Present); Secretary, The Managers Funds, Managers AMG Funds and Managers Trust II (2004-Present); Senior Counsel, Vice President and Director of Operational Risk Management and Compliance, Wellington Management Company, LLP (1995-2004); Deputy General Counsel, The Boston Company, Inc. (1993-1995); Associate General Counsel, The Boston Company Advisors, Inc. (1991-1993); Associate, Sullivan & Worcester LLP (1987-1991). |
| |
Donald S. Rumery, 5/29/58 • Chief Financial Officer since 2007 • Treasurer since 2000 | | Senior Vice President, Managers Investment Group LLC (2005-Present); Director, Finance and Planning, The Managers Funds LLC, (1994-2004); Treasurer and Chief Financial Officer, Managers Distributors, Inc. (2000-Present); Treasurer, The Managers Funds (1995-Present); Treasurer, Managers AMG Funds (1999-Present); Treasurer, Managers Trust II (2000-Present); Secretary, Managers Trust I and Managers Trust II (2000-2004) and Secretary, The Managers Funds (1997-2004); Chief Financial Officer, The Managers Funds, Managers AMG Funds and Managers Trust II (2007-Present). |
| |
Keitha L. Kinne, 5/16/58 • Chief Operating Officer since 2007 | | Managing Partner and Chief Operating Officer, Managers Investment Group LLC (2007-Present); Chief Operating Officer, The Managers Funds, Managers AMG Funds and Managers Trust II (2007-Present); Chief Investment Officer, Managers Investment Group LLC (2008-Present); Managing Director, Legg Mason & Co., LLC (2006-2007); Managing Director, Citigroup Asset Management (2004- 2006); Senior Vice President, Prudential Investments (1999-2004). |
| |
David Kurzweil, 6/22/74 • Assistant Secretary since 2008 | | Senior Vice President and Associate Counsel, Managers Investment Group LLC (2008-Present); Assistant Secretary, The Managers Funds, Managers Trust I, Managers Trust II, and Managers AMG Funds (2008-Present); Counsel and Senior Vice President, Lazard Asset Management LLC (2003-2008). |
49
Annual Renewal of Investment Advisory Agreements
On June 4-5, 2009, the Board of Trustees, including a majority of the Trustees who are not “interested persons” of the Trust (the “Independent Trustees”), approved the Investment Management Agreement with the Investment Manager for each of the Managers AMG FQ U.S. Equity Fund, Managers AMG FQ Tax-Managed U.S. Equity Fund and Managers AMG FQ Global Alternatives Fund (each a “Fund”) and the Subadvisory Agreement with respect to each Fund. The Independent Trustees were separately represented by independent counsel in connection with their consideration of the approval of these agreements. In considering the Investment Management and Subadvisory Agreements, the Trustees reviewed a variety of materials relating to each Fund, the Investment Manager and the Subadvisor, including comparative performance, fee and expense information for an appropriate peer group of similar mutual funds for each Fund (each a “Peer Group”), performance information for the relevant benchmark index for each Fund (each a “Fund Benchmark”) and, with respect to the Subadvisor, comparative performance information for an appropriate peer group of managed accounts, and, as to all other matters, other information provided to them on a periodic basis throughout the year, as well as information provided in connection with the meetings of June 4-5, 2009, regarding the nature, extent and quality of services provided by the Investment Manager and the Subadvisor under their respective agreements. Prior to voting, the Independent Trustees: (a) reviewed the foregoing information with their independent legal counsel and with management; (b) received materials from their independent legal counsel discussing the legal standards applicable to their consideration of the Investment Management and Subadvisory Agreements; and (c) met with their independent legal counsel in private sessions at which no representatives of management were present.
Nature, extent and quality of services.
In considering the nature, extent and quality of the services provided by the Investment Manager, the Trustees reviewed information relating to the Investment Manager’s operations and personnel. Among other things, the Investment Manager provided financial information, biographical information on its supervisory and professional staff and descriptions of its organizational and management structure. The Trustees also took into account information provided periodically throughout the previous year by the Investment Manager relating to the performance of its duties with respect to the Funds and the Trustees’ familiarity with the Investment Manager’s management through Board meetings, discussions and reports. In the course of their deliberations regarding the Investment Management Agreement, the Trustees evaluated, among other things: (a) the extent and quality of the Investment Manager’s oversight of the operation and management of the Funds; (b) the quality of the Investment Manager’s oversight of the performance by the Subadvisor of its portfolio management duties; (c) the Investment Manager’s ability to supervise the Funds’ other service providers; and (d) the Investment Manager’s compliance programs. The Trustees also took into account the financial condition of the Investment Manager with respect to its ability to provide the services required under the Investment Management Agreement and the Investment Manager’s undertaking to maintain contractual expense limitations for the Funds.
The Trustees also reviewed information relating to the Subadvisor’s financial condition, operations and personnel and the investment philosophy, strategies and techniques (its “Investment Strategy”) used in managing each Fund. Among other things, the Trustees reviewed biographical information on portfolio management and other professional staff, information regarding the Subadvisor’s organizational and management structure and the Subadvisor’s brokerage policies and practices. The Trustees considered specific information provided regarding the experience of the individuals at the Subadvisor with portfolio management responsibility for the Funds, including the information set forth in each Fund’s prospectus and statement of additional information. In the course of their deliberations, the Trustees evaluated, among other things: (a) the services rendered by the Subadvisor in the past; (b) the qualifications and experience of the Subadvisor’s personnel; and (c) the Sub-advisor’s compliance programs. The Trustees also took into account the financial condition of the Subadvisor with respect to its ability to provide the services required under each Subadvisory Agreement.
Performance.
With respect to the Managers AMG FQ U.S. Equity Fund, among other information related to the Fund’s performance, the Trustees noted that the Fund’s performance for Institutional Class shares for the 1-year, 3-year, 5-year and 10-year periods ended March 31, 2009 was above, above, above and below, respectively, the median performance of the Peer Group and above, above, above and below, respectively, the performance of the Fund Benchmark, the Russell 3000 Index. The Trustees took into account management’s discussion of the Fund’s performance and noted that the Fund’s Subadvisor was engaged in 2004. The Trustees concluded that the Fund’s performance has been satisfactory in light of all factors considered.
With respect to the Managers AMG FQ Tax-Managed U.S. Equity Fund, among other information related to the Fund’s performance, the Trustees noted that the Fund’s performance for Institutional Class shares for the 1-year, 3-year and 5-year periods ended March 31, 2009 and for the period from the Fund’s inception on December 18, 2000 through March 31, 2009 was below, below, above and above, respectively, the median performance of the Peer Group and below, below, above and above, respectively, the performance of the Fund Benchmark, the Russell 3000 Index. The Trustees also took into account management’s discussion of the Fund’s longer term performance, including the fact that the Fund’s Institutional Class outperformed the Fund Benchmark while performing in the top quartile relative to the Peer Group over the 5-year period and since the Fund’s inception. The Trustees concluded that the Fund’s performance has been satisfactory in light of all factors considered.
50
Annual Renewal of Investment Advisory Agreements (continued)
With respect to the Managers AMG FQ Global Alternatives Fund, among other information related to the Fund’s performance, the Trustees noted that the Fund’s performance for the 1-year and 3-year periods ended March 31, 2009 and for the period from the Fund’s inception on March 30, 2006 through March 31, 2009 was above the median performance of the Peer Group and below the performance of the Fund Benchmark, the Citigroup 1-Month T-Bill Index, for each period. The Trustees took into account management’s discussion of the Fund’s performance, including the Fund’s performance against the Peer Group for the last three years and since the Fund’s inception. The Trustees concluded that the Fund’s performance was satisfactory in light of its limited performance record.
As noted above, the Board considered each Fund’s performance during relevant time periods as compared to the Fund’s Peer Group and considered the Subadvisor’s performance as compared to an appropriate peer group of managed accounts and noted that the Board reviews on a quarterly basis detailed information about each Fund’s performance results and portfolio composition as well as the Subadvisor’s Investment Strategy. The Board noted the Investment Manager’s expertise and resources in monitoring the performance, investment style and risk-adjusted performance of the Subadvisor. The Board was mindful of the Investment Manager’s attention to monitoring the Subadvisor’s performance with respect to the Funds and its discussions with management regarding the factors that contributed to the performance of the Funds.
Advisory and Subadvisory Fees and Profitability.
In considering the reasonableness of the advisory fee payable to the Investment Manager and the subadvisory fee payable by the Investment Manager to the Subadvisor, the Trustees reviewed information provided by the Investment Manager setting forth all revenues and other benefits, both direct and indirect, received by the Investment Manager and its affiliates attributable to managing each Fund and all the mutual funds in the Managers Family of Funds, the cost of providing such services and the resulting profitability to the Investment Manager and its affiliates from these relationships. The Trustees noted that the Investment Manager and the Subadvisor are affiliated and that, in the case of the Managers AMG FQ Tax-Managed U.S. Equity Fund and the Managers AMG FQ U.S. Equity Fund, the Investment Manager pays the Subadvisor a subadvisory fee that is equal to the advisory fee that it receives from the Fund. The Trustees also noted the current asset levels of the Funds, including the effect on assets attributable to the economic and market conditions over the past year, and considered the impact on profitability of the current asset levels and any future growth of assets of the Funds.
In considering the cost of services to be provided by the Investment Manager under the Investment Management Agreement and the profitability to the Investment Manager of its relationship with the Funds, the Trustees noted the current asset level of the Funds and the undertaking by the Investment Manager to maintain contractual expense limitations for the Funds. The Board also took into account management’s discussion of the current advisory fee structure. Based on the foregoing, the Trustees concluded that the profitability to the Investment Manager is reasonable and that the Investment Manager is not realizing material benefits from economies of scale that would warrant adjustments to the advisory fee at this time. Also with respect to economies of scale, the Trustees noted that as a Fund’s assets increase over time, the Fund may realize other economies of scale to the extent the increase in assets is proportionally greater than the increase in certain other expenses.
In considering the reasonableness of the subadvisory fees payable by the Investment Manager to the Subadvisor, the Trustees reviewed information provided by the Subadvisor regarding the cost of providing subadvisory services to each of the Funds and the resulting profitability to the Subadvisor from these relationships. In considering the cost of services to be provided by the Subadvisor under the Subadvisory Agreements and the profitability to the Subadvisor of its relationship with the Funds, the Trustees noted the current asset level of each Fund and the undertaking by the Investment Manager to maintain contractual expense limitations for the Funds. As a consequence, the cost of services to be provided by the Subadvisor and the profitability to the Subadvisor of its relationship with each Fund were not material factors in the Trustees’ deliberations. For similar reasons, the Trustees did not consider potential economies of scale in the management of the Funds by the Subadvisor to be a material factor in their considerations at this time.
With respect to the Managers AMG FQ U.S. Equity Fund, the Trustees noted that the Fund’s advisory fee and total expenses (net of applicable expense waivers/reimbursements) as of March 31, 2009 were both lower than the average for the Fund’s Peer Group. The Trustees took into account the fact that the Investment Manager has contractually agreed, through March 1, 2010, to limit the Fund’s net annual operating expenses to 1.04%, 1.79% and 0.79% for Class A shares, Class C shares and Institutional Class shares, respectively. The Trustees concluded that, in light of the nature, extent and quality of the services provided by the Investment Manager and the Subadvisor, the Fund’s performance, the foregoing expense limitation and the considerations noted above with respect to the Subadvisor and the Investment Manager, the Fund’s advisory fees are reasonable.
With respect to the Managers AMG FQ Tax-Managed U.S. Equity Fund, the Trustees noted that the Fund’s advisory fee and total expenses (net of applicable expense waivers/reimbursements) as of March 31, 2009 were both higher than the average for the Fund’s Peer Group. The Trustees took into account the fact that the Investment Manager has contractually agreed, through March 1, 2010, to limit the Fund’s net annual operating expenses to 1.24%, 1.99% and 0.99% for Class A shares, Class C shares and Institutional
51
Annual Renewal of Investment Advisory Agreements (continued)
Class shares, respectively. The Board also took into account the current size of the Fund. The Trustees concluded that, in light of the nature, extent and quality of the services provided by the Investment Manager and the Subadvisor, the Fund’s performance, the foregoing expense limitation and the considerations noted above with respect to the Subadvisor and the Investment Manager, the Fund’s advisory fees are reasonable.
With respect to the Managers AMG FQ Global Alternatives Fund, the Trustees noted that the Fund’s advisory fee and total expenses (net of applicable expense waivers/reimbursements) as of March 31, 2009 were both higher than the average for the Fund’s Peer Group. In this regard, the Trustees noted that because of the Investment Strategy of the Fund, the Peer Group contains a small group of funds, some of which pursue an investment strategy considerably different from that of the Fund. The Trustees took into account the fact that the Investment Manager has contractually agreed, through at least March 1, 2010, to limit the Fund’s net annual operating expenses to 1.99% for Class A shares and 2.74% for Class C shares. The Trustees concluded that, in light of the nature, extent and quality of the services to be provided by the Investment Manager and the Subadvisor, the Fund’s performance, the foregoing expense limitation and the considerations noted above with respect to the Subadvisor and the Investment Manager, the Fund’s advisory fees are reasonable.
* * * *
After consideration of the foregoing, the Trustees also reached the following conclusions regarding the Investment Management and Subadvisory Agreements in addition to the conclusions discussed above: (a) the Investment Manager has demonstrated that it possesses the resources and capability to perform its duties under the Investment Management Agreement; (b) the Subadvisor has the resources to perform its duties under the Subadvisory Agreements and is qualified to manage each Fund’s assets in accordance with its investment objectives and policies; and (c) the Investment Manager and Subadvisor maintain appropriate compliance programs.
Based on all of the above-mentioned factors and their related conclusions, with no single factor or conclusion being determinative and with each Trustee not necessarily attributing the same weight to each factor, the Trustees concluded that approval of the Investment Management Agreement and each Subadvisory Agreement (as applicable) would be in the best interests of each Fund and its shareholders. Accordingly, on June 4-5, 2009, the Trustees, including a majority of the Independent Trustees, voted to approve the Investment Management and Subadvisory Agreements (as applicable) for each Fund.
MANAGERS FREMONT GLOBAL FUND
On June 4-5, 2009, the Board of Trustees, including a majority of the Trustees who are not “interested persons” of the Trust (the “Independent Trustees”), approved the Investment Management Agreement with the Investment Manager for the Managers Fremont Global Fund (the “Fund”) and the Subadvisory Agreement for each Subadvisor of the Fund. The Fund’s name was changed to the Managers AMG FQ Global Essentials Fund on September 28, 2009. The Independent Trustees were separately represented by independent counsel in connection with their consideration of the approval of these agreements. In considering the Investment Management and Subadvisory Agreements, the Trustees reviewed a variety of materials relating to the Fund, the Investment Manager and each Subadvisor, including comparative performance, fee and expense information for an appropriate peer group of similar mutual funds (the “Peer Group”), performance information for a relevant benchmark index (the “Fund Benchmark”) and, with respect to each Subadvisor, comparative performance information for an appropriate peer group of managed accounts, and, as to all other matters, other information provided to them on a periodic basis throughout the year, as well as information provided in connection with the meetings of June 4-5, 2009, regarding the nature, extent and quality of services provided by the Investment Manager and the Subadvisors under their respective agreements. Prior to voting, the Independent Trustees: (a) reviewed the foregoing information with their independent legal counsel and with management; (b) received materials from their independent legal counsel discussing the legal standards applicable to their consideration of the Investment Management Agreement and the Subadvisory Agreements; and (c) met with their independent legal counsel in private sessions at which no representatives of management were present.
Nature, extent and quality of services.
In considering the nature, extent and quality of the services provided by the Investment Manager, the Trustees reviewed information relating to the Investment Manager’s operations and personnel. Among other things, the Investment Manager provided financial information, biographical information on its supervisory and professional staff and descriptions of its organizational and management structure. The Trustees also took into account information provided periodically throughout the previous year by the Investment Manager relating to the performance of its duties with respect to the Fund and the Trustees’ familiarity with the Investment Manager’s management through Board meetings, discussions and reports. In the course of their deliberations regarding the Investment Management Agreement, the Trustees evaluated, among other things: (a) the extent and quality of the Investment Manager’s oversight of the operation and management of the Fund; (b) the quality of the search, selection and monitoring services performed by the Investment
52
Annual Renewal of Investment Advisory Agreements (continued)
Manager in overseeing the portfolio management responsibilities of the Subadvisors; (c) the Investment Manager’s ability to supervise the Fund’s other service providers; and (d) the Investment Manager’s compliance programs. The Trustees also took into account the financial condition of the Investment Manager with respect to its ability to provide the services required under the Investment Management Agreement and to maintain a contractual expense limitation for the Fund.
The Trustees also reviewed information relating to each Subadvisor’s operations and personnel and the investment philosophy, strategies and techniques (for each Subadvisor, its “Investment Strategy”) used in managing the portion of the Fund for which the Subadvisor has portfolio management responsibility. Among other things, the Trustees reviewed biographical information on portfolio management and other professional staff, information regarding each Subadvisor’s organizational and management structure and each Subadvisor’s brokerage policies and practices. The Trustees considered specific information provided regarding the experience of the individual or individuals at each Subadvisor with portfolio management responsibility for the portion of the Fund managed by the Subadvisor, including the information set forth in the Fund’s prospectus and statement of additional information. The Trustees also noted information provided by the Investment Manager regarding the manner in which each Subadvisor’s Investment Strategy complements those utilized by the Fund’s other Subadvisors. In the course of their deliberations, the Trustees evaluated, among other things: (a) the services rendered by each Subadvisor in the past; (b) the qualifications and experience of the Subadvisor’s personnel; and (c) the Subadvisor’s compliance programs. The Trustees also took into account the financial condition of each Subadvisor with respect to its ability to provide the services required under its Subadvisory Agreement.
Performance.
Among other information relating to the Fund’s performance, the Trustees noted that the Fund’s performance for the 1-year, 3-year, 5-year and 10-year periods ended March 31, 2009 was below the median performance of the Peer Group and below the performance of the Fund Benchmark, a Composite Index (65% MSCI World Index and 35% Barclays Capital Global Aggregate Index), for each period. The Trustees took into account management’s discussion of the Fund’s performance. The Trustees noted that the Fund’s long-term performance had previously been strong and had been negatively affected by the past year’s performance. The Trustees concluded that the Fund’s performance has been satisfactory in light of all factors considered.
As noted above, the Board considered the Fund’s performance during relevant time periods as compared to the Fund’s Peer Group and considered each Subadvisor’s performance as compared to an appropriate peer group of managed accounts and noted that the Board reviews on a quarterly basis detailed information about the Fund’s performance results, portfolio composition and Investment Strategies, including with respect to the portion of the Fund managed by each Subadvisor. The Board noted the Investment Manager’s expertise and resources in monitoring the performance, investment style and risk-adjusted performance of each Subadvisor. The Board also noted each Subadvisor’s performance record with respect to the Fund. The Board was mindful of the Investment Manager’s attention to monitoring each Subadvisor’s performance with respect to the Fund and its discussions with management regarding the factors that contributed to the performance of the Fund.
Advisory Fees and Profitability.
In considering the reasonableness of the advisory fee charged by the Investment Manager for managing the Fund, the Trustees noted that the Investment Manager, and not the Fund, is responsible for paying the fees charged by the Fund’s Subadvisors and, therefore, that the fees paid to the Investment Manager cover the cost of providing portfolio management services as well as the cost of providing search, selection and monitoring services in operating a “manager-of-managers” complex of mutual funds. The Trustees concluded that, in light of the additional high quality supervisory services provided by the Investment Manager and the fact that the subadvisory fees are paid out of the advisory fee, the advisory fee payable by the Fund to the Investment Manager can reasonably be expected to exceed the median advisory fee for the Peer Group, which consists of many funds that do not operate with a manager-of-managers structure. In this regard, the Trustees also noted that the Investment Manager has undertaken to maintain an expense limitation for the Fund.
In considering the reasonableness of the advisory fee payable to the Investment Manager, the Trustees also reviewed information provided by the Investment Manager setting forth all revenues and other benefits, both direct and indirect, received by the Investment Manager and its affiliates attributable to managing the Fund and all the mutual funds in the Managers Family of Funds, the cost of providing such services and the resulting profitability to the Investment Manager and its affiliates from these relationships. The Trustees noted that the Investment Manager allocated a portion of the Fund’s assets to another fund in the Managers Family of Funds and received direct and indirect benefits from that arrangement. The Trustees also noted the current and potential asset levels of the Fund and the willingness of the Investment Manager to waive fees and pay expenses for the Fund from time to time as a means of limiting total expenses. The Trustees also considered the current asset levels of the Fund, including the effect on assets attributable to the economic and market conditions over the past year, and considered the impact on profitability of the current asset levels and any future growth of assets of the Fund. The Board took into account management’s discussion of the current advisory fee structure. In this regard, the Trustees noted that, unlike a mutual
53
Annual Renewal of Investment Advisory Agreements (continued)
fund that is managed by a single investment adviser, the Fund operates in a manager-of-managers structure. The Trustees also noted that the subadvisory fees are paid by the Investment Manager out of its advisory fee. Based on the foregoing, the Trustees concluded that the profitability to the Investment Manager is reasonable and that the Investment Manager is not realizing material benefits from economies of scale that would warrant adjustments to the advisory fees for the Fund at this time. With respect to economies of scale, the Trustees also noted that as the Fund’s assets increase over time, the Fund may realize other economies of scale to the extent that the increase in assets is proportionally greater than the increase in certain other expenses.
The Trustees noted that the Fund’s advisory fee and total expenses (net of applicable expense waivers/reimbursements) as of March 31, 2009 were higher and lower, respectively, than the average for the Peer Group. The Trustees took into account the fact that the Investment Manager has contractually agreed, through March 1, 2010, to waive its entire management fee for the Fund with respect to those assets of the Fund invested in another fund in the Managers Family of Funds. The Trustees concluded that, in light of the nature, extent and quality of the services provided by the Investment Manager and the Subadvisors, the foregoing management fee waiver and the considerations noted above with respect to the Subadvisors and the Investment Manager, the Fund’s advisory fees are reasonable.
Subadvisory Fees and Profitability.
In considering the reasonableness of the fee payable by the Investment Manager to each Subadvisor (other than First Quadrant, L.P. (“FQ”)), which is an affiliate of the Investment Manager), the Trustees relied on the ability of the Investment Manager to negotiate the terms of the Subadvisory Agreement at arm’s length as part of the manager-of-managers structure, noting that the Subadvisor is not affiliated with the Investment Manager (other than FQ). In addition, the Trustees noted that the subadvisory fees are paid by the Investment Manager out of its advisory fee. Accordingly, the cost of services to be provided by the Subadvisor and the profit-ability to the Subadvisor of its relationship with the Fund were not material factors in the Trustees’ deliberations. For similar reasons, and based on the current size of the portion of the Fund managed by a Subadvisor, the Trustees concluded that any economies of scale being realized by the Subadvisor was not a material factor in the Trustees’ deliberations at this time.
In considering the reasonableness of the fee payable by the Investment Manager to FQ, the Trustees noted that FQ is an affiliate of the Investment Manager and reviewed information provided by FQ regarding the cost to FQ of providing subadvisory services to the Fund and the resulting profitability from such relationship. The Trustees also noted that the subadvisory fee is paid by the Investment Manager out of the advisory fee. Based on the current size of the portion of the Fund managed by each Subadvisor, the Trustees concluded that the effect of any economies of scale being realized by FQ was not a material factor in the Trustees’ deliberations at this time.
* * * *
After consideration of the foregoing, the Trustees also reached the following conclusions regarding the Investment Management Agreement and each Subadvisory Agreement, in addition to those conclusions discussed above: (a) the Investment Manager and each Subadvisor have demonstrated that they possess the capability and resources to perform the duties required of them under the Investment Management Agreement and the applicable Subadvisory Agreements; (b) each Subadvisor’s Investment Strategy is appropriate for pursuing the Fund’s investment objectives; (c) each Subadvisor is reasonably likely to execute its Investment Strategy consistently over time; and (d) the Investment Manager and each Subadvisor maintain appropriate compliance programs.
Based on all of the above-mentioned factors and their related conclusions, with no single factor or conclusion being determinative and with each Trustee not necessarily attributing the same weight to each factor, the Trustees concluded that approval of each Investment Management Agreement and each Subadvisory Agreement would be in the best interests of the Fund and its shareholders. Accordingly, on June 4-5, 2009, the Trustees, including a majority of the Independent Trustees, voted to approve the Investment Management Agreement and the Subadvisory Agreements for the Fund.
54
THIS PAGE INTENTIONALLY LEFT BLANK
Investment Manager and Administrator
Managers Investment Group LLC
333 W. Wacker Drive
Suite 1200
Chicago, IL 60606
(800) 835-3879
Distributor
Managers Investment Group LLC
333 W. Wacker Drive
Suite 1200
Chicago, IL 60606
(800) 835-3879
Subadvisor
First Quadrant, L.P.
800 E. Colorado Boulevard, Suite 900
Pasadena, CA 91101
Custodian
The Bank of New York Mellon
2 Hanson Place
Brooklyn, New York 11217
Legal Counsel
Ropes & Gray LLP
One International Place
Boston, Massachusetts 02110-2624
Transfer Agent
PNC Global Investment Servicing (U.S.) Inc.
Attn: Managers
P.O. Box 9769
Providence, Rhode Island 02940
(800) 548-4539
For Managers Choice Only
Managers
c/o PNC Global Investment Servicing (U.S.) Inc.
P.O. Box 61204
King of Prussia, Pennsylvania 19406-0851
(800) 358-7668

MANAGERSAND MANAGERS AMG FUNDS
| | | | |
EQUITY FUNDS | | BALANCED FUNDS |
| EMERGING MARKETS EQUITY | | CHICAGO EQUITY PARTNERS MID-CAP | | CHICAGO EQUITY PARTNERS BALANCED |
| Rexiter Capital Management Limited | | Chicago Equity Partners, LLC | | Chicago Equity Partners, LLC |
Schroder Investment Management North America Inc. | | REAL ESTATE SECURITIES | | ALTERNATIVE FUNDS |
| | Urdang Securities Management, Inc. | | FQ GLOBAL ALTERNATIVES |
| ESSEX GROWTH | | | | FQ GLOBAL ESSENTIALS |
| ESSEX LARGE CAP GROWTH | | RENAISSANCE LARGE CAP GROWTH | | First Quadrant, L.P. |
| ESSEX SMALL/MICRO CAP GROWTH | | Renaissance Group LLC | | |
| Essex Investment Management Co., LLC | | | | INCOME FUNDS |
| | SKYLINE SPECIAL EQUITIES PORTFOLIO | | BOND (MANAGERS) |
| FQ TAX-MANAGED U.S. EQUITY | | Skyline Asset Management, L.P. | | FIXED INCOME |
| FQ U.S. EQUITY | | | | GLOBAL BOND |
| First Quadrant, L.P. | | SMALL CAP | | Loomis, Sayles & Co., L.P. |
| | Frontier Capital Management Company, LLC | | |
| GW&K SMALL CAP EQUITY | | | | BOND (MANAGERS FREMONT) |
| Gannett Welsh & Kotler, LLC | | SPECIAL EQUITY | | Pacific Investment Management Co. LLC |
| | Ranger Investment Management, L.P. | | |
| INSTITUTIONAL MICRO-CAP | | Lord, Abbett & Co. LLC | | CALIFORNIA INTERMEDIATE TAX-FREE |
| MICRO-CAP | | Smith Asset Management Group, L.P. | | Miller Tabak Asset Management LLC |
| Lord, Abbett & Co. LLC | | Federated MDTA LLC | | |
| WEDGE Capital Management L.L.P. | | | | GW&K MUNICIPAL BOND |
| Next Century Growth Investors LLC | | SYSTEMATIC VALUE | | GW&K MUNICIPAL ENHANCED YIELD |
| Voyageur Asset Management Inc. | | SYSTEMATIC MID CAP VALUE | | Gannett Welsh & Kotler, LLC |
| | Systematic Financial Management, L.P. | | |
| INTERNATIONAL EQUITY | | | | HIGH YIELD |
| AllianceBernstein L.P. | | TIMESSQUARE MID CAP GROWTH | | J.P. Morgan Investment Management LLC |
| Lazard Asset Management, LLC | | TIMESSQUARE SMALL CAP GROWTH | | |
| Martin Currie Inc. | | TimesSquare Capital Management, LLC | | INTERMEDIATE DURATION GOVERNMENT |
| | | | SHORT DURATION GOVERNMENT |
| | | | Smith Breeden Associates, Inc. |
| | | | |
This report is prepared for the Funds’ shareholders. It is authorized for distribution to prospective investors only when preceded or accompanied by an effective prospectus. To receive a free copy of the prospectus or Statement of Additional Information, which includes additional information about Fund Trustees, please contact us by calling 800.835.3879. Distributed by Managers Distributors, Inc., member FINRA. A description of the policies and procedures each Fund uses to vote its proxies is available: (i) without charge, upon request, by calling 800.835.3879, or (ii) on the Securities and Exchange Commission’s (SEC) Web site at www.sec.gov. For information regarding each Fund’s proxy voting record for the 12-month period ended October 31, call 800.835.3879 or visit the SEC Web site at www.sec.gov. The Funds file their complete schedule of portfolio holdings with the SEC for the first and third quarters of each fiscal year on Form N-Q. The Funds’ Forms N-Q are available on the SEC’s website at www.sec.gov. A Fund’s Forms N-Q may be reviewed and copied at the SEC’s Public Reference Room in Washington, DC. Information on the operation of the Public Reference Room may be obtained by calling 800.SEC.0330. To review a complete list of the Funds’ portfolio holdings, or to view the most recent quarterly holdings report, semiannual report, or annual report, please visit www.managersinvest.com. www.managersinvest.com 
| | MONEY MARKET |
| | JPMorgan Investment Advisors Inc. |
| | |
| | |
| | |
| | |
| | |
| | |
| | |
| | |
| | |
| | |
| | |
| | |
| | |
| | |
| | |
| | |
| |  |
| | |
| | |
| | |
| | |
| | |
| | |
ANNUAL REPORT
Managers Funds
October 31, 2009
Managers Fremont Bond Fund

AR021-1009
Managers Fremont Bond Fund
Annual Report — October 31, 2009
| | |
TABLE OF CONTENTS | | Page |
| |
LETTER TO SHAREHOLDERS | | 1 |
| |
ABOUT YOUR FUND’S EXPENSES | | 3 |
| |
PORTFOLIO MANAGER COMMENTS | | 4 |
| |
FUND SNAPSHOT | | 7 |
Summary of portfolio credit quality and top ten holdings at October 31, 2009 | | |
| |
SCHEDULE OF PORTFOLIO INVESTMENTS | | 8 |
| |
FINANCIAL STATEMENTS: | | |
Statement of Assets and Liabilities | | 18 |
Fund balance sheet, net asset value (NAV) per share computation and cumulative undistributed amount | | |
| |
Statement of Operations | | 19 |
Detail of sources of income, Fund expenses, and realized and unrealized gains (losses) during the fiscal year | | |
| |
Statement of Changes in Net Assets | | 20 |
Detail of changes in Fund assets for the past two fiscal years | | |
| |
FINANCIAL HIGHLIGHTS | | 21 |
Historical net asset values per share, distributions, total returns, expense ratios, turnover ratios and net assets | | |
| |
NOTES TO FINANCIAL STATEMENTS | | 22 |
Accounting and distribution policies, details of agreements and transactions with Fund management and affiliates, and descriptions of certain investment risks | | |
| |
REPORT OF INDEPENDENT REGISTERED PUBLIC ACCOUNTING FIRM | | 34 |
| |
TRUSTEES AND OFFICERS | | 35 |
| |
ANNUAL RENEWAL OF INVESTMENT ADVISORY AGREEMENT | | 36 |
Nothing contained herein is to be considered an offer, sale or solicitation of an offer to buy shares of any series of the Managers Family of Funds. Such offering is made only by Prospectus, which includes details as to offering price and other material information.
Letter to Shareholders
Dear Shareholder:
The past twelve months will go down in the history books as one of the wildest rides in the history of Wall Street. Early in the period, securities markets were under severe pressure as the credit crisis, which began in the summer of 2007, accelerated in the fourth quarter of last year amid ongoing concerns about deteriorating economic conditions and the health of some of the most prominent financial institutions. Banks of all sizes remained under pressure, which led to continued consolidation within the industry. Wachovia agreed to sell itself to Wells Fargo & Co. while PNC agreed to acquire the troubled National City. Meanwhile, the U.S. Government attempted to stabilize the system by formally bailing out companies like Citigroup and by providing injections of capital into hundreds of other financial institutions. Like a sprawling fire, the crises extended to other industries with the automakers finding themselves on the verge of collapse. Once again, the U.S. Government stepped in and in late December 2008 President Bush approved an emergency bailout of the U.S. auto industry, offering $17.4 billion in rescue loans to Chrysler and General Motors with the expectation that the companies would move quickly to develop acceptable plans for long-term viability.
Consumer and investor confidence continued to sink in the early part of 2009 despite the U.S. Government’s aggressive efforts to restore the economy and stabilize the financial markets. During January, February and early March, stocks plunged, sending broad indexes to levels not seen since the mid to late 1990s. From peak (October 10, 2007) to trough (March 9, 2009), stocks, as measured by the S&P 500 Index lost 55.5%, the Index’s steepest decline since the Great Depression. Then, on March 10, a very sharp recovery began amid preliminary signs that the Government’s efforts might be starting to bear fruit. More specifically, Citigroup, which had been under extreme pressure and was essentially bailed out by the Government, reported that it returned to profitability in the months of January and February. Citigroup’s surprising news seemed to ignite both equity and credit markets and ultimately set the stage for a sharp recovery in equities and extended the rally in credit sensitive fixed income securities.
For the period, bonds generated strong returns as measured by the Barclays Capital U.S. Aggregate Bond Index and the Barclays Capital Global Aggregate ex US Index, which returned 13.8% and 21.3%, respectively. Within the fixed income markets, lower-quality securities posted the best results as investors took advantage of extraordinarily wide yield spreads. This is best exemplified by the 48.1% and 6.3% returns generated by the Barclays Capital U.S. Corporate High Yield Index and the Barclays Capital U.S. Government –Treasury Index, respectively.
Against this backdrop, for the one-year period that ended October 31, 2009, the Managers Fremont Bond Fund (the “Fund”) posted a strong absolute return of 20.6%. This compares favorably on a relative basis as its benchmark, the Barclays Capital U.S. Aggregate Bond Index, posted a return of 13.8% for that same period as detailed further below.
| | | | | | | | | | | | | | | | | |
Periods Ended 10/31/09 | | 6 Months | | | 1 Year | | | 3 Years | | | 5 Years | | | 10 Years | | | Inception Date |
Managers Fremont Bond Fund | | 11.79 | % | | 20.62 | % | | 8.31 | % | | 6.30 | % | | 7.33 | % | | 4/30/1993 |
Barclays Capital U.S. Aggregate Bond Index® | | 5.61 | % | | 13.79 | % | | 6.35 | % | | 5.05 | % | | 6.31 | % | | |
1
Letter to Shareholders (continued)
The Fund’s strong absolute and relative returns for the period are attributable to a number of factors including the Fund’s interest rate strategies and sector positioning. Yield curve steepening strategies, including exposure to short maturities in the U.S. and U.K., added value as yield curves generally steepened throughout the period. In addition, a substantial overweight to high-quality agency mortgage pass-through securities, since reduced, helped add significant value as these bonds outperformed in the first half of 2009. In addition, the Fund’s emphasis on bonds of financial companies, which outperformed the broader corporate market as major banks began to wean themselves off of government aid during the second and third quarters, also added value to the Fund. Finally, the Fund also benefited in early 2009 from exposure to rebounding areas of the credit markets including holdings of TIPS (Treasury Inflation Protected Securities) and municipal bonds.
Looking ahead, we anticipate the Fund will focus its interest rate strategies on maintaining a modestly longer duration than the benchmark given the investment team’s benign cyclical inflation outlook. The Fund will likely increase holdings in longer-dated Treasuries given improving valuations. In addition, we anticipate the Fund will continue to scale back holdings of mortgages prior to the end of the Federal Reserve’s purchase program. We also anticipate the Fund will maintain an underweight in the near-term to corporate bonds as current fundamentals do not seem to support the risk/return tradeoff. Within emerging markets, the Fund will focus on countries where debt is paired with strong reserves. Finally, the Fund looks to maintain a modest exposure to TIPS as disinflation looks likely over a cyclical timeframe.
The following report covers the one year period that ended October 31, 2009. Should you have any questions about this report, or if you’d like to receive a prospectus and additional information, including fees and expenses for these or any of the other Funds in our family, please feel free to contact us at 1-800-835-3879, or visit our Web site at www.managersinvest.com. As always, please read the prospectus carefully before you invest or send money.
If you are curious about how you can better diversify your investment program, visit the Knowledge Center on our Web site and view our articles in the investment strategies section. You can rest assured that under all market conditions our team is focused on delivering excellent investment management services for your benefit.
We thank you for your continued confidence and investment in The Managers Funds.
|
| Respectfully, |
|
 |
| John H. Streur |
| Senior Managing Partner |
| Managers Investment Group LLC |
2
About Your Fund’s Expenses
As a shareholder of a Fund, you may incur two types of costs: (1) transaction costs, which may include sales charges (loads) on purchase payments; redemption fees; and exchange fees; and (2) ongoing costs, including management fees; distribution (12b-1) fees; and other Fund expenses. This example is intended to help you understand your ongoing costs (in dollars) of investing in the Fund and to compare these costs with the ongoing costs of investing in other mutual funds. The example is based on $1,000 invested at the beginning of the period and held for the entire period as indicated below.
Actual Expenses
The first line of the following table provides information about the actual account values and actual expenses. You may use the information in this line, together with the amount you invested, to estimate the expenses that you paid over the period. Simply divide your account value by $1,000 (for example, an $8,600 account value divided by $1,000 = 8.6), then multiply the result by the number in the first line under the heading entitled “Expenses Paid During Period” to estimate the expenses you paid on your account during this period.
Hypothetical Example for Comparison Purposes
The second line of the following table provides information about hypothetical account values and hypothetical expenses based on the Fund’s actual expense ratio and an assumed annual rate of return of 5% before expenses, which is not the Fund’s actual return. The hypothetical account values and expenses may not be used to estimate the actual ending account balance or expenses you paid for the period. You may use this information to compare the ongoing costs of investing in the Fund and other funds by comparing this 5% hypothetical example with the 5% hypothetical examples that appear in the shareholder reports of other funds.
Please note that the expenses shown in the table are meant to highlight your ongoing costs only and do not reflect any transactional costs, such as sales charges (loads), redemption fees, or exchange fees. Therefore, the second line of the table is useful in comparing ongoing costs only, and will not help you determine the relative total costs of owning different funds.
| | | | | | | | | | | | |
Six Months Ended October 31, 2009 | | Expense
Ratio | | | Beginning
Account Value
05/01/09 | | Ending
Account Value
10/31/09 | | Expenses Paid
During the
Period* |
Managers Fremont Bond Fund | | | | | | | | | | | | |
Actual | | 0.58 | % | | $ | 1,000 | | $ | 1,118 | | $ | 3.10 |
Hypothetical (5% return before expenses) | | 0.58 | % | | $ | 1,000 | | $ | 1,022 | | $ | 2.96 |
| * | Expenses are equal to the Fund’s annualized expense ratio multiplied by the average account value over the period, multiplied by the number of days in the most recent fiscal half-year (184), then divided by 365. |
3
Managers Fremont Bond Fund
Portfolio Managers’ Comments
Managers Fremont Bond Fund seeks to maximize total return consistent with the preservation of capital by investing in debt securities such as corporate, mortgage backed, international, and government bonds. Normally, the Fund will invest at least 80% of its total assets in these types of bonds.
The Portfolio Manager
Pacific Investment Management Company, LLC
Pacific Investment Management Company, LLC (“PIMCO”), the subadvisor for the Managers Fremont Bond Fund, was founded in 1971. PIMCO is one of the world’s leading fixed-income managers with expertise and significant resources committed to virtually every sector of the global bond market.
Managers Fremont Bond Fund is an actively managed, diversified bond fund that focuses on intermediate-term, investment-grade bonds. The universe for the Fund includes all sectors of the bond market: governments, corporate bonds, mortgages, asset-backed securities, money market instruments, and international bonds. The Fund seeks total return consistent with preservation of capital by employing PIMCO’s “Total Return” fixed-income investment philosophy. This philosophy follows three key principles:
| | • | | Major shifts in portfolio strategy are driven by longer-term, or secular, trends as opposed to short-term interest rate fluctuations. |
| | • | | Consistent investment performance is achieved by avoiding extreme swings in maturity/duration of a portfolio. |
| | • | | Emphasis is placed on adding value through state-of-the-art tools such as futures, options, and volatility analysis. |
Economic analysis serves as the base for PIMCO’s portfolio strategy. Annually, PIMCO investment professionals conduct a three-day secular forum, where long-term economic and market forces are evaluated and portfolio strategies are set. Each quarter, the team meets to evaluate the current business cycle and develop shorter-term forecasts which are used to fine-tune the investment strategy. PIMCO’s fixed-income research efforts focus on identifying relative value and understanding the risks inherent in different portfolio structures, strategies, and bond market sectors. Using proprietary analytics and bottom-up credit analysis, the portfolio managers select individual bonds based on recommendations from sector analysts (who specialize in corporate, mortgage, high yield, government, and international bonds).
The ideal investment exhibits many of the following traits:
| | • | | It allows management to meet its overall portfolio positioning targets. Management typically invests in investment-grade securities but may invest up to 10% of the portfolio in securities that are below investment grade. |
| | • | | The investment has been independently analyzed by PIMCO. PIMCO does not rely solely on the credit ratings assigned by outside credit agencies. |
| | • | | Fund management deems that the security provides value relative to other securities within the same sector. |
Portfolio management:
| | • | | Is committed to seeking value across all bond market sectors. |
| | • | | Actively manages duration exposure, yield-curve position, volatility, sector allocation, and security selection and takes only modest exposures in each of these areas relative to the market. |
| | • | | Normally hedges at least 75% of its foreign currency exposure. |
| | • | | Utilizes derivatives (futures, options, swap agreements) as substitutes for physical securities as a means of gaining more cost-effective exposure. |
The investment team may sell securities when:
| | • | | Securities individually no longer represent relative value. |
| | • | | Fund management makes a shift in its portfolio strategy (change in duration, yield curve positioning, sector strategy, etc.). |
The Year in Review
The U.S. bond market started the fiscal year that ended October 31, 2009, in the midst of a global credit crisis. Eventually the U.S. bond market stabilized, along with broader financial markets and the economy, in the latter stages of the first quarter of 2009. Policy initiatives enacted in late 2008 began to yield positive results in the second half of this past fiscal year as the Federal Reserve’s purchase of mortgage and Treasury securities along with the government’s support for consumer finance markets and near zero short-term interest rates all helped revive risk appetites and helped stabilize credit markets both in the U.S. and abroad. As a result, riskier, higher yielding assets outperformed their higher quality counterparts within global credit markets
For the 12 months ended October 31, 2009, the Managers Fremont Bond Fund returned 20.6%, compared with 13.8% for its benchmark, the Barclays Capital U.S. Aggregate Bond Index. The Fund’s strong absolute and relative returns for the period are attributable to a number of factors, including the Fund’s interest rate strategies and sector positioning. Yield curve steepening strategies, including exposure to short maturities in the U.S. and U.K., added value as yield curves generally steepened throughout the period. In addition, a substantial overweight to high-quality agency mortgage pass-through securities, since reduced, helped add significant value as these bonds outperformed in the first half of 2009. In addition, the Fund’s emphasis on bonds of financial companies, which outperformed the broader corporate market as major banks began to wean themselves off of government aid during the second and third quarters, also added value to the Fund. Finally, the Fund also benefited in early 2009 from exposure to rebounding areas of the credit markets, including holdings of TIPS (Treasury Inflation Protected Securities) and municipal bonds.
Looking Forward
The portfolio management team at PIMCO believes that the likely outcome for the U.S. economy will be a weak recovery in 2010. On the downside, the U.S. could slip back into recession. Emerging economies, especially China, should continue to grow at a faster pace than the developed world, helped by aggressive stimulus policies. The rationale for PIMCO’s outlook includes:
| | • | | Limits to U.S. Growth– A slower pace of inventory drawdown by businesses and positive effects from stimulus programs should support growth at the end of 2009 but PIMCO believes this boost will not be sustainable. The reasons include: excessive levels of consumer debt and an expected increase |
4
Managers Fremont Bond Fund
Portfolio Managers’ Comments (continued)
| | in savings to work these levels down, a stubbornly high unemployment rate, and weak business investment in the face of record lows in capacity utilization. |
| | • | | Muted Monetary Policy– PIMCO expects the Federal Reserve to retain near-zero policy rates for some time. Even so, the impact of low rates and the Fed’s huge liquidity injections may be largely muted due to overleveraged consumers’ reluctance to borrow. |
| | • | | Weak Recoveries in Europe, U.K., and Japan– The rest of the developed world is expected to face similar challenges with the sustainability of demand into 2010. In Europe, large public debts and economic linkages to the U.S. and U.K. are likely to impose constraints on recovery. Japan’s recovery will face limits arising from its reliance on U.S. demand for its exports, especially autos, and weak capital spending as capacity utilization rates remain low. |
| | • | | China to Grow Faster– China is likely to grow far faster than more developed economies. Its fiscal stimulus has been especially large to compensate for a decline in exports. A surge in infrastructure investment has readjusted China’s GDP back towards its critical growth target of 8%. |
| | • | | Bifurcated Emerging Markets– Emerging economies overall are showing signs of a rebound. PIMCO believes that EM economies that are more reliant on external demand, such as Korea, Mexico, and Russia, will face greater headwinds for sustained recovery. Countries driven more by internal demand, including Brazil and India, would appear to be more resilient. |
| | • | | Tame Inflation– Substantial excess capacity in labor and product markets should keep inflation low over a cyclical time frame. Over the longer run, inflation risk may be heightened by the massive liquidity the Federal Reserve has injected into the financial system. For now, however, transmission of that liquidity into the broader economy will continue to be constrained by strong demand for cash among financial institutions and consumers eager to pay down debt. |
PIMCO will look to tactically reduce risk exposures within the Fund following powerful rallies in non-Treasury sectors driven primarily by favorable technicals and government policy. PIMCO believes this approach will protect the Fund in the event that the economy slips back into a recession and should allow PIMCO to reinvest at more attractive valuations later. The key elements of PIMCO’s positioning within the Fund include:
| | • | | Interest Rate Strategies– PIMCO will target above-index duration. While shorter maturity yields are unlikely to move much from current lows, there could be downward pressure on longer maturity yields should the economy weaken over the next year. PIMCO will retain money market futures positions in the U.S., Europe, and the U.K. as it anticipates that central banks will tighten more slowly than markets expect. |
| | • | | Move Toward an Underweight in Agency Mortgages– PIMCO’s significant overweight to high-quality Agency mortgage-backed securities (MBS) has recently been strongly positive for returns. With MBS valuations having richened substantially and the Federal Reserve’s mortgage plan slated to end in March of next year, PIMCO will look to potentially move to an underweight in an effort to benefit from an expected cheapening of Agency MBS. To help offset any loss of yield from this move, PIMCO will seek to collect premiums from written options on fixed income securities. |
| | • | | Reduce Corporate Bond Holdings– PIMCO will also look to trim corporate bond positions into the current rally, especially those that have appreciated most such as senior bonds of high-quality banks. While PIMCO will look to underweight the corporate sector overall, PIMCO will retain an emphasis on recession-resistant sectors such as telecom and utilities as well as energy. |
| | • | | Emerging Markets and Currency– PIMCO will take exposure to high-quality EM credits such as Mexico, Brazil, Korea, and Russia, which have relatively little debt coming due in the near future and a high level of reserves. PIMCO will take similar positions in EM currencies, with the exception of Russia, and also take exposure to the Chinese yuan, anticipating that faster growth in these economies should allow their currencies to gain versus the U.S. dollar. |
| | • | | Municipals and TIPS– PIMCO will continue to sell tax-exempt municipal bond positions, especially longer-dated issues, which have rallied along with other non-Treasury assets. While TIPS offer a potential hedge against long-run inflation risks, PIMCO believes their valuations compared to nominal bonds are unappealing over a cyclical time frame. As a consequence, the Fund’s TIPS holdings will likely be relatively light. |
5
Managers Fremont Bond Fund
Portfolio Managers’ Comments (continued)
Cumulative Total Return Performance
The Fund’s cumulative total return is based on the daily change in net asset value (NAV), and assumes that all distributions were reinvested. The Barclays Capital U.S. Aggregate Bond Index® is an index of the U.S. investment grade fixed-rate bond market, including both government and corporate bonds. Unlike the Fund, the Barclays Capital U.S. Aggregate Bond Index® is unmanaged, is not available to investment, and does not incur expenses. The chart illustrates the performance of a hypothetical $10,000 investment made in the Managers Fremont Bond Fund on October 31, 1999, to a $10,000 investment made in the Barclays Capital U.S. Aggregate Bond Index® for the same time period. The graph and table do not reflect the deduction of taxes that a shareholder would pay on a Fund distribution or redemption of shares. The listed returns for the Fund are net of expenses and the returns for the index exclude expenses. Total returns for the Fund would have been lower had certain expenses not been reduced.
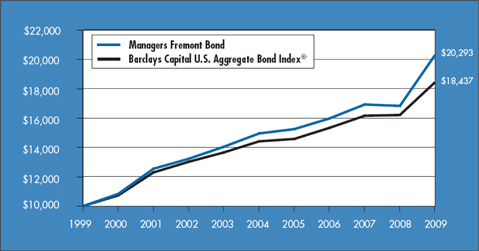
The table below shows the average annual total returns for the Managers Fremont Bond Fund and the Barclays Capital U.S. Aggregate Bond Index® from October 31, 1999 through October 31, 2009.
| | | | | | | | | |
Average Annualized Total Returns 1 | | One Year | | | Five Years | | | Ten Years | |
Managers Fremont Bond 2,3,4,5,6,7 | | 20.62 | % | | 6.30 | % | | 7.33 | % |
Barclays Capital U.S. Aggregate Bond Index® 8 | | 13.79 | % | | 5.05 | % | | 6.31 | % |
The performance data shown represents past performance. Past performance is not a guarantee of future results. Current performance may be lower or higher than the performance data quoted. The investment return and principal value of an investment in the Fund will fluctuate so that an investor’s shares, when redeemed, may be worth more or less than their original cost. For performance information through the most recent month end, please call (800) 835-3879 or visit our Web site at www.managersinvest.com.
In choosing a Fund, investors should carefully consider the amount they plan to invest, their investment objectives, the Fund’s investment objectives, risks, charges and expenses before investing. For this and other information, please call (800) 835-3879 or visit www.managersinvest.com for a free prospectus. Read it carefully before investing or sending money. Distributed by Managers Distributors, Inc., member FINRA.
| 1 | Total return equals income yield plus share price change and assumes reinvestment of all dividends and capital gain distributions. Returns are net of fees and may reflect offsets of Fund expenses as described in the Prospectus. No adjustment has been made for taxes payable by shareholders on their reinvested dividends and capital gain distributions. Returns for periods greater than one year are the average annual return. The listed returns on the Fund are net of expenses and based on the published NAV as of October 31, 2009. All returns are in U.S. dollars($). |
| 2 | Fund for which, from time to time, the advisor has waived its fees and/or absorbed Fund expenses, which has resulted in higher returns. |
| 3 | The Fund is subject to the risks associated with investments in debt securities, such as default risk and fluctuations in the perception of the debtors’ ability to pay their creditors. Changing interest rates may adversely affect the value of an investment. An increase in interest rates typically causes the value of bonds and other fixed-income securities to fall. |
| 4 | The Fund may use derivative instruments for hedging purposes or as part of its investment strategy. There is a risk that a derivative intended as a hedge may not perform as expected. The main risk with derivatives is that some types can amplify a gain or loss, potentially earning or losing substantially more money than the actual cost of the derivative; or that the counterparty may fail to honor its contract terms, causing a loss for the Fund. Use of these instruments may also involve certain costs and risks such as liquidity risk, interest rate risk, market risk, credit risk, management risk, and the risk that a fund could not close out a position when it would be most advantageous to do so. |
| 5 | Investments in international securities are subject to certain risks of overseas investing including currency fluctuations and changes in political and economic conditions, which could result in significant market fluctuations. These risks are magnified in emerging markets. |
| 6 | High yield bonds (also known as “junk bonds”) are subject to additional risks such as the risk of default. |
| 7 | Many bonds have call provisions which allow the debtors to pay them back before maturity. This is especially true with mortgage securities, which can be paid back any time. Typically debtors prepay their debt when it is to their advantage (when interest rates drop making a new loan at current rates more attractive), and thus likely to the disadvantage of bondholders, who may have to reinvest prepayment proceeds in securities with lower yields. Prepayment risk will vary depending on the provisions of the security and current interest rates relative to the interest rate of the debt. |
| 8 | Prior to October 31, 2008, the Index was known as the Lehman Brothers U.S. Aggregate Bond Index. |
Not FDIC insured, nor bank guaranteed. May lose value.
6
Managers Fremont Bond Fund
Fund Snapshot
October 31, 2009
Portfolio Breakdown
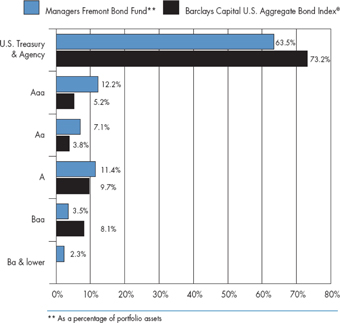
| | | | | | |
Rating | | Managers
Fremont Bond
Fund** | | | Barclays Capital
U.S. Aggregate
Bond Index® | |
U.S. Treasury & Agency | | 63.5 | % | | 73.2 | % |
Aaa | | 12.2 | % | | 5.2 | % |
Aa | | 7.1 | % | | 3.8 | % |
A | | 11.4 | % | | 9.7 | % |
Baa | | 3.5 | % | | 8.1 | % |
Ba & lower | | 2.3 | % | | 0.0 | % |
Top Ten Holdings
| | | |
Security Name | | Percentage
of Net Assets | |
U.S. Treasury Notes, 1.000%, 08/31/11 | | 13.3 | % |
JPMorgan Chase & Co., dated 10/30/09, due 11/03/09, 0.11%, total to be received $84,000,257 (secured by $85,840,000 Cash Management Bills, 1.000%, 07/15/10) | | 7.5 | |
JPMorgan Chase & Co., dated 10/29/09, due 11/02/09, 0.07%, total to be received $83,900,489 (secured by $86,481,850 U.S. Treasury Inflation Indexed Bonds, 2.375%, 01/15/25) | | 7.5 | |
JPMorgan Chase & Co., dated 10/30/09, due 11/03/09, 0.10%, total to be received $81,500,226 (secured by $83,163,000 U.S. Treasury Bills, 0.257%, 02/25/10) | | 7.3 | |
JPMorgan Chase & Co., dated 10/29/09, due 11/02/09, 0.07%, total to be received $78,400,457 (secured by $80,205,000 U.S. Treasury Bills, 0.364%, 08/26/10) | | 7.0 | |
U.S. Treasury Bonds, 4.250%, 05/15/39 | | 3.1 | |
FHLMC, 6.000%, TBA | | 2.8 | |
FHLMC, 5.500%, TBA | | 2.6 | |
FHLMC Gold Pool, 5.000%, TBA | | 2.3 | |
FNMA, 6.000%, TBA | | 2.2 | |
| | | |
Top Ten as a Group | | 55.6 | % |
| | | |
Any sectors, industries, or securities discussed should not be perceived as investment recommendations. Mention of a specific security should not be considered a recommendation to buy or solicitation to sell that security. Specific securities mentioned in this report may have been sold from the Fund’s portfolio of investments by the time you receive this report.
7
Managers Fremont Bond Fund
Schedule of Portfolio Investments
October 31, 2009
| | | | | | |
| | | Principal Amount | | Value |
Corporate Bonds - 42.8% | | | | | | |
Asset-Backed Securities - 3.2% | | | | | | |
Asset Backed Funding Certificates, Series 2006-OPT3 A3A, 0.304%, 11/25/36, (11/25/09)4 | | $ | 215,158 | | $ | 212,895 |
Ally Autos Receivable Trust, Series 2009-A, Class A2, 1.320%, 03/15/12 (a) | | | 1,200,000 | | | 1,201,659 |
Amortizing Residential Collateral Trust, 0.534%, 07/25/32, (11/25/09)4 | | | 77,398 | | | 55,571 |
Bear Stearns Asset Backed Securities, Inc., 0.324%, 10/25/36, (11/25/09)4 | | | 397,538 | | | 361,932 |
Countrywide Asset-Backed Certificates, 0.294%, 05/25/37, (11/25/09)4 | | | 423,603 | | | 412,248 |
EMC Mortgage Loan Trust, Class A, 0.614%, 05/25/40, (11/25/09) (a)4 | | | 1,052,963 | | | 735,851 |
First Franklin Mortgage Loan Asset Backed Certificates, Series 2006-FF15, Class A3, 0.294%, 11/25/36, (11/25/09)4 | | | 740,330 | | | 729,328 |
First NLC Trust, 0.314%, 08/25/37, (11/25/09) (a)4 | | | 1,195,109 | | | 841,034 |
Fremont Home Loan Trust, 0.304%, 01/25/37, (11/25/09)4 | | | 551,974 | | | 357,749 |
GSAMP Trust, Series 2006-HE7, Class A2A, 0.284%, 10/25/46, (11/25/09)4 | | | 265,077 | | | 261,127 |
HSI Asset Securitization Corp. Trust, 0.294%, 12/25/36, (11/25/09)4 | | | 306,896 | | | 211,773 |
Indymac Residential Asset Backed Trust, 0.304%, 04/25/37, (11/25/09)4 | | | 131,568 | | | 128,984 |
JPMorgan Acquisition Corp., Class A, 0.294%, 08/25/36, (11/25/09)4 | | | 46,893 | | | 45,950 |
Lehman XS Trust, 0.324%, 11/25/46, (11/25/09)4 | | | 786,736 | | | 750,538 |
Long Beach Mortgage Loan Trust, 0.524%, 10/25/34, (11/25/09)4 | | | 55,661 | | | 42,806 |
Morgan Stanley ABS Capital I, 0.284%, 10/25/36, (11/25/09)4 | | | 206,624 | | | 202,442 |
Morgan Stanley ABS Capital I, 0.294%, 10/25/36, (11/25/09)4 | | | 113,609 | | | 109,573 |
Morgan Stanley IXIS Real Estate Capital Trust, Series 2006-2, Class A1, 0.294%, 11/25/36, (11/25/09)4 | | | 229,480 | | | 222,922 |
Option One Mortgage Loan Trust, 0.294%, 01/25/37, (11/25/09)4 | | | 181,147 | | | 178,185 |
Park Place Securities, Inc., Series 2005-WCW1, Class A1B, 0.504%, 09/25/35, (11/25/09)4 | | | 1,587,551 | | | 1,038,885 |
Residential Asset Securities Corp., 0.314%, 11/25/36, (11/25/09)4 | | | 17,728 | | | 17,555 |
Saxon Asset Securities Trust, 0.304%, 10/25/46, (11/25/09)4 | | | 36,535 | | | 36,130 |
Securitized Asset Backed Receivables LLC Trust, Series 2007-NC2, Class A2A, 0.284%, 01/25/37, (11/25/09)4 | | | 845,194 | | | 775,392 |
Securitized Asset Backed Receivables LLC Trust, 0.304%, 12/25/36, (11/25/09)4 | | | 674,364 | | | 336,417 |
Structured Asset Securities Corp., 0.294%, 10/25/36, (11/25/09)4 | | | 555,052 | | | 522,260 |
Structured Asset Securities Corp., 0.534%, 01/25/33, (11/25/09)4 | | | 71,607 | | | 47,343 |
U.S. Small Business Administration Participation Certificates, Series 2009-20E, Class 1, 4.430%, 05/01/29 | | | 5,500,000 | | | 5,738,295 |
U.S. Small Business Administration Participation Certificates, Series 2008-10E, Class 1, 5.110%, 09/01/18 | | | 3,739,252 | | | 4,042,168 |
U.S. Small Business Administration Participation Certificates, 5.130%, 09/01/23 | | | 111,728 | | | 118,815 |
U.S. Small Business Administration Participation Certificates, Series 2007-20K, Class 1, 5.510%, 11/01/27 | | | 4,879,623 | | | 5,250,768 |
U.S. Small Business Administration Participation Certificates, Series 2008-20I, 5.600%, 09/01/28 | | | 9,388,177 | | | 10,192,456 |
U.S. Small Business Administration Surety Bonds, 6.344%, 08/01/11 | | | 304,613 | | | 319,736 |
U.S. Small Business Administration Surety Bonds, 7.449%, 08/01/10 | | | 18,161 | | | 18,730 |
Total Asset-Backed Securities | | | | | | 35,517,517 |
The accompanying notes are an integral part of these financial statements.
8
Managers Fremont Bond Fund
Schedule of Portfolio Investments (continued)
| | | | | | | |
| | | Principal Amount | | | Value |
Financials - 25.6% | | | | | | | |
Allstate Life Global Funding Trusts, 5.375%, 04/30/13 | | $ | 1,600,000 | | | $ | 1,719,228 |
American Express Centurion Bank, Series BKNT, 0.304%, 03/23/10, (11/23/09)4 | | | 5,000,000 | | | | 4,982,395 |
American Express Co., 7.000%, 03/19/18 | | | 1,000,000 | | | | 1,106,987 |
American Express Credit Co., 0.304%, 11/09/09, (11/09/09)4 | | | 2,400,000 | | | | 2,399,945 |
American Express Travel Related Services Co., Inc., Series EMTN, 0.444%, 06/01/11, (12/01/09)4 | | | 900,000 | | | | 863,319 |
American International Group, Inc., 5.050%, 10/01/15 | | | 400,000 | | | | 310,126 |
American International Group, Inc., 8.250%, 08/15/18 | | | 4,500,000 | | | | 3,840,854 |
ANZ National International, Ltd., 6.200%, 07/19/13 (a) | | | 1,800,000 | | | | 1,968,581 |
Australia and New Zealand Banking Group, Ltd., 3.200%, 12/15/11 (a) | | | 19,000,000 | 2 | | | 19,638,400 |
Banco Santander, 6.671%, 10/29/49 (a)5,6 | | | 2,100,000 | | | | 1,919,100 |
Bank of America Corp., 2.100%, 04/30/12 (FDIC Guaranteed)11 | | | 5,500,000 | | | | 5,594,550 |
Bank of America Corp., 6.000%, 10/15/36 | | | 900,000 | | | | 918,777 |
Bank of America Corp., 6.500%, 08/01/16 | | | 2,800,000 | | | | 2,999,738 |
Barclays Bank PLC, 5.450%, 09/12/12 | | | 17,300,000 | | | | 18,736,678 |
Bear Stearns Companies, Inc., The, 0.650%, 08/15/11, (11/16/09)4 | | | 200,000 | | | | 199,778 |
Bear Stearns Companies, Inc., The, 6.950%, 08/10/12 | | | 5,800,000 | | | | 6,513,267 |
C10 Capital SPV, Ltd., 6.722%, 12/31/49 (a)5,6 | | | 1,500,000 | 2 | | | 1,065,616 |
Chrysler Term Loan, 4.250%, 8/30/14 | | | 5,880,000 | | | | 5,647,658 |
CIT Group, Inc. Term Loan, 01/18/12*8,9 | | | 1,200,000 | | | | 1,248,000 |
CIT Group, Inc., 05/13/14*9 | | € | 1,800,000 | | | | 1,576,136 |
Citibank NA, 1.875%, 06/04/12 (FDIC Guaranteed)11 | | | 400,000 | 2 | | | 404,226 |
Citigroup Capital XXI, 8.300%, 12/21/575 | | | 1,200,000 | | | | 1,122,000 |
Citigroup Funding, Inc., 2.250%, 12/10/12 (FDIC Guaranteed)11 | | | 1,500,000 | | | | 1,524,345 |
Citigroup, Inc., 0.313%, 12/28/09, (12/28/09)4 | | | 300,000 | | | | 300,006 |
Citigroup, Inc., 1.875%, 05/07/12 (FDIC Guaranteed)11 | | | 800,000 | | | | 808,836 |
Citigroup, Inc., 2.125%, 04/30/12 (FDIC Guaranteed)11 | | | 800,000 | | | | 815,819 |
Citigroup, Inc., 5.300%, 10/17/12 | | | 200,000 | | | | 209,788 |
Citigroup, Inc., 5.500%, 08/27/12 | | | 500,000 | | | | 524,962 |
Citigroup, Inc., 5.500%, 10/15/14 | | | 5,800,000 | | | | 5,954,628 |
Citigroup, Inc., 5.625%, 08/27/12 | | | 1,300,000 | | | | 1,347,693 |
Citigroup, Inc., 5.850%, 07/02/13 | | | 100,000 | | | | 104,900 |
Citigroup, Inc., 6.000%, 08/15/17 | | | 4,200,000 | | | | 4,235,851 |
Citigroup, Inc., 6.125%, 05/15/18 | | | 800,000 | | | | 810,975 |
Citigroup, Inc., 6.125%, 08/25/36 | | | 4,200,000 | | | | 3,750,541 |
Citigroup, Inc., 8.125%, 07/15/39 | �� | | 600,000 | | | | 700,349 |
Citigroup, Inc., 8.500%, 05/22/19 | | | 100,000 | | | | 117,088 |
Citigroup, Inc., Series EMTN, Class B, 3.625%, 11/30/175 | | € | 3,800,000 | | | | 4,711,802 |
Commonwealth Bank of Australia, 0.704%, 07/12/13, (01/12/10) (a)4 | | | 7,500,000 | | | | 7,484,175 |
Credit Agricole (London), 0.422%, 05/28/10, (11/30/09) (a)4 | | | 2,200,000 | | | | 2,199,883 |
Danske Bank A/S, 2.500%, 05/10/12 (a) | | | 1,200,000 | | | | 1,225,651 |
Deutsche Bank AG London, 6.000%, 09/01/17 | | | 5,000,000 | | | | 5,464,340 |
The accompanying notes are an integral part of these financial statements.
9
Managers Fremont Bond Fund
Schedule of Portfolio Investments (continued)
| | | | | | | |
| | | Principal Amount | | | Value |
Financials - 25.6% (continued) | | | | | | | |
Ford Motor Credit Company LLC, 7.250%, 10/25/11 | | $ | 200,000 | | | $ | 196,248 |
Ford Motor Credit Company LLC, 7.375%, 02/01/11 | | | 300,000 | | | | 301,276 |
Ford Motor Credit Company LLC, 7.875%, 06/15/10 | | | 2,900,000 | | | | 2,928,710 |
Ford Motor Credit Company LLC, 8.625%, 11/01/10 | | | 700,000 | 2 | | | 714,235 |
Fortis Bank Nederland Holding N.V., 3.000%, 04/17/12 | | € | 200,000 | | | | 300,641 |
General Electric Capital Corp., 0.484%, 01/08/16, (01/08/10)4 | | | 1,000,000 | | | | 895,071 |
General Electric Capital Corp., 0.510%, 08/15/11, (11/16/09)4 | | | 3,600,000 | | | | 3,524,108 |
General Electric Capital Corp., 2.000%, 09/28/12 (FDIC Guaranteed)11 | | | 3,100,000 | | | | 3,129,872 |
General Electric Capital Corp., 3.000%, 12/09/11 (FDIC Guaranteed)11 | | | 200,000 | | | | 207,653 |
General Electric Capital Corp., 5.500%, 09/15/67 (a)5 | | € | 5,500,000 | | | | 6,475,254 |
General Electric Capital Corp., 5.875%, 01/14/38 | | | 2,300,000 | | | | 2,205,173 |
General Electric Capital Corp., Series MTN, 2.625%, 12/28/12 (FDIC Guaranteed)11 | | | 7,900,000 | | | | 8,118,222 |
GMAC LLC, 6.000%, 12/15/11 | | | 400,000 | 2 | | | 375,410 |
Goldman Sachs Group, Inc., 0.520%, 11/16/09, (11/16/09)4 | | | 1,300,000 | | | | 1,300,079 |
Goldman Sachs Group, Inc., 5.950%, 01/18/18 | | | 4,800,000 | | | | 5,065,829 |
Goldman Sachs Group, Inc., 6.150%, 04/01/18 | | | 2,000,000 | | | | 2,134,740 |
Goldman Sachs Group, Inc., 6.250%, 09/01/17 | | | 3,200,000 | | | | 3,429,002 |
HSBC Holdings PLC, 6.500%, 05/02/36 | | | 800,000 | | | | 879,939 |
HSBC Holdings PLC, 6.500%, 09/15/37 | | | 900,000 | | | | 989,780 |
ICICI Bank, Ltd., 5.900%, 01/12/10, (01/12/10) (a)4 | | | 3,400,000 | | | | 3,366,313 |
International Lease Finance Corp., 4.380%, 11/01/09 | | | 2,500,000 | | | | 2,500,000 |
International Lease Finance Corp., 5.875%, 05/01/13 | | | 400,000 | | | | 305,954 |
International Lease Finance Corp., 6.375%, 03/25/13 | | | 400,000 | | | | 316,602 |
International Lease Finance Corp., Series MTN, 5.250%, 01/10/13 | | | 400,000 | | | | 321,844 |
JPMorgan Chase & Co., 6.000%, 01/15/18 | | | 1,600,000 | | | | 1,715,837 |
JPMorgan Chase Bank, N.A., 0.630%, 06/13/16, (12/14/09)4 | | | 1,300,000 | | | | 1,212,022 |
JPMorgan Chase Bank, N.A., 6.000%, 10/01/17 | | | 4,500,000 | | | | 4,800,658 |
JPMorgan Chase Capital, 6.550%, 09/29/36 | | | 400,000 | | | | 374,122 |
Key Bank N.A., 2.598%, 06/02/10, (12/02/09) (a)4 | | | 2,700,000 | | | | 2,699,330 |
Korea Development Bank, 0.424%, 04/03/10, (01/04/10)4 | | | 7,100,000 | | | | 7,037,250 |
LeasePlan Corp. N.V., 3.125%, 02/10/12 | | € | 1,300,000 | | | | 1,961,881 |
Lehman Brothers Holdings, Inc., 10/22/08*8,9 | | | 3,900,000 | | | | 633,750 |
Lehman Brothers Holdings, Inc., 12/23/08*8,9 | | | 200,000 | | | | 32,500 |
Lehman Brothers Holdings, Inc., 04/03/09*8,9 | | | 4,700,000 | | | | 763,750 |
Lehman Brothers Holdings, Inc., 11/16/09*8,9 | | | 1,200,000 | | | | 195,000 |
Lehman Brothers Holdings, Inc., 05/25/10*8,9 | | | 1,000,000 | | | | 162,500 |
Lehman Brothers Holdings, Inc., 07/18/11*8,9 | | | 1,700,000 | | | | 276,250 |
Lehman Brothers Holdings, Inc., 01/24/13*8,9 | | | 2,000,000 | | | | 330,000 |
Lehman Brothers Holdings, Inc., 05/02/18*8,9 | | | 600,000 | | | | 99,750 |
Lloyds Banking Group PLC, 5.920%, 09/29/49 (a)5,6 | | | 400,000 | | | | 254,000 |
Lloyds TSB Bank PLC, 6.350%, 10/29/495,6 | | € | 1,800,000 | | | | 1,894,012 |
The accompanying notes are an integral part of these financial statements.
10
Managers Fremont Bond Fund
Schedule of Portfolio Investments (continued)
| | | | | | |
| | | Principal Amount | | Value |
Financials - 25.6% (continued) | | | | | | |
Merrill Lynch & Co., Inc., 0.410%, 12/04/09, (12/04/09)4 | | $ | 2,100,000 | | $ | 2,100,080 |
Merrill Lynch & Co., Inc., 0.482%, 07/25/11, (01/25/10)4 | | | 3,000,000 | | | 2,949,222 |
Met Life Global Funding, 0.480%, 05/17/10, (11/17/09) (a)4 | | | 4,100,000 | | | 4,092,985 |
Metlife, Inc., 6.400%, 12/15/36 | | | 800,000 | | | 705,000 |
Morgan Stanley, 0.374%, 01/15/10, (01/15/10)4 | | | 4,600,000 | | | 4,599,347 |
Morgan Stanley, 3.250%, 12/01/11 (FDIC Guaranteed)11 | | | 1,300,000 | | | 1,357,039 |
Morgan Stanley, 5.950%, 12/28/17 | | | 1,800,000 | | | 1,853,917 |
Morgan Stanley, 6.250%, 08/28/17 | | | 1,000,000 | | | 1,050,350 |
Morgan Stanley, Series MTN, 2.550%, 05/14/10, (11/16/09)4 | | | 3,100,000 | | | 3,133,294 |
MUFG Captial Finance, Ltd., 6.299%, 07/29/495,6 | | £ | 400,000 | | | 548,179 |
National Australia Bank, Ltd., 5.350%, 6/12/13 (a) | | | 1,500,000 | | | 1,608,208 |
Petroleum Export Ltd., 5.265%, 06/15/11 (a) | | | 146,790 | | | 143,601 |
Principal Life Income Funding Trust, 5.300%, 04/24/13 | | | 1,500,000 | | | 1,544,958 |
Principal Life Income Funding Trust, 5.550%, 04/27/15 | | | 2,300,000 | | | 2,321,581 |
Resona Bank Ltd., 5.850%, 04/15/49 (a)5,6 | | | 500,000 | | | 438,066 |
Royal Bank of Scotland Group PLC, 0.854%, 04/08/11, (11/13/09)(a)4 | | | 3,700,000 | | | 3,709,624 |
Royal Bank of Scotland Group PLC, 3.000%, 12/09/11 (a) | | | 2,700,000 | | | 2,788,614 |
Royal Bank of Scotland Group PLC, 4.875%, 08/25/14 (a) | | | 200,000 | | | 203,769 |
Royal Bank of Scotland Group PLC, 6.990%, 10/29/49 (a)5,6 | | | 2,600,000 | | | 1,457,856 |
Royal Bank of Scotland Group PLC, 9.118%, 10/01/496 | | | 1,000,000 | | | 935,089 |
SLM Corp., 0.499%, 3/15/11, (12/15/09)4 | | | 4,500,000 | | | 3,999,510 |
SMFG Preferred Capital, Ltd., 6.078%, 01/29/49 (a)5,6 | | | 200,000 | | | 173,754 |
SMFG Preferred Capital, Ltd., Series REGS, 6.164%, 01/29/495,6 | | £ | 1,100,000 | | | 1,445,478 |
State Street Capital, 1.299%, 06/15/37, (12/15/09)4 | | | 300,000 | | | 202,608 |
State Street Capital Trust III, 8.250%, 03/15/425,6 | | | 2,000,000 | | | 2,018,460 |
Swedbank AB, 3.625%, 12/02/11 | | € | 200,000 | | | 303,634 |
Temasek Financial I, Ltd., 4.300%, 10/25/19 (a) | | | 900,000 | | | 895,999 |
TNK- BP Finance SA, 6.125%, 03/20/12 (a) | | | 400,000 | | | 403,500 |
TransCapitalInvest, Ltd., 8.700%, 08/07/18 (a) | | | 600,000 | | | 673,051 |
UBS AG, 5.750%, 04/25/18 | | | 1,300,000 | | | 1,328,005 |
UBS AG, Series DPNT, 5.875%, 12/20/17 | | | 1,400,000 | | | 1,440,215 |
USB Capital IX, 6.189%, 3/29/495,6 | | | 300,000 | | | 233,250 |
Wachovia Corp., 0.411%, 12/01/09, (12/01/09)4 | | | 4,500,000 | | | 4,500,166 |
Wachovia Corp., 0.414%, 10/15/11, (01/15/10)4 | | | 3,500,000 | | | 3,443,468 |
Wachovia Corp., 5.750%, 02/01/18 | | | 4,400,000 | | | 4,605,810 |
Wachovia Corp., Series MTN, 0.471%, 08/01/13, (02/01/10)4 | | | 300,000 | | | 285,857 |
Wells Fargo & Co., Series K, 7.980%, 02/28/495,6 | | | 21,200,000 | | | 19,954,500 |
Total Financials | | | | | | 284,939,602 |
The accompanying notes are an integral part of these financial statements.
11
Managers Fremont Bond Fund
Schedule of Portfolio Investments (continued)
| | | | | | | |
| | | Principal Amount | | | Value |
Industrials - 6.3% | | | | | | | |
Amgen, Inc., 6.150%, 06/01/18 | | $ | 4,900,000 | | | $ | 5,512,407 |
AstraZeneca PLC, 5.900%, 09/15/17 | | | 800,000 | | | | 898,378 |
AstraZeneca PLC, 6.450%, 09/15/37 | | | 700,000 | | | | 815,219 |
AT&T, Inc., 0.379%, 02/05/10, (02/05/10)4 | | | 1,200,000 | | | | 1,200,554 |
AT&T, Inc., 4.950%, 01/15/13 | | | 1,700,000 | | | | 1,815,591 |
AT&T, Inc., 5.500%, 02/01/18 | | | 1,700,000 | | | | 1,787,523 |
AT&T, Inc., 6.300%, 01/15/38 | | | 1,200,000 | | | | 1,255,087 |
Codelco, Inc., 6.150%, 10/24/36 (a) | | | 300,000 | | | | 302,522 |
Comcast Corp., 5.875%, 02/15/18 | | | 600,000 | | | | 634,481 |
Comcast Corp., 6.450%, 03/15/37 | | | 600,000 | | | | 617,095 |
Corp Nacional del Cobre de Chile, 7.500%, 01/15/19 (a) | | | 1,500,000 | | | | 1,788,039 |
Gaz Capital SA, 6.212%, 11/22/16 (a) | | | 400,000 | | | | 385,520 |
Gaz Capital SA, 8.625%, 04/28/34 | | | 5,500,000 | | | | 6,091,800 |
IBM Corp., 5.700%, 09/14/17 | | | 9,000,000 | | | | 9,954,315 |
NGPL Pipeco LLC, 6.514%, 12/15/12 (a) | | | 1,800,000 | | | | 1,967,832 |
Peabody Energy Corp., 7.875%, 11/01/26 | | | 700,000 | | | | 686,000 |
Petroleos Mexicanos, 8.000%, 05/03/19 | | | 5,100,000 | | | | 5,877,750 |
Philip Morris International, Inc., 5.650%, 05/16/18 | | | 1,000,000 | | | | 1,077,422 |
Qwest Capital Funding, Inc., 7.250%, 02/15/11 | | | 1,813,000 | | | | 1,822,065 |
Ras Laffan Liquefied Natural Gas Co., Ltd, 5.298%, 09/30/20 (a) | | | 900,000 | | | | 915,121 |
Rohm & Haas Holdings, 6.000%, 09/15/17 | | | 1,100,000 | | | | 1,112,385 |
Sonat, Inc., 7.625%, 07/15/11 | | | 1,300,000 | | | | 1,329,229 |
Tennessee Gas Pipeline Co., 7.000%, 10/15/28 | | | 6,145,000 | 2 | | | 6,517,080 |
Time Warner, Inc., 0.684%, 11/13/09, (11/13/09)4 | | | 2,000,000 | | | | 2,000,212 |
Time Warner, Inc., 5.875%, 11/15/16 | | | 1,200,000 | | | | 1,288,244 |
United Airlines, Inc., 10.400%, 11/01/16 | | | 500,000 | 2 | | | 510,000 |
UnitedHealth Group, Inc., 4.875%, 02/15/13 | | | 1,600,000 | | | | 1,671,422 |
Vale Overseas, Ltd., 6.250%, 01/23/17 | | | 500,000 | | | | 523,950 |
Vale Overseas, Ltd., 6.875%, 11/01/36 | | | 500,000 | | | | 504,300 |
Verizon Wireless Capital LLC, 5.250%, 02/01/12 (a) | | | 9,300,000 | | | | 9,942,965 |
Total Industrials | | | | | | | 70,804,508 |
Mortgage-Backed Securities - 7.1% | | | | | | | |
American Home Mortgage Investment Trust, 4.390%, 02/25/45, (12/01/09)4 | | | 757,212 | | | | 610,892 |
Bank of America Funding Corp., 3.442%, 05/25/35 | | | 1,146,279 | | | | 1,122,823 |
Bear Stearns Adjustable Rate Mortgage Trust, 3.442%, 11/25/30 | | | 27,504 | | | | 26,045 |
Bear Stearns Adjustable Rate Mortgage Trust, 5.118%, 04/25/33 | | | 469,861 | | | | 426,045 |
Bear Stearns Adjustable Rate Mortgage Trust, 5.629%, 02/25/33 | | | 110,195 | | | | 108,482 |
Bear Stearns Adjustable Rate Mortgage Trust, Series 2005-2, Class A2, 2.194%, 03/25/35, (12/01/09)4 | | | 8,769,719 | | | | 7,870,312 |
Bear Stearns Adjustable Rate Mortgage Trust, Series 2005-2, Class A1, 2.830%, 03/25/35, (12/01/09)4 | | | 13,207,671 | | | | 11,889,884 |
Bear Stearns Adjustable Rate Mortgage Trust, Series 2005-5, Class A2, 4.550%, 08/25/35, (12/01/09)4 | | | 16,827,622 | | | | 14,982,175 |
Bear Stearns Alt-A Trust, 5.353%, 05/25/355 | | | 1,654,748 | | | | 1,255,854 |
The accompanying notes are an integral part of these financial statements.
12
Managers Fremont Bond Fund
Schedule of Portfolio Investments (continued)
| | | | | | |
| | | Principal Amount | | Value |
Mortgage-Backed Securities - 7.1% (continued) | | | | | | |
Bear Stearns Alt-A Trust, Series 2005-7, Class 22A1, 5.487%, 09/25/355 | | $ | 812,497 | | $ | 548,695 |
Bear Stearns Commercial Mortgage Securities, Series 2007-PW18, Class A4, 5.700%, 06/11/50 | | | 2,800,000 | | | 2,594,162 |
Bear Stearns Mortgage Funding Trust, 0.314%, 02/25/37, (11/25/09)4 | | | 1,051,696 | | | 965,956 |
Citigroup Mortgage Loan Trust, Inc., Series 2005-6, Class A1, 2.510%, 08/25/35, (10/25/10)4 | | | 8,578,691 | | | 8,106,731 |
Citigroup Mortgage Loan Trust, Inc., Series 2005-11, Class 2A1, 4.700%, 12/25/35, (07/25/10)4 | | | 499,006 | | | 459,651 |
Countrywide Alternative Loan Trust, 0.424%, 05/25/47, (11/25/09)4 | | | 1,562,806 | | | 812,238 |
Countrywide Home Loans, Inc., 5.250%, 02/20/36, (09/20/10)4 | | | 531,092 | | | 370,380 |
Greenpoint Mortgage Funding Trust, 0.324%, 10/25/46, (11/25/09)4 | | | 1,077,239 | | | 929,645 |
Greenpoint Mortgage Funding Trust, 0.324%, 01/25/47, (11/25/09)4 | | | 1,168,073 | | | 1,020,033 |
GS Mortgage Securities Corp., 0.334%, 03/06/20, (11/06/09) (a)4 | | | 2,223,170 | | | 2,107,666 |
GSR Mortgage Loan Trust, Series 2005-AR7, Class 6A1, 5.237%, 11/25/355 | | | 1,998,777 | | | 1,799,907 |
Impac Secured Assets Corp, 0.324%, 01/25/37, (11/25/09)4 | | | 290,721 | | | 169,823 |
Indymac Index Mortgage Loan Trust, 0.334%, 11/25/46, (11/25/09)4 | | | 486,857 | | | 444,795 |
IndyMac Index Mortgage Loan Trust, Series 2005-AR31, Class 1A1, 5.210%. 01/25/365 | | | 1,976,185 | | | 1,251,367 |
JPMorgan Mortgage Trust, Series 2005-A1, Class 6T1, 5.014%, 02/25/35 | | | 1,210,059 | | | 1,149,269 |
JPMorgan Chase Commercial Mortgage Securities Corp., Series 2006-LDP9, Class A3, 5.336%, 05/15/47 | | | 2,100,000 | | | 1,894,765 |
Lehman Brothers Floating Rate Commecial Mortgage Trust, 0.325%, 09/15/21, (11/15/09) (a)4 | | | 272,026 | | | 250,805 |
Merrill Lynch Mortgage Investors, Inc., Series 2005-A10, Class A, 0.454%, 02/25/36, (11/25/09)4 | | | 926,834 | | | 636,585 |
MLCC Mortgage Investors, Inc., Series 2005-3, Class 4A, 0.494%, 11/25/35, (11/25/09)4 | | | 247,268 | | | 180,071 |
Morgan Stanley Capital I, Series 2007-IQ16, Class A4, 5.809%, 12/12/49 | | | 3,000,000 | | | 2,718,638 |
Prime Mortgage Trust, 0.644%, 02/25/19, (11/25/09)4 | | | 40,650 | | | 38,471 |
Prime Mortgage Trust, 0.644%, 02/25/34, (11/25/09)4 | | | 263,523 | | | 239,078 |
Structured Asset Mortgage Investments, Inc., 0.905%, 09/19/32, (11/19/09)4 | | | 413,040 | | | 352,026 |
Structured Asset Mortgage Investments, Inc., Series 2005-AR5, Class A2, 0.495%, 07/19/35, (11/19/09)4 | | | 1,018,735 | | | 775,928 |
Structured Asset Securities Corp., 3.384%, 01/25/32 | | | 27,417 | | | 25,533 |
Structured Asset Securities Corp., 3.783%, 10/25/35 (a)5 | | | 1,065,730 | | | 649,082 |
Thornburg Mortgage Securities Trust, 0.354%, 12/25/36, (11/25/09)4 | | | 1,186,653 | | | 1,147,927 |
Wachovia Bank Commercial Mortgage Trust, 0.325%, 06/15/20, (11/15/09) (a)4 | | | 2,547,462 | | | 2,184,193 |
Wachovia Bank Commercial Mortgage Trust, Series 2006-WL7A, Class A1, 0.335%, 09/15/21, (11/15/09) (a)4 | | | 5,643,919 | | | 4,958,955 |
Washington Mutual Mortgage Pass-Through, 1.958%, 11/25/42, (12/01/09)4 | | | 198,315 | | | 132,616 |
Washington Mutual Mortgage Pass-Through, Series 2005-AR13, Class A1A1, 0.534%, 10/25/45, (11/25/09)4 | | | 376,568 | | | 278,345 |
Washington Mutual MSC Mortgage Pass-Through, 3.056%, 02/25/31 | | | 66,451 | | | 56,673 |
Wells Fargo Mortgage Backed Securities Trust, Series 2006-AR2, Class 2A1, 4.950%, 03/25/365 | | | 2,194,321 | | | 1,880,119 |
Total Mortgage-Backed Securities | | | | | | 79,422,640 |
Utilities - 0.6% | | | | | | |
Enel Finance International SA, 6.800%, 09/15/37 (a) | | | 5,800,000 | | | 6,595,273 |
Total Corporate Bonds (cost $488,579,775) | | | | | | 477,279,540 |
The accompanying notes are an integral part of these financial statements.
13
Managers Fremont Bond Fund
Schedule of Portfolio Investments (continued)
| | | | | | |
| | | Principal Amount | | Value |
Foreign Government and Agency Obligations - 0.3% | | | | | | |
Export-Import Bank of China, The, 4.875%, 07/21/15 (a) | | $ | 300,000 | | $ | 319,756 |
Mexico Government International Bond, 6.050%, 01/11/40 | | | 800,000 | | | 807,200 |
Republic of Brazil, 10.250%, 01/10/28 | | R$ | 1,250,000 | | | 711,356 |
Societe Financement de l’Economie Francaise, 0.484%, 07/16/12, (01/18/10) (a)4 | | | 1,000,000 | | | 1,000,000 |
Total Foreign Government and Agency Obligations (cost $2,815,165) | | | | | | 2,838,312 |
U.S. Government and Agency Obligations - 49.7% | | | | | | |
Federal Home Loan Bank - 0.1% | | | | | | |
FHLB, 3.375%, 06/24/11 | | | 1,000,000 | | | 1,039,748 |
Federal Home Loan Mortgage Corporation - 11.3% | | | | | | |
FHLMC, 0.395%, 07/15/19 to 08/15/19, (11/15/09)4 | | | 6,630,654 | | | 6,538,462 |
FHLMC, 0.545%, 05/15/36, (11/15/09)4 | | | 1,389,925 | | | 1,370,923 |
FHLMC, 0.745%, 09/15/30, (11/15/09)4 | | | 53,613 | | | 53,187 |
FHLMC, 1.125%, 06/01/11 | | | 6,000,000 | | | 6,037,740 |
FHLMC, 3.884%, 07/01/30, (07/01/10)4 | | | 3,023 | | | 3,076 |
FHLMC, 3.909%, 11/01/34, (06/01/10)4 | | | 2,260,755 | | | 2,342,199 |
FHLMC, 5.000%, 04/18/17 to 11/01/18 | | | 4,727,340 | | | 5,187,002 |
FHLMC, 5.030%, 08/01/35, (08/01/15)4 | | | 280,779 | | | 295,623 |
FHLMC, 5.250%, 07/18/11 | | | 600,000 | | | 645,516 |
FHLMC, 5.500%, 08/01/37 | | | 2,573,952 | | | 2,715,561 |
FHLMC, 5.500%, TBA | | | 27,800,000 | | | 29,263,837 |
FHLMC, 6.000%, 02/01/16 to 09/01/16 | | | 140,308 | | | 151,238 |
FHLMC, 6.000%, TBA | | | 29,500,000 | | | 31,348,352 |
FHLMC, 6.500%, 01/01/26 to 08/15/31 | | | 8,648,610 | | | 9,388,296 |
FHLMC, 7.000%, 11/15/20 | | | 24,778 | | | 26,535 |
FHLMC, 7.500%, 08/15/30 | | | 339,224 | | | 386,538 |
FHLMC Gold Pool, 4.500%, 02/01/14 | | | 169,029 | | | 174,945 |
FHLMC Gold Pool, 5.000%, TBA | | | 25,000,000 | | | 25,910,150 |
FHLMC Gold Pool, 5.500%, 04/01/37 | | | 3,196,409 | | | 3,372,263 |
FHLMC Gold Pool, 6.000%, 05/01/16 to 02/01/38 | | | 495,851 | | | 528,340 |
FHLMC Structured Pass Through Securities, 2.101%, 02/25/45, (12/01/09)4 | | | 182,108 | | | 172,034 |
Total Federal Home Loan Mortgage Corporation | | | | | | 125,911,817 |
Federal National Mortgage Association - 17.3% | | | | | | |
FNMA, 0.304%, 12/25/36, (11/25/09)4 | | | 952,282 | | | 880,839 |
FNMA, 2.101%, 07/01/44, (11/01/09)4 | | | 335,456 | | | 331,108 |
FNMA, 3.500%, 07/01/11 | | | 181,387 | | | 185,211 |
FNMA, 3.827%, 05/01/36, (11/01/09)4 | | | 1,570,626 | | | 1,564,716 |
FNMA, 4.000%, 05/01/14 | | | 207,431 | | | 213,330 |
FNMA, 4.036%, 05/01/36, (11/01/09)4 | | | 876,726 | | | 881,995 |
FNMA, 4.084%, 05/25/35 | | | 320,840 | | | 327,605 |
FNMA, 4.500%, TBA | | | 5,700,000 | | | 5,922,653 |
FNMA, 4.679%, 09/01/35, (08/01/10)4 | | | 3,250,385 | | | 3,387,664 |
The accompanying notes are an integral part of these financial statements.
14
Managers Fremont Bond Fund
Schedule of Portfolio Investments (continued)
| | | | | | |
| | | Principal Amount | | Value |
Federal National Mortgage Association - 17.3% (continued) | | | | | | |
FNMA, 4.825%, 06/01/35, (06/01/10)4 | | $ | 5,340,696 | | $ | 5,553,956 |
FNMA, 5.000%, 05/01/14 to 03/01/36 | | | 42,038,800 | | | 43,925,626 |
FNMA, 5.000%, TBA | | | 18,000,000 | | | 18,660,942 |
FNMA, 5.021%, 05/01/35, (05/01/15)4 | | | 267,722 | | | 282,462 |
FNMA, 5.500%, 12/01/16 to 03/01/39 | | | 28,292,435 | | | 29,907,278 |
FNMA, 5.500%, TBA | | | 1,900,000 | | | 2,000,046 |
FNMA, 6.000%, 04/01/16 to 01/01/39 | | | 44,066,359 | | | 46,964,246 |
FNMA, 6.000%, TBA | | | 23,500,000 | | | 24,965,084 |
FNMA, 6.500%, 11/01/35 to 04/01/37 | | | 1,019,844 | | | 1,097,404 |
FNMA, 6.500%, TBA | | | 4,800,000 | | | 5,153,251 |
FNMA, 7.200%, 05/25/23 | | | 722,745 | | | 806,406 |
FNMA Whole Loan, 6.500%, 12/25/42 | | | 321,534 | | | 349,083 |
Total Federal National Mortgage Association | | | | | | 193,360,905 |
Government National Mortgage Association - 1.1% | | | | | | |
GNMA, 4.125%, 11/20/24 to 11/20/29, (01/01/10)4 | | | 355,084 | | | 360,661 |
GNMA, 4.375%, 04/20/21, (07/01/10)4 | | | 8,022 | | | 8,232 |
GNMA, 4.375%, 03/20/24, (04/01/10)4 | | | 40,608 | | | 41,508 |
GNMA, 4.625%, 08/20/25, (10/01/10)4 | | | 27,382 | | | 28,214 |
GNMA, 6.000%, TBA | | | 2,000,000 | | | 2,124,064 |
GNMA, 6.500%, 06/20/28 | | | 906,398 | | | 983,538 |
GNMA, 6.750%, 10/16/405 | | | 7,660,874 | | | 8,483,203 |
Total Government National Mortgage Association | | | | | | 12,029,420 |
United States Treasury Securities - 19.9% | | | | | | |
U.S. Treasury Bills, 0.14%, 04/01/107,13 | | | 46,000 | | | 45,976 |
U.S. Treasury Notes, 0.875%, 12/31/107 | | | 300,000 | | | 301,500 |
U.S. Treasury Notes, 0.875%, 02/28/11 | | | 200,000 | | | 200,977 |
U.S. Treasury Notes, 0.875%, 03/31/117 | | | 200,000 | | | 200,953 |
U.S. Treasury Notes, 0.875%, 04/30/117 | | | 1,708,000 | | | 1,715,607 |
U.S. Treasury Notes, 0.875%, 05/31/11 | | | 100,000 | | | 100,418 |
U.S. Treasury Notes, 1.000%, 07/31/117 | | | 11,106,000 | | | 11,162,407 |
U.S. Treasury Notes, 1.000%, 08/31/117 | | | 148,100,000 | | | 148,695,954 |
U.S. Treasury Notes, 1.000%, 09/30/11 | | | 400,000 | | | 401,250 |
U.S. Treasury Notes, 1.125%, 06/30/117 | | | 310,000 | | | 312,362 |
U.S. Treasury Bonds, 3.500%, 02/15/39 | | | 5,300,000 | | | 4,647,443 |
U.S. Treasury Bonds, 4.250%, 05/15/39 | | | 34,900,000 | | | 34,992,729 |
U.S. Treasury Bonds, 4.375%, 02/15/38 | | | 4,500,000 | | | 4,606,880 |
U.S. Treasury Bonds, 4.500%, 05/15/38 to 08/15/39 | | | 5,500,000 | | | 5,747,333 |
U.S. Treasury Bonds, 4.750%, 02/15/37 | | | 1,800,000 | | | 1,952,439 |
U.S. Treasury Bonds, 5.375%, 02/15/31 | | | 5,800,000 | | | 6,741,595 |
Total United States Treasury Securities | | | | | | 221,825,823 |
Total U.S. Government and Agency Obligations (cost $540,809,960) | | | | | | 554,167,713 |
The accompanying notes are an integral part of these financial statements.
15
Managers Fremont Bond Fund
Schedule of Portfolio Investments (continued)
| | | | | | |
| | | Principal Amount | | Value |
Municipal Bonds - 2.0% | | | | | | |
Buckeye Tobacco Settlement Financing Authority (OH), Class A-2, 5.875%, 06/01/30 | | $ | 1,000,000 | | $ | 868,460 |
California State University, Series A, 5.250%, 11/01/38 | | | 500,000 | | | 508,595 |
Chicago Transit Authority, Series A, 6.300%, 12/01/21 | | | 300,000 | | | 323,463 |
Chicago Transit Authority, Series A, 6.899%, 12/01/40 | | | 1,600,000 | | | 1,749,360 |
Chicago Transit Authority, Series B, 6.899%, 12/01/40 | | | 1,700,000 | | | 1,858,695 |
Illinois Municipal Electric Agency Power Supply System Revenue, Series C, 6.832%, 02/01/35 | | | 800,000 | | | 859,696 |
Los Angeles, CA Unified School District, Series A-1, 4.500%, 07/01/22 (FSA Insured)11 | | | 3,600,000 | | | 3,674,664 |
North Carolina Turnpike Authority Revenue, Series B, 6.700%, 01/01/39 | | | 900,000 | | | 948,339 |
Public Power Generation Agency Revenue (NE), Series A, 7.240%, 01/01/41 | | | 1,200,000 | | | 1,212,024 |
State of California, 5.000%, 06/01/32 | | | 2,200,000 | | | 2,063,402 |
State of California, 5.650%, 04/01/39, (04/01/13)4 | | | 1,200,000 | | | 1,255,836 |
State of California, 7.500%, 04/01/34 to 04/01/39 | | | 2,600,000 | | | 2,693,275 |
State of Texas, Transportation Commission Mobility Fund, Series A, 4.750%, 04/01/35 | | | 1,000,000 | | | 1,010,410 |
Truckee Meadows Water Authority (NY), 5.000%, 07/01/36 | | | 200,000 | | | 198,530 |
University of California Revenue, Series R, 6.270%, 05/15/31 | | | 2,500,000 | | | 2,575,825 |
Total Municipal Bonds (cost $20,855,549) | | | | | | 21,800,574 |
| | |
| | | Shares | | |
Municipal Bond Funds - 0.5% | | | | | | |
Dreyfus Municipal Income, Inc. | | | 37,500 | | | 312,000 |
DWS Municipal Income Trust | | | 55,000 | | | 624,250 |
MFS Municipal Income Trust | | | 53,800 | | | 346,472 |
Nuveen Performance Plus Municipal Fund | | | 55,000 | | | 741,400 |
Nuveen Premium Income Municipal Fund II | | | 55,000 | | | 716,100 |
Nuveen Premium Income Municipal Fund IV | | | 55,000 | | | 642,950 |
Nuveen Quality Income Municipal Fund | | | 55,000 | | | 729,300 |
Putnam Municipal Opportunities Trust | | | 33,648 | | | 370,128 |
Van Kampen Advantage Municipal Income Trust II | | | 61,796 | | | 697,059 |
Van Kampen Trust for Investment Grade Municipals | | | 55,000 | | | 745,250 |
Total Municipal Bond Funds (cost $6,544,612) | | | | | | 5,924,909 |
Preferred Stocks - 0.5% | | | | | | |
DG Funding Trust, 0.629%, (12/31/09) (a)4,8 (cost $6,037,773) | | | 573 | | | 5,101,695 |
Short-Term Investments - 30.9% | | | | | | |
Other Investment Companies - 1.5%1 | | | | | | |
BNY Institutional Cash Reserves Fund, Series A, 0.07%3 | | | 10,385,038 | | | 10,385,038 |
BNY Institutional Cash Reserves Fund, Series B*3,10 | | | 643,217 | | | 101,307 |
Dreyfus Cash Management Fund, Institutional Class Shares, 0.13%12 | | | 6,352,906 | | | 6,352,906 |
Total Other Investment Companies | | | | | | 16,839,251 |
The accompanying notes are an integral part of these financial statements.
16
Managers Fremont Bond Fund
Schedule of Portfolio Investments (continued)
| | | | | | | |
| | | Principal Amount | | Value | |
Repurchase Agreements - 29.4% | | | | | | | |
JPMorgan Chase & Co., dated 10/30/09, due 11/03/09, 0.11%, total to be received $84,000,257 (secured by $85,840,000 Cash Management Bills, 1.000%, 07/15/10) | | $ | 84,000,000 | | $ | 84,000,000 | |
JPMorgan Chase & Co., dated 10/30/09, due 11/03/09, 0.10%, total to be received $81,500,226 (secured by $83,163,000 U.S. Treasury Bills, 0.257%, 02/25/10) | | | 81,500,000 | | | 81,500,000 | |
JPMorgan Chase & Co., dated 10/29/09, due 11/02/09, 0.07%, total to be received $83,900,489 (secured by $86,481,850 U.S. Treasury Inflation Indexed Bonds, 2.375%, 01/15/25) | | | 83,900,000 | | | 83,900,000 | |
JPMorgan Chase & Co., dated 10/29/09, due 11/02/09, 0.07%, total to be received $78,400,457 (secured by $80,205,000 U.S. Treasury Bills, 0.364%, 08/26/10) | | | 78,400,000 | | | 78,400,000 | |
Total Repurchase Agreements | | | | | | 327,800,000 | |
Total Short-Term Investments
(cost $345,181,161) | | | | | | 344,639,251 | |
Total Investments - 126.7%
(cost $1,410,823,995) | | | | | | 1,411,751,994 | |
Other Assets, less Liabilities - (26.7)% | | | | | | (297,588,127 | ) |
Net Assets - 100.0% | | | | | $ | 1,114,163,867 | |
Note: Based on the cost of investments of $1,411,216,804 for Federal income tax purposes at October 31, 2009, the aggregate gross unrealized appreciation and depreciation were $34,607,217 and $34,072,027, respectively, resulting in net unrealized appreciation of investments of $535,190.
| * | Non-income-producing security. |
| (a) | Security exempt from registration under Rule 144A of the Securities Act of 1933. This security may be resold in transactions exempt from registration, normally to qualified buyers. At October 31, 2009, the value of these securities amounted to $106,133,298, or 9.5% of net assets. |
| 1 | Yield shown for each investment company listed represents the October 31, 2009, seven-day average yield, which refers to the sum of the previous seven days’ dividends paid, expressed as an annual percentage. |
| 2 | Some or all of these securities, amounting to a market value of $10,732,377, or 1.0% of net assets, were out on loan to various brokers. |
| 3 | Collateral received from brokers for securities lending was invested in this short-term investment. |
| 4 | Floating Rate Security. The rate listed is as of October 31, 2009. Date in parentheses represents the security’s next coupon rate reset. |
| 5 | Variable Rate Security. The rate listed is as of October 31, 2009 and is periodically reset subject to terms and conditions set forth in the debenture. |
| 6 | Perpetuity Bond. The date shown is the final call date. |
| 7 | Some or all of this security is held as collateral for futures contracts, amounting to a market value of $3,137,244, or 0.3% of net assets. |
| 8 | Illiquid Security. A security not readily convertible into cash such as a stock, bond or commodity that is not actively traded and would be difficult to sell in a current sale. The Fund may not invest more than 15% of its net assets in illiquid securities. |
| 9 | Security is in default. Issuer has failed to make a timely payment of either principal or interest or has failed to comply with some provision of the bond indenture. |
| 10 | On September 12, 2008, The Bank of New York Mellon established a separate sleeve of the BNY Institutional Cash Reserves Fund (Series B) to hold certain Lehman Brothers floating rate notes. The Fund’s position in Series B is being marked to market daily. |
| 11 | At October 31, 2009, 2.3% of the securities in the portfolio were backed by insurance of financial institutions and financial guaranty assurance agencies. |
| 12 | Collateral received from brokers for swap contracts in the amount of $5,860,263, was invested in this short-term investment. |
| 13 | Yield shown represents yield to maturity at October 31, 2009. |
Investment Definitions and Abbreviations:
| | |
| EMTN: | | European Medium Term Note |
| |
| FDIC: | | Federal Deposit Insurance Corp. |
| |
| FHLB: | | Federal Home Loan Bank |
| |
| FHLMC: | | Federal Home Loan Mortgage Corp. |
| |
| FNMA: | | Federal National Mortgage Association |
| |
| FSA: | | Financial Security Assurance |
| |
| GNMA: | | Government National Mortgage Association |
| |
| MTN: | | Medium Term Note |
| |
| TBA: | | To Be Announced |
Abbreviations have been used throughout the portfolio to indicate amounts shown in currencies other than the U.S. dollar (USD):
| | |
| R$: | | Brazilian Real |
| |
| £: | | British Pound |
| |
| €: | | Euro |
The accompanying notes are an integral part of these financial statements.
17
Managers Fremont Bond Fund
Statement of Assets and Liabilities
October 31, 2009
| | | |
Assets: | | | |
Investments at value* (including securities on loan valued at $10,732,377) | | $ | 1,411,751,994 |
Foreign currency** | | | 3,126,246 |
Receivable for delayed delivery investments sold | | | 145,988,524 |
Receivable for investments sold | | | 40,996 |
Receivable for Fund shares sold | | | 4,579,590 |
Unrealized appreciation on swaps | | | 5,142,046 |
Variation margin receivable | | | 742,514 |
Unrealized appreciation on foreign currency contracts | | | 290,037 |
Dividends, interest and other receivables | | | 7,266,207 |
Prepaid expenses | | | 36,556 |
Total assets | | | 1,578,964,710 |
Liabilities: | | | |
Payable for investments purchased | | | 165,500,000 |
Payable to brokers upon termination of swap contracts | | | 5,857,262 |
Payable for delayed delivery investments purchased | | | 238,546,895 |
Payable for TBA sale commitments | | | 39,266,408 |
Payable for Fund shares repurchased | | | 1,671,457 |
Payable upon return of securities loaned | | | 11,028,255 |
Options written (premiums received $2,550,510) | | | 806,649 |
Variation margin payable | | | 492 |
Unrealized depreciation on swaps | | | 611,006 |
Unrealized depreciation on foreign currency contracts | | | 368,803 |
Dividends payable to shareholders | | | 365,473 |
Accrued expenses: | | | |
Investment advisory and management fees | | | 240,375 |
Administrative fees | | | 187,003 |
Other | | | 350,765 |
Total liabilities | | | 464,800,843 |
Net Assets | | $ | 1,114,163,867 |
Shares outstanding | | | 105,022,041 |
Net asset value, offering and redemption price per share | | $ | 10.61 |
Net Assets Represent: | | | |
Paid-in capital | | $ | 1,088,699,726 |
Undistributed net investment income | | | 4,372,366 |
Accumulated net realized gain from investments, options, futures, swaps, foreign currency contracts and translations | | | 10,196,498 |
Net unrealized appreciation of investments, options, futures, swaps, foreign currency contracts and translations | | | 10,895,277 |
Net Assets | | $ | 1,114,163,867 |
* Investments at cost | | $ | 1,410,823,995 |
** Foreign currency at cost | | $ | 3,123,155 |
The accompanying notes are an integral part of these financial statements.
18
Managers Fremont Bond Fund
Statement of Operations
For the fiscal year ended October 31, 2009
| | | | |
Investment Income: | | | | |
Interest income | | $ | 42,595,507 | |
Dividend income | | | 820,793 | |
Securities lending fees | | | 23,744 | |
Total investment income | | | 43,440,044 | |
Expenses: | | | | |
Investment advisory and management fees | | | 3,987,329 | |
Administrative fees | | | 2,492,080 | |
Transfer agent fees | | | 399,824 | |
Professional fees | | | 305,742 | |
Custodian fees | | | 245,230 | |
Reports to shareholders | | | 133,058 | |
Trustees fees and expenses | | | 105,313 | |
Registration fees | | | 64,445 | |
Insurance | | | 52,678 | |
Miscellaneous | | | 15,960 | |
Total expenses before offsets | | | 7,801,659 | |
Expense reimbursements | | | (1,512,408 | ) |
Fee waivers | | | (498,416 | ) |
Expense reductions | | | (7,969 | ) |
Net expenses | | | 5,782,866 | |
Net investment income | | | 37,657,178 | |
Net Realized and Unrealized Gain (Loss): | | | | |
Net realized gain on investments, options, futures, and swap transactions | | | 49,221,068 | |
Net realized gain on foreign currency contracts and translations | | | (1,416 | ) |
Net unrealized appreciation of investments, options, futures, swaps, foreign currency contracts and translations | | | 103,136,316 | |
Net realized and unrealized gain | | | 152,355,968 | |
Net increase in net assets resulting from operations | | $ | 190,013,146 | |
The accompanying notes are an integral part of these financial statements.
19
Managers Fremont Bond Fund
Statement of Changes in Net Assets
For the fiscal years ended October 31,
| | | | | | | | |
| | | 2009 | | | 2008 | |
Increase (Decrease) in Net Assets From Operations: | | | | | | | | |
Net investment income | | $ | 37,657,178 | | | $ | 53,229,700 | |
Net realized gain on investments, options, futures, swaps, foreign currency contracts and translations | | | 49,219,652 | | | | 60,687,064 | |
Net unrealized appreciation (depreciation) of investments, options, futures, swaps, foreign currency contracts and translations | | | 103,136,316 | | | | (113,536,012 | ) |
Net increase in net assets resulting from operations | | | 190,013,146 | | | | 380,752 | |
Distributions to Shareholders: | | | | | | | | |
From net investment income | | | (49,075,351 | ) | | | (58,764,642 | ) |
From net realized gain on investments | | | (69,131,312 | ) | | | — | |
Total distributions to shareholders | | | (118,206,663 | ) | | | (58,764,642 | ) |
From Capital Share Transactions: | | | | | | | | |
Proceeds from the sale of shares | | | 384,079,754 | | | | 442,971,996 | |
Reinvestment of dividends | | | 104,726,190 | | | | 54,573,251 | |
Cost of shares repurchased | | | (482,953,055 | ) | | | (609,729,159 | ) |
Net increase (decrease) from capital share transactions | | | 5,852,889 | | | | (112,183,912 | ) |
Total increase (decrease) in net assets | | | 77,659,372 | | | | (170,567,802 | ) |
Net Assets: | | | | | | | | |
Beginning of year | | | 1,036,504,495 | | | | 1,207,072,297 | |
End of year | | $ | 1,114,163,867 | | | $ | 1,036,504,495 | |
End of year undistributed net investment income | | $ | 4,372,366 | | | $ | 3,739,280 | |
| | | | | | | | |
Share Transactions: | | | | | | | | |
Sale of shares | | | 38,751,647 | | | | 41,903,295 | |
Shares issued in connection with reinvestment of dividends | | | 11,025,577 | | | | 5,209,779 | |
Shares repurchased | | | (50,015,482 | ) | | | (57,793,808 | ) |
Net decrease in shares | | | (238,258 | ) | | | (10,680,734 | ) |
The accompanying notes are an integral part of these financial statements.
20
Managers Fremont Bond Fund
Financial Highlights
For a share outstanding throughout each fiscal year
| | | | | | | | | | | | | | | | | | | | |
| | | For the fiscal year ended October 31, | |
| | | 2009 | | | 2008 | | | 2007 | | | 2006 | | | 2005 | |
Net Asset Value, Beginning of Year | | $ | 9.85 | | | $ | 10.41 | | | $ | 10.31 | | | $ | 10.31 | | | $ | 10.79 | |
Income from Investment Operations: | | | | | | | | | | | | | | | | | | | | |
Net investment income | | | 0.49 | | | | 0.57 | | | | 0.47 | | | | 0.47 | | | | 0.37 | |
Net realized and unrealized gain (loss) on investments | | | 1.44 | | | | (0.61 | ) | | | 0.13 | | | | (0.00 | )3 | | | (0.17 | ) |
Total from investment operations | | | 1.93 | | | | (0.04 | ) | | | 0.60 | | | | 0.47 | | | | 0.20 | |
Less Distributions to Shareholders from: | | | | | | | | | | | | | | | | | | | | |
Net investment income | | | (0.49 | ) | | | (0.52 | ) | | | (0.50 | ) | | | (0.47 | ) | | | (0.35 | ) |
Net realized gain on investments | | | (0.68 | ) | | | — | | | | — | | | | — | | | | (0.33 | ) |
Total distributions to shareholders | | | (1.17 | ) | | | (0.52 | ) | | | (0.50 | ) | | | (0.47 | ) | | | (0.68 | ) |
Net Asset Value, End of Year | | $ | 10.61 | | | $ | 9.85 | | | $ | 10.41 | | | $ | 10.31 | | | $ | 10.31 | |
Total Return 1 | | | 20.62 | % | | | (0.60 | )% | | | 5.96 | % | | | 4.75 | % | | | 2.00 | % |
Ratio of net operating expenses to average net assets | | | 0.58 | % | | | 0.58 | % | | | 0.60 | % | | | 0.60 | % | | | 0.60 | % |
Ratio of net investment income to average net assets 1 | | | 3.78 | % | | | 4.47 | % | | | 4.86 | % | | | 4.72 | % | | | 3.43 | % |
Portfolio turnover | | | 531 | % | | | 431 | % | | | 249 | % | | | 244 | % | | | 392 | % |
Net assets at end of year (000’s omitted) | | $ | 1,114,164 | | | $ | 1,036,504 | | | $ | 1,207,072 | | | $ | 1,163,251 | | | $ | 971,130 | |
| | | | | | | | | | | | | | | | | | | | |
Ratios absent expense offsets: 2 | | | | | | | | | | | | | | | | | | | | |
Ratio of total expenses to average net assets | | | 0.78 | % | | | 0.75 | % | | | 0.77 | % | | | 0.77 | % | | | 0.72 | % |
Ratio of net investment income to average net assets | | | 3.58 | % | | | 4.30 | % | | | 4.69 | % | | | 4.55 | % | | | 3.31 | % |
| | | | | | | | | | | | | | | | | | | | |
| 1 | Total returns and net investment income would have been lower had certain expenses not been reduced. (See Note 1(c) of Notes to Financial Statements.) |
| 2 | Excludes the impact of expense reimbursements or fee waivers and expense reductions such as brokerage credits, but includes non-reimbursable expenses, if any, such as interest and taxes. (See Note 1(c) of Notes to Financial Statements.) |
| 3 | Rounds to less than ($0.01) per share. |
21
Managers Fremont Bond Fund
Notes to Financial Statements
October 31, 2009
1. Summary of Significant Accounting Policies
Managers Trust I (the “Trust”) is an open-end management investment company organized as a Massachusetts business trust and registered under the Investment Company Act of 1940, as amended (the “1940 Act”). Currently, the Trust is comprised of a number of investment series. Included in this report is the Managers Fremont Bond Fund (the “Fund”).
The Fund’s financial statements are prepared in accordance with accounting principles generally accepted in the United States of America, which require management to make estimates and assumptions that affect the reported amounts of assets and liabilities and disclosure of contingent assets and liabilities at the date of the financial statements and the reported amounts of income and expenses during the reporting periods. Actual results could differ from those estimates and such differences could be material. The following is a summary of significant accounting policies followed by the Fund in the preparation of its financial statements:
a. Valuation of Investments
Equity securities traded on a domestic or international securities exchange are valued at the last quoted sale price, or, lacking any sales, at the last quoted bid price. Over-the-counter securities are valued at the Nasdaq Official Closing Price, if one is available. Lacking any sales, over-the-counter securities are valued at the last quoted bid price. The Fund’s investments are generally valued based on market quotations provided by the third-party pricing services approved by the Board of Trustees of the Fund. Under certain circumstances, the value of certain Fund investments may be based on an evaluation of its fair value, pursuant to procedures established by and under the general supervision of the Board of Trustees of the Fund. The Fund may use the fair value of a portfolio security to calculate its NAV when, for example, (1) market quotations are not readily available because a portfolio security is not traded in a public market or the principal market in which the security trades is closed, (2) trading in a portfolio security is suspended and has not resumed before the Fund calculates its NAV, (3) a significant event affecting the value of a portfolio security is determined to have occurred between the time of the market quotation provided for a portfolio security and the time as of which the Fund calculates its NAV, (4) a security’s price has remained unchanged over a period of time (often referred to as a “stale price”), or (5) Managers Investment Group LLC (the “Investment Manager”) determines that a market quotation is inaccurate. Portfolio investments that trade primarily on foreign markets are priced based upon the market quotation of such securities as of the close of their respective principal markets, as adjusted to reflect the Investment Manager’s determination of the impact of events occurring subsequent to the close of such markets but prior to the time as of which the Fund calculates its NAV. In accordance with procedures approved by the Board of Trustees, the Investment Manager relies upon recommendations of a third-party fair valuation service in adjusting the prices of such foreign portfolio investments. The Fund may invest in securities that may be thinly traded. The Board of Trustees has adopted procedures to adjust prices when thinly traded securities are judged to be stale so that they reflect fair value. An investment valued on the basis of its fair value may be valued at a price higher or lower than available market quotations. An investment’s valuation may differ depending on the method used and the factors considered in determining value according to the Fund’s fair value procedures.
Fixed-income securities are valued based on valuations furnished by independent pricing services that utilize matrix systems, which reflect such factors as security prices, yields, maturities, and ratings, and are supplemented by dealer and exchange quotations. Futures contracts for which market quotations are readily available are valued at the settlement price as of the close of the futures exchange. Short-term investments having a remaining maturity of 60 days or less are valued at amortized cost, which approximates market value. Investments in other regulated investment companies are valued at their end of day net asset value per share. Investments in certain mortgage-backed and stripped mortgage-backed securities, preferred stocks, convertible securities, derivatives and other debt securities not traded on an organized securities market are valued on the basis of valuations provided by dealers or by a pricing service which uses information with respect to transactions in such securities and various relationships between securities and yield to maturity in determining value. Securities (including derivatives) for which market quotations are not readily available are valued at fair value, as determined in good faith, and pursuant to procedures adopted by the Board of Trustees of the Trust. The values assigned to fair value investments are based on available information and do not necessarily represent amounts that might ultimately be realized, since such amounts depend on future developments inherent in long-term investments. Further, because of the inherent uncertainty of valuation, those estimated values may differ significantly from the values that would have been used had a ready market for the investments existed, and the differences could be material.
Generally Accepted Accounting Principles (GAAP) define fair value as the price that a Fund would receive to sell an asset or pay to transfer a liability in an orderly transaction between market participants at the measurement date. GAAP also establishes a framework for measuring fair value, and a three-level hierarchy for fair value measurements based upon the transparency of inputs to the valuation of an asset or liability. Inputs may be observable or unobservable and refer broadly to the assumptions that market participants would use in pricing the asset or liability. Observable inputs reflect the assumptions market participants would use in pricing the asset or liability based on market data obtained from sources independent of the Fund. Unobservable inputs reflect the Fund’s own assumptions about the assumptions that market participants would use in pricing the asset or liability developed based on the best information available in the circumstances. Each investment is assigned a level based upon the observability of the inputs which are significant to the overall valuation.
22
Managers Fremont Bond Fund
Notes to Financial Statements (continued)
The three-tier hierarchy of inputs is summarized below:
Level 1 – quoted prices in active markets for identical investments
Level 2 – other significant observable inputs (including quoted prices for similar investments, interest rates, prepayment speeds, credit risk)
Level 3 – significant unobservable inputs (including the Fund’s own assumptions in determining the fair value of investments)
The inputs or methodologies used for valuing investments are not necessarily an indication of the risk associated with investing in those investments. The following table summarizes the inputs used to value the Fund’s net assets by the above fair value hierarchy levels as of October 31, 2009:
| | | | | | | | | | | |
| | | Level 1 | | Level 2 | | Level 3 | | Total |
Fremont Bond | | | | | | | | | | | |
Investments in Securities | | | | | | | | | | | |
Corporate Bonds | | | | | | | | | | | |
Asset-Backed Securities | | | — | | $ | 35,517,517 | | — | | $ | 35,517,517 |
Financials | | | — | | | 284,939,602 | | — | | | 284,939,602 |
Industrials | | | — | | | 70,804,508 | | — | | | 70,804,508 |
Mortgage-Backed Securities | | | — | | | 79,422,640 | | — | | | 79,422,640 |
Utilities | | | — | | | 6,595,273 | | — | | | 6,595,273 |
Foreign Government and Agency Obligations | | | — | | | 2,838,312 | | — | | | 2,838,312 |
U.S. Government and Agency Obligations | | | | | | | | | | | |
Federal Home Loan Bank | | | — | | | 1,039,748 | | — | | | 1,039,748 |
Federal Home Loan Mortgage Corporation | | | — | | | 125,911,817 | | — | | | 125,911,817 |
Federal National Mortgage Association | | | — | | | 193,360,905 | | — | | | 193,360,905 |
Government National Mortgage Association | | | — | | | 12,029,420 | | — | | | 12,029,420 |
United States Treasury Securities | | | — | | | 221,825,823 | | — | | | 221,825,823 |
Municipal Bonds | | | — | | | 21,800,574 | | — | | | 21,800,574 |
Municipal Bond Funds | | $ | 5,924,909 | | | — | | | | | 5,924,909 |
Preferred Stocks | | | — | | | 5,101,695 | | — | | | 5,101,695 |
Short-Term Investments | | | | | | | | | | | |
Other Investment Companies | | | 16,737,944 | | | 101,307 | | — | | | 16,839,251 |
Repurchase Agreements | | | — | | | 327,800,000 | | — | | | 327,800,000 |
| | | | | | | | | | | |
Total Investments in Securities | | | 22,662,853 | | | 1,389,089,141 | | — | | | 1,411,751,994 |
Other Financial Instruments* | | | 4,177,420 | | | 6,131,855 | | — | | | 10,309,275 |
| | | | | | | | | | | |
Totals | | $ | 26,840,273 | | $ | 1,395,220,996 | | — | | $ | 1,422,061,269 |
| | | | | | | | | | | |
| * | Other financial instruments are derivative instruments not reflected in the Schedule of Portfolio Investments, such as futures, forwards, options, and swap contracts, which are valued at the unrealized appreciation/depreciation of the instrument. |
23
Managers Fremont Bond Fund
Notes to Financial Statements (continued)
The fair values of derivative instruments at October 31, 2009, were as follows:
| | | | | | | | | | |
| | | Asset Derivatives | | Liability Derivatives |
Derivatives not accounted for as hedging
instruments | | Statement of Assets and Liabilities
Location | | Fair Value | | Statement of Assets and Liabilities
Location | | Fair Value |
Credit contracts | | Unrealized appreciation on swap contracts | | $ | 275,640 | | Unrealized depreciation on swap contracts | | $ | 103,701 |
Interest rate contracts | | Unrealized appreciation on swap contracts | | | 4,866,406 | | Unrealized depreciation on swap contracts | | | 507,305 |
Interest rate contracts | | — | | | — | | Options written on Treasuries | | | 806,649 |
Interest rate contracts | | Variation margin receivable on futures contracts* | | | 742,514 | | Variation margin payable on futures contracts* | | | 492 |
Foreign exchange contracts | | Unrealized appreciation of foreign currency contracts | | | 290,037 | | Unrealized depreciation of foreign currency contracts | | | 368,803 |
| | | | | | | | | | |
Totals | | | | $ | 6,174,597 | | | | $ | 1,786,950 |
| | | | | | | | | | |
| * | Includes only the current day’s variation margin. Prior variation margin movements have been reflected in cash on the Statement of Assets and Liabilities upon receipt or payment. |
For the fiscal year ended October 31, 2009, the effect of derivative instruments on the Statement of Operations and the amount of realized gain/(loss) on derivatives recognized in income were as follows:
| | | | | | | | | | | | | | | | | | | | |
Derivatives not accounted for as hedging instruments | | Futures | | | Forward Currency
Contracts | | | Options | | | Swaps | | | Total | |
Credit contracts | | | — | | | | — | | | | — | | | $ | (1,056,205 | ) | | $ | (1,056,205 | ) |
Foreign exchange contracts | | | — | | | $ | 616,335 | | | | — | | | | — | | | | 616,335 | |
Interest rate contracts | | $ | 40,001,114 | | | | — | | | $ | (11,865,534 | ) | | | (23,692,335 | ) | | | 4,443,245 | |
| | | | | | | | | | | | | | | | | | | | |
Totals | | $ | 40,001,114 | | | $ | 616,335 | | | $ | (11,865,534 | ) | | $ | (24,748,540 | ) | | $ | 4,003,375 | |
| | | | | | | | | | | | | | | | | | | | |
|
| The change in unrealized gain/(loss) on derivatives recognized in income were as follows: | |
| | | | | |
Derivatives not accounted for as hedging instruments | | Futures | | | Forward Currency
Contracts | | | Options | | | Swaps | | | Total | |
Credit contracts | | | — | | | | — | | | | — | | | $ | 1,499,777 | | | $ | 1,499,777 | |
Foreign exchange contracts | | | — | | | $ | (1,015,310 | ) | | | — | | | | — | | | | (1,015,310 | ) |
Interest rate contracts | | $ | (24,352,508 | ) | | | — | | | $ | 602,239 | | | | 11,576,977 | | | | (12,173,292 | ) |
| | | | | | | | | | | | | | | | | | | | |
Totals | | $ | (24,352,508 | ) | | $ | (1,015,310 | ) | | $ | 602,239 | | | $ | 13,076,754 | | | $ | (11,688,825 | ) |
| | | | | | | | | | | | | | | | | | | | |
Open derivatives as of October 31, 2009, which is also indicative of activity for the year ended October 31, 2009, can be found in the Notes to Financial Statements.
24
Managers Fremont Bond Fund
Notes to Financial Statements (continued)
b. Security Transactions
Security transactions are accounted for as of the trade date. Realized gains and losses on securities sold are determined on the basis of identified cost.
c. Investment Income and Expenses
Dividend income is recorded on the ex-dividend date except certain dividends from foreign securities where the ex-dividend date may have passed. These dividends are recorded as soon as the Trust is informed of the ex-dividend date. Dividend income on foreign securities is recorded net of any withholding tax. Interest income, which includes amortization of premium and accretion of discount on debt securities, as required, is accrued as earned. Non-cash dividends included in dividend income, if any, are reported at the fair market value of the securities received. Other income and expenses are recorded on an accrual basis. Expenses that cannot be directly attributed to a fund are apportioned among the Funds in the Trust and in some cases other affiliated funds based upon their relative average net assets or number of shareholders.
The Fund has a “balance credit” arrangement with The Bank of New York Mellon (formerly The Bank of New York) (“BNYM”), the Fund’s custodian, whereby the Fund is credited with an interest factor equal to 0.75% below the effective 90-day T-Bill rate for account balances left uninvested overnight. If the T-Bill rate falls below 0.75%, no credits will be earned. These credits serve to reduce custody expenses that would otherwise be charged to the Fund. For the fiscal year ended October 31, 2009, the custodian expense was reduced by $1,177.
Overdrafts will cause a reduction of any earnings credits, computed at 2% above the Federal funds rate on the day of the overdraft. For the fiscal year ended October 31, 2009, overdraft fees equaled $1,239.
The Trust also has a balance credit arrangement with its Transfer Agent, PNC Global Investment Servicing (U.S.) Inc., whereby earnings credits are used to offset banking charges and other out-of-pocket expenses. For the fiscal year ended October 31, 2009, the transfer agent expense was reduced by $6,792.
Total returns and net investment income for the Fund would have been lower had certain expenses not been offset. Total expenses before offsets exclude the impact of expense reimbursements or fee waivers and expense offsets such as brokerage recapture credits, but include non-reimbursable expenses, if any, such as interest and taxes.
d. Dividends and Distributions
Dividends resulting from net investment income, if any, normally will be declared daily and paid monthly. Distributions of capital gains, if any, will be made on an annual basis and when required for Federal excise tax purposes. Income and capital gain distributions are determined in accordance with Federal income tax regulations, which may differ from GAAP. These differences are primarily due to differing treatments for losses deferred due to wash sales, equalization accounting for tax purposes, foreign currency, options, futures and market discount transactions. Permanent book and tax basis differences, if any, relating to shareholder distributions will result in reclassifications to paid-in capital. The tax character of distributions paid during the fiscal years ended October 31, 2009 and 2008 were as follows:
| | | | | | |
Distributions paid from: | | 2009 | | 2008 |
Ordinary income | | $ | 49,075,351 | | $ | 58,764,642 |
Short-term capital gains | | | 47,684,315 | | | — |
Long-term capital gains | | | 21,446,997 | | | — |
| | | | | | |
| | $ | 118,206,663 | | $ | 58,764,642 |
| | | | | | |
As of October 31, 2009, the components of distributable earnings (excluding unrealized appreciation/depreciation) on a tax basis consisted of:
| | | |
Capital loss carryforward | | | — |
Undistributed ordinary income | | $ | 5,520,034 |
Undistributed short-term capital gains | | | 14,260,699 |
Undistributed long-term capital gains | | | — |
e. Federal Taxes
The Fund intends to comply with the requirements under Subchapter M of the Internal Revenue Code of 1986, as amended, to distribute substantially all of its taxable income and gains to its shareholders and to meet certain diversification and income requirements with respect to investment companies. Therefore, no provision for Federal income or excise tax is included in the accompanying financial statements.
Additionally, based on the Fund’s understanding of the tax rules and rates related to income, gains and transactions for the foreign jurisdictions in which it invests, the Fund will provide for foreign taxes, and where appropriate, deferred foreign taxes.
Management has analyzed the Fund’s tax positions taken on federal income tax returns for all open tax years (tax years ended October 31, 2006-2009), and has concluded that no provision for federal income tax is required in the Fund’s financial statements. Additionally, the Fund is not aware of any tax position for which it is reasonably possible that the total amounts of unrecognized tax benefits will change materially in the next twelve months.
25
Managers Fremont Bond Fund
Notes to Financial Statements (continued)
f. Capital Stock
The Trust’s Declaration of Trust authorizes for each series the issuance of an unlimited number of shares of beneficial interest, without par value. The Fund records sales and repurchases of its capital stock on the trade date. The cost of securities contributed to the Fund in connection with the issuance of shares is based on the valuation of those securities in accordance with the Fund’s policy on investment valuation. Dividends and distributions to shareholders are recorded on the ex-dividend date.
At October 31, 2009, certain unaffiliated shareholders of record, specifically omnibus accounts, individually held greater than 10% of the outstanding shares of the Fund as follows: 2 collectively own 39%. Transactions by these shareholders may have a material impact on the Fund.
g. Repurchase Agreements
The Fund may enter into repurchase agreements provided that the value of the underlying collateral, including accrued interest, will equal or exceed the value of the repurchase agreement during the term of the agreement. The underlying collateral for all repurchase agreements is held in safekeeping by the Fund’s custodian or at the Federal Reserve Bank. If the seller defaults and the value of the collateral declines, or if bankruptcy proceedings commence with respect to the seller of the security, realization of the collateral by the Fund may be delayed or limited. At October 31, 2009, the market value of repurchase agreements outstanding was $327,800,000.
h. Foreign Currency Translation
The books and records of the Fund are maintained in U.S. dollars. The value of investments, assets and liabilities denominated in currencies other than U.S. dollars are translated into U.S. dollars based upon current foreign exchange rates. Purchases and sales of foreign investments, income and expenses are converted into U.S. dollars based on currency exchange rates prevailing on the respective dates of such transactions. Net realized and unrealized gain (loss) on foreign currency transactions represent: (1) foreign exchange gains and losses from the sale and holdings of foreign currencies; (2) gains and losses between trade date and settlement date on investment securities transactions and forward foreign currency exchange contracts; and (3) gains and losses from the difference between amounts of interest and dividends recorded and the amounts actually received.
The Fund does not isolate the net realized and unrealized gain or loss resulting from changes in exchange rates from the fluctuations in market prices of securities held. Such fluctuations are included with the net realized and unrealized gain or loss on investments.
i. Securities Transacted on a When Issued Basis
The Fund may enter into To Be Announced (“TBA”) sale commitments to hedge its portfolio positions or to sell mortgage-backed securities it owns under delayed delivery arrangements. Proceeds of TBA sale commitments are not received until the contractual settlement date. During the time a TBA sale commitment is outstanding, equivalent deliverable securities, or an offsetting TBA purchase commitment deliverable on or before the sale commitment date, are held as “cover” for the transaction. Unsettled TBA sale commitments are valued at the current market value of the underlying securities according to the procedures described under “Valuation of Investments,” in footnote 1a above. Each contract is marked-to-market daily and the change in market value is recorded by the Fund as an unrealized gain or loss. If the TBA sale commitment is closed through the acquisition of an offsetting purchase commitment, the Fund realizes a gain or loss. If the Fund delivers securities under the commitment, the Fund realizes a gain or a loss from the sale of the securities based upon the unit price established at the date the commitment was entered into.
TBA sale commitments outstanding at October 31, 2009 were as follows:
| | | | | | |
Principal/Share
Amount | | Security | | Current Liability |
| $ | 7,200,000 | | FNMA, 5.000%, 11/15/24 | | $ | 7,585,877 |
| | 30,000,000 | | FNMA, 5.000%, 11/15/34 | | | 31,101,570 |
| | 550,000 | | FNMA, 5.500%, 11/15/37 | | | 578,961 |
2. Agreements and Transactions with Affiliates
The Trust has entered into an Investment Management Agreement dated January 15, 2005, under which the Investment Manager, an independently managed subsidiary of Affiliated Managers Group, Inc. (“AMG”), provides or oversees investment management services to the Fund. The Investment Manager selects subadvisors for the Fund (subject to Trustee approval) and monitors each subadvisor’s investment programs and results. The Fund’s investment portfolio is managed by a portfolio manager who serves pursuant to a subadvisory agreement with the Investment Manager.
Investment management fees are paid directly by the Fund to the Investment Manager based on average daily net assets. The annual investment management fee rate, as a percentage of average daily net assets for the fiscal year ended October 31, 2009, was 0.40%.
The Trust has entered into an Administration and Shareholder Servicing Agreement under which the Investment Manager serves as the Fund’s administrator (the “Administrator”) and is responsible
26
Managers Fremont Bond Fund
Notes to Financial Statements (continued)
for all aspects of managing the Fund’s operations, including administration and shareholder services to the Fund, its shareholders, and certain institutions, such as bank trust departments, broker-dealers and registered investment advisers, that advise or act as an intermediary with the Fund’s shareholders. For its services, the Administrator is paid a fee at a rate of 0.25% per annum. For the fiscal year ended October 31, 2009, the Administrator voluntarily agreed to waive 0.05% of its fee amounting to $498,416. During the fiscal year ended October 31, 2009, the Fund paid administration fees of $1,993,664, net of waivers.
Effective June 9, 2008, the Investment Manager has contractually agreed, through at least March 1, 2010, to limit net annual fund operating expenses (exclusive of brokerage costs, acquired fund fees and expenses, interest, taxes and extraordinary expenses) to 0.58% of average daily net assets of the Fund.
The Fund is obligated to repay the Investment Manager such amounts waived, paid or reimbursed in future years provided that the repayment occurs within thirty-six (36) months after the waiver or reimbursement and that such repayment would not cause the Fund’s expenses in any such year to exceed the previously stated expense limitation percentage of the Fund’s average daily net assets. For the fiscal year ended October 31, 2009, the Fund made no such repayments to the Investment Manager. At October 31, 2009, the cumulative amount of expense reimbursement by the Investment Manager subject to repayment by the Fund equaled $3,967,446.
The aggregate annual retainer paid to each Independent Trustee is $65,000, plus $4,000 or $2,500 for each regular or special meeting attended, respectively. The Trustees’ fees and expenses are allocated amongst all of the Funds for which the Investment Manager serves as the advisor (the “Managers Funds”) based on the relative net assets of such Funds. The Independent Chairman of the Trusts receives an additional payment of $15,000 per year. The Chairman of the Audit Committee receives an additional payment of $5,000 per year. The “Trustees fees and expenses” shown in the financial statements represents the Fund’s allocated portion of the total fees and expenses paid by the Fund and other affiliated funds in the Managers Funds.
The Funds are distributed by Managers Distributors, Inc. (“MDI”), a wholly-owned subsidiary of the Investment Manager. MDI serves as the principal underwriter for each Fund and is a registered broker-dealer and member of the Financial Industry Regulatory Authority, Inc. (“FINRA”). Shares of each Fund will be continuously offered and will be sold by brokers, dealers or other financial intermediaries who have executed selling agreements with MDI. MDI bears all the expenses of providing services pursuant to the Underwriting Agreement, including the payment of the expenses relating to the distribution of Prospectuses for sales purposes and any advertising or sales literature. Certain Trustees and Officers of the Funds are Officers and/or Directors of the Investment Manager, AMG and/or MDI.
On June 23, 2009, the Securities and Exchange Commission granted an exemptive order that permits the Fund to lend and borrow money for certain temporary purposes directly to and from other eligible Funds in the Managers Family of Funds (the “Fund Family”). Participation in this interfund lending program is voluntary for both borrowing and lending Funds, and an interfund loan is only made if it benefits each participating Fund. The Investment Manager administers the program according to procedures approved by the Funds’ Board of Trustees (the “Board”), and the Board monitors the operation of the program. An interfund loan must comply with certain conditions set out in the exemptive order, which are designed to assure fairness and protect all participating Funds. For the period from June 23, 2009 through October 31, 2009, the Fund either borrowed from or lent to other Funds in the Fund Family as follows: the Fund lent $6,971,873 for 3 days earning interest of $337; the interest amount can be found in the Statement of Operations in Interest income.
3. Purchases and Sales of Securities
Purchases and sales of securities, excluding short-term securities, for the fiscal year ended October 31, 2009, were $9,892,575,201 and $10,523,157,496, respectively. Purchases and sales of U.S. Government securities for the fiscal year ended October 31, 2009, were $9,653,731,669 and $10,150,246,321, respectively.
27
Managers Fremont Bond Fund
Notes to Financial Statements (continued)
4. Portfolio Securities Loaned
The Fund may participate in a securities lending program offered by BNYM, providing for the lending of securities to qualified brokers. Securities lending fees include earnings of such temporary cash investments, plus or minus any rebate to a borrower. These earnings (after any rebate) are then divided between BNYM, as a fee for its services under the program, and the Fund, according to agreed-upon rates. Collateral on all securities loaned is accepted in cash and/or government securities and is maintained at a minimum level of 102% (105% in the case of certain foreign securities) of the market value, plus interest, if applicable, of investments on loan. It is the Fund’s policy to obtain additional collateral from or return excess collateral to the borrower by the end of the next business day, following the valuation date of the securities loaned. Therefore, the value of the collateral held may be temporarily less than the value of the securities on loan. Lending securities entails a risk of loss to the Fund if and to the extent that the market value of the securities loaned were to increase and the borrower did not increase the collateral accordingly, and the borrower fails to return the securities. The Fund bears the risk of any deficiency in the amount of the collateral available for return to the borrower due to any loss on the collateral invested. Collateral received in the form of cash is invested temporarily in the BNY Institutional Cash Reserves Fund (the “ICRF”), or other short-term investments as defined in the Securities Lending Agreement with BNYM.
In September 2008, BNYM advised the Investment Manager that the ICRF had exposure to certain defaulted debt obligations, and that BNYM had established separate sleeves of the ICRF to hold these securities. The net impact of these positions is not material to the Fund. The Fund’s position in the separate sleeves of the ICRF Fund is included in the Schedule of Investments and the unrealized loss on such investment is included in Net Unrealized Depreciation on the Statement of Assets and Liabilities and Statement of Operations.
5. Commitments and Contingencies
In the normal course of business, the Fund may enter into contracts and agreements that contain a variety of representations and warranties, which provide general indemnifications. The maximum exposure to the Fund under these arrangements is unknown, as this would involve future claims that may be made against the Fund that have not yet occurred. However, based on experience, the Fund expects the risk of loss to be remote.
6. Forward Commitments
Certain transactions, such as futures and forward transactions, dollar roll agreements, or purchases of when-issued or delayed delivery securities may have a similar effect on the Fund’s net asset value as if the Fund had created a degree of leverage in its portfolio. However, if the Fund enters into such a transaction, the Fund will establish a segregated account with its custodian in which it will maintain cash, U.S. government securities or other liquid securities equal in value to its obligations in respect to such transaction. Securities and other assets held in the segregated account may not be sold while the transaction is outstanding, unless other suitable assets are substituted.
7. Futures Contracts
The Fund may purchase or sell futures contracts to achieve a desired level of investment, whether to accommodate portfolio turnover or cash flows from capital shares transactions. There are certain risks associated with futures contracts. Prices may not move as expected or the Fund may not be able to close out the contract when it desires to do so, resulting in losses.
Futures are valued at their quoted daily settlement prices. The aggregate principal amounts of the contracts are not recorded in the financial statements. Daily fluctuations in the value of the contracts are recorded in the Statement of Assets and Liabilities as an asset (liability) and in the Statement of Operations as unrealized appreciation (depreciation) until the contracts are closed, when they are recorded as realized gains (losses) on futures or forward currency contracts.
At October 31, 2009, the Fund had the following open futures contracts:
| | | | | | | | | | |
Type | | Number of
Contracts | | Position | | Expiration
Date | | Unrealized
Gain/(Loss) | |
3-Month Eurodollar | | 1,932 | | Long | | 12/14/09-
12/14/10 | | $ | 3,545,176 | |
3-Month Euro Euribor | | 69 | | Long | | 12/14/09-
03/15/10 | | | 174,663 | |
3-Month Pound Sterling | | 124 | | Long | | 12/16/09-
12/15/10 | | | 331,364 | |
2-Year U.S. Treasury Note | | 570 | | Long | | 12/31/09 | | | 196,547 | |
5-Year U.S. Treasury Note | | 9 | | Long | | 12/31/09 | | | 14,906 | |
10-Year U.S. Treasury Note | | 387 | | Long | | 12/21/09 | | | (149,516 | ) |
Total | | | | | | | | $ | 4,113,140 | |
8. Interest Rate Caps, Swap Contracts and Options
The Fund may enter into over-the-counter transactions involving interest rate caps, swap contracts, or purchased and written (sold) options to enter into such contracts, in order to manage interest rate risk. In an interest rate cap agreement, one party agrees to make payments only under specified circumstances, usually in return for payment of a fee by the other party. An interest rate cap entitles the purchaser, to the extent that a specified index exceeds a predetermined interest rate, to receive payments of interest on a notional principal amount from the party selling such interest rate cap. Swap contracts represent an agreement between counterparties to exchange cash flows based on the difference between two rates applied to a notional principal amount for a specified period. The most common type of interest rate swap involves the exchange of fixed-rate cash flows for variable-rate cash flows. Swaps do not involve the exchange of principal between the parties. Purchased options on swap contracts (“swaptions”) give the holder the right, but not the obligation, to enter into a swap contract with the counterparty which has written the option on a date, at an interest rate, and with a notional amount as specified in the swaption agreement. If the counterparty to the swap transaction defaults, the Fund will be limited to contractual remedies pursuant to the agreements governing the transaction. There is no assurance that
28
Managers Fremont Bond Fund
Notes to Financial Statements (continued)
swap or swaption contract counterparties will be able to meet their obligations under the contracts or that, in the event of default, the Fund will succeed in pursuing contractual remedies. The Fund may thus assume the risk that payments owed the Fund under a swap or swaption contract will be delayed, or not received at all. During the term of the swap agreement or swaption, unrealized gains or losses are recorded as a result of “marking to market.” When the swap agreement or swaption is terminated, the Fund will record a realized gain or loss equal to the difference between the proceeds from (or cost of) the closing transaction and the Fund’s basis in the contract, if any. Accrued interest and interest paid are recognized as unrealized and realized gain (loss), respectively. In each of the written contracts, the Fund pays a premium, to the counterparty, in return for the swaption. These swaptions may be exercised by entering into a swap contract with the counterparty only on the date specified in each contract. The Fund holds zero coupon swaps in which one party makes regular payments while the other party makes one lump sum payment, typically at the end of the contract. The Fund also sold credit protection through credit default swaps. Under the terms of the swaps, the seller of the credit protection receives a periodic payment amount (premium) from the buyer that is a fixed percentage amount applied to a notional principal amount.
In return, the seller agrees to pay the buyer the notional amount and take delivery of a debt instrument of the reference issuer of the same notional par amount if the reference entity is subject to a credit event (such as bankruptcy, failure to pay, or obligation acceleration) during the term of the swap.
A written option contract is a contract in which the writer of the option grants the buyer of the option the right to purchase from (call option) or sell to (put option) the writer a designated instrument at a specified price within a specified period of time. Options written (sold) are recorded as liabilities. When an option expires, the premium (original option value) is realized as a gain if the option was written or as a loss if the option was purchased. When the exercise of an option results in a cash settlement, the difference between the premium and the settlement proceeds is recognized as realized gain or loss. When securities are acquired or delivered upon exercise of an option, the acquisition cost or sale proceeds are adjusted by the amount of the premium. When an option is closed, the difference between the premium and the cost to close the position is realized as a gain or loss.
At October 31, 2009, the Fund had the following open swap contracts:
| | | | | | | | | | | | | | |
Pay | | Receive | | Counterparty | | Maturity | | Notional Amount | | | Unrealized
Gain/(Loss) | |
Interest Rate Swaps | | | | | | | | | | | | | | |
3-Month AUD-BBR-BBSW | | Fixed Rate 4.500% | | DUB | | 06/15/11 | | A$ | 40,800,000 | | | $ | (358,678 | ) |
6-Month AUD-BBR-BBSW | | Fixed Rate 6.000% | | UAG | | 09/15/12 | | A$ | 15,300,000 | | | | (20,454 | ) |
6-Month EUR-EURIBOR-Reuters | | Fixed Rate 4.500% | | BPS | | 03/18/14 | | € | 2,200,000 | | | | 252,332 | |
6-Month France CPI Excl. Tobacco Index | | Fixed Rate 2.103% | | BRC | | 10/15/10 | | € | 3,900,000 | | | | 215,089 | |
6-Month France CPI Excl. Tobacco Index | | Fixed Rate 2.146% | | UAG | | 10/15/10 | | € | 1,000,000 | | | | 56,709 | |
6-Month GBP-LIBOR-BBA | | Fixed Rate 5.000% | | GLM | | 09/17/13 | | £ | 500,000 | | | | 62,507 | |
6-Month GBP-LIBOR-BBA | | Fixed Rate 5.000% | | HUS | | 09/17/13 | | £ | 2,900,000 | | | | 362,539 | |
6-Month GBP-LIBOR-BBA | | Fixed Rate 5.000% | | DUB | | 03/18/14 | | £ | 3,100,000 | | | | 400,580 | |
6-Month GBP-LIBOR-BBA | | Fixed Rate 5.000% | | DUB | | 03/18/14 | | £ | 9,000,000 | | | | 1,162,973 | |
6-Month GBP-LIBOR-BBA | | Fixed Rate 5.250% | | RYL | | 03/18/14 | | £ | 1,500,000 | | | | 219,226 | |
6-Month GBP-LIBOR-BBA | | Fixed Rate 5.250% | | GLM | | 03/18/14 | | £ | 600,000 | | | | 87,690 | |
6-Month GBP-LIBOR-BBA | | Fixed Rate 6.000% | | GLM | | 12/19/09 | | £ | 2,400,000 | | | | 25,367 | |
3-Month USD-LIBOR-BBA | | Fixed Rate 3.000% | | RYL | | 02/04/11 | | $ | 11,900,000 | | | | 336,466 | |
3-Month USD-LIBOR-BBA | | Fixed Rate 3.450% | | RYL | | 08/05/11 | | $ | 5,400,000 | | | | 224,090 | |
3-Month USD-LIBOR-BBA | | Fixed Rate 3.600% | | RYL | | 07/07/11 | | $ | 16,100,000 | | | | 694,332 | |
3-Month USD-LIBOR-BBA | | Fixed Rate 4.000% | | RYL | | 12/16/14 | | $ | 2,700,000 | | | | 158,066 | |
Credit Default Swaps | | | | | | | | | | | | | | |
American International Group, Inc. | | Fixed Rate 5.000% | | JPM | | 09/20/16 | | $ | 800,000 | | | $ | (78,884 | ) |
Federative Republic of Brazil Bond | | Fixed Rate 1.520% | | MYC | | 01/20/17 | | $ | 3,000,000 | | | | 6,615 | |
Federative Republic of Brazil Bond | | Fixed Rate 1.950% | | MYC | | 08/20/16 | | $ | 3,500,000 | | | | 102,399 | |
General Electric Capital Corp. | | Fixed Rate 1.000% | | BPS | | 09/20/10 | | $ | 5,600,000 | | | | (19,936 | ) |
General Electric Capital Corp. | | Fixed Rate 5.000% | | DUB | | 12/20/09 | | $ | 6,000,000 | | | | 31,190 | |
General Electric Capital Corp. | | Fixed Rate 5.000% | | JPM | | 09/20/11 | | $ | 2,000,000 | | | | 124,153 | |
Republic of Panama Bond | | Fixed Rate 1.250% | | JPM | | 01/20/17 | | $ | 200,000 | | | | (4,881 | ) |
CDX.NA.HY.12 | | Fixed Rate 5.000% | | DUB | | 06/20/14 | | $ | (188,000 | ) | | | 11,283 | |
29
Managers Fremont Bond Fund
Notes to Financial Statements (continued)
| | | | | | | | | | | | | |
Pay | | Receive | | Counterparty | | Maturity | | Notional Amount | | Unrealized
Gain/(Loss) | |
| | | | | |
Zero Coupon Swaps | | | | | | | | | | | | | |
Brazil Interbank Deposit Rate | | Fixed Rate 10.575% | | UAG | | 01/02/12 | | R$ | 6,700,000 | | $ | (110,825 | ) |
Brazil Interbank Deposit Rate | | Fixed Rate 10.600% | | JPM | | 01/02/12 | | R$ | 600,000 | | | (3,622 | ) |
Brazil Interbank Deposit Rate | | Fixed Rate 10.600% | | BRC | | 01/02/12 | | R$ | 900,000 | | | (5,434 | ) |
Brazil Interbank Deposit Rate | | Fixed Rate 10.610% | | HUS | | 01/02/12 | | R$ | 1,400,000 | | | (8,292 | ) |
Brazil Interbank Deposit Rate | | Fixed Rate 11.360% | | BRC | | 01/04/10 | | R$ | 5,500,000 | | | 8,971 | |
Brazil Interbank Deposit Rate | | Fixed Rate 11.430% | | MLC | | 01/04/10 | | R$ | 3,600,000 | | | 9,391 | |
Brazil Interbank Deposit Rate | | Fixed Rate 11.465% | | GLM | | 01/04/10 | | R$ | 1,400,000 | | | 4,318 | |
Brazil Interbank Deposit Rate | | Fixed Rate 11.980% | | MLC | | 01/02/12 | | R$ | 5,800,000 | | | 50,754 | |
Brazil Interbank Deposit Rate | | Fixed Rate 12.410% | | UAG | | 01/04/10 | | R$ | 2,800,000 | | | 42,646 | |
Brazil Interbank Deposit Rate | | Fixed Rate 12.540% | | UAG | | 01/02/12 | | R$ | 3,400,000 | | | 56,803 | |
Brazil Interbank Deposit Rate | | Fixed Rate 12.540% | | BRC | | 01/02/12 | | R$ | 3,400,000 | | | 56,803 | |
Brazil Interbank Deposit Rate | | Fixed Rate 12.540% | | MLC | | 01/02/12 | | R$ | 7,300,000 | | | 121,959 | |
Brazil Interbank Deposit Rate | | Fixed Rate 12.670% | | MYC | | 01/04/10 | | R$ | 2,800,000 | | | 43,720 | |
Brazil Interbank Deposit Rate | | Fixed Rate 12.780% | | MYC | | 01/04/10 | | R$ | 5,000,000 | | | 101,716 | |
Brazil Interbank Deposit Rate | | Fixed Rate 12.948% | | MLC | | 01/04/10 | | R$ | 2,100,000 | | | 47,839 | |
Brazil Interbank Deposit Rate | | Fixed Rate 14.765% | | HUS | | 01/02/12 | | R$ | 300,000 | | | 12,704 | |
Brazil Interbank Deposit Rate | | Fixed Rate 14.765% | | MLC | | 01/02/12 | | R$ | 1,200,000 | | | 50,816 | |
| | | | |
Total | | | | | | | | | | | $ | 4,531,040 | |
| | | | | | | | | | | | | |
| | | | | | |
| A$: Australian Dollar | | £: British Pound | | $: U.S. Dollar | | |
| R$: Brazilian Real | | €: Euro | | | | |
| | | |
| BPS: BNP Paribas | | GLM: Goldman Sachs | | MLC: Merrill Lynch | | RYL: Royal Bank of Scotland |
| BRC: Barclays Bank | | HUS: HSBC Bank | | MYC: Morgan Stanley | | UAG: UBS |
| DUB: Deutsche Bank | | JPM: JPMorgan Chase | | | | |
As of October 31, 2009, the Fund paid and received premiums of $27,620,334 and $27,331,921, respectively, on open swap contracts. At October 31, 2009, the unrealized appreciation (excluding premiums) on open swap contracts was $4,242,627.
The table that follows shows the undiscounted maximum potential amount of future payments by the Fund related to selling credit protection in credit default swaps:
| | | | | | | | | |
Type of reference asset on which the Fund sold protection | | Maximum potential amount of future payments(undiscounted) for selling credit protection | | Amount
Recoverable* | | Reference asset
rating range** |
Investment Grade Corporate Debt | | | | $ | 14,400,000 | | — | | Aa2 to A3 |
Investment Grade Sovereign Debt | | | | | 6,500,000 | | — | | Baa3 |
Non-Investment Grade Sovereign Debt | | | | | 200,000 | | — | | Ba1 |
| | | | | | | | | |
Totals | | | | $ | 21,100,000 | | — | | |
| | | | | | | | | |
| * | The Fund has no amounts recoverable from related purchased protection. In addition, the Fund has no recourse provisions under the credit derivatives and holds no collateral which can offset or reduce potential payments under a triggering event. |
| ** | The period end reference asset security ratings are included in the equivalent Moody’s rating category. The reference asset rating represents the likelihood of a potential credit event on the reference asset which would result in a related payment by the Fund. |
30
Managers Fremont Bond Fund
Notes to Financial Statements (continued)
At October 31, 2009, the following written put and call options and swaptions were outstanding:
| | | | | | | | | | | |
Name | | Number of
Contracts/Par | | Exercise
Price | | | Expiration
Date | | Unrealized
Gain/Loss | |
3-Month USD-LIBOR-BBA (Put) | | 15,000,000 | | 3.00 | % | | 11/23/09 | | $ | 91,372 | |
3-Month USD-LIBOR-BBA (Put) | | 2,800,000 | | 3.25 | % | | 04/19/10 | | | (10,349 | ) |
3-Month USD-LIBOR-BBA (Put) | | 2,800,000 | | 3.25 | % | | 04/19/10 | | | (8,808 | ) |
3-Month USD-LIBOR-BBA (Put) | | 77,700,000 | | 3.42 | % | | 11/23/09 | | | 89,614 | |
3-Month USD-LIBOR-BBA (Put) | | 31,000,000 | | 3.42 | % | | 11/23/09 | | | 334,128 | |
3-Month USD-LIBOR-BBA (Put) | | 7,000,000 | | 4.00 | % | | 11/23/09 | | | 73,387 | |
3-Month USD-LIBOR-BBA (Put) | | 2,000,000 | | 4.00 | % | | 11/23/09 | | | 20,168 | |
3-Month USD-LIBOR-BBA (Put) | | 2,800,000 | | 4.25 | % | | 04/19/10 | | | 16,075 | |
3-Month USD-LIBOR-BBA (Put) | | 2,800,000 | | 4.25 | % | | 04/19/10 | | | 15,235 | |
3-Month USD-LIBOR-BBA (Put) | | 6,700,000 | | 4.25 | % | | 12/29/09 | | | 15,330 | |
3-Month USD-LIBOR-BBA (Put) | | 600,000 | | 4.35 | % | | 11/23/09 | | | 3,360 | |
3-Month USD-LIBOR-BBA (Put) | | 1,800,000 | | 4.35 | % | | 11/23/09 | | | 8,267 | |
3-Month USD-LIBOR-BBA (Put) | | 2,000,000 | | 5.00 | % | | 04/19/10 | | | 7,625 | |
3-Month USD-LIBOR-BBA (Put) | | 25,000,000 | | 5.00 | % | | 06/15/10 | | | 265,392 | |
3-Month USD-LIBOR-BBA (Put) | | 28,000,000 | | 5.50 | % | | 08/31/10 | | | 217,417 | |
3-Month USD-LIBOR-BBA (Put) | | 29,000,000 | | 5.50 | % | | 08/31/10 | | | 163,820 | |
3-Month USD-LIBOR-BBA (Put) | | 45,000,000 | | 5.50 | % | | 08/31/10 | | | 265,454 | |
3-Month USD-LIBOR-BBA (Put) | | 7,500,000 | | 6.00 | % | | 08/18/10 | | | 36,919 | |
3-Month USD-LIBOR-BBA (Put) | | 2,000,000 | | 6.00 | % | | 08/31/10 | | | 5,140 | |
3-Month USD-LIBOR-BBA (Put) | | 11,600,000 | | 6.00 | % | | 08/31/10 | | | 54,193 | |
3-Month USD-LIBOR-BBA (Put) | | 2,900,000 | | 6.00 | % | | 08/31/10 | | | 13,322 | |
3-Month USD-LIBOR-BBA (Put) | | 1,000,000 | | 6.00 | % | | 08/31/10 | | | 2,520 | |
10-Year U.S. Treasury Notes (Put) | | 136 | | 112 | | | 12/24/09 | | | 7,957 | |
10-Year U.S. Treasury Notes (Put) | | 88 | | 115 | | | 11/20/09 | | | 53,155 | |
10-Year U.S. Treasury Notes (Call) | | 68 | | 119 | | | 11/20/09 | | | 3,018 | |
10-Year U.S. Treasury Notes (Call) | | 95 | | 120 | | | 12/24/09 | | | (9,175 | ) |
10-Year U.S. Treasury Notes (Call) | | 20 | | 121 | | | 11/20/09 | | | 9,325 | |
| | | | | | | | | | | |
Total | | | | | | | | | $ | 1,743,861 | |
| | | | | | | | | | | |
31
Managers Fremont Bond Fund
Notes to Financial Statements (continued)
Transactions in written put and call options and swaptions for the fiscal year ended October 31, 2009, were as follows:
| | | | | | | |
| | | Number of Contracts/Par | | | Amount of Premiums | |
Options outstanding at October 31, 2008 | | 150,500,436 | | | $ | 4,385,034 | |
Options written | | 381,001,129 | | | | 3,398,529 | |
Options exercised/expired | | (224,501,158 | ) | | | (5,233,052 | ) |
| | | | | | | |
Options outstanding at October 31, 2009 | | 307,000,407 | | | $ | 2,550,510 | |
| | | | | | | |
9. Forward Foreign Currency Contracts
During the fiscal year ended October 31, 2009, the Fund invested in forward foreign currency exchange contracts to manage currency exposure. These investments may involve greater market risk than the amounts disclosed in the Fund’s financial statements.
A forward foreign currency exchange contract is an agreement between a Fund and another party to buy or sell a currency at a set price at a future date. The market value of the contract will fluctuate with changes in currency exchange rates. The contract is marked-to-market daily, and the change in market value is recorded as an unrealized gain or loss. Gain or loss on the purchase or sale of contracts having the same settlement date, amount and counterparty is realized on the date of offset, otherwise gain or loss is realized on the settlement date.
The Fund may invest in non-U.S. dollar denominated instruments subject to limitations, and enter into forward foreign currency exchange contracts to facilitate transactions in foreign securities and to hedge against foreign currency exchange rate risk on its non-U.S. dollar denominated investment securities. Risks may arise upon entering into these contracts from the potential inability of counterparties to meet the terms of their contracts and from unanticipated movements in the value of a foreign currency relative to the U.S. dollar.
Open forward foreign currency exchange contracts (in U.S. Dollars) at October 31, 2009, were as follows:
| | | | | | | | | | | | | | |
Foreign Currency | | Settlement Date | | Contract Value
(Receivable) | | Contract Value
(Payable) | | Unrealized
Gain/Loss | |
Australian Dollar | | Short | | 11/05/09 | | $ | 79,614 | | $ | 77,377 | | $ | 2,237 | |
Australian Dollar | | Long | | 11/30/09 | | | 2,707,964 | | | 2,755,406 | | | (47,442 | ) |
Brazilian Real | | Long | | 02/02/10 | | | 6,204,839 | | | 6,029,686 | | | 175,153 | |
Canadian Dollar | | Long | | 12/10/09 | | | 1,187,590 | | | 1,204,887 | | | (17,297 | ) |
Chinese Yuan Renminbi | | Long | | 03/29/10-08/25/10 | | | 7,458,248 | | | 7,588,000 | | | (129,752 | ) |
Euro | | Short | | 11/19/09 | | | 11,051,623 | | | 11,108,958 | | | (57,335 | ) |
Euro | | Long | | 11/19/09 | | | 2,943,160 | | | 2,966,380 | | | (23,220 | ) |
Indonesian Rupiah | | Long | | 10/07/10 | | | 1,324,511 | | | 1,300,000 | | | 24,511 | |
Japanese Yen | | Short | | 11/24/09 | | | 2,819,480 | | | 2,841,454 | | | (21,974 | ) |
Japanese Yen | | Long | | 11/17/09 | | | 417,067 | | | 419,439 | | | (2,372 | ) |
Malaysian Ringgit | | Short | | 11/12/09 | | | 191,454 | | | 189,265 | | | 2,189 | |
Malaysian Ringgit | | Long | | 11/12/09-06/14/10 | | | 1,938,360 | | | 1,914,270 | | | 24,090 | |
Pound Sterling | | Short | | 11/24/09 | | | 8,013,185 | | | 8,047,445 | | | (34,260 | ) |
Singapore Dollar | | Long | | 11/18/09 | | | 419,005 | | | 407,000 | | | 12,005 | |
South Korean Won | | Short | | 11/18/09-11/27/09 | | | 1,027,139 | | | 1,031,817 | | | (4,678 | ) |
South Korean Won | | Long | | 11/18/09-08/27/10 | | | 3,753,466 | | | 3,737,144 | | | 16,322 | |
New Taiwan Dollar | | Long | | 11/16/09 | | | 409,057 | | | 406,000 | | | 3,057 | |
| | | | | | | | | | | | | | |
Totals | | | | | | $ | 51,945,762 | | $ | 52,024,528 | | $ | (78,766 | ) |
| | | | | | | | | | | | | | |
32
Managers Fremont Bond Fund
Notes to Financial Statements (continued)
10. Risks Associated with Collateralized Mortgage Obligations (“CMOs”)
The net asset value of the Fund may be sensitive to interest rate fluctuations because the Fund may hold several instruments, including CMOs and other derivatives, whose values can be significantly impacted by interest rate movements. CMOs are obligations collateralized by a portfolio of mortgages or mortgage-related securities. Payments of principal and interest on the mortgage are passed through to the holder of the CMOs on the same schedule as they are received, although certain classes of CMOs have priority over others with respect to the receipt of prepayments on the mortgages.
Therefore, the investment in CMOs may be subject to a greater or lesser risk of prepayment than other types of mortgage-related securities. CMOs may have a fixed or variable rate of interest.
11. Dollar Roll Transactions
The Fund may enter into dollar rolls in which it sells debt securities for delivery currently and simultaneously contracts to repurchase similar, but not identical, securities at the same price or a lower price on an agreed date. The Fund receives compensation as consideration for entering into the commitment to repurchase. The compensation is the difference between the current sale price and the forward price for the future price (often referred to as the “drop”) as well as the interest earned on the cash proceeds of the initial sale. The Fund may also be compensated by the receipt of a commitment fee. As the holder, the counterparty receives all principal and interest payments, including prepayments, made with respect to the similar security. Dollar rolls may be renewed with a new sale and repurchase price with a cash settlement made at renewal without physical delivery of the securities subject to the contract.
Certain risks may arise upon entering into dollar rolls from the potential inability of counterparties to meet the terms of their commitments. Additionally, the value of such securities may change adversely before the Fund is able to repurchase them. There can be no assurance that the Fund’s use of the cash that it receives from a dollar roll will provide a return that exceeds its costs.
12. Subsequent Events
The Fund has determined that no additional material events or transactions occurred subsequent to October 31, 2009, and through December 22, 2009, the date of the issuance of the Fund’s financial statements, which require additional disclosure in the Fund’s financial statements.
Tax Information (unaudited)
The Fund hereby designates the maximum amount allowable of its net taxable income as qualified dividends as provided in the Jobs and Growth Tax Relief Reconciliation Act of 2003. The 2009 Form 1099-DIV you receive for the Fund will show the tax status of all distributions paid to you during the year.
Pursuant to section 852 of the Internal Revenue Code, Managers Fremont Bond hereby designates $0 as a capital gain distribution with respect to the taxable year ended October 31, 2009, or if subsequently determined to be different, the net capital gains of such year.
33
Report of Independent Registered Public Accounting Firm
To the Board of Trustees of Managers Trust I and the Shareholders of Managers Fremont Bond Fund:
In our opinion, the accompanying statement of assets and liabilities, including the schedule of portfolio investments, and the related statements of operations and of changes in net assets and the financial highlights present fairly, in all material respects, the financial position of Managers Fremont Bond Fund (one of the series constituting Managers Trust I, hereafter referred to as the “Fund”) at October 31, 2009, the results of its operations for the year then ended, the changes in its net assets for each of two years in the period then ended and the financial highlights for the each of the five years in the period then ended, in conformity with accounting principles generally accepted in the United States of America. These financial statements and financial highlights (hereafter referred to as “financial statements”) are the responsibility of the Fund’s management; our responsibility is to express an opinion on these financial statements based on our audits. We conducted our audits of these financial statements in accordance with the standards of the Public Company Accounting Oversight Board (United States). Those standards require that we plan and perform the audit to obtain reasonable assurance about whether the financial statements are free of material misstatement. An audit includes examining, on a test basis, evidence supporting the amounts and disclosures in the financial statements, assessing the accounting principles used and significant estimates made by management, and evaluating the overall financial statement presentation. We believe that our audits, which included confirmation of securities at October 31, 2009 by correspondence with the custodian and brokers, provide a reasonable basis for our opinion.
PricewaterhouseCoopers LLP
Philadelphia, Pennsylvania
December 22, 2009
34
Trustees and Officers
The Trustees and Officers of the Trust, their business addresses, principal occupations for the past five years and dates of birth are listed below. The Trustees provide broad supervision over the affairs of the Trust and the Funds. The Trustees are experienced executives who meet periodically throughout the year to oversee the Funds’ activities, review contractual arrangements with companies that provide services to the Funds, and review the Funds’ performance. Unless otherwise noted, the address of each Trustee or Officer is the address of the Trust: 800 Connecticut Avenue, Norwalk, Connecticut 06854.
There is no stated term of office for Trustees. Trustees serve until their resignation, retirement or removal in accordance with the Trust’s organizational documents and policies adopted by the Board from time to time. The Chairman of the Trustees, President, Treasurer and Secretary of the Trust are elected by the Trustees annually. Other officers hold office at the pleasure of the Trustees.
Independent Trustees
The following Trustees are not “interested persons” of the Trust within the meaning of the 1940 Act:
| | |
Name, Date of Birth, Number of Funds Overseen in Fund Complex* | | Principal Occupation(s) During Past 5 Years and Other Directorships Held by Trustee |
| |
Jack W. Aber, 9/9/37 • Trustee since 2000 • Oversees 34 Funds in Fund Complex | | Professor of Finance, Boston University School of Management (1972-Present); Trustee of Appleton Growth Fund (1 portfolio); Trustee of Third Avenue Trust (5 portfolios); Trustee of Third Avenue Variable Trust (1 portfolio). |
| |
William E. Chapman, II, 9/23/41 • Independent Chairman • Trustee since 2000 • Oversees 34 Funds in Fund Complex | | President and Owner, Longboat Retirement Planning Solutions (1998-Present); Hewitt Associates, LLC (part time) (provider of Retirement and Investment Education Seminars); Trustee of Bowdoin College (2002-Present); Director of Harding, Loevner Funds, Inc. (6 portfolios); Trustee of Third Avenue Trust (5 portfolios); Trustee of Third Avenue Variable Trust (1 portfolio). |
| |
Edward J. Kaier, 9/23/45 • Trustee since 2000 • Oversees 34 Funds in Fund Complex | | Attorney at Law and Partner, Teeters Harvey Gilboy & Kaier LLP (2007-Present); Attorney at Law and Partner, Hepburn Willcox Hamilton & Putnam, LLP (1977-2007); Trustee of Third Avenue Trust (5 portfolios); Trustee of Third Avenue Variable Trust (1 portfolio). |
| |
Steven J. Paggioli, 4/3/50 • Trustee since 2000 • Oversees 34 Funds in Fund Complex | | Consultant (2001-Present); Formerly Executive Vice President and Director, The Wadsworth Group (1986- 2001); Executive Vice President, Secretary and Director, Investment Company Administration, LLC (1990-2001); Vice President, Secretary and Director, First Fund Distributors, Inc. (1991-2001); Trustee, Professionally Managed Portfolios (22 portfolios); Advisory Board Member, Sustainable Growth Advisors, LP; Independent Director, Chase Investment Counsel (2008 – Present). |
| |
Eric Rakowski, 6/5/58 • Trustee since 2000 • Oversees 34 Funds in Fund Complex | | Professor, University of California at Berkeley School of Law (1990-Present); Director of Harding, Loevner Funds, Inc. (6 portfolios); Trustee of Third Avenue Trust (5 portfolios); Trustee of Third Avenue Variable Trust (1 portfolio). |
| |
Thomas R. Schneeweis, 5/10/47 • Trustee since 2000 • Oversees 34 Funds in Fund Complex | | Professor of Finance, University of Massachusetts (1977-Present); Director, CISDM at the University of Massachusetts, (1996-Present); President, Alternative Investment Analytics, LLC, (formerly Schneeweis Partners, LLC) (2001-Present); Partner, White Bear Partners, LLC (2007-Present); Partner, Schneeweis Capital Management, LLC (2007-Present); Partner, Schneeweis Associates, LLC (2007-Present); Partner, Northampton Capital Management, LLC (2004-Present); Partner, TRS Associates (2007-Present). |
| * | The Fund Complex consists of Managers AMG Funds, The Managers Funds, Managers Trust I and Managers Trust II. |
Interested Trustees
The following Trustees are “interested persons” of the Trust within the meaning of the 1940 Act. Mr. Dalton is an interested person by virtue of his positions with, and interest in securities of, Affiliated Managers Group, Inc. and his position with Managers Distributors, Inc. Mr. Streur is an interested person by virtue of his positions with Managers Investment Group LLC.
| | |
Name, Date of Birth, Number of Funds Overseen in Fund Complex* | | Principal Occupation(s) During Past 5 Years and Other Directorships Held by Trustee |
| |
Nathaniel Dalton, 9/29/66 • Trustee since 2008 • Oversees 34 Funds in Fund Complex | | Executive Vice President and Chief Operating Officer, Affiliated Managers Group, Inc., (2006-Present); Executive Vice President, Affiliated Managers Group, Inc., (2002 -2006); Executive Vice President and General Counsel, Affiliated Managers Group, Inc. (2001-2002); Senior Vice President and General Counsel, Affiliated Managers Group, Inc. (1996-2001). Director, Managers Distributors, Inc. (2000-Present). |
| |
John H. Streur, 2/6/60 • Trustee since 2008 • President since 2008 • Oversees 34 Funds in Fund Complex | | Senior Managing Partner, Managers Investment Group LLC (2006-Present); President, Managers Distributors, Inc. (2006-Present); Managing Partner, Managers Investment Group LLC (2005-2006); Chief Executive Officer, President and Chief Operating Officer, The Burridge Group LLC (1996-2004). |
Officers
| | |
Name, Date of Birth, Position(s) Held with Fund and Length of Time Served | | Principal Occupation(s) During Past 5 Years |
| |
Christine C. Carsman, 4/2/52 • Secretary since 2004 | | Senior Vice President and Chief Regulatory Counsel, Affiliated Managers Group, Inc. (2004-Present); Secretary, The Managers Funds, Managers AMG Funds and Managers Trust II (2004-Present); Senior Counsel, Vice President and Director of Operational Risk Management and Compliance, Wellington Management Company, LLP (1995-2004); Deputy General Counsel, The Boston Company, Inc. (1993-1995); Associate General Counsel, The Boston Company Advisors, Inc. (1991-1993); Associate, Sullivan & Worcester LLP (1987-1991). |
| |
Donald S. Rumery, 5/29/58 • Chief Financial Officer since 2007 • Treasurer since 2000 | | Senior Vice President, Managers Investment Group LLC (2005-Present); Director, Finance and Planning, The Managers Funds LLC, (1994-2004); Treasurer and Chief Financial Officer, Managers Distributors, Inc. (2000-Present); Treasurer, The Managers Funds (1995-Present); Treasurer, Managers AMG Funds (1999-Present); Treasurer, Managers Trust II (2000-Present); Secretary, Managers Trust I and Managers Trust II (2000-2004) and Secretary, The Managers Funds (1997-2004); Chief Financial Officer, The Managers Funds, Managers AMG Funds and Managers Trust II (2007-Present). |
| |
Keitha L. Kinne, 5/16/58 • Chief Operating Officer since 2007 | | Managing Partner and Chief Operating Officer, Managers Investment Group LLC (2007-Present); Chief Operating Officer, The Managers Funds, Managers AMG Funds and Managers Trust II (2007-Present); Chief Investment Officer, Managers Investment Group LLC (2008-Present); Managing Director, Legg Mason & Co., LLC (2006-2007); Managing Director, Citigroup Asset Management (2004- 2006); Senior Vice President, Prudential Investments (1999-2004). |
| |
David Kurzweil, 6/22/74 • Assistant Secretary since 2008 | | Senior Vice President and Associate Counsel, Managers Investment Group LLC (2008-Present); Assistant Secretary, The Managers Funds, Managers Trust I, Managers Trust II, and Managers AMG Funds (2008-Present); Counsel and Senior Vice President, Lazard Asset Management LLC (2003-2008). |
35
Annual Renewal of Investment Advisory Agreements
On June 4-5, 2009, the Board of Trustees, including a majority of the Trustees who are not “interested persons” of the Trust (the “Independent Trustees”), approved the Investment Management Agreement with the Investment Manager for the Managers Fremont Bond Fund (the “Fund”) and the Subadvisory Agreement for the Subadvisor of the Fund. The Independent Trustees were separately represented by independent counsel in connection with their consideration of the approval of these agreements. In considering the Investment Management and Subadvisory Agreements, the Trustees reviewed a variety of materials relating to the Fund, the Investment Manager and the Subadvisor, including comparative performance, fee and expense information for an appropriate peer group of similar mutual funds (the “Peer Group”), performance information for the relevant benchmark index (the “Fund Benchmark”) and, with respect to the Subadvisor, comparative performance information for an appropriate peer group of managed accounts, and, as to all other matters, other information provided to them on a periodic basis throughout the year, as well as information provided in connection with the meetings of June 4-5, 2009, regarding the nature, extent and quality of services provided by the Investment Manager and the Subadvisor under their respective agreements. Prior to voting, the Independent Trustees: (a) reviewed the foregoing information with their independent legal counsel and with management; (b) received materials from their independent legal counsel discussing the legal standards applicable to their consideration of the Investment Management Agreement and the Subadvisory Agreement; and (c) met with their independent legal counsel in private sessions at which no representatives of management were present.
Nature, extent and quality of services.
In considering the nature, extent and quality of the services provided by the Investment Manager, the Trustees reviewed information relating to the Investment Manager’s operations and personnel. Among other things, the Investment Manager provided financial information, biographical information on its supervisory and professional staff and descriptions of its organizational and management structure. The Trustees also took into account information provided periodically throughout the previous year by the Investment Manager relating to the performance of its duties with respect to the Fund and the Trustees’ familiarity with the Investment Manager’s management through Board meetings, discussions and reports. In the course of their deliberations regarding the Investment Management Agreement, the Trustees evaluated, among other things: (a) the extent and quality of the Investment Manager’s oversight of the operation and management of the Fund; (b) the quality of the search, selection and monitoring services performed by the Investment Manager in overseeing the portfolio management responsibilities of the Subadvisor; (c) the Investment Manager’s ability to supervise the Fund’s other service providers; and (d) the Investment Manager’s compliance programs. The Trustees also took into account the financial condition of the Investment Manager with respect to its ability to provide the services required under the Investment Management Agreement and to maintain a contractual expense limitation for the Fund.
The Trustees also reviewed information relating to the Subadvisor’s operations and personnel and the investment philosophy, strategies and techniques (the “Investment Strategy”) used in managing the Fund. Among other things, the Trustees reviewed biographical information on portfolio management and other professional staff, information regarding the Subadvisor’s organizational and management structure and the Subadvisor’s brokerage policies and practices. The Trustees considered specific information provided regarding the experience of the individual or individuals at the Subadvisor with portfolio management responsibility for the Fund, including the information set forth in the Fund’s prospectus and statement of additional information. In the course of their deliberations, the Trustees evaluated, among other things: (a) the services rendered by the Subadvisor in the past; (b) the qualifications and experience of the Subadvisor’s personnel; and (c) the Subadvisor’s compliance programs. The Trustees also took into account the financial condition of the Subadvisor with respect to its ability to provide the services required under the Subadvisory Agreement.
Performance.
Among other information relating to the Fund’s performance, the Trustees noted that the Fund’s performance for the 1-year, 3-year, 5-year and 10-year periods ended March 31, 2009 was above the median performance of the Peer Group for each period and below, below, below and above, respectively, the performance of the Fund Benchmark, the Barclays Capital U.S. Aggregate Index. The Board also took into account management’s discussion of the Fund’s performance, noting that the Fund outperformed the Peer Group for each period and outperformed the Fund Benchmark for the 10-year period. The Trustees concluded that the Fund’s performance has been satisfactory in light of all factors considered.
As noted above, the Board considered the Fund’s performance during relevant time periods as compared to the Fund’s Peer Group and considered the Subadvisor’s performance as compared to an appropriate peer group of managed accounts and noted that the Board reviews on a quarterly basis detailed information about the Fund’s performance results, portfolio composition and Investment Strategies. The Board noted the Investment Manager’s expertise and resources in monitoring the performance, investment style and risk-adjusted performance of the Subadvisor. The Board was mindful of the Investment Manager’s attention to monitoring the Subadvisor’s performance with respect to the Fund and its discussions with management regarding the factors that contributed to the performance of the Fund.
Advisory Fees and Profitability.
In considering the reasonableness of the advisory fee charged by the Investment Manager for managing the Fund, the Trustees noted that the Investment Manager, and not the Fund, is responsible for paying the fees charged by the Fund’s Subadvisor and, therefore, that the fees paid to the Investment Manager cover the cost of providing portfolio management services as well as the cost of providing search, selection and monitoring services in operating a “manager-of-managers”
36
Annual Renewal of Investment Advisory Agreements (continued)
complex of mutual funds. The Trustees concluded that, in light of the additional high quality supervisory services provided by the Investment Manager and the fact that the subadvisory fees are paid out of the advisory fee, the advisory fee payable by the Fund to the Investment Manager can reasonably be expected to exceed the median advisory fee for the Peer Group, which consists of many funds that do not operate with a manager-of-managers structure. In this regard, the Trustees also noted that the Investment Manager has undertaken to maintain an expense limitation for the Fund.
In considering the reasonableness of the advisory fee payable to the Investment Manager, the Trustees also reviewed information provided by the Investment Manager setting forth all revenues and other benefits, both direct and indirect, received by the Investment Manager and its affiliates attributable to managing the Fund and all the mutual funds in the Managers Family of Funds, the cost of providing such services and the resulting profitability to the Investment Manager and its affiliates from these relationships. The Trustees also noted the current and potential asset levels of the Fund and the willingness of the Investment Manager to waive fees and pay expenses for the Fund from time to time as a means of limiting the total expenses of the Fund. The Trustees also considered the current asset level of the Fund, including the effect on assets attributable to the economic and market conditions over the past year, and considered the impact on profitability of the current asset level and any future growth of assets of the Fund. The Board took into account management’s discussion of the current advisory fee structure. The Trustees also noted that the subadvisory fees are paid by the Investment Manager out of its advisory fee. Based on the foregoing, the Trustees concluded that the profitability to the Investment Manager is reasonable and that the Investment Manager is not realizing material benefits from economies of scale that would warrant adjustments to the advisory fees for the Fund at this time. With respect to economies of scale, the Trustees also noted that as the Fund’s assets increase over time, the Fund may realize other economies of scale to the extent that the increase in assets is proportionally greater than the increase in certain other expenses.
The Trustees noted that the Fund’s advisory fee and total expenses (net of applicable expense waivers/reimbursements) as of March 31, 2009 were higher and lower, respectively, than the average for the Peer Group. The Trustees took into account the fact that the Investment Manager has contractually agreed, through March 1, 2010, to limit the Fund’s net annual operating expenses to 0.58%. The Trustees concluded that, in light of the nature, extent and quality of the services provided by the Investment Manager and the Subadvisor, the Fund’s performance, the foregoing expense limitation and the considerations noted above with respect to the Subadvisor and the Investment Manager, the Fund’s advisory fees are reasonable.
Subadvisory Fees and Profitability.
In considering the reasonableness of the fee payable by the Investment Manager to the Subadvisor, the Trustees relied on the ability of the Investment Manager to negotiate the terms of the Subadvisory Agreement at arm’s length as part of the manager-of-managers structure, noting that the Subadvisor is not affiliated with the Investment Manager. In addition, the Trustees noted that the subadvisory fees are paid by the Investment Manager out of its advisory fee. Accordingly, the cost of services to be provided by the Subadvisor and the profitability to the Subadvisor of its relationship with the Fund were not material factors in the Trustees’ deliberations. For similar reasons, and based on the current size of the portion of the Fund managed by the Subadvisor, the Trustees concluded that any economies of scale being realized by the Subadvisor was not a material factor in the Trustees’ deliberations at this time.
* * * *
After consideration of the foregoing, the Trustees also reached the following conclusions regarding the Investment Management Agreement and the Subadvisory Agreement, in addition to those conclusions discussed above: (a) the Investment Manager and the Subadvisor have demonstrated that they possess the capability and resources to perform the duties required of them under the Investment Management Agreement and the Subadvisory Agreement; (b) the Subadvisor’s Investment Strategy is appropriate for pursuing the Fund’s investment objectives; (c) the Subadvisor is reasonably likely to execute its Investment Strategy consistently over time; and (d) the Investment Manager and the Subadvisor maintain appropriate compliance programs.
Based on all of the above-mentioned factors and related conclusions, with no single factor or conclusion being determinative and with each Trustee not necessarily attributing the same weight to each factor, the Trustees concluded that approval of the Investment Management Agreement and the Subadvisory Agreement would be in the best interests of the Fund and its shareholders. Accordingly, on June 4-5, 2009, the Trustees, including a majority of the Independent Trustees, voted to approve the Investment Management Agreement and the Subadvisory Agreement for the Fund’s Subadvisor.
37
THIS PAGE INTENTIONALLY LEFT BLANK
THIS PAGE INTENTIONALLY LEFT BLANK
Investment Manager and Administrator
Managers Investment Group LLC
333 W. Wacker Drive
Suite 1200
Chicago, IL 60606
(800) 835-3879
Distributor
Managers Investment Group LLC
333 W. Wacker Drive
Suite 1200
Chicago, IL 60606
(800) 835-3879
Custodian
The Bank of New York Mellon
2 Hanson Place
Brooklyn, New York 11217
Legal Counsel
Ropes & Gray LLP
One International Place
Boston, Massachusetts 02110-2624
Transfer Agent
PNC Global Investment Servicing (U.S.) Inc.
Attn: Managers
P.O. Box 9769
Providence, Rhode Island 02940
(800) 548-4539
For Managers Choice Only
Managers
c/o PNC Global Investment Servicing (U.S.) Inc.
P.O. Box 61204
King of Prussia, Pennsylvania 19406-0851
(800) 358-7668

MANAGERSAND MANAGERS AMG FUNDS
| | | | |
EQUITY FUNDS | | BALANCED FUNDS |
| | |
EMERGING MARKETS EQUITY Rexiter Capital Management Limited Schroder Investment Management North America Inc. ESSEX GROWTH ESSEX LARGE CAP GROWTH ESSEX SMALL/MICRO CAP GROWTH Essex Investment Management Co., LLC FQ TAX-MANAGED U.S. EQUITY FQ U.S. EQUITY First Quadrant, L.P. GW&K SMALL CAP EQUITY Gannett Welsh & Kotler, LLC INSTITUTIONAL MICRO-CAP MICRO-CAP Lord, Abbett & Co. LLC WEDGE Capital Management L.L.P. Next Century Growth Investors LLC Voyageur Asset Management Inc. INTERNATIONAL EQUITY AllianceBernstein L.P. Lazard Asset Management, LLC Martin Currie Inc. | | CHICAGO EQUITY PARTNERS MID-CAP Chicago Equity Partners, LLC REAL ESTATE SECURITIES Urdang Securities Management, Inc. RENAISSANCE LARGE CAP GROWTH Renaissance Group LLC SKYLINE SPECIAL EQUITIES PORTFOLIO Skyline Asset Management, L.P. SMALL CAP Frontier Capital Management Company, LLC SPECIAL EQUITY Ranger Investment Management, L.P. Lord, Abbett & Co. LLC Smith Asset Management Group, L.P. Federated MDTA LLC SYSTEMATIC VALUE SYSTEMATIC MID CAP VALUE Systematic Financial Management, L.P. TIMESSQUARE MID CAP GROWTH TIMESSQUARE SMALL CAP GROWTH TimesSquare Capital Management, LLC | | CHICAGO EQUITY PARTNERS BALANCED Chicago Equity Partners, LLC ALTERNATIVE FUNDS FQ GLOBAL ALTERNATIVES FQ GLOBAL ESSENTIALS First Quadrant, L.P. INCOME FUNDS BOND (MANAGERS) FIXED INCOME GLOBAL BOND Loomis, Sayles & Co., L.P. BOND (MANAGERS FREMONT) Pacific Investment Management Co. LLC CALIFORNIA INTERMEDIATE TAX-FREE Miller Tabak Asset Management LLC GW&K MUNICIPAL BOND GW&K MUNICIPAL ENHANCED YIELD Gannett Welsh & Kotler, LLC HIGH YIELD J.P. Morgan Investment Management LLC INTERMEDIATE DURATION GOVERNMENT SHORT DURATION GOVERNMENT Smith Breeden Associates, Inc. |
This report is prepared for the Fund’s shareholders. It is authorized for distribution to prospective investors only when preceded or accompanied by an effective prospectus. To receive a free copy of the prospectus or Statement of Additional Information, which includes additional information about Fund Trustees, please contact us by calling 800.835.3879. Distributed by Managers Distributors, Inc., member FINRA. A description of the policies and procedures each Fund uses to vote its proxies is available: (i) without charge, upon request, by calling 800.835.3879, or (ii) on the Securities and Exchange Commission’s (SEC) Web site at www.sec.gov. For information regarding each Fund’s proxy voting record for the 12-month period ended October 31, call 800.835.3879 or visit the SEC Web site at www.sec.gov. The Fund files its complete schedule of portfolio holdings with the SEC for the first and third quarters of each fiscal year on Form N-Q. The Fund’s Forms N-Q are available on the SEC’s website at www.sec.gov. A Fund’s Forms N-Q may be reviewed and copied at the SEC’s Public Reference Room in Washington, DC. Information on the operation of the Public Reference Room may be obtained by calling 1-800-SEC-0330. To review a complete list of the Fund’s portfolio holdings, or to view the most recent quarterly holdings report, semiannual report, or annual report, please visit www.managersinvest.com. | | MONEY MARKET JPMorgan Investment Advisors Inc. |
| |  |
| www.managersinvest.com | | |

Registrant has adopted a Code of Ethics. See attached Exhibit (a)(1).
| Item 3. | AUDIT COMMITTEE FINANCIAL EXPERT |
Registrant’s Board of Trustees has determined that independent Trustees Mr. Jack W. Aber and Mr. Steven J. Paggioli each qualify as the Audit Committee Financial Expert. Mr. Aber and Mr. Paggioli are “independent” as such term is defined in Form N-CSR.
| Item 4. | PRINCIPAL ACCOUNTANT FEES AND SERVICES |
The aggregate fees billed by PwC to the Fund for the Funds’ two most recent fiscal years for professional services rendered for audits of annual financial statements, or services that are normally provided in connection with statutory and regulatory filings or engagements (“Audit Fees”) were as follows:
| | | | | |
| | | Fiscal 2009 | | Fiscal 2008 |
Managers AMG FQ Tax-Managed U.S. Equity Fund | | 21,519 | | $ | 21,437 |
Managers AMG FQ U.S. Equity Fund | | 21,387 | | $ | 21,301 |
Managers AMG FQ Global Alternatives Fund 1 | | 31,260 | | $ | 28,449 |
Managers Fremont Global Fund | | 26,126 | | $ | 25,905 |
Managers Small Cap Fund | | 21,619 | | $ | 17,135 |
Managers Fremont Micro-Cap Fund | | 19,833 | | $ | 19,305 |
Managers Fremont Institutional Micro-Cap Fund | | 19,917 | | $ | 19,387 |
Managers Real Estate Securities Fund | | 20,799 | | $ | 20,189 |
Managers Fremont Bond Fund | | 43,122 | | $ | 42,030 |
Managers CA Intermediate Tax-Free Fund | | 20,519 | | $ | 19,937 |
1 – Fund commenced operations on March 30, 2006
Audit-Related Fees
There were no fees billed by PwC to the Fund in its two recent fiscal years for services rendered for assurance and related services that are reasonably related to the performance of the audit or review of the Fund’s financial statements, but are not reported as Audit Fees (“Audit-Related Fees”).
For the Funds’ two most recent fiscal years, there were no Audit-Related Fees billed by PwC for engagements related directly to the operations and financial reporting of one or more Funds by a Fund Service Provider. A Fund Service Provider is (a) any investment adviser to the Fund (not including any Subadvisor whose role is primarily portfolio management and is subcontracted with or overseen by another investment adviser) or (b) any entity that provides ongoing services to the Fund and is controlling, controlled by or under common control with a Fund investment adviser described in (a).
Tax Fees
The aggregate fees billed by PwC to the Funds for the two most recent fiscal years for professional services rendered for tax compliance, tax advice, and tax planning (“Tax Fees”) were as follows:
| | | | | |
| | | Fiscal 2009 | | Fiscal 2008 |
Managers AMG FQ Tax-Managed U.S. Equity Fund | | 6,900 | | $ | 7,046 |
Managers AMG FQ U.S. Equity Fund | | 6,500 | | $ | 7,046 |
Managers AMG FQ Global Alternatives Fund 1 | | 11,200 | | $ | 10,593 |
Managers Fremont Global Fund | | 9,600 | | $ | 9,298 |
Managers Small Cap Fund | | 6,650 | | $ | 7,046 |
Managers Fremont Micro-Cap Fund | | 6,500 | | $ | 7,237 |
Managers Fremont Institutional Micro-Cap Fund | | 5,800 | | $ | 7,237 |
Managers Real Estate Securities Fund | | 10,100 | | $ | 9,634 |
Managers Fremont Bond Fund | | 11,200 | | $ | 10,593 |
Managers CA Intermediate Tax-Free Fund | | 8,500 | | $ | 6,231 |
1 – Fund commenced operations on March 30, 2006
For the Funds’ two most recent fiscal years, Tax Fees billed by PwC for engagements by Fund Service Providers that related directly to the operations and financial reporting of the Funds were $0 for fiscal 2007 and $0 for fiscal 2006, respectively.
The services for which Tax Fees were charged comprise all services performed by professional staff in PwC’s tax division except those services related to the audit. Typically, this category would include fees for tax compliance, tax planning, and tax advice. Tax compliance, tax advice, and tax planning services include preparation of original and amended tax returns, claims for refund and tax payment-planning services, assistance with tax audits and appeals, tax advice related to mergers and acquisitions and requests for rulings or technical advice from taxing authorities.
All Other Fees
There were no other fees billed by PwC to the Funds for all other non-audit services (“Other Fees”) during the Funds’ two most recent fiscal years. During the same period, there were no Other Fees billed by PwC for engagements by Fund Service Providers that related directly to the operations and financial reporting of the Funds.
According to policies adopted by the Audit Committee, services provided by PwC to the Funds must be pre-approved by the Audit Committee. On an annual basis, the Audit Committee reviews and pre-approves various types of services that PwC may perform for the Funds without specific approval of each engagement, subject to specified budget limitations. As contemplated by the Sarbanes-Oxley Act of 2002 and related SEC rules, the Audit Committee also pre-approves non-audit services provided by PwC to any Fund Service Provider for any engagement that relates directly to the operations and financial reporting of the Funds. Any engagement that is not already pre-approved or that will
exceed a pre-approved budget must be submitted to the Audit Committee for pre-approval. The Chairman of the Audit Committee is authorized on behalf of the Board of Trustees and the Audit Committee to approve the engagement of PwC to perform non-audit services subject to certain conditions, including notification to the Audit Committee of such pre-approval not later than the next meeting of the Audit Committee following the date of such pre-approval.
There were no other fees billed by PwC for non-audit services rendered to the Funds and to Fund Service Providers for the Funds’ two most recent fiscal years.
The Audit Committee has considered whether the provision of non-audit services by PwC to Fund Service Providers that were not required to be pre-approved by the Audit Committee is compatible with maintaining PwC’s independence in its audit of the Funds, taking into account representations from PwC, in accordance with Independence Standards Board Standard No. 1, regarding its independence from the Funds and its related entities.
The following table sets forth the non-audit services provided by PwC to the Funds and its service affiliates defined as the Funds’ investment advisor and any entity controlling, controlled by or under common control with Managers Investment Group LLC that provides ongoing services to the Funds (“Control Affiliates”) for the last two fiscal years.
| | | | | | | | | | | | | | | | | | |
| | | Audit-related fees A | | Tax fees A | | All other fees A |
| | | 2008 | | 2007 | | 2008 | | 2007 | | 2008 | | 2007 |
Control Affiliates | | $ | 343,015 | | $ | 467,485 | | $ | 897,895 | | $ | 1,264,360 | | $ | 0 | | $ | 0 |
| A | Aggregate amounts may reflect rounding. |
| Item 5. | AUDIT COMMITTEE OF LISTED REGISTRANTS |
Not applicable.
| Item 6. | SCHEDULE OF INVESTMENTS |
The schedule of investments in unaffiliated issuers as of the close of the reporting period is included as part of the shareholder report contained in Item 1 hereof.
| Item 7. | DISCLOSURE OF PROXY VOTING POLICIES AND PROCEDURES FOR CLOSED-END MANAGEMENT INVESTMENT COMPANIES |
Not applicable.
| Item 8. | PORTFOLIO MANAGERS OF CLOSED-END MANAGEMENT INVESTMENT COMPANIES |
Not applicable.
| Item 9. | PURCHASES OF EQUITY SECURITIES BY CLOSED-END MANAGEMENT INVESTMENT COMPANIES AND AFFILIATED PURCHASERS |
Not applicable.
| Item 10. | SUBMISSION OF MATTERS TO A VOTE OF SECURITY HOLDERS |
Not applicable.
| Item 11. | CONTROLS AND PROCEDURES |
(a) The Registrant’s principal executive and principal financial officers have concluded, based on their evaluation of the registrant’s disclosure controls and procedures as of a date within 90 days of the filing of this report, that the Registrant’s disclosure controls and procedures are reasonably designed to ensure that information required to be disclosed by the Registrant on Form N-CSR is recorded, processed, summarized and reported within the required time periods and that information required to be disclosed by the registrant in the reports that it files or submits on Form N-CSR is accumulated and communicated to the Registrant’s management, including its principal executive and principal financial officers, as appropriate to allow timely decisions regarding required disclosure.
(b) There were no changes in the Registrant’s internal control over financial reporting during the Registrant’s fourth fiscal quarter of the period covered by this report that have materially affected, or are reasonably likely to affect, the internal control over financial reporting.
| | |
| |
(a) (1) | | Any Code of Ethics or amendments hereto. Filed herewith. |
| |
(a) (2) | | Certifications pursuant to Rule 30a-2(a) under the Investment Company Act of 1940 - Filed herewith. |
| |
(a) (3) | | Not applicable. |
| |
(b) | | Certifications pursuant to Rule 30a-2(b) under the Investment Company Act of 1940 - Filed herewith. |
SIGNATURES
Pursuant to the requirements of the Securities Exchange Act of 1934 and the Investment Company Act of 1940, the registrant has duly caused this report to be signed on its behalf by the undersigned, thereunto duly authorized.
| | |
| MANAGERS TRUST I |
| |
| By: | | /S/ JOHN H. STREUR |
| | John H. Streur, President |
| |
| Date: | | January 8, 2010 |
Pursuant to the requirements of the Securities Exchange Act of 1934 and the Investment Company Act of 1940, this report has been signed below by the following persons on behalf of the registrant and in the capacities and on the dates indicated.
| | |
| By: | | /S/ JOHN H. STREUR |
| | John H. Streur, President |
| |
| Date: | | January 8, 2010 |
| |
| By: | | /S/ DONALD S. RUMERY |
| | Donald S. Rumery, Chief Financial Officer |
| |
| Date: | | January 8, 2010 |