UNITED STATES
SECURITIES AND EXCHANGE COMMISSION
Washington, D.C. 20549
FORM N-CSR
CERTIFIED SHAREHOLDER REPORT OF
REGISTERED MANAGEMENT INVESTMENT COMPANIES
Investment Company Act file number: 811-06520
MANAGERS TRUST I
(Exact name of registrant as specified in charter)
800 Connecticut Avenue, Norwalk, Connecticut 06854
(Address of principal executive offices) (Zip code)
Managers Investment Group LLC
800 Connecticut Avenue, Norwalk, Connecticut 06854
(Name and address of agent for service)
Registrant’s telephone number, including area code: (203) 299-3500
Date of fiscal year end: OCTOBER 31
Date of reporting period: NOVEMBER 1, 2005 – OCTOBER 31, 2006 (Annual Shareholder Report)
| Item 1. | Reports to Shareholders |
ANNUAL REPORT
Managers Funds
October 31, 2006
| • | | Managers Fremont Global Fund |
| • | | Managers Small Cap Fund |
| • | | Managers Real Estate Securities Fund |
| • | | Managers California Intermediate Tax-Free Fund |
| • | | Fremont Money Market Fund |
AR010d
The Managers Funds
Annual Report — October 31, 2006
Nothing contained herein is to be considered an offer, sale or solicitation of an offer to buy shares of The Managers Funds or Managers AMG Funds. Such offering is made only by Prospectus, which includes details as to offering price and other material information.
Letter to Shareholders
Dear Fellow Shareholder:
The year 2006 has been volatile but rewarding for investors. Markets confronted new Federal Reserve leadership and accompanying communication style, commodity price increases, the end (at least for now) of interest rate hikes, and then a sharp decline in oil prices and a dramatic slowdown in the real estate market. Times like these challenge investors to remove emotion from decisions and remain disciplined with their long-term investment plans.
Regardless of market conditions, we at Managers maintain our focus on providing excellent, trusted, and rigorously monitored investment solutions across all major market segments and styles. We encourage our portfolio managers to take a long-term view and to invest accordingly. We strive to stay on track even when market volatility causes some investors concern.
Our overriding goal is to hire fund managers that can effectively manage assets in all types of market conditions. Toward this goal, we maintain a team of skilled investment professionals focused solely on understanding the global capital markets and overseeing the managers in our Funds. We hire fund portfolio managers who excel over time, have a strong investment discipline, and stick to that discipline.
Regardless of market conditions, we at Managers maintain our focus on providing excellent, trusted, and rigorously monitored investment solutions across all major market segments and styles.
Our investment team oversees the Funds’ managers and portfolios every day so you don’t have to. Once you have selected Managers Funds as part of your asset allocation, you can be assured that we are monitoring that investment every day to help ensure it is delivering on its investment mandate.
As 2006 comes to a close, we begin to think about next year and beyond. The two things we believe will impact investment returns the most are the condition of the economy and the change to the political landscape this fall’s election brings. Obviously, these are only the headlines and there are many subtleties relating to each.
First, with regard to the health of the economy, the risk appears to be the leverage consumers have assumed through their exposure to the residential real estate market. The “house as cash machine” combined with the speculative investment in real estate has increased the economy’s exposure to any weakness in prices or excess supply of real estate. Both these factors seem to be in play. Aside from this risk, consumers and businesses seem to be in good financial shape with relatively healthy balance sheets.
Second, with regard to the changes in Washington D.C., much has and will be written regarding mid-term power shifts, the third year of a President’s term, tax policy and its relationship to growth, and the war in Iraq. Suffice it to say that there are many interesting challenges facing the financial markets, and managing an investment portfolio requires diligence, attention, and resources.
Each of us at Managers appreciates the trust you express in us by allowing us the privilege of investing some of your capital. We will do everything we can to continue to deserve your trust in the months and years ahead.
Respectfully,
| | |
 | |  |
Peter M. Lebovitz President Managers Funds | | Thomas G. Hoffman, CFA Executive Vice President Chief Investment Officer Managers Investment Group LLC |
1
About Your Fund’s Expenses
As a shareholder of a Fund, you may incur two types of costs: (1) transaction costs, which may include sales charges (loads) on purchase payments; redemption fees; and exchange fees; and (2) ongoing costs, including management fees; distribution (12b-1) fees; and other Fund expenses. This example is intended to help you understand your ongoing costs (in dollars) of investing in the Fund and to compare these costs with the ongoing costs of investing in other mutual funds. The example is based on an investment of $1,000 invested at the beginning of the period and held for the entire period as indicated below.
Actual Expenses
The first line of the table below provides information about the actual account values and actual expenses. You may use the information in this line, together with the amount you invested, to estimate the expenses that you paid over the period. Simply divide your account value by $1,000 (for example, an $8,600 account value divided by $1,000 = 8.6), then multiply the result by the number in the first line under the heading entitled “Expenses Paid During Period” to estimate the expenses you paid on your account during this period.
Hypothetical Example for Comparison Purposes
The second line of the table below provides information about hypothetical account values and hypothetical expenses based on the Fund’s actual expense ratio and an assumed annual rate of return of 5% before expenses, which is not the Fund’s actual return. The hypothetical account values and expenses may not be used to estimate the actual ending account balance or expenses you paid for the period. You may use this information to compare the ongoing costs of investing in the Fund and other funds by comparing this 5% hypothetical example with the 5% hypothetical examples that appear in the shareholder reports of other funds.
Please note that the expenses shown in the table are meant to highlight your on going costs only and do not reflect any transactional costs, such as sales charges (loads), redemption fees, or exchange fees. Therefore, the second line of the table is useful in comparing ongoing costs only, and will not help you determine the relative total costs of owning different funds.
| | | | | | | | | |
Six Months Ended October 31, 2006 | | Beginning Account Value
5/1/2006 | | Ending Account Value
10/31/2006 | | Expenses Paid
During the
Period* |
Managers Fremont Global Fund | | | | | | | | | |
Based on Actual Fund Return | | $ | 1,000 | | $ | 1,022 | | $ | 5.61 |
Based on Hypothetical 5% Annual Return | | $ | 1,000 | | $ | 1,020 | | $ | 5.60 |
Managers Small Cap Fund | | | | | | | | | |
Based on Actual Fund Return | | $ | 1,000 | | $ | 983 | | $ | 6.80 |
Based on Hypothetical 5% Annual Return | | $ | 1,000 | | $ | 1,018 | | $ | 6.92 |
Managers Real Estate Securities Fund | | | | | | | | | |
Based on Actual Fund Return | | $ | 1,000 | | $ | 1,180 | | $ | 7.86 |
Based on Hypothetical 5% Annual Return | | $ | 1,000 | | $ | 1,018 | | $ | 7.27 |
Managers California Intermediate Tax Free Fund | | | | | | | | | |
Based on Actual Fund Return | | $ | 1,000 | | $ | 1,050 | | $ | 2.84 |
Based on Hypothetical 5% Annual Return | | $ | 1,000 | | $ | 1,022 | | $ | 2.80 |
Fremont Money Market Fund | | | | | | | | | |
Based on Actual Fund Return | | $ | 1,000 | | $ | 1,023 | | $ | 3.32 |
Based on Hypothetical 5% Annual Return | | $ | 1,000 | | $ | 1,022 | | $ | 3.31 |
| * | Expenses are equal to the Fund’s annualized expense ratio multiplied by the average account value over the period, multiplied by the number of days in the most recent fiscal half-year (184), then divided by 365. |
2
Fremont Global Fund
Portfolio Manager’s Comments
Managers Fremont Global Fund seeks to maximize total return while reducing risk by investing in U.S. and international stocks, bonds, and short-term securities (cash).
Northstar Capital Management
Northstar Capital Management’s investment team believes that investing in high quality, high earnings growth companies will generate superior investment returns over full market cycles. To find these companies, the portfolio management team performs fundamental, bottom-up research using a combination of quantitative and qualitative criteria.
The investment process begins with the universe of stocks with market capitalizations exceeding $5 billion. Stocks must also exhibit low volatility and high liquidity. The team then runs a screen to identify stocks that exhibit: (1) higher than market trailing EPS growth; (2) higher than market 5-year projected EPS growth; (3) higher earnings stability; (4) P/E to growth ratio lower than the market; and (5) return on equity higher than the market. This quantitative screen narrows the universe to approximately 100 stocks.
Fundamental, bottom-up analysis is then performed on each company, narrowing the candidate universe down to those with strong qualitative characteristics. Management looks for companies that have excellent businesses with unique characteristics deriving from superior products, niche markets, first-rate customer service, innovative approaches, creative skills, superior management, and high employee involvement. These companies are typically acknowledged leaders in their fields. This qualitative analysis then leads to a portfolio of approximately 25 - 30 names representing the best ideas of the portfolio management team. Stocks in the portfolio are generally equally weighted, and holdings are monitored to assure competitive advantage and growth characteristics.
Armstrong Shaw Associates, Inc.
Jeff Shaw and the investment management team at Armstrong Shaw take a disciplined absolute value approach to investing in the equity market. The team’s goal is to purchase companies that are selling at a substantial discount to intrinsic value. Armstrong Shaw defines intrinsic value as an estimate of what a company would be worth if it were sold as a continuing operation to a knowledgeable buyer. This approach permits price appreciation if the stock grows into its intrinsic value while limiting the risk of significant price depreciation.
The team begins by screening the universe of domestic stocks for those with market caps more than $2.5 billion, P/E ratios below the market average, EPS growth better than 10%, and return on equity better than 15%. The team might also search for certain events or special situations such as restructurings, industry events, or legislative changes. After narrowing the universe to about 200 mid- and large-cap names, the investment team analyzes the companies by speaking with management, suppliers and customers and examining financial statements. Qualitatively, Armstrong Shaw prefers companies with discernable business franchises and a management team with a successful track record. Unlike a deep value manager where price is the main concern, Armstrong Shaw is willing to pay a bit more for a company with a strong business plan as long as the price is still below what the team estimates as the intrinsic value. Quantitatively, the team compares the stock prices to cash flows, EPS, sales, etc. The team will estimate the stock’s intrinsic value and purchase stocks only when they are selling for less than 70% of the estimated intrinsic value.
This results in a portfolio of 30-40 of the team’s best ideas. Another 100 stocks or so remain on a watch list for future consideration. Then the team sets target prices on there stocks that reflect its expectation of 30-50% price appreciation over the next 2-3 years. Thus, turnover tends to be low. The portfolio’s performance is driven by each stock’s appreciation toward its intrinsic value along with rising intrinsic value in response to improved business or industry outlooks. Armstrong Shaw will sell a position when a price target is reached, the company’s fundamentals deteriorate, or if it reports below-expectation financial results. Additionally, a drop in price of 25% from average cost triggers an automatic review process for potential sale.
First Quadrant, L.P.
First Quadrant believes that there are significant and recurring market inefficiencies and that history can help identify which inefficiencies are profitable. Inefficiencies may be identified through ongoing fundamental research conducted by First Quadrant’s research team. Incorporating this fundamental research into a quantitative model leads to a consistent, disciplined investment process.
Led by Chris Luck and Max Darnell, First Quadrant’s investment team uses a proprietary multi-factor quantitative model to construct portfolios that combine a top-down analysis of market and economic conditions with a bottom-up stock selection process. The top-down analysis consists of a review of market and economic data to identify those industries and sectors of the market that are likely to benefit from present and future economic conditions. The top-down analysis helps fund management determine how to tilt the portfolio relative to the benchmark in terms of style, market cap, and industry weightings. Individual stock selection, however, is driven by bottom-up models that focus primarily on market sentiment, valuation, and accounting fundamentals.
Kern Capital Management LLC
Kern Capital Management believes the U.S. micro-cap stock universe provides the opportunity to invest in innovative companies with exceptional growth prospects. With minimal research coverage by brokerage firms and low institutional ownership, Kern Capital Management believes micro-cap stocks represent the least efficient sector of the market.
Bob Kern is one of the pioneers of small-cap and micro-cap investing. While focusing his attention on small companies, Bob Kern and his team direct their efforts toward finding companies that are succeeding through innovation of new products or services. Thus, the portfolio tends to be concentrated in the technology, health care, consumer goods and service sectors. The team seeks to earn returns from the appreciation of stocks as the companies’ products develop and penetrate new markets.
In most cases, the analysis of the product and judgments regarding its potential are the most important aspects of the decision to own a stock. In all cases, however, the operational and financial health of the company must be verified. Bob and the investment team at Kern Capital like to find companies in which margins will increase with revenue growth and that can finance much of their growth from operating cash flow. Although valuation is clearly important, the team is often willing to pay relatively high multiples when it sees compelling growth potential.
3
Fremont Global Fund
Portfolio Manager’s Comments (continued)
Wellington Management Company, LLP
Wellington Management’s portfolio is managed by its International Growth Team (“IGT”), comprised of portfolio managers Jean-Marc Berteaux and Andrew S. Offit. Jean-Marc and Andy are supported by Wellington Management’s global industry analysts and regional analysts as well as specialized fundamental, quantitative, and technical analysts, and traders. The IGT’s investment philosophy is built on the beliefs that industry is the dominant competitive factor for companies, that companies can dominate industries on a global basis, and that expectations about companies, specifically earnings, drive stock prices. Wellington’s focus is to identify industry leaders with earnings forecasts ahead of market expectations, and to identify the key drivers for the earnings.
The initial investable universe is comprised of companies in the MSCI EAFE Index with market capitalizations greater than U.S. $1 billion. These companies are researched by Wellington Management’s specialist group of industry analysts who perform intensive ongoing fundamental analysis. Analysts provide assessments, financial models, and fundamental research to the IGT. The focus of this research is to update an ongoing assessment of management, current business challenges, and aggregate industry trends. Thorough analysis is done in preparation for and following company contacts to ensure that “the numbers support the story” – that the strategy and challenges outlined by management are coming through in financial results. The companies ultimately purchased for the portfolio will exhibit the following characteristics: industry leadership, identified earnings drivers, and above consensus earnings growth expectations. Companies in the portfolio are continually monitored to ensure their fundamental attractiveness based on the identified earnings drivers. Market expectations catching up to their earnings forecast and/or deterioration in earnings drivers will factor into the sell decision. The portfolio will generally hold 50 to 80 securities. Portfolio turnover is expected to be high, exceeding 150% on average per annum. While the portfolio’s holdings-based turnover is expected to be in the 100% range, the IGT will actively trade these positions as a result of significant near-term price movements and other factors.
Bernstein Investment Research and Management
Bernstein’s approach to investing is value-based and research driven. Bernstein’s thesis is that human nature leads investors to buy and sell financial assets based on an overreaction to near-term events as they confuse temporary or cyclical characteristics with structural change. Thus, short-term problems, which cause profits and stocks to decline, can create buying opportunities, as investors underestimate the potential for corrective strategies to restore long-term earnings power. The investment team, led by Kevin Simms, attempts to exploit this by using research to separate fact from emotion. Bernstein’s International Strategic Value discipline is designed to create a focused portfolio of companies with strong fundamentals and sound business prospects not yet reflected in their share price.
The investment process begins with a broad universe of several thousand companies. The investment team screens this universe with a proprietary return model to identify the companies with the most attractive valuations relative to their earnings power. The model derives an expected return for each company by assessing it both from a global industry-based perspective and from a country-based standpoint, including such factors as price to cash earnings, price to book, return on equity, and price momentum. A deep team of analysts perform extensive research, focusing on the most attractively valued stocks. These analysts dissect corporate financial statements and visit company management and also meet frequently with customers, suppliers, or other industry experts. They build spreadsheets of historical and projected balance-sheet and income-statement information in order to estimate normalized earnings power, cash flow and asset values for each company for the next five years, performing simulations to see the potential impact of changes in various components. Analysts then present their estimates and ratings for each security to the Research Review Committee of the Investment Policy Group (IPG). The Committee challenges the analyst’s assumptions and conclusions to ensure they are sound. The IPG uses this research to build a portfolio of approximately 40-60 of the best ideas, building on the combined convictions of Bernstein industry analysts and regional portfolio management teams. A stock is sold when it has achieved forecasted fair value target, or if a change in the earnings forecast reduces the price target to current levels.
333 Global Advisers
Sandie Kinchen of 333 Global Advisers manages the fixed income portion of the portfolio. The manager’s goal is to provide diversification within the global bond environment. The investment process begins with macro analysis of fundamentals that affect bond yields and monetary policies in the G7 countries. The majority of holdings in the portfolio are government bonds, although business cycle and credit research will identify value added opportunities in the investment-grade corporate bond market. This portfolio also holds global inflation-linked bonds to reduce the inflation risk of a typical bond portfolio. The manager applies a macro forecast and interest rate sensitivity analysis to adjust portfolio duration between 4 to 6.5 years. Foreign currency exposures are typically hedged when management is neutral on its currency view. From time to time, the portfolio will have foreign currency exposure based on fundamental analysis of long-term currency trends.
The Year in Review
The financial markets were quite strong during the fiscal year ending October 31, 2006, such that the Fund was able to deliver a satisfying return of 13.67% for the twelve-month period. Most of these gains were paced by stock appreciation. With interest rates remaining modest and corporate profitability at all time highs, stock markets across the globe appreciated meaningfully. Foreign stock markets were especially strong as foreign economies generally seem to be in an earlier stage of economic growth, while the U.S. economy has begun to moderate. In addition, foreign stocks got a boost in U.S. dollar terms as foreign currencies generally appreciated versus the dollar during the period. For example, the MSCI EAFE Index returned 27.5% in U.S. dollars during the period, while the S&P 500 returned 16.3%.
Meanwhile, bonds provided modest yet steady gains throughout the period. In the U.S., even while short-term rates moved sharply higher through most of the period until the Fed finally stopped raising rates, long-term yields moved lower such that bond prices moved higher. Overseas, although rates moved modestly higher, they remain relatively low from an historical standpoint. Foreign currency gains benefited U.S. holders of foreign bonds. The JP Morgan Global Bond Index returned 5.07% for the twelve months ended October 31st.
4
Fremont Global Fund
Portfolio Manager’s Comments (continued)
While nominally satisfying, the return for the Fund was less than its primary benchmark during the period. The Fund returned 13.67% for the twelve months ending October 31, 2006 compared to a return of 16.34% for the S&P 500. The secondary bench-mark, a combination of 65% MSCI World Index (equities) and 35% JPMorgan Global Bond Index –hedged, returned 15.22% during the period. In large part the underperformance was due to the fact that the portfolio had less exposure to foreign stocks and a corresponding overweight in U.S. equities. Although we can be pleased that our decision to increase the Fund’s foreign stock exposure was directionally correct, we could have been even more aggressive. Our decision to increase the Fund’s exposure to foreign currencies within the fixed income portfolio was generally constructive, and our tactical overweight to equities throughout the year was also additive. From a style perspective, we entered fiscal 2006 with a slight bias toward the growth strategies, particularly within the domestic equity managers. While this was sub-optimal during most of the year, we remain convinced that it is prudent and are beginning to see the tide turn.
Looking Forward
Heading into the next fiscal year, the Fund’s long-term neutral allocation is 45% domestic equity, 20% foreign equity, 33% global bonds (both nominal and inflation linked), and 2% cash. On a tactical basis, the Fund’s asset allocation committee is guardedly optimistic, believing that strong corporate profitability and modest economic growth will continue to favor stocks over bonds, particularly in foreign markets. Hence, we will continue to modestly overweight stocks with an increasing proportion of foreign holdings.
Cumulative Total Return Performance
The Fund’s cumulative total return is based on the daily change in net asset value (NAV), and assumes that all distributions were reinvested. The S&P 500 Index is designed to measure performance of the broad domestic economy through changes in aggregate market value of 500 stocks representing all major industries. The Managers Fremont Global Fund Composite Index is a hypothetical representation of the performance of the Fund’s stock and bond asset classes according to their respective weightings in the Fund’s neutral mix (65% global equities and 35% global bonds). The MSCI World Index is Morgan Stanley Capital International’s market capitalization weighted index composed of companies representative of the market structure of 22 developed market countries in North America, Europe, and the Asia/Pacific Region. The index is calculated without dividends, with net or with gross dividends reinvested, in both US dollars and local currencies. Countries include Australia, Hong Kong, Singapore, Austria, Ireland, South Africa, Belgium, Italy, Spain, Canada, Japan, Sweden, Denmark, Malaysia, Switzerland, Finland, Netherlands, United Kingdom, France, New Zealand, United States, Germany and Norway. The JP Morgan Global Government Bond Index (Hedged) consists of issues from 13 international bond markets including Australia, Belgium, Canada, Denmark, France, Germany, Italy, Japan, Netherlands, Spain, Sweden, the United Kingdom, and the United States. The
(continued on next page)
5
Fremont Global Fund
Portfolio Manager’s Comments (continued)
index consist of regularly traded, fixed-rate, domestic government bonds of countries that offer opportunity to international investors. Unlike the Fund, the above stated indices are unmanaged, are not available to investment, and do not incur expenses. The chart illustrates the performance of a hypothetical $10,000 investment made in the Managers Fremont Global Fund on October 31, 1996, to a $10,000 investment made in the above stated indices for the same period. Performance for periods longer than one year is annualized. The graph and table do not reflect the deduction of taxes that a shareholder would pay on a Fund distribution or redemption of shares. The listed returns for the Fund are net of expenses and the returns for the indices exclude expenses. Total returns for the Fund would have been lower had certain expenses not been reduced.
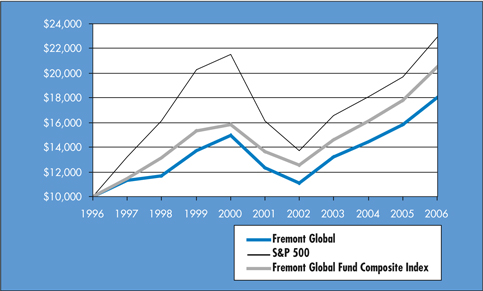
The table below shows the average annual total returns for the Managers Fremont Global Fund, S&P 500 index, and the Managers Fremont Global Fund Composite Index (before taxes) since October 31, 1996 through October 31, 2006.
| | | | | | | | | |
Average Annual Total Returns | | One Year | | | Five Years | | | Ten Years | |
Managers Fremont Global | | 13.67 | % | | 7.89 | % | | 6.05 | % |
S&P 500 Index | | 16.34 | % | | 7.26 | % | | 8.64 | % |
Fremont Global Composite Index | | 15.22 | % | | 8.45 | % | | 7.44 | % |
The performance data shown represents past performance. Past performance is not a guarantee of future results. Current performance may be lower or higher than the performance data quoted. The investment return and the principal value of an investment will fluctuate so that an investor’s shares, when redeemed, may be worth more or less than their original cost. For performance information through the most recent month end please call (800) 835-3879 or visit our Web site at www.managersinvest.com.
Investment in foreign securities are subject to additional risks such as erratic market conditions, economic and political instability, and currency exchange rate fluctuations.
Changing interest rates may adversely affect the value of an investment. An increase in interest rates typically causes the value of bonds and other fixed-income securities to fall.
6
Managers Fremont Global Fund
Fund Snapshots
October 31, 2006
Portfolio Breakdown
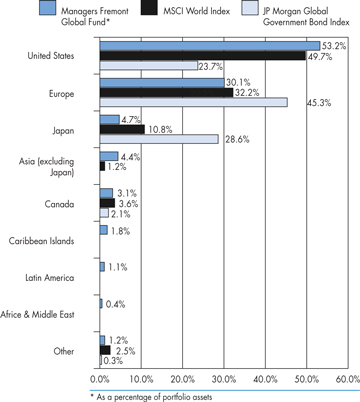
| | | | | | | | | |
Geographic Diversification | | Managers Fremont Global Fund* | | | JP Morgan Global Government Bond Index | | | MSCI World Index | |
United States | | 53.2 | % | | 23.7 | % | | 49.7 | % |
Europe | | 30.1 | % | | 45.3 | % | | 32.2 | % |
Japan | | 4.7 | % | | 28.6 | % | | 10.8 | % |
Asia (excluding Japan) | | 4.4 | % | | 0.0 | % | | 1.2 | % |
Canada | | 3.1 | % | | 2.1 | % | | 3.6 | % |
Caribbean Islands | | 1.8 | % | | 0.0 | % | | 0.0 | % |
Latin America | | 1.1 | % | | 0.0 | % | | 0.0 | % |
Africe & Middle East | | 0.4 | % | | 0.0 | % | | 0.0 | % |
Other | | 1.2 | % | | 0.3 | % | | 2.5 | % |
Top Ten Holdings
| | | |
Security Name | | Percentage of Net Assets | |
Norwegian Government, 5.000%, 05/15/15* | | 1.4 | % |
Bank of America Corp.* | | 1.2 | |
France Telecom SA, 7.000%, 12/23/09* | | 1.1 | |
Pemex Project Funding Master Trust, 6.625%, 04/04/10* | | 1.1 | |
U.S. Treasury Bonds, 4.875%, 08/15/06 | | 1.1 | |
U.K. Gilts, 4.750%, 03/04/20* | | 1.1 | |
Citigroup, Inc.* | | 1.1 | |
France, Government of, 3.400%, 07/25/29* | | 1.1 | |
France, Government of, 8.500%, 10/25/19* | | 1.0 | |
U.K. Gilts, 4.000%, 03/07/09 | | 1.0 | |
| | | |
Top Ten as a Group | | 11.2 | % |
| | | |
| * | Top Ten Holding at April 30, 2006 |
Any sectors, industries, or securities discussed should not be perceived as investment recommendations. Mention of a specific security should not be considered a recommendation to buy or solicitation to sell that security.
7
Managers Fremont Global Fund
Schedule of Portfolio Investments
October 31, 2006
| | | | | |
| | | Shares | | Value |
Common Stocks - 66.7% | | | | | |
Consumer Discretionary - 8.7% | | | | | |
American Eagle Outfitters, Inc. | | 7,000 | | $ | 320,600 |
Aristocrat Leisure, Ltd. (Australia) | | 9,8883 | | | 106,591 |
A.T. Cross Co.* | | 1,800 | | | 12,384 |
Carphone Warehouse Group, The (United Kingdom) | | 95,652 | | | 516,042 |
Century Casinos, Inc.* | | 10,000 | | | 103,300 |
Coach, Inc. | | 25,000 | | | 991,000 |
Comcast Corp., Special Class A | | 24,6803 | | | 999,046 |
Continental AG (Germany) | | 5,600 | | | 627,364 |
Debenhams PLC (United Kingdom) | | 56,781 | | | 203,371 |
dELiA*s Corp.* | | 3,529 | | | 32,043 |
EMI Group PLC (United Kingdom) | | 92,251 | | | 474,324 |
Garmin, Ltd. (Cayman Islands) | | 7,5003 | | | 400,575 |
Harley-Davidson, Inc. | | 14,0003 | | | 960,820 |
Harris Interactive, Inc.* | | 14,100 | | | 94,188 |
Hyundai Motor Co. - Sponsored GDR (South Korea) (a) | | 1,2003 | | | 48,000 |
IMAX Corp. (Canada) | | 13,5003 | | | 66,015 |
J.C. Penney Co., Inc.* | | 9,760 | | | 734,245 |
KarstadtQuelle AG (Germany)* | | 2,6133 | | | 61,545 |
Kesa Electricals PLC (United Kingdom) | | 46,349 | | | 308,948 |
Koninklijke (Royal) Phillips Electronics N.V. (Netherlands) | | 14,453 | | | 503,439 |
Lakes Gaming, Inc.* | | 5,900 | | | 67,024 |
Leopalace21 Corp. (Japan) | | 3,200 | | | 120,168 |
Lowe’s Co., Inc. | | 47,7403 | | | 1,438,884 |
Marriott International, Inc. | | 3,4003 | | | 142,018 |
Nevada Gold & Casinos, Inc.* | | 9,000 | | | 48,960 |
News Corp., Inc., Class A* | | 43,000 | | | 896,550 |
NTL, Inc. | | 1,2003 | | | 32,436 |
Pantry, Inc., The* | | 2,6003 | | | 141,908 |
Persimmon PLC (United Kingdom) | | 4,200 | | | 106,912 |
Pinault-Printemps-Redoute SA (France) | | 2,778 | | | 414,270 |
Rakuten, Inc. (Japan)* | | 2313 | | | 102,507 |
Reed Elsevier PLC (United Kingdom) | | 24,570 | | | 279,320 |
Renault SA (France) | | 5,700 | | | 665,979 |
Scopus Video Neworks, Ltd. (Israel)* | | 9,4003 | | | 35,720 |
Sharp Corp. (Japan) | | 23,000 | | | 409,403 |
Starbucks Corp. | | 22,6003 | | | 853,150 |
SUZUKI MOTOR Corp. (Japan) | | 11,000 | | | 311,649 |
Swatch Group AG, The (Switzerland) | | 5,963 | | | 238,169 |
Target Corp. | | 2,600 | | | 153,868 |
Time Warner, Inc.* | | 48,0003 | | | 960,480 |
Toyota Motor Corp. (Japan) | | 11,300 | | | 667,214 |
Wyndham Worldwide Corp. | | 7,176 | | | 211,692 |
Total Consumer Discretionary | | | | | 15,862,121 |
| | |
Consumer Staples - 3.8% | | | | | |
Admiral Group PLC (United Kingdom)* | | 3,528 | | | 62,437 |
Boots Group PLC (United Kingdom) | | 25,012 | | | 386,369 |
British American Tobacco PLC (United Kingdom) | | 7,200 | | | 196,091 |
ConAgra Foods, Inc. | | 600 | | | 15,690 |
CVS Corp. | | 16,420 | | | 515,260 |
Del Monte Foods Co.* | | 4,2003 | | | 45,318 |
Deutche Luftansa AG (Germany) | | 12,600 | | | 291,344 |
Fomento Economico Mexicano SA de CV (Mexico) | | 1,600 | | | 154,704 |
Groupe Danone (France)* | | 3,888 | | | 569,228 |
J Sainsbury PLC (United Kingdom) | | 61,500 | | | 459,451 |
Japan Tobacco, Inc. (Japan) | | 250 | | | 1,088,114 |
Kroger Co.* | | 34,000 | | | 764,660 |
Nestle SA, Registered (Switzerland) | | 675 | | | 230,658 |
Parlux Fragrances, Inc. | | 6,200 | | | 42,966 |
Pilgrim’s Pride Corp., Class B | | 1,4003 | | | 34,972 |
Reckitt Benckiser PLC (United Kingdom) | | 8,103 | | | 352,265 |
Swedish Match AB (Sweden) | | 18,400 | | | 293,966 |
Tesco PLC (United Kingdom) | | 82,211 | | | 616,768 |
Walgreen Co. | | 17,000 | | | 742,560 |
Total Consumer Staples | | | | | 6,862,821 |
| | |
Energy - 4.4% | | | | | |
Anadarko Petroleum Corp. | | 1,200 | | | 55,704 |
Apache Corp.* | | 400 | | | 26,128 |
BP PLC (United Kingdom) | | 12,800 | | | 143,094 |
ChevronTexaco Corp. | | 20,100 | | | 1,350,720 |
China Petroleum and Chemical Corp., Class H (Hong Kong) | | 368,000 | | | 255,218 |
ConocoPhillips Co. | | 19,310 | | | 1,163,234 |
Devon Energy Corp. | | 15,800 | | | 1,056,072 |
Dynegy, Inc., Class A | | 26,600 | | | 161,728 |
Eni S.p.A. (Italy) | | 14,900 | | | 450,722 |
Helmerich & Payne, Inc. | | 3,000 | | | 71,850 |
Hess Corp. | | 6003 | | | 25,440 |
Linde AG (Germany) | | 1,057 | | | 104,894 |
Marathon Oil Corp. | | 200 | | | 17,280 |
The accompanying notes are an integral part of these financial statements.
8
Managers Fremont Global Fund
Schedule of Portfolio Investments (continued)
| | | | | |
| | | Shares | | Value |
Energy (continued) | | | | | |
Mirant Corp.* | | 6,400 | | $ | 189,248 |
MOL Magyar Olaj- es Gazipari Rt. (Hungary)* | | 1,970 | | | 195,922 |
Patterson-UTI Energy, Inc. | | 1,4003 | | | 32,480 |
PetroChina Co., Ltd. (China)* | | 100,000 | | | 110,356 |
Petroleo Brasileiro S.A. (Brazil) | | 5,300 | | | 429,088 |
Pride International, Inc.* | | 1,0003 | | | 27,610 |
Repsol YPF, S.A. (Spain) | | 11,200 | | | 372,334 |
Smith International, Inc.* | | 22,1003 | | | 872,508 |
SulphCo, Inc.* | | 12,9003 | | | 70,563 |
Tesoro Corp. | | 7,6003 | | | 485,944 |
Total SA (France) | | 4,8003 | | | 324,700 |
Valero Energy Corp.* | | 2,200 | | | 115,126 |
Total Energy | | | | | 8,107,963 |
| | |
Financials - 17.9% | | | | | |
Allianz AG (Germany) | | 1,802 | | | 334,852 |
Allstate Corp., The | | 6,780 | | | 416,021 |
American Express Co. | | 16,900 | | | 976,989 |
American Home Mortgage Investment Corp. | | 5,4003 | | | 184,518 |
American International Group, Inc. | | 15,740 | | | 1,057,256 |
Aviva PLC (United Kingdom) | | 30,100 | | | 444,616 |
Banco Bilbao Vizcaya Argentaria SA (Spain) | | 10,036 | | | 242,228 |
Bank of America Corp. | | 40,789 | | | 2,197,302 |
Barclays PLC (United Kingdom) | | 36,700 | | | 494,484 |
Bear, Stearns & Co., Inc.* | | 3,0003 | | | 454,050 |
Blackrock, Inc. | | 2,2003 | | | 331,848 |
BNP Paribas SA (France) | | 7,825 | | | 859,399 |
BOC Hong Kong Holdings, Ltd. (Hong Kong)* | | 128,500 | | | 287,134 |
British Land Co., PLC (United Kingdom) | | 12,105 | | | 345,184 |
Capital One Financial Corp. | | 4,240 | | | 336,359 |
Cash Systems, Inc.* | | 19,100 | | | 113,645 |
CB Richard Ellis Group, Inc. | | 29,700 | | | 891,891 |
Central Pacific Financial Corp. | | 1,400 | | | 51,506 |
Chicago Mercantile Exchange Holdings, Inc.* | | 2,0003 | | | 1,002,000 |
Chubb Corp. | | 11,890 | | | 631,954 |
Citigroup, Inc. | | 39,200 | | | 1,966,271 |
Corus Bankshares, Inc. | | 6,4003 | | | 131,392 |
Credit Agricole SA (France) | | 8,400 | | | 356,872 |
Credit Suisse Group (Switzerland) | | 8,200 | | | 494,304 |
Deutsche Boerse AG (Germany) | | 2,342 | | | 378,327 |
Erste Bank der oesterreichischen Sparkassen AG (Austria)* | | 4,360 | | | 296,603 |
Euronext NV (Netherlands) | | 1,011 | | | 100,953 |
Fannie Mae Co. | | 3,600 | | | 213,336 |
Fondiaria-Sai SpA (Italy) | | 4,200 | | | 186,847 |
Fondiaria-Sai SpA - RNC (Italy)* | | 600 | | | 19,927 |
Fortis (Belgium)* | | 6,100 | | | 255,790 |
Franklin Resources, Inc. | | 9,300 | | | 1,059,828 |
Friends Provident PLC (United Kingdom) | | 38,000 | | | 150,025 |
Goldman Sachs Group, Inc. | | 5,600 | | | 1,062,824 |
Hartford Financial Services Group, Inc.* | | 2,200 | | | 191,774 |
HBOS PLC (United Kingdom) | | 26,370 | | | 546,306 |
ING Groep NV (Netherlands) | | 19,700 | | | 872,478 |
JPMorgan Chase & Co. | | 10,400 | | | 493,376 |
KBC Bank & Insurance Group, Inc. (Belgium) | | 938 | | | 102,426 |
Kookmin Bank, Sponsored ADR (South Korea) | | 2,900 | | | 230,144 |
Lehman Brothers Holdings, Inc. | | 15,400 | | | 1,198,735 |
Man Group PLC (United Kingdom) | | 35,466 | | | 329,548 |
Merrill Lynch & Co., Inc. | | 6,100 | | | 533,262 |
MGIC Investment Corp.* | | 400 | | | 23,504 |
Moody’s Corp. | | 15,400 | | | 1,021,020 |
Morgan Stanley Co. | | 14,400 | | | 1,100,592 |
Muenchener Rueckversicherungs AG (Germany) | | 3,400 | | | 551,202 |
National City Corp. | | 3,800 | | | 141,550 |
North Fork Bancorporation, Inc. | | 14,740 | | | 421,269 |
ORIX Corp. (Japan) | | 2,990 | | | 840,890 |
PMI Group, Inc. | | 7,4003 | | | 315,610 |
Radian Group, Inc.* | | 5,6003 | | | 298,480 |
Royal Bank of Scotland Group PLC (United Kingdom) | | 15,900 | | | 566,011 |
Safeco Corp. | | 6,200 | | | 360,778 |
Shinsei Bank, Ltd. (Japan) | | 13,000 | | | 74,958 |
Shun TAK Holdings, Ltd. (Hong Kong) | | 190,000 | | | 250,681 |
Sino Land Co., Ltd. (Hong Kong)* | | 67,4013 | | | 117,174 |
Societe Generale (France) | | 2,730 | | | 453,220 |
Sovereign Bancorp, Inc. | | 8,610 | | | 205,435 |
Standard Bank Group, Ltd. (South Africa)* | | 17,500 | | | 205,634 |
Standard Chartered, PLC (United Kingdom)* | | 11,685 | | | 328,721 |
Sumitomo Mitsui Financial Group, Inc. (Japan) | | 48 | | | 524,558 |
The accompanying notes are an integral part of these financial statements.
9
Managers Fremont Global Fund
Schedule of Portfolio Investments (continued)
| | | | | |
| | | Shares | | Value |
Financials (continued) | | | | | |
Sumitomo Realty & Development Co., Ltd. (Japan)* | | 11,000 | | $ | 364,440 |
Thornburg Mortgage, Inc. | | 2,800 | | | 71,904 |
UBS AG (Switzerland) | | 7,000 | | | 417,987 |
Unibail (France) | | 6673 | | | 145,150 |
Washington Mutual, Inc. | | 24,900 | | | 1,053,270 |
Total Financials | | | | | 32,678,622 |
| | |
Health Care - 7.0% | | | | | |
Abbott Laboratories Co. | | 14,500 | | | 688,895 |
Aetna, Inc.* | | 6,200 | | | 255,564 |
Amgen, Inc.* | | 23,400 | | | 1,776,293 |
AngioDynamics, Inc.* | | 4,400 | | | 95,260 |
Applera Corp. - Applied Biosystems Group* | | 1,200 | | | 44,760 |
AstraZeneca PLC (United Kingdom) | | 5,195 | | | 306,154 |
AstraZeneca PLC - Sponsored ADR (United Kingdom) | | 9,400 | | | 551,780 |
Biogen Idec, Inc. | | 3,0003 | | | 142,800 |
Boston Scientific Corp. | | 33,760 | | | 537,122 |
Cardica, Inc.* | | 5,700 | | | 24,624 |
Cepheid, Inc.* | | 8,600 | | | 70,606 |
CIGNA Corp.* | | 600 | | | 70,188 |
Conceptus, Inc.* | | 10,900 | | | 216,038 |
Cyberonics, Inc. | | 2,700 | | | 48,681 |
Daiichi Sankyo Co., Ltd. (Japan)* | | 9,600 | | | 285,268 |
Eclipsys Corp.* | | 8,400 | | | 177,996 |
Eisai Co., Ltd. (Japan) | | 6,600 | | | 337,596 |
Elan Corp., PLC - Sponsored ADR (Ireland)* | | 14,6003 | | | 211,408 |
Essilor International SA (France) | | 2,225 | | | 233,206 |
Forest Laboratories, Inc. | | 4,200 | | | 205,548 |
Gilead Sciences, Inc. | | 14,4003 | | | 992,160 |
GlaxoSmithKline PLC (United Kingdom) | | 3,500 | | | 93,277 |
Harvard Bioscience, Inc.* | | 11,200 | | | 57,232 |
HCA, Inc.* | | 8,4403 | | | 426,389 |
ICON PLC (Ireland)* | | 2,600 | | | 93,288 |
Isis Pharmaceuticals, Inc. | | 7,600 | | | 65,208 |
Kinetic Concepts, Inc. | | 2,8003 | | | 97,328 |
King Pharmaceuticals, Inc. | | 11,600 | | | 194,068 |
Magellan Health Services, Inc.* | | 4,2003 | | | 183,288 |
Medtronic, Inc. | | 16,400 | | | 798,352 |
Merck & Co., Inc.* | | 8,600 | | | 390,612 |
Mylan Laboratories, Inc.* | | 17,0003 | | | 348,500 |
NeoPharm, Inc.* | | 23,262 | | | 168,417 |
Nobel Biocare Holding AG (Switzerland) | | 630 | | | 172,369 |
NxStage Medical, Inc.* | | 4,300 | | | 31,519 |
Omnicell, Inc.* | | 10,300 | | | 192,919 |
Pfizer, Inc. | | 34,000 | | | 906,100 |
Regeneration Technologies, Inc.* | | 27,600 | | | 175,812 |
Roche Holding AG (Switzerland) | | 1,026 | | | 179,641 |
Sanofi -Synthelabo SA (France)* | | 5,172 | | | 440,404 |
Sierra Health Services, Inc. | | 5,8003 | | | 198,592 |
Tenet Healthcare Corp.* | | 8,8003 | | | 62,128 |
UCB SA (Belgium) | | 1,5473 | | | 95,681 |
Vital Images, Inc. | | 2,200 | | | 68,288 |
Total Health Care | | | | | 12,711,359 |
| | |
Industrials - 7.9% | | | | | |
Air France - KLM (France) | | 4,600 | | | 163,841 |
BAE Systems PLC (United Kingdom) | | 36,800 | | | 294,234 |
British Airways PLC (United Kingdom)* | | 25,243 | | | 220,797 |
Buzzi Unicem S.p.A (Italy) | | 9,100 | | | 239,747 |
Caterpillar, Inc. | | 12,000 | | | 728,520 |
Coinstar, Inc.* | | 1,200 | | | 36,456 |
Cummins, Inc. | | 2,000 | | | 253,960 |
Eaton Corp. | | 3,800 | | | 275,234 |
Emerson Electric Co. | | 8,150 | | | 687,860 |
European Aeronautic Defense and Space Co. (Netherlands) | | 8,4003 | | | 227,503 |
Flow International Corp.* | | 9,700 | | | 114,266 |
Fuel Tech, Inc.* | | 1,800 | | | 35,370 |
General Electric Co. | | 46,200 | | | 1,622,081 |
Global Traffic Network, Inc.* | | 14,300 | | | 71,071 |
Honeywell International, Inc. | | 11,100 | | | 467,532 |
InnerWorkings, Inc.* | | 3,600 | | | 53,820 |
Insituform Technologies, Inc.* | | 800 | | | 18,696 |
KVH Industries, Inc.* | | 4,600 | | | 50,232 |
Lennox International, Inc. | | 8,000 | | | 215,680 |
Lockheed Martin Corp. | | 9,900 | | | 860,607 |
Masco Corp. | | 23,2003 | | | 641,480 |
Mitsui O.S.K. Lines, Ltd. (Japan) | | 25,000 | | | 208,185 |
Northrop Grumman Corp. | | 10,800 | | | 717,012 |
PACCAR, Inc.* | | 2,700 | | | 159,867 |
Parker Hannifin Corp. | | 5,200 | | | 434,876 |
PDG Environmental, Inc.* | | 44,500 | | | 44,500 |
Pitney Bowes, Inc. | | 17,600 | | | 822,096 |
Potash Corp. of Saskatchewan, Inc. (Canada) | | 900 | | | 112,410 |
The accompanying notes are an integral part of these financial statements.
10
Managers Fremont Global Fund
Schedule of Portfolio Investments (continued)
| | | | | |
| | | Shares | | Value |
Industrials (continued) | | | | | |
Powell Industries, Inc.* | | 4,700 | | $ | 112,659 |
Raytheon Co. | | 14,600 | | | 729,270 |
Reliance Steel & Aluminum Co. | | 2,400 | | | 82,440 |
Ryanair Holdings PLC (Ireland)* | | 4,5003 | | | 300,690 |
Ryder System, Inc.* | | 400 | | | 21,060 |
SNC-Lavalin Group, Inc. (Canada) | | 7,900 | | | 215,694 |
Stanley, Inc.* | | 2,900 | | | 50,518 |
Sumitomo Heavy Industries, Ltd. (Japan) | | 31,000 | | | 265,089 |
TVI Corp.* | | 58,200 | | | 171,690 |
Tyco International, Ltd. | | 23,400 | | | 688,662 |
United Technologies Corp. | | 22,000 | | | 1,445,840 |
Wright Express Corp. (France) | | 2,139 | | | 531,692 |
Total Industrials | | | | | 14,393,237 |
| | |
Information Technology - 10.3% | | | | | |
Acacia Research Corp.* | | 3,800 | | | 48,564 |
Access Integrated Technologies, Inc.* | | 4,600 | | | 48,944 |
Airspan Networks, Inc. | | 32,000 | | | 94,400 |
Aladdin Knowledge Systems, Ltd. (Israel)* | | 3,300 | | | 58,938 |
Alcatel SA (France) | | 8,026 | | | 101,887 |
Anaren Microwave, Inc.* | | 6,000 | | | 120,660 |
Apple Computer, Inc. | | 13,6003 | | | 1,102,688 |
Applied Materials, Inc. | | 32,800 | | | 570,392 |
ARM Holdings PLC (United Kingdom)* | | 129,180 | | | 289,671 |
Arrow Electronics, Inc.* | | 5,200 | | | 155,220 |
ASML Holding N.V. (Netherlands)* | | 9,976 | | | 227,637 |
Astro-Med, Inc. | | 5,425 | | | 55,118 |
ATMI, Inc.* | | 11,900 | | | 377,111 |
AudioCodes, Ltd. (Israel)* | | 25,200 | | | 279,216 |
Avaya, Inc. | | 4,2003 | | | 53,802 |
Bottomline Technologies, Inc.* | | 4,100 | | | 39,688 |
CalAmp Corp.* | | 17,600 | | | 117,040 |
Canon, Inc. (Japan) | | 3,700 | | | 197,603 |
Ceragon Networks, Ltd. (Israel)* | | 18,900 | | | 101,871 |
Cisco Systems, Inc.* | | 45,100 | | | 1,088,262 |
Cognizant Technology Solutions Corp.* | | 13,800 | | | 1,038,864 |
CommVault Systems, Inc.* | | 2,900 | | | 51,823 |
Eagle Test Systems, Inc.* | | 3,200 | | | 56,320 |
eCollege.com* | | 8,600 | | | 148,780 |
EDGAR Online, Inc.* | | 11,7003 | | | 42,354 |
Elpida Memory, Inc. (Japan) | | 5,700 | | | 265,762 |
EMCORE Corp.* | | 12,000 | | | 69,000 |
Equinix, Inc.* | | 6,7003 | | | 458,280 |
Exar Corp.* | | 1,600 | | | 20,752 |
Exfo Electro-Optical Engineering, Inc. (Canada) | | 33,200 | | | 163,676 |
FEI Co.* | | 11,800 | | | 269,748 |
First Data Corp. | | 11,3503 | | | 275,238 |
Flextronics International, Ltd. (Singapore)* | | 14,100 | | | 163,560 |
Global Payments, Inc.* | | 1,600 | | | 69,936 |
Google, Inc.* | | 3,100 | | | 1,476,808 |
High Tech Computer Corp. (Taiwan) | | 1,000 | | | 99,218 |
HON HAI Precision Industry Co., Ltd. (Taiwan) | | 30,234 | | | 391,787 |
Identity Solutions, Inc.* | | 5,492 | | | 78,591 |
IKON Office Solutions, Inc. | | 3,400 | | | 50,694 |
Imation Corp. | | 6003 | | | 27,462 |
Ingram Micro, Inc., Class A* | | 7,200 | | | 148,392 |
Intel Corp.* | | 25,974 | | | 554,285 |
Intergraph Corp.* | | 4,200 | | | 183,498 |
Internap Network Services Corp.* | | 7,520 | | | 123,930 |
International Business Machines Corp. | | 9,150 | | | 844,820 |
Lightbrigde, Inc.* | | 5,000 | | | 57,800 |
Logitech International S.A. (Switzerland)* | | 19,696 | | | 517,574 |
Motorola, Inc.* | | 4,600 | | | 106,076 |
NCI, Inc., Class A * | | 4,500 | | | 52,245 |
NCR Corp. | | 600 | | | 24,912 |
Nintendo Co., Ltd. (Japan) | | 2,300 | | | 470,051 |
Omniture, Inc.* | | 3,600 | | | 32,688 |
Online Resources Corp.* | | 9,500 | | | 99,370 |
Openwave Systems, Inc.* | | 6,500 | | | 56,095 |
OPNET Technologies, Inc.* | | 6,000 | | | 87,720 |
Optibase Ltd. (Israel)* | | 29,000 | | | 85,840 |
Optical Communication Products, Inc.* | | 38,100 | | | 81,915 |
Oracle Corp.* | | 33,300 | | | 615,051 |
Pericom Semiconductor Corp.* | | 3,900 | | | 37,479 |
Photon Dynamics, Inc.* | | 8,600 | | | 102,082 |
Power Integrations, Inc.* | | 9,300 | | | 204,042 |
Quanta Computer, Inc. (Taiwan) | | 24,400 | | | 180,838 |
Rae Systems, Inc.* | | 11,700 | | | 45,162 |
Research In Motion, Ltd. (Canada)* | | 5,2003 | | | 610,896 |
RightNow Technologies, Inc.* | | 600 | | | 9,912 |
Rudolph Technologies, Inc.* | | 3,500 | | | 61,810 |
Sabre Holdings Corp.* | | 4,200 | | | 106,764 |
Samsung Electronics Co., Ltd., GDR (South Korea) (a) | | 2,013 | | | 652,697 |
The accompanying notes are an integral part of these financial statements.
11
Managers Fremont Global Fund
Schedule of Portfolio Investments (continued)
| | | | | |
| | | Shares | | Value |
Information Technology (continued) | | | | | |
Silicon Motion Technology Corp., ADR (Taiwan)* | | 2,900 | | $ | 44,573 |
Simpletech, Inc.* | | 11,100 | | | 96,126 |
SRS Labs, Inc.* | | 16,800 | | | 106,008 |
Standard Microsystems Corp. | | 2,000 | | | 61,660 |
Stratasys, Inc.* | | 2,700 | | | 75,276 |
Symantec Corp. | | 35,7003 | | | 708,288 |
Taiwan Semiconductor Manufacturing Co., Ltd., Sponsored ADR (Taiwan) | | 27,5683 | | | 267,410 |
Techwell, Inc.* | | 9,600 | | | 145,056 |
Terayon Communication Systems, Inc. | | 72,700 | | | 111,958 |
The Knot, Inc.* | | 2,800 | | | 67,116 |
Tokyo Electron, Ltd. (Japan) | | 600 | | | 44,753 |
Xerox Corp. | | 37,0703 | | | 630,190 |
Total Information Technology | | | | | 18,859,723 |
| | |
Materials - 2.3% | | | | | |
BASF AG (Germany) | | 2,500 | | | 220,748 |
Calgon Carbon Corp.* | | 14,200 | | | 65,604 |
Cameco Corp. (Canada)* | | 6,300 | | | 221,319 |
Cemex SA de CV (Mexico) | | 14,960 | | | 459,870 |
Compania Vale do Rio Doce - ADR (Brazil)* | | 3,200 | | | 81,408 |
JFE Holdings, Inc. (Japan)* | | 14,300 | | | 574,230 |
Louisana-Pacific Corp. | | 4,0003 | | | 79,120 |
Lyondell Chemical Co.* | | 6,8003 | | | 174,556 |
Mitsui Chemicals, Inc. (Japan) | | 27,000 | | | 185,024 |
Mittal Steel Co. NV (Netherlands) | | 7,379 | | | 316,084 |
Northern Technologies International Corp.* | | 6,950 | | | 66,025 |
Nucor Corp.* | | 1,8003 | | | 105,138 |
Phelps Dodge Corp. | | 4,400 | | | 441,672 |
POSCO, Sponsored ADR (South Korea) | | 5,3003 | | | 373,756 |
Salzgitter AG (Germany) | | 2,135 | | | 229,142 |
Symyx Technologies, Inc.* | | 4,200 | | | 103,110 |
Xstrata PLC (United Kingdom)* | | 10,401 | | | 442,875 |
Total Materials | | | | | 4,139,681 |
| | |
Telecommunication Services - 2.7% | | | | | |
America Movil , S.A. de C.V. (Mexico) | | 22,000 | | | 943,140 |
Centurytel, Inc. | | 10,6003 | | | 426,544 |
China Mobile Ltd. (Hong Kong) | | 14,500 | | | 117,798 |
China Netcom Group Corp., (HK) Ltd. (Hong Kong)* | | 116,0003 | | | 205,859 |
Cogent Comminications Group, Inc.* | | 10,100 | | | 143,016 |
Iliad SA (France)* | | 1,559 | | | 132,707 |
Nippon Telegraph & Telephone Corp. (Japan) | | 43 | | | 216,007 |
Qwest Communications International, Inc. | | 24,6003 | | | 212,298 |
Rogers Communications, Inc. (Canada)* | | 5,000 | | | 299,167 |
Sprint Nextel* | | 39,7033 | | | 742,049 |
TeleCommunication Systems, Inc. | | 24,9003 | | | 80,925 |
Verizon Communications, Inc. | | 23,530 | | | 870,610 |
Vodaphone Group PLC (United Kingdom) | | 210,088 | | | 541,344 |
Total Telecommunication Services | | | | | 4,931,464 |
| | |
Utilities - 1.7% | | | | | |
Alliant Energy Corp. | | 4,600 | | | 176,410 |
American Electric Power Co., Inc.* | | 7,200 | | | 298,296 |
E.ON AG (Germany) | | 3,400 | | | 409,403 |
Endesa, S.A. (Spain) | | 1,700 | | | 74,585 |
Energen Corp.* | | 7,800 | | | 333,996 |
Exelon Corp. | | 11,300 | | | 700,374 |
FirstEnergy Corp. | | 2,600 | | | 153,010 |
National Fuel Gas Co. | | 1,600 | | | 59,840 |
RWE AG (Germany) | | 3,370 | | | 333,777 |
Veolia Environnement (France) | | 8,699 | | | 532,344 |
Total Utilities | | | | | 3,072,035 |
Total Common Stocks (cost $100,461,408) | | | | $ | 121,619,026 |
The accompanying notes are an integral part of these fi nancial statements.
12
Managers Fremont Global Fund
Schedule of Portfolio Investments (continued)
| | | | | | |
Security Description | | Principal Amount | | Value |
Corporate Bonds - 10.5% | | | | | | |
Banque De Tunisie, 3.300%, 08/02/10 | | JPY | 100,000,000 | | $ | 904,477 |
BAT International Finance PLC, 5.125%, 07/09/13 | | EUR | 1,000,000 | | | 1,328,792 |
Deutsche Bahn Finance BV, 5.000%, 06/10/08 | | EUR | 2,000,000 | | | 1,328,094 |
Fidelity International Ltd., 6.250%, 03/21/12 | | EUR | 1,000,000 | | | 1,394,642 |
Ford Credit of Canada Ltd., 7.250%, 12/07/07 | | GBP | 500,000 | | | 952,357 |
France Telecom SA, 7.000%, 12/23/09 | | EUR | 1,500,000 | | | 2,076,840 |
General Electric Capital Australia Funding Property Ltd., 7.000%, 09/15/09 | | AUD | 2,000,000 | | | 1,566,322 |
General Electric Capital Corp., 5.250%, 04/15/13 5 | | USD | 1,000,000 | | | 974,862 |
General Electric Capital Corp., Series A, 5.430%, 01/03/08, (01/03/07) 1 | | USD | 1,000,000 | | | 1,001,640 |
General Motors Acceptance Corp., 7.500%, 12/01/06 | | NZD | 1,000,000 | | | 668,344 |
Glencore Funding LLC, 6.000%, 04/15/04 (a) | | USD | 500,000 | | | 486,401 |
HSBC Finance Corp., 1.790%, 09/18/15 | | USD | 100,000,000 | | | 837,300 |
Kazkommerts International BV, 7.875%, 04/07/14 (a) | | USD | 1,750,000 | | | 1,809,063 |
Pacific Life Funding LLC, 6.500%, 04/15/08 | | AUD | 1,000,000 | | | 772,130 |
Pemex Project Funding Master Trust, 6.625%, 04/04/10 | | EUR | 1,500,000 | | | 2,050,771 |
Shinhan Bank, 5.663%, 03/02/35 5 | | EUR | 1,000,000 | | | 942,075 |
Total Corporate Bonds (cost $18,253,333) | | | | | | 19,094,110 |
Foreign Government - 14.6% | | | | | | |
Bonos Y Obligaciones Del Estado (Spain), 5.500%, 07/30/17 | | EUR | 1,000,000 | | | 1,465,782 |
Canadian Government Real Return Bonds, 4.500%, 06/01/15 | | CAD | 1,700,000 | | | 1,568,308 |
Canadian Government Real Return Bonds, 5.250%, 06/01/13 | | CAD | 1,600,000 | | | 1,530,426 |
Deutschland Republic, 3.250%, 07/04/15 | | EUR | 1,000,000 | | | 1,233,702 |
Development Bank of Japan, 1.700%, 09/20/22 | | JPY | 100,000,000 | | | 795,126 |
Eurofima, 6.000%, 01/28/14 | | AUD | 2,000,000 | | | 1,533,993 |
Finnish Government, 5.750%, 02/23/11 | | EUR | 1,000,000 | | | 1,380,016 |
France, Government of, 3.000%, 07/25/12 | | EUR | 1,101,880 | | | 1,512,894 |
France, Government of, 3.150%, 07/25/32 | | EUR | 626,626 | | | 1,049,249 |
France, Government of, 3.400%, 07/25/29 | | EUR | 1,164,096 | | | 1,955,567 |
France, Government of, 8.500%, 10/25/19 | | EUR | 1,000,470 | | | 1,884,720 |
International Finance Corp., 6.750%, 07/15/09 | | NZD | 1,000,000 | | | 659,250 |
Norwegian Government, 5.000%, 05/15/15 | | NOK | 15,500,000 | | | 2,505,831 |
Norwegian Government, 5.500%, 05/15/09 | | NOK | 6,000,000 | | | 950,660 |
Norwegian Government, 6.000%, 05/16/11 | | NOK | 5,000,000 | | | 823,646 |
Singapore, Government of, 3.500%, 07/01/12 | | SGD | 1,600,000 | | | 1,048,750 |
Singapore, Government of, 3.625%, 07/01/14 | | SGD | 1,500,000 | | | 994,506 |
U.K. Gilts, 4.000%, 03/07/09 | | GBP | 1,000,000 | | | 1,868,533 |
U.K. Gilts, 4.750%, 03/04/20 | | GBP | 1,000,000 | | | 1,971,672 |
Total Foreign Government (cost $24,113,731) | | | | | | 26,732,631 |
U.S. Government and Agency Obligations - 3.7% | | | | | | |
Federal National Mortgage Association - 0.9% | | | | | | |
FNMA, 6.000%, 10/01/24 | | USD | 658,821 | | | 668,018 |
The accompanying notes are an integral part of these financial statements.
13
Managers Fremont Global Fund
Schedule of Portfolio Investments (continued)
| | | | | | | | |
Security Description | | Principal Amount | | | Value | |
Federal National Mortgage Association (continued) | | | | | | | | |
FNMA Gold Pool, 5.500%, 12/01/15 | | USD | 906,850 | | | $ | 910,471 | |
Total Federal National Mortgage Association | | | | | | | 1,578,489 | |
United States Treasury Bonds - 2.8% | | | | | | | | |
U.S. Treasury Bonds, 2.000%, 01/15/14 to 01/15/06 | | USD | 2,130,700 | 3 | | | 2,074,099 | |
U.S. Treasury Bonds, 4.875%, 08/15/06 | | USD | 2,000,000 | 3 | | | 2,042,188 | |
U.S. Treasury Inflation Indexed Bonds, 0.875%, 04/15/10 | | USD | 1,076,230 | | | | 1,014,516 | |
Total United States Treasury Bonds | | | | | | | 5,130,803 | |
Total U.S. Government and Agency Obligations (cost $6,836,807) | | | | | | | 6,709,292 | |
| | |
| | | Shares | | | | |
Warrants - 0.2% | | | | | | | | |
AU Optronics Corp. (Luxembourg) | | | 146,400 | | | | 197,640 | |
United Microelectronics Corp. (Taiwan) | | | 337,828 | | | | 188,508 | |
Total Warrants (cost $437,255) | | | | | | | 386,148 | |
Other Investment Companies - 16.8%4 | | | | | | | | |
Bank of New York Institutional Cash Reserves Fund, 5.32%2 | | | 23,917,531 | | | | 23,917,531 | |
JPMorgan Prime Money Market Fund, Institutional Class Shares, 5.18% | | | 6,769,386 | | | | 6,769,386 | |
Total Other Investment Companies (cost $30,686,917) | | | | | | | 30,686,917 | |
Total Investments - 112.5% (cost $180,789,451) | | | | | | | 205,228,124 | |
Other Assets, less Liabilities - (12.5)% | | | | | | | (22,840,875 | ) |
Net Assets - 100.0% | | | | | | $ | 182,387,249 | |
The accompanying notes are an integral part of these financial statements.
14
Managers Small Cap Fund
Portfolio Manager’s Comments
Managers Small Cap Fund seeks to achieve long-term capital appreciation by investing primarily in the stocks of small-capitalization companies.
TimesSquare Capital Management, LLC
TimesSquare Capital Management LLC (“TimesSquare”) utilizes a bottom-up fundamental approach to small-cap investing. Led by co-managers Yvette Bockstein, Grant Babyak, and Ken Duca, the investment team at TimesSquare believes its proprietary fundamental research skills, which place a particular emphasis on the assessment of management quality and an in-depth understanding of superior business models, enable the team to build a diversified portfolio of small-cap growth stocks designed to generate good risk-adjusted returns. When selecting small-cap growth stocks, Fund management utilizes a fundamental, bottom-up process to identify companies that demonstrate consistent and sustainable revenue and earnings growth, offer distinct and sustainable competitive advantages, have strong, experienced management teams, have stocks selling at reasonable valuations, and that Fund management believes have the potential to appreciate in price by 25-50% within the next 12-18 months.
The Year in Review
Good things come in small packages. Much to the surprise of many investment strategists, small-cap stocks are not easily ceding their lead to the larger-cap stocks. Good earnings growth paved the way as small-cap stocks moved in a steady upward trajectory for most of the last twelve months. Worries of rising oil prices and tensions in the Middle East briefly weighed more heavily on the small-caps than on the large-caps in the Spring and early Summer, but when the armed conflict in Lebanon calmed down, when oil prices took a tumble, and when the Fed stopped tightening, the market responded favorably and resumed its upward trek with small caps reasserting their lead, posting solid double-digit returns for the twelve months ended October 31st, ahead of the large caps. The Russell 2000 Index rose 20.0% for the period vs. 16.0% for the Russell 1000 Index. Because the sell-off was crueler to the growth stocks, small-cap value stocks came out on top for the twelve months; the Russell 2000 Value Index was up 22.9% vs. 17.1% for the Russell 2000 Growth Index.
Within the market, double digit returns were to be found across the board in all economic sectors. The Energy sector responded to rising oil and gas prices early in the period but then rolled over as the commodity prices faded. Technology stocks took a beating during the correction but rebounded nicely, though not enough to make it one of the stronger sectors. Financial services did well in anticipation of the end of the Fed’s tightening. Health care stocks provided decent returns though they were among the less robust sectors of the benchmark.
Given that our process is strictly a bottom-up one that focuses on identifying quality managements with superior business models, that demonstrate sustainable competitive advantage and good sales and earnings growth, it is not surprising that stock selection was entirely responsible for the Fund’s solid outperformance over the last twelve months. Strong relative stock selection was evident across almost every sector. Favorable results came from the Fund’s financial services, health care, technology, and consumer discretionary holdings. Disappointments came from a couple of holdings in the energy sector and a couple of Technology companies.
Though banks stocks were not the place to be over the past twelve months, the rest of the Financial Services sector did well enough to make it one of the better performing sectors. Our holdings strongly outperformed the sector. The portfolio’s top contributor for the period was Alliance Data Systems, up almost 71%. The provider of transaction services, credit services, and marketing services, reported stronger than expected earnings. Fundamentals remain strong as the company is experiencing solid business momentum in all segments. Credit trends also remain better than expected for its private label credit card business. The Fund also benefited from a strong contribution from Trammell Crow, which provides commercial real estate services, up approximately 92%. As the period was coming to a close CB Richard Ellis signed an agreement to acquire it for $49.51 per share in cash. Cohen & Steers, an investment manager of equity portfolios specializing in real estate investment trusts, has been experiencing good asset flows into its products and the stock soared 92%. Options securities broker OptionsXpress reported good quarterly earnings; resulting in a 66% increase in the stock price.
The wave of mergers and acquisitions and management buyouts was evident throughout the year within our portfolio and contributed to the outperformance of our holdings in the consumer discretionary sector. In particular, education services provider Education Management announced it is going private, in a private equity deal with Goldman Sachs and Providence Equity Partners. The stock rose 39% over the period and was the second largest contributor to results. West Corporation, a leading provider of outsourced communication solutions, announced that it would go private in a transaction sponsored by an investor group; it rose approximately 23%, making a good contribution. Both positions are now gone from the portfolio as the deals have been consummated. Pool Corporation, the largest wholesale distributor of swimming pool products and one of the larger positions in the portfolio has been constrained of late because of its perceived ties to residential construction. Though we don’t agree that the slowdown in housing significantly impacts the company, the current perception is otherwise. Nevertheless the stock returned a respectable 15% for the full year. We eliminated our position in Radio One as the deteriorating industry fundamentals proved to be too big of a headwind for the company; the stock returned -40% for the period, one of the bottom contributors.
Our results in health care added good relative value and though the benchmark sector fell a little short of the Russell 2000 Growth Index return, our holdings outperformed even the overall benchmark. Our focus on the services businesses continued to add value. Within our services holdings, we have been adding to our position in Magellan Health Services. The provider of mental health services completed its acquisition of National Imaging Associates, a privately held radiology benefits management firm. This new direction should create substantial growth opportunities; the position returned almost 47%. The company just recently signed a major contract for this business and fundamentals look attractive. We have been gradually scaling out of a position in kidney dialysis services provider DaVita due to its larger capitalization. It added another 13% to last year’s excellent return. On the negative side, we sold Allion Healthcare, a national provider of specialty pharmacy and disease management services focused on HIV/AIDS patients; we were disappointed with management’s execution of its business strategy. The small position was the portfolio’s worst
15
Managers Small Cap Fund
Portfolio Manager’s Comments (continued)
contributor, down 74%. Biotech and pharmaceuticals were laggards in the benchmark. Though underweighted, our biotech and pharmaceutical holdings generally provided excellent returns to the portfolio. Results were bolstered by a good contribution from Biomarin Pharmaceuticals, a position we had added to over the period. It is one of the few biotechnology companies focused on enzyme replacement therapies for rare genetic diseases, a niche market with low clinical and regulatory risks and high barriers to entry. It was up approximately 90% for the period with successful launches of a couple of products and with news that the FDA approved its orally administered version of prednisolone for acute asthma in children. The company has a solid pipeline of products which we believe gives it one of the best growth profiles in biotech.
Our holdings within the industrials sector added excellent value to results both on an absolute and relative basis. We recently increased our position in Orbital Sciences, which develops and manufactures small rockets and space systems for commercial, military, and civil government customers in the United States. The company won several contracts, increasing the visibility into its favorable outlook for 2007. The stock made a solid contribution with its 56% return. In addition, an excellent contribution came from Manitowoc, up 46%. The manufacturer of construction cranes reported strong earnings benefiting from the strong commercial construction cycle. We sold the position when it reached our price target and were out by the end of July. Documents management software company American Reprographics, which provides document management services to the architectural, engineering, and construction industries was among the top contributors, up 110%, a beneficiary of the strength of the commercial construction cycle.
Technology holdings outperformed the benchmark sector and made a modest total contribution to overall results. A poor contribution was made by Wind River System, down 38%. We sold the supplier of software solutions and development tools for embedded systems as we got concerned about the competitive landscape and a change in management. Atheros Communications, a market share leader in the design and development of wireless semiconductor products, reported much better than expected fourth quarter earnings and experienced strong near-term business conditions. We sold the position at our price target in anticipation of challenges for some of their new products; the position returned 73%. Microsemi, which makes specialized semiconductors that manage and control or regulate power, reported better than expected results at the end of July with its chips gaining market share in notebooks, but then sold off sharply in September as the company pre-announced a small disappointment citing overall weakness in its markets; our position returned -17% for the period and was among the poorer contributors.
It was an incredibly volatile twelve months for the energy sector with the stocks down late in 2005, soaring in the first half of calendar 2006, before reversing much of the gains in the latter part of the period. Stock prices followed the volatile oil and gas prices. The benchmark sector managed to pull out double digit returns; our holdings did not and produced some of the portfolio’s poorer contributors. TODCO, which provides oil and gas drilling services, primarily in the Gulf of Mexico is dependent on the supply of drilling rigs and the day rates for these services. Day rates have seen some softening and the stock was a detractor for the period, down 23%. Our holdings that were more levered to natural gas prices suffered. In particular, Brigham Exploration, which reported some mixed quarters depreciated by 35%. Offsetting some of the detractors was a stellar contribution from Universal Compression, which provides compression services to the domestic and international natural gas industry. The company actually raised its revenue and earnings guidance over the course of the year. In a move to unlock values, the company restructured to offload debt through the initial public offering of its natural-gas-compression-services business, as a master limited partnership; the stock was up 69% over the period.
Looking Forward
Small caps are not inexpensive relative to the large caps and strategists have been saying for a while that the large caps are the place to be. However our research has shown that more often than not, long-term performance is on the side of the small caps. The pace of small-cap mergers and acquisitions in 2006 is on track to surpass the 2005 level and has traditionally been associated with a good small cap market. Leveraged buyouts in the small cap space continue to rise to levels not seen since the late 1980s.
Though value stocks have stood their ground and proven difficult to overtake, valuation parameters continue to support a move into the growth stocks. This has been the case for a while yet valuation by itself is not an impetus for leadership change. The Fed is in a wait and see mode as the economy has some signs of slowing, but core inflation remains above its comfort zone of 1.5% to 2%. If the weakening economy succeeds in bringing down core inflation, the Fed may shift into reverse, cutting rates. When that happens, we believe the catalyst to get growth stocks going will be in place. In the meantime, we continue to find good opportunities within this universe from quality growth companies with sound business models and great management teams with the potential to generate strong, consistent growth in their businesses.
(continued on next page)
16
Managers Small Cap Fund
Portfolio Manager’s Comments (continued)
Cumulative Total Return Performance
The Fund’s cumulative total return is based on the daily change in net asset value (NAV), and assumes that all distributions were reinvested. The Russell 2000 Growth Index measures the performance of the Russell 2000 companies with higher price to-book ratios and higher forecasted growth values. Unlike the Fund, the Russell 2000 Growth Index is unmanaged, is not available to investment, and does not incur expenses. The chart illustrates the performance of a hypothetical $10,000 investment made in the Managers Small Cap Fund on September 24, 1997, to a $10,000 investment made in the Russell 2000 Growth Index for the same period. Performance for periods longer than one year is annualized. The graph and table do not reflect the deduction of taxes that a shareholder would pay on a Fund distribution or redemption of shares. The listed returns for the Fund are net of expenses and the returns for the index exclude expenses. Total returns for the Fund would have been lower had certain expenses not been reduced.
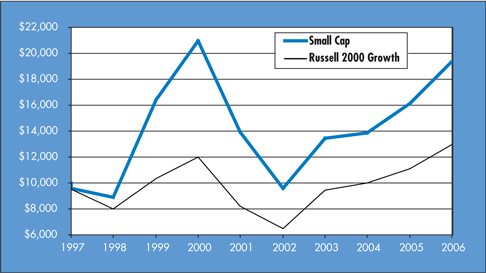
The table below shows the average annual total returns for the Managers Small Cap Fund and the Russell 2000 Growth Index since inception through October 31, 2006.
| | | | | | | | | |
Average Annual Total Returns | | One Year | | | Five Years | | | Since Inception* | |
Small Cap | | 20.02 | % | | 6.84 | % | | 7.53 | % |
Russell 2000 Growth Index | | 17.07 | % | | 9.51 | % | | 2.90 | % |
| * | Commencement of operations was September 24, 1997. |
The performance data shown represents past performance. Past performance is not a guarantee of future results. Current performance may be lower or higher than the performance data quoted. The investment return and the principal value of an investment will fluctuate so that an investor’s shares, when redeemed, may be worth more or less than their original cost. For performance information through the most recent month end please call (800) 835-3879 or visit our Web site at www.managersinvest.com.
The Fund is subject to risks associated with investments in small-capitalization companies, such as erratic earnings patterns, competitive conditions, limited earnings history, and a reliance on one or a limited number of products.
17
Managers Small Cap Fund
Fund Snapshots
October 31, 2006
Portfolio Breakdown
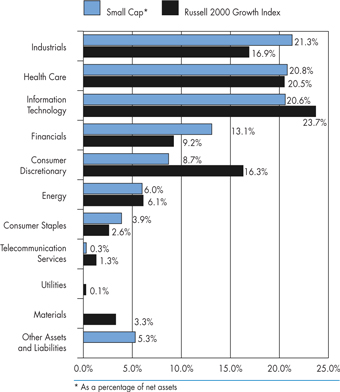
| | | | | | |
Industry | | Small Cap* | | | Russell 2000 Growth Index | |
Industrials | | 21.3 | % | | 16.9 | % |
Health Care | | 20.8 | % | | 20.5 | % |
Information Technology | | 20.6 | % | | 23.7 | % |
Financials | | 13.1 | % | | 9.2 | % |
Consumer Discretionary | | 8.7 | % | | 16.3 | % |
Energy | | 6.0 | % | | 6.1 | % |
Consumer Staples | | 3.9 | % | | 2.6 | % |
Telecommunication Services | | 0.3 | % | | 1.3 | % |
Utilities | | 0.0 | % | | 0.1 | % |
Materials | | 0.0 | % | | 3.3 | % |
Other Assets and Liabilities | | 5.3 | % | | 0.0 | % |
Top Ten Holdings
| | | |
Security Name | | Percentage of Net Assets | |
Alliance Data Systems Corp.* | | 3.4 | % |
SCP Pool Corp.* | | 2.5 | |
Universal Compression Holdings, Inc.* | | 1.8 | |
Magellan Health Services, Inc. | | 1.6 | |
Mobile Mini, Inc.* | | 1.6 | |
Corporate Executive Board Co.* | | 1.6 | |
Global Payments, Inc. | | 1.6 | |
Trammell Crow Co. | | 1.5 | |
DaVita, Inc.* | | 1.5 | |
Resources Connection, Inc. | | 1.4 | |
| | | |
Top Ten as a Group | | 18.5 | % |
| | | |
| * | Top Ten Holding at April 30, 2006 |
Any sectors, industries, or securities discussed should not be perceived as investment recommendations. Mention of a specific security should not be considered a recommendation to buy or solicitation to sell that security.
18
Managers Small Cap Fund
Schedule of Portfolio Investments
October 31, 2006
| | | | | | |
| | | Shares | | | Value |
Common Stocks - 94.7% | | | | | | |
| | |
Consumer Discretionary - 8.7% | | | | | | |
Aaron Rents, Inc. | | 16,900 | 3 | | $ | 420,472 |
Gaylord Entertainment Co., Class A* | | 19,000 | 3 | | | 884,260 |
Hibbett Sporting Goods, Inc. | | 13,500 | | | | 394,740 |
Marvel Entertainment, Inc.* | | 18,600 | 3 | | | 471,510 |
Monro Muffler Brake, Inc. | | 16,200 | | | | 614,466 |
Orient-Express Hotels, Ltd. | | 20,900 | | | | 824,505 |
Outdoor Channel Holdings, Inc.* | | 31,600 | | | | 441,768 |
Playtex Products, Inc. | | 46,600 | 3 | | | 649,604 |
Pool Corp. | | 55,250 | 3 | | | 2,264,145 |
Williams Scotsman International, Inc.* | | 31,900 | | | | 750,607 |
Total Consumer Discretionary | | | | | | 7,716,077 |
| | |
Consumer Staples - 3.9% | | | | | | |
Central Garden & Pet Co.* | | 22,800 | | | | 1,139,316 |
Herbalife Ltd. | | 30,400 | | | | 1,112,640 |
Inter Parfums, Inc. | | 24,300 | | | | 477,009 |
United Natural Foods, Inc.* | | 21,600 | 3 | | | 753,840 |
Total Consumer Staples | | | | | | 3,482,805 |
| | |
Energy - 6.0% | | | | | | |
Brigham Exploration Co.* | | 64,100 | | | | 499,339 |
Denbury Resources, Inc.* | | 34,300 | 3 | | | 985,782 |
Hydril Co. | | 8,200 | 3 | | | 492,410 |
Pioneer Drilling Co.* | | 27,100 | | | | 355,823 |
Quicksilver Resources, Inc.* | | 18,850 | 3 | | | 646,178 |
TODCO, Class A* | | 23,100 | 3 | | | 788,403 |
Universal Compression Holdings, Inc.* | | 26,700 | | | | 1,608,942 |
Total Energy | | | | | | 5,376,877 |
| | |
Financials - 13.1% | | | | | | |
Argonaut Group, Inc.* | | 26,500 | | | | 901,265 |
Assured Guaranty, Ltd. | | 26,800 | | | | 674,556 |
Bancshares of Florida, Inc.* | | 16,400 | | | | 342,596 |
Clayton Holdings, Inc.* | | 48,000 | | | | 675,360 |
Cohen & Steers, Inc. | | 17,900 | 3 | | | 624,352 |
CVB Financial Corp. | | 37,041 | 3 | | | 538,206 |
Evercore Partners, Inc., Class A* | | 4,500 | | | | 165,060 |
Investors Financial Services Corp. | | 29,100 | | | | 1,144,212 |
Jefferies Group, Inc. | | 29,800 | | | | 856,154 |
Markel Corp.* | | 2,900 | | | | 1,158,550 |
Midwest Banc Holdings, Inc. | | 19,700 | | | | 463,738 |
optionsXpress, Inc. | | 25,400 | | | | 789,432 |
Primus Guaranty, Ltd. | | 56,900 | | | | 650,367 |
PrivateBancorp, Inc. | | 9,700 | | | | 398,379 |
Resource Capital Corp. | | 23,800 | | | | 391,986 |
Texas Capital Bancshares, Inc. | | 11,200 | | | | 224,448 |
Trammell Crow Co.* | | 27,800 | 3 | | | 1,355,250 |
UCBH Holdings, Inc. | | 20,300 | 3 | | | 347,942 |
Total Financials | | | | | | 11,701,853 |
| | |
Health Care - 20.8% | | | | | | |
Adeza Biomedical Corp.* | | 27,700 | | | | 386,138 |
Advisory Board Co., The* | | 17,400 | | | | 960,828 |
American Dental Partners, Inc.* | | 32,000 | | | | 624,000 |
AtriCure, Inc.* | | 32,200 | | | | 258,566 |
BioMarin Pharmaceutical, Inc.* | | 56,700 | 3 | | | 908,901 |
Bio-Rad Laboratories, Inc. | | 9,380 | 3 | | | 688,680 |
Conor Medsystems, Inc. | | 27,700 | | | | 680,312 |
DaVita, Inc.* | | 23,250 | | | | 1,293,398 |
DJ Orthopedics, Inc.* | | 18,000 | | | | 724,140 |
Emageon, Inc. | | 32,200 | | | | 513,590 |
Genesis HealthCare Corp. | | 12,200 | | | | 590,846 |
Haemonetics Corp. | | 17,200 | 3 | | | 784,320 |
Integra LifeSciences Holdings Corp.* | | 11,600 | 3 | | | 428,388 |
Magellan Health Services, Inc.* | | 33,100 | 3 | | | 1,444,483 |
Matria Healthcare, Inc. | | 26,000 | | | | 733,200 |
MWI Veterinary Supply, Inc.* | | 16,800 | | | | 562,968 |
New River Pharmaceuticals, Inc.* | | 2,600 | 3 | | | 132,236 |
Panacos Pharmaceuticals, Inc.* | | 78,300 | | | | 537,138 |
Pediatrix Medical Group, Inc.* | | 24,700 | | | | 1,109,771 |
Pharmion Corp. | | 19,500 | | | | 476,775 |
PolyMedica Corp. | | 19,095 | | | | 793,397 |
Respironics, Inc.* | | 35,400 | | | | 1,250,328 |
Stereotaxis, Inc.* | | 49,000 | | | | 587,020 |
Symmetry Medical, Inc.* | | 34,200 | | | | 533,520 |
Syneron Medical Ltd. | | 28,700 | | | | 738,451 |
VCA Antech, Inc.* | | 24,900 | | | | 806,013 |
Total Health Care | | | | | | 18,547,407 |
| | |
Industrials - 21.3% | | | | | | |
American Reprographics Co.* | | 25,000 | | | | 887,500 |
Barrett Business Services, Inc. | | 17,900 | | | | 382,344 |
Beacon Roofi ng Supply, Inc.* | | 47,050 | | | | 931,590 |
Corporate Executive Board Co. | | 15,900 | 3 | | | 1,428,138 |
CoStar Group, Inc.* | | 18,200 | | | | 861,770 |
Dionex Corp.* | | 13,500 | | | | 734,400 |
FirstService Corp. | | 23,300 | | | | 557,802 |
Houston Wire & Cable Co. * | | 15,200 | | | | 321,480 |
The accompanying notes are an integral part of these financial statements.
19
Managers Small Cap Fund
Schedule of Portfolio Investments (continued)
| | | | | | | |
| | | Shares | | | Value | |
Industrials (continued) | | | | | | | |
Huron Consulting Group, Inc.* | | 21,600 | | | $ | 863,136 | |
Jackson Hewitt Tax Service, Inc. | | 29,400 | 3 | | | 1,017,240 | |
Kenexa Corp.* | | 7,000 | 3 | | | 224,910 | |
Mobile Mini, Inc. | | 44,800 | | | | 1,441,216 | |
MTC Technologies, Inc.* | | 19,600 | | | | 443,744 | |
Nuco2, Inc. | | 20,200 | | | | 565,196 | |
On Assignment, Inc. | | 58,300 | | | | 661,705 | |
Orbital Sciences Corp. | | 59,900 | | | | 1,087,784 | |
Pacer International, Inc. | | 18,500 | 3 | | | 567,765 | |
Portfolio Recovery Associates, Inc. | | 18,700 | | | | 871,794 | |
RBC Bearings, Inc.* | | 25,900 | | | | 703,962 | |
Resources Connection, Inc.* | | 44,400 | 3 | | | 1,284,936 | |
Ritchie Bros. Auctioneers, Inc. | | 9,500 | 3 | | | 518,035 | |
Si International, Inc.* | | 20,700 | | | | 686,412 | |
Stericycle, Inc.* | | 13,600 | | | | 961,656 | |
UTI Worldwide, Inc. | | 38,000 | | | | 982,300 | |
Total Industrials | | | | | | 18,986,815 | |
| | |
Information Technology - 20.6% | | | | | | | |
Alliance Data Systems Corp.* | | 49,500 | 3 | | | 3,005,640 | |
Alvarion, Ltd. | | 59,400 | | | | 440,748 | |
ATMI, Inc.* | | 27,400 | | | | 868,306 | |
Cognex Corp. | | 26,000 | | | | 598,780 | |
CPI International, Inc.* | | 24,500 | | | | 343,980 | |
CSG Systems International, Inc. | | 16,900 | 3 | | | 455,962 | |
Cymer, Inc.* | | 15,800 | 3 | | | 732,014 | |
DealerTrack Holdings, Inc.* | | 14,400 | | | | 367,056 | |
DivX, Inc.* | | 6,800 | | | | 155,312 | |
Euronet Worldwide, Inc. | | 7,800 | | | | 231,816 | |
Global Payments, Inc. | | 32,600 | | | | 1,424,946 | |
Henry (Jack) & Associates, Inc. | | 49,200 | 3 | | | 1,072,068 | |
J2 Global Communications, Inc. | | 28,300 | 3 | | | 776,552 | |
MICROS Systems, Inc. | | 9,000 | 3 | | | 447,120 | |
Microsemi Corp.* | | 21,800 | | | | 427,280 | |
PDF Solutions, Inc.* | | 52,800 | | | | 747,120 | |
RADVision Ltd. | | 30,300 | | | | 580,851 | |
Semtech Corp.* | | 38,700 | | | | 504,261 | |
Silicon Motion Technology Corp., ADR | | 25,700 | | | | 395,009 | |
SiRF Technology Holdings, Inc.* | | 13,300 | 3 | | | 373,996 | |
Supertex, Inc.* | | 5,500 | | | | 244,255 | |
Synaptics, Inc.* | | 2,000 | | | | 56,341 | |
THQ, Inc.* | | 23,500 | 3 | | | 706,645 | |
Ultimate Software Group, Inc., The* | | 6,300 | | | | 155,862 | |
Varian Semiconductor Equipment Associates, Inc.* | | 11,800 | | | | 430,582 | |
Verint Systems, Inc.* | | 12,000 | | | | 392,880 | |
ViaSat, Inc.* | | 26,500 | | | | 719,210 | |
Volterra Semiconductor Corp.* | | 30,000 | | | | 517,800 | |
Wright Express Corp.* | | 43,500 | | | | 1,190,595 | |
Total Information Technology | | | | | | 18,362,987 | |
| | |
Telecommunication Services - 0.3% | | | | | | | |
General Communication, Inc., Class A | | 17,900 | | | | 234,669 | |
Total Common Stocks (cost $59,377,606) | | | | | | 84,409,490 | |
| | |
Other Investment Companies - 28.3%4 | | | | | | | |
Bank of New York Institutional Cash Reserves Fund, 5.32%2 | | 20,126,971 | | | | 20,126,971 | |
JPMorgan Prime Money Market Fund, Institutional Class Shares, 5.18% | | 5,119,719 | | | | 5,119,719 | |
| | |
Total Other Investment Companies (cost $25,246,690) | | | | | | 25,246,690 | |
Total Investments - 123.0% (cost $84,624,296) | | | | | | 109,656,180 | |
Other Assets, less Liabilities - (23.0)% | | | | | | (20,481,650 | ) |
Net Assets - 100.0% | | | | | $ | 89,174,530 | |
The accompanying notes are an integral part of these financial statements.
20
Managers Real Estate Securities Fund
Portfolio Manager’s Comments
Managers Real Estate Securities Fund seeks a combination of income and long-term capital appreciation by investing in stocks of companies that are principally engaged in owning and operating commercial real estate properties for the benefit of their investors including Real Estate Investment Trusts (REIT’s). Managers utilizes an independent subadvisor to manage the portfolio’s assets. Todd Briddell leads the investment team of Urdang Securities Management, Inc (“Urdang”) in managing this Fund.
Urdang Securities Management, Inc.
Todd Briddell and the investment team at Urdang believe real estate securities play an important role in a multi-asset class investment portfolio. Urdang’s strategy recognizes that real estate securities are not simply stocks, or real estate. They are hybrid financial investments that must be valued on the basis of a number of meaningful factors, only one of which is the value of the firm’s property portfolio. To accurately assess the relative value of a REIT security, they take into account critical business and market factors, such as: the company’s capitalization, its position within public capital markets, and the quality of the management team.
Investment success is the result of the company’s ability to provide a consistently accurate answer to the question at the heart of its value-oriented investment strategy: Which REITs does Urdang believe will generate the highest risk-adjusted returns? Overall, Urdang believes:
A Diversified portfolio + Value orientation = Strong, risk-adjusted returns.
Urdang employs a value-oriented investment process with two distinct and complementary components: bottom-up real estate research and the company’s proprietary Relative Value Model (“RVM”) securities valuation process, which was designed to provide a uniform basis for evaluating the validity of a security’s trading price. Combining real estate research and the RVM process has been central to Urdang’s track record of delivering strong returns without incurring high levels of risk.
The Year in Review
For the 12 months ended October 31, 2006, the Fund returned 36.42% compared to a gain of 39.10% for the Dow Jones Wilshire REIT Index, marking the seventh straight fiscal year that the real estate securities market and the Fund have outperformed the broader equity markets.
Capital flows into real estate from both private and public sources remained robust during the year. One of the largest drivers of the REIT market in 2006 was frenetic merger and privatization activity. Thirteen transactions have been announced since August 1, 2006, alone. Fueled by voracious demand for hard real estate assets from private equity investors wanting to quickly and efficiently invest their capital, there has been a dramatic increase in the number of privatizations.
Real estate fundamentals remain healthy. Demand for space exceeds new construction across the majority of markets and property types. Rents are rising and vacancy is falling. Investor demand for assets remains at an all-time high with buildings trading at historically low cap rates. Many REITs have turned to development to boost external growth as the acquisition environment has grown overly competitive.
Office properties, particularly those located in high barrier-to-entry, supply-constrained markets like Manhattan, Boston, or Washington D.C. for example, have enjoyed strong rent growth and occupancy. The negative trend of late-1990s vintage leases expiring and being re-leased at today’s lower rents appears to be at an end. Over the next five years, the relatively low-rate leases from the early 2000 period will expire and should roll over at higher rents. Recent sales of “trophy” office buildings at prices exceeding $1,000 per square foot support our conviction that REITs with similar assets are undervalued relative to the private market.
Apartments have benefited from the difficult single-family home market. Owning had been an attractive alternative to renting thanks to record low interest rates. However, the cost of home ownership has risen significantly due to the run up in house prices combined with today’s higher interest rates. At the same time, apartment rents have risen only slightly creating a significant opportunity for apartment owners to raise rents.
Tenant demand for quality shopping center and regional mall space has been bolstered by retailers’ desire to expand store counts. The national vacancy rate is less than 10% thanks to below average new supply and above average demand. Regional malls, which have seen scant new supply over the past decade are enjoying the strongest rent growth today. Retail fundamentals have started to decelerate, however, as concern has grown over softening consumer spending. Also concerning is a projected increase in new supply.
Hotel fundamentals have also been good, particularly for upscale, urban hotels given limited new supply. Limited-service hotels and suburban hotels in particular, however, have begun to slow. We expect luxury hotels to experience good but slowing cash flow growth next year, however we fear economy hotels could experience further weakness as a result of reduced consumer leisure spending.
The portfolio was positioned with four key themes in mind at the beginning of the year. Relative value in the mid-capitalization REITs was apparent due to very strong out-performance of large-capitalization REITs over the prior two years. Hotels were expected to continue to outperform and were thus positioned with an overweight. And while 2005 ended with an underweight to office, portfolio management aggressively added to the position early in the year making office the largest overweight. Finally, given improving fundamentals and private market valuations, apartments were viewed upon favorably. Office and apartment overweights were rewarded handsomely, but large-cap REITs once again outperformed by a wide margin hurting the portfolio’s mid-cap concentration. The initial overweight to hotels, which was reversed mid-year, worked less well.
Positive contributions to the Funds’ total return were generated by all property sectors. In the apartment sector, Avalon Bay Communities and Essex Property Trust, which focus on the coastal U.S. markets, posted stellar returns of 56.36% and 52.95%, respectively. Within the office sector, Boston Properties which has a portfolio concentrated in Boston and New York City, delivered a 59.09% return for the last twelve months. Upscale regional mall owner, Taubman Centers lead the mall sector with a 46.84% return. ProLogis, a dominant, global industrial REIT, returned 51.89%. Host Hotels and Resorts had a solid 41.46% return thanks to its concentration of urban and upscale assets.
21
Managers Real Estate Securities Fund
Portfolio Manager’s Comments (continued)
While the portfolio contained many REITs that delivered total returns exceeding 40%, a handful of relative laggards offset these notable gains. For example, Alexandria Real Estate Equities, a niche office company focused on the life science industry, under-performed despite generating a 27.25% return. Cash drag negatively impacted performance to a certain extent as well.
Looking Forward
The portfolio management team at Urdang constantly monitors and readjusts portfolio positioning. The team’s initial 2007 strategy will be founded on several notable themes outlined in the following. More M&A activity is expected and the portfolio will be positioned to benefit from this on a risk-adjusted basis. The team will favor those companies with diversified business models, global exposure, and those that build shareholder value through fund management and joint ventures. Finally, portfolio management is likely to maintain their overweight to the office sector. With the flurry of privatizations and mergers in the office sector, current pricing suggests many office REITs remain undervalued.
While portfolio management does not expect the REIT market to repeat the stellar performance of the past several years, they remain cautiously optimistic for 2007. Demand for real estate assets and real estate securities is as strong as ever. Prices should continue to be supported by sound operating fundamentals, earnings growth in the 7% to 10% range, private market valuations, and capital flows from institutional, foreign, and private-equity investors. The subadvisor believes real estate securities are capable of generating long-term total returns in the 7% to 9% range.
Cumulative Total Return Performance
The Fund’s cumulative total return is based on the daily change in net asset value (NAV), and assumes that all distributions were reinvested. The Dow Jones Wilshire REIT Index measures U.S. publicly traded Real Estate Investment Trusts. Unlike the Fund, the Dow Jones Wilshire REIT Index is unmanaged, is not available to investment, and does not incur expenses. The chart illustrates the performance of a hypothetical $10,000 investment made in the Managers Real Estate Securities Fund on December 31, 1997, to a $10,000 investment made in the Dow Jones Wilshire REIT Index
(continued on next page)
22
Managers Real Estate Securities Fund
Portfolio Manager’s Comments (continued)
for the same period. Performance for periods longer than one year is annualized. The graph and table do not reflect the deduction of taxes that a shareholder would pay on a Fund distribution or redemption of shares. The listed returns for the Fund are net of expenses and the returns for the index exclude expenses. Total returns for the Fund would have been lower had certain expenses not been reduced.
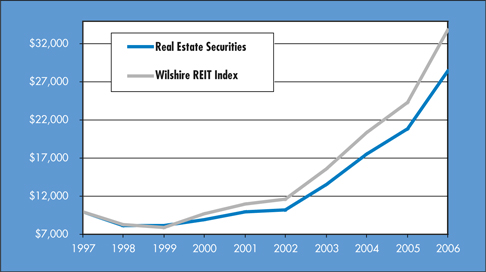
The table below shows the average annual total returns for the Managers Real Estate Securities Fund and the Dow Jones Wilshire REIT Index since inception through October 31, 2006.
| | | | | | | | | |
Average Annual Total Returns | | One Year | | | Five Years | | | Since Inception* | |
Real Estate Securities | | 36.42 | % | | 23.52 | % | | 12.59 | % |
Wilshire REIT Index | | 39.10 | % | | 25.33 | % | | 14.79 | % |
| * | Commencement of operations was December 31, 1997. |
The performance data shown represents past performance. Past performance is not a guarantee of future results. Current performance may be lower or higher than the performance data quoted. The investment return and the principal value of an investment will fluctuate so that an investor’s shares, when redeemed, may be worth more or less than their original cost. For performance information through the most recent month end please call (800) 835-3879 or visit our Web site at www.managersinvest.com.
The Fund is subject to special risk considerations similar to those associated with the direct ownership of real estate. Real estate valuations may be subject to factors such as changing general and local economic, financial, competitive, and environmental conditions.
23
Managers Real Estate Securities Fund
Fund Snapshots
October 31, 2006
Portfolio Breakdown
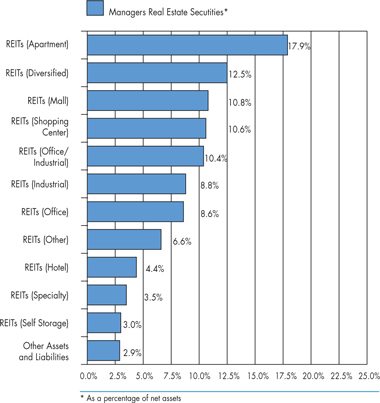
| | | |
Industry | | Percentage of
Net Assets | |
REITs (Apartment) | | 17.9 | % |
REITs (Diversified) | | 12.5 | % |
REITs (Mall) | | 10.8 | % |
REITs (Shopping Center) | | 10.6 | % |
REITs (Office/Industrial) | | 10.4 | % |
REITs (Industrial) | | 8.8 | % |
REITs (Office) | | 8.6 | % |
REITs (Other) | | 6.6 | % |
REITs (Hotel) | | 4.4 | % |
REITs (Specialty) | | 3.5 | % |
REITs (Self Storage) | | 3.0 | % |
Other Assets and Liabilities | | 2.9 | % |
Top Ten Holdings
| | | |
Security Name | | Percentage of
Net Assets | |
Simon Property Group, Inc.* | | 7.3 | % |
ProLogis* | | 6.2 | |
AvalonBay Communities, Inc.* | | 5.3 | |
Vornado Realty Trust* | | 5.1 | |
Boston Properties, Inc.* | | 4.8 | |
Archstone-Smith Trust* | | 4.2 | |
Kimco Realty Corp.* | | 4.1 | |
Equity Office Properties Trust | | 3.9 | |
Alexandria Real Estate Equities, Inc. | | 3.8 | |
Essex Property Trust, Inc.* | | 3.7 | |
| | | |
Top Ten as a Group | | 48.4 | % |
| | | |
| * | Top Ten Holding at April 30, 2006 |
Any sectors, industries, or securities discussed should not be perceived as investment recommendations. Mention of a specific security should not be considered a recommendation to buy or solicitation to sell that security.
24
Managers Real Estate Securities Fund
Schedule of Portfolio Investments
October 31, 2006
| | | | | |
| | | Shares | | Value |
REITs - 97.1% | | | | | |
Apartments - 17.9% | | | | | |
Apartment Investment & Management Co. | | 12,450 | | $ | 713,634 |
Archstone-Smith Trust | | 19,480 | | | 1,172,891 |
AvalonBay Communities, Inc. | | 11,070 | | | 1,450,834 |
Camden Property Trust | | 3,940 | | | 318,037 |
Essex Property Trust, Inc. | | 7,570 | | | 1,008,930 |
Post Properties, Inc. | | 5,930 | | | 290,451 |
Total Apartments | | | | | 4,954,777 |
| | |
Diversified - 12.5% | | | | | |
Cousins Properties, Inc. | | 16,630 | | | 594,855 |
Douglas Emmett, Inc.* | | 12,240 | | | 291,924 |
SL Green Realty Corp. | | 6,890 | | | 834,035 |
Spirit Finance Corp. | | 25,300 | | | 301,323 |
Vornado Realty Trust | | 11,890 | | | 1,417,883 |
Total Diversified | | | | | 3,440,020 |
| | |
Finance - 2.5% | | | | | |
American Financial Realty Trust | | 16,590 | | | 193,605 |
Highwoods Properties, Inc. | | 13,090 | | | 500,038 |
Total Finance | | | | | 693,643 |
| | |
Health Care - 1.4% | | | | | |
Nationwide Health Properties, Inc. | | 10,740 | | | 308,668 |
Windrose Medical Properties Trust. | | 4,600 | | | 85,836 |
Total Health Care | | | | | 394,504 |
| | |
Hotel - 4.4% | | | | | |
Host Marriott Corp. | | 17,143 | | | 395,318 |
Strategic Hotels & Resorts, Inc. | | 14,370 | | | 305,650 |
Sunstone Hotel Investors, Inc. | | 17,530 | | | 516,434 |
Total Hotel | | | | | 1,217,402 |
| | |
Industrial - 8.8% | | | | | |
AMB Property Corp. | | 7,880 | | | 460,271 |
Brandywine Realty Trust | | 8,050 | | | 268,548 |
ProLogis | | 26,993 | | | 1,707,846 |
Total Industrial | | | | | 2,436,665 |
| | |
Mall - 10.8% | | | | | |
General Growth Properties, Inc. | | 17,232 | | | 894,341 |
Mills Corp., The | | 4,090 | | | 74,724 |
Simon Property Group, Inc. | | 20,670 | | | 2,007,057 |
Total Mall | | | | | 2,976,122 |
| | |
Office - 8.6% | | | | | |
Alexandria Real Estate Equities, Inc. | | 10,470 | | | 1,043,859 |
Boston Properties, Inc. | | 12,460 | | | 1,331,101 |
Total Office | | | | | 2,374,960 |
| | |
Office/Industrial - 10.4% | | | | | |
Equity Office Properties Trust | | 25,410 | | | 1,079,925 |
First Potomac Realty Trust | | 7,850 | | | 242,879 |
Kilroy Realty Corp. | | 7,240 | | | 545,389 |
Liberty Property Trust | | 13,920 | | | 670,944 |
Reckson Associates Realty Corp. | | 7,590 | | | 334,871 |
Total Office/Industrial | | | | | 2,874,008 |
| | |
Residential - 2.7% | | | | | |
Equity Residential | | 13,370 | | | 730,136 |
| | |
Self Storage - 3.0% | | | | | |
Extra Space Storage, Inc. | | 17,920 | | | 330,445 |
Public Storage, Inc. | | 5,610 | | | 503,273 |
Total Self Storage | | | | | 833,718 |
| | |
Shopping Center - 10.6% | | | | | |
Federal Realty Investment Trust | | 10,500 | | | 841,575 |
Kimco Realty Corp. | | 25,413 | | | 1,129,105 |
Regency Centers Corp. | | 7,010 | | | 505,842 |
Taubman Centers, Inc. | | 9,840 | | | 461,496 |
Total Shopping Center | | | | | 2,938,018 |
| | |
Specialty - 3.5% | | | | | |
American Campus Communities, Inc. | | 8,650 | | | 230,350 |
Digital Realty Trust, Inc. | | 9,240 | | | 308,524 |
Realty Income Corp. | | 15,730 | | | 415,272 |
Total Specialty | | | | | 954,146 |
| | |
Total REITs (cost $20,454,649) | | | | | 26,818,119 |
| | |
REOCs (Hotel) - 1.1% | | | | | |
Starwood Hotels & Resorts Worldwide, Inc. (cost $294,480) | | 5,010 | | | 299,297 |
| | |
Other Investment Companies - 0.8%4 | | | | | |
JPMorgan Prime Money Market Fund, Institutional Class Shares, 5.18% (cost $231,329) | | 231,329 | | | 231,329 |
Total Investments - 99.0% (cost $20,980,458) | | | | | 27,348,745 |
Other Assets, less Liabilities - 1.0% | | | | | 275,693 |
Net Assets - 100.0% | | | | $ | 27,624,438 |
The accompanying notes are an integral part of these financial statements.
25
Managers California Intermediate Tax-Free Fund
Portfolio Manager’s Comments
Managers California Intermediate Tax-Free Fund’s objective is to achieve income free from Federal income taxes and California state income taxes, including alternative minimum tax.
Managers California Intermediate Tax-Free Fund invests at least 80% of its total assets in intermediate-term California municipal bonds that are free from both Federal and California state income taxes, including alternative minimum tax. The Fund’s securities will have a quality rating comparable to the four highest ratings categories of Moody’s or Standard & Poor’s. The dollar-weighted average maturity of these intermediate-term securities is normally 3 to 10 years. The Fund’s benchmark is the Lehman Brothers 5-Year Municipal Bond Index.
Evergreen Investment Management Company, LLC
Evergreen Investment Management Company, LLC (“Evergreen”), the subadvisor for the Managers California Intermediate Tax-Free Fund, was founded in 1932, and is a subsidiary of Wachovia Corporation. Evergreen is a broadly diversified asset management organization, with products and services distributed across several lines of business.
The investment team at Evergreen believes there are two key ways to add value when investing in municipal bonds:
| | • | Positioning the portfolio appropriately in terms of duration position, yield curve position and sector exposure; and |
| | • | Undertaking extensive credit research, focusing the portfolio only on attractive issues with limited credit risk. |
Evergreen utilizes a total return strategy that attempts to add value through its duration positioning, yield curve positioning, sector exposure, security selection, and credit research. The firm’s trading capabilities and vast network of approximately 90 broker-dealers has also helped to add value.
The portfolio management team at Evergreen meets weekly to discuss its macro-economic view and establish the target portfolio positioning in terms of interest rate exposure, yield curve positioning and sector allocation. A list of the securities approved for investment is used to implement the portfolio strategy. In selecting bonds, the portfolio manager must consider a comprehensive set of factors including liquidity, regional trends, coupon, and legislative or legal developments.
The ideal bond exhibits many of the following traits:
| | • | It is liquid and rated A or higher. The portfolio manager will not invest in bonds rated below investment grade |
| | • | It has been thoroughly analyzed and approved for investment by the Fund’s credit analyst. The credit analyst may believe that there is the potential for a credit upgrade |
| | • | It will typically have a maturity of less than 15 years Fund management analyzes macroeconomic, political, and market forces to try to identify the trends for interest rates |
The portfolio manager then attempts to position the portfolio–by either lengthening average portfolio maturity when interest rates are expected to decline or by shortening it when rates are expected to rise–to take advantage of these interest rate changes
Investments are concentrated in those sectors of the municipal securities universe believed to have the best risk/reward potential.
The portfolio management team strives to enhance yield and minimize credit and interest rate risk by:
| | • | positioning the portfolio advantageously on the yield curve; |
| | • | adjusting average credit quality within the investment grade category; |
| | • | exploiting pockets of inefficient pricing in the municipal bond market; and |
| | • | executing fundamental credit analysis focusing on identifying bonds with the potential for credit quality upgrades. |
The Fund manager may sell a security when:
| | • | A bond is deemed to be overpriced |
| | • | The structure of the portfolio changes (management estimates that a large portion of the turnover in the portfolio is related to interest rate changes) |
| | • | A more compelling security is identified |
| | • | There is a problem with the security’s credit |
The Year in Review
For the twelve months ended October 31, 2006, the Managers California Intermediate Tax-Free Bond Fund had a net return of 6.21%. This significantly outperformed the 3.88% net return on the Fund’s benchmark, the Lehman Brothers Five Year Municipal Index.
The Fund’s outperformance relative to its benchmark can be directly attributed to its overweight position in municipals maturing between 12-15 years. This area of the yield curve has benefited nicely from the flattening of the U.S. Treasury yield curve brought on by the Federal Reserve’s vigilance against potential inflationary pressures. As a result, the Fund’s holdings appreciated smartly due to the muni market’s perceived relative “cheapness” to longer dated taxable debt.
The primary drag on overall performance over the last year has been the significant tightening of quality spreads in the municipal market. The U.S. economy’s long and uninterrupted economic expansion has lulled historically conservative municipal investors into taking on more credit risk in exchange for a modest bump upwards in yield. The Fund’s AAA average credit quality left it little room to participate in the broader quality spread tightening that was pervasive in the municipal market during this time.
Looking Forward
Moving forward, portfolio management believes that the backdrop for investing in California exempt municipals will remain a favorable one. The management team’s view is that the Federal Reserve has concluded its tightening campaign for this cycle, and it is more likely that the next move in interest rates by the Fed will be down. While California municipals certainly stand to benefit from a “friendlier Fed,” portfolio management believes the ongoing correction in the Golden State’s real estate market will continue to lead investors to the relative safety of tax-free bonds.
Cumulative Total Return Performance
The Fund’s cumulative total return is based on the daily change in net asset value (NAV), and assumes that all distributions were reinvested. The Lehman Brothers 5-Year Municipal Bond Index provides a broad-based performance measure of the U.S. municipal bond market consisting of securities with 4-6 year maturities. The
26
Managers California Intermediate Tax-Free Fund
Portfolio Manager’s Comments (continued)
Index tracks general obligation, revenue, insured and prerefunded bonds with a minimum credit rating of Baa by Moody’s. Unlike the Fund, the Lehman Brothers 5-Year Municipal Bond Index is unmanaged, is not available to investment, and does not incur expenses. The chart illustrates the performance of a hypothetical $10,000 investment made in the Managers California Intermediate Tax-Free Fund on October 31, 1996, to a $10,000 investment made in the Lehman Brothers 5-Year Municipal Bond Index for the same period. Performance for periods longer than one year is annualized. The graph and table do not reflect the deduction of taxes that a shareholder would pay on a Fund distribution or redemption of shares. The listed returns for the Fund are net of expenses and the returns for the index exclude expenses. Total returns for the Fund would have been lower had certain expenses not been reduced.
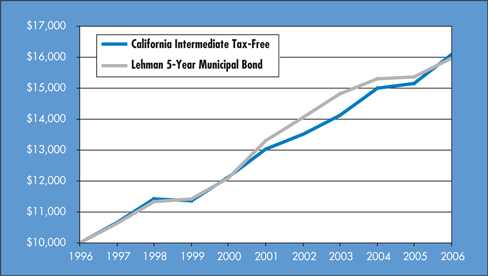
The table below shows the average annual total returns for the Managers California Intermediate Tax-Free Fund and the Lehman Brothers 5-Year Municipal Bond Index from October 31, 1996 through October 31, 2006.
| | | | | | | | | |
Average Annual Total Returns | | One Year | | | Five Years | | | Ten Years | |
California Intermediate Tax-Free | | 6.21 | % | | 4.31 | % | | 4.87 | % |
Lehman Brothers 5-Year Municipal Bond Index | | 3.88 | % | | 3.73 | % | | 4.79 | % |
The performance data shown represents past performance. Past performance is not a guarantee of future results. Current performance may be lower or higher than the performance data quoted. The investment return and the principal value of an investment will fluctuate so that an investor’s shares, when redeemed, may be worth more or less than their original cost. For performance information through the most recent month end please call (800) 835-3879 or visit our Web site at www.managersinvest.com.
The Fund is subject to risks associated with economic, political, geographic, and demographic conditions of California that could adversely affect the value of the Fund’s investment portfolio.
The Fund is subject to the risks associated with investments in debt securities, such as default risk and fluctuations in the perception of the debtor’s ability to pay its creditors. Changing interest rates may adversely affect the value of an investment. An increase in interest rates typically causes the value of bonds and other fixed-income securities to fall. Investment income may be subject to certain state and local taxes, and depending on your tax status, the federal alternative minimum tax. Capital gains are not exempt from federal income tax.
27
Managers California Intermediate Tax-Free Fund
Fund Snapshots
October 31, 2006
Portfolio Breakdown
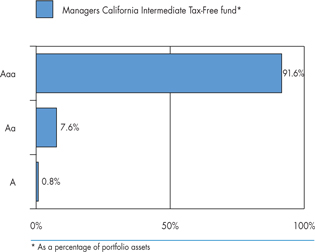
| | | |
Portfolio Credit Quality | | Percentage of Portfolio Assets | |
Aaa | | 91.6 | % |
Aa | | 7.6 | % |
A | | 0.8 | % |
Top Ten Holdings
| | | |
Security Name | | Percentage of Net Assets | |
El Camino Community College District of CA, 5.000%, 08/01/21 | | 6.0 | % |
California State University Systemwide Revenue, Series C, 5.000%, 11/01/17 (MBIA Insured)* | | 5.1 | |
Los Angeles County, CA Sanitation Districts Financing Authority, Series A, 5.000%, 10/01/17 (FSA Insured)* | | 4.0 | |
Los Angeles, CA Series A, 5.000%, 09/01/18 (MBIA Insured)* | | 4.0 | |
Bay Area Toll Authority of San Francisco, CA, Toll Bridge Revenue, Series F, 5.000%, 04/01/21* | | 3.5 | |
San Diego, CA Unified School District, Election of 1998, Series E, 5.250%, 07/01/17 (FSA Insured)* | | 3.3 | |
Contra Costa, CA Water District, Water Revenue Refunding, Series M, 5.000%, 10/01/16 (FSA Insured)* | | 3.0 | |
San Jose-Evergreen, CA Community College District, Series A, 5.000%, 09/01/19 (AMBAC Insured)* | | 3.0 | |
Yosemite, CA Community College District, Election of 2004, Series A, 5.000%, 08/01/19 (FGIC Insured)* | | 3.0 | |
Novato, CA Unified School District, 5.000%, 08/01/20 | | 2.8 | |
| | | |
Top Ten as a Group | | 37.7 | % |
| | | |
| * | Top Ten Holding at April 30, 2006 |
Any sectors, industries, or securities discussed should not be perceived as investment recommendations. Mention of a specific security should not be considered a recommendation to buy or solicitation to sell that security.
28
Managers California Intermediate Tax-Free Fund
Schedule of Portfolio Investments
October 31, 2006
| | | | | | |
Security Description | | Principal Amount | | Value |
Municipal Bonds - 96.8% | | | | | | |
Anaheim, CA Unified High School District, 4.500%, 08/01/20 (FSA Insured) | | $ | 250,000 | | $ | 258,388 |
Bay Area Government Association CA Revenue, 5.000%, 08/01/20 (AMBAC Insured) | | | 500,000 | | | 527,505 |
Bay Area Toll Authority of San Francisco, CA, Toll Bridge Revenue, Series F, 5.000%, 04/01/21 | | | 1,750,000 | | | 1,890,332 |
Bay Area Toll Authority, CA Toll Bridge Revenue, Series F, 5.000%, 04/01/19 | | | 1,000,000 | | | 1,088,390 |
California Educational Facilities Authority Revenue, Santa Clara University, 5.250%, 09/01/17 (AMBAC Insured) | | | 1,000,000 | | | 1,139,120 |
California Infrastructure & Economic Development Bank Revenue, 5.000%, 10/01/20 | | | 455,000 | | | 488,133 |
California State Department of Water Resources, Central Valley Project Revenue, Water Systems Series Y, 5.250%, 12/01/18 (FGIC Insured) | | | 1,000,000 | | | 1,092,170 |
California State Department of Water Resources, Power Supply Revenue Series A, 5.000%, 05/01/17 (MBIA Insured) | | | 500,000 | | | 536,140 |
California State Public Works Board, Lease Revenue Department of General Services - Teale Data Center B, 5.250%, 03/01/19 (AMBAC Insured) | | | 200,000 | | | 216,262 |
California State Refunding Bonds, 5.000%, 03/01/17 | | | 400,000 | | | 432,192 |
California State University Systemwide Revenue, Series C, 5.000%, 11/01/17 (MBIA Insured) | | | 2,500,000 | | | 2,746,724 |
Campbell, CA Union High School District, 4.300%, 08/01/19 (FSA Insured) | | | 270,000 | | | 276,602 |
Clovis, CA Unified School District, 5.000%, 08/01/21 | | | 540,000 | | | 586,829 |
Coast Community College District of CA, 5.000%, 08/01/16 (MBIA Insured) | | | 250,000 | | | 275,453 |
Contra Costa, CA Water Authority, Water Treatment Revenue, Series A, 5.000%, 10/01/18 (FGIC Insured) | | | 1,235,000 | | | 1,312,089 |
Contra Costa, CA Water District, Water Revenue Refunding, Series M, 5.000%, 10/01/16 (FSA Insured) | | | 1,500,000 | | | 1,628,580 |
Contra Costa, CA Water District, Water Revenue, Series L, 5.000%, 10/01/19 (FSA Insured) | | | 1,000,000 | | | 1,067,330 |
Cotati-Rohnert Park, CA Unified School District, 5.000%, 08/01/19 (FGIC Insured) | | | 500,000 | | | 541,935 |
East Bay, CA MUD, Water Systems Revenue, 5.000%, 06/01/18 (FSA Insured) | | | 340,000 | | | 364,358 |
East Bay, CA MUD, 4.750%, 06/01/20 | | | 1,300,000 | | | 1,357,395 |
Eastern Municipal Water District of CA, Water & Sewer Revenue, Certificates of Participation, 5.000%, 07/01/17 (MBIA Insured) | | | 100,000 | | | 110,039 |
Eastern Municipal Water District, Water & Sewer Revenue, Certificates of Participation, Series A, 5.000%, 07/01/21 | | | 330,000 | | | 356,816 |
El Camino Community College District of CA, 5.000%, 08/01/21 | | | 3,000,000 | | | 3,260,160 |
El Monte, CA City School District, Election of 2004, Series A, 5.000%, 05/01/19 (FGIC Insured) | | | 225,000 | | | 244,105 |
Fremont, CA Unified High School District of Santa Clara County, 5.000%, 09/01/20 (FGIC Insured) | | | 400,000 | | | 433,508 |
Fremont, CA Unified School District of Alameda County, Election of 2002, Series B, 4.500%, 08/01/20 (FSA Insured) | | | 365,000 | | | 378,607 |
Fresno, CA Sewer Revenue, Series A-1, 5.250%, 09/01/19 | | | 1,000,000 | | | 1,126,750 |
Kern, CA High School District, 5.000%, 08/01/21 | | | 1,100,000 | | | 1,194,061 |
Lincoln, CA Unified School District - San Joaquin County Election of 2004, 4.500%, 08/01/19 (FGIC Insured) | | | 150,000 | | | 155,754 |
Lodi, CA Unified School District, 5.000%, 08/01/18 (MBIA Insured) | | | 800,000 | | | 849,400 |
Long Beach, CA Habor Revenue Refunding - Series B, 5.000%, 05/15/18 (FGIC Insured) | | | 670,000 | | | 724,056 |
Los Angeles, CA Series A, 5.000%, 09/01/18 (MBIA Insured) | | | 2,000,000 | | | 2,154,260 |
Los Angeles, CA Series A, 5.000%, 09/01/18 (MBIA Insured) | | | 500,000 | | | 534,850 |
Los Angeles County, CA Metropolitan Transportation Authority, Sales Tax Revenue, Series B, 5.000%, 07/01/19 (MBIA Insured) | | | 250,000 | | | 267,953 |
Los Angeles County, CA Sanitation Districts Financing Authority, Series A, 5.000%, 10/01/17 (FSA Insured) | | | 2,000,000 | | | 2,157,220 |
Los Angeles, CA Certificate Participation Real Property Program, 5.250%, 04/01/19 (AMBAC Insured) | | | 300,000 | | | 324,591 |
The accompanying notes are an integral part of these financial statements.
29
Managers California Intermediate Tax-Free Fund
Schedule of Portfolio Investments (continued)
| | | | | | |
Security Description | | Principal
Amount | | Value |
Municipal Bonds (continued) | | | | | | |
Los Angeles, CA Community College, Series B, 5.000%, 08/01/18 (FSA Insured) | | $ | 300,000 | | $ | 322,887 |
Los Angeles, CA Department of Water & Power, Waterworks Revenue, Series C, 5.250%, 07/01/18 (MBIA Insured) | | | 510,000 | | | 565,519 |
Los Angeles, CA Unified School District, 5.000%, 07/01/20 | | | 800,000 | | | 872,248 |
Los Angeles, CA Unified School District, Election of 1997 Series F, 5.000%, 07/01/16 (FSA Insured) | | | 1,000,000 | | | 1,083,450 |
Los Angeles, CA, Habor Department Revenue, Series B, 5.000%, 08/01/20 (MBIA Insured) | | | 275,000 | | | 301,785 |
Los Osos, CA Community Service, Wastewater Assessment District No. 1, 5.000%, 09/02/17 (MBIA Insured) | | | 1,000,000 | | | 1,072,050 |
Metropolitan Water District of Southern California, Waterworks Revenue, Series A, 4.125%, 03/01/19 | | | 325,000 | | | 330,376 |
Moorpark, CA Unified School District, 5.000%, 08/01/18 (FSA Insured) | | | 390,000 | | | 425,732 |
Murrieta Vallye, CA, Unified School District, Election of 2002, Series B, 4.125%, 09/01/20 (FSA Insured) | | | 345,000 | | | 346,635 |
Nevada Joint Union High School District, Series A, 5.000%, 08/01/19 (FSA Insured) | | | 400,000 | | | 425,176 |
Newark, CA Union School District, 4.000%, 08/01/19 (MBIA Insured) | | | 150,000 | | | 150,588 |
North Orange County, CA Community College District, 5.000%, 08/01/19 (MBIA Insured) | | | 340,000 | | | 369,566 |
Novato, CA Unified School District, 5.000%, 08/01/21 | | | 465,000 | | | 503,363 |
Novato, CA Unified School District, 5.000%, 08/01/20 | | | 1,385,000 | | | 1,505,106 |
Oakland, CA Sewer Revenue, Series A, 5.000%, 06/15/17 (FSA Insured) | | | 150,000 | | | 162,317 |
Perris, CA Union High School District, Series A, 5.000%, 09/01/18 (FGIC Insured) | | | 300,000 | | | 326,535 |
Redwood City, CA School District, 5.000%, 07/15/19 (FGIC Insured) | | | 500,000 | | | 531,255 |
Riverside, CA Community College District, 5.000%, 08/01/21 | | | 250,000 | | | 268,853 |
Riverside, CA Unified School District, Election of 2001, Series B, 4.250%, 08/01/21 (MBIA Insured) | | | 300,000 | | | 304,776 |
Sacramento County, CA Sanitation Districts Financing Authority, 4.750%, 12/01/20 (FGIC Insured) | | | 500,000 | | | 527,130 |
San Diego, CA Unified School District, Election of 1998, Series E, 5.250%, 07/01/17 (FSA Insured) | | | 1,615,000 | | | 1,782,216 |
San Diego, CA Unified School District, Series C, 5.000%, 07/01/19 (FSA Insured) | | | 500,000 | | | 540,030 |
San Jose, CA Library, Parks, & Public Safety Projects, 5.000%, 09/01/19 | | | 500,000 | | | 530,540 |
San Jose-Evergreen, CA Community College District, 2010 Crossover Series C, 5.250%, 09/01/16 (AMBAC Insured) | | | 500,000 | | | 554,740 |
San Jose-Evergreen, CA Community College District, Series A, 5.000%, 09/01/19 (AMBAC Insured) | | | 1,500,000 | | | 1,618,710 |
Santa Clara Valley, CA Water District, Certificates of Participation, Series A, 5.000%, 02/01/17 (FGIC Insured) | | | 490,000 | | | 530,131 |
Santa Clara Valley, CA Water District, Certificates of Participation, Series A, 5.000%, 02/01/18 (FGIC Insured) | | | 655,000 | | | 703,902 |
Santa Clarita, CA Community College District, 5.000%, 08/01/2020 | | | 350,000 | | | 379,085 |
Santa Rosa, CA High School District, Election of 2002, 5.000%, 08/01/19 (MBIA Insured) | | | 730,000 | | | 780,750 |
Southwestern Community College, 5.000%, 08/01/18 | | | 600,000 | | | 663,636 |
University of California Revenues, Series F, 4.750%, 05/15/20 (FSA insured) | | | 200,000 | | | 209,936 |
Yosemite, CA Community College District, Election of 2004, Series A, 5.000%, 08/01/19 (FGIC Insured) | | | 1,475,000 | | | 1,603,265 |
Municipal Bonds (cost $50,982,086) | | | | | | 52,390,345 |
| | |
| | | Shares | | |
Other Investment Companies - 1.9%4 | | | | | | |
BlackRock Liquidity Funds, Institutional Class Shares - California Money Fund, 3.280% | | | 50,084 | | | 50,084 |
Fidelity California AMT Tax-Free Money Market Fund, 3.200% | | | 1,009,135 | | | 1,009,135 |
Total Other Investment Companies (cost $1,059,219) | | | | | | 1,059,219 |
Total Investments - 98.7% (cost $52,041,305) | | | | | | 53,449,564 |
Other Assets, less Liabilities - 1.3% | | | | | | 694,544 |
Net Assets - 100.0% | | | | | $ | 54,144,108 |
The accompanying notes are an integral part of these financial statements.
30
Fremont Money Market Fund
Portfolio Manager’s Comments
Fremont Money Market Fund seeks to maximize current income consistent with the preservation of capital and liquidity. Norman Gee leads the money market investment team of 333 Global Investment Advisors (“333 Global”) in managing the Fund.
333 Global Investment Advisors
Norman Gee and the team at 333 Global focus on identifying undervalued securities and creating active maturity management strategies to produce higher yields without greater interest rate or credit risk. The portfolio manager believes that through pricesensitive trading, prudent maturity management, and independent research focusing on market inefficiencies, the Fund can deliver consistently superior performance
The investment team monitors macroeconomic indicators to project short-term interest rate trends. Average portfolio maturity is adjusted consistent with interest rate forecasts—shortened if rates are projected to trend higher and lengthened if rates are projected to fall. The portfolio manager also seeks to enhance yield by uncovering opportunities presented by inefficient pricing in the money markets.
The Year in Review
For the 12 months ended October 31, 2006, the Fund returned 4.22% compared to a gain of 4.07% for the Money Fund Report Averages – First Tier Retail, and 4.62% for the 3-Month Treasury Bill. The Fed instituted a “data dependent” stance following the May 10th Federal Open Market Committee Meeting (“FOMC”) which it has maintained throughout the period. Following seventeen consecutive hikes, the tightening campaign finally came to an end at the August 8th meeting whereby the FOMC determined there was enough downward pressure on inflation to hold rates steady at 5.25%. An excerpt from the August press release expands upon this: “…inflation pressures seem likely to moderate over time, reflecting contained inflation expectations and the cumulative effects of monetary policy actions and other factors restraining aggregate demand. This level has been maintained with indications pointing toward easing in early to mid 2007.”
Throughout the year, portfolio management has slowly increased the allocation to top tier commercial paper to just over 95%. U.S. agency discounts were utilized less often as they are generally longer in maturity and become more valuable in times of fl at or decreasing rates. The weighted average maturity continued to trend down in fiscal 2006 and was at 27 days as of October 31, 2006. The shorter average maturity enabled the Fund to take advantage of favorable rates that were available on the short end of the curve.
Looking Forward
Finishing out the final quarter of 2006 and heading into 2007, the Fund’s sector weights will continue to be heavily weighted in commercial paper. The weighted average maturity will likely remain on the shorter side as the portfolio is currently structured to take advantage of a fl at to inverted money market curve. Given the current market environment, it seems plausible that the Fed will keep the target Fed Funds Rate at 5.25% for the near future with rate cuts a possibility in mid-2007 depending on inflation and economic growth data. If and when the Fed begins to show indications of easing, portfolio management will selectively and opportunistically look to extend the weighted average maturity of the portfolio.
(continued on next page)
31
Fremont Money Market Fund
Portfolio Manager’s Comments (continued)
Cumulative Total Return Performance
The Fund’s cumulative total return is based on the daily change in net asset value (NAV), and assumes that all distributions were reinvested. The Money Fund Report Averages - First Tier (“Money Fund Report”) are based on the 30-day average percentage yield on all highly rated taxable money market funds reported in the Money Fund Report, a service of iMoneyNet, Inc. (formerly IBC Financial Data). Unlike the Fund, the Money Fund Report is unmanaged, is not available to investment, and does not incur expenses. The chart illustrates the performance of a hypothetical $10,000 investment made in the Fremont Money Market Fund on October 31, 1996, to a $10,000 investment made in the Money Fund Report for the same period. Performance for periods longer than one year is annualized. The graph and table do not reflect the deduction of taxes that a shareholder would pay on a Fund distribution or redemption of shares. The listed returns for the Fund are net of expenses and the returns for the index exclude expenses.
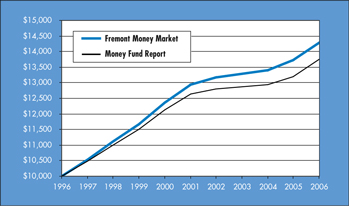
The table below shows the average annual total returns for the Fremont Money Market Fund and the Money Fund Report Averages - First Tier from October 31, 1996 through October 31, 2006.
| | | | | | | | | |
Average Annual Total Returns | | One Year | | | Five Years | | | Ten Years | |
Fremont Money Market | | 4.22 | % | | 2.02 | % | | 3.64 | % |
Money Fund Report Averages - First Tier | | 4.07 | % | | 1.70 | % | | 3.23 | % |
The performance data shown represents past performance. Past performance is not a guarantee of future results. Current performance may be lower or higher than the performance data quoted. The investment return and the principal value of an investment through the most recent month end please call (800) 835-3879 or visit our Web site at www.managersinvest.com.
An investment in the Fund is neither insured nor guaranteed by the Federal Deposit Insurance Corporation or any other government agency. Although the Fund seeks to preserve the value of your investment at $1.00 per share, it is possible to lose money by investing in the Fund.
32
Managers Fremont Money Market Fund
Fund Snapshots
October 31, 2006
Portfolio Breakdown
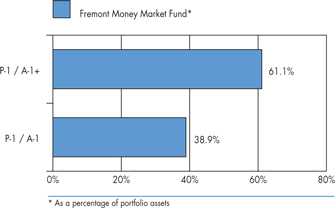
| | | |
Portfolio Credit Quality | | Percentage of Portfolio Assets | |
P-1 / A-1+ | | 61.1 | % |
P-1 / A-1 | | 38.9 | % |
Top Ten Holdings
| | | |
Security Name | | Percentage of Net Assets | |
Province of Quebec, 5.242%, 11/03/06 | | 4.0 | % |
Hitachi America Capital, Ltd., 5.265%, 11/06/06 | | 4.0 | |
National Rural Utilities Co-op Finance Corp., 5.275%, 11/06/06 | | 4.0 | |
Prudential PLC, 5.245%, 11/04/06 | | 4.0 | |
Cargill Global Funding PLC, 5.267%, 11/09/06 | | 4.0 | |
McCormick & Co., Inc., 5.290%, 11/13/06 | | 4.0 | |
Queen’s Health Systems, Inc., 5.261%, 11/14/06 | | 4.0 | |
American General Finance Corp., 5.262%, 11/15/06 | | 4.0 | |
Swedish National Housing Financial Management, 5.262%, 11/16/06 | | 4.0 | |
Caisse Centrale Desjardins du Quebec, 5.283%, 11/17/06 | | 4.0 | |
| | | |
Top Ten as a Group | | 40.0 | % |
| | | |
Any sectors, industries, or securities discussed should not be perceived as investment recommendations. Mention of a specific security should not be considered a recommendation to buy or solicitation to sell that security.
33
Fremont Money Market Fund
Schedule of Portfolio Investments
October 31, 2006
| | | | | | |
Security Description | | Principal
Amount | | Value |
Commercial Paper - 96.3% | | | | | | |
Capital Goods - 4.0% | | | | | | |
Hitachi America Capital, Ltd., 5.265%, 11/06/06 (a) | | $ | 5,000,000 | | $ | 4,996,347 |
Consumer Staples - 8.1% | | | | | | |
Cargill Global Funding PLC, 5.267%, 11/09/06 (a) | | | 5,000,000 | | | 4,994,156 |
McCormick & Co., Inc., 5.290%, 11/13/06 (a) | | | 5,000,000 | | | 4,991,200 |
Total Consumer Staples | | | | | | 9,985,356 |
Education - 4.0% | | | | | | |
Regents of the University of California, 5.274%, 12/01/06 | | | 5,000,000 | | | 4,978,125 |
Energy - 4.0% | | | | | | |
Electricite de France, 5.271%, 11/27/06 | | | 5,000,000 | | | 4,981,042 |
Financial Services (Banks) - 8.0% | | | | | | |
Caisse Centrale Desjardins du Quebec, 5.283%, 11/17/06 | | | 5,000,000 | | | 4,988,289 |
HBOS Treasury Services, Inc., 5.287%, 12/05/06 | | | 5,000,000 | | | 4,975,161 |
Total Financial Services (Banks) | | | | | | 9,963,450 |
Financial Services (Other) - 32.1% | | | | | | |
American Express Credit Corp., 5.253%, 11/30/06 | | | 5,000,000 | | | 4,978,935 |
American General Finance Corp., 5.262%, 11/15/06 | | | 5,000,000 | | | 4,989,792 |
American Honda Finance Corp., 5.256%, 11/21/06 | | | 5,000,000 | | | 4,985,444 |
Merrill Lynch & Co., 5.273%, 12/13/06 | | | 5,000,000 | | | 4,969,433 |
Morgan Stanley Group, 5.265%, 11/20/06 | | | 5,000,000 | | | 4,986,146 |
Swedish National Housing Financial Management, 5.262%, 11/16/06 (a) | | | 5,000,000 | | | 4,989,063 |
Swiss Re Financial Products Corp., 5.293%, 12/06/06 (a) | | | 5,000,000 | | | 4,974,406 |
UBS Finance (Delaware) LLC, 5.273%, 12/20/06 | | | 5,000,000 | | | 4,964,373 |
Total Financial Services (Other) | | | | | | 39,837,592 |
Foreign Government Obligations - 4.0% | | | | | | |
Province of Quebec, 5.242%, 11/03/06 (a) | | | 5,000,000 | | | 4,998,544 |
Health Care - 4.0% | | | | | | |
Queen’s Health Systems, Inc., 5.261%, 11/14/06 (a) | | | 5,000,000 | | | 4,990,521 |
Industrials - 16.1% | | | | | | |
BASF Corp., 5.294%, 12/31/06 (a) | | | 5,000,000 | | | 4,959,166 |
BHP Billiton Finance, Ltd., 5.281%, 11/27/06 (a) | | | 5,000,000 | | | 4,981,006 |
National Rural Utilities Co-op Finance Corp., 5.275%, 11/06/06 | | | 5,000,000 | | | 4,996,340 |
Nationwide Building Society, 5.292%, 12/12/06 (a) | | | 5,000,000 | | | 4,970,047 |
Total Industrials | | | | | | 19,906,559 |
Insurance - 4.0% | | | | | | |
Prudential PLC, 5.245%, 11/04/06 (a) | | | 5,000,000 | | | 4,995,633 |
Sovereign Debt - 4.0% | | | | | | |
AWB Harvest Finance Ltd., 5.315%, 01/10/07 (a) | | | 5,000,000 | | | 4,948,861 |
Telecommunication Services - 4.0% | | | | | | |
Telstra Corp., 5.299%, 12/08/06 (a) | | | 5,000,000 | | | 4,972,918 |
Total Commercial Paper (cost $119,554,948) | | | | | | 119,554,948 |
The accompanying notes are an integral part of these financial statements.
34
Fremont Money Market Fund
Schedule of Portfolio Investments (continued)
| | | | | |
Security Description | | Shares | | Value |
Other Investment Companies - 2.2%4 | | | | | |
JPMorgan Prime Money Market Fund, Institutional Class Shares, 5.18% (cost $2,722,048) | | 2,722,048 | | $ | 2,722,048 |
Total Investments - 98.5% (cost $122,276,996) | | | | | 122,276,996 |
Other Assets, less Liabilities - 1.5% | | | | | 1,816,682 |
Net Assets - 100.0% | | | | $ | 124,093,678 |
The accompanying notes are an integral part of these financial statements.
35
Notes to Schedules of Portfolio Investments
The following footnotes and abbreviations are to be read in conjunction with the Schedules of Portfolio Investments previously presented in the report.
At October 31, 2006 the cost of securities for Federal income tax purposes and the gross aggregate unrealized appreciation and/or depreciation based on tax cost were approximately as follows:
| | | | | | | | | | | | | |
Fund | | Cost | | Appreciation | | Depreciation | | | Net |
Fremont Global | | $ | 181,064,067 | | $ | 26,683,839 | | $ | (2,519,782 | ) | | $ | 24,164,057 |
Small Cap | | | 84,822,617 | | | 26,289,891 | | | (1,456,328 | ) | | | 24,833,563 |
Real Estate Securities | | | 21,076,357 | | | 6,450,409 | | | (178,021 | ) | | | 6,272,388 |
California Intermediate Tax-Free | | | 52,041,305 | | | 1,408,677 | | | (418 | ) | | | 1,408,259 |
| * | Non-income-producing security |
| (a) | Security exempt from registration under Rule 144A of the Securities Act of 1933. This security may be resold in transactions exempt from registration, normally to qualified buyers. At October 31, 2006, the value of these securities amounted to the following: |
| | | | | | |
Fund | | Market Value | | % of Net Assets | |
Fremont Global | | $ | 2,948,161 | | 1.6 | % |
Fremont Money Market | | | 64,761,868 | | 52.2 | % |
| 1 | Floating Rate Security. The rate listed is as of October 31, 2006. Date in parenthesis represents the security’s next coupon rate reset. |
| 2 | Collateral received from brokers for securities lending was invested in this short-term investment. |
| 3 | Some or all of these shares were out on loan to various brokers as of October 31, 2006, amounting to: |
| | | | | | |
Fund | | Market Value | | % of Net Assets | |
Fremont Global | | $ | 23,317,834 | | 12.8 | % |
Small Cap | | | 19,582,602 | | 15.8 | % |
| 4 | Yield shown for an investment company represents its October 31, 2006, seven-day average yield, which refers to the sum of the previous seven days’ dividends paid, expressed as an annual percentage. |
| 5 | Variable rate security. The rate listed is as of October 31, 2006 and is periodically reset subject to terms and conditions set forth in the debenture. |
Investment Definitions and Abbreviations:
| | |
| ADR/GDR: | | ADR after the name of a holding stands for American Depositary Receipt, representing ownership of foreign securities on deposit with a domestic custodian bank; a GDR (Global Depositary Receipt) is comparable, but foreign securities are held on deposit in a non-U.S. bank. The value of the ADR/GDR securities is determined or significantly influenced by trading on exchanges not located in the United States or Canada. Sponsored ADR/GDRs are initiated by the underlying foreign company. |
|
| FHLMC: Federal Home Loan Mortgage Corp. |
| FNMA: Federal National Mortgage Association |
| GNMA: Government National Mortgage Association |
| MBIA: Municipal Bond Investor Assurance Corp. |
| REOC: Real Estate Operating Company |
| AMBAC: American Municipal Bond Assurance Corp. |
| FGIC: Financial Guaranty Insurance Corp. |
| FHLB: Federal Home Loan Bank |
| FSA: FSA Capital, Inc. |
| MUD: Municipal Utility District |
| REIT: Real Estate Investment Trust |
Registered shares: A security whose owner has been recorded with its issuer or issuer’s registrar. Abbreviations have been used throughout the portfolios to indicate amounts shown in currencies other than the U.S. dollar (USD):
| | |
| AUD: | | Australian Dollar |
| CAD: | | Canadian Dollar |
| EUR: | | Euro |
| GBP: | | British Pound |
| SGD: | | Singapore Dollar |
| NZD: | | New Zealand Dollar |
| JPY: | | Japanese Yen |
| NOK: | | Norwegian Krone |
36
Statements of Assets and Liabilities
October 31, 2006
| | | | | | | | | | | | | | | | | | |
| | | Managers
Fremont Global
Fund | | | Managers
Small Cap
Fund | | | Managers
Real Estate
Securities
Fund | | Managers
California
Intermediate
Tax-Free
Fund | | Fremont
Money Market
Fund | |
Assets: | | | | | | | | | | | | | | | | | | |
Investments at value* (including securities on loan valued at $23,317,834, $19,582,602, $0, $0, $0, respectively) | | $ | 205,228,124 | | | $ | 109,656,180 | | | $ | 27,348,745 | | $ | 53,449,564 | | $ | 122,276,996 | |
Cash | | | — | | | | 48,338 | | | | — | | | 228,573 | | | 2,018,291 | |
Foreign currency** | | | 245,345 | | | | — | | | | — | | | — | | | — | |
Cash - collateral on futures | | | 46,898 | | | | — | | | | — | | | — | | | — | |
Receivable for investments sold | | | 1,332,766 | | | | 404,306 | | | | 444,390 | | | — | | | — | |
Receivable for Fund shares sold | | | 37,431 | | | | 4,081 | | | | 15,500 | | | 6 | | | — | |
Unrealized appreciation of foreign currency contracts | | | 156,850 | | | | — | | | | — | | | — | | | — | |
Dividends, interest and other receivables | | | 1,129,756 | | | | 24,286 | | | | 23,135 | | | 566,484 | | | 4,589 | |
Prepaid expenses | | | 11,488 | | | | 9,429 | | | | 5,342 | | | 1,204 | | | 9,746 | |
| | | | | | | | | | | | | | | | | | |
Total assets | | | 208,188,658 | | | | 110,146,620 | | | | 27,837,112 | | | 54,245,831 | | | 124,309,622 | |
| | | | | | | | | | | | | | | | | | |
Liabilities: | | | | | | | | | | | | | | | | | | |
Payable to Custodian | | | 74,908 | | | | — | | | | 9,852 | | | — | | | — | |
Payable for Fund shares repurchased | | | — | | | | 5,708 | | | | 8,972 | | | — | | | 52 | |
Payable upon return of securities loaned | | | 23,917,531 | | | | 20,126,971 | | | | — | | | — | | | — | |
Payable for investments purchased | | | 1,247,891 | | | | 689,802 | | | | 109,372 | | | — | | | — | |
Unrealized depreciation of foreign currency contracts | | | 220,285 | | | | — | | | | — | | | — | | | — | |
Dividends payable to shareholders | | | — | | | | — | | | | — | | | 26,974 | | | 85,903 | |
Accrued expenses: | | | | | | | | | | | | | | | | | | |
Investment advisory and management fees | | | 91,765 | | | | 75,487 | | | | 19,517 | | | 4,337 | | | 25,280 | |
Administrative fees | | | 38,236 | | | | 18,872 | | | | 5,740 | | | 11,304 | | | 15,775 | |
Other | | | 210,793 | | | | 55,250 | | | | 59,221 | | | 59,108 | | | 88,934 | |
| | | | | | | | | | | | | | | | | | |
Total liabilities | | | 25,801,409 | | | | 20,972,090 | | | | 212,674 | | | 101,723 | | | 215,944 | |
| | | | | | | | | | | | | | | | | | |
Net Assets | | $ | 182,387,249 | | | $ | 89,174,530 | | | $ | 27,624,438 | | $ | 54,144,108 | | $ | 124,093,678 | |
| | | | | | | | | | | | | | | | | | |
Net Assets Represent: | | | | | | | | | | | | | | | | | | |
Paid-in capital | | $ | 221,041,533 | | | $ | 89,563,317 | | | $ | 17,092,822 | | $ | 52,610,958 | | $ | 124,092,262 | |
Undistributed net investment income (loss) | | | (215,461 | ) | | | — | | | | 163,139 | | | 208 | | | 173,617 | |
Accumulated net realized gain (loss) from investments, futures and foreign currency transactions | | | (62,846,124 | ) | | | (25,420,671 | ) | | | 4,000,190 | | | 124,683 | | | (172,201 | ) |
Net unrealized appreciation of investments, futures, and foreign currency contracts and translations | | | 24,407,301 | | | | 25,031,884 | | | | 6,368,287 | | | 1,408,259 | | | — | |
| | | | | | | | | | | | | | | | | | |
Net Assets | | $ | 182,387,249 | | | $ | 89,174,530 | | | $ | 27,624,438 | | $ | 54,144,108 | | $ | 124,093,678 | |
| | | | | | | | | | | | | | | | | | |
Shares Outstanding | | | 12,809,626 | | | | 5,765,057 | | | | 1,874,176 | | | 5,037,629 | | | 124,092,410 | |
| | | | | | | | | | | | | | | | | | |
Net asset value, offering and redemption price per share | | $ | 14.24 | | | $ | 15.47 | | | $ | 14.74 | | $ | 10.75 | | $ | 1.00 | |
| | | | | | | | | | | | | | | | | | |
| ______________ | | | | | | | | | | | | | | | | | | |
* Investments at cost | | $ | 180,789,451 | | | $ | 84,624,296 | | | $ | 20,880,939 | | $ | 52,041,305 | | $ | 122,276,996 | |
** Foreign currency at cost | | $ | 243,750 | | | | — | | | | — | | | — | | | — | |
The accompanying notes are an integral part of these financial statements.
37
Statements of Operations
For the fiscal year ended October 31, 2006
| | | | | | | | | | | | | | | | | | | |
| | | Managers
Fremont
Global Fund | | | Managers
Small Cap
Fund | | | Managers
Real Estate
Securities
Fund | | | Managers
California
Intermediate
Tax-Free
Fund | | | Fremont
Money
Market
Fund |
Investment Income: | | | | | | | | | | | | | | | | | | | |
Interest income | | $ | 2,913,473 | | | | — | | | | — | | | $ | 2,140,550 | | | $ | 8,890,099 |
Dividend income | | | 2,305,475 | | | $ | 417,383 | | | $ | 618,025 | | | | 46,135 | | | | — |
Foreign withholding tax | | | (129,770 | ) | | | (1,052 | ) | | | (568 | ) | | | — | | | | — |
Securities lending fees | | | 62,698 | | | | 26,087 | | | | 1,961 | | | | — | | | | 2,256 |
| | | | | | | | | | | | | | | | | | | |
Total investment income | | | 5,151,876 | | | | 442,418 | | | | 619,418 | | | | 2,186,685 | | | | 8,892,355 |
| | | | | | | | | | | | | | | | | | | |
Expenses: | | | | | | | | | | | | | | | | | | | |
Investment management fees | | | 1,104,917 | | | | 817,920 | | | | 216,515 | | | | 189,604 | | | | 441,052 |
Administrative fees | | | 460,382 | | | | 204,480 | | | | 63,681 | | | | 126,924 | | | | 293,289 |
Transfer agent | | | 168,194 | | | | 31,478 | | | | 8,585 | | | | 7,374 | | | | 213,269 |
Custodian | | | 203,993 | | | | 33,435 | | | | 23,700 | | | | 28,289 | | | | 46,494 |
Professional fees | | | 68,390 | | | | 38,776 | | | | 37,637 | | | | 37,374 | | | | 53,623 |
Registration fees | | | 15,849 | | | | 16,352 | | | | 16,510 | | | | 3,482 | | | | 23,369 |
Trustees fees and expenses | | | 14,238 | | | | 4,874 | | | | 629 | | | | 3,580 | | | | 18,297 |
Reports to shareholders | | | 27,666 | | | | 8,324 | | | | 3,946 | | | | 16,204 | | | | 22,895 |
Miscellaneous | | | 17,184 | | | | 3,258 | | | | 1,232 | | | | 1,430 | | | | 22,154 |
| | | | | | | | | | | | | | | | | | | |
Total expenses before offsets | | | 2,080,813 | | | | 1,158,897 | | | | 372,435 | | | | 414,261 | | | | 1,134,442 |
| | | | | | | | | | | | | | | | | | | |
Expense (reimbursement)/recoupment | | | — | | | | — | | | | 7,975 | | | | (134,543 | ) | | | — |
Expense reduction | | | (31,389 | ) | | | (27,750 | ) | | | (8,457 | ) | | | — | | | | — |
| | | | | | | | | | | | | | | | | | | |
Net expenses | | | 2,049,424 | | | | 1,131,147 | | | | 371,953 | | | | 279,718 | | | | 1,134,442 |
| | | | | | | | | | | | | | | | | | | |
Net investment income (loss) | | | 3,102,452 | | | | (688,729 | ) | | | 247,465 | | | | 1,906,967 | | | | 7,757,913 |
| | | | | | | | | | | | | | | | | | | |
Net Realized and Unrealized Gain (Loss): | | | | | | | | | | | | | | | | | | | |
Net realized gain on investments and futures | | | 13,476,955 | | | | 4,325,624 | | | | 4,509,798 | | | | 124,779 | | | | — |
Net realized loss on foreign currency contracts and translations | | | (631,314 | ) | | | — | | | | — | | | | — | | | | — |
Net unrealized appreciation of investments and futures | | | 8,457,399 | | | | 9,894,002 | | | | 3,066,846 | | | | 1,038,003 | | | | — |
Net unrealized depreciation of foreign currency contracts and translations | | | (864,444 | ) | | | — | | | | — | | | | — | | | | — |
| | | | | | | | | | | | | | | | | | | |
Net realized and unrealized gain | | | 20,438,596 | | | | 14,219,626 | | | | 7,576,644 | | | | 1,162,782 | | | | — |
| | | | | | | | | | | | | | | | | | | |
Net Increase in Net Assets Resulting from Operations | | $ | 23,541,048 | | | $ | 13,530,897 | | | $ | 7,824,109 | | | $ | 3,069,749 | | | $ | 7,757,913 |
| | | | | | | | | | | | | | | | | | | |
The accompanying notes are an integral part of these financial statements.
38
Statements of Changes in Net Assets
For the fiscal year ended October 31,
| | | | | | | | | | | | | | | | |
| | | Managers Fremont Global Fund | | | Managers Small Cap Fund | |
| | | 2006 | | | 2005 | | | 2006 | | | 2005 | |
Increase (Decrease) in Net Assets From Operations: | | | | | | | | | | | | | | | | |
Net investment income (loss) | | $ | 3,102,452 | | | $ | 3,362,679 | | | $ | (688,729 | ) | | $ | (696,937 | ) |
Net realized gain on investments and foreign currency transactions | | | 12,845,641 | | | | 31,284,598 | | | | 4,325,624 | | | | 5,291,658 | |
Net unrealized appreciation (depreciation) of investments and foreign currency translations | | | 7,592,955 | | | | (13,626,541 | ) | | | 9,894,002 | | | | 4,401,284 | |
| | | | | | | | | | | | | | | | |
Net increase in net assets resulting from operations | | | 23,541,048 | | | | 21,020,736 | | | | 13,630,897 | | | | 8,996,005 | |
| | | | | | | | | | | | | | | | |
Distributions to Shareholders: | | | | | | | | | | | | | | | | |
From net investment income | | | (9,462,057 | ) | | | (3,011,208 | ) | | | — | | | | — | |
From net realized gain on investments | | | — | | | | — | | | | — | | | | — | |
| | | | | | | | | | | | | | | | |
Total distributions to shareholders | | | (9,462,057 | ) | | | (3,011,208 | ) | | | — | | | | — | |
| | | | | | | | | | | | | | | | |
From Capital Share Transactions: | | | | | | | | | | | | | | | | |
Proceeds from sale of shares | | | 8,714,063 | | | | 18,185,791 | | | | 24,549,330 | | | | 19,628,320 | |
Reinvestment of dividends and distributions | | | 9,372,373 | | | | 2,985,349 | | | | — | | | | — | |
Cost of shares repurchased | | | (32,975,080 | ) | | | (94,420,068 | ) | | | (15,206,935 | ) | | | (16,424,115 | ) |
| | | | | | | | | | | | | | | | |
Net increase (decrease) from capital share transactions | | | (14,888,644 | ) | | | (73,248,928 | ) | | | 9,342,395 | | | | 3,204,205 | |
| | | | | | | | | | | | | | | | |
Total increase (decrease) in net assets | | | (809,653 | ) | | | (55,239,400 | ) | | | 22,873,292 | | | | 12,200,210 | |
| | | | | | | | | | | | | | | | |
Net Assets: | | | | | | | | | | | | | | | | |
Beginning of year | | | 183,196,902 | | | | 238,436,302 | | | | 66,301,238 | | | | 54,101,028 | |
| | | | | | | | | | | | | | | | |
End of year | | $ | 182,387,249 | | | $ | 183,196,902 | | | $ | 89,174,530 | | | $ | 66,301,238 | |
| | | | | | | | | | | | | | | | |
End of year undistributed net investment income (loss) | | $ | (215,461 | ) | | $ | 5,737,246 | | | | — | | | | — | |
| | | | | | | | | | | | | | | | |
Share Transactions: | | | | | | | | | | | | | | | | |
Sale of shares | | | 630,051 | | | | 1,380,176 | | | | 1,670,203 | | | | 1,718,443 | |
Reinvestment of dividends and distributions | | | 698,358 | | | | 230,416 | | | | — | | | | — | |
Shares repurchased | | | (2,411,674 | ) | | | (7,285,403 | ) | | | (1,045,430 | ) | | | (1,451,712 | ) |
| | | | | | | | | | | | | | | | |
Net increase (decrease) in shares | | | (1,083,265 | ) | | | (5,674,811 | ) | | | 624,773 | | | | 266,731 | |
| | | | | | | | | | | | | | | | |
The accompanying notes are an integral part of these financial statements.
39
| | | | | | | | | | | | | | | | | | | | | | | | |
| | | Managers Real Estate Securities
Fund | | | Managers California
Intermediate Tax-Free Fund | | | Fremont Money Market Fund | |
| | | 2006 | | | 2005 | | | 2006 | | | 2005 | | | 2006 | | | 2005 | |
Increase (Decrease) in Net Assets From Operations: | | | | | | | | | | | | | | | | | | | | | | | | |
Net investment income (loss) | | $ | 247,465 | | | $ | 527,792 | | | $ | 1,906,967 | | | $ | 1,817,618 | | | $ | 7,757,913 | | | $ | 12,535,236 | |
Net realized gain on investments and foreign currency transactions | | | 4,509,798 | | | | 4,560,437 | | | | 124,779 | | | | 724,302 | | | | — | | | | 743 | |
Net unrealized appreciation (depreciation) of investments and foreign currency translations | | | 3,066,846 | | | | (408,525 | ) | | | 1,038,003 | | | | (2,142,747 | ) | | | — | | | | — | |
| | | | | | | | | | | | | | | | | | | | | | | | |
Net increase in net assets resulting from operations | | | 7,824,109 | | | | 4,679,704 | | | | 3,069,749 | | | | 399,173 | | | | 7,757,913 | | | | 12,535,979 | |
| | | | | | | | | | | | | | | | | | | | | | | | |
Distributions to Shareholders: | | | | | | | | | | | | | | | | | | | | | | | | |
From net investment income | | | (183,846) | | | | (746,429 | ) | | | (1,906,973 | ) | | | (1,890,087 | ) | | | (7,642,986 | ) | | | (12,476,544 | ) |
From net realized gain on investments | | | (3,922,812) | | | | (4,065,837 | ) | | | (706,464 | ) | | | (845,845 | ) | | | — | | | | — | |
| | | | | | | | | | | | | | | | | | | | | | | | |
Total distributions to shareholders | | | (4,106,658) | | | | (4,812,266 | ) | | | (2,613,437 | ) | | | (2,735,932 | ) | | | (7,642,986 | ) | | | (12,476,544 | ) |
| | | | | | | | | | | | | | | | | | | | | | | | |
From Capital Share Transactions: | | | | | | | | | | | | | | | | | | | | | | | | |
Proceeds from sale of shares | | | 3,149,594 | | | | 7,196,066 | | | | 7,383,255 | | | | 2,758,005 | | | | 100,543,607 | | | | 500,982,667 | |
Reinvestment of dividends and distributions | | | 4,049,920 | | | | 4,738,722 | | | | 2,077,415 | | | | 1,256,706 | | | | 7,689,203 | | | | 12,150,763 | |
Cost of shares repurchased | | | (8,195,257) | | | | (15,485,814 | ) | | | (3,620,308 | ) | | | (4,614,301 | ) | | | (478,149,898 | ) | | | (650,654,439 | ) |
| | | | | | | | | | | | | | | | | | | | | | | | |
Net increase (decrease) from capital share transactions | | | (995,743 | ) | | | (3,551,026 | ) | | | 5,840,362 | | | | (599,590 | ) | | | (369,917,088 | ) | | | (137,521,009 | ) |
| | | | | | | | | | | | | | | | | | | | | | | | |
Total increase (decrease) in net assets | | | 2,721,708 | | | | (3,683,588 | ) | | | 6,296,674 | | | | (2,936,349 | ) | | | (369,802,161 | ) | | | (137,461,574 | ) |
| | | | | | | | | | | | | | | | | | | | | | | | |
Net Assets: | | | | | | | | | | | | | | | | | | | | | | | | |
Beginning of year | | | 24,902,730 | | | | 28,586,318 | | | | 47,847,434 | | | | 50,783,783 | | | | 493,895,839 | | | | 631,357,413 | |
| | | | | | | | | | | | | | | | | | | | | | | | |
End of year | | $ | 27,624,438 | | | $ | 24,902,730 | | | $ | 54,144,108 | | | $ | 47,847,434 | | | $ | 124,093,678 | | | $ | 493,895,839 | |
| | | | | | | | | | | | | | | | | | | | | | | | |
End of year undistributed net investment income (loss) | | $ | 163,139 | | | | — | | | $ | 208 | | | $ | 16,826 | | | $ | 173,617 | | | $ | 58,690 | |
| | | | | | | | | | | | | | | | | | | | | | | | |
Share Transactions: | | | | | | | | | | | | | | | | | | | | | | | | |
Sale of shares | | | 237,272 | | | | 583,669 | | | | 695,945 | | | | 270,743 | | | | 100,543,607 | | | | 500,982,667 | |
Reinvestment of dividends and distributions | | | 352,981 | | | | 387,553 | | | | 196,086 | | | | 115,569 | | | | 7,689,203 | | | | 12,150,763 | |
Shares repurchased | | | (652,624) | | | | (1,276,881 | ) | | | (342,587 | ) | | | (442,633 | ) | | | (478,149,750 | ) | | | (650,654,439 | ) |
| | | | | | | | | | | | | | | | | | | | | | | | |
Net increase (decrease) in shares | | | (62,371) | | | | (305,659 | ) | | | 549,444 | | | | (56,321 | ) | | | (369,916,940 | ) | | | (137,521,009 | ) |
| | | | | | | | | | | | | | | | | | | | | | | | |
The accompanying notes are an integral part of these financial statements.
40
Financial Highlights
For a share outstanding throughout each fiscal year
| | | | | | | | | | | | | | | | | | | | |
| | | For the fiscal year ended October 31, | |
Managers Fremont Global Fund | | 2006 | | | 2005 | | | 2004 | | | 2003 | | | 2002 | |
Net Asset Value, Beginning of Year | | $ | 13.19 | | | $ | 12.19 | | | $ | 11.17 | | | $ | 9.50 | | | $ | 10.65 | |
| | | | | | | | | | | | | | | | | | | | |
Income from Investment Operations: | | | | | | | | | | | | | | | | | | | | |
Net investment income | | | 0.27 | | | | 0.46 | | | | 0.18 | | | | 0.27 | | | | 0.15 | |
Net realized and unrealized gain (loss) on investments | | | 1.48 | | | | 0.69 | | | | 0.86 | | | | 1.52 | | | | (1.18 | ) |
| | | | | | | | | | | | | | | | | | | | |
Total from investment operations | | | 1.75 | | | | 1.15 | | | | 1.04 | | | | 1.79 | | | | (1.03 | ) |
| | | | | | | | | | | | | | | | | | | | |
Less Distributions to Shareholders from: | | | | | | | | | | | | | | | | | | | | |
Net investment income | | | (0.70 | ) | | | (0.15 | ) | | | (0.02 | ) | | | (0.10 | ) | | | (0.12 | ) |
Return of capital distribution | | | — | | | | — | | | | — | | | | (0.02 | ) | | | — | |
| | | | | | | | | | | | | | | | | | | | |
Total distributions to shareholders | | | (0.70 | ) | | | (0.15 | ) | | | (0.02 | ) | | | (0.12 | ) | | | (0.12 | ) |
| | | | | | | | | | | | | | | | | | | | |
Net Asset Value, End of Year | | $ | 14.24 | | | $ | 13.19 | | | $ | 12.19 | | | $ | 11.17 | | | $ | 9.50 | |
| | | | | | | | | | | | | | | | | | | | |
Total Return 1 | | | 13.67 | % | | | 9.79 | % | | | 9.27 | % | | | 18.94 | % | | | (9.85 | )% |
| | | | | | | | | | | | | | | | | | | | |
Ratio of net expenses to average net assets | | | 1.11 | % | | | 1.09 | % | | | 1.02 | % | | | 0.95 | % | | | 0.95 | % |
Ratio of total expenses to average net assets 2 | | | 1.13 | % | | | 1.10 | % | | | 1.02 | % | | | 0.95 | % | | | 0.95 | % |
Ratio of net investment income to average net assets 1 | | | 1.68 | % | | | 1.56 | % | | | 1.38 | % | | | 1.74 | % | | | 1.43 | % |
Portfolio turnover | | | 60 | % | | | 108 | % | | | 56 | % | | | 73 | % | | | 104 | % |
Net assets at end of year (000’s omitted) | | $ | 182,387 | | | $ | 183,197 | | | $ | 238,436 | | | $ | 236,625 | | | $ | 508,214 | |
| | | | | | | | | | | | | | | | | | | | |
| |
| | | For the fiscal year ended October 31, | |
Managers Small Cap Fund | | 2006 | | | 2005 | | | 2004 | | | 2003 | | | 2002 | |
Net Asset Value, Beginning of Year | | $ | 12.90 | | | $ | 11.10 | | | $ | 10.76 | | | $ | 7.66 | | | $ | 11.11 | |
| | | | | | | | | | | | | | | | | | | | |
Income from Investment Operations: | | | | | | | | | | | | | | | | | | | | |
Net investment income (loss) | | | (0.12 | )3 | | | 0.14 | | | | (0.15 | ) | | | (0.14 | ) | | | (0.13 | ) |
Net realized and unrealized gain (loss) on investments | | | 2.69 3 | | | | 1.66 | | | | 0.49 | | | | 3.24 | | | | (3.32 | ) |
| | | | | | | | | | | | | | | | | | | | |
Total from investment operations | | | 2.57 | | | | 1.80 | | | | 0.34 | | | | 3.10 | | | | (3.45 | ) |
| | | | | | | | | | | | | | | | | | | | |
Net Asset Value, End of Year | | $ | 15.47 | | | $ | 12.90 | | | $ | 11.10 | | | $ | 10.76 | | | $ | 7.66 | |
| | | | | | | | | | | | | | | | | | | | |
Total Return 1 | | | 19.92 | % | | | 16.13 | % | | | 3.16 | % | | | 40.47 | % | | | (31.05 | )% |
| | | | | | | | | | | | | | | | | | | | |
Ratio of net expenses to average net assets | | | 1.38 | % | | | 1.47 | % | | | 1.60 | % | | | 1.60 | % | | | 1.56 | % |
Ratio of total expenses to average net assets 2 | | | 1.42 | % | | | 1.53 | % | | | 1.63 | % | | | 1.72 | % | | | 1.88 | % |
Ratio of net investment loss to average net assets 1 | | | (0.84 | )% | | | (1.10 | )% | | | (1.43 | )% | | | (1.42 | )% | | | (1.27 | )% |
Portfolio turnover | | | 49 | % | | | 67 | % | | | 54 | % | | | 207 | % | | | 108 | % |
Net assets at end of year (000’s omitted) | | $ | 89,175 | | | $ | 66,301 | | | $ | 54,101 | | | $ | 38,738 | | | $ | 31,563 | |
| | | | | | | | | | | | | | | | | | | | |
41
Financial Highlights
For a share outstanding throughout each fiscal year
| | | | | | | | | | | | | | | | | | | | |
| | | For the fiscal year ended October 31, | |
Managers Real Estate Securities Fund | | 2006 | | | 2005 | | | 2004 | | | 2003 | | | 2002 | |
Net Asset Value, Beginning of Year | | $ | 12.86 | | | $ | 12.75 | | | $ | 10.09 | | | $ | 8.12 | | | $ | 8.22 | |
| | | | | | | | | | | | | | | | | | | | |
Income from Investment Operations: | | | | | | | | | | | | | | | | | | | | |
Net investment income | | | 0.18 | | | | 0.35 | | | | 0.30 | | | | 0.46 | | | | 0.39 | |
Net realized and unrealized gain (loss) on investments | | | 3.87 | | | | 1.86 | | | | 2.66 | | | | 2.10 | | | | (0.11 | ) |
| | | | | | | | | | | | | | | | | | | | |
Total from investment operations | | | 4.05 | | | | 2.21 | | | | 2.96 | | | | 2.56 | | | | 0.28 | |
| | | | | | | | | | | | | | | | | | | | |
Less Distributions to Shareholders from: | | | | | | | | | | | | | | | | | | | | |
Net investment income | | | (0.10 | ) | | | (0.35 | ) | | | (0.30 | ) | | | (0.59 | ) | | | (0.38 | ) |
Net realized gain on investments | | | (2.07 | ) | | | (1.75 | ) | | | — | | | | — | | | | — | |
| | | | | | | | | | | | | | | | | | | | |
Total distributions to shareholders | | | (2.17 | ) | | | (2.10 | ) | | | (0.30 | ) | | | (0.59 | ) | | | (0.38 | ) |
| | | | | | | | | | | | | | | | | | | | |
Net Asset Value, End of Year | | $ | 14.74 | | | $ | 12.86 | | | $ | 12.75 | | | $ | 10.09 | | | $ | 8.12 | |
| | | | | | | | | | | | | | | | | | | | |
Total Return 1 | | | 36.43 | % | | | 18.84 | % | | | 29.56 | % | | | 32.75 | % | | | 3.12 | % |
| | | | | | | | | | | | | | | | | | | | |
Ratio of net expenses to average net assets | | | 1.46 | % | | | 1.42 | % | | | 1.50 | % | | | 1.50 | % | | | 1.50 | % |
Ratio of total expenses to average net assets 2 | | | 1.46 | % | | | 1.54 | % | | | 1.67 | % | | | 1.74 | % | | | 1.62 | % |
Ratio of net investment income to average net assets 1 | | | 0.97 | % | | | 1.93 | % | | | 2.68 | % | | | 4.89 | % | | | 4.19 | % |
Portfolio turnover | | | 69 | % | | | 70 | % | | | 136 | % | | | 60 | % | | | 79 | % |
Net assets at end of year (000’s omitted) | | $ | 27,624 | | | $ | 24,903 | | | $ | 28,586 | | | $ | 29,567 | | | $ | 20,181 | |
| | | | | | | | | | | | | | | | | | | | |
| |
| | | For the fiscal year ended October 31, | |
Managers California Intermediate Tax-Free Fund | | 2006 | | | 2005 | | | 2004 | | | 2003 | | | 2002 | |
Net Asset Value, Beginning of Year | | $ | 10.66 | | | $ | 11.17 | | | $ | 11.08 | | | $ | 11.08 | | | $ | 11.16 | |
| | | | | | | | | | | | | | | | | | | | |
Income from Investment Operations: | | | | | | | | | | | | | | | | | | | | |
Net investment income | | | 0.39 | | | | 0.39 | | | | 0.40 | | | | 0.41 | | | | 0.48 | |
Net realized and unrealized gain (loss) on investments | | | 0.25 | | | | (0.31 | ) | | | 0.28 | | | | 0.07 | | | | (0.08 | ) |
| | | | | | | | | | | | | | | | | | | | |
Total from investment operations | | | 0.64 | | | | 0.08 | | | | 0.68 | | | | 0.48 | | | | 0.40 | |
| | | | | | | | | | | | | | | | | | | | |
Less Distributions to Shareholders from: | | | | | | | | | | | | | | | | | | | | |
Net investment income | | | (0.40 | ) | | | (0.40 | ) | | | (0.40 | ) | | | (0.41 | ) | | | (0.48 | ) |
Net realized gain on investments | | | (0.15 | ) | | | (0.19 | ) | | | (0.19 | ) | | | (0.07 | ) | | | — | |
| | | | | | | | | | | | | | | | | | | | |
Total distributions to shareholders | | | (0.55 | ) | | | (0.59 | ) | | | (0.59 | ) | | | (0.48 | ) | | | (0.48 | ) |
| | | | | | | | | | | | | | | | | | | | |
Net Asset Value, End of Year | | $ | 10.75 | | | $ | 10.66 | | | $ | 11.17 | | | $ | 11.08 | | | $ | 11.08 | |
| | | | | | | | | | | | | | | | | | | | |
Total Return 1 | | | 6.21 | % | | | 0.92 | % | | | 6.39 | % | | | 4.46 | % | | | 3.65 | % |
| | | | | | | | | | | | | | | | | | | | |
Ratio of net expenses to average net assets | | | 0.55 | % | | | 0.55 | % | | | 0.55 | % | | | 0.55 | % | | | 0.53 | % |
Ratio of total expenses to average net assets 2 | | | 0.82 | % | | | 0.81 | % | | | 0.74 | % | | | 0.69 | % | | | 0.67 | % |
Ratio of net investment income to average net assets 1 | | | 3.76 | % | | | 3.74 | % | | | 3.63 | % | | | 3.72 | % | | | 4.32 | % |
Portfolio turnover | | | 22 | % | | | 28 | % | | | 66 | % | | | 116 | % | | | 22 | % |
Net assets at end of year (000’s omitted) | | $ | 54,144 | | | $ | 47,847 | | | $ | 50,784 | | | $ | 59,012 | | | $ | 60,570 | |
| | | | | | | | | | | | | | | | | | | | |
42
Financial Highlights
For a share outstanding throughout each fiscal year
| | | | | | | | | | | | | | | | | | | | |
| | | For the fiscal year ended October 31, | |
Fremont Money Market Fund | | 2006 | | | 2005 | | | 2004 | | | 2003 | | | 2002 | |
Net Asset Value, Beginning of Year | | $ | 1.00 | | | $ | 1.00 | | | $ | 1.00 | | | $ | 1.00 | | | $ | 1.00 | |
| | | | | | | | | | | | | | | | | | | | |
Income from Investment Operations: | | | | | | | | | | | | | | | | | | | | |
Net investment income | | | 0.04 | | | | 0.02 | | | | 0.01 | | | | 0.01 | | | | 0.02 | |
| | | | | | | | | | | | | | | | | | | | |
Less Distributions to Shareholders from: | | | | | | | | | | | | | | | | | | | | |
Net investment income | | | (0.04 | ) | | | (0.02 | ) | | | (0.01 | ) | | | (0.01 | ) | | | (0.02 | ) |
| | | | | | | | | | | | | | | | | | | | |
Net Asset Value, End of Year | | $ | 1.00 | | | $ | 1.00 | | | $ | 1.00 | | | $ | 1.00 | | | $ | 1.00 | |
| | | | | | | | | | | | | | | | | | | | |
Total Return | | | 4.22 | % | | | 2.39 | % | | | 0.84 | % | | | 0.93 | % | | | 1.77 | % |
| | | | | | | | | | | | | | | | | | | | |
Ratio of net expenses to average net assets | | | 0.58 | % | | | 0.48 | % | | | 0.43 | % | | | 0.42 | % | | | 0.42 | % |
Ratio of net investment income to average net assets | | | 3.97 | % | | | 2.34 | % | | | 0.83 | % | | | 0.95 | % | | | 1.75 | % |
Net assets at end of year (000’s omitted) | | $ | 124,094 | | | $ | 493,896 | | | $ | 631,357 | | | $ | 701,587 | | | $ | 870,105 | |
| | | | | | | | | | | | | | | | | | | | |
The following notes should be read in conjunction with the Financial Highlights of the Funds presented on the proceeding pages.
| 1 | Total returns and net investment income would have been lower had certain expenses not been reduced. (See Note 1c of Notes to Financial Statements.) |
| 2 | Excludes the impact of expense (reimbursement)/recoupement and expense offsets such as brokerage recapture credits, but includes non-reimbursable expenses such as interest and taxes. (See Note 1c of Notes to Financial Statements.) |
| 3 | Per share numbers have been calculated using average shares. |
43
Notes to Financial Statements
October 31, 2006
| 1. | Summary of Significant Accounting Policies |
Managers Trust I (the “Trust”) is an open-end management investment company organized as a Massachusetts business trust and registered under the Investment Company Act of 1940, as amended (the “1940 Act”). Currently, the Trust is comprised of a number of investment series. Included in this report are the Managers Fremont Global Fund (“Managers Fremont Global”), formerly Fremont Global Fund; Managers Small Cap Fund (“Small Cap”), formerly Fremont U.S. Small Cap Fund; Managers Real Estate Securities Fund (“Real Estate Securities”), formerly Fremont Real Estate Securities Fund; Managers California Intermediate Tax-Free Fund (“California Intermediate Tax-Free”), formerly Fremont California Intermediate Tax-Free Fund; and Fremont Money Market Fund (“Fremont Money Market”), formerly Fremont Money Market Fund; collectively the “Funds.” The former Funds will be referred to herein collectively as “the former Fremont Funds.”
At the close of business on January 14, 2005, each of the former Fremont Funds was re-organized from a series of Fremont Mutual Funds, Inc. into a new series of Managers Trust I.
The Funds’ financial statements are prepared in accordance with accounting principles generally accepted in the United States of America, which require management to make estimates and assumptions that affect the reported amount of assets and liabilities and disclosure of contingent assets and liabilities at the date of the financial statements and the reported amounts of income and expenses during the reporting periods. Actual results could differ from those estimates. The following is a summary of significant accounting policies followed by the Funds in the preparation of their financial statements:
| a. | Valuation of Investments |
Equity securities traded on a domestic or international securities exchange are generally valued at the last quoted sale price, or, lacking any sales, at the last quoted bid price. Over-the-counter securities are valued at the NASDAQ Official Closing Price, if one is available. Lacking any sales, over-the-counter securities, are valued at the last quoted bid price. The Funds’ investments are generally valued based on market quotations by third-party pricing services approved by the Board of Trustees of the Funds. Under certain circumstances, the value of a Fund investment may be based on an evaluation of its fair value, pursuant to procedures established by and under the general supervision of the Board of Trustees of the Trust. A Fund may use the fair value of a portfolio security to calculate its NAV when, for example, (1) market quotations are not readily available because a portfolio security is not traded in a public market or the principal market in which the security trades is closed, (2) trading in a portfolio security is suspended and has not resumed prior to the time as of which the Fund calculates its NAV, (3) where a significant event affecting the value of a portfolio security is determined to have occurred between the time of the market quotation provided for a portfolio security and the time as of which the Fund calculates its NAV, (4) an investment’s price has remained unchanged over a period of time (often referred to as a “stale price”), or (5) the Investment Manager determines that a market quotation is inaccurate. An investment valued on the basis of an evaluation of its fair value maybe valued higher or lower than the available market quotations. An investment’s valuation may differ depending on the method used and the factors considered in determining value persuant to the Funds’ fair value procedure. The Investment Manager monitors intervening events that may affect the value of securities held in each Fund’s portfolio and, in accordance with procedures adopted by the Funds’ Trustees, will adjust the prices of securities traded in foreign markets, as appropriate, to reflect the impact of events occurring subsequent to the close of such markets but prior to the time each Fund’s NAV is calculated. Fixed-income securities are valued based on valuations furnished by independent pricing services that utilize matrix systems, which reflect such factors as security prices, yields, maturities and ratings, and are supplemented by dealer and exchange quotations. Fremont Money Market and other short-term investments are valued at amortized cost which approximates market value. The amortized cost method of valuation values a security at its cost at the time of purchase and therefore assumes a constant amortization to maturity of any discount or premium, regardless of the impact of fluctuating interest rates on the market value of the instruments. Investments in other regulated investment companies are valued at their end of day net asset value per share except iShares or other ETF’s, which are valued the same as equity securities. Securities (including derivatives) for which market quotations are not readily available are valued at fair value, as determined in good faith, and pursuant to procedures adopted by the Board of Trustees of the Trust. The values assigned to fair value investments are based on available information and do not necessarily represent amounts that might ultimately be realized, since such amounts depend on future developments inherent in long-term investments. Further, because of the inherent uncertainty of valuation, those estimated values may differ significantly from the values that would have been used had a ready market for the investments existed, and the differences could be material.
Investments in certain mortgage-backed, stripped mortgage-backed, preferred stocks, convertible securities, derivatives and other debt securities not traded on an organized securities market, are valued on the basis of valuations provided by dealers or by a pricing service which uses information with respect to transactions in such securities, various relationships between securities and yield to maturity in determining value.
Security transactions are accounted for as of the trade date. Realized gains and losses on securities sold are determined on the basis of identified cost.
| c. | Investment Income and Expenses |
Dividend income is recorded on the ex-dividend date except certain dividends from foreign securities where the ex-dividend date may have passed. These dividends are recorded as soon as the Trust is informed of the ex-dividend date. Dividend income on foreign securities is recorded net of any withholding tax. Interest income, which includes amortization of premium and accretion of discount on debt securities, as required, is accrued as earned. Non-cash dividends included in dividend income, if any, are reported at the fair value of the securities received. Other income and expenses are recorded on an accrual basis. Expenses that cannot be directly attributed to a fund are apportioned among the Funds in the Trust and in some cases other affiliated funds based upon their relative average net assets or number of shareholders.
The following Funds had certain portfolio trades directed to various brokers who paid a portion of such Fund’s expenses. For the fiscal year ended October 31, 2006, under these arrangements the amount by which the Funds’ expenses were reduced and the impact on the expense ratios were as follows: Managers Fremont Global - $31,389 or 0.02%, Small Cap - $27,750 or 0.04%, and Real Estate Securities - $8,457 or 0.03%.
44
Notes to Financial Statements (continued)
In addition, each of the Funds has a “balance credit” arrangement with The Bank of New York (“BNY”), the Funds’ custodian, whereby each Fund is credited with an interest factor equal to 1% below the effective 90-day T-Bill rate for account balances left uninvested overnight. These credits serve to reduce custody expenses that would otherwise be charged to each Fund. For the fiscal year ended October 31, 2006, the custodian expense was not reduced for any of the Funds. Prior to January 15, 2005, the former Fremont Funds participated in a similar program offered by State Street Bank. Overdrafts will cause a reduction of any earnings credits, computed at 2% above the effective Federal Funds rate on the day of the overdraft. For the fiscal year ended October 31, 2006, overdraft fees for Small Cap, Real Estate Securities and California Intermediate Tax-Free equaled $8, $211, and $485, respectively.
Managers Investment Group LLC (the “Investment Manager”), a subsidiary of Affiliated Managers Group, Inc. (“AMG”) and the Investment Manager for the Funds, has contractually agreed, through at least March 1, 2007, to waive fees and pay or reimburse expenses of Small Cap, Real Estate Securities, and California Intermediate Tax-Free to the extent that the total annual operating expenses (exclusive of brokerage, interest, taxes and extraordinary expenses) of the Fund exceed 1.60%, 1.50%, and 0.55%, respectively, of each Fund’s average daily net assets.
Effective January 15, 2005, each Fund may be obligated to repay the Investment Manager such amounts waived, paid or reimbursed in future years provided that the repayment occurs within three (3) years after the waiver or reimbursement and that such repayment would not cause the Fund’s expenses in any such year to exceed the previously stated percentages of that Fund’s average daily net assets. [Prior to January 15, 2005, the former Fremont Funds had a similar expense reimbursement agreement with the former Investment Advisor, Fremont Investment Advisors, Inc. (“FIA”)]. For the fiscal year ended October 31, 2006, Real Securities made such repayments to the Investment Manager in the amount of $7,975. At October 31, 2006, the cumulative amount of expense reimbursement by the Manager subject to repayment by Small Cap, Real Estate Securities, and California Intermediate Tax-Free equaled $0, $746, and $219,415, respectively.
| d. | Dividends and Distributions |
Dividends resulting from net investment income, if any, normally will be declared and paid as follows:
Annually - Small Cap
Quarterly - Fremont Global and Real Estate Securities
Declared daily, paid monthly - California Intermediate Tax-Free and Fremont Money Market
Distributions of capital gains, if any, will be made on an annual basis and when required for Federal excise tax purposes. Income and capital gain distributions are determined in accordance with Federal income tax regulations, which may differ from generally accepted accounting principles. These differences are primarily due to differing treatments for losses deferred due to wash sales, REITs, equalization accounting for tax purposes, foreign currency, futures and market discount transactions. Permanent book and tax basis differences, if any, relating to shareholder distributions will result in reclassifications to paid-in capital. The tax character of distributions paid during the fiscal years ended 2006 and 2005 were as follows:
| | | | | | | | | | | | | | | | |
| | | Managers Fremont Global | | Small Cap | | Real Estate Securities |
| | | 2006 | | 2005 | | 2006 | | 2005 | | 2006 | | 2005 |
Distributions paid from: | | | | | | | | | | | | | | | | |
Ordinary income | | $ | 9,462,057 | | $ | 3,011,208 | | — | | — | | $ | 183,846 | | $ | 746,429 |
Short-term capital gains | | | — | | | — | | — | | — | | | 1,239,381 | | | 430,454 |
Long-term capital gains | | | — | | | — | | — | | — | | | 2,683,431 | | | 3,635,383 |
| | | | | | | | | | | | | | | | |
| | $ | 9,462,057 | | $ | 3,011,208 | | — | | — | | $ | 4,106,658 | | $ | 4,812,266 |
| | | | | | | | | | | | | | | | |
| | | | | | | | | | | | |
| | | California Intermediate
Tax-Free | | Fremont Money Market |
| | | 2006 | | 2005 | | 2006 | | 2005 |
Distributions paid from: | | | | | | | | | | | | |
Ordinary income | | $ | 1,906,973 | | $ | 1,890,087 | | $ | 7,642,986 | | $ | 12,476,546 |
Short-term capital gains | | | — | | | 17,639 | | | — | | | — |
Long-term capital gains | | | 706,464 | | | 828,205 | | | — | | | — |
| | | | | | | | | | | | |
| | $ | 2,613,437 | | $ | 2,735,931 | | $ | 7,642,986 | | $ | 12,476,546 |
| | | | | | | | | | | | |
As of October 31, 2006, the components of distributable earnings (excluding unrealized appreciation/depreciation) on a tax basis consisted of:
| | | | | | | | | | | | | | | |
| | | Managers
Fremont
Global | | Small Cap | | Real Estate
Securities | | California
Intermediate
Tax-Free | | Fremont
Money
Market |
Capital loss carryforward | | $ | 62,571,508 | | $ | 25,222,350 | | | — | | | — | | $ | 172,201 |
Undistributed ordinary income | | | — | | | — | | $ | 63,620 | | $ | 27,182 | | | 259,520 |
Undistributed short-term capital gains | | | — | | | — | | | 510,553 | | | 10,282 | | | — |
Undistributed long-term capital gains | | | — | | | — | | | 3,684,747 | | | 114,401 | | | — |
45
Notes to Financial Statements (continued)
Each Fund intends to comply with the requirements under Subchapter M of the Internal Revenue Code of 1986, as amended, to distribute substantially all of its taxable income and gains to its shareholders and to meet certain diversification and income requirements with respect to investment companies. Therefore, no provision for Federal income or excise tax is included in the accompanying financial statements.
Additionally, based on the Fund’s understanding of the tax rules and rates related to income, gains and transactions for the foreign jurisdictions in which it invests, the Fund will provide for foreign taxes, and where appropriate, deferred foreign taxes.
| f. | Capital Loss Carryovers |
As of October 31, 2006, the following Funds had accumulated net realized capital loss carryovers from securities transactions for Federal income tax purposes as shown in the following chart. These amounts may be used to offset realized capital gains, if any, through the expiration dates listed.
| | | | | |
Fund | | Capital Loss
Carryover
Amount | | Expires
October 31, |
Managers Fremont Global | | $ | 12,917,279 | | 2010 |
| | | 49,654,229 | | 2011 |
Small Cap | | | 12,743,730 | | 2009 |
| | | 12,478,620 | | 2010 |
Fremont Money Market | | | 20,009 | | 2008 |
| | | 2,100 | | 2010 |
| | | 150,092 | | 2011 |
For the fiscal year ended October 31, 2006, Managers Fremont Global, Small Cap, and Fremont Money Market utilized capital loss carryovers in the amounts of $12,314,149, $4,250,222, and $0, respectively.
The Trust’s Declaration of Trust authorizes for each series the issuance of an unlimited number of shares of beneficial interest, without par value. Each Fund records sales and repurchases of its capital stock on the trade date. Dividends and distributions to shareholders are recorded on the ex-dividend date.
At October 31, 2006, certain unaffiliated shareholders, specifically omnibus accounts, individually held greater than 10% of the outstanding shares of the following Funds: Managers Fremont Global - one owns 10%; Small Cap - three collectively own 48%; Real Estate Securities - two collectively own 40%; California Intermediate Tax-Free - - three collectively own 70%; Fremont Money Market - one owns 18%. Transactions by these shareholders may have a material impact on the Funds.
| h. | Foreign Currency Translation |
The books and records of the Funds are maintained in U.S. dollars. The value of investments, assets and liabilities denominated in currencies other than U.S. dollars are translated into U.S. dollars based upon current foreign exchange rates. Purchases and sales of foreign investments, income and expenses are converted into U.S. dollars based on currency exchange rates prevailing on the respective dates of such transactions. Net realized and unrealized gain (loss) on foreign currency transactions represent: (1) foreign exchange gains and losses from the sale and holdings of foreign currencies; (2) gains and losses between trade date and settlement date on investment securities transactions and forward foreign currency exchange contracts; and (3) gains and losses from the difference between amounts of interest and dividends recorded and the amounts actually received.
In addition, the Funds do not isolate the net realized and unrealized gain or loss resulting from changes in exchange rates from the fluctuations resulting from changes in market prices of securities held. Such fluctuations are included with the net realized and unrealized gain or loss on investments.
| 2. | Agreements and Transactions with Affiliates |
The Trust has entered into an Investment Management Agreement under which the Investment Manager provides or oversees investment management services to the Funds. (Prior to January 15, 2005, the former Fremont Funds had a similar Investment Management Agreement with FIA). The Investment Manager selects subadvisors for each Fund (subject to Trustee approval), allocates assets among subadvisors and monitors the subadvisors’ investment programs and results. Each Fund’s investment portfolio is managed by portfolio managers who serve pursuant to Subadvisory Agreements with the Investment Manager.
Investment management fees are paid directly by each Fund to the Investment Manager based on average daily net assets. The annual investment management fee rates, as a percentage of average daily net assets for the fiscal year ended October 31, 2006, were as follows:
| | | |
Fund | | Investment
Management
Fee | |
Managers Fremont Global | | 0.60 | % |
Small Cap | | 1.00 | % |
Real Estate Securities | | 0.85 | % |
California Intermediate Tax-Free | | | |
on first $25 million | | 0.40 | % |
on next $25 million | | 0.35 | % |
on next $50 million | | 0.30 | % |
on next $50 million | | 0.25 | % |
on balance over $150 million | | 0.20 | % |
Fremont Money Market | | | |
on first $50 million | | 0.30 | % |
on balance over $50 million | | 0.20 | % |
The Trust has entered into an Administration and Shareholder Servicing Agreement under which Managers Investment Group LLC serves as each Fund’s administrator (the “Administrator”) and is responsible for all aspects of managing the Funds’ operations, including administration and shareholder services to each Fund, its shareholders, and certain institutions, such as bank trust departments, broker-dealers and registered investment advisers, that advise or act as an intermediary with the Funds’ shareholders. For its services, the Administrator is paid a fee at a rate of 0.25% of average net assets per annum, except for Fremont Money Market Fund for which it is paid a fee of 0.15% per annum. Prior to January 15, 2005, the former Fremont Funds had a similar administration agreement with FIA at an annual rate of 0.20% per annum, except for Fremont Money Market Fund for which it paid a fee to FIA of 0.15% per annum.
46
Notes to Financial Statements (continued)
Prior to July 1, 2005, the aggregate annual retainer paid to each Independent Trustee was $52,000, plus $2,000 per meeting attended. Effective July 1, 2005, the aggregate annual retainer paid to each Independent Trustee is $55,000, plus $4,000 for each meeting attended. The Trustees’ fees and expenses are allocated amongst all of the Funds for which Managers Investment Group LLC serves as the Investment Manager (the “Managers Funds”) based on the relative net assets of such Funds. Prior to March 3, 2006, the Trust had an additional Independent Trustee who was paid an annual retainer of $30,000 plus $4,000 for each meeting attended. The fee was allocated amongst the Funds in the Trust based on the relative net assets of each Fund. The Independent Chairman of the Managers Funds receives an additional payment of $10,000 per year. (Prior to July 1, 2005, the Independent Chairman was paid an additional $5,000 per year). Effective July 1, 2005, the Chairman of the Audit Committee receives an additional $2,000 per year. The “Trustee fees and expenses” shown in the financial statements represents the Fund’s allocated portion of the total fees and expenses paid by the Managers Funds.
The Funds are distributed by Managers Distributors, Inc. (the “Distributor”), a wholly-owned subsidiary of Managers Investment Group LLC. Certain Trustees and Officers of the Funds are Officers and/or Directors of the Investment Manager, AMG and/or the Distributor. The Distributor serves as the principal underwriter for each Fund. The Distributor is a registered broker-dealer and member of the National Association of Securities Dealers, Inc. Shares of each Fund will be continuously offered and will be sold by brokers, dealers or other financial intermediaries who have executed selling agreements with the Distributor. The Distributor bears all the expenses of providing services pursuant to an Underwriting Agreement, including the payment of the expenses relating to the distribution of Prospectuses for sales purposes and any advertising or sales literature. (Prior to January 15, 2005, the former Fremont Funds had a similar distribution agreement with Quasar Distributors, LLC).
| 3. | Purchases and Sales of Securities |
Purchases and sales of securities, excluding short-term securities, for the fiscal year ended October 31, 2006, for Managers Fremont Global were $99,653,187 and $122,331,997; Small Cap were $45,218,132 and $37,711,735; Real Estate Securities were $17,416,025 and $22,392,352; and California Intermediate Tax-Free were $15,576,165 and $10,996,113, respectively. Purchase and sales of U.S. Government securities for the fiscal year ended October 31, 2006 for Managers Fremont Global were $6,193,764 and $5,981,331, respectively.
| 4. | Portfolio Securities Loaned |
The Funds may participate in a securities lending program offered by BNY providing for the lending of equities, corporate bonds and government securities to qualified brokers. Collateral on all securities loaned is accepted in cash and/or government securities. Collateral is maintained at a minimum level of 102% of the market value, plus interest, if applicable, of investments on loan. Collateral received in the form of cash is invested temporarily in institutional money market funds or other short-term investments by BNY. These earnings (after any rebate) are then divided between BNY, as a fee for its services under the program, and the Fund loaning the security, according to agreed-upon rates.
| 5. | Commitments and Contingencies |
In the normal course of business, the Funds may enter into contracts and agreements that contain a variety of representations and warranties, which provide general indemnifications. The maximum exposure to the Funds under these arrangements is unknown, as this would involve future claims that may be against the Funds that have not yet occurred. However, based on experience, the Funds expect the risks of loss to be remote.
Certain transactions, such as futures and forward transactions, dollar roll agreements, or purchases of when-issued or delayed delivery securities may have a similar effect on a Fund’s net asset value as if the Fund had created a degree of leverage in its portfolio. However, if a Fund enters into such a transaction, the Fund will establish a segregated account with its custodian in which it will maintain cash, U.S. government securities or other liquid securities equal in value to its obligations in respect to such transaction. Securities and other assets held in the segregated account may not be sold while the transaction is outstanding, unless other suitable assets are substituted.
Prior to January 15, 2005 the former Fremont Funds had a Line of Credit Arrangement (“LOC”) with State Street Bank and Trust Company (“SSB”). Under the terms of the LOC, each former Fremont Fund’s borrowings could not exceed 20% of each Fund’s net assets and the combined borrowings of all the former Fremont Funds could not exceed the $40 million cap on the total line of credit. The interest rate paid on the LOC equaled SSB’s overnight federal funds rate as determined on each day at 11:00 a.m. Boston time plus 0.50% per annum. The former Fremont Funds paid a commitment fee of 0.09% of the unused balance of the LOC and the former Fremont Fund’s portion for the period November 1, 2004 through January 14, 2005 was $639, $141, $168, $76, $128, and $1,373, for the Fremont Global Fund, Fremont International Growth Fund, Fremont U.S. Small Cap Fund, Fremont Real Estate Securities Fund, Fremont California Intermediate Tax-Free Fund, and Fremont Money Market Fund, respectively. The LOC was terminated at the close of business on January 14, 2005.
| 8. | Futures Contracts Held or Issued for Purposes other than Trading |
Fremont Global uses Equity Index futures contracts to a limited extent, with the objective of maintaining exposure to equity stock markets while maintaining liquidity. The Fund may purchase or sell futures contracts to achieve a desired level of investment, whether to accommodate portfolio turnover or cash flows from capital shares transactions. There are certain risks associated with futures contracts. Prices may not move as expected or the Fund may not be able to close out the contract when it desires to do so, resulting in losses.
Futures are valued at their quoted daily settlement prices. The aggregate principal amounts of the contracts are not recorded in the financial statements. Fluctuations in the value of the contracts are recorded in the Statement of Assets and Liabilities as an asset (liability) and in the Statement of Operations as unrealized appreciation (depreciation) until the contracts are closed, when they are recorded as realized gains (losses) on futures or forward currency contracts. Managers Fremont Global had the following open futures contracts as of October 31, 2006: Dow Jones Euro STOXX 50 Futures, five contracts, expiring December 2006 with an unrealized gain of $16,871.
47
Notes to Financial Statements (continued)
| 9. | Forward Foreign Currency Contracts |
During the fiscal year ended October 31, 2006, Managers Fremont Global invested in forward foreign currency exchange contracts to manage currency exposure. These investments may involve greater market risk than the amounts disclosed in the Funds’ financial statements.
A forward foreign currency exchange contract is an agreement between a Fund and another party to buy or sell a currency at a set price at a future date. The market value of the contract will fluctuate with changes in currency exchange rates. The contract is marked-to-market daily, and the change in market value is recorded as an unrealized gain or loss. Gain or loss on the purchase or sale of contracts having the same settlement date, amount and counter party is realized on the date of offset, otherwise gain or loss is realized on settlement date.
Fremont Global may invest in non-U.S. dollar denominated instruments subject to limitations, and enter into forward foreign currency exchange contracts to facilitate transactions in foreign securities and to protect against a possible loss resulting from an adverse change in the relationship between the U.S. dollar and such foreign currency. Risks may arise upon entering into these contracts from the potential inability of counterparties to meet the terms of their contracts and from unanticipated movements in the value of a foreign currency relative to the U.S. dollar.
Open forward foreign currency exchange contracts (in U.S. Dollars) at October 31, 2006 were as follows:
| | | | | | | | | | | | | | | | |
Foreign Currency | | | | Settlement Date | | Current Value
(Receivable) | | | Contract Value
(Payable) | | | Unrealized
Gain/ Loss | |
Managers Fremont Global | | | | | | | | | | | | | | | | |
Australian Dollar | | Short | | 11/17/06 | | $ | (3,870,039 | ) | | $ | (3,766,000 | ) | | $ | (104,039 | ) |
Euro | | Short | | 11/01/06 -11/17/06 | | | (7,764,584 | ) | | | (7,815,100 | ) | | | 50,516 | |
Euro | | Long | | 11/02/06 -11/17/06 | | | 1,277,724 | | | | 1,286,862 | | | | (9,138 | ) |
Japanese Yen | | Short | | 11/02/06 -11/17/06 | | | (2,717,029 | ) | | | (2,760,420 | ) | | | 43,391 | |
Japanese Yen | | Long | | 11/01/06 | | | 4,327 | | | | 4,273 | | | | 54 | |
New Zealand Dollar | | Short | | 11/17/06 | | | (1,338,331 | ) | | | (1,260,000 | ) | | | (78,331 | ) |
Norwegian Krone | | Short | | 11/17/06 | | | (2,143,776 | ) | | | (2,142,802 | ) | | | (974 | ) |
Pound Sterling | | Short | | 11/01/06 -11/17/06 | | | (4,414,546 | ) | | | (4,388,289 | ) | | | (26,257 | ) |
Pound Sterling | | Long | | 11/17/06 | | | 4,388,051 | | | | 4,326,990 | | | | 61,061 | |
Swedish Krona | | Long | | 11/01/06 -11/02/06 | | | 12,886 | | | | 12,857 | | | | 29 | |
Swiss Franc | | Short | | 11/03/06 | | | (126,103 | ) | | | (126,167 | ) | | | 64 | |
Swiss Franc | | Long | | 11/01/06 -11/02/06 | | | 54,034 | | | | 53,845 | | | | 189 | |
| | | | Total | | $ | (16,637,386 | ) | | $ | (16,573,951 | ) | | $ | (63,435 | ) |
| | | | | | | | | | | | | | | | |
48
Notes to Financial Statements (continued)
At a meeting held on December 8, 2006, the Trust’s Board of Trustees has approved a plan to liquidate and terminate the Fremont Money Market Fund on or about January 31, 2007. Cash proceeds of the liquidation are expected to be distributed to shareholders promptly following the date of liquidation. It is currently expected that the Fremont Money Market Fund, as part of its preparations for liquidation, may invest a substantial portion of its total assets in the shares of one or more money market mutual funds. Accordingly, at the meeting, the Board of Trustees approved the elimination of the Fremont Money Market Fund’s restriction on investments of more that 5% of its total assets in the securities of any one issuer.
| 11. | New Accounting Pronouncements |
The Financial Accounting Standards Board (“FASB”) has recently issued Interpretation No. 48, “Accounting for Uncertainty in Income Taxes - an Interpretation of FASB Statement No. 109 (the “Interpretation”), which applies to all registered investment companies, clarifies the accounting for uncertain tax positions. The Interpretation is effective for financial statements for fiscal years beginning after December 15, 2006. Management has not yet completed their analysis of the Interpretation, and is not currently in a position to estimate the significance, if any, that the impact of adoption will have on the financial statements.
In addition, in September 2006, Statement of Financial Accounting Standards No. 157, Fair Value Measurements (“SFAS 157”), was issued and is effective for fiscal years beginning after November 15, 2007. SFAS 157 defines fair value, establishes a framework for measuring fair value and expands disclosures about fair value measurements. Management is currently evaluating the impact, if any, the adoption of SFAS 157 will have on the Fund’s financial statements.
Tax Information (unaudited)
The Fund hereby designates the maximum amounts allowable of its net taxable income as qualified dividends as provided in the Jobs and Growth Tax Relief Reconciliation Act of 2003. The 2006 Form 1099-DIVs you receive for the Fund will show the tax status of all distributions paid to you during the respective calendar year.
Pursuant to section 852 of the Internal Revenue Code, Managers Fremont Global, Small Cap, Real Estate Securities, California Intermediate Tax-Free, and Fremont Money Market designate $0, $0, $3,580,523, $114,497, and $0, respectively, as long-term capital gains for the taxable year ended October 31, 2006.
49
Report of Independent Registered Public Accounting Firm
To the Board of Trustees of Managers Trust I and the Shareholders of
Managers Fremont Global Fund, Managers Small Cap Fund, Managers Real Estate Securities Fund, Managers California Intermediate Tax-Free Fund, and Fremont Money Market Fund:
In our opinion, the accompanying statements of assets and liabilities, including the schedules of portfolio investments, and the related statements of operations and of changes in net assets and the financial highlights present fairly, in all material respects, the financial positions of Managers Fremont Global Fund, Managers Small Cap Fund, Managers Real Estate Securities Fund, Managers California Intermediate Tax-Free Fund, and Fremont Money Market Fund (five of the series constituting Trust I, hereafter referred to as the “Funds”), at October 31, 2006, and the results of each of their operations, the changes in each of their net assets and the financial highlights for the periods indicated, in conformity with accounting principles generally accepted in the United States of America. These financial statements and financial highlights (hereafter referred to as “financial statements”) are the responsibility of the Funds’ management; our responsibility is to express an opinion on these financial statements based on our audits. We conducted our audits of these financial statements in accordance with the standards of the Public Company Accounting Oversight Board (United States). Those standards require that we plan and perform the audit to obtain reasonable assurance about whether the financial statements are free of material misstatement. An audit includes examining, on a test basis, evidence supporting the amounts and disclosures in the financial statements, assessing the accounting principles used and significant estimates made by management, and evaluating the overall financial statement presentation. We believe that our audits, which included confirmation of securities at October 31, 2006 by correspondence with the custodian and brokers, provide a reasonable basis for our opinion.
As discussed in Note 10 of the Notes to Financials Statements, Fremont Money Market Fund will liquidate and distribute net cash proceeds on or about July 31, 2006, pursuant to a plan approved by the Board of Trustees.
PricewaterhouseCoopers LLP
Boston, Massachusetts
December 18, 2006
50
Trustees and Officers
The Trustees and Officers of the Trust, their business addresses, principal occupations for the past five years and dates of birth are listed below. The Trustees provide broad supervision over the affairs of the Trust and the Funds. The Trustees are experienced executives who meet periodically throughout the year to oversee the Funds’ activities, review contractual arrangements with companies that provide services to the Funds, and review the Funds’ performance. Unless otherwise noted, the address of each Trustee or Officer is the address of the Trust: 800 Connecticut Avenue, Norwalk, Connecticut 06854.
There is no stated term of office for Trustees. Trustees serve until their resignation, retirement or removal in accordance with the Trust’s organizational documents and policies adopted by the Board from time to time. The Chairman of the Trustees, President, Treasurer and Secretary of the Trust are elected by the Trustees annually. Other officers hold office at the pleasure of the Trustees.
Independent Trustees
The following Trustees are not “interested persons” of the Trust within the meaning of the 1940 Act:
| | |
Name, Date of Birth, Number of Funds Overseen in Fund Complex* | | Principal Occupation(s) During Past 5 Years and Other Directorships Held by Trustee |
Jack W. Aber, 9/9/37 • Trustee since 2000 • Oversees 33 Funds in Fund Complex | | Professor of Finance, Boston University School of Management (1972-Present); Trustee of Appleton Growth Fund (1 portfolio); Trustee of Third Avenue Trust (4 portfolios); Trustee of Third Avenue Variable Trust (1 portfolio) |
| |
William E. Chapman, II, 9/23/41 • Independent Chairman • Trustee since 2000 • Oversees 33 Funds in Fund Complex | | President and Owner, Longboat Retirement Planning Solutions (1998-Present); Hewitt Associates, LLC (part time) (provider of Retirement and Investment Education Seminars); Interim Executive Vice President, QuadraMed Corporation (2001); Trustee of Bowdoin College (2002- Present); Trustee of Third Avenue Trust (4 portfolios); Trustee of Third Avenue Variable Trust (1 portfolio) |
| |
Edward J. Kaier, 9/23/45 • Trustee since 2000 • Oversees 33 Funds in Fund Complex | | Attorney at Law and Partner, Hepburn Willcox Hamilton & Putnam, LLP (1977-Present); Trustee of Third Avenue Trust (4 portfolios); Trustee of Third Avenue Variable Trust (1 portfolio) |
| |
Steven J. Paggioli, 4/3/50 • Trustee since 2000 • Oversees 33 Funds in Fund Complex | | Consultant (2001-Present); Formerly Executive Vice President and Director. The Wadsworth Group (1986- 2001); Executive Vice President, Secretary and Director, Investment Company Administration, LLC (1990-2001); Vice President, Secretary and Director, First Fund Distributors, Inc. (1991-2001); Trustee, Professionally Managed Portfolios (22 portfolios); Advisory Board Member, Sustainable Growth Advisors, LP |
| |
Eric Rakowski, 6/5/58 • Trustee since 2000 • Oversees 33 Funds in Fund Complex | | Professor, University of California at Berkeley School of Law (1990-Present); Trustee of Third Avenue Trust (4 portfolios); Trustee of Third Avenue Variable Trust (1 portfolio) |
| |
Thomas R. Schneeweis, 5/10/47 • Trustee since 2000 • Oversees 33 Funds in Fund Complex | | Professor of Finance, University of Massachusetts (1985-Present); Director, CISDM at the University of Massachusetts, (1996-Present); President, Alternative Investment Analytics, LLC, (formerly Schneeweis Partners, LLC) (2001-Present); Director of Research, URSA Capital (subsidiaries: Lyra/Starview Capital LLC), (2004- Present); Partner, Northampton Capital Management, LLC; Partner, TRS Associates (Sole Proprietorship) and member of Massachusetts Finance Institute (wholly owned subsidiary of Alternative Investment Analytics). No other directorships held by Trustee. |
| * | The Fund Complex consists of Managers AMG Funds, The Managers Funds, Managers Trust I and Managers Trust II. |
Interested Trustees
The following Trustees are “interested persons” of the Trust within the meaning of the 1940 Act. Mr. Lebovitz is an interested person of the Trust within the meaning of the 1940 Act by virtue of his positions with Managers Investment Group LLC and Managers Distributors, Inc. Mr. Nutt is an interested person of the Trust within the meaning of the 1940 Act by virtue of his positions with, and interest in securities of, Affiliated Managers Group, Inc.
| | |
Name, Date of Birth, Number of Funds Overseen in Fund Complex* | | Principal Occupation(s) During Past 5 Years and Other Directorships Held by Trustee |
Peter M. Lebovitz, 1/18/55 • Trustee since 2002 • President since 2000 • Oversees 33 Funds in Fund Complex | | Managing Partner, Managers Investment Group LLC (2005-Present); President and Chief Executive Officer, The Managers Funds LLC (1999-2004); President, Managers Distributors, Inc. (2000-2006), Vice President, Managers Distributors, Inc. (2006-Present); President, The Managers Funds (1999-Present); President, Managers AMG Funds (1999-Present); President, Managers Trust II (2000-Present); Director of Marketing, The Managers Funds, LP (1994-1999); No other directorships held by trustee. |
| |
William J. Nutt, 3/30/45 • Trustee since 2005 • Oversees 33 Funds in Fund Complex | | Chairman and Founder of Affiliated Managers Group, Inc., (1993-Present); Chief Executive Officer of Affiliated Managers Group, Inc. (1993-2004); Director, Affiliated Managers Group, Inc. (1993-Present). |
| * | The Fund Complex consists of Managers AMG Funds, The Managers Funds, Managers Trust I and Managers Trust II. |
Officers
| | |
Name, Date of Birth, Position(s) Held with
Fund and Length of Time Served | | Principal Occupation(s) During Past 5 Years |
Bruce M. Aronow, 5/31/65 • Chief Financial Officer since 2005 | | Managing Partner, Managers Investment Group LLC (2005-Present); Chief Financial Officer, The Managers Funds, Managers AMG Funds and Managers Trust II (2005-Present); Executive Vice President and Chief Financial Officer and Principal, Rorer Asset Management (1999-2004); Chief Operating Officer, Rorer Asset Management (2001-2004). |
| |
Christine C. Carsman, 4/2/52 • Secretary since 2004 | | Vice President and Chief Regulatory Counsel, Affiliated Managers Group, Inc. (2004-Present); Secretary, The Managers Funds, Managers AMG Funds and Managers Trust II (2004-Present); Senior Counsel, Vice President and Director of Operational Risk Management and Compliance, Wellington Management Company, LLP (1995-2004). |
| |
Colin J. Dean, 3/6/77 • Assistant Secretary since 2006 | | Associate Counsel, Affiliated Managers Group, Inc. (2005-Present); Assistant Secretary, The Managers Funds, Managers AMG Funds and Managers Trust II (2006- Present); Associate, Dechert LLP (2002-2005). |
| |
Donald S. Rumery, 5/29/58 • Treasurer since 2000 | | Senior Vice-President, Managers Investment Group LLC (2005-Present); Director, Finance and Planning, The Managers Funds LLC, (1994-2004); Treasurer and Chief Financial Officer, Managers Distributors, Inc. (2000- Present); Treasurer, The Managers Funds (1995-Present); Treasurer, Managers AMG Funds (1999-Present); Treasurer, Managers Trust II (2000-Present); Secretary, Managers Trust I and Managers Trust II (2000-2004) and Secretary, The Managers Funds (1997-2004). |
51
Annual Renewal of Investment Advisory Agreements (unaudited)
On June 2, 2006, the Board of Trustees, including a majority of the Trustees who are not “interested persons” of the Trust (the “Independent Trustees”), approved the Investment Management Agreement with the Investment Manager for each of the Funds identified below and the Subadvisory Agreement for each of the Subadvisors. The Independent Trustees were separately represented by independent counsel in connection with their consideration of the approval of these agreements. In considering the Investment Management and Subadvisory Agreements, the Trustees reviewed a variety of materials relating to each Fund, the Investment Manager and each Subadvisor, including comparative performance, fee and expense information for an appropriate peer group of similar mutual funds (each, a “Peer Group”), performance information for relevant benchmark indices (each, a “Fund Benchmark”) and other information regarding the nature, extent and quality of services provided by the Investment Manager and the Subadvisors under their respective agreements. The Trustees also took into account performance, fee and expense information regarding each Fund provided to them on a quarterly basis throughout the year. Prior to voting, the Independent Trustees: (a) reviewed the foregoing information with their independent legal counsel and with management; (b) received materials from their independent legal counsel discussing the legal standards applicable to their consideration of the Investment Management Agreement and the Subadvisory Agreements; and (c) met with their independent legal counsel in private sessions at which no representatives of management were present.
Nature, extent and quality of services
In considering the nature, extent and quality of the services provided by the Investment Manager, the Trustees reviewed information relating to the Investment Manager’s operations and personnel. Among other things, the Investment Manager provided financial information, biographical information on its supervisory and professional staff and descriptions of its organizational and management structure. The Trustees also took into account information provided periodically throughout the previous year by the Investment Manager relating to the performance of its duties with respect to the Funds and the Trustees’ familiarity with the Investment Manager’s management through Board meetings, discussions and reports. In the course of their deliberations regarding the Investment Management Agreement, the Trustees evaluated, among other things: (a) the quality of the search, selection and monitoring services performed by the Investment Manager in overseeing the portfolio management responsibilities of the Subadvisors; (b) the Investment Manager’s ability to supervise each of the Fund’s other service providers; and (c) the Investment Manager’s compliance programs. The Trustees also took into account the financial condition of the Investment Manager with respect to its ability to provide the services required under the Investment Management Agreement and to maintain contractual expense limitations for certain of the Funds.
For each Fund, the Trustees also reviewed information relating to each Subadvisor’s operations and personnel and the investment philosophy, strategies and techniques (for each Subadvisor, its “Investment Strategy”) used in managing the Fund or the portion of the Fund for which the Subadvisor has portfolio management responsibility. Among other things, the Trustees reviewed biographical information on portfolio management and other professional staff, information regarding each Subadvisor’s organizational and management structure and each Subadvisor’s brokerage policies and practices. The Trustees considered specific information provided regarding the experience of the individual or individuals at each Subadvisor with portfolio management responsibility for the portion of the Fund managed by the Subadvisor, including the information set forth in the Fund’s prospectus and statement of additional information. With respect to those Funds managed with multiple Subadvisors, the Trustees also noted information provided by the Investment Manager regarding the manner in which each Subadvisor’s Investment Strategy complements those utilized by the Fund’s other Subadvisors. In the course of their deliberations, the Trustees evaluated, among other things: (a) the services rendered by each Subadvisor in the past; (b) the qualifications and experience of the Subadvisor’s personnel; and (c) the Subadvisor’s compliance programs. The Trustees also took into account the financial condition of the Subadvisor with respect to its ability to provide the services required under the Subadvisory Agreement.
With respect to Urdang Securities Management, Inc. (“Urdang”), Subadvisor to the Real Estate Securities Fund, the Trustees noted their review of the Subadvisory Agreement with Urdang at a special meeting held on March 1, 2006 in connection with the acquisition of Urdang by The Bank of New York, the Fund’s custodian. The Trustees determined at that meeting that the acquisition of Urdang was not likely to have a material impact on the Fund.
Performance
As noted above, the Board considered each Fund’s performance during relevant time periods as compared to each Fund’s Peer Group and noted that the Board reviews on a quarterly basis detailed information about each Fund’s performance results, portfolio composition and Investment Strategies, including with respect to the portion of the Fund managed by each Subadvisor. The Board noted the Investment Manager’s expertise and resources in monitoring the performance, investment style and risk adjusted performance of each Subadvisor. The Board also noted each Subadvisor’s performance record with respect to the Funds. The Board was mindful of the Investment Manager’s focus on each Subadvisor’s performance with respect to the Fund and the explanations of management regarding the factors that contributed to the performance of the Fund.
Advisory Fees and Profitability
In considering the reasonableness of the advisory fee charged by the Investment Manager for managing each Fund, the Trustees noted that the Investment Manager, and not the Fund, is responsible for paying the fees charged by the Funds’ Subadvisors and, therefore, that the fees paid to the Investment Manager cover the reasonable cost of providing portfolio management services as well as the reasonable cost of providing search, selection and monitoring services in operating a “manager-of-managers” complex of mutual funds. The Trustees concluded that, in light of the additional high quality supervisory services provided by the Investment Manager and the fact that the subadvisory fees are paid out of the advisory fee, the advisory fee payable by each Fund to the Investment Manager can reasonably be expected to exceed the median advisory fee for the Peer Group, which consists mostly of funds that do not operate with a manager-of-managers structure. The Trustees noted that there is no Subadvisor with respect to the Fremont Money Market Fund and that 333 Global Advisers, a division of the Investment Manager, provides portfolio management services to such Fund. They also noted that 333 Global Advisers manages a portion of the Fremont Global Fund.
In considering the reasonableness of the advisory fee payable to the Investment Manager, the Trustees also reviewed information
52
Annual Renewal of Investment Advisory Agreements (continued)
provided by the Investment Manager setting forth all revenues and other benefits, both direct and indirect, received by the Investment Manager and its affiliates attributable to managing each Fund and all the mutual funds in the Managers Family of Funds, the cost of providing such services and the resulting profitability to the Investment Manager and its affiliates from these relationships. The Trustees also noted the current and potential asset levels of each Fund and the willingness of the Investment Manager to waive fees and pay expenses for certain of the Funds from time to time as a means of limiting the total expenses of the smaller Funds. In this regard, the Trustees noted that, unlike the typical mutual fund that is managed by a single investment adviser, the Funds operate in a manager-of-managers structure and, as a Fund grows in size, it is common practice for the Investment Manager to recommend the selection of an additional Subadvisor to manage a portion of the Fund’s portfolio. The Trustees also noted that the subadvisory fees are paid by the Investment Manager out of its advisory fee. The Trustees further noted that, because of this practice, the Investment Manager’s oversight and supervisory responsibilities with respect to the Funds can be expected to increase with the size of the Funds. On this basis, the Trustees concluded that the profitability to the Investment Manager is reasonable and that the Investment Manager is not realizing material benefits from economies of scale that would warrant adjustments to the fees for the Funds at this time. With respect to economies of scale, the Trustees also noted that as a Fund’s assets increase over time, the Fund may realize other economies of scale to the extent that the increase in assets is proportionally greater than the increase in certain other expenses.
Subadvisory Fees and Profitability
In considering the reasonableness of the fee payable by the Investment Manager to each Subadvisor (other than First Quadrant L.P. (“FQ”) and TimesSquare Capital Management, LLC (“TimesSquare”), which are affiliates of the Investment Manager), the Trustees relied on the ability of the Investment Manager to negotiate the terms of the Subadvisory Agreement at arm’s length as part of the manager-of-managers structure, noting that the Subadvisor is not affiliated with the Investment Manager (other than FQ). In addition, the Trustees noted that the subadvisory fees are paid by the Investment Manager out of its advisory fee. Accordingly, the cost of services to be provided by the Subadvisor and the profitability to the Subadvisor of its relationship with the Fund were not material factors in the Trustees’ deliberations. For similar reasons, and based on the current size of the portion of the Fund managed by the Subadvisor, the Trustees concluded that any economies of scale being realized by the Subadvisor was not a material factor in the Trustees’ deliberations at this time.
In considering the reasonableness of the fee payable by the Investment Manager to FQ, a Subadvisor to the Fremont Global Fund, the Trustees noted that FQ is an affiliate of the Investment Manager and reviewed information regarding the cost to FQ of providing subadvisory services to the Fund and the resulting profitability from such relationship. The Trustees also noted that the subadvisory fee is paid by the Investment Manager out of the advisory fee. Based on the current size of the portion of the Fund managed by each Subadvisor, the Trustees concluded that the profitability to FQ is reasonable and that FQ is not realizing material benefits from economies of scale that would warrant adjustments to the fees for the Fund at this time.
In considering the reasonableness of the fee payable by the Investment Manager to TimesSquare, a Subadvisor to the Small Cap Fund, the Trustees noted that TimesSquare is an affiliate of the Investment Manager and reviewed information regarding the cost to TimesSquare of providing subadvisory services to the Fund and the resulting profitability from such relationship. The Trustees also noted that the subadvisory fee is paid by the Investment Manager out of the advisory fee. Based on the current size of the portion of the Fund managed by each Subadvisor, the Trustees concluded that the profitability to TimesSquare is reasonable and that TimesSquare is not realizing material benefits from economies of scale that would warrant adjustments to the fees for the Fund at this time.
In addition to the foregoing, the Trustees considered the specific factors and related conclusions set forth below with respect to each Fund.
Fremont Global Fund
Fund Performance
Among the other information relating to the Fund’s performance, the Trustees noted that the Fund’s performance for the 1-year, 3-year, 5-year and 10-year periods ended March 31, 2006 was above, below, below and below, respectively, the median performance of the Peer Group and was above, above, below and below, respectively, the performance of the Fund Benchmark, which is a Composite Index (65% MSCI World Index and 35% J.P. Morgan Global Government Bond Index (Hedged)). The Trustees further noted management’s discussion of the Fund’s performance, and that the performance of new Subadvisors engaged in 2004 and 2005 has been strong. The Trustees concluded that the Fund’s performance has been satisfacory in light of all factors considered.
Advisory Fees
The Trustees noted that the Fund’s advisory fee and total expenses (net of applicable expense waivers/reimbursements) as of March 31, 2006 were lower and higher, respectively, than the average for the Peer Group. The Trustees concluded that, in light of the nature, extent and quality of the services provided by the Investment Manager and the Subadvisors, the Fund’s performance and the considerations noted above with respect to the Subadvisors and the Investment Manager, the Fund’s advisory fees are reasonable.
Small Cap Fund
Fund Performance
Among other information relating to the Fund’s performance, the Trustees noted that the Fund’s performance for the 1-year, 3-year and 5-year periods ended March 31, 2006 was above, above and below the median performance of the Peer Group and above, below and below the performance of the Fund Benchmark, which is the Russell 2000 Growth Index. The Trustees concluded that Fund’s performance has been satisfactory.
Advisory Fees
The Trustees noted that the Fund’s advisory fee and total expenses (net of applicable expense waivers/reimbursements) as of March 31, 2006 were higher and lower, respectively, than the average for the Peer Group and that the Investment Manager has contractually agreed through March 1, 2007 to limit the Fund’s net annual operating expenses to 1.60%. The Trustees concluded that, in light of the nature, extent and quality of the services provided by the Investment Manager and the Subadvisor, the Fund’s performance, the foregoing expense limitation and the considerations noted above with respect to the Subadvisor and the Investment Manager, the Fund’s advisory fees are reasonable.
53
Annual Renewal of Investment Advisory Agreements (continued)
Real Estate Securities Fund
Fund Performance
Among the other information relating to the Fund’s performance, the Trustees noted that the Fund’s performance for the 1-year, 3-year and 5-year period ended March 31, 2006 was above, below and below, respectively, the median performance of the Peer Group. The Fund’s performance for the 1-year, 3-year and 5-year periods ended March 31, 2006 was below the performance of the Fund Bench-mark, which is the Dow Jones Wilshire REIT Index. The Trustees further noted management’s discussion of the Fund’s performance, and that the Fund’s relative performance has improved since the engagement of a new Subadvisor in 2004. The Trustees concluded that the Fund’s performance has been reasonable in light of all factors considered. The Trustees noted that the Investment Manager will continue to monitor the performance of the Subadvisor.
Advisory Fees
The Trustees noted that the Fund’s advisory fee and total expenses (net of applicable expense waivers/reimbursements) as of March 31, 2006 were higher than the average for the Peer Group and that the Investment Manager has contractually agreed through March 1, 2007 to limit the Fund’s net annual operating expenses to 1.50%. The Trustees concluded that, in light of the nature, extent and quality of the services provided by the Investment Manager and the Subadvisor, the Fund’s performance, the foregoing expense limitation and the considerations noted above with respect to the Subadvisor and the Investment Manager, the Fund’s advisory fees are reasonable.
California Intermediate Tax-Free Fund
Fund Performance
Among the other information relating to the Fund’s performance, the Trustees noted that the Fund’s performance for the 1-year, 3-year, 5-year and 10-year periods ended March 31, 2006 was above the median performance of the Peer Group and above, above, above and below, respectively, the performance of the Fund Benchmark, which is the Lehman Brothers 5-Year Municipal Bond Index. The Trustees concluded that Fund’s performance has been satisfactory.
Advisory Fees
The Trustees noted that the Fund’s advisory fee and total expenses (net of applicable expense waivers/reimbursements) as of March 31, 2006 were average and below average, respectively, for the Peer Group and that the Investment Manager has contractually agreed through March 1, 2007 to limit the Fund’s net annual operating expenses to 0.55%. The Trustees concluded that, in light of the nature, extent and quality of the services provided by the Investment Manager and the Subadvisor, the Fund’s performance, the foregoing expense limitation and the considerations noted above with respect to the Subadvisor and the Investment Manager, the Fund’s advisory fees are reasonable.
Fremont Money Market Fund
Fund Performance
Among the other information relating to the Fund’s performance, the Trustees noted that the Fund’s performance for the 1-year, 3-year, 5-year and 10-year periods ended March 31, 2006 was above the median performance of the Peer Group and above the performance of the Fund Benchmark, which is the iMoneyNet First Tier Average. The Trustees concluded that Fund’s performance has been satisfactory.
Advisory Fees
The Trustees noted that the Fund’s advisory fee and total expenses (net of applicable expense waivers/reimbursements) as of March 31, 2006 were average and below average, respectively, for the Peer Group. The Trustees concluded that, in light of the nature, extent and quality of the services provided by the Investment Manager and the Fund’s performance and the considerations noted above with respect to the Investment Manager, the Fund’s advisory fees are reasonable.
* * * *
After consideration of the foregoing, the Trustees also reached the following conclusions regarding the Investment Management Agreement and each Subadvisory Agreement, in addition to those conclusions discussed above: (a) the Investment Manager and each Subadvisor have demonstrated that they possess the capability and resources to perform the duties required of them under the Investment Management Agreement and the applicable Subadvisory Agreements; (b) each Subadvisor’s Investment Strategy is appropriate for pursuing the applicable Fund’s investment objectives; (c) each Subadvisor is reasonably likely to execute its Investment Strategy consistently over time; and (d) the Investment Manager and each Subadvisor maintain appropriate compliance programs.
Based on all of the above-mentioned factors and related conclusions, with no single factor or conclusion being determinative and with each Trustee not necessarily attributing the same weight to each factor, the Trustees concluded that approval of each Investment Management Agreement and each Subadvisory Agreement would be in the interests of each Fund and its shareholders. Accordingly, on June 2, 2006 the Trustees, including a majority of the Independent Trustees, voted to approve the Investment Management Agreement and the Subadvisory Agreements for each of the Funds’ Subadvisors.
54
THIS PAGE INTENTIONALLY LEFT BLANK
Investment Manager and Administrator
Managers Investment Group LLC
800 Connecticut Avenue
Norwalk, Connecticut 06854
(203) 299-3500 or (800) 835-3879
Distributor
Managers Distributors, Inc.
800 Connecticut Avenue
Norwalk, Connecticut 06854
(203) 299-3500 or (800) 835-3879
Custodian
The Bank of New York
2 Hanson Place
Brooklyn, New York 11217
Legal Counsel
Ropes & Gray LLP
One International Place
Boston, Massachusetts 02110-2624
Transfer Agent
PFPC, Inc.
attn: Managers
P.O. Box 9769
Providence, Rhode Island 02940
(800) 548-4539

| | | | |
| MANAGERSAND MANAGERS AMG EQUITY FUNDS | | MANAGERS BALANCED FUNDS |
EMERGING MARKETS EQUITY Rexiter Capital Management Limited ESSEX GROWTH ESSEX LARGE CAP GROWTH (Formerly known as Capital Appreciation) ESSEX SMALL/MICRO CAP GROWTH Essex Investment Management Co., LLC FQ TAX-MANAGED U.S. EQUITY FQ U.S. EQUITY First Quadrant, L.P. INSTITUTIONAL MICRO-CAP MICRO-CAP Kern Capital Management LLC INTERNATIONAL EQUITY Alliance Bernstein L.P. Lazard Asset Management, LLC Wellington Management Company, LLP MID-CAP Chicago Equity Partners, LLC REAL ESTATE SECURITIES Urdang Securities Management, Inc. | | RORER LARGE-CAP Rorer Asset Management, LLC SMALL CAP TIMESSQUARE MID CAP GROWTH TIMESSQUARE SMALL CAP GROWTH TimesSquare Capital Management, LLC SMALL COMPANY Epoch Investment Partners, Inc. Kalmar Investment Advisers, Inc. SPECIAL EQUITY Donald Smith & Co., Inc. Kern Capital Management LLC Skyline Asset Management, L.P. Smith Asset Management Group, LP Veredus Asset Management LLC Westport Asset Management, Inc. SYSTEMATIC VALUE Systematic Financial Management, L.P. VALUE Armstrong Shaw Associates Inc. Osprey Partners Investment Mgmt., LLC | | BALANCED Chicago Equity Partners, LLC Loomis, Sayles & Company L.P. GLOBAL 333 Global Advisers* Armstrong Shaw Associates Inc. Alliance Bernstein L.P. First Quadrant, L.P. Kern Capital Management LLC Northstar Capital Management, Inc. Wellington Management Company, LLP ALTERNATIVE FUNDS FQ GLOBAL ALTERNATIVES First Quadrant, L.P. MANAGERS FIXED INCOME FUNDS BOND (MANAGERS) FIXED INCOME GLOBAL BOND Loomis, Sayles & Company L.P. BOND (MANAGERS FREMONT) Pacific Investment Management Co. LLC CALIFORNIA INTERMEDIATE TAX-FREE Evergreen Investment Management Co., LLC HIGH YIELD J.P. Morgan Investment Management Inc. INTERMEDIATE DURATION GOVERNMENT SHORT DURATION GOVERNMENT Smith Breeden Associates, Inc. MONEY MARKET (MANAGERS) JPMorgan Investment Advisors Inc. MONEY MARKET (FREMONT) 333 Global Advisers* |
| | |
| | |
| | |
| | |
| | |
| | |
| | |
| | |
| | |
| | |
| | |
| | |
| | |
| | |
| | |
| | |
| | |
| | |
| | |
| | |
| | |
| | |
| | |
| | |
| | |
| * | A division of Managers Investment Group LLC |
This report is prepared for the Funds’ shareholders. It is authorized for distribution to prospective investors only when preceded or accompanied by an effective prospectus. To receive a free copy of the prospectus or Statement of Additional Information, which includes additional information about Fund Trustees, please contact us by calling 800.835.3879. Distributed by Managers Distributors, Inc., member NASD.
A description of the policies and procedures each Fund uses to vote its proxies is available: (i) without charge, upon request, by calling 800.835.3879, or (ii) on the Securities and Exchange Commission’s (SEC) Web site at www.sec.gov. For information regarding each Fund’s proxy voting record for the 12-month period ended June 30, call 800.835.3879 or visit the SEC Web site at www.sec.gov.
The Funds file their complete schedule of portfolio holdings with the SEC for the first and third quarters of each fiscal year on Form N-Q. The Funds’ Forms N-Q are available on the SEC’s website at www.sec.gov. A Fund’s Forms N-Q may be reviewed and copied at the SEC’s Public Reference Room in Washington, DC. Information on the operation of the Public Reference Room may be obtained by calling 800.SEC.0330. To review a complete list of the Funds’ portfolio holdings, or to view the most recent quarterly holdings report, semiannual report, or annual report, please visit www.managersinvest.com.
| | |
| www.managersinvest.com | |  |
ANNUAL REPORT
Managers Funds
October 31, 2006
• Managers Fremont Bond Fund

AR010c
Managers Fremont Bond Fund
Annual Report — October 31, 2006
| | |
TABLE OF CONTENTS | | Page |
| LETTER TO SHAREHOLDERS | | 1 |
| |
| ABOUT YOUR FUND’S EXPENSES | | 2 |
| |
| PORTFOLIO MANAGER COMMENTS | | 3 |
| |
| FUND SNAPSHOTS | | 8 |
| |
Summary of portfolio credit quality and top ten holdings at October 31, 2006 | | |
| |
| SCHEDULE OF PORTFOLIO INVESTMENTS | | 9 |
| |
| FINANCIAL STATEMENTS: | | |
| |
Statement of Assets and Liabilities | | 20 |
| |
Fund balance sheet, net asset value (NAV) per share computation and cumulative undistributed amount | | |
| |
Statement of Operations | | 21 |
| |
Detail of sources of income, Fund expenses, and realized and unrealized gains (losses) during the fiscal year | | |
| |
Statement of Changes in Net Assets | | 22 |
| |
Detail of changes in Fund assets for the past two fiscal years | | |
| |
| FINANCIAL HIGHLIGHTS | | 23 |
| |
Historical net asset values per share, distributions, total returns, expense ratios, turnover ratios and net assets | | |
| |
| NOTES TO FINANCIAL STATEMENTS | | 24 |
| |
Accounting and distribution policies, details of agreements and transactions with Fund management and affiliates, and descriptions of certain investment risks | | |
| |
| REPORT OF INDEPENDENT REGISTERED PUBLIC ACCOUNTING FIRM | | 36 |
| |
| TRUSTEES AND OFFICERS | | 37 |
| |
| ANNUAL RENEWAL OF INVESTMENT ADVISORY AGREEMENT | | 40 |
Nothing contained herein is to be considered an offer, sale or solicitation of an offer to buy shares of The Managers Funds or Managers AMG Funds. Such offering is made only by Prospectus, which includes details as to offering price and other material information.
Letter to Shareholders
Dear Fellow Shareholder:
The year 2006 has been volatile but rewarding for investors. Markets confronted new Federal Reserve leadership and accompanying communication style, commodity price increases, the end (at least for now) of interest rate hikes, and then a sharp decline in oil prices and a dramatic slowdown in the real estate market. Times like these challenge investors to remove emotion from decisions and remain disciplined with their long-term investment plans.
Regardless of market conditions, we at Managers maintain our focus on providing excellent, trusted, and rigorously monitored investment solutions across all major market segments and styles. We encourage our portfolio managers to take a long-term view and to invest accordingly. We strive to stay on track even when market volatility causes some investors concern.
Our overriding goal is to hire fund managers that can effectively manage assets in all types of market conditions. Toward this goal, we maintain a team of skilled investment professionals focused solely on understanding the global capital markets and overseeing the managers in our Funds. We hire fund portfolio managers who excel over time, have a strong investment discipline, and stick to that discipline.
Regardless of market conditions, we at Managers maintain our focus on providing excellent, trusted, and rigorously monitored investment solutions across all major market segments and styles.
Our investment team oversees the Funds’ managers and portfolios every day so you don’t have to. Once you have selected Managers Funds as part of your asset allocation, you can be assured that we are monitoring that investment every day to help ensure it is delivering on its investment mandate.
As 2006 comes to a close, we begin to think about next year and beyond. The two things we believe will impact investment returns the most are the condition of the economy and the change to the political landscape this fall’s election brings. Obviously, these are only the headlines and there are many subtleties relating to each.
First, with regard to the health of the economy, the risk appears to be the leverage consumers have assumed through their exposure to the residential real estate market. The “house as cash machine” combined with the speculative investment in real estate has increased the economy’s exposure to any weakness in prices or excess supply of real estate. Both these factors seem to be in play. Aside from this risk, consumers and businesses seem to be in good financial shape with relatively healthy balance sheets.
Second, with regard to the changes in Washington D.C., much has and will be written regarding mid-term power shifts, the third year of a President’s term, tax policy and its relationship to growth, and the war in Iraq. Suffice it to say that there are many interesting challenges facing the financial markets, and managing an investment portfolio requires diligence, attention, and resources.
Each of us at Managers appreciates the trust you express in us by allowing us the privilege of investing some of your capital. We will do everything we can to continue to deserve your trust in the months and years ahead.
Respectfully,
| | | | | | |
| |  | |  | | |
| | Peter M. Lebovitz | | Thomas G. Hoffman | | |
| | President | | Executive Vice President | | |
| | Managers Funds | | Chief Investment Officer | | |
| | | | Managers Investment Group LLC | | |
1
About Your Fund’s Expenses
As a shareholder of a Fund, you may incur two types of costs: (1) transaction costs, which may include sales charges (loads) on purchase payments; redemption fees; and exchange fees; and (2) ongoing costs, including management fees; distribution (12b-1) fees; and other Fund expenses. This example is intended to help you understand your ongoing costs (in dollars) of investing in the Fund and to compare these costs with the ongoing costs of investing in other mutual funds. The example is based on an investment of $1,000 invested at the beginning of the period and held for the entire period as indicated below.
Actual Expenses
The first line of the table below provides information about the actual account values and actual expenses. You may use the information in this line, together with the amount you invested, to estimate the expenses that you paid over the period. Simply divide your account value by $1,000 (for example, an $8,600 account value divided by $1,000 = 8.6), then multiply the result by the number in the first line under the heading entitled “Expenses Paid During Period” to estimate the expenses you paid on your account during this period.
Hypothetical Example for Comparison Purposes
The second line of the table below provides information about hypothetical account values and hypothetical expenses based on the Fund’s actual expense ratio and an assumed annual rate of return of 5% before expenses, which is not the Fund’s actual return. The hypothetical account values and expenses may not be used to estimate the actual ending account balance or expenses you paid for the period. You may use this information to compare the ongoing costs of investing in the Fund and other funds by comparing this 5% hypothetical example with the 5% hypothetical examples that appear in the shareholder reports of other funds.
Please note that the expenses shown in the table are meant to highlight your on going costs only and do not reflect any transactional costs, such as sales charges (loads), redemption fees, or exchange fees. Therefore, the second line of the table is useful in comparing ongoing costs only, and will not help you determine the relative total costs of owning different funds.
| | | | | | | | | |
Six Months Ended October 31, 2006 | | Beginning
Account Value
5/1/06 | | Ending
Account Value
10/31/06 | | Expenses Paid
During the
Period* |
Managers Fremont Bond Fund | | | | | | | | | |
Actual | | $ | 1,000 | | $ | 1,038 | | $ | 3.08 |
Hypothetical (5% return before expenses) | | $ | 1,000 | | $ | 1,022 | | $ | 3.06 |
| * | Expenses are equal to the Fund’s annualized expense ratio multiplied by the average account value over the period, multiplied by the number of days in the most recent fiscal half-year (184), then divided by 365. |
2
Managers Fremont Bond Fund
Portfolio Manager’s Comments
Managers Fremont Bond Fund seeks to maximize total return consistent with the preservation of capital by investing in debt securities such as corporate, mortgage backed, international and government bonds. Normally, the Fund will invest at least 80% of its total assets in these types of bonds.
Pacific Investment Management Company, LLC
Pacific Investment Management Company, LLC (“PIMCO”), the subadvisor for the Managers Fremont Bond was founded in 1971. PIMCO is one of the world’s leading fixed income managers with expertise and significant resources committed to virtually every sector of the global bond market.
Managers Fremont Bond Fund is an actively managed, diversified bond fund that focuses on intermediate-term, investment-grade bonds. The universe for the Fund includes all sectors of the bond market: governments, corporate bonds, mortgages, asset-backed securities, money market instruments and international bonds. The Fund seeks total return consistent with preservation of capital by employing PIMCO’s “Total Return” fixed investment philosophy. This philosophy follows three key principles:
| | • | | Major shifts in portfolio strategy are driven by longer-term, or secular, trends as opposed to short-term interest rate fluctuations. |
| | • | | Consistent investment performance is achieved by avoiding extreme swings in maturity/duration of a portfolio. |
| | • | | Emphasis is placed on adding value through state-of-the-art tools such as futures, options and volatility analysis. |
Economic analysis serves as the base for PIMCO’s portfolio strategy. Annually, PIMCO investment professionals conduct a 3-day secular forum, where long-term economic and market forces are evaluated and portfolio strategies are set. Each quarter, the team meets to evaluate the current business cycle and develop shorter-term forecasts which are used to fi ne-tune investment strategy. PIMCO’s fixed income research efforts focus on identifying relative value and understanding the risks inherent in different portfolio structures, strategies, and bond market sectors. Using proprietary analytics and bottom-up credit analysis, the portfolio managers select individual bonds based on recommendations from sector analysts (who specialize in corporate, mortgage, high yield, government, and international bonds).
The ideal investment exhibits many of the following traits:
| | • | | It allows management to meet its overall portfolio positioning targets. Management typically invests in investment-grade securities but may invest up to 10% of the portfolio in securities that are below investment grade. |
| | • | | The investment has been independently analyzed by PIMCO. PIMCO does not rely solely on the credit ratings assigned by outside credit agencies. |
| | • | | Fund management deems that the security provides value relative to other securities within the same sector. |
The portfolio management team:
| | • | | Is committed to seeking value across all bond market sectors. |
3
Managers Fremont Bond Fund
Portfolio Manager’s Comments (continued)
| | • | | Actively manages duration exposure, yield curve position, volatility, sector allocation, and security selection and takes only modest exposures in each of these areas relative to the market. |
| | • | | Normally hedges at least 75% of its foreign currency exposure. |
| | • | | Utilizes derivatives (futures, options, swap agreements) as substitutes for physical securities as a means of gaining more cost-effective exposure. |
The investment team may sell securities when:
| | • | | Securities individually no longer represent relative value |
| | • | | Fund management makes a shift in its portfolio strategy (change in duration, yield curve positioning, sector strategy, etc.) |
The Year in Review
The U.S. bond market in the fiscal year ended October 31, 2006 was defined by two distinct halves – the first, which was marked by escalating inflationary fears, tighter global central bank policy and higher interest rates; and the second, which was marked by a Federal Reserve pause, poor economic data, and sharply falling rates. During the year, the Fed hiked the Fed Funds rate 6 times, from 3.75% to 5.25%, as higher energy prices and a resilient U.S. economy led to concerns over higher inflation. In August, however, for the first time in over 2 years, the Fed decided to keep rates on hold, signaling that the tightening cycle may have come to an end. Following the Fed pause in August, economic data releases began to signal a weakening economy, led by poor data in the housing and auto sectors. The economic slowdown sparked a sharp bond rally, as the 10-year Treasury yield fell to 4.60%, well off the fiscal year’s high of 5.24% reached in June. As longer-term bonds rallied and rates fell, short-term bonds were anchored by the Fed Funds rate, which led to an inversion in the yield curve. Yield curve inversions historically have been associated with future economic recessions.
For the 12-month period ending October 31, 2006, the Managers Fremont Bond Fund returned 4.75%, compared to a return of 5.19% for its benchmark, the Lehman Brothers Aggregate Bond Index. Relative performance was driven by various sources. Strategies that added to relative performance included: a duration overweight, particularly in the second half of the year as yields fell, an overweight to mortgage-backed securities, which benefited from strong investor demand, and allocations to municipal and emerging market bonds. Conversely, an emphasis on short-term securities, which failed to keep up with longer bonds due to aggressive monetary policy, an underweight to corporate bonds, which outperformed due to higher yields, and a small allocation to Treasury Inflation-Protected Securities (TIPS) detracted from relative performance. Additionally, non-U.S. dollar exposure detracted from returns, as holdings in short-term U.K. bonds underperformed due to aggressive tightening of monetary policy.
Looking Forward
The most likely outcome for the global economy over the next several quarters is for slower growth with inflation near or slightly higher than current levels. What is more important from PIMCO’s perspective is the distribution of risks around this forecast, which we believe tilts toward a sharper-than-expected slowdown and lower inflation. The key elements of PIMCO’s outlook include:
4
Managers Fremont Bond Fund
Portfolio Manager’s Comments (continued)
| | • | | Housing Contraction Could Trigger Weaker Economy – The current slowdown in the property market, which has already helped curtail growth, may intensify in the months ahead. Given modest growth in real disposable income, the greatest risk is that the downturn in housing, amplified by weakness in the auto sector, could have a large enough effect on the consumer to drive the economy toward a recession. |
| | • | | Faster Growth Possible, But Not Probable – Growth could turn out to be faster than PIMCO expects, but this outcome is less likely. In this case, the cyclical correction in energy prices now under way will have a more powerful effect on consumer purchasing power than the housing downturn. |
| | • | | Fed Tightening Finished, Cuts May Come In Next Few Months – Should the housing downturn deepen and flow through to consumption, the Fed will ease to forestall a recession. This could potentially drive the federal funds rate toward 4 percent from the current 5.25 percent. |
| | • | | Inflation Modestly Higher, But Contained – The culprits in higher inflation have been increased housing rental rates, rising unit labor costs, and higher energy prices. Going forward, the decline in the housing sector and weaker global growth should help contain these pressures. Financial markets see inflation as relatively benign over the longer term, as evidenced by the modest inflation expectations observable in the market for longer dated Treasury Inflation Protected Securities (TIPS). |
| | • | | Europe and Japan on Slower Path as Well – Deceleration in European growth will come from fiscal and monetary tightening. Germany will see a substantial boost in its Value Added Tax next year and the European Central Bank (ECB) will continue raising rates to bring headline inflation back within its target zone. Asia/Japan will likely see a modest slowdown as weaker U.S. growth crimps durable goods exports. The Bank of Japan will tighten at a measured pace so as not to threaten Japan’s recovery. |
| | • | | Emerging Markets Resilient as Global Growth Cools – Emerging economies will feel the impact of decelerating U.S. growth and lower commodity prices but these effects will be far less severe than in the past. Improvement in their economic fundamentals, including more flexible exchange rates and abundant currency reserves, will cushion the blow. |
PIMCO will remain focused on higher quality assets that should perform well in the event of a sharper-than-expected downturn. In addition, we will pursue strategies that seek price gains rather than yield enhancement. These positions will include:
| | • | | Interest Rate Strategies – We will target duration above the Index in an effort to capture gains from falling rates as the economy weakens. PIMCO will emphasize shorter maturities that should gain as markets continue to anticipate Fed easing. |
| | • | | Mortgage-Backed Bonds – Mortgages remain a source of high quality yield for port-folios in an environment where riskier assets are fully valued. PIMCO plans to retain its overweight to this sector and also seek gains from security selection. It also plans to emphasize asset-backed bonds, where even after strong recent performance attractive valuations remain available along with the potential ample collateral protection. |
5
Managers Fremont Bond Fund
Portfolio Manager’s Comments (continued)
| | • | | Corporates/Emerging Markets – Thin credit premiums in these sectors remain at risk of widening as the global economy weakens and risk aversion heightens. PIMCO therefore plans to continue to underweight corporates and hold only modest levels of high quality emerging market credits. |
| | • | | TIPS and Municipals – TIPS valuations are not especially compelling, so we plan to maintain relatively small positions as a hedge in case inflation accelerates more than expected. PIMCO would look to add TIPS opportunistically. |
Cumulative Total Return Performance
The Fund’s cumulative total return is based on the daily change in net asset value (NAV), and assumes that all distributions were reinvested. The Lehman Brothers Aggregate Bond Index is an index of the U.S. investment grade fixed-rate bond market, including both government and corporate bonds. Unlike the Fund, the Lehman Brothers Aggregate Bond Index is unmanaged, is not available to investment, and does not incur expenses. The chart illustrates the performance of a hypothetical $10,000 investment made in the Managers Fremont Bond Fund on October 31, 1996, to a $10,000 investment made in the Lehman Brothers Aggregate Bond Index for the same period. Performance for periods longer than one year is annualized. The graph and table do not reflect the deduction of taxes that a shareholder would pay on a Fund distribution or redemption of shares. The listed returns for the Fund are net of expenses and the returns for the index exclude expenses. Total returns for the Fund would have been lower had certain expenses not been reduced.
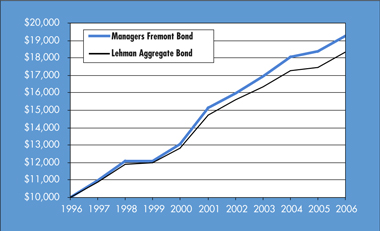
6
Managers Fremont Bond Fund
Portfolio Manager’s Comments (continued)
The table below shows the average annual total returns for the Managers Fremont Bond Fund and the Lehman Brothers Aggregate Bond Index from October 31, 1996 through October 31, 2006.
| | | | | | | | | |
Average Annual Total Returns | | One Year | | | Five Years | | | Ten Years | |
Managers Fremont Bond | | 4.75 | % | | 4.95 | % | | 6.78 | % |
Lehman Brothers Aggregate Bond Index | | 5.19 | % | | 4.51 | % | | 6.26 | % |
The performance data shown represents past performance. Past performance is not a guarantee of future results. Current performance may be lower or higher than the per-formance data quoted. The investment return and the principal value of an investment will fluctuate so that an investor’s shares, when redeemed, may be worth more or less than their original cost. For performance information through the most recent month end please call (800) 835-3879 or visit our Web site at www.managersinvest.com.
Fixed-income funds are subject to risks associated with investments in debt securities, such as default risk and fluctuations in the perception of the debtor’s ability to pay its creditors. Changing interest rates may adversely affect the value of a fixed income investment. An increase in interest rates typically causes the value of bonds and other fixed-income securities to fall.
The Fund may use derivative instruments for hedging purposes or as part of its investment strategy. There is a risk that a derivative intended as a hedge may not perform as expected. The main risk with derivatives is that some types can amplify a gain or loss, potentially earning or losing substantially more money than the actual cost of the derivative; or that the counterparty may fail to honor its contract terms, causing a loss for the Fund. Use of these instruments may also involve certain costs and risks such as liquidity risk, interest rate risk, market risk, credit risk, management risk, and the risk that a fund could not close out a position when it would be most advantageous to do so.
7
Managers Fremont Bond Fund
Fund Snapshots
October 31, 2006
Summary of Portfolio Credit Quality (as a Percentage of Portfolio Assets)
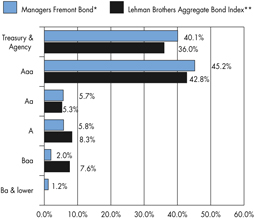
| * | As a percentage of portfolio assets |
| ** | As of September 30, 2006. |
| | | | | | |
Rating | | Managers
Fremont
Bond* | | | Lehman Brothers Aggregate Bond Index** | |
Treasury & Agency | | 40.1 | % | | 36.0 | % |
Aaa | | 45.2 | % | | 42.8 | % |
Aa | | 5.7 | % | | 5.3 | % |
A | | 5.8 | % | | 8.3 | % |
Baa | | 2.0 | % | | 7.6 | % |
Ba & lower | | 1.2 | % | | 0.0 | % |
Top Ten Holdings
| | | |
Security Name | | Percentage
of Net Assets | |
FNMA, 5.500%, TBA | | 6.6 | % |
FNMA, 5.500%, 02/01/35* | | 3.6 | |
Rabobank USA Financial Corp., Discount Notes, 5.290%, 11/01/06 | | 2.7 | |
Total Fina Elf SA, Discount Notes, 5.290%, 11/01/06 | | 2.7 | |
Fortis Funding LLC, Discount Notes, 5.250%, 11/27/06 | | 2.7 | |
UBS Finance (Delaware) LLC, Discount Notes, 5.240%, 01/22/07 | | 2.7 | |
Toyota Motors Credit Corp., Discount Notes, 5.230%, 02/23/07 | | 2.7 | |
IXIS Commercial Paper Corp., Discount Notes, 5.270%, 11/07/06 | | 2.5 | |
Societe Generale N.A., Discount Notes, 5.250%, 12/01/06 | | 2.1 | |
Westpac Banking Corp., Discount Notes, 5.250%, 01/25/07 | | 1.9 | |
| | | |
Top Ten as a Group | | 30.2 | % |
| | | |
| * | Top Ten Holding at April 30, 2006 |
Any sectors, industries, or securities discussed should not be perceived as investment recommendations. Mention of a specific security should not be considered a recommendation to buy or solicitation to sell that security.
8
Managers Fremont Bond Fund
Schedule of Portfolio Investments
October 31, 2006
| | | | | | |
| | | Principal Amount | | Value |
Corporate Bonds - 27.2% | | | | | | |
Asset-Backed Securities - 11.1% | | | | | | |
American Home Mortgage Investment Trust, 4.390%, 02/25/45, (11/25/06) 1 | | $ | 1,497,809 | | $ | 1,460,095 |
Amortizing Residential Collateral Trust, 5.610%, 07/25/32, (11/25/06) 1 | | | 77,398 | | | 77,585 |
Argent Securities, Inc., 5.380%, 09/25/36, (11/25/06) 1 | | | 1,356,494 | | | 1,357,338 |
Arkle Master Issuer PLC, Series 2006-1A, Class 1A, 5.315%, 11/19/07, (12/17/06) 1 | | | 5,800,000 | | | 5,800,908 |
Badger Tobacco Asset Securitization Corp., 6.000%, 06/01/17 | | | 2,600,000 | | | 2,779,816 |
Banc of America Funding Corp., 4.114%, 05/25/35 8 | | | 1,775,965 | | | 1,734,865 |
Bear Stearns Adjustable Rate Mortgage Trust, 5.059%, 04/25/33 8 | | | 1,109,945 | | | 1,114,058 |
Bear Stearns Adjustable Rate Mortgage Trust, 5.623%, 02/25/33 8 | | | 248,361 | | | 247,474 |
Bear Stearns Adjustable Rate Mortgage Trust, 6.041%, 11/25/30 8 | | | 84,866 | | | 85,018 |
Bear Stearns Alt-A Trust, 5.393%, 05/25/35 8 | | | 2,797,485 | | | 2,805,273 |
Citigroup Commercial Mortgage Trust, 2004-Fl2 A1, 5.390%, 07/15/18 | | | 5,200,000 | | | 5,203,258 |
Citigroup Mortgage Loan Trust, Inc., 2006-WFH4 A1, 5.370%, 11/25/36 | | | 1,600,000 | | | 1,600,000 |
Citigroup Mortgage Loan Trust, Inc., Series 2005-11, Class A2A, 4.700%, 12/25/35, (07/25/10) 1 | | | 729,686 | | | 717,994 |
Countrywide Alternative Loan Trust, 5.500%, 01/25/46 8 | | | 2,100,000 | | | 2,100,000 |
Countrywide Alternative Loan Trust, 5.500%, 12/25/46 8 | | | 2,300,000 | | | 2,300,000 |
Countrywide Home Loans, Inc., Asset Backed Certificates, 5.250%, 09/20/10 8 | | | 783,754 | | | 776,574 |
Credit Suisse First Boston Mortgage Securities Corp., 5.540%, 11/15/19, (11/15/06) 1 | | | 2,680,810 | | | 2,683,943 |
Credit Suisse First Boston Mortgage Securities Corp., 5.756%, 10/25/32 8 | | | 74,503 | | | 74,248 |
Credit Suisse First Boston Mortgage Securities Corp., 5.870%, 08/25/33, (11/25/06) 1 | | | 718,032 | | | 718,239 |
EMC Mortgage Loan Trust, Class A, 5.690%, 05/25/40, (11/25/06) (a) 1 | | | 1,775,791 | | | 1,781,845 |
First Franklin Mortgage Loan Asset Backed Certificates, Series 2006-FF15, Class A3, 5.370%, 11/25/36, (11/25/06) 1 | | | 3,700,000 | | | 3,702,898 |
Fremont Home Loan Trust, 5.410%, 01/25/36, (11/25/06) 1 | | | 667,772 | | | 668,277 |
Goldman Sachs Mortgage Security Corp., GSAMP Trust Series 2006-HE7, Class A2A, 5.360%, 11/25/46, (11/25/06) 1 | | | 4,327,000 | | | 4,328,355 |
Hyundai Auto Receivables Trust, 5.280%, 11/15/07 8 | | | 4,800,000 | | | 4,800,754 |
IndyMac Index Mortgage Loan Trust, Series 2005-AR31, 5.189%. 01/25/36 8 | | | 4,094,741 | | | 4,084,294 |
The accompanying notes are an integral part of these financial statements.
9
Managers Fremont Bond Fund
Schedule of Portfolio Investments (continued)
| | | | | | |
| | | Principal Amount | | Value |
Asset-Backed Securities (continued) | | | | | | |
IndyMac Index Mortgage Loan Trust, Series 2006-AR14, 5.410%, 11/25/46, (11/25/06) 1 | | $ | 2,200,000 | | $ | 2,200,259 |
JP Morgan Acquisition Corp., Class A, 5.380%, 08/25/36, (11/25/06) 1 | | | 1,462,369 | | | 1,463,153 |
JP Morgan Chase Capital XX, 6.550%, 09/29/36 | | | 400,000 | | | 415,767 |
Lehman Brothers Commercial Mortgage Trust, 5.400%, 09/15/21, (11/15/06) 1 | | | 2,417,596 | | | 2,419,094 |
Lehman XS Trust, 5.400%, 11/25/46, (11/25/06) 1 | | | 3,862,068 | | | 3,862,670 |
Long Beach Mortgage Loan Trust, Series 2004-4, Class 1A1, 5.600%, 10/25/34, (11/25/06) 1 | | | 727,251 | | | 728,081 |
Morgan Stanley ABS Capital I, Inc. Trust, 5.370%, 11/15/36 8 | | | 1,400,000 | | | 1,400,000 |
Nordea Bank Finland PLC, 5.263%, 03/31/08, (11/29/06) 1 | | | 1,800,000 | | | 1,799,487 |
Park Place Securities, Inc., Series 2005-WCW1, Class A1B, 5.580%, 09/25/35, (11/25/06) 1 | | | 4,858,512 | | | 4,868,547 |
Prime Mortgage Trust, 5.720%, 02/25/19, (11/25/06) 1 | | | 124,668 | | | 124,906 |
Prime Mortgage Trust, 5.720%, 02/25/34, (11/25/06) 1 | | | 547,204 | | | 549,026 |
Prudential Home Mortgage Securities, 7.000%, 06/25/08 | | | 54,334 | | | 54,151 |
Residential Asset Mortgage Products, Inc., 5.390%, 11/25/36, (11/25/06) 1 | | | 7,170,000 | | | 7,172,246 |
Residential Asset Securities Corp., Class 1A1, 5.390%, 11/25/36, (11/25/06) 1 | | | 5,800,000 | | | 5,801,817 |
Residential Asset Securities Corp., Class AI1, 5.390%, 11/25/36, (11/25/06) 1 | | | 3,200,000 | | | 3,201,002 |
Saxon Asset Securities Trust, 5.380%, 11/25/36, (11/25/06) 1 | | | 1,672,337 | | | 1,673,376 |
Structured Asset Mortgage Investments, Inc., 5.650%, 09/19/32, (11/19/06) 1 | | | 1,006,346 | | | 1,007,877 |
Structured Asset Securities Corp., 5.345%, 10/25/35 8 | | | 3,400,000 | | | 3,382,469 |
Structured Asset Securities Corp., 5.370%, 10/25/36, (11/25/06) 1 | | | 3,500,000 | | | 3,500,000 |
Structured Asset Securities Corp., 5.420%, 07/25/35, (11/25/06) 1 | | | 1,125,711 | | | 1,126,682 |
Structured Asset Securities Corp., 5.620%, 01/25/33, (11/25/06) 1 | | | 77,557 | | | 78,101 |
Structured Asset Securities Corp., 6.792%, 01/25/32 8 | | | 121,769 | | | 121,334 |
U.S. Small Business Administration Participation Certificates, 5.130%, 09/01/23 | | | 160,506 | | | 160,449 |
U.S. Small Business Administration Surety Bonds, 7.449%, 08/01/10 | | | 47,933 | | | 50,584 |
U.S. Small Business Administration Surety Bonds, 6.344%, 08/01/11 | | | 2,033,977 | | | 2,103,844 |
Unicredito Luxembourg Finance SA, 5.425%, 10/24/08 (a) 8 | | | 10,900,000 | | | 10,904,218 |
Wachovia Bank Commercial Mortgage Trust, Series 2006-WL7A Class A1, 5.410%, 09/15/21, (11/15/06) 1 | | | 8,500,000 | | | 8,505,267 |
The accompanying notes are an integral part of these financial statements.
10
Managers Fremont Bond Fund
Schedule of Portfolio Investments (continued)
| | | | | | | |
| | | Principal Amount | | | Value |
Asset-Backed Securities (continued) | | | | | | | |
Washington Mutual MSC Mortgage Pass-Through, 5.410%, 02/25/31 8 | | | 254,379 | | | | 253,613 |
Washington Mutual, Series 2005-AR13, Class A1A1, 5.610%, 10/25/45, (11/25/06) 1 | | $ | 846,514 | | | $ | 851,738 |
Wells Fargo Co., 4.950%, 03/25/36 8 | | | 3,244,371 | | | | 3,220,630 |
Wells Fargo Home Equity Trust, 5.610%, 12/25/35, (11/25/06) 1 | | | 3,564,651 | | | | 3,567,345 |
Total Asset-Backed Securities | | | | | | | 129,570,842 |
Finance - 11.8% | | | | | | | |
American Express Bank, Ltd., 5.330%, 10/16/08, (11/16/06) 1 | | | 3,100,000 | | | | 3,100,735 |
American Express Bank, Ltd., 5.380%, 10/20/09, (11/20/06) 1 | | | 2,300,000 | | | | 2,301,327 |
American General Finance Corp., 5.429%, 03/23/07, (12/27/06) 1 | | | 600,000 | | | | 600,281 |
American International Group, 5.050%, 10/01/15 (a) | | | 400,000 | 2 | | | 391,516 |
ANX National Bank, Ltd., 5.539%, 08/07/09, (02/08/07) (a) 1 | | | 2,500,000 | | | | 2,499,193 |
Bank of America Corp., 5.405%, 06/19/09, (12/19/06) 1 | | | 10,500,000 | | | | 10,510,752 |
Bank of America Corp., 6.000%, 10/15/36 | | | 900,000 | | | | 931,317 |
Bear, Stearns Co., Inc., 5.457%, 03/30/09, (12/29/06) 1 | | | 2,400,000 | 2 | | | 2,403,557 |
Bear, Stearns Co., Inc., 5.489%, 08/21/09, (11/21/06) 1 | | | 4,800,000 | | | | 4,806,874 |
China Development Bank, 5.000%, 10/15/15 | | | 300,000 | | | | 293,267 |
CIT Group, Inc., 5.526%, 01/30/09, (01/30/07) 1 | | | 5,400,000 | | | | 5,415,325 |
CIT Group, Inc., 5.546%, 08/17/09, (11/17/06) 1 | | | 2,400,000 | | | | 2,403,120 |
CIT Group, Inc., 5.656%, 07/28/11, (01/29/07) 1 | | | 2,600,000 | | | | 2,605,151 |
Citigroup Global Markets Holdings, Inc., 5.495%, 03/17/09, (12/18/06) 1 | | | 2,200,000 | | | | 2,203,344 |
Citigroup, Inc., 5.408%, 12/26/08, (12/27/06) 1 | | | 2,700,000 | | | | 2,702,938 |
Citigroup, Inc., 5.416%, 01/30/09, (01/31/07) 1 | | | 3,400,000 | 2 | | | 3,403,053 |
Citigroup, Inc., 6.125%, 08/25/36 | | | 4,100,000 | | | | 4,272,602 |
DnB NOR Bank ASA, 5.443%, 10/13/09, (10/13/07) (a) 1 | | | 11,000,000 | | | | 11,003,278 |
Ford Motor Credit Corp., 7.875%, 06/15/10 | | | 2,000,000 | | | | 1,953,132 |
General Electric Capital Corp., 5.410%, 01/05/09, (01/05/07) 1 | | | 2,500,000 | | | | 2,502,725 |
General Electric Capital Corp., 5.444%, 01/20/10, (01/22/07) 1 | | | 2,300,000 | | | | 2,304,931 |
General Motors Acceptance Corp., 6.243%, 03/20/07, (11/20/06) 1 | | | 700,000 | | | | 699,541 |
Goldman Sachs Group, Inc., 5.477%, 12/22/08, (12/22/06) 1 | | | 6,000,000 | | | | 6,009,618 |
Goldman Sachs Group, Inc., 5.479%, 06/23/09, (12/26/06) 1 | | | 4,300,000 | | | | 4,304,610 |
HBOS PLC, 5.920%, 09/01/49 (a) 5,8 | | | 400,000 | 2 | | | 392,366 |
HBOS Treasury Services PLC, 5.414%, 07/17/09, (01/17/07) (a) 1 | | | 3,600,000 | | | | 3,603,863 |
HSBC Bank USA, N.A., 5.460%, 09/12/07, (12/21/06) 1 | | | 5,100,000 | | | | 5,106,401 |
HSBC Finance Corp., 5.520%, 09/15/08, (12/15/06) 1 | | | 5,900,000 | | | | 5,917,960 |
The accompanying notes are an integral part of these financial statements.
11
Managers Fremont Bond Fund
Schedule of Portfolio Investments (continued)
| | | | | | | |
| | | Principal Amount | | | Value |
Finance (continued) | | | | | | | |
KBC Bank Fund Trust II, 6.875%, 06/30/49 5,8 | | € | 1,900,000 | | | $ | 2,583,579 |
Lehman Brothers Holdings, Inc., 5.460%, 04/03/09, (01/03/07) 1 | | | 4,700,000 | 2 | | | 4,706,900 |
Lehman Brothers Holdings, Inc., 5.464%, 10/22/08, (01/22/07) 1 | | | 3,900,000 | 2 | | | 3,905,990 |
Lehman Brothers Holdings, Inc., 5.594%, 07/18/11, (01/18/07) 1 | | | 1,700,000 | 2 | | | 1,704,797 |
Lloyds TSB Capital 1, L.P., 7.375%, 02/07/49 5,8 | | € | 1,800,000 | | | | 2,616,916 |
Merrill Lynch & Co., Inc., 5.414%, 10/23/08, (01/23/07) 1 | | | 4,300,000 | | | | 4,300,929 |
Merrill Lynch & Co., Inc., 5.466%, 08/14/09, (02/14/07) 1 | | | 2,200,000 | | | | 2,201,969 |
Merrill Lynch & Co., Inc., 5.577%, 07/25/11, (01/25/07) 1 | | | 3,000,000 | | | | 3,006,003 |
Mitsubishi Ufj Financial Group, Inc., 6.346%, 07/29/49 5,8 | | | 400,000 | | | | 404,685 |
Morgan Stanley & Co, Inc., 5.485%, 02/09/09, (02/09/07) 1 | | | 1,400,000 | | | | 1,402,614 |
Resona Bank Ltd., 5.850%, 04/15/49 (a) 5,8 | | | 500,000 | | | | 490,649 |
Royal Bank of Scotland Group PLC, 5.424%, 07/21/08, (01/22/07) (a) 1 | | | 1,800,000 | | | | 1,801,870 |
Royal Bank of Scotland Group PLC, 9.118%, 03/31/49 5 | | | 1,000,000 | 2 | | | 1,114,484 |
Santander U.S. Floater, 5.450%, 09/19/08, (12/21/06) 1 | | | 10,200,000 | | | | 10,216,565 |
USB Capital IX, 6.189%, 03/29/49 5,8 | | | 300,000 | 2 | | | 306,600 |
VTB Capital SA., 5.970%, 08/01/08, (02/01/07) 1 | | | 2,200,000 | | | | 2,200,000 |
Total Finance | | | | | | | 137,607,327 |
Energy - 0.1% | | | | | | | |
Peabody Energy Corp., 7.875%, 11/01/26 (a) | | | 1,000,000 | | | | 1,042,500 |
Industrials - 4.0% | | | | | | | |
AT&T, Inc., 4.214%, 06/05/07 (a) | | | 3,100,000 | | | | 3,084,977 |
BellSouth Corp., 5.580%, 08/15/08, (11/15/06) 1 | | | 3,600,000 | 2 | | | 3,602,952 |
Codelco, Inc., 6.150%, 10/24/36 (a) | | | 300,000 | | | | 308,765 |
DaimlerChrysler N.A. Holding Corp., 5.740%, 11/17/06, (11/17/06) 1 | | | 5,800,000 | | | | 5,800,522 |
DaimlerChrysler N.A. Holding Corp., 5.820%, 08/03/09, (02/05/07) 1 | | | 2,200,000 | | | | 2,202,732 |
General Electric Capital Corp., 5.410%, 10/26/09, (01/26/07) 1 | | | 6,000,000 | 2 | | | 6,001,788 |
General Electric Capital Corp., 5.431%, 03/04/08, (12/04/06) 1 | | | 5,000,000 | | | | 5,005,495 |
General Electric Capital Corp., 5.570%, 01/08/16, (01/08/07) 1 | | | 1,000,000 | | | | 1,003,916 |
Heinz (H.J.) Co., 6.428%, 12/01/08 (a) | | | 400,000 | | | | 407,828 |
Pemex Project Funding Master Trust, 5.750%, 12/15/15 (a) | | | 800,000 | | | | 791,000 |
Pemex Project Funding Master Trust, 8.000%, 11/15/11 | | | 1,800,000 | 2 | | | 1,984,500 |
Pemex Project Funding Master Trust, 8.625%, 02/01/22 | | | 400,000 | | | | 489,000 |
Petroleum Export Ltd. (Cayman), 5.265%, 06/15/11 (a) | | | 278,644 | | | | 271,770 |
Qwest Capital Funding, Inc., 7.250%, 02/15/11 | | | 1,813,000 | 2 | | | 1,844,728 |
Qwest Communications International, 7.500%, 02/15/14 | | | 1,600,000 | 2 | | | 1,640,000 |
The accompanying notes are an integral part of these financial statements.
12
Managers Fremont Bond Fund
Schedule of Portfolio Investments (continued)
| | | | | | | |
| | | Principal Amount | | | Value |
Industrials (continued) | | | | | | | |
Ras Laffan Liquefi ed Natural Gas Co., Ltd, 5.298%, 09/30/20 (a) | | $ | 900,000 | 2 | | $ | 870,548 |
Sonat, Inc., 7.625, 07/15/11 | | | 1,300,000 | | | | 1,352,000 |
Telefonica Emisiones SAU, 5.690%, 06/19/09, (12/20/06) 1 | | | 3,000,000 | | | | 3,004,659 |
Tennessee Gas Pipeline Co., 7.000%, 10/15/28 | | | 6,145,000 | 2 | | | 6,230,477 |
Total Industrials | | | | | | | 45,897,657 |
Utility - 0.2% | | | | | | | |
Transocean, Inc., 5.591%, 09/05/08, (12/05/06) 1 | | | 2,200,000 | | | | 2,201,683 |
Total Corporate Bonds (cost $309,446,196) | | | | | | | 316,320,009 |
Foreign Government and Agency Obligations - 0.5% | | | | | | | |
Export-Import Bank of China, The, 4.875%, 07/21/15 (a) | | | 300,000 | | | | 291,209 |
Federal Republic of Brazil, 7.875%, 03/07/15 | | | 3,200,0002 | | | | 3,552,000 |
Mexico Government, 5.625%, 01/15/17 | | | 1,000,000 | | | | 1,002,000 |
Republic of Panama, 8.875%, 09/30/27 | | | 200,000 | | | | 250,000 |
Total Foreign Government and Agency Obligations (cost $4,726,404) | | | | | | | 5,095,209 |
U.S. Government and Agency Obligations - 45.4% | | | | | | | |
Federal Home Loan Bank - 0.1%6,8 | | | | | | | |
FHLB, 0.000%, 02/05/07 | | | 700,000 | | | | 687,750 |
Federal Home Loan Mortgage Corporation - 2.5% | | | | | | | |
FHLMC, 4.919%, 11/01/34, (09/01/09) 1 | | | 5,510,223 | | | | 5,432,457 |
FHLMC, 5.000%, 10/01/18 to 11/01/18 | | | 2,324,137 | | | | 2,293,851 |
FHLMC, 5.620%, 05/15/36, (11/15/06) 1 | | | 1,800,000 | | | | 1,799,137 |
FHLMC, 5.820%, 09/15/30, (11/15/06) 1 | | | 90,793 | | | | 91,237 |
FHLMC, 6.000%, 02/01/16 to 09/01/16 | | | 392,359 | | | | 398,436 |
FHLMC, 6.500%, 01/01/26 to 08/15/31 | | | 16,471,266 | | | | 17,104,121 |
FHLMC, 7.000%, 11/15/20 | | | 48,964 | | | | 48,882 |
FHLMC, 7.209%, 07/01/30, (07/01/07) 1 | | | 5,346 | | | | 5,441 |
FHLMC, 7.500%, 08/15/30 | | | 641,607 | | | | 644,196 |
FHLMC Gold Pool, 4.500%, 02/01/14 | | | 373,261 | | | | 365,429 |
FHLMC Structured Pass Through Securities, 5.763%, 02/25/45, (11/25/06) 1 | | | 445,259 | | | | 444,936 |
Total Federal Home Loan Mortgage Corporation | | | | | | | 28,628,123 |
Federal National Mortgage Association - 38.8% | | | | | | | |
FNMA, 3.500%, 07/01/11 | | | 591,819 | | | | 561,079 |
FNMA, 4.000%, 05/01/14 | | | 478,386 | | | | 461,651 |
FNMA, 4.500%, 05/01/21 | | | 180,252 | | | | 174,424 |
The accompanying notes are an integral part of these financial statements.
13
Managers Fremont Bond Fund
Schedule of Portfolio Investments (continued)
| | | | | | | |
| | | Principal Amount | | | Value |
Federal National Mortgage Association (continued) | | | | | | | |
FNMA, 4.614%, 09/01/35, (08/01/10) 1 | | $ | 5,240,828 | | | $ | 5,159,987 |
FNMA, 4.836%, 06/01/35, (06/01/10) 1 | | | 8,084,794 | | | | 8,005,732 |
FNMA, 5.000%, 05/01/14 to 03/01/36 | | | 79,602,643 | | | | 78,082,250 |
FNMA, 5.000%, TBA | | | 22,000,000 | | | | 21,243,750 |
FNMA, 5.462%, 05/01/36, (11/01/06) 1 | | | 2,656,283 | | | | 2,676,291 |
FNMA, 5.465%, 05/01/36, (11/01/06) 1 | | | 1,512,008 | | | | 1,523,409 |
FNMA, 5.500%, 02/01/17 to 06/01/36 | | | 233,280,564 | | | | 230,917,150 |
FNMA, 5.500%, TBA | | | 78,000,000 | | | | 77,098,163 |
FNMA, 5.500%, TBA | | | 16,500,000 | | | | 16,304,063 |
FNMA, 6.000%, 04/01/16 to 11/01/33 | | | 3,983,644 | | | | 4,050,089 |
FNMA, 6.000%, TBA | | | 3,000,000 | | | | 3,018,750 |
FNMA, 7.200%, 05/25/23 | | | 1,250,871 | | | | 1,311,912 |
FNMA, 7.500%, 02/25/08 | | | 70,986 | | | | 71,432 |
FNMA, Series 2006-5, Class 3A2, 4.678%, 05/25/35 8 | | | 500,000 | | | | 494,088 |
FNMA Whole Loan, 6.500%, 12/25/42 | | | 527,330 | | | | 537,861 |
Total Federal National Mortgage Association | | | | | | | 451,692,081 |
Government National Mortgage Association - 0.9% | | | | | | | |
GNMA, 5.125%, 11/20/24 to 11/20/29, (01/01/07) 1 | | | 701,644 | | | | 707,619 |
GNMA, 5.375%, 03/20/24, (04/01/07) 1 | | | 74,215 | | | | 74,602 |
GNMA, 5.375%, 04/20/21, (07/01/07) 1 | | | 13,876 | | | | 13,965 |
GNMA, 5.750%, 08/20/25, (10/01/07) 1 | | | 49,209 | | | | 49,672 |
GNMA, 6.500%, 06/20/28 | | | 1,545,039 | | | | 1,590,617 |
GNMA, 6.750%, 10/16/40 | | | 7,623,148 | | | | 8,320,150 |
Total Government National Mortgage Association | | | | | | | 10,756,625 |
Unites States Treasury Bonds - 3.1% | | | | | | | |
U.S. Treasury Bonds, 2.375%, 01/15/25 | | | 10,762,418 | 2 | | | 10,897,798 |
U.S. Treasury Bonds, 4.790%, 12/14/06 | | | 10,516,000 | | | | 10,454,765 |
U.S. Treasury Bonds, 4.840%, 11/30/06 | | | 440,000 | | | | 438,212 |
U.S. Treasury Inflation Indexed Bonds, 2.000%, 01/15/26 | | | 12,635,298 | 2 | | | 12,080,040 |
U.S. Treasury Inflation Indexed Bonds, 3.375%, 01/15/07 7 | | | 900,816 | | | | 890,506 |
U.S. Treasury Inflation Indexed Bonds, 3.625%, 04/15/28 | | | 1,134,531 | 2 | | | 1,401,324 |
Total Unites States Treasury Bonds | | | | | | | 36,162,645 |
Total U.S. Government and Agency Obligations (cost $528,885,449) | | | | | | | 527,927,224 |
The accompanying notes are an integral part of these financial statements.
14
Managers Fremont Bond Fund
Schedule of Portfolio Investments (continued)
| | | | | | | |
| | | Principal
Amount | | | Value |
Municipal Bonds - 0.8% | | | | | | | |
New York State Environmental Facilities Corp., State Clean Water & Drinking Residuals, Series 658, 6.320%, 06/15/23, (11/16/06) 1 | | $ | 1,050,000 | | | $ | 1,180,463 |
State of Texas, Transportation Commission-Mobility Fund, Series A, 4.750%, 04/01/35 | | | 1,200,000 | | | | 1,232,616 |
New Jersey Tobacco Settlement Funding Corp., 6.125%, 06/01/24 | | | 950,000 | | | | 1,031,947 |
New Jersey Tobacco Settlement Funding Corp., 6.750%, 06/01/39 | | | 5,350,000 | | | | 6,123,450 |
Truckee Meadows, NV Water Authority Revenue, Series A, 5.000%, 07/01/36 8 | | | 67,000 | | | | 78,863 |
Total Municipal Bonds (cost $11,061,128) | | | | | | | 9,647,339 |
| | |
| | | Shares | | | |
Municipal Funds - 1.0% | | | | | | | |
Dreyfus Municipal Income, Inc. | | | 37,500 | | | | 342,375 |
BlackRock MuniEnhanced Fund, Inc. | | | 44,000 | | | | 483,560 |
BlackRock MuniHoldings Florida Insured Fund | | | 25,000 | 2 | | | 361,500 |
BlackRock MuniHoldings Insured Fund II, Inc. | | | 51,900 | | | | 674,181 |
BlackRock MuniVest Fund, Inc. | | | 55,000 | | | | 555,500 |
BlackRock MuniYield Fund, Inc. | | | 55,000 | | | | 866,800 |
BlackRock MuniYield Quality Fund II, Inc. | �� | | 55,000 | | | | 711,150 |
BlackRock MuniYield Quality Fund, Inc. | | | 55,000 | 2 | | | 796,400 |
DWS Municipal Income Trust | | | 55,000 | | | | 604,450 |
MFS Municipal Income Trust | | | 53,800 | 2 | | | 441,160 |
Nuveen Performance Plus Municipal Fund | | | 55,000 | | | | 829,950 |
Nuveen Premium Income Municipal Fund 2 | | | 55,000 | | | | 772,750 |
Nuveen Premium Income Municipal Fund 4 | | | 55,000 | | | | 704,000 |
Nuveen Quality Income Municipal Fund | | | 55,000 | | | | 810,150 |
Putnam Municipal Bond Fund | | | 48,000 | | | | 590,880 |
Van Kampen Advantage Municipal Income Trust II | | | 61,796 | | | | 809,528 |
Van Kampen Trust for Investment Grade Municipals | | | 55,000 | | | | 821,700 |
Western Asset Managed Municipals Fund, Inc. | | | 55,000 | | | | 613,250 |
Western Asset Municipal Partners Fund, Inc. | | | 10,582 | | | | 148,360 |
Total Municipal Funds (cost $11,573,900) | | | | | | | 11,937,644 |
Preferred Stock - 0.5%1 | | | | | | | |
DG Funding Trust, 7.626%, (12/29/06) (a) (cost $6,037,773) | | | 573 | | | | 6,111,403 |
Rights - 0.0%# | | | | | | | |
United Mexican States Value Recovery Rights, Series E, Expires June 2007 (cost $33,521) | | | 11,950,000 | | | | 236,013 |
The accompanying notes are an integral part of these financial statements.
15
Managers Fremont Bond Fund
Schedule of Portfolio Investments (continued)
| | | | | |
| | | Notional Amount | | Value |
Options and Swaptions - 0.4% | | | | | |
3-Month Eurodollar (Put), $92.50, 12/18/06 | | 620,000 | | $ | 1,550 |
3-Month Eurodollar (Put), $92.75, 12/18/06 | | 750,000 | | | 1,875 |
3-Month Eurodollar (Put), $92.00, 12/18/06 | | 897,500 | | | 2,244 |
3-Month Eurodollar (Put), $92.25, 12/18/06 | | 1,115,000 | | | 2,788 |
3-Month Eurodollar (Put), $91.25, 09/17/07 | | 1,215,000 | | | 3,038 |
3-Month Eurodollar (Put), $92.25, 12/18/06 | | 1,240,000 | | | 3,100 |
3-Month Eurodollar (Put), $92.25, 03/19/07 | | 1,247,500 | | | 3,119 |
3-Month Eurodollar (Put), $92.00, 03/19/07 | | 2,277,500 | | | 5,694 |
3-Month Eurodollar (Put), $90.75, 09/17/07 | | 2,645,000 | | | 6,613 |
3-Month Eurodollar (Put), $91.25, 06/18/07 | | 3,155,000 | | | 7,888 |
3-Month Eurodollar (Put), $91.00, 06/18/07 | | 3,195,000 | | | 7,987 |
3-Month USD-LIBOR-BBA (Call), 4.850%, 07/02/07 | | 49,000,000 | | | 582,316 |
3-Month USD-LIBOR-BBA (Call), 4.850%, 07/02/07 | | 50,000,000 | | | 92,424 |
3-Month USD-LIBOR-BBA (Call), 4.890%, 12/22/06 | | 30,000,000 | | | 12,960 |
3-Month USD-LIBOR-BBA (Call), 4.900%, 10/25/07 | | 39,000,000 | | | 233,974 |
3-Month USD-LIBOR-BBA (Call), 5.000%, 03/08/07 | | 16,000,000 | | | 52,736 |
3-Month USD-LIBOR-BBA (Call), 5.000%, 03/08/07 | | 30,000,000 | | | 98,880 |
3-Month USD-LIBOR-BBA (Call), 5.000%, 07/02/07 | | 23,000,000 | | | 76,019 |
3-Month USD-LIBOR-BBA (Call), 5.080%, 04/19/07 | | 32,200,000 | | | 161,386 |
3-Month USD-LIBOR-BBA (Call), 5.170%, 02/01/07 | | 26,100,000 | | | 115,023 |
3-Month USD-LIBOR-BBA (Call), 5.200%, 05/09/07 | | 58,100,000 | | | 396,532 |
3-Month USD-LIBOR-BBA (Call), 5.200%, 05/23/07 | | 49,000,000 | | | 346,675 |
3-Month USD-LIBOR-BBA (Call), 5.250%, 06/07/07 | | 9,000,000 | | | 71,973 |
3-Month USD-LIBOR-BBA (Call), 5.250%, 06/07/07 | | 51,000,000 | | | 407,847 |
3-Month USD-LIBOR-BBA (Call), 5.250%, 07/02/07 | | 134,000,000 | | | 1,123,590 |
3-Month USD-LIBOR-BBA (Call), 5.370%, 07/02/07 | | 35,300,000 | | | 353,565 |
6-Month EUR-EURIBOR-Telerate (Call), 3.960%, 07/02/07 | | 9,000,000 | | | 46,946 |
6-Month EUR-EURIBOR-Telerate (Call), 3.960%, 07/02/07 | | 20,000,000 | | | 104,325 |
6-Month EUR-EURIBOR-Telerate (Call), 3.960%, 07/02/07 | | 29,000,000 | | | 151,272 |
6-Month EUR-EURIBOR-Telerate (Call), 4.100%, 07/02/07 | | 20,000,000 | | | 146,418 |
6-Month GBP-LIBOR-BBA (Call), 5.080%, 06/15/07 | | 2,900,000 | | | 9,885 |
6-Month GBP-LIBOR-BBA (Call), 5.080%, 06/15/07 | | 4,400,000 | | | 15,001 |
6-Month GBP-LIBOR-BBA (Call), 5.080%, 06/15/07 | | 7,000,000 | | | 22,093 |
Total Options and Swaptions (cost $3,277,398) | | | | | 4,667,736 |
The accompanying notes are an integral part of these financial statements.
16
Managers Fremont Bond Fund
Schedule of Portfolio Investments (continued)
| | | | | | | |
| | | Principal Amount | | | Value |
Short-Term Investments - 41.7% | | | | | | | |
Certificates of Deposit - 0.6%1 | | | | | | | |
Skandinav Enskilda Bank, 5.272%, 10/03/07, (12/04/06) | | $ | 7,000,000 | | | $ | 6,999,139 |
Commercial Paper - 29.6% | | | | | | | |
Bank of America Corp., Discount Notes, 5.230%, 01/12/07 | | | 400,000 | | | | 395,788 |
Bank of America Corp., Discount Notes, 5.240%, 12/01/06 | | | 21,900,000 | | | | 21,804,078 |
Bank of America Corp., Discount Notes, 5.250%, 01/18/07 | | | 2,100,000 | | | | 2,076,039 |
Barclays U.S. Funding Corp., Discount Notes, 5.220%, 12/22/06 | | | 4,100,000 | | | | 4,069,619 |
CBA (Delaware) Finance, Inc., Discount Notes, 5.240%, 11/20/06 | | | 8,600,000 | | | | 8,576,216 |
CBA (Delaware) Finance, Inc., Discount Notes, 5.250%, 11/27/06 | | | 21,900,000 | | | | 21,817,042 |
Danske Corp., Discount Notes, 5.240%, 12/27/06 | | | 600,000 | | | | 595,086 |
Fortis Funding LLC, Discount Notes, 5.250%, 11/27/06 (a) | | | 31,600,000 | | | | 31,480,297 |
General Electric Capital Corp., Discount Notes, 5.240%, 01/17/07 | | | 18,300,000 | | | | 18,095,040 |
HBOS Treasury Services PLC, Discount Notes, 5.230%, 12/27/06 | | | 3,800,000 | | | | 3,769,068 |
IXIS Commercial Paper Corp., Discount Notes, 5.250%, 12/14/06 (a) | | | 5,400,000 | | | | 5,366,138 |
IXIS Commercial Paper Corp., Discount Notes, 5.270%, 11/07/06 (a) | | | 29,500,000 | | | | 29,474,335 |
Rabobank USA Financial Corp., Discount Notes, 5.290%, 11/01/06 | | | 31,900,000 | | | | 31,900,000 |
Societe Generale N.A., Discount Notes, 5.250%, 12/01/06 | | | 24,700,000 | | | | 24,592,308 |
Societe Generale N.A., Discount Notes, 5.250%, 12/18/06 | | | 7,900,000 | | | | 7,846,043 |
Total Fina Elf SA, Discount Notes, 5.290%, 11/01/06 | | | 31,900,000 | | | | 31,900,000 |
Toyota Motors Credit Corp., Discount Notes, 5.230%, 02/23/07 | | | 31,700,000 | | | | 31,174,730 |
UBS Finance (Delaware) LLC, Discount Notes, 5.220%, 01/08/07 | | | 2,400,000 | | | | 2,376,288 |
UBS Finance (Delaware) LLC, Discount Notes, 5.240%, 01/22/07 | | | 31,700,000 | | | | 31,321,818 |
UBS Finance (Delaware) LLC, Discount Notes, 5.290%, 11/01/06 | | | 800,000 | | | | 800,000 |
Westpac Banking Corp., Discount Notes, 5.250%, 01/18/07 | | | 12,700,000 | | | | 12,555,982 |
Westpac Banking Corp., Discount Notes, 5.250%, 01/25/07 | | | 22,100,000 | | | | 21,826,623 |
Total Commercial Paper | | | | | | | 343,812,538 |
U.S. Government and Agency Discount Notes - 2.4%6,7 | | | | | | | |
FNMA Discount Notes, 0.000%, 11/01/06 to 11/22/06 | | | 28,300,000 | 2 | | | 28,268,892 |
The accompanying notes are an integral part of these financial statements.
17
Managers Fremont Bond Fund
Schedule of Portfolio Investments (continued)
| | | | | | |
| | | Shares | | Value | |
Other Investment Companies - 9.1%3 | | | | | | |
Bank of New York Institutional Cash Reserves Fund, 5.32%4 | | 64,953,589 | | $ | 64,953,589 | |
JPMorgan Prime Money Market Fund, Institutional Class Shares, 5.18% | | 41,223,788 | | | 41,223,788 | |
Total Other Investment Companies | | | | | 106,177,377 | |
Total Short-Term Investments (cost $485,253,896) | | | | | 485,257,946 | |
Total Investments - 117.5% (cost $1,360,295,665) | | | | | 1,367,200,523 | |
Other Assets, less Liabilities - (17.5)% | | | | | (203,949,248 | ) |
Net Assets - 100.0% | | | | $ | 1,163,251,275 | |
The accompanying notes are an integral part of these financial statements.
18
Managers Fremont Bond Fund
Notes to Schedule of Portfolio Investments
The following footnotes and abbreviations are to be read in conjunction with the Schedule of Portfolio Investments previously presented in this report.
Note: Based on the cost of investments of $1,360,305,209 for Federal income tax purposes at October 31, 2006, the aggregate gross unrealized appreciation and depreciation were $12,197,875 and $5,302,561, respectively, resulting in net unrealized appreciation of investments of $6,895,314.
| * | Non-income-producing securities. |
| (a) | Security exempt from registration under Rule 144A of the Securities Act of 1933. This security may be resold in transactions exempt from registration, normally to qualified buyers. At October 31, 2006, the value of these securities amounted to $112,369,568, or 9.7% of net assets. |
| 1 | Floating Rate Security. The rate listed is as of October 31, 2006. Date in parenthesis represents the security’s next coupon rate reset. |
| 2 | Some or all of these shares, amounting to a market value of $64,135,801, or 5.5% of net assets, were out on loan to various brokers. |
| 3 | Yield shown for an investment company represents the October 31, 2006, seven-day average yield, which refers to the sum of the previous seven days’ dividends paid, expressed as an annual percentage. |
| 4 | Collateral received from brokers for securities lending was invested in this short-term investment. |
| 5 | Perpetuity Bond. The date shown is the final call date. |
| 7 | Security held as collateral for futures contracts, amounting to a market value of $11,783,407, or 1.0% of net assets. |
| 8 | Variable rate security. The rate listed is as of October 31, 2006 and is periodically reset subject to terms and conditions set forth in the debenture. |
| # | Rounds to less than 0.1%. |
Investment Definitions and Abbreviations:
| | | | | | |
| FHLMC: | | Federal Home Loan Mortgage Corp. | | FNMA: | | Federal National Mortgage Association |
| FHLB: | | Federal Home Loan Bank | | GNMA: | | Government National Mortgage Association |
| LIBOR: | | London Inter-Bank Offered Rate | | USD: | | United States Dollar |
| GBP: | | British Pound | | JPY: | | Japanese Yen |
| TBA: | | To Be Announced | | | | |
Abbreviations have been used throughout the portfolio to indicate amounts shown in currencies other than the U.S. dollar (USD): € : Euro
19
Managers Fremont Bond Fund
Statement of Assets and Liabilities
October 31, 2006
| | | | |
Assets: | | | | |
Investments at value* (including securities on loan valued at $64,135,801) | | $ | 1,367,200,523 | |
Cash | | | 2,723,941 | |
Foreign currency** | | | 2,084,380 | |
Receivable for investments sold | | | 1,903,243 | |
Receivable for TBA investments sold | | | 16,254,434 | |
Receivable for Fund shares sold | | | 646,044 | |
Swaps at value, long (premiums paid $3,464,942) | | | 66,799,547 | |
Unrealized appreciation on foreign currency contracts | | | 117,166 | |
Variation margin receivable | | | 1,968,532 | |
Dividends, interest and other receivables | | | 4,126,042 | |
Prepaid expenses | | | 34,542 | |
| | | | |
Total assets | | | 1,463,858,394 | |
| | | | |
Liabilities: | | | | |
Payable for investments purchased | | | 25,443,902 | |
Payable for TBA investments purchased | | | 133,048,750 | |
Payable for Fund shares repurchased | | | 1,009,681 | |
Payable upon return of securities loaned | | | 64,953,589 | |
Options written (premiums received $4,604,411) | | | 7,763,759 | |
Swaps at value, short (premiums received $3,356,882) | | | 66,009,370 | |
Unrealized depreciation on foreign currency contracts | | | 877,014 | |
Dividends payable to shareholders | | | 767,704 | |
Accrued expenses: | | | | |
Investment advisory and management fees | | | 253,800 | |
Administrative fees | | | 189,127 | |
Other | | | 290,423 | |
| | | | |
Total liabilities | | | 300,607,119 | |
| | | | |
Net Assets | | $ | 1,163,251,275 | |
Shares outstanding | | | 112,843,402 | |
Net asset value, offering and redemption price per share | | $ | 10.31 | |
Net Assets Represent: | | | | |
Paid-in capital | | $ | 1,161,908,527 | |
Undistributed net investment income | | | 1,389,898 | |
Accumulated net realized loss from investments, options, futures, swaps, foreign currency contracts and transactions | | | (3,662,907 | ) |
Net unrealized appreciation of investments, options, futures, swaps, foreign currency contracts and translations | | | 3,615,757 | |
| | | | |
Net Assets | | $ | 1,163,251,275 | |
| | | | |
| ____________ | | | | |
* Investments at cost | | $ | 1,360,295,665 | |
** Foreign currency at cost | | | 2,057,605 | |
The accompanying notes are an integral part of these financial statements.
20
Managers Fremont Bond Fund
Statement of Operations
For the fiscal year ended October 31, 2006
| | | | |
Investment Income: | | | | |
Interest income | | $ | 54,106,853 | |
Dividend income | | | 1,515,101 | |
Securities lending fees | | | 94,237 | |
| | | | |
Total investment income | | | 55,716,191 | |
| | | | |
Expenses: | | | | |
Investment advisory and management fees | | | 4,191,938 | |
Administrative fees | | | 2,619,961 | |
Transfer agent fees | | | 384,777 | |
Custodian fees | | | 353,699 | |
Professional fees | | | 204,347 | |
Reports to shareholders | | | 104,880 | |
Trustees fees and expenses | | | 72,725 | |
Registration fees | | | 50,899 | |
Insurance | | | 36,145 | |
Miscellaneous | | | 12,921 | |
| | | | |
Total expenses before offsets | | | 8,032,292 | |
| | | | |
Expense reimbursements | | | (1,222,042 | ) |
Fee waivers | | | (523,992 | ) |
Net expenses | | | 6,286,258 | |
| | | | |
Net investment income | | | 49,429,933 | |
| | | | |
Net Realized and Unrealized Gain (Loss): | | | | |
Net realized loss on investment, option, future, and swap transactions | | | (7,155,235 | ) |
Net realized loss on foreign currency contracts and transactions | | | (389,723 | ) |
Net unrealized appreciation of investments, options, futures, swaps, foreign currency contracts and translations | | | 7,507,079 | |
Net realized and unrealized loss | | | (37,879 | ) |
| | | | |
Net Increase in Net Assets Resulting from Operations | | $ | 49,392,054 | |
| | | | |
The accompanying notes are an integral part of these financial statements.
21
Managers Fremont Bond Fund
Statement of Changes in Net Assets
For the fiscal year ended October 31,
| | | | | | | | |
| | | 2006 | | | 2005 | |
Increase (Decrease) in Net Assets From Operations: | | | | | | | | |
Net investment income | | $ | 49,429,933 | | | $ | 31,028,672 | |
Net realized gain (loss) on investments, options, futures, swaps, foreign currency transactions | | | (7,544,958 | ) | | | 9,740,198 | |
Net unrealized appreciation (depreciation) of investments, options, futures, swaps, foreign currency contracts and translations | | | 7,507,079 | | | | (24,367,108 | ) |
| | | | | | | | |
Net increase in net assets resulting from operations | | | 49,392,054 | | | | 16,401,762 | |
| | | | | | | | |
Distributions to Shareholders: | | | | | | | | |
From net investment income | | | (48,914,309 | ) | | | (30,445,598 | ) |
From net realized gain on investments | | | — | | | | (27,506,988 | ) |
| | | | | | | | |
Total distributions to shareholders | | | (48,914,309 | ) | | | (57,952,586 | ) |
| | | | | | | | |
From Capital Share Transactions: | | | | | | | | |
Proceeds from the sale of shares | | | 369,012,726 | | | | 298,492,130 | |
Reinvestment of dividends and distributions | | | 44,650,870 | | | | 52,735,949 | |
Cost of shares repurchased | | | (222,019,862 | ) | | | (191,346,721 | ) |
| | | | | | | | |
Net increase from capital share transactions | | | 191,643,734 | | | | 159,881,357 | |
| | | | | | | | |
Total increase in net assets | | | 192,121,479 | | | | 118,330,533 | |
| | | | | | | | |
Net Assets: | | | | | | | | |
Beginning of year | | | 971,129,796 | | | | 852,799,263 | |
| | | | | | | | |
End of year | | $ | 1,163,251,275 | | | $ | 971,129,796 | |
| | | | | | | | |
Undistributed net investment income | | $ | 1,389,898 | | | $ | 1,207,521 | |
| | |
Share Transactions: | | | | | | | | |
Sale of shares | | | 35,957,793 | | | | 29,203,827 | |
Shares issued in connection with reinvestment of dividends and distributions | | | 4,364,095 | | | | 5,035,478 | |
Shares repurchased | | | (21,686,576 | ) | | | (19,089,390 | ) |
| | | | | | | | |
Net increase in shares | | | 18,635,312 | | | | 15,149,914 | |
| | | | | | | | |
The accompanying notes are an integral part of these financial statements.
22
Managers Fremont Bond Fund
Financial Highlights
For a share outstanding throughout each fiscal year
| | | | | | | | | | | | | | | | | | | | |
| | | For the fiscal year ended October 31, | |
| | | 2006 | | | 2005 | | | 2004 | | | 2003 | | | 2002 | |
Net Asset Value, Beginning of Year | | $ | 10.31 | | | $ | 10.79 | | | $ | 10.43 | | | $ | 10.51 | | | $ | 10.57 | |
Income from Investment Operations: | | | | | | | | | | | | | | | | | | | | |
Net investment income | | | 0.47 | | | | 0.37 | | | | 0.24 | | | | 0.27 | | | | 0.41 | |
Net realized and unrealized gain (loss) on investments | | | (0.00 | )3 | | | (0.17 | ) | | | 0.42 | | | | 0.36 | | | | 0.13 | |
| | | | | | | | | | | | | | | | | | | | |
Total from investment operations | | | 0.47 | | | | 0.20 | | | | 0.66 | | | | 0.63 | | | | 0.54 | |
| | | | | | | | | | | | | | | | | | | | |
Less Distributions to Shareholders from: | | | | | | | | | | | | | | | | | | | | |
Net investment income | | | (0.47 | ) | | | (0.35 | ) | | | (0.25 | ) | | | (0.37 | ) | | | (0.47 | ) |
Net realized gain on investments | | | — | | | | (0.33 | ) | | | (0.05 | ) | | | (0.34 | ) | | | (0.13 | ) |
| | | | | | | | | | | | | | | | | | | | |
Total distributions to shareholders | | | (0.47 | ) | | | (0.68 | ) | | | (0.30 | ) | | | (0.71 | ) | | | (0.60 | ) |
| | | | | | | | | | | | | | | | | | | | |
Net Asset Value, End of Year | | $ | 10.31 | | | $ | 10.31 | | | $ | 10.79 | | | $ | 10.43 | | | $ | 10.51 | |
| | | | | | | | | | | | | | | | | | | | |
Total Return1 | | | 4.75 | % | | | 2.00 | % | | | 6.45 | % | | | 6.20 | % | | | 5.43 | % |
| | | | | | | | | | | | | | | | | | | | |
Ratio of net operating expenses to average net assets | | | 0.60 | % | | | 0.60 | % | | | 0.60 | % | | | 0.61 | % | | | 0.59 | % |
Ratio of net investment income to average net assets 1 | | | 4.72 | % | | | 3.43 | % | | | 2.24 | % | | | 2.81 | % | | | 3.75 | % |
Portfolio turnover | | | 244 | % | | | 392 | % | | | 113 | % | | | 85 | % | | | 81 | % |
Net assets at end of year (000’s omitted) | | $ | 1,163,251 | | | $ | 971,130 | | | $ | 852,799 | | | $ | 852,076 | | | $ | 1,150,534 | |
| | | | | | | | | | | | | | | | | | | | |
Ratios absent expense offsets:2 | | | | | | | | | | | | | | | | | | | | |
Ratio of total expenses to average net assets | | | 0.77 | % | | | 0.72 | % | | | 0.69 | % | | | 0.66 | % | | | 0.64 | % |
Ratio of net investment income to average net assets | | | 4.55 | % | | | 3.31 | % | | | 2.15 | % | | | 2.76 | % | | | 3.70 | % |
| | | | | | | | | | | | | | | | | | | | |
| 1 | Total returns and net investment income would have been lower had certain expenses not been reduced. (See Note 1c of Notes to Financial Statements.) |
| 2 | Excludes the impact of expense reimbursements and expense offsets such as brokerage recapture credits, but includes non-reimbursable expenses such as interest and taxes. (See Note 1c of Notes to Financial Statements.) |
| 3 | Rounds to less than $(0.01) per share. |
23
Managers Fremont Bond Fund
Notes to Financial Statements
October 31, 2006
| | 1. | Summary of Significant Accounting Policies |
Managers Trust I (the “Trust”) is an open-end management investment company organized as a Massachusetts business trust and registered under the Investment Company Act of 1940, as amended (the “1940 Act”). Currently, the Trust is comprised of a number of investment series. Included in this report is the Managers Fremont Bond Fund (the “Fund”), formerly Fremont Bond Fund (the “Predecessor Fund”).
At the close of business on January 14, 2005, the Fund was re-organized from a series of Fremont Mutual Funds, Inc. into Managers Fremont Bond Fund, a series of Managers Trust I.
The Fund’s financial statements are prepared in accordance with accounting principles generally accepted in the United States of America, which require management to make estimates and assumptions that affect the reported amount of assets and liabilities and disclosure of contingent assets and liabilities at the date of the financial statements and the reported amounts of income and expenses during the reporting periods. Actual results could differ from those estimates. The following is a summary of significant accounting policies followed by the Fund in the preparation of its financial statements:
| | a. | Valuation of Investments |
Equity securities traded on a domestic securities exchange are valued at the last quoted sale price, or, lacking any sales, at the last quoted bid price. Over-the-counter securities are valued at the NASDAQ Official Closing Price, if one is available. Lacking any sales, over-the-counter securities are valued at the last quoted bid price. The Fund’s investments are generally valued based on the market quotations provided by third-party pricing sources approved by the Board of Trustees of the Fund. Under certain circumstances, the value of a Fund investment may be based on an evaluation of its fair value, pursuant to procedures established by and under the general supervision of the Board of Trustees of the Trust. The Fund may use the fair value of a portfolio security to calculate its NAV when, for example, (1) market quotations are not readily available because a portfolio security is not traded in a public market or the principal market in which the security trades is closed, (2) trading in a portfolio security is suspended and has not resumed prior to the time as of which the Fund calculates its NAV, (3) where a significant event affecting the value of a portfolio security is determined to have occurred between the time of the market quotation provided for a portfolio security and the time as of which the Fund calculates its NAV, (4) an investment’s price has remained unchanged over a period of time (often referred to as a “stale price”), or (5) the Investment Manager determines that a market quotation is inaccurate. An investment valued on the basis of an evaluation of its fair value may be valued higher or lower than available market quotations. An investment’s valuation may differ depending on the method used and the factors considered in determining value pursuant to the Fund’s fair value procedure. The Investment Manager monitors intervening events that may affect the value of securities held in the Fund’s portfolio and, in accordance with procedures adopted by the Fund’s Trustees, will adjust the prices of securities traded in foreign markets, as appropriate, to reflect the impact of events occurring subsequent to the close of such markets but prior to the time each Fund’s NAV is calculated. Fixed-income securities are valued based on valuations furnished by independent pricing services that utilize matrix systems, which reflect such factors as security prices, yields, maturities and ratings, and are
24
Managers Fremont Bond Fund
Notes to Financial Statements (continued)
supplemented by dealer and exchange quotations. Short-term investments having a remaining maturity of 60 days or less are valued at amortized cost, which approximates market value. Investments in other regulated investment companies are valued at their end of day net asset value per share. Futures contracts for which market quotations are readily available are valued at the settlement price as of the close of the futures exchange. Securities (including derivatives) for which market quotations are not readily available are valued at fair value, as determined in good faith, and pursuant to procedures adopted by the Board of Trustees of the Trust. The values assigned to fair value investments are based on available information and do not necessarily represent amounts that might ultimately be realized, since such amounts depend on future developments inherent in long-term investments. Further, because of the inherent uncertainty of valuation, those estimated values may differ significantly from the values that would have been used had a ready market for the investments existed, and the differences could be material.
Investments in certain mortgage-backed, stripped mortgage-backed, preferred stocks, convertible securities, derivatives and other debt securities not traded on an organized securities market, are valued on the basis of valuations provided by dealers or by a pricing service which uses information with respect to transactions in such securities, various relationships between securities and yield to maturity in determining value.
Security transactions are accounted for as of the trade date. Realized gains and losses on securities sold are determined on the basis of identified cost.
| | c. | Investment Income and Expenses |
Dividend income is recorded on the ex-dividend date except certain dividends from foreign securities where the ex-dividend date may have passed. These dividends are recorded as soon as the Trust is informed of the ex-dividend date. Dividend income on foreign securities is recorded net of any withholding tax. Interest income, which includes amortization of premium and accretion of discount on debt securities, as required, is accrued as earned. Non-cash dividends included in dividend income, if any, are reported at the fair market value of the securities received. Other income and expenses are recorded on an accrual basis. Expenses that cannot be directly attributed to a fund are apportioned among the Funds in the Trust and in some cases other affiliated funds based upon their relative average net assets or number of shareholders.
The Fund has a “balance credit” arrangement with The Bank of New York (“BNY”), the Fund’s custodian, whereby the Fund is credited with an interest factor equal to 1% below the effective 90-day T-Bill rate for account balances left uninvested overnight. These credits serve to reduce custody expenses that would otherwise be charged the Fund. For the fiscal year ended October 31, 2006, the custodian expense was not reduced. (Prior to January 15, 2005, the Predecessor Fund participated in a similar program offered by State Street Bank.)
Overdrafts will cause a reduction of any earnings credits, computed at 2% above the Federal Funds rate on the day of the overdraft. For the fiscal year ended October 31, 2006, the Fund had no overdraft fees. Managers Investment Group LLC (the “Investment Manager”), a subsidiary of Affiliated Managers Group, Inc. (“AMG”) and the Investment Manager for the Fund, has contractually agreed, through at least March 1, 2007, to waive
25
Managers Fremont Bond Fund
Notes to Financial Statements (continued)
fees and pay or reimburse expenses to the extent that the total annual operating expenses (exclusive of brokerage, interest, taxes and extraordinary expenses) of the Fund exceed 0.60% of the Fund’s average daily net assets.
As of January 15, 2005, the Fund may be obligated to repay the Investment Manager such amounts waived, paid or reimbursed in future years provided that the repayment occurs within three (3) years after the waiver or reimbursement and that such repayment would not cause the Fund’s expenses in any such year to exceed the previously stated percentages of that Fund’s average daily net assets. Prior to January 15, 2005, the Fund had a similar expense reimbursement agreement with the former Investment Advisor, Fre-mont Investment Advisors, Inc. (“FIA”). For the fi scal year ended October 31, 2006, the Fund made no such repayments to the Investment Manager. For the period January 15, 2005 through October 31, 2006, the cumulative amount of expense reimbursement by the Manager subject to repayment by the Fund equaled $1,921,232.
| | d. | Dividends and Distributions |
Dividends resulting from net investment income, if any, normally will be declared daily and paid monthly. Distributions of capital gains, if any, will be made on an annual basis and when required for Federal excise tax purposes. Income and capital gain distributions are determined in accordance with Federal income tax regulations, which may differ from generally accepted accounting principles. These differences are primarily due to differing treatments for losses deferred due to wash sales, equalization accounting for tax purposes, foreign currency, options, futures and market discount transactions. Permanent book and tax basis differences, if any, relating to shareholder distributions will result in reclassifi cations to paid-in capital. The tax character of distributions paid during fi scal years 2006 and 2005 were as follows:
| | | | | | |
Distributions paid from: | | 2006 | | 2005 |
Ordinary income | | $ | 48,914,309 | | $ | 39,202,690 |
Short-term capital gains | | | — | | | 1,569,805 |
Long-term capital gains | | | — | | | 17,019,460 |
| | $ | 48,914,309 | | $ | 57,791,955 |
| | | | | | |
As of October 31, 2006, the components of distributable earnings (excluding unrealized appreciation/ depreciation) on a tax basis consisted of:
| | | |
Capital loss carryforward | | $ | 4,789,451 |
Undistributed ordinary income | | | 1,399,668 |
The Fund intends to comply with the requirements under Subchapter M of the Internal Revenue Code of 1986, as amended, to distribute substantially all of its taxable income and gains to its shareholders and to meet certain diversifi cation and income requirements with respect to investment companies. Therefore, no provision for Federal income or excise tax is included in the accompanying fi nancial statements.
Additionally, based on the Fund’s understanding of the tax rules and rates related to income, gains and transactions for the foreign jurisdictions in which it invests, the Fund will provide for foreign taxes, and where appropriate, deferred foreign taxes.
26
Managers Fremont Bond Fund
Notes to Financial Statements (continued)
| | f. | Capital Loss Carryovers |
As of October 31, 2006, the Fund had accumulated net realized capital loss carryovers of $41,319 and $4,748,132. These amounts may be used for Federal income tax purposes to offset future realized capital gains, if any, through October 31, 2013 and 2014, respectivly.
The Trust’s Declaration of Trust authorizes for each series the issuance of an unlimited number of shares of beneficial interest, without par value. The Fund records sales and repurchases of its capital stock on the trade date. Dividends and distributions to shareholders are recorded on the ex-dividend date.
At October 31, 2006, certain unaffiliated shareholders, specifically omnibus accounts, individually held greater than 10% of the outstanding shares of the Fund as follows: three own collectively 56%. Transactions by these shareholders may have a material impact on the Fund.
The Fund may enter into repurchase agreements provided that the value of the underlying collateral, including accrued interest, will be equal to or exceed the value of the repurchase agreement during the term of the agreement. The underlying collateral for all repurchase agreements is held in safekeeping by the Fund’s custodian or at the Federal Reserve Bank. If the seller defaults and the value of the collateral declines, or if bankruptcy proceedings commence with respect to the seller of the security, realization of the collateral by the Fund may be delayed or limited. At October 31, 2006, the Fund had no repurchase agreements.
| | i. | Foreign Currency Translation |
The books and records of the Fund are maintained in U.S. dollars. The value of investments, assets and liabilities denominated in currencies other than U.S. dollars are translated into U.S. dollars based upon current foreign exchange rates. Purchases and sales of foreign investments, income and expenses are converted into U.S. dollars based on currency exchange rates prevailing on the respective dates of such transactions. Net realized and unrealized gain (loss) on foreign currency transactions represent: (1) foreign exchange gains and losses from the sale and holdings of foreign currencies; (2) gains and losses between trade date and settlement date on investment securities transactions and forward foreign currency exchange contracts; and (3) gains and losses from the difference between amounts of interest and dividends recorded and the amounts actually received.
In addition, the Fund does not isolate the net realized and unrealized gain or loss resulting from changes in exchange rates from the fluctuations resulting from changes in market prices of securities held. Such fluctuations are included with the net realized and unrealized gain or loss on investments.
| | j. | Securities Transacted on a When Issued Basis |
The Fund may enter into To Be Announced (“TBA”) sale commitments to hedge its portfolio positions or to sell mortgage-backed securities it owns under delayed delivery arrangements. Proceeds of TBA sale commitments are not received until the contractual settlement date. During the time a TBA sale commitment is outstanding, equivalent deliverable securities, or an offsetting TBA purchase commitment deliverable on or
27
Managers Fremont Bond Fund
Notes to Financial Statements (continued)
before the sale commitment date, are held as “cover” for the transaction. Unsettled TBA sale commitments are valued at the current market value of the underlying securities, generally according to the procedures described under “Valuation of Investments,” in footnote 1a above. Each contract is marked-to-market daily and the change in market value is recorded by the Fund as an unrealized gain or loss. If the TBA sale commitment is closed through the acquisition of an offsetting purchase commitment, the Fund realizes a gain or loss. If the Fund delivers securities under the commitment, the Fund realizes a gain or a loss from the sale of the securities based upon the unit price established at the date the commitment was entered into. The Fund had no TBA sale commitments outstanding as of October 31, 2006.
2. Agreements and Transactions with Affiliates
The Trust has entered into an Investment Management Agreement dated January 15, 2005 under which the Investment Manager provides or oversees investment management services to the Fund. Prior to January 15, 2005, the Predecessor Fund had a similar Investment Management Agreement with FIA. The Investment Manager selects subadvisors for the Fund (subject to Trustee approval) and monitors the subadvisor’s investment programs and results. The Fund’s investment portfolio is managed by a portfolio manager who serves pursuant to a Subadvisory Agreement with the Investment Manager.
Investment management fees are paid directly by the Fund to the Investment Manager based on average daily net assets. The annual investment management fee rate, as a percentage of average daily net assets for the fiscal year ended October 31, 2006, was 0.40%.
The Trust has entered into an Administration and Shareholder Servicing Agreement under which Managers Investment Group LLC serves as the Fund’s administrator (the “Administrator”) and is responsible for all aspects of managing the Fund’s operations, including administration and shareholder services to the Fund, its shareholders, and certain institutions, such as bank trust departments, broker-dealers and registered investment advisers, that advise or act as an intermediary with the Fund’s shareholders. For its services, the Administrator is paid a fee at a rate of 0.25% per annum. For the fiscal year ended October 31, 2006, the Administrator voluntarily agreed to waive 0.05% of its fee amounting to $523,992. Prior to January 15, 2005, the Predecessor Fund had a similar expense reimbursement agreement with FIA at an annual rate of 0.20% per annum. During the fiscal year ended October 31, 2006, the Fund paid administration fees of $2,619,961, net of waivers.
Prior to July 1, 2005, the aggregate annual retainer paid to each Independent Trustee was $52,000, plus $2,000 per meeting attended. Effective July 1, 2005, the aggregate annual retainer paid to each Independent Trustee is $55,000, plus $4,000 for each meeting attended. The Trustees’ fees and expenses are allocated amongst all of the Funds for which Managers Investment Group LLC serves as the Investment Managers (the “Managers Funds”) based on the relative net assets of such Funds. Prior to March 3, 2006, the Trust had an additional Independent Trustee who was paid an annual retainer of $30,000 plus $4,000 for each meeting attended. The fee was only allocated amongst the Funds in the Trust based on the relative net assets of each Fund. The Independent Chairman of the Managers Funds receives an additional payment of $10,000 per year. (Prior to July 1, 2005,
28
Managers Fremont Bond Fund
Notes to Financial Statements (continued)
the Independent Chairman was paid an additional $5,000 per year). Effective July 1, 2005, the Chairman of the Audit Committee receives an additional $2,000 per year. The “Trustee fees and expenses” shown in the financial statements represents the Fund’s allocated portion of the total fees and expenses paid by the Fund and other affiliated funds in the Managers Funds.
The Fund is distributed by Managers Distributors, Inc. (the “Distributor”), a wholly-owned subsidiary of Managers Investment Group LLC. Certain Trustees and Officers of the Funds are Officers and/or Directors of the Investment Manager, AMG and/or the Distributor. The Distributor serves as the principal underwriter for the Fund. The Distributor is a registered broker-dealer and member of the National Association of Securities Dealers, Inc. Shares of the Fund will be continuously offered and will be sold by brokers, dealers or other financial intermediaries who have executed selling agreements with the Distributor. The Distributor bears all the expenses of providing services pursuant to an Underwriting Agreement, including the payment of the expenses relating to the distribution of Prospectuses for sales purposes and any advertising or sales literature. (Prior to January 15, 2005, the Predecessor Fund had a similar distribution agreement with Quasar Distributors, LLC).
3. Purchases and Sales of Securities
Purchases and sales of securities, excluding short-term securities, for the fiscal year ended October 31, 2006, were $2,069,127,792 and $1,858,690,627, respectively. Purchases and sales of U.S. Government securities for the fiscal year ended October 31, 2006, were $1,857,976,622 and $1,779,950,483, respectively.
4. Portfolio Securities Loaned
The Fund may participate in a securities lending program offered by BNY providing for the lending of equities, corporate bonds and government securities to qualified brokers. Collateral on all securities loaned is accepted in cash and/or government securities. Collateral is maintained at a minimum level of 102% of the market value, plus interest, if applicable, of investments on loan. Collateral received in the form of cash is invested temporarily in institutional money market funds or other short-term investments by BNY. Security lending fees include earnings of such temporary cash investments, plus or minus any rebate. Earnings (after any rebate) then are divided between BNY, as a fee for its ser-vices under the program, and the Fund loaning the security, according to agreed-upon rates.
5. Commitments and Contingencies
In the normal course of business, the Fund may enter into contracts and agreements that contain a variety of representations and warranties, which provide general indemnifications. The maximum exposure to the Fund under these arrangements is unknown, as this would involve future claims that may be made against the Fund that have not yet occurred. However, based on experience, the Fund expects the risk of loss to be remote.
6. Forward Commitments
Certain transactions, such as futures and forward transactions, dollar roll agreements, or purchases of when-issued or delayed delivery securities may have a similar effect on the Fund’s net asset value as if the Fund had created a degree of leverage in its portfolio. However, if the Fund enters into such a transaction, the Fund will establish a segregated account with its custodian in which it will maintain cash, U.S. government securities or
29
Managers Fremont Bond Fund
Notes to Financial Statements (continued)
other liquid securities equal in value to its obligations in respect to such transaction. Securities and other assets held in the segregated account may not be sold while the transaction is outstanding, unless other suitable assets are substituted.
7. Futures Contracts Held or Issued
The Fund may purchase or sell futures contracts to achieve a desired level of investment, whether to accommodate portfolio turnover or cash flows from capital shares transactions. There are certain risks associated with futures contracts. Prices may not move as expected or the Fund may not be able to close out the contract when it desires to do so, resulting in losses.
Futures are valued at their quoted daily settlement prices. The aggregate principal amounts of the contracts are not recorded in the financial statements. Fluctuations in the value of the contracts are recorded in the Statement of Assets and Liabilities as an asset (liability) and in the Statement of Operations as unrealized appreciation (depreciation) until the contracts are closed, when they are recorded as realized gains (losses) on futures or forward currency contracts.
At October 31, 2006, the Fund had the following open futures contracts:
| | | | | | | | | | |
Type | | Number of Contracts | | Position | | Expiration Month | | Unrealized Gain/ (Loss) | |
3-Month Pound Sterling | | 301 | | Short | | Jun. 07 - Jun. 08 | | $ | (57,425 | ) |
3-Month Eurodollar | | 5,825 | | Short | | Mar. 07 - Dec. 07 | | | (2,770,246 | ) |
3-Month Eurodollar | | 2,954 | | Long | | Mar. 07 - Dec. 07 | | | 1,889,646 | |
10-Year U.S. Treasury Note | | 489 | | Long | | Dec. 06 | | | 439,031 | |
30-Year U.S. Treasury Bond | | 206 | | Long | | Dec. 06 | | | 417,516 | |
| | | | | | | | | | |
| | | | | | | | $ | (81,478 | ) |
| | | | | | | | | | |
8. Interest Rate Caps, Swap Contracts and Options
The Fund may enter into over-the-counter transactions involving interest rate caps, swap contracts, or purchase and write (sell) options to enter into such contracts, in order to manage interest rate risk. In an interest rate cap agreement, one party agrees to make payments only under specified circumstances, usually in return for payment of a fee by the other party. An interest rate cap entitles the purchaser, to the extent that a specified index exceeds a predetermined interest rate, to receive payments of interest on a notional principal amount from the party selling such interest rate cap. Swap contracts represent an agreement between counter parties to exchange cash flows based on the difference between two rates applied to a notional principal amount for a specified period. The most common type of interest rate swap involves the exchange of fixed-rate cash flows for variable-rate cash flows. Swaps do not involve the exchange of principal between the parties. Purchased options on swap contracts (“swaptions”) give the holder the right, but not the obligation, to enter into a swap contract with the counter party which has written the option on a date, at an interest rate, and with a notional amount as specified in the swaption agreement. If the counter party to the swap transaction defaults, the Fund will be limited to contractual remedies pursuant to the agreements governing the transaction. There is no assurance that swap or swaption contract counter parties will be able to meet
30
Managers Fremont Bond Fund
Notes to Financial Statements (continued)
their obligations under the contracts or that, in the event of default, the Fund will succeed in pursuing contractual remedies. The Fund may thus assume the risk that payments owed the Fund under a swap or swaption contract will be delayed, or not received at all. During the term of the swap agreement or swaption, unrealized gains or losses are recorded as a result of “marking to market.” When the swap agreement or swaption is terminated, the Fund will record a realized gain or loss equal to the difference between the proceeds from (or cost of) the closing transaction and the Fund’s basis in the contract, if any. Accrued interest and interest paid are recognized as unrealized and realized gain (loss), respectively. In each of the contracts, the Fund pays a premium, to the counter party, in return for the swaption. These swaptions may be exercised by entering into a swap contract with the counter party only on the date specified in each contract.
At October 31, 2006, the Fund had the following open swap contracts:
| | | | | | | | | | | |
Pay | | Receive | | Maturity | | Notional Amount | | Unrealized
Gain/(Loss) | |
Interest Rate Swaps | | | | | | | | | | | |
3-Month USD-LIBOR-BBA | | Fixed Rate 5.000% | | 12/20/08 | | $ | 28,200,000 | | $ | (19,246 | ) |
6-Month France CPI Excl. Tobacco Index | | Fixed Rate 2.1025% | | 10/15/10 | | € | 3,900,000 | | | 48,694 | |
6-Month France CPI Excl. Tobacco Index | | Fixed Rate 2.1455% | | 10/15/10 | | € | 1,000,000 | | | 15,038 | |
6-Month GBP-LIBOR | | Fixed Rate 5.000% | | 06/16/11 | | £ | 7,100,000 | | | (98,737 | ) |
6-Month EUR-EURIBOR | | Fixed Rate 6.000% | | 06/18/34 | | € | 5,200,000 | | | 1,203,938 | |
Fixed Rate 4.000% | | 6-Month GBP-LIBOR | | 12/15/35 | | £ | 1,100,000 | | | 32,201 | |
3-Month USD-LIBOR-BBA | | Fixed Rate 5.000% | | 12/15/35 | | $ | 3,200,000 | | | (95,537 | ) |
3-Month USD-LIBOR-BBA | | Fixed Rate 5.000% | | 12/20/36 | | $ | 6,000,000 | | | (231,999 | ) |
3-Month USD-LIBOR-BBA | | Fixed Rate 5.000% | | 12/20/36 | | $ | 1,600,000 | | | (61,264 | ) |
Credit Default Swaps | | | | | | | | | | | |
Softbank Corp. Bond | | Fixed Rate 2.300% | | 09/20/07 | | ¥ | 85,000,000 | | | — | |
Russian Federation Bond | | Fixed Rate 0.495% | | 08/20/11 | | $ | 3,500,000 | | | (3,604 | ) |
Petroleos Mexicanos, 9.500%, 09/15/27 | | Fixed Rate 0.620% | | 08/20/11 | | $ | 3,500,000 | | $ | (920 | ) |
Federative Republic of Brazil Bond | | Fixed Rate 1.950% | | 08/20/16 | | $ | 3,500,000 | | | 32,393 | |
Volatility Swaps | | | | | | | | | | | |
Fixed Rate 8.440% | | 1-Year Yen Forward
Rate Volatility | | 01/17/07 | | $ | 3,000,000 | | | (11,310 | ) |
Fixed Rate 8.800% | | 1-Year Yen Forward
Rate Volatility | | 01/17/07 | | $ | 3,000,000 | | | (19,470 | ) |
| | | | | | | | | | | |
| | | | | | | | | $ | 790,177 | |
| | | | | | | | | | | |
$: U.S. Dollar €: Euro £: British Pound ¥: Japanese Yen
31
Managers Fremont Bond Fund
Notes to Financial Statements (continued)
For the fiscal year ended October 31, 2006, the Fund paid and received premiums of $3,464,942 and $3,356,882, respectively, on swap contracts. At October 31, 2006, the unrealized depreciation (net of premiums) on open swap contracts was $682,117.
A written option contract is a contract in which the writer of the option grants the buyer of the option the right to purchase from (call option) or sell to (put option) the writer a designated instrument at a specified price within a specified period of time. Options written (sold) are recorded as liabilities. When an option expires, the premium (original option value) is realized as a gain if the option was written or as a loss if the option was purchased. When the exercise of an option results in a cash settlement, the difference between the premium and the settlement proceeds is recognized as realized gain or loss. When securities are acquired or delivered upon exercise of an option, the acquisition cost or sale proceeds are adjusted by the amount of the premium. When an option is closed, the difference between the premium and the cost to close the position is realized as a gain or loss.
At October 31, 2006, the following written options were outstanding:
| | | | | | | | | | | |
Name | | Number of
Contracts | | Exercise
Price | | | Expiration
Month | | Unrealized
Gain/(Loss) | |
10-Year USTN (Call) | | 41 | | 106.00 | | | Nov. 06 | | $ | 4,992 | |
10-Year USTN (Call) | | 41 | | 109.00 | | | Nov. 06 | | | (3,336 | ) |
3-Month USD-LIBOR (Call) | | 13,000,000 | | 4.85 | % | | Dec. 06 | | | 150,280 | |
3-Month USD-LIBOR (Call) | | 11,300,000 | | 5.24 | % | | Feb. 07 | | | (67,229 | ) |
3-Month USD-LIBOR (Call) | | 7,000,000 | | 5.04 | % | | Mar. 07 | | | 23,126 | |
3-Month USD-LIBOR (Call) | | 13,000,000 | | 5.04 | % | | Mar. 07 | | | 23,686 | |
3-Month USD-LIBOR (Call) | | 14,000,000 | | 5.22 | % | | Apr. 07 | | | (85,536 | ) |
3-Month USD-LIBOR (Call) | | 21,000,000 | | 5.30 | % | | May 07 | | | (153,909 | ) |
3-Month USD-LIBOR (Call) | | 25,400,000 | | 5.32 | % | | May 07 | | | (180,734 | ) |
6-Month GBP-LIBOR-BBA (Call) | | 800,000 | | 4.85 | % | | Jun. 07 | | | 1,812 | |
6-Month GBP-LIBOR-BBA (Call) | | 2,000,000 | | 4.85 | % | | Jun. 07 | | | (3,644 | ) |
6-Month GBP-LIBOR-BBA (Call) | | 1,300,000 | | 4.85 | % | | Jun. 07 | | | (1,926 | ) |
3-Month USD-LIBOR (Call) | | 4,000,000 | | 5.33 | % | | Jun. 07 | | | (39,908 | ) |
3-Month USD-LIBOR (Call) | | 22,000,000 | | 5.34 | % | | Jun. 07 | | | (192,962 | ) |
3-Month USD-LIBOR (Call) | | 21,000,000 | | 5.60 | % | | Jun. 07 | | | (357,147 | ) |
6-Month EUR-LIBOR (Call) | | 3,000,000 | | 4.10 | % | | Jul. 07 | | | (17,758 | ) |
6-Month EUR-EURIBOR (Call) | | 13,000,000 | | 4.10 | % | | Jul. 07 | | | (54,053 | ) |
6-Month EUR-EURIBOR (Call) | | 9,000,000 | | 4.10 | % | | Jul. 07 | | | (59,482 | ) |
6-Month EUR-EURIBOR (Call) | | 9,000,000 | | 4.23 | % | | Jul. 07 | | | (92,644 | ) |
3-Month LIBOR (Call) | | 11,800,000 | | 4.95 | % | | Jul. 07 | | | 14,541 | |
6-Month LIBOR (Call) | | 9,900,000 | | 5.00 | % | | Jul. 07 | | | (1,147 | ) |
32
Managers Fremont Bond Fund
Notes to Financial Statements (continued)
| | | | | | | | | | | |
Name | | Number of
Contracts | | Exercise
Price | | | Expiration
Month | | Unrealized
Gain/(Loss) | |
3-Month USD-LIBOR (Call) | | 58,000,000 | | 5.37 | % | | Jul. 07 | | $ | (483,548 | ) |
3-Month USD-LIBOR (Call) | | 11,600,000 | | 5.50 | % | | Jul. 07 | | | (215,710 | ) |
3-Month USD-LIBOR (Call) | | 17,000,000 | | 5.01 | % | | Oct. 07 | | | (71,688 | ) |
30 Year USTB (Put) | | 143 | | 104.00 | | | Nov. 06 | | | 50,035 | |
30 Year USTB (Put) | | 160 | | 105.00 | | | Nov. 06 | | | 48,229 | |
30 Year USTB (Put) | | 328 | | 111.00 | | | Nov. 06 | | | (359,441 | ) |
30 Year USTB (Put) | | 39 | | 111.00 | | | Nov. 06 | | | 4,748 | |
30 Year USTB (Put) | | 39 | | 114.00 | | | Nov. 06 | | | 10,232 | |
6-Month GBP-LIBOR (Put) | | 18,800,000 | | 4.50 | % | | Dec. 06 | | | (208,702 | ) |
3-Month EURO (Put) | | 111 | | 95.00 | | | Dec. 06 | | | (30,698 | ) |
3-Month EURO (Put) | | 986 | | 95.25 | | | Dec. 06 | | | (747,429 | ) |
3-Month GBP-LIBOR (Put) | | 33 | | 95.50 | | | Dec. 06 | | | (61,376 | ) |
3-Month EURO (Put) | | 35 | | 94.75 | | | Mar. 07 | | | 10,386 | |
3-Month EURO (Put) | | 41 | | 95.25 | | | Mar. 07 | | | (11,408 | ) |
| | | | | | | | | | | |
| | | | | | | Total | | $ | (3,159,348 | ) |
| | | | | | | | | | | |
Transactions in written put and call options for the fiscal year ended October 31, 2006 were as follows:
| | | | | | | |
| | | Number of Contracts | | | Amounts of Premiums | |
Options outstanding at October 31, 2005 | | 1,088,702,290 | | | $ | 1,410,189 | |
Options written | | 265,100,791 | | | | 3,242,108 | |
Options exercised | | (1,036,901,084 | ) | | | (47,886 | ) |
| | | | | | | |
Options outstanding at October 31, 2006 | | 316,901,997 | | | $ | 4,604,411 | |
| | | | | | | |
9. Forward Foreign Currency Contracts
During the fiscal year ended October 31, 2006, the Fund invested in forward foreign currency exchange contracts to manage currency exposure. These investments may involve greater market risk than the amounts disclosed in the Fund’s financial statements.
A forward foreign currency exchange contract is an agreement between a Fund and another party to buy or sell a currency at a set price at a future date. The market value of the contract will fluctuate with changes in currency exchange rates. The contract is marked-to-market daily, and the change in market value is recorded as an unrealized gain or loss. Gain or loss on the purchase or sale of contracts having the same settlement date, amount and counter party is realized on the date of offset, otherwise gain or loss is realized on settlement date.
The Fund may invest in non-U.S. dollar denominated instruments subject to limitations,
33
Managers Fremont Bond Fund
Notes to Financial Statements (continued)
and enter into forward foreign currency exchange contracts to facilitate transactions in foreign securities and to protect against a possible loss resulting from an adverse change in the relationship between the U.S. dollar and such foreign currency. Risks may arise upon entering into these contracts from the potential inability of counterparties to meet the terms of their contracts and from unanticipated movements in the value of a foreign currency relative to the U.S. dollar.
Open forward foreign currency exchange contracts (in U.S. Dollars) at October 31, 2006, were as follows:
| | | | | | | | | | | | | | | | |
Foreign Currency | | Settlement Date | | Contract Value (Receivable) | | | Contract Value (Payable) | | | Unrealized Gain/Loss | |
Brazilian Real | | Long | | 01/18/07 | | $ | 286,877 | | | $ | 284,172 | | | $ | 2,705 | |
Canadian Dollar | | Long | | 11/30/06 | | | 3,010,776 | | | | 2,967,531 | | | | 43,245 | |
Chilean Peso | | Long | | 11/08/06 - 12/18/06 | | | 499,928 | | | | 485,355 | | | | 14,573 | |
Chinese Yuan Renminbi | | Long | | 03/19/07 - 09/25/07 | | | 1,221,783 | | | | 1,231,000 | | | | (9,217 | ) |
Euro | | Short | | 12/08/06 | | | (2,187,067 | ) | | | (2,181,173 | ) | | | (5,894 | ) |
Indian Rupee | | Long | | 03/20/07 - 03/30/07 | | | 279,786 | | | | 273,879 | | | | 5,907 | |
Japanese Yen | | Short | | 11/15/06 | | | (7,803,395 | ) | | | (7,754,476 | ) | | | (48,919 | ) |
Japanese Yen | | Long | | 11/15/06 | | | 30,711,582 | | | | 31,508,341 | | | | (796,759 | ) |
Mexican Nuevo Peso | | Long | | 12/04/06 - 01/16/07 | | | 430,015 | | | | 420,128 | | | | 9,887 | |
New Taiwan Dollar | | Long | | 02/26/07 | | | 566,149 | | | | 577,084 | | | | (10,935 | ) |
Polish Zloty | | Long | | 11/24/06 | | | 366,583 | | | | 358,515 | | | | 8,068 | |
Russian Ruble | | Long | | 12/13/06 - 03/20/07 | | | 1,580,202 | | | | 1,582,179 | | | | (1,977 | ) |
Singapore Dollar | | Long | | 11/27/06 - 03/21/07 | | | 955,902 | | | | 940,740 | | | | 15,162 | |
South African Rand | | Short | | 11/02/06 | | | (3,258 | ) | | | (3,200 | ) | | | (58 | ) |
South African Rand | | Long | | 11/02/06 - 05/16/07 | | | 51,211 | | | | 49,994 | | | | 1,217 | |
South Korean Won | | Long | | 12/26/06 - 05/25/07 | | | 2,579,107 | | | | 2,565,960 | | | | 13,147 | |
| | | | | | | | | | | | | | | | |
Total | | | | | | $ | 32,546,181 | | | $ | 33,306,029 | | | $ | (759,848 | ) |
| | | | | | | | | | | | | | | | |
10. Risks Associated with Collateralized Mortgage Obligations (“CMOs”)
The net asset value of the Fund may be sensitive to interest rate fluctuations because the Fund may hold several instruments, including CMOs and other derivatives, whose values can be significantly impacted by interest rate movements. CMOs are obligations collateralized by a portfolio of mortgages or mortgage-related securities. Payments of principal and interest on the mortgage are passed through to the holder of the CMOs on the same schedule as they are received, although certain classes of CMOs have priority over others with respect to the receipt of prepayments on the mortgages.
Therefore, the investment in CMOs may be subject to a greater or lesser risk of prepayment than other types of mortgage-related securities. CMOs may have a fixed or variable rate of interest.
34
Managers Fremont Bond Fund
Notes to Financial Statements (continued)
11. Line of Credit
Prior to January 15, 2005 the Predecessor Fund had a Line of Credit Arrangement (“LOC”) with State Street Bank and Trust Company (“SSB”). Under the terms of the LOC, the Predecessor Fund’s borrowings could not exceed 20% of the Fund’s net assets and the combined borrowings of all the former Fremont Funds could not exceed the $40 million cap on the total line of credit. The interest rate paid on the LOC equaled SSB’s overnight federal funds rate as determined on each day at 11:00 a.m. Boston time plus 0.50% per annum. The former Fremont Funds paid a commitment fee of 0.09% of the unused balance of the LOC. The LOC was terminated at the close of business on January 14, 2005.
12. New Accounting Pronouncements
The Financial Accounting Standards Board (“FASB”) has recently issued Interpretation No. 48, “Accounting for Uncertainty in Income Taxes – an Interpretation of FASB Statement No. 109 (the “Interpretation”), which applies to all registered investment companies, clarifies the accounting for uncertain tax positions. The Interpretation is effective for financial statements for fiscal years beginning after December 15, 2006. Management has not yet completed their analysis of the Interpretation, and is not currently in a position to estimate the significance. if any, that the impact of adoption will have on the financial statements.
In addition, in September 2006, Statement of Financial Accounting Standards No. 157, Fair Value Measurements (“SFAS 157”), was issued and is effective for fiscal years beginning after November 15, 2007. SFAS 157 defines fair value, establishes a frame-work for measuring fair value and expands disclosures about fair value measurements. Management is currently evaluating the impact, if any, the adoption of SFAS 157 will have on the Fund’s financial statements.
Tax Information (unaudited)
The Fund hereby designates the maximum amounts allowable of its net taxable income as qualified dividends as provided in the Jobs and Growth Tax Relief Reconciliation Act of 2003. The 2006 Form 1099-DIVs you receive for the Fund will show the tax status of all distributions paid to you during the respective calendar year.
Pursuant to section 852 of the Internal Revenue Code, the Fund designates there were no long-term capital gains for the taxable year ended October 31, 2006.
35
Report of Independent Registered Public Accounting Firm
To the Board of Trustees of Managers Trust I and the Shareholders of
Managers Fremont Bond Fund:
In our opinion, the accompanying statement of assets and liabilities, including the schedule of portfolio investments and the related statements of operations and of changes in net assets and the financial highlights present fairly, in all material respects, the financial position of Managers Fremont Bond Fund (the “Fund”) at October 31, 2006, the results of its operations, the changes in its net assets and the financial highlights for the periods indicated, in conformity with accounting principles generally accepted in the United States of America. These financial statements and financial highlights (hereafter referred to as “fi nancial statements”) are the responsibility of the Fund’s management; our responsibility is to express an opinion on these financial statements based on our audits. We conducted our audits of these financial statements in accordance with the standards of the Public Company Accounting Oversight Board (United States). Those standards require that we plan and perform the audit to obtain reasonable assurance about whether the financial statements are free of material misstatement. An audit includes examining, on a test basis, evidence supporting the amounts and disclosures in the financial statements, assessing the accounting principles used and significant estimates made by management, and evaluating the overall financial statement presentation. We believe that our audits, which included confirmation of securities at October 31, 2006 by correspondence with the custodian and brokers, provide a reasonable basis for our opinion.
PricewaterhouseCoopers LLP
Boston, Massachusetts
December 21, 2006
36
Trustees and Officers
The Trustees and Officers of the Trust, their business addresses, principal occupations for the past five years and dates of birth are listed below. The Trustees provide broad supervision over the affairs of the Trust and the Fund. The Trustees are experienced executives who meet periodically throughout the year to oversee the Fund’s activities, review contractual arrangements with companies that provide services to the Fund, and review the Fund’s performance. Unless otherwise noted, the address of each Trustee or Officer is the address of the Trust: 800 Connecticut Avenue, Norwalk, Connecticut 06854.
There is no stated term of office for Trustees. Trustees serve until their resignation, retirement or removal in accordance with the Trust’s organizational documents and policies adopted by the Board from time to time. The Chairman of the Trustees, President, Treasurer and Secretary of the Trust are elected by the Trustees annually. Other officers hold office at the pleasure of the Trustees.
Independent Trustees
The following Trustees are not “interested persons” of the Trust within the meaning of the 1940 Act:
| | |
Name, Date of Birth, Number of Funds Overseen in Fund Complex* | | Principal Occupation(s) During Past 5 Years and Other Directorships Held by Trustee |
Jack W. Aber, 9/9/37 • Trustee since 2000 • Oversees 33 Funds in Fund Complex | | Professor of Finance, Boston University School of Management (1972-Present); Trustee of Appleton Growth Fund (1 portfolio); Trustee of Third Avenue Trust (4 portfolios); Trustee of Third Avenue Variable Trust (1 portfolio) |
| |
William E. Chapman, II, 9/23/41 • Independent Chairman • Trustee since 2000 • Oversees 33 Funds in Fund Complex | | President and Owner, Longboat Retirement Planning Solutions (1998-Present); Hewitt Associates, LLC (part time) (provider of Retirement and Investment Education Seminars); Interim Executive Vice President, QuadraMed Corporation (2001); President, Retirement Plans Group, Kemper Funds (1990-1998); Trustee of Bowdoin College (2002-Present); Trustee of Third Avenue Trust (4 portfolios); Trustee of Third Avenue Variable Trust (1 portfolio) |
| |
| Edward J. Kaier, 9/23/45 | | Attorney at Law and Partner, Hepburn Willcox Hamilton & Putnam, |
• Trustee since 2000 | | LLP (1977-Present); Trustee of Third Avenue Trust (4 portfolios); |
• Oversees 33 Funds in Fund Complex | | Trustee of Third Avenue Variable Trust (1 portfolio) |
| |
Steven J. Paggioli, 4/3/50 • Trustee since 2000 • Oversees 33 Funds in Fund Complex | | Consultant (2001-Present); Formerly Executive Vice President and Director, The Wadsworth Group (1986-2001); Executive Vice President, Secretary and Director, Investment Company Administration, LLC (1990-2001); Vice President, Secretary and Director, First Fund Distributors, Inc. (1991-2001); Trustee, Professionally Managed Portfolios (22 portfolios); Advisory Board Member, Sustainable Growth Advisors, LP |
37
Trustees and Officers (continued)
| | |
Name, Date of Birth, Number of Funds Overseen in Fund Complex* | | Principal Occupation(s) During Past 5 Years and Other Directorships Held by Trustee |
| |
EricRakowski, 6/5/58 • Trustee since 2000 • Oversees 33 Funds in Fund Complex | | Professor, University of California at Berkeley School of Law (1990-Present); Trustee of Third Avenue Trust (4 port folios); Trustee of Third Avenue Variable Trust (1 portfolio) |
| |
ThomasR. Schneeweis, 5/10/47 • Trustee since 2000 • Oversees 33 Funds in Fund Complex | | Professor of Finance, University of Massachusetts (1985-Present); Director, CISDM at the University of Massachusetts, (1996-Present); President, Alternative Investment Analytics, LLC, (formerly Schneeweis Partners, LLC) (2001-Present); Director of Research, URSA Capital (subsidiaries: Lyra/Starview Capital LLC), (2004-Present); Partner, Northampton Capital Management, LLC; Partner, TRS Associates (Sole Proprietorship) and member of Massachusetts Finance Institute (wholly owned subsidiary of Alternative Investment Analytics). No other directorships held by Trustee. |
| * | The Fund Complex consists of Managers AMG Funds, The Managers Funds, Managers Trust I and Managers Trust II. |
Interested Trustees
The following Trustees are “interested persons” of the Trust within the meaning of the 1940 Act. Mr. Lebovitz is an interested person of the Trust within the meaning of the 1940 Act by virtue of his positions with Managers Investment Group LLC and Managers Distributors, Inc. Mr. Nutt is an interested person of the Trust within the meaning of the 1940 Act by virtue of his positions with, and interest in securities of, Affiliated Managers Group, Inc.
| | |
Name, Date of Birth, Number of Funds Overseen in Fund Complex* | | Principal Occupation(s) During Past 5 Years and Other Directorships Held by Trustee |
| |
PeterM. Lebovitz, 1/18/55 • Trustee since 2002 • President since 2000 • Oversees 33 Funds in Fund Complex | | Managing Partner, Managers Investment Group LLC (2005-Present); President and Chief Executive Officer, The Managers Funds LLC (1999-2004); President, Managers Distributors, Inc. (2000-2006), Vice President, Managers Distributors, Inc. (2006-Present); President, The Managers Funds (1999-Present); President, Managers AMG Funds (1999-Present); President, Managers Trust II (2000-Present); Director of Marketing, The Managers Funds, LP (1994-1999). No other directorships held by trustee. |
| |
WilliamJ. Nutt, 3/30/45 • Trustee since 2005 • Oversees 33 Funds in Fund Complex | | Chairman and Founder of Affiliated Managers Group, Inc., (1993-Present); Chief Executive Officer of Affiliated Managers Group, Inc. (1993-2004); Director, Affiliated Managers Group, Inc. (1993-Present) |
| |
| * | The Fund Complex consists of Managers AMG Funds, The Managers Funds, Managers Trust I and Managers Trust II. |
38
Trustees and Officers (continued)
Officers
| | |
Name, Date of Birth, Position(s) Held with Fund and Length of Time Served | | Principal Occupation(s) During Past 5 Years |
Bruce M. Aronow, 5/31/65 • Chief Financial Officer since 2005 | | Managing Partner, Managers Investment Group LLC (2005-Present); Chief Financial Officer, The Managers Funds, Managers AMG Funds and Managers Trust II (2005-Present); Executive Vice President and Chief Financial Officer and Principal, Rorer Asset Management (1999-2004); Chief Operating Officer, Rorer Asset Management (2001-2004) |
| |
Christine C. Carsman, 4/2/52 • Secretary since 2004 | | Vice President and Chief Regulatory Counsel, Affiliated Managers Group, Inc. (2004-Present); Secretary, The Managers Funds, Managers AMG Funds and Managers Trust II (2004-Present); Senior Counsel, Vice President and Director of Operational Risk Management and Compliance, Wellington Management Company, LLP (1995-2004) |
| |
Colin J. Dean, 3/6/77 • Assistant Secretary since 2006 | | Associate Counsel, Affiliated Managers Group, Inc. (2005-Present); Assistant Secretary, The Managers Funds, Managers AMG Funds and Managers Trust II (2006-Present); Associate, Dechert LLP (2002-2005). |
| |
Donald S. Rumery, 5/29/58 • Treasurer since 2000 | | Senior Vice-President, Managers Investment Group LLC (2005- Present); Director, Finance and Planning, The Managers Funds LLC, (1994-2004); Treasurer and Chief Financial Officer, Managers Distributors, Inc. (2000-Present); Treasurer, The Managers Funds (1995-Present); Treasurer, Managers AMG Funds (1999-Present); Treasurer, Managers Trust II (2000-Present); Secretary, Managers Trust I and Managers Trust II (2000-2004) and Secretary, The Managers Funds (1997-2004). |
39
Annual Renewal of Investment Advisory Agreements
On June 2, 2006, the Board of Trustees, including a majority of the Trustees who are not “interested persons” of the Trust (the “Independent Trustees”), approved the Investment Management Agreement with the Investment Manager for the Fremont Bond Fund (the “Fund”) and the Subadvisory Agreement for the Subadvisor. The Independent Trustees were separately represented by independent counsel in connection with their consideration of the approval of these agreements. In considering the Invest-ment Management and Subadvisory Agreements, the Trustees reviewed a variety of materials relating to the Fund, the Investment Manager and the Subadvisor, including comparative performance, fee and expense information for an appropriate peer group of similar mutual funds (the “Peer Group”), performance information for the relevant benchmark index (the “Fund Benchmark”) and other information regarding the nature, extent and quality of services provided by the Investment Manager and the Subadvisor under their respective agreements. The Trustees also took into account performance, fee and expense information regarding the Fund provided to them on a quarterly basis throughout the year. Prior to voting, the Independent Trustees: (a) reviewed the foregoing information with their independent legal counsel and with management; (b) received materials from their independent legal counsel discussing the legal standards applicable to their consideration of the Investment Management Agreement and the Subadvisory Agreement; and (c) met with their independent legal counsel in private sessions at which no representatives of management were present.
Nature, extent and quality of services
In considering the nature, extent and quality of the services provided by the Investment Manager, the Trustees reviewed information relating to the Investment Manager’s operations and personnel. Among other things, the Investment Manager provided financial information, biographical information on its supervisory and professional staff and descriptions of its organizational and management structure. The Trustees also took into account information provided periodically throughout the previous year by the Investment Manager relating to the performance of its duties with respect to the Fund and the Trustees’ familiarity with the Investment Manager’s management through Board meetings, discussions and reports. In the course of their deliberations regarding the Investment Management Agreement, the Trustees evaluated, among other things: (a) the quality of the search, selection and monitoring services performed by the Investment Manager in overseeing the portfolio management responsibilities of the Subadvisor; (b) the Investment Manager’s ability to supervise the Fund’s other service providers; and (c) the Investment Manager’s compliance programs. The Trustees also took into account the financial condition of the Investment Manager with respect to its ability to provide the services required under the Investment Management Agreement and to maintain contractual expense limitations for the Fund.
The Trustees also reviewed information relating to the Subadvisor’s operations and personnel and the investment philosophy, strategies and techniques (the “Investment Strategy”) used in managing the Fund. Among other things, the Trustees reviewed bio-graphical information on portfolio management and other professional staff, information regarding the Subadvisor’s organizational and management structure and the Subadvisor’s brokerage policies and practices. The Trustees considered specific information provided regarding the experience of the individual or individuals at the Subadvisor with portfolio management responsibility for the Fund, including the information set
40
Annual Renewal of Investment Advisory Agreements (continued)
forth in the Fund’s prospectus and statement of additional information. In the course of their deliberations, the Trustees evaluated, among other things: (a) the services rendered by the Subadvisor in the past; (b) the qualifications and experience of the Subadvisor’s personnel; and (c) the Subadvisor’s compliance programs. The Trustees also took into account the financial condition of the Subadvisor with respect to its ability to provide the services required under the Subadvisory Agreement.
Performance
Among other information relating to the Fund’s performance, the Trustees noted that the Fund’s performance for the 1-year, 3-year, 5-year and 10-year periods ended March 31, 2006 was above the median performance of the Peer Group and the performance of the Fund Benchmark, which is the Lehman Brothers Aggregate Bond Index. The Trustees concluded that Fund’s performance has been satisfactory.
As noted above, the Board considered the Fund’s performance during relevant time periods as compared to the Fund’s Peer Group and noted that the Board reviews on a quarterly basis detailed information about the Fund’s performance results, portfolio composition and Investment Strategies. The Board noted the Investment Manager’s expertise and resources in monitoring the performance, investment style and risk adjusted performance of the Subadvisor.
Advisory Fees and Profitability
In considering the reasonableness of the advisory fee charged by the Investment Manager for managing the Fund, the Trustees noted that the Investment Manager, and not the Fund, is responsible for paying the fees charged by the Fund’s Subadvisor and, therefore, that the fees paid to the Investment Manager cover the reasonable cost of providing portfolio management services as well as the reasonable cost of providing search, selection and monitoring services in operating a “manager-of-managers” complex of mutual funds. The Trustees concluded that, in light of the additional high quality supervisory services provided by the Investment Manager and the fact that the subadvisory fees are paid out of the advisory fee, the advisory fee payable by the Fund to the Investment Manager can reasonably be expected to exceed the median advisory fee for the Peer Group, which consists mostly of funds that do not operate with a manager-of-managers structure.
In considering the reasonableness of the advisory fee payable to the Investment Manager, the Trustees also reviewed information provided by the Investment Manager setting forth all revenues and other benefits, both direct and indirect, received by the Investment Manager and its affiliates attributable to managing the Fund and all the mutual funds in the Managers Family of Funds, the cost of providing such services and the resulting profitability to the Investment Manager and its affiliates from these relationships. The Trustees also noted the current and potential asset levels of the Fund and the willingness of the Investment Manager to waive fees and pay expenses for the Fund from time to time as a means of limiting the total expenses of the Fund. In this regard, the Trustees noted that, unlike the typical mutual fund that is managed by a single investment adviser, the Fund operates in a manager-of-managers structure and, as the Fund grows in size, it is common practice for the Investment Manager to recommend the selection of an additional Subadvisor to manage a portion of the Fund’s portfolio. The Trustees also noted that the subadvisory fees are paid by the Investment
41
Annual Renewal of Investment Advisory Agreements (continued)
Manager out of its advisory fee. The Trustees further noted that, because of this practice, the Investment Manager’s oversight and supervisory responsibilities with respect to the Fund can be expected to increase with the size of the Fund. On this basis, the Trustees concluded that the profitability to the Investment Manager is reasonable and that the Investment Manager is not realizing material benefits from economies of scale that would warrant adjustments to the fees for the Fund at this time. With respect to economies of scale, the Trustees also noted that as a Fund’s assets increase over time, the Fund may realize other economies of scale to the extent that the increase in assets is proportionally greater than the increase in certain other expenses.
The Trustees noted that the Fund’s advisory fee and total expenses (net of applicable expense waivers/reimbursements) as of March 31, 2006 were higher and lower, respectively, than the average for the Peer Group and that the Investment Manager has contractually agreed through March 1, 2007 to limit the Fund’s net annual operating expenses to 0.60%. The Trustees concluded that, in light of the nature, extent and quality of the services provided by the Investment Manager and the Subadvisor, the Fund’s performance, the foregoing expense limitation and the considerations noted above with respect to the Subadvisor and the Investment Manager, the Fund’s advisory fees are reasonable.
Subadvisory Fees and Profitability
In considering the reasonableness of the fee payable by the Investment Manager to the Subadvisor, the Trustees relied on the ability of the Investment Manager to negotiate the terms of the Subadvisory Agreement at arm’s length as part of the manager-of-managers structure, noting that the Subadvisor is not affiliated with the Investment Manager. In addition, the Trustees noted that the subadvisory fees are paid by the Investment Manager out of its advisory fee. Accordingly, the cost of services to be pro-vided by the Subadvisor and the profitability to the Subadvisor of its relationship with the Fund were not material factors in the Trustees’ deliberations. For similar reasons, and based on the current size of the portion of the Fund managed by the Subadvisor, the Trustees concluded that any economies of scale being realized by the Subadvisor was not a material factor in the Trustees’ deliberations at this time.
* * * *
After consideration of the foregoing, the Trustees also reached the following conclusions regarding the Investment Management Agreement and the Subadvisory Agreement, in addition to those conclusions discussed above: (a) the Investment Manager and the Subadvisor have demonstrated that they possess the capability and resources to perform the duties required of them under the Investment Management Agreement and the Subadvisory Agreement; (b) the Subadvisor’s Investment Strategy is appropriate for pursuing the Fund’s investment objectives; (c) the Subadvisor is reasonably likely to execute its Investment Strategy consistently over time; and (d) the Investment Manager and the Subadvisor maintain appropriate compliance programs.
Based on all of the above-mentioned factors and related conclusions, with no single factor or conclusion being determinative and with each Trustee not necessarily attributing the same weight to each factor, the Trustees concluded that approval of the Investment Management Agreement and the Subadvisory Agreement would be in the interests of
42
Annual Renewal of Investment Advisory Agreements (continued)
the Fund and its shareholders. Accordingly, on June 2, 2006 the Trustees, including a majority of the Independent Trustees, voted to approve the Investment Management Agreement and the Subadvisory Agreement for the Fund’s Subadvisor.
43
Investment Manager and Administrator
Managers Investment Group LLC
800 Connecticut Avenue
Norwalk, Connecticut 06854
(203) 299-3500 or (800) 835-3879
Distributor
Managers Distributors, Inc.
800 Connecticut Avenue
Norwalk, Connecticut 06854
(203) 299-3500 or (800) 835-3879
Subadvisor
Pacific Investment Management Co., LLC
840 Newport Center Drive, Suite 100
Newport Beach, CA 92660
Custodian
The Bank of New York
2 Hanson Place
Brooklyn, New York 11217
Legal Counsel
Ropes & Gray LLP
One International Place
Boston, Massachusetts 02110-2624
Transfer Agent
PFPC, Inc.
Attn: Managers
P.O. Box 9769
Providence, Rhode Island 02940
(800) 548-4539

| | | | |
MANAGERS AND MANAGERS AMG EQUITY FUNDS | | MANAGERS BALANCED FUNDS |
| EMERGING MARKETS EQUITY | | RORER LARGE-CAP | | BALANCED |
| Rexiter Capital Management Limited | | Rorer Asset Management, LLC | | Chicago Equity Partners, LLC |
| | | | Loomis, Sayles & Company L.P. |
| | |
| ESSEX GROWTH | | SMALL CAP | | GLOBAL |
| ESSEX LARGE CAP GROWTH | | TIMESSQUARE MID CAP GROWTH | | 333 Global Advisers* |
| (Formerly known as Capital Appreciation) | | TIMESSQUARE SMALL CAP GROWTH | | Armstrong Shaw Associates Inc. |
| ESSEX SMALL/MICRO CAP GROWTH | | TimesSquare Capital Management, LLC | | Alliance Bernstein L.P. |
| Essex Investment Management Co., LLC | | | | First Quadrant, L.P. |
| | SMALL COMPANY | | Kern Capital Management LLC |
| FQ TAX-MANAGED U.S. EQUITY | | Epoch Investment Partners, Inc. | | Northstar Capital Management, Inc. |
| FQ U.S. EQUITY | | Kalmar Investment Advisers, Inc. | | Wellington Management Company, LLP |
| First Quadrant, L.P. | | | | |
| | | SPECIAL EQUITY | | ALTERNATIVE FUNDS |
| | Donald Smith & Co., Inc. | | FQ GLOBAL ALTERNATIVES |
| INSTITUTIONAL MICRO-CAP | | Kern Capital Management LLC | | First Quadrant, L.P. |
| MICRO-CAP | | Skyline Asset Management, L.P. | | |
| Kern Capital Management LLC | | Smith Asset Management Group, LP | | MANAGERS |
| | | Veredus Asset Management LLC | | FIXED INCOME FUNDS |
| INTERNATIONAL EQUITY | | Westport Asset Management, Inc. | | BOND (MANAGERS) |
| Alliance Bernstein L.P. | | | | FIXED INCOME |
| Lazard Asset Management, LLC | | SYSTEMATIC VALUE | | GLOBAL BOND |
| Wellington Management Company, LLP | | Systematic Financial Management, L.P. | | Loomis, Sayles & Company L.P. |
| | | | |
| MID-CAP | | VALUE | | BOND (MANAGERS FREMONT) |
| Chicago Equity Partners, LLC | | Armstrong Shaw Associates Inc. | | Pacific Investment Management Co. LLC |
| | Osprey Partners Investment Mgmt., LLC | | |
| REAL ESTATE SECURITIES | | | | CALIFORNIA INTERMEDIATE |
| Urdang Securities Management, Inc. | | | | TAX-FREE |
| | | | Evergreen Investment Management Company, LLC |
| | | | | |
| | | | HIGH YIELD |
| | | | J.P. Morgan Investment Management Inc. |
| | | | |
| | | | INTERMEDIATE DURATION |
| | | | GOVERNMENT |
| | | | SHORT DURATION GOVERNMENT |
| | | | Smith Breeden Associates, Inc. |
| | | | |
| | | | MONEY MARKET (MANAGERS) |
| | | | JPMorgan Investment Advisors Inc. |
| | | | |
| | | | MONEY MARKET (FREMONT) |
| | | | 333 Global Advisers* |
| * | A division of Managers Investment Group LLC |
This report is prepared for the Fund’s shareholders. It is authorized for distribution to prospective investors only when preceded or accompanied by an effective prospectus. To receive a free copy of the prospectus or Statement of Additional Information, which includes additional information about Fund Trustees, please contact us by calling 800.835.3879. Distributed by Managers Distributors, Inc., member NASD.
A description of the policies and procedures the Fund uses to vote its proxies is available: (i) without charge, upon request, by calling 800.835.3879, or (ii) on the Securities and Exchange Commission’s (SEC) Web site at www.sec.gov. For information regarding the Fund’s proxy voting record for the 12-month period ended June 30, call 800.835.3879 or visit the SEC Web site at www.sec.gov.
The Fund files its complete schedule of portfolio holdings with the SEC for the first and third quarters of each fiscal year on Form N-Q. The Fund’s Forms N-Q are available on the SEC’s website at www.sec.gov. A Fund’s Forms N-Q may be reviewed and copied at the SEC’s Public Reference Room in Washington, DC. Information on the operation of the Public Reference Room may be obtained by calling 1-800-SEC-0330. To review a complete list of the Fund’s portfolio holdings, or to view the most recent quarterly holdings report, semiannual report, or annual report, please visit www.managersinvest.com.
| | | | |
| www.managersinvest.com | | | |  |
ANNUAL REPORT
Managers Funds
October 31, 2006
| • | | Managers Fremont Institutional Micro-Cap Fund |

AR010b
Managers Fremont Institutional Micro-Cap Fund
Annual Report–October 31, 2006
| | |
TABLE OF CONTENTS | | Page |
LETTER TO SHAREHOLDERS | | 1 |
| |
ABOUT YOUR FUND’S EXPENSES | | 2 |
| |
PORTFOLIO MANAGER COMMENTS | | 3 |
| |
FUND SNAPSHOTS | | 8 |
Portfolio breakdown and top ten holdings at October 31, 2006 | | |
| |
SCHEDULE OF PORTFOLIO INVESTMENTS | | 9 |
| |
FINANCIAL STATEMENTS: | | |
| |
Statement of Assets and Liabilities | | 13 |
Fund balance sheet, net asset value (NAV) per share computation and cumulative undistributed amount | | |
| |
Statement of Operations | | 14 |
Detail of sources of income, Fund expenses, and realized and unrealized gains (losses) during the fiscal year | | |
| |
Statement of Changes in Net Assets | | 15 |
Detail of changes in Fund assets for the past two fiscal years | | |
| |
FINANCIAL HIGHLIGHTS | | 16 |
Historical net asset values per share, distributions, total returns, expense ratios, turnover ratios and net assets | | |
| |
NOTES TO FINANCIAL STATEMENTS | | 17 |
Accounting and distribution policies, details of agreements and transactions with Fund management and affiliates, and descriptions of certain investment risks | | |
| |
REPORT OF INDEPENDENT REGISTERED PUBLIC ACCOUNTING FIRM | | 23 |
| |
TRUSTEES AND OFFICERS | | 24 |
| |
ANNUAL RENEWAL OF INVESTMENT ADVISORY AGREEMENTS | | 27 |
Nothing contained herein is to be considered an offer, sale or solicitation of an offer to buy shares of The Managers Funds or Managers AMG Funds. Such offering is made only by Prospectus, which includes details as to offering price and other material information.
Letter to Shareholders
Dear Fellow Shareholder:
The year 2006 has been volatile but rewarding for investors. Markets confronted new Federal Reserve leadership and accompanying communication style, commodity price increases, the end (at least for now) of interest rate hikes, and then a sharp decline in oil prices and a dramatic slowdown in the real estate market. Times like these challenge investors to remove emotion from decisions and remain disciplined with their long-term investment plans.
Regardless of market conditions, we at Managers maintain our focus on providing excellent, trusted, and rigorously monitored investment solutions across all major market segments and styles. We encourage our portfolio managers to take a long-term view and to invest accordingly. We strive to stay on track even when market volatility causes some investors concern.
Our overriding goal is to hire fund managers that can effectively manage assets in all types of market conditions. Toward this goal we maintain a team of skilled investment professionals focused solely on understanding the global capital markets and overseeing the managers in our Funds. We hire fund portfolio managers who excel over time, have a strong investment discipline, and stick to that discipline.
Regardless of market conditions, we at Managers maintain our focus on providing excellent, trusted, and rigorously monitored investment solutions across all major market segments and styles.
Our investment team oversees the Funds’ managers and portfolios every day so you don’t have to. Once you have selected Managers Funds as part of your asset allocation, you can be assured that we are monitoring that investment every day to help ensure it is delivering on its investment mandate.
As 2006 comes to a close, we begin to think about next year and beyond. The two things we believe will impact investment returns the most are the condition of the economy and the change to the political landscape this fall’s election brings. Obviously, these are only the headlines and there are many subtleties relating to each.
First, with regard to the health of the economy, the risk appears to be the leverage consumers have assumed through their exposure to the residential real estate market. The “house as cash machine” combined with the speculative investment in real estate has increased the economy’s exposure to any weakness in prices or excess supply of real estate. Both these factors seem to be in play. Aside from this risk, consumers and businesses seem to be in good financial shape with relatively healthy balance sheets.
Second, with regard to the changes in Washington D.C., much has and will be written regarding mid-term power shifts, the third year of a President’s term, tax policy and its relationship to growth, and the war in Iraq. Suffice it to say that there are many interesting challenges facing the financial markets, and managing an investment portfolio requires diligence, attention, and resources.
Each of us at Managers appreciates the trust you express in us by allowing us the privilege of investing some of your capital. We will do everything we can to continue to deserve your trust in the months and years ahead.
| | | | |
| Respectfully, | | | | |
| | |
/s/ Peter M. Lebovitz | | | | /s/ Thomas G. Hoffman |
| Peter M. Lebovitz | | | | Thomas G. Hoffman |
| President | | | | Executive Vice President |
| Managers Funds | | | | Chief Investment Officer |
| | | | Managers Investment Group LLC |
1
About Your Fund’s Expenses
As a shareholder of the Fund, you may incur two types of costs: (1) transaction costs, which may include sales charges (loads) on purchase payments; redemption fees; and exchange fees; and (2) ongoing costs, including management fees and other Fund expenses. This Fund incurs only ongoing costs. This example is intended to help you understand your ongoing costs (in dollars) of investing in the Fund and to compare these costs with the ongoing costs of investing in other mutual funds. The example is based on an investment of $1,000 invested at the beginning of the period and held for the entire period as indicated below.
Actual Expenses
The first line of the table below provides information about the actual account values and actual expenses. You may use the information in this line, together with the amount you invested, to estimate the expenses that you paid over the period. Simply divide your account value by $1,000 (for example, an $8,600 account value divided by $1,000 = 8.6), then multiply the result by the number in the first line under the heading entitled “Expenses Paid During Period” to estimate the expenses you paid on your account during this period.
Hypothetical Example for Comparison Purposes
The second line of the table below provides information about hypothetical account values and hypothetical expenses based on the Fund’s actual expense ratio and an assumed annual rate of return of 5% before expenses, which is not the Fund’s actual return. The hypothetical account values and expenses may not be used to estimate the actual ending account balance or expenses you paid for the period. You may use this information to compare the ongoing costs of investing in the Fund and other funds by comparing this 5% hypothetical example with the 5% hypothetical examples that appear in the shareholder reports of other funds.
Please note that the expenses shown in the table are meant to highlight your ongoing costs only and do not reflect any transactional costs, such as sales charges (loads), redemption fees, or exchange fees. Therefore, the second line of the table is useful in comparing ongoing costs only, and will not help you determine the relative total costs of owning different funds.
| | | | | | | | | |
Six Months Ended October 31, 2006 | | Beginning Account Value
5/1/2006 | | Ending
Account Value
10/31/2006 | | Expenses
Paid During
Period* |
Managers Fremont Institutional Micro-Cap Fund | | | | | | | | | |
Based on Actual Fund Return | | $ | 1,000 | | $ | 940 | | $ | 6.60 |
Based on Hypothetical 5% Annual Return | | $ | 1,000 | | $ | 1,018 | | $ | 6.87 |
| * | Expenses are equal to the Fund’s annualized expense ratio multiplied by the average account value over the period, multiplied by the number of days in the most recent fiscal half-year (184), then divided by 365. |
2
Managers Fremont Institutional Micro-Cap Fund
Portfolio Manager’s Comments
The Managers Fremont Institutional Micro-Cap Fund primarily invests in the stocks of U.S. micro-capitalization companies. These companies have market capitalizations that, at the time of initial purchase, place them among the smallest 5% of companies listed on U.S. stock markets. Normally, the Fund will invest at least 80% of its assets in U.S. micro-cap stocks. The Russell 2000 Growth Index is the benchmark for the Fund.
The Portfolio Manager
Kern Capital Management LLC
Kern Capital Management LLC (“KCM”), subadvisor for the Managers Fremont Institutional Micro-Cap Fund was founded in 1997 by Robert (Bob) E. Kern, Jr. and David G. Kern. KCM is an employee owned investment advisory firm dedicated to researching and investing in innovative micro-cap and small-cap growth companies.
KCM believes the U.S. smaller company stock universe provides the opportunity to invest in innovative companies with exceptional growth prospects. With minimal research coverage by brokerage firms and low institutional ownership, KCM believes small- and micro-cap stocks represent the least efficient sector of the market and its investment process is designed to capitalize on this inefficiency.
KCM’s fundamental research is dedicated to uncovering innovative small companies early in their growth cycle while they are still relatively undiscovered. With a huge universe of investment opportunity, KCM’s investment process focuses on the most innovative sectors in the U.S. economy (technology, health care, services, and consumer sectors). Research specialization by economic sector provides the depth of knowledge necessary to make high quality investment decisions and minimize fundamental investment mistakes.
KCM builds portfolios one company at a time. The team’s hands-on approach to fundamental investment research and financial analysis seeks to answer three basic questions to determine an investment’s attractiveness.
| | • | | How attractive is the business? Companies that are pioneering new markets or revolutionizing existing ones can often sustain rapid growth as they establish leading positions in their targeted markets. |
| | • | | How strong is the management? Successful companies require management capable of capitalizing on attractive growth opportunities. Management’s vision and ability to execute the business plan represent key elements in determining how successful a company will be. |
| | • | | How much is the company worth? The team’s process is valuation sensitive. Depending on the economic sector, different criteria are used to determine a company’s enterprise value, which determines if KCM would buy the entire company at the current market value of its equity. |
Given that KCM is focused on investing in innovative growth companies, the first two questions are answered before determining if the valuation is attractive. In fact, the answers to the first two questions will help determine the appropriate valuation for the company.
3
Managers Fremont Institutional Micro-Cap Fund
Portfolio Manager’s Comments (continued)
The ideal company exhibits many of the following traits:
| | • | | Leading market position in a rapidly growing market with high barriers to entry |
| | • | | Entrepreneurial management team with experience managing a growth business |
| | • | | Focused business plan with tight internal controls |
The portfolio management process includes:
| | • | | Investing in between 70 and 90 companies which have market capitalizations that, at the time of initial purchase, place them among the smallest 5% of companies listed in the U.S. stock markets |
| | • | | Building portfolios from the bottom up and seeks to identify companies early in their growth cycle |
| | • | | Utilizing a team approach to cover approximately 600 stocks through an extensive network of contact and other information sources: |
| | • | | Brokerage firm and industry analysts |
| | • | | Corporate management contacts |
| | • | | Trade shows and trade journals |
| | • | | Focusing on business sectors where KCM believes the level of innovation is greatest, such as technology, health care, services and consumer |
| | • | | Using fundamental analysis to identify small, relatively unknown companies that exhibit the potential to become much larger and more successful |
| | • | | Meeting with corporate management to discuss business plans and strategies |
The investment team will make a sell decision when:
| | • | | An investment’s growth prospects deteriorate |
| | • | | Investments achieve excessive valuation relative to the growth opportunities and/or addressable markets. |
| | • | | There is a negative change in fundamental confidence and/or investment time horizon |
The Year in Review
Fiscal 2006 was a period when strong performance by the large-cap and small-cap stock market indexes produced high double-digit rates of return; e.g., the small-cap Russell 2000 Growth Index gained 17.1% compared with an increase of 16.3% by the large-cap S&P 500 Index. During this period, the Managers Fremont Institutional Micro-Cap Fund increased 16.3%. Performance during the last three months of the fiscal year made a significant contribution to the Fund’s annual return, and represented almost 50% of the year’s net appreciation. Renewed interest in the technology sector, which has been driven partially by falling oil prices and the search by investors to find alternative investment opportunities in other sectors, benefited the Fund’s large portfolio weighting in technology companies.
4
Managers Fremont Institutional Micro-Cap Fund
Portfolio Manager’s Comments (continued)
The Fund’s performance can also be analyzed by economic sector and the market capitalization of the portfolio companies. Kern Capital Management invests in innovative small-cap and micro-cap growth companies and focuses its fundamental approach to investment research on the most innovative sectors in the U.S. economy – technology, health care, services, and consumer. Each of these sectors made positive contributions to the Fund’s return with technology stocks representing approximately two-thirds of the total return and outperforming technology stocks in the Russell 2000 Growth Index by over 700 basis points. The Fund’s second most heavily weighted sector, health care, underperformed the benchmark primarily due to losses in several biotechnology investments.
Based upon market capitalization, the Institutional Micro-Cap Fund’s weighted average of $506 million was significantly less than the approximately $1.2 billion for the Russell 2000 Growth Index on 10/31/06. Overall, fiscal 2006 was a year which did not favor the smallest growth companies – performance of the bottom two quintiles of the Russell 2000 Growth Index ranged between +10-13% while the top three quintiles ranged between +16-21%. Although this divergence made it more challenging for the Fund, stock selection among technology companies and the consumer discretionary sector made a significant contribution to fiscal year performance.
Within the micro-cap universe, individual stock selection represents one of the best opportunities for investors to achieve high rates of return. During fiscal 2006, the top three contributors to appreciation were: Equinix, Identix, and Gymboree. The three largest losses were: Terayon Communications, NeoPharm, and Cash Systems. Based upon investments which accounted for the ten largest gains and losses during the year, gains exceeded losses by a ratio of 1.9 to 1.0.
The focus of KCM’s investment team on innovative small-cap and micro-cap growth companies, and the search for the most attractive investment opportunities, led to the addition of investment research resources during the past year. These resources are primarily focused on the service sector and the successful implementation of this planned change has been reflected in the portfolio weighting of service companies increasing from 14% at the beginning of fiscal 2006 to 23% on 10/31/06. Importantly, service companies accounted for slightly over 25% of the Fund’s appreciation in fiscal 2006.
The Fund’s portfolio structure reflects a high portfolio weighting in technology companies that was maintained throughout the year. Although this strategy had a negative impact on performance during the May to mid-July timeframe, a strong finish to the year provided a return which was similar to the Fund’s performance. Also, the consumer discretionary sector is believed to offer fewer innovative growth opportunities, especially in the traditional retail and restaurant segments. This change, and concerns about the negative impact of high energy costs, higher interest rates and declining home prices during the past year, was reflected in single-digit portfolio weightings in the consumer discretionary sector throughout fiscal 2006.
5
Managers Fremont Institutional Micro-Cap Fund
Portfolio Manager’s Comments (continued)
The stock market rally, which began in July, was triggered by the Federal Reserve’s decision not to raise interest rates in August and a sharp drop in the price of oil. These positive developments more than offset investor concerns surrounding the decline in homebuilding and the beginning of an economic slowdown. Slowing economic growth is expected to cause growth stock investors to focus on companies which have the potential to continue to achieve high rates of growth, e.g., innovative technology companies that participate in high secular growth trends or niche companies with a strong new product cycle. In addition, it is anticipated that investors will favor companies which have limited exposure to an economic slowdown, e.g., select health care and service companies.
Looking Forward
Longer-term, the Fund has achieved high absolute rates of return and significantly outperformed the Russell 2000 Growth Index. For the ten year period ended 10/31/06, the Managers Fremont Institutional Micro-Cap Fund’s average annual total return was 15.4%. The comparable return for the Russell 2000 Growth Index was 5.2%.
These results reflect a time-tested approach of successfully investing in micro-cap growth companies and an investment team with long-term experience investing in this specialized sector of the equities market. Among all asset classes, we believe investing in micro-cap growth stocks represents one of the best opportunities for investors to achieve high, long-term, absolute rates of return.
Cumulative Total Return Performance
Managers Fremont Institutional Micro-Cap Fund’s cumulative total return is based on the daily change in net asset value (NAV), and assumes that all distributions were reinvested. The Russell 2000 Growth Index measures the performance of those Russell 2000 companies with higher price-to-book ratios and higher forecasted growth values. This chart compares a hypothetical $10,000 investment made in the Managers Fremont Institutional Micro-Cap Fund on 10/31/96 to a $10,000 investment made in the Russell 2000 Growth Index for the same time period. The graph and table do not reflect the deduction of taxes that a shareholder would pay on a Fund distribution or redemption of shares. Past performance is not indicative of future results.
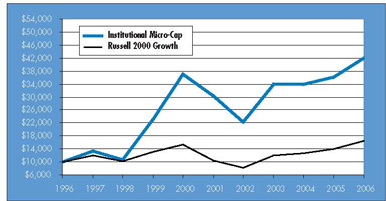
6
Managers Fremont Institutional Micro-Cap Fund
Portfolio Manager’s Comments (continued)
The table below shows the average annualized total returns for the Managers Fremont Institutional Micro-Cap Fund and the Russell 2000 Growth Index for the one-year, five-year and ten-year periods ending October 31, 2006.
| | | | | | | | | |
AVERAGE ANNUAL TOTAL RETURNS: | | One
Year | | | Five
Years | | | Ten
Years | |
Managers Fremont Institutional Micro-Cap | | 16.33 | % | | 6.71 | % | | 15.44 | % |
Russell 2000 Growth Index | | 17.07 | % | | 9.51 | % | | 5.15 | % |
The performance data shown represents past performance. Past performance is not a guarantee of future results. Current performance may be lower or higher than the performance data quoted. The investment return and the principal value of an investment will fluctuate so that an investor’s shares, when redeemed, may be worth more or less than their original cost. For performance information through the most recent month end please call (800) 835-3879 or visit our Web site at www.managersinvest.com.
The returns shown were achieved during a period of generally rising market values, especially in the technology sector. In addition, a portion of the Fund’s performance can be attributed to investments in Initial Public Offerings (IPOs). Investors should not expect that such favorable returns can be consistently achieved.
The Fund is subject to risks associated with investments in small-capitalization companies, such as erratic earnings patterns, competitive conditions, limited earnings history, and a reliance on one or a limited number of products.
Managers Fremont Institutional Micro-Cap Fund performance reflects the performance of the post-venture Fund of Fund A of the Bechtel Trust & Thrift Retirement Plan, whose assets were transferred into and became the Managers Fremont Institutional Micro-Cap Fund on 08/06/97. The post-venture Fund imposed higher fees and expenses than that of the Managers Fremont Institutional Micro-Cap Fund and was not registered with the Securities and Exchange Commission and therefore was not subject to the investment restrictions imposed on registered mutual funds.
7
Managers Fremont Institutional Micro-Cap Fund
Fund Snapshots
October 31, 2006
Portfolio Breakdown
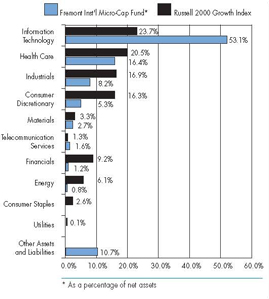
| | | | | | |
Industy | | Managers
Fremont Inst’l
Micro-Cap* | | | Russell
2000
Growth | |
Information Technology | | 53.1 | % | | 23.7 | % |
Health Care | | 16.4 | % | | 20.5 | % |
Industrials | | 8.2 | % | | 16.9 | % |
Consumer Discretionary | | 5.3 | % | | 16.3 | % |
Materials | | 2.7 | % | | 3.3 | % |
Telecommunication Services | | 1.6 | % | | 1.3 | % |
Financials | | 1.2 | % | | 9.2 | % |
Energy | | 0.8 | % | | 6.1 | % |
Consumer Staples | | 0.0 | % | | 2.6 | % |
Utilities | | 0.0 | % | | 0.1 | % |
Other Assets and Liabilities | | 10.7 | % | | 0.0 | % |
Top Ten Holdings
| | | |
Security Name | | Percentage of
Net Assets | |
Equinix, Inc.* | | 5.0 | % |
ATMI, Inc.* | | 4.4 | |
AudioCodes, Ltd.* | | 3.2 | |
FEI Co. | | 3.2 | |
Conceptus, Inc. | | 2.5 | |
Power Integrations, Inc. | | 2.3 | |
Omnicell, Inc. | | 2.2 | |
Regeneration Technologies, Inc.* | | 2.2 | |
Eclipsys Corp. | | 2.0 | |
TVI Corp.* | | 2.0 | |
| | | |
Top Ten as a Group | | 29.0 | % |
| | | |
| * | Top Ten Holding at April 30, 2006 |
Any sectors, industries, or securities discussed should not be perceived as investment recommendations. Mention of a specific security should not be considered a recommendation to buy or solicitation to sell that security.
8
Managers Fremont Institutional Micro-Cap Fund
Schedule of Portfolio Investments
October 31, 2006
| | | | | | |
| | | Shares | | | Value |
Common Stocks - 89.3% | | | | | | |
Consumer Discretionary - 5.3% | | | | | | |
AT Cross - Cl A* | | 50,100 | | | $ | 344,687 |
Century Casinos, Inc. * | | 291,400 | | | | 3,010,162 |
dELiA*s Corp.* | | 104,488 | | | | 948,751 |
Harris Interactive, Inc.* | | 458,500 | | | | 3,062,780 |
IMAX Corp. | | 404,500 | 1 | | | 1,978,005 |
Lakes Gaming, Inc.* | | 168,100 | | | | 1,909,616 |
Nevada Gold & Casinos, Inc.* | | 277,000 | | | | 1,506,880 |
Scopus Video Neworks, Ltd. | | 290,400 | | | | 1,103,520 |
Total Consumer Discretionary | | | | | | 13,864,401 |
Energy - 0.8% | | | | | | |
SulphCo, Inc.* | | 379,000 | 1 | | | 2,073,130 |
Financials - 1.2% | | | | | | |
Cash Systems, Inc.* | | 546,500 | | | | 3,251,675 |
Health Care - 16.4% | | | | | | |
AngioDynamics, Inc.* | | 145,900 | | | | 3,158,735 |
Cardica, Inc.* | | 95,300 | 1 | | | 411,696 |
Cepheid, Inc.* | | 246,200 | | | | 2,021,302 |
Conceptus, Inc.* | | 322,500 | | | | 6,391,950 |
Cyberonics, Inc.* | | 81,500 | | | | 1,469,445 |
Eclipsys Corp.* | | 249,500 | | | | 5,286,905 |
Harvard Bioscience, Inc.* | | 343,600 | | | | 1,755,796 |
ICON PLC. | | 74,100 | | | | 2,658,708 |
NeoPharm, Inc.* | | 674,341 | 1 | | | 4,882,229 |
NxStage Medical, Inc.* | | 127,300 | | | | 933,109 |
Omnicell, Inc.* | | 306,400 | | | | 5,738,872 |
Regeneration Technologies, Inc.* | | 891,100 | | | | 5,676,307 |
Vital Images, Inc.* | | 65,700 | | | | 2,039,328 |
Total Health Care | | | | | | 42,424,382 |
Industrials - 8.2% | | | | | | |
Coinstar Inc* | | 34,400 | | | | 1,045,072 |
Flow International Corp.* | | 288,600 | | | | 3,399,708 |
The accompanying notes are an integral part of these financial statements.
9
Managers Fremont Institutional Micro-Cap Fund
Schedule of Portfolio Investments (continued)
| | | | | | |
| | | Shares | | | Value |
Industrials (continued) | | | | | | |
Fuel Tech, Inc. | | 52,500 | | | $ | 1,031,625 |
Global Traffic Network, Inc.* | | 451,200 | | | | 2,242,464 |
InnerWorkings, Inc.* | | 105,800 | | | | 1,581,710 |
Insituform Technologies, Inc.* | | 25,900 | | | | 605,283 |
KVH Industries, Inc.* | | 134,800 | | | | 1,472,016 |
PDG Environmental, Inc. * 4 | | 1,310,500 | | | | 1,310,500 |
Powell Industries, Inc.* | | 138,600 | | | | 3,322,242 |
TVI Corp.* 4 | | 1,742,100 | | | | 5,139,195 |
Total Industrials | | | | | | 21,149,815 |
Information Technology - 53.1% | | | | | | |
Acacia Research Corp.* | | 110,200 | | | | 1,408,356 |
Access Integrated Technologies, Inc.* | | 130,800 | | | | 1,391,712 |
Airspan Networks, Inc.* | | 951,500 | | | | 2,806,925 |
Aladdin Knowledge Systems, Ltd.* | | 95,800 | | | | 1,710,988 |
Anaren Microwave, Inc.* | | 175,900 | | | | 3,537,349 |
Astro-Med, Inc. | | 171,050 | | | | 1,737,868 |
ATMI, Inc.* | | 357,700 | | | | 11,335,513 |
AudioCodes, Ltd. | | 749,500 | | | | 8,304,460 |
Bottomline Technologies, Inc.* | | 125,500 | | | | 1,214,840 |
CalAmp Corp. * | | 515,700 | | | | 3,429,405 |
Ceragon Networks, Ltd. | | 541,100 | | | | 2,916,529 |
CommVault Systems, Inc.* | | 83,700 | | | | 1,495,719 |
Eagle Test Systems, Inc.* | | 90,900 | | | | 1,599,840 |
eCollege.com* | | 254,300 | | | | 4,399,390 |
EDGAR Online, Inc.* | | 369,000 | 1 | | | 1,335,780 |
EMCORE Corp.* | | 340,400 | | | | 1,957,300 |
Equinix, Inc.* | | 191,500 | 1 | | | 13,098,600 |
Exfo Electro-Optical Engineering, Inc. | | 957,800 | | | | 4,721,954 |
FEI Co.* | | 361,700 | | | | 8,268,462 |
Identity Solutions, Inc.* | | 166,196 | | | | 2,378,265 |
Internap Network Services Corp.* | | 214,400 | | | | 3,533,312 |
Lightbridge, Inc.* | | 152,600 | | | | 1,764,056 |
The accompanying notes are an integral part of these financial statements.
10
Managers Fremont Institutional Micro-Cap Fund
Schedule of Portfolio Investments (continued)
| | | | | | |
| | | Shares | | | Value |
Information Technology (continued) | | | | | | |
NCI, Inc., Class A* | | 150,500 | | | $ | 1,747,305 |
Omniture, Inc.* | | 100,100 | | | | 908,908 |
Online Resources Corp.* | | 282,600 | | | | 2,955,996 |
Openwave Systems, Inc.* | | 196,400 | | | | 1,694,932 |
OPNET Technologies, Inc.* | | 179,500 | | | | 2,624,290 |
Optibase Ltd. 4 | | 872,600 | | | | 2,582,896 |
Optical Communication Products, Inc.* | | 1,105,800 | | | | 2,377,470 |
Pericom Semiconductor Corp* | | 110,500 | | | | 1,061,905 |
Photon Dynamics, Inc.* | | 251,200 | | | | 2,981,744 |
Power Integrations, Inc.* | | 272,200 | | | | 5,972,068 |
Rae Systems, Inc.* | | 352,500 | | | | 1,360,650 |
RightNow Technologies, Inc.* | | 18,100 | | | | 299,012 |
Rudolph Technologies, Inc.* | | 99,300 | | | | 1,753,638 |
Silicon Motion Technology Corp., ADR | | 82,700 | | | | 1,271,099 |
Simpletech, Inc.* | | 327,700 | | | | 2,837,882 |
SRS Labs, Inc.* | | 500,600 | | | | 3,158,786 |
Standard Microsystems Corp.* | | 60,400 | | | | 1,862,132 |
Stanley, Inc.* | | 83,700 | | | | 1,458,054 |
Stratasys, Inc.* | | 79,300 | | | | 2,210,884 |
Techwell, Inc.* | | 291,100 | | | | 4,398,521 |
TeleCommunication Systems, Inc.* | | 712,200 | | | | 2,314,650 |
Terayon Communication Systems, Inc.* | | 2,395,700 | | | | 3,689,378 |
The Knot, Inc.* | | 79,900 | | | | 1,915,203 |
Total Information Technology | | | | | | 137,784,026 |
Materials - 2.7% | | | | | | |
Calgon Carbon Corp.* | | 452,600 | 1 | | | 2,091,012 |
Northern Technologies International Corp.* 4 | | 205,900 | | | | 1,956,050 |
Symyx Technologies, Inc.* | | 123,500 | | | | 3,031,925 |
Total Materials | | | | | | 7,078,987 |
Telecommunication Services - 1.6% | | | | | | |
Cogent Communications Group, Inc.* | | 287,400 | | | | 4,069,584 |
Total Common Stocks (cost $208,576,446) | | | | | | 231,696,000 |
The accompanying notes are an integral part of these financial statements.
11
Managers Fremont Institutional Micro-Cap Fund
Schedule of Portfolio Investments (continued)
| | | | | | |
| | | Shares | | Value | |
Other Investment Companies - 14.4% 2 | | | | | | |
Bank of New York Institutional Cash Reserves Fund, 5.32% 3 | | 11,605,713 | | $ | 11,605,713 | |
JPMorgan Prime Money Market Fund, Institutional Class Shares, 5.18% | | 16,074,503 | | | 16,074,503 | |
Vanguard Prime Money Market Fund, Institutional Class Shares, 5.30% | | 9,626,900 | | | 9,626,900 | |
Total Other Investment Companies (cost $37,307,116) | | | | | 37,307,116 | |
Total Investments - 103.7% (cost $245,883,562) | | | | | 269,003,116 | |
Other Assets, less Liabilities - (3.7%) | | | | | (9,607,676 | ) |
Net Assets - 100.0% | | | | $ | 259,395,440 | |
Note: Based on the cost of investments of $249,153,816 for Federal income tax purposes at October 31, 2006, the aggregate gross unrealized appreciation and depreciation were $40,538,697 and $20,689,397, respectively, resulting in net unrealized appreciation of investments of $19,849,300.
| * | Non-income-producing securities. |
| 1 | Some or all of these shares, amounting to a market value of $11,158,702, or 4.3% of net assets, were out on loan to various brokers. |
| 2 | Yield shown for an investment company represents the October 31, 2006, seven-day average yield, which refers to the sum of the previous seven days’ dividends paid, expressed as an annual percentage. |
| 3 | Collateral received from brokers for securities lending was invested in this short-term investment. |
| 4 | Affiliated Company- See Note 6 in the Notes to Financial Statements. |
The accompanying notes are an integral part of these financial statements.
12
Managers Fremont Institutional Micro-Cap Fund
Statement of Assets and Liabilities
October 31, 2006
| | | |
Assets: | | | |
Investments at value (including securities on loan valued at $11,158,702) | | $ | 269,003,116 |
Receivable for investments sold | | | 6,179,805 |
Receivable for Fund shares sold | | | 31,544 |
Dividends and other receivables | | | 118,550 |
Prepaid expenses | | | 14,623 |
| | | |
Total assets | | | 275,347,638 |
| | | |
Liabilities: | | | |
Payable to Custodian | | | 259,451 |
Payable for Fund shares repurchased | | | 470,296 |
Payable upon return of securities loaned | | | 11,605,713 |
Payable for investments purchased | | | 3,257,208 |
Accrued expenses: | | | |
Investment advisory and management fees | | | 213,851 |
Administrative fees | | | 55,133 |
Other | | | 90,546 |
| | | |
Total liabilities | | | 15,952,198 |
| | | |
Net Assets | | $ | 259,395,440 |
| | | |
Shares outstanding | | | 17,208,722 |
| | | |
Net asset value, offering and redemption price per share | | $ | 15.07 |
| | | |
Net Assets Represent: | | | |
Paid-in capital | | $ | 218,246,623 |
Accumulated net realized gain from investments | | | 18,029,263 |
Net unrealized appreciation of investments | | | 23,119,554 |
| | | |
Net Assets | | $ | 259,395,440 |
| | | |
Investments at cost | | $ | 245,883,562 |
The accompanying notes are an integral part of these financial statements.
13
Managers Fremont Institutional Micro-Cap Fund
Statement of Operations
For the fiscal year ended October 31, 2006
| | | | |
Investment Income: | | | | |
Dividend income | | $ | 1,282,753 | |
Securities lending fees | | | 748,278 | |
| | | | |
Total investment income | | | 2,031,031 | |
| | | | |
Expenses: | | | | |
Investment management fees | | | 2,828,336 | |
Administrative fees | | | 707,084 | |
Transfer agent | | | 76,397 | |
Custodian | | | 78,135 | |
Professional fees | | | 62,407 | |
Reports to shareholders | | | 43,420 | |
Trustees fees and expenses | | | 23,186 | |
Registration fees | | | 27,842 | |
Insurance | | | 10,154 | |
Miscellaneous | | | 5,085 | |
| | | | |
Total expenses before offsets | | | 3,862,046 | |
| | | | |
Expense reimbursement | | | (43,728 | ) |
Expense reductions | | | (64 | ) |
| | | | |
Net expenses | | | 3,818,254 | |
| | | | |
Net investment loss | | | (1,787,223 | ) |
| | | | |
Net Realized and Unrealized Gain: | | | | |
Net realized gain on investment | | | 22,660,485 | |
Net unrealized appreciation of investments | | | 24,049,420 | |
| | | | |
Net realized and unrealized gain | | | 46,709,905 | |
| | | | |
Net Increase in Net Assets Resulting from Operations | | $ | 44,922,682 | |
| | | | |
The accompanying notes are an integral part of these financial statements.
14
Managers Fremont Institutional Micro-Cap Fund
Statement of Changes in Net Assets
For the fiscal year ended October 31,
| | | | | | | | |
| | | 2006 | | | 2005 | |
Increase (Decrease) in Net Assets From Operations: | | | | | | | | |
Net investment loss | | $ | (1,787,223 | ) | | $ | (3,085,292 | ) |
Net realized gain on investments | | | 22,660,485 | | | | 49,508,104 | |
Net unrealized appreciation (depreciation) of investments | | | 24,049,420 | | | | (20,867,105 | ) |
| | | | | | | | |
Net increase in net assets resulting from operations | | | 44,922,682 | | | | 25,555,707 | |
| | | | | | | | |
Distributions to Shareholders: | | | | | | | | |
From net investment income: | | | — | | | | (2,857 | ) |
From net realized gain on investments: | | | (40,148,337 | ) | | | (12,361,161 | ) |
| | | | | | | | |
Total distributions to shareholders | | | (40,148,337 | ) | | | (12,364,018 | ) |
| | | | | | | | |
From Capital Share Transactions: | | | | | | | | |
Proceeds from sale of shares | | | 44,149,235 | | | | 43,846,665 | |
Reinvestment of dividends and distributions | | | 38,621,555 | | | | 11,637,724 | |
Cost of shares repurchased | | | (123,850,684 | ) | | | (130,986,089 | ) |
| | | | | | | | |
Net decrease from capital share transactions | | | (41,079,894 | ) | | | (75,501,700 | ) |
| | | | | | | | |
Total decrease in net assets | | | (36,305,549 | ) | | | (62,310,011 | ) |
| | | | | | | | |
Net Assets: | | | | | | | | |
Beginning of year | | | 295,700,989 | | | | 358,011,000 | |
| | | | | | | | |
End of year | | $ | 259,395,440 | | | $ | 295,700,989 | |
| | | | | | | | |
End of year undistributed net investment income | | | — | | | | — | |
| | | | | | | | |
Share Transactions: | | | | | | | | |
Sale of shares | | | 2,957,002 | | | | 3,135,379 | |
Reinvested shares | | | 2,766,703 | | | | 742,276 | |
Shares repurchased | | | (8,304,374 | ) | | | (8,826,603 | ) |
| | | | | | | | |
Net decrease in shares | | | (2,580,669 | ) | | | (4,948,948 | ) |
| | | | | | | | |
The accompanying notes are an integral part of these financial statements.
15
Managers Fremont Institutional Micro-Cap Fund
Financial Highlights
For a share outstanding throughout each fiscal year
| | | | | | | | | | | | | | | | | | | | |
| | | For the fiscal year ended October 31, | |
| | | 2006 | | | 2005 | | | 2004 | | | 2003 | | | 2002 | |
Net Asset Value, Beginning of Year | | $ | 14.94 | | | $ | 14.49 | | | $ | 14.52 | | | $ | 9.50 | | | $ | 12.98 | |
| | | | | | | | | | | | | | | | | | | | |
Income from Investment Operations: | | | | | | | | | | | | | | | | | | | | |
Net investment loss | | | (0.09 | )4 | | | — | | | | (0.17 | ) | | | (0.13 | ) | | | (0.11 | ) |
Net realized and unrealized gain (loss) on investments | | | 2.36 | | | | 0.97 | | | | 0.14 | | | | 5.15 | | | | (3.37 | ) |
| | | | | | | | | | | | | | | | | | | | |
Total from investment operations | | | 2.27 | | | | 0.97 | | | | (0.03 | ) | | | 5.02 | | | | (3.48 | ) |
| | | | | | | | | | | | | | | | | | | | |
Less Distributions to Shareholders from: | | | | | | | | | | | | | | | | | | | | |
Net investment income | | | — | | | | (0.00 | )# | | | — | | | | — | | | | — | |
Net realized gain on investments | | | (2.14 | ) | | | (0.52 | ) | | | — | | | | — | | | | — | |
| | | | | | | | | | | | | | | | | | | | |
Total distribution to shareholders | | | (2.14 | ) | | | (0.52 | ) | | | — | | | | — | | | | — | |
| | | | | | | | | | | | | | | | | | | | |
Net Asset Value End of Year | | $ | 15.07 | | | $ | 14.94 | | | $ | 14.49 | | | $ | 14.52 | | | $ | 9.50 | |
| | | | | | | | | | | | | | | | | | | | |
Total Return 1 | | | 16.33 | % | | | 6.54 | % | | | (0.21 | )% | | | 52.84 | % | | | (26.81 | )% |
| | | | | | | | | | | | | | | | | | | | |
Ratio of net operating expenses to average net assets 2 | | | 1.35 | % | | | 1.35 | % | | | 1.30 | % | | | 1.30 | % | | | 1.29 | % |
Ratio of net investment loss to average net assets 1 | | | (0.63 | )% | | | (0.89 | )% | | | (1.09 | )% | | | (1.12 | )% | | | (0.96 | )% |
Portfolio turnover | | | 78 | % | | | 73 | % | | | 87 | % | | | 119 | % | | | 64 | % |
Net assets at end of year (000’s omitted) | | $ | 259,395 | | | $ | 295,701 | | | $ | 358,011 | | | $ | 391,662 | | | $ | 253,297 | |
| | | | | | | | | | | | | | | | | | | | |
Ratios absent expense offsets: 3 | | | | | | | | | | | | | | | | | | | | |
Ratio of total expenses to average net assets | | | 1.37 | % | | | 1.39 | % | | | 1.30 | % | | | 1.30 | % | | | 1.29 | % |
Ratio of net investment loss to average net assets 1 | | | (0.65 | )% | | | (0.93 | )% | | | (1.09 | )% | | | (1.12 | )% | | | (0.96 | )% |
| | | | | | | | | | | | | | | | | | | | |
| # | Rounds to less than ($0.01) per share. |
| 1 | Total returns and net investment income would have been lower had certain expenses not been reduced. |
| 2 | Excludes the impact of expense reimbursement and expense offsets such as brokerage credits, but includes non-reimbursable expenses such as interest and taxes. (See Note 1(c) of “Notes to Financial Statements.”) |
| 3 | Ratio information assuming no reduction of Fund expenses. (See Notes to Financial Statements.) |
| 4 | Per share numbers have been calculated using average shares. |
16
Managers Fremont Institutional Micro-Cap Fund
Notes to Financial Statements
October 31, 2006
| 1. | Summary of Significant Accounting Policies |
Managers Trust I (the “Trust”) is an open-end management investment company organized as a Massachusetts business trust and registered under the Investment Company Act of 1940 (the “1940 Act”), as amended. Currently, the Trust is comprised of a number of different funds, each having distinct investment management objectives, strategies, risks and policies. Included in this report is the Managers Fremont Institutional Micro-Cap Fund (the “Fund).
The Fund’s financial statements are prepared in accordance with accounting principles generally accepted in the United States of America, which require management to make estimates and assumptions that affect the reported amount of assets and liabilities and disclosure of contingent assets and liabilities at the date of the financial statements and the reported amounts of income and expenses during the reporting periods. Actual results could differ from those estimates. The following is a summary of significant accounting policies followed by the Fund in the preparation of its financial statements:
| a. | Valuation of Investments |
Equity securities traded on a domestic securities exchange are valued at the last quoted sale price, or, lacking any sales, at the last quoted bid price. Over-the-counter securities are valued at the NASDAQ Official Closing Price, if one is available. Lacking any sales, over-the-counter securities are valued at the last quoted bid price. The Fund’s investments are generally valued based on market quotations provided by third-party pricing services approved by the Board of Trustees of the Fund. Under certain circumstances, the value of a Fund investment may be based on an evaluation of its fair value, pursuant to procedures established by and under the general supervision of the Board of Trustees of the Trust. The Fund may use the fair value of a portfolio security to calculate its NAV when, for example, (1) market quotations are not readily available because a portfolio security is not traded in a public market or the principal market in which the security trades is closed, (2) trading in a portfolio security is suspended and has not resumed prior to the time as of which the Fund calculates its NAV, (3) where a significant event affecting the value of a portfolio security is determined to have occurred between the time of the market quotation provided for a portfolio security and the time as of which the Fund calculates its NAV, (4) a security’s price has remained unchanged over a period of time (often referred to as a “stale price”), or (5) the Manager determines that a market quotation is inaccurate. An investment valued on the basis of an evaluation of its fair value may be valued at a price higher or lower than available market quotations. An investment’s valuation may differ depending on the method used and the factors considered in determining value pursuant to the Fund’s fair value procedures. The Investment Manager monitors intervening events that may affect the value of securities held in the Fund’s portfolio and, in accordance with procedures adopted by the Fund’s Trustees, will adjust the prices of securities traded in foreign markets, as appropriate, to reflect the impact of events occurring subsequent to the close of such markets but prior to the time the Fund’s NAV is calculated. Fixed-income securities are valued based on valuations furnished by independent pricing services that utilize matrix systems, which reflect such factors as security prices, yields, maturities and ratings, and are supplemented by dealer and exchange quotations. Short-term investments having a remaining maturity of 60 days or less are valued at amortized cost, which approximates market value. Investments in other regulated investment companies
17
Managers Fremont Institutional Micro-Cap Fund
Notes to Financial Statements (continued)
are valued at their end of day net asset value per share, except iShares or other ETF’s which are valued the same as equity securities. Securities (including derivatives) for which market quotations are not readily available are valued at fair value, as determined in good faith, and pursuant to procedures adopted by the Board of Trustees of the Trust. The values assigned to fair value investments are based on available information and do not necessarily represent amounts that might ultimately be realized, since such amounts depend on future developments inherent in long-term investments. Further, because of the inherent uncertainty of valuation, those estimated values may differ significantly from the values that would have been used had a ready market for the investments existed, and the differences could be material.
Security transactions are accounted for as of the trade date. Realized gains and losses on securities sold are determined on the basis of identified cost.
| c. | Investment Income and Expenses |
Dividend income is recorded on the ex-dividend date except certain dividends from foreign securities where the ex-dividend date may have passed. These dividends are recorded as soon as the Trust is informed of the ex-dividend date. Dividend income on foreign securities is recorded net of any withholding tax. Interest income, which includes amortization of premium and accretion of discount on debt securities, as required, is accrued as earned. Non-cash dividends included in dividend income, if any, are reported at the fair market value of the securities received. Other income and expenses are recorded on an accrual basis. Expenses that cannot be directly attributed to a fund are apportioned among the Funds in the Trust and in some cases other affiliated funds based upon their relative average net assets or number of shareholders.
The Fund may participate in a directed brokerage program where certain portfolio trades are directed to various brokers who pay a portion of the Fund’s expenses. For the fiscal year ended October 31, 2006 no trades were directed under this program.
In addition, the Fund has a “balance credit” arrangement with The Bank of New York (“BNY”), the Fund’s custodian, whereby the Fund is credited with an interest factor equal to 1% below the effective 90-day T-Bill rate for account balances left uninvested overnight. These credits serve to reduce custody expenses that would otherwise be charged to the Fund. For the fiscal year ended October 31, 2006, the custodian expense was reduced $64 under the BNY arrangement.
Managers Investment Group LLC (the “Investment Manager”), a subsidiary of Affiliated Managers Group, Inc. (“AMG”) and the Investment Manager for the Fund, has contractually agreed, through at least March 1, 2007, to waive fees and pay or reimburse expenses to the extent that the total annual operating expenses (exclusive of brokerage, interest, taxes and extraordinary expenses) of the Fund exceed 1.35% of the Fund’s average daily net assets.
The Fund may be obligated to repay the Investment Manager such amounts waived, paid or reimbursed in future years provided that the repayment occurs within three (3) years after the waiver or reimbursement and that such repayment would not cause the Fund’s expenses in any such year to exceed the previously stated percentages of that Fund’s average daily net assets. At October 31, 2006, the cumulative amount of expense reimbursement by the Manager subject to repayment by the Fund equaled $75,671.
18
Managers Fremont Institutional Micro-Cap Fund
Notes to Financial Statements (continued)
| d. | Dividends and Distributions |
Dividends resulting from net investment income and distributions of capital gains, if any, normally will be declared and paid annually in December and when required for Federal excise tax purposes. Dividends are recorded on the ex-dividend date. Income and capital gain distributions are determined in accordance with Federal income tax regulations, which may differ from generally accepted accounting principles. These differences are primarily due to differing treatments for losses deferred due to wash sales, equalization accounting for tax purposes, foreign currency and market discount transactions. Permanent book and tax basis differences, if any, relating to shareholder distributions will result in reclassifications to paid-in capital. The tax character of distributions paid during fiscal 2006 and 2005 were as follows:
| | | | | | |
| | | 2006 | | 2005 |
Distributions paid from: | | | | | | |
Ordinary income | | | — | | $ | 2,857 |
Short-term capital gains | | | — | | | 8,312,723 |
Long-term capital gains | | $ | 40,148,337 | | | 4,048,438 |
| | | | | | |
| | $ | 40,148,337 | | $ | 12,364,018 |
| | | | | | |
As of October 31, 2006, the components of distributable (excluding unrealized appreciation/depreciation) on a tax basis consisted of:
| | | |
| | | 2006 |
Capital loss carryforward | | | — |
Undistributed ordinary income | | | — |
Undistributed short-term capital gains | | $ | 738,757 |
Undistributed long-term capital gains | | | 20,560,760 |
| | | |
| | $ | 21,299,517 |
| | | |
The Fund intends to comply with the requirements under Subchapter M of the Internal Revenue Code of 1986, as amended, to distribute substantially all of its taxable income and gains to its shareholders and to meet certain diversification and income requirements with respect to investment companies. Therefore, no provision for Federal income or excise tax is included in the accompanying financial statements.
Additionally, based on the Fund’s understanding of the tax rules and rates related to income, gains and transactions for the foreign jurisdictions in which it invests, the Fund will provide for foreign taxes, and where appropriate, deferred foreign taxes.
| f. | Capital Loss Carryovers |
As of October 31, 2006, the Fund had no accumulated net realized capital loss carryover from securities transactions for Federal income tax purposes.
19
Managers Fremont Institutional Micro-Cap Fund
Notes to Financial Statements (continued)
The Trust’s Declaration of Trust authorizes for each series the issuance of an unlimited number of shares of beneficial interest, without par value. The Fund records sales and repurchases of its capital stock on the trade date. Dividends and distributions to shareholders are recorded on the ex-dividend date.
At October 31, 2006, certain unaffiliated shareholders, specifically omnibus accounts, individually held greater than 10% of the outstanding shares of the Fund as follows: two own collectively 71%. Transactions by these shareholders may have a material impact on the Fund.
| 2. | Agreements and Transactions with Affiliates |
The Trust has entered into an Investment Management Agreement under which the Investment Manager provides or oversees investment management services to the Fund. The Investment Manager selects subadvisors for the Fund (subject to Trustee approval) and monitors the subadvisor’s investment programs and results. The Fund’s investment portfolio is managed by a portfolio manager who serves pursuant to a Subadvisory Agreement with the Investment Manager.
Investment management fees are paid directly by the Fund to the Investment Manager based on average daily net assets. The annual investment management fee rate, as a percentage of average daily net assets for the fiscal year ended October 31, 2006, was 1.00%.
The Trust has entered into an Administration and Shareholder Servicing Agreement under which Managers Investment Group LLC serves as the Fund’s administrator (the “Administrator”) and is responsible for all aspects of managing the Fund’s operations, including administration and shareholder services to each Fund, its shareholders, and certain institutions, such as bank trust departments, broker-dealers and registered investment advisers, that advise or act as an intermediary with the Fund’s shareholders. For its services, the Administrator is paid a fee at the rate of 0.25% per annum. For the fiscal year ended October 31, 2006 the Fund paid administration fees of $707,084.
Prior to July 1, 2005, the aggregate annual retainer paid to each Independent Trustee for all Trusts in the Fund family was $52,000, plus $2,000 for each meeting attended. Effective July 1, 2005, the aggregate annual retainer paid to each Independent Trustee is $55,000, plus $4,000 for each meeting attended. The Trustees’ fees and expenses are allocated amongst all of the Funds for which Managers Investment Group LLC serves as the Investment Manager (the “Managers Funds”) based on the relative net assets of such Funds. Through March, 2006, the Trust had an additional Independent Trustee who was paid an annual retainer of $30,000 plus $4,000 for each meeting attended. The Independent Chairman of the Trusts receives an additional payment of $10,000 per year (prior to July 1, 2005, the Independent Chairman was paid an additional $5,000 per year). Effective July 1, 2005 the Audit Committee Chairperson receives an additional $2,000 per year. The “Trustee fees and expenses” shown in the financial statements amounting to $23,186 for the fiscal year ended October 31, 2006 represent the Fund’s allocated portion of the total fees and expenses paid by the Fund and other affiliated funds in the Managers Funds.
20
Managers Fremont Institutional Micro-Cap Fund
Notes to Financial Statements (continued)
The Fund is distributed by Managers Distributors, Inc. (“MDI”), a wholly-owned subsidiary of Managers Investment Group LLC. Certain Trustees and Officers of the Fund are Officers and/or Directors of the Investment Manager, AMG and/or MDI. MDI serves as the principal underwriter for the Fund. MDI is a registered broker-dealer and member of the National Association of Securities Dealers, Inc. Shares of the Fund will be continuously offered and will be sold by brokers, dealers or other financial intermediaries who have executed selling agreements with MDI. MDI bears all the expenses of providing services pursuant to an Underwriting Agreement, including the payment of the expenses relating to the distribution of Prospectuses for sales purposes and any advertising or sales literature.
| 3. | Purchases and Sales of Securities |
Purchases and sales of securities, excluding short-term securities, for the fiscal year ended October 31, 2006, were $201,372,761 and $287,217,626, respectively. There were no purchases or sales of U.S. Government securities.
| 4. | Portfolio Securities Loaned |
The Fund may participate in a securities lending program offered by BNY providing for the lending of equities, corporate bonds and government securities to qualified brokers. Collateral on all securities loaned is accepted in cash and/or government securities. Collateral is maintained at a minimum level of 102% of the market value, plus interest, if applicable, of investments on loan. Collateral received in the form of cash is invested temporarily in institutional money market funds or other short-term investments by BNY. Securities lending fees include earnings of such temporary cash investments, plus or minus any rebate to a borrower. These earnings (after any rebate) are then divided between BNY, as a fee for its services under the program, and the Fund according to agreed-upon rates.
| 5. | Commitments and Contingencies |
In the normal course of business, the Fund may enter into contracts and agreements that contain a variety of representations and warranties, which provide general indemnifications. The maximum exposure to the Fund under these arrangements is unknown, as this would involve future claims that may be against the Fund that have not yet occurred. However, based on experience, the Fund expects the risk of loss to be remote.
21
Managers Fremont Institutional Micro-Cap Fund
Notes to Financial Statements (continued)
| 6. | Transactions with Affiliated Companies |
An affiliated company is a company that is directly or indirectly controlled by a related party or a company in which a fund has ownership of at least 5% of the voting securities. Transactions during the fiscal year ended October 31, 2006, with companies which are or were affiliates are as follows:
SUMMARY OF TRANSACTIONS WITH AFFILIATED COMPANIES :
| | | | | | | | | | | | | | | | | | |
Affiliate | | Purchase
Cost | | Sales Cost | | Dividend Income | | Market Value | | Gains/
Losses | | | % Ownership of Affiliate | |
Northern Technologies International Corp. | | $ | 226,339 | | $ | 158,464 | | — | | $ | 1,956,050 | | $ | (41,559 | ) | | 5.7 | % |
Optibase Ltd | | | 1,021,063 | | | — | | — | | | 2,582,896 | | | — | | | 6.5 | % |
PDG Environmental, Inc. | | | 2,488,594 | | | — | | — | | | 1,310,500 | | | — | | | 6.4 | % |
TVI Corp. | | | 2,923,386 | | | 354,492 | | — | | | 5,139,195 | | | (195,403 | ) | | 5.3 | % |
| | | | | | | | | | | | | | | | | | |
Totals | | $ | 6,659,382 | | $ | 512,956 | | — | | $ | 10,988,641 | | $ | (236,962 | ) | | | |
| | | | | | | | | | | | | | | | | | |
| 7. | New Accounting Pronouncements |
The Financial Accounting Standards Board (“FASB”) has recently issued Interpretation No. 48, “Accounting for Uncertainty in Income Taxes - an Interpretation of FASB Statement No. 109 (the “Interpretation”), which applies to all registered investment companies and clarifies the accounting for uncertain tax positions. The Interpretation is effective for financial statements for fiscal years beginning after December 15, 2006. Management has not yet completed their analysis of the Interpretation, and is not currently in a position to estimate the significance, if any, that the impact of adoption will have on the financial statements.
In addition, in September 2006, Statement of Financial Accounting Standards No. 157, Fair Value Measurements (“SFAS 157”), was issued and is effective for fiscal years beginning after November 15, 2007. SFAS 157 defines fair value, establishes a framework for measuring fair value and expands disclosures about fair value measurements. Management is currently evaluating the impact, if any, the adoption of SFAS 157 will have on the Fund’s financial statements.
Tax Information (unaudited)
The Fund hereby designates the maximum amount allowable of its net taxable income as qualified dividends as provided in the Jobs and Growth Tax Relief Reconciliation Act of 2003. The 2006 Form 1099-DIV you receive for the Fund, will show the tax status of all distributions paid to you during the year.
Pursuant to section 852 of the Internal Revenue Code, the Fund designates $20,628,476 of long-term capital gain for the taxable year ended October 31, 2006.
22
Report of Independent Registered Public Accounting Firm
To the Board of Trustees of Managers Trust I and the Shareholders of
Managers Fremont Institutional Micro-Cap Fund:
In our opinion, the accompanying statement of assets and liabilities, including the schedule of portfolio investments and the related statements of operations and of changes in net assets and the financial highlights present fairly, in all material respects, the financial position of Managers Fremont Institutional Micro-Cap Fund (the “Fund”) at October 31, 2006, the results of its operations, the changes in its net assets and the financial highlights for the periods indicated, in conformity with accounting principles generally accepted in the United States of America. These financial statements and financial highlights (hereafter referred to as “financial statements”) are the responsibility of the Fund’s management; our responsibility is to express an opinion on these financial statements based on our audits. We conducted our audits of these financial statements in accordance with the standards of the Public Company Accounting Oversight Board (United States). Those standards require that we plan and perform the audit to obtain reasonable assurance about whether the financial statements are free of material misstatement. An audit includes examining, on a test basis, evidence supporting the amounts and disclosures in the financial statements, assessing the accounting principles used and significant estimates made by management, and evaluating the overall financial statement presentation. We believe that our audits, which included confirmation of securities at October 31, 2006 by correspondence with the custodian and brokers, provide a reasonable basis for our opinion.
PricewaterhouseCoopers LLP
Boston, Massachusetts
December 18, 2006
23
Trustees and Officers
The Trustees and Officers of the Trust, their business addresses, principal occupations for the past five years and dates of birth are listed below. The Trustees provide broad supervision over the affairs of the Trust and the Fund. The Trustees are experienced executives who meet periodically throughout the year to oversee the Fund’s activities, review contractual arrangements with companies that provide services to the Fund, and review the Fund’s performance. Unless otherwise noted, the address of each Trustee or Officer is the address of the Trust: 800 Connecticut Avenue, Norwalk, Connecticut 06854.
There is no stated term of office for Trustees. Trustees serve until their resignation, retirement or removal in accordance with the Trust’s organizational documents and policies adopted by the Board from time to time. The Chairman of the Trustees, President, Treasurer and Secretary of the Trust are elected by the Trustees annually. Other officers hold office at the pleasure of the Trustees.
Independent Trustees
The following Trustees are not “interested persons” of the Trust within the meaning of the 1940 Act:
| | |
Name, Date of Birth, Number of Funds
Overseen in Fund Complex* | | Principal Occupation(s) During Past 5 Years and Other Directorships Held by Trustee |
Jack W. Aber, 9/9/37 • Trustee since 2000 • Oversees 33 Funds in Fund Complex | | Professor of Finance, Boston University School of Management (1972- Present); Trustee of Appleton Growth Fund (1 portfolio); Trustee of Third Avenue Trust (4 portfolios); Trustee of Third Avenue Variable Trust (1 portfolio). |
| |
William E. Chapman, II, 9/23/41 • Independent Chairman • Trustee since 2000 • Oversees 33 Funds in Fund Complex | | President and Owner, Longboat Retirement Planning Solutions (1998-Present); Hewitt Associates, LLC (part time) (provider of Retirement and Investment Education Seminars); Interim Executive Vice President, QuadraMed Corporation (2001); President, Retirement Plans Group, Kemper Funds (1990-1998); Trustee of Bowdoin College (2002-Present); Trustee of Third Avenue Trust (4 portfolios); Trustee of Third Avenue Variable Trust (1 portfolio). |
| |
Edward J. Kaier, 9/23/45 • Trustee since 2000 • Oversees 33 Funds in Fund Complex | | Attorney at Law and Partner, Hepburn Willcox Hamilton & Putnam, LLP (1977-Present); Trustee of Third Avenue Trust (4 portfolios); Trustee of Third Avenue Variable Trust (1 portfolio). |
| |
Steven J. Paggioli, 4/3/50 • Trustee since 2000 • Oversees 33 Funds in Fund Complex | | Consultant (2001-Present); Formerly Executive Vice President and Director, The Wadsworth Group (1986-2001); Executive Vice President, Secretary and Director, Investment Company Administration, LLC (1990-2001); Vice President, Secretary and Director, First Fund Distributors, Inc. (1991-2001); Trustee, Professionally Managed Portfolios (22 portfolios); Advisory Board Member, Sustainable Growth Advisors, LP. |
24
Trustees and Officers (continued)
| | |
Name, Date of Birth, Number of Funds
Overseen in Fund Complex* | | Principal Occupation(s) During Past 5 Years and Other Directorships Held by Trustee |
Eric Rakowski, 6/5/58 • Trustee since 2000 • Oversees 33 Funds in Fund Complex | | Professor, University of California at Berkeley School of Law (1990- Present); Trustee of Third Avenue Trust (4 portfolios); Trustee of Third Avenue Variable Trust (1 portfolio). |
| |
Thomas R. Schneeweis, 5/10/47 • Trustee since 2000 • Oversees 33 Funds in Fund Complex | | Professor of Finance, University of Massachusetts (1985-Present); Director, CISDM at the University of Massachusetts, (1996-Present); President, Alternative Investment Analytics, LLC, (formerly Schneeweis Partners, LLC) (2001-Present); Director of Research, URSA Capital (subsidiaries: Lyra/Starview Capital LLC), (2004- Present); Partner, Northampton Capital Management, LLC; Partner, TRS Associates (Sole Proprietorship) and member of Massachusetts Finance Institute (wholly owned subsidiary of Alternative Investment Analytics). No other directorships held by Trustee. |
| * | The Fund Complex consists of Managers AMG Funds, The Managers Funds, Managers Trust I and Managers Trust II. |
Interested Trustees
The following Trustees are “interested persons” of the Trust within the meaning of the 1940 Act. Mr. Lebovitz is an interested person of the Trust within the meaning of the 1940 Act by virtue of his positions with Managers Investment Group LLC and Managers Distributors, Inc. Mr. Nutt is an interested person of the Trust within the meaning of the 1940 Act by virtue of his positions with, and interest in securities of, Affiliated Managers Group, Inc.
| | |
Name, Date of Birth, Number of
Funds Overseen in Fund Complex* | | Principal Occupation(s) During Past 5 Years and Other Directorships Held by Trustee |
Peter M. Lebovitz, 1/18/55 • Trustee since 2002 • President since 2000 • Oversees 33 Funds in Fund Complex | | Managing Partner, Managers Investment Group LLC (2005-Present); President and Chief Executive Officer, The Managers Funds LLC (1999-2004); President, Managers Distributors, Inc. (2000-2006), Vice President, Managers Distributors, Inc. (2006-Present); President, The Managers Funds (1999-Present); President, Managers AMG Funds (1999-Present); President, Managers Trust II (2000-Present); Director of Marketing, The Managers Funds, LP (1994-1999). No other directorships held by trustee. |
| |
William J. Nutt, 3/30/45 • Trustee since 2005 • Oversees 33 Funds in Fund Complex | | Chairman and Founder of Affiliated Managers Group, Inc., (1993- Present); Chief Executive Officer of Affiliated Managers Group, Inc. (1993-2004); Director, Affiliated Managers Group, Inc. (1993-Present); President of Affiliated Managers Group, Inc. (1993-1999); President and Chief Operating Officer, The Boston Company (1989-1993); Senior Executive Vice President, The Boston Company (1982-1989). |
| * | The Fund Complex consists of Managers AMG Funds, The Managers Funds, Managers Trust I and Managers Trust II. |
25
Trustees and Officers (continued)
Officers
| | |
Name, Date of Birth, Position(s) Held
with Fund and Length of Time Served | | Principal Occupation(s) During Past 5 Years |
Bruce M. Aronow, 5/31/65 • Chief Financial Officer since 2005 | | Managing Partner, Managers Investment Group LLC (2005-Present); Chief Financial Officer, The Managers Funds, Managers AMG Funds and Managers Trust II (2005-Present); Executive Vice President and Chief Financial Officer and Principal, Rorer Asset Management (1999- 2004); Chief Operating Officer, Rorer Asset Management (2001-2004); Staff Accountant, Manager and Partner, PricewaterhouseCoopers LLP (1987-1998). |
| |
Christine C. Carsman, 4/2/52 • Secretary since 2004 | | Vice President and Chief Regulatory Counsel, Affiliated Managers Group, Inc. (2004-Present); Secretary, The Managers Funds, Managers AMG Funds and Managers Trust II (2004-Present); Senior Counsel, Vice President and Director of Operational Risk Management and Compliance, Wellington Management Company, LLP (1995-2004); Deputy General Counsel, The Boston Company, Inc. (1993-1995); Associate General Counsel, The Boston Company Advisors, Inc. (1991- 1993); Associate, Sullivan & Worcester LLP (1987-1991). |
| |
Colin J. Dean, 3/6/77 • Assistant Secretary since 2006 | | Associate Counsel, Affiliated Managers Group, Inc. (2005-Present); Assistant Secretary, The Managers Funds, Managers AMG Funds and Managers Trust II (2006-Present); Associate, Dechert LLP (2002-2005). |
| |
Donald S. Rumery, 5/29/58 • Treasurer since 2000 | | Senior Vice-President, Managers Investment Group LLC (2005- Present); Director, Finance and Planning, The Managers Funds LLC, (1994-2004); Treasurer and Chief Financial Officer, Managers Distributors, Inc. (2000-Present); Treasurer, The Managers Funds (1995-Present); Treasurer, Managers AMG Funds (1999-Present); Treasurer, Managers Trust II (2000-Present); Secretary, Managers Trust I and Managers Trust II (2000-2004) and Secretary, The Managers Funds (1997-2004). |
26
Annual Renewal of Investment Advisory Agreements
On June 2, 2006, the Board of Trustees, including a majority of the Trustees who are not “interested persons” of the Trust (the “Independent Trustees”), approved the Investment Management Agreement with the Investment Manager for the Managers Fremont Institutional Micro-Cap Fund (the “Fund”) and the Subadvisory Agreement for the Subadvisor. The Independent Trustees were separately represented by independent counsel in connection with their consideration of the approval of these agreements. In considering the Investment Management and Subadvisory Agreements, the Trustees reviewed a variety of materials relating to the Fund, the Investment Manager and the Subadvisor, including comparative performance, fee and expense information for an appropriate peer group of similar mutual funds (the “Peer Group”), performance information for the relevant benchmark index (the “Fund Benchmark”) and other information regarding the nature, extent and quality of services provided by the Investment Manager and the Subadvisor under their respective agreements. The Trustees also took into account performance, fee and expense information regarding the Fund provided to them on a quarterly basis throughout the year. Prior to voting, the Independent Trustees: (a) reviewed the foregoing information with their independent legal counsel and with management; (b) received materials from their independent legal counsel discussing the legal standards applicable to their consideration of the Investment Management Agreement and the Subadvisory Agreement; and (c) met with their independent legal counsel in private sessions at which no representatives of management were present.
Nature, extent and quality of services.
In considering the nature, extent and quality of the services provided by the Investment Manager, the Trustees reviewed information relating to the Investment Manager’s operations and personnel. Among other things, the Investment Manager provided financial information, biographical information on its supervisory and professional staff and descriptions of its organizational and management structure. The Trustees also took into account information provided periodically throughout the previous year by the Investment Manager relating to the performance of its duties with respect to the Fund and the Trustees’ familiarity with the Investment Manager’s management through Board meetings, discussions and reports. In the course of their deliberations regarding the Investment Management Agreement, the Trustees evaluated, among other things: (a) the quality of the search, selection and monitoring services performed by the Investment Manager in overseeing the portfolio management responsibilities of the Subadvisor; (b) the Investment Manager’s ability to supervise the Fund’s other service providers; and (c) the Investment Manager’s compliance programs. The Trustees also took into account the financial condition of the Investment Manager with respect to its ability to provide the services required under the Investment Management Agreement and to maintain contractual expense limitations for the Fund.
The Trustees also reviewed information relating to the Subadvisor’s operations and personnel and the investment philosophy, strategies and techniques (the “Investment Strategy”) used in managing the Fund. Among other things, the Trustees reviewed biographical information on portfolio management and other professional staff, information regarding the Subadvisor’s organizational and management structure and the Subadvisor’s brokerage policies and practices. The Trustees considered specific information provided regarding the experience of the individuals at the Subadvisor with portfolio management
27
Annual Renewal of Investment Advisory Agreements (continued)
responsibility for the Fund, including the information set forth in the Fund’s prospectus and statement of additional information. In the course of their deliberations, the Trustees evaluated, among other things: (a) the services rendered by the Subadvisor in the past; (b) the qualifications and experience of the Subadvisor’s personnel; and (c) the Subadvisor’s compliance programs. The Trustees also took into account the financial condition of the Subadvisor with respect to its ability to provide the services required under the Subadvisory Agreement.
Performance.
Among other information relating to the Fund’s performance, the Trustees noted that the Fund’s performance for the 1-year, 3-year, 5-year and 10-year periods ended March 31, 2006 was below, below, above and above, respectively, the median performance of the Peer Group and the performance of the Fund Benchmark, which is the Russell 2000 Growth Index. The Trustees noted the longer-term performance of the Fund. They further noted management’s discussion of the Fund’s performance. The Trustees concluded that the Fund’s performance has been reasonable in light of all factors considered. The Trustees noted that the Investment Manager will continue to monitor the performance of the Subadvisor.
As noted above, the Board considered the Fund’s performance during relevant time periods as compared to the Fund’s Peer Group and noted that the Board reviews on a quarterly basis detailed information about the Fund’s performance results, portfolio composition and Investment Strategies. The Board noted the Investment Manager’s expertise and resources in monitoring the performance, investment style and risk adjusted performance of the Subadvisor. The Board also noted the Subadvisor’s performance record with respect to the Fund. The Board was mindful of the Investment Manager’s focus on the Subadvisor’s performance with respect to the Fund and the explanations of management regarding the factors that contributed to the performance of the Fund.
Advisory Fees and Profitability.
In considering the reasonableness of the advisory fee charged by the Investment Manager for managing the Fund, the Trustees noted that the Investment Manager, and not the Fund, is responsible for paying the fees charged by the Fund’s Subadvisor and, therefore, that the fees paid to the Investment Manager cover the reasonable cost of providing portfolio management services as well as the reasonable cost of providing search, selection and monitoring services in operating a “manager-of-managers” complex of mutual funds. The Trustees concluded that, in light of the additional high quality supervisory services provided by the Investment Manager and the fact that the subadvisory fees are paid out of the advisory fee, the advisory fee payable by the Fund to the Investment Manager can reasonably be expected to exceed the median advisory fee for the Peer Group, which consists mostly of funds that do not operate with a manager-of-managers structure.
In considering the reasonableness of the advisory fee payable to the Investment Manager, the Trustees also reviewed information provided by the Investment Manager setting forth all revenues and other benefits, both direct and indirect, received by the Investment Manager and its affiliates attributable to managing the Fund and all the mutual funds in the Managers Family of Funds, the cost of providing such services and the resulting profitability to the Investment Manager and its affiliates from these relationships. The Trustees also
28
Annual Renewal of Investment Advisory Agreements (continued)
noted the current and potential asset levels of the Fund and the willingness of the Investment Manager to waive fees and pay expenses for the Fund from time to time as a means of limiting the total expenses of the Fund. In this regard, the Trustees noted that, unlike the typical mutual fund that is managed by a single investment adviser, the Fund operates in a manager-of-managers structure and, as the Fund grows in size, it is common practice for the Investment Manager to recommend the selection of an additional Subadvisor to manage a portion of the Fund’s portfolio. The Trustees also noted that the subadvisory fees are paid by the Investment Manager out of its advisory fee. The Trustees further noted that, because of this practice, the Investment Manager’s oversight and supervisory responsibilities with respect to the Fund can be expected to increase with the size of the Fund. On this basis, the Trustees concluded that the profitability to the Investment Manager is reasonable and that the Investment Manager is not realizing material benefits from economies of scale that would warrant adjustments to the fees for the Fund at this time. With respect to economies of scale, the Trustees also noted that as the Fund’s assets increase over time, the Fund may realize other economies of scale to the extent that the increase in assets is proportionally greater than the increase in certain other expenses.
The Trustees noted that the Fund’s advisory fee and total expenses (net of applicable expense waivers/reimbursements) as of March 31, 2006 were higher and lower than the average, respectively, for the Peer Group and that the Investment Manager has contractually agreed through March 1, 2007 to limit the Fund’s net annual operating expenses to 1.35%. The Trustees concluded that, in light of the nature, extent and quality of the services provided by the Investment Manager and the Subadvisor, the Fund’s performance, the foregoing expense limitation and the considerations noted above with respect to the Subadvisor and the Investment Manager, the Fund’s advisory fees are reasonable.
Subadvisory Fees and Profitability.
In considering the reasonableness of the fee payable by the Investment Manager to the Subadvisor, the Trustees relied on the ability of the Investment Manager to negotiate the terms of the Subadvisory Agreement at arm’s length as part of the manager-of-managers structure, noting that the Subadvisor is not affiliated with the Investment Manager. In addition, the Trustees noted that the subadvisory fees are paid by the Investment Manager out of its advisory fee. Accordingly, the cost of services to be provided by the Subadvisor and the profitability to the Subadvisor of its relationship with the Fund were not material factors in the Trustees’ deliberations. For similar reasons, and based on the current size of the portion of the Fund managed by the Subadvisor, the Trustees concluded that any economies of scale being realized by the Subadvisor was not a material factor in the Trustees’ deliberations at this time.
* * * *
After consideration of the foregoing, the Trustees also reached the following conclusions regarding the Investment Management Agreement and the Subadvisory Agreement, in addition to those conclusions discussed above: (a) the Investment Manager and the Sub-advisor have demonstrated that they possess the capability and resources to perform the duties required of them under the Investment Management Agreement and the Subadvisory Agreement; (b) the Subadvisor’s Investment Strategy is appropriate for pursuing the Fund’s investment objectives; (c) the Subadvisor is reasonably likely to execute its Investment Strategy consistently over time; and (d) the Investment Manager and the Subadvisor maintain appropriate compliance programs.
29
Annual Renewal of Investment Advisory Agreements (continued)
Based on all of the above-mentioned factors and related conclusions, with no single factor or conclusion being determinative and with each Trustee not necessarily attributing the same weight to each factor, the Trustees concluded that approval of the Investment Management Agreement and the Subadvisory Agreement would be in the interests of the Fund and its shareholders. Accordingly, on June 2, 2006 the Trustees, including a majority of the Independent Trustees, voted to approve the Investment Management Agreement and the Subadvisory Agreement for the Fund’s Subadvisor.
30
Investment Manager and Administrator
Managers Investment Group LLC
800 Connecticut Avenue
Norwalk, Connecticut 06854
(203) 299-3500 or (800) 835-3879
Distributor
Managers Distributors, Inc.
800 Connecticut Avenue
Norwalk, Connecticut 06854
(203) 299-3500 or (800) 835-3879
Subadvisor
Kern Capital Management LLC
114 West 47th Street, 19th Floor
New York, New York 10036
Custodian
The Bank of New York
2 Hanson Place
Brooklyn, New York 11217
Legal Counsel
Ropes & Gray LLP
One International Place
Boston, Massachusetts 02110-2624
Transfer Agent
PFPC, Inc.
Attn: Managers
P.O. Box 9769
Providence, Rhode Island 02940
(800) 548-4539

| | | | |
| MANAGERSAND MANAGERS AMG EQUITY FUNDS | | MANAGERS BALANCED FUNDS |
EMERGING MARKETS EQUITY Rexiter Capital Management Limited ESSEX GROWTH ESSEX LARGE CAP GROWTH (Formerly known as Capital Appreciation) ESSEX SMALL/MICRO CAP GROWTH Essex Investment Management Co., LLC FQ TAX-MANAGED U.S. EQUITY FQ U.S. EQUITY First Quadrant, L.P. INSTITUTIONAL MICRO-CAP MICRO-CAP Kern Capital Management LLC INTERNATIONAL EQUITY Alliance Bernstein L.P. Lazard Asset Management, LLC Wellington Management Company, LLP MID-CAP Chicago Equity Partners, LLC REAL ESTATE SECURITIES Urdang Securities Management, Inc. | | RORER LARGE-CAP Rorer Asset Management, LLC SMALL CAP TIMESSQUARE MID CAP GROWTH TIMESSQUARE SMALL CAP GROWTH TimesSquare Capital Management, LLC SMALL COMPANY Epoch Investment Partners, Inc. Kalmar Investment Advisers, Inc. SPECIAL EQUITY Donald Smith & Co., Inc. Kern Capital Management LLC Skyline Asset Management, L.P. Smith Asset Management Group, LP Veredus Asset Management LLC Westport Asset Management, Inc. SYSTEMATIC VALUE Systematic Financial Management, L.P. VALUE Armstrong Shaw Associates Inc. Osprey Partners Investment Mgmt., LLC | | BALANCED Chicago Equity Partners, LLC Loomis, Sayles & Company L.P. GLOBAL 333 Global Advisers* Armstrong Shaw Associates Inc. Alliance Bernstein L.P. First Quadrant, L.P. Kern Capital Management LLC Northstar Capital Management, Inc. Wellington Management Company, LLP ALTERNATIVE FUNDS FQ GLOBAL ALTERNATIVES First Quadrant, L.P. MANAGERS FIXED INCOME FUNDS BOND (MANAGERS) FIXED INCOME GLOBAL BOND Loomis, Sayles & Company L.P. BOND (MANAGERS FREMONT) Pacific Investment Management Co. LLC CALIFORNIA INTERMEDIATE TAX-FREE Evergreen Investment Management Company, LLC HIGH YIELD J.P. Morgan Investment Management Inc. INTERMEDIATE DURATION GOVERNMENT SHORT DURATION GOVERNMENT Smith Breeden Associates, Inc. MONEY MARKET (MANAGERS) JPMorgan Investment Advisors Inc. MONEY MARKET (FREMONT) 333 Global Advisers* * A division of Managers Investment Group LLC |
This report is prepared for the Fund’s shareholders. It is authorized for distribution to prospective investors only when preceded or accompanied by an effective prospectus. To receive a free copy of the prospectus or Statement of Additional Information, which includes additional information about Fund Trustees, please contact us by calling 800.835.3879. Distributed by Managers Distributors, Inc., member NASD. A description of the policies and procedures the Fund uses to vote its proxies is available: (i) without charge, upon request, by calling 800.835.3879, or (ii) on the Securities and Exchange Commission’s (SEC) Web site at www.sec.gov. For information regarding the Fund’s proxy voting record for the 12-month period ended June 30, call 800.835.3879 or visit the SEC Web site at www.sec.gov. The Fund files its complete schedule of portfolio holdings with the SEC for the first and third quarters of each fiscal year on Form N-Q. The Fund’s Forms N-Q are available on the SEC’s website at www.sec.gov. A Fund’s Forms N-Q may be reviewed and copied at the SEC’s Public Reference Room in Washington, DC. Information on the operation of the Public Reference Room may be obtained by calling 1-800-SEC-0330. To review a complete list of the Fund’s portfolio holdings, or to view the most recent quarterly holdings report, semiannual report, or annual report, please visit www.managersinvest.com. | |
| www.managersinvest.com | |  |
ANNUAL REPORT
Managers Funds
October 31, 2006
| • | | Managers Fremont Micro-Cap Fund |

AR010a
Managers Fremont Micro-Cap Fund
Annual Report–October 31, 2006
| | |
TABLE OF CONTENTS | | Page |
LETTER TO SHAREHOLDERS | | 1 |
| |
ABOUT YOUR FUND’S EXPENSES | | 2 |
| |
PORTFOLIO MANAGER COMMENTS | | 3 |
| |
FUND SNAPSHOTS | | 8 |
Portfolio breakdown and top ten holdings at October 31, 2006 | | |
| |
SCHEDULE OF PORTFOLIO INVESTMENTS | | 9 |
| |
FINANCIAL STATEMENTS: | | |
| |
Statement of Assets and Liabilities | | 13 |
Fund balance sheet, net asset value (NAV) per share computation and cumulative undistributed amount | | |
| |
Statement of Operations | | 14 |
Detail of sources of income, Fund expenses, and realized and unrealized gains (losses) during the fiscal period | | |
| |
Statement of Changes in Net Assets | | 15 |
Detail of changes in Fund assets for the past two fiscal periods | | |
| |
FINANCIAL HIGHLIGHTS | | 16 |
Historical net asset values per share, distributions, total returns, expense ratios, turnover ratios and net assets | | |
| |
NOTES TO FINANCIAL STATEMENTS | | 17 |
Accounting and distribution policies, details of agreements and transactions with Fund management and affiliates, and descriptions of certain investment risks | | |
| |
REPORT OF INDEPENDENT REGISTERED PUBLIC ACCOUNTING FIRM | | 23 |
| |
TRUSTEES AND OFFICERS | | 24 |
| |
ANNUAL RENEWAL OF INVESTMENT ADVISORY AGREEMENTS | | 27 |
Nothing contained herein is to be considered an offer, sale or solicitation of an offer to buy shares of The Managers Funds or Managers AMG Funds. Such offering is made only by Prospectus, which includes details as to offering price and other material information.
Letter to Shareholders
Dear Fellow Shareholder:
The year 2006 has been volatile but rewarding for investors. Markets confronted new Federal Reserve leadership and accompanying communication style, commodity price increases, the end (at least for now) of interest rate hikes, and then a sharp decline in oil prices and a dramatic slowdown in the real estate market. Times like these challenge investors to remove emotion from decisions and remain disciplined with their long-term investment plans.
Regardless of market conditions, we at Managers maintain our focus on providing excellent, trusted, and rigorously monitored investment solutions across all major market segments and styles. We encourage our portfolio managers to take a long-term view and to invest accordingly. We strive to stay on track even when market volatility causes some investors concern.
Our overriding goal is to hire fund managers that can effectively manage assets in all types of market conditions. Toward this goal we maintain a team of skilled investment professionals focused solely on understanding the global capital markets and overseeing the managers in our Funds. We hire fund portfolio managers who excel over time, have a strong investment discipline, and stick to that discipline.
Regardless of market conditions, we at Managers maintain our focus on providing excellent, trusted, and rigorously monitored investment solutions across all major market segments and styles.
Our investment team oversees the Funds’ managers and portfolios every day so you don’t have to. Once you have selected Managers Funds as part of your asset allocation, you can be assured that we are monitoring that investment every day to help ensure it is delivering on its investment mandate.
As 2006 comes to a close, we begin to think about next year and beyond. The two things we believe will impact investment returns the most are the condition of the economy and the change to the political landscape this fall’s election brings. Obviously, these are only the headlines and there are many subtleties relating to each.
First, with regard to the health of the economy, the risk appears to be the leverage consumers have assumed through their exposure to the residential real estate market. The “house as cash machine” combined with the speculative investment in real estate has increased the economy’s exposure to any weakness in prices or excess supply of real estate. Both these factors seem to be in play. Aside from this risk, consumers and businesses seem to be in good financial shape with relatively healthy balance sheets.
Second, with regard to the changes in Washington D.C., much has and will be written regarding mid-term power shifts, the third year of a President’s term, tax policy and its relationship to growth, and the war in Iraq. Suffice it to say that there are many interesting challenges facing the financial markets, and managing an investment portfolio requires diligence, attention, and resources.
Each of us at Managers appreciates the trust you express in us by allowing us the privilege of investing some of your capital. We will do everything we can to continue to deserve your trust in the months and years ahead.
| | | | | | | | | | |
| | Respectfully, | | | | | | |
| | | | |
| | /s/ Peter M. Lebovitz | | | | | | /s/ Thomas G. Hoffman |
| | Peter M. Lebovitz President Managers Funds | | | | | | Thomas G. Hoffman Executive Vice President Chief Investment Officer Managers Investment Group LLC |
1
About Your Fund’s Expenses
As a shareholder of the Fund, you may incur two types of costs: (1) transaction costs, which may include sales charges (loads) on purchase payments; redemption fees; and exchange fees; and (2) ongoing costs, including management fees and other Fund expenses. This Fund incurs only ongoing costs. This example is intended to help you understand your ongoing costs (in dollars) of investing in the Fund and to compare these costs with the ongoing costs of investing in other mutual funds. The example is based on an investment of $1,000 invested at the beginning of the period and held for the entire period as indicated below.
Actual Expenses
The first line of the table below provides information about the actual account values and actual expenses. You may use the information in this line, together with the amount you invested, to estimate the expenses that you paid over the period. Simply divide your account value by $1,000 (for example, an $8,600 account value divided by $1,000 = 8.6), then multiply the result by the number in the first line under the heading entitled “Expenses Paid During Period” to estimate the expenses you paid on your account during this period.
Hypothetical Example for Comparison Purposes
The second line of the table below provides information about hypothetical account values and hypothetical expenses based on the Fund’s actual expense ratio and an assumed annual rate of return of 5% before expenses, which is not the Fund’s actual return. The hypothetical account values and expenses may not be used to estimate the actual ending account balance or expenses you paid for the period. You may use this information to compare the ongoing costs of investing in the Fund and other funds by comparing this 5% hypothetical example with the 5% hypothetical examples that appear in the shareholder reports of other funds.
Please note that the expenses shown in the table are meant to highlight your ongoing costs only and do not reflect any transactional costs, such as sales charges (loads), redemption fees, or exchange fees. Therefore, the second line of
the table is useful in comparing ongoing costs only, and will not help you determine the relative total costs of owning different funds.
| | | | | | | | | |
Six Months Ended October 31, 2006 | | Beginning
Account Value
5/1/2006 | | Ending Account Value
10/31/2006 | | Expenses Paid During
Period* |
Managers Fremont Micro-Cap Fund | | | | | | | | | |
Based on Actual Fund Return | | $ | 1,000 | | $ | 943 | | $ | 7.61 |
Based on Hypothetical 5% Annual Return | | $ | 1,000 | | $ | 1,017 | | $ | 7.91 |
| * | Expenses are equal to the Fund’s annualized expense ratio multiplied by the average account value over the period, multiplied by the number of days in the most recent fiscal half-year (184), then divided by 365. |
2
Managers Fremont Micro-Cap Fund
Portfolio Manager’s Comments
The Managers Fremont Micro-Cap Fund primarily invests in the stocks of U.S. micro-capitalization companies. These companies have market capitalizations that, at the time of initial purchase, place them among the smallest 5% of companies listed on U.S. stock markets. Normally, the Fund will invest at least 80% of its assets in U.S. micro-cap stocks. The Russell 2000 Growth Index is the benchmark for the Fund.
The Portfolio Manager
Kern Capital Management LLC
Kern Capital Management LLC (“KCM”), subadvisor for the Managers Fremont Micro-Cap Fund, was founded in 1997 by Robert (Bob) E. Kern, Jr. and David G. Kern. KCM is an employee owned investment advisory firm dedicated to researching and investing in innovative micro-cap and small-cap growth companies.
KCM believes the U.S. smaller company stock universe provides the opportunity to invest in innovative companies with exceptional growth prospects. With minimal research coverage by brokerage firms and low institutional ownership, KCM believes small- and micro-cap stocks represent the least efficient sector of the market and its investment process is designed to capitalize on this inefficiency.
KCM’s fundamental research is dedicated to uncovering innovative small companies early in their growth cycle while they are still relatively undiscovered. With a huge universe of investment opportunity, KCM’s investment process focuses on the most innovative sectors in the U.S. economy (technology, health care, services, and consumer sectors). Research specialization by economic sector provides the depth of knowledge necessary to make high quality investment decisions and minimize fundamental investment mistakes.
KCM builds portfolios one company at a time. The team’s hands-on approach to fundamental investment research and financial analysis seeks to answer three basic questions to determine an investment’s attractiveness.
| | • | | How attractive is the business? Companies that are pioneering new markets or revolutionizing existing ones can often sustain rapid growth as they establish leading positions in their targeted markets. |
| | • | | How strong is the management? Successful companies require management capable of capitalizing on attractive growth opportunities. Management’s vision and ability to execute the business plan represent key elements in determining how successful a company will be. |
| | • | | How much is the company worth? The team’s process is valuation sensitive. Depending on the economic sector, different criteria are used to determine a company’s enterprise value, which determines if KCM would buy the entire company at the current market value of its equity. |
Given that KCM is focused on investing in innovative growth companies, the first two questions are answered before determining if the valuation is attractive. In fact, the answers to the first two questions will help determine the appropriate valuation for the company.
3
Managers Fremont Micro-Cap Fund
Portfolio Manager’s Comments (continued)
The ideal company exhibits many of the following traits:
| | • | | Leading market position in a rapidly growing market with high barriers to entry |
| | • | | Entrepreneurial management team with experience managing a growth business |
| | • | | Focused business plan with tight internal controls |
The portfolio management process includes:
| | • | | Investing in between 70 and 90 companies which have market capitalizations that, at the time of initial purchase, place them among the smallest 5% of companies listed in the U.S. stock markets |
| | • | | Building portfolios from the bottom up and seeks to identify companies early in their growth cycle |
| | • | | Utilizing a team approach to cover approximately 600 stocks through an extensive network of contact and other information sources: |
| | • | | Brokerage firm and industry analysts |
| | • | | Corporate management contacts |
| | • | | Trade shows and trade journals |
| | • | | Focusing on business sectors where KCM believes the level of innovation is greatest, such as technology, health care, services and consumer |
| | • | | Using fundamental analysis to identify small, relatively unknown companies that exhibit the potential to become much larger and more successful |
| | • | | Meeting with corporate management to discuss business plans and strategies |
The investment team will make a sell decision when:
| | • | | An investment’s growth prospects deteriorate |
| | • | | Investments achieve excessive valuation relative to the growth opportunities and/or addressable markets. |
| | • | | There is a negative change in fundamental confidence and/or investment time horizon |
The Year in Review
Fiscal 2006 was a period when strong performance by the large-cap and small-cap stock market indexes produced high double-digit rates of return; e.g., the small-cap Russell 2000 Growth Index gained 17.1% compared with an increase of 16.3% by the large-cap S&P 500 Index. During this period, the Managers Fremont Micro-Cap Fund increased 16.3%. Performance during the last three months of the fiscal year made a significant contribution to the Fund’s annual return, and represented almost 50% of the year’s net appreciation. Renewed interest in the technology sector, which has been driven partially by falling oil prices and the search by investors to find alternative investment opportunities in other sectors, benefited the Fund’s large portfolio weighting in technology companies.
4
Managers Fremont Micro-Cap Fund
Portfolio Manager’s Comments (continued)
The Fund’s performance can also be analyzed by economic sector and the market capitalization of the portfolio companies. Kern Capital Management invests in innovative small-cap and micro-cap growth companies and focuses its fundamental approach to investment research on the most innovative sectors in the U.S. economy – technology, health care, services, and consumer. Each of these sectors made positive contributions to the Fund’s return with technology stocks representing approximately two-thirds of the total return and outperforming technology stocks in the Russell 2000 Growth Index by over 700 basis points. The Fund’s second most heavily weighted sector, health care, underperformed the benchmark primarily due to losses in several biotechnology investments.
Based upon market capitalization, the Micro-Cap Fund’s weighted average of $502 million was significantly less than the approximately $1.2 billion for the Russell 2000 Growth Index on 10/31/06. Overall, fiscal 2006 was a year which did not favor the smallest growth companies – performance of the bottom two quintiles of the Russell 2000 Growth Index ranged between +10-13% while the top three quintiles ranged between +16-21%. Although this divergence made it more challenging for the Fund, stock selection among technology companies and the consumer discretionary sector made a significant contribution to fiscal year performance.
Within the micro-cap universe, individual stock selection represents one of the best opportunities for investors to achieve high rates of return. During fiscal 2006, the top three contributors to appreciation were: Equinix, Identix, and Gymboree. The three largest losses were: Terayon Communications, NeoPharm, and Cash Systems. Based upon investments which accounted for the ten largest gains and losses during the year, gains exceeded losses by a ratio of 1.9 to 1.0.
The focus of KCM’s investment team on innovative small-cap and micro-cap growth companies, and the search for the most attractive investment opportunities, led to the addition of investment research resources during the past year. These resources are primarily focused on the service sector and the successful implementation of this planned change has been reflected in the portfolio weighting of service companies increasing from 14% at the beginning of fiscal 2006 to 23% on 10/31/06. Importantly, service companies accounted for slightly over 25% of the Fund’s appreciation in fiscal 2006.
The Fund’s portfolio structure reflects a high portfolio weighting in technology companies that was maintained throughout the year. Although this strategy had a negative impact on performance during the May to mid-July timeframe, a strong finish to the year provided a return which was similar to the Fund’s performance. Also, the consumer discretionary sector is believed to offer fewer innovative growth opportunities, especially in the traditional retail and restaurant segments. This change, and concerns about the negative impact of high energy costs, higher interest rates and declining home prices during the past year, was reflected in single-digit portfolio weightings in the consumer discretionary sector throughout fiscal 2006.
5
Managers Fremont Micro-Cap Fund
Portfolio Manager’s Comments (continued)
The stock market rally, which began in July, was triggered by the Federal Reserve’s decision not to raise interest rates in August and a sharp drop in the price of oil. These positive developments more than offset investor concerns surrounding the decline in homebuilding and the beginning of an economic slowdown. Slowing economic growth is expected to cause growth stock investors to focus on companies which have the potential to continue to achieve high rates of growth, e.g., innovative technology companies that participate in high secular growth trends or niche companies with a strong new product cycle. In addition, it is anticipated that investors will favor companies which have limited exposure to an economic slowdown, e.g., select health care and service companies.
Looking Forward
Longer-term, the Fund has achieved high absolute rates of return and significantly outperformed the Russell 2000 Growth Index. For the ten year period ended 10/31/06, the Managers Fremont Micro-Cap Fund’s average annual total return was 12.7%. The comparable return for the Russell 2000 Growth Index was 5.2%.
These results reflect a time-tested approach of successfully investing in micro-cap growth companies and an investment team with long-term experience investing in this specialized sector of the equities market. Among all asset classes, we believe investing in micro-cap growth stocks represents one of the best opportunities for investors to achieve high, long-term, absolute rates of return.
Cumulative Total Return Performance
Managers Fremont Micro-Cap Fund’s cumulative total return is based on the daily change in net asset value (NAV), and assumes that all distributions were reinvested. The Russell 2000 Growth Index measures the performance of those Russell 2000 companies with higher price-to-book ratios and higher forecasted growth values. This chart compares a hypothetical $10,000 investment made in the Managers Fremont Micro-Cap Fund on 10/31/96 to a $10,000 investment made in the Russell 2000 Growth Index for the same time period. The graph and table do not reflect the deduction of taxes that a shareholder would pay on a Fund distribution or redemption of shares. Past performance is not indicative of future results.
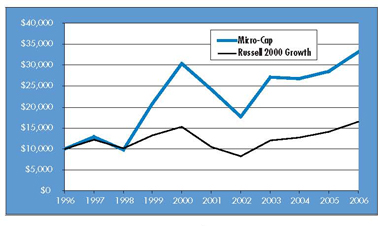
6
Managers Fremont Micro-Cap Fund
Portfolio Manager’s Comments (continued)
The table below shows the average annualized total returns for the Managers Fremont Micro-Cap Fund and the Russell 2000 Growth Index for the one-year, five-year and ten-year periods ending October 31, 2006.
| | | | | | | | | |
AVERAGE ANNUAL TOTAL RETURNS: | | One Year | | | Five Years | | | Ten Years | |
Managers Fremont Micro-Cap | | 16.29 | % | | 6.45 | % | | 12.72 | % |
Russell 2000 Growth Index | | 17.07 | % | | 9.51 | % | | 5.15 | % |
The performance data shown represents past performance. Past performance is not a guarantee of future results. Current performance may be lower or higher than the performance data quoted. The investment return and the principal value of an investment will fluctuate so that an investor’s shares, when redeemed, may be worth more or less than their original cost. For performance information through the most recent month end please call (800) 835-3879 or visit our Web site at www.managersinvest.com.
The returns shown were achieved during a period of generally rising market values, especially in the technology sector. In addition, a portion of the Fund’s performance can be attributed to investments in Initial Public Offerings (IPOs). Investors should not expect that such favorable returns can be consistently achieved.
The Fund is subject to risks associated with investments in small-capitalization companies, such as erratic earnings patterns, competitive conditions, limited earnings history, and a reliance on one or a limited number of products.
7
Managers Fremont Micro-Cap Fund
Fund Snapshots
October 31, 2006
Portfolio Breakdown
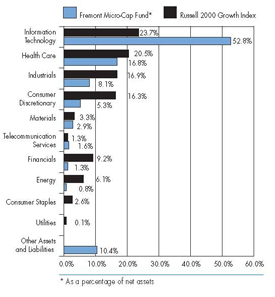
| | | | | | |
Industry | | Managers Fremont Micro Cap* | | | Russell 2000 Growth | |
Information Technology | | 52.8 | % | | 23.7 | % |
Health Care | | 16.8 | % | | 20.5 | % |
Industrials | | 8.1 | % | | 16.9 | % |
Consumer Discretionary | | 5.3 | % | | 16.3 | % |
Materials | | 2.9 | % | | 3.3 | % |
Telecommunication Services | | 1.6 | % | | 1.3 | % |
Financials | | 1.3 | % | | 9.2 | % |
Energy | | 0.8 | % | | 6.1 | % |
Consumer Staples | | 0.0 | % | | 2.6 | % |
Utilities | | 0.0 | % | | 0.1 | % |
Other Assets and Liabilities | | 10.4 | % | | 0.0 | % |
Top Ten Holdings
| | | |
Security Name | | Percentage of Net Assets | |
Equinix, Inc.* | | 5.0 | % |
ATMI, Inc.* | | 4.3 | |
FEI Co. | | 3.2 | |
AudioCodes, Ltd.* | | 2.7 | |
Conceptus, Inc. | | 2.5 | |
Omnicell, Inc. | | 2.5 | |
Regeneration Technologies, Inc.* | | 2.4 | |
Power Integrations, Inc. | | 2.3 | |
Eclipsys Corp. | | 2.1 | |
TVI Corp. | | 2.0 | |
| | | |
Top Ten as a Group | | 29.0 | % |
| | | |
| * | Top Ten Holding at April 30, 2006. |
Any sectors, industries, or securities discussed should not be perceived as investment recommendations. Mention of a specific security should not be considered a recommendation to buy or solicitation to sell that security.
8
Managers Fremont Micro-Cap Fund
Schedule of Portfolio Investments
October 31, 2006
| | | | | | |
| | | Shares | | | Value |
Common Stocks - 89.6% | | | | | | |
Consumer Discretionary - 5.3% | | | | | | |
AT Cross Cl A* | | 58,500 | | | $ | 402,480 |
Century Casinos, Inc.* | | 339,500 | | | | 3,507,035 |
dELiA*s Corp.* | | 121,601 | | | | 1,104,137 |
Harris Interactive, Inc.* | | 550,200 | | | | 3,675,336 |
IMAX Corp. | | 488,400 | 1 | | | 2,388,276 |
Lakes Gaming, Inc.* | | 195,700 | | | | 2,223,152 |
Nevada Gold & Casinos, Inc.* | | 271,900 | | | | 1,479,136 |
Scopus Video Neworks, Ltd. | | 359,000 | 1 | | | 1,364,200 |
Total Consumer Discretionary | | | | | | 16,143,752 |
Energy - 0.8% | | | | | | |
SulphCo, Inc.* | | 440,800 | 1 | | | 2,411,176 |
Financials - 1.3% | | | | | | |
Cash Systems, Inc.* | | 636,438 | | | | 3,786,806 |
Health Care - 16.8% | | | | | | |
AngioDynamics, Inc.* | | 172,600 | | | | 3,736,790 |
Cardica, Inc.* | | 130,600 | | | | 564,192 |
Cepheid, Inc.* | | 286,700 | | | | 2,353,807 |
Conceptus, Inc.* | | 378,900 | | | | 7,509,798 |
Cyberonics, Inc.* | | 94,800 | | | | 1,709,244 |
Eclipsys Corp.* | | 295,200 | | | | 6,255,288 |
Harvard Bioscience, Inc.* | | 473,900 | | | | 2,421,629 |
ICON PLC. | | 86,500 | | | | 3,103,620 |
NeoPharm, Inc.* | | 791,170 | 1 | | | 5,728,071 |
NxStage Medical, Inc.* | | 148,000 | | | | 1,084,840 |
Omnicell, Inc.* | | 397,400 | | | | 7,443,302 |
Regeneration Technologies, Inc.* | | 1,138,300 | | | | 7,250,971 |
Vital Images, Inc.* | | 63,200 | | | | 1,961,728 |
Total Health Care | | | | | | 51,123,280 |
Industrials - 8.1% | | | | | | |
Coinstar Inc* | | 40,200 | | | | 1,221,276 |
Flow International Corp.* | | 335,800 | | | | 3,955,724 |
The accompanying notes are an integral part of these financial statements.
9
Managers Fremont Micro-Cap Fund
Schedule of Portfolio Investments (continued)
| | | | | | |
| | | Shares | | | Value |
Industrials (continued) | | | | | | |
Fuel Tech, Inc. | | 39,900 | | | $ | 784,035 |
Global Traffic Network, Inc.* | | 612,700 | | | | 3,045,119 |
InnerWorkings, Inc.* | | 122,400 | | | | 1,829,880 |
Insituform Technologies, Inc.* | | 31,500 | | | | 736,155 |
KVH Industries, Inc.* | | 157,100 | | | | 1,715,532 |
PDG Environmental, Inc. * 4 | | 1,524,100 | 1 | | | 1,524,100 |
Powell Industries, Inc.* | | 161,200 | | | | 3,863,964 |
TVI Corp.* 4 | | 2,026,000 | | | | 5,976,700 |
Total Industrials | | | | | | 24,652,485 |
Information Technology - 52.8% | | | | | | |
Acacia Research Corp.* | | 128,500 | | | | 1,642,230 |
Access Integrated Technologies, Inc.* | | 152,600 | | | | 1,623,664 |
Airspan Networks, Inc.* | | 1,131,000 | 1 | | | 3,336,450 |
Aladdin Knowledge Systems, Ltd.* | | 111,400 | | | | 1,989,604 |
Anaren Microwave, Inc.* | | 205,200 | | | | 4,126,573 |
Astro-Med, Inc. | | 233,696 | | | | 2,374,351 |
ATMI, Inc.* | | 411,500 | | | | 13,040,435 |
AudioCodes, Ltd. | | 750,300 | | | | 8,313,324 |
Bottomline Technologies, Inc.* | | 88,000 | | | | 851,840 |
CalAmp Corp.* | | 593,100 | | | | 3,944,115 |
Ceragon Networks, Ltd. | | 630,300 | | | | 3,397,317 |
CommVault Systems, Inc.* | | 97,500 | | | | 1,742,325 |
Eagle Test Systems, Inc.* | | 105,900 | | | | 1,863,840 |
eCollege.com* | | 283,800 | | | | 4,909,740 |
EDGAR Online, Inc.* | | 455,000 | 1 | | | 1,647,100 |
EMCORE Corp.* | | 397,400 | | | | 2,285,050 |
Equinix, Inc.* | | 223,200 | 1 | | | 15,266,880 |
Exfo Electro-Optical Engineering, Inc. | | 1,119,200 | | | | 5,517,656 |
FEI Co.* | | 418,300 | | | | 9,562,338 |
Identity Solutions, Inc.* | | 196,469 | | | | 2,811,471 |
Internap Network Services Corp.* | | 249,660 | | | | 4,114,397 |
Lightbridge, Inc.* | | 214,800 | | | | 2,483,088 |
The accompanying notes are an integral part of these financial statements.
10
Managers Fremont Micro-Cap Fund
Schedule of Portfolio Investments (continued)
| | | | | | |
| | | Shares | | | Value |
Information Technology (continued) | | | | | | |
NCI, Inc., Class A* | | 195,300 | | | $ | 2,267,433 |
Omniture, Inc.* | | 116,400 | | | | 1,056,912 |
Online Resources Corp.* | | 323,100 | | | | 3,379,626 |
Openwave Systems, Inc.* | | 227,200 | | | | 1,960,736 |
OPNET Technologies, Inc.* | | 208,700 | | | | 3,051,194 |
Optibase Ltd. 4 | | 1,091,600 | | | | 3,231,136 |
Optical Communication Products, Inc.* | | 1,283,000 | | | | 2,758,450 |
Pericom Semiconductor Corp* | | 128,600 | | | | 1,235,846 |
Photon Dynamics, Inc.* | | 293,000 | | | | 3,477,910 |
Power Integrations, Inc.* | | 321,600 | | | | 7,055,904 |
Rae Systems, Inc.* | | 409,900 | | | | 1,582,214 |
RightNow Technologies, Inc.* | | 21,100 | | | | 348,572 |
Rudolph Technologies, Inc.* | | 113,700 | | | | 2,007,942 |
Silicon Motion Technology Corp., ADR | | 96,300 | | | | 1,480,131 |
Simpletech, Inc.* | | 381,100 | | | | 3,300,326 |
SRS Labs, Inc.* | | 585,149 | | | | 3,692,290 |
Standard Microsystems Corp.* | | 76,200 | | | | 2,349,246 |
Stanley, Inc.* | | 97,400 | | | | 1,696,708 |
Stratasys, Inc.* | | 91,000 | | | | 2,537,080 |
Techwell, Inc.* | | 339,200 | | | | 5,125,312 |
TeleCommunication Systems, Inc.* | | 829,400 | 1 | | | 2,695,550 |
Terayon Communication Systems, Inc.* | | 3,201,600 | | | | 4,930,464 |
The Knot, Inc.* | | 93,175 | | | | 2,233,405 |
Total Information Technology | | | | | | 160,298,175 |
Materials - 2.9% | | | | | | |
Calgon Carbon Corp.* | | 609,100 | | | | 2,814,042 |
Northern Technologies International Corp.* 4 | | 258,350 | | | | 2,454,325 |
Symyx Technologies, Inc.* | | 143,800 | | | | 3,530,290 |
Total Materials | | | | | | 8,798,657 |
Telecommunication Services - 1.6% | | | | | | |
Cogent Communications Group, Inc.* | | 335,200 | | | | 4,746,432 |
Total Common Stocks (cost $242,962,986) | | | | | | 271,960,763 |
The accompanying notes are an integral part of these financial statements.
11
Managers Fremont Micro-Cap Fund
Schedule of Portfolio Investments (continued)
| | | | | | |
| | | Shares | | Value | |
Other Investment Companies - 15.1% 2 | | | | | | |
Bank of New York Institutional Cash Reserves Fund, 5.32% 3 | | 16,684,463 | | $ | 16,684,463 | |
JPMorgan Prime Money Market Fund, Institutional Class Shares, 5.18% | | 26,388,746 | | | 26,388,746 | |
Vanguard Prime Money Market Fund, Institutional Class Shares, 5.30% | | 2,848,924 | | | 2,848,924 | |
Total Other Investment Companies (cost $45,922,133) | | | | | 45,922,133 | |
Total Investments - 104.7% (cost $288,885,119) | | | | | 317,882,896 | |
Other Assets, less Liabilities - (4.7%) | | | | | (14,408,852 | ) |
Net Assets - 100.0% | | | | $ | 303,474,044 | |
Note: Based on the cost of investments of $293,328,173 for Federal income tax purposes at October 31, 2006, the aggregate gross unrealized appreciation and depreciation were $48,531,711 and $23,976,988, respectively, resulting in net unrealized appreciation of investments of $24,554,723.
| * | Non-income-producing securities. |
| 1 | Some or all of these shares, amounting to a market value of $16,016,389, or 5.3% of net assets, were out on loan to various brokers. |
| 2 | Yield shown for an investment company represents the October 31, 2006, seven-day average yield, which refers to the sum of the previous seven days’ dividends paid, expressed as an annual percentage. |
| 3 | Collateral received from brokers for securities lending was invested in this short-term investment. |
| 4 | Affiliated Company - See Note 6 in the Notes to Financial Statements. |
The accompanying notes are an integral part of these financial statements.
12
Managers Fremont Micro-Cap Fund
Statement of Assets and Liabilities
October 31, 2006
| | | | |
Assets: | | | | |
Investments at value (including securities on loan valued at $16,016,389) | | $ | 317,882,896 | |
Receivable for investments sold | | | 7,352,234 | |
Receivable for Fund shares sold | | | 49,698 | |
Dividends and other receivables | | | 120,443 | |
Prepaid expenses | | | 12,668 | |
| | | | |
Total assets | | | 325,417,939 | |
| | | | |
Liabilities: | | | | |
Payable to Custodian | | | 579,950 | |
Payable for Fund shares repurchased | | | 335,540 | |
Payable upon return of securities loaned | | | 16,684,463 | |
Payable for investments purchased | | | 3,807,783 | |
Accrued expenses: | | | | |
Investment advisory and management fees | | | 256,998 | |
Administrative fees | | | 64,249 | |
Other | | | 214,912 | |
| | | | |
Total liabilities | | | 21,943,895 | |
| | | | |
Net Assets | | $ | 303,474,044 | |
| | | | |
Shares outstanding | | | 8,802,276 | |
| | | | |
Net asset value, offering and redemption price per share | | $ | 34.48 | |
| | | | |
Net Assets Represent: | | | | |
Paid-in capital | | $ | 292,861,788 | |
Accumulated net realized loss from investments | | | (18,385,521 | ) |
Net unrealized appreciation of investments | | | 28,997,777 | |
| | | | |
Net Assets | | $ | 303,474,044 | |
| | | | |
Investments at cost | | $ | 288,885,119 | |
The accompanying notes are an integral part of these financial statements.
13
Managers Fremont Micro-Cap Fund
Statement of Operations
For the fiscal year ended October 31, 2006
| | | | |
Investment Income: | | | | |
Dividend income | | $ | 1,812,306 | |
Securities lending fees | | | 1,042,366 | |
| | | | |
Total investment income | | | 2,854,672 | |
| | | | |
Expenses: | | | | |
Investment management fees | | | 3,822,060 | |
Administrative fees | | | 955,515 | |
Transfer agent | | | 784,375 | |
Custodian | | | 89,693 | |
Professional fees | | | 78,616 | |
Reports to shareholders | | | 68,004 | |
Trustees fees and expenses | | | 28,120 | |
Registration fees | | | 22,621 | |
Insurance | | | 16,558 | |
Miscellaneous | | | 4,923 | |
| | | | |
Total expenses before offsets | | | 5,870,485 | |
| | | | |
Expense reductions | | | (202 | ) |
| | | | |
Net expenses | | | 5,870,283 | |
| | | | |
Net investment loss | | | (3,015,611 | ) |
| | | | |
Net Realized and Unrealized Gain (Loss): | | | | |
Net realized gain on investment transactions | | | 20,083,106 | |
Net unrealized appreciation of investments | | | 36,118,248 | |
| | | | |
Net realized and unrealized gain | | | 56,201,354 | |
| | | | |
Net Increase in Net Assets Resulting from Operations | | $ | 53,185,743 | |
| | | | |
The accompanying notes are an integral part of these financial statements.
14
Managers Fremont Micro-Cap Fund
Statement of Changes in Net Assets
For the fiscal year ended October 31,
| | | | | | | | |
| | | 2006 | | | 2005 | |
Increase (Decrease) in Net Assets From Operations: | | | | | | | | |
Net investment loss | | $ | (3,015,611 | ) | | $ | (5,135,393 | ) |
Net realized gain on investments | | | 20,083,106 | | | | 65,151,923 | |
Net unrealized appreciation (depreciation) of investments | | | 36,118,248 | | | | (25,791,471 | ) |
| | | | | | | | |
Net increase in net assets resulting from operations | | | 53,185,743 | | | | 34,225,059 | |
| | | | | | | | |
From Capital Share Transactions: | | | | | | | | |
Proceeds from sale of shares | | | 21,520,857 | | | | 42,000,900 | |
Cost of shares repurchased | | | (168,861,323 | ) | | | (169,124,192 | ) |
| | | | | | | | |
Net decrease from capital share transactions | | | (147,340,466 | ) | | | (127,123,292 | ) |
| | | | | | | | |
Total increase (decrease) in net assets | | | (94,154,723 | ) | | | (92,898,233 | ) |
| | | | | | | | |
Net Assets: | | | | | | | | |
Beginning of year | | | 397,628,767 | | | | 490,527,000 | |
| | | | | | | | |
End of year | | $ | 303,474,044 | | | $ | 397,628,767 | |
| | | | | | | | |
End of year undistributed net investment loss | | | — | | | | — | |
| | | | | | | | |
Share Transactions: | | | | | | | | |
Sale of shares | | | 643,893 | | | | 1,633,719 | |
Shares repurchased | | | (5,253,627 | ) | | | (5,826,551 | ) |
| | | | | | | | |
Net decrease in shares | | | (4,609,734 | ) | | | (4,192,832 | ) |
| | | | | | | | |
The accompanying notes are an integral part of these financial statements.
15
Managers Fremont Micro-Cap Fund
Financial Highlights
For a share outstanding throughout each fiscal year
| | | | | | | | | | | | | | | | | | | | |
| | | For the fiscal year ended October 31, | |
| | | 2006 | | | 2005 | | | 2004 | | | 2003 | | | 2002 | |
Net Asset Value, Beginning of Year | | $ | 29.65 | | | $ | 27.86 | | | $ | 28.14 | | | $ | 18.43 | | | $ | 25.22 | |
| | | | | | | | | | | | | | | | | | | | |
Income from Investment Operations: | | | | | | | | | | | | | | | | | | | | |
Net investment loss | | | (0.26 | )3 | | | (0.38 | ) | | | (0.44 | ) | | | (0.33 | ) | | | (0.35 | ) |
Net realized and unrealized gain (loss) on investments | | | 5.09 | | | | 2.17 | | | | 0.16 | | | | 10.04 | | | | (6.44 | ) |
| | | | | | | | | | | | | | | | | | | | |
Total from investment operations | | | 4.83 | | | | 1.79 | | | | (0.28 | ) | | | 9.71 | | | | (6.79 | ) |
| | | | | | | | | | | | | | | | | | | | |
Net Asset Value End of Year | | $ | 34.48 | | | $ | 29.65 | | | $ | 27.86 | | | $ | 28.14 | | | $ | 18.43 | |
| | | | | | | | | | | | | | | | | | | | |
Total Return 1 | | | 16.29 | % | | | 6.42 | % | | | (1.00 | )% | | | 52.69 | % | | | (26.92 | )% |
| | | | | | | | | | | | | | | | | | | | |
Ratio of net operating expenses to average net assets | | | 1.54 | %2 | | | 1.56 | %2 | | | 1.62 | % | | | 1.64 | % | | | 1.61 | % |
Ratio of net investment loss to average net assets 1 | | | (0.79 | )% | | | (1.11 | )% | | | (1.41 | )% | | | (1.47 | )% | | | (1.33 | )% |
Portfolio turnover | | | 82 | % | | | 68 | % | | | 83 | % | | | 105 | % | | | 68 | % |
Net assets at end of year (000’s omitted) | | $ | 303,474 | | | $ | 397,629 | | | $ | 490,527 | | | $ | 573,677 | | | $ | 401,068 | |
| | | | | | | | | | | | | | | | | | | | |
| 1 | Total returns and net investment income would have been lower had certain expenses not been reduced. |
| 2 | After expense offsets. (See Note 1(c) of “Notes to Financial Statements.”) |
| 3 | Per share numbers have been calculated using average shares. |
16
Managers Fremont Micro-Cap Fund
Notes to Financial Statements
October 31, 2006
| 1. | Summary of Significant Accounting Policies |
Managers Trust I (the “Trust”) is an open-end management investment company organized as a Massachusetts business trust and registered under the Investment Company Act of 1940 (the “1940 Act”), as amended. Currently, the Trust is comprised of a number of different funds, each having distinct investment management objectives, strategies, risks and policies. Included in this report is the Managers Fremont Micro-Cap Fund (the “Fund”), formerly Fremont U.S. Micro-Cap Fund (the “Predecessor Fund”).
The Fund’s financial statements are prepared in accordance with accounting principles generally accepted in the United States of America, which require management to make estimates and assumptions that affect the reported amount of assets and liabilities and disclosure of contingent assets and liabilities at the date of the financial statements and the reported amounts of income and expenses during the reporting period. Actual results could differ from those estimates. The following is a summary of significant accounting policies followed by the Fund in the preparation of its financial statements:
| a. | Valuation of Investments |
Equity securities traded on a domestic securities exchange are valued at the last quoted sale price, or, lacking any sales, at the last quoted bid price. Over-the-counter securities are valued at the NASDAQ Official Closing Price, if one is available. Lacking any sales, over-the-counter securities are valued at the last quoted bid price. The Fund’s investments are generally valued based on market quotations provided by third-party pricing services approved by the Board of Trustees of the Fund. Under certain circumstances, the value of a Fund investment may be based on an evaluation of its fair value, pursuant to procedures established by and under the general supervision of the Board of Trustees of the Trust. The Fund may use the fair value of a portfolio security to calculate its NAV when, for example, (1) market quotations are not readily available because a portfolio security is not traded in a public market or the principal market in which the security trades is closed, (2) trading in a portfolio security is suspended and has not resumed prior to the time as of which the Fund calculates its NAV, (3) where a significant event affecting the value of a portfolio security is determined to have occurred between the time of the market quotation provided for a portfolio security and the time as of which the Fund calculates its NAV, (4) a security’s price has remained unchanged over a period of time (often referred to as a “stale price”), or (5) the Investment Manager determines that a market quotation is inaccurate. An investment valued on the basis of an evaluation of its fair value may be valued at a price higher or lower than available market quotations. An investment’s valuation may differ depending on the method used and the factors considered in determining value pursuant to the Funds fair value procedures. The Investment Manager monitors intervening events that may affect the value of securities held in the Fund’s portfolio and, in accordance with procedures adopted by the Fund’s Trustees, will adjust the prices of securities traded in foreign markets, as appropriate, to reflect the impact of events occurring subsequent to the close of such markets but prior to the time each Fund’s NAV is calculated. Fixed-income securities are valued based on valuations furnished by independent pricing services that utilize matrix systems, which reflect such factors as security prices, yields, maturities and ratings, and are supplemented by dealer and exchange quotations. Short-term investments having a remaining maturity of 60 days or less are valued at amortized cost,
17
Managers Fremont Micro-Cap Fund
Notes to Financial Statements (continued)
which approximates market value. Investments in other regulated investment companies are valued at their end of day net asset value per share except iShares or other ETF’s which are valued the same as equity securities. Securities (including derivatives) for which market quotations are not readily available are valued at fair value, as determined in good faith, and pursuant to procedures adopted by the Board of Trustees of the Trust. The values assigned to fair value investments are based on available information and do not necessarily represent amounts that might ultimately be realized, since such amounts depend on future developments inherent in long-term investments. Further, because of the inherent uncertainty of valuation, those estimated values may differ significantly from the values that would have been used had a ready market of the investments existed, and the differences could be material.
Security transactions are accounted for as of the trade date. Realized gains and losses on securities sold are determined on the basis of identified cost.
| c. | Investment Income and Expenses |
Dividend income is recorded on the ex-dividend date except certain dividends from foreign securities where the ex-dividend date may have passed. These dividends are recorded as soon as the Trust is informed of the ex-dividend date. Dividend income on foreign securities is recorded net of any withholding tax. Interest income, which includes amortization of premium and accretion of discount on debt securities, is accrued as earned. Non-cash dividends included in dividend income, if any, are reported at the fair market value of the securities received. Other income and expenses are recorded on an accrual basis. Expenses that cannot be directly attributed to a fund are apportioned among the Funds in the Trust and in some cases other affiliated funds based upon their relative average net assets or number of shareholders.
The Fund may participate in a directed brokerage program whereby certain portfolio trades are directed to various brokers who pay a portion of the Fund’s expenses. For the fiscal year ended October 31, 2006 no trades were directed under this program.
In addition, the Fund has a “balance credit” arrangement with The Bank of New York (“BNY”), the Fund’s custodian, whereby the Fund is credited with an interest factor equal to 1% below the effective 90-day T-Bill rate for account balances left uninvested overnight. These credits serve to reduce custody expenses that would otherwise be charged to the Fund. For the fiscal year ended October 31, 2006, the custodian expense was reduced by $202. Managers Investment Group LLC (the “Investment Manager”), a subsidiary of Affiliated Managers Group, Inc. (“AMG”) and the Investment Manager for the Fund, has contractually agreed, through at least March 1, 2007, to waive fees and pay or reimburse expenses to the extent that the total annual operating expenses (exclusive of brokerage, interest, taxes and extraordinary expenses) of the Fund exceed 1.98% of the Fund’s average daily net assets. For the fiscal year ended October 31, 2006, no reimbursement payments were required.
The Fund may be obligated to repay the Investment Manager such amounts waived, paid or reimbursed in future years provided that the repayment occurs within three (3) years after the waiver or reimbursement and that such repayment would not cause the Fund’s expenses in any such year to exceed the previously stated percentages of that Fund’s average daily net assets.
18
Managers Fremont Micro-Cap Fund
Notes to Financial Statements (continued)
| d. | Dividends and Distributions |
Dividends resulting from net investment income and distributions of capital gains, if any, normally will be declared and paid annually in December and when required for Federal excise tax purposes. Distributions are recorded on the ex-dividend date. Income and capital gain distributions are determined in accordance with Federal income tax regulations, which may differ from generally accepted accounting principles. These differences are primarily due to differing treatments for losses deferred due to wash sales, equalization accounting for tax purposes, foreign currency and market discount transactions. Permanent book and tax basis differences, if any, relating to shareholder distributions will result in reclassifications to paid-in capital. The Fund paid no distributions during 2006 or 2005.
The Fund intends to comply with the requirements under Subchapter M of the Internal Revenue Code of 1986, as amended, to distribute substantially all of its taxable income and gains to its shareholders and to meet certain diversification and income requirements with respect to investment companies. Therefore, no provision for Federal income or excise tax is included in the accompanying financial statements.
Additionally, based on the Fund’s understanding of the tax rules and rates related to income, gains and transactions for the foreign jurisdictions in which it invests, the Fund will provide for foreign taxes, and where appropriate, deferred foreign taxes.
| f. | Capital Loss Carryovers |
As of October 31, 2006, the Fund had utilized capital losses during the year of $20,590,011 and had an accumulated net realized capital loss carryover of $13,942,467. This amount may be used to offset realized capital gains, if any, through October 31, 2010.
The Trust’s Declaration of Trust authorizes for each series the issuance of an unlimited number of shares of beneficial interest, without par value. The Fund records sales and repurchases of its capital stock on the trade date. Dividends and distributions to shareholders are recorded on the ex-dividend date.
At October 31, 2006, certain unaffiliated shareholders, specifically omnibus accounts, individually held greater than 10% of the outstanding shares of the Fund as follows: 2 own collectively 52%. Transactions by these shareholders may have a material impact on the Fund.
| 2. | Agreements and Transactions with Affiliates |
The Trust has entered into an Investment Management Agreement under which the Investment Manager provides or oversees investment management services to the Fund. The Investment Manager selects subadvisors for the Fund (subject to Trustee approval) and monitors the subadvisor’s investment programs and results. The Fund’s investment portfolio is managed by a portfolio manager who serves pursuant to a Subadvisory Agreement with the Investment Manager.
19
Managers Fremont Micro-Cap Fund
Notes to Financial Statements (continued)
Investment management fees are paid directly by the Fund to the Investment Manager based on average daily net assets. The annual investment management fee rate, as a percentage of average daily net assets for the fiscal year ended October 31, 2006 was 1.00%.
The Trust has entered into an Administration and Shareholder Servicing Agreement under which Managers Investment Group LLC serves as the Fund’s administrator (the “Administrator”) and is responsible for all aspects of managing the Fund’s operations, including administration and shareholder services to each Fund, its shareholders, and certain institutions, such as bank trust departments, broker-dealers and registered investment advisers, that advise or act as an intermediary with the Fund’s shareholders. During the fiscal year ended October 31, 2006, the Fund paid a fee to the Administrator at the rate of 0.25% per annum of the Fund’s average daily net assets.
Prior to July 1, 2005, the aggregate annual retainer paid to each Independent Trustee for all Trusts in the Fund family was $52,000, plus $2,000 for each meeting attended. Effective July 1, 2005, the aggregate annual retainer paid to each Independent Trustee is $55,000, plus $4,000 for each meeting attended. The Trustees’ fees and expenses are allocated amongst all of the Funds for which Managers Investment Group LLC serves as the Investment Manager (the “Managers Funds”) based on the relative net assets of such Funds. Through March, 2006, the Trust had an additional Independent Trustee who was paid an annual retainer of $30,000, plus $4,000 for each meeting attended. The fee is allocated amongst the Funds in the Trust based on the relative net assets of each Fund. The Independent Chairman of the Trusts receives an additional payment of $10,000 per year. (Prior to July 1, 2005, the Independent Chairman was paid an additional $5,000 per year). Effective July 1, 2005, the Chairman of the Audit Committee receives an additional $2,000 per year. The “Trustee fees and expenses” shown in the financial statements amounting to $28,120 represents the Fund’s allocated portion of the total fees and expenses paid by the Fund and other affiliated funds in the Trust and in the complex for the fiscal year ended October 31, 2006.
The Fund is distributed by Managers Distributors, Inc. (“MDI”), a wholly-owned subsidiary of Managers Investment Group LLC. Certain Trustees and Officers of the Fund are Officers and/or Directors of the Investment Manager, AMG and/or MDI. MDI serves as the principal underwriter for the Fund. MDI is a registered broker-dealer and member of the National Association of Securities Dealers, Inc. Shares of the Fund will be continuously offered and will be sold by brokers, dealers or other financial intermediaries who have executed selling agreements with MDI. MDI bears all the expenses of providing services pursuant to an Underwriting Agreement, including the payment of the expenses relating to the distribution of Prospectuses for sales purposes and any advertising or sales literature.
| 3. | Purchases and Sales of Securities |
Purchases and sales of securities, excluding short-term securities, for the fiscal year ended October 31, 2006, were $267,893,530 and $412,521,159, respectively. There were no purchases or sales of U.S. Government securities.
| 4. | Portfolio Securities Loaned |
The Fund may participate in a securities lending program offered by BNY providing for the lending of equities, corporate bonds and government securities to qualified brokers.
20
Managers Fremont Micro-Cap Fund
Notes to Financial Statements (continued)
Collateral on all securities loaned is accepted in cash and/or government securities. Collateral is maintained at a minimum level of 102% of the market value, plus interest, if applicable, of investments on loan. Collateral received in the form of cash is invested temporarily in institutional money market funds or other short-term investments by BNY. Securities lending fees include earnings of such temporary cash investments, plus or minus any rebate to a borrower. These earnings (after rebate) are then divided between BNY, as a fee for its services under the program, and the Fund according to agreed-upon rates.
| 5. | Commitments and Contingencies |
In the normal course of business, the Fund may enter into contracts and agreements that contain a variety of representations and warranties, which provide general indemnifications. The maximum exposure to the Fund under these arrangements is unknown, as this would involve future claims that may be against the Fund that have not yet occurred. However, based on experience, the Fund expects the risk of loss to be remote.
| 6. | Transactions with Affiliated Companies |
An affiliated company is a company that is directly or indirectly controlled by a related party or a company in which a fund has ownership of at least 5% of the voting securities. Transactions during the fiscal year ended October 31, 2006, with companies which are or were affiliates are as follows:
SUMMARY OF TRANSACTIONS WITH AFFILIATED COMPANIES :
| | | | | | | | | | | | | | | | | | |
Affiliate | | Purchase Cost | | Sales Cost | | Dividend Income | | Market Value | | Gains/ Losses | | | % Ownership of Affiliate | |
Northern Technologies International Corp. | | $ | 20,766 | | $ | 642,619 | | — | | $ | 2,454,325 | | $ | (41,266 | ) | | 7.2 | % |
Optibase Ltd | | | 1,343,025 | | | — | | — | | | 3,231,136 | | | — | | | 8.1 | % |
PDG Environmental Corp. | | | 3,076,966 | | | 37,513 | | — | | | 1,524,100 | | | (15,129 | ) | | 7.6 | % |
TVI Corp. | | | 4,396,254 | | | 2,085,916 | | — | | | 5,976,700 | | | (1,092,426 | ) | | 6.2 | % |
| | | | | | | | | | | | | | | | | | |
Totals | | $ | 8,837,011 | | $ | 2,766,048 | | — | | $ | 13,186,261 | | $ | (1,148,821 | ) | | | |
| | | | | | | | | | | | | | | | | | |
| 7. | New Accounting Pronouncements |
The Financial Accounting Standards Board (“FASB”) has recently issued Interpretation No. 48, “Accounting for Uncertainty in Income Taxes - an Interpretation of FASB Statement No. 109 (the “Interpretation”), which applies to all registered investment companies and clarifies the accounting for uncertain tax positions. The Interpretation is effective for financial statements for fiscal years beginning after December 15, 2006. Management has not yet completed their analysis of the Interpretation, and is not currently in a position to estimate the significance, if any, that the impact of adoption will have on the financial statements.
In addition, in September 2006, Statement of Financial Accounting Standards No. 157, Fair Value Measurements (“SFAS 157”), was issued and is effective for fiscal years beginning after November 15, 2007. SFAS 157 defines fair value, establishes a framework
21
Managers Fremont Micro-Cap Fund
Notes to Financial Statements (continued)
for measuring fair value and expands disclosures about fair value measurements. Management is currently evaluating the impact, if any, the adoption of SFAS 157 will have on the Fund’s financial statements.
Tax Information (unaudited)
The Fund hereby designates the maximum amount allowable of its net taxable income as qualified dividends as provided in the Jobs and Growth Tax Relief Reconciliation Act of 2003. The 2006 Form 1099-DIV you receive for the Fund, will show the tax status of all distributions paid to you during the year.
Pursuant to section 852 of the Internal Revenue Code, there were no long-term capital gains for the Fund for the taxable year ended October 31, 2006.
22
Report of Independent Registered Public Accounting Firm
To the Board of Trustees of Managers Trust I and the Shareholders of
Managers Fremont Micro-Cap Fund:
In our opinion, the accompanying statement of assets and liabilities, including the schedule of portfolio investments and the related statements of operations and of changes in net assets and the financial highlights present fairly, in all material respects, the financial position of Managers Fremont Micro-Cap Fund (the “Fund”) at October 31, 2006, the results of its operations, the changes in its net assets and the financial highlights for the periods indicated, in conformity with accounting principles generally accepted in the United States of America. These financial statements and financial highlights (hereafter referred to as “financial statements”) are the responsibility of the Fund’s management; our responsibility is to express an opinion on these financial statements based on our audits. We conducted our audits of these financial statements in accordance with the standards of the Public Company Accounting Oversight Board (United States). Those standards require that we plan and perform the audit to obtain reasonable assurance about whether the financial statements are free of material misstatement. An audit includes examining, on a test basis, evidence supporting the amounts and disclosures in the financial statements, assessing the accounting principles used and significant estimates made by management, and evaluating the overall financial statement presentation. We believe that our audits, which included confirmation of securities at October 31, 2006 by correspondence with the custodian and brokers, provide a reasonable basis for our opinion.
PricewaterhouseCoopers LLP
Boston, Massachusetts
December 18, 2006
23
Trustees and Officers
The Trustees and Officers of the Trust, their business addresses, principal occupations for the past five years and dates of birth are listed below. The Trustees provide broad supervision over the affairs of the Trust and the Fund. The Trustees are experienced executives who meet periodically throughout the year to oversee the Fund’s activities, review contractual arrangements with companies that provide services to the Fund, and review the Fund’s performance. Unless otherwise noted, the address of each Trustee or Officer is the address of the Trust: 800 Connecticut Avenue, Norwalk, Connecticut 06854.
There is no stated term of office for Trustees. Trustees serve until their resignation, retirement or removal in accordance with the Trust’s organizational documents and policies adopted by the Board from time to time. The Chairman of the Trustees, President, Treasurer and Secretary of the Trust are elected by the Trustees annually. Other officers hold office at the pleasure of the Trustees.
Independent Trustees
The following Trustees are not “interested persons” of the Trust within the meaning of the 1940 Act:
| | |
Name, Date of Birth, Number of Funds Overseen in Fund Complex* | | Principal Occupation(s) During Past 5 Years and Other Directorships Held by Trustee |
Jack W. Aber, 9/9/37 • Trustee since 2000 • Oversees 33 Funds in Fund Complex | | Professor of Finance, Boston University School of Management (1972- Present); Trustee of Appleton Growth Fund (1 portfolio); Trustee of Third Avenue Trust (4 portfolios); Trustee of Third Avenue Variable Trust (1 portfolio). |
| |
William E. Chapman, II, 9/23/41 • Independent Chairman • Trustee since 2000 • Oversees 33 Funds in Fund Complex | | President and Owner, Longboat Retirement Planning Solutions (1998-Present); Hewitt Associates, LLC (part time) (provider of Retirement and Investment Education Seminars); Interim Executive Vice President, QuadraMed Corporation (2001); President, Retirement Plans Group, Kemper Funds (1990-1998); Trustee of Bowdoin College (2002-Present); Trustee of Third Avenue Trust (4 portfolios); Trustee of Third Avenue Variable Trust (1 portfolio). |
| |
Edward J. Kaier, 9/23/45 • Trustee since 2000 • Oversees 33 Funds in Fund Complex | | Attorney at Law and Partner, Hepburn Willcox Hamilton & Putnam, LLP (1977-Present); Trustee of Third Avenue Trust (4 portfolios); Trustee of Third Avenue Variable Trust (1 portfolio). |
| |
Steven J. Paggioli, 4/3/50 • Trustee since 2000 • Oversees 33 Funds in Fund Complex | | Consultant (2001-Present); Formerly Executive Vice President and Director, The Wadsworth Group (1986-2001); Executive Vice President, Secretary and Director, Investment Company Administration, LLC (1990-2001); Vice President, Secretary and Director, First Fund Distributors, Inc. (1991-2001); Trustee, Professionally Managed Portfolios (22 portfolios); Advisory Board Member, Sustainable Growth Advisors, LP. |
24
Trustees and Officers (continued)
| | |
Name, Date of Birth, Number of Funds Overseen in Fund Complex* | | Principal Occupation(s) During Past 5 Years and Other Directorships Held by Trustee |
Eric Rakowski, 6/5/58 • Trustee since 2000 • Oversees 33 Funds in Fund Complex | | Professor, University of California at Berkeley School of Law (1990- Present); Trustee of Third Avenue Trust (4 portfolios); Trustee of Third Avenue Variable Trust (1 portfolio). |
| |
Thomas R. Schneeweis, 5/10/47 • Trustee since 2000 • Oversees 33 Funds in Fund Complex | | Professor of Finance, University of Massachusetts (1985-Present); Director, CISDM at the University of Massachusetts, (1996-Present); President, Alternative Investment Analytics, LLC, (formerly Schneeweis Partners, LLC) (2001-Present); Director of Research, URSA Capital (subsidiaries: Lyra/Starview Capital LLC), (2004- Present); Partner, Northampton Capital Management, LLC; Partner, TRS Associates (Sole Proprietorship) and member of Massachusetts Finance Institute (wholly owned subsidiary of Alternative Investment Analytics). No other directorships held by Trustee. |
| * | The Fund Complex consists of Managers AMG Funds, The Managers Funds, Managers Trust I and Managers Trust II. |
Interested Trustees
The following Trustees are “interested persons” of the Trust within the meaning of the 1940 Act. Mr. Lebovitz is an interested person of the Trust within the meaning of the 1940 Act by virtue of his positions with Managers Investment Group LLC and Managers Distributors, Inc. Mr. Nutt is an interested person of the Trust within the meaning of the 1940 Act by virtue of his positions with, and interest in securities of, Affiliated Managers Group, Inc.
| | |
Name, Date of Birth, Number of Funds Overseen in Fund Complex* | | Principal Occupation(s) During Past 5 Years and Other Directorships Held by Trustee |
Peter M. Lebovitz, 1/18/55 • Trustee since 2002 • President since 2000 • Oversees 33 Funds in Fund Complex | | Managing Partner, Managers Investment Group LLC (2005-Present); President and Chief Executive Officer, The Managers Funds LLC (1999-2004); President, Managers Distributors, Inc. (2000-2006), Vice President, Managers Distributors, Inc. (2006-Present); President, The Managers Funds (1999-Present); President, Managers AMG Funds (1999-Present); President, Managers Trust II (2000-Present); Director of Marketing, The Managers Funds, LP (1994-1999). No other directorships held by trustee. |
| |
William J. Nutt, 3/30/45 • Trustee since 2005 • Oversees 33 Funds in Fund Complex | | Chairman and Founder of Affiliated Managers Group, Inc., (1993- Present); Chief Executive Officer of Affiliated Managers Group, Inc. (1993-2004); Director, Affiliated Managers Group, Inc. (1993-Present); President of Affiliated Managers Group, Inc. (1993-1999); President and Chief Operating Officer, The Boston Company (1989-1993); Senior Executive Vice President, The Boston Company (1982-1989). |
| * | The Fund Complex consists of Managers AMG Funds, The Managers Funds, Managers Trust I and Managers Trust II. |
25
Trustees and Officers (continued)
Officers
| | |
Name, Date of Birth, Position(s) Held with Fund and Length of Time Served | | Principal Occupation(s) During Past 5 Years |
Bruce M. Aronow, 5/31/65 • Chief Financial Officer since 2005 | | Managing Partner, Managers Investment Group LLC (2005-Present); Chief Financial Officer, The Managers Funds, Managers AMG Funds and Managers Trust II (2005-Present); Executive Vice President and Chief Financial Officer and Principal, Rorer Asset Management (1999- 2004); Chief Operating Officer, Rorer Asset Management (2001-2004); Staff Accountant, Manager and Partner, PricewaterhouseCoopers LLP (1987-1998). |
| |
Christine C. Carsman, 4/2/52 • Secretary since 2004 | | Vice President and Chief Regulatory Counsel, Affiliated Managers Group, Inc. (2004-Present); Secretary, The Managers Funds, Managers AMG Funds and Managers Trust II (2004-Present); Senior Counsel, Vice President and Director of Operational Risk Management and Compliance, Wellington Management Company, LLP (1995-2004); Deputy General Counsel, The Boston Company, Inc. (1993-1995); Associate General Counsel, The Boston Company Advisors, Inc. (1991- 1993); Associate, Sullivan & Worcester LLP (1987-1991). |
| |
Colin J. Dean, 3/6/77 • Assistant Secretary since 2006 | | Associate Counsel, Affiliated Managers Group, Inc. (2005-Present); Assistant Secretary, The Managers Funds, Managers AMG Funds and Managers Trust II (2006-Present); Associate, Dechert LLP (2002-2005). |
| |
Donald S. Rumery, 5/29/58 • Treasurer since 2000 | | Senior Vice-President, Managers Investment Group LLC (2005- Present); Director, Finance and Planning, The Managers Funds LLC, (1994-2004); Treasurer and Chief Financial Officer, Managers Distributors, Inc. (2000-Present); Treasurer, The Managers Funds (1995-Present); Treasurer, Managers AMG Funds (1999-Present); Treasurer, Managers Trust II (2000-Present); Secretary, Managers Trust I and Managers Trust II (2000-2004) and Secretary, The Managers Funds (1997-2004). |
26
Annual Renewal of Investment Advisory Agreements
On June 2, 2006, the Board of Trustees, including a majority of the Trustees who are not “interested persons” of the Trust (the “Independent Trustees”), approved the Investment Management Agreement with the Investment Manager for the Managers Fremont Micro-Cap Fund (the “Fund”) and the Subadvisory Agreement for the Subadvisor. The Independent Trustees were separately represented by independent counsel in connection with their consideration of the approval of these agreements. In considering the Investment Management and Subadvisory Agreements, the Trustees reviewed a variety of materials relating to the Fund, the Investment Manager and the Subadvisor, including comparative performance, fee and expense information for an appropriate peer group of similar mutual funds (the “Peer Group”), performance information for the relevant benchmark index (the “Fund Benchmark”) and other information regarding the nature, extent and quality of services provided by the Investment Manager and the Subadvisor under their respective agreements. The Trustees also took into account performance, fee and expense information regarding the Fund provided to them on a quarterly basis throughout the year. Prior to voting, the Independent Trustees: (a) reviewed the foregoing information with their independent legal counsel and with management; (b) received materials from their independent legal counsel discussing the legal standards applicable to their consideration of the Investment Management Agreement and the Subadvisory Agreement; and (c) met with their independent legal counsel in private sessions at which no representatives of management were present.
Nature, extent and quality of services.
In considering the nature, extent and quality of the services provided by the Investment Manager, the Trustees reviewed information relating to the Investment Manager’s operations and personnel. Among other things, the Investment Manager provided financial information, biographical information on its supervisory and professional staff and descriptions of its organizational and management structure. The Trustees also took into account information provided periodically throughout the previous year by the Investment Manager relating to the performance of its duties with respect to the Fund and the Trustees’ familiarity with the Investment Manager’s management through Board meetings, discussions and reports. In the course of their deliberations regarding the Investment Management Agreement, the Trustees evaluated, among other things: (a) the quality of the search, selection and monitoring services performed by the Investment Manager in overseeing the portfolio management responsibilities of the Subadvisor; (b) the Investment Manager’s ability to supervise the Fund’s other service providers; and (c) the Investment Manager’s compliance programs. The Trustees also took into account the financial condition of the Investment Manager with respect to its ability to provide the services required under the Investment Management Agreement and to maintain contractual expense limitations for the Fund.
The Trustees also reviewed information relating to the Subadvisor’s operations and personnel and the investment philosophy, strategies and techniques (the “Investment Strategy”) used in managing the Fund. Among other things, the Trustees reviewed biographical information on portfolio management and other professional staff, information regarding the Subadvisor’s organizational and management structure and the Subadvisor’s brokerage policies and practices. The Trustees considered specific information provided regarding the experience of the individuals at the Subadvisor with portfolio management
27
Annual Renewal of Investment Advisory Agreements (continued)
responsibility for the Fund, including the information set forth in the Fund’s prospectus and statement of additional information. In the course of their deliberations, the Trustees evaluated, among other things: (a) the services rendered by the Subadvisor in the past; (b) the qualifications and experience of the Subadvisor’s personnel; and (c) the Subadvisor’s compliance programs. The Trustees also took into account the financial condition of the Subadvisor with respect to its ability to provide the services required under the Subadvisory Agreement.
Performance.
Among other information relating to the Fund’s performance, the Trustees noted that the Fund’s performance for the 1-year, 3-year, 5-year and 10-year periods ended March 31, 2006 was below, below, above and above, respectively, the median performance of the Peer Group and the performance of the Fund Benchmark, which is the Russell 2000 Growth Index. The Trustees noted the longer-term performance of the Fund. They further noted management’s discussion of the Fund’s performance. The Trustees concluded that the Fund’s performance has been reasonable in light of all factors considered. The Trustees noted that the Investment Manager will continue to monitor the performance of the Subadvisor.
As noted above, the Board considered the Fund’s performance during relevant time periods as compared to the Fund’s Peer Group and noted that the Board reviews on a quarterly basis detailed information about the Fund’s performance results, portfolio composition and Investment Strategies. The Board noted the Investment Manager’s expertise and resources in monitoring the performance, investment style and risk adjusted performance of the Subadvisor. The Board also noted the Subadvisor’s performance record with respect to the Fund. The Board was mindful of the Investment Manager’s focus on the Subadvisor’s performance with respect to the Fund and the explanations of management regarding the factors that contributed to the performance of the Fund.
Advisory Fees and Profitability.
In considering the reasonableness of the advisory fee charged by the Investment Manager for managing the Fund, the Trustees noted that the Investment Manager, and not the Fund, is responsible for paying the fees charged by the Fund’s Subadvisor and, therefore, that the fees paid to the Investment Manager cover the reasonable cost of providing portfolio management services as well as the reasonable cost of providing search, selection and monitoring services in operating a “manager-of-managers” complex of mutual funds. The Trustees concluded that, in light of the additional high quality supervisory services provided by the Investment Manager and the fact that the subadvisory fees are paid out of the advisory fee, the advisory fee payable by the Fund to the Investment Manager can reasonably be expected to exceed the median advisory fee for the Peer Group, which consists mostly of funds that do not operate with a manager-of-managers structure.
In considering the reasonableness of the advisory fee payable to the Investment Manager, the Trustees also reviewed information provided by the Investment Manager setting forth all revenues and other benefits, both direct and indirect, received by the Investment Manager and its affiliates attributable to managing the Fund and all the mutual funds in the Managers Family of Funds, the cost of providing such services and the resulting profitability to the Investment Manager and its affiliates from these relationships. The Trustees also
28
Annual Renewal of Investment Advisory Agreements (continued)
noted the current and potential asset levels of the Fund and the willingness of the Investment Manager to waive fees and pay expenses for the Fund from time to time as a means of limiting the total expenses of the Fund. In this regard, the Trustees noted that, unlike the typical mutual fund that is managed by a single investment adviser, the Fund operates in a manager-of-managers structure and, as the Fund grows in size, it is common practice for the Investment Manager to recommend the selection of an additional Subadvisor to manage a portion of the Fund’s portfolio. The Trustees also noted that the subadvisory fees are paid by the Investment Manager out of its advisory fee. The Trustees further noted that, because of this practice, the Investment Manager’s oversight and supervisory responsibilities with respect to the Funds can be expected to increase with the size of the Fund. On this basis, the Trustees concluded that the profitability to the Investment Manager is reasonable and that the Investment Manager is not realizing material benefits from economies of scale that would warrant adjustments to the fees for the Fund at this time. With respect to economies of scale, the Trustees also noted that as the Fund’s assets increase over time, the Fund may realize other economies of scale to the extent that the increase in assets is proportionally greater than the increase in certain other expenses.
The Trustees noted that the Fund’s advisory fee and total expenses (net of applicable expense waivers/reimbursements) as of March 31, 2006 were higher and lower than the average, respectively, for the Peer Group and that the Investment Manager has contractually agreed through March 1, 2007 to limit the Fund’s net annual operating expenses to 1.98%. The Trustees concluded that, in light of the nature, extent and quality of the services provided by the Investment Manager and the Subadvisor, the Fund’s performance, the foregoing expense limitation and the considerations noted above with respect to the Subadvisor and the Investment Manager, the Fund’s advisory fees are reasonable.
Subadvisory Fees and Profitability. In considering the reasonableness of the fee payable by the Investment Manager to the Subadvisor, the Trustees relied on the ability of the Investment Manager to negotiate the terms of the Subadvisory Agreement at arm’s length as part of the manager-of-managers structure, noting that the Subadvisor is not affiliated with the Investment Manager. In addition, the Trustees noted that the subadvisory fees are paid by the Investment Manager out of its advisory fee. Accordingly, the cost of services to be provided by the Subadvisor and the profitability to the Subadvisor of its relationship with the Fund were not material factors in the Trustees’ deliberations. For similar reasons, and based on the current size of the portion of the Fund managed by the Subadvisor, the Trustees concluded that any economies of scale being realized by the Subadvisor was not a material factor in the Trustees’ deliberations at this time.
* * * *
After consideration of the foregoing, the Trustees also reached the following conclusions regarding the Investment Management Agreement and the Subadvisory Agreement, in addition to those conclusions discussed above: (a) the Investment Manager and the Sub-advisor have demonstrated that they possess the capability and resources to perform the duties required of them under the Investment Management Agreement and the Subadvisory Agreement; (b) the Subadvisor’s Investment Strategy is appropriate for pursuing the Fund’s investment objectives; (c) the Subadvisor is reasonably likely to execute its Investment Strategy consistently over time; and (d) the Investment Manager and the Subadvisor maintain appropriate compliance programs.
29
Annual Renewal of Investment Advisory Agreements (continued)
Based on all of the above-mentioned factors and related conclusions, with no single factor or conclusion being determinative and with each Trustee not necessarily attributing the same weight to each factor, the Trustees concluded that approval of the Investment Management Agreement and the Subadvisory Agreement would be in the interests of the Fund and its shareholders. Accordingly, on June 2, 2006 the Trustees, including a majority of the Independent Trustees, voted to approve the Investment Management Agreement and the Subadvisory Agreement for the Fund’s Subadvisor.
30
Investment Manager and Administrator
Managers Investment Group LLC
800 Connecticut Avenue
Norwalk, Connecticut 06854
(203) 299-3500 or (800) 835-3879
Distributor
Managers Distributors, Inc.
800 Connecticut Avenue
Norwalk, Connecticut 06854
(203) 299-3500 or (800) 835-3879
Subadvisor
Kern Capital Management LLC
114 West 47th Street, 19th Floor
New York, New York 10036
Custodian
The Bank of New York
2 Hanson Place
Brooklyn, New York 11217
Legal Counsel
Ropes & Gray LLP
One International Place
Boston, Massachusetts 02110-2624
Transfer Agent
PFPC, Inc.
Attn: Managers
P.O. Box 9769
Providence, Rhode Island 02940
(800) 548-4539

| | | | |
| MANAGERSAND MANAGERS AMG EQUITY FUNDS | | MANAGERS BALANCED FUNDS |
EMERGING MARKETS EQUITY Rexiter Capital Management Limited ESSEX GROWTH ESSEX LARGE CAP GROWTH (Formerly known as Capital Appreciation) ESSEX SMALL/MICRO CAP GROWTH Essex Investment Management Co., LLC FQ TAX-MANAGED U.S. EQUITY FQ U.S. EQUITY First Quadrant, L.P. INSTITUTIONAL MICRO-CAP MICRO-CAP Kern Capital Management LLC INTERNATIONAL EQUITY Alliance Bernstein L.P. Lazard Asset Management, LLC Wellington Management Company, LLP MID-CAP Chicago Equity Partners, LLC REAL ESTATE SECURITIES Urdang Securities Management, Inc. | | RORER LARGE-CAP Rorer Asset Management, LLC SMALL CAP TIMESSQUARE MID CAP GROWTH TIMESSQUARE SMALL CAP GROWTH TimesSquare Capital Management, LLC SMALL COMPANY Epoch Investment Partners, Inc. Kalmar Investment Advisers, Inc. SPECIAL EQUITY Donald Smith & Co., Inc. Kern Capital Management LLC Skyline Asset Management, L.P. Smith Asset Management Group, LP Veredus Asset Management LLC Westport Asset Management, Inc. SYSTEMATIC VALUE Systematic Financial Management, L.P. VALUE Armstrong Shaw Associates Inc. Osprey Partners Investment Mgmt., LLC | | BALANCED Chicago Equity Partners, LLC Loomis, Sayles & Company L.P. GLOBAL 333 Global Advisers* Armstrong Shaw Associates Inc. Alliance Bernstein L.P. First Quadrant, L.P. Kern Capital Management LLC Northstar Capital Management, Inc. Wellington Management Company, LLP ALTERNATIVE FUNDS FQ GLOBAL ALTERNATIVES First Quadrant, L.P. MANAGERS FIXED INCOME FUNDS BOND (MANAGERS) FIXED INCOME GLOBAL BOND Loomis, Sayles & Company L.P. BOND (MANAGERS FREMONT) Pacific Investment Management Co. LLC CALIFORNIA INTERMEDIATE TAX-FREE Evergreen Investment Management Company, LLC HIGH YIELD J.P. Morgan Investment Management Inc. INTERMEDIATE DURATION GOVERNMENT SHORT DURATION GOVERNMENT Smith Breeden Associates, Inc. MONEY MARKET (MANAGERS) JPMorgan Investment Advisors Inc. MONEY MARKET (FREMONT) 333 Global Advisers* * A division of Managers Investment Group LLC |
This report is prepared for the Fund’s shareholders. It is authorized for distribution to prospective investors only when preceded or accompanied by an effective prospectus. To receive a free copy of the prospectus or Statement of Additional Information, which includes additional information about Fund Trustees, please contact us by calling 800.835.3879. Distributed by Managers Distributors, Inc., member NASD. A description of the policies and procedures the Fund uses to vote its proxies is available: (i) without charge, upon request, by calling 800.835.3879, or (ii) on the Securities and Exchange Commission’s (SEC) Web site at www.sec.gov. For information regarding the Fund’s proxy voting record for the 12-month period ended June 30, call 800.835.3879 or visit the SEC Web site at www.sec.gov. The Fund files its complete schedule of portfolio holdings with the SEC for the first and third quarters of each fiscal year on Form N-Q. The Fund’s Forms N-Q are available on the SEC’s website at www.sec.gov. A Fund’s Forms N-Q may be reviewed and copied at the SEC’s Public Reference Room in Washington, DC. Information on the operation of the Public Reference Room may be obtained by calling 1-800-SEC-0330. To review a complete list of the Fund’s portfolio holdings, or to view the most recent quarterly holdings report, semiannual report, or annual report, please visit www.managersinvest.com. | |
| | |
| www.managersinvest.com | |  |
Registrant has adopted a Code of Ethics. See attached Exhibit (a)(1).
| Item 3. | AUDIT COMMITTEE FINANCIAL EXPERT |
Registrant’s Board of Trustees has determined that independent Trustees Mr. Jack W. Aber and Mr. Steven J. Paggioli each qualify as the Audit Committee Financial Expert. Mr. Aber and Mr. Paggioli are “independent” as such term is defined in Form N-CSR.
| Item 4. | PRINCIPAL ACCOUNTANT FEES AND SERVICES |
The aggregate fees billed by PwC to the Fund for the Funds’ two most recent fiscal years for professional services rendered for audits of annual financial statements, or services that are normally provided in connection with statutory and regulatory filings or engagements (“Audit Fees”) were as follows:
| | | | | | |
| | | Fiscal
2006 | | Fiscal
2005 |
Managers Fremont Global Fund | | $ | 28,350 | | $ | 27,000 |
Managers Small Cap Fund | | $ | 16,860 | | $ | 17,000 |
Managers Fremont Micro-Cap Fund | | $ | 15,630 | | $ | 14,400 |
Managers Fremont Institutional Micro-Cap Fund | | $ | 15,710 | | $ | 14,000 |
Managers Real Estate Securities Fund | | $ | 19,903 | | $ | 17,900 |
Managers Fremont Bond Fund | | $ | 43,179 | | $ | 37,975 |
Managers CA Intermediate Tax-Free Fund | | $ | 19,635 | | $ | 18,700 |
Fremont Money Market Fund | | $ | 14,700 | | $ | 14,000 |
Audit-Related Fees
There were no fees billed by PwC to the Fund in its two recent fiscal years for services rendered for assurance and related services that are reasonably related to the performance of the audit or review of the Fund’s financial statements, but are not reported as Audit Fees (“Audit-Related Fees”).
For the Funds’ two most recent fiscal years, there were no Audit-Related Fees billed by PwC for engagements related directly to the operations and financial reporting of one or more Funds by a Fund Service Provider. A Fund Service Provider is (a) any investment adviser to the Fund (not including any Subadvisor whose role is primarily portfolio management and is subcontracted with or overseen by another investment adviser) or (b) any entity that provides ongoing services to the Fund and is controlling, controlled by or under common control with a Fund investment adviser described in (a).
Tax Fees
The aggregate fees billed by PwC to the Funds for the two most recent fiscal years for professional services rendered for tax compliance, tax advice, and tax planning (“Tax Fees”) were as follows:
| | | | | | |
| | | Fiscal
2006 | | Fiscal
2005 |
Managers Fremont Global Fund | | $ | 9,240 | | $ | 8,400 |
Managers Small Cap Fund | | $ | 7,810 | | $ | 7,100 |
Managers Fremont Micro-Cap Fund | | $ | 7,810 | | $ | 7,100 |
Managers Fremont Institutional Micro-Cap Fund | | $ | 7,810 | | $ | 7,100 |
Managers Real Estate Securities Fund | | $ | 9,350 | | $ | 8,500 |
Managers Fremont Bond Fund | | $ | 10,560 | | $ | 9,600 |
Managers CA Intermediate Tax-Free Fund | | $ | 8,250 | | $ | 7,500 |
Fremont Money Market Fund | | $ | 5,130 | | $ | 3,300 |
For the Funds’ two most recent fiscal years, Tax Fees billed by PwC for engagements by Fund Service Providers that related directly to the operations and financial reporting of the Funds were $0 for fiscal 2006 and $0 for fiscal 2005, respectively.
The services for which Tax Fees were charged comprise all services performed by professional staff in PwC’s tax division except those services related to the audit. Typically, this category would include fees for tax compliance, tax planning, and tax advice. Tax compliance, tax advice, and tax planning services include preparation of original and amended tax returns, claims for refund and tax payment-planning services, assistance with tax audits and appeals, tax advice related to mergers and acquisitions and requests for rulings or technical advice from taxing authorities.
All Other Fees
There were no other fees billed by PwC to the Funds for all other non-audit services (“Other Fees”) during the Funds’ two most recent fiscal years. During the same period, there were no Other Fees billed by PwC for engagements by Fund Service Providers that related directly to the operations and financial reporting of the Funds.
According to policies adopted by the Audit Committee, services provided by PwC to the Funds must be pre-approved by the Audit Committee. On an annual basis, the Audit Committee reviews and pre-approves various types of services that PwC may perform for the Funds without specific approval of each engagement, subject to specified budget limitations. As contemplated by the Sarbanes-Oxley Act of 2002 and related SEC rules, the Audit Committee also pre-approves non-audit services provided by PwC to any Fund Service Provider for any engagement that relates directly to the operations and financial reporting of the Funds. Any engagement that is not already pre-approved or that will exceed a pre-approved budget must be submitted to the Audit Committee for pre-approval. The Chairman of the Audit Committee is authorized on behalf of the Board of Trustees and the Audit Committee to approve the engagement of PwC to perform non-audit services subject to certain conditions, including notification to the Audit Committee of such pre-approval not later than the next meeting of the Audit Committee following the date of such pre-approval.
There were no other fees billed by PwC for non-audit services rendered to the Funds and to Fund Service Providers for the Funds’ two most recent fiscal years.
The Audit Committee has considered whether the provision of non-audit services by PwC to Fund Service Providers that were not required to be pre-approved by the Audit Committee is compatible with maintaining PwC’s independence in its audit of the Funds, taking into account representations from PwC, in accordance with Independence Standards Board Standard No. 1, regarding its independence from the Funds and its related entities.
The following table sets forth the non-audit services provided by PwC to the Funds and its service affiliates defined as the Funds’ investment advisor and any entity controlling, controlled by or under common control with Managers Investment Group LLC that provides ongoing services to the Funds (“Control Affiliates”) for the last two fiscal years.
| | | | | | | | | | | | | | | | | | |
| | | Audit-related fees A | | Tax fees A | | All other fees A |
| | | 2005 | | 2004 | | 2005 | | 2004 | | 2005 | | 2004 |
Control Affiliates | | $ | 0 | | $ | 155,040 | | $ | 98,304 | | $ | 260,600 | | $ | 0 | | $ | 0 |
| A | Aggregate amounts may reflect rounding. |
| Item 5. | AUDIT COMMITTEE OF LISTED REGISTRANTS |
Not applicable.
| Item 6. | SCHEDULE OF INVESTMENTS |
Not applicable.
| Item 7. | DISCLOSURE OF PROXY VOTING POLICIES AND PROCEDURES FOR CLOSED-END MANAGEMENT INVESTMENT COMPANIES |
Not applicable.
| Item 8. | PORTFOLIO MANAGERS OF CLOSED-END MANAGEMENT INVESTMENT COMPANIES |
Not applicable.
| Item 9. | PURCHASES OF EQUITY SECURITIES BY CLOSED-END MANAGEMENT INVESTMENT COMPANIES AND AFFILIATED PURCHASERS |
Not applicable.
| Item 10. | SUBMISSION OF MATTERS TO A VOTE OF SECURITY HOLDERS |
Not applicable.
| Item 11. | CONTROLS AND PROCEDURES |
(a) The Registrant’s principal executive and principal financial officers have concluded, based on their evaluation of the registrant’s disclosure controls and procedures as of a date within 90 days of the filing of this report, that the Registrant’s disclosure controls and procedures are reasonably designed to ensure that information required to be disclosed by the Registrant on Form N-CSR is recorded, processed, summarized and reported within the required time periods and that information required to be disclosed by the registrant in the reports that it files or submits on Form N-CSR is accumulated and communicated to the Registrant’s management, including its principal executive and principal financial officers, as appropriate to allow timely decisions regarding required disclosure.
(b) There were no changes in the Registrant’s internal control over financial reporting during the Registrant’s fourth fiscal quarter of the period covered by this report that have materially affected, or are reasonably likely to affect, the internal control over financial reporting.
| | |
| |
| (a)(1) | | Any Code of Ethics or amendments hereto. Filed herewith. |
| |
| (a)(2) | | Certifications pursuant to Rule 30a-2(a) under the Investment Company Act of 1940 - Filed herewith. |
| |
| (a)(3) | | Not applicable. |
| |
| (b) | | Certifications pursuant to Rule 30a-2(b) under the Investment Company Act of 1940 - Filed herewith. |
SIGNATURES
Pursuant to the requirements of the Securities Exchange Act of 1934 and the Investment Company Act of 1940, the registrant has duly caused this report to be signed on its behalf by the undersigned, thereunto duly authorized.
| | |
| MANAGERS TRUST I |
| |
| By: | | /s/ Peter M. Lebovitz |
| | Peter M. Lebovitz, President |
| |
| Date: | | December 29, 2006 |
Pursuant to the requirements of the Securities Exchange Act of 1934 and the Investment Company Act of 1940, this report has been signed below by the following persons on behalf of the registrant and in the capacities and on the dates indicated.
| | |
| |
| By: | | /s/ Peter M. Lebovitz |
| | Peter M. Lebovitz, President |
| |
| Date: | | December 29, 2006 |
| |
| By: | | /s/ Bruce M. Aronow |
| | Bruce M. Aronow, Chief Financial Officer |
| |
| Date: | | December 29, 2006 |