UNITED STATES
SECURITIES AND EXCHANGE COMMISSION
Washington, D.C. 20549
FORM N-CSR
CERTIFIED SHAREHOLDER REPORT OF REGISTERED
MANAGEMENT INVESTMENT COMPANIES
Investment Company Act file number: 811-06520
MANAGERS TRUST I
(Exact name of registrant as specified in charter)
800 Connecticut Avenue, Norwalk, Connecticut 06854
(Address of principal executive offices) (Zip code)
Managers Investment Group LLC
800 Connecticut Avenue, Norwalk, Connecticut 06854
(Name and address of agent for service)
Registrant’s telephone number, including area code: (203) 299-3500
Date of fiscal year end: OCTOBER 31
Date of reporting period: NOVEMBER 1, 2012 – OCTOBER 31, 2013
(Annual Shareholder Report)
| Item 1. | Reports to Shareholders |
Managers AMG FQ Funds
Annual Report — October 31, 2013
| | | | |
| TABLE OF CONTENTS | | Page | |
| |
LETTER TO SHAREHOLDERS | | | 2 | |
| |
ABOUT YOUR FUND’S EXPENSES | | | 3 | |
| |
PORTFOLIO MANAGER’S COMMENTS, FUND SNAPSHOTS, AND SCHEDULES OF PORTFOLIO INVESTMENTS | | | | |
| |
Managers AMG FQ Tax-Managed U.S. Equity Fund | | | 4 | |
| |
Managers AMG FQ U.S. Equity Fund | | | 9 | |
| |
Managers AMG FQ Global Alternatives Fund | | | 15 | |
| |
Managers AMG FQ Global Essentials Fund | | | 18 | |
| |
NOTES TO SCHEDULES OF PORTFOLIO INVESTMENTS | | | 22 | |
| |
FINANCIAL STATEMENTS | | | | |
| |
Statement of Assets and Liabilities | | | 32 | |
Balance sheets, net asset value (NAV) per share computations and cumulative undistributed amounts | | | | |
| |
Statement of Operations | | | 34 | |
Detail of sources of income, expenses, and realized and unrealized gains (losses) during the fiscal year | | | | |
| |
Statements of Changes in Net Assets | | | 35 | |
Detail of changes in assets for the past two fiscal years | | | | |
| |
FINANCIAL HIGHLIGHTS | | | 37 | |
Historical net asset values per share, distributions, total returns, income and expense ratios, turnover ratios and net assets | | | | |
| |
NOTES TO FINANCIAL HIGHLIGHTS | | | 43 | |
| |
NOTES TO FINANCIAL STATEMENTS | | | 44 | |
Accounting and distribution policies, details of agreements and transactions with Fund management and affiliates, and descriptions of certain investment risks | | | | |
| |
REPORT OF INDEPENDENT REGISTERED PUBLIC ACCOUNTING FIRM | | | 54 | |
| |
TRUSTEES AND OFFICERS | | | 55 | |
| |
ANNUAL RENEWAL OF INVESTMENT MANAGEMENT AND SUBADVISORY AGREEMENTS | | | 57 | |
Nothing contained herein is to be considered an offer, sale or solicitation of an offer to buy shares of any series of the Managers Family of Funds. Such offering is made only by Prospectus, which includes details as to offering price and other material information.
Letter to Shareholders
Dear Shareholder:
Thank you for your investment in The Managers Funds. Our foremost goal at Managers Investment Group is to provide investment products and solutions that help our shareholders and clients successfully reach their investment goals and objectives. We do this by offering a broad selection of Funds managed by a collection of Affiliated Managers Group’s (“AMG”) affiliate investment boutiques, along with a complementary series of open-architecture mutual funds.
The past year has been an exciting one for us at MIG. We were pleased to welcome the Brandywine Funds into the Managers Fund family several months ago. We have been excited to begin this new chapter in the 27-year history of the Brandywine Funds, while maintaining shareholders’ access to the same investment team that has guided the Brandywine Funds since inception using its research-driven investment approach.
We announced effective November 1, 2013 that the GW&K Small Cap Equity Fund would be closed to new investors with certain limited exceptions. The team at GW&K manages a total of $2.3 billion (as of October 31, 2013) in small-capitalization equities and closing the Fund to new investors allows the team to continue to execute on the investment process that has been effective for the team for more than a decade. We will continue to make decisions such as these that we believe are in the best interest of our shareholders.
Risky assets have done quite well thus far in 2013, with U.S. equity markets surpassing all-time highs. Ongoing global monetary easing, a low-yield environment, and healthy U.S. economic growth are supporting investor appetite for risk assets. Despite improving investor sentiment, risks remain, including uncertainty surrounding the Fed’s eventual exit from its ultra-accommodative monetary policy, ongoing fiscal headwinds in the U.S. and slower growth in emerging markets. Nevertheless, we are optimistic about the prospects for the upcoming year and we are confident that our Funds are well positioned to weather an uncertain economic environment.
We thank you for your continued confidence and investment in The Managers Funds. You can rest assured that under all market conditions our team is focused on delivering excellent investment management services for your benefit.
Respectfully,

Keitha Kinne
President
The Managers Funds
2
About Your Fund’s Expenses
As a shareholder of a Fund, you may incur two types of costs: (1) transaction costs, which may include sales charges (loads) on purchase payments; redemption fees; and exchange fees; and (2) ongoing costs, including management fees; distribution (12b-1) fees; and other Fund expenses. This example is intended to help you understand your ongoing costs (in dollars) of investing in the Fund and to compare these costs with the ongoing costs of investing in other mutual funds. The example is based on $1,000 invested at the beginning of the period and held for the entire period as indicated below.
Actual Expenses
The first line of the following table provides information about the actual account values and actual expenses. You may use the information in this line, together with the amount you invested, to estimate the expenses that you paid over the period. Simply divide your account value by $1,000 (for example, an $8,600 account value divided by $1,000 = 8.6), then multiply the result by the number in the first line under the heading entitled “Expenses Paid During Period” to estimate the expenses you paid on your account during this period.
Hypothetical Example for Comparison Purposes
The second line of the following table provides information about hypothetical account values and hypothetical expenses based on the Fund’s actual expense ratio and an assumed annual rate of return of 5% before expenses, which is not the Fund’s actual return. The hypothetical account values and expenses may not be used to estimate the actual ending account balance or expenses you paid for the period. You may use this information to compare the ongoing costs of investing in the Fund and other funds by comparing this 5% hypothetical example with the 5% hypothetical examples that appear in the shareholder reports of other funds.
Please note that the expenses shown in the table are meant to highlight your on going costs only and do not reflect any transactional costs, such as sales charges (loads), redemption fees, or exchange fees. Therefore, the second line of the table is useful in comparing ongoing costs only, and will not help you determine the relative total costs of owning different funds.
| | | | | | | | | | | | | | | | | | |
| | | Six Months Ended October 31, 2013 | | Expense
Ratio for
the Period | | | Beginning
Account
Value
5/01/13 | | | Ending
Account
Value
10/31/13 | | | Expenses
Paid
During
the Period* | |
| | Managers AMG FQ Tax-Managed U.S. Equity Fund | | | | | | | | | | | | | | | | |
| | Investor Class Shares** | | | | | | | | | | | | | | | | |
| | Based on Actual Fund Return | | | 1.24 | % | | $ | 1,000 | | | $ | 1,141 | | | $ | 6.69 | |
| | Hypothetical (5% return before expenses) | | | 1.24 | % | | $ | 1,000 | | | $ | 1,019 | | | $ | 6.31 | |
| | Institutional Class Shares | | | | | | | | | | | | | | | | |
| | Based on Actual Fund Return | | | 0.99 | % | | $ | 1,000 | | | $ | 1,144 | | | $ | 5.35 | |
| | Hypothetical (5% return before expenses) | | | 0.99 | % | | $ | 1,000 | | | $ | 1,020 | | | $ | 5.04 | |
| | Managers AMG FQ U.S. Equity Fund | | | | | | | | | | | | | | | | |
| | Investor Class Shares** | | | | | | | | | | | | | | | | |
| | Based on Actual Fund Return | | | 1.04 | % | | $ | 1,000 | | | $ | 1,105 | | | $ | 5.52 | |
| | Hypothetical (5% return before expenses) | | | 1.04 | % | | $ | 1,000 | | | $ | 1,020 | | | $ | 5.30 | |
| | Institutional Class Shares | | | | | | | | | | | | | | | | |
| | Based on Actual Fund Return | | | 0.79 | % | | $ | 1,000 | | | $ | 1,107 | | | $ | 4.20 | |
| | Hypothetical (5% return before expenses) | | | 0.79 | % | | $ | 1,000 | | | $ | 1,021 | | | $ | 4.02 | |
| | Managers AMG FQ Global Alternatives Fund | | | | | | | | | | | | | | | | |
| | Investor Class Shares** | | | | | | | | | | | | | | | | |
| | Based on Actual Fund Return | | | 1.88 | % | | $ | 1,000 | | | $ | 1,005 | | | $ | 9.50 | |
| | Hypothetical (5% return before expenses) | | | 1.88 | % | | $ | 1,000 | | | $ | 1,016 | | | $ | 9.55 | |
| | Service Class Shares | | | | | | | | | | | | | | | | |
| | Based on Actual Fund Return | | | 1.57 | % | | $ | 1,000 | | | $ | 1,007 | | | $ | 7.94 | |
| | Hypothetical (5% return before expenses) | | | 1.57 | % | | $ | 1,000 | | | $ | 1,017 | | | $ | 7.98 | |
| | Institutional Class Shares | | | | | | | | | | | | | | | | |
| | Based on Actual Fund Return | | | 1.44 | % | | $ | 1,000 | | | $ | 1,007 | | | $ | 7.28 | |
| | Hypothetical (5% return before expenses) | | | 1.44 | % | | $ | 1,000 | | | $ | 1,018 | | | $ | 7.32 | |
| | Managers AMG FQ Global Essentials Fund | | | | | | | | | | | | | | | | |
| | Investor Class Shares | | | | | | | | | | | | | | | | |
| | Based on Actual Fund Return | | | 1.39 | % | | $ | 1,000 | | | $ | 953 | | | $ | 6.84 | |
| | Hypothetical (5% return before expenses) | | | 1.39 | % | | $ | 1,000 | | | $ | 1,018 | | | $ | 7.07 | |
| | Service Class Shares | | | | | | | | | | | | | | | | |
| | Based on Actual Fund Return | | | 0.92 | % | | $ | 1,000 | | | $ | 956 | | | $ | 4.54 | |
| | Hypothetical (5% return before expenses) | | | 0.92 | % | | $ | 1,000 | | | $ | 1,021 | | | $ | 4.69 | |
| | Institutional Class Shares | | | | | | | | | | | | | | | | |
| | Based on Actual Fund Return | | | 0.89 | % | | $ | 1,000 | | | $ | 955 | | | $ | 4.39 | |
| | Hypothetical (5% return before expenses) | | | 0.89 | % | | $ | 1,000 | | | $ | 1,021 | | | $ | 4.53 | |
| | * Expenses are equal to the Fund’s annualized expense ratio multiplied by the average account value over the period, multiplied by the number of days in the most recent fiscal half-year (184), then divided by 365. ** Effective as of the close of business November 30, 2012, all Class A shares were renamed Investor Class shares and Class C shares converted to Investor Class shares. | |
Managers AMG FQ Tax-Managed U.S. Equity Fund
Portfolio Manager’s Comments
THE YEAR IN REVIEW
For the fiscal year ended October 31, 2013, the Managers AMG FQ Tax-Managed U.S. Equity Fund (Investor Class) returned 31.31%, compared to 28.99% for its benchmark, the Russell 3000® Index. Please refer to the table on page 36 for returns for various classes of shares.
U.S. equities continued their multi-year rally over the prior fiscal year as the Federal Reserve (the “Fed”) continued to fuel the rally with a combination of its easy money short- and long-term interest rate policies. With the exception of the May/June time period when investors became skittish about the prospects of the Federal Reserve pulling back on its third round of quantitative easing, equities moved ahead steadily and consistently throughout the year while frequently reaching new all-time highs. Investors’ skepticism generally remains, however, as both macro and micro conditions have only shown modest improvement throughout the year. While the likelihood appears that we are not headed for another recession in the near-future, prospects for a tepid recovery remain high and investors now fear the combination of high valuations for equities and the inevitable withdrawal of bond-buying from the Fed. For the entire one-year period ended October 31, 2013, smaller-cap equities generally outperformed their larger-cap brethren with the Russell 1000® (large cap), Russell 2000® (small cap), Russell 3000® (all cap), and the Russell Microcap® Indices returning 28.40%, 36.28%, 28.99%, and 38.72%, respectively.
The Fund delivered positive absolute returns for the prior fiscal year while outperforming the benchmark Russell 3000® Index as well. Stock selection added value during the year with a majority of gains concentrated within the industrials sector. Meanwhile sector positioning relative to the benchmark was close to neutral throughout the year consistent with the Fund’s investment process and, therefore, failed to add or detract significant value. Exposure to top-down factors offered mixed results relative to the benchmark throughout the year as well.
The Fund’s subadvisor, First Quadrant L.P. (“First Quadrant”) maintains a neutral positioning on market capitalization as it has for most of the past year. The indicators First Quadrant tracks have been biased towards small stocks, but not sufficiently to overcome a threshold First Quadrant imposes to control transaction costs. The outlook for price momentum is moderately positive as the economy continues to advance, which is positive for momentum. The Fund also maintains a modest value bias but one somewhat reduced from earlier in the year. At the sector level, the Fund maintains modest overweights to the information technology and telecomm sectors relative to the benchmark Russell 3000® Index but enters the new fiscal year with sector weightings broadly in-line with the benchmark. As a tax advantaged Fund, the Portfolio is managed to seek positive pre-tax and after-tax alpha. For this reason, First Quadrant employs tax-aware optimization which uses losses to offset gains as the Portfolio is repositioned. Currently most of the Portfolio is locked up in gains, however, the Fund continues to maintain a large tax loss carry-forward, all of which will expire in 2017.
This commentary reflects the viewpoints of the portfolio manager, First Quadrant L.P, as of October 31, 2013 and is not intended as a forecast or guarantee of future results, and is subject to change without notice.
CUMULATIVE TOTAL RETURN PERFORMANCE
Managers AMG FQ Tax-Managed U.S. Equity Fund’s cumulative total return is based on the daily change in net asset value (NAV), and assumes that all distributions were reinvested. This chart compares a hypothetical $10,000 investment made in the Institutional Class Shares of the Fund on October 31, 2003 with a $10,000 investment made in the Russell 3000® Index for the same time period. Performance for periods longer than one year is annualized. The graph and table do not reflect the deduction of taxes that a shareholder would pay on a Fund distribution or redemption of shares. The listed returns for the Fund are net of expenses and the returns for the index exclude expenses. Past performance is not indicative of future results. Total returns would have been lower had certain expenses not been reduced.
4
Managers AMG FQ Tax-Managed U.S. Equity Fund
Portfolio Manager’s Comments (continued)
CUMULATIVE TOTAL RETURN PERFORMANCE (continued)
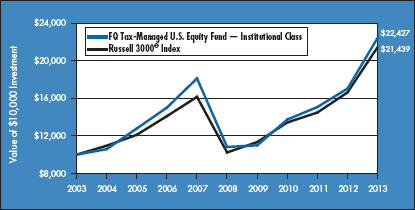
The table below shows the average annual total returns for the Managers AMG FQ Tax-Managed U.S. Equity Fund and the Russell 3000® Index for the same time periods ended October 31, 2013.
| | | | | | | | | | | | | | | | | | | | |
| | | Average Annual Total Returns1 | |
| | | One Year | | | Five Years | | | Ten Years | | | Since
Inception | | | Inception Date | |
Managers AMG FQ Tax-Managed U.S. Equity Fund 2,3 | |
Investor Class* | | | 31.31 | % | | | 15.43 | % | | | — | | | | 6.12 | % | | | 03/01/06 | |
Institutional Class | | | 31.72 | % | | | 15.70 | % | | | 8.41 | % | | | 6.06 | % | | | 12/18/00 | |
Russell 3000® Index 4 | | | 28.99 | % | | | 15.94 | % | | | 7.92 | % | | | 4.92 | % | | | 12/18/00 | |
Return After Tax on Distributions:5 | | | | | | | | | | | | | |
Investor Class* | | | 31.15 | % | | | 15.35 | % | | | — | | | | 6.07 | % | | | 03/01/06 | |
Institutional Class | | | 31.53 | % | | | 15.57 | % | | | 8.32 | % | | | 5.96 | % | | | 12/18/00 | |
Return After Tax on Distribution & Sale of Shares:5 | |
Investor Class* | | | 17.93 | % | | | 12.45 | % | | | — | | | | 4.86 | % | | | 03/01/06 | |
Institutional Class | | | 18.20 | % | | | 12.68 | % | | | 6.88 | % | | | 4.93 | % | | | 12/18/00 | |
The performance data shown represents past performance. Past performance is not a guarantee of future results. Current performance may be lower or higher than the performance data quoted. The investment return and principal value of an investment in the Fund will fluctuate so that an investor’s shares, when redeemed, may be worth more or less than their original cost. For performance information through the most recent month end, please call (800) 835-3879 or visit our Web site at www.managersinvest.com. Current net asset values per share for each Fund are available on the Fund’s Web site at www.managersinvest.com.
Investors should carefully consider the Fund’s investment objectives, risks, charges, and expenses before investing. For this and other information, please call (800) 835-3879 or visit our Web site at www.managersinvest.com for a free prospectus. Read it carefully before investing or sending money. Funds are distributed by Managers Distributors, Inc., member FINRA.
| * | The performance information for the Fund’s Investor Class shares (formerly Class A shares, were renamed Investor Class shares as of December 1, 2012) for periods prior to December 1, 2012 does not reflect the impact of the front-end and deferred sales charges (loads) that were in effect until December 1, 2012. |
| | |
1 | | Total return equals income yield plus share price change and assumes reinvestment of all dividends and capital gain distributions. Returns are net of fees and may reflect offsets of Fund expenses as described in the Prospectus. No adjustment has been made for taxes payable by shareholders on their reinvested dividends and capital gain distributions. Returns for periods greater than one year are the average annual returns. The listed returns on the Fund are net of expenses and based on the published NAV as of October 31, 2013. All returns are in U.S. dollars ($). |
2 | | From time to time, the Fund’s advisor has waived its fees and/or absorbed Fund expenses, which has resulted in higher returns. |
3 | | The Fund invests in large-capitalization companies that may underperform other stock funds (such as funds that focus on small and medium capitalization companies) when stocks of large-capitalization companies are out of favor. Although the Fund is managed to minimize taxable distributions, it may not be able to avoid taxable distributions. |
4 | | The Russell 3000® Index is composed of the 3,000 largest U.S. companies as measured by market capitalization, and represents approximately 98% of the U.S. stock market. Unlike the Fund, the Russell 3000® Index is unmanaged, is not available for investment, and does not incur expenses. |
5 | | After-tax returns are calculated using the historical highest individual federal marginal income tax rates and do not reflect the impact of state and local taxes. Actual after-tax returns depend on an investor’s tax situation and may differ from those shown, and after-tax returns are not relevant to investors who hold their Fund shares through tax-deferred arrangements, such as 401(k) plans or individual retirement accounts. |
| Not FDIC insured, nor bank guaranteed. May lose value. |
5
Managers AMG FQ Tax-Managed U.S. Equity Fund
Fund Snapshots
October 31, 2013
Portfolio Breakdown (unaudited)
| | | | | | | | |
Industry | | Managers AMG FQ
Tax-Managed
U.S. Equity Fund** | | | Russell 3000®
Index | |
Information Technology | | | 21.3 | % | | | 17.8 | % |
Financials | | | 14.9 | % | | | 17.3 | % |
Industrials | | | 12.8 | % | | | 11.5 | % |
Health Care | | | 12.2 | % | | | 12.5 | % |
Consumer Discretionary | | | 11.1 | % | | | 13.4 | % |
Energy | | | 9.5 | % | | | 9.5 | % |
Consumer Staples | | | 8.7 | % | | | 8.8 | % |
Materials | | | 3.7 | % | | | 3.8 | % |
Telecommunication Services | | | 3.3 | % | | | 2.2 | % |
Utilities | | | 0.8 | % | | | 3.2 | % |
Other Assets and Liabilities | | | 1.7 | % | | | 0.0 | % |
| ** | As a percentage of net assets |
Top Ten Holdings (unaudited)
| | | | |
Security Name | | %of
Net Assets | |
Chevron Corp.* | | | 3.0 | % |
Exxon Mobil Corp.* | | | 3.0 | |
Apple, Inc.* | | | 2.6 | |
International Business Machines Corp.* | | | 2.5 | |
Berkshire Hathaway, Inc., Class B* | | | 2.4 | |
MasterCard, Inc., Class A* | | | 2.3 | |
Visa, Inc., Class A* | | | 2.2 | |
DIRECTV* | | | 2.0 | |
Kroger Co., The | | | 1.7 | |
Microsoft Corp. | | | 1.6 | |
| | | | |
Top Ten as a Group | | | 23.3 | % |
| | | | |
| * | Top Ten Holding at April 30, 2013 |
Any sectors, industries, or securities discussed should not be perceived as investment recommendations. Mention of a specific security should not be considered a recommendation to buy or solicitation to sell that security. Specific securities mentioned in this report may have been sold from the Fund’s portfolio of investments by the time you receive this report.
6
Managers AMG FQ Tax-Managed U.S. Equity Fund
Schedule of Portfolio Investments
October 31, 2013
| | | | | | | | |
| | | Shares | | | Value | |
Common Stocks - 98.3% | | | | | | | | |
Consumer
Discretionary - 1.1% | | | | | | | | |
Aaron’s, Inc.* | | | 3,300 | | | $ | 93,621 | |
Bed Bath & Beyond, Inc.* | | | 6,400 | | | | 494,848 | |
Dillard’s, Inc., Class A | | | 8,900 | | | | 729,622 | |
DIRECTV* | | | 16,100 | | | | 1,006,089 | |
Discovery Communications, Inc., Class A* | | | 1,400 | | | | 124,488 | |
Gap, Inc., The | | | 14,000 | | | | 517,860 | |
Home Depot, Inc., The | | | 500 | | | | 38,945 | |
Jack in the Box, Inc.* | | | 12,200 | | | | 496,296 | |
Johnson Outdoors, Inc., Class A | | | 1,500 | | | | 41,145 | |
Liberty Global PLC, Class A* | | | 900 | | | | 70,533 | |
Lowe’s Cos., Inc. | | | 7,000 | | | | 348,460 | |
Macy’s, Inc. | | | 9,700 | | | | 447,267 | |
Ross Stores, Inc. | | | 700 | | | | 54,145 | |
Target Corp. | | | 2,000 | | | | 129,580 | |
TJX Cos., Inc. | | | 11,600 | | | | 705,164 | |
Visteon Corp.* | | | 2,800 | | | | 215,852 | |
Total Consumer Discretionary | | | | | | | 5,513,915 | |
Consumer Staples - 8.7% | | | | | | | | |
Archer-Daniels-Midland Co. | | | 2,300 | | | | 94,070 | |
CVS Caremark Corp. | | | 9,200 | | | | 572,792 | |
Hershey Co., The | | | 1,900 | | | | 188,556 | |
Kroger Co., The | | | 19,500 | | | | 835,380 | |
Oil-Dri Corp. of America | | | 1,400 | | | | 49,686 | |
Philip Morris International, Inc. | | | 6,400 | | | | 570,368 | |
Pilgrim’s Pride Corp.* | | | 34,500 | | | | 488,865 | |
Procter & Gamble Co., The | | | 3,400 | | | | 274,550 | |
Safeway, Inc. | | | 5,800 | | | | 202,420 | |
Tyson Foods, Inc., Class A | | | 16,200 | | | | 448,254 | |
Wal-Mart Stores, Inc. | | | 7,400 | | | | 567,950 | |
Total Consumer Staples | | | | | | | 4,292,891 | |
Energy - 9.5% | | | | | | | | |
Chevron Corp. | | | 12,300 | | | | 1,475,508 | |
ConocoPhillips | | | 10,800 | | | | 791,640 | |
Exxon Mobil Corp. | | | 16,400 | | | | 1,469,768 | |
Marathon Petroleum Corp. | | | 4,700 | | | | 336,802 | |
Occidental Petroleum Corp. | | | 3,500 | | | | 336,280 | |
Phillips 66 | | | 4,600 | | | | 296,378 | |
Total Energy | | | | | | | 4,706,376 | |
Financials - 14.9% | | | | | | | | |
American Financial Group, Inc. | | | 1,800 | | | | 101,268 | |
American International Group, Inc. | | | 4,900 | | | | 253,085 | |
American Tower Corp. | | | 800 | | | | 63,480 | |
| | | | | | | | |
| | | Shares | | | Value | |
Arch Capital Group, Ltd.* | | | 11,700 | | | $ | 678,132 | |
Bank of America Corp. | | | 7,100 | | | | 99,116 | |
Berkshire Hathaway, Inc., Class A* | | | 1 | | | | 172,995 | |
Berkshire Hathaway, Inc., Class B* | | | 10,287 | | | | 1,183,828 | |
Central Pacific Financial Corp. | | | 7,800 | | | | 143,676 | |
Chubb Corp., The | | | 2,200 | | | | 202,576 | |
Citigroup, Inc. | | | 3,600 | | | | 175,608 | |
Crawford & Co., Class B | | | 4,700 | | | | 51,653 | |
Discover Financial Services | | | 10,500 | | | | 544,740 | |
Everest Re Group, Ltd. | | | 2,200 | | | | 338,228 | |
FelCor Lodging Trust, Inc.* | | | 7,300 | | | | 49,056 | |
First Defiance Financial Corp. | | | 1,000 | | | | 25,820 | |
Franklin Resources, Inc. | | | 1,800 | | | | 96,948 | |
GAMCO Investors, Inc., Class A | | | 3,300 | | | | 235,983 | |
Goldman Sachs Group, Inc., The | | | 900 | | | | 144,774 | |
Hanmi Financial Corp. | | | 18,900 | | | | 330,372 | |
JPMorgan Chase & Co. | | | 10,400 | | | | 536,016 | |
KeyCorp | | | 25,800 | | | | 323,274 | |
Morgan Stanley | | | 1,200 | | | | 34,476 | |
PNC Financial Services Group, Inc., The | | | 2,300 | | | | 169,119 | |
PrivateBancorp, Inc. | | | 15,300 | | | | 372,708 | |
Provident Financial Holdings, Inc. | | | 1,900 | | | | 28,804 | |
SunTrust Banks, Inc. | | | 15,800 | | | | 531,512 | |
United Community Banks, Inc.* | | | 15,400 | | | | 240,086 | |
World Acceptance Corp.*,1 | | | 2,500 | | | | 260,300 | |
Total Financials | | | | | | | 7,387,633 | |
Health Care - 12.2% | | | | | | | | |
Actavis PLC* | | | 2,924 | | | | 451,992 | |
Amgen, Inc. | | | 6,300 | | | | 730,800 | |
Anika Therapeutics, Inc.* | | | 9,800 | | | | 292,726 | |
ArthroCare Corp.* | | | 3,700 | | | | 138,528 | |
Atrion Corp. | | | 251 | | | | 67,062 | |
Biogen Idec, Inc.* | | | 2,350 | | | | 573,846 | |
Cantel Medical Corp. | | | 2,250 | | | | 78,975 | |
CareFusion Corp.* | | | 14,600 | | | | 566,042 | |
Cyberonics, Inc.* | | | 2,400 | | | | 138,624 | |
Depomed, Inc.* | | | 3,500 | | | | 25,200 | |
Emergent Biosolutions, Inc.* | | | 1,300 | | | | 25,389 | |
Humana, Inc. | | | 1,800 | | | | 165,870 | |
Johnson & Johnson | | | 3,200 | | | | 296,352 | |
Lannett Co., Inc.* | | | 8,900 | | | | 210,129 | |
McKesson Corp. | | | 1,800 | | | | 281,412 | |
Medtronic, Inc. | | | 11,500 | | | | 660,100 | |
Pfizer, Inc. | | | 5,200 | | | | 159,536 | |
The accompanying notes are an integral part of these financial statements.
7
Managers AMG FQ Tax-Managed U.S. Equity Fund
Schedule of Portfolio Investments (continued)
| | | | | | | | |
| | | Shares | | | Value | |
Health Care - 12.2% (continued) | | | | | | | | |
Sciclone Pharmaceuticals, Inc.* | | | 10,800 | | | $ | 51,084 | |
SurModics, Inc.* | | | 19,000 | | | | 448,020 | |
UnitedHealth Group, Inc. | | | 10,100 | | | | 689,426 | |
Total Health Care | | | | | | | 6,051,113 | |
Industrials - 12.8% | | | | | | | | |
Alaska Air Group, Inc. | | | 11,200 | | | | 791,392 | |
AMERCO | | | 2,600 | | | | 525,018 | |
Consolidated Graphics, Inc.* | | | 7,200 | | | | 461,448 | |
Delta Air Lines, Inc. | | | 20,650 | | | | 544,747 | |
FedEx Corp. | | | 5,500 | | | | 720,500 | |
General Electric Co. | | | 7,800 | | | | 203,892 | |
Navigant Consulting, Inc.* | | | 8,700 | | | | 150,945 | |
Oshkosh Corp.* | | | 9,800 | | | | 466,382 | |
RPX Corp.* | | | 23,700 | | | | 423,282 | |
Swift Transportation Co.*,1 | | | 32,100 | | | | 699,459 | |
Towers Watson & Co., Class A | | | 2,200 | | | | 252,582 | |
UniFirst Corp. | | | 4,800 | | | | 493,536 | |
Union Pacific Corp. | | | 3,800 | | | | 575,320 | |
VSE Corp. | | | 600 | | | | 26,280 | |
Total Industrials | | | | | | | 6,334,783 | |
Information
Technology - 21.3% | | | | | | | | |
Activision Blizzard, Inc. | | | 28,000 | | | | 465,920 | |
Aeroflex Holding Corp.* | | | 5,700 | | | | 44,175 | |
Anaren, Inc.* | | | 5,100 | | | | 127,398 | |
Apple, Inc. | | | 2,513 | | | | 1,312,665 | |
Avnet, Inc. | | | 8,000 | | | | 317,600 | |
Benchmark Electronics, Inc.* | | | 17,000 | | | | 386,410 | |
Brocade Communications Systems, Inc.* | | | 5,100 | | | | 40,902 | |
Cisco Systems, Inc. | | | 21,500 | | | | 483,750 | |
EMC Corp. | | | 6,500 | | | | 156,455 | |
Google, Inc., Class A* | | | 301 | | | | 310,205 | |
International Business Machines Corp. | | | 6,800 | | | | 1,218,628 | |
MasterCard, Inc., Class A | | | 1,558 | | | | 1,117,242 | |
Microsoft Corp. | | | 22,700 | | | | 802,445 | |
Oracle Corp. | | | 23,600 | | | | 790,600 | |
PC Connection, Inc. | | | 13,900 | | | | 277,861 | |
Sanmina Corp.* | | | 19,900 | | | | 289,744 | |
SYNNEX Corp.* | | | 9,400 | | | | 576,220 | |
TiVo, Inc.* | | | 39,100 | | | | 519,639 | |
Visa, Inc., Class A | | | 5,600 | | | | 1,101,352 | |
| | | | | | | | |
| | | Shares | | | Value | |
Xerox Corp. | | | 20,900 | | | $ | 207,746 | |
Total Information Technology | | | | | | | 10,546,957 | |
Materials - 3.7% | | | | | | | | |
CF Industries Holdings, Inc. | | | 2,205 | | �� | | 475,398 | |
Graphic Packaging Holding Co.* | | | 25,300 | | | | 212,520 | |
KapStone Paper and Packaging Corp. | | | 2,500 | | | | 129,900 | |
LyondellBasell Industries N.V., Class A | | | 8,100 | | | | 604,260 | |
Westlake Chemical Corp. | | | 4,000 | | | | 429,680 | |
Total Materials | | | | | | | 1,851,758 | |
Telecommunication
Services - 3.3% | | | | | | | | |
AT&T, Inc. | | | 14,900 | | | | 539,380 | |
T-Mobile US, Inc.* | | | 13,450 | | | | 372,969 | |
United States Cellular Corp. | | | 4,300 | | | | 208,120 | |
Verizon Communications, Inc. | | | 10,300 | | | | 520,253 | |
Total
Telecommunication
Services | | | | | | | 1,640,722 | |
Utilities - 0.8% | | | | | | | | |
AES Corp., The | | | 27,000 | | | | 380,430 | |
Total Common Stocks (cost $32,794,778) | | | | | | | 48,706,578 | |
| | | Principal
Amount | | | | |
Short-Term
Investments - 3.0% | | | | | | | | |
Repurchase
Agreements - 1.3%2 | | | | | | | | |
BNP Paribas Securities Corp., dated 10/31/13, due 11/01/13, 0.090%, total to be received $642,544 (collateralized by various U.S. Government Agency Obligations, 0.250% - 3.125%, 02/28/14 - 02/15/43, totaling $655,393) | | $ | 642,542 | | | | 642,542 | |
| | | Shares | | | | |
Other Investment
Companies - 1.7%3 | | | | | | | | |
Dreyfus Institutional Cash Advantage Fund, Institutional Class Shares, 0.06% | | | 830,073 | | | | 830,073 | |
Total Short-Term Investments
(cost $1,472,615) | | | | | | | 1,472,615 | |
Total Investments - 101.3% (cost $34,267,393) | | | | | | | 50,179,193 | |
Other Assets, less
Liabilities - (1.3)% | | | | | | | (647,341 | ) |
Net Assets - 100.0% | | | | | | $ | 49,531,852 | |
The accompanying notes are an integral part of these financial statements.
8
Managers AMG FQ U.S. Equity Fund
Portfolio Manager’s Comments
THE YEAR IN REVIEW
For the fiscal year ended October 31, 2013, the Managers AMG FQ U.S. Equity Fund (Investor Class) returned 25.66%, compared to 28.99% for its benchmark, the Russell 3000® Index. Please refer to the table on page 37 for returns for various classes of shares.
U.S. equities continued their multi-year rally over the prior fiscal year as the Federal Reserve (the “Fed”) continued to fuel the rally with a combination of its easy money short- and long-term interest rate policies. With the exception of the May/June time period when investors became skittish about the prospects of the Federal Reserve pulling back on its third round of quantitative easing, equities moved ahead steadily and consistently throughout the year while frequently reaching new all-time highs. Investors skepticism generally remains, however, as both macro and micro conditions have only shown modest improvement throughout the year. While the likelihood appears that we are not headed for another recession in the near-future, prospects for a tepid recovery remain high and investors now fear the combination of high valuations for equities and the inevitable withdrawal of bond-buying from the Fed. For the entire one-year period ended October 31, 2013, smaller-cap equities generally outperformed their larger-cap brethren with the Russell 1000® (large cap), Russell 2000® (small cap), Russell 3000® (all cap), and the Russell Microcap® Indices returning 28.40%, 36.28%, 28.99%, and 38.72%, respectively.
The Fund delivered strong positive absolute returns for the prior fiscal year but trailed the benchmark during this time. The Fund detracted value from both the equity-only portion of its portfolio as well as from its put-spread collar options (protection strategy) positions. Stock selection weakness within the financials and health care sectors detracted from performance throughout the year although the Fund did benefit from strong selection within the industrials sector. Meanwhile, sector positioning relative to the benchmark was close to neutral throughout the year consistent with the Fund’s investment process and, therefore, failed to add or detract significant value. Exposure to top-down factors offered mixed results relative to the benchmark throughout the year. The
Fund’s protection strategy, an enhancement added to the Fund the prior fiscal year, as expected, detracted from performance as equity markets generally moved upward during this period.
The Fund’s subadvisor, First Quadrant L.P. (“First Quadrant”) maintains a neutral positioning on market capitalization as it has for most of the past year. The indicators First Quadrant tracks have been biased towards small stocks, but not sufficiently to overcome a threshold First Quadrant imposes to control transaction costs. The outlook for price momentum is moderately positive as the economy continues to advance, which is positive for momentum. The Fund also maintains a modest value bias but one somewhat reduced from earlier in the year. At the sector level, the Fund maintains modest overweights to the financials and information technology sectors relative to the benchmark Russell 3000® Index but enters the new fiscal year with sector weightings broadly in-line with the benchmark.
This commentary reflects the viewpoints of the portfolio manager, First Quadrant L.P, as of October 31, 2013 and is not intended as a forecast or guarantee of future results, and is subject to change without notice.
CUMULATIVE TOTAL RETURN PERFORMANCE
Managers AMG FQ U.S. Equity Fund’s cumulative total return is based on the daily change in net asset value (NAV), and assumes that all distributions were reinvested. This chart compares a hypothetical $10,000 investment made in the Institutional Class Shares of the Fund on October 31, 2003 with a $10,000 investment made in the Russell 3000® Index for the same time period. Performance for periods longer than one year is annualized. The graph and table do not reflect the deduction of taxes that a shareholder would pay on a Fund distribution or redemption of shares. The listed returns for the Fund are net of expenses and the returns for the index exclude expenses. Past performance is not indicative of future results. Total returns would have been lower had certain expenses not been reduced.
Managers AMG FQ U.S. Equity Fund
Portfolio Manager’s Comments (continued)
CUMULATIVE TOTAL RETURN PERFORMANCE (continued)
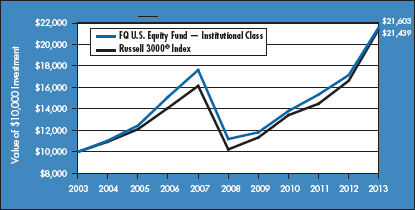
The table below shows the average annual total returns for the Managers AMG FQ U.S. Equity Fund and the Russell 3000® Index for the same time periods ended October 31, 2013.
| | | | | | | | | | | | | | | | | | | | |
| | | Average Annual Total Returns1 | |
| | One Year | | | Five Years | | | Ten Years | | | Since
Inception | | | Inception Date | |
Managers AMG FQ U.S. Equity Fund 2,3 | |
Investor Class* | | | 25.66 | % | | | 13.73 | % | | | — | | | | 5.80 | % | | | 03/01/06 | |
Institutional Class | | | 26.00 | % | | | 14.04 | % | | | 8.01 | % | | | 8.20 | % | | | 08/14/92 | |
Russell 3000® Index4,5 | | | 28.99 | % | | | 15.94 | % | | | 7.92 | % | | | 9.45 | % | | | 08/31/92 | |
The performance data shown represents past performance. Past performance is not a guarantee of future results. Current performance may be lower or higher than the performance data quoted. The investment return and principal value of an investment in the Fund will fluctuate so that an investor’s shares, when redeemed, may be worth more or less than their original cost. For performance information through the most recent month end, please call (800) 835-3879 or visit our Web site at www.managersinvest.com. Current net asset values per share for each Fund are available on the Fund’s Web site at www.managersinvest.com.
Investors should carefully consider the Fund’s investment objectives, risks, charges and expenses before investing. For this and other information, please call (800) 835-3879 or visit our Web site at www.managersinvest.com for a free prospectus. Read it carefully before investing or sending money. Funds are distributed by Managers Distributors, Inc., member FINRA.
| * | The performance information for the Fund’s Investor Class shares (formerly Class A shares, were renamed Investor Class shares as of December 1, 2012) for periods prior to December 1, 2012 does not reflect the impact of the front-end and deferred sales charges (loads) that were in effect until December 1, 2012. |
| 1 | Total return equals income yield plus share price change and assumes reinvestment of all dividends and capital gain distributions. Returns are net of fees and may reflect offsets of Fund expenses as described in the Prospectus. No adjustment has been made for taxes payable by shareholders on their reinvested dividends and capital gain distributions. Returns for periods greater than one year are the average annual returns. The listed returns on the Fund are net of expenses and based on the published NAV as of October 31, 2013. All returns are in U.S. dollars ($). |
| 2 | From time to time, the Fund’s advisor has waived its fees and/or absorbed Fund expenses, which has resulted in higher returns. |
| 3 | The Fund invests in large-capitalization companies that may underperform other stock funds (such as funds that focus on small and medium capitalization companies) when stocks of large-capitalization companies are out of favor. Also, the Fund may invest in derivatives; the complexity and rapidly changing structure of derivatives markets may increase the possibility of market losses. |
| | |
4 | | The Russell 3000® Index is composed of the 3,000 largest U.S. companies as measured by market capitalization, and represents approximately 98% of the U.S. stock market. Unlike the Fund, the Russell 3000® Index is unmanaged, is not available for investment, and does not incur expenses. |
5 | | The date reflects the closest available index date to the Fund’s inception date. |
Not FDIC insured, nor bank guaranteed. May lose value. |
| |
| |
| |
| |
| |
| |
| |
|
| |
| |
| |
| |
| |
| |
| |
| |
| |
| |
| |
| |
| |
| |
| |
| |
| |
| |
| |
| |
| |
| |
| |
| |
| |
| |
| |
| |
| |
| |
| |
| |
| |
| |
| |
| |
| |
| |
| |
| |
| |
| |
| |
| |
| |
| |
| |
10
Managers AMG FQ U.S. Equity Fund
Fund Snapshots
October 31, 2013
Portfolio Breakdown (unaudited)
| | | | | | | | |
Industry | | Managers AMG FQ U.S. Equity
Fund** | | | Russell 3000®
Index | |
Information Technology | | | 18.7 | % | | | 17.8 | % |
Financials | | | 18.3 | % | | | 17.3 | % |
Consumer Discretionary | | | 12.7 | % | | | 13.4 | % |
Industrials | | | 11.7 | % | | | 11.5 | % |
Health Care | | | 11.4 | % | | | 12.5 | % |
Consumer Staples | | | 8.9 | % | | | 8.8 | % |
Energy | | | 8.7 | % | | | 9.5 | % |
Materials | | | 3.8 | % | | | 3.8 | % |
Telecommunication Services | | | 3.3 | % | | | 2.2 | % |
Utilities | | | 1.6 | % | | | 3.2 | % |
Other Assets and Liabilities | | | 0.9 | % | | | 0.0 | % |
| ** | As a percentage of net assets |
Top Ten Holdings (unaudited)
| | | | |
Security Name | | % of
Net Assets | |
Exxon Mobil Corp.* | | | 2.7 | % |
Berkshire Hathaway, Inc., Class B | | | 2.1 | |
JPMorgan Chase & Co. | | | 2.0 | |
Microsoft Corp.* | | | 2.0 | |
AT&T, Inc.* | | | 1.9 | |
Chevron Corp.* | | | 1.9 | |
Apple, Inc.* | | | 1.9 | |
Medtronic, Inc. | | | 1.6 | |
Cisco Systems, Inc.* | | | 1.6 | |
Union Pacific Corp.* | | | 1.5 | |
Top Ten as a Group | | | 19.2 | % |
| * | Top Ten Holding at April 30, 2013 |
Any sectors, industries, or securities discussed should not be perceived as investment recommendations. Mention of a specific security should not be considered a recommendation to buy or solicitation to sell that security. Specific securities mentioned in this report may have been sold from the Fund’s portfolio of investments by the time you receive this report.
11
Managers AMG FQ U.S. Equity Fund
Schedule of Portfolio Investments
October 31, 2013
| | | | | | | | |
| | | Shares | | | Value | |
Common Stocks - 99.1% | | | | | | | | |
Consumer
Discretionary - 12.7% | | | | | | | | |
Bally Technologies, Inc.* | | | 9,200 | | | $ | 672,888 | |
Best Buy Co., Inc. | | | 1,800 | | | | 77,040 | |
Capella Education Co.* | | | 5,200 | | | | 316,784 | |
CBS Corp., Class B | | | 8,200 | | | | 484,948 | |
Comcast Corp., Class A | | | 14,600 | | | | 694,668 | |
Dana Holding Corp. | | | 27,500 | | | | 539,000 | |
Domino’s Pizza, Inc. | | | 1,900 | | | | 127,414 | |
Gap, Inc., The | | | 16,600 | | | | 614,034 | |
Home Depot, Inc., The4 | | | 9,600 | | | | 747,744 | |
Macy’s, Inc. | | | 13,200 | | | | 608,652 | |
Marcus Corp., The | | | 3,300 | | | | 47,388 | |
Marriott International Inc., Class A | | | 1,200 | | | | 54,096 | |
Mattel, Inc. | | | 12,200 | | | | 541,314 | |
News Corp., Class A* | | | 5,725 | | | | 100,760 | |
NIKE, Inc., Class B | | | 3,000 | | | | 227,280 | |
Pool Corp. | | | 500 | | | | 27,190 | |
Smith & Wesson Holding Corp.*,1 | | | 2,700 | | | | 29,106 | |
TJX Cos., Inc. | | | 5,700 | | | | 346,503 | |
Twenty-First Century Fox, Inc., Class A | | | 22,900 | | | | 780,432 | |
Viacom, Inc., Class B | | | 1,300 | | | | 108,277 | |
Visteon Corp.* | | | 900 | | | | 69,381 | |
Walt Disney Co., The | | | 6,000 | | | | 411,540 | |
Wynn Resorts, Ltd. | | | 700 | | | | 116,375 | |
Total Consumer Discretionary | | | | | | | 7,742,814 | |
Consumer Staple - 8.9% | | | | | | | | |
Altria Group, Inc. | | | 1,600 | | | | 59,568 | |
Archer-Daniels-Midland Co. | | | 5,900 | | | | 241,310 | |
Brown-Forman Corp., Class B | | | 450 | | | | 32,841 | |
Church & Dwight Co., Inc. | | | 600 | | | | 39,090 | |
Clorox Co., The | | | 1,500 | | | | 135,285 | |
CVS Caremark Corp. | | | 5,700 | | | | 354,882 | |
Energizer Holdings, Inc. | | | 500 | | | | 49,055 | |
Green Mountain Coffee Roasters, Inc.*,1 | | | 1,800 | | | | 113,058 | |
Hershey Co., The | | | 500 | | | | 49,620 | |
Ingredion, Inc. | | | 6,700 | | | | 440,592 | |
Kroger Co., The4 | | | 19,200 | | | | 822,528 | |
Pilgrim’s Pride Corp.* | | | 37,000 | | | | 524,290 | |
Procter & Gamble Co., The4 | | | 8,800 | | | | 710,600 | |
Safeway, Inc. | | | 11,900 | | | | 415,310 | |
Tyson Foods, Inc., Class A | | | 23,200 | | | | 641,944 | |
USANA Health Sciences, Inc.*,1 | | | 1,000 | | | | 68,230 | |
Walgreen Co. | | | 3,500 | | | | 207,340 | |
| | | | | | | | |
| | | Shares | | | Value | |
Wal-Mart Stores, Inc. | | | 6,900 | | | $ | 529,575 | |
Total Consumer Staples | | | | | | | 5,435,118 | |
Energy - 8.7% | | | | | | | | |
Chevron Corp.4 | | | 9,700 | | | | 1,163,612 | |
ConocoPhillips4 | | | 10,400 | | | | 762,320 | |
Dawson Geophysical Co.* | | | 2,200 | | | | 64,328 | |
Exxon Mobil Corp.4 | | | 18,200 | | | | 1,631,084 | |
Helmerich & Payne, Inc. | | | 1,900 | | | | 147,345 | |
HollyFrontier Corp. | | | 2,600 | | | | 119,756 | |
Marathon Petroleum Corp. | | | 500 | | | | 35,830 | |
Matrix Service Co.* | | | 7,700 | | | | 160,083 | |
Occidental Petroleum Corp.4 | | | 3,000 | | | | 288,240 | |
Oceaneering International, Inc. | | | 900 | | | | 77,292 | |
Schlumberger, Ltd. | | | 3,200 | | | | 299,904 | |
Valero Energy Corp. | | | 13,600 | | | | 559,912 | |
Total Energy | | | | | | | 5,309,706 | |
Financials - 18.3% | | | | | | | | |
Aflac, Inc. | | | 11,900 | | | | 773,262 | |
Alexander’s, Inc. | | | 200 | | | | 64,352 | |
Allstate Corp., The | | | 7,900 | | | | 419,174 | |
American Capital Agency Corp. | | | 3,400 | | | | 73,848 | |
American Express Co.4 | | | 8,400 | | | | 687,120 | |
American International Group, Inc. | | | 1,500 | | | | 77,475 | |
American Tower Corp. | | | 400 | | | | 31,740 | |
Arch Capital Group, Ltd.* | | | 8,200 | | | | 475,272 | |
Arlington Asset Investment Corp., Class A | | | 5,800 | | | | 143,086 | |
AvalonBay Communities, Inc. | | | 400 | | | | 50,020 | |
Axis Capital Holdings, Ltd. | | | 2,600 | | | | 123,292 | |
Bancfirst Corp. | | | 1,100 | | | | 61,127 | |
Bank of America Corp. | | | 58,900 | | | | 822,244 | |
Berkshire Hathaway, Inc., Class B* | | | 11,300 | | | | 1,300,404 | |
Capstead Mortgage Corp. | | | 5,800 | | | | 68,614 | |
Central Pacific Financial Corp. | | | 7,200 | | | | 132,624 | |
Citigroup, Inc. | | | 4,800 | | | | 234,144 | |
Discover Financial Services | | | 2,100 | | | | 108,948 | |
Dynex Capital, Inc. | | | 6,300 | | | | 54,432 | |
Eagle Bancorp, Inc.* | | | 2,400 | | | | 63,480 | |
Everest Re Group, Ltd. | | | 400 | | | | 61,496 | |
First Merchants Corp. | | | 3,200 | | | | 60,160 | |
First NBC Bank Holding Co.* | | | 2,400 | | | | 63,960 | |
Franklin Resources, Inc. | | | 3,300 | | | | 177,738 | |
GAMCO Investors, Inc., Class A | | | 1,000 | | | | 71,510 | |
Geo Group, Inc., The | | | 1,400 | | | | 49,378 | |
Goldman Sachs Group, Inc., The | | | 2,100 | | | | 337,806 | |
.
|
The accompanying notes are an integral part of these financial statements. 12 |
Managers AMG FQ U.S. Equity Fund
Schedule of Portfolio Investments (continued)
| | | | | | | | |
| | | Shares | | | Value | |
Financials - 18.3% (continued) | | | | | | | | |
Hanmi Financial Corp. | | | 6,200 | | | $ | 108,376 | |
Health Care REIT, Inc. | | | 700 | | | | 45,395 | |
Horace Mann Educators Corp. | | | 7,200 | | | | 199,440 | |
JPMorgan Chase & Co.4 | | | 24,000 | | | | 1,236,960 | |
Morgan Stanley | | | 4,500 | | | | 129,285 | |
Old National Bancorp | | | 1,800 | | | | 26,172 | |
Potlatch Corp. | | | 15,600 | | | | 636,948 | |
Republic Bancorp, Inc., Class A | | | 1,900 | | | | 43,738 | |
Silver Bay Realty Trust Corp. | | | 1 | | | | 5 | |
Simon Property Group, Inc. | | | 1,900 | | | | 293,645 | |
State Street Corp. | | | 1,900 | | | | 133,133 | |
TD Ameritrade Holding Corp. | | | 2,300 | | | | 62,698 | |
Travelers Cos., Inc., The | | | 1,400 | | | | 120,820 | |
United Community Banks, Inc.* | | | 13,800 | | | | 215,142 | |
Universal Insurance Holdings, Inc. | | | 29,800 | | | | 233,632 | |
Webster Financial Corp. | | | 4,300 | | | | 119,927 | |
Wells Fargo & Co.4 | | | 16,400 | | | | 700,116 | |
XL Group PLC | | | 9,000 | | | | 275,130 | |
Total Financials | | | | | | | 11,167,268 | |
Health Care - 11.4% | | | | | | | | |
Abbott Laboratories | | | 1,400 | | | | 51,170 | |
Albany Molecular Research, Inc.* | | | 11,200 | | | | 146,720 | |
Allergan, Inc. | | | 500 | | | | 45,305 | |
Amgen, Inc. | | | 2,300 | | | | 266,800 | |
AMN Healthcare Services, Inc.* | | | 3,100 | | | | 38,440 | |
ArthroCare Corp.* | | | 8,400 | | | | 314,496 | |
Cambrex Corp.* | | | 2,100 | | | | 35,322 | |
Cyberonics, Inc.* | | | 5,400 | | | | 311,904 | |
Emergent Biosolutions, Inc.* | | | 3,100 | | | | 60,543 | |
Johnson & Johnson | | | 3,600 | | | | 333,396 | |
Lannett Co., Inc.* | | | 6,900 | | | | 162,909 | |
Ligand Pharmaceuticals, Inc., Class B* | | | 2,300 | | | | 119,048 | |
Magellan Health Services, Inc.* | | | 3,900 | | | | 228,930 | |
Medtronic, Inc. | | | 16,800 | | | | 964,320 | |
Merck & Co., Inc. | | | 800 | | | | 36,072 | |
PDL BioPharma, Inc.1 | | | 84,400 | | | | 682,796 | |
Pfizer, Inc.4 | | | 29,100 | | | | 892,788 | |
Providence Service Corp., The* | | | 2,000 | | | | 59,780 | |
Questcor Pharmaceuticals, Inc.1 | | | 6,600 | | | | 405,042 | |
Repligen Corp.* | | | 28,900 | | | | 316,166 | |
Select Medical Holdings Corp. | | | 6,000 | | | | 50,880 | |
SurModics, Inc.* | | | 1,900 | | | | 44,802 | |
United Therapeutics Corp.* | | | 1,500 | | | | 132,780 | |
| | | | | | | | |
| | | Shares | | | Value | |
UnitedHealth Group, Inc.4 | | | 8,300 | | | $ | 566,558 | |
Zimmer Holdings, Inc. | | | 600 | | | | 52,482 | |
Zoetis, Inc. | | | 19,500 | | | | 617,370 | |
Total Health Care | | | | | | | 6,936,819 | |
Industrials - 11.7% | | | | | | | | |
Allegiant Travel Co. | | | 3,200 | | | | 333,664 | |
American Science & Engineering, Inc. | | | 1,100 | | | | 72,358 | |
Boeing Co., The | | | 3,400 | | | | 443,700 | |
Coleman Cable, Inc. | | | 2,500 | | | | 61,500 | |
Consolidated Graphics, Inc.* | | | 3,900 | | | | 249,951 | |
Delta Air Lines, Inc. | | | 2,800 | | | | 73,864 | |
Deluxe Corp. | | | 4,700 | | | | 221,323 | |
Emerson Electric Co. | | | 2,200 | | | | 147,334 | |
FedEx Corp.4 | | | 1,400 | | | | 183,400 | |
General Electric Co. | | | 5,400 | | | | 141,156 | |
Hyster-Yale Materials Handling, Inc. | | | 600 | | | | 47,064 | |
Lockheed Martin Corp. | | | 6,500 | | | | 866,710 | |
Matson, Inc. | | | 2,300 | | | | 62,307 | |
Northrop Grumman Corp. | | | 7,000 | | | | 752,570 | |
Oshkosh Corp.* | | | 2,900 | | | | 138,011 | |
Parker Hannifin Corp. | | | 300 | | | | 35,016 | |
Republic Airways Holdings, Inc.* | | | 15,500 | | | | 182,590 | |
Rockwell Automation, Inc. | | | 600 | | | | 66,246 | |
Southwest Airlines Co. | | | 42,200 | | | | 726,684 | |
Swift Transportation Co.*,1 | | | 30,800 | | | | 671,132 | |
UniFirst Corp. | | | 6,200 | | | | 637,484 | |
Union Pacific Corp. | | | 6,000 | | | | 908,400 | |
United Parcel Service, Inc., Class B | | | 1,000 | | | | 98,240 | |
United Technologies Corp.4 | | | 400 | | | | 42,500 | |
Total Industrials | | | | | | | 7,163,204 | |
Information
Technology - 18.7% | | | | | | | | |
AOL, Inc.* | | | 1,000 | | | | 36,240 | |
Apple, Inc.4 | | | 2,201 | | | | 1,149,692 | |
Arrow Electronics, Inc.* | | | 1,200 | | | | 57,624 | |
Benchmark Electronics, Inc.* | | | 29,100 | | | | 661,443 | |
Brocade Communications Systems, Inc.* | | | 8,900 | | | | 71,378 | |
CA, Inc. | | | 19,200 | | | | 609,792 | |
Cabot Microelectronics Corp.* | | | 2,900 | | | | 118,581 | |
Cisco Systems, Inc.4 | | | 42,600 | | | | 958,500 | |
Fabrinet* | | | 25,300 | | | | 423,522 | |
First Solar, Inc.* | | | 2,800 | | | | 140,756 | |
FLIR Systems, Inc. | | | 2,200 | | | | 62,656 | |
Google, Inc., Class A* | | | 124 | | | | 127,792 | |
Harris Corp. | | | 11,100 | | | | 687,756 | |
The accompanying notes are an integral part of these financial statements.
13
Managers AMG FQ U.S. Equity Fund
Schedule of Portfolio Investments (continued)
| | | | | | | | |
| | | Shares | | | Value | |
Information Technology -
18.7% (continued) | | | | | | | | |
Hewlett-Packard Co. | | | 14,000 | | | $ | 341,180 | |
Insight Enterprises, Inc.* | | | 2,900 | | | | 61,103 | |
Intel Corp. | | | 7,200 | | | | 175,896 | |
InterDigital, Inc. | | | 12,800 | | | | 496,000 | |
International Business Machines Corp.4 | | | 4,300 | | | | 770,603 | |
Intuit, Inc. | | | 600 | | | | 42,846 | |
LSI Corp. | | | 8,600 | | | | 72,928 | |
Microsoft Corp.4 | | | 34,400 | | | | 1,216,040 | |
NIC, Inc. | | | 11,100 | | | | 273,282 | |
Oracle Corp.4 | | | 12,200 | | | | 408,700 | |
PC Connection, Inc. | | | 5,000 | | | | 99,950 | |
Sanmina Corp.* | | | 3,300 | | | | 48,048 | |
ScanSource, Inc.* | | | 4,200 | | | | 161,532 | |
Silicon Image, Inc.* | | | 13,000 | | | | 68,250 | |
Stamps.com, Inc.* | | | 800 | | | | 36,352 | |
TiVo, Inc.* | | | 14,400 | | | | 191,376 | |
ValueClick, Inc.* | | | 2,700 | | | | 51,867 | |
VeriSign, Inc.* | | | 10,100 | | | | 548,228 | |
Visa, Inc., Class A4 | | | 2,700 | | | | 531,009 | |
VMware, Inc., Class A* | | | 1,100 | | | | 89,408 | |
WebMD Health Corp.* | | | 11,900 | | | | 419,118 | |
Xerox Corp. | | | 23,900 | | | | 237,566 | |
Total Information Technology | | | | | | | 11,447,014 | |
Materials - 3.8% | | | | | | | | |
CF Industries Holdings, Inc. | | | 1,100 | | | | 237,160 | |
LyondellBasell Industries N.V., Class A | | | 10,500 | | | | 783,300 | |
Monsanto Co. | | | 1,300 | | | | 136,344 | |
Myers Industries, Inc. | | | 15,300 | | | | 272,646 | |
Packaging Corp. of America | | | 11,500 | | | | 716,220 | |
Schweitzer-Mauduit International, Inc. | | | 1,000 | | | | 61,880 | |
Silgan Holdings, Inc. | | | 1,100 | | | | 49,577 | |
SunCoke Energy, Inc.* | | | 3,900 | | | | 78,000 | |
Total Materials | | | | | | | 2,335,127 | |
Telecommunication Services - 3.3% | | | | | | | | |
AT&T, Inc.4 | | | 33,000 | | | | 1,194,600 | |
Atlantic Tele-Network, Inc. | | | 2,600 | | | | 144,092 | |
United States Cellular Corp. | | | 7,000 | | | | 338,800 | |
Verizon Communications, Inc. | | | 6,100 | | | | 308,111 | |
Total Telecommunication Services | | | | | | | 1,985,603 | |
Utilities - 1.6% | | | | | | | | |
American Electric Power Co., Inc. | | | 5,900 | | | | 276,356 | |
DTE Energy Co. | | | 8,100 | | | | 560,034 | |
Duke Energy Corp. | | | 800 | | | | 57,384 | |
| | | | | | | | |
| | | Shares | | | Value | |
Public Service Enterprise Group, Inc. | | | 3,100 | | | $ | 103,850 | |
Total Utilities | | | | | | | 997,624 | |
Total Common Stocks
(cost $49,369,552) | | | | | | | 60,520,297 | |
| | | Number of
Contracts | | | | |
Purchased Options - 0.2% | | | | | | | | |
S&P 500 Puts, 1550 Strike Price, Expiration 01/18/14 | | | 141 | | | | 77,550 | |
S&P 500 Puts, 1550 Strike Price, Expiration 11/16/13 | | | 106 | | | | 4,770 | |
S&P 500 Puts, 1600 Strike Price, Expiration 01/18/14 | | | 11 | | | | 9,515 | |
S&P 500 Puts, 1610 Strike Price, Expiration 12/21/13 | | | 79 | | | | 35,945 | |
Total Purchased Options
(cost $558,805) | | | | | | | 127,780 | |
| | | Principal
Amount | | | | |
Short-Term Investments - 3.8% | | | | | | | | |
Repurchase Agreements - 2.5%2 | | | | | | | | |
BNP Paribas Securities Corp., dated 10/31/13, due 11/01/13, 0.090%, total to be received $522,692 (collateralized by various U.S. Government Agency Obligations, 0.250% - 3.125%, 02/28/14 - 02/15/43, totaling $533,145) | | $ | 522,691 | | | | 522,691 | |
Citigroup Global Markets, Inc., dated 10/31/13, due 11/01/13, 0.110%, total to be received $1,000,003 (collateralized by various U.S. Government Agency Obligations, 1.625% - 7.000%, 01/01/14 - 10/01/43, totaling $1,020,000) | | | 1,000,000 | | | | 1,000,000 | |
Total Repurchase Agreements | | | | | | | 1,522,691 | |
| | | Shares | | | | |
Other Investment Companies - 1.3%3 | | | | | | | | |
Dreyfus Institutional Cash Advantage Fund, Institutional Class Shares, 0.06% | | | 784,340 | | | | 784,340 | |
Total Short-Term Investments
(cost $2,307,031) | | | | | | | 2,307,031 | |
Total Investments - 103.1%
(cost $52,235,388) | | | | | | | 62,955,108 | |
Other Assets, less Liabilities - (3.1)% | | | | | | | (1,892,290 | ) |
Net Assets - 100.0% | | | | | | $ | 61,062,818 | |
The accompanying notes are an integral part of these financial statements.
14
Managers AMG FQ Global Alternatives Fund
Portfolio Manager’s Comments
THE YEAR IN REVIEW
The Managers AMG FQ Global Alternatives Fund (“Global Alternatives” or the “Fund”) delivered negative returns for the past fiscal year ended October 31, 2013. The Fund (Investor Class) returned -1.39% while the benchmark, the Citigroup 1-Month Treasury Bill Index, returned 0.04% during this time. Please refer to the tables beginning on page 38 for the returns of the other share classes.
Global capital markets continued their multi-year rally over the prior fiscal year driven by risk-based assets as low interest rates and easy global central bank policy continued to push investors to these areas of the market. For the entire one-year period ended October 31, 2013, smaller-cap equities generally outperformed their larger-cap brethren with the Russell 1000® (large cap), Russell 2000® (small cap), Russell 3000® (all cap), and the Russell Microcap® Indices returning 28.40%, 36.28%, 28.99%, and 38.72%, respectively. International developed-market stocks modestly underperformed their domestic counterparts as the MSCI EAFE Index returned 26.88% during this period. Meanwhile, REITs sharply underperformed domestic U.S. equities returning 10.00% and were hurt during the selloff in May and June. Fixed-income securities struggled for the prior fiscal year as interest rates rose with the Barclays U.S. Aggregate and the Barclays Global Aggregate Indexes returning -1.08% and -1.54%, respectively. Lower-quality securities posted results much stronger than their higher-quality counterparts, returning 8.87% as measured by the Barclays U.S. Corporate High Yield Index.
During this period, the Global Alternatives Fund’s disappointing performance was primarily driven by losses within the stock country selection strategy in the fourth quarter of 2012 and April of this year. In the fourth quarter, losses were primarily driven by long exposure to U.S. equities. During April, the Fund’s anti “Euro Zone periphery” theme weighed heavily on results. The other three strategies had mixed results throughout the year. The Fund’s currency strategy added its most value towards the end of 2012 and amid the market volatility of May. In May, the Fund’s cross-sectional positioning was quite successful as currency markets rewarded fundamentally driven positions. The Fund’s bond country selection
strategy delivered positive results for the year including positive returns in five of the first six months. The Fund’s asset class selection strategy maintained a modest long position throughout the year which contributed positively to performance.
The Portfolio continues to be positioned relatively defensively in most sleeves as most of the sources of fundamental uncertainty present in the third quarter of 2013 continue to remain in place. We believe that the environment for the Fund has in general improved after the Fed’s decision not to taper. We expect the markets to gyrate less violently going forward, now that investors better understand the uncertainty surrounding a number of broad and country-specific events. We continue to monitor the signals and markets closely for those risks, including the consequences of the U.S. government shutdown and debt ceiling negotiations as well as central bank actions (or lack thereof).
This commentary reflects the viewpoints of the portfolio manager, First Quadrant L.P, as of October 31, 2013 and is not intended as a forecast or guarantee of future results, and is subject to change without notice.
CUMULATIVE TOTAL RETURN PERFORMANCE
Managers AMG FQ Global Alternatives Fund’s cumulative total return is based on the daily change in net asset value (NAV), and assumes that all distributions were reinvested. This chart compares a hypothetical $10,000 investment made in the Investor Class of the Fund on March 30, 2006 (commencement of operations), to a $10,000 investment made in the 1-Month Treasury Index for the same time period. Figures include reinvestment of capital gains and dividends. The listed returns for the Fund are net of expenses and the returns for the index exclude expenses. Performance for periods longer than one year is annualized. The graph and table do not reflect the deduction of taxes that a shareholder would pay on a Fund distribution or redemption of shares. The listed returns for the Fund are net of expenses and the returns for the index exclude expenses. Past performance is not indicative of future results. Total returns would have been lower had certain expenses not been reduced.
15
Managers AMG FQ Global Alternatives Fund
Portfolio Manager’s Comments (continued)
CUMULATIVE TOTAL RETURN PERFORMANCE (continued)
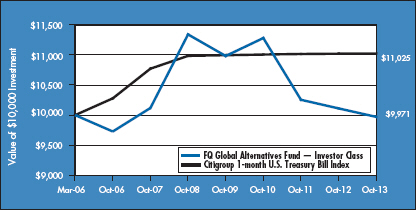
The table below shows the average annual total returns for the Managers AMG FQ Global Alternatives Fund and the Citigroup 1-month U.S. Treasury Bill Index for the same time periods ended October 31, 2013.
| | | | | | | | | | | | | | | | |
| | | Average Annual Total Returns1 | |
| | | One Year | | | Five Years | | | Since
Inception | | | Inception
Date | |
Managers AMG FQ Global Alternative Fund 2,3,4,5,6 | |
Investor Class* | | | (1.39 | )% | | | (2.54 | )% | | | (0.04 | )% | | | 03/30/06 | |
Service Class** | | | (1.02 | )% | | | — | | | | (2.20 | )% | | | 01/01/10 | |
Institutional Class** | | | (0.88 | )% | | | — | | | | (2.08 | )% | | | 01/01/10 | |
Citigroup 1-month U.S. Treasury Bill Index7 | | | 0.04 | % | | | 0.07 | % | | | 1.34 | % | | | 03/31/06 | |
The performance data shown represents past performance. Past performance is not a guarantee of future results. Current performance may be lower or higher than the performance data quoted. The investment return and principal value of an investment in the Fund will fluctuate so that an investor’s shares, when redeemed, may be worth more or less than their original cost. For performance information through the most recent month end please call (800) 835-3879 or visit our Web site at www.managersinvest.com. Current net asset values per share for each Fund are available on the Fund’s Web site at www.managersinvest.com.
Investors should carefully consider the Fund’s investment objectives, risks, charges and expenses before investing. For this and other information, please call (800) 835-3879 or visit our Web site at www.managersinvest.com for a free prospectus. Read it carefully before investing or sending money. Funds are distributed by Managers Distributors, Inc., member FINRA.
| * | The performance information for the Fund’s Investor Class shares (formerly Class A shares, were renamed Investor Class shares as of December 1, 2012) for periods prior to December 1, 2012 does not reflect the impact of the front-end and deferred sales charges (loads) that were in effect until December 1, 2012. |
| ** | Service and Institutional Class shares commenced operations on January 1, 2010. |
| | |
1 Total return equals income yield plus share price change and assumes reinvestment of all dividends and capital gain distributions. Returns are net of fees and may reflect offsets of Fund expenses as described in the Prospectus. No adjustment has been made for taxes payable by shareholders on their reinvested dividends and capital gain distributions. Returns for periods greater than one year are the average annual returns. The listed returns on the Fund are net of expenses and based on the published NAV as of October 31, 2013. All returns are in U.S. dollars ($). |
2 From time to time, the Fund’s advisor has waived its fees and/or absorbed Fund expenses, which has resulted in higher returns. |
3 Changing interest rates may adversely affect the value of an investment. An increase in interest rates typically causes the value of bonds and other fixed-income securities to fall. |
4 The Fund may use derivative instruments for hedging purposes or as part of its investment strategy. There is a risk that a derivative intended as a hedge may not perform as expected. The main risk with derivatives is that some types can amplify a gain or loss, potentially earning or losing substantially more money than the actual cost of the derivative or that the counterparty may fail to honor its contract terms, causing a loss for the Fund. Use of these instruments may also involve certain costs and risks such as liquidity risk, interest rate risk, market risk, credit risk, management risk, and the risk that a fund could not close out a position when it would be most advantageous to do so. The Fund is subject to currency risk resulting from fluctuations in exchange rates that may affect the total loss or gain on a non- U.S. Dollar security when converted back to U.S. Dollars. |
5 Investments in foreign securities and currency instruments are subject to additional risks such as erratic market conditions, economic and political instability, and currency exchange rate fluctuations. |
6 Because the Fund invests in exchange traded funds (ETFs) which incur their own costs, investing in them could result in a higher cost to the investor. Additionally, the Fund will be indirectly exposed to all the risks of securities held by the ETFs. |
7 Performance for the Citigroup 1-month U.S. Treasury Bill Index reflects an inception date of March 31, 2006. The Citigroup 1-month U.S. Treasury Bill Index is a market value-weighted index of public obligations of the U.S. Treasury with maturities of one month. Unlike the Fund, the Citigroup 1-month U.S. Treasury Bill Index is unmanaged, is not available for investment, and does not incur expenses. |
| Not FDIC insured, nor bank guaranteed. May lose value. |
16
Managers AMG FQ Global Alternatives Fund
Schedule of Portfolio Investments
October 31, 2013
| | | | | | | | |
| | | Shares | | | Value | |
Exchange Traded Funds - 22.5% | | | | | | | | |
SPDR S&P 500 ETF Trust (cost $17,597,996) | | | 152,118 | | | $ | 26,731,696 | |
| | | Principal
Amount | | | | |
U.S. Government Obligations - 40.5% | | | | | | | | |
U.S. Treasury Bills, | | | | | | | | |
0.034%, 11/29/135,6 | | $ | 28,625,000 | | | | 28,624,227 | |
0.055%, 03/20/145,6 | | | 18,480,000 | | | | 18,476,082 | |
0.063%, 03/27/145,6 | | | 1,000,000 | | | | 999,747 | |
Total U.S. Government Obligations (cost $48,100,661) | | | | | | | 48,100,056 | |
| | | Shares | | | | |
Other Investment Companies - 39.4%3 | | | | | | | | |
Dreyfus Institutional Cash Advantage Fund, Institutional Class Shares, 0.06% | | | 21,985,804 | | | | 21,985,804 | |
JPMorgan Liquid Assets Money Market Fund, Capital Shares, 0.07% | | | 24,880,147 | | | | 24,880,147 | |
Total Other Investment Companies
(cost $46,865,951) | | | | | | | 46,865,951 | |
Total Investments - 102.4% (cost $112,564,608) | | | | | | | 121,697,703 | |
Other Assets, less Liabilities - (2.4)% | | | | | | | (2,859,319 | ) |
Net Assets - 100.0% | | | | | | $ | 118,838,384 | |
The accompanying notes are an integral part of these financial statements.
17
Managers AMG FQ Global Essentials Fund
Portfolio Manager’s Comments
THE YEAR IN REVIEW
The Managers AMG FQ Global Essentials Fund (“Global Essentials”) delivered positive absolute and relative returns for the past fiscal year ended October 31, 2013. The Fund (Investor Class shares) returned 1.16%, while its benchmark, which consists of 60% of the return of MSCI World (hedged) Index and 40% of the return of the Citigroup World Government Bond (hedged) Index, returned 15.18% during this time.
Global capital markets continued their multi-year rally over the prior fiscal year driven by risk-based assets as low interest rates and easy global central bank policy continued to push investors to these areas of the market. For the entire one-year period ended October 31, 2013, smaller-cap equities generally outperformed their larger-cap brethren with the Russell 1000® (large cap), Russell 2000® (small cap), Russell 3000® (all cap), and the Russell Microcap® Indices returning 28.40%, 36.28%, 28.99%, and 38.72%, respectively. International developed-market stocks modestly underperformed their domestic counterparts as the MSCI EAFE Index returned 26.88% during this period. Meanwhile, REITs sharply underperformed domestic U.S. equities returning 10.00% and were hurt during the sell-off in May and June. Fixed-income securities struggled for the prior fiscal year as interest rates rose with the Barclays U.S. Aggregate and the Barclays Global Aggregate Indexes returning -1.08% and -1.54%, respectively. Lower-quality securities posted results much stronger than their higher-quality counterparts, returning 8.87% as measured by the Barclays U.S. Corporate High Yield Index.
While the Fund delivered positive absolute performance for the year, May and June were a particularly tough performance period for the Fund. During that time, separate news events coincided to cause all three asset classes (equities, bonds and commodities) to decline together. Those independent events were the hints of the beginning of the end of the latest round of quantitative easing by the Federal Reserve and a darkening economic outlook in China and other emerging markets. Additional pressure also came from U.S. Dollar appreciation, as growth prospects in the U.S., while not vibrant, looked better than those of the rest of the world. A Fund like Global Essentials depends upon diversification to succeed. When correlations between asset classes temporarily increase due to a
coincidence of independent events, as they did during this period, the Fund can have a significant but, generally, short-lived draw down. The rise in correlations between stocks, bonds and commodities is usually not a long-term phenomenon and that proved to be the case this time as well. In the last four months of the fiscal year, the Fund performed well as the Fed tempered its statements and, coupled with improved Chinese growth data, caused the market to reflect and ultimately adjust expectations. This led to a bounce back in various asset classes and steady performance for the Fund through the end of the year.
The First Quadrant Market Risk Index, (one of First Quadrant’s proprietary investment tools) is currently measuring a “Very Low Risk” environment as of the end of the fiscal year driven by the low cost of hedging, narrow credit spreads and expansive monetary policy. This does not mean, however, that the world is without risk.
This commentary reflects the viewpoints of the portfolio manager, First Quadrant L.P,, as of October 31, 2013 and is not intended as a forecast or guarantee of future results, and is subject to change without notice.
CUMULATIVE TOTAL RETURN PERFORMANCE
Managers AMG FQ Global Essentials Fund’s cumulative total return is based on the daily change in net asset value (NAV), and assumes that all distributions were reinvested. This chart compares a hypothetical $10,000 investment made in the Institutional Class Shares of the Fund on October 31, 2003, to a $10,000 investment made in the Hedged Index and the Unhedged Index for the same time period. Figures include reinvestment of capital gains and dividends. The listed returns for the Fund are net of expenses and the returns for the index exclude expenses. Performance for periods longer than one year is annualized. The graph and table do not reflect the deduction of taxes that a shareholder would pay on a Fund distribution or redemption of shares. The listed returns for the Fund are net of expenses and the returns for the index exclude expenses. Past performance is not indicative of future results. Total returns would have been lower had certain expenses not been reduced.
18
Managers AMG FQ Global Essentials Fund
Portfolio Manager’s Comments (continued)
CUMULATIVE TOTAL RETURN PERFORMANCE (continued)
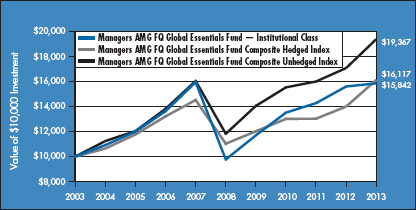
The table below shows the average annual total returns for the Managers AMG FQ Global Essentials Fund and the Managers AMG FQ Global Essentials Fund Composite Hedged and Unhedged Indexes for the same time periods ended October 31, 2013.
| | | | | | | | | | | | | | | | | | | | |
| | | Average Annual Total Returns1 | |
| | | One Year | | | Five Years | | | Ten Years | | | Since
Inception | | | Inception Date | |
Managers AMG FQ Global Essentials Fund 2,3,4,5,6,7 | | | | | |
Investor Class* | | | 1.16 | % | | | — | | | | — | | | | 7.01 | % | | | 01/01/10 | |
Service Class* | | | 1.61 | % | | | — | | | | — | | | | 7.39 | % | | | 01/01/10 | |
Institutional Class | | | 1.61 | % | | | 10.14 | % | | | 4.71 | % | | | 6.22 | % | | | 11/18/88 | |
Managers AMG FQ Global Essentials Fund Composite Hedged Index8 | | | 15.18 | % | | | 7.88 | % | | | 4.89 | % | | | 5.76 | % | | | 11/30/88 | |
Managers AMG FQ Global Essentials Fund Composite Unhedged Index8 | | | 13.50 | % | | | 10.38 | % | | | 6.83 | % | | | 6.99 | % | | | 11/30/88 | |
The performance data shown represents past performance. Past performance is not a guarantee of future results. Current performance may be lower or higher than the performance data quoted. The investment return and principal value of an investment in the Fund will fluctuate so that an investor’s shares, when redeemed, may be worth more or less than their original cost. For performance information through the most recent month end please call (800) 835-3879 or visit our Web site at www.managersinvest.com. Current net asset values per share for each Fund are available on the Fund’s Web site at www.managersinvest.com.
Investors should carefully consider the Fund’s investment objectives, risks, charges and expenses before investing. For this and other information, please call (800) 835-3879 or visit our Web site at www.managersinvest.com for a free prospectus. Read it carefully before investing or sending money. Funds are distributed by Managers Distributors, Inc., member FINRA.
| * | Investor and Service Class shares commenced operations on January 1, 2010. |
| 1 | Total return equals income yield plus share price change and assumes reinvestment of all dividends and capital gain distributions. Returns are net of fees and may reflect offsets of Fund expenses as described in the Prospectus. No adjustment has been made for taxes payable by shareholders on their reinvested dividends and capital gain distributions. Returns for periods greater than one year are the average annual returns. The listed returns on the Fund are net of expenses and based on the published NAV as of October 31, 2013. All returns are in U.S. dollars ($). |
| 2 | From time to time, the Fund’s advisor has waived its fees and/or absorbed Fund expenses, which has resulted in higher returns. |
| 3 | Investments in foreign securities, even though publicly traded in the United States, may involve risks which are in addition to those inherent in domestic investments. The use of leverage in a Fund’s strategy can magnify relatively small market movements into relatively larger losses for the Fund. |
| | | | |
4 | | The Fund is subject to special risk considerations similar to those associated with the direct ownership of real estate. Real estate valuations may be subject to factors such as changing general and local economic, financial, competitive and environmental conditions. |
5 | | Because the Fund invests in exchange traded funds (ETFs) which incur their own costs, investing in them could result in a higher cost to the investor. Additionally, the Fund will be indirectly exposed to all the risks of securities held by the ETFs. |
6 | | Obligations of certain government agencies are not backed by the full faith and credit of the U.S. Government. If one of these agencies defaulted on a loan, there is no guarantee that the U.S. Government will provide financial support. Additionally, debt securities of the U.S. Government may be affected by changing interest rates and subject to prepayment risk. |
7 | | The Fund may use derivative instruments for hedging purposes or as part of its investment strategy. There is a risk that a derivative intended as a hedge may not perform as expected. The main risk with derivatives is that some types can amplify a gain or loss, potentially earning or losing substantially more money than the actual cost of the derivative or that the counterparty may fail to honor its contract terms, causing a loss for the Fund. Use of these instruments may also involve certain costs and risks such as liquidity risk, interest rate risk, market risk, credit risk, management risk, and the risk that a fund could not close out a position when it would be most advantageous to do so. The Fund is subject to currency risk resulting from fluctuations in exchange rates that may affect the total loss or gain on a non-U.S. Dollar security when converted back to U.S. Dollars. |
8 | | The Fund’s index is comprised of 60% MSCI World Index, 40% Citigroup World Government Bond Index and reflects an inception date of November 30, 1988. The MSCI World Index is a free float-adjusted market capitalization weighted index that is designed to measure the equity market performance of developed and emerging markets. The MSCI World Index consists of 24 developed country indices. The Citigroup World Government Bond Index is a market capitalization weighted index consisting of the government bond markets. Country eligibility is determined based on market capitalization and investability criteria. All issues have a remaining maturity of at least one year. Unlike the Fund, the Composite Index is unmanaged, is not available for investment, and does not incur fees. All MSCI data is provided ’as is.’ The products described herein are not sponsored or endorsed and have not been reviewed or passed on by MSCI. In no event shall MSCI, its affiliates, or any MSCI data provider have any liability of any kind in connection with the MSCI data or the products described herein. Copying or redistributing the MSCI data is strictly prohibited. |
| Not FDIC insured, nor bank guaranteed. May lose value. |
19
Managers AMG FQ Global Essentials Fund
Schedule of Portfolio Investments
October 31, 2013
| | | | | | | | |
| | | Shares | | | Value | |
Exchange Traded Funds - 60.2% | | | | | | | | |
iShares Barclays TIPS Bond Fund | | | 112,253 | | | $ | 12,676,732 | |
iShares iBoxx $ High Yield Corporate Bond Fund | | | 336,824 | | | | 31,459,362 | |
Jefferies TR/J CRB Global Commodity Equity Index Fund | | | 50,138 | | | | 2,167,967 | |
Market Vectors RVE Hard Assets Producers | | | 57,953 | | | | 2,177,874 | |
Materials Select Sector SPDR Fund1 | | | 50,312 | | | | 2,202,156 | |
SPDR DB International Government Inflation-Protected Bond | | | 39,347 | | | | 2,376,952 | |
Vanguard REIT | | | 101,112 | | | | 6,988,861 | |
Total Exchange Traded Funds (cost $59,582,825) | | | | | | | 60,049,904 | |
Exchange Traded Notes - 10.8% | | | | | | | | |
Barclays, Inc., iPath Dow Jones-UBS Copper Subindex Total Return, 10/22/37 | | | 44,032 | | | | 1,778,893 | |
Barclays, Inc., iPath Dow Jones-UBS Grains Subindex Total Return, 10/22/37 | | | 21,542 | | | | 971,113 | |
Barclays, Inc., iPath Goldman Sachs Crude Oil Total Return Index, 08/07/361 | | | 44,324 | | | | 1,007,041 | |
Deutsche Bank AG, PowerShares DB Agriculture Double Long, 04/01/38 | | | 123,077 | | | | 1,022,770 | |
Deutsche Bank AG, PowerShares DB Gold Double Long, 02/15/381 | | | 66,184 | | | | 2,022,583 | |
Swedish Export Credit Corp., ELEMENTS Linked to the Rogers International Commodity Index - Total Return, 10/24/22 | | | 482,901 | | | | 3,935,643 | |
Total Exchange Traded Notes (cost $12,308,395) | | | | | | | 10,738,043 | |
| | | Number of
Contracts | | | | |
Purchased Options - 0.2% | | | | | | | | |
S&P 500 Puts, 1540 Strike Price, Expiration 12/21/13 | | | 191 | | | | 42,020 | |
S&P 500 Puts, 1550 Strike Price, Expiration 11/16/13 | | | 204 | | | | 9,180 | |
S&P 500 Puts, 1600 Strike Price, Expiration 01/18/14 | | | 186 | | | | 160,890 | |
Total Purchased Options (cost $770,316) | | | | | | | 212,090 | |
| | | Principal
Amount | | | | |
U.S. Government Obligations - 9.0% | | | | | | | | |
U.S. Treasury Bills, 0.030%, 11/29/135,6 (cost $8,999,475) | | $ | 9,000,000 | | | | 8,999,784 | |
Short-Term Investments - 23.5% | | | | | | | | |
Repurchase Agreements - 2.0%2 | | | | | | | | |
Barclays Capital, dated 10/31/13, due 11/01/13, 0.080%, total to be received $48,442 (collateralized by various U.S. Government Agency Obligations, 0.000% - 4.250%, 11/15/13 - 08/15/43, totaling $49,411) | | | 48,442 | | | | 48,442 | |
Citigroup Global Markets, Inc., dated 10/31/13, due 11/01/13, 0.110%, total to be received $1,000,003 (collateralized by various U.S. Government Agency Obligations, 1.625% - 7.000%, 01/01/14 - 10/01/43, totaling $1,020,000) | | | 1,000,000 | | | | 1,000,000 | |
Merrill Lynch, Pierce, Fenner & Smith, Inc., dated 10/31/13, due 11/01/13, 0.100%, total to be received $1,000,003 (collateralized by various U.S. Government Agency Obligations, 3.000% - 3.500%, 09/20/42 - 05/20/43, totaling $1,020,000) | | | 1,000,000 | | | | 1,000,000 | |
Total Repurchase Agreements | | | | | | | 2,048,442 | |
The accompanying notes are an integral part of these financial statements.
20
Managers AMG FQ Global Essentials Fund
Schedule of Portfolio Investments (continued)
| | | | | | | | |
| | | Shares | | | Value | |
Other Investment Companies - 21.5%3 | | | | | | | | |
Dreyfus Institutional Cash Advantage Fund, Institutional Class Shares, 0.06% | | | 11,270,641 | | | $ | 11,270,641 | |
JPMorgan Liquid Assets Money Market Fund, Capital Shares, 0.07% | | | 10,138,608 | | | | 10,138,608 | |
Total Other Investment Companies | | | | | | | 21,409,249 | |
Total Short-Term Investments (cost $23,457,691) | | | | | | | 23,457,691 | |
Total Investments - 103.7% (cost $105,118,702) | | | | | | | 103,457,512 | |
Other Assets, less Liabilities - (3.7)% | | | | | | | (3,674,435 | ) |
Net Assets - 100.0% | | | | | | $ | 99,783,077 | |
The accompanying notes are an integral part of these financial statements.
21
Notes to Schedules of Portfolio Investments
The following footnotes and abbreviations should be read in conjunction with each of the Schedules of Portfolio Investments previously presented in this report.
At October 31, 2013, the approximate cost of investments for Federal income tax purposes and the aggregate gross unrealized appreciation and/or depreciation based on tax cost were as follows:
| | | | | | | | | | | | | | | | |
Fund | | Cost | | | Appreciation | | | Depreciation | | | Net | |
Managers AMG FQ Tax-Managed U.S. Equity Fund | | $ | 34,267,393 | | | $ | 16,067,903 | | | $ | (156,103 | ) | | $ | 15,911,800 | |
Managers AMG FQ U.S. Equity Fund | | | 52,288,806 | | | | 11,514,018 | | | | (847,716 | ) | | | 10,666,302 | |
Managers AMG FQ Global Alternatives Fund | | | 112,564,608 | | | | 9,134,596 | | | | (1,501 | ) | | | 9,133,095 | |
Managers AMG FQ Global Essentials Fund | | | 106,209,256 | | | | 1,078,163 | | | | (3,829,907 | ) | | | (2,751,744 | ) |
| * | Non-income producing security. |
| 1 | Some or all of these shares were out on loan to various brokers as of October 31, 2013, amounting to: |
| | | | | | | | |
Fund | | Market Value | | | % of Net Assets | |
Managers AMG FQ Tax-Managed U.S. Equity Fund | | $ | 617,469 | | | | 1.2 | % |
Managers AMG FQ U.S. Equity Fund | | | 1,477,043 | | | | 2.4 | % |
Managers AMG FQ Global Essentials Fund | | | 1,968,783 | | | | 2.0 | % |
| 2 | Collateral received from brokers for securities lending was invested in these short-term investments. |
| 3 | Yield shown for each investment company represents the October 31, 2013, seven-day average yield, which refers to the sum of the previous seven days’ dividends paid, expressed as an annual percentage. |
| 4 | Some or all of these securities were held as collateral for options written. |
| 5 | Represents yield to maturity at October 31, 2013. |
| 6 | Some or all of these securities were held as collateral for futures contracts as of October 31, 2013, amounting to: |
| | | | | | | | |
Fund | | Market Value | | | % of Net Assets | |
Managers AMG FQ Global Alternatives Fund | | $ | 48,100,056 | | | | 40.5 | % |
Managers AMG FQ Global Essentials Fund | | | 8,999,784 | | | | 9.0 | % |
The following tables summarize the inputs used to value the Funds’ net assets by the fair value hierarchy levels as of October 31, 2013: (See Note 1(a) in the Notes to Financial Statements.)
| | | | | | | | | | | | | | | | |
| | | Quoted Prices in Active
Markets for Identical
Investments
Level 1 | | | Significant Other
Observable Inputs
Level 2 | | | Significant Unobservable Inputs
Level 3 | | | Total | |
Managers AMG FQ Tax-Managed U.S. Equity Fund | | | | | | | | | | | | | | | | |
Investments in Securities | |
Common Stocks† | | $ | 48,706,578 | | | | — | | | | — | | | $ | 48,706,578 | |
Short-Term Investments | | | | | | | | | | | | | | | | |
Repurchase Agreements | | | — | | | $ | 642,542 | | | | — | | | | 642,542 | |
Other Investment Companies | | | 830,073 | | | | — | | | | — | | | | 830,073 | |
| | | | | | | | | | | | | | | | |
Total Investments in Securities | | $ | 49,536,651 | | | $ | 642,542 | | | | — | | | $ | 50,179,193 | |
| | | | | | | | | | | | | | | | |
The accompanying notes are an integral part of these financial statements.
22
Notes to Schedules of Portfolio Investments (continued)
| | | | | | | | | | | | | | | | |
| | | Quoted Prices in Active
Markets for Identical
Investments
Level 1 | | | Significant Other
Observable Inputs
Level 2 | | | Significant Unobservable Inputs
Level 3 | | | Total | |
Managers AMG FQ U.S. Equity Fund | |
Investments in Securities | | | | |
Common Stocks† | | $ | 60,520,297 | | | | — | | | | — | | | $ | 60,520,297 | |
Short-Term Investments | | | | | | | | | | | | | | | | |
Repurchase Agreements | | | — | | | $ | 1,522,691 | | | | — | | | | 1,522,691 | |
Other Investment Companies | | | 784,340 | | | | — | | | | — | | | | 784,340 | |
| | | | | | | | | | | | | | | | |
Total Investments in Securities | | $ | 61,304,637 | | | $ | 1,522,691 | | | | — | | | $ | 62,827,328 | |
| | | | | | | | | | | | | | | | |
Financial Derivative Instruments-Assets†† | | | | | | | | | | | | | | | | |
Equity Contracts | | $ | 135,042 | | | | — | | | | — | | | $ | 135,042 | |
| | | | | | | | | | | | | | | | |
Financial Derivative Instruments-Liabilities†† | | | | | | | | | | | | | | | | |
Equity Contracts | | | (492,018 | ) | | | — | | | | — | | | | (492,018 | ) |
| | | | | | | | | | | | | | | | |
Total Financial Derivative Instruments | | $ | (356,976 | ) | | | — | | | | — | | | $ | (356,976 | ) |
| | | | | | | | | | | | | | | | |
| | | | | | | | | | | | | | | | |
| | | Quoted Prices in Active
Markets for Identical
Investments
Level 1 | | | Significant Other
Observable
Inputs
Level 2 | | | Significant Unobservable Inputs
Level 3 | | | Total | |
Managers AMG FQ Global Alternatives Fund | | | | | | | | | | | | | |
Investments in Securities | | | | | | | | | | | | | | | | |
Exchange Traded Funds††† | | $ | 26,731,696 | | | | — | | | | — | | | $ | 26,731,696 | |
U.S. Government Obligations†††† | | | — | | | $ | 48,100,056 | | | | — | | | | 48,100,056 | |
Other Investment Companies | | | 46,865,951 | | | | — | | | | — | | | | 46,865,951 | |
| | | | | | | | | | | | | | | | |
Total Investments in Securities | | $ | 73,597,647 | | | $ | 48,100,056 | | | | — | | | $ | 121,697,703 | |
| | | | | | | | | | | | | | | | |
Financial Derivative Instruments-Assets†† | | | | | | | | | | | | | | | | |
Foreign Exchange Contracts | | | — | | | $ | 4,320,151 | | | | — | | | $ | 4,320,151 | |
Equity Contracts | | $ | 304,602 | | | | | | | | — | | | | 304,602 | |
Interest Rate Contracts | | | 2,044,084 | | | | | | | | — | | | | 2,044,084 | |
| | | | | | | | | | | | | | | | |
| | | 2,348,686 | | | | 4,320,151 | | | | — | | | | 6,668,837 | |
| | | | | | | | | | | | | | | | |
Financial Derivative Instruments-Liabilities†† | | | | | | | | | | | | | | | | |
Foreign Exchange Contracts | | | — | | | | (4,538,873 | ) | | | — | | | | (4,538,873 | ) |
Equity Contracts | | | (1,344,358 | ) | | | | | | | — | | | | (1,344,358 | ) |
Interest Rate Contracts | | | (1,871,012 | ) | | | | | | | — | | | | (1,871,012 | ) |
| | | | | | | | | | | | | | | | |
| | | (3,215,370 | ) | | | (4,538,873 | ) | | | — | | | | (7,754,243 | ) |
| | | | | | | | | | | | | | | | |
Total Financial Derivative Instruments | | $ | (866,684 | ) | | $ | (218,722 | ) | | | — | | | $ | (1,085,406 | ) |
| | | | | | | | | | | | | | | | |
The accompanying notes are an integral part of these financial statements.
23
Notes to Schedules of Portfolio Investments (continued)
| | | | | | | | | | | | | | | | |
| | | Quoted Prices in Active
Markets for Identical
Investments
Level 1 | | | Significant Other
Observable Inputs
Level 2 | | | Significant Unobservable Inputs
Level 3 | | | Total | |
Managers AMG FQ Global Essentials Fund | | | | | | | | | | | | | | | | |
Investments in Securities | | | | | | | | | | | | | | | | |
Exchange Traded Funds††† | | $ | 60,049,904 | | | | — | | | | — | | | $ | 60,049,904 | |
Exchange Traded Notes††† | | | 10,738,043 | | | | — | | | | — | | | | 10,738,043 | |
U.S. Government Obligations†††† | | | — | | | $ | 8,999,784 | | | | — | | | | 8,999,784 | |
Short-Term Investments | | | | | | | | | | | | | | | | |
Repurchase Agreements | | | — | | | | 2,048,442 | | | | — | | | | 2,048,442 | |
Other Investment Companies | | | 21,409,249 | | | | — | | | | — | | | | 21,409,249 | |
| | | | | | | | | | | | | | | | |
Total Investments in Securities | | $ | 92,197,196 | | | $ | 11,048,226 | | | | — | | | $ | 103,245,422 | |
| | | | | | | | | | | | | | | | |
Financial Derivative Instruments-Assets†† | | | | | | | | | | | | | | | | |
Equity Contracts | | $ | 2,788,451 | | | | — | | | | — | | | $ | 2,788,451 | |
Interest Rate Contracts | | | 732,466 | | | | — | | | | — | | | | 732,466 | |
| | | | | | | | | | | | | | | | |
| | | 3,520,917 | | | | — | | | | — | | | | 3,520,917 | |
| | | | | | | | | | | | | | | | |
Financial Derivative Instruments-Liabilities†† | | | | | | | | | | | | | | | | |
Equity Contracts | | | (832,765 | ) | | | — | | | | — | | | | (832,765 | ) |
| | | | | | | | | | | | | | | | |
Total Financial Derivative Instruments | | $ | 2,688,152 | | | | — | | | | — | | | $ | 2,688,152 | |
| | | | | | | | | | | | | | | | |
| † | For a detailed break-out of the common stocks by major industry classification, please refer to the Schedule of Portfolio Investments. |
| †† | Derivative instruments, such as futures, written options and forwards, are not reflected in the Schedule of Portfolio Investments. Futures and forwards are valued at the unrealized appreciation/depreciation of the instrument and written options are shown at value. |
| ††† | All exchange traded funds and exchange traded notes held in the Fund are level 1 securities. For a detailed breakout of these securities, please refer to the Schedule of Portfolio Investments. |
| †††† | All U.S. government and agency obligations held in the Fund are level 2 securities. For a detailed breakout of the U.S. government and agency obligations by major industry or agency classification, please refer to the Schedule of Portfolio Investments. |
As of October 31, 2013, the Funds had no transfers between levels from the beginning of the reporting period.
The following schedule shows the fair value of derivative instruments at October 31, 2013:
| | | | | | | | | | | | | | |
| | | | | Asset Derivatives | | | Liability Derivatives | |
Fund | | Derivatives not
accounted for as
hedging instruments | | Statement of Assets and Liabilities
Location | | Fair Value | | | Statement of Assets and Liabilities
Location | | Fair Value | |
Managers AMG FQ U.S. Equity
Fund | | Equity contracts | | Options purchased2 | | $ | 127,780 | | �� | Options written | | $ | 492,018 | |
| | Equity contracts | | Receivable for variation margin*,1 | | | 7,262 | | | Payable for variation margin*,1 | | | — | |
| | | | | | | | | | | | | | |
Totals | | $ | 135,042 | | | | | $ | 492,018 | |
| | | | | | | | | | | | | | |
| | | | | | | | | | | | | | |
| | | | | Asset Derivatives | | | Liability Derivatives | |
Fund | | Derivatives not
accounted for as
hedging instruments | | Statement of Assets and Liabilities
Location | | Fair Value | | | Statement of Assets and Liabilities
Location | | Fair Value | |
Managers AMG FQ Global Alternatives Fund | | Equity contracts | | Receivable for variation margin*,1 | | $ | 304,602 | | | Payable for variation margin*,1 | | $ | 1,344,358 | |
| | Interest rate
contracts* | | Receivable for variation margin*,1 | | | 2,044,084 | | | Payable for variation margin*,1 | | | 1,871,012 | |
| | Foreign exchange
contracts | | Unrealized appreciation of foreign
currency contracts | | | 4,320,151 | | | Unrealized depreciation of
foreign currency contracts | | | 4,538,873 | |
| | | | | | | | | | | | | | |
Totals | | $ | 6,668,837 | | | | | $ | 7,754,243 | |
| | | | | | | | | | | | | | |
The accompanying notes are an integral part of these financial statements.
24
Notes to Schedules of Portfolio Investments (continued)
| | | | | | | | | | | | | | |
| | | | | Asset Derivatives | | | Liability Derivatives | |
Fund | | Derivatives not accounted for as
hedging instruments | | Statement of Assets and Liabilities
Location | | Fair Value | | | Statement of Assets and Liabilities
Location | | Fair Value | |
Managers AMG FQ Global Essentials Fund | | Equity contracts | | Options purchased2 | | $ | 212,090 | | | Options Written | | $ | 832,765 | |
| | Equity contracts | | Receivable for variation margin*,1 | | | 2,576,361 | | | Payable for variation margin*,1 | | | — | |
| | Interest rate contracts | | Receivable for variation margin*,1 | | | 732,466 | | | Payable for variation margin*,1 | | | — | |
| | | | | | | | | | | | | | |
Totals | | | | | | $ | 3,520,917 | | | | | $ | 832,765 | |
| | | | | | | | | | | | | | |
| | * | Includes only the October 31, 2013 futures variation margin. Prior futures variation margin movements have been settled in cash on the Statement of Assets and Liabilities upon receipt or payment. |
| | 1 | Only current day’s variation margin is reported within the Statement of Assets and Liabilities. |
For the fiscal year ended October 31, 2013, the effect of derivative instruments on the Statement of Operations for the Funds and the amount of realized gain (loss) and unrealized gain (loss) on derivatives recognized in income is as follows:
| | | | | | | | | | | | | | |
| | | | | Realized Gain (Loss) | | | Change in Unrealized Gain (Loss) | |
Fund | | Derivatives not accounted for as
hedging instruments | | Statement of Operations
Location | | Realized
Gain/(Loss) | | | Statement of Operations Location | | Change in
Unrealized
Gain/(Loss) | |
Managers AMG FQ U.S. Equity Fund | | Equity contracts | | Net realized loss on
options purchased2 | | $ | (2,149,917 | ) | | Net change in unrealized appreciation (depreciation) options purchased2 | | $ | (263,632 | ) |
| | Equity contracts | | Net realized loss on
options written2 | | | 1,471,927 | | | Net change in unrealized appreciation (depreciation) options written | | | (133,420 | ) |
| | Equity contracts | | Net realized gain
on futures contracts | | | 26,881 | | | Net change in unrealized appreciation (depreciation) of futures contracts | | | 9,845 | |
| | | | | | | | | | | | | | |
Totals | | | | | | $ | (651,109 | ) | | | | $ | (387,207 | ) |
| | | | | | | | | | | | | | |
| | | | | | | | | | | | | | |
| | | | | Realized Gain (Loss) | | | Change in Unrealized Gain (Loss) | |
Fund | | Derivatives not accounted for as
hedging instruments | | Statement of Operations
Location | | Realized
Gain/(Loss) | | | Statement of Operations Location | | Change in
Unrealized
Gain/(Loss) | |
Managers AMG FQ Global Alternatives Fund | | Equity contracts | | Net realized loss on
futures contracts | | $ | (11,341,843 | ) | | Net change in unrealized appreciation (depreciation) of futures contracts | | $ | (3,668,773 | ) |
| | Interest rate contracts | | Net realized loss on
futures contracts | | | (2,820,216 | ) | | Net change in unrealized appreciation (depreciation) of futures contracts | | | 2,835,158 | |
| | Foreign exchange contracts | | Net realized gain
on foreign currency
transactions | | | 7,878,413 | | | Net change in unrealized appreciation (depreciation) of foreign currency translations | | | (1,673,238 | ) |
| | | | | | | | | | | | | | |
Totals | | | | | | $ | (6,283,646 | ) | | | | $ | (2,506,853 | ) |
| | | | | | | | | | | | | | |
The accompanying notes are an integral part of these financial statements.
25
Notes to Schedules of Portfolio Investments (continued)
| | | | | | | | | | | | | | |
| | | | | Realized Gain (Loss) | | | Change in Unrealized Gain (Loss) | |
Fund | | Derivatives not accounted for as
hedging instruments | | Statement of Operations
Location | | Realized
Gain/(Loss) | | | Statement of Operations Location | | Change in
Unrealized
Gain/(Loss) | |
Managers AMG FQ Global Essentials Fund | | Equity contracts | | Net realized loss on
options purchased2 | | $ | (474,140 | ) | | Net change in unrealized appreciation (depreciation) options purchased2 | | $ | (558,226 | ) |
| | Equity contracts | | Net realized loss on
options written2 | | | (328,733 | ) | | Net change in unrealized appreciation (depreciation) options written | | | (54,913 | ) |
| | Equity contracts | | Net realized gain
on futures contracts | | | 7,754,123 | | | Net change in unrealized appreciation (depreciation) of futures contracts | | | 3,233,809 | |
| | Interest rate contracts | | Net realized loss on
futures contracts | | | (6,438,532 | ) | | Net change in unrealized appreciation (depreciation) of futures contracts | | | 1,046,170 | |
| | | | | | | | | | | | | | |
Totals | | | | | | $ | 512,718 | | | | | $ | 3,666,840 | |
| | | | | | | | | | | | | | |
| | 2 | Options purchased are included in Investments at value on the Statement of Assets and Liabilities. Net realized gain (loss) on options purchased/written and net change in unrealized appreciation (depreciation) options purchased are included in the net realized gain (loss) on investments on the Statement of Operations. |
At October 31, 2013, the following Funds had open written options:
(See Note 10 in the Notes to Financial Statements.)
Managers AMG FQ U.S. Equity Fund - Written Option Contracts
| | | | | | | | | | | | | | |
Description | | Exercise Price | | Expiration Date | | Number of Contracts | | Premium | | | Unrealized
Gain/(Loss) | |
S&P 500 Index (Call) | | 1,750 | | 11/16/13 | | 49 | | $ | 39,127 | | | $ | (56,424 | ) |
S&P 500 Index (Call) | | 1,760 | | 11/16/13 | | 57 | | | 41,809 | | | | (35,540 | ) |
S&P 500 Index (Call) | | 1,820 | | 01/18/14 | | 152 | | | 69,692 | | | | (121,828 | ) |
S&P 500 Index (Call) | | 1,825 | | 12/21/13 | | 79 | | | 53,172 | | | | 10,512 | |
S&P 500 Index (Call) | | 1,850 | | 01/18/14 | | 11 | | | 4,603 | | | | (2,382 | ) |
S&P 500 Index (Put) | | 1,490 | | 11/16/13 | | 77 | | | 89,484 | | | | 87,175 | |
S&P 500 Index (Put) | | 1,500 | | 11/16/13 | | 29 | | | 36,207 | | | | 35,337 | |
S&P 500 Index (Put) | | 1,500 | | 01/18/14 | | 152 | | | 151,772 | | | | 96,748 | |
S&P 500 Index (Put) | | 1,550 | | 12/21/13 | | 79 | | | 78,847 | | | | 59,097 | |
| | | | | | | | | | | | | | |
Totals | | | | | | | | $ | 564,713 | | | $ | 72,695 | |
| | | | | | | | | | | | | | |
The accompanying notes are an integral part of these financial statements.
26
Notes to Schedules of Portfolio Investments (continued)
Managers AMG FQ Global Essentials Fund - Written Option Contracts
| | | | | | | | | | | | | | |
Description | | Exercise Price | | Expiration Date | | Number of Contracts | | Premium | | | Unrealized
Gain/(Loss) | |
S&P 500 Index (Call) | | 1,740 | | 11/16/13 | | 204 | | $ | 177,050 | | | $ | (359,470 | ) |
S&P 500 Index (Call) | | 1,850 | | 01/18/14 | | 186 | | | 77,728 | | | | (40,382 | ) |
S&P 500 Index (Call) | | 1,850 | | 12/21/13 | | 191 | | | 75,998 | | | | 30,158 | |
S&P 500 Index (Put) | | 1,470 | | 12/21/13 | | 191 | | | 95,098 | | | | 71,223 | |
S&P 500 Index (Put) | | 1,490 | | 11/16/13 | | 204 | | | 203,570 | | | | 197,450 | |
S&P 500 Index (Put) | | 1,550 | | 01/18/14 | | 186 | | | 148,408 | | | | 46,108 | |
| | | | | | | | | | | | | | |
Totals | | | | | | | | $ | 777,852 | | | $ | (54,913 | ) |
| | | | | | | | | | | | | | |
Transactions in written put and call options and swaptions for the fiscal year ended October 31, 2013, were as follows: (See Note 10 in the Notes to Financial Statements.)
Managers AMG FQ U.S. Equity Fund
| | | | | | | | |
| | | Number of
Contracts | | | Amount of Premiums | |
Options outstanding at October 31, 2012 | | | 490 | | | $ | 227,265 | |
Options written | | | 5,033 | | | | 2,509,286 | |
Options exercised/expired/closed | | | (4,838 | ) | | | (2,171,838 | ) |
| | | | | | | | |
Options outstanding at October 31, 2013 | | | 685 | | | $ | 564,713 | |
| | | | | | | | |
Managers AMG FQ Global Essentials
| | | | | | | | |
| | | Number of
Contracts | | | Amount of Premiums | |
Options outstanding at October 31, 2012 | | | — | | | | — | |
Options written | | | 1,978 | | | $ | 1,239,211 | |
Options exercised/expired/closed | | | (816 | ) | | | (461,359 | ) |
| | | | | | | | |
Options outstanding at October 31, 2013 | | | 1,162 | | | $ | 777,852 | |
| | | | | | | | |
All futures contracts are exchange traded unless otherwise noted. The counterparty for all OTC contracts is Morgan Stanley and Goldman Sachs. (See Note 9 in the Notes to Financial Statements.) At October 31, 2013, the following Funds had open futures contracts:
Managers AMG FQ U.S. Equity Fund - Futures Contracts
| | | | | | | | | | | | |
Type | | Number of Contracts | | Position | | Expiration
Date | | | Unrealized
Gain | |
S&P 500 E-Mini Index | | 2 | | Long | | | 12/20/13 | | | $ | 7,262 | |
| | | | | | | | | | | | |
The accompanying notes are an integral part of these financial statements.
27
Notes to Schedules of Portfolio Investments (continued)
Managers AMG FQ Global Alternatives Fund - Futures Contracts
| | | | | | | | | | | | |
Type | | Currency | | Number of Contracts | | Position | | Expiration
Date | | Unrealized
Gain/(Loss) | |
Amsterdam Index | | EUR | | 43 | | Long | | 11/15/13 | | $ | 114,914 | |
Australia 10-Year Bond | | AUD | | 292 | | Short | | 12/16/13 | | | (369,996 | ) |
Australian SPI 200 | | AUD | | 126 | | Short | | 12/19/13 | | | (375,850 | ) |
CAC40 Index | | EUR | | 43 | | Long | | 11/15/13 | | | 35,962 | |
Canadian 10-Year Bond | | CAD | | 669 | | Short | | 12/18/13 | | | (1,405,062 | ) |
DAX Index | | EUR | | 14 | | Short | | 12/20/13 | | | (99,992 | ) |
Euro-Bund 10-Year | | EUR | | 66 | | Long | | 12/06/13 | | | 366,834 | |
FTSE 100 Index | | GBP | | 21 | | Long | | 12/20/13 | | | 69,642 | |
FTSE/MIB Index | | EUR | | 20 | | Long | | 12/20/13 | | | 33,976 | |
Hang Seng Index | | HKD | | 15 | | Long | | 11/28/13 | | | 47,699 | |
IBEX 35 Index | | EUR | | 90 | | Short | | 11/15/13 | | | (98,883 | ) |
Japanese 10-Year Bond | | JPY | | 45 | | Short | | 12/10/13 | | | (95,954 | ) |
S&P 500 E-Mini Index | | USD | | 222 | | Short | | 12/20/13 | | | (769,633 | ) |
S&P/TSX 60 Index | | CAD | | 3 | | Short | | 12/19/13 | | | 1,352 | |
TOPIX Index | | JPY | | 102 | | Long | | 12/12/13 | | | 1,057 | |
U.K. 10-Year Gilt | | GBP | | 130 | | Long | | 12/27/13 | | | 358,290 | |
U.S. Treasury 10-Year Bond | | USD | | 669 | | Long | | 12/19/13 | | | 1,318,960 | |
| | | | | | | | | | | | |
Total | | | | | | | | | | $ | (866,684 | ) |
| | | | | | | | | | | | |
Managers AMG FQ Global Essentials Fund - Futures Contracts
| | | | | | | | | | | | | | |
Type | | Currency | | Number of Contracts | | Position | | Expiration
Date | | | Unrealized
Gain | |
Amsterdam Index | | EUR | | 27 | | Long | |
| 11/15/13
to
12/20/13 |
| | $ | 106,338 | |
Australia 10-Year Bond | | AUD | | 61 | | Long | | | 12/16/13 | | | | 75,648 | |
Australian SPI 200 | | AUD | | 40 | | Long | | | 12/19/13 | | | | 175,491 | |
CAC40 Index | | EUR | | 46 | | Long | |
| 11/15/13
to
12/20/13 |
| | | 100,890 | |
Canadian 10-Year Bond | | CAD | | 53 | | Long | | | 12/18/13 | | | | 161,295 | |
DAX Index | | EUR | | 8 | | Long | | | 12/20/13 | | | | 117,395 | |
E-Mini MSCI Index | | USD | | 274 | | Long | | | 12/20/13 | | | | 502,201 | |
Euro-Bund 10-Year | | EUR | | 23 | | Long | | | 12/06/13 | | | | 127,840 | |
The accompanying notes are an integral part of these financial statements.
28
Notes to Schedules of Portfolio Investments (continued)
| | | | | | | | | | | | |
Type | | Currency | | Number of Contracts | | Position | | Expiration
Date | | Unrealized
Gain | |
Euro-Bund 30-Year | | EUR | | 16 | | Long | | 12/06/13 | | $ | 48,313 | |
FTSE 100 Index | | GBP | | 33 | | Long | | 12/20/13 | | | 84,921 | |
FTSE/MIB Index | | EUR | | 20 | | Long | | 12/20/13 | | | 230,751 | |
Hang Seng Index | | HKD | | 16 | | Long | | 11/28/13 | | | 50,879 | |
IBEX 35 Index | | EUR | | 20 | | Long | | 11/15/13 | | | 49,461 | |
Russell 2000 Index | | USD | | 137 | | Long | | 12/20/13 | | | 705,254 | |
S&P 500 E-Mini Index | | USD | | 52 | | Long | | 12/20/13 | | | 188,778 | |
S&P/TSX 60 Index | | CAD | | 31 | | Long | | 12/19/13 | | | 195,671 | |
TOPIX Index | | JPY | | 31 | | Long | | 12/12/13 | | | 68,331 | |
U.K. 10-Year Gilt | | GBP | | 50 | | Long | | 12/27/13 | | | 161,818 | |
U.S. Treasury Long Bond | | USD | | 45 | | Long | | 12/19/13 | | | 157,552 | |
| | | | | | | | | | | | |
Total | | | | | | | | | | $ | 3,308,827 | |
| | | | | | | | | | | | |
At October 31, 2013, the following Funds had foreign currency contracts (in U.S. Dollars): (See Note 8 in the Notes to Financial Statements.)
Managers AMG FQ Global Alternatives Fund - Foreign Currency
| | | | | | | | | | | | | | | | | | |
Foreign Currency | | Position | | Settlement Date | | Counterparty | | Receivable
Amount | | | Payable Amount | | | Unrealized
Gain/
(Loss) | |
Australian Dollar | | Long | | 12/18/13 | | GS | | $ | 7,152,090 | | | $ | 7,190,720 | | | $ | (38,630 | ) |
Australian Dollar | | Long | | 12/18/13 | | GS | | | 3,043,957 | | | | 3,022,853 | | | | 21,104 | |
Australian Dollar | | Long | | 12/18/13 | | MS | | | 4,014,681 | | | | 4,042,309 | | | | (27,628 | ) |
Australian Dollar | | Long | | 12/18/13 | | MS | | | 643,570 | | | | 630,584 | | | | 12,986 | |
British Pound | | Long | | 12/18/13 | | GS | | | 5,638,099 | | | | 5,668,598 | | | | (30,499 | ) |
British Pound | | Long | | 12/18/13 | | MS | | | 33,010,318 | | | | 32,321,598 | | | | 688,720 | |
Canadian Dollar | | Long | | 12/18/13 | | GS | | | 6,620,342 | | | | 6,683,802 | | | | (63,460 | ) |
Canadian Dollar | | Long | | 12/18/13 | | MS | | | 4,215,826 | | | | 4,306,091 | | | | (90,265 | ) |
Euro | | Long | | 12/18/13 | | GS | | | 14,328,341 | | | | 14,466,625 | | | | (138,284 | ) |
Euro | | Long | | 12/18/13 | | GS | | | 40,774,002 | | | | 39,835,362 | | | | 938,640 | |
Euro | | Long | | 12/18/13 | | MS | | | 31,600,175 | | | | 30,845,274 | | | | 754,901 | |
Japanese Yen | | Long | | 12/18/13 | | GS | | | 15,431,727 | | | | 15,583,245 | | | | (151,518 | ) |
Japanese Yen | | Long | | 12/18/13 | | GS | | | 4,900,130 | | | | 4,878,815 | | | | 21,315 | |
Japanese Yen | | Long | | 12/18/13 | | MS | | | 4,821,017 | | | | 4,762,652 | | | | 58,365 | |
New Zealand Dollar | | Long | | 12/18/13 | | GS | | | 3,548,172 | | | | 3,584,048 | | | | (35,876 | ) |
The accompanying notes are an integral part of these financial statements.
29
Notes to Schedules of Portfolio Investments (continued)
| | | | | | | | | | | | | | | | | | |
Foreign Currency | | Position | | Settlement Date | | Counterparty | | Receivable
Amount | | | Payable Amount | | | Unrealized
Gain/
(Loss) | |
New Zealand Dollar | | Long | | 12/18/13 | | MS | | $ | 4,498,186 | | | $ | 4,553,442 | | | $ | (55,256 | ) |
New Zealand Dollar | | Long | | 12/18/13 | | MS | | | 9,347,835 | | | | 9,081,424 | | | | 266,411 | |
Norwegian Krone | | Long | | 12/18/13 | | GS | | | 8,862,233 | | | | 8,909,399 | | | | (47,166 | ) |
Norwegian Krone | | Long | | 12/18/13 | | GS | | | 18,142,268 | | | | 18,126,423 | | | | 15,845 | |
Norwegian Krone | | Long | | 12/18/13 | | MS | | | 8,929,082 | | | | 8,910,145 | | | | 18,937 | |
Singapore Dollar | | Long | | 12/18/13 | | MS | | | 4,751,348 | | | | 4,695,975 | | | | 55,373 | |
Swedish Krona | | Long | | 12/18/13 | | GS | | | 3,898,991 | | | | 3,972,863 | | | | (73,872 | ) |
Swedish Krona | | Long | | 12/18/13 | | MS | | | 12,018,036 | | | | 11,852,073 | | | | 165,963 | |
Swiss Franc | | Long | | 12/18/13 | | GS | | | 3,870,841 | | | | 3,944,725 | | | | (73,884 | ) |
Swiss Franc | | Long | | 12/18/13 | | GS | | | 4,894,930 | | | | 4,756,908 | | | | 138,022 | |
Swiss Franc | | Long | | 12/18/13 | | MS | | | 5,518,385 | | | | 5,492,840 | | | | 25,545 | |
Australian Dollar | | Short | | 12/18/13 | | GS | | | 5,958,487 | | | | 5,851,501 | | | | 106,986 | |
Australian Dollar | | Short | | 12/18/13 | | MS | | | 501,038 | | | | 503,565 | | | | (2,527 | ) |
British Pound | | Short | | 12/18/13 | | GS | | | 985,010 | | | | 1,006,897 | | | | (21,887 | ) |
British Pound | | Short | | 12/18/13 | | MS | | | 2,198,486 | | | | 2,197,049 | | | | 1,437 | |
Canadian Dollar | | Short | | 12/18/13 | | GS | | | 38,798,062 | | | | 38,472,233 | | | | 325,829 | |
Canadian Dollar | | Short | | 12/18/13 | | MS | | | 15,323,538 | | | | 15,226,648 | | | | 96,890 | |
Euro | | Short | | 12/18/13 | | GS | | | 11,356,461 | | | | 11,461,727 | | | | (105,266 | ) |
Euro | | Short | | 12/18/13 | | GS | | | 10,329,940 | | | | 10,216,429 | | | | 113,511 | |
Euro | | Short | | 12/18/13 | | MS | | | 5,656,369 | | | | 5,677,063 | | | | (20,694 | ) |
Japanese Yen | | Short | | 12/18/13 | | GS | | | 5,402,612 | | | | 5,508,292 | | | | (105,680 | ) |
Japanese Yen | | Short | | 12/18/13 | | GS | | | 3,028,788 | | | | 2,999,125 | | | | 29,663 | |
New Zealand Dollar | | Short | | 12/18/13 | | GS | | | 37,277,794 | | | | 38,318,863 | | | | (1,041,069 | ) |
New Zealand Dollar | | Short | | 12/18/13 | | GS | | | 14,376,155 | | | | 14,181,713 | | | | 194,442 | |
Norwegian Krone | | Short | | 12/18/13 | | GS | | | 4,033,481 | | | | 4,083,586 | | | | (50,105 | ) |
Norwegian Krone | | Short | | 12/18/13 | | GS | | | 11,528,563 | | | | 11,464,006 | | | | 64,557 | |
Singapore Dollar | | Short | | 12/18/13 | | GS | | | 22,351,626 | | | | 22,806,266 | | | | (454,640 | ) |
Singapore Dollar | | Short | | 12/18/13 | | GS | | | 1,517,962 | | | | 1,513,017 | | | | 4,945 | |
Swedish Krona | | Short | | 12/18/13 | | GS | | | 33,928,657 | | | | 34,324,243 | | | | (395,586 | ) |
Swedish Krona | | Short | | 12/18/13 | | GS | | | 3,860,732 | | | | 3,818,871 | | | | 41,861 | |
Swedish Krona | | Short | | 12/18/13 | | MS | | | 5,553,797 | | | | 5,454,609 | | | | 99,188 | |
Swiss Franc | | Short | | 12/18/13 | | GS | | | 27,167,743 | | | | 27,940,573 | | | | (772,830 | ) |
The accompanying notes are an integral part of these financial statements.
30
Notes to Schedules of Portfolio Investments (continued)
| | | | | | | | | | | | | | | | | | |
Foreign Currency | | Position | | Settlement Date | | Counterparty | | Receivable
Amount | | | Payable Amount | | | Unrealized
Gain/
(Loss) | |
Swiss Franc | | Short | | 12/18/13 | | GS | | $ | 6,125,513 | | | $ | 6,066,798 | | | $ | 58,715 | |
Swiss Franc | | Short | | 12/18/13 | | MS | | | 26,857,762 | | | | 27,600,013 | | | | (742,251 | ) |
| | | | | | | | | | | | | | | | | | |
Totals | | | | | | | | $ | 558,593,158 | | | $ | 558,811,880 | | | $ | (218,722 | ) |
| | | | | | | | | | | | | | | | | | |
| | |
Currency Abbreviations: |
| |
| AUD: | | Australian Dollar |
| CAD: | | Canadian Dollar |
| EUR: | | Euro |
| GBP: | | British Pound |
| HKD: | | Hong Kong Dollar |
| JPY: | | Japanese Yen |
| USD: | | U.S. Dollar |
|
Counterparty Abbreviations: |
| |
| MS: | | Morgan Stanley |
| GS: | | Goldman Sachs Group, Inc. |
| OTC: | | Over-the-counter |
The accompanying notes are an integral part of these financial statements.
31
Statement of Assets and Liabilities
October 31, 2013
| | | | | | | | | | | | | | | | |
| | | Managers AMG FQ
Tax-Managed
U.S. Equity Fund | | | Managers AMG FQ
U.S.
Equity Fund | | | Managers AMG FQ
Global
Alternatives Fund | | | Managers AMG FQ
Global
Essentials Fund | |
Assets: | | | | | | | | | | | | | | | | |
Investments at value* (including securities on loan valued at $617,469, $1,477,043, $0, and $1,968,783, respectively) | | $ | 50,179,193 | | | $ | 62,955,108 | | | $ | 121,697,703 | | | $ | 103,457,512 | |
Cash | | | 3,192 | | | | — | | | | — | | | | — | |
Cash collateral for futures | | | — | | | | 77,000 | | | | — | | | | — | |
Receivable for Fund shares sold | | | 27,585 | | | | 100,594 | | | | 137,841 | | | | 8,893 | |
Dividends, interest and other receivables | | | 27,618 | | | | 37,804 | | | | 2,387 | | | | 19,995 | |
Receivable for variation margin on futures contracts | | | — | | | | — | | | | 313,922 | | | | 97,443 | |
Receivable for investments sold | | | — | | | | — | | | | 520,676 | | | | 289,729 | |
Receivable from affiliate | | | — | | | | — | | | | 45,118 | | | | 20,703 | |
Unrealized appreciation on forward foreign currency contracts | | | — | | | | — | | | | 4,320,151 | | | | — | |
Prepaid expenses | | | 15,946 | | | | 16,365 | | | | 17,912 | | | | 19,247 | |
Total assets | | | 50,253,534 | | | | 63,186,871 | | | | 127,055,710 | | | | 103,913,522 | |
Liabilities: | | | | | | | | | | | | | | | | |
Payable to custodian | | | — | | | | 825 | | | | — | | | | 255,838 | |
Payable upon return of securities loaned | | | 642,542 | | | | 1,522,691 | | | | — | | | | 2,048,442 | |
Payable for Fund shares repurchased | | | 7,988 | | | | 33,560 | | | | 584,002 | | | | 81,502 | |
Written options (premium received $564,713 and $777,852, respectively) | | | — | | | | 492,018 | | | | — | | | | 832,765 | |
Payable for variation margin on futures contracts | | | — | | | | 960 | | | | 565,786 | | | | 503,439 | |
Unrealized depreciation on forward foreign currency contracts | | | — | | | | — | | | | 4,538,873 | | | | — | |
Payable for broker collateral on futures | | | — | | | | — | | | | 1,690,000 | | | | — | |
Payable for investments purchased | | | — | | | | — | | | | 523,107 | | | | 291,104 | |
Accrued expenses: | | | | | | | | | | | | | | | | |
Investment management and advisory fees | | | 35,173 | | | | 17,859 | | | | 173,243 | | | | 51,354 | |
Shareholder servicing fees - Investor Class | | | — | | | | — | | | | 6,631 | | | | 1,209 | |
Administrative fees | | | — | | | | 12,756 | | | | 25,477 | | | | 21,397 | |
Distribution fees - Investor Class | | | 1,332 | | | | 4,791 | | | | 12,616 | | | | 1,209 | |
Trustees fees and expenses | | | 252 | | | | 193 | | | | 1,590 | | | | 550 | |
Other | | | 34,395 | | | | 38,400 | | | | 96,001 | | | | 41,636 | |
Total liabilities | | | 721,682 | | | | 2,124,053 | | | | 8,217,326 | | | | 4,130,445 | |
| | | | |
Net Assets | | $ | 49,531,852 | | | $ | 61,062,818 | | | $ | 118,838,384 | | | $ | 99,783,077 | |
* Investments at cost | | $ | 34,267,393 | | | $ | 52,235,388 | | | $ | 112,564,608 | | | $ | 105,118,702 | |
The accompanying notes are an integral part of these financial statements.
32
Statement of Assets and Liabilities
October 31, 2013 (continued)
| | | | | | | | | | | | | | | | |
| | | Managers AMG FQ
Tax-Managed
U.S. Equity Fund | | | Managers AMG FQ
U.S.
Equity Fund | | | Managers AMG FQ
Global
Alternatives Fund | | | Managers AMG FQ
Global
Essentials Fund | |
Net Assets Represent: | | | | | | | | | | | | | | | | |
Paid-in capital | | $ | 52,186,678 | | | $ | 58,000,638 | | | $ | 107,761,248 | | | $ | 115,808,578 | |
Undistributed net investment income | | | 107,748 | | | | 22,286 | | | | 7,349,905 | | | | — | |
Accumulated net realized loss from investments, options, futures and foreign currency transactions | | | (18,674,374 | ) | | | (7,759,783 | ) | | | (4,318,027 | ) | | | (17,622,752 | ) |
Net unrealized appreciation of investments, options, futures and foreign currency translations | | | 15,911,800 | | | | 10,799,677 | | | | 8,045,258 | | | | 1,597,251 | |
Net Assets | | $ | 49,531,852 | | | $ | 61,062,818 | | | $ | 118,838,384 | | | $ | 99,783,077 | |
| | | | |
Investor Shares: | | | | | | | | | | | | | | | | |
Net Assets | | $ | 6,324,483 | 1 | | $ | 23,103,126 | 1 | | $ | 58,165,271 | 1 | | $ | 5,519,769 | |
Shares outstanding | | | 315,854 | 1 | | | 1,517,112 | 1 | | | 6,537,349 | 1 | | | 420,127 | |
Net asset value and redemption price per share | | $ | 20.02 | 1 | | $ | 15.23 | 1 | | $ | 8.90 | 1 | | $ | 13.14 | |
Service Shares: | | | | | | | | | | | | | | | | |
Net Assets | | | n/a | | | | n/a | | | $ | 39,059,624 | | | $ | 5,844,122 | |
Shares outstanding | | | n/a | | | | n/a | | | | 4,372,256 | | | | 442,512 | |
Net asset value and redemption price per share | | | n/a | | | | n/a | | | $ | 8.93 | | | $ | 13.21 | |
Institutional Class Shares: | | | | | | | | | | | | | | | | |
Net Assets | | $ | 43,207,369 | | | $ | 37,959,692 | | | $ | 21,613,489 | | | $ | 88,419,186 | |
Shares outstanding | | | 2,161,015 | | | | 2,486,561 | | | | 2,413,497 | | | | 6,682,925 | |
Net asset value and redemption price per share | | $ | 19.99 | | | $ | 15.27 | | | $ | 8.96 | | | $ | 13.23 | |
| 1 | Effective December 1, 2012, all Class A shares were renamed Investor Class shares and Class C shares converted to Investor Class shares. |
The accompanying notes are an integral part of these financial statements.
33
Statement of Operations
For the fiscal year ended October 31, 2013
| | | | | | | | | | | | | | | | |
| | | Managers AMG FQ
Tax-Managed
U.S. Equity Fund | | | Managers AMG FQ
U.S.
Equity Fund | | | Managers AMG FQ
Global
Alternatives Fund | | | Managers AMG FQ
Global
Essentials Fund | |
Investment Income: | | | | | | | | | | | | | | | | |
Dividend income | | $ | 740,934 | 1 | | $ | 1,325,861 | 1 | | $ | 758,303 | | | $ | 1,845,519 | |
Interest income | | | — | | | | 2 | | | | 46,201 | | | | 9,426 | |
Securities lending income | | | 569 | | | | 13,717 | | | | 2,526 | | | | 23,557 | |
Foreign withholding tax | | | (3,503 | ) | | | (2,504 | ) | | | — | | | | — | |
Total investment income | | | 738,000 | | | | 1,337,076 | | | | 807,030 | | | | 1,878,502 | |
Expenses: | | | | | | | | | | | | | | | | |
Investment management and advisory fees | | | 384,038 | | | | 186,178 | | | | 2,559,163 | | | | 683,721 | |
Administrative fees | | | — | | | | 132,985 | | | | 376,346 | | | | 284,883 | |
Distribution fees - Investor Class | | | 14,049 | | | | 42,341 | | | | 224,317 | | | | 24,408 | |
Distribution fees - Class C | | | 2,291 | | | | 439 | | | | 12,394 | | | | — | |
Shareholder servicing fees - Investor Class | | | — | | | | — | | | | 175,994 | | | | 24,408 | |
Shareholder servicing fees - Service Class | | | — | | | | — | | | | 57,946 | | | | 8,201 | |
Registration fees | | | 35,286 | | | | 34,316 | | | | 36,077 | | | | 48,821 | |
Transfer agent | | | 21,395 | | | | 30,405 | | | | 189,521 | | | | 26,092 | |
Custodian | | | 21,115 | | | | 11,904 | | | | 10,896 | | | | 14,918 | |
Reports to shareholders | | | 11,609 | | | | 12,224 | | | | 57,478 | | | | 19,064 | |
Extraordinary expense | | | 10,639 | | | | 12,254 | | | | 28,738 | | | | 29,140 | |
Professional fees | | | 8,382 | | | | 25,719 | | | | 29,893 | | | | 72,819 | |
Trustees fees and expenses | | | 1,280 | | | | 1,864 | | | | 4,146 | | | | 3,437 | |
Interest expense on futures contracts | | | — | | | | — | | | | 9,817 | | | | 2,512 | |
Miscellaneous | | | 2,068 | | | | 2,153 | | | | 6,036 | | | | 4,756 | |
Total expenses before offsets | | | 512,152 | | | | 492,782 | | | | 3,778,762 | | | | 1,247,180 | |
Fee waivers | | | — | | | | — | | | | (80,987 | ) | | | (13,474 | ) |
Expense reimbursements | | | (40,130 | ) | | | (17,474 | ) | | | (1,047,432 | ) | | | (144,328 | ) |
Net expenses | | | 472,022 | | | | 475,308 | | | | 2,650,343 | | | | 1,089,378 | |
| | | | |
Net investment income (loss) | | | 265,978 | | | | 861,768 | | | | (1,843,313 | ) | | | 789,124 | |
Net Realized and Unrealized Gain (Loss): | | | | | | | | | | | | | | | | |
Net realized gain (loss) on investments | | | 5,319,200 | | | | 5,479,862 | | | | 13,599,523 | | | | (1,173,365 | ) |
Net realized gain (loss) on futures contracts | | | — | | | | 26,881 | | | | (14,162,059 | ) | | | 1,315,591 | |
Net realized gain on foreign currency transactions | | | — | | | | — | | | | 8,866,774 | | | | 36,904 | |
Net change in unrealized appreciation (depreciation) of investments | | | 6,683,434 | | | | 5,958,699 | | | | (6,965,394 | ) | | | (3,634,033 | ) |
Net change in unrealized appreciation (depreciation) of futures contracts | | | — | | | | 9,845 | | | | (833,615 | ) | | | 4,279,979 | |
Net change in unrealized appreciation (depreciation) on foreign currency translations | | | — | | | | — | | | | (1,665,904 | ) | | | 2,283 | |
Net change in unrealized appreciation (depreciation) on written options | | | — | | | | (133,420 | ) | | | — | | | | (54,913 | ) |
Net realized and unrealized gain (loss) | | | 12,002,634 | | | | 11,341,867 | | | | (1,160,675 | ) | | | 772,446 | |
| | | | |
Net increase (decrease) in net assets resulting from operations | | $ | 12,268,612 | | | $ | 12,203,635 | | | $ | (3,003,988 | ) | | $ | 1,561,570 | |
| 1 | Includes non-recurring dividends of $146,497 and $107,285 for Managers AMG FQ Tax-Managed U.S. Equity Fund and Managers AMG FQ U.S. Equity Fund, respectively. |
The accompanying notes are an integral part of these financial statements.
34
Statements of Changes in Net Assets
For the fiscal year ended October 31,
| | | | | | | | | | | | | | | | |
| | | Managers AMG FQ Tax-Managed U.S.
Equity Fund | | | Managers AMG FQ U.S.
Equity Fund | |
| | | 2013 | | | 2012 | | | 2013 | | | 2012 | |
Increase (Decrease) in Net Assets From Operations: | | | | | | | | | | | | | | | | |
Net investment income | | $ | 265,978 | | | $ | 219,934 | | | $ | 861,768 | | | $ | 963,151 | |
Net realized gain on investments, options and futures | | | 5,319,200 | | | | 4,837,628 | | | | 5,506,743 | | | | 1,833,887 | |
Net change in unrealized appreciation (depreciation) of investments, options and futures | | | 6,683,434 | | | | 109,819 | | | | 5,835,124 | | | | 2,402,913 | |
Net increase in net assets resulting from operations | | | 12,268,612 | | | | 5,167,381 | | | | 12,203,635 | | | | 5,199,951 | |
Distributions to Shareholders: | | | | | | | | | | | | | | | | |
From net investment income: | | | | | | | | | | | | | | | | |
Investor Class | | | (45,496 | ) | | | — | | | | (217,396 | ) | | | (317,159 | ) |
Class C | | | — | | | | — | | | | — | | | | (5,029 | ) |
Institutional Class | | | (329,833 | ) | | | (35,481 | ) | | | (638,539 | ) | | | (1,034,913 | ) |
Total distributions to shareholders | | | (375,329 | ) | | | (35,481 | ) | | | (855,935 | ) | | | (1,357,101 | ) |
Capital Share Transactions:1 | | | | | | | | | | | | | | | | |
Net increase (decrease) from capital share transactions | | | (5,096,506 | ) | | | (3,997,806 | ) | | | 2,180,618 | | | | (3,044,387 | ) |
| | | | |
Total increase in net assets | | | 6,796,777 | | | | 1,134,094 | | | | 13,528,318 | | | | 798,463 | |
Net Assets: | | | | | | | | | | | | | | | | |
Beginning of year | | | 42,735,075 | | | | 41,600,981 | | | | 47,534,500 | | | | 46,736,037 | |
End of year | | $ | 49,531,852 | | | $ | 42,735,075 | | | $ | 61,062,818 | | | $ | 47,534,500 | |
End of year undistributed net investment income | | $ | 107,748 | | | $ | 217,099 | | | $ | 22,286 | | | $ | 31,560 | |
| | | | | | | | | | | | | | | | |
| 1 | See Note 1(g) of the Notes to Financial Statements. |
The accompanying notes are an integral part of these financial statements.
35
Statements of Changes in Net Assets
For the fiscal year ended October 31,
| | | | | | | | | | | | | | | | |
| | | Managers AMG FQ Global
Alternatives Fund | | | Managers AMG FQ Global
Essentials Fund | |
| | | 2013 | | | 2012 | | | 2013 | | | 2012 | |
Increase (Decrease) in Net Assets From Operations: | | | | | | | | | | | | | | | | |
Net investment income (loss) | | $ | (1,843,313 | ) | | $ | (4,965,878 | ) | | $ | 789,124 | | | $ | 140,984 | |
Net realized gain on investments, futures and foreign currency transactions | | | 8,304,238 | | | | 11,578,914 | | | | 179,130 | | | | 9,426,219 | |
Net change in unrealized appreciation (depreciation) of investments, futures and foreign currency translations | | | (9,464,913 | ) | | | (13,473,125 | ) | | | 593,316 | | | | 21,713 | |
Net increase (decrease) in net assets resulting from operations | | | (3,003,988 | ) | | | (6,860,089 | ) | | | 1,561,570 | | | | 9,588,916 | |
Distributions to Shareholders: | | | | | | | | | | | | | | | | |
From net investment income: | | | | | | | | | | | | | | | | |
Investor Class | | | (1,998,827 | ) | | | — | | | | (352,805 | ) | | | (422,712 | ) |
Service Class | | | (922,404 | ) | | | — | | | | (399,327 | ) | | | (57,632 | ) |
Institutional Class | | | (570,386 | ) | | | — | | | | (3,193,560 | ) | | | (3,809,314 | ) |
Total distributions to shareholders | | | (3,491,617 | ) | | | — | | | | (3,945,692 | ) | | | (4,289,658 | ) |
Capital Share Transactions:1 | | | | | | | | | | | | | | | | |
Net increase (decrease) from capital share transactions | | | (196,130,478 | ) | | | (136,860,506 | ) | | | (21,786,490 | ) | | | 22,792,473 | |
| | | | |
Total increase (decrease) in net assets | | | (202,626,083 | ) | | | (143,720,595 | ) | | | (24,170,612 | ) | | | 28,091,731 | |
Net Assets: | | | | | | | | | | | | | | | | |
Beginning of year | | | 321,464,467 | | | | 465,185,062 | | | | 123,953,689 | | | | 95,861,958 | |
End of year | | $ | 118,838,384 | | | $ | 321,464,467 | | | $ | 99,783,077 | | | $ | 123,953,689 | |
End of year undistributed net investment income (loss) | | $ | 7,349,905 | | | $ | 579,429 | | | | — | | | $ | 3,945,371 | |
| | | | | | | | | | | | | | | | |
| 1 | See Note 1(g) of the Notes to Financial Statements. |
The accompanying notes are an integral part of these financial statements.
36
Managers AMG FQ Tax-Managed U.S. Equity Fund
Financial Highlights
For a share outstanding throughout each fiscal year
| | | | | | | | | | | | | | | | | | | | |
| | | For the fiscal year ended October 31, | |
Investor Class | | 2013 | | | 2012 | | | 2011 | | | 2010 | | | 2009 | |
Net Asset Value, Beginning of Year | | $ | 15.37 | | | $ | 13.63 | | | $ | 12.47 | | | $ | 10.01 | | | $ | 9.99 | |
Income from Investment Operations: | | | | | | | | | | | | | | | | | | | | |
Net investment income (loss) | | | 0.06 | 3,4 | | | 0.05 | 3,6 | | | (0.01 | )3 | | | 0.02 | 3 | | | 0.09 | |
Net realized and unrealized gain on investments | | | 4.71 | 3 | | | 1.69 | 3 | | | 1.18 | 3 | | | 2.44 | 3 | | | 0.04 | |
Total from investment operations | | | 4.77 | | | | 1.74 | | | | 1.17 | | | | 2.46 | | | | 0.13 | |
Less Distributions to Shareholders from: | | | | | | | | | | | | | | | | | | | | |
Net investment income | | | (0.12 | ) | | | — | | | | (0.01 | ) | | | — | | | | (0.11 | ) |
Net Asset Value, End of Year | | $ | 20.02 | | | $ | 15.37 | | | $ | 13.63 | | | $ | 12.47 | | | $ | 10.01 | |
Total Return1 | | | 31.31 | % | | | 12.77 | % | | | 9.40 | % | | | 24.58 | % | | | 1.53 | % |
Ratio of net expenses to average net assets (with offsets/reductions) | | | 1.26 | %5 | | | 1.24 | % | | | 1.24 | % | | | 1.24 | % | | | 1.24 | % |
Ratio of expenses to average net assets (with offsets) | | | 1.26 | %5 | | | 1.24 | % | | | 1.24 | % | | | 1.24 | % | | | 1.24 | % |
Ratio of total expenses to average net assets (without offsets/reductions)2 | | | 1.35 | %5 | | | 1.39 | % | | | 1.36 | % | | | 1.44 | % | | | 1.43 | % |
Ratio of net investment income (loss) to average net assets1 | | | 0.35 | %5 | | | 0.35 | % | | | (0.07 | )% | | | 0.22 | % | | | 0.45 | % |
Portfolio turnover | | | 49 | % | | | 36 | % | | | 40 | % | | | 81 | % | | | 147 | % |
Net assets at end of year (000’s omitted) | | $ | 6,324 | | | $ | 3,026 | | | $ | 3,049 | | | $ | 4,116 | | | $ | 7,175 | |
| | | | | | | | | | | | | | | | | | | | |
| |
| | | For the fiscal year ended October 31, | |
Institutional Class | | 2013 | | | 2012 | | | 2011 | | | 2010 | | | 2009 | |
Net Asset Value, Beginning of Year | | $ | 15.33 | | | $ | 13.58 | | | $ | 12.43 | | | $ | 9.98 | | | $ | 9.99 | |
Income from Investment Operations: | | | | | | | | | | | | | | | | | | | | |
Net investment income | | | 0.11 | 3,4 | | | 0.09 | 3,6 | | | 0.02 | 3 | | | 0.05 | 3 | | | 0.07 | |
Net realized and unrealized gain on investments | | | 4.70 | 3 | | | 1.67 | 3 | | | 1.19 | 3 | | | 2.43 | 3 | | | 0.07 | |
Total from investment operations | | | 4.81 | | | | 1.76 | | | | 1.21 | | | | 2.48 | | | | 0.14 | |
Less Distributions to Shareholders from: | | | | | | | | | | | | | | | | | | | | |
Net investment income | | | (0.15 | ) | | | (0.01 | ) | | | (0.06 | ) | | | (0.03 | ) | | | (0.15 | ) |
Net Asset Value, End of Year | | $ | 19.99 | | | $ | 15.33 | | | $ | 13.58 | | | $ | 12.43 | | | $ | 9.98 | |
Total Return1 | | | 31.65 | %9 | | | 13.00 | % | | | 9.70 | % | | | 24.92 | % | | | 1.65 | % |
Ratio of net expenses to average net assets (with offsets/reductions) | | | 1.01 | %5 | | | 0.99 | % | | | 0.99 | % | | | 0.99 | % | | | 0.99 | % |
Ratio of expenses to average net assets (with offsets) | | | 1.01 | %5 | | | 0.99 | % | | | 0.99 | % | | | 0.99 | % | | | 0.99 | % |
Ratio of total expenses to average net assets (without offsets/reductions)2 | | | 1.10 | %5 | | | 1.14 | % | | | 1.11 | % | | | 1.19 | % | | | 1.18 | % |
Ratio of net investment income to average net assets1 | | | 0.62 | %5 | | | 0.60 | % | | | 0.18 | % | | | 0.45 | % | | | 0.69 | % |
Portfolio turnover | | | 49 | % | | | 36 | % | | | 40 | % | | | 81 | % | | | 147 | % |
Net assets at end of year (000’s omitted) | | $ | 43,207 | | | $ | 36,884 | | | $ | 35,741 | | | $ | 39,420 | | | $ | 39,366 | |
| | | | | | | | | | | | | | | | | | | | |
37
Managers AMG FQ U.S. Equity Fund
Financial Highlights
For a share outstanding throughout each fiscal year
| | | | | | | | | | | | | | | | | | | | |
| | | For the fiscal year ended October 31, | |
Investor Class | | 2013 | | | 2012 | | | 2011 | | | 2010 | | | 2009 | |
Net Asset Value, Beginning of Year | | $ | 12.29 | | | $ | 11.30 | | | $ | 10.29 | | | $ | 8.93 | | | $ | 8.63 | |
Income from Investment Operations: | | | | | | | | | | | | | | | | | | | | |
Net investment income | | | 0.19 | 3,4 | | | 0.22 | 3 | | | 0.09 | 3 | | | 0.10 | | | | 0.11 | |
Net realized and unrealized gain on investments | | | 2.94 | 3 | | | 1.07 | 3 | | | 1.01 | 3 | | | 1.37 | | | | 0.32 | |
Total from investment operations | | | 3.13 | | | | 1.29 | | | | 1.10 | | | | 1.47 | | | | 0.43 | |
Less Distributions to Shareholders from: | | | | | | | | | | | | | | | | | | | | |
Net investment income | | | (0.19 | ) | | | (0.30 | ) | | | (0.09 | ) | | | (0.11 | ) | | | (0.13 | ) |
Net Asset Value, End of Year | | $ | 15.23 | | | $ | 12.29 | | | $ | 11.30 | | | $ | 10.29 | | | $ | 8.93 | |
Total Return1 | | | 25.66 | % | | | 11.50 | % | | | 10.72 | % | | | 16.57 | % | | | 5.21 | % |
Ratio of net expenses to average net assets (with offsets/reductions) | | | 1.06 | %7 | | | 1.04 | % | | | 1.04 | %8 | | | 1.04 | % | | | 1.04 | % |
Ratio of expenses to average net assets (with offsets) | | | 1.06 | %7 | | | 1.04 | % | | | 1.04 | %8 | | | 1.04 | % | | | 1.04 | % |
Ratio of total expenses to average net assets (without offsets/reductions)2 | | | 1.10 | %7 | | | 1.15 | % | | | 1.13 | % | | | 1.15 | % | | | 1.29 | % |
Ratio of net investment income to average net assets1 | | | 1.37 | %7 | | | 1.84 | % | | | 0.83 | %8 | | | 0.98 | % | | | 1.35 | % |
Portfolio turnover | | | 91 | % | | | 132 | % | | | 138 | % | | | 117 | % | | | 151 | % |
Net assets at end of year (000’s omitted) | | $ | 23,103 | | | $ | 12,764 | | | $ | 12,966 | | | $ | 18,755 | | | $ | 18,588 | |
| | | | | | | | | | | | | | | | | | | | |
| |
| | | For the fiscal year ended October 31, | |
Institutional Class | | 2013 | | | 2012 | | | 2011 | | | 2010 | | | 2009 | |
Net Asset Value, Beginning of Year | | $ | 12.34 | | | $ | 11.38 | | | $ | 10.35 | | | $ | 8.99 | | | $ | 8.68 | |
Income from Investment Operations: | | | | | | | | | | | | | | | | | | | | |
Net investment income | | | 0.24 | 3,4 | | | 0.25 | 3 | | | 0.12 | 3 | | | 0.13 | | | | 0.14 | |
Net realized and unrealized gain on investments | | | 2.93 | 3 | | | 1.07 | 3 | | | 1.03 | 3 | | | 1.37 | | | | 0.32 | |
Total from investment operations | | | 3.17 | | | | 1.32 | | | | 1.15 | | | | 1.50 | | | | 0.46 | |
Less Distributions to Shareholders from: | | | | | | | | | | | | | | | | | | | | |
Net investment income | | | (0.24 | ) | | | (0.36 | ) | | | (0.12 | ) | | | (0.14 | ) | | | (0.15 | ) |
Net Asset Value, End of Year | | $ | 15.27 | | | $ | 12.34 | | | $ | 11.38 | | | $ | 10.35 | | | $ | 8.99 | |
Total Return1 | | | 26.00 | % | | | 11.78 | % | | | 11.12 | % | | | 16.75 | % | | | 5.56 | % |
Ratio of net expenses to average net assets (with offsets/reductions) | | | 0.81 | %7 | | | 0.79 | % | | | 0.79 | %8 | | | 0.79 | % | | | 0.79 | % |
Ratio of expenses to average net assets (with offsets) | | | 0.81 | %7 | | | 0.79 | % | | | 0.79 | %8 | | | 0.79 | % | | | 0.79 | % |
Ratio of total expenses to average net assets (without offsets/reductions)2 | | | 0.85 | %7 | | | 0.90 | % | | | 0.88 | % | | | 0.90 | % | | | 1.04 | % |
Ratio of net investment income to average net assets1 | | | 1.73 | %7 | | | 2.09 | % | | | 1.08 | %8 | | | 1.22 | % | | | 1.58 | % |
Portfolio turnover | | | 91 | % | | | 132 | % | | | 138 | % | | | 117 | % | | | 151 | % |
Net assets at end of year (000’s omitted) | | $ | 37,960 | | | $ | 34,231 | | | $ | 33,250 | | | $ | 32,309 | | | $ | 31,175 | |
| | | | | | | | | | | | | | | | | | | | |
38
Managers AMG FQ Global Alternatives Fund
Financial Highlights
For a share outstanding throughout each fiscal period
| | | | | | | | | | | | | | | | | | | | |
| | | For the fiscal year ended October 31, | |
Investor Class | | 2013 | | | 2012 | | | 2011 | | | 2010 | | | 2009 | |
Net Asset Value, Beginning of Year | | $ | 9.17 | | | $ | 9.30 | | | $ | 10.24 | | | $ | 9.96 | | | $ | 11.00 | |
Income (Loss) from Investment Operations: | | | | | | | | | | | | | | | | | | | | |
Net investment loss3 | | | (0.12 | ) | | | (0.12 | ) | | | (0.14 | ) | | | (0.14 | ) | | | (0.09 | ) |
Net realized and unrealized gain (loss) on investments3 | | | — | | | | (0.01 | ) | | | (0.80 | ) | | | 0.42 | | | | (0.27 | ) |
Total from investment operations | | | (0.12 | ) | | | (0.13 | ) | | | (0.94 | ) | | | 0.28 | | | | (0.36 | ) |
Less Distributions to Shareholders from: | | | | | | | | | | | | | | | | | | | | |
Net investment income | | | (0.15 | )11 | | | — | | | | — | | | | — | | | | (0.68 | )11 |
Net Asset Value, End of Year | | $ | 8.90 | | | $ | 9.17 | | | $ | 9.30 | | | $ | 10.24 | | | $ | 9.96 | |
Total Return1 | | | (1.28 | )%9 | | | (1.40 | )% | | | (9.18 | )%9 | | | 2.81 | %9 | | | (3.15 | )% |
Ratio of net expenses to average net assets (with offsets/reductions) | | | 1.90 | %10 | | | 1.92 | % | | | 1.92 | %12 | | | 1.91 | % | | | 2.00 | % |
Ratio of expenses to average net assets (with offsets) | | | 1.90 | %10 | | | 1.92 | % | | | 1.92 | %12 | | | 1.92 | % | | | 1.97 | % |
Ratio of total expenses to average net assets (without offsets/reductions)2 | | | 2.65 | %10 | | | 2.65 | % | | | 2.58 | % | | | 2.55 | % | | | 2.44 | % |
Ratio of net investment loss to average net assets1 | | | (1.37 | )%10 | | | (1.35 | )% | | | (1.47 | )%12 | | | (1.39 | )% | | | (0.88 | )% |
Portfolio turnover | | | — | | | | — | | | | 12 | % | | | 17 | % | | | 77 | % |
Net assets at end of year (000’s omitted) | | $ | 58,165 | | | $ | 237,013 | | | $ | 362,659 | | | $ | 518,118 | | | $ | 206,153 | |
| | | | | | | | | | | | | | | | | | | | |
| | | | | | | | | | | | | | | | |
| | | For the fiscal year ended October 31, | | | For the fiscal
period ended
October 31, 2010## | |
Service Class | | 2013 | | | 2012 | | | 2011 | | |
Net Asset Value, Beginning of Period | | $ | 9.25 | | | $ | 9.36 | | | $ | 10.27 | | | $ | 9.97 | |
Income from Investment Operations: | | | | | | | | | | | | | | | | |
Net investment loss3 | | | (0.09 | ) | | | (0.10 | ) | | | (0.11 | ) | | | (0.10 | ) |
Net realized and unrealized gain (loss) on investments3 | | | — | | | | (0.01 | ) | | | (0.80 | ) | | | 0.40 | |
Total from investment operations | | | (0.09 | ) | | | (0.11 | ) | | | (0.91 | ) | | | 0.30 | |
Less Distributions to Shareholders from: | | | | | | | | | | | | | | | | |
Net investment income | | | (0.23 | )11 | | | — | | | | — | | | | — | |
Net Asset Value, End of Period | | $ | 8.93 | | | $ | 9.25 | | | $ | 9.36 | | | $ | 10.27 | |
Total Return1 | | | (1.02 | )% | | | (1.18 | )% | | | (8.86 | )% | | | 3.01 | %14 |
Ratio of net expenses to average net assets (with offsets/reductions) | | | 1.60 | %10 | | | 1.62 | % | | | 1.63 | %12 | | | 1.70 | %15 |
Ratio of expenses to average net assets (with offsets) | | | 1.60 | %10 | | | 1.62 | % | | | 1.63 | %12 | | | 1.70 | %15 |
Ratio of total expenses to average net assets (without offsets/reductions)2 | | | 2.35 | %10 | | | 2.35 | % | | | 2.29 | % | | | 2.36 | %15 |
Ratio of net investment loss to average net assets1 | | | (1.03 | )%10 | | | (1.05 | )% | | | (1.18 | )%12 | | | (1.17 | )%15 |
Portfolio turnover | | | — | | | | — | | | | 12 | % | | | 17 | %14 |
Net assets at end of period (000’s omitted) | | $ | 39,060 | | | $ | 44,587 | | | $ | 43,870 | | | $ | 18,049 | |
| | | | | | | | | | | | | | | | |
39
Managers AMG FQ Global Alternatives Fund
Financial Highlights
For a share outstanding throughout each fiscal period
| | | | | | | | | | | | | | | | |
| | | For the fiscal year ended October 31, | | | For the fiscal
period ended
October 31, 2010## | |
Institutional Class | | 2013 | | | 2012 | | | 2011 | | |
Net Asset Value, Beginning of Period | | $ | 9.28 | | | $ | 9.38 | | | $ | 10.28 | | | $ | 9.97 | |
Income (Loss) from Investment Operations: | | | | | | | | | | | | | | | | |
Net investment loss3 | | | (0.08 | ) | | | (0.08 | ) | | | (0.10 | ) | | | (0.08 | ) |
Net realized and unrealized gain (loss) on investments3 | | | 0.01 | | | | (0.02 | ) | | | (0.80 | ) | | | 0.39 | |
Total from investment operations | | | (0.07 | ) | | | (0.10 | ) | | | (0.90 | ) | | | 0.31 | |
Less Distributions to Shareholders from: | | | | | | | | | | | | | | | | |
Net investment income | | | (0.25 | )11 | | | — | | | | — | | | | — | |
Net Asset Value, End of Period | | $ | 8.96 | | | $ | 9.28 | | | $ | 9.38 | | | $ | 10.28 | |
Total Return1 | | | (0.77 | )%9 | | | (1.07 | )% | | | (8.75 | )%9 | | | 3.11 | %9,14 |
Ratio of net expenses to average net assets (with offsets/reductions) | | | 1.45 | %10 | | | 1.47 | % | | | 1.48 | %12 | | | 1.48 | %15 |
Ratio of expenses to average net assets (with offsets) | | | 1.45 | %10 | | | 1.47 | % | | | 1.48 | %12 | | | 1.48 | %15 |
Ratio of total expenses to average net assets (without offsets/reductions)2 | | | 2.20 | %10 | | | 2.20 | % | | | 2.14 | % | | | 2.14 | %15 |
Ratio of net investment loss to average net assets1 | | | (0.89 | )%10 | | | (0.90 | )% | | | (1.03 | )%12 | | | (0.95 | )%15 |
Portfolio turnover | | | — | | | | — | | | | 12 | % | | | 17 | %14 |
Net assets at end of period (000’s omitted) | | $ | 21,613 | | | $ | 24,242 | | | $ | 31,045 | | | $ | 25,856 | |
| | | | | | | | | | | | | | | | |
40
Managers AMG FQ Global Essentials Fund
Financial Highlights
For a share outstanding throughout each fiscal period
| | | | | | | | | | | | | | | | |
| | | For the fiscal year ended October 31, | | | For the fiscal
period ended
October 31, 2010* | |
Investor Class | | 2013 | | | 2012 | | | 2011 | | |
Net Asset Value, Beginning of Period | | $ | 13.36 | | | $ | 12.80 | | | $ | 12.73 | | | $ | 11.36 | |
Income from Investment Operations: | | | | | | | | | | | | | | | | |
Net investment income (loss)3 | | | 0.03 | | | | (0.04 | ) | | | 0.01 | | | | (0.07 | ) |
Net realized and unrealized gain on investments3 | | | 0.13 | | | | 1.11 | | | | 0.62 | | | | 1.44 | |
Total from investment operations | | | 0.16 | | | | 1.07 | | | | 0.63 | | | | 1.37 | |
Less Distributions to Shareholders from: | | | | | | | | | | | | | | | | |
Net investment income | | | (0.38 | )11 | | | (0.51 | )11 | | | (0.56 | )11 | | | — | |
Net Asset Value, End of Period | | $ | 13.14 | | | $ | 13.36 | | | $ | 12.80 | | | $ | 12.73 | |
Total Return1 | | | 1.16 | % | | | 8.67 | %9 | | | 5.23 | %9 | | | 12.06 | %9,14 |
Ratio of net expenses to average net assets (with offsets/reductions) | | | 1.41 | %13 | | | 1.44 | % | | | 1.47 | % | | | 1.46 | %15 |
Ratio of expenses to average net assets (with offsets) | | | 1.41 | %13 | | | 1.44 | % | | | 1.47 | % | | | 1.46 | %15 |
Ratio of total expenses to average net assets (without offsets/reductions)2 | | | 1.55 | %13 | | | 1.50 | % | | | 1.49 | % | | | 1.54 | %15 |
Ratio of net investment income (loss) to average net assets1 | | | 0.25 | %13 | | | (0.32 | )% | | | 0.06 | % | | | (0.72 | )%15 |
Portfolio turnover | | | 36 | % | | | 43 | % | | | 80 | % | | | 127 | %14 |
Net assets at end of period (000’s omitted) | | $ | 5,520 | | | $ | 13,043 | | | $ | 7,824 | | | $ | 6,517 | |
| | | | | | | | | | | | | | | | |
| | |
| | | For the fiscal year ended October 31, | | | For the fiscal
period ended
October 31, 2010* | |
Service Class | | 2013 | | | 2012 | | | 2011 | | |
Net Asset Value, Beginning of Period | | $ | 13.44 | | | $ | 12.86 | | | $ | 12.77 | | | $ | 11.36 | |
Income from Investment Operations: | | | | | | | | | | | | | | | | |
Net investment income (loss)3 | | | 0.08 | | | | (0.02 | ) | | | 0.03 | | | | (0.04 | ) |
Net realized and unrealized gain on investments3 | | | 0.14 | | | | 1.15 | | | | 0.62 | | | | 1.45 | |
Total from investment operations | | | 0.22 | | | | 1.13 | | | | 0.65 | | | | 1.41 | |
Less Distributions to Shareholders from: | | | | | | | | | | | | | | | | |
Net investment income | | | (0.45 | )11 | | | (0.55 | )11 | | | (0.56 | )11 | | | — | |
Net Asset Value, End of Period | | $ | 13.21 | | | $ | 13.44 | | | $ | 12.86 | | | $ | 12.77 | |
Total Return1 | | | 1.61 | % | | | 9.11 | % | | | 5.44 | % | | | 12.41 | %14 |
Ratio of net expenses to average net assets (with offsets/reductions) | | | 0.99 | %13 | | | 0.99 | % | | | 1.15 | % | | | 1.17 | %15 |
Ratio of expenses to average net assets (with offsets) | | | 0.99 | %13 | | | 0.99 | % | | | 1.15 | % | | | 1.17 | %15 |
Ratio of total expenses to average net assets (without offsets/reductions)2 | | | 1.13 | %13 | | | 1.08 | % | | | 1.17 | % | | | 1.25 | %15 |
Ratio of net investment income (loss) to average net assets1 | | | 0.63 | %13 | | | (0.14 | )% | | | 0.24 | % | | | (0.43 | )%15 |
Portfolio turnover | | | 36 | % | | | 43 | % | | | 80 | % | | | 127 | %14 |
Net assets at end of period (000’s omitted) | | $ | 5,844 | | | $ | 11,738 | | | $ | 1,103 | | | $ | 217 | |
| | | | | | | | | | | | | | | | |
41
Managers AMG FQ Global Essentials Fund
Financial Highlights
For a share outstanding throughout each fiscal year
| | | | | | | | | | | | | | | | | | | | |
| | | For the fiscal year ended October 31, | |
| | | | | |
Institutional Class | | 2013 | | | 2012 | | | 2011 | | | 2010** | | | 2009 | |
Net Asset Value, Beginning of Year | | $ | 13.47 | | | $ | 12.88 | | | $ | 12.77 | | | $ | 11.16 | | | $ | 9.82 | |
Income from Investment Operations: | | | | | | | | | | | | | | | | | | | | |
Net investment income (loss)3 | | | 0.10 | | | | 0.03 | | | | 0.08 | | | | (0.01 | ) | | | 0.47 | |
Net realized and unrealized gain on investments3 | | | 0.12 | | | | 1.12 | | | | 0.61 | | | | 1.72 | | | | 1.35 | |
Total from investment operations | | | 0.22 | | | | 1.15 | | | | 0.69 | | | | 1.71 | | | | 1.82 | |
Less Distributions to Shareholders from: | | | | | | | | | | | | | | | | | | | | |
Net investment income | | | (0.46 | )11 | | | (0.56 | )11 | | | (0.58 | )11 | | | (0.10 | ) | | | (0.48 | ) |
Net Asset Value, End of Year | | $ | 13.23 | | | $ | 13.47 | | | $ | 12.88 | | | $ | 12.77 | | | $ | 11.16 | |
Total Return1 | | | 1.61 | % | | | 9.29 | % | | | 5.70 | %9 | | | 15.41 | %9,15 | | | 19.67 | % |
Ratio of net expenses to average net assets (with offsets/reductions) | | | 0.91 | %13 | | | 0.94 | % | | | 0.97 | % | | | 0.97 | % | | | 0.92 | % |
Ratio of expenses to average net assets (with offsets) | | | 0.91 | %13 | | | 0.94 | % | | | 0.97 | % | | | 0.97 | % | | | 0.94 | % |
Ratio of total expenses to average net assets (without offsets/reductions)2 | | | 1.05 | %13 | | | 1.00 | % | | | 0.99 | % | | | 1.05 | % | | | 1.17 | % |
Ratio of net investment income (loss) to average net assets1 | | | 0.75 | %13 | | | 0.20 | % | | | 0.64 | % | | | (0.09 | )% | | | 4.82 | % |
Portfolio turnover | | | 36 | % | | | 43 | % | | | 80 | % | | | 127 | % | | | 213 | % |
Net assets at end of year (000’s omitted) | | $ | 88,419 | | | $ | 99,173 | | | $ | 86,935 | | | $ | 93,903 | | | $ | 80,584 | |
| | | | | | | | | | | | | | | | | | | | |
42
Notes to Financial Highlights
The following footnotes should be read in conjunction with the Financial Highlights of the Funds previously presented in this report.
| | ## | Commenced operations on January 1, 2010. |
| | * | Investor Class and Service Class shares commenced operations on January 1, 2010. |
| | ** | Effective January 1, 2010, existing shares of Managers AMG FQ Global Essentials Fund were reclassified and redesignated as Institutional Class shares. |
| | 1 | Total returns and net investment income would have been lower had certain expenses not been offset. |
| | 2 | Excludes the impact of expense reimbursements or fee waivers and expense reductions such as brokerage credits, but includes non-reimbursable expenses, if any, such as interest and taxes. |
| | 3 | Per share numbers have been calculated using average shares. |
| | 4 | Includes non-recurring dividends. Without these dividends, net investment income per class would have been $0.00 and $0.05 for Managers AMG FQ Tax- Managed U.S. Equity Fund’s Investor Class and Institutional Class, respectively, and $0.16 and $0.21 for Managers AMG FQ U.S. Equity Fund’s Investor Class and Institutional Class, respectively. |
| | 5 | Includes non-routine extraordinary expenses amounting to 0.025% and 0.024% of average net assets for the Investor Class and Institutional Class, respectively. |
| | 6 | Includes non-recurring dividends. Without these dividends, net investment income per class would have been $0.01, and $0.05 for Managers AMG FQ Tax-Managed U.S. Equity Fund’s Investor Class and Institutional Class Shares, respectively. |
| | 7 | Includes non-routine extraordinary expenses amounting to 0.022% and 0.023% of average net assets for the Investor Class, and Institutional Class, respectively. |
| | 8 | Excludes tax expense for the fiscal year ended October 31, 2011, of $2,454 or 0.01%. |
| | 9 | The total return is based on the Financial Statement Net Asset Values as shown above. |
| | 10 | Includes non-routine extraordinary expenses amounting to 0.020%, 0.018% and 0.020% of average net assets for the Investor Class, Service Class and Institutional Class, respectively. |
| | 11 | The per share income distribution shown for the Institutional, Service, and Investor Class shares represents income derived primarily from foreign currency gains. (See Note 1d) of Notes to Financial Statements.) |
| | 12 | Includes interest expense for the fiscal year ended October 31, 2011, of $62,878 or 0.01%. |
| | 13 | Includes non-routine extraordinary expenses amounting to 0.026%, 0.023% and 0.026% of average net assets for the Investor Class, Service Class and Institutional Class, respectively. |
43
Notes to Financial Statements
October 31, 2013
| 1. | Summary of Significant Accounting Policies |
Managers Trust I (the “Trust”) is an open-end management investment company, organized as a Massachusetts business trust, and registered under the Investment Company Act of 1940, as amended (the “1940 Act”). Currently, the Trust consists of a number of different funds, each having distinct investment management objectives, strategies, risks, and policies. Included in this report are: Managers AMG FQ Tax-Managed U.S. Equity Fund (“Tax-Managed”), Managers AMG FQ U.S. Equity Fund (“U.S. Equity”), Managers AMG FQ Global Alternatives Fund (“Global Alternatives”) and Managers AMG FQ Global Essentials Fund (“Global Essentials”), each a “Fund” and collectively the “Funds.”
Effective December 1, 2012, Class A shares of the Tax-Managed, U.S. Equity and Global Alternatives Funds were renamed Investor Class shares. On November 30, 2012 at the close of business, all outstanding Class C shares of the Tax-Managed, U.S. Equity and Global Alternatives Funds were automatically converted to a number of full and/or fractional Investor Class shares equal in value to the shareholder Class C shares of each respective Fund.
Tax-Managed and U.S. Equity each offers two classes of shares: Investor Class and Institutional Class. Global Alternatives and Global Essentials each offers three classes of shares: Investor Class, Service Class and Institutional Class. Each class represents an interest in the same assets of the Fund and the classes are identical except for class specific expenses related to shareholder activity. Each class has equal voting privileges except that each class has exclusive voting rights with respect to its services and/or distribution plan. Please refer to a current prospectus for additional information on each share class.
The Funds’ financial statements are prepared in accordance with accounting principles generally accepted in the United States of America (“U.S. GAAP”), which require management to make estimates and assumptions that affect the reported amounts of assets and liabilities and disclosure of contingent assets and liabilities at the date of the financial statements and the reported amounts of income and expenses during the reporting period. Actual results could differ from those estimates and such differences could be material. The following is a summary of significant accounting policies followed by the Funds in the preparation of their financial statements:
| a. | Valuation of Investments |
Equity securities traded on a domestic or international securities exchange are valued at the last quoted sale price, or, lacking any sales, at the last quoted bid price. Over-the-counter securities are valued at the Nasdaq Official Closing Price, if one is available. Lacking any sales, over-the-counter securities are valued at the last quoted bid price. The Funds’ investments are generally valued based on market quotations provided by third-party pricing services approved by the Board of Trustees of the Funds (the “Board”).
Fixed-income securities are valued based on valuations furnished by independent pricing services that utilize matrix systems, which reflect such factors as security prices, yields, maturities, and ratings, and are supplemented by dealer and exchange quotations. Futures contracts for which market quotations are readily available are valued at the settlement price as of the close of the futures exchange. Short-term investments having a remaining maturity of 60
days or less are valued at amortized cost, which approximates market value. Investments in other open-end regulated investment companies are valued at their end of day net asset value per share except iShares or other ETF’s, which are valued the same as equity securities. Investments in certain mortgage-backed and stripped mortgage-backed securities, preferred stocks, convertible securities, derivatives and other debt securities not traded on an organized securities market are valued on the basis of valuations provided by dealers or by a pricing service which uses information with respect to transactions in such securities and various relationships between such securities and yield to maturity in determining value.
Under certain circumstances, the value of certain Fund investments (including derivatives) may be based on an evaluation of fair value, pursuant to procedures established by and under the general supervision of the Board. The Pricing Committee is the committee formed by the Board to make fair value determinations for such investments. When determining the fair value of an investment, the Pricing Committee seeks to determine the price that the Fund might reasonably expect to receive from a current sale of that investment in an arm’s-length transaction. Fair value determinations shall be based upon consideration of all available facts and information, including, but not limited to (i) attributes specific to the investment; (ii) fundamental analytical data and press releases relating to the investment and its issuer; (iii) the value of comparable securities or relevant financial instruments, including derivative securities, traded on other markets or among dealers; and (iv) other factors, such as future cash flows, interest rates, yield curves, volatilities, credit risks and/or default rates. The Board will be presented with a quarterly report comparing fair values determined by the Pricing Committee against subsequent market valuations for those securities. The values assigned to fair value investments are based on available information and do not necessarily represent amounts that might ultimately be realized, since such amounts depend on future developments inherent in long-term investments. Further, because of the inherent uncertainty of valuation, those estimated values may differ significantly from the values that would have been used had a ready market for the investments existed, and the differences could be material. Each Fund may use the fair value of a portfolio investment to calculate its Net Asset Value (“NAV”) when, for example, (1) market quotations are not readily available because a portfolio investment is not traded in a public market or the principal market in which the investment trades is closed, (2) trading in a portfolio investment is suspended and has not resumed before the Fund calculates its NAV, (3) a significant event affecting the value of a portfolio investment is determined to have occurred between the time of the market quotation provided for a portfolio investment and the time as of which the Fund calculates its NAV, (4) an investment’s price has remained unchanged over a period of time (often referred to as a “stale price”), or (5) Managers Investment Group LLC (the “Investment Manager”) determines that a market quotation is inaccurate. Portfolio investments that trade primarily on foreign markets are priced based upon the market quotation of such securities as of the close of their respective principal markets. Under certain circumstances, the Investment Manager may adjust such prices based on its determination of the impact of events occurring subsequent to the close of such markets but prior to the time as of which each Fund calculates its NAV. The Funds may invest in securities that may be thinly traded. The Board has
Notes to Financial Statements (continued)
adopted procedures to adjust prices of thinly traded securities that are judged to be stale so that they reflect fair value. An investment valued on the basis of its fair value may be valued at a price higher or lower than available market quotations. An investment valuation may differ depending on the method used and the factors considered in determining value according to the Funds’ fair value procedures.
U.S. GAAP defines fair value as the price that a Fund would receive to sell an asset or pay to transfer a liability in an orderly transaction between market participants at the measurement date. U.S. GAAP also establishes a framework for measuring fair value, and a three level hierarchy for fair value measurements based upon the transparency of inputs to the valuation of an asset or liability. Inputs may be observable or unobservable and refer broadly to the assumptions that market participants would use in pricing the asset or liability. Observable inputs reflect the assumptions market participants would use in pricing the asset or liability based on market data obtained from sources independent of the Funds. Unobservable inputs reflect the Funds’ own assumptions about the assumptions that market participants would use in pricing the asset or liability developed based on the best information available in the circumstances. Each investment is assigned a level based upon the observability of the inputs which are significant to the overall valuation.
The three-tier hierarchy of inputs is summarized below:
Level 1 – inputs are quoted prices in active markets for identical investments (e.g., equity securities, open-end investment companies, futures contracts, option contracts)
Level 2 – other observable inputs (including, but not limited to: quoted prices for similar assets or liabilities in markets that are active, quoted prices for identical or similar assets or liabilities in markets that are not active, inputs other than quoted prices that are observable for the assets or liabilities (such as interest rates, yield curves, volatilities, prepayment speeds, loss severities, credit risks and default rates) or other market corroborated inputs) (e.g., debt securities, government securities, foreign currency exchange contracts, foreign securities utilizing international fair value pricing, broker-quoted securities, fair valued securities with observable inputs)
Level 3 – inputs are significant unobservable inputs (including the Fund’s own assumptions used to determine the fair value of investments) (e.g., fair valued securities with unobservable inputs)
Changes in inputs or methodologies used for valuing investments may result in a transfer in or out of levels within the fair value hierarchy. The inputs or methodologies used for valuing investments are not necessarily an indication of the risk associated with investing in those investments.
Security transactions are accounted for as of trade date. Realized gains and losses on securities sold are determined on the basis of identified cost.
| c. | Investment Income and Expenses |
Dividend income is recorded on the ex-dividend date. Dividend and interest income on foreign securities is recorded net of any withholding tax. Interest income, which includes amortization of premium and accretion of discount on debt securities, is accrued as
earned. Non-cash dividends included in dividend income, if any, are reported at the fair market value of the securities received. Distributions received in excess of income from return of capital including real estate investment trusts (REITs) are recorded as a reduction of the cost of the related investment and/or as a realized gain. If the Fund no longer owns the applicable securities, any distributions received in excess of income are recorded as an adjustment to realized gain. Other income and expenses are recorded on an accrual basis. Expenses that cannot be directly attributed to a Fund are apportioned among the Funds in the Trust and in some cases other affiliated funds based upon their relative average net assets or number of shareholders. Investment income, realized and unrealized capital gains and losses, the common expenses of each Fund, and certain Fund level expense reductions, if any, are allocated on a pro-rata basis to each class based on the relative net assets of each class to the total net assets of each Fund.
The Funds have a “balance credit” agreement with The Bank of New York Mellon (“BNYM”), the Funds’ custodian, whereby each Fund is credited with an interest factor equal to 0.75% below the effective 90-day T-Bill rate for account balances left uninvested overnight. If the T-Bill rate falls below 0.75%, no credits will be earned. These credits serve to reduce custody expenses that would otherwise be charged to each Fund. For the fiscal year ended October 31, 2013, custodian expense was not reduced.
Overdraft fees are computed at 1% above the effective Federal Funds rate on the day of the overdraft. Prior to January 1, 2013, the rate was 2% above the effective Federal Funds rate. For the fiscal year ended October 31, 2013, overdraft fees for Tax-Managed and U.S. Equity equaled $11 and $42, respectively.
The Trust has filed a proxy statement with the SEC to approve a new Declaration of Trust for the Trust, among other proposals. The costs associated with this proxy are being treated as “extraordinary expenses,” and, therefore, are excluded from the expense limitation agreement described in Note 2.
| d. | Dividends and Distributions |
Dividends resulting from net investment income, if any, normally will be declared and paid quarterly for U.S. Equity and annually for Tax-Managed, Global Alternatives and Global Essentials. Distributions of capital gains, if any, will be made on an annual basis and when required for Federal excise tax purposes. Dividends and distributions to shareholders are recorded on the ex-dividend date. Income and capital gain distributions are determined in accordance with Federal income tax regulations, which may differ from U.S. GAAP. The most common differences are due to differing treatments for losses deferred due to wash sales, REITs, foreign currency, futures, and market discount transactions. Permanent book and tax basis differences, if any, relating to shareholder distributions will result in reclassifications to paid-in capital.
Notes to Financial Statements (continued)
The tax character of distributions paid during the fiscal years ended October 31, 2012 and October 31, 2013 were as follows:
| | | | | | | | | | | | | | | | | | | | | | | | | | | | | | | | |
| | | Tax-Managed | | | U.S. Equity | | | Global Alternatives | | | Global Essentials | |
| | | 2013 | | | 2012 | | | 2013 | | | 2012 | | | 2013 | | | 2012 | | | 2013 | | | 2012 | |
Distributions paid from: | | | | | | | | | | | | | | | | | | | | | | | | | | | | | | | | |
Ordinary income | | $ | 375,329 | | | $ | 35,481 | | | $ | 855,935 | | | $ | 1,357,101 | | | $ | 3,491,617 | | | $ | — | | | $ | 3,945,692 | | | $ | 4,289,658 | |
Short-term capital gains | | | — | | | | — | | | | — | | | | — | | | | — | | | | — | | | | — | | | | — | |
Long-term capital gains | | | — | | | | — | | | | — | | | | — | | | | — | | | | — | | | | — | | | | — | |
Return of capital | | | — | | | | — | | | | — | | | | — | | | | — | | | | — | | | | — | | | | — | |
| | | | | | | | | | | | | | | | | | | | | | | | | | | | | | | | |
Totals | | $ | 375,329 | | | $ | 35,481 | | | $ | 855,935 | | | $ | 1,357,101 | | | $ | 3,491,617 | | | $ | — | | | $ | 3,945,692 | | | $ | 4,289,658 | |
| | | | | | | | | | | | | | | | | | | | | | | | | | | | | | | | |
As of October 31, 2013, the components of distributable earnings (excluding unrealized appreciation/depreciation) on a tax basis consisted of:
| | | | | | | | | | | | | | | | |
| | | Tax-Managed | | | U.S. Equity | | | Global Alternatives | | | Global Essentials | |
Capital loss carryforward | | $ | 18,674,374 | | | $ | 8,041,718 | | | $ | 3,073,927 | | | $ | 15,051,266 | |
Undistributed ordinary income | | | 107,748 | | | | 6,571 | | | | 7,525,504 | | | | — | |
Undistributed short-term capital gains | | | — | | | | — | | | | — | | | | — | |
Undistributed long-term capital gains | | | — | | | | — | | | | — | | | | — | |
Each Fund intends to comply with the requirements under Subchapter M of the Internal Revenue Code of 1986, as amended, and to distribute substantially all of its taxable income and gains to its shareholders and to meet certain diversification and income requirements with respect to investment companies. Therefore, no provision for Federal income or excise tax is included in the accompanying financial statements.
Additionally, based on each Fund’s understanding of the tax rules and rates related to income, gains and transactions for the foreign jurisdictions in which it invests, each Fund will provide for foreign taxes, and where appropriate, deferred foreign taxes.
Management has analyzed the Funds’ tax positions taken on Federal income tax returns as of October 31, 2013, and for all open tax years, and has concluded that no provision for federal income tax is required in the Funds’ financial statements. Additionally, the Funds are not aware of any tax position for which it is reasonably possible that the total amounts of unrecognized tax benefits will change materially in the next twelve months.
Under the Regulated Investment Company Modernization Act of 2010, post-enactment capital losses may be carried forward for an unlimited time period. However, any new losses incurred will be required to be utilized prior to any loss carryovers incurred in pre-enactment taxable years, which generally expire eight years following the close of the taxable year in which they were incurred. As a result of this ordering rule, pre-enactment capital loss carryovers may be more likely to expire unused. Additionally, post-enactment capital losses that are carried forward retain their tax character as either short-term or long-term capital losses rather than being considered all short-term as under previous law.
| f. | Capital Loss Carryovers and Deferrals |
As of October 31, 2013, the following Funds had accumulated net realized capital loss carryovers from securities transactions for Federal income tax purposes as shown in the following chart. These amounts may be used to offset future realized capital gains, if any, through the expiration dates listed or in the case of post-enactment losses, for an unlimited time period.
| | | | | | | | | | | | |
| | | Capital Loss
Carryover Amounts | | | Expires
October 31, | |
Fund | | Short-Term | | | Long-Term | | |
Tax-Managed | | | | | | | | | | | | |
(Pre-Enactment) | | $ | 18,674,374 | | | | — | | | | 2017 | |
| | | | | | | | | | | | |
U.S. Equity | | | | | | | | | | | | |
(Pre-Enactment) | | $ | 8,041,718 | | | | — | | | | 2017 | |
| | | | | | | | | | | | |
Global Alternatives | | | | | | | | | | | | |
(Post-Enactment) | | $ | 3,073,927 | | | | — | | | | Unlimited | |
| | | | | | | | | | | | |
Global Essentials | | | | | | | | | | | | |
(Pre-Enactment) | | $ | 15,051,266 | | | | — | | | | 2017 | |
| | | | | | | | | | | | |
Notes to Financial Statements (continued)
For the fiscal year ended October 31, 2013, the following Funds utilized capital loss carryovers in the amount of:
| | | | | | | | |
| | | Capital Loss
Short-Term | | | Carryover Utilized
Long-Term | |
Tax-Managed | | $ | 5,319,200 | | | | — | |
U.S. Equity | | | 5,123,118 | | | | — | |
Global Alternatives | | | — | | | | — | |
Global Essentials | | | 5,611,727 | | | | — | |
The Trust’s Declaration of Trust authorizes for each series the issuance of an unlimited number of shares of beneficial interest, without par value. Each Fund records sales and repurchases of its capital stock on the trade date. The cost of securities contributed to the Funds in connection with the issuance of shares is based on the valuation of those securities in accordance with the Funds’ policy on investment valuation.
For the fiscal years ended October 31, 2012 and October 31, 2013, the capital stock transactions by class for Tax-Managed, U.S. Equity, Global Alternative and Global Essentials were as follows:
| | | | | | | | | | | | | | | | | | | | | | | | | | | | | | | | |
| | | Tax-Managed | | | U.S. Equity | |
| | | October 31, 2013 | | | October 31, 2012 | | | October 31, 2013 | | | October 31, 2012 | |
| | | Shares | | | Amount | | | Shares | | | Amount | | | Shares | | | Amount | | | Shares | | | Amount | |
Investor Class: | | | | | | | | | | | | | | | | | | | | | | | | | | | | | | | | |
Proceeds from sale of shares† | | | 205,826 | | | $ | 3,228,327 | | | | 21,148 | | | $ | 310,469 | | | | 705,035 | | | $ | 9,826,464 | | | | 190,613 | | | $ | 2,282,623 | |
Reinvestment of distributions | | | 2,390 | | | | 36,540 | | | | — | | | | — | | | | 15,831 | | | | 214,473 | | | | 26,473 | | | | 313,035 | |
Cost of shares repurchased | | | (89,202 | ) | | | (1,494,904 | ) | | | (48,036 | ) | | | (704,809 | ) | | | (242,438 | ) | | | (3,364,257 | ) | | | (325,419 | ) | | | (3,868,906 | ) |
| | | | | | | | | | | | | | | | | | | | | | | | | | | | | | | | |
Net increase (decrease) | | | 119,014 | 1 | | $ | 1,769,963 | 1 | | | (26,888 | ) | | $ | (394,340 | ) | | | 478,428 | 1 | | $ | 6,676,680 | 1 | | | (108,333 | ) | | $ | (1,273,248 | ) |
| | | | | | | | | | | | | | | | | | | | | | | | | | | | | | | | |
Class C: | | | | | | | | | | | | | | | | | | | | | | | | | | | | | | | | |
Proceeds from sale of shares | | | 46 | | | $ | 680 | | | | 13,176 | | | $ | 190,299 | | | | 61 | | | $ | 731 | | | | 3,243 | | | $ | 38,876 | |
Reinvestment of distributions | | | — | | | | — | | | | — | | | | — | | | | — | | | | — | | | | 393 | | | | 4,710 | |
Cost of shares repurchased | | | (190,519 | ) | | | (2,841,267 | ) | | | (34,820 | ) | | | (501,589 | ) | | | (44,041 | ) | | | (545,096 | ) | | | (6,088 | ) | | | (70,627 | ) |
| | | | | | | | | | | | | | | | | | | | | | | | | | | | | | | | |
Net decrease | | | (190,473 | )2 | | $ | (2,840,587 | )2 | | | (21,644 | ) | | $ | (311,290 | ) | | | (43,980 | )2 | | $ | (544,365 | )2 | | | (2,452 | ) | | $ | (27,041 | ) |
| | | | | | | | | | | | | | | | | | | | | | | | | | | | | | | | |
Institutional Class: | | | | | | | | | | | | | | | | | | | | | | | | | | | | | | | | |
Proceeds from sale of shares | | | 235,286 | | | $ | 4,059,672 | | | | 137,624 | | | $ | 2,045,870 | | | | 105,723 | | | $ | 1,479,746 | | | | 184,680 | | | $ | 2,275,545 | |
Reinvestment of distributions | | | 20,620 | | | | 314,047 | | | | 2,456 | | | | 33,691 | | | | 46,517 | | | | 623,273 | | | | 85,355 | | | | 1,013,708 | |
Cost of shares repurchased | | | (500,175 | ) | | | (8,399,601 | ) | | | (367,488 | ) | | | (5,371,737 | ) | | | (440,096 | ) | | | (6,054,716 | ) | | | (416,697 | ) | | | (5,033,351 | ) |
| | | | | | | | | | | | | | | | | | | | | | | | | | | | | | | | |
Net decrease | | | (244,269 | ) | | $ | (4,025,882 | ) | | | (227,408 | ) | | $ | (3,292,176 | ) | | | (287,856 | ) | | $ | (3,951,697 | ) | | | (146,662 | ) | | $ | (1,744,098 | ) |
| | | | | | | | | | | | | | | | | | | | | | | | | | | | | | | | |
| † | For the fiscal year ended October 31, 2013, 183,714 shares and $2,840,671 are included due to the conversion of Class C shares into Investor Class shares for Tax-Managed and 43,914 shares and $544,417 are included due to the conversion of Class C shares into Investor Class shares for U.S. Equity. |
| 1 | Effective December 1, 2012, all Class A shares were renamed Investor Class shares. |
| 2 | Effective December 1, 2012, all Class C shares converted to Investor Class shares. |
47
Notes to Financial Statements (continued)
| | | | | | | | | | | | | | | | |
| | | Global Alternatives | |
| | | October 31, 2013 | | | October 31, 2012 | |
| | | Shares | | | Amount | | | Shares | | | Amount | |
Investor Class: | | | | | | | | | | | | | | | | |
Proceeds from sale of shares† | | | 4,690,722 | | | $ | 42,644,278 | | | | 10,131,589 | | | $ | 92,330,176 | |
Reinvestment of distributions | | | 179,330 | | | | 1,617,558 | | | | — | | | | — | |
Cost of shares repurchased | | | (24,188,615 | ) | | | (218,773,799 | ) | | | (23,267,270 | ) | | | (212,509,753 | ) |
| | | | | | | | | | | | | | | | |
Net decrease | | | (19,318,563 | )1 | | $ | (174,511,963 | )1 | | | (13,135,681 | ) | | $ | (120,179,577 | ) |
| | | | | | | | | | | | | | | | |
Class C: | | | | | | | | | | | | | | | | |
Proceeds from sale of shares | | | 485 | | | $ | 4,241 | | | | 129,396 | | | $ | 1,140,044 | |
Reinvestment of distributions | | | — | | | | — | | | | — | | | | — | |
Cost of shares repurchased | | | (1,768,034 | ) | | | (15,520,802 | ) | | | (1,423,883 | ) | | | (12,575,682 | ) |
| | | | | | | | | | | | | | | | |
Net decrease | | | (1,767,549 | )2 | | $ | (15,516,561 | )2 | | | (1,294,487 | ) | | $ | (11,435,638 | ) |
| | | | | | | | | | | | | | | | |
Service Class: | | | | | | | | | | | | | | | | |
Proceeds from sale of shares | | | 2,680,416 | | | $ | 24,037,223 | | | | 2,639,431 | | | $ | 24,252,794 | |
Reinvestment of distributions | | | 101,432 | | | | 915,925 | | | | — | | | | ��� | |
Cost of shares repurchased | | | (3,229,606 | ) | | | (29,276,547 | ) | | | (2,507,087 | ) | | | (23,024,132 | ) |
| | | | | | | | | | | | | | | | |
Net increase (decrease) | | | (447,758 | ) | | $ | (4,323,399 | ) | | | 132,344 | | | $ | 1,228,662 | |
| | | | | | | | | | | | | | | | |
Institutional Class: | | | | | | | | | | | | | | | | |
Proceeds from sale of shares | | | 1,772,695 | | | $ | 15,972,797 | | | | 1,161,768 | | | $ | 10,685,136 | |
Reinvestment of distributions | | | 62,451 | | | | 564,557 | | | | — | | | | — | |
Cost of shares repurchased | | | (2,033,565 | ) | | | (18,315,909 | ) | | | (1,861,276 | ) | | | (17,159,089 | ) |
| | | | | | | | | | | | | | | | |
Net decrease | | | (198,419 | ) | | $ | (1,778,555 | ) | | | (699,508 | ) | | $ | (6,473,953 | ) |
| | | | | | | | | | | | | | | | |
| † | For the fiscal year ended October 31, 2013, 1,610,344 shares and $14,666,848 are included due to the conversion of Class C shares into Investor Class shares. |
| 1 | Effective December 1, 2012, all Class A shares were renamed Investor Class shares. |
| 2 | Effective December 1, 2012, all Class C shares converted to Investor Class shares. |
| | | | | | | | | | | | | | | | |
| | | Global Essentials | |
| | | October 31, 2013 | | | October 31, 2012 | |
| | | Shares | | | Amount | | | Shares | | | Amount | |
Investor Class: | | | | | | | | | | | | | | | | |
Proceeds from sale of shares | | | 135,790 | | | $ | 1,816,759 | | | | 868,385 | | | $ | 11,244,318 | |
Reinvestment of distributions | | | 26,780 | | | | 352,700 | | | | 33,898 | | | | 422,712 | |
Cost of shares repurchased | | | (718,516 | ) | | | (9,297,354 | ) | | | (537,581 | ) | | | (7,033,497 | ) |
| | | | | | | | | | | | | | | | |
Net increase (decrease) | | | (555,946 | ) | | $ | (7,127,895 | ) | | | 364,702 | | | $ | 4,633,533 | |
| | | | | | | | | | | | | | | | |
Service Class: | | | | | | | | | | | | | | | | |
Proceeds from sale of shares | | | 485,265 | | | $ | 6,476,211 | | | | 837,694 | | | $ | 11,034,532 | |
Reinvestment of distributions | | | 30,275 | | | | 399,327 | | | | 4,611 | | | | 57,632 | |
Cost of shares repurchased | | | (946,436 | ) | | | (12,572,020 | ) | | | (54,718 | ) | | | (716,094 | ) |
| | | | | | | | | | | | | | | | |
Net increase (decrease) | | | (430,896 | ) | | $ | (5,696,482 | ) | | | 787,587 | | | $ | 10,376,070 | |
| | | | | | | | | | | | | | | | |
Institutional Class: | | | | | | | | | | | | | | | | |
Proceeds from sale of shares | | | 788,526 | | | $ | 10,408,006 | | | | 1,622,529 | | | $ | 21,209,227 | |
Reinvestment of distributions | | | 235,952 | | | | 3,116,920 | | | | 298,927 | | | | 3,739,575 | |
Cost of shares repurchased | | | (1,705,440 | ) | | | (22,487,039 | ) | | | (1,306,146 | ) | | | (17,165,932 | ) |
| | | | | | | | | | | | | | | | |
Net increase (decrease) | | | (680,962 | ) | | $ | (8,962,113 | ) | | | 615,310 | | | $ | 7,782,870 | |
| | | | | | | | | | | | | | | | |
At October 31, 2013, certain unaffiliated shareholders of record, specifically omnibus accounts, individually or collectively held greater than 10% of the outstanding shares of the following Funds: Tax-Managed - two collectively own 23%; Global Alternatives - eight collectively own 57% and Global Essentials - four collectively own 10%. U.S. Equity had no unaffiliated shareholders that owned greater than 10%. Transactions by these shareholders may have a material impact on the respective Funds.
48
Notes to Financial Statements (continued)
The Funds may enter into repurchase agreements provided that the value of the underlying collateral, including accrued interest, will equal or exceed the value of the repurchase agreement during the term of the agreement. The underlying collateral for all repurchase agreements is held in safekeeping by the Fund’s custodian or at the Federal Reserve Bank. If the seller defaults and the value of the collateral declines, or if bankruptcy proceedings commence with respect to the seller of the security, realization of the collateral by the Fund may be delayed or limited. At October 31, 2013, the market value of repurchase agreements outstanding for Tax-Managed, U.S. Equity and Global Essentials was $642,542, $1,522,691 and $2,048,442, respectively.
| i. | Foreign Currency Translation |
The books and records of the Funds are maintained in U.S. dollars. The value of investments, assets and liabilities denominated in currencies other than U.S. dollars are translated into U.S. dollars based upon current foreign exchange rates. Purchases and sales of foreign investments, income and expenses are converted into U.S. dollars based on currency exchange rates prevailing on the respective dates of such transactions. Net realized and unrealized gain (loss) on foreign currency transactions represent: (1) foreign exchange gains and losses from the sale and holdings of foreign currencies; (2) gains and losses between trade date and settlement date on investment securities transactions and forward foreign currency exchange contracts; and (3) gains and losses from the difference between amounts of interest and dividends recorded and the amounts actually received.
The Funds do not isolate the net realized and unrealized gain or loss resulting from changes in exchange rates from the fluctuations in market prices of securities held. Such fluctuations are included with the net realized and unrealized gain or loss on investments.
Certain Funds invest in securities of foreign entities and in instruments denominated in foreign currencies which involve risks not typically associated with investments in domestic securities. Non-domestic securities carry special risks, such as exposure to currency fluctuations, less developed or less efficient trading markets, political instability, a lack of company information, differing auditing and legal standards, and, potentially, less liquidity.
Realized gains in certain countries may be subject to foreign taxes at the Fund level, at rates ranging from approximately 10% to 15%. The Funds would pay such foreign taxes at the appropriate rate for each jurisdiction.
| 2. | Agreements and Transactions with Affiliates |
For each of the Funds, the Trust has entered into an Investment Management Agreement under which the Investment Manager, a subsidiary of Affiliated Managers Group, Inc. (“AMG”), serves as investment manager to the Funds and is responsible for the Funds’ overall administration and operations. The Investment Manager selects subadvisors for the Funds (subject to Board approval) and monitors each subadvisor’s investment performance, security holdings and investment strategies. Each Fund’s investment portfolios are managed by First Quadrant, L.P. (“First Quadrant”),
who serves pursuant to a subadvisory agreement with the Investment Manager. AMG indirectly owns a majority interest in First Quadrant.
Tax-Managed is obligated by the Investment Management Agreement to pay a management fee to the Investment Manager at the annual rate of 0.85% of the average daily net assets of the Fund. Under the Investment Management Agreement with the Tax-Managed Fund, the Investment Manager provides a variety of administrative services to the Fund. The Investment Manager receives no additional compensation from the Fund for these services. Pursuant to a reimbursement agreement between the Investment Manager and First Quadrant, First Quadrant reimburses the Investment Manager for the costs the Investment Manager bears in providing such services to the Fund.
U.S. Equity, Global Alternatives and Global Essentials are obligated by the Investment Management Agreement to pay a management fee to the Investment Manager based on the average daily net assets. The Investment Manager, in turn, pays a portion of this fee to First Quadrant for its services as subadvisor. For the fiscal year ended October 31, 2013, the annual investment management fee rates, as a percentage of average daily net assets, were as follows:
| | | | |
U.S. Equity | | | 0.35 | % |
Global Alternatives | | | 1.70 | % |
Global Essentials | | | 0.60 | % |
The Investment Manager has agreed to waive a portion of its management fee in consideration of shareholder servicing fees that it has received from JPMorgan Distribution Services, Inc., with respect to short-term cash investments each Fund may have made in the JPMorgan Liquid Assets Money Market Fund, Capital Shares. For the fiscal year ended October 31, 2013, the management fee for Global Alternatives and Global Essentials was reduced by $26,624 or 0.02% and $13,474 or 0.01%, respectively.
The Investment Manager has contractually agreed, through March 1, 2014, to waive management fees and pay/or reimburse Fund expenses in order to limit total annual Fund operating expenses after fee waiver and expense reimbursements (exclusive of taxes, interest (including interest incurred in connection with bank and custody overdrafts), shareholder servicing fees, distribution and service (12b-1) fees, brokerage commissions, and other transaction costs, acquired fund fees and expenses and extraordinary expenses) of Tax-Managed and U.S. Equity to 0.99% and 0.79%, respectively, of each Fund’s average daily net assets.
Effective July 1, 2013, Managers Investment Group LLC has contractually agreed through March 1, 2015, to waive management fees and/or reimburse Fund expenses in order to limit the Global Alternatives Fund’s total annual operating expenses after fee waiver and expense reimbursements (exclusive of taxes, interest (including interest incurred in connection with bank and custody overdrafts), shareholder servicing fees, distribution and service (12b-1) fees, brokerage commissions and other transaction costs, acquired fund fees and expenses, and extraordinary expenses) to 1.44% of average daily net assets. Immediately prior to July 1, 2013, the Fund had a contractual expense limitation of 1.49%. For the period November 1, 2012 through June 30, 2013, the Investment Manger voluntarily agreed to retroactively waive additional expenses to limit the Fund’s
Notes to Financial Statements (continued)
total operating expenses to 1.44% of average daily net assets. For the fiscal year ended October 31, 2013, the amount waived is $54,363.
Effective July 1, 2012, Managers Investment Group LLC has contractually agreed through March 1, 2014, to limit the Global Essentials Fund’s total annual operating expenses (exclusive of taxes, interest (including interest incurred in connection with bank and custody overdrafts), shareholder servicing fees, distribution and service (12b-1) fees, brokerage commissions and other transaction costs, acquired fund fees and expenses, and extraordinary expenses) to 0.89% of average daily net assets. Immediately prior to July 1, 2012, the Fund had contractual expense limitation of 0.99%.
Each Fund is obligated to repay the Investment Manager such amounts waived, paid or reimbursed in future years provided that the repayment occurs within thirty-six (36) months after the waiver or reimbursement and that such repayment would not cause the Fund’s total operating expenses in any such future year to exceed that Fund’s respective expense cap. For the fiscal year ended October 31, 2013, each Fund’s components of reimbursement available are detailed in the following chart:
| | | | | | | | | | | | | | | | |
| | | Tax-Managed | | | U.S. Equity | | | Global
Alternatives | | | Global
Essentials | |
Reimbursement Available - 10/31/12 | | $ | 212,998 | | | $ | 153,702 | | | $ | 8,918,120 | | | $ | 123,089 | |
Additional Reimbursements | | | 40,130 | | | | 17,474 | | | | 1,047,432 | | | | 144,328 | |
Expired Reimbursements | | | (96,502 | ) | | | (57,861 | ) | | | (2,371,339 | ) | | | (48,809 | ) |
| | | | | | | | | | | | | | | | |
Reimbursement Available - 10/31/13 | | $ | 156,626 | | | $ | 113,315 | | | $ | 7,594,213 | | | $ | 218,608 | |
| | | | | | | | | | | | | | | | |
The aggregate annual retainer paid to each Independent Trustee of the Board is $105,000, plus $6,000 or $2,500 for each regular or special meeting attended, respectively. The Independent Chairman of the Trusts receives an additional payment of $25,000 per year. The Chairman of the Audit Committee receives an additional payment of $10,000 per year. The Trustees’ fees and expenses are allocated among all of the Funds for which the Investment Manager serves as the advisor (the “Managers Funds”) based on the relative net assets of such Funds. The “Trustees fees and expenses” shown in the financial statements represents each Fund’s allocated portion of the total fees and expenses paid by the Managers Funds.
Prior to January 1, 2013, the aggregate annual retainer paid to each Independent Trustee of the Board was $80,000, plus $5,000 or $2,500 for each regular or special meeting attended, respectively. The Independent Chairman of the Trust formerly received an additional payment of $20,000 per year. The Chairman of the Audit Committee formerly received an additional payment of $8,000 per year.
The Funds are distributed by Managers Distributors, Inc. (the “Distributor” or “MDI”), a wholly-owned subsidiary of the Investment Manager. MDI serves as the distributor and underwriter for each Fund and is a registered broker-dealer and member of the Financial Industry Regulatory Authority, Inc. (“FINRA”). Shares of each Fund will be continuously offered and will be sold directly to prospective purchasers through brokers, dealers or other financial
intermediaries who have executed selling agreements with MDI. Subject to the compensation arrangement discussed below, generally MDI bears all or a portion of the expenses of providing services pursuant to the distribution agreement, including the payment of the expenses relating to the distribution of prospectuses for sales purposes and any advertising or sales literature. Certain Trustees and Officers of the Funds are Officers and/or Directors of the Investment Manager, AMG and/or the Distributor.
The Trust has adopted a distribution and service plan (the “Plan”) with respect to the Investor Class shares and through November 30, 2012 Class C shares, in accordance with the requirements of Rule 12b-1 under the 1940 Act and the requirements of the applicable rules of FINRA regarding asset-based sales charges. Pursuant to the Plan, each Fund may make payments to the Distributor for its expenditures in financing any activity primarily intended to result in the sale of each such class of the Fund’s shares and for maintenance and personal service provided to existing shareholders of that class. The Plan authorizes payments to the Distributor up to 0.25% annually of each Fund’s average daily net assets attributable to the Investor Class shares and 1.00% annually through November 30, 2012 for Class C shares.
For each of the Investor and Service Classes, the Board has approved reimbursement payments to the Investment Manager for shareholder servicing expenses incurred (“shareholder servicing fees.”) Shareholder servicing fees include payments to third parties such as a bank, broker-dealer, trust company or other financial intermediaries who provide shareholder recordkeeping and account servicing services. The Investor and Service Class shares may reimburse the Investment Manager for the actual amount incurred up to a maximum annual rate of each Class’s average daily net assets as shown in the table below.
The impact on the annualized expense ratios for the fiscal year ended October 31, 2013 was as follows:
| | | | | | | | |
Fund | | Maximum
Amount
Allowed | | | Actual
Amount
Incurred | |
Tax-Managed | | | | | | | | |
Investor Class | | | n/a | | | | n/a | |
U.S. Equity | | | | | | | | |
Investor Class | | | n/a | | | | n/a | |
Global Alternatives | | | | | | | | |
Investor Class | | | 0.20 | % | | | 0.20 | % |
Service Class | | | 0.25 | % | | | 0.15 | % |
Global Essentials | | | | | | | | |
Investor Class | | | 0.25 | % | | | 0.25 | % |
Service Class | | | 0.25 | % | | | 0.08 | % |
The Securities and Exchange Commission granted an exemptive order that permits the Funds to lend and borrow money for certain temporary purposes directly to and from other eligible Managers Funds. Participation in this interfund lending program is voluntary for both borrowing and lending funds, and an interfund loan is only made if it benefits each participating fund. The Investment Manager administers the program according to procedures approved by the
Notes to Financial Statements (continued)
Board, and the Board monitors the operation of the program. An interfund loan must comply with certain conditions set out in the exemptive order, which are designed to assure fairness and protect all participating funds. For the fiscal year ended October 31, 2013, the following Funds either borrowed from or lent to other Managers Funds: Global Alternatives lent varying amounts not exceeding $3,949,713 for five days earning interest of $1,092 and Global Essentials lent $1,475,333 for two days earning interest of $89. The interest amount is included in the Statement of Operations as interest income. At October 31, 2013, the Funds had no loans outstanding.
| 3. | Purchases and Sales of Securities |
Purchases and sales of securities (excluding short-term securities) for the fiscal year ended October 31, 2013, were as follows:
| | | | | | | | | | | | | | | | |
| | | Long-Term
Securities | | | U.S. Government
Obligations | |
Fund | | Purchases | | | Sales | | | Purchases | | | Sales | |
Tax-Managed | | $ | 21,852,181 | | | $ | 27,595,059 | | | | — | | | | — | |
U.S. Equity | | | 49,290,978 | | | | 47,536,642 | | | | — | | | | — | |
Global Alternatives | | | — | | | | 51,993,264 | | | $ | 116,646,670 | | | $ | 116,690,000 | |
Global Essentials | | | 32,551,404 | | | | 24,611,617 | | | | 17,991,319 | | | | 18,000,000 | |
| 4. | Portfolio Securities Loaned |
The Funds participate in a securities lending program offered by BNYM (the “Program”), providing for the lending of securities to qualified brokers. Securities lending income includes earnings of such temporary cash investments, plus or minus any rebate to a borrower. These earnings (after any rebate) are then divided between BNYM, as a fee for its services under the program, and the Funds, according to agreed-upon rates. Collateral on all securities loaned is accepted in cash and is maintained at a minimum level of 102% (105% in the case of certain foreign securities) of the market value, plus interest, if applicable, of investments on loan. It is the Funds’ policy to obtain additional collateral from or return excess collateral to the borrower by the end of the next business day, following the valuation date of the securities loaned. Therefore, the value of the collateral held may be temporarily less than the value of the securities on loan. Lending securities entails a risk of loss to the Funds if and to the extent that the market value of the securities
loaned were to increase and the borrower did not increase the collateral accordingly, and the borrower fails to return the securities. Under the terms of the Program, the Funds are indemnified for such losses by BNYM. Cash collateral is held in a separate account managed by BNYM, who is authorized to exclusively enter into overnight government repurchase agreements. BNYM bears the risk of any deficiency in the amount of the cash collateral available for return to the borrower due to any loss on the collateral invested.
| 5. | Commitments and Contingencies |
In the normal course of business, the Funds may enter into contracts and agreements that contain a variety of representations and warranties, which provide general indemnifications. The maximum exposure to the Funds under these arrangements is unknown, as this would involve future claims that may be made against a Fund that have not yet occurred. However, based on experience the Funds had no prior claims or losses and expect the risks of loss to be remote.
Certain transactions, such as futures and forward transactions, dollar roll agreements, or purchases of when-issued or delayed delivery securities may have a similar effect on the Fund’s net asset value as if the Fund had created a degree of leverage in its portfolio. However, if a Fund enters into such a transaction, the Fund will establish a segregated account with its custodian in which it will maintain cash, U.S. government securities or other liquid securities equal in value to its obligations in respect to such transaction. Securities and other assets held in the segregated account may not be sold while the transaction is outstanding, unless other suitable assets are substituted.
The following disclosures contain information on how and why the Funds use derivative instruments, the credit risk and how derivative instruments affect the Fund’s financial position, results of operations and cash flows. The location and fair value amounts of these instruments on the Statement of Assets and Liabilities and the realized and changes in unrealized gains and losses on the Statement of Operations, each categorized by type of derivative contract, are included in a table in the Notes to the Schedules of Portfolio Investments. For the fiscal year ended October 31, 2013, the average quarterly balances of outstanding derivative financial instruments were as follows:
| | | | | | | | | | | | |
| | | U.S.
Equity | | | Global
Alternatives | | | Global
Essentials | |
Financial futures contracts: | | | | | | | | | | | | |
Average number of contracts purchased | | | 2 | | | | 1,517 | | | | 1,227 | |
Average number of contracts sold | | | — | | | | 2,323 | | | | — | |
Average notional value of contracts purchased | | $ | 158,476 | | | $ | 221,526,284 | | | $ | 144,270,629 | |
Average notional value of contracts sold | | | — | | | $ | 258,064,839 | | | | — | |
Foreign currency exchange contracts: | | | | | | | | | | | | |
Average US dollar amounts purchased/sold | | | — | | | $ | 723,733,956 | | | | — | |
Options: | | | | | | | | | | | | |
Average notional value of option contracts purchased | | $ | 97,638 | | | | — | | | $ | 42,418 | |
Average notional value of option contracts written | | $ | 276,442 | | | | — | | | $ | 166,553 | |
Notes to Financial Statements (continued)
| 8. | Forward Foreign Currency Contracts |
During the fiscal year ended October 31, 2013, Global Alternatives invested in forward foreign currency contracts to facilitate transactions in foreign securities and to hedge against foreign currency exchange rate risk on its non-U.S. dollar denominated investment securities.
A forward foreign currency contract is an agreement between a fund and another party to buy or sell a currency at a set price at a future date. The market value of the contract will fluctuate with changes in currency exchange rates. The contract is marked-to-market daily, and the change in market value is recorded as an unrealized gain or loss. Gain or loss on the purchase or sale of contracts having the same settlement date, amount and counterparty is realized on the date of offset, otherwise gain or loss is realized on the settlement date. Risks may arise upon entering into these contracts from the potential inability of counterparties to meet the terms of their contracts and from unanticipated movements in the value of a foreign currency relative to the U.S. dollar.
U.S. Equity entered into equity index futures contracts with the objective of maintaining exposure to equity stock markets while maintaining liquidity. Global Essentials and Global Alternatives entered into futures contracts, including futures contracts on global equity and fixed-income securiries, interest rate futures contracts, foreign currency futures contracts and futures contracts on security indices (including broad-based security indices). The Funds purchased and sold futures contracts to achieve a desired level of investment, whether to accommodate portfolio turnover or cash flows from capital shares transactions. There are certain risks associated with futures contracts. Prices may not move as expected or the Fund may not be able to close out the contract when it desires to do so, resulting in losses.
On entering into a futures contract, either cash or securities in an amount equal to a certain percentage of the contract value (initial margin) must be deposited with the futures broker. Subsequent payments (variation margin) are made or received each day. The variation margin payments equal the daily changes in the contract value and are recorded as unrealized gains or losses. For OTC futures, daily valuation margin is not required. The Funds recognize a realized gain or loss when the contract is closed or expires equal to the difference between the value of the contract at the time it was opened and the value at the time it was closed. Futures are valued at their quoted daily settlement prices. The aggregate principal amounts of the contracts are not recorded in the financial statements. Fluctuations in the value of the contracts are recorded in the Statement of Assets and Liabilities as an asset (liability) and in the Statement of Operations as unrealized appreciation (depreciation) until the contracts are closed, when they are recorded as realized gains (losses) on future contracts.
For the fiscal year ended October 31, 2013, U.S. Equity and Global Essentials entered into over-the-counter transactions involving interest rate caps and floors, swap contracts, or purchased and written (sold) options in order to manage their exposure to credit, currency, equity, interest rate and inflation risk.
A written option contract is a contract in which the writer of the option grants the buyer of the option the right to purchase from (call option) or sell to (put option) the writer a designated instrument at a specified price within a specified period of time. Options written (sold) are recorded as liabilities. U.S. Equity and Global Essentials, as writer of written options, bears the risk of an unfavorable change in the market value of the instrument underlying the written option. When an option expires, the premium (original option value) is realized as a gain if the option was written or as a loss if the option was purchased. When the exercise of an option results in a cash settlement, the difference between the premium and the settlement proceeds is recognized as realized gain or loss. When securities are acquired or delivered upon exercise of an option, the acquisition cost or sale proceeds are adjusted by the amount of the premium. When an option is closed, the difference between the premium and the cost to close the position is realized as a gain or loss.
Global Essentials invests in Exchange Traded Notes (“ETNs”). ETNs are senior, unsecured, unsubordinated debt securities issued by a financial institution, listed on an exchange and traded in the secondary market. There are no periodic interest payments, and principal is not protected. The Fund could lose some or all of the amount invested. The price in the secondary market is determined by supply and demand, the current performance of the index, and the credit rating of the ETN issuer. At maturity, the issuer pays the Fund a return linked to the performance of the market index, such as a commodity index, to which the ETN is linked, minus the issuer’s fee. ETNs are subject to the risk of a breakdown in the futures markets that they use. As a means to obtain commodity exposure, the Fund invests in ETNs linked to commodity indices. The Fund may be exposed to a wide variety of commodity sectors, including, without limitation, agriculture, livestock, base/industrial metals, oil, energy and precious metals. Commodity prices, and the value of stocks of companies exposed to commodities, can be extremely volatile and are affected by a wide range of factors.
| 12. | Market, Credit and Counterparty Risks |
In the normal course of business, Global Alternatives and Global Essentials invest in securities and enter into transactions where risks exist due to market fluctuations and are exposed to credit risk with parties with whom it trades (issuers or counterparties). Market prices of investments held by the Funds may fall rapidly or unpredictably and will rise and fall due to changing economic, political, or market conditions or in response to events that affect particular industries or companies. Each Fund may be exposed to credit or counterparty risk, or the risk that an institution or other entity with which the Fund has unsettled or open transactions will default or not perform under the contract. The Fund minimizes credit risk and counterparty risk by undertaking transactions with a large number of customers and counterparties on recognized and reputable exchanges. The Fund could lose money if the issuer or guarantor of a fixed income security, or the counterparty to a financial derivatives contract, repurchase agreement or a loan of portfolio securities, is unable or unwilling to make timely principal and/or interest payments, or to otherwise honor its obligations.
The Funds are subject to various Master Agreements, which govern the terms of certain transactions with select counterparties. These Master Agreements reduce the counterparty risk associated with
Notes to Financial Statements (continued)
relevant transactions by specifying credit protection mechanisms and providing standardization that improves legal certainty. Master Agreements can also help limit counterparty risk by specifying collateral posting arrangements at pre-arranged exposure levels. Under the Master Agreements, collateral is routinely transferred if the total net exposure to certain transactions (net of existing collateral already in place) governed under the relevant master agreement with a counterparty in a given account exceeds a specified threshold, which typically ranges from zero to $250,000 depending on the counterparty and the type of Master Agreement.
International Swaps and Derivatives Association, Inc. Master Agreements (“ISDA Master Agreements”) govern OTC financial derivative transactions entered into by the Funds and the respective counterparty. The ISDA Master Agreements maintain provisions for general obligations, representations, agreements, collateral and events of default or termination. Certain ISDA Master Agreements allow counterparties to OTC derivatives to terminate derivative contracts prior to maturity in the event the Funds’ net assets decline by a stated percentage or the Funds fail to meet the terms of the ISDA Master Agreement, which requires accelerated settlement of all outstanding transactions under the applicable ISDA Master Agreement. Any election to terminate early could be material to the financial statements.
| 13. | New Accounting Pronouncements |
In December 2011, the Financial Accounting Standards Board (“FASB”) issued Accounting Standards Update (“ASU”) No. 2011-11 “Disclosures about Offsetting Assets and Liabilities.” ASU 2011-11 requires disclosures to make financial statements that are prepared under U.S. GAAP more comparable to those prepared under IFRS. The new disclosure requirements mandate that entities disclose both gross and net information about instruments and transactions eligible for offset in the statement of assets and
liabilities as well as instruments and transactions subject to an agreement similar to a master netting arrangement. In addition, ASU 2011-11 requires disclosure of collateral received and posted in connection with master netting agreements or similar arrangements. New disclosures are required for annual reporting periods beginning on or after January 1, 2013, and interim periods within those annual periods. Management is evaluating the impact of ASU 2011-11 on the Funds’ financial statements and disclosures.
The Funds have determined that no material events or transactions occurred through the issuance date of the Funds’ financial statements which require additional disclosure in or adjustment of the Funds’ financial statements.
| Tax | Information (unaudited) |
The Managers AMG FQ Tax-Managed, Managers AMG FQ U.S. Equity, Managers AMG FQ Global Alternatives and Managers AMG FQ Global Essentials Funds each hereby designates the maximum amount allowable of its net taxable income as qualified dividends as provided in the Jobs and Growth Tax Relief Reconciliation Act of 2003. The 2012/2013 Form 1099-DIV you receive for each Fund will show the tax status of all distributions paid to you during the year.
Pursuant to section 852 of the Internal Revenue Code, Managers AMG FQ Tax-Managed, Managers AMG FQ U.S. Equity, Managers AMG FQ Global Alternatives and Managers AMG FQ Global Essentials Funds each hereby designate $0, $0, $0 and $0, respectively, as a capital gain distribution with respect to the taxable year ended October 31, 2013, or if subsequently determined to be different, the net capital gains of such fiscal year.
Report of Independent Registered Public Accounting Firm
To the Board of Trustees of Managers Trust I and the Shareholders of Managers AMG FQ Tax-Managed U.S. Equity Fund, Managers AMG FQ U.S. Equity Fund, Managers AMG FQ Global Alternatives Fund and Managers AMG Global Essentials Fund
In our opinion, the accompanying statements of assets and liabilities, including the schedules of portfolio investments, and the related statements of operations and of changes in net assets and the financial highlights present fairly, in all material respects, the financial position of Managers AMG FQ Tax-Managed U.S. Equity Fund, Managers AMG FQ U.S. Equity Fund, Managers AMG FQ Global Alternatives Fund and Managers AMG FQ Global Essentials Fund (the “Funds”) at October 31, 2013, and the results of each of their operations, the changes in each of their net assets and the financial highlights for each of the periods indicated, in conformity with accounting principles generally accepted in the United States of America. These financial statements and financial highlights (hereafter referred to as “financial statements”) are the responsibility of the Funds’ management. Our responsibility is to express an opinion on these financial statements based on our audits. We conducted our audits of these financial statements in accordance with the standards of the Public Company Accounting Oversight Board (United States). Those standards require that we plan and perform the audit to obtain reasonable assurance about whether the financial statements are free of material misstatement. An audit includes examining, on a test basis, evidence supporting the amounts and disclosures in the financial statements, assessing the accounting principles used and significant estimates made by management, and evaluating the overall financial statement presentation. We believe that our audits, which included confirmation of securities at October 31, 2013 by correspondence with the custodian, brokers, transfer agent, and the application of alternative auditing procedures where securities purchased had not been received, provide a reasonable basis for our opinion.
PricewaterhouseCoopers LLP
Boston, Massachusetts
December 26, 2013
Trustees and Officers
The Trustees and Officers of the Trust, their business addresses, principal occupations for the past five years and dates of birth are listed below. The Trustees provide broad supervision over the affairs of the Trust and the Funds. The Trustees are experienced executives who meet periodically throughout the year to oversee the Funds’ activities, review contractual arrangements with companies that provide services to the Funds, and review the Funds’ performance. Unless otherwise noted, the address of each Trustee or Officer is the address of the Trust: 800 Connecticut Avenue, Norwalk, Connecticut 06854.
There is no stated term of office for Trustees. Trustees serve until their resignation, retirement or removal in accordance with the Trust’s organizational documents and policies adopted by the Board from time to time. The Chairman of the Trustees, President, Treasurer and Secretary of the Trust are elected by the Trustees annually. Other officers hold office at the pleasure of the Trustees.
Independent Trustees
The following Trustees are not “interested persons” of the Trust within the meaning of the 1940 Act:
| | |
Name, Date of Birth, Number of Funds Overseen in Fund Complex* | | Principal Occupation(s) During Past 5 Years and Other Directorships Held by Trustee |
Bruce B. Bingham, 12/01/48 • Trustee since 2012 • Oversees 40 Funds in Fund Complex | | Partner, Hamilton Partners (real estate development firm)(1987-Present). |
| |
William E. Chapman, II, 9/23/41 • Independent Chairman • Trustee since 2000 • Oversees 40 Funds in Fund Complex | | President and Owner, Longboat Retirement Planning Solutions (1998-Present); Hewitt Associates, LLC (part time) (provider of Retirement and Investment Education Seminars) (2002-2009); Trustee of Bowdoin College (2002-Present); Director of Harding, Loevner Funds, Inc. (6 portfolios); Trustee of Third Avenue Trust (5 portfolios); Trustee of Third Avenue Variable Trust (1 portfolio); Trustee of Aston Funds (26 portfolios). |
| |
Edward J. Kaier, 9/23/45 • Trustee since 2000 • Oversees 40 Funds in Fund Complex | | Attorney at Law and Partner, Teeters Harvey Gilboy & Kaier LLP (2007-Present); Attorney at Law and Partner, Hepburn Willcox Hamilton & Putnam, LLP (1977-2007); Trustee of Third Avenue Trust (5 portfolios); Trustee of Third Avenue Variable Trust (1 portfolio); Trustee of Aston Funds (26 portfolios). |
| |
Kurt Keilvacker, 10/05/63 • Trustee since 2013 • Oversees 40 Funds in Fund Complex | | Managing Member, TechFund Europe (2000-Present); Managing Member, TechFund Capital (1997-Present) |
| |
Steven J. Paggioli, 4/03/50 • Trustee since 2000 • Oversees 40 Funds in Fund Complex | | Independent Consultant (2002-Present); Formerly Executive Vice President and Director, The Wadsworth Group (1986-2001); Executive Vice President, Secretary and Director, Investment Company Administration, LLC (1990-2001); Vice President, Secretary and Director, First Fund Distributors, Inc. (1991-2001); Trustee, Professionally Managed Portfolios (43 portfolios); Advisory Board Member, Sustainable Growth Advisors, LP; Independent Director, Chase Investment Counsel (2008 – Present); Trustee of Aston Funds (26 portfolios). |
| |
Richard F. Powers III, 2/02/46 • Trustee since 2013 • Oversees 40 Funds in Fund Complex | | Adjunct Professor, Boston College (2011-Present); Director of Ameriprise Financial Inc. (2005-2009) |
| |
Eric Rakowski, 6/05/58 • Trustee since 2000 • Oversees 40 Funds in Fund Complex | | Professor, University of California at Berkeley School of Law (1990-Present); Director of Harding, Loevner Funds, Inc. (6 portfolios); Trustee of Third Avenue Trust (5 portfolios); Trustee of Third Avenue Variable Trust (1 portfolio); Trustee of Aston Funds (26 portfolios). |
| |
Victoria Sassine, 8/11/65 • Trustee since 2013 • Oversees 40 Funds in Fund Complex | | Lecturer, Babson College (2007 – Present) |
| | |
Name, Date of Birth, Number of Funds Overseen in Fund Complex* | | Principal Occupation(s) During Past 5 Years and Other Directorships Held by Trustee |
Thomas R. Schneeweis, 5/10/47 • Trustee since 2000 • Oversees 40 Funds in Fund Complex | | Professor Emeritus, University of Massachusetts (2013 - Present); Director, CISDM at the University of Massachusetts, (1996-Present); President, Alternative Investment Analytics, LLC, (formerly Schneeweis Partners, LLC) (2001-Present); Partner, S Capital Management, LLC (2007-Present); President, TRS Associates (1982-Present); Professor of Finance, University of Massachusetts (1977-2013); Partner, White Bear Partners, LLC (2007-2010); Partner, Northampton Capital Management, LLC (2004-2010); Trustee of Aston Funds (26 portfolios). |
|
* The Fund Complex consists of Managers AMG Funds, The Managers Funds, Managers Trust I and Managers Trust II. |
| |
| Interested Trustees | | |
|
Each Trustee in the following table is an “interested person” of the Trust within the meaning of the 1940 Act. Ms. Carsman is an interested person of the Trust within the meaning of the 1940 Act by virtue of her position with, and interest in securities of, AMG, and her former position as Chief Legal Officer of the Trust. |
Name, Date of Birth, Number of Funds Overseen in Fund Complex* | | Principal Occupation(s) During Past 5 Years and Other Directorships Held by Trustee |
Christine C. Carsman, 4/02/52 • Trustee since 2011 • Oversees 40 Funds in Fund Complex | | Senior Vice President and Deputy General Counsel, Affiliated Managers Group, Inc. (2011-Present); Senior Vice President and Chief Regulatory Counsel, Affiliated Managers Group, Inc. (2007-2011); Vice President and Chief Regulatory Counsel, Affiliated Managers Group, Inc. (2004-2007); Secretary and Chief Legal Officer, Managers AMG Funds, The Managers Funds, Managers Trust I and Managers Trust II (2004-2011); Senior Counsel, Vice President and Director of Operational Risk Management and Compliance, Wellington Management Company, LLP (1995-2004). |
| |
| Officers | | |
| |
Name, Date of Birth, Position(s) Held with Fund and Length of Time Served | | Principal Occupation(s) During Past 5 Years |
Keitha L. Kinne, 5/16/58 • President since 2012 • Chief Operating Officer since 2007 | | Managing Partner and Chief Operating Officer, Managers Investment Group LLC (2007-Present); Chief Operating Officer, The Managers Funds, Managers AMG Funds and Managers Trust II (2007-Present); Chief Investment Officer, Managers Investment Group LLC (2008-Present); President, Managers Distributors, Inc. (2012-Present); Managing Director, Legg Mason & Co., LLC (2006-2007); Managing Director, Citigroup Asset Management (2004-2006). |
| |
Lewis Collins, 2/22/66 • Secretary since 2011 • Chief Legal Officer since 2011 | | Senior Vice President and Senior Counsel, Affiliated Managers Group, Inc. (2010-Present); Vice President and Senior Counsel, Affiliated Managers Group, Inc. (2006-2010); Senior Counsel, Affiliated Managers Group, Inc. (2002-2006); Attorney, Ropes & Gray LLP (1998-2002). |
Trustees and Officers (continued)
| | |
| |
Name, Date of Birth, Position(s) Held with Fund and Length of Time Served | | Principal Occupation(s) During Past 5 Years |
| |
Donald S. Rumery, 5/29/58 • Chief Financial Officer since 2007 • Treasurer since 2000 | | Senior Vice President, Managers Investment Group LLC (2005-Present); Treasurer, The Managers Funds (1995-Present); Treasurer, Managers AMG Funds (1999-Present); Treasurer, Managers Trust II (2000-Present); Chief Financial Officer, The Managers Funds, Managers AMG Funds and Managers Trust II (2007-Present); Treasurer and Chief Financial Officer, Managers Distributors, Inc. (2000-2012); Vice President, The Managers Funds LLC, (1994-2004). |
| |
John J. Ferencz, 3/09/62 • Chief Compliance Officer since 2010 | | Vice President, Legal and Compliance, Managers Investment Group LLC (2010-Present); Senior Compliance Analyst, Mutual Funds and Regulatory, GE Asset Management Incorporated (2005-2010). |
| | |
| |
Name, Date of Birth, Position(s) Held with Fund and Length of Time Served | | Principal Occupation(s) During Past 5 Years |
| |
Michael S. Ponder, 9/12/73 • Assistant Secretary since 2011 | | Senior Vice President and Counsel, Managers Investment Group LLC (2011-Present); Attorney, DeNovo Legal (2009-2010); Vice President, Credit Suisse (2007-2009); Associate, Willkie Farr & Gallagher LLP (2006-2007). |
| |
Matthew B. Wallace, 11/24/80 • Anti-Money Laundering Compliance Officer since 2012 | | Senior Associate, Legal and Compliance, Managers Investment Group LLC (2012-Present); Associate, Legal and Compliance, Managers Investment Group LLC (2010-2012); Compliance Specialist, Calamos Advisors LLC (2007-2010). |
Annual Renewal of Investment Management and Subadvisory Agreements
On June 20-21, 2013, the Board of Trustees, including a majority of the Trustees who are not “interested persons” of the Trust (the “Independent Trustees”), approved the Investment Management Agreement with the Investment Manager for each of Managers AMG FQ U.S. Equity Fund, Managers AMG FQ Tax-Managed U.S. Equity Fund, Managers AMG FQ Global Alternatives Fund and Managers AMG FQ Global Essentials Fund (each a “Fund”) and the Subadvisory Agreement with respect to each Fund. The Independent Trustees were separately represented by independent counsel in connection with their consideration of the approval of these agreements. In considering the Investment Management and Subadvisory Agreements, the Trustees reviewed a variety of materials relating to each Fund, the Investment Manager and the Subadvisor, including comparative performance, fee and expense information for an appropriate peer group of similar mutual funds for each Fund (each a “Peer Group”), performance information for the relevant benchmark index for each Fund (each a “Fund Benchmark”) and, with respect to the Subadvisor, comparative performance information for an appropriate peer group of managed accounts, and, as to all other matters, other information provided to them on a periodic basis throughout the year, as well as information provided in connection with the meetings of June 20-21, 2013, regarding the nature, extent and quality of services provided by the Investment Manager and the Subadvisor under their respective agreements. Prior to voting, the Independent Trustees: (a) reviewed the foregoing information with their independent legal counsel and with management; (b) received materials from their independent legal counsel discussing the legal standards applicable to their consideration of the Investment Management and Subadvisory Agreements; and (c) met with their independent legal counsel in private sessions at which no representatives of management were present.
Nature, extent and quality of services.
In considering the nature, extent and quality of the services provided by the Investment Manager, the Trustees reviewed information relating to the Investment Manager’s operations and personnel. Among other things, the Investment Manager provided financial information, biographical information on its supervisory and professional staff and descriptions of its organizational and management structure. The Trustees also took into account information provided periodically throughout the previous year by the Investment Manager in Board meetings relating to the performance of its duties with respect to the Funds and the Trustees’ knowledge of the Investment Manager’s management and the quality of the performance of the Investment Manager’s duties. In the course of their deliberations regarding the Investment Management Agreement, the Trustees evaluated, among other things: (a) the extent and quality of the Investment Manager’s oversight of the operation and management of the Funds; (b) the quality of the Investment Manager’s oversight of the performance by the Subadvisor of its portfolio management duties; (c) the Investment Manager’s ability to supervise the Funds’ other service providers; and (d) the Investment Manager’s compliance program.
The Trustees also took into account that, in performing its functions under the Investment Management Agreement and supervising the Subadvisor, the Investment Manager: performs periodic detailed analysis and reviews of the performance by the Subadvisor of its obligations to each Fund, including without limitation a review of the Subadvisor’s investment performance in respect of each Fund; prepares and presents periodic reports to the Board regarding the investment performance of the Subadvisor and other information regarding the Subadvisor, at such times and in such forms as the Board may reasonably request; reviews and considers any changes in the personnel of the Subadvisor responsible for performing the Subadvisor’s obligations and makes appropriate reports to the Board; reviews and considers any changes in the ownership or senior management of the Subadvisor and makes appropriate reports to the Board; performs periodic in-person or telephonic diligence meetings, including with respect to compliance matters, with representatives of the Subadvisor; assists the Board and management of the Trust in developing and reviewing information with respect to the annual consideration of each Subadvisory Agreement; prepares recommendations with respect to the continued retention of the Subadvisor or the replacement of the Subadvisor; identifies potential successors to or replacements of the Subadvisor or potential additional Subadvisors, performs appropriate due diligence, and develops and presents to the Board a recommendation as to any such successor, replacement, or additional Subadvisor; designates and compensates from its own resources such personnel as the Investment Manager may consider necessary or appropriate to the performance of its services; and performs such other review and reporting functions as the Board shall reasonably request consistent with the Investment Management Agreement and applicable law. The Trustees noted the affiliation of the Subadvisor with the Investment Manager, noting any potential conflicts of interest. The Trustees also took into account the financial condition of the Investment Manager with respect to its ability to provide the services required under the Investment Management Agreement and the Investment Manager’s undertaking to maintain contractual expense limitations for the Funds. The Trustees also considered the Investment Manager’s risk management processes.
The Trustees also reviewed information relating to the Subadvisor’s financial condition, operations and personnel and the investment philosophy, strategies and techniques (its “Investment Strategy”) used in managing each Fund. Among other things, the Trustees reviewed biographical information on portfolio management and other professional staff, information regarding the Subadvisor’s organizational and management structure and the Subadvisor’s brokerage policies and practices. The Trustees considered specific information provided regarding the experience of the individuals at the Subadvisor with portfolio management responsibility for the Funds, including the information set forth in each Fund’s prospectus and statement of additional information. In the course of their deliberations, the Trustees evaluated, among other things: (a) the services rendered by the Subadvisor in the past; (b) the qualifications and experience of the Subadvisor’s personnel; and
Annual Renewal of Investment Management and Subadvisory Agreements (continued)
(c) the Subadvisor’s compliance program. The Trustees also took into account the financial condition of the Subadvisor with respect to its ability to provide the services required under each Subadvisory Agreement. The Trustees also considered the Subadvisor’s risk management processes.
Performance.
As noted above, the Board considered each Fund’s net performance during relevant time periods as compared to the Fund’s Peer Group and Fund Benchmark and considered the Subadvisor’s performance as compared to an appropriate peer group of managed accounts and also considered the gross performance of the Fund as compared to the Subadvisor’s relevant performance composite that utilizes the same investment strategy and approach and noted that the Board reviews on a quarterly basis detailed information about each Fund’s performance results and portfolio composition, as well as the Subadvisor’s Investment Strategy. The Board noted the Investment Manager’s expertise and resources in monitoring the performance, investment style and risk-adjusted performance of the Subadvisor. The Board was mindful of the Investment Manager’s attention to monitoring the Subadvisor’s performance with respect to the Funds and its discussions with management regarding the factors that contributed to the performance of the Funds.
With respect to Managers AMG FQ U.S. Equity Fund, among other information related to the Fund’s performance, the Trustees noted that the Fund’s performance for Institutional Class shares for the 1-year, 3-year, 5-year and 10-year periods ended March 31, 2013 was below, above, above and above, respectively, the median performance of the Peer Group and below, above, below and above, respectively, the performance of the Fund Benchmark, the Russell 3000® Index. The Trustees took into account management’s discussion of the Fund’s performance, including the reasons for the Fund’s recent underperformance. The Trustees noted that the Fund ranked in the top quartile relative to the Peer Group for both the 3-year and 10-year periods. The Trustees also took into account management’s discussion of the Fund’s Peer Group. The Trustees concluded that the Fund’s overall performance has been satisfactory in light of all factors considered.
With respect to Managers AMG FQ Tax-Managed U.S. Equity Fund, among other information related to the Fund’s performance, the Trustees noted that the Fund’s performance for Institutional Class shares for the 1-year, 3-year, 5-year and 10-year periods ended March 31, 2013 was above the median performance of the Peer Group and below, above, below and above, respectively, the performance of the Fund Benchmark, the Russell 3000® Index. The Trustees also took into account management’s discussion of the Fund’s performance. The Trustees noted that the Fund ranked in the top quartile of the Peer Group for the 3-year, 5-year and 10-year periods. The Trustees concluded that the Fund’s overall performance has been satisfactory.
With respect to Managers AMG FQ Global Alternatives Fund, among other information related to the Fund’s performance, the
Trustees noted that the Fund’s performance for Investor Class shares for the 1-year, 3-year and 5-year periods ended March 31, 2013 was below the median performance of the Peer Group and below the performance of the Fund Benchmark, the Citigroup 1-Month Treasury Bill Index. The Trustees took into account management’s discussion of the Fund’s performance. The Trustees also took into account the impact of market conditions on the Fund’s performance over the last 12 months. The Trustees concluded that the Fund’s performance is being addressed.
With respect to Managers AMG FQ Global Essentials Fund, among other information related to the Fund’s performance, the Trustees noted that the Fund’s performance for Institutional Class shares for the 1-year, 3-year, 5-year and 10-year periods ended March 31, 2013 was above, above, below and below, respectively, the median performance of the Peer Group and below, above, below and above, respectively, the performance of the Fund Benchmark, a Composite Index (60% MSCI World Index and 40% Citigroup World Government Bond Index (Hedged)). The Trustees took into account management’s discussion of the Fund’s performance, including the reasons for the Fund’s more recent underperformance relative to the Fund Benchmark. The Trustees further noted that First Quadrant, L.P. has been the sole Subadvisor to the Fund since 2009 and that the Fund ranked in the top quintile of the Peer Group for the 3-year period. The Trustees concluded that the Fund’s overall performance has been satisfactory in light of all factors considered.
Advisory and Subadvisory Fees and Profitability.
In considering the reasonableness of the advisory fee payable to the Investment Manager, the Trustees reviewed information provided by the Investment Manager setting forth all revenues and other benefits, both direct and indirect (including any so-called “fallout benefits” such as reputational value derived from the Investment Manager serving as Investment Manager to a Fund), received by the Investment Manager and its affiliates attributable to managing each Fund and all the mutual funds in the Managers Family of Funds, the cost of providing such services and the resulting profitability to the Investment Manager and its affiliates from these relationships. The Trustees noted that the Investment Manager and the Subadvisor are affiliated and that, in the case of Managers AMG FQ Tax-Managed U.S. Equity Fund and Managers AMG FQ U.S. Equity Fund, the Investment Manager pays the Subadvisor a subadvisory fee that is equal to the advisory fee that it receives from the Fund. In the case of Managers AMG FQ Global Alternatives Fund and Managers AMG FQ Global Essentials Fund, the Trustees also considered the amount of the advisory fee retained by the Investment Manager after payment of the subadvisory fee with respect to each Fund. The Trustees also noted management’s discussion of the current asset levels of the Funds, and considered the impact on profitability of the current asset levels and any future growth of assets of the Funds.
In considering the cost of services to be provided by the Investment Manager under the Investment Management Agreement
Annual Renewal of Investment Management and Subadvisory Agreements (continued)
and the profitability to the Investment Manager of its relationship with the Funds, the Trustees noted the undertaking by the Investment Manager to maintain contractual expense limitations for the Funds. The Board also took into account management’s discussion of the current advisory fee structure, and, as noted above, the services the Investment Manager provides in performing its functions under the Investment Management Agreement and supervising the Subadvisor. Based on the foregoing, the Trustees concluded that the profitability to the Investment Manager is reasonable and that the Investment Manager is not realizing material benefits from economies of scale that would warrant adjustments to the advisory fee at this time. Also with respect to economies of scale, the Trustees noted that as a Fund’s assets increase over time, the Fund may realize other economies of scale to the extent the increase in assets is proportionally greater than the increase in certain other expenses.
In considering the reasonableness of the subadvisory fees payable by the Investment Manager to the Subadvisor, the Trustees reviewed information provided by the Subadvisor regarding the cost of providing subadvisory services to each of the Funds and the resulting profitability to the Subadvisor from these relationships and noted that, because the Subadvisor is an affiliate of the Investment Manager, such profitability might be directly or indirectly shared by the Investment Manager.
The Trustees also noted that the subadvisory fees are paid by the Investment Manager out of its advisory fee. The Board also took into account management’s discussion of the current subadvisory fee structure, and the services the Subadvisor provides in performing its functions under each Subadvisory Agreement. Based on the foregoing, the Trustees concluded that the profitability to the Subadvisor is reasonable and that the Subadvisor is not realizing material benefits from economies of scale that would warrant adjustments to the subadvisory fees at this time. Also with respect to economies of scale, the Trustees noted that as a Fund’s assets increase over time, the Fund may realize other economies of scale to the extent the increase in assets is proportionally greater than the increase in certain other expenses.
With respect to Managers AMG FQ U.S. Equity Fund, the Trustees noted that the Fund’s advisory fees (which include both the advisory and administration fee) and total expenses (net of applicable expense waivers/reimbursements) as of March 31, 2013 were both lower than the average for the Fund’s Peer Group. The Trustees took into account the fact that the Investment Manager has contractually agreed, through March 1, 2014, to limit the Fund’s net annual operating expenses (subject to certain excluded expenses) to 0.79%. The Trustees noted that, effective December 1, 2012, the Fund’s share class structure was revised to better conform to the Investment Manager’s platform share class structure. The Trustees concluded that, in light of the nature, extent and quality of the services provided by the Investment Manager and the Subadvisor (which is an affiliate of the Investment Manager), the foregoing expense limitation and the considerations noted above with respect to the Subadvisor and the
Investment Manager, the Fund’s advisory fees, including subadvisory fees, are reasonable.
With respect to Managers AMG FQ Tax-Managed U.S. Equity Fund, the Trustees noted that the Fund’s advisory fee and total expenses (net of applicable expense waivers/reimbursements) as of March 31, 2013 were higher and lower, respectively, than the average for the Fund’s Peer Group. The Trustees took into account the fact that the Investment Manager has contractually agreed, through March 1, 2014, to limit the Fund’s net annual operating expenses (subject to certain excluded expenses) to 0.99%. The Board also took into account management’s discussion of the Fund’s expenses and the current size of the Fund. The Board also considered the differences in the Fund’s investment strategy relative to its Peer Group. The Trustees also noted that, effective December 1, 2012, the Fund’s share class structure was revised to better conform to the Investment Manager’s platform share class structure. The Trustees concluded that, in light of the nature, extent and quality of the services provided by the Investment Manager and the Subadvisor (which is an affiliate of the Investment Manager), the foregoing expense limitation and the considerations noted above with respect to the Subadvisor and the Investment Manager, the Fund’s advisory fees, including subadvisory fees, are reasonable.
With respect to Managers AMG FQ Global Alternatives Fund, the Trustees noted that the Fund’s advisory fees (which include both the advisory and administration fee) and total expenses (net of applicable expense waivers/reimbursements) as of March 31, 2013 were both higher than the average for the Fund’s Peer Group. The Trustees took into account the fact that the Investment Manager has contractually agreed to lower the Fund’s contractual expense limitation from 1.49% to 1.44% of the Fund’s net annual operating expenses (subject to certain excluded expenses) effective July 1, 2013 through at least March 1, 2015. The Trustees took into account management’s discussion of the Fund’s expenses and distinct investment strategy. The Trustees also noted that, effective December 1, 2012, the Fund’s share class structure was revised to better conform to the Investment Manager’s platform share class structure. The Trustees concluded that, in light of the nature, extent and quality of the services to be provided by the Investment Manager and the Subadvisor (which is an affiliate of the Investment Manager), the foregoing expense limitation and the considerations noted above with respect to the Subadvisor and the Investment Manager, the Fund’s advisory fees, including subadvisory fees, are reasonable.
With respect to Managers AMG FQ Global Essentials Fund, the Trustees noted that the Fund’s advisory fees (which include both the advisory and administration fee) and total expenses (net of applicable expense waivers/reimbursements) as of March 31, 2013 were both lower than the average for the Fund’s Peer Group. The Trustees took into account the fact that the Investment Manager has contractually agreed, through March 1, 2014, to limit the Fund’s net annual operating expenses (subject to certain excluded expenses) to 0.89%. The Trustees also noted that the Investment
Annual Renewal of Investment Management and Subadvisory Agreements (continued)
Manager reduced this expense limitation from 0.99% to 0.89% the previous year. The Trustees concluded that, in light of the nature, extent and quality of the services provided by the Investment Manager and the Subadvisor (which is an affiliate of the Investment Manager), the foregoing expense limitation and the considerations noted above with respect to the Subadvisor and the Investment Manager, the Fund’s advisory fees, including subadvisory fees, are reasonable.
****
After consideration of the foregoing, the Trustees also reached the following conclusions (in addition to the conclusions discussed above) regarding the Investment Management and Subadvisory Agreements: (a) the Investment Manager has demonstrated that it possesses the resources and capability to perform its duties under the Investment Management Agreement; (b) the Subadvisor has the
resources to perform its duties under the Subadvisory Agreements and is qualified to manage each Fund’s assets in accordance with its investment objectives and policies; and (c) the Investment Manager and Subadvisor maintain appropriate compliance programs
Based on all of the above-mentioned factors and their related conclusions, with no single factor or conclusion being determinative and with each Trustee not necessarily attributing the same weight to each factor, the Trustees concluded that approval of the Investment Management Agreement and each Subadvisory Agreement would be in the best interests of the applicable Fund and its shareholders. Accordingly, on June 20-21, 2013, the Trustees, including a majority of the Independent Trustees, voted to approve the Investment Management Agreement and the Subadvisory Agreement for each Fund.
Proxy Results
A special meeting of shareholders of Managers Trust I was held on July 2, 2013. With respect to the proposals to amend certain “fundamental” investment restrictions of the Funds, the meeting was adjourned to August 20, 2013, for Managers AMG FQ Global Essentials Fund, and Managers AMG FQ Global Alternatives Fund; to August 20, 2013 and September 27, 2013 for Managers AMG FQ U.S. Equity Fund; and to August 20, 2013, September 27, 2013, and October 22, 2013 with respect to Managers AMG FQ Tax-Managed U.S. Equity Fund. With respect to the proposals to amend and restate the Agreement and Declaration of Trust relating to certain items, the meeting was adjourned to October 22, 2013. The proposals and results of the votes are summarized below.
| | | | | | | | |
| | | All Funds in Trust | |
| Managers Trust I | | For | | | Withheld | |
| Election of Directors | | (in $ NAV, rounded to the
nearest dollar) | |
Bruce Bingham | | $ | 130,861,528 | | | $ | 4,865,035 | |
William E. Chapman, II | | | 130,740,436 | | | | 4,986,127 | |
Edward J. Kaier | | | 130,926,087 | | | | 4,800,475 | |
Steven J. Paggioli | | | 130,924,285 | | | | 4,802,277 | |
Erik Rakowski | | | 130,841,911 | | | | 4,884,651 | |
Thomas R. Schneeweis | | | 130,778,924 | | | | 4,947,639 | |
Christine C. Carsman | | | 131,045,716 | | | | 4,680,846 | |
Kurt Keilhacker | | | 130,714,266 | | | | 5,012,297 | |
Richard F. Powers III | | | 130,640,619 | | | | 5,085,943 | |
Victoria Sassine | | | 130,736,799 | | | | 4,989,763 | |
| | | | | | | | | | | | | | | | |
| | | Managers AMG FQ Tax-Managed U.S. Equity Fund | |
| | | For | | | Against | | | Abstain | | | Broker Non-Votes | |
| To amend “fundamental” restrictions of the Funds with respect to: | | (in $NAV, rounded to the nearest dollar) | |
Issuance of Senior Securities | | $ | 1,320,446 | | | $ | 94,477 | | | $ | 124,989 | | | $ | 408,329 | |
Borrowing | | | 1,298,180 | | | | 120,612 | | | | 121,119 | | | | 408,329 | |
Lending | | | 1,304,958 | | | | 105,653 | | | | 129,300 | | | | 408,329 | |
The Underwriting of Securities | | | 1,309,746 | | | | 107,793 | | | | 122,373 | | | | 408,329 | |
Purchasing and Selling Commodities | | | 1,320,484 | | | | 100,368 | | | | 119,059 | | | | 408,329 | |
Purchasing and Selling Real Estate | | | 1,325,210 | | | | 97,268 | | | | 117,434 | | | | 408,329 | |
Diversification of Investments | | | 1,343,302 | | | | 77,340 | | | | 119,269 | | | | 408,329 | |
Concentrating Investments in a Particular Industry | | | 1,289,971 | | | | 128,886 | | | | 121,053 | | | | 408,329 | |
Short Sales | | | 1,286,777 | | | | 127,587 | | | | 125,546 | | | | 408,329 | |
Investing for Control | | | 1,321,328 | | | | 96,218 | | | | 122,365 | | | | 408,329 | |
Securities Issued by Other Investment Companies | | | 1,315,177 | | | | 100,273 | | | | 124,461 | | | | 408,329 | |
Margin Transactions | | | 1,284,665 | | | | 131,017 | | | | 124,228 | | | | 408,329 | |
Investing in New Issuers | | | 1,326,913 | | | | 86,318 | | | | 126,680 | | | | 408,329 | |
Proxy Results (continued)
| | | | | | | | | | | | | | | | |
| | | Managers AMG FQ U.S. Equity Fund | |
| | | For | | | Against | | | Abstain | | | Broker Non-Votes | |
| To amend “fundamental” restrictions of the Funds with respect to: | | (in $NAV, rounded to the nearest dollar) | |
Issuance of Senior Securities | | $ | 1,987,248 | | | $ | 266,260 | | | $ | 249,402 | | | $ | 87,530 | |
Borrowing | | | 1,952,627 | | | | 299,719 | | | | 250,564 | | | | 87,530 | |
Lending | | | 1,970,176 | | | | 289,570 | | | | 243,164 | | | | 87,530 | |
The Underwriting of Securities | | | 1,975,860 | | | | 260,428 | | | | 266,623 | | | | 87,530 | |
Purchasing and Selling Commodities | | | 2,001,062 | | | | 273,867 | | | | 227,981 | | | | 87,530 | |
Purchasing and Selling Real Estate | | | 1,941,951 | | | | 282,413 | | | | 278,546 | | | | 87,530 | |
Diversification of Investments | | | 1,970,336 | | | | 259,634 | | | | 272,940 | | | | 87,530 | |
Concentrating Investments in a Particular Industry | | | 1,918,956 | | | | 297,885 | | | | 286,069 | | | | 87,530 | |
Short Sales | | | N/A | | | | N/A | | | | N/A | | | | N/A | |
Investing for Control | | | N/A | | | | N/A | | | | N/A | | | | N/A | |
Securities Issued by Other Investment Companies | | | N/A | | | | N/A | | | | N/A | | | | N/A | |
Margin Transactions | | | N/A | | | | N/A | | | | N/A | | | | N/A | |
Investing in New Issuers | | | N/A | | | | N/A | | | | N/A | | | | N/A | |
| |
| | | Managers AMG FQ Global Alternatives Fund | |
| | | For | | | Against | | | Abstain | | | Broker Non-Votes | |
| To amend “fundamental” restrictions of the Funds with respect to: | | (in $NAV, rounded to the nearest dollar) | |
Issuance of Senior Securities | | $ | 6,736,315 | | | $ | 118,833 | | | $ | 564,358 | | | $ | 1,614,536 | |
Borrowing | | | 6,701,003 | | | | 145,815 | | | | 572,688 | | | | 1,614,536 | |
Lending | | | 6,707,222 | | | | 142,698 | | | | 569,586 | | | | 1,614,536 | |
The Underwriting of Securities | | | 6,731,864 | | | | 120,190 | | | | 567,452 | | | | 1,614,536 | |
Purchasing and Selling Commodities | | | 6,754,631 | | | | 92,273 | | | | 572,602 | | | | 1,614,536 | |
Purchasing and Selling Real Estate | | | 6,746,868 | | | | 100,602 | | | | 572,036 | | | | 1,614,536 | |
Diversification of Investments | | | N/A | | | | N/A | | | | N/A | | | | N/A | |
Concentrating Investments in a Particular Industry | | | 6,764,058 | | | | 83,423 | | | | 572,025 | | | | 1,614,536 | |
Short Sales | | | 6,646,374 | | | | 213,325 | | | | 559,806 | | | | 1,614,536 | |
Investing for Control | | | 6,700,976 | | | | 149,681 | | | | 568,849 | | | | 1,614,536 | |
Securities Issued by Other Investment Companies | | | 6,652,668 | | | | 195,624 | | | | 571,214 | | | | 1,614,536 | |
Margin Transactions | | | 6,721,171 | | | | 136,002 | | | | 562,333 | | | | 1,614,536 | |
Investing in New Issuers | | | N/A | | | | N/A | | | | N/A | | | | N/A | |
62
Proxy Results (continued)
| | | | | | | | | | | | | | | | |
| | | Managers AMG FQ Global Essentials | |
| | | For | | | Against | | | Abstain | | | Broker Non-Votes | |
| To amend “fundamental” restrictions of the Funds with respect to: | | (in $NAV, rounded to the nearest dollar) | |
Issuance of Senior Securities | | $ | 4,236,376 | | | $ | 496,659 | | | $ | 375,399 | | | $ | 587,925 | |
Borrowing | | | 4,160,725 | | | | 589,034 | | | | 358,674 | | | | 587,925 | |
Lending | | | 4,184,459 | | | | 556,918 | | | | 367,057 | | | | 587,925 | |
The Underwriting of Securities | | | 4,272,750 | | | | 492,269 | | | | 343,415 | | | | 587,925 | |
Purchasing and Selling Commodities | | | 4,233,068 | | | | 524,745 | | | | 350,621 | | | | 587,925 | |
Purchasing and Selling Real Estate | | | 4,259,249 | | | | 511,885 | | | | 337,300 | | | | 587,925 | |
Diversification of Investments | | | 4,295,505 | | | | 478,566 | | | | 334,363 | | | | 587,925 | |
Concentrating Investments in a Particular Industry | | | 4,181,483 | | | | 623,576 | | | | 303,374 | | | | 587,925 | |
Short Sales | | | N/A | | | | N/A | | | | N/A | | | | N/A | |
Investing for Control | | | N/A | | | | N/A | | | | N/A | | | | N/A | |
Securities Issued by Other Investment Companies | | | N/A | | | | N/A | | | | N/A | | | | N/A | |
Margin Transactions | | | N/A | | | | N/A | | | | N/A | | | | N/A | |
Investing in New Issuers | | | N/A | | | | N/A | | | | N/A | | | | N/A | |
| |
| | | Managers AMG FQ Tax-Managed U.S. Equity Fund | |
| | | For | | | Against | | | Abstain | | | Broker Non-Votes | |
To amend and restate the Agreement and Declaration of the Trust relating
to: | | (in $NAV, rounded to the nearest dollar) | |
Declaration of Trust Amendment Procedures | | $ | 1,322,543 | | | $ | 94,392 | | | $ | 122,974 | | | $ | 408,332 | |
Merger, Consolidation, Sale of Assets and Termination of Trust, Series or Classes | | | 1,318,777 | | | | 99,238 | | | | 121,893 | | | | 408,332 | |
Other Changes | | | 1,293,534 | | | | 96,470 | | | | 149,905 | | | | 408,332 | |
| |
| | | Managers AMG FQ U.S. Equity Fund | |
| | | For | | | Against | | | Abstain | | | Broker Non-Votes | |
To amend and restate the Agreement and Declaration of the Trust relating
to: | | (in $NAV, rounded to the nearest dollar) | |
Declaration of Trust Amendment Procedures | | $ | 2,069,279 | | | $ | 185,090 | | | $ | 285,756 | | | $ | 83,013 | |
Merger, Consolidation, Sale of Assets and Termination of Trust, Series or Classes | | | 1,973,436 | | | | 271,761 | | | | 294,929 | | | | 83,013 | |
Other Changes | | | 1,937,811 | | | | 258,152 | | | | 344,162 | | | | 83,013 | |
| |
| | | Managers AMG FQ Global Alternatives Fund | |
| | | For | | | Against | | | Abstain | | | Broker Non-Votes | |
To amend and restate the Agreement and Declaration of the Trust relating
to: | | (in $NAV, rounded to the nearest dollar) | |
Declaration of Trust Amendment Procedures | | $ | 7,451,378 | | | $ | 136,504 | | | $ | 274,564 | | | $ | 1,524,326 | |
Merger, Consolidation, Sale of Assets and Termination of Trust, Series or Classes | | | 7,450,794 | | | | 115,244 | | | | 296,409 | | | | 1,524,326 | |
Other Changes | | | 6,920,895 | | | | 626,005 | | | | 315,545 | | | | 1,524,326 | |
63
Proxy Results (continued)
| | | | | | | | | | | | | | | | |
| | | Managers AMG FQ Global Essentials | |
| | | For | | | Against | | | Abstain | | | Broker Non-Votes | |
To amend and restate the Agreement and Declaration of the Trust
relating to: | | (in $NAV, rounded to the nearest dollar) | |
Declaration of Trust Amendment Procedures | | $ | 4,704,037 | | | $ | 498,766 | | | $ | 442,675 | | | $ | 557,660 | |
Merger, Consolidation, Sale of Assets and Termination of Trust, Series or Classes | | | 4,687,724 | | | | 546,465 | | | | 411,290 | | | | 557,660 | |
Other Changes | | | 4,652,967 | | | | 482,813 | | | | 509,699 | | | | 557,660 | |
| |
| | | All Funds in Trust | |
| | | For | | | Against | | | Abstain | | | Broker Non-Votes | |
To amend and restate the Agreement and Declaration of the Trust
relating to: | | (in $NAV, rounded to the nearest dollar) | |
Declaration of Trust Amendment Procedures | | $ | 192,290,005 | | | $ | 7,507,459 | | | $ | 7,994,207 | | | $ | 31,541,556 | |
Merger, Consolidation, Sale of Assets and Termination of Trust, Series or Classes | | | 124,093,865 | | | | 6,962,787 | | | | 8,955,316 | | | | 31,541,556 | |
Other Changes | | | 122,906,748 | | | | 7,515,009 | | | | 9,223,126 | | | | 31,541,556 | |
64
Investment Manager and Administrator
Managers Investment Group LLC
800 Connecticut Avenue
Norwalk, CT 06854
(800) 835-3879
Distributor
Managers Distributors, Inc.
800 Connecticut Avenue
Norwalk, CT 06854
(800) 835-3879
Subadvisor
First Quadrant, L.P.
800 E. Colorado Boulevard, Suite 900
Pasadena, CA 91101
Custodian
The Bank of New York Mellon
2 Hanson Place
Brooklyn, NY 11217
Legal Counsel
Ropes & Gray LLP
Prudential Tower, 800 Boylston Street
Boston, MA 02199-3600
Transfer Agent
BNY Mellon Investment Servicing (US) Inc.
Attn: Managers
P.O. Box 9769
Providence, RI 02940
(800) 548-4539
For ManagersChoiceTM Only
Managers
c/o BNY Mellon Investment Servicing (US) Inc.
P.O. Box 9847
Providence, Rhode Island 02940-8047
(800) 358-7668

MANAGERS AND MANAGERS AMG FUNDS
| | | | | | |
EQUITY FUNDS | | | | BALANCED FUNDS |
BRANDYWINE BRANDYWINE BLUE BRANDYWINE ADVISORS MIDCAP GROWTH Friess Associates, LLC CADENCE CAPITAL APPRECIATION CADENCE MID-CAP CADENCE EMERGING COMPANIES Cadence Capital Management, LLC ESSEX SMALL/MICRO CAP GROWTH Essex Investment Management Co., LLC FQ TAX-MANAGED U.S. EQUITY FQ U.S. EQUITY First Quadrant, L.P. FRONTIER SMALL CAP GROWTH Frontier Capital Management Company, LLC GW&K SMALL CAP EQUITY Gannett Welsh & Kotler, LLC MICRO-CAP Lord, Abbett & Co. LLC WEDGE Capital Management L.L.P. Next Century Growth Investors LLC RBC Global Asset Management (U.S.) Inc. REAL ESTATE SECURITIES CenterSquare Investment Management, Inc. | | RENAISSANCE LARGE CAP GROWTH Renaissance Group LLC SKYLINE SPECIAL EQUITIES PORTFOLIO Skyline Asset Management, L.P. SPECIAL EQUITY Ranger Investment Management, L.P. Lord, Abbett & Co. LLC Smith Asset Management Group, L.P. Federated MDTA LLC SYSTEMATIC VALUE SYSTEMATIC MID CAP VALUE Systematic Financial Management, L.P. TIMESSQUARE INTERNATIONAL SMALL CAP TIMESSQUARE MID CAP GROWTH TIMESSQUARE SMALL CAP GROWTH TSCM GROWTH EQUITY TimesSquare Capital Management, LLC TRILOGY GLOBAL EQUITY TRILOGY EMERGING MARKETS EQUITY TRILOGY INTERNATIONAL SMALL CAP Trilogy Global Advisors, L.P. YACKTMAN YACKTMAN FOCUSED Yacktman Asset Management LP | | | | CHICAGO EQUITY PARTNERS BALANCED |
| | | | | Chicago Equity Partners, LLC |
| | | | | |
| | | | | ALTERNATIVE FUNDS |
| | | | | FQ GLOBAL ALTERNATIVES |
| | | | | FQ GLOBAL ESSENTIALS |
| | | | | First Quadrant, L.P. |
| | | | | |
| | | | | |
| | | | | INCOME FUNDS |
| | | | | BOND (MANAGERS) GLOBAL INCOME OPPORTUNITY Loomis, Sayles & Co., L.P. BOND (MANAGERS PIMCO) Pacific Investment Management Co. LLC GW&K MUNICIPAL BOND GW&K FIXED INCOME GW&K MUNICIPAL ENHANCED YIELD Gannett Welsh & Kotler, LLC HIGH YIELD J.P. Morgan Investment Management LLC INTERMEDIATE DURATION GOVERNMENT SHORT DURATION GOVERNMENT Amundi Smith Breeden LLC |
| | | | |
| | | | |
| | | | |
| | | | |
| | | | |
| | | | |
| | | | |
| | | | |
| | | | |
| | | | |
| | | | |
| | | | |
| | | | |
| | | | |
| | | | |
| | | | |
| | | | |
| | | | |
| | | | |
| | | | |
| | | | | |
This report is prepared for the Funds’ shareholders. It is authorized for distribution to prospective investors only when preceded or accompanied by an effective prospectus. To receive a free copy of the prospectus or Statement of Additional Information, which includes additional information about Fund Trustees, please contact us by calling 800.835.3879. Distributed by Managers Distributors, Inc., member FINRA.
A description of the policies and procedures each Fund uses to vote its proxies is available: (i) without charge, upon request, by calling 800.835.3879, or (ii) on the Securities and Exchange Commission’s (SEC) Web site at www. sec.gov. For information regarding each Fund’s proxy voting record for the 12-month period ended June 30, call 800.835.3879 or visit the SEC Web site at www.sec.gov.
The Funds file their complete schedule of portfolio holdings with the SEC for the first and third quarters of each fiscal year on Form N-Q. The Funds’ Forms N-Q are available on the SEC’s Web site at www.sec.gov. A Fund’s Forms N-Q may be reviewed and copied at the SEC’s Public Reference Room in Washington, DC. Information on the operation of the Public Reference Room may be obtained by calling 800.SEC.0330. To review a complete list of the Funds’ portfolio holdings, or to view the most recent quarterly holdings report, semiannual report, or annual report, please visit www.managersinvest.com.
| | | | |
| | | |  |
www.managersinvest.com

Managers Funds
Annual Report—October 31, 2013
| | | | |
TABLE OF CONTENTS | | Page | |
| |
LETTER TO SHAREHOLDERS | | | 2 | |
| |
ABOUT YOUR FUND’S EXPENSES | | | 3 | |
| |
PORTFOLIO MANAGER’S COMMENTS, FUND SNAPSHOTS, AND SCHEDULES OF PORTFOLIO INVESTMENTS | | | | |
| |
Managers Frontier Small Cap Growth Fund | | | 4 | |
| |
Managers AMG TSCM Growth Equity Fund | | | 10 | |
| |
Managers Micro-Cap Fund | | | 16 | |
| |
Managers Real Estate Securities Fund | | | 25 | |
| |
NOTES TO SCHEDULES OF PORTFOLIO INVESTMENTS | | | 29 | |
| |
FINANCIAL STATEMENTS | | | | |
| |
Statement of Assets and Liabilities | | | 31 | |
Balance sheets, net asset value (NAV) per share computations and cumulative undistributed amounts | | | | |
| |
Statement of Operations | | | 33 | |
Detail of sources of income, expenses, and realized and unrealized gains (losses) during the fiscal year | | | | |
| |
Statements of Changes in Net Assets | | | 34 | |
Detail of changes in assets for the past two fiscal years | | | | |
| |
FINANCIAL HIGHLIGHTS | | | 36 | |
Historical net asset values per share, distributions, total returns, income and expense ratios, turnover ratios and net assets | | | | |
| |
NOTES TO FINANCIAL HIGHLIGHTS | | | 42 | |
| |
NOTES TO FINANCIAL STATEMENTS | | | 43 | |
Accounting and distribution policies, details of agreements and transactions with Fund management and affiliates, and descriptions of certain investment risks | | | | |
| |
REPORT OF INDEPENDENT REGISTERED PUBLIC ACCOUNTING FIRM | | | 51 | |
| |
TRUSTEES AND OFFICERS | | | 52 | |
| |
ANNUAL RENEWAL OF INVESTMENT MANAGEMENT AND SUBADVISORY AGREEMENTS | | | 54 | |
Nothing contained herein is to be considered an offer, sale or solicitation of an offer to buy shares of any series of the Managers Family of Funds. Such offering is made only by Prospectus, which includes details as to offering price and other material information.
Letter to Shareholders
Dear Shareholder:
Thank you for your investment in The Managers Funds. Our foremost goal at Managers Investment Group (“MIG”) is to provide investment products and solutions that help our shareholders and clients successfully reach their investment goals and objectives. We do this by offering a broad selection of Funds managed by a collection of Affiliated Managers Group’s (“AMG”) affiliate investment boutiques, along with a complementary series of open-architecture mutual funds.
The past year has been an exciting one for us at MIG. We were pleased to welcome the Brandywine Funds into the Managers Fund family several months ago. We have been excited to begin this new chapter in the 27-year history of the Brandywine Funds, while maintaining shareholders’ access to the same investment team that has guided the Brandywine Funds since inception using its research-driven investment approach.
We announced effective November 1, 2013 that the GW&K Small Cap Equity Fund would be closed to new investors with certain limited exceptions. The team at GW&K manages a total of $2.3 billion (as of October 31, 2013) in small-capitalization equities and closing the Fund to new investors allows the team to continue to execute on the investment process that has been effective for the team for more than a decade. We will continue to make decisions such as these that we believe are in the best interest of our shareholders.
Risky assets have done quite well thus far in 2013, with U.S. equity markets surpassing all-time highs. Ongoing global monetary easing, a low-yield environment, and healthy U.S. economic growth are supporting investor appetite for risk assets. Despite improving investor sentiment, risks remain, including uncertainty surrounding the Fed’s eventual exit from its ultra-accommodative monetary policy, ongoing fiscal headwinds in the U.S. and slower growth in emerging markets. Nevertheless, we are optimistic about the prospects for the upcoming year and we are confident that our Funds are well positioned to weather an uncertain economic environment.
We thank you for your continued confidence and investment in The Managers Funds. You can rest assured that under all market conditions our team is focused on delivering excellent investment management services for your benefit.
Respectfully,
Keitha Kinne
President
The Managers Funds
2
About Your Fund’s Expenses
As a shareholder of a Fund, you may incur two types of costs: (1) transaction costs, which may include sales charges (loads) on purchase payments; redemption fees; and exchange fees; and (2) ongoing costs, including management fees; distribution (12b-1) fees; and other Fund expenses. This example is intended to help you understand your ongoing costs (in dollars) of investing in the Fund and to compare these costs with the ongoing costs of investing in other mutual funds. The example is based on $1,000 invested at the beginning of the period and held for the entire period as indicated below.
Actual Expenses
The first line of the following table provides information about the actual account values and actual expenses. You may use the information in this line, together with the amount you invested, to estimate the expenses that you paid over the period. Simply divide your account value by $1,000 (for example, an $8,600 account value divided by $1,000 = 8.6), then multiply the result by the number in the first line under the heading entitled “Expenses Paid During Period” to estimate the expenses you paid on your account during this period.
Hypothetical Example for Comparison Purposes
The second line of the following table provides information about hypothetical account values and hypothetical expenses based on the Fund’s actual expense ratio and an assumed annual rate of return of 5% before expenses, which is not the Fund’s actual return. The hypothetical account values and expenses may not be used to estimate the actual ending account balance or expenses you paid for the period. You may use this information to compare the ongoing costs of investing in the Fund and other funds by comparing this 5% hypothetical example with the 5% hypothetical examples that appear in the shareholder reports of other funds.
Please note that the expenses shown in the table are meant to highlight your ongoing costs only and do not reflect any transactional costs, such as sales charges (loads), redemption fees, or exchange fees. Therefore, the second line of the table is useful in comparing ongoing costs only, and will not help you determine the relative total costs of owning different funds.
| | | | | | | | | | | | | | | | | | |
| | | Six Months Ended
October 31, 2013 | | Expense
Ratio for
the
Period | | | Beginning
Account Value
05/01/13 | | | Ending
Account Value
10/31/13 | | | Expenses
Paid During
the Period* | |
| | Managers Frontier Small Cap Growth Fund | |
| | Investor Class Shares | | | | | | | | | |
| | Based on Actual Fund Return | | | 1.55 | % | | $ | 1,000 | | | $ | 1,204 | | | $ | 8.61 | |
| | Hypothetical (5% return before expenses) | | | 1.55 | % | | $ | 1,000 | | | $ | 1,017 | | | $ | 7.88 | |
| | Service Class Shares | |
| | Based on Actual Fund Return | | | 1.29 | % | | $ | 1,000 | | | $ | 1,205 | | | $ | 7.17 | |
| | Hypothetical (5% return before expenses) | | | 1.29 | % | | $ | 1,000 | | | $ | 1,019 | | | $ | 6.56 | |
| | Institutional Class Shares | |
| | Based on Actual Fund Return | | | 1.05 | % | | $ | 1,000 | | | $ | 1,206 | | | $ | 5.84 | |
| | Hypothetical (5% return before expenses) | | | 1.05 | % | | $ | 1,000 | | | $ | 1,020 | | | $ | 5.35 | |
| | Managers AMG TSCM Growth Equity Fund | |
| | Investor Class Shares | | | | | | | | | | | | | | | | |
| | Based on Actual Fund Return | | | 1.28 | % | | $ | 1,000 | | | $ | 1,147 | | | $ | 6.93 | |
| | Hypothetical (5% return before expenses) | | | 1.28 | % | | $ | 1,000 | | | $ | 1,019 | | | $ | 6.51 | |
| | Service Class Shares | |
| | Based on Actual Fund Return | | | 0.89 | % | | $ | 1,000 | | | $ | 1,150 | | | $ | 4.82 | |
| | Hypothetical (5% return before expenses) | | | 0.89 | % | | $ | 1,000 | | | $ | 1,021 | | | $ | 4.53 | |
| | Institutional Class Shares | |
| | Based on Actual Fund Return | | | 0.79 | % | | $ | 1,000 | | | $ | 1,150 | | | $ | 4.28 | |
| | Hypothetical (5% return before expenses) | | | 0.79 | % | | $ | 1,000 | | | $ | 1,021 | | | $ | 4.02 | |
| | Managers Micro-Cap Fund | |
| | Service Class Shares | | | | | | | | | | | | | | | | |
| | Based on Actual Fund Return | | | 1.43 | % | | $ | 1,000 | | | $ | 1,279 | | | $ | 8.21 | |
| | Hypothetical (5% return before expenses) | | | 1.43 | % | | $ | 1,000 | | | $ | 1,018 | | | $ | 7.27 | |
| | Institutional Class Shares | |
| | Based on Actual Fund Return | | | 1.18 | % | | $ | 1,000 | | | $ | 1,281 | | | $ | 6.78 | |
| | Hypothetical (5% return before expenses) | | | 1.18 | % | | $ | 1,000 | | | $ | 1,019 | | | $ | 6.01 | |
| | Managers Real Estate Securities Fund | |
| | Based on Actual Fund Return | | | 1.24 | % | | $ | 1,000 | | | $ | 947 | | | $ | 6.08 | |
| | Hypothetical (5% return before expenses) | | | 1.24 | % | | $ | 1,000 | | | $ | 1,019 | | | $ | 6.31 | |
| | * Expenses are equal to the Fund’s annualized expense ratio multiplied by the average account value over the period, multiplied by the number of days in the most recent fiscal half-year (184), then divided by 365. | |
Managers Frontier Small Cap Growth Fund
Portfolio Manager’s Comments
THE PORTFOLIO MANAGER
Frontier Capital Management Co. LLC (“Frontier”) manages client assets in small-, small/mid-, mid- and large-cap U.S. equity strategies. The Managers Frontier Small Cap Growth Fund follows a small-cap growth discipline as Frontier implements its “GARP” investment approach to select attractive small-cap stocks.
Frontier believes:
| | • | | Fundamental research is the cornerstone to adding value |
| | • | | Stock prices ultimately are linked to sales and earnings growth |
| | • | | Growth must be purchased at a reasonable price (“GARP”) |
| | • | | Research is a continuous process |
Frontier utilizes and draws support from its entire team of 19 investment professionals to identify opportunities and conduct fundamental research. Through fundamental bottom-up research, Frontier seeks long-term capital appreciation by investing in small-capitalization companies that it believes have above-average earnings growth potential and are available at reasonable valuations.
Frontier looks for companies it believes can generate long-term, sustainable earnings, managed by qualified professionals capable of executing a well-conceived strategic plan. Frontier seeks businesses that can generate superior rates of return on capital in excess of their cost of capital over a business cycle due to above-average secular growth prospects or a competitive advantage.
THE YEAR IN REVIEW
For the fiscal year ended October 31, 2013, the Managers Frontier Small Cap Growth Fund (Service Class) (the “Fund”) returned 40.01%, on pace with the Russell 2000® Growth Index, which returned 39.84%.
U.S. equities finished the twelve months ending October 31, 2013 with very strong returns. Small caps significantly outperformed as the Russell 2000® rose 36.3% versus the 28.4% gain of the large cap Russell 1000®. From a style perspective growth led the market as the Russell 2000® Growth advanced 39.8%.
The period ended with U.S. equity indices hitting new all-time highs despite the government shutdown, partisan budget battles, and uncertainty surrounding the federal debt ceiling. Economic data has been stronger than expected, which is surprising given the ineptitude in Washington DC. GDP rose 2.8% in the third quarter, exceeding the median economist forecast of 2.0%, and representing the second quarter of acceleration. However, the growth was led by the biggest increase in inventories since the first quarter of 2012 as household purchases and business investment slowed. Consumer spending, which accounts for more than two-thirds of GDP, grew at a paltry 1.5%, matching the slowest pace of growth in more than 3 1⁄2 years. Business spending on capital equipment, a key measure of companies’ willingness to invest, fell for only the second time since the recovery began more than four years ago. The 3.7% drop is a sign companies may have become skittish as political battles over the federal budget and debt ceiling dragged on. While the strong inventory growth could risk holding back production in the current quarter, we are not seeing the evidence in other data points. The ISM Manufacturing Index unexpectedly rose 0.2 in October to 56.4, the highest level since April 2011, and defied economists’ expectations for a drop to 55. The ISM service soared a full point
higher to 55.4, well above projections. Readings above 50 indicate economic expansion. Additionally October payrolls increased more than forecasted to 204,000, ahead of an upwardly revised 163,000 gain in September. Taken together, the latest released economic data point to an economy growing at roughly the same subpar pace that has plagued the recovery, now in its fifth year. Many economists had predicted growth would accelerate in the second half of the year as the effects of tax increases and federal spending cuts eased. That appears increasingly unlikely. The potential for renewed political battles over the federal budget and debt ceiling in early 2014 is already raising fears of another setback to the economy.
The Fund’s performance was primarily driven by strong stock selection, although sector selection was also a modest positive. Our three top contributing sectors were health care, financials, and materials & processing. Health care, a sector we are slightly underweight, was our largest contributor to relative performance as our 62% return exceeded the 41% gain of the index. Top stocks included neonatal and anesthesiology practice operator Mednax, up 58%, and Onyx Pharmaceuticals, up 58%. Onyx agreed to be acquired by Amgen at $125 per share, and we subsequently sold the position.
Financials was our second strongest contributing sector solely due to our overweight position as our 38% return matched the sector return of the Index. Performance was led by securities brokerage Jefferies Group, up 53%, after the company agreed to be acquired by conglomerate Leucadia National. Asset manager Waddell & Reed rose 96% as the company benefitted from strong flows, good performance, and market appreciation. The Fund also realized strong returns in materials & processing, a sector we were equal weight with the index. Our returns were 49%, outperforming the index return of 31%. In that sector we saw a positive contribution from commercial cable and connectivity company Belden, which was up 89%.
Another notable sector was technology, a sector we are underweight, as our 58% return bested the 39% return of the Index. Two stocks, Yelp Incorporated, up 140%, and Tessera Technologies, up 39%, were the top two technology stocks. Yelp, the leading online platform that allows users to find and review local businesses, posted better than expected financial results for the second quarter that included year-over-year growth rates of 69% for revenue, 38% for average monthly unique visitors, and 62% for new business accounts. Yelp is one of the fastest growing technology companies and in our opinion has the potential to be a much larger business. Tessera’s stock price rose as investors gained confidence that the management team and Board of Directors would be replaced following a proxy battle with an activist shareholder. The company now has a new CEO and CFO as well as a more qualified Board that should drive the company back to its historical position as an intellectual property leader with strong profitability.
Consumer discretionary, a sector we are underweight, was our largest detractor to performance as our 34% return lagged the 39% gain of the benchmark. Mattress retailer Select Comfort who operates the Sleep Number stores declined 34% and was our worst consumer stock. After very strong performance from late 2009 through 2012, the company was hurt by slowing industry trends that were exacerbated by a change in their marketing plans. We believe
4
Managers Frontier Small Cap Growth Fund
Portfolio Manager’s Comments (continued)
the marketing issues have been corrected and new product innovations will drive sales in 2014 and beyond and we continue to hold our position. Handbag brand Vera Bradley, down 26%, was our second worst consumer stock. Inventory issues and mismanagement of its wholesale channel weighed on results. We believe in the brand longer term and new management has joined to address the execution issues. Weakness in consumer discretionary was also found in footwear products company Crocs, Inc., down 22% for the fiscal year.
Energy, a sector with a modest overweight, was also a detractor from our relative returns as our 17% gain significantly trailed the 44% gain of the index. KiOR, down 65%, was responsible for the majority of our underperformance. This alternative energy company has a promising catalyst product that converts biomass into oil. Unfortunately, KiOR has run into a series of operational start up issues at its first production facility. While the facility is producing oil, it has not reached the rate management expected and this has pressured the stock. Additionally, investors and short sellers realized that the company must raise a substantial amount of capital in order to fund the next production facility. Fortunately, in late September, KiOR received a $50M cash infusion from its largest investor which will allow it to continue operations for at least another year. We believe the company can overcome its production issues and produce oil at a cost competitive level.
An improving housing market and auto industry, as well as a domestic renaissance in manufacturing are driving the U.S. economy. We continue to envision a period of low absolute growth
given the headwinds from anemic international economies, more fiscal restraint, modest wage growth, and the eventual tapering of Federal Reserve bond purchases. With this backdrop, our team continues to look for companies with differentiated products and services that can grow secularly and maintain pricing power. We feel we had success in this endeavor over the past twelve months and look forward to the opportunities in the year ahead.
This commentary reflects the viewpoints of the portfolio manager, Frontier Capital Management, as of October 31, 2013 and is not intended as a forecast or guarantee of future results, and is subject to change without notice.
CUMULATIVE TOTAL RETURN PERFORMANCE
Managers Frontier Small Cap Growth Fund’s cumulative total return is based on the daily change in net asset value (NAV) and assumes that all dividends and distributions were reinvested. This chart compares a hypothetical $10,000 investment made in Managers Frontier Small Cap Growth Fund’s Service Class on October 31, 2003, to a $10,000 investment made in the Russell 2000® Growth Index for the same time period. Performance for periods longer than one year is annualized. The graph and table do not reflect the deduction of taxes that a shareholder would pay on a Fund distribution or redemption of shares. The listed returns for the Fund are net of expenses and the returns for the index exclude expenses. Past performance is not indicative of future results. Total returns would have been lower had certain expenses not been reduced.
5
Managers Frontier Small Cap Growth Fund
Portfolio Manager’s Comments (continued)
CUMULATIVE TOTAL RETURN PERFORMANCE (continued)
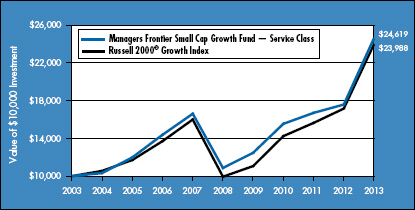
The table below shows the average annual total returns for the Managers Frontier Small Cap Growth Fund and the Russell 2000® Growth Index for the same time periods ended October 31, 2013.
| | | | | | | | | | | | | | | | | | | | |
| | | Average Annual Total Returns1 | |
| | | One Year | | | Five Years | | | Ten Years | | | Since Inception | | | Inception Date | |
Managers Frontier Small Cap Equity Fund2,3,4 | |
Investor Class | | | 39.61 | % | | | — | | | | — | | | | 16.48 | % | | | 01/01/10 | |
Service Class | | | 40.01 | % | | | 17.78 | % | | | 9.43 | % | | | 7.73 | % | | | 09/24/97 | |
Institutional Class | | | 40.34 | % | | | — | | | | — | | | | 17.01 | % | | | 01/01/10 | |
Russell 2000® Growth Index5 | | | 39.84 | % | | | 19.27 | % | | | 9.14 | % | | | 5.20 | % | | | 09/24/97 | † |
The performance data shown represents past performance. Past performance is not a guarantee of future results. Current performance may be lower or higher than the performance data quoted. The investment return and principal value of an investment in the Fund will fluctuate so that an investor’s shares, when redeemed, may be worth more or less than their original cost. For performance information through the most recent month end, please call (800) 835-3879 or visit our Web site at www.managersinvest.com. Current net asset values per share for each Fund are available on the Funds’ Web site at www.managersinvest.com.
Investors should carefully consider the Fund’s investment objectives, risks, charges and expenses before investing. For this and other information, please call (800) 835-3879 or visit our Web site at www.managersinvest.com for a free prospectus. Read it carefully before investing or sending money. Funds are distributed by Managers Distributors, Inc., member FINRA.
| † | The date reflects the inception date of the Fund, not the index. |
| | |
1 | | Total return equals income yield plus share price change and assumes reinvestment of all dividends and capital gain distributions. Returns are net of fees and may reflect offsets of Fund expenses as described in the Prospectus. No adjustment has been made for taxes payable by shareholders on their reinvested dividends and capital gain distributions. Returns for periods greater than one year are annualized. The listed returns on the Fund are net of expenses and based on the published NAV as of October 31, 2013. All returns are in U.S. dollars ($). |
2 | | From time to time, the Fund’s advisor has waived its fees and/or absorbed Fund expenses, which has resulted in higher returns. |
3 | | The Fund is subject to risks associated with investments in small-capitalization companies, such as erratic earnings patterns, competitive conditions, limited earnings history, and a reliance on one or a limited number of products. |
4 | | The Fund invests in growth stocks, which may be more sensitive to market movements because their prices tend to reflect future investor expectations rather than just current profits. Growth stocks may underperform value stocks during given periods. |
5 | | The Russell 2000® Growth Index measures the performance of the Russell 2,000 companies with higher price-to-book ratios and higher forecasted growth values. Unlike the Fund, the Russell 2000® Growth Index is unmanaged, is not available for investment, and does not incur expenses. |
| |
| The Russell 2000® Growth Index is a registered trademark of Russell Investments. Russell® is a trademark of Russell Investments. |
| |
| Not FDIC insured, nor bank guaranteed. May lose value. |
Managers Frontier Small Cap Growth Fund
Fund Snapshots
October 31, 2013
Portfolio Breakdown (unaudited)
| | | | | | | | |
Industry | | Managers
Frontier Small Cap
Growth Fund** | | | Russell 2000®
Growth Index | |
Industrials | | | 27.7 | % | | | 12.2 | % |
Information Technology | | | 23.9 | % | | | 26.4 | % |
Health Care | | | 18.4 | % | | | 12.1 | % |
Financials | | | 9.7 | % | | | 5.4 | % |
Consumer Discretionary | | | 7.7 | % | | | 19.9 | % |
Energy | | | 4.8 | % | | | 4.8 | % |
Materials | | | 3.2 | % | | | 4.5 | % |
Telecommunication Services | | | 3.1 | % | | | 2.1 | % |
Consumer Staples | | | 0.0 | % | | | 12.4 | % |
Utilities | | | 0.0 | % | | | 0.2 | % |
Other Assets and Liabilities | | | 1.5 | % | | | 0.0 | % |
| ** | As a percentage of net assets. |
Top Ten Holdings (unaudited)
| | | | |
Security Name | | %of
Net Assets | |
MEDNAX, Inc.* | | | 4.7 | % |
MasTec, Inc.* | | | 4.5 | |
Raymond James Financial, Inc.* | | | 3.0 | |
Watsco, Inc.* | | | 2.7 | |
Alkermes PLC | | | 2.6 | |
Belden, Inc.* | | | 2.3 | |
WABCO Holdings, Inc.* | | | 2.3 | |
Cogent Communications Group, Inc. | | | 2.3 | |
WESCO International, Inc.* | | | 1.8 | |
United Therapeutics Corp. | | | 1.8 | |
Top Ten as a Group | | | 28.0 | % |
| | | | |
|
* Top Ten Holding at April 30, 2013 | |
Any sectors, industries, or securities discussed should not be perceived as investment recommendations. Mention of a specific security should not be considered a recommendation to buy or solicitation to sell that security. Specific securities mentioned in this report may have been sold from the Fund’s portfolio of investments by the time you receive this report.
Managers Frontier Small Cap Growth Fund
Schedule of Portfolio Investments
October 31, 2013
| | | | | | | | |
| | | Shares | | | Value | |
Common Stocks - 98.5% | | | | | | | | |
Consumer
Discretionary - 7.7% | | | | | | | | |
Cheesecake Factory, Inc., The | | | 8,000 | | | $ | 378,000 | |
Chico’s FAS, Inc. | | | 29,300 | | | | 502,495 | |
Crocs, Inc.* | | | 28,200 | | | | 343,476 | |
Fiesta Restaurant Group, Inc.* | | | 9,770 | | | | 414,150 | |
Harman International Industries, Inc. | | | 6,800 | | | | 550,936 | |
Imax Corp.* | | | 17,100 | | | | 498,465 | |
K12, Inc.* | | | 7,472 | | | | 136,588 | |
LifeLock, Inc.* | | | 13,700 | | | | 220,433 | |
LKQ Corp.* | | | 26,000 | | | | 858,780 | |
Select Comfort Corp.* | | | 32,200 | | | | 589,904 | |
Tilly’s, Inc., Class A* | | | 24,380 | | | | 354,973 | |
Vera Bradley, Inc.*,1 | | | 8,900 | | | | 197,135 | |
Vitamin Shoppe, Inc.* | | | 13,000 | | | | 609,830 | |
Total Consumer Discretionary | | | | | | | 5,655,165 | |
Energy - 4.8% | | | | | | | | |
Atwood Oceanics, Inc.* | | | 12,900 | | | | 685,377 | |
Carrizo Oil & Gas, Inc.* | | | 13,900 | | | | 609,376 | |
Emerald Oil, Inc.* | | | 20,310 | | | | 176,697 | |
InterOil Corp.*,1 | | | 10,500 | | | | 729,225 | |
KiOR, Inc., Class A* | | | 123,200 | | | | 287,056 | |
Matrix Service Co.* | | | 24,500 | | | | 509,355 | |
SandRidge Energy, Inc.*,1 | | | 88,000 | | | | 557,920 | |
Total Energy | | | | | | | 3,555,006 | |
Financials - 9.7% | | | | | | | | |
Allied World Assurance Co. Holdings AG | | | 10,400 | | | | 1,126,216 | |
Endurance Specialty Holdings, Ltd. | | | 12,500 | | | | 691,125 | |
Fidelity National Financial, Inc., Class A | | | 2,930 | | | | 82,480 | |
Jones Lang LaSalle, Inc. | | | 6,100 | | | | 580,720 | |
Raymond James Financial, Inc. | | | 48,400 | | | | 2,209,460 | |
RE/MAX Holdings, Inc., Class A* | | | 257 | | | | 7,247 | |
Signature Bank* | | | 10,700 | | | | 1,089,474 | |
Waddell & Reed Financial, Inc., Class A | | | 7,600 | | | | 469,300 | |
WR Berkley Corp. | | | 19,700 | | | | 865,027 | |
Total Financials | | | | | | | 7,121,049 | |
Health Care - 18.4% | | | | | | | | |
Alkermes PLC* | | | 54,800 | | | | 1,928,412 | |
Centene Corp.* | | | 14,300 | | | | 803,088 | |
Charles River Laboratories International, Inc.* | | | 18,300 | | | | 900,543 | |
Covance, Inc.* | | | 2,800 | | | | 249,928 | |
DexCom, Inc.* | | | 43,600 | | | | 1,252,628 | |
Fluidigm Corp.* | | | 1,500 | | | | 47,250 | |
Foundation Medicine, Inc.*,1 | | | 5,263 | | | | 167,785 | |
| | | | | | | | |
| | | Shares | | | Value | |
HeartWare International, Inc.* | | | 570 | | | $ | 41,359 | |
Incyte Corp., Ltd.* | | | 9,500 | | | | 370,500 | |
Insulet Corp.* | | | 15,450 | | | | 602,859 | |
Intrexon Corp.*,1 | | | 22,800 | | | | 483,360 | |
MAKO Surgical Corp.* | | | 17,510 | | | | 521,973 | |
Medicines Co., The* | | | 21,000 | | | | 712,320 | |
MEDNAX, Inc.* | | | 31,600 | | | | 3,445,032 | |
PerkinElmer, Inc. | | | 10,100 | | | | 384,204 | |
Seattle Genetics, Inc.*,1 | | | 200 | | | | 7,726 | |
Unilife Corp.* | | | 123,500 | | | | 374,205 | |
United Therapeutics Corp.* | | | 14,852 | | | | 1,314,699 | |
Total Health Care | | | | | | | 13,607,871 | |
Industrials - 27.7% | | | | | | | | |
A. O. Smith Corp. | | | 25,200 | | | | 1,301,580 | |
Advisory Board Co., The* | | | 13,900 | | | | 953,540 | |
Carlisle Cos., Inc. | | | 12,200 | | | | 886,696 | |
Chart Industries, Inc.* | | | 4,400 | | | | 472,868 | |
CLARCOR, Inc. | | | 12,300 | | | | 719,304 | |
ExOne Co., The*,1 | | | 7,900 | | | | 405,507 | |
Hub Group, Inc.,
Class A* | | | 23,000 | | | | 844,790 | |
Insperity, Inc. | | | 24,100 | | | | 931,947 | |
KAR Auction Services, Inc. | | | 33,250 | | | | 988,190 | |
MasTec, Inc.* | | | 104,700 | | | | 3,347,259 | |
Meritor, Inc.* | | | 64,300 | | | | 441,741 | |
Mine Safety Appliances Co. | | | 10,600 | | | | 510,496 | |
MRC Global, Inc.* | | | 28,064 | | | | 784,389 | |
Pall Corp. | | | 400 | | | | 32,208 | |
Primoris Services Corp. | | | 18,900 | | | | 492,156 | |
Quanta Services, Inc.* | | | 26,800 | | | | 809,628 | |
RPX Corp.* | | | 37,000 | | | | 660,820 | |
Terex Corp.* | | | 14,700 | | | | 513,765 | |
UTi Worldwide, Inc. | | | 7,900 | | | | 120,080 | |
WABCO Holdings, Inc.* | | | 19,800 | | | | 1,696,464 | |
Waste Connections, Inc. | | | 3,500 | | | | 149,590 | |
Watsco, Inc. | | | 20,800 | | | | 1,982,032 | |
WESCO International, Inc.* | | | 16,000 | | | | 1,367,360 | |
Total Industrials | | | | | | | 20,412,410 | |
Information Technology - 23.9% | | | | | | | | |
Active Network, Inc., The* | | | 45,000 | | | | 649,800 | |
Advanced Energy Industries, Inc.* | | | 13,500 | | | | 281,880 | |
Atmel Corp.* | | | 75,800 | | | | 551,824 | |
Belden, Inc. | | | 25,300 | | | | 1,701,678 | |
Blackhawk Network Holdings, Inc.* | | | 12,810 | | | | 292,837 | |
The accompanying notes are an integral part of these financial statements.
8
Managers Frontier Small Cap Growth Fund
Schedule of Portfolio Investments (continued)
| | | | | | | | |
| | | Shares | | | Value | |
Information Technology - 23.9% (continued) | | | | | | | | |
Cadence Design Systems, Inc.* | | | 45,200 | | | $ | 586,244 | |
Callidus Software, Inc.* | | | 23,700 | | | | 245,295 | |
Ellie Mae, Inc.* | | | 26,700 | | | | 771,630 | |
Envestnet, Inc.* | | | 17,000 | | | | 617,100 | |
FireEye, Inc.* | | | 198 | | | | 7,494 | |
Fleetmatics Group PLC* | | | 12,800 | | | | 406,400 | |
FLIR Systems, Inc. | | | 10,800 | | | | 307,584 | |
Fortinet, Inc.* | | | 28,800 | | | | 579,168 | |
Guidewire Software, Inc.* | | | 5,300 | | | | 268,816 | |
Heartland Payment Systems, Inc.1 | | | 18,700 | | | | 756,415 | |
Ingram Micro, Inc.,
Class A* | | | 7,800 | | | | 180,726 | |
Jabil Circuit, Inc. | | | 36,900 | | | | 769,734 | |
Jack Henry & Associates, Inc. | | | 17,500 | | | | 955,675 | |
Kulicke & Soffa Industries, Inc.* | | | 42,500 | | | | 548,250 | |
Microsemi Corp.* | | | 21,300 | | | | 535,269 | |
Monolithic Power Systems, Inc. | | | 6,200 | | | | 197,408 | |
Move, Inc.* | | | 16,200 | | | | 274,914 | |
Pandora Media, Inc.*,1 | | | 15,800 | | | | 397,054 | |
QuinStreet, Inc.* | | | 54,800 | | | | 487,172 | |
RealPage, Inc.*,1 | | | 12,600 | | | | 309,078 | |
Synchronoss Technologies, Inc.* | | | 25,900 | | | | 896,658 | |
Tangoe, Inc.* | | | 18,600 | | | | 355,260 | |
Tessera Technologies, Inc. | | | 63,120 | | | | 1,200,542 | |
Virtusa Corp.* | | | 20,900 | | | | 649,572 | |
Web.com Group, Inc.* | | | 36,990 | | | | 996,881 | |
WEX, Inc.* | | | 7,500 | | | | 700,125 | |
Yelp, Inc.* | | | 2,000 | | | | 135,500 | |
Total Information Technology | | | | | | | 17,613,983 | |
Materials - 3.2% | | | | | | | | |
Albemarle Corp. | | | 3,900 | | | | 258,141 | |
CaesarStone Sdot Yam, Ltd.* | | | 14,300 | | | | 603,031 | |
Eagle Materials, Inc. | | | 7,600 | | | | 570,076 | |
Globe Specialty Metals, Inc. | | | 36,700 | | | | 643,718 | |
RTI International Metals, Inc.* | | | 8,300 | | | | 281,370 | |
Total Materials | | | | | | | 2,356,336 | |
Telecommunication
Services - 3.1% | | | | | | | | |
Cogent Communications Group, Inc. | | | 48,000 | | | | 1,686,240 | |
NII Holdings, Inc.*,1 | | | 109,700 | | | | 377,368 | |
Premiere Global Services, Inc.* | | | 25,800 | | | | 232,458 | |
Total Telecommunication Services | | | | | | | 2,296,066 | |
Total Common Stocks
(cost $49,942,925) | | | | | | | 72,617,886 | |
| | | | | | | | |
| | | Principal
Amount | | | Value | |
Short-Term
Investments - 6.0% | | | | | | | | |
Repurchase
Agreements - 4.3%2 | | | | | | | | |
Citigroup Global Markets, Inc., dated 10/31/13, due 11/01/13, 0.110%, total to be received $1,000,003 (collateralized by various U.S. Government Agency Obligations, 1.625% - 7.000%, 01/01/14 - 10/01/43, totaling $1,020,000) | | $ | 1,000,000 | | | $ | 1,000,000 | |
Deutsche Bank Securities, Inc., dated 10/31/13, due 11/01/13, 0.120%, total to be received $1,000,003 (collateralized by various U.S. Government Agency Obligations, 2.000% - 7.000%, 07/01/25 - 11/01/47, totaling $1,020,000) | | | 1,000,000 | | | | 1,000,000 | |
Merrill Lynch, Pierce, Fenner & Smith, Inc., dated 10/31/13, due 11/01/13, 0.100%, total to be received $1,000,003 (collateralized by various U.S. Government Agency Obligations, 3.000% - 3.500%, 09/20/42 - 05/20/43, totaling $1,020,000) | | | 1,000,000 | | | | 1,000,000 | |
Nomura Securities, dated 10/31/13, due 11/01/13, 0.100%, total to be received $186,445 (collateralized by various U.S. Government Agency Obligations, 0.125% - 3.875%, 04/15/14 - 02/15/43, totaling $190,173) | | | 186,444 | | | | 186,444 | |
Total Repurchase Agreements | | | | | | | 3,186,444 | |
| | | Shares | | | | |
Other Investment
Companies - 1.7%3 | | | | | | | | |
Dreyfus Institutional Cash Advantage Fund, Institutional Class Shares, 0.06% | | | 1,263,666 | | | | 1,263,666 | |
Total Short-Term Investments
(cost $4,450,110) | | | | | | | 4,450,110 | |
Total Investments - 104.5%
(cost $54,393,035) | | | | | | | 77,067,996 | |
Other Assets, less
Liabilities - (4.5)% | | | | | | | (3,312,180 | ) |
Net Assets - 100.0% | | | | | | $ | 73,755,816 | |
|
The accompanying notes are an integral part of these financial statements. 9 |
Managers AMG TSCM Growth Equity Fund
Portfolio Manager’s Comments
The Managers AMG TSCM Growth Equity Fund (the “Fund”) seeks to achieve long-term capital appreciation by investing in the stocks of large-, mid- and small-capitalization companies.
The Portfolio Manager
TimesSquare Capital Management, LLC (“TimesSquare”), the Fund’s subadvisor, utilizes a bottom-up fundamental approach to all-cap investing. Led by co-managers Kenneth Duca, Tony Rosenthal and Grant Babyak, the investment team at TimesSquare believes its proprietary fundamental research skills, which place a particular emphasis on the assessment of management quality and an in-depth understanding of superior business models, enable the team to build a diversified portfolio of large-cap, mid-cap and small-cap growth stocks designed to generate good risk-adjusted returns. When selecting growth stocks, Fund management utilizes a fundamental, bottom-up process to identify companies that demonstrate consistent and sustainable revenue and earnings growth, offer distinct and sustainable competitive advantages, have strong, experienced management teams, have stocks selling at reasonable valuations and that Fund management believes have the potential to appreciate in price by 25 to 50% within the next 12 to 18 months.
The Period in Review
For the fiscal year ended October 31, 2013, the Managers AMG TSCM Growth Equity Fund (Institutional Class Shares) returned 30.92%, outperforming the Russell 3000® Growth Index, which returned 29.16%.
The U.S. equity markets in 2012 witnessed strong double-digit returns for all of the major size and style indices in the 16% to 18% range. Unemployment fell from 8.5% to 7.8%, home prices steadily rose throughout the year, annual automotive sales reached its highest level in five years, and inflation declined from over 3% to under 2%. Meanwhile, the Federal Reserve maintained its zero interest rate policy and national elections decisively maintained the status quo in terms of the President as well as majorities in both the House and Senate. By one extent, 2012 did not officially come to a close until January 2, 2013, when the U.S. government finally reached some measure of accommodation on the “fiscal cliff” - an issue that weighed on the economy for the latter part of 2012 - and passed the American Taxpayer Relief Act of 2012.
The U.S. equity markets then logged three straight months of positive performance, resulting in significant returns for the first quarter of 2013. While the broader economy improved slightly, each positive data point seemed to have an associated caveat. The most recent quarterly report of GDP growth, the third and final “estimate,” nudged the rate from slightly negative to slightly positive, but still only a rounding error away from zero. Unemployment edged down to 7.6%, a level not seen since 2008, but that drop was also a function of labor force participation decreasing to 63.3%, the lowest workforce rate since 1979, and jobless claims were greater than expected. With a flurry of mixed signals, it was not surprising that measures of consumer confidence and sentiment fell sharply, even though the major stock market indices reached record high levels.
Containing positive and negative months, the second quarter ended with the U.S. equity markets gaining an average of 3%. Microcaps
had the strongest showing as smaller stocks generally performed better than their larger siblings. There were few consistent patterns among the returns for small to mid cap growth stocks, though lower quality - as defined by return on equity quintiles - outperformed, higher risk- as defined by beta - lagged, and the consumer-oriented segments led other areas of the economy. The various macroeconomic currents mirrored those results. Measures of consumer sentiment and confidence improved to levels not seen since prior to the 2008 recession. Meanwhile, the Euro Zone experienced its sixth straight quarter of recession, pointing to the global fragility of a sustained economic recovery. A lack of strong foundation was also evident by the “taper tantrum” toward the end of the quarter that sharply sent markets down and treasury yields up when the Federal Reserve announced a potential timetable for winding down its bond-buying program.
During the third quarter, positive U.S. equity market returns in July and September bookended a lackluster August and produced high single digit to low double digit performance across the Russell indices. As has been the case for much of the year thus far, microcaps had the strongest showing as smaller stocks performed better than their larger brethren. Two patterns were common within the returns for small to mid cap growth stocks: lower quality, as defined by return on equity, and higher risk, as defined by beta, both outperformed. The markets seemed unconcerned as the federal government approached the end of its fiscal year with neither a budget nor a short-term continuing resolution. Investors likely held out the hope - later dashed - that another last minute agreement would be reached to avoid a government shutdown. Measures of consumer confidence and sentiment dipped sharply from their recent upward trajectories, and not unexpectedly, the forward-looking metrics were the weakest components.
Towards the end of the period, October’s spotlight fell on the 16-day federal government shutdown that began the month and continued to ripple through the economy after its end. While a détente was achieved in Washington D.C., those measures merely continued government operations until mid-January 2014 and suspended the federal debt limit until mid-February. Such a temporary fix - as well as the shutdown itself - weighed on measures of consumer confidence and sentiment, sending both down sharply. Reversing the dominant trend in the U.S. equity markets thus far in 2013, during October, larger market capitalization stocks and value stocks performed better than their smaller and growth counterparts. All segments posted positive returns, and the overall U.S. market had a 4% return for the month.
The Portfolio outperformed the Russell 3000® Growth Index on a relative basis during the period. Stock selection had a strong net positive effect and drove our outperformance; in general, our investments in technology, consumer staples, producer durables, financial services, consumer discretionary, and materials & processing outpaced their counterparts in the index, while holdings in health care and energy lagged. Sector allocation also had a net positive effect although we continue to build our concentrated all cap growth portfolio from the bottom-up.
Within the consumer discretionary sector, Starbucks Corp. (“Starbucks”), the premier roaster, marketer and retailer of specialty coffee, perked up 79%. During the second quarter, there was a
10
Managers AMG TSCM Growth Equity Fund
Portfolio Manager’s Comments (continued)
significant improvement in gross margins as falling coffee prices began to be reflected, which should provide an advantage for the next several quarters. Starbuck’s CEO was also excited about the sales launch in China of packaged coffee. Starbucks later posted fiscal fourth quarter results with earnings surpassing consensus estimates. Higher revenue was driven by improved same store sales and the addition of 415 net new stores. Starbucks announced the acquisition of Teavana Holdings Inc., which sells high-end, loose-leaf teas and has locations in approximately 300 shopping malls. Starbucks has also benefitted from new products, such as its La Boulange bakery offerings and continued international expansion. Virgin Media Inc. supplies broadband internet, television, mobile telephony and fixed line telephone services to residential and commercial customers throughout the United Kingdom. We closed our position in the second quarter after Liberty Global announced its agreement to acquire Virgin Media in a stock and cash deal. Virgin Media’s shares gained 49% during the time we held the stock during the period. Coach, Inc. (“Coach”), designs and markets premium handbags, leather goods and accessories. In the first quarter, Coach reported disappointing quarterly revenues and earnings with lackluster holiday sales in North America. We had expected that the new Legacy line would generate both sales and store traffic, but neither developed. Some competitors, however, showed significant strength. As a result, we sold our position during the same quarter and took the -11% loss on it. In the second quarter, we established a position in Hertz Global Holdings, Inc. (“Hertz”), which engages in the car and equipment rental business worldwide under its namesake brand as well as the Dollar and Thrifty brands. We believe the auto rental companies have become far more rational on pricing now that several years of consolidation have reduced eight major companies down to three. Hertz’s multiple brands expand its reach across price tiers and allow Hertz to move cars as they age down the rental scale. Hertz shares have backed up by -8% since our purchase as management reduced forward earnings guidance in the third quarter based on lower than expected rental volumes at U.S. airports; rental pricing, however, has been stronger than expected, and we added to our position. We believe that Hertz still has high earnings growth visibility and improving pricing power.
The top contributor to our returns for the period hailed from the consumer staples sector: GNC Holdings, Inc. (“GNC”), a specialty retailer of health and wellness products including vitamins, minerals, sports nutrition and diet products. With a healthy gain of 72% and as a new position in the fourth quarter of 2012, GNC reported quarterly results in the first quarter of 2013 that were in line with prior comparisons, which when adjusted for the impact of superstorm Sandy, translated to a meaningful increase. Part of that increase came from tests of a new “Gold Card” membership pricing program that drove sales increases for participating stores; GNC’s management also raised its forward guidance. In the third quarter, GNC exceeded top and bottom line estimates, driven by upside in its domestic retail operations. The new Gold Card program rollout had proven to be successful in pilot programs, as evidenced by same store sales increases, and the program would now be implemented chain-wide. Monster Beverage Corp. (“Monster”), develops and sells alternative category beverages including carbonated energy drinks, energy supplements, iced teas and fruit and coconut water juices under
brands including Monster Energy, Peace Tea and Hansen’s. Monster came into and went out of the Portfolio in the third quarter leading to a -9% decline during the time that we held the stock. Energy drink consumption had been rebounding in the U.S. despite negative publicity, and the company’s gross margins and market share were improving, but then Nielsen scanner data in September proved to be very disappointing and indicative of lower than expected revenue growth rates.
In energy, we closed our position in National Oilwell Varco, Inc. in the third quarter; the company provides equipment, supplies and components for offshore and onshore rigs used for oil and gas drilling and production. While the company posted a record quarter for bookings showing the strength of the offshore market, weakness in the onshore market negatively impacted its rig tech margins and would likely continue to keep margins under pressure. National Oilwell Varco shares ebbed by -6% during the time we held the stock.
Moving to financial services, Alliance Data Systems Corp. (“Alliance”), is a provider of data-driven and transaction-based marketing, private label credit cards and customer loyalty solutions. Alliance was credited with a 66% gain thanks to fiscal quarterly results in the second quarter that were as expected, though management slightly raised full year guidance. Alliance noted that its credit card business performed well, having won the service contract for Barneys New York, as did its Epsilon marketing operations. In the third quarter, Alliance Data issued strong quarterly results with increased guidance for future earnings; Alliance’s Private Label and Epsilon units performed well although Loyalty (Air Miles) had softer revenues. Alliance also announced during the quarter that Zales jewelry stores had become a new private label credit card client and that Dunkin’ Donuts became a new loyalty marketing client with Alliance working on the DD Perks program.
In the health care sector, Onyx Pharmaceuticals, Inc. (“Onyx”), is a biotech company focused on cancer therapies. Onyx shares soared by 64% on news that the company received and rejected an unsolicited takeover offer from Amgen, and management acknowledged interest from other parties. Onyx later agreed to a $125 per share price from Amgen, and we decided to lock in our gain and closed the position in the third quarter. Onyx’s Kyprolis drug helps Amgen’s product lineup which contains many drugs to support rather than to treat cancer patients.
We had mixed results in the technology sector. Falling -10% and as the bottom detractor to our performance, Apple, Inc. (“Apple”), designs and markets mobile communication and media devices, personal computing products, and portable digital music players and related software, services, peripherals and third-party applications. In the first quarter, Apple reported disappointing results with Mac sales significantly below expectations, while both iPhone and iPad volumes were also less than expected. Supply shortages were the main culprits for the shortfalls, although the company also provided lower-than-expected guidance for 2013. In July, Apple reported modest top and bottom line beats, although while the company shipped more iPhones than expected, the average selling price declined, indicating that users were opting for the cheaper/free iPhone 4/4S rather than paying more for the iPhone
Managers AMG TSCM Growth Equity Fund
Portfolio Manager’s Comments (continued)
5. In September, Apple issued a positive preannouncement with better than expected iPhone sales, and management indicated that revenues would come in at the high end of their guided range. Towards the end of the period, Apple announced a solid fiscal fourth quarter report with revenues and earnings coming in ahead of expectations and their pre-announced range. Postponed sales weighed on Teradata Corp. (“Teradata”), the provider of data warehousing solutions, in the second quarter. While Teradata had a technological lead in its market that was increasing, and secular demand for data environments for business intelligence and analysis was growing, corporations in general were doing what they could to delay large capital expenditures. This led to shortfalls in Teradata’s revenues and earnings, along with a reduction in forward guidance and a -35% decline. Despite Teradata management believing that U.S. demand had reached a bottom, we are reevaluating our position. Climbing 66%, ASML Holding N.V.’s (“ASML”), primary business is designing and manufacturing lithography systems; lithography is the part of the chip making process whereby a pattern is imaged into the light-sensitive material on the surface of a silicon wafer. In the second quarter, ASML reported revenue and earnings just ahead of expectations while maintaining full year guidance. Its next generation extreme ultraviolet (EUV) development was progressing, although meaningful volume production and adoption of EUV looked to be further out into the 2015/2016 timeframe. In the meantime, ASML continued to sell more of its current generation immersion systems, which commanded greater margins. The company also saw tremendous demand for its new high margin product called Yieldstar that combines several aspects of the R&D and production processes for semiconductors. Later, in the first quarter after ASML’s integration of the Cymer acquisition, management reported top and bottom line results that exceeded expectations as bookings showed solid improvement. ASML also raised full year revenue guidance reflecting stronger demand from the DRAM industry, and the long term thesis surrounding ASML’s opportunity with Extreme Ultraviolet (EUV) lithography technology remains intact as more EUV units will be shipped over the next few years. Google Inc. (“Google”), a global technology company that builds products and services focused on improving the ways people connect with information. In the first quarter, Google reported solid quarterly results that showed its core search and advertising operations were growing steadily and significantly. That the company could continue at such a pace despite its ever-increasing size was a testament to Google’s yet untapped opportunities and dominant competitive position. Management later reported second quarter revenue and earnings that missed consensus estimates with weakness in core business revenue growth and a decline in cost-per-
click (CPC) rates. We still believe that Google is the highest quality mega-cap technology name, and with the Android operating system dominating market share on the smartphone platform, Google is the default search provider on every Android smartphone that ships. Google shares rose by 52%. We initiated a position in WNS Holdings Limited (“WNS”), a global business process outsourcing (BPO) company focused on providing data, voice, and analytical services primarily to the travel, insurance, banking, manufacturing, and retail industries, during the third quarter. WNS reported solid quarterly results, beating revenue estimates and raising earnings guidance for 2014 with a strong deal pipeline; positive contributors included two new large deals in Europe, several deals in the U.S. and a weaker Rupee. WNS shares have soared by 76% since our purchase.
With concerns surrounding the federal budget and debt ceiling pushed into 2014, higher-than-expected recent GDP growth of 2.8%, and likely a smooth transition for the Federal Reserve chair, the markets seem poised to continue their climb. Questions remain regarding the breadth and strength of the underlying economic growth and the timing of the looming taper of the Fed’s quantitative easing. From our bottom-up perspective, company fundamentals vary widely as do their relationships with their market valuations, so our disciplined investment process remains focused on the growth of the former and the appropriateness of the latter.
This commentary reflects the viewpoints of the portfolio manager, TimesSquare Capital Management, as of October 31, 2013 and is not intended as a forecast or guarantee of future results, and is subject to change without notice.
CUMULATIVE TOTAL RETURN PERFORMANCE
Managers AMG TSCM Growth Equity Fund’s cumulative total return is based on the daily change in net asset value (NAV), and assumes that all dividends and distributions were reinvested. This chart compares a hypothetical $10,000 investment made in Managers AMG TSCM Growth Equity Fund’s Institutional Class on July 30, 2010 (commencement of operations) to a $10,000 investment made in the Russell 3000® Growth Index for the same time period. Performance for periods longer than one year is annualized. The graph and table do not reflect the deduction of taxes that a shareholder would pay on a Fund distribution or redemption of shares. The listed returns for the Fund are net of expenses and the returns for the index exclude expenses. Past performance is not indicative of future results. Total returns would have been lower had certain expenses not been reduced.
12
Managers AMG TSCM Growth Equity Fund
Portfolio Manager’s Comments (continued)
CUMULATIVE TOTAL RETURN PERFORMANCE (continued)
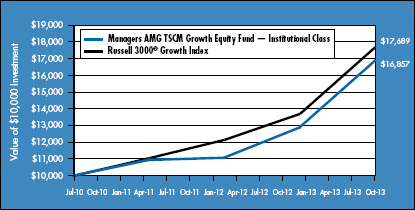
The table below shows the average annual total returns for the Managers AMG TSCM Growth Equity Fund and the Russell 3000® Growth Index for the same time periods ended October 31, 2013.
| | | | | | | | | | | | |
| | | Average Annual Total Returns1 | |
| | | One Year | | | Since Inception | | | Inception Date | |
Managers AMG TSCM Growth Equity Fund2,3,4,5,6 | |
| | | |
Investor Class | | | 30.41 | % | | | 16.91 | % | | | 07/30/10 | |
| | | |
Service Class | | | 30.88 | % | | | 17.40 | % | | | 07/30/10 | |
| | | |
Institutional Class | | | 30.92 | % | | | 17.40 | % | | | 07/30/10 | |
| | | |
Russell 3000® Growth Index7 | | | 29.16 | % | | | 19.17 | % | | | 07/30/10 | † |
The performance data shown represents past performance. Past performance is not a guarantee of future results. Current performance may be lower or higher than the performance data quoted. The investment return and principal value of an investment in the Fund will fluctuate so that an investor’s shares, when redeemed, may be worth more or less than their original cost. For performance information through the most recent month end, please call (800) 835-3879 or visit our Web site at www.managersinvest.com. Current net asset values per share for each Fund are available on the Funds’ Web site at www.managersinvest.com.
Investors should carefully consider the Fund’s investment objectives, risks, charges and expenses before investing. For this and other information, please call (800) 835-3879 or visit our Web site at www.managersinvest.com for a free prospectus. Read it carefully before investing or sending money. Funds are distributed by Managers Distributors, Inc., member FINRA.
| † | The date reflects the inception date of the Fund, not the index. |
| | |
| 1 | | Total return equals income yield plus share price change and assumes reinvestment of all dividends and capital gain distributions. Returns are net of fees and may reflect offsets of Fund expenses as described in the Prospectus. No adjustment has been made for taxes payable by shareholders on their reinvested dividends and capital gain distributions. Returns for periods greater than one year are annualized. The listed returns on the Fund are net of expenses and based on the published NAV as of October 31, 2013. All returns are in U.S. dollars ($). |
| 2 | | From time to time, the Fund’s advisor has waived its fees and/or absorbed Fund expenses, which has resulted in higher returns. |
| 3 | | The Fund invests in growth stocks, which may be more sensitive to market movements because their prices tend to reflect future investor expectations rather than just current profits. Growth stocks may underperform value stocks during given periods. |
| 4 | | The Fund invests in large-capitalization companies that may underperform other stock funds (such as funds that focus on small- and medium-capitalization companies) when stocks of large-capitalization companies are out of favor. The Fund is subject to risks associated with small- and mid-capitalization companies, such as erratic earnings patterns, competitive conditions, limited earnings history, and a reliance on one or a limited number of products. |
| 5 | | A greater percentage of the Fund’s holdings may be focused in a smaller number of securities which may place the Fund at greater risk than a more diversified fund. |
| 6 | | Investing in public offerings (IPOs) is risky and the prices of stocks purchased in IPOs tend to fluctuate more widely than stocks of companies that have been publicly traded for a longer period of time. Stocks purchased in IPOs generally do not have a trading history, and information about the companies may be available for very limited periods. |
| 7 | | The Russell 3000® Growth Index measures the performance of those Russell 3000® Index companies with higher price-to-book ratios and higher forecasted growth values. Unlike the Fund, the Russell 3000® Growth Index is unmanaged, is not available for investment, and does not incur expenses. |
|
The Russell 3000® Growth Index is a registered trademark of Russell Investments. Russell® is a trademark of Russell Investments. Not FDIC insured, nor bank guaranteed. May lose value. |
13
Managers AMG TSCM Growth Equity Fund
Fund Snapshots
October 31, 2013
Portfolio Breakdown (unaudited)
| | | | | | | | |
Industry | | Managers AMG
TSCM Growth
Equity Fund** | | | Russell 3000®
Growth Index | |
Information Technology | | | 27.2 | % | | | 26.3 | % |
Consumer Discretionary | | | 20.2 | % | | | 19.7 | % |
Industrials | | | 17.1 | % | | | 12.4 | % |
Health Care | | | 13.4 | % | | | 12.8 | % |
Financials | | | 8.7 | % | | | 5.5 | % |
Energy | | | 4.6 | % | | | 4.8 | % |
Materials | | | 4.4 | % | | | 4.5 | % |
Consumer Staples | | | 3.0 | % | | | 11.8 | % |
Telecommunication Services | | | 0.0 | % | | | 2.0 | % |
Utilities | | | 0.0 | % | | | 0.2 | % |
Other Assets and Liabilities | | | 1.4 | % | | | 0.0 | % |
| ** | As a percentage of net assets. |
Top Ten Holdings (unaudited)
| | | | |
Security Name | | % of
Net Assets | |
Google, Inc., Class A* | | | 4.6 | % |
GNC Holdings, Inc., Class A* | | | 3.6 | |
Alliance Data Systems Corp. | | | 3.3 | |
American Tower Corp.* | | | 3.3 | |
priceline.com, Inc. | | | 3.3 | |
GlaxoSmithKline PLC* | | | 3.2 | |
eBay, Inc.* | | | 3.1 | |
Estee Lauder Cos. Inc., The, Class A | | | 3.0 | |
Apple, Inc.* | | | 3.0 | |
IntercontinentalExchange, Inc. | | | 2.9 | |
| | | | |
Top Ten as a Group | | | 33.3 | % |
| | | | |
| * | Top Ten Holding at April 30, 2013 |
Any sectors, industries, or securities discussed should not be perceived as investment recommendations. Mention of a specific security should not be considered a recommendation to buy or solicitation to sell that security. Specific securities mentioned in this report may have been sold from the Fund’s portfolio of investments by the time you receive this report.
14
Managers AMG TSCM Growth Equity Fund
Schedule of Portfolio Investments
October 31, 2013
| | | | | | | | |
| | | Shares | | | Value | |
Common Stocks - 98.6% | | | | | | | | |
Consumer Discretionary - 20.2% | | | | | | | | |
GNC Holdings, Inc., Class A | | | 22,560 | | | $ | 1,326,979 | |
O’Reilly Automotive, Inc.* | | | 7,945 | | | | 983,670 | |
priceline.com, Inc.* | | | 1,134 | | | | 1,195,043 | |
Ross Stores, Inc. | | | 11,130 | | | | 860,906 | |
Starbucks Corp. | | | 11,965 | | | | 969,763 | |
Walt Disney Co., The | | | 15,285 | | | | 1,048,398 | |
Wyndham Worldwide Corp. | | | 14,330 | | | | 951,512 | |
Total Consumer Discretionary | | | | | | | 7,336,271 | |
Consumer Staples - 3.0% | | | | | | | | |
Estee Lauder Cos. Inc., The, Class A | | | 15,345 | | | | 1,088,881 | |
Energy - 4.6% | | | | | | | | |
EOG Resources, Inc. | | | 4,240 | | | | 756,416 | |
Schlumberger, Ltd. | | | 9,610 | | | | 900,649 | |
Total Energy | | | | | | | 1,657,065 | |
Financials - 8.7% | | | | | | | | |
American Tower Corp. | | | 15,120 | | | | 1,199,772 | |
IntercontinentalExchange, Inc.* | | | 5,460 | | | | 1,052,306 | |
Marsh & McLennan Cos., Inc. | | | 19,910 | | | | 911,878 | |
Total Financials | | | | | | | 3,163,956 | |
Health Care - 13.4% | | | | | | | | |
Air Methods Corp. | | | 12,755 | | | | 557,649 | |
Celldex Therapeutics, Inc.* | | | 21,750 | | | | 498,293 | |
DaVita HealthCare Partners, Inc.* | | | 17,395 | | | | 977,773 | |
Envision Healthcare Holdings, Inc.* | | | 29,770 | | | | 864,818 | |
GlaxoSmithKline PLC, Sponsored ADR | | | 21,930 | | | | 1,154,176 | |
Intuitive Surgical, Inc.* | | | 2,165 | | | | 804,298 | |
Total Health Care | | | | | | | 4,857,007 | |
Industrials - 17.1% | | | | | | | | |
Clean Harbors, Inc.* | | | 14,320 | | | | 884,260 | |
Corporate Executive Board Co., The | | | 11,585 | | | | 844,547 | |
DigitalGlobe, Inc.* | | | 25,075 | | | | 797,887 | |
| | | | | | | | |
| | | Shares | | | Value | |
Hertz Global Holdings, Inc.* | | | 41,925 | | | $ | 962,598 | |
Norfolk Southern Corp. | | | 10,875 | | | | 935,467 | |
On Assignment, Inc.* | | | 25,865 | | | | 873,978 | |
WABCO Holdings, Inc.* | | | 10,835 | | | | 928,343 | |
Total Industrials | | | | | | | 6,227,080 | |
Information Technology - 27.2% | | | | | | | | |
Alliance Data Systems Corp.* | | | 5,095 | | | | 1,207,821 | |
Apple, Inc. | | | 2,067 | | | | 1,079,697 | |
ASML Holding N.V. | | | 9,845 | | | | 931,731 | |
Citrix Systems, Inc.* | | | 10,725 | | | | 608,965 | |
CommVault Systems, Inc.* | | | 4,805 | | | | 375,174 | |
eBay, Inc.* | | | 21,370 | | | | 1,126,413 | |
Google, Inc., Class A* | | | 1,618 | | | | 1,667,478 | |
MasterCard, Inc., Class A | | | 1,329 | | | | 953,026 | |
NeuStar, Inc., Class A* | | | 12,815 | | | | 588,465 | |
Teradata Corp.* | | | 11,665 | | | | 514,077 | |
WNS Holdings, Ltd., ADR* | | | 35,925 | | | | 807,953 | |
Total Information Technology | | | | | | | 9,860,800 | |
Materials - 4.4% | | | | | | | | |
Ecolab, Inc. | | | 8,360 | | | | 886,160 | |
PolyOne Corp. | | | 23,470 | | | | 711,141 | |
Total Materials | | | | | | | 1,597,301 | |
Total Common Stocks
(cost $28,919,596) | | | | | | | 35,788,361 | |
Other Investment Companies - 0.9%3 | | | | | | | | |
Dreyfus Institutional Cash Advantage
Fund, Institutional Class Shares, 0.06%
(cost $327,417) | | | 327,417 | | | | 327,417 | |
Total Investments - 99.5%
(cost $29,247,013) | | | | | | | 36,115,778 | |
Other Assets, less Liabilities - 0.5% | | | | | | | 175,825 | |
Net Assets - 100.0% | | | | | | $ | 36,291,603 | |
|
The accompanying notes are an integral part of these financial statements. 15 |
Managers Micro-Cap Fund
Portfolio Manager’s Comments
The Managers Micro-Cap Fund primarily invests in the stocks of U.S. micro-capitalization companies. Normally the Fund will invest at least 80% of its net assets in U.S. micro-cap stocks. The Fund employs multiple portfolio managers who specialize in distinct investment approaches. This “intelligence diversification” not only serves to manage risk, but also seeks to incorporate into the Portfolio the breadth of the micro-cap market by focusing different analytical insights on micro-cap investing. The Fund’s team of subadvisors strives to achieve this performance and diversification while ensuring that the Fund operates within the framework of its investment objective and principal investment strategies. The Russell Microcap® Index is the benchmark for the Fund.
The Portfolio Managers
Lord, Abbett & Co., LLC (“Lord Abbett”)
The team focuses its stock selection effort on companies that have revenue growth of at least 15%, are experiencing year-to-year operating margin improvement, and are experiencing earnings growth that is driven by top-line growth rather than being driven by one-time events or simple cost-cutting measures. The focus is also on identifying companies with higher-quality balance sheets (often captured by finding companies with manageable debt-to-total-capital ratios) and that are already profitable. Once this process is completed, the focus for the team is on forecasting both revenue and earnings growth over the next several years. To achieve this goal, and to find companies that are expected to grow faster than their industry average, members of the team spend an extensive amount of time understanding the competitive advantages of a firm, the industry dynamics within which they operate, and the strength of management.
The sell discipline is enacted if there is a fundamental change in the business, a more attractive alternative is found, or if a holding reaches a 5% weight in the overall Portfolio. The Lord Abbett Portfolio typically holds between 75 and 100 stocks with no individual holding typically exceeding 5%. There is a risk constraint that prevents any individual industry from being greater than 25% of the total portfolio weight. The annual turnover of the Portfolio is expected to be relatively high although there is no explicit target as part of either the stock selection or the portfolio-construction process.
Next Century Growth Investors, LLC (“Next Century”)
The team requires historical revenue growth of at least 15% for a company before conducting further research. Other key factors considered initially by the team are strong historical revenue growth, low debt, and high Return On Equity (“ROE”). Quantitative screening is done on a regular basis to see which stocks over the past year are experiencing significant growth. The next stage of this process involves intensive first-hand research to determine the growth prospects of a company with the team choosing a stock only when it has become convinced a company has an extraordinary opportunity to grow their business. The uniqueness of this process lies in the fact that the team seeks out these companies regardless of their short-term prospects and\or current valuation. The team is looking for “home runs” and companies that will grow to the point that they will eventually reach a small-market capitalization.
The sell discipline is enacted if there is a change in the original investment thesis or a fundamental change in business of the company. In addition, a holding will become a candidate for sale if it reaches an extreme valuation, becomes larger than 5% of the overall Portfolio or as it approaches $1 billion in market capitalization. Typically, companies are sold out of the micro-cap Portfolio because they have approached $1 billion in market capitalization.
The Next Century portion of the Portfolio is concentrated and typically has 40-60 holdings, which can create a high level of volatility. The only risk constraints are that sector weights can not exceed two times the Russell 2000® Growth sector weights, and no individual holding can be greater than 5% of the Portfolio.
RBC Global Asset Management (U.S.) Inc. (“RBC”)
The team uses an investment process that focuses on generating solid stock selection by identifying companies with strong, long-term, attractive business fundamentals that are selling at low valuations. In order to initially generate ideas, the team at RBC uses quantitative screens and industry research to concentrate stock selection on a narrower sub-universe of micro-cap companies. The team then focuses a majority of its time on conducting intensive “on-the-ground” fundamental research in order to uncover these opportunities. The focus is on identifying companies with long-term, solid business fundamentals and near-term profitability improvement potential. In terms of short-term factors, the team looks for companies that have shown institutional investor neglect or avoidance and sizeable insider ownership with the potential for both improving profit margins and accelerating earnings in the near future. In terms of long-term factors, the team looks for companies with proven products or services that are leading in market share within their respective industries while maintaining a sustainable competitive advantage and a solid balance sheet.
The resulting portfolio that is generated by this stock selection process tends to exhibit low turnover with company stocks generally held for several years. The Portfolio is well diversified with anywhere from 60 to 90 holdings with a maximum of 5% in any single holding.
WEDGE Capital Management L.L.P. (“WEDGE”)
The investment process is a combination of both quantitative and fundamental research insights. The quantitative portion of the investment process uses commonly found factors and characteristics that can be accessed via any number of commercial databases. The value-added portion of the process, therefore, uses a number of different factors across five major categories: valuation, earnings quality, operating efficiency, capital usage and momentum, whose efficacy has
been verified via long-term regression analysis. This is referred to as the Fundamental Value model. The top results of this model are combined with the best resulting stocks from the Financial Quality model, which measures stocks across categories such as multiple earnings growth, profitability, leverage and liquidity. The top stocks that appear in both models are eligible for fundamental research. The fundamental research portion of the investment process is exclusionary in nature and meant to eliminate stocks that are not strong in earnings forecasts, valuation metrics, sector\industry outlook or any factor that can not be easily captured quantitatively.
Managers Micro-Cap Fund
Portfolio Manager’s Comments (continued)
A stock is scrutinized for possible sale if it falls below the top four deciles in the Fundamental Value model. Stocks are sold when they become fairly valued, an upgrade opportunity develops, or the original investment thesis materially deteriorates. The portion of the Portfolio managed by WEDGE is confined to plus or minus 10% in any given sector, although sector positions tend to be much closer to the Index weight than this (it should be noted that these self-imposed sector weighting constraints are based on a proprietary liquidity analysis conducted on an ongoing basis by the micro-cap team and is NOT driven by the sector weightings of any micro-cap benchmark). The final Portfolio seeks to be a well-diversified, micro-cap Portfolio holding approximately 150 securities and consistently maintaining a value bias relative to the benchmark. The Portfolio tends to hold securities within the $40 million to $400 million market capitalization range, although it does not require a sale of a holding until it reaches $800 million in market capitalization.
THE YEAR IN REVIEW
Over the past year, equities within the U.S. posted solid gains despite ongoing macroeconomic headwinds that continue to threaten what has been, thus far, a somewhat muted recovery from the 2008 and 2009 deep recession. While equities within the U.S. posted robust gains across the market capitalization spectrum, these gains were achieved in fitful spurts as the “risk on, risk off” environment, Federal Reserve policy changes, and U.S. government concerns continued to create uncertainty. Despite these risks, investors increased equity exposure as U.S. equity funds turned positive in 2013. Investors tentatively entered the fourth quarter firmly focused the Fed’s next move to potentially “taper” asset purchases and U.S. economics including unemployment and housing statistics. Against this backdrop, micro-cap equities delivered returns of 38.72%, as measured by the Russell Microcap® Index, which outpaced returns of their large-cap and small-cap brethren, which returned 28.40% and 36.28%, respectively, as measured by the Russell 1000® and Russell 2000® Indexes.
For the fiscal year ended October 31, 2013, the Managers Micro-Cap Fund (Service Class) returned 49.00%, compared with 38.72% for its benchmark, the Russell Microcap® Index. The Fund delivered robust absolute and relative returns during the year as the Fund significantly outperformed its benchmark. A majority of the outperformance was driven by the Fund’s stock selection, which was particularly strong in the information technology, energy, and health care sectors. Weak stock selection within the materials, financials, telecommunication services and industrials sectors slightly detracted from relative performance. Additionally, the Fund’s sector weights, which are primarily a residual of the stock selection process for each of the Fund’s subadvisors, also contributed to outperformance. The Funds overweights within financials and consumer discretionary sectors benefitted relative performance, but were partially offset by the underperformance of the cash position.
At the subadvisor level, all four subadvisors outperformed the Russell Microcap® Index led by significant outperformance from
Lord, Abbett and Company, LLC (“Lord Abbett”) and Next Century Growth Investors LLC (Next Century), with contributions from Wedge Capital Management, LLP (“Wedge”) and RBC Global Asset Management (U.S.) Inc (“RBC”). Both Lord Abbett’s and Next Century’s aggressive growth styles benefitted from robust stock selection in the high-growth information technology and energy sectors, partially offset by weak stock selection in the financials sector. RBC’s core growth process also produced strong stock selection within the same two sectors despite relative underperformance of holdings in the materials and health care sector. Additionally, Lord Abbett contributed to the Fund’s relative outperformance with robust stock selection in the health care sector. Wedge’s quantitative process produced strong stock selection within consumer discretionary, industrials and information technology sectors, partially offset by the relative underperformance of an underweight to the health care sector and an overweight to the materials sector.
Looking Forward
The portfolio managers are cautiously optimistic about forward-looking prospects for micro-cap equities. The portfolio managers believe that each of their respective investment processes, focused on finding companies with solid secular growth prospects, have the potential to perform well if investors focus on company fundamentals and less so on uncertainties related to Federal Reserve policy or other macro risks. The Fund generally remains positioned for ongoing economic recovery with overweights in economically sensitive information technology, industrials and consumer discretionary sectors. The portfolio managers continue to avoid financials with a large underweight (15%) to this sector relative to the benchmark.
This commentary reflects the viewpoints of the portfolio managers, Lord, Abbett & Co., LLC, Next Century Growth Investors, LLC, RBC Global Asset Management (U.S.) Inc. and WEDGE Capital Management L.L.P., as of October 31, 2013 and is not intended as a forecast or guarantee of future results, and is subject to change without notice.
CUMULATIVE TOTAL RETURN PERFORMANCE
Managers Micro-Cap Fund’s (Service) cumulative total return is based on the daily change in net asset value (NAV), and assumes that all distributions were reinvested. This chart compares a hypothetical $10,000 investment made in the Managers Micro-Cap Fund’s Service Class on October 31, 2003 to a $10,000 investment made in the Russell 2000® Growth Index and the Russell Microcap® Index for the same time period. Performance for periods longer than one year is annualized. The graph and table do not reflect the deduction of taxes that a shareholder would pay on a Fund distribution or redemption of shares. The listed returns for the Fund are net of expenses and the returns for the index exclude expenses. Past performance is not indicative of future results. Total returns would have been lower had certain expenses not been reduced
Managers Micro-Cap Fund
Portfolio Manager’s Comments (continued)
CUMULATIVE TOTAL RETURN PERFORMANCE (continued)
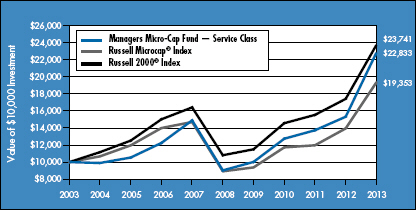
The table below shows the average annual total returns for the Managers Micro-Cap Fund and the Russell Microcap® and Russell 2000® Indices for the same time periods ended October 31, 2013.
| | | | | | | | | | | | | | | | | | | | |
| | | Average Annual Total Returns1 | |
| | | One
Year | | | Five
Years | | | Ten
Years | | | Since
Inception | | | Inception
Date | |
Managers Micro-Cap Fund2,3 | | | | | | | | | | | | | | | | | | | | |
Service Class | | | 49.00 | % | | | 20.39 | % | | | 8.61 | % | | | 13.98 | % | | | 06/30/94 | |
Institutional Class | | | 49.36 | % | | | — | | | | — | | | | 37.50 | % | | | 10/01/11 | |
Russell Microcap® Index5 | | | 38.72 | % | | | 16.74 | % | | | 6.83 | % | | | — | 4 | | | 06/30/00 | |
Russell 2000® Index6 | | | 36.28 | % | | | 17.04 | % | | | 9.03 | % | | | 9.65 | % | | | 06/30/94 | † |
The performance data shown represents past performance. Past performance is not a guarantee of future results. Current performance may be lower or higher than the performance data quoted. The investment return and principal value of an investment in the Fund will fluctuate so that an investor’s shares, when redeemed, may be worth more or less than their original cost. For performance information through the most recent month end, please call (800) 835-3879 or visit our Web site at www.managersinvest.com. Current net asset values per share for each Fund are available on the Funds’ Web site at www.managersinvest.com.
Investors should carefully consider the Fund’s investment objectives, risks, charges and expenses before investing. For this and other information, please call (800) 835-3879 or visit our Web site at www.managersinvest.com for a free prospectus. Read it carefully before investing or sending money. Funds are distributed by Managers Distributors, Inc., member FINRA.
| † | The date reflects the inception date of the Fund, not the index. |
| | | | |
| | | 1 | | Total return equals income yield plus share price change and assumes reinvestment of all dividends and capital gain distributions. Returns are net of fees and may reflect offsets of Fund expenses as described in the Prospectus. No adjustment has been made for taxes payable by shareholders on their reinvested dividends and capital gain distributions. Returns for periods greater than one year are annualized. The listed returns on the Fund are net of expenses and based on the published NAV as of October 31, 2013. All returns are in U.S. dollars ($). |
| | | 2 | | From time to time, the Fund’s advisor has waived its fees and/or absorbed Fund expenses, which has resulted in higher returns. |
| | | 3 | | The Fund is subject to the special risks associated with investments in micro-cap companies, such as relatively short earnings histories, competitive conditions, less publicly available corporate information, and reliance on a limited number of products. |
| | | 4 | | Since the Russell Microcap® Index’s inception date of June 30, 2000, the average annual return for the index was 7.39%. |
| | | 5 | | The Russell Microcap® Index tracks the micro-cap segment of the U.S. equity market. It makes up less than 3% of the U.S. equity market and is represented by the smallest 1,000 securities in the small-cap Russell 2000® Index plus the next 1,000 securities. Unlike the Fund, the Russell Microcap® Index is unmanaged, not available for investment, and does not incur expenses. |
| | | 6 | | The Russell 2000® Index is composed of the 2,000 smallest stocks in the Russell 3000® Index and is widely regarded in the industry as the premier measure of small-cap stock performance. Unlike the Fund, the Russell 2000® Index is unmanaged, is not available for investment, and does not incur expenses. |
| | |
| | | The Russell Microcap® Index and the Russell 2000® Index are trademarks of Russell Investments. Russell® is a trademark of Russell Investments. |
| | |
| | | Not FDIC insured, nor bank guaranteed. May lose value. |
Managers Micro-Cap Fund
Fund Snapshots
October 31, 2013
Portfolio Breakdown (unaudited)
| | | | | | | | | | | | |
Industry | | Managers
Micro-Cap
Fund** | | | Russell
Microcap®
Index | | | Russell 2000®
Index | |
Information Technology | | | 23.4 | % | | | 16.6 | % | | | 17.7 | % |
Industrials | | | 17.8 | % | | | 13.8 | % | | | 14.6 | % |
Consumer Discretionary | | | 16.0 | % | | | 12.6 | % | | | 13.8 | % |
Health Care | | | 12.5 | % | | | 16.0 | % | | | 12.6 | % |
Financials | | | 12.2 | % | | | 27.4 | % | | | 22.7 | % |
Energy | | | 4.6 | % | | | 4.3 | % | | | 5.9 | % |
Consumer Staples | | | 3.6 | % | | | 3.0 | % | | | 4.0 | % |
Materials | | | 3.4 | % | | | 2.9 | % | | | 4.8 | % |
Telecommunication Services | | | 1.4 | % | | | 2.3 | % | | | 0.8 | % |
Utilities | | | 0.5 | % | | | 1.1 | % | | | 3.1 | % |
Other Assets and Liabilities | | | 4.6 | % | | | 0.0 | % | | | 0.0 | % |
| ** | As a percentage of net assets. |
Top Ten Holdings (unaudited)
| | | | |
Security Name | | %of
Net Assets | |
Tyler Technologies, Inc.* | | | 1.3 | % |
Universal Electronics, Inc.* | | | 1.3 | |
Fluidigm Corp. | | | 1.3 | |
Columbus McKinnon Corp.* | | | 1.1 | �� |
Power Solutions International, Inc. | | | 1.0 | |
Interactive Intelligence Group, Inc.* | | | 1.0 | |
RigNet, Inc. | | | 0.9 | |
Encore Capital Group, Inc. | | | 0.9 | |
Gulfport Energy Corp.* | | | 0.9 | |
Compass Diversified Holdings | | | 0.9 | |
| | | | |
Top Ten as a Group | | | 10.6 | % |
| | | | |
| * | Top Ten Holding at April 30, 2013 |
Any sectors, industries, or securities discussed should not be perceived as investment recommendations. Mention of a specific security should not be considered a recommendation to buy or solicitation to sell that security. Specific securities mentioned in this report may have been sold from the Fund’s portfolio of investments by the time you receive this report.
19
Managers Micro-Cap Fund
Schedule of Portfolio Investments
October 31, 2013
| | | | | | | | |
| | | Shares | | | Value | |
Common Stocks - 95.4% | | | | | | | | |
Consumer Discretionary - 16.0% | | | | | |
1-800-Flowers.com, Inc., Class A* | | | 50,800 | | | $ | 275,844 | |
Arctic Cat, Inc. | | | 5,126 | | | | 268,602 | |
Big 5 Sporting Goods Corp. | | | 15,000 | | | | 283,650 | |
Black Diamond, Inc.* | | | 24,385 | | | | 363,580 | |
Bravo Brio Restaurant Group, Inc.* | | | 24,700 | | | | 368,771 | |
Bridgepoint Education, Inc.* | | | 73,400 | | | | 1,438,640 | |
Chuy’s Holdings, Inc.* | | | 43,906 | | | | 1,650,865 | |
Core-Mark Holding Co., Inc. | | | 5,533 | | | | 391,349 | |
Culp, Inc. | | | 12,500 | | | | 241,875 | |
Delta Apparel, Inc.* | | | 49,300 | | | | 931,770 | |
Destination Maternity Corp. | | | 37,585 | | | | 1,174,155 | |
Destination XL Group, Inc.* | | | 197,720 | | | | 1,374,154 | |
Diversified Restaurant Holdings, Inc.* | | | 52,122 | | | | 360,163 | |
Einstein Noah Restaurant Group, Inc. | | | 28,600 | | | | 510,224 | |
Entravision Communications Corp., Class A | | | 98,872 | | | | 666,397 | |
Famous Dave’s of America, Inc.* | | | 7,225 | | | | 130,411 | |
Fiesta Restaurant Group, Inc.* | | | 29,749 | | | | 1,261,060 | |
Frisch’s Restaurants, Inc. | | | 5,600 | | | | 134,792 | |
G-III Apparel Group, Ltd.* | | | 10,111 | | | | 573,496 | |
Gordmans Stores, Inc. | | | 10,500 | | | | 103,950 | |
Grand Canyon Education, Inc.* | | | 31,300 | | | | 1,479,551 | |
Harte-Hanks, Inc. | | | 27,200 | | | | 216,784 | |
Haverty Furniture Cos., Inc. | | | 9,650 | | | | 268,366 | |
Hooker Furniture Corp. | | | 15,885 | | | | 250,983 | |
iRobot Corp.* | | | 22,022 | | | | 745,885 | |
Johnson Outdoors, Inc., Class A | | | 4,625 | | | | 126,864 | |
Kirkland’s, Inc.* | | | 6,800 | | | | 120,700 | |
Kona Grill, Inc.* | | | 76,198 | | | | 1,046,199 | |
Libbey, Inc.* | | | 47,800 | | | | 1,020,530 | |
LifeLock, Inc.* | | | 79,195 | | | | 1,274,248 | |
Lifetime Brands, Inc. | | | 7,400 | | | | 115,884 | |
M/I Homes, Inc.* | | | 18,138 | | | | 371,285 | |
Mac-Gray Corp. | | | 33,004 | | | | 695,724 | |
Marcus Corp., The | | | 33,725 | | | | 484,291 | |
Modine Manufacturing Co.* | | | 15,900 | | | | 211,788 | |
Multimedia Games Holding Co., Inc.* | | | 9,047 | | | | 294,118 | |
Nexstar Broadcasting Group, Inc., Class A | | | 11,757 | | | | 521,893 | |
Red Robin Gourmet Burgers, Inc.* | | | 20,995 | | | | 1,599,399 | |
Rentrak Corp.* | | | 40,787 | | | | 1,529,105 | |
RG Barry Corp. | | | 68,686 | | | | 1,310,529 | |
Rocky Brands, Inc. | | | 6,425 | | | | 97,403 | |
| | | | | | | | |
| | | Shares | | | Value | |
Ruth’s Hospitality Group, Inc. | | | 30,200 | | | $ | 368,138 | |
Saga Communications, Inc., Class A | | | 2,500 | | | | 119,025 | |
Smith & Wesson Holding Corp.*,1 | | | 94,600 | | | | 1,019,788 | |
SodaStream International, Ltd.*,1 | | | 16,400 | | | | 876,908 | |
Sonic Corp.* | | | 24,775 | | | | 478,158 | |
Standard Motor Products, Inc. | | | 14,650 | | | | 529,744 | |
Stein Mart, Inc. | | | 18,100 | | | | 267,337 | |
Summer Infant, Inc.* | | | 44,700 | | | | 126,948 | |
Tower International, Inc.* | | | 6,200 | | | | 131,564 | |
Town Sports International Holdings, Inc. | | | 28,800 | | | | 372,096 | |
TRI Pointe Homes, Inc.* | | | 32,940 | | | | 524,405 | |
Unifi, Inc.* | | | 9,700 | | | | 236,583 | |
Universal Electronics, Inc.* | | | 70,600 | | | | 2,747,046 | |
West Marine, Inc.* | | | 19,600 | | | | 239,316 | |
Zagg, Inc.* | | | 93,200 | | | | 441,768 | |
Total Consumer Discretionary | | | | | | | 34,764,101 | |
Consumer Staples - 3.6% | | | | | | | | |
Annie’s, Inc.* | | | 35,281 | | | | 1,667,027 | |
Boulder Brands, Inc.* | | | 37,394 | | | | 612,888 | |
Chefs’ Warehouse, Inc., The* | | | 23,264 | | | | 557,405 | |
Craft Brew Alliance, Inc.* | | | 39,657 | | | | 643,237 | |
Fairway Group Holdings Corp.* | | | 27,474 | | | | 671,190 | |
Farmer Bros Co.* | | | 7,600 | | | | 137,256 | |
Nash Finch Co. | | | 18,300 | | | | 513,498 | |
Natural Grocers by Vitamin Cottage, Inc.*,1 | | | 39,999 | | | | 1,595,960 | |
Pantry, Inc., The* | | | 30,075 | | | | 402,704 | |
Spartan Stores, Inc. | | | 20,650 | | | | 485,895 | |
SunOpta, Inc.* | | | 50,300 | | | | 541,731 | |
Total Consumer Staples | | | | | | | 7,828,791 | |
Energy - 4.6% | | | | | | | | |
Bolt Technology Corp. | | | 6,100 | | | | 109,129 | |
Canadian Solar, Inc.*,1 | | | 25,398 | | | | 584,154 | |
Dawson Geophysical Co.* | | | 18,000 | | | | 526,320 | |
GasLog, Ltd. | | | 59,338 | | | | 882,949 | |
Geospace Technologies Corp.* | | | 15,400 | | | | 1,500,268 | |
Goodrich Petroleum Corp.* | | | 16,010 | | | | 374,474 | |
Gulf Island Fabrication, Inc. | | | 19,391 | | | | 489,041 | |
Gulfport Energy Corp.* | | | 32,600 | | | | 1,913,294 | |
Natural Gas Services Group, Inc.* | | | 8,350 | | | | 233,717 | |
Panhandle Oil and Gas, Inc., Class A | | | 8,350 | | | | 280,309 | |
Renewable Energy Group, Inc.* | | | 23,126 | | | | 252,305 | |
RigNet, Inc.* | | | 55,425 | | | | 2,042,965 | |
Synergy Resources Corp.* | | | 62,400 | | | | 646,464 | |
|
The accompanying notes are an integral part of these financial statements. 20 |
Managers Micro-Cap Fund
Schedule of Portfolio Investments (continued)
| | | | | | | | |
| | | Shares | | | Value | |
Energy - 4.6% (continued) | | | | | | | | |
TGC Industries, Inc. | | | 15,582 | | | $ | 114,838 | |
Total Energy | | | | | | | 9,950,227 | |
Financials - 12.2% | | | | | | | | |
AMERISAFE, Inc. | | | 47,175 | | | | 1,816,238 | |
Asta Funding, Inc. | | | 48,800 | | | | 418,704 | |
Banc of California, Inc. | | | 25,900 | | | | 365,449 | |
Boston Private Financial Holdings, Inc. | | | 32,100 | | | | 365,619 | |
Center Bancorp, Inc. | | | 8,000 | | | | 119,680 | |
Centerstate Banks, Inc. | | | 23,900 | | | | 235,654 | |
Chatham Lodging Trust | | | 33,700 | | | | 635,582 | |
CoBiz Financial, Inc. | | | 79,100 | | | | 858,235 | |
Community Trust Bancorp, Inc. | | | 11,761 | | | | 500,901 | |
Compass Diversified Holdings* | | | 99,200 | | | | 1,902,656 | |
Crawford & Co., Class B | | | 12,400 | | | | 136,276 | |
Diamond Hill Investment Group, Inc. | | | 2,200 | | | | 242,594 | |
Donegal Group, Inc., Class A | | | 7,500 | | | | 118,875 | |
Eagle Bancorp, Inc.* | | | 12,800 | | | | 338,560 | |
eHealth, Inc.* | | | 42,128 | | | | 1,795,495 | |
EMC Insurance Group, Inc. | | | 8,000 | | | | 272,320 | |
Encore Capital Group, Inc.*,1 | | | 40,801 | | | | 1,993,129 | |
Financial Institutions, Inc. | | | 12,375 | | | | 292,916 | |
First Defiance Financial Corp. | | | 9,700 | | | | 250,454 | |
First Merchants Corp. | | | 28,150 | | | | 529,220 | |
Flushing Financial Corp. | | | 26,250 | | | | 527,363 | |
Fortegra Financial Corp.* | | | 14,000 | | | | 103,180 | |
Heritage Financial Group, Inc. | | | 6,300 | | | | 108,234 | |
HFF, Inc., Class A | | | 31,495 | | | | 773,202 | |
Hilltop Holdings, Inc.* | | | 31,922 | | | | 553,527 | |
ICG Group, Inc.* | | | 21,845 | | | | 356,292 | |
JMP Group, Inc. | | | 18,400 | | | | 117,944 | |
Kite Realty Group Trust | | | 61,700 | | | | 394,880 | |
LaSalle Hotel Properties | | | 25,800 | | | | 801,090 | |
MainSource Financial Group, Inc. | | | 8,400 | | | | 136,248 | |
Marlin Business Services Corp. | | | 28,491 | | | | 785,497 | |
National Interstate Corp. | | | 21,400 | | | | 559,182 | |
Northrim BanCorp, Inc. | | | 34,626 | �� | | | 869,113 | |
OceanFirst Financial Corp. | | | 21,250 | | | | 373,787 | |
One Liberty Properties, Inc. | | | 11,200 | | | | 236,768 | |
Oppenheimer Holdings, Inc., Class A | | | 13,200 | | | | 261,756 | |
Orrstown Financial Services, Inc.* | | | 6,800 | | | | 113,764 | |
Pacific Continental Corp. | | | 17,600 | | | | 242,528 | |
Pinnacle Financial Partners, Inc.* | | | 24,157 | | | | 748,867 | |
Piper Jaffray Cos.* | | | 14,000 | | | | 502,460 | |
Regional Management Corp.* | | | 15,200 | | | | 486,552 | |
| | | | | | | | |
| | | Shares | | | Value | |
Silvercrest Asset Management Group, Inc., Class A* | | | 36,037 | | | $ | 532,266 | |
StellarOne Corp. | | | 16,200 | | | | 377,136 | |
SY Bancorp, Inc. | | | 16,790 | | | | 503,868 | |
Territorial Bancorp, Inc. | | | 10,925 | | | | 238,274 | |
Trico Bancshares | | | 20,700 | | | | 523,503 | |
Union First Market Bankshares Corp. | | | 20,200 | | | | 487,224 | |
Washington Banking Co. | | | 32,300 | | | | 549,423 | |
Washington Trust Bancorp, Inc. | | | 11,275 | | | | 370,835 | |
West Bancorporation, Inc. | | | 8,925 | | | | 123,344 | |
Whitestone REIT | | | 32,600 | | | | 449,554 | |
Total Financials | | | | | | | 26,396,218 | |
Health Care - 12.5% | | | | | | | | |
ABIOMED, Inc.* | | | 30,439 | | | | 729,927 | |
Albany Molecular Research, Inc.* | | | 9,300 | | | | 121,830 | |
AMN Healthcare Services, Inc.* | | | 25,000 | | | | 310,000 | |
Anika Therapeutics, Inc.* | | | 14,700 | | | | 439,089 | |
Array BioPharma, Inc.* | | | 129,908 | | | | 652,138 | |
BioScrip, Inc.* | | | 114,600 | | | | 803,346 | |
Cadence Pharmaceuticals, Inc.* | | | 48,927 | | | | 241,210 | |
Cardiovascular Systems, Inc.* | | | 40,507 | | | | 1,229,387 | |
Columbia Laboratories, Inc.*,1 | | | 54,100 | | | | 389,520 | |
Cross Country Healthcare, Inc.* | | | 38,700 | | | | 229,878 | |
Cynosure, Inc., Class A* | | | 31,095 | | | | 671,963 | |
Endologix, Inc.* | | | 68,364 | | | | 1,235,337 | |
Epizyme, Inc.*,1 | | | 11,941 | | | | 457,579 | |
Exactech, Inc.* | | | 47,000 | | | | 1,066,900 | |
ExamWorks Group, Inc.* | | | 34,459 | | | | 890,765 | |
Fluidigm Corp.* | | | 85,747 | | | | 2,701,031 | |
Foundation Medicine, Inc.*,1 | | | 17,839 | | | | 568,707 | |
Genomic Health, Inc.*,1 | | | 9,807 | | | | 293,425 | |
HealthStream, Inc.* | | | 43,806 | | | | 1,564,750 | |
Intercept Pharmaceuticals, Inc.*,1 | | | 9,840 | | | | 533,722 | |
InterMune, Inc.* | | | 20,816 | | | | 293,297 | |
IPC The Hospitalist Co., Inc.* | | | 13,828 | | | | 757,636 | |
Keryx Biopharmaceuticals, Inc.*,1 | | | 109,012 | | | | 1,128,274 | |
KYTHERA Biopharmaceuticals, Inc.* | | | 13,326 | | | | 595,805 | |
Lannett Co., Inc.* | | | 6,700 | | | | 158,187 | |
Medical Action Industries, Inc.* | | | 37,800 | | | | 229,068 | |
Meridian Bioscience, Inc. | | | 15,700 | | | | 388,104 | |
Natus Medical, Inc.* | | | 32,900 | | | | 649,117 | |
Novadaq Technologies, Inc.* | | | 37,280 | | | | 616,238 | |
Onconova Therapeutics, Inc.* | | | 20,430 | | | | 321,568 | |
Osiris Therapeutics, Inc.*,1 | | | 19,745 | | | | 262,806 | |
|
The accompanying notes are an integral part of these financial statements. 21 |
Managers Micro-Cap Fund
Schedule of Portfolio Investments (continued)
| | | | | | | | |
| | | Shares | | | Value | |
Health Care - 12.5% (continued) | | | | | | | | |
Providence Service Corp., The* | | | 4,000 | | | $ | 119,560 | |
Raptor Pharmaceutical Corp.*,1 | | | 68,817 | | | | 989,588 | |
Rockwell Medical, Inc.*,1 | | | 29,014 | | | | 334,241 | |
RTI Surgical, Inc.* | | | 63,000 | | | | 175,770 | |
Santarus, Inc.* | | | 21,510 | | | | 501,828 | |
Sarepta Therapeutics, Inc.*,1 | | | 7,623 | | | | 296,840 | |
Spectranetics Corp.* | | | 16,197 | | | | 338,355 | |
Streamline Health Solutions, Inc.* | | | 31,883 | | | | 259,846 | |
SurModics, Inc.* | | | 32,400 | | | | 763,992 | |
US Physical Therapy, Inc. | | | 47,576 | | | | 1,518,626 | |
Utah Medical Products, Inc. | | | 2,200 | | | | 122,452 | |
Verastem, Inc.* | | | 27,255 | | | | 272,550 | |
Zeltiq Aesthetics, Inc.* | | | 69,261 | | | | 898,315 | |
Total Health Care | | | | | | | 27,122,567 | |
Industrials - 17.8% | | | | | | | | |
Acacia Research Corp.1 | | | 40,400 | | | | 609,636 | |
ACCO Brands Corp.* | | | 105,400 | | | | 616,590 | |
Aceto Corp. | | | 23,500 | | | | 374,825 | |
Air Transport Services Group, Inc.* | | | 98,300 | | | | 711,692 | |
Alamo Group, Inc. | | | 10,059 | | | | 474,684 | |
Allied Defense Group, Inc., The*,4 | | | 38,600 | | | | 121,590 | |
Ameresco, Inc., Class A* | | | 12,600 | | | | 131,796 | |
American Woodmark Corp.* | | | 12,683 | | | | 430,207 | |
Apogee Enterprises, Inc. | | | 23,395 | | | | 731,796 | |
Astronics Corp.* | | | 34,654 | | | | 1,700,113 | |
Astronics Corp., Class B* | | | 1,129 | | | | 54,519 | |
AZZ, Inc. | | | 42,100 | | | | 1,890,290 | |
Barrett Business Services, Inc. | | | 3,200 | | | | 266,464 | |
Ceco Environmental Corp. | | | 16,300 | | | | 287,695 | |
Celadon Group, Inc. | | | 12,982 | | | | 240,686 | |
Chart Industries, Inc.* | | | 6,000 | | | | 644,820 | |
Columbus McKinnon Corp.* | | | 91,800 | | | | 2,387,718 | |
Consolidated Graphics, Inc.* | | | 6,700 | | | | 429,403 | |
CRA International, Inc.* | | | 18,750 | | | | 357,187 | |
Ducommun, Inc.* | | | 30,600 | | | | 760,716 | |
Dynamic Materials Corp. | | | 15,167 | | | | 335,191 | |
Echo Global Logistics, Inc.* | | | 7,887 | | | | 145,200 | |
Ennis, Inc. | | | 65,950 | | | | 1,170,613 | |
FreightCar America, Inc. | | | 24,600 | | | | 547,104 | |
Furmanite Corp.* | | | 49,300 | | | | 554,625 | |
Gibraltar Industries, Inc.* | | | 15,975 | | | | 255,760 | |
Global Power Equipment Group, Inc. | | | 11,600 | | | | 236,176 | |
GP Strategies Corp.* | | | 40,649 | | | | 1,138,985 | |
Graham Corp. | | | 23,092 | | | | 850,017 | |
| | | | | | | | |
| | | Shares | | | Value | |
Greenbrier Cos., Inc.* | | | 45,800 | | | $ | 1,215,532 | |
H&E Equipment Services, Inc.* | | | 36,835 | | | | 921,980 | |
Hudson Technologies, Inc.* | | | 75,800 | | | | 161,454 | |
Hurco Cos., Inc. | | | 6,721 | | | | 164,597 | |
Interface, Inc. | | | 49,300 | | | | 998,325 | |
KEYW Holding Corp., The* | | | 65,600 | | | | 754,400 | |
Kimball International, Inc., Class B | | | 10,800 | | | | 126,360 | |
LB Foster Co., Class A | | | 10,550 | | | | 493,213 | |
Lydall, Inc.* | | | 20,800 | | | | 378,976 | |
Marten Transport, Ltd. | | | 57,038 | | | | 1,006,142 | |
Mistras Group, Inc.* | | | 11,800 | | | | 216,648 | |
MiX Telematics, Ltd., Sponsored ADR* | | | 5,347 | | | | 69,725 | |
MYR Group, Inc.* | | | 13,800 | | | | 365,010 | |
NN, Inc. | | | 66,050 | | | | 1,062,084 | |
Old Dominion Freight Line, Inc.* | | | 17,725 | | | | 831,302 | |
Orion Marine Group, Inc.* | | | 92,525 | | | | 1,156,563 | |
Performant Financial Corp.* | | | 59,969 | | | | 597,891 | |
PGT, Inc.* | | | 149,000 | | | | 1,557,050 | |
Pike Electric Corp. | | | 23,100 | | | | 249,711 | |
Power Solutions International, Inc.* | | | 38,504 | | | | 2,243,243 | |
RBC Bearings, Inc.* | | | 7,167 | | | | 493,018 | |
Saia, Inc.* | | | 7,599 | | | | 247,195 | |
Sparton Corp.* | | | 28,600 | | | | 754,754 | |
Sun Hydraulics Corp. | | | 27,350 | | | | 1,085,248 | |
Trex Co., Inc.* | | | 14,141 | | | | 992,981 | |
US Ecology, Inc. | | | 15,871 | | | | 564,214 | |
voxeljet AG, ADR*,1 | | | 44,100 | | | | 1,502,928 | |
Total Industrials | | | | 38,666,642 | |
Information Technology - 23.4% | | | | | |
Actuate Corp.* | | | 65,238 | | | | 522,556 | |
American Software Inc., Class A | | | 41,850 | | | | 366,188 | |
Anaren, Inc.* | | | 19,025 | | | | 475,245 | |
Aspen Technology, Inc.* | | | 20,900 | | | | 799,007 | |
Bel Fuse, Inc., Class B | | | 13,900 | | | | 292,456 | |
Benefitfocus, Inc.* | | | 28,467 | | | | 1,426,197 | |
Carbonite, Inc.* | | | 45,807 | | | | 606,485 | |
ChannelAdvisor Corp.* | | | 24,063 | | | | 838,836 | |
Clearfield, Inc.* | | | 20,554 | | | | 305,021 | |
Commtouch Software, Ltd.* | | | 74,500 | | | | 199,660 | |
Computer Task Group, Inc. | | | 80,350 | | | | 1,376,395 | |
comScore, Inc.* | | | 39,404 | | | | 1,052,875 | |
Covisint Corp.* | | | 34,865 | | | | 427,794 | |
Cray, Inc.* | | | 15,887 | | | | 355,233 | |
CTS Corp. | | | 31,800 | | | | 592,116 | |
|
The accompanying notes are an integral part of these financial statements. 22 |
Managers Micro-Cap Fund
Schedule of Portfolio Investments (continued)
| | | | | | | | |
| | | Shares | | | Value | |
Information Technology - 23.4% (continued) | | | | | |
Demandware, Inc.* | | | 8,102 | | | $ | 400,644 | |
Digi International, Inc.* | | | 22,883 | | | | 230,661 | |
eGain Corp.* | | | 69,130 | | | | 793,612 | |
Electro Scientific Industries, Inc. | | | 30,700 | | | | 367,786 | |
Envestnet, Inc.* | | | 34,851 | | | | 1,265,091 | |
EPAM Systems, Inc.* | | | 12,862 | | | | 481,939 | |
ePlus, Inc. | | | 4,500 | | | | 244,620 | |
Fabrinet* | | | 21,028 | | | | 352,009 | |
FARO Technologies, Inc.* | | | 15,080 | | | | 716,300 | |
Fleetmatics Group PLC* | | | 13,098 | | | | 415,862 | |
Gigamon, Inc.* | | | 13,871 | | | | 426,949 | |
Globecomm Systems, Inc.* | | | 35,000 | | | | 491,050 | |
Glu Mobile, Inc.* | | | 146,100 | | | | 496,740 | |
GSI Group, Inc.* | | | 61,400 | | | | 612,772 | |
GSI Technology, Inc.* | | | 15,700 | | | | 110,214 | |
Hackett Group, Inc., The | | | 34,800 | | | | 247,776 | |
Imperva, Inc.* | | | 14,479 | | | | 555,125 | |
Infinera Corp.*,1 | | | 44,070 | | | | 449,955 | |
Integrated Silicon Solution, Inc.* | | | 42,900 | | | | 462,462 | |
Interactive Intelligence Group, Inc.* | | | 36,500 | | | | 2,242,925 | |
InvenSense, Inc.*,1 | | | 27,500 | | | | 464,475 | |
IXYS Corp. | | | 47,712 | | | | 554,891 | |
Luxoft Holding, Inc.* | | | 37,748 | | | | 1,102,997 | |
Magnachip Semiconductor Corp.* | | | 19,491 | | | | 364,287 | |
Marketo, Inc.* | | | 8,506 | | | | 287,163 | |
Methode Electronics, Inc. | | | 32,187 | | | | 823,343 | |
Monolithic Power Systems, Inc. | | | 15,627 | | | | 497,564 | |
Move, Inc.* | | | 43,629 | | | | 740,384 | |
NIC, Inc. | | | 32,000 | | | | 787,840 | |
Oplink Communications, Inc.* | | | 20,011 | | | | 365,201 | |
PC Connection, Inc. | | | 15,546 | | | | 310,765 | |
PLX Technology, Inc.* | | | 60,200 | | | | 363,608 | |
Points International, Ltd.* | | | 37,061 | | | | 787,917 | |
Proofpoint, Inc.* | | | 40,879 | | | | 1,293,411 | |
PROS Holdings, Inc.* | | | 31,326 | | | | 1,107,374 | |
Qualys, Inc.* | | | 36,257 | | | | 754,146 | |
Rally Software Development Corp.* | | | 54,540 | | | | 1,463,308 | |
Responsys, Inc.* | | | 68,928 | | | | 1,126,284 | |
RMG Networks Holding Corp.* | | | 32,900 | | | | 263,200 | |
Rocket Fuel, Inc.*,1 | | | 4,300 | | | | 219,472 | |
Rubicon Technology, Inc.*,1 | | | 25,235 | | | | 217,021 | |
Seachange International, Inc.* | | | 30,200 | | | | 428,538 | |
ServiceSource International, Inc.* | | | 34,840 | | | | 376,969 | |
Sierra Wireless, Inc.* | | | 29,211 | | | | 527,551 | |
| | | | | | | | |
| | | Shares | | | Value | |
Silver Spring Networks, Inc.* | | | 25,919 | | | $ | 566,071 | |
SPS Commerce, Inc.* | | | 13,804 | | | | 940,743 | |
Stamps.com, Inc.* | | | 31,561 | | | | 1,434,132 | |
Supertex, Inc. | | | 19,200 | | | | 489,792 | |
Symmetricom, Inc.* | | | 48,942 | | | | 350,914 | |
Tessco Technologies, Inc. | | | 48,500 | | | | 1,718,355 | |
Textura Corp.* | | | 27,869 | | | | 1,068,219 | |
Trina Solar, Ltd., Sponsored ADR*,1 | | | 37,446 | | | | 549,333 | |
Trulia, Inc.* | | | 9,166 | | | | 366,365 | |
Tyler Technologies, Inc.* | | | 29,700 | | | | 2,872,287 | |
Ultra Clean Holdings, Inc.* | | | 32,700 | | | | 304,437 | |
Virtusa Corp.* | | | 45,113 | | | | 1,402,112 | |
Vishay Precision Group, Inc.* | | | 26,050 | | | | 427,220 | |
XO Group, Inc.* | | | 9,000 | | | | 124,920 | |
Xoom Corp.* | | | 37,019 | | | | 1,101,315 | |
Xyratex, Ltd. | | | 85,300 | | | | 847,882 | |
Total Information Technology | | | | | | | 50,792,362 | |
Materials - 3.4% | | | | | | | | |
Flotek Industries, Inc.* | | | 46,775 | | | | 1,000,050 | |
Koppers Holdings, Inc. | | | 30,200 | | | | 1,344,202 | |
Landec Corp.* | | | 59,100 | | | | 692,061 | |
Materion Corp. | | | 21,025 | | | | 626,755 | |
Myers Industries, Inc. | | | 24,500 | | | | 436,590 | |
OMNOVA Solutions, Inc.* | | | 173,800 | | | | 1,512,060 | |
Penford Corp.* | | | 8,000 | | | | 108,800 | |
UFP Technologies, Inc.* | | | 4,925 | | | | 113,521 | |
Universal Stainless & Alloy Products, Inc.* | | | 46,000 | | | | 1,486,720 | |
Total Materials | | | | | | | 7,320,759 | |
Telecommunication Services - 1.4% | | | | | | | | |
8x8, Inc.* | | | 82,079 | | | | 940,625 | |
HickoryTech Corp. | | | 9,700 | | | | 129,786 | |
IDT Corp., Class B | | | 13,000 | | | | 284,570 | |
inContact, Inc.* | | | 39,797 | | | | 302,059 | |
NTELOS Holdings Corp. | | | 7,100 | | | | 135,184 | |
Premiere Global Services, Inc.* | | | 62,300 | | | | 561,323 | |
Shenandoah Telecommunications Co. | | | 15,000 | | | | 415,950 | |
Towerstream Corp.* | | | 120,900 | | | | 290,160 | |
Total Telecommunication Services | | | | | | | 3,059,657 | |
Utilities - 0.5% | | | | | | | | |
Chesapeake Utilities Corp. | | | 9,075 | | | | 493,771 | |
Unitil Corp. | | | 21,000 | | | | 634,620 | |
Total Utilities | | | | | | | 1,128,391 | |
Total Common Stocks
(cost $145,659,218) | | | | | | | 207,029,715 | |
The accompanying notes are an integral part of these financial statements.
23
Managers Micro-Cap Fund
Schedule of Portfolio Investments (continued)
| | | | | | | | |
| | | Shares | | | Value | |
Exchange Traded Funds - 0.5% | | | | | | | | |
SPDR S&P Regional Banking ETF1
(cost $1,111,302) | | | 32,200 | | | $ | 1,202,670 | |
| | |
| | | Principal
Amount | | | | |
Short-Term Investments - 8.6% | | | | | | | | |
Repurchase
Agreements - 4.6%2 | | | | | | | | |
Citigroup Global Markets, Inc., dated 10/31/13, due 11/01/13, 0.100%, total to be received $2,356,870 (collateralized by various U.S. Government Agency Obligations, 0.000% - 5.500%, 11/15/13 - 07/18/33, totaling $2,404,000) | | $ | 2,356,863 | | | | 2,356,863 | |
Credit Suisse Securities (USA) LLC, dated 10/31/13, due 11/01/13, 0.080%, total to be received $496,167 (collateralized by various U.S. Government Agency Obligations, 0.000%, 02/15/18 - 11/15/40, totaling $506,090) | | | 496,166 | | | | 496,166 | |
Deutsche Bank Securities, Inc., dated 10/31/13, due 11/01/13, 0.120%, total to be received $2,356,871 (collateralized by various U.S. Government Agency Obligations, 2.000% - 7.000%, 07/01/25 - 11/01/47, totaling $2,404,000) | | | 2,356,863 | | | | 2,356,863 | |
| | | | | | | | |
| | | Principal
Amount | | | Value | |
JP Morgan Securities LLC, dated 10/31/13, due 11/01/13, 0.100%, total to be received $2,356,870 (collateralized by various U.S. Government Agency Obligations, 0.000% - 6.051%, 07/01/27 - 12/01/47, totaling $2,404,000) | | $ | 2,356,863 | | | $ | 2,356,863 | |
Merrill Lynch, Pierce, Fenner & Smith, Inc., dated 10/31/13, due 11/01/13, 0.100%, total to be received $2,356,870 (collateralized by various U.S. Government Agency Obligations, 3.000% - 3.500%, 09/20/42 - 05/20/43, totaling $2,404,000) | | | 2,356,863 | | | | 2,356,863 | |
Total Repurchase Agreements | | | | | | | 9,923,618 | |
| | |
| | | Shares | | | | |
Other Investment Companies - 4.0%3 | | | | | | | | |
Dreyfus Institutional Cash Advantage Fund, Institutional Class Shares, 0.06% | | | 8,718,144 | | | | 8,718,144 | |
Total Short-Term Investments
(cost $18,641,762) | | | | | | | 18,641,762 | |
| | |
Total Investments - 104.5%
(cost $165,412,282) | | | | | | | 226,874,147 | |
Other Assets, less
Liabilities - (4.5)% | | | | | | | (9,826,381 | ) |
Net Assets - 100.0% | | | | | | $ | 217,047,766 | |
The accompanying notes are an integral part of these financial statements.
24
Managers Real Estate Securities Fund
Portfolio Manager’s Comments
Managers Real Estate Securities Fund seeks a combination of income and long-term capital appreciation by investing in stocks of companies that are principally engaged in owning and operating commercial real estate properties for the benefit of their investors including real estate investment trusts (REITs). Managers Investment Group LLC utilizes an independent subadvisor, CenterSquare Investment Management, LLC (formerly Urdang Securities Management, Inc.) (“CenterSquare”), to manage the assets of this Portfolio.
The Portfolio Manager
CenterSquare Investment Management, LLC
The investment team at CenterSquare believes real estate securities play an important role in a multi-asset class investment portfolio. CenterSquare’s strategy recognizes that real estate securities are not simply stocks or real estate. They are hybrid financial investments that must be valued on the basis of a number of meaningful factors, only one of which is the value of the firm’s property portfolio. To accurately assess the relative value of a REIT, CenterSquare takes into account critical business and market factors, such as: the company’s capitalization, its position within public capital markets and the quality of the management team.
CenterSquare believes that investment success is the result of the company’s ability to provide a consistently accurate answer to the question at the heart of its value-oriented investment strategy: which REITs do they believe will generate the highest risk-adjusted returns? CenterSquare believes that a diversified portfolio with a value orientation will result in strong risk-adjusted returns.
CenterSquare employs a value-oriented investment process with two distinct and complementary components: bottom-up real estate research and the company’s proprietary Relative Value Model (RVM) securities valuation process, which was designed to provide a uniform basis for evaluating the validity of a security’s trading price. Combining real estate research and the RVM process has been central to CenterSquare’s track record of delivering strong returns without incurring high levels of risk.
THE YEAR IN REVIEW
For the fiscal year ended October 31, 2013, the Managers Real Estate Securities Fund returned 10.99%, compared with 9.96% for its benchmark, the Dow Jones U.S. Select REIT Index. During the same period the S&P 500 Index returned 27.18%.
The U.S. REIT market had total returns in-line with the broader equity markets through late May. However, the rapid rise in the 10-year U.S. Treasury yield triggered by concern over a possible earlier-than-expected removal of monetary stimulus caused income-oriented investments like REITs to decline in value. REITs recovered off of their lows, however, ending up roughly 10% for the fiscal year as investor focus shifted from interest rates to REIT’s steady recovery in operating fundamentals and strong dividend growth. Occupancy has recovered to the historical averages and rental rates are rising. Operating fundamentals were strongest for apartments and self-storage where short duration lease and low vacancy levels made for strength in the improving economy. Retail real estate fundamentals also saw a marked improvement albeit from a lower base.
All major property sectors generated positive total returns during the fiscal year. Only one small sector generated a negative total return. Property sector performance was led by hotel and self storage which posted total returns of 35.0% and 28.0%, respectively. The worst performing sectors — residential and specialty, on the other hand, generated total returns of positive 0.1% and negative 5.6%, respectively. The specialty sector — a small and unique niche sector — was disproportionately negatively affected by the performance of one stock in particular.
The Portfolio outperformed the benchmark during the year. Both stock selection and sector positioning contributed to the Fund’s outperformance during the year. Stock selection alpha was broad-based with all but two sectors contributing to relative performance. Stock selection in the residential and office sectors benefitted relative performance while hotel and specialty sectors detracted from performance. Sector positioning benefited by an underweight to health care and an overweight to hotels. An overweight to the residential detracted from relative performance.
Outlook
The economic environment is favorable in our view, notwithstanding the budget deadlock and government shut-down that introduced an unneeded element of risk to the U.S. economy and eroded investor confidence. A healthy economy led by an improving housing market, employment and retail sales is good for real estate fundamentals, particularly in the absence of new construction. The eventual end of quantitative easing should be a welcome event as it should signal a healthier economy. However, in the short-run it has dampened sentiment for capital intensive, income-oriented vehicles regardless of the favorable operating fundamentals and some compelling valuations in the REIT sector. The short-lived era of buying of “yield at any cost” is giving way to a period where the focus will return to finding high-quality real estate companies with strong earnings growth, sustainable yields, fortress balance sheets and management teams that can capitalize on external growth opportunities. We believe REITs offer attractive risk-adjusted total returns and that REITs offer good investment opportunities to investors seeking high and growing dividends.
This commentary reflects the viewpoints of the portfolio manager, CenterSquare Investment Management LLC, as of October 31, 2013 and is not intended as a forecast or guarantee of future results.
CUMULATIVE TOTAL RETURN PERFORMANCE
Managers Real Estate Securities Fund’s cumulative total return is based on the daily change in net asset value (NAV), and assumes that all dividends and distributions were reinvested. This chart compares a hypothetical $10,000 investment made in Managers Real Estate Securities Fund on October 31, 2003, to a $10,000 investment made in the Dow Jones U.S. Select REIT Index for the same time period. Performance for periods longer than one year is annualized. The graph and table do not reflect the deduction of taxes that a shareholder would pay on a Fund distribution or redemption of shares. The listed returns for the Fund are net of expenses and the returns for the index exclude expenses. Past performance is not indicative of future results. Total returns would have been lower had certain expenses not been reduced.
25
Managers Real Estate Securities Fund
Portfolio Manager’s Comments (continued)
CUMULATIVE TOTAL RETURN PERFORMANCE (continued)
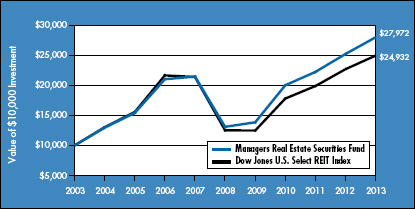
The table below shows the average annual total returns for the Managers Real Estate Securities Fund and the S&P 500 and Dow Jones U.S. Select REIT indices for the same time periods ended October 31, 2013.
| | | | | | | | | | | | |
| | | Average Annual Total Returns1 | |
| | | One Year | | | Five Years | | | Ten Years | |
Managers Real Estate Securities Fund2,3,4 | | | 10.99 | % | | | 16.39 | % | | | 10.83 | % |
Dow Jones U.S. Select REIT Index5 | | | 9.96 | % | | | 14.79 | % | | | 9.57 | % |
S&P 500 Index6 | | | 27.18 | % | | | 15.17 | % | | | 7.46 | % |
The performance data shown represents past performance. Past performance is not a guarantee of future results. Current performance may be lower or higher than the performance data quoted. The investment return and principal value of an investment in the Fund will fluctuate so that an investor’s shares, when redeemed, may be worth more or less than their original cost. For performance information through the most recent month end, please call (800) 835-3879 or visit our Web site at www.managersinvest.com. Current net asset values per share for each Fund are available on the Funds’ Web site at www.managersinvest.com.
Investors should carefully consider the Fund’s investment objectives, risks, charges and expenses before investing. For this and other information, please call (800) 835-3879 or visit our Web site at www.managersinvest.com for a free prospectus. Read it carefully before investing or sending money. Funds are distributed by Managers Distributors, Inc., member FINRA.
|
1 Total return equals income yield plus share price change and assumes reinvestment of all dividends and capital gain distributions. Returns are net of fees and may reflect offsets of Fund expenses as described in the Prospectus. No adjustment has been made for taxes payable by shareholders on their reinvested dividends and capital gain distributions. Returns for periods greater than one year are annualized. The listed returns on the Fund are net of expenses and based on the published NAV as of October 31, 2013. All returns are in U.S. dollars ($). 2 From time to time, the Fund’s advisor has waived its fees and/or absorbed Fund expenses, which has resulted in higher returns. 3 The Fund is subject to special risk considerations similar to those associated with the direct ownership of real estate. Real estate valuations may be subject to factors such as changing general and local economic, financial, competitive, and environmental conditions. 4 Companies that are in similar businesses may be similarly affected by particular economic or market events; to the extent the Fund has substantial holdings within a particular sector, the risks associated with that sector increase. 5 The Dow Jones U.S. Select REIT Index measures U.S. publicly traded Real Estate Investment Trusts. Unlike the Fund, the Dow Jones U.S. Select REIT Index is unmanaged, is not available for investment, and does not incur expenses. 6 The S&P 500 Index is a capitalization-weighted index of 500 stocks. The S&P 500 Index is designed to measure performance of the broad domestic economy through changes in the aggregate market value of 500 stocks representing all major industries. Unlike the Fund, the Index is unmanaged, is not available for investment, and does not incur expenses. The S&P 500 Index is proprietary data of Standard & Poor’s, a division of McGraw-Hill Companies, Inc. All rights reserved. Not FDIC insured, nor bank guaranteed. May lose value. |
Managers Real Estate Securities Fund
Fund Snapshots
October 31, 2013
| | | | |
Portfolio Breakdown (unaudited) | |
Industry | | Managers
Real Estate
Securities Fund** | |
REITs (Regional Malls) | | | 19.0 | % |
REITs (Apartments) | | | 14.4 | % |
REITs (Office Properties) | | | 12.7 | % |
REITs (Health Care) | | | 11.4 | % |
REITs (Diversified) | | | 10.1 | % |
REITs (Shopping Centers) | | | 9.2 | % |
REITs (Hotels) | | | 6.8 | % |
REITs (Warehouse/Industrials) | | | 6.2 | % |
REITs (Storage) | | | 5.9 | % |
Other Assets and Liabilities | | | 4.3 | % |
|
** As a percentage of net assets. | |
| |
| Top Ten Holdings (unaudited) | | | | |
Security Name | | %of
Net Assets | |
Simon Property Group, Inc.* | | | 7.2 | % |
Ventas, Inc.* | | | 5.2 | |
Prologis, Inc.* | | | 5.0 | |
AvalonBay Communities, Inc.* | | | 4.0 | |
Macerich Co., The | | | 3.8 | |
Public Storage* | | | 3.7 | |
Kimco Realty Corp.* | | | 3.6 | |
Regency Centers Corp. | | | 3.5 | |
Boston Properties, Inc.* | | | 3.4 | |
HCP, Inc.* | | | 3.4 | |
| | | | |
Top Ten as a Group | | | 42.8 | % |
| | | | |
|
* Top Ten Holding at April 30, 2013 | |
Any sectors, industries, or securities discussed should not be perceived as investment recommendations. Mention of a specific security should not be considered a recommendation to buy or solicitation to sell that security. Specific securities mentioned in this report may have been sold from the Fund’s portfolio of investments by the time you receive this report.
27
Managers Real Estate Securities Fund
Schedule of Portfolio Investments
October 31, 2013
| | | | | | | | |
| | | Shares | | | Value | |
Common Stocks - 2.0% | | | | | | | | |
Brixmor Property Group, Inc. (Financials)* | | | 30,510 | | | $ | 630,031 | |
Empire State Realty Trust, Inc. (Financials)* | | | 152,970 | | | | 2,164,525 | |
QTS Realty Trust, Inc., Class A (Financials)* | | | 28,580 | | | | 613,898 | |
Rexford Industrial Realty, Inc. (Financials)* | | | 68,380 | | | | 931,336 | |
Total Common Stocks
(cost $4,147,322) | | | | | | | 4,339,790 | |
REITs - 95.7% | | | | | | | | |
Apartments - 14.4% | | | | | | | | |
AvalonBay Communities, Inc. | | | 69,050 | | | | 8,634,703 | |
BRE Properties, Inc. | | | 34,050 | | | | 1,859,470 | |
Camden Property Trust | | | 84,840 | | | | 5,446,728 | |
Equity Residential | | | 45,770 | | | | 2,396,517 | |
Essex Property Trust, Inc. | | | 27,980 | | | | 4,504,780 | |
Mid-America Apartment Communities, Inc. | | | 37,000 | | | | 2,456,800 | |
UDR, Inc. | | | 211,060 | | | | 5,236,399 | |
Total Apartments | | | | | | | 30,535,397 | |
Diversified - 10.1% | | | | | | | | |
Cousins Properties, Inc. | | | 96,460 | | | | 1,092,892 | |
Digital Realty Trust, Inc. | | | 43,320 | | | | 2,064,631 | |
Duke Realty Corp. | | | 318,020 | | | | 5,269,591 | |
Liberty Property Trust | | | 171,330 | | | | 6,371,763 | |
Vornado Realty Trust | | | 74,240 | | | | 6,611,814 | |
Total Diversified | | | | | | | 21,410,691 | |
Health Care - 11.4% | | | | | | | | |
Aviv REIT, Inc. | | | 54,900 | | | | 1,394,460 | |
HCP, Inc. | | | 174,790 | | | | 7,253,785 | |
Health Care REIT, Inc. | | | 59,250 | | | | 3,842,362 | |
Omega Healthcare Investors, Inc. | | | 20,210 | | | | 671,780 | |
Ventas, Inc. | | | 168,680 | | | | 11,004,683 | |
Total Health Care | | | | | | | 24,167,070 | |
Hotels - 6.8% | | | | | | | | |
Ashford Hospitality Trust, Inc. | | | 48,480 | | | | 633,149 | |
Host Hotels & Resorts, Inc. | | | 389,390 | | | | 7,223,184 | |
LaSalle Hotel Properties | | | 41,731 | | | | 1,295,748 | |
RLJ Lodging Trust | | | 72,530 | | | | 1,832,108 | |
Sunstone Hotel Investors, Inc. | | | 260,190 | | | | 3,447,518 | |
Total Hotels | | | | | | | 14,431,707 | |
Office Properties - 12.7% | | | | | |
Alexandria Real Estate Equities, Inc. | | | 48,110 | | | | 3,164,676 | |
Boston Properties, Inc. | | | 70,420 | | | | 7,288,470 | |
Brandywine Realty Trust | | | 79,820 | | | | 1,135,839 | |
CyrusOne, Inc. | | | 25,640 | | | | 499,724 | |
| | | | | | | | |
| | | Shares | | | Value | |
Highwoods Properties, Inc. | | | 131,278 | | | $ | 5,067,331 | |
Hudson Pacific Properties, Inc. | | | 16,290 | | | | 337,040 | |
Kilroy Realty Corp. | | | 68,210 | | | | 3,626,044 | |
Parkway Properties, Inc. | | | 51,870 | | | | 939,366 | |
SL Green Realty Corp. | | | 52,430 | | | | 4,958,305 | |
Total Office Properties | | | | | | | 27,016,795 | |
Regional Malls - 19.0% | | | | | | | | |
General Growth Properties, Inc. | | | 332,732 | | | | 7,063,900 | |
Macerich Co., The | | | 138,240 | | | | 8,185,190 | |
Pennsylvania Real Estate Investment Trust | | | 27,523 | | | | 498,992 | |
Simon Property Group, Inc. | | | 98,970 | | | | 15,295,814 | |
Tanger Factory Outlet Centers | | | 184,760 | | | | 6,438,886 | |
Taubman Centers, Inc. | | | 45,063 | | | | 2,964,695 | |
Total Regional Malls | | | | | | | 40,447,477 | |
Shopping Centers - 9.2% | | | | | | | | |
DDR Corp. | | | 80,530 | | | | 1,364,984 | |
Federal Realty Investment Trust | | | 24,990 | | | | 2,588,964 | |
Kimco Realty Corp. | | | 356,430 | | | | 7,656,116 | |
Regency Centers Corp. | | | 142,610 | | | | 7,367,233 | |
Retail Opportunity Investments Corp. | | | 43,970 | | | | 650,756 | |
Total Shopping Centers | | | | | | | 19,628,053 | |
Storage - 5.9% | | | | | | | | |
CubeSmart | | | 110,410 | | | | 2,017,191 | |
Public Storage | | | 47,040 | | | | 7,854,269 | |
Sovran Self Storage, Inc. | | | 35,360 | | | | 2,704,686 | |
Total Storage | | | | | | | 12,576,146 | |
Warehouse/Industrials - 6.2% | | | | | |
EastGroup Properties, Inc. | | | 21,850 | | | | 1,390,971 | |
First Industrial Realty Trust, Inc. | | | 68,490 | | | | 1,237,614 | |
Prologis, Inc. | | | 264,130 | | | | 10,551,994 | |
Total Warehouse/ Industrials | | | | | | | 13,180,579 | |
Total REITs
(cost $193,971,228) | | | | | | | 203,393,915 | |
Other Investment
Companies - 2.0%3 | | | | | | | | |
Dreyfus Institutional Cash Advantage Fund,
Institutional Class Shares, 0.06%
(cost $4,343,509) | | | 4,343,509 | | | | 4,343,509 | |
Total Investments - 99.7%
(cost $202,462,059) | | | | | | | 212,077,214 | |
Other Assets, less
Liabilities - 0.3% | | | | | | | 548,689 | |
Net Assets - 100.0% | | | | | | $ | 212,625,903 | |
|
The accompanying notes are an integral part of these financial statements. 28 |
Notes to Schedules of Portfolio Investments
The following footnotes and abbreviations should be read in conjunction with each of the Schedules of Portfolio Investments previously presented in this report.
At October 31, 2013, the approximate cost of investments for Federal income tax purposes and the aggregate gross unrealized appreciation and/or depreciation based on tax cost were as follows:
| | | | | | | | | | | | | | | | |
Fund | | Cost | | | Appreciation | | | Depreciation | | | Net | |
Managers Frontier Small Cap Growth Fund | | $ | 55,294,157 | | | $ | 23,748,275 | | | $ | (1,974,436 | ) | | $ | 21,773,839 | |
Managers AMG TSCM Growth Equity Fund | | | 29,312,920 | | | | 7,186,003 | | | | (383,145 | ) | | | 6,802,858 | |
Managers Micro-Cap Fund | | | 166,444,031 | | | | 63,148,294 | | | | (2,718,178 | ) | | | 60,430,116 | |
Managers Real Estate Securities Fund | | | 204,292,054 | | | | 10,926,584 | | | | (3,141,424 | ) | | | 7,785,160 | |
| * | Non-income producing security. |
| 1 | Some or all of these shares were out on loan to various brokers as of October 31, 2013 amounting to: |
| | | | | | | | |
Fund | | Market Value | | | % of Net Assets | |
Managers Frontier Small Cap Growth Fund | | $ | 2,967,355 | | | | 4.0 | % |
Managers Micro-Cap Fund | | | 9,514,951 | | | | 4.4 | % |
| 2 | Collateral received from brokers for securities lending was invested in these short-term investments. |
| 3 | Yield shown represents the October 31, 2013, seven-day average yield, which refers to the sum of the previous seven days’ dividends paid, expressed as an annual percentage. |
| 4 | Illiquid Security: A security not readily convertible into cash such as a stock, bond or commodity that is not actively traded, and would be difficult to sell in a timely sale. The Funds may not invest more than 15% of its net assets in illiquid securities. All illiquid securities are valued by an independent pricing agent. The market value of illiquid securities at October 31, 2013, amounted to the following: |
| | | | | | | | |
Fund | | Market Value | | | % of Net Assets | |
Managers Micro-Cap Fund | | $ | 121,590 | | | | 0.1 | % |
As of October 31, 2013, the securities in the Managers AMG TSCM Growth Equity Fund and Managers Real Estate Securities Fund were all valued using Level 1 inputs. For a detailed breakout of the common stocks and REITs by major industry classification, please refer to the respective Schedule of Portfolio Investments previously presented in this report. (See Note 1(a) in the Notes to Financial Statements.)
The following tables summarize the inputs used to value the Funds’ net assets by the fair value hierarchy levels as of October 31, 2013. (See Note 1 (a) in the Notes to the Financial Statements.)
| | | | | | | | | | | | | | | | |
| | | Quoted Prices in
Active Markets
for Identical
Investments
Level 1 | | | Significant
Other
Observable
Inputs
Level 2 | | | Significant
Unobservable
Inputs
Level 3 | | | Total | |
Managers Frontier Small Cap Growth Fund | | | | | | | | | |
Investments in Securities | | | | | | | | | | | | | |
Common Stocks† | | $ | 72,617,886 | | | | — | | | | — | | | $ | 72,617,886 | |
Short-Term Investments | | | | | | | | | | | | | | | | |
Repurchase Agreements | | | — | | | $ | 3,186,444 | | | | — | | | | 3,186,444 | |
Other Investment Companies | | | 1,263,666 | | | | — | | | | — | | | | 1,263,666 | |
| | | | | | | | | | | | | | | | |
Total Investments in Securities | | $ | 73,881,552 | | | $ | 3,186,444 | | | | — | | | $ | 77,067,996 | |
| | | | | | | | | | | | | | | | |
|
The accompanying notes are an integral part of these financial statements. 29 |
Notes to Schedules of Portfolio Investments (continued)
| | | | | | | | | | | | | | | | |
| | | Quoted Prices
in Active
Markets for
Identical
Investments
Level 1 | | | Significant Other
Observable
Inputs
Level 2 | | | Significant
Unobservable
Inputs
Level 3 | | | Total | |
Managers Micro-Cap Fund | | | | | | | | | | | | | | | | |
Investments in Securities | | | | | | | | | | | | | | | | |
Common Stocks | | | | | | | | | | | | | | | | |
Information Technology | | $ | 50,792,362 | | | | — | | | | — | | | $ | 50,792,362 | |
Industrials | | | 38,545,052 | | | $ | 121,590 | | | | — | | | | 38,666,642 | |
Consumer Discretionary | | | 34,764,101 | | | | — | | | | — | | | | 34,764,101 | |
Health Care | | | 27,122,567 | | | | — | | | | — | | | | 27,122,567 | |
Financials | | | 26,396,218 | | | | — | | | | — | | | | 26,396,218 | |
Energy | | | 9,950,227 | | | | — | | | | — | | | | 9,950,227 | |
Consumer Staples | | | 7,828,791 | | | | — | | | | — | | | | 7,828,791 | |
Materials | | | 7,320,759 | | | | — | | | | — | | | | 7,320,759 | |
Telecommunication Services | | | 3,059,657 | | | | — | | | | — | | | | 3,059,657 | |
Utilities | | | 1,128,391 | | | | — | | | | — | | | | 1,128,391 | |
Exchange Traded Funds | | | 1,202,670 | | | | — | | | | — | | | | 1,202,670 | |
Short-Term Investments | | | | | | | | | | | | | | | | |
Repurchase Agreements | | | — | | | | 9,923,618 | | | | — | | | | 9,923,618 | |
Other Investment Companies | | | 8,718,144 | | | | — | | | | — | | | | 8,718,144 | |
| | | | | | | | | | | | | | | | |
Total Investments in Securities | | $ | 216,828,939 | | | $ | 10,045,208 | | | | — | | | $ | 226,874,147 | |
| | | | | | | | | | | | | | | | |
| † | All common stocks held in the Fund are Level 1 securities. For a detailed breakout of the common stocks by major industry classification, please refer to the Schedule of Portfolio Investments. |
As of October 31, 2013, the Funds had no transfers between levels from the beginning of the reporting period.
Investments Definitions and Abbreviations:
ADR: ADR after the name of a holding stands for American Depositary Receipt, representing ownership of foreign securities on deposit with a domestic custodian bank. The value of the ADR securities is determined or significantly influenced by trading on exchanges not located in the United States or Canada. Sponsored ADRs are initiated by the underlying foreign company.
ETF: Exchange Traded Fund
REIT: Real Estate Investment Trust
|
The accompanying notes are an integral part of these financial statements. 30 |
Statement of Assets and Liabilities
October 31, 2013
| | | | | | | | | | | | |
| | | Managers Frontier
Small Cap
Growth Fund | | | Managers AMG
TSCM Growth
Equity Fund | | | Managers
Micro-Cap Fund | |
Assets: | | | | | | | | | | | | |
Investments at value* (including securities on loan valued at $2,967,355, $0 and $9,514,951, respectively) | | $ | 77,067,996 | | | $ | 36,115,778 | | | $ | 226,874,147 | |
Cash | | | — | | | | — | | | | 1,060,537 | |
Receivable for investments sold | | | 438,743 | | | | 605,575 | | | | 846,150 | |
Receivable for Fund shares sold | | | 1,278 | | | | 8,662 | | | | 567,685 | |
Dividends, interest and other receivables | | | 18,596 | | | | 11,301 | | | | 69,526 | |
Receivable from affiliate | | | 2,520 | | | | 16,201 | | | | — | |
Prepaid expenses | | | 17,316 | | | | 20,009 | | | | 17,894 | |
Total assets | | | 77,546,449 | | | | 36,777,526 | | | | 229,435,939 | |
Liabilities: | | | | | | | | | | | | |
Payable upon return of securities loaned | | | 3,186,444 | | | | — | | | | 9,923,618 | |
Payable for investments purchased | | | 493,231 | | | | 396,156 | | | | 1,951,336 | |
Payable for Fund shares repurchased | | | 15,500 | | | | 32,267 | | | | 167,713 | |
Accrued expenses: | | | | | | | | | | | | |
Investment advisory and management fees | | | 62,315 | | | | 22,654 | | | | 180,075 | |
Administrative fees | | | — | | | | 7,551 | | | | 45,018 | |
Shareholder servicing fees - Investor Class | | | — | | | | 4,863 | | | | — | |
Shareholder servicing fees - Service Class | | | 2,801 | | | | 2,849 | | | | 35,808 | |
Distribution fees - Investor Class | | | 78 | | | | 1,055 | | | | — | |
Trustees fees and expenses | | | 42 | | | | — | | | | 1,318 | |
Other | | | 30,222 | | | | 18,528 | | | | 83,287 | |
Total liabilities | | | 3,790,633 | | | | 485,923 | | | | 12,388,173 | |
| | | |
Net Assets | | $ | 73,755,816 | | | $ | 36,291,603 | | | $ | 217,047,766 | |
| | | |
Net Assets Represent: | | | | | | | | | | | | |
Paid-in capital | | $ | 43,639,881 | | | $ | 25,629,096 | | | $ | 128,864,481 | |
Undistributed net investment income (loss) | | | — | | | | (14,957 | ) | | | 78,367 | |
Accumulated net realized gain from investments | | | 7,440,974 | | | | 3,808,699 | | | | 26,643,053 | |
Net unrealized appreciation of investments | | | 22,674,961 | | | | 6,868,765 | | | | 61,461,865 | |
Net Assets | | $ | 73,755,816 | | | $ | 36,291,603 | | | $ | 217,047,766 | |
Investor Class: | | | | | | | | | | | | |
Net Assets | | $ | 366,073 | | | $ | 5,045,722 | | | | n/a | |
Shares outstanding | | | 13,941 | | | | 304,015 | | | | n/a | |
Net asset value, offering and redemption price per share | | $ | 26.26 | | | $ | 16.60 | | | | n/a | |
Service Class: | | | | | | | | | | | | |
Net Assets | | $ | 15,272,828 | | | $ | 28,281,326 | | | $ | 172,958,695 | |
Shares outstanding | | | 576,680 | | | | 1,683,316 | | | | 3,378,933 | |
Net asset value, offering and redemption price per share | | $ | 26.48 | | | $ | 16.80 | | | $ | 51.19 | |
Institutional Class: | | | | | | | | | | | | |
Net Assets | | $ | 58,116,915 | | | $ | 2,964,555 | | | $ | 44,089,071 | |
Shares outstanding | | | 2,175,186 | | | | 176,821 | | | | 859,249 | |
Net asset value, offering and redemption price per share | | $ | 26.72 | | | $ | 16.77 | | | $ | 51.31 | |
* Investments at cost | | $ | 54,393,035 | | | $ | 29,247,013 | | | $ | 165,412,282 | |
The accompanying notes are an integral part of these financial statements.
31
Statement of Assets and Liabilities
October 31, 2013 (continued)
| | | | |
| | | Managers
Real Estate
Securities Fund | |
Assets: | | | | |
Investments at value* | | $ | 212,077,214 | |
Receivable for investments sold | | | 6,383,670 | |
Receivable for Fund shares sold | | | 776,032 | |
Dividends, interest and other receivables | | | 143,118 | |
Prepaid expenses | | | 9,908 | |
Total assets | | | 219,389,942 | |
Liabilities: | | | | |
Payable for investments purchased | | | 6,026,810 | |
Payable for Fund shares repurchased | | | 467,576 | |
Accrued expenses: | | | | |
Investment advisory and management fees | | | 106,559 | |
Administrative fees | | | 44,399 | |
Shareholder servicing fees | | | 44,399 | |
Trustees fees and expenses | | | 966 | |
Other | | | 73,330 | |
Total liabilities | | | 6,764,039 | |
| |
Net Assets | | $ | 212,625,903 | |
| |
Net Assets Represent: | | | | |
Paid-in capital | | $ | 191,928,349 | |
Undistributed net investment income | | | 654,982 | |
Accumulated net realized gain from investments | | | 10,427,417 | |
Net unrealized appreciation of investments | | | 9,615,155 | |
Net Assets | | $ | 212,625,903 | |
Shares outstanding | | | 19,697,871 | |
Net asset value, offering and redemption price per share | | $ | 10.79 | |
* Investments at cost | | $ | 202,462,059 | |
The accompanying notes are an integral part of these financial statements.
32
Statement of Operations
For the fiscal year ended October 31, 2013
| | | | | | | | | | | | | | | | |
| | | Managers Frontier
Small Cap
Growth Fund | | | Managers AMG
TSCM Growth
Equity Fund | | | Managers
Micro-Cap Fund | | | Managers
Real Estate
Securities Fund | |
Investment Income: | | | | | | | | | | | | | | | | |
Dividend income | | $ | 696,565 | 1 | | $ | 344,088 | 2 | | $ | 1,766,376 | 3 | | $ | 4,612,486 | |
Securities lending income | | | 80,993 | | | | 1,035 | | | | 73,314 | | | | — | |
Interest income | | | — | | | | — | | | | 36 | | | | — | |
Foreign withholding tax | | | — | | | | (3,325 | ) | | | — | | | | (6,608 | ) |
Total investment income | | | 777,558 | | | | 341,798 | | | | 1,839,726 | | | | 4,605,878 | |
Expenses: | | | | | | | | | | | | | | | | |
Investment advisory and management fees | | | 855,843 | | | | 226,906 | | | | 1,656,889 | | | | 1,181,736 | |
Administrative fees | | | — | | | | 75,635 | | | | 414,221 | | | | 492,388 | |
Distribution fees - Investor Class | | | 1,033 | | | | 10,733 | | | | — | | | | — | |
Shareholder servicing fees - Service Class | | | 35,225 | | | | 24,060 | | | | 328,340 | | | | — | |
Shareholder servicing fees - Investor Class | | | — | | | | 10,671 | | | | — | | | | — | |
Shareholder servicing fees | | | — | | | | — | | | | — | | | | 492,388 | |
Registration fees | | | 37,734 | | | | 38,654 | | | | 30,519 | | | | 44,721 | |
Professional fees | | | 24,805 | | | | 23,256 | | | | 31,151 | | | | 30,262 | |
Extraordinary expense | | | 22,397 | | | | 7,036 | | | | 37,074 | | | | 53,466 | |
Transfer agent | | | 14,392 | | | | 23,981 | | | | 52,734 | | | | 50,249 | |
Custodian | | | 14,263 | | | | 5,230 | | | | 55,974 | | | | 25,897 | |
Reports to shareholders | | | 9,759 | | | | 2,074 | | | | 21,539 | | | | 54,238 | |
Trustees fees and expenses | | | 2,055 | | | | 853 | | | | 6,524 | | | | 7,981 | |
Miscellaneous | | | 2,768 | | | | 2,198 | | | | 4,907 | | | | 5,035 | |
Total expenses before offsets | | | 1,020,274 | | | | 451,287 | | | | 2,639,872 | | | | 2,438,361 | |
Expense repayments | | | — | | | | — | | | | — | | | | 65,671 | |
Expense reimbursements | | | (62,431 | ) | | | (159,766 | ) | | | (319,324 | ) | | | (6,318 | ) |
Expense reductions | | | — | | | | (4,605 | ) | | | (21,771 | ) | | | (16,794 | ) |
Net expenses | | | 957,843 | | | | 286,916 | | | | 2,298,777 | | | | 2,480,920 | |
| | | | |
Net investment income (loss) | | | (180,285 | ) | | | 54,882 | | | | (459,051 | ) | | | 2,124,958 | |
Net Realized and Unrealized Gain: | | | | | | | | | | | | | | | | |
Net realized gain on investments | | | 8,773,344 | | | | 4,505,144 | | | | 29,255,923 | | | | 11,667,269 | |
Net change in unrealized appreciation (depreciation) of investments | | | 18,984,862 | | | | 3,689,693 | | | | 37,936,325 | | | | 2,575,248 | |
Net realized and unrealized gain | | | 27,758,206 | | | | 8,194,837 | | | | 67,192,248 | | | | 14,242,517 | |
| | | | |
Net increase in net assets resulting from operations | | $ | 27,577,921 | | | $ | 8,249,719 | | | $ | 66,733,197 | | | $ | 16,367,475 | |
| 1 | Includes non-recurring dividends of $219,548. |
| 2 | Includes non-recurring dividends of $56,945. |
| 3 | Includes non-recurring dividends of $681,042. |
The accompanying notes are an integral part of these financial statements.
33
Statements of Changes in Net Assets
For the fiscal year ended October 31,
| | | | | | | | | | | | | | | | | | | | | | | | |
| | | Managers Frontier
Small Cap Growth Fund | | | Managers AMG TSCM Growth
Equity Fund | | | Managers
Micro-Cap Fund | |
| | | 2013 | | | 2012 | | | 2013 | | | 2012 | | | 2013 | | | 2012 | |
Increase (Decrease) in Net Assets From Operations: | | | | | | | | | | | | | | | | | | | | | | | | |
Net investment income (loss) | | $ | (180,285 | ) | | $ | (225,425 | ) | | $ | 54,882 | | | $ | 19,253 | | | $ | (459,051 | ) | | $ | (821,927 | ) |
Net realized gain (loss) on investments | | | 8,773,344 | | | | (25,991 | ) | | | 4,505,144 | | | | 234,312 | | | | 29,255,923 | | | | 9,982,766 | |
Net change in unrealized appreciation (depreciation) of investments | | | 18,984,862 | | | | 5,211,506 | | | | 3,689,693 | | | | 3,287,379 | | | | 37,936,325 | | | | 6,192,551 | |
Net increase in net assets resulting from operations | | | 27,577,921 | | | | 4,960,090 | | | | 8,249,719 | | | | 3,540,944 | | | | 66,733,197 | | | | 15,353,390 | |
Distributions to Shareholders: | | | | | | | | | | | | | | | | | | | | | | | | |
From net investment income: | | | | | | | | | | | | | | | | | | | | | | | | |
Investor Class | | | — | | | | — | | | | (6,039 | ) | | | — | | | | — | | | | — | |
Service Class | | | — | | | | — | | | | (66,568 | ) | | | — | | | | (200,919 | ) | | | — | |
Institutional Class | | | — | | | | — | | | | (16,460 | ) | | | — | | | | (134,351 | ) | | | — | |
From net realized gain on investments: | | | | | | | | | | | | | | | | | | | | | | | | |
Investor Class | | | — | | | | — | | | | — | | | | — | | | | — | | | | — | |
Service Class | | | — | | | | — | | | | — | | | | — | | | | (8,440,046 | ) | | | (8,215,902 | ) |
Institutional Class | | | — | | | | — | | | | — | | | | — | | | | (2,201,758 | ) | | | (2,309,261 | ) |
Total distributions to shareholders | | | — | | | | — | | | | (89,067 | ) | | | — | | | | (10,977,074 | ) | | | (10,525,163 | ) |
Capital Share Transactions:1 | | | | | | | | | | | | | | | | | | | | | | | | |
Net increase (decrease) from capital share transactions | | | (40,721,845 | ) | | | (14,039,711 | ) | | | 2,745,621 | | | | (924,160 | ) | | | 20,768,144 | | | | (9,781,867 | )2 |
| | | | | | |
Total increase (decrease) in net assets | | | (13,143,924 | ) | | | (9,079,621 | ) | | | 10,906,273 | | | | 2,616,784 | | | | 76,524,267 | | | | (4,953,640 | ) |
Net Assets: | | | | | | | | | | | | | | | | | | | | | | | | |
Beginning of year | | | 86,899,740 | | | | 95,979,361 | | | | 25,385,330 | | | | 22,768,546 | | | | 140,523,499 | | | | 145,477,139 | |
End of year | | $ | 73,755,816 | | | $ | 86,899,740 | | | $ | 36,291,603 | | | $ | 25,385,330 | | | $ | 217,047,766 | | | $ | 140,523,499 | |
End of year undistributed net investment income (loss) | | | — | | | $ | (161,224 | ) | | $ | (14,957 | ) | | $ | 19,347 | | | $ | 78,367 | | | $ | (129,526 | ) |
| | | | | | | | | | | | | | | | | | | | | | | | |
| 1 | See Note 1(g) of the Notes to Financial Statements. |
| 2 | For the fiscal year ended October 31, 2012, the proceeds from the sale of shares for Managers Micro-Cap include the receipt of market timing settlements of $647,713. |
|
The accompanying notes are an integral part of these financial statements. 34 |
Statements of Changes in Net Assets
For the fiscal year ended October 31,
| | | | | | | | |
| | | Managers Real Estate
Securities Fund | |
| | | 2013 | | | 2012 | |
Increase (Decrease) in Net Assets From Operations: | | | | | | | | |
Net investment income | | $ | 2,124,958 | | | $ | 969,883 | |
Net realized gain on investments | | | 11,667,269 | | | | 4,286,642 | |
Net change in unrealized appreciation (depreciation) of investments | | | 2,575,248 | | | | 3,518,401 | |
Net increase in net assets resulting from operations | | | 16,367,475 | | | | 8,774,926 | |
Distributions to Shareholders: | | | | | | | | |
From net investment income: | | | (1,863,912 | ) | | | (855,892 | ) |
From net realized gain on investments: | | | (3,921,545 | ) | | | — | |
Total distributions to shareholders | | | (5,785,457 | ) | | | (855,892 | ) |
Capital Share Transactions: | | | | | | | | |
Proceeds from sale of shares | | | 129,568,438 | | | | 131,112,035 | |
Reinvestment of dividends and distributions | | | 5,096,432 | | | | 731,421 | |
Cost of shares repurchased | | | (100,989,345 | ) | | | (26,962,627 | ) |
Net increase from capital share transactions | | | 33,675,525 | | | | 104,880,829 | |
| | |
Total increase in net assets | | | 44,257,543 | | | | 112,799,863 | |
Net Assets: | | | | | | | | |
Beginning of year | | | 168,368,360 | | | | 55,568,497 | |
End of year | | $ | 212,625,903 | | | $ | 168,368,360 | |
End of year undistributed net investment income (loss) | | $ | 654,982 | | | $ | 188,625 | |
| | | | | | | | |
Share Transactions: | | | | | | | | |
Sale of shares | | | 12,151,788 | | | | 13,173,769 | |
Reinvested shares from dividends and distributions | | | 503,733 | | | | 74,151 | |
Shares repurchased | | | (9,677,837 | ) | | | (2,739,342 | ) |
Net increase in shares | | | 2,977,684 | | | | 10,508,578 | |
|
The accompanying notes are an integral part of these financial statements. 35 |
Managers Frontier Small Cap Growth Fund
Financial Highlights
For a share outstanding throughout each fiscal period
| | | | | | | | | | | | | | | | | | | | |
| | | | | | For the fiscal year ended October 31, | | | For the fiscal
period ended
October 31, 2010* | |
Investor Class | | | | | 2013 | | | 2012 | | | 2011 | | |
Net Asset Value, Beginning of Period | | | | | | $ | 18.81 | | | $ | 17.90 | | | $ | 16.70 | | | $ | 14.64 | |
Income from Investment Operations: | | | | | | | | | | | | | | | | | | | | |
Net investment loss1 | | | | | | | (0.14 | )4 | | | (0.13 | )5 | | | (0.16 | ) | | | (0.11 | ) |
Net realized and unrealized gain on investments1 | | | | | | | 7.59 | | | | 1.04 | | | | 1.36 | | | | 2.17 | |
Total from investment operations | | | | | | | 7.45 | | | | 0.91 | | | | 1.20 | | | | 2.06 | |
Net Asset Value, End of Period | | | | | | $ | 26.26 | | | $ | 18.81 | | | $ | 17.90 | | | $ | 16.70 | |
Total Return2 | | | | | | | 39.61 | % | | | 5.08 | % | | | 7.19 | % | | | 14.07 | %12 |
Ratio of net expenses to average net assets (with offsets/reductions) | | | | | | | 1.58 | %6 | | | 1.55 | % | | | 1.55 | % | | | 1.55 | %13 |
Ratio of expenses to average net assets (with offsets) | | | | | | | 1.58 | %6 | | | 1.55 | % | | | 1.55 | % | | | 1.55 | %13 |
Ratio of total expenses to average net assets (without offsets/reductions)3 | | | | | | | 1.65 | %6 | | | 1.65 | % | | | 1.72 | % | | | 1.94 | %13 |
Ratio of net investment loss to average net assets2 | | | | | | | (0.64 | )%6 | | | (0.70 | )% | | | (0.86 | )% | | | (0.91 | )%13 |
Portfolio turnover | | | | | | | 65 | % | | | 38 | % | | | 44 | % | | | 52 | %12 |
Net assets at end of period (000’s omitted) | | | | | | $ | 366 | | | $ | 474 | | | $ | 563 | | | $ | 406 | |
| | | | | | | | | | | | | | | | | | | | |
| |
| | | For the fiscal year ended October 31, | |
| | | | | |
Service Class | | 2013 | | | 2012 | | | 2011 | | | 2010* | | | 2009 | |
Net Asset Value, Beginning of Year | | $ | 18.92 | | | $ | 17.96 | | | $ | 16.72 | | | $ | 13.42 | | | $ | 11.69 | |
Income from Investment Operations: | | | | | | | | | | | | | | | | | | | | |
Net investment loss1 | | | (0.10 | )4 | | | (0.09 | )5 | | | (0.12 | ) | | | (0.12 | ) | | | (0.10 | ) |
Net realized and unrealized gain on investments1 | | | 7.66 | | | | 1.05 | | | | 1.36 | | | | 3.42 | | | | 1.83 | |
Total from investment operations | | | 7.56 | | | | 0.96 | | | | 1.24 | | | | 3.30 | | | | 1.73 | |
Net Asset Value, End of Year | | $ | 26.48 | | | $ | 18.92 | | | $ | 17.96 | | | $ | 16.72 | | | $ | 13.42 | |
Total Return2 | | | 39.96 | %7 | | | 5.35 | %7 | | | 7.42 | %7 | | | 24.59 | % | | | 14.80 | % |
Ratio of net expenses to average net assets (with offsets/reductions) | | | 1.33 | %6 | | | 1.30 | % | | | 1.30 | % | | | 1.37 | % | | | 1.46 | % |
Ratio of expenses to average net assets (with offsets) | | | 1.33 | %6 | | | 1.30 | % | | | 1.30 | % | | | 1.37 | % | | | 1.46 | % |
Ratio of total expenses to average net assets (without offsets/reductions)3 | | | 1.40 | %6 | | | 1.40 | % | | | 1.47 | % | | | 1.66 | % | | | 1.50 | % |
Ratio of net investment loss to average net assets2 | | | (0.43 | )%6 | | | (0.48 | )% | | | (0.63 | )% | | | (0.78 | )% | | | (0.90 | )% |
Portfolio turnover | | | 65 | % | | | 38 | % | | | 44 | % | | | 52 | % | | | 136 | % |
Net assets at end of year (000’s omitted) | | $ | 15,273 | | | $ | 12,664 | | | $ | 18,199 | | | $ | 18,290 | | | $ | 39,536 | |
| | | | | | | | | | | | | | | | | | | | |
36
Managers Frontier Small Cap Growth Fund
Financial Highlights
For a share outstanding throughout each fiscal period
| | | | | | | | | | | | | | | | |
| | | For the fiscal year ended October 31, | | | For the fiscal
period ended
October 31, 2010* | |
Institutional Class | | 2013 | | | 2012 | | | 2011 | | |
Net Asset Value, Beginning of Period | | $ | 19.04 | | | $ | 18.03 | | | $ | 16.74 | | | $ | 14.64 | |
Income from Investment Operations: | | | | | | | | | | | | | | | | |
Net investment loss1 | | | (0.04 | )4 | | | (0.04 | )5 | | | (0.08 | ) | | | (0.05 | ) |
Net realized and unrealized gain on investments1 | | | 7.72 | | | | 1.05 | | | | 1.37 | | | | 2.15 | |
Total from investment operations | | | 7.68 | | | | 1.01 | | | | 1.29 | | | | 2.10 | |
Net Asset Value, End of Period | | $ | 26.72 | | | $ | 19.04 | | | $ | 18.03 | | | $ | 16.74 | |
Total Return2 | | | 40.34 | % | | | 5.60 | % | | | 7.71 | % | | | 14.34 | %12 |
Ratio of net expenses to average net assets (with offsets/reductions) | | | 1.08 | %6 | | | 1.05 | % | | | 1.05 | % | | | 1.05 | %13 |
Ratio of expenses to average net assets (with offsets) | | | 1.08 | %6 | | | 1.05 | % | | | 1.05 | % | | | 1.05 | %13 |
Ratio of total expenses to average net assets (without offsets/reductions)3 | | | 1.15 | %6 | | | 1.15 | % | | | 1.22 | % | | | 1.44 | %13 |
Ratio of net investment loss to average net assets2 | | | (0.17 | )%6 | | | (0.20 | )% | | | (0.41 | )% | | | (0.41 | )%13 |
Portfolio turnover | | | 65 | % | | | 38 | % | | | 44 | % | | | 52 | %12 |
Net assets at end of period (000’s omitted) | | $ | 58,117 | | | $ | 73,762 | | | $ | 77,217 | | | $ | 11,750 | |
| | | | | | | | | | | | | | | | |
37
Managers AMG TSCM Growth Equity Fund
Financial Highlights
For a share outstanding throughout each fiscal period
| | | | | | | | | | | | | | | | |
| | | For the fiscal year ended October 31, | | | For the fiscal
period ended
October 31, 2010** | |
Investor Class | | 2013 | | | 2012 | | | 2011 | | |
Net Asset Value, Beginning of Period | | $ | 12.75 | | | $ | 11.02 | | | $ | 10.93 | | | $ | 10.00 | |
Income from Investment Operations: | | | | | | | | | | | | | | | | |
Net investment loss1 | | | (0.02 | )8 | | | (0.02 | )5 | | | (0.10 | ) | | | (0.00 | )# |
Net realized and unrealized gain on investments1 | | | 3.89 | | | | 1.75 | | | | 0.19 | | | | 0.93 | |
Total from investment operations | | | 3.87 | | | | 1.73 | | | | 0.09 | | | | 0.93 | |
Distributions to Shareholders from: | | | | | | | | | | | | | | | | |
Net investment income | | | (0.02 | ) | | | — | | | | (0.00 | )# | | | — | |
Net Asset Value, End of Period | | $ | 16.60 | | | $ | 12.75 | | | $ | 11.02 | | | $ | 10.93 | |
Total Return2 | | | 30.41 | % | | | 15.70 | % | | | 0.84 | % | | | 9.30 | %12 |
Ratio of net expenses to average net assets (with offsets/reductions) | | | 1.30 | %9 | | | 1.17 | % | | | 1.11 | % | | | 1.17 | %13 |
Ratio of expenses to average net assets (with offsets) | | | 1.32 | %9 | | | 1.19 | % | | | 1.19 | % | | | 1.17 | %13 |
Ratio of total expenses to average net assets (without offsets/reductions)3 | | | 1.85 | %9 | | | 1.80 | % | | | 2.04 | % | | | 15.15 | %13 |
Ratio of net investment loss to average net assets2 | | | (0.17 | )%9 | | | (0.14 | )% | | | (0.86 | )% | | | (0.11 | )%13 |
Portfolio turnover | | | 102 | % | | | 87 | % | | | 102 | % | | | 50 | %12 |
Net assets at end of period (000’s omitted) | | $ | 5,046 | | | $ | 3,608 | | | $ | 2,465 | | | $ | 14 | |
| | | | | | | | | | | | | | | | |
| | |
| | | For the fiscal year ended October 31, | | | For the fiscal
period ended
October 31, 2010** | |
Service Class | | 2013 | | | 2012 | | | 2011 | | |
Net Asset Value, Beginning of Period | | $ | 12.88 | | | $ | 11.10 | | | $ | 10.94 | | | $ | 10.00 | |
Income from Investment Operations: | | | | | | | | | | | | | | | | |
Net investment income (loss)1 | | | 0.03 | 8 | | | 0.01 | 5 | | | (0.02 | ) | | | (0.00 | )# |
Net realized and unrealized gain on investments1 | | | 3.93 | | | | 1.77 | | | | 0.18 | | | | 0.94 | |
Total from investment operations | | | 3.96 | | | | 1.78 | | | | 0.16 | | | | 0.94 | |
Distributions to Shareholders from: | | | | | | | | | | | | | | | | |
Net investment income | | | (0.04 | ) | | | — | | | | — | | | | — | |
Net Asset Value, End of Period | | $ | 16.80 | | | $ | 12.88 | | | $ | 11.10 | | | $ | 10.94 | |
Total Return2 | | | 30.88 | % | | | 16.04 | %7 | | | 1.46 | %7 | | | 9.40 | %12 |
Ratio of net expenses to average net assets (with offsets/reductions) | | | 0.90 | %9 | | | 0.96 | % | | | 0.96 | % | | | 1.03 | %13 |
Ratio of expenses to average net assets (with offsets) | | | 0.92 | %9 | | | 0.98 | % | | | 1.04 | % | | | 1.03 | %13 |
Ratio of total expenses to average net assets (without offsets/reductions)3 | | | 1.45 | %9 | | | 1.59 | % | | | 1.89 | % | | | 15.00 | %13 |
Ratio of net investment income (loss) to average net assets2 | | | 0.23 | %9 | | | 0.09 | % | | | (0.17 | )% | | | 0.00 | %#,13 |
Portfolio turnover | | | 102 | % | | | 87 | % | | | 102 | % | | | 50 | %12 |
Net assets at end of period (000’s omitted) | | $ | 28,281 | | | $ | 19,498 | | | $ | 18,321 | | | $ | 11 | |
| | | | | | | | | | | | | | | | |
38
Managers AMG TSCM Growth Equity Fund
Financial Highlights
For a share outstanding throughout each fiscal period
| | | | | | | | | | | | | | | | |
| | | | | | | | | | | | For the fiscal
period ended
October 31,
2010** | |
| | | For the fiscal year ended
October 31, | | |
Institutional Class | | 2013 | | | 2012 | | | 2011 | | |
Net Asset Value, Beginning of Period | | $ | 12.87 | | | $ | 11.07 | | | $ | 10.94 | | | $ | 10.00 | |
Income from Investment Operations: | | | | | | | | | | | | | | | | |
Net investment income1 | | | 0.05 | 8 | | | 0.03 | 5 | | | 0.00 | # | | | 0.01 | |
Net realized and unrealized gain on investments1 | | | 3.92 | | | | 1.77 | | | | 0.13 | | | | 0.93 | |
Total from investment operations | | | 3.97 | | | | 1.80 | | | | 0.13 | | | | 0.94 | |
Distributions to Shareholders from: | | | | | | | | | | | | | | | | |
Net investment income | | | (0.07 | ) | | | — | | | | (0.00 | )# | | | — | |
Net Asset Value, End of Period | | $ | 16.77 | | | $ | 12.87 | | | $ | 11.07 | | | $ | 10.94 | |
Total Return2 | | | 31.00 | %7 | | | 16.26 | % | | | 1.23 | % | | | 9.40 | %12 |
Ratio of net expenses to average net assets (with offsets/reductions) | | | 0.80 | %9 | | | 0.77 | % | | | 0.71 | % | | | 0.79 | %13 |
Ratio of expenses to average net assets (with offsets) | | | 0.82 | %9 | | | 0.79 | % | | | 0.79 | % | | | 0.79 | %13 |
Ratio of total expenses to average net assets (without offsets/reductions)3 | | | 1.35 | %9 | | | 1.40 | % | | | 1.64 | % | | | 14.74 | %13 |
Ratio of net investment income to average net assets2 | | | 0.35 | %9 | | | 0.26 | % | | | 0.03 | % | | | 0.27 | %13 |
Portfolio turnover | | | 102 | % | | | 87 | % | | | 102 | % | | | 50 | %12 |
Net assets at end of period (000’s omitted) | | $ | 2,965 | | | $ | 2,279 | | | $ | 1,982 | | | $ | 1,063 | |
| | | | | | | | | | | | | | | | |
39
Managers Micro-Cap Fund
Financial Highlights
For a share outstanding throughout each fiscal period
| | | | | | | | | | | | | | | | | | | | |
| | | For the fiscal year ended October 31, | |
Service Class† | | 2013 | | | 2012 | | | 2011 | | | 2010 | | | 2009 | |
Net Asset Value, Beginning of Year | | $ | 37.26 | | | $ | 36.03 | | | $ | 33.42 | | | $ | 26.37 | | | $ | 25.41 | |
Income from Investment Operations: | | | | | | | | | | | | | | | | | | | | |
Net investment loss1 | | | (0.14 | )4 | | | (0.23 | ) | | | (0.27 | ) | | | (0.25 | ) | | | (0.21 | ) |
Net realized and unrealized gain on investments1 | | | 16.99 | | | | 4.12 | | | | 2.88 | | | | 7.30 | | | | 2.73 | |
Total from investment operations | | | 16.85 | | | | 3.89 | | | | 2.61 | | | | 7.05 | | | | 2.52 | |
Distributions to Shareholders from: | | | | | | | | | | | | | | | | | | | | |
Net investment income | | | (0.07 | ) | | | — | | | | — | | | | — | | | | — | |
Net realized gain on investments | | | (2.85 | ) | | | (2.66 | ) | | | — | | | | — | | | | (1.56 | ) |
Total distributions to shareholders | | | (2.92 | ) | | | (2.66 | ) | | | — | | | | — | | | | (1.56 | ) |
Net Asset Value, End of Year | | $ | 51.19 | | | $ | 37.26 | | | $ | 36.03 | | | $ | 33.42 | | | $ | 26.37 | |
Total Return2 | | | 49.00 | % | | | 11.55 | %††† | | | 7.78 | % | | | 26.73 | %7 | | | 11.34 | %7 |
Ratio of net expenses to average net assets (with offsets/reductions) | | | 1.44 | %10 | | | 1.41 | % | | | 1.41 | % | | | 1.50 | % | | | 1.53 | % |
Ratio of expenses to average net assets (with offsets) | | | 1.45 | %10 | | | 1.43 | % | | | 1.43 | % | | | 1.52 | % | | | 1.56 | % |
Ratio of total expenses to average net assets (without offsets/reductions)3 | | | 1.65 | %10 | | | 1.68 | % | | | 1.66 | % | | | 1.72 | % | | | 1.75 | % |
Ratio of net investment loss to average net assets2 | | | (0.33 | )%10 | | | (0.62 | )% | | | (0.73 | )% | | | (0.84 | )% | | | (0.90 | )% |
Portfolio turnover | | | 96 | % | | | 64 | % | | | 85 | % | | | 93 | % | | | 82 | % |
Net assets at end of year (000’s omitted) | | $ | 172,959 | | | $ | 110,732 | | | $ | 113,742 | | | $ | 135,570 | | | $ | 127,322 | |
| | | | | | | | | | | | | | | | | | | | |
| | | | | | | | | | | | |
| | | For the fiscal year
ended October 31, | | | For the fiscal
period
October 1, 2011
through October 31, | |
Institutional Class†† | | 2013 | | | 2012 | | | 2011 | |
Net Asset Value, Beginning of Period | | $ | 37.37 | | | $ | 36.03 | | | $ | 31.02 | |
Income from Investment Operations: | | | | | | | | | | | | |
Net investment loss1 | | | (0.03 | )4 | | | (0.13 | ) | | | (0.01 | ) |
Net realized and unrealized gain on investments1 | | | 16.99 | | | | 4.13 | | | | 5.02 | |
Total from investment operations | | | 16.96 | | | | 4.00 | | | | 5.01 | |
Distributions to Shareholders from: | | | | | | | | | | | | |
Net investment income | | | (0.17 | ) | | | — | | | | — | |
Net realized gain on investments | | | (2.85 | ) | | | (2.66 | ) | | | — | |
Total distributions to shareholders | | | (3.02 | ) | | | (2.66 | ) | | | — | |
Net Asset Value, End of Period | | $ | 51.31 | | | $ | 37.37 | | | $ | 36.03 | |
Total Return2 | | | 49.36 | % | | | 11.84 | %††† | | | 16.18 | %12 |
Ratio of net expenses to average net assets (with offsets/reductions) | | | 1.19 | %10 | | | 1.16 | % | | | 1.17 | %13 |
Ratio of expenses to average net assets (with offsets) | | | 1.20 | %10 | | | 1.18 | % | | | 1.19 | %13 |
Ratio of total expenses to average net assets (without
offsets/reductions)3 | | | 1.40 | %10 | | | 1.43 | % | | | 1.50 | %13 |
Ratio of net investment loss to average net assets2 | | | (0.08 | )%10 | | | (0.37 | )% | | | (0.42 | )%13 |
Portfolio turnover | | | 96 | % | | | 64 | % | | | 85 | %12 |
Net assets at end of period (000’s omitted) | | $ | 44,089 | | | $ | 29,791 | | | $ | 31,735 | |
| | | | | | | | | | | | |
40
Managers Real Estate Securities Fund
Financial Highlights
For a share outstanding throughout each fiscal period
| | | | | | | | | | | | | | | | | | | | |
| | | For the fiscal year ended October 31, | |
| | | 2013 | | | 2012 | | | 2011 | | | 2010 | | | 2009 | |
Net Asset Value, Beginning of Year | | $ | 10.07 | | | $ | 8.95 | | | $ | 8.12 | | | $ | 5.68 | | | $ | 5.55 | |
Income from Investment Operations: | | | | | | | | | | | | | | | | | | | | |
Net investment income1 | | | 0.11 | | | | 0.09 | | | | 0.06 | | | | 0.08 | | | | 0.12 | |
Net realized and unrealized gain on investments1 | | | 0.96 | | | | 1.11 | | | | 0.83 | | | | 2.43 | | | | 0.16 | |
Total from investment operations | | | 1.07 | | | | 1.20 | | | | 0.89 | | | | 2.51 | | | | 0.28 | |
Distributions to Shareholders from: | | | | | | | | | | | | | | | | | | | | |
Net investment income | | | (0.10 | ) | | | (0.08 | ) | | | (0.06 | ) | | | (0.07 | ) | | | (0.15 | ) |
Net realized gain on investments | | | (0.25 | ) | | | — | | | | — | | | | — | | | | — | |
Total distributions to shareholders | | | (0.35 | ) | | | (0.08 | ) | | | (0.06 | ) | | | (0.07 | ) | | | (0.15 | ) |
Net Asset Value, End of Year | | $ | 10.79 | | | $ | 10.07 | | | $ | 8.95 | | | $ | 8.12 | | | $ | 5.68 | |
Total Return2 | | | 10.89 | %7 | | | 13.43 | % | | | 11.06 | % | | | 44.47 | % | | | 5.77 | % |
Ratio of net expenses to average net assets (with offsets/reductions) | | | 1.26 | %11 | | | 1.26 | % | | | 1.41 | % | | | 1.49 | % | | | 1.48 | % |
Ratio of expenses to average net assets (with offsets) | | | 1.27 | %11 | | | 1.27 | % | | | 1.42 | % | | | 1.50 | % | | | 1.50 | % |
Ratio of total expenses to average net assets (without offsets/reductions)3 | | | 1.27 | %11 | | | 1.28 | % | | | 1.48 | % | | | 1.79 | % | | | 2.47 | % |
Ratio of net investment income to average net assets2 | | | 1.08 | %11 | | | 0.92 | % | | | 0.69 | % | | | 1.12 | % | | | 2.56 | % |
Portfolio turnover | | | 86 | % | | | 36 | % | | | 75 | % | | | 99 | % | | | 107 | % |
Net assets at end of year (000’s omitted) | | $ | 212,626 | | | $ | 168,368 | | | $ | 55,568 | | | $ | 23,787 | | | $ | 14,526 | |
| | | | | | | | | | | | | | | | | | | | |
41
Notes to Financial Highlights
The following footnotes should be read in conjunction with the Financial Highlights of the Funds previously presented in this report.
| | # | Rounds to less than $0.01 per share or 0.01%. |
| | * | Effective January 1, 2010, existing shares of Managers Frontier Small Cap Growth Fund were reclassified and redesignated as Service Class shares. Investor Class and Institutional Class shares commenced operations on January 1, 2010. |
| | ** | Commenced operations on July 30, 2010. |
| | † | Effective October 1, 2011, existing shares of Managers Micro-Cap Fund were reclassified and redesignated as Service Class shares. |
| | †† | As of the close of business on September 30, 2011, Managers Institutional Micro-Cap Fund (“Institutional Micro-Cap”) merged into Managers Micro-Cap Fund. Each full and partial share of Institutional Micro-Cap was exchanged for shares in the new Institutional Class of Micro-Cap in an equivalent dollar amount. |
| | ††† | Returns would have been lower if not for capital inflow resulting from market timing settlements. |
| | 1 | Per share numbers have been calculated using average shares. |
| | 2 | Total returns and net investment income (loss) would have been lower had certain expenses not been offset. |
| | 3 | Excludes the impact of expense reimbursement and expense reductions such as brokerage credits, but includes expense repayments and non-reimbursable expenses, if any, such as interest, taxes and extraordinary expenses. (See Note 1(c) of Notes to Financial Statements.) |
| | 4 | Includes non-recurring dividends. Without these dividends, net investment income per share would have been $(0.20), $(0.17), and $(0.09) for Managers Frontier Small Cap Growth Equity’s Investor Class, Service Class, and Institutional Class shares, respectively, and $(0.31) and $(0.20) for Managers Micro-Cap Fund’s Service Class and Institutional Class shares, respectively. |
| | 5 | Includes non-recurring dividends. Without these dividends, net investment income per share would have been $(0.16), $(0.12), and $(0.07) for Managers Frontier Small Cap Growth Equity’s Investor Class, Service Class, and Institutional Class shares, respectively, and $(0.03), $(0.01), and $0.02 for Managers AMG TSCM Growth Equity Fund’s Investor Class, Service Class, and Institutional Class shares, respectively. |
| | 6 | Includes non-routine extraordinary expenses amounting to 0.026%, 0.026% and 0.026% of average net assets for the Investor Class, Service Class and Institutional Class, respectively. |
| | 7 | The Total Return is based on the Financial Statement Net Asset Values as shown above. |
| | 8 | Includes a non-recurring dividend. Without this dividend, net investment income per share would have been $(0.05), $0.00, and $0.03 for Managers AMG TSCM Growth Equity Fund’s Investor Class, Service Class, and Institutional Class shares, respectively. |
| | 9 | Includes non-routine extraordinary expenses amounting to 0.023%, 0.023% and 0.026% of average net assets for the Investor Class, Service Class and Institutional Class, respectively. |
| | 10 | Includes non-routine extraordinary expenses amounting to 0.022% and 0.022% of average net assets for the Service Class and Institutional Class, respectively. |
| | 11 | Includes non-routine extraordinary expenses amounting to 0.027% of average net assets. |
Notes to Financial Statements
October 31, 2013
| 1. | Summary of Significant Accounting Policies |
Managers Trust I (the “Trust”) is an open-end management investment company organized as a Massachusetts business trust, and registered under the Investment Company Act of 1940, as amended (the “1940 Act”). Currently, the Trust consists of a number of different funds, each having distinct investment management objectives, strategies, risks and policies. Included in this report are the Managers Frontier Small Cap Growth Fund (“Small Cap”), Managers AMG TSCM Growth Equity Fund (“TSCM Growth Equity”), Managers Micro-Cap Fund (“Micro-Cap”) and Managers Real Estate Securities Fund (“Real Estate Securities”), each a “Fund” and collectively the “Funds.”
Small Cap and TSCM Growth Equity each offer three classes of shares: Investor Class, Service Class, and Institutional Class. Micro-Cap currently offers two classes of shares: Institutional Class and Service Class. Each class represents an interest in the same assets of the Fund and the classes are identical except for class specific expenses related to shareholder activity. Each class has equal voting privileges except that each class has exclusive voting rights with respect to its services and/or distribution plan. Please refer to a current prospectus for additional information on each share class.
The Funds’ financial statements are prepared in accordance with accounting principles generally accepted in the United States of America (“U.S. GAAP”), which require management to make estimates and assumptions that affect the reported amounts of assets and liabilities and disclosure of contingent assets and liabilities at the date of the financial statements and the reported amounts of income and expenses during the reporting periods. Actual results could differ from those estimates and such differences could be material. The following is a summary of significant accounting policies followed by the Funds in the preparation of their financial statements:
| a. | Valuation of Investments |
Equity securities traded on a domestic or international securities exchange are valued at the last quoted sale price, or, lacking any sales, at the last quoted bid price. Over-the-counter securities are valued at the Nasdaq Official Closing Price, if one is available. Lacking any sales, over-the-counter securities are valued at the last quoted bid price. The Funds’ investments are generally valued based on market quotations provided by third-party pricing services approved by the Board of Trustees of the Funds (the “Board”).
Short-term investments having a remaining maturity of 60 days or less are generally valued at amortized cost, which approximates market value. Investments in other open-end regulated investment companies are valued at their end of day net asset value per share.
Under certain circumstances, the value of certain Fund investments (including derivatives) may be based on an evaluation of fair value, pursuant to procedures established by and under the general supervision of the Board. The Pricing Committee is the committee formed by the Board to make fair value determinations for such investments. When determining the fair value of an investment, the Pricing Committee seeks to determine the price that the Fund might reasonably expect to receive from a current sale of that investment in an arm’s-length transaction. Fair value determinations shall be based upon consideration of all available facts and information, including, but not limited to (i) attributes specific to the investment;
(ii) fundamental analytical data and press releases relating to the investment and its issuer; (iii) the value of comparable securities or relevant financial instruments, including derivative securities, traded on other markets or among dealers; and (iv) other factors, such as future cash flows, interest rates, yield curves, volatilities, credit risks and/or default rates. The Board will be presented with a quarterly report comparing fair values determined by the Pricing Committee against subsequent market valuations for those securities. The values assigned to fair value investments are based on available information and do not necessarily represent amounts that might ultimately be realized, since such amounts depend on future developments inherent in long-term investments. Further, because of the inherent uncertainty of valuation, those estimated values may differ significantly from the values that would have been used had a ready market for the investments existed, and the differences could be material. Each Fund may use the fair value of a portfolio investment to calculate its Net Asset Value (“NAV”) when, for example, (1) market quotations are not readily available because a portfolio investment is not traded in a public market or the principal market in which the investment trades is closed, (2) trading in a portfolio investment is suspended and has not resumed before the Fund calculates its NAV, (3) a significant event affecting the value of a portfolio investment is determined to have occurred between the time of the market quotation provided for a portfolio investment and the time as of which the Fund calculates its NAV, (4) an investment’s price has remained unchanged over a period of time (often referred to as a “stale price”), or (5) Managers Investment Group LLC (the “Investment Manager”) determines that a market quotation is inaccurate. Portfolio investments that trade primarily on foreign markets are priced based upon the market quotation of such securities as of the close of their respective principal markets. Under certain circumstances, the Investment Manager may adjust such prices based on its determination of the impact of events occurring subsequent to the close of such markets but prior to the time as of which each Fund calculates its NAV. The Funds may invest in securities that may be thinly traded. The Board has adopted procedures to adjust prices of thinly traded securities that are judged to be stale so that they reflect fair value. An investment valued on the basis of its fair value may be valued at a price higher or lower than available market quotations. An investment valuation may differ depending on the method used and the factors considered in determining value according to the Funds’ fair value procedures.
U.S. GAAP defines fair value as the price that a Fund would receive to sell an asset or pay to transfer a liability in an orderly transaction between market participants at the measurement date. U.S. GAAP also establishes a framework for measuring fair value, and a three level hierarchy for fair value measurements based upon the transparency of inputs to the valuation of an asset or liability. Inputs may be observable or unobservable and refer broadly to the assumptions that market participants would use in pricing the asset or liability. Observable inputs reflect the assumptions market participants would use in pricing the asset or liability based on market data obtained from sources independent of the Funds. Unobservable inputs reflect the Funds’ own assumptions about the assumptions that market participants would use in pricing the asset or liability developed based on the best information available in the
Notes to Financial Statements (continued)
circumstances. Each investment is assigned a level based upon the observability of the inputs which are significant to the overall valuation.
The three-tier hierarchy of inputs is summarized below:
Level 1 – inputs are quoted prices in active markets for identical investments (e.g., equity securities, open-end investment companies)
Level 2 – other observable inputs (including, but not limited to: quoted prices for similar assets or liabilities in markets that are active, quoted prices for identical or similar assets or liabilities in markets that are not active, inputs other than quoted prices that are observable for the assets or liabilities (such as interest rates, yield curves, volatilities, prepayment speeds, loss severities, credit risks and default rates) or other market corroborated inputs) (e.g., debt securities, government securities, foreign securities utilizing international fair value pricing, broker-quoted securities, fair valued securities with observable inputs)
Level 3 – inputs are significant unobservable inputs (including the Fund’s own assumptions used to determine the fair value of investments) (e.g., fair valued securities with unobservable inputs)
Changes in inputs or methodologies used for valuing investments may result in a transfer in or out of levels within the fair value hierarchy. The inputs or methodologies used for valuing investments are not necessarily an indication of the risk associated with investing in those investments.
Security transactions are accounted for as of trade date. Realized gains and losses on securities sold are determined on the basis of identified cost.
| c. | Investment Income and Expenses |
Dividend income is recorded on the ex-dividend date. Dividend and interest income on foreign securities is recorded net of any withholding tax. Interest income, which includes amortization of premium and accretion of discount on debt securities, is accrued as earned. Non-cash dividends included in dividend income, if any, are reported at the fair market value of the securities received. Distributions received in excess of income from return of capital including real estate-investment trusts (REITs) are recorded as a reduction of the cost of the related investment and/or as a realized gain. If the Fund no longer owns the applicable securities, any distributions received in excess of income are recorded as an adjustment to realized gain. Other income and expenses are recorded on an accrual basis. Expenses that cannot be directly attributed to a Fund are apportioned among the Funds in the Trust and in some cases other affiliated funds based upon their relative average net assets or number of shareholders. For Small Cap, TSCM Growth Equity and Micro-Cap Funds, investment income, realized and unrealized capital gains and losses, the common expenses of each Fund, and certain Fund level expense reductions, if any, are allocated on a pro rata basis to each class based on the relative net assets of each class to the total net assets of each Fund.
The following Funds had certain portfolio trades directed to various brokers, under a brokerage recapture program, which paid a portion of such Fund’s expenses. For the fiscal year ended October 31, 2013, the amount by which the Funds’ expenses were reduced and
the impact on the expense ratios if any, were as follows: TSCM Growth Equity -$4,605 or 0.02%, Micro-Cap -$21,771 or 0.01% and Real Estate Securities -$16,794 or 0.01%.
The Funds have a “balance credit” arrangement with The Bank of New York Mellon (“BNYM”), the Funds’ custodian, whereby each Fund is credited with an interest factor equal to 0.75% below the effective 90-day T-Bill rate for account balances left uninvested overnight. If the T-Bill rate falls below 0.75%, no credits will be earned. These credits serve to reduce custody expenses that would otherwise be charged to each Fund. For the fiscal year ended October 31, 2013, the custodian expense was not reduced.
Overdraft fees are computed at 1% above the effective Federal Funds rate on the day of the overdraft. Prior to January 1, 2013, the rate was 2% above the effective Federal Funds rate. For the fiscal year ended October 31, 2013, the overdraft fees for TSCM Growth Equity, Micro-Cap and Real Estate Securities equaled $6, $7 and $344, respectively.
The Trust has filed a proxy statement with the SEC to approve a new Declaration of Trust for the Trust, among other proposals. The costs associated with this proxy are being treated as “extraordinary expenses,” and, therefore, are excluded from the expense limitation agreement described in Note 2.
| d. | Dividends and Distributions |
Dividends resulting from net investment income, if any, normally will be declared and paid annually for Small Cap, Micro-Cap, and TSCM Growth Equity and quarterly for Real Estate Securities. Distributions of capital gains, if any, will be made on an annual basis and when required for Federal excise tax purposes. Dividends and distributions to shareholders are recorded on the ex-dividend date. Income and capital gain distributions are determined in accordance with Federal income tax regulations, which may differ from U.S. GAAP. The most common differences are due to differing treatments for losses deferred due to wash sales, REITs and market discount transactions. Permanent book and tax basis differences, if any, relating to shareholder distributions will result in reclassifications to paid-in capital.
Notes to Financial Statements (continued)
The tax character of distributions paid during the fiscal years ended October 31, 2013 and October 31, 2012 were as follows:
| | | | | | | | | | | | | | | | | | | | | | | | | | | | | | | | |
| | | Small Cap | | | TSCM Growth
Equity | | | Micro-Cap | | | Real Estate Securities | |
| | | 2013 | | | 2012 | | | 2013 | | | 2012 | | | 2013 | | | 2012 | | | 2013 | | | 2012 | |
Distributions paid from: | | | | | | | | | | | | | | | | | | | | | | | | | | | | | | | | |
Ordinary income | | | — | | | | — | | | $ | 89,067 | | | | — | | | | — | | | | — | | | $ | 1,720,440 | | | $ | 855,892 | |
Short-term capital gains | | | — | | | | — | | | | — | | | | — | | | $ | 335,270 | | | | — | | | | 1,449,621 | | | | — | |
Long-term capital gains | | | — | | | | — | | | | — | | | | — | | | | 10,641,804 | | | $ | 10,525,163 | | | | 2,615,396 | | | | — | |
Return of capital | | | — | | | | — | | | | — | | | | — | | | | — | | | | — | | | | — | | | | — | |
| | | | | | | | | | | | | | | | | | | | | | | | | | | | | | | | |
| | | — | | | | — | | | $ | 89,067 | | | | — | | | $ | 10,977,074 | | | $ | 10,525,163 | | | $ | 5,785,457 | | | $ | 855,892 | |
| | | | | | | | | | | | | | | | | | | | | | | | | | | | | | | | |
As of October 31, 2013, the components of distributable earnings (excluding unrealized appreciation/depreciation) on a tax basis consisted of:
| | | | | | | | | | | | | | | | |
| | | Small Cap | | | TSCM Growth
Equity | | | Micro-Cap | | | Real Estate
Securities | |
Capital loss carryforward | | | — | | | | — | | | | — | | | | — | |
Undistributed ordinary income | | | — | | | | — | | | $ | 13,504,325 | | | $ | 654,982 | |
Undistributed short-term capital gains | | $ | 3,364,676 | | | $ | 1,450,346 | | | | — | | | | 2,782,554 | |
Undistributed long-term capital gains | | | 4,977,420 | | | | 2,424,260 | | | | 14,949,962 | | | | 9,474,858 | |
Post-October loss deferral | | | — | | | | 14,957 | | | | — | | | | — | |
Each Fund intends to comply with the requirements under Subchapter M of the Internal Revenue Code of 1986, as amended, and to distribute substantially all of its taxable income and gains to its shareholders and to meet certain diversification and income requirements with respect to investment companies. Therefore, no provision for Federal income or excise tax is included in the accompanying financial statements.
Additionally, based on each Fund’s understanding of the tax rules and rates related to income, gains and transactions for the foreign jurisdictions in which it invests, each Fund will provide for foreign taxes, and where appropriate, deferred foreign taxes.
Management has analyzed the Funds’ tax positions taken on Federal income tax returns as of October 31, 2013 and for all open tax years and has concluded that no provision for Federal income tax is required in the Funds’ financial statements. Additionally, the Funds are not aware of any tax position for which it is reasonably possible that the total amounts of unrecognized tax benefits will change materially in the next twelve months.
Under the Regulated Investment Company Modernization Act of 2010, post-enactment capital losses may be carried forward for an unlimited time period. However, any new losses incurred will be required to be utilized prior to any loss carryovers incurred in pre-enactment taxable years, which generally expire eight years
following the close of the taxable year in which they were incurred. As a result of this ordering rule, pre-enactment capital loss carryovers may be more likely to expire unused. Additionally, post-enactment capital losses that are carried forward retain their tax character as either short-term or long-term capital losses rather than being considered all short-term as under previous law.
| f. | Capital Loss Carryovers and Deferrals |
As of October 31, 2013, the Funds had no accumulated net realized capital loss carryovers from securities transactions for Federal income tax purposes. Should the Funds incur net capital losses for the year ended October 31, 2014, such amounts may be used to offset future realized capital gains, if any, through the expiration dates listed or in the case of post-enactment losses, for an unlimited time period.
For the fiscal year ended October 31, 2013, the following Funds utilized capital loss carryovers in the amount of:
| | | | | | | | |
| | | Capital Loss Carryovers
Utilized | |
| | | Short-Term | | | Long-Term | |
Small Cap | | $ | 244,392 | | | | — | |
TSCM Growth Equity | | | 643,689 | | | | — | |
Notes to Financial Statements (continued)
The Trust’s Declaration of Trust authorizes for each series the issuance of an unlimited number of shares of beneficial interest, without par value. Each Fund records sales and repurchases of its capital stock on the trade date. The cost of securities contributed to the Funds in connection with the issuance of shares is based on the valuation of those securities in accordance with the Funds’ policy on investment valuation.
For the fiscal years ended October 31, 2013, and October 31, 2012, the capital stock transactions by class for the Small Cap, TSCM Growth Equity and Micro-Cap were:
| | | | | | | | | | | | | | | | | | | | | | | | | | | | | | | | |
| | | Small Cap | | | TSCM Growth Equity | |
| | | 2013 | | | 2012 | | | 2013 | | | 2012 | |
| | | Shares | | | Amount | | | Shares | | | Amount | | | Shares | | | Amount | | | Shares | | | Amount | |
Investor Class Shares | | | | | | | | | | | | | | | | | | | | | | | | | | | | | | | | |
Proceeds from sale of shares | | | 472 | | | $ | 11,202 | | | | 52 | | | $ | 1,000 | | | | 44,427 | | | $ | 652,528 | | | | 66,027 | | | $ | 796,782 | |
Reinvestment of distributions | | | — | | | | — | | | | — | | | | — | | | | 465 | | | | 6,034 | | | | — | | | | — | |
Cost of shares repurchased | | | (11,753 | ) | | | (257,651 | ) | | | (6,303 | ) | | | (115,848 | ) | | | (23,858 | ) | | | (354,373 | ) | | | (6,791 | ) | | | (85,317 | ) |
| | | | | | | | | | | | | | | | | | | | | | | | | | | | | | | | |
Net increase (decrease) | | | (11,281 | ) | | $ | (246,449 | ) | | | (6,251 | ) | | $ | (114,848 | ) | | | 21,034 | | | $ | 304,189 | | | | 59,236 | | | $ | 711,465 | |
| | | | | | | | | | | | | | | | | | | | | | | | | | | | | | | | |
Service Class Shares | | | | | | | | | | | | | | | | | | | | | | | | | | | | | | | | |
Proceeds from sale of shares | | | 14,996 | | | $ | 346,091 | | | | 45,568 | | | $ | 876,060 | | | | 506,959 | | | $ | 7,532,724 | | | | 240,701 | | | $ | 2,940,331 | |
Reinvestment of distributions | | | — | | | | — | | | | — | | | | — | | | | 5,075 | | | | 66,433 | | | | — | | | | — | |
Cost of shares repurchased | | | (107,664 | ) | | | (2,411,622 | ) | | | (389,323 | ) | | | (7,195,772 | ) | | | (342,293 | ) | | | (5,092,088 | ) | | | (377,040 | ) | | | (4,564,994 | ) |
| | | | | | | | | | | | | | | | | | | | | | | | | | | | | | | | |
Net increase (decrease) | | | (92,668 | ) | | $ | (2,065,531 | ) | | | (343,755 | ) | | $ | (6,319,712 | ) | | | 169,741 | | | $ | 2,507,069 | | | | (136,339 | ) | | $ | (1,624,663 | ) |
| | | | | | | | | | | | | | | | | | | | | | | | | | | | | | | | |
Institutional Class Shares | | | | | | | | | | | | | | | | | | | | | | | | | | | | | | | | |
Proceeds from sale of shares | | | 24,657 | | | $ | 530,043 | | | | 145,614 | | | $ | 2,684,462 | | | | 98,087 | | | $ | 1,355,750 | | | | 57,631 | | | $ | 720,319 | |
Reinvestment of distributions | | | — | | | | — | | | | — | | | | — | | | | 1,097 | | | | 14,314 | | | | — | | | | — | |
Cost of shares repurchased | | | (1,723,427 | ) | | | (38,939,908 | ) | | | (553,664 | ) | | | (10,289,613 | ) | | | (99,460 | ) | | | (1,435,701 | ) | | | (59,612 | ) | | | (731,281 | ) |
| | | | | | | | | | | | | | | | | | | | | | | | | | | | | | | | |
Net decrease | | | (1,698,770 | ) | | $ | (38,409,865 | ) | | | (408,050 | ) | | $ | (7,605,151 | ) | | | (276 | ) | | $ | (65,637 | ) | | | (1,981 | ) | | $ | (10,962 | ) |
| | | | | | | | | | | | | | | | | | | | | | | | | | | | | | | | |
Notes to Financial Statements (continued)
| | | | | | | | | | | | | | | | |
| | | Micro-Cap | |
| | | 2013 | | | 2012 | |
| | | Shares | | | Amount | | | Shares | | | Amount | |
Service Class Shares | | | | | | | | | | | | | | | | |
Proceeds from sale of shares | | | 769,762 | | | $ | 35,294,189 | | | | 65,755 | | | $ | 2,901,959 | † |
Reinvestment of distributions | | | 245,892 | | | | 8,478,353 | | | | 238,842 | | | | 8,075,238 | |
Cost of shares repurchased | | | (608,491 | ) | | | (25,727,865 | ) | | | (489,724 | ) | | | (17,676,338 | ) |
| | | | | | | | | | | | | | | | |
Net increase (decrease) | | | 407,163 | | | $ | 18,044,677 | | | | (185,127 | ) | | $ | (6,699,141 | ) |
| | | | | | | | | | | | | | | | |
Institutional Class Shares | | | | | | | | | | | | | | | | |
Proceeds from sale of shares | | | 171,893 | | | $ | 8,092,144 | | | | 69,753 | | | $ | 2,644,029 | † |
Reinvestment of distributions | | | 66,982 | | | | 2,310,199 | | | | 67,898 | | | | 2,296,309 | |
Cost of shares repurchased | | | (176,822 | ) | | | (7,678,876 | ) | | | (221,147 | ) | | | (8,023,064 | ) |
| | | | | | | | | | | | | | | | |
Net increase (decrease) | | | 62,053 | | | $ | 2,723,467 | | | | (83,496 | ) | | $ | (3,082,726 | ) |
| | | | | | | | | | | | | | | | |
| † | Includes market timing settlements of $503,960 and $143,752 for Service Class and Institutional Class, respectively. |
At October 31, 2013, certain unaffiliated shareholders of record, specifically omnibus accounts, individually or collectively held greater than 10% of the outstanding shares of the following Funds: Small Cap - five collectively own 63%; TSCM Growth Equity - four collectively own 21%; Micro-Cap - four collectively own 52%; Real Estate Securities - three collectively own 59%. Transactions by these shareholders may have a material impact on the respective Funds.
The Funds may enter into repurchase agreements provided that the value of the underlying collateral, including accrued interest, will equal or exceed the value of the repurchase agreement during the term of the agreement. The underlying collateral for all repurchase agreements is held in safekeeping by the Fund’s custodian or at the Federal Reserve Bank. If the seller defaults and the value of the collateral declines, or if bankruptcy proceedings commence with respect to the seller of the security, realization of the collateral by the Fund may be delayed or limited. At October 31, 2013, the market value of repurchase agreements outstanding for Small Cap and Micro-Cap was $3,186,444 and $9,923,618, respectively.
| 2. | Agreements and Transactions with Affiliates |
For each of the Funds, the Trust has entered into an Investment Management Agreement under which the Investment Manager, a subsidiary of Affiliated Managers Group, Inc. (“AMG”), serves as investment manager to the Funds and is responsible for the Funds’ overall administration and operations. The Investment Manager selects subadvisors for the Funds (subject to Board approval) and monitors each subadvisor’s investment performance, security holdings and investment strategies. Each Fund’s investment portfolio is managed by one or more portfolio managers who serve pursuant to a subadvisory agreement with the Investment Manager. Small Cap is managed by Frontier Capital Management Co., LLC (“Frontier”). TSCM Growth Equity is managed by TimesSquare Capital Management, LLC (“TimesSquare”). AMG indirectly owns a majority interest in Frontier and TimesSquare.
Investment management fees are paid directly by the Funds to the Investment Manager based on average daily net assets. For the fiscal year ended October 31, 2013, the annual investment
management fee rates, as a percentage of average daily net assets, were as follows:
| | | | |
Small Cap | | | 1.00 | % |
TSCM Growth Equity | | | 0.75 | % |
Micro-Cap | | | 1.00 | % |
Real Estate Securities | | | 0.60 | % |
The Investment Manager has contractually agreed, through March 1, 2014, to waive management fees and/or reimburse Fund expenses in order to limit total annual Fund operating expenses after fee waiver and expense reimbursements (exclusive of taxes, interest (including interest incurred in connection with bank and custody overdrafts), shareholder servicing fees, distribution and service (12b-1) fees, brokerage commissions, and other transaction costs, acquired fund fees and expenses and extraordinary expenses) of Small Cap, TSCM Growth Equity, and Micro-Cap to 1.05%, 0.79%, and 1.18%, respectively, of each Fund’s average daily net assets.
Notes to Financial Statements (continued)
Effective July 1, 2012, the Investment Manager has contractually agreed through March 1, 2014 to waive management fees and/or reimburse Fund expenses in order to limit the Real Estate Securities Fund’s total annual Fund operating expenses after fee waiver and expense reimbursements (exclusive of taxes, interest (including interest incurred in connection with bank and custody overdrafts), brokerage commissions and other transaction costs, acquired fund fees and expenses, and extraordinary expenses) to 1.24% of the Fund’s average daily net assets. Immediately prior to July 1, 2012, the Fund had a contractual expense limitation of 1.29%.
Each Fund is obligated to repay the Investment Manager such amounts waived, paid or reimbursed in future years provided that the repayment occurs within thirty-six (36) months after the waiver or reimbursement and that such repayment would not cause the Fund’s total operating expenses in any such future year to exceed that Fund’s respective expense cap. For the fiscal year ended October 31, 2013, each Fund’s components of reimbursement available are detailed in the following chart:
| | | | | | | | | | | | |
| | | Small Cap | | | TSCM Growth
Equity | | | Micro-Cap | |
Reimbursement Available - 10/31/12 | | $ | 298,552 | | | $ | 343,952 | | | $ | 951,105 | |
Additional Reimbursements | | | 62,431 | | | | 159,766 | | | | 319,324 | |
Repayments | | | — | | | | — | | | | — | |
Expired Reimbursements | | | (92,681 | ) | | | (38,363 | ) | | | (266,870 | ) |
| | | | | | | | | | | | |
Reimbursement Available - 10/31/13 | | $ | 268,302 | | | $ | 465,355 | | | $ | 1,003,559 | |
| | | | | | | | | | | | |
| | | | |
| | | Real Estate
Securities | |
Reimbursement Available - 10/31/12 | | $ | 92,162 | |
Additional Reimbursements | | | 6,318 | |
Repayments | | | (65,671 | ) |
Expired Reimbursements | | | (7,147 | ) |
| | | | |
Reimbursement Available - 10/31/13 | | $ | 25,662 | |
| | | | |
Small Cap is obligated by its investment management contract to pay an annual management fee to the Investment Manager. The Investment Manager, in turn, pays all or a portion of this fee to Frontier. Under its Investment Manager Agreement with the Fund, the Investment Manager provides a variety of administrative services to the Fund. The Investment Manager receives compensation from Frontier for its administrative services to the Fund pursuant to a separate agreement between the Investment Manager and Frontier. For each of the Funds other than Small Cap, the Trust has entered into an Administration and Shareholder Servicing Agreement under which the Investment Manager serves as the Funds’ administrator (the “Administrator”) and is responsible for all aspects of managing the Funds’ operations, including administration and shareholder services to each Fund, its shareholders, and certain institutions, such as bank trust departments, broker-dealers and registered investment advisers,
that advise or act as an intermediary with the Funds’ shareholders. The Funds pays a fee to the Administrator at the rate of 0.25% per annum of each Fund’s average daily net assets for this service.
The aggregate annual retainer paid to each Independent Trustee of the Board is $105,000, plus $6,000 or $2,500 for each regular or special meeting attended, respectively. The Independent Chairman of the Trusts receives an additional payment of $25,000 per year. The Chairman of the Audit Committee receives an additional payment of $10,000 per year. The Trustees’ fees and expenses are allocated among all of the funds for which the Investment Manager serves as the advisor (the “Managers Funds”) based on the relative net assets of such Funds. The “Trustees fees and expenses” shown in the financial statements represents each Fund’s allocated portion of the total fees and expenses paid by the Managers Funds.
Prior to January 1, 2013, the aggregate annual retainer paid to each Independent Trustee of the Board was $80,000, plus $5,000 or $2,500 for each regular or special meeting attended, respectively. The Independent Chairman of the Trust formerly received an additional payment of $20,000 per year. The Chairman of the Audit Committee formerly received an additional payment of $8,000 per year.
The Funds are distributed by Managers Distributors, Inc. (the “Distributor” or “MDI”), a wholly-owned subsidiary of the Investment Manager. MDI serves as the distributor and underwriter for each Fund and is a registered broker-dealer and member of the Financial Industry Regulatory Authority, Inc. (“FINRA”). Shares of each Fund will be continuously offered and will be sold directly to prospective purchasers through brokers, dealers or other financial intermediaries who have executed selling agreements with MDI. Subject to the compensation arrangement discussed below, generally MDI bears all or a portion of the expenses of providing services pursuant to the distribution agreement, including the payment of the expenses relating to the distribution of prospectuses for sales purposes and any advertising or sales literature. Certain Trustees and Officers of the Funds are Officers and/or Directors of the Investment Manager, AMG and/or the Distributor.
Small Cap and TSCM Growth Equity have adopted a distribution and service plan (the “Plan”) with respect to the Investor Class shares in accordance with the requirements of Rule 12b-1 under the 1940 Act and the requirements of the applicable rules of FINRA regarding asset based sales charges. Pursuant to the Plan, each Fund may compensate the Distributor for its expenditures in financing any activity primarily intended to result in the sale of such class of the Fund’s shares and for maintenance and personal service provided to existing shareholders of that class. The Plan authorizes payments to the Distributor up to 0.25% annually of each Fund’s average daily net assets attributable to the Investor Class shares.
Notes to Financial Statements (continued)
For each of the Investor and Service Classes, the Board has approved reimbursement payments to the Investment Manager for shareholder servicing expenses incurred (“shareholder servicing fees”). Shareholder servicing fees include payments to third parties such as a bank, broker-dealer, trust company or other financial intermediaries who provide shareholder recordkeeping and account servicing services. The Investor and Service Class shares may reimburse the Investment Manager for the actual amount incurred up to a maximum annual rate of each Class’s average daily net asset value as shown in the table below.
The impact on the annualized expense ratios for the fiscal year ended October 31, 2013 were as follows:
| | | | | | | | |
Fund | | Maximum Amount
Allowed | | | Actual Amount
Incurred | |
Small Cap | | | | | | | | |
Investor Class | | | 0.25 | % | | | 0.25 | % |
Service Class | | | 0.25 | % | | | 0.25 | % |
TSCM Growth Equity | |
Investor Class | | | 0.25 | % | | | 0.25 | % |
Service Class | | | 0.25 | % | | | 0.10 | % |
Micro-Cap | | | | | | | | |
Service Class | | | 0.25 | % | | | 0.25 | % |
The Securities and Exchange Commission granted an exemptive order that permits the Funds to lend and borrow money for certain temporary purposes directly to and from other eligible Managers Funds. Participation in this interfund lending program is voluntary for both borrowing and lending funds, and an interfund loan is only made if it benefits each participating fund. The Investment Manager administers the program according to procedures approved by the Board, and the Board monitors the operation of the program. An interfund loan must comply with certain conditions set out in the exemptive order, which are designed to assure fairness and protect all participating Funds. For the fiscal year ended October 31, 2013, the following Funds either borrowed from or lent to other Managers Funds: Small Cap borrowed varying amounts not exceeding $4,938,975, for seven days paying interest of $511 and Real Estate Securities borrowed varying amounts not exceeding $8,984,135, for six days paying interest of $1,342. The interest amount is included in the Statement of Operations as miscellaneous expense. Micro-Cap lent $1,111,119, for one day earning interest of $36. The interest amount is included in the Statement of Operations as interest income. At October 31, 2013, the Funds had no loans outstanding.
For the fiscal year ended October 31, 2013, the Micro-Cap Fund executed the following transaction at the closing price of the security and with no commissions under Rule 17a-7 procedures approved by the Board:
December 10, 2012 – sold 10,145 shares of Western Alliance Bancorp at $10.08 to Lord Abbett Value Opportunities Fund.
June 26, 2013 – sold 3,718 shares of Shutterstock, Inc. at $49.75 to Lord Abbett Developing Growth Fund.
August 13, 2013 – sold 2,743 shares of Western Alliance Bancorp at $17.785 to Lord Abbett Securities Trust- Value Opportunities Fund
| 3. | Purchases and Sales of Securities |
Purchases and sales of securities (excluding short-term securities and U.S. Government Obligations) for the fiscal year ended October 31, 2013, were as follows:
| | | | | | | | |
| | | Long-Term Securities | |
Fund | | Purchases | | | Sales | |
Small Cap | | $ | 54,007,426 | | | $ | 93,982,397 | |
TSCM Growth Equity | | | 32,906,272 | | | | 30,385,017 | |
Micro-Cap | | | 160,267,793 | | | | 155,644,483 | |
Real Estate Securities | | | 194,717,400 | | | | 164,265,848 | |
The Funds had no purchases or sales of U.S. Government obligations during the fiscal year ended October 31, 2013.
| 4. | Portfolio Securities Loaned |
The Funds, other than Real Estate Securities, participate in a securities lending program offered by BNYM (the “Program”), providing for the lending of securities to qualified brokers. Securities lending income includes earnings of such temporary cash investments, plus or minus any rebate to a borrower. These earnings (after any rebate) are then divided between BNYM, as a fee for its services under the program, and the Funds, according to agreed-upon rates. Collateral on all securities loaned is accepted in cash and is maintained at a minimum level of 102% (105% in the case of certain foreign securities) of the market value, plus interest, if applicable, of investments on loan. It is the Funds’ policy to obtain additional collateral from or return excess collateral to the borrower by the end of the next business day, following the valuation date of the securities loaned. Therefore, the value of the collateral held may be temporarily less than the value of the securities on loan. Lending securities entails a risk of loss to the Funds if and to the extent that the market value of the securities loaned were to increase and the borrower did not increase the collateral accordingly, and the borrower fails to return the securities. Under the terms of the Program, the Funds are indemnified for such losses by BNYM. Cash collateral is held in a separate account managed by BNYM, who is authorized to exclusively enter into overnight government repurchase agreements. BNYM bears the risk of any deficiency in the amount of the cash collateral available for return to the borrower due to any loss on the collateral invested.
| 5. | Commitments and Contingencies |
In the normal course of business, the Funds may enter into contracts and agreements that contain a variety of representations and warranties, which provide general indemnifications. The maximum exposure to the Funds under these arrangements is unknown, as this would involve future claims that may be made against a Fund that have not yet occurred. However, based on experience, the Funds had no prior claims or losses and expect the risks of loss to be remote.
Notes to Financial Statements (continued)
| 6. | New Accounting Pronouncements |
In December 2011, the Financial Accounting Standards Board (“FASB”) issued Accounting Standards Update (“ASU”) No. 2011- 11 “Disclosures about Offsetting Assets and Liabilities.” ASU 2011-11 requires disclosures to make financial statements that are prepared under U.S. GAAP more comparable to those prepared under IFRS. The new disclosure requirements mandate that entities disclose both gross and net information about instruments and transactions eligible for offset in the statement of assets and liabilities as well as instruments and transactions subject to an agreement similar to a master netting arrangement. In addition, ASU 2011-11 requires disclosure of collateral received and posted in connection with master netting agreements or similar arrangements. New disclosures are required for annual reporting periods beginning on or after January 1, 2013, and interim periods within those annual periods. Management is evaluating the impact of ASU 2011-11 on the Funds’ financial statements and disclosures.
The Funds have determined that no material events or transactions occurred through the issuance date of the Funds’ financial
statements which require additional disclosure in or adjustment of the Funds’ financial statements.
Tax Information (unaudited)
Managers Frontier Small Cap Growth Fund, Managers AMG TSCM Growth Equity Fund, Managers Micro-Cap Fund, and Managers Real Estate Securities Fund each hereby designate the maximum amount allowable of its net taxable income as qualified dividends as provided in the Jobs and Growth Tax Relief Reconciliation Act of 2003. The 2013 Form 1099-DIV you receive for each Fund will show the tax status of all distributions paid to you during the year.
Pursuant to section 852 of the Internal Revenue Code, Frontier Small Cap Growth Fund, Managers AMG TSCM Growth Equity Fund, Managers Micro-Cap Fund, and Managers Real Estate Securities Fund each hereby designate $4,977,420, $2,424,260, $10,641,804 and $9,474,858, respectively, as a capital gain distribution with respect to the taxable year ended October 31, 2013, or if subsequently determined to be different, the net capital gains of such year.
Report of Independent Registered Public Accounting Firm
To the Board of Trustees of Managers Trust I and the Shareholders of Managers Frontier Small Cap Growth Fund, Managers AMG TSCM Growth Equity Fund, Managers Micro-Cap Fund and Managers Real Estate Securities Fund:
In our opinion, the accompanying statements of assets and liabilities, including the schedules of portfolio investments, and the related statements of operations and of changes in net assets and the financial highlights present fairly, in all material respects, the financial position of Managers Frontier Small Cap Growth Fund, Managers AMG TSCM Growth Equity Fund, Managers Micro-Cap Fund and Managers Real Estate Securities Fund (the “Funds”) at October 31, 2013, and the results of each of their operations, the changes in each of their net assets and the financial highlights for each of the periods indicated, in conformity with accounting principles generally accepted in the United States of America. These financial statements and financial highlights (hereafter referred to as “financial statements”) are the responsibility of the Funds’ management. Our responsibility is to express an opinion on these financial statements based on our audits. We conducted our audits of these financial statements in accordance with the standards of the Public Company Accounting Oversight Board (United States). Those standards require that we plan and perform the audit to obtain reasonable assurance about whether the financial statements are free of material misstatement. An audit includes examining, on a test basis, evidence supporting the amounts and disclosures in the financial statements, assessing the accounting principles used and significant estimates made by management, and evaluating the overall financial statement presentation. We believe that our audits, which included confirmation of securities at October 31, 2013 by correspondence with the custodian, brokers and the application of alternative auditing procedures where securities purchased had not been received, provide a reasonable basis for our opinion.
PricewaterhouseCoopers LLP
Boston, Massachusetts
December 26, 2013
Trustees and Officers
The Trustees and Officers of the Trust, their business addresses, principal occupations for the past five years and dates of birth are listed below. The Trustees provide broad supervision over the affairs of the Trust and the Funds. The Trustees are experienced executives who meet periodically throughout the year to oversee the Funds’ activities, review contractual arrangements with companies that provide services to the Funds, and review the Funds’ performance. Unless otherwise noted, the address of each Trustee or Officer is the address of the Trust: 800 Connecticut Avenue, Norwalk, Connecticut 06854.
There is no stated term of office for Trustees. Trustees serve until their resignation, retirement or removal in accordance with the Trust’s organizational documents and policies adopted by the Board from time to time. The Chairman of the Trustees, President, Treasurer and Secretary of the Trust are elected by the Trustees annually. Other officers hold office at the pleasure of the Trustees.
| | |
| Independent Trustees |
|
The following Trustees are not “interested persons” of the Trust within the meaning of the 1940 Act: |
Name, Date of Birth, Number of Funds Overseen in Fund Complex* | | Principal Occupation(s) During
Past 5 Years and Other
Directorships Held by Trustee |
Bruce B. Bingham, 12/01/48 • Trustee since 2012 • Oversees 40 Funds in Fund Complex | | Partner, Hamilton Partners (real estate development firm) (1987-Present). |
| |
William E. Chapman, II, 9/23/41 • Independent Chairman • Trustee since 2000 • Oversees 40 Funds in Fund Complex | | President and Owner, Longboat Retirement Planning Solutions (1998-Present); Hewitt Associates, LLC (part time) (provider of Retirement and Investment Education Seminars) (2002-2009); Trustee Emeritus of Bowdoin College (2013-Present), Trustee of Bowdoin College (2002-2013); Director of Harding, Loevner Funds, Inc. (6 portfolios); Trustee of Third Avenue Trust (5 portfolios); Trustee of Third Avenue Variable Trust (1 portfolio); Trustee of Aston Funds (26 portfolios). |
| |
Edward J. Kaier, 9/23/45 • Trustee since 2000 • Oversees 40 Funds in Fund Complex | | Attorney at Law and Partner, Teeters Harvey Gilboy & Kaier LLP (2007-Present); Attorney at Law and Partner, Hepburn Willcox Hamilton & Putnam, LLP (1977-2007); Trustee of Third Avenue Trust (5 portfolios); Trustee of Third Avenue Variable Trust (1 portfolio); Trustee of Aston Funds (26 portfolios). |
| |
Kurt Keibacker, 10/05/63 • Trustee since 2013 • Oversees 40 Funds in Fund Complex | | Managing Member, TechFund Europe (2000-Present); Managing Member, TechFund Capital (1997-Present) |
| |
Steven J. Paggioli, 4/03/50 • Trustee since 2000 • Oversees 40 Funds in Fund Complex | | Independent Consultant (2002-Present); Formerly Executive Vice President and Director, The Wadsworth Group (1986-2001); Executive Vice President, Secretary and Director, Investment Company Administration, LLC (1990-2001); Vice President, Secretary and Director, First Fund Distributors, Inc. (1991-2001); Trustee, Professionally Managed Portfolios (38 portfolios); Advisory Board Member, Sustainable Growth Advisors, LP; Independent Director, Chase Investment Counsel (2008 – Present); Trustee of Aston Funds (26 portfolios). |
| |
Richard F. Powers, III, 2/02/46 • Trustee since 2013 • Oversees 40 Funds in Fund Complex | | Adjunct Professor, Boston College (2011-Present); Director of Ameriprise Financial Inc. (2005-2009) |
| |
Eric Rakowski, 6/05/58 • Trustee since 2000 • Oversees 40 Funds in Fund Complex | | Professor, University of California at Berkeley School of Law (1990-Present); Director of Harding, Loevner Funds, Inc. (6 portfolios); Trustee of Third Avenue Trust (5 portfolios); Trustee of Third Avenue Variable Trust (1 portfolio); Trustee of Aston Funds (26 portfolios). |
| |
Victoria Sassine, 8/11/65 • Trustee since 2013 • Oversees 40 Funds in Fund Complex | | Lecturer, Babson College (2007 – Present) |
| | |
Name, Date of Birth, Number of Funds Overseen in Fund Complex* | | Principal Occupation(s) During
Past 5 Years and Other
Directorships Held by Trustee |
Thomas R. Schneeweis, 5/10/47 • Trustee since 2000 • Oversees 40 Funds in Fund Complex | | Professor Emeritus, University of Massachusetts (2013 - Present); Director, CISDM at the University of Massachusetts, (1996-Present); President, Alternative Investment Analytics, LLC, (formerly Schneeweis Partners, LLC) (2001-Present); Partner, S Capital Management, LLC (2007-Present); President, TRS Associates (1982-Present); Professor of Finance, University of Massachusetts (1977-2013); Partner, White Bear Partners, LLC (2007-2010); Partner, Northampton Capital Management, LLC (2004-2010); Trustee of Aston Funds (26 portfolios). |
|
* The Fund Complex consists of Managers AMG Funds, The Managers Funds, Managers Trust I and Managers Trust II. |
|
Interested Trustees Each Trustee in the following table is an “interested person” of the Trust within the meaning of the 1940 Act. Ms. Carsman is an interested person of the Trust within the meaning of the 1940 Act by virtue of her position with, and interest in securities of, AMG, and her former position as Chief Legal Officer of the Trust. |
|
Name, Date of Birth, Number of Funds Overseen in Fund Complex* | | Principal Occupation(s) During
Past 5 Years and Other
Directorships Held by Trustee |
Christine C. Carsman, 4/02/52 • Trustee since 2011 • Oversees 40 Funds in Fund Complex | | Senior Vice President and Deputy General Counsel, Affiliated Managers Group, Inc. (2011-Present); Senior Vice President and Chief Regulatory Counsel, Affiliated Managers Group, Inc. (2007-2011); Vice President and Chief Regulatory Counsel, Affiliated Managers Group, Inc. (2004-2007); Secretary and Chief Legal Officer, Managers AMG Funds, The Managers Funds, Managers Trust I and Managers Trust II (2004-2011); Senior Counsel, Vice President and Director of Operational Risk Management and Compliance, Wellington Management Company, LLP (1995-2004). |
| |
| Officers | | |
| |
Name, Date of Birth, Position(s) Held with Fund
and Length of Time Served | | Principal Occupation(s) During
Past 5 Years |
Keitha L. Kinne, 5/16/58 • President since 2012 • Chief Operating Officer since 2007 | | Managing Partner and Chief Operating Officer, Managers Investment Group LLC (2007-Present); Chief Operating Officer, The Managers Funds, Managers AMG Funds and Managers Trust II (2007-Present); Chief Investment Officer, Managers Investment Group LLC (2008-Present); President, Managers Distributors, Inc. (2012-Present); Managing Director, Legg Mason & Co., LLC (2006-2007); Managing Director, Citigroup Asset Management (2004-2006). |
| |
Lewis Collins, 2/26/66 • Secretary since 2011 • Chief Legal Officer since 2011 | | Senior Vice President and Senior Counsel, Affiliated Managers Group, Inc. (2010-Present); Vice President and Senior Counsel, Affiliated Managers Group, Inc. (2006-2010); Senior Counsel, Affiliated Managers Group, Inc. (2002-2006); Attorney, Ropes & Gray LLP (1998-2002). |
Trustees and Officers (continued)
| | |
| |
Name, Date of Birth, Position(s) Held with Fund and Length of Time Served | | Principal Occupation(s) During Past 5 Years |
Donald S. Rumery, 5/29/58 • Chief Financial Officer since 2007 • Treasurer since 2000 | | Senior Vice President, Managers Investment Group LLC (2005-Present); Treasurer, The Managers Funds (1995-Present); Treasurer, Managers AMG Funds (1999-Present); Treasurer, Managers Trust II (2000-Present); Chief Financial Officer, The Managers Funds, Managers AMG Funds and Managers Trust II (2007-Present); Treasurer and Chief Financial Officer, Managers Distributors, Inc. (2000-2012); Vice President, The Managers Funds LLC, (1994-2004). |
| |
John J. Ferencz, 3/09/62 • Chief Compliance Officer since 2010 | | Vice President, Legal and Compliance, Managers Investment Group LLC (2010-Present); Senior Compliance Analyst, Mutual Funds and Regulatory, GE Asset Management Incorporated (2005-2010). |
| | |
| |
Name, Date of Birth, Position(s) Held with Fund and Length of Time Served | | Principal Occupation(s) During Past 5 Years |
Michael S. Ponder, 9/12/73 • Assistant Secretary since 2011 | | Senior Vice President and Counsel, Managers Investment Group LLC (2011-Present); Attorney, DeNovo Legal (2009-2010); Vice President, Credit Suisse (2007-2009); Associate, Willkie Farr & Gallagher LLP (2006-2007). |
| |
Matthew B. Wallace, 11/24/80 • Anti-Money Laundering Compliance Officer since 2012 | | Senior Associate, Legal and Compliance, Managers Investment Group LLC (2012-Present); Associate, Legal and Compliance, Managers Investment Group LLC (2010-2012); Compliance Specialist, Calamos Advisors LLC (2007-2010). |
Annual Renewal of Investment Management and Subadvisory Agreements
On June 20-21, 2013, the Board of Trustees, including a majority of the Trustees who are not “interested persons” of the Trust (the “Independent Trustees”), approved the Investment Management Agreement with the Investment Manager for each of Managers Micro-Cap Fund, Managers Frontier Small Cap Growth Fund, Managers AMG TSCM Growth Equity Fund and Managers Real Estate Securities Fund (each a “Fund”) and the Subadvisory Agreement for each of the Subadvisors. The Independent Trustees were separately represented by independent counsel in connection with their consideration of the approval of these agreements. In considering the Investment Management and Subadvisory Agreements, the Trustees reviewed a variety of materials relating to each Fund, the Investment Manager and each Subadvisor, including comparative performance, fee and expense information for an appropriate peer group of similar mutual funds (each a “Peer Group”), performance information for relevant benchmark indices (each a “Fund Benchmark”) and, with respect to each Subadvisor, comparative performance information for an appropriate peer group of managed accounts, and, as to all other matters, other information provided to them on a periodic basis throughout the year, as well as information provided in connection with the meetings of June 20-21, 2013, regarding the nature, extent and quality of services provided by the Investment Manager and the Subadvisors under their respective agreements. Prior to voting, the Independent Trustees: (a) reviewed the foregoing information with their independent legal counsel and with management; (b) received materials from their independent legal counsel discussing the legal standards applicable to their consideration of the Investment Management Agreement and the Subadvisory Agreements; and (c) met with their independent legal counsel in private sessions at which no representatives of management were present.
Nature, extent and quality of services.
In considering the nature, extent and quality of the services provided by the Investment Manager, the Trustees reviewed information relating to the Investment Manager’s operations and personnel. Among other things, the Investment Manager provided financial information, biographical information on its supervisory and professional staff and descriptions of its organizational and management structure. The Trustees also took into account information provided periodically throughout the previous year by the Investment Manager in Board meetings relating to the performance of its duties with respect to the Funds and the Trustees’ knowledge of the Investment Manager’s management and the quality of the performance of the Investment Manager’s duties. In the course of their deliberations regarding the Investment Management Agreement, the Trustees evaluated, among other things: (a) the extent and quality of the Investment Manager’s oversight of the operation and management of the Funds; (b) the quality of the search, selection and monitoring services performed by the Investment Manager in overseeing the portfolio management responsibilities of the Subadvisors; (c) the Investment Manager’s ability to supervise the Funds’ other service providers; and (d) the Investment Manager’s compliance program. The Trustees also took
into account that, in performing its functions under the Investment Management Agreement and supervising each Subadvisor, the Investment Manager: performs periodic detailed analysis and reviews of the performance by each Subadvisor of its obligations to a Fund, including without limitation a review of each Subadvisor’s investment performance in respect of a Fund; prepares and presents periodic reports to the Board regarding the investment performance of each Subadvisor and other information regarding each Subadvisor, at such times and in such forms as the Board may reasonably request; reviews and considers any changes in the personnel of each Subadvisor responsible for performing the Subadvisor’s obligations and makes appropriate reports to the Board; reviews and considers any changes in the ownership or senior management of each Subadvisor and makes appropriate reports to the Board; performs periodic in-person or telephonic diligence meetings, including with respect to compliance matters, with representatives of each Subadvisor; assists the Board and management of the Trust in developing and reviewing information with respect to the annual consideration of each Subadvisory Agreement; prepares recommendations with respect to the continued retention of any Subadvisor or the replacement of any Subadvisor; identifies potential successors to or replacements of any Subadvisor or potential additional Subadvisors, performs appropriate due diligence, and develops and presents to the Board a recommendation as to any such successor, replacement, or additional Subadvisor; designates and compensates from its own resources such personnel as the Investment Manager may consider necessary or appropriate to the performance of its services; and performs such other review and reporting functions as the Board shall reasonably request consistent with the Investment Management Agreement and applicable law. With respect to Managers Frontier Small Cap Growth Fund and Managers AMG TSCM Growth Equity Fund, the Trustees noted the affiliation of each Subadvisor with the Investment Manager, noting any potential conflicts of interest. The Trustees also took into account the financial condition of the Investment Manager with respect to its ability to provide the services required under the Investment Management Agreement and the Investment Manager’s undertaking to maintain contractual expense limitations for the Funds. The Trustees also considered the Investment Manager’s risk management processes.
The Trustees also reviewed information relating to each Subadvisor’s operations and personnel and the investment philosophy, strategies and techniques (for each Subadvisor, its “Investment Strategy”) used in managing a Fund or the portion of a Fund for which the Subadvisor has portfolio management responsibility. Among other things, the Trustees reviewed biographical information on portfolio management and other professional staff, information regarding each Subadvisor’s organizational and management structure and each Subadvisor’s brokerage policies and practices. The Trustees considered specific information provided regarding the experience of the individual(s) at each Subadvisor with portfolio management responsibility for a Fund or the portion of a Fund managed by the Subadvisor,
Annual Renewal of Investment Management and Subadvisory Agreements (continued)
including the information set forth in the Fund’s prospectus and statement of additional information. With respect to Managers Micro-Cap Fund, which is managed with multiple Subadvisors, the Trustees also noted information provided by the Investment Manager regarding the manner in which each Subadvisor’s Investment Strategy complements those utilized by the Fund’s other Subadvisors. In the course of their deliberations, the Trustees evaluated, among other things: (a) the services rendered by each Subadvisor in the past; (b) the qualifications and experience of the Subadvisor’s personnel; and (c) the Subadvisor’s compliance program. The Trustees also took into account the financial condition of each Subadvisor with respect to its ability to provide the services required under its Subadvisory Agreement. The Trustees also considered each Subadvisor’s risk management processes.
Performance.
As noted above, the Board considered each Fund’s net performance during relevant time periods as compared to each Fund’s Peer Group and Fund Benchmark and considered each Subadvisor’s performance as compared to an appropriate peer group of managed accounts and also considered the gross performance of the Fund or the portion of the Fund managed by each Subadvisor as compared to the Subadvisor’s relevant performance composite that utilizes the same investment strategy and approach and noted that the Board reviews on a quarterly basis detailed information about each Fund’s performance results, portfolio composition and Investment Strategies, including with respect to Managers Micro-Cap Fund, the portion of the Fund managed by each Subadvisor. The Board noted the Investment Manager’s expertise and resources in monitoring the performance, investment style and risk-adjusted performance of each Subadvisor. The Board also noted each Subadvisor’s performance record with respect to Managers Micro-Cap Fund. The Board was mindful of the Investment Manager’s attention to monitoring each Subadvisor’s performance with respect to the Funds and its discussions with management regarding the factors that contributed to the performance of the Funds.
Advisory Fees and Profitability.
In considering the reasonableness of the advisory fee charged by the Investment Manager for managing each Fund, the Trustees noted that the Investment Manager, and not the Fund, is responsible for paying the fees charged by the Fund’s Subadvisor(s) and, therefore, that the fees paid to the Investment Manager cover the cost of providing portfolio management services as well as the cost of providing search, selection and monitoring services in operating a “manager-of-managers” complex of mutual funds. With respect to Managers Micro-Cap Fund, Managers AMG TSCM Growth Equity Fund and Managers Real Estate Securities Fund, the Trustees also considered the amount of the advisory fee retained by the Investment Manager after payment of the subadvisory fee with respect to each Fund. The Trustees concluded that, in light of the additional high quality supervisory services
provided by the Investment Manager and the fact that the subadvisory fees are paid out of the advisory fee, the advisory fee payable by each Fund to the Investment Manager can reasonably be expected to exceed the median advisory fee for the Peer Group, which consists of many funds that do not operate with a manager-of-managers structure. In this regard, the Trustees also noted that the Investment Manager has undertaken to maintain contractual expense limitations for the Funds.
In considering the reasonableness of the advisory fee payable to the Investment Manager, the Trustees also reviewed information provided by the Investment Manager setting forth all revenues and other benefits, both direct and indirect (including any so-called “fallout benefits” such as reputational value derived from the Investment Manager serving as Investment Manager to a Fund), received by the Investment Manager and its affiliates attributable to managing each Fund and all the mutual funds in the Managers Family of Funds, the cost of providing such services and the resulting profitability to the Investment Manager and its affiliates from these relationships. The Trustees also noted the current and potential asset levels of each Fund and the willingness of the Investment Manager to waive fees and pay expenses for all the Funds from time to time as a means of limiting total expenses. The Trustees also considered management’s discussion of the current asset levels of the Funds, and considered the impact on profitability of the current asset levels and any future growth of assets of the Funds. The Board took into account management’s discussion of the current advisory fee structure, and, as noted above, the services the Investment Manager provides in performing its functions under the Investment Management Agreement and supervising each Subadvisor. In this regard, the Trustees noted that, unlike a mutual fund that is managed by a single investment adviser, the Funds operate in a manager-of-managers structure. Based on the foregoing, the Trustees concluded that the profitability to the Investment Manager is reasonable and that the Investment Manager is not realizing material benefits from economies of scale that would warrant adjustments to the advisory fees for any Fund at this time. With respect to economies of scale, the Trustees also noted that as a Fund’s assets increase over time, the Fund may realize other economies of scale to the extent that the increase in assets is proportionally greater than the increase in certain other expenses.
Subadvisory Fees and Profitability.
In considering the reasonableness of the fee payable by the Investment Manager to each Subadvisor (other than Frontier Capital Management Company, LLC (“Frontier”) and TimesSquare Capital Management, LLC (“TimesSquare”), which are affiliates of the Investment Manager), the Trustees relied on the ability of the Investment Manager to negotiate the terms of the Subadvisory Agreement at arm’s length as part of the manager-of-managers structure, noting that the Subadvisor (other than Frontier and TimesSquare) is not affiliated with the Investment Manager. In addition, the Trustees considered other potential benefits of the subadvisory relationship to a Subadvisor, including, among others,
Annual Renewal of Investment Management and Subadvisory Agreements (continued)
the indirect benefits that the Subadvisor may receive from the Subadvisor’s relationship with a Fund, including any so-called “fallout benefits” to the Subadvisor, such as reputational value derived from the Subadvisor serving as Subadvisor to the Fund. In addition, the Trustees noted that the subadvisory fees are paid by the Investment Manager out of its advisory fee. As a consequence of all of the foregoing, the cost of services to be provided by each unaffiliated Subadvisor and the profitability to the Subadvisor of its relationship with a Fund were not material factors in the Trustees’ deliberations. For similar reasons, the Trustees did not consider potential economies of scale in the management of a Fund or the portion of a Fund managed by each unaffiliated Subadvisor to be a material factor in their deliberations at this time.
In considering the reasonableness of the fees payable by the Investment Manager to each of Frontier and TimesSquare, the Trustees noted that each of Frontier and TimesSquare is an affiliate of the Investment Manager and reviewed information provided by each of Frontier and TimesSquare regarding the cost to Frontier and TimesSquare, respectively, of providing subadvisory services to a Fund and the resulting profitability from such relationship and noted that, because each of Frontier and TimesSquare is an affiliate of the Investment Manager, such profitability might be directly or indirectly shared by the Investment Manager.
The Trustees also noted that the subadvisory fees are paid by the Investment Manager out of its advisory fee. The Board also took into account management’s discussion of the current subadvisory fee structure, and the services each of Frontier and TimesSquare provides in performing its functions under the applicable Subadvisory Agreement. Based on the foregoing, the Trustees concluded that the profitability to each of Frontier and TimesSquare is reasonable and that neither Frontier nor TimesSquare is realizing material benefits from economies of scale that would warrant adjustments to the subadvisory fees at this time. Also with respect to economies of scale, the Trustees noted that as a Fund’s assets increase over time, the Fund may realize other economies of scale to the extent the increase in assets is proportionally greater than the increase in certain other expenses.
In addition to the foregoing, the Trustees considered the specific factors and related conclusions set forth below with respect to each Fund.
Managers Micro-Cap Fund
Fund Performance.
Among other information relating to the Fund’s performance, the Trustees noted that the Fund’s performance for Service Class shares for the 1-year, 3-year, 5-year and 10-year periods ended March 31, 2013 was below, above, above and below, respectively, the median performance of the Peer Group and below, above, above and above, respectively, the performance of the Fund Benchmark, the Russell Microcap® Index. The Trustees took into account management’s discussion of the Fund’s performance, including the reasons for the Fund’s more recent
underperformance. The Trustees also took into account the fact that the Fund ranked in the top third of the Peer Group for the 3-year and 5-year periods, respectively, noting the Fund’s favorable 5-year track record as a multi-manager, multi-style Fund. The Trustees concluded that the Fund’s overall performance has been satisfactory in light of all factors considered.
Advisory Fees.
The Trustees noted that the Fund’s advisory fees (which include both the advisory and administration fee) and total expenses (net of applicable expense waivers/reimbursements) as of March 31, 2013 were both higher than the average for the Peer Group. The Trustees took into account the fact that the Investment Manager has contractually agreed, through March 1, 2014, to limit the Fund’s net annual operating expenses (subject to certain excluded expenses) to 1.18%. The Trustees also noted that the Investment Manager had reduced the Fund’s expense limitation in previous years. The Trustees took into account management’s discussion of the Fund’s expenses and competitiveness with comparably sized funds. The Trustees concluded that, in light of the nature, extent and quality of the services provided by the Investment Manager and the Subadvisors, the foregoing expense limitation and the considerations noted above with respect to the Subadvisors and the Investment Manager, the Fund’s advisory fees, including subadvisory fees, are reasonable.
Managers Frontier Small Cap Growth Fund
Performance.
Among other information relating to the Fund’s performance, the Trustees noted that the Fund’s performance for Service Class shares for the 1-year, 3-year, 5-year and 10-year periods ended March 31, 2013 was below, below, at and above, respectively, the median performance of the Peer Group and below the performance of the Fund Benchmark, the Russell 2000® Growth Index. The Trustees took into account management’s discussion of the Fund’s performance, including the reasons for the Fund’s more recent underperformance and the fact that the Fund’s performance has ranked at or near the median of the Peer Group for the 5-year and 10-year periods. The Trustees concluded that the Fund’s overall performance has been satisfactory in light of all factors considered.
Advisory Fees.
The Trustees noted that the Fund’s advisory fee and total expenses (net of applicable expense waivers/reimbursements) as of March 31, 2013 were both lower than the average for the Peer Group. The Trustees took into account the fact that the Investment Manager has contractually agreed, through March 1, 2014, to limit the Fund’s net annual operating expenses (subject to certain excluded expenses) to 1.05%. The Trustees concluded that, in light of the nature, extent and quality of the services provided by the Investment Manager and the Subadvisor (which is an affiliate of the Investment Manager), the foregoing expense limitation and the considerations noted above with respect to the Subadvisor and the Investment Manager, the Fund’s advisory fees, including subadvisory fees, are reasonable.
Annual Renewal of Investment Management and Subadvisory Agreements (continued)
Managers AMG TSCM Growth Equity Fund
Fund Performance.
Among other information relating to the Fund’s performance, the Trustees noted that the Fund’s performance for Service Class shares for the 1-year period ended March 31, 2013 and the period from the Fund’s inception on July 30, 2010 through March 31, 2013 was above the median performance of the Peer Group and above and below, respectively, the performance of the Fund Benchmark, the Russell 3000® Growth Index. The Trustees took into account management’s discussion of the Fund’s more recent performance. The Trustees noted that the Fund has outperformed the Fund Benchmark since a new Portfolio Manager was appointed. The Trustees concluded that the Fund’s overall performance has been satisfactory in light of the Fund’s limited performance history.
Advisory Fees.
The Trustees noted that the Fund’s advisory fees (which include both the advisory and administration fee) and total expenses (net of applicable expense waivers/reimbursements) as of March 31, 2013 were higher and lower, respectively, than the average for the Peer Group. The Trustees took into account the fact that the Investment Manager has contractually agreed, through March 1, 2014, to limit the Fund’s net annual operating expenses (subject to certain excluded expenses) to 0.79%. The Board took into account management’s discussion of the Fund’s expenses and the current size of the Fund. The Trustees concluded that, in light of the nature, extent and quality of the services provided by the Investment Manager and the Subadvisor (which is an affiliate of the Investment Manager), the foregoing expense limitation and the considerations noted above with respect to the Subadvisor and the Investment Manager, the Fund’s advisory fees, including subadvisory fees, are reasonable.
Managers Real Estate Securities Fund
Fund Performance.
Among other information relating to the Fund’s performance, the Trustees noted that the Fund’s performance for the 1-year, 3-year, 5-year and 10-year periods ended March 31, 2013 was below, above, above and above, respectively, the median performance of the Peer Group and below, below, above and above, respectively, the performance of the Fund Benchmark, the Dow Jones U.S. Select REIT Index. The Trustees took into account management’s discussion of the Fund’s performance, including the Fund’s strong performance compared to the Fund Benchmark and the Peer
Group over the longer-term. The Trustees also noted that the Fund ranked in the top quartile of its Peer Group for the 3-year, 5-year and 10-year periods. The Trustees concluded that the Fund’s overall performance has been satisfactory in light of all factors considered.
Advisory Fees.
The Trustees noted that the Fund’s advisory fees (which include both the advisory and administration fee) and total expenses (net of applicable expense waivers/reimbursements) as of March 31, 2013 were lower and higher, respectively, than the average for the Peer Group. The Trustees took into account the fact that the Investment Manager has contractually agreed, through March 31, 2014, to limit the Fund’s net annual operating expenses (subject to certain excluded expenses) to 1.24% and noted that the Fund was operating below its expense cap as of March 31, 2013. The Trustees also noted that the Investment Manager reduced the Fund’s expense limitation from 1.29% to 1.24% in 2012. The Trustees also took into account management’s discussion of the Fund’s expenses and competitiveness with comparably sized funds. The Trustees concluded that, in light of the nature, extent and quality of the services provided by the Investment Manager and the Subadvisor, the foregoing expense limitation and the considerations noted above with respect to the Subadvisor and the Investment Manager, the Fund’s advisory fees, including subadvisory fees, are reasonable.
* * * *
After consideration of the foregoing, the Trustees also reached the following conclusions (in addition to the conclusions discussed above) regarding the Investment Management Agreement and each Subadvisory Agreement: (a) the Investment Manager and each Subadvisor have demonstrated that they possess the capability and resources to perform the duties required of them under the Investment Management Agreement and the applicable Subadvisory Agreements; (b) each Subadvisor’s Investment Strategy is appropriate for pursuing the applicable Fund’s investment objectives; and (c) the Investment Manager and each Subadvisor maintain appropriate compliance programs.
Based on all of the above-mentioned factors and their related conclusions, with no single factor or conclusion being determinative and with each Trustee not necessarily attributing the same weight to each factor, the Trustees concluded that approval of the Investment Management Agreement and each Subadvisory Agreement would be in the best interests of the applicable Fund and its shareholders. Accordingly, on June 20-21, 2013, the Trustees, including a majority of the Independent Trustees, voted to approve the Investment Management Agreement and the Subadvisory Agreements (as applicable) for each Fund.
PROXY RESULTS
A special meeting of shareholders of Managers Trust I was held on July 2, 2013. With respect to the proposals to amend certain “fundamental” investment restrictions of the Funds, the meeting was adjourned to August 20, 2013 for Managers Frontier Small Cap Growth Fund and Managers Micro-Cap Fund with respect to Subproposal 2G, and was adjourned to August 20, 2013 and October 22, 2013 with respect to Managers AMG TSCM Growth Equity Fund, Managers Real Estate Securities Fund, and the remainder of the Proposal 2 Subproposals for Managers Micro-Cap Fund. With respect to the proposals to amend and restate the Amended and Restated Declaration of Trust, the meeting was adjourned until August 20, 2013 and October 22, 2013. The proposals and results of the votes are summarized below.
| | | | | | | | |
| | | All Funds in Trust | |
| Managers Trust I | | For | | | Withheld | |
| Election of Directors | | (in $ NAV, rounded to the nearest dollar) | |
Bruce Bingham | | $ | 130,861,528 | | | $ | 4,865,035 | |
William E. Chapman, II | | | 130,740,436 | | | | 4,986,127 | |
Edward J. Kaier | | | 130,926,087 | | | | 4,800,475 | |
Steven J. Paggioli | | | 130,924,285 | | | | 4,802,277 | |
Erik Rakowski | | | 130,841,911 | | | | 4,884,651 | |
Thomas R. Schneeweis | | | 130,778,924 | | | | 4,947,639 | |
Christine C. Carsman | | | 131,045,716 | | | | 4,680,846 | |
Kurt Keilhacker | | | 130,714,266 | | | | 5,012,297 | |
Richard F. Powers III | | | 130,640,619 | | | | 5,085,943 | |
Victoria Sassine | | | 130,736,799 | | | | 4,989,763 | |
| | | | | | | | | | | | | | | | |
| | | Managers Frontier Small Cap Growth Fund | |
| | | For | | | Against | | | Abstain | | | Broker Non-Votes | |
| To amend “fundamental” restrictions of the Funds with respect to: | | (in $NAV, rounded to the nearest dollar) | |
Issuance of Senior Securities | | $ | 2,895,333 | | | $ | 57,628 | | | $ | 16,807 | | | $ | 177,982 | |
Borrowing | | | 2,880,291 | | | | 76,325 | | | | 13,153 | | | | 177,982 | |
Lending | | | 2,896,111 | | | | 59,162 | | | | 13,995 | | | | 177,982 | |
The Underwriting of Securities | | | 2,884,972 | | | | 69,989 | | | | 14,807 | | | | 177,982 | |
Purchasing and Selling Commodities | | | 2,884,535 | | | | 71,447 | | | | 13,786 | | | | 177,982 | |
Purchasing and Selling Real Estate | | | 2,883,191 | | | | 72,237 | | | | 14,340 | | | | 177,982 | |
Diversification of Investments | | | 2,893,895 | | | | 62,087 | | | | 13,786 | | | | 177,982 | |
Concentrating Investments in a Particular Industry | | | 2,874,265 | | | | 80,586 | | | | 14,917 | | | | 177,982 | |
PROXY RESULTS (continued)
| | | | | | | | | | | | | | | | |
| | | Managers Real Estate Securities Fund | |
| | | For | | | Against | | | Abstain | | | Broker Non-Votes | |
| To amend “fundamental” restrictions of the Funds with respect to: | | (in $NAV, rounded to the nearest dollar) | |
Issuance of Senior Securities | | $ | 10,278,699 | | | $ | 405,307 | | | $ | 406,238 | | | $ | 4,224,409 | |
Borrowing | | | 10,177,106 | | | | 475,474 | | | | 437,663 | | | | 4,224,409 | |
Lending | | | 10,243,617 | | | | 416,661 | | | | 429,966 | | | | 4,224,409 | |
The Underwriting of Securities | | | 10,249,464 | | | | 417,614 | | | | 423,165 | | | | 4,224,409 | |
Purchasing and Selling Commodities | | | 10,241,087 | | | | 436,817 | | | | 412,340 | | | | 4,224,409 | |
Purchasing and Selling Real Estate | | | 10,381,844 | | | | 332,125 | | | | 376,275 | | | | 4,224,409 | |
Diversification of Investments | | | n/a | | | | n/a | | | | n/a | | | | n/a | |
Concentrating Investments in a Particular Industry | | | 10,264,246 | | | | 357,727 | | | | 468,271 | | | | 4,224,409 | |
| |
| | | Managers AMG TSCM Growth Equity Fund | |
| | | For | | | Against | | | Abstain | | | Broker Non-Votes | |
| To amend “fundamental” restrictions of the Funds with respect to: | | (in $NAV, rounded to the nearest dollar) | |
Issuance of Senior Securities | | $ | 1,129,133 | | | $ | 23,589 | | | $ | 78,818 | | | $ | 9,492 | |
Borrowing | | | 1,290,280 | | | | 28,987 | | | | 79,273 | | | | 9,492 | |
Lending | | | 1,291,805 | | | | 27,146 | | | | 79,589 | | | | 9,492 | |
The Underwriting of Securities | | | 1,294,203 | | | | 24,465 | | | | 79,873 | | | | 9,492 | |
Purchasing and Selling Commodities | | | 1,293,318 | | | | 24,734 | | | | 80,489 | | | | 9,492 | |
Purchasing and Selling Real Estate | | | 1,292,344 | | | | 25,504 | | | | 80,692 | | | | 9,492 | |
Diversification of Investments | | | 1,298,140 | | | | 21,970 | | | | 78,430 | | | | 9,492 | |
Concentrating Investments in a Particular Industry | | | 1,293,433 | | | | 28,663 | | | | 76,445 | | | | 9,492 | |
| |
| | | Managers Micro-Cap Fund | |
| | | For | | | Against | | | Abstain | | | Broker Non-Votes | |
| To amend “fundamental” restrictions of the Funds with respect to: | | (in $NAV, rounded to the nearest dollar) | |
Issuance of Senior Securities | | $ | 1,642,582 | | | $ | 140,785 | | | $ | 125,158 | | | $ | 503,682 | |
Borrowing | | | 1,624,667 | | | | 165,070 | | | | 118,788 | | | | 503,682 | |
Lending | | | 1,637,650 | | | | 151,271 | | | | 119,604 | | | | 503,682 | |
The Underwriting of Securities | | | 1,651,103 | | | | 131,440 | | | | 125,982 | | | | 503,682 | |
Purchasing and Selling Commodities | | | 1,652,795 | | | | 141,481 | | | | 114,250 | | | | 503,682 | |
Purchasing and Selling Real Estate | | | 1,645,389 | | | | 149,227 | | | | 113,909 | | | | 503,682 | |
Diversification of Investments | | | 1,493,394 | | | | 102,364 | | | | 111,870 | | | | 503,682 | |
Concentrating Investments in a Particular Industry | | | 1,630,771 | | | | 152,210 | | | | 125,546 | | | | 503,682 | |
PROXY RESULTS (continued)
| | | | | | | | | | | | | | | | |
| | | Managers Frontier Small Cap Growth Fund | |
| | | For | | | Against | | | Abstain | | | Broker Non-Votes | |
| To amend and restate the Agreement and Declaration of the Trust relating to: | | (in $NAV, rounded to the nearest dollar) | |
Declaration of Trust Amendment Procedures | | $ | 3,578,389 | | | $ | 50,404 | | | $ | 131,773 | | | $ | 166,472 | |
Merger, Consolidation, Sale of Assets and Termination of Trust, Series or Classes | | | 3,573,584 | | | | 54,655 | | | | 132,327 | | | | 166,472 | |
Other Changes | | | 3,555,005 | | | | 71,509 | | | | 134,050 | | | | 166,472 | |
| |
| | | Managers Real Estate Securities Fund | |
| | | For | | | Against | | | Abstain | | | Broker Non-Votes | |
| To amend and restate the Agreement and Declaration of the Trust relating to: | | (in $NAV, rounded to the nearest dollar) | |
Declaration of Trust Amendment Procedures | | $ | 10,337,481 | | | $ | 437,478 | | | $ | 390,009 | | | $ | 3,772,424 | |
Merger, Consolidation, Sale of Assets and Termination of Trust, Series or Classes | | | 10,252,430 | | | | 435,568 | | | | 476,970 | | | | 3,772,424 | |
Other Changes | | | 10,262,498 | | | | 399,014 | | | | 504,457 | | | | 3,772,424 | |
| |
| | | Managers AMG TSCM Growth Equity Fund | |
| | | For | | | Against | | | Abstain | | | Broker Non-Votes | |
| To amend and restate the Agreement and Declaration of the Trust relating to: | | (in $NAV, rounded to the nearest dollar) | |
Declaration of Trust Amendment Procedures | | $ | 1,333,694 | | | $ | 17,196 | | | $ | 86,646 | | | $ | 9,312 | |
Merger, Consolidation, Sale of Assets and Termination of Trust, Series or Classes | | | 1,329,509 | | | | 19,552 | | | | 88,476 | | | | 9,312 | |
Other Changes | | | 1,308,273 | | | | 27,618 | | | | 101,646 | | | | 9,312 | |
| |
| | | Managers Micro-Cap Fund | |
| | | For | | | Against | | | Abstain | | | Broker Non-Votes | |
| To amend and restate the Agreement and Declaration of the Trust relating to: | | (in $NAV, rounded to the nearest dollar) | |
Declaration of Trust Amendment Procedures | | $ | 1,968,367 | | | $ | 149,503 | | | $ | 164,350 | | | $ | 390,484 | |
Merger, Consolidation, Sale of Assets and Termination of Trust, Series or Classes | | | 1,974,732 | | | | 153,853 | | | | 153,634 | | | | 390,484 | |
Other Changes | | | 1,948,415 | | | | 163,370 | | | | 170,435 | | | | 390,484 | |
| |
| | | All Funds in Trust | |
| | | For | | | Against | | | Abstain | | | Broker Non-Votes | |
| To amend and restate the Agreement and Declaration of the Trust relating to: | | (in $NAV, rounded to the nearest dollar) | |
Declaration of Trust Amendment Procedures | | $ | 192,290,005 | | | $ | 7,507,459 | | | $ | 7,994,207 | | | $ | 31,541,556 | |
Merger, Consolidation, Sale of Assets and Termination of Trust, Series or Classes | | | 124,093,865 | | | | 6,962,787 | | | | 8,955,316 | | | | 31,541,556 | |
Other Changes | | | 122,906,748 | | | | 7,515,009 | | | | 9,223,126 | | | | 31,541,556 | |
Investment Manager and Administrator
Managers Investment Group LLC
800 Connecticut Ave.
Norwalk, CT 06854
(800) 835-3879
Distributor
Managers Distributors, Inc.
800 Connecticut Ave.
Norwalk, CT 06854
(800) 835-3879
Custodian
The Bank of New York Mellon
2 Hanson Place
Brooklyn, NY 11217
Legal Counsel
Ropes & Gray LLP
Prudential Tower, 800 Boylston Street
Boston, MA 02199-3600
Transfer Agent
BNY Mellon Investment Servicing (US) Inc.
Attn: Managers
P.O. Box 9769
Providence, RI 02940
(800) 548-4539
For ManagersChoiceTM Only
Managers
c/o BNY Mellon Investment Servicing (US) Inc.
P.O. Box 9847
Providence, RI 02940-8047
(800) 358-7668
MANAGERS AND MANAGERS AMG FUNDS
| | | | | | |
EQUITY FUNDS | | | | BALANCED FUNDS |
| BRANDYWINE | | RENAISSANCE LARGE CAP GROWTH | | | | CHICAGO EQUITY PARTNERS BALANCED |
| BRANDYWINE BLUE | | Renaissance Group LLC | | | | Chicago Equity Partners, LLC |
| BRANDYWINE ADVISORS MIDCAP GROWTH | | | | | | |
| Friess Associates, LLC | | SKYLINE SPECIAL EQUITIES | | | | ALTERNATIVE FUNDS |
| | PORTFOLIO | | | | |
| CADENCE CAPITAL APPRECIATION | | Skyline Asset Management, L.P. | | | | FQ GLOBAL ALTERNATIVES |
| CADENCE MID-CAP | | | | | | FQ GLOBAL ESSENTIALS |
| CADENCE EMERGING COMPANIES | | SPECIAL EQUITY | | | | First Quadrant, L.P. |
| Cadence Capital Management, LLC | | Ranger Investment Management, L.P. | | | | |
| | Lord, Abbett & Co. LLC | | | | INCOME FUNDS |
| ESSEX SMALL/MICRO CAP GROWTH | | Smith Asset Management Group, L.P. | | | | |
| Essex Investment Management Co., LLC | | Federated MDTA LLC | | | | BOND (MANAGERS) |
| | | | | | GLOBAL INCOME OPPORTUNITY |
| FQ TAX-MANAGED U.S. EQUITY | | SYSTEMATIC VALUE | | | | Loomis, Sayles & Co., L.P. |
| FQ U.S. EQUITY | | SYSTEMATIC MID CAP VALUE | | | | |
| First Quadrant, L.P. | | Systematic Financial Management, L.P. | | | | BOND (MANAGERS PIMCO) |
| | | | | | Pacific Investment Management Co. LLC |
| FRONTIER SMALL CAP GROWTH | | TIMESSQUARE INTERNATIONAL | | | | |
| Frontier Capital Management Company, LLC | | SMALL CAP | | | | GW&K FIXED INCOME |
| | TIMESSQUARE MID CAP GROWTH | | | | GW&K MUNICIPAL BOND |
| GW&K SMALL CAP EQUITY | | TIMESSQUARE SMALL CAP GROWTH | | | | GW&K MUNICIPAL ENHANCED YIELD |
| Gannett Welsh & Kotler, LLC | | TSCM GROWTH EQUITY | | | | Gannett Welsh & Kotler, LLC |
| | TimesSquare Capital Management, LLC | | | | |
| MICRO-CAP | | | | | | HIGH YIELD |
| Lord, Abbett & Co. LLC | | TRILOGY GLOBAL EQUITY | | | | J.P. Morgan Investment Management LLC |
| WEDGE Capital Management L.L.P. | | TRILOGY EMERGING MARKETS EQUITY | | | | |
| Next Century Growth Investors LLC | | TRILOGY INTERNATIONAL SMALL CAP | | | | INTERMEDIATE DURATION GOVERNMENT |
| RBC Global Asset Management (U.S.) Inc. | | Trilogy Global Advisors, L.P. | | | | SHORT DURATION GOVERNMENT |
| | | | | | Amundi Smith Breeden LLC |
| REAL ESTATE SECURITIES | | YACKTMAN | | | | |
| CenterSquare Investment Management, Inc. | | YACKTMAN FOCUSED | | | | |
| | Yacktman Asset Management LP | | | | |
This report is prepared for the Funds’ shareholders. It is authorized for distribution to prospective investors only when preceded or accompanied by an effective prospectus. To receive a free copy of the prospectus or Statement of Additional Information, which includes additional information about Fund Trustees, please contact us by calling 800.835.3879. Distributed by Managers Distributors, Inc., member FINRA.
A description of the policies and procedures each Fund uses to vote its proxies is available: (i) without charge, upon request, by calling 800.835.3879, or (ii) on the Securities and Exchange Commission’s (SEC) Web site at www. sec.gov. For information regarding each Fund’s proxy voting record for the 12-month period ended June 30, call 800.835.3879 or visit the SEC Web site at www.sec.gov.
The Funds file their complete schedule of portfolio holdings with the SEC for the first and third quarters of each fiscal year on Form N-Q. The Funds’ Forms N-Q are available on the SEC’s Web site at www.sec.gov. A Fund’s Forms N-Q may be reviewed and copied at the SEC’s Public Reference Room in Washington, DC. Information on the operation of the Public Reference Room may be obtained by calling 800.SEC.0330. To review a complete list of the Funds’ portfolio holdings, or to view the most recent quarterly holdings report, semiannual report, or annual report, please visit www.managersinvest.com.
www.managersinvest.com

Managers PIMCO Bond Fund
Annual Report—October 31, 2013
| | | | |
TABLE OF CONTENTS | | Page | |
| |
LETTER TO SHAREHOLDERS | | | 2 | |
| |
ABOUT YOUR FUND’S EXPENSES | | | 3 | |
| |
PORTFOLIO MANAGER’S COMMENTS, FUND SNAPSHOTS, AND SCHEDULE OF PORTFOLIO INVESTMENTS | | | 4 | |
| |
NOTES TO SCHEDULE OF PORTFOLIO INVESTMENTS | | | 18 | |
| |
FINANCIAL STATEMENTS | | | | |
| |
Statement of Assets and Liabilities | | | 27 | |
Balance sheet, net asset value (NAV) per share computation and cumulative undistributed amounts | | | | |
| |
Statement of Operations | | | 28 | |
Detail of sources of income, expenses, and realized and unrealized gains (losses) during the fiscal year | | | | |
| |
Statements of Changes in Net Assets | | | 29 | |
Detail of changes in assets for the past two fiscal years | | | | |
| |
FINANCIAL HIGHLIGHTS | | | 30 | |
Historical net asset values per share, distributions, total returns, income and expense ratios, turnover ratios and net assets | | | | |
| |
NOTES TO FINANCIAL STATEMENTS | | | 31 | |
Accounting and distribution policies, details of agreements and transactions with Fund management and affiliates, and descriptions of certain investment risks | | | | |
| |
REPORT OF INDEPENDENT REGISTERED PUBLIC ACCOUNTING FIRM | | | 38 | |
| |
TRUSTEES AND OFFICERS | | | 39 | |
| |
ANNUAL RENEWAL OF INVESTMENT MANAGEMENT AND SUBADVISORY AGREEMENT | | | 41 | |
Nothing contained herein is to be considered an offer, sale or solicitation of an offer to buy shares of any series of the Managers Family of Funds. Such offering is made only by Prospectus, which includes details as to offering price and other material information.
Letter to Shareholders
Dear Shareholder:
Thank you for your investment in The Managers Funds. Our foremost goal at Managers Investment Group (“MIG”) is to provide investment products and solutions that help our shareholders and clients successfully reach their investment goals and objectives. We do this by offering a broad selection of Funds managed by a collection of Affiliated Managers Group’s (“AMG”) affiliate investment boutiques, along with a complementary series of open-architecture mutual funds.
The past year has been an exciting one for us at MIG. We were pleased to welcome the Brandywine Funds into the Managers Fund family several months ago. We have been excited to begin this new chapter in the 27-year history of the Brandywine Funds, while maintaining shareholders’ access to the same investment team that has guided the Brandywine Funds since inception using its research-driven investment approach.
We announced effective November 1, 2013 that the GW&K Small Cap Equity Fund would be closed to new investors with certain limited exceptions. The team at GW&K manages a total of $2.3 billion (as of October 31, 2013) in small-capitalization equities and closing the Fund to new investors allows the team to continue to execute on the investment process that has been effective for the team for more than a decade. We will continue to make decisions such as these that we believe are in the best interest of our shareholders.
Risky assets have done quite well thus far in 2013, with U.S. equity markets surpassing all-time highs. Ongoing global monetary easing, a low-yield environment, and healthy U.S. economic growth are supporting investor appetite for risk assets. Despite improving investor sentiment, risks remain, including uncertainty surrounding the Fed’s eventual exit from its ultra-accommodative monetary policy, ongoing fiscal headwinds in the U.S. and slower growth in emerging markets. Nevertheless, we are optimistic about the prospects for the upcoming year and we are confident that our Funds are well positioned to weather an uncertain economic environment.
We thank you for your continued confidence and investment in The Managers Funds. You can rest assured that under all market conditions our team is focused on delivering excellent investment management services for your benefit.
Respectfully,
Keitha Kinne
President
The Managers Funds
2
About Your Fund’s Expenses
| | |
As a shareholder of a Fund, you may incur two types of costs: (1) transaction costs, which may include sales charges (loads) on purchase payments; redemption fees; and exchange fees; and (2) ongoing costs, including management fees; distribution (12b-1) fees; and other Fund expenses. This example is intended to help you understand your ongoing costs (in dollars) of investing in the Fund and to compare these costs with the ongoing costs of investing in other mutual funds. The example is based on $1,000 invested at the beginning of the period and held for the entire period as indicated below. Actual Expenses The first line of the following table provides information about the actual account values and actual expenses. You may use the information in this line, together with the amount you invested, to estimate the expenses that you paid over the period. Simply divide your account value by $1,000 (for example, an $8,600 account value divided by $1,000 = 8.6), then multiply the result by the number in the first line under the heading entitled “Expenses Paid During Period” to estimate the expenses you paid on your account during this period. Hypothetical Example for Comparison Purposes The second line of the following table provides information about hypothetical account values and hypothetical expenses based on the Fund’s actual expense ratio and an assumed annual rate of return of 5% before expenses, which is not the Fund’s actual return. The hypothetical account values and expenses may not be used to estimate the actual ending account balance or expenses you paid for the period. You may use this information to compare the ongoing costs of investing in the Fund and other funds by comparing this 5% hypothetical example with the 5% hypothetical examples that appear in the shareholder reports of other funds. Please note that the expenses shown in the table are meant to highlight your ongoing costs only and do not reflect any transactional costs, such as sales charges (loads), redemption fees, or exchange fees. Therefore, the second line of the table is useful in comparing ongoing costs only, and will not help you determine the relative total costs of owning different funds. | | |
| | | | | | | | | | | | | | | | |
Six Months Ended October 31, 2013 | | Expense
Ratio for
the Period | | | Beginning
Account
Value
5/01/13 | | | Ending
Account
Value
10/31/13 | | | Expenses
Paid
During
the Period* | |
Managers PIMCO Bond Fund | | | | | | | | | | | | | | | | |
Based on Actual Fund Return | | | 0.58 | % | | $ | 1,000 | | | $ | 976 | | | $ | 2.89 | |
Hypothetical (5% return before expenses) | | | 0.58 | % | | $ | 1,000 | | | $ | 1,022 | | | $ | 2.96 | |
| * | Expenses are equal to the Fund’s annualized expense ratio multiplied by the average account value over the period, multiplied by the number of days in the period (184), then divided by 365. |
Managers PIMCO Bond Fund
Portfolio Manager’s Comments
Managers PIMCO Bond Fund seeks to maximize total return consistent with the preservation of capital by investing in debt securities such as corporate, mortgage-backed, international, and government bonds. Normally, the Fund will invest at least 80% of its net assets in these types of bonds.
THE PORTFOLIO MANAGER
Pacific Investment Management Company, LLC
Pacific Investment Management Company, LLC (“PIMCO”), the subadvisor for the Managers PIMCO Bond Fund, was founded in 1971. PIMCO is one of the world’s leading fixed income managers with expertise and significant resources committed to virtually every sector of the global bond market.
Managers PIMCO Bond Fund is an actively managed, diversified bond fund that focuses on intermediate-term, investment-grade bonds. The universe for the Fund includes all sectors of the bond market: governments, corporate bonds, mortgages, asset-backed securities, money market instruments, and international bonds. The Fund seeks total return consistent with preservation of capital by employing PIMCO’s “Total Return” fixed income investment philosophy. This philosophy follows three key principles:
| | • | | Major shifts in portfolio strategy are driven by longer-term, or secular, trends as opposed to short-term interest rate fluctuations. |
| | • | | Consistent investment performance is achieved by avoiding extreme swings in maturity/duration of a portfolio. |
| | • | | Emphasis is placed on adding value through state-of-the-art tools such as futures, options, and volatility analysis. |
Economic analysis serves as the base for PIMCO’s portfolio strategy. Annually, PIMCO investment professionals conduct a three-day secular forum, where long-term economic and market forces are evaluated and portfolio strategies are set. Each quarter, the team meets to evaluate the current business cycle and develop shorter-term forecasts which are used to fine-tune the investment strategy. PIMCO’s fixed income research efforts focus on identifying relative value and understanding the risks inherent in different portfolio structures, strategies, and bond market sectors. Using proprietary analytics and bottom-up credit analysis, the portfolio managers select individual bonds based on recommendations from sector analysts who specialize in corporate, mortgage, high yield, government, and international bonds.
The ideal investment exhibits many of the following traits:
| | • | | It allows management to meet its overall portfolio positioning targets. Management typically invests in investment-grade securities but may invest up to 10% of the Portfolio in securities that are below investment grade. |
| | • | | The investment has been independently analyzed by PIMCO. PIMCO does not rely solely on the credit ratings assigned by outside credit agencies. |
| | • | | Fund management deems that the security provides value relative to other securities within the same sector. |
Portfolio management:
| | • | | Is committed to seeking value across all bond market sectors. |
| | • | | Actively manages duration exposure, yield-curve position, volatility, sector allocation, and security selection and takes only modest exposures in each of these areas relative to the market. |
| | • | | Normally hedges at least 75% of its foreign currency exposure. |
| | • | | Utilizes derivatives (futures, options, swap agreements) as substitutes for physical securities as a means of gaining more cost-effective exposure. |
The investment team may sell securities when:
| | • | | Securities individually no longer represent relative value. |
| | • | | Fund management makes a shift in its portfolio strategy (change in duration, yield curve positioning, sector strategy, etc.). |
THE YEAR IN REVIEW
Fixed income markets fell during the prior 12 months with losses concentrated in May and June after conditions in financial markets deteriorated as investors reacted to signals by the Federal Reserve (“Fed”) that it would begin to slow the pace of asset purchases later in the year. The shift in tone fueled a broad-based sell-off of fixed income assets, undermining market liquidity, and sending yields higher across the risk spectrum. However, in the wake of a volatile summer sell-off, benchmark Treasury yields fell substantially in September after the Fed surprised markets by announcing no changes to its asset purchase program. Against this backdrop of elevated economic and fiscal policy uncertainty, the Fed continues to enhance one source of certainty for investors: the policy rate. The Fed will not begin hiking rates until a “considerable time” after the third quantitative easing (QE3) has been wound down; the longer the withdrawal from QE3 is delayed, the further the Fed pushes out the eventual first rate hike.
For the 12-month period ended October 31, 2013, the Managers PIMCO Bond Fund returned -0.72%, compared with -1.08% for its benchmark, the Barclays U.S. Aggregate Bond Index. The Fund outperformed steadily throughout the year with the primary exception being the period immediately following the Fed’s signaling that it would being to slow the pace of QE3. An overweight to agency mortgage-backed securities contributed to relative performance during the year, particularly in recent months as these securities benefitted from investor demand given attractive valuations. An underweight to investment-grade credits also contributed to relative performance as investment-grade credit underperformed like-duration Treasuries during the second quarter primarily due to selloffs stemming from QE tapering expectations, creating technical disruptions in the credit markets. However, later in this year this same underweight detracted from relative performance as investment grade corporates outperformed like-duration Treasuries. An underweight to U.S. duration contributed to relative performance earlier in the year as U.S. Treasury yields rose. By the end of the fiscal year, this positioning was shifted to an overweight to U.S. duration which also added value as U.S. Treasury yields fell from highs hit towards the end of the third quarter.
LOOKING FORWARD
PIMCO expects the global economy to grow at a real rate of 2.25 to 2.75 percent over the next twelve months. While this marks an acceleration relative to prior forecasts, our expectations remain below market consensus, as growth remains constrained by new normal dynamics.
In spite of persistent structural impediments to robust economic growth, we see a number of reasons to be cautiously optimistic for growth prospects over the next twelve months. Firstly, fiscal policy
Managers PIMCO Bond Fund
Portfolio Manager’s Comments (continued)
(in the U.S. and Europe) is likely to be less of a drag on global growth in the year ahead than the year just passed, although we expect U.S. sequestration to affect growth over the next few months. Secondly, measures of global financial wealth have recently increased substantially, which should strengthen private sector confidence in the year ahead. Finally, global central banks will likely continue to use monetary policy to clip financial tail risks, with the European Central Bank (ECB) risking to the occasion during the sovereign debt crisis of 2012, and high quality emerging market central banks doing so more recently during the emerging market (EM) liquidity crisis in the 2nd quarter, 2013.
We believe growth will be constrained, however, by side-effects of a highly levered global economy. Household balance sheets in developed countries will continue to reduce debt relative to income in the year ahead, limiting the developed market economies’ ability to achieve the credit traction and breakout growth rates expected by the consensus. Furthermore, the recent rise in global interest rates will result in tighter financial conditions for the most interest-rate-sensitive components of the global economy, tempering growth impulses from U.S. housing and EM corporate spending going forward.
While we expect headline growth and inflation numbers to be substantially similar to prior years, we are looking for important changes in the composition of those numbers - specifically, evidence of a transition from policy-supported growth to private sector growth. Successful handoffs are achieved when household income and spending pick up just as fiscal and monetary policy effects wane. But failed handoffs occur when household income and spending growth do not accelerate to neutralize fiscal and monetary policy drag, or when policy errors dampen private sector demand.
Central bank policy has been a key driver of financial markets and we expect this influence to persist. In the U.S., the Federal Reserve’s (Fed’s) policy response will remain data dependent, so mixed signals coming from economic data will cause market volatility. What is unlikely to change, however, is the policy rate, as long as inflation and employment remain below the Fed’s thresholds.
While the Fed is looking for opportunities to phase out its influence, scope remains for the ECB to support the nascent recovery in the Eurozone, should conditions deteriorate.
Japanese economic growth on the other hand remains dependent on the continuation of extraordinary fiscal and monetary expansion. Therefore, the implications of a policy failure would be particularly costly to Japan and to the global economy in the year to come.
Large withdrawals of liquidity from EM economies during the first half of 2013 have tightened financial conditions considerably, leading to important questions about the growth outlook for emerging markets going forward. EM countries with large U.S. Dollar reserve and pro-active central banks such as China, Russia, Mexico and Brazil will likely stabilize financial conditions and therefore growth the fastest. But EM countries with current account deficits funded by volatile fund flows like India, Turkey and Indonesia will take some time to regain control of financial conditions, and might even need assistance from international balance sheets during the cyclical period ahead. China will be the
key EM economy to watch, with upcoming structural and cyclical policy decisions weighing heavily on the outlook for sustained growth.
Managers PIMCO Bond Fund remains careful in risk taking, as most financial assets are fully valued and central banks continue to use unconventional monetary policy. While these non-economic buyers continue to distort market prices, we will maintain a cautious risk and liquidity profile, focused on high conviction ideas and high quality and sources of potential return.
• Interest Rate Strategies- Fund will seek to target neutral to slightly below benchmark duration, as the bulk of portfolio duration will be sourced from lower maturity bonds that are stabilized by the Fed’s policy rate. Portfolio positioning will remain concentrated in the 3-5 year portion of the yield curve where we see superior opportunities for rolldown and price appreciation, as market expectations for rate increases are unlikely to be met. We remain underweight the long end of the yield curve as longer maturities may not adequately compensate investors for price volatility and longer-term inflation risk. The Portfolio will maintain quality bias, investing primarily in U.S. securities and complementing those with smaller allocations to Canada, Brazil and Mexico.
• Mortgages- Agency mortgage-backed securities (MBS) present opportunities for tactical and relative value positioning, while we maintain a near benchmark level of mortgage exposure. We plan to hold non-Agency mortgages and commercial MBS that have senior positions in the capital structure and continue to be a source of relatively attractive yield.
• Corporate Bonds- The Fund will remain underweight exposure to corporate credit, as we see more favorable risk-adjusted returns in other spread sectors such as non-Agency mortgages, emerging markets and municipal bonds. Individual credits may be added opportunistically and based on issue specific considerations.
• Emerging Markets (EM)- As the pace of economic growth in the developing world slows, we will become increasingly selective in its EM allocations. We see Brazil and Mexico as high quality emerging economies with steep yield curves and high interest rates offering potential return through carry and roll-down.
• Currency- The Fund will minimize its use of currency strategies as part of overall portfolio de-risking, given the tendency for currency positions to act as shock absorbers in times of market difficulties and challenged liquidity. Furthermore, continued central bank intervention makes predicting currency movements based on fundamentals increasingly difficult.
• Municipals- The Fund will broadly maintain its municipal positioning, as the sector offers attractive yields relative to similar Treasuries. PIMCO prefers revenue bonds, including taxable Build America Bonds (“BABs”) to tax-backed general obligation bonds.
• Treasury Inflation-Protected Securities- PIMCO believes that the recent sell-off in TIPS has been overdone and that inflation protection now looks relatively attractive over the long term.
Managers PIMCO Bond Fund
Portfolio Manager’s Comments (continued)
Cumulative Total Return Performance
The Fund’s cumulative total return is based on the daily change in net asset value (NAV), and assumes that all distributions were reinvested. This chart compares a hypothetical $10,000 investment made in the Managers PIMCO Bond Fund on October 31, 2003, to a $10,000 investment made in the Barclays U.S. Aggregate Bond Index® for the same time period. Performance for periods longer than one year is annualized. The graph and table do not reflect the deduction of taxes that a shareholder would pay on a Fund distribution or redemption of shares. The listed returns for the Fund are net of expenses and the returns for the index exclude expenses. Past performance is not indicative of future results. Total returns would have been lower had certain expenses not been reduced.
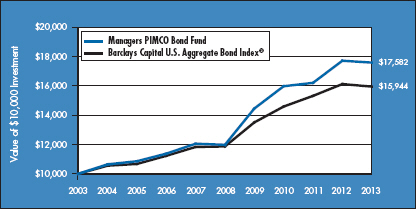
The table below shows the average annual total returns for the Managers PIMCO Bond Fund and the Barclays U.S. Aggregate Bond Index® for the same time periods ended October 31, 2013.
| | | | | | | | | | | | |
Periods Ended 10/31/131 | | One
Year | | | Five
Years | | | Ten
Years | |
Managers PIMCO Bond Fund 2,3,4,5,6,7,8 | | | (0.72 | )% | | | 7.98 | % | | | 5.81 | % |
Barclays U.S. Aggregate Bond Index®9 | | | (1.08 | )% | | | 6.09 | % | | | 4.78 | % |
The performance data shown represents past performance. Past performance is not a guarantee of future results. Current performance may be lower or higher than the performance data quoted. The investment return and principal value of an investment in the Fund will fluctuate so that an investor’s shares, when redeemed, may be worth more or less than their original cost. For performance information through the most recent month end, please call (800) 835-3879 or visit our Web site at www.managersinvest.com. Current net asset value per share for the Fund is available on the Fund’s Web site at www.managersinvest.com.
Investors should carefully consider the Fund’s investment objectives, risks, charges and expenses before investing. For this and other information, please call (800) 835-3879 or visit our Web site at www.managersinvest.com for a free prospectus. Read it carefully before investing or sending money. Distributed by Managers Distributors, Inc., member FINRA.
| 1 | Total return equals income yield plus share price change and assumes reinvestment of all dividends and capital gain distributions. Returns are net of fees and may reflect offsets of Fund expenses as described in the Prospectus. No adjustment has been made for taxes payable by shareholders on their reinvested dividends and capital gain distributions. Returns for periods greater than one year are annualized. The listed returns on the Fund are net of expenses and based on the published NAV as of October 31, 2013. All returns are in U.S. dollars($). |
| | |
| 2 | | From time to time, the Fund’s advisor has waived its fees and/or absorbed Fund expenses, which has resulted in higher returns. |
| 3 | | Fixed income funds are subject to the risks associated with investments in debt securities, such as default risk and fluctuations in the perception of the debtor’s ability to pay its creditors. Changing interest rates may adversely affect the value of a fixed income investment. An increase in interest rates typically causes the value of bonds and other fixed-income securities to fall. |
| 4 | | The Fund may use derivative instruments for hedging purposes or as part of its investment strategy. There is also a risk that a derivative intended as a hedge may not perform as expected. The main risk with derivatives is that some types can amplify a gain or loss, potentially earning or losing substantially more money than the actual cost of the derivative; or that the counterparty may fail to honor its contract terms, causing a loss for the Fund. Use of these instruments may involve certain costs and risks such as liquidity risk, interest rate risk, market risk, credit risk, management risk, and the risk that the Fund could not close out a position when it would be most advantageous to do so. |
| 5 | | Investments in international securities are subject to certain risks of overseas investing including currency fluctuations and changes in political and economic conditions, which could result in significant market fluctuations. These risks are magnified in emerging markets. |
| 6 | | High yield bonds (also known as “junk bonds”) are subject to additional risks such as the risk of default. |
| 7 | | Many bonds have call provisions which allow the debtors to pay them back before maturity. This is especially true with mortgage securities, which can be paid back any time. Typically debtors prepay their debt when it is to their advantage (when interest rates drop making a new loan at current rates more attractive), and thus likely to the disadvantage of bondholders, who may have to reinvest prepayment proceeds in securities with lower yields. Prepayment risk will vary depending on the provisions of the security and current interest rates relative to the interest rate of the debt. |
| 8 | | Market risk associated with equity securities may become more pronounced for the Fund. |
| 9 | | The Barclays U.S. Aggregate Bond Index® is an index of the U.S. investment-grade fixed-rate bond market, including both government and corporate bonds. Unlike the Fund, the Barclays U.S. Aggregate Bond Index® is unmanaged, is not available for investment, and does not incur expenses. |
| |
| Not FDIC insured, nor bank guaranteed. May lose value. |
Managers PIMCO Bond Fund
Fund Snapshots
October 31, 2013
Portfolio Breakdown (unaudited)
| | | | | | | | |
Category | | Managers
PIMCO Bond
Fund** | | | Barclays
U.S. Aggregate
Bond Index® | |
U.S. Government and Agency Obligations | | | 69.9 | % | | | 40.2 | % |
Corporate Bonds and Notes | | | 10.3 | % | | | 22.0 | % |
Foreign Government and Agency Obligations | | | 7.7 | % | | | 6.0 | % |
Municipal Bonds | | | 4.3 | % | | | 0.0 | % |
Mortgage-Backed Securities | | | 3.4 | % | | | 31.4 | % |
Asset-Backed Securities | | | 2.7 | % | | | 0.4 | % |
Municipal Closed-End Bond Funds | | | 0.4 | % | | | 0.0 | % |
Preferred Stocks | | | 0.3 | % | | | 0.0 | % |
Other Assets and Liabilities | | | 1.0 | % | | | 0.0 | % |
| ** | As a percentage of net assets. |
| | | | | | | | |
Rating | | Managers
PIMCO Bond
Fund*** | | | Barclays
U.S. Aggregate
Bond Index® | |
U.S. Treasury & Agency | | | 72.0 | % | | | 69.8 | % |
Aaa | | | 1.1 | % | | | 3.9 | % |
Aa | | | 6.4 | % | | | 3.8 | % |
A | | | 6.2 | % | | | 11.0 | % |
Baa | | | 4.8 | % | | | 11.5 | % |
Ba & lower | | | 9.5 | % | | | 0.0 | % |
| *** | As a percentage of market value of fixed income securities. Chart does not include equity securities. |
Top Ten Holdings (unaudited)
| | | | |
Security Name | | %of
Net Assets | |
RBS Securities, Inc., dated 10/31/13, due 11/04/13, | | | | |
0.100%, total to be received $155,401,727 (collateralized by $158,553,447 U.S. Treasury Notes, 0.380%, 02/15/16) | | | 12.5 | % |
RBS Securities, Inc., dated 10/31/13, due 11/01/13, 0.110%, total to be received $152,500,466 (collateralized by $155,337,167 U.S. Treasury Notes, 0.500%, 07/31/17) | | | 12.3 | |
U.S. Treasury Notes, 1.375%, 06/30/18 | | | 10.2 | |
Barclays Capital, Inc., dated 10/31/13, due 11/04/13, | | | | |
0.100%, total to be received $105,801,176 (collateralized by $107,958,830 U.S. Treasury Inflation Protection Bonds, 0.130%, 04/15/17) | | | 8.5 | |
FNMA, 5.000%, TBA* | | | 8.5 | |
Barclays Capital, Inc., dated 10/31/13, due 11/01/13, 0.100%, total to be received $105,100,292 (collateralized by $107,115,119 U.S. Treasury Inflation Protection Bonds, 0.130%, 04/15/17) | | | 8.4 | |
FNMA, 4.500%, TBA | | | 8.3 | |
U.S. Treasury Notes, 0.625%, 04/30/18 | | | 5.4 | |
FNMA, 4.000%, TBA* | | | 3.0 | |
FHLB, 0.020%, 12/11/13 | | | 2.4 | |
Top Ten as a Group | | | 79.5 | % |
| | | | |
| * | Top Ten Holding at April 30, 2013 |
Any sectors, industries, or securities discussed should not be perceived as investment recommendations. Mention of a specific security should not be considered a recommendation to buy or solicitation to sell that security. Specific securities mentioned in this report may have been sold from the Fund’s portfolio of investments by the time you receive this report.
7
Managers PIMCO Bond Fund
Schedule of Portfolio Investments
October 31, 2013
| | | | | | | | |
| | | Principal Amount† | | | Value | |
Asset-Backed Securities - 2.7% | | | | | | | | |
Amortizing Residential Collateral Trust, Series 2002-BC4, 0.750%, 07/25/32 (11/25/13)1 | | $ | 77,398 | | | $ | 71,308 | |
Bear Stearns Asset-Backed Securities, Inc., Series 2006-AQ1, Class 2A1, 0.250%, 10/25/36 (11/25/13)1 | | | 14,477 | | | | 14,435 | |
Countrywide Asset-Backed Certificates, | | | | | | | | |
Series 2005-14, Class 3A3, 0.520%, 04/25/36 (11/25/13)1 | | | 3,200,000 | | | | 3,029,840 | |
Series 2007-2, Class 2A2, 0.270%, 08/25/37 (11/25/13)1 | | | 6,713,234 | | | | 6,640,291 | |
EFS Volunteer No. 2 LLC, Series 2012-1, Class A1, 1.060%, 07/26/27 (11/25/13) (a)1 | | | 1,686,140 | | | | 1,705,809 | |
EMC Mortgage Loan Trust, Series 2001-A, Class A, 0.910%, 05/25/40 (11/25/13) (a)1 | | | 504,097 | | | | 478,242 | |
First NLC Trust, Series 2007-1, Class A1, 0.240%, 08/25/37 (11/25/13) (a)1 | | | 636,465 | | | | 323,939 | |
Fremont Home Loan Trust, Series 2006-E, Class 2A1, 0.230%, 01/25/37
(11/25/13)1 | | | 37,966 | | | | 18,704 | |
Long Beach Mortgage Loan Trust, Series 2004-4, Class 1A1, 0.730%, 10/25/34 (11/25/13)1 | | | 55,661 | | | | 53,426 | |
Morgan Stanley IXIS Real Estate Capital Trust, Series 2006-2, Class A1, 0.220%, 11/25/36 (11/25/13)1 | | | 11,165 | | | | 4,966 | |
Park Place Securities, Inc., Series 2005-WCW1, Class A1B, 0.430%, 09/25/35 (11/25/13)1 | | | 1,587,551 | | | | 1,555,365 | |
Residential Asset Securities Corporation, | | | | | | | | |
Series 2006-EMX2, Class A2, 0.370%, 02/25/36 (11/25/13)1 | | | 306,607 | | | | 300,040 | |
Series 2006-KS4, Class M1, 0.450%, 06/25/36 (11/25/13)1 | | | 6,000,000 | | | | 4,589,460 | |
Securitized Asset Backed Receivables LLC, Series 2007-HE1, Class A2A, 0.230%, 12/25/36 (11/25/13)1 | | | 447,937 | | | | 150,509 | |
Small Business Administration Participation Certificates, | | | | | | | | |
Series 2003-20I, Class 1, 5.130%, 09/01/23 | | | 44,452 | | | | 48,189 | |
Series 2007-20K, Class 1, 5.510%, 11/01/27 | | | 2,828,588 | | | | 3,144,095 | |
Series 2008-10E, Class 1, 5.110%, 09/01/18 | | | 1,066,253 | | | | 1,138,865 | |
Series 2008-20I, Class 1, 5.600%, 09/01/28 | | | 5,943,027 | | | | 6,641,956 | |
Series 2009-20E, Class 1, 4.430%, 05/01/29 | | | 3,810,865 | | | | 4,127,408 | |
Structured Asset Securities Corp., Series 2002-HF1, 0.750%, 01/25/33 (11/25/13)1 | | | 39,591 | | | | 37,723 | |
Total Asset-Backed Securities (cost $33,270,459) | | | | | | | 34,074,570 | |
Corporate Bonds and Notes - 10.3% | | | | | | | | |
Financials - 8.1% | | | | | | | | |
Ally Financial, Inc., | | | | | | | | |
3.465%, 02/11/14 (11/11/13)1 | | | 1,000,000 | | | | 1,007,270 | |
4.500%, 02/11/14 | | | 7,700,000 | | | | 7,772,188 | |
5.500%, 02/15/17 | | | 3,300,000 | | | | 3,580,500 | |
7.500%, 12/31/13 | | | 1,500,000 | | | | 1,513,388 | |
7.500%, 09/15/20 | | | 1,000,000 | | | | 1,173,750 | |
8.300%, 02/12/15 | | | 800,000 | | | | 869,000 | |
American International Group, Inc., | | | | | | | | |
5.050%, 10/01/15 | | | 400,000 | | | | 431,316 | |
6.250%, 03/15/37 | | | 800,000 | | | | 814,000 | |
8.250%, 08/15/18 | | | 2,500,000 | | | | 3,169,133 | |
MTN, 5.600%, 10/18/16 | | | 800,000 | | | | 897,498 | |
Australia and New Zealand Banking Group, Ltd., 2.125%, 01/10/14 (a) | | | 2,400,000 | | | | 2,407,308 | |
Banco Santander Brasil SA, 4.500%, 04/06/15 (a) | | | 200,000 | | | | 208,000 | |
|
The accompanying notes are an integral part of these financial statements. 8 |
Managers PIMCO Bond Fund
Schedule of Portfolio Investments (continued)
| | | | | | | | | | | | |
| | | | | | Principal Amount† | | | Value | |
Financials - 8.1% (continued) | | | | | | | | | | | | |
Bank of America Corp., | | | | | | | | | | | | |
4.500%, 04/01/15 | | | | | | $ | 10,000,000 | | | $ | 10,496,980 | |
6.500%, 08/01/16 | | | | | | | 2,800,000 | | | | 3,183,032 | |
Bank of Montreal, 2.850%, 06/09/15 (a) | | | | | | | 400,000 | | | | 415,403 | |
Bank of Nova Scotia, 1.950%, 01/30/17 (a) | | | | | | | 200,000 | | | | 206,430 | |
Barclays Bank PLC, 7.625%, 11/21/222 | | | | | | | 7,100,000 | | | | 7,341,400 | |
BBVA Bancomer SA, | | | | | | | | | | | | |
4.500%, 03/10/16 (a) | | | | | | | 500,000 | | | | 528,750 | |
6.500%, 03/10/21 (a) | | | | | | | 900,000 | | | | 978,750 | |
CIT Group, Inc., 5.250%, 04/01/14 (a) | | | | | | | 300,000 | | | | 305,625 | |
Citigroup, Inc., | | | | | | | | | | | | |
6.125%, 08/25/36 | | | | | | | 3,200,000 | | | | 3,379,962 | |
MTN, 5.500%, 10/15/14 | | | | | | | 2,577,000 | | | | 2,692,790 | |
Credit Suisse New York, 2.200%, 01/14/14 | | | | | | | 800,000 | | | | 803,013 | |
Dexia Credit Local SA, 0.717%, 04/29/14 (01/29/14) (a)1 | | | | | | | 4,100,000 | | | | 4,103,665 | |
Ford Motor Credit Co. LLC, | | | | | | | | | | | | |
7.000%, 04/15/15 | | | | | | | 1,400,000 | | | | 1,522,354 | |
8.700%, 10/01/142 | | | | | | | 1,000,000 | | | | 1,073,038 | |
Goldman Sachs Group, Inc., The, 1.265%, 02/07/14 (11/07/13)1 | | | | | | | 2,200,000 | | | | 2,204,387 | |
HSBC Bank PLC, 2.000%, 01/19/14 (a) | | | | | | | 800,000 | | | | 803,020 | |
International Lease Finance Corp., | | | | | | | | | | | | |
5.750%, 05/15/16 | | | | | | | 300,000 | | | | 321,375 | |
6.750%, 09/01/16 (a) | | | | | | | 800,000 | | | | 893,000 | |
Intesa Sanpaolo S.p.A, 2.662%, 02/24/14 (11/25/13) (a)1 | | | | | | | 1,700,000 | | | | 1,707,320 | |
JPMorgan Chase Bank, NA, | | | | | | | | | | | | |
0.584%, 06/13/16 (12/13/13)1 | | | | | | | 1,300,000 | | | | 1,288,518 | |
0.889%, 05/31/172,3 | | | EUR | | | | 900,000 | | | | 1,207,926 | |
LBG Capital No.1 PLC, | | | | | | | | | | | | |
8.500%, 12/29/49 (a)3,4 | | | | | | | 400,000 | | | | 426,703 | |
Series 8, 7.869%, 08/25/20 | | | GBP | | | | 2,300,000 | | | | 3,944,153 | |
Merrill Lynch & Co., Inc., GMTN, 6.400%, 08/28/17 | | | | | | | 3,400,000 | | | | 3,954,431 | |
Nationwide Building Society, 6.250%, 02/25/20 (a) | | | | | | | 1,800,000 | | | | 2,069,280 | |
Nordea Bank AB, 2.125%, 01/14/14 (a) | | | | | | | 400,000 | | | | 401,438 | |
Principal Life Income Funding Trusts, MTN, 5.550%, 04/27/15 | | | | | | | 2,300,000 | | | | 2,465,046 | |
Qatari Diar Finance “Q.S.C.”, 3.500%, 07/21/15 | | | | | | | 900,000 | | | | 935,217 | |
Royal Bank of Scotland Group PLC, The, 6.990%, 10/29/49 (a)3,4 | | | | | | | 2,600,000 | | | | 2,749,500 | |
SLM Corp., MTN, 6.250%, 01/25/16 | | | | | | | 300,000 | | | | 327,750 | |
Springleaf Finance Corp., 4.125%, 11/29/13 | | | EUR | | | | 3,900,000 | | | | 5,305,834 | |
State Bank of India, 4.500%, 07/27/15 (a) | | | | | | | 2,900,000 | | | | 2,990,825 | |
Stone Street Trust, 5.902%, 12/15/15 (a) | | | | | | | 2,800,000 | | | | 3,024,050 | |
Sumitomo Mitsui Banking Corp., 1.950%, 01/14/14 (a)5 | | | | | | | 1,000,000 | | | | 1,002,912 | |
UBS AG, 1.238%, 01/28/14 (01/28/14)1 | | | | | | | 300,000 | | | | 300,786 | |
Wells Fargo & Co., Series K, 7.980%, 03/29/493,4 | | | | | | | 1,600,000 | | | | 1,812,000 | |
Total Financials | | | | | | | | | | | 101,010,014 | |
|
The accompanying notes are an integral part of these financial statements. 9 |
Managers PIMCO Bond Fund
Schedule of Portfolio Investments (continued)
| | | | | | | | | | | | |
| | | | | | Principal Amount† | | | Value | |
Industrials - 1.9% | | | | | | | | | | | | |
AbbVie, Inc., 1.027%, 11/06/15 (11/06/13)1 | | | | | | $ | 2,900,000 | | | $ | 2,931,494 | |
Corp. Nacional del Cobre de Chile, 7.500%, 01/15/19 (a) | | | | | | | 1,200,000 | | | | 1,460,595 | |
Petrobras Global Finance BV, 3.000%, 01/15/19 | | | | | | | 400,000 | | | | 381,637 | |
Petrobras International Finance Co., | | | | | | | | | | | | |
3.875%, 01/27/16 | | | | | | | 3,300,000 | | | | 3,428,202 | |
5.875%, 03/01/18 | | | | | | | 2,300,000 | | | | 2,497,942 | |
Petroleos Mexicanos, 8.000%, 05/03/19 | | | | | | | 1,200,000 | | | | 1,472,400 | |
Ras Laffan Liquefied Natural Gas Co., Ltd., 5.298%, 09/30/20 (a) | | | | | | | 639,180 | | | | 695,428 | |
Rohm & Haas Co., 6.000%, 09/15/17 | | | | | | | 1,100,000 | | | | 1,268,618 | |
Time Warner, Inc., 5.875%, 11/15/16 | | | | | | | 1,200,000 | | | | 1,361,659 | |
UAL 2009-1 Pass Through Trust, 10.400%, 11/01/16 | | | | | | | 273,917 | | | | 309,527 | |
Verizon Communications, Inc., | | | | | | | | | | | | |
2.002%, 09/14/18 (12/16/13)1 | | | | | | | 500,000 | | | | 532,680 | |
2.500%, 09/15/16 | | | | | | | 700,000 | | | | 726,895 | |
3.650%, 09/14/18 | | | | | | | 1,800,000 | | | | 1,916,532 | |
5.150%, 09/15/23 | | | | | | | 400,000 | | | | 434,841 | |
6.400%, 09/15/33 | | | | | | | 1,000,000 | | | | 1,135,203 | |
Volkswagen International Finance NV, 0.858%, 04/01/14 (01/01/14) (a)1 | | | | | | | 2,900,000 | | | | 2,903,927 | |
Total Industrials | | | | | | | | | | | 23,457,580 | |
Utilities - 0.3% | | | | | | | | | | | | |
Entergy Corp., 3.625%, 09/15/15 | | | | | | | 2,200,000 | | | | 2,280,428 | |
Majapahit Holding, B.V., 7.750%, 01/20/20 | | | | | | | 700,000 | | | | 806,750 | |
Tokyo Electric Power Co., Inc., The, | | | | | | | | | | | | |
Series 513, 1.850%, 07/28/14 | | | JPY | | | | 7,000,000 | | | | 70,919 | |
Series 527, 1.500%, 05/30/14 | | | JPY | | | | 1,000,000 | | | | 10,121 | |
Total Utilities | | | | | | | | | | | 3,168,218 | |
Total Corporate Bonds and Notes (cost $119,402,345) | | | | | | | | | | | 127,635,812 | |
Foreign Government and Agency Obligations - 7.7% | | | | | | | | | | | | |
Autonomous Community of Valencia Spain, Notes, EMTN, 4.375%, 07/16/15 | | | EUR | | | | 400,000 | | | | 559,395 | |
Banco Nacional de Desenvolvimento Economico e Social, | | | | | | | | | | | | |
Notes, 3.375%, 09/26/16 (a)5 | | | | | | | 400,000 | | | | 405,000 | |
Notes, 4.125%, 09/15/17 (a) | | | EUR | | | | 400,000 | | | | 573,787 | |
Brazil Letras do Tesouro Nacional, Notes, 12.991%, 01/01/176 | | | BRL | | | | 3,000,000 | | | | 948,310 | |
Brazil Notas do Tesouro Nacional, Notes, Series F, 10.000%, 01/01/17 | | | BRL | | | | 1,539,000 | | | | 685,374 | |
Export-Import Bank of Korea, The, Notes, 8.125%, 01/21/14 | | | | | | | 1,000,000 | | | | 1,016,101 | |
Italy Buoni Ordinari del Tesoro, | | | | | | | | | | | | |
Notes, 0.440%, 02/28/146 | | | EUR | | | | 11,000,000 | | | | 14,913,706 | |
Notes, 0.734%, 09/12/146 | | | EUR | | | | 3,400,000 | | | | 4,587,205 | |
Notes, 0.746%, 10/14/146 | | | EUR | | | | 10,200,000 | | | | 13,751,297 | |
Italy Buoni Poliennali Del Tesoro, Notes, 2.500%, 03/01/15 | | | EUR | | | | 2,200,000 | | | | 3,046,664 | |
Italy Certificati di Credito del Tesoro, Notes, 1.365%, 06/30/156 | | | EUR | | | | 1,400,000 | | | | 1,858,658 | |
Korea Development Bank Notes, The, 4.375%, 08/10/15 | | | | | | | 3,500,000 | | | | 3,704,778 | |
Korea Finance Corp. Notes, 3.250%, 09/20/16 | | | | | | | 800,000 | | | | 837,787 | |
|
The accompanying notes are an integral part of these financial statements. 10 |
Managers PIMCO Bond Fund
Schedule of Portfolio Investments (continued)
| | | | | | | | | | | | |
| | | | | | Principal Amount† | | | Value | |
Foreign Government and Agency Obligations - 7.7% (continued) | | | | | | | | | | | | |
Korea Housing Finance Corp. Notes, 4.125%, 12/15/15 (a) | | | | | | $ | 500,000 | | | $ | 530,020 | |
Mexico Cetes, Notes, Series BI, 3.447%, 01/23/146 | | | MXN | | | | 38,000,000 | | | | 288,957 | |
Ontario Bonds, Province of, | | | | | | | | | | | | |
3.150%, 06/02/22 | | | CAD | | | | 1,300,000 | | | | 1,249,379 | |
4.000%, 06/02/21 | | | CAD | | | | 2,700,000 | | | | 2,781,105 | |
4.200%, 06/02/20 | | | CAD | | | | 1,900,000 | | | | 1,990,586 | |
4.400%, 06/02/19 | | | CAD | | | | 1,400,000 | | | | 1,482,618 | |
MTN, 5.500%, 06/02/18 | | | CAD | | | | 400,000 | | | | 439,887 | |
Ontario Notes, Province of, | | | | | | | | | | | | |
1.000%, 07/22/16 | | | | | | | 100,000 | | | | 100,721 | |
1.650%, 09/27/19 | | | | | | | 1,100,000 | | | | 1,072,345 | |
3.000%, 07/16/18 | | | | | | | 400,000 | | | | 425,307 | |
Quebec Bonds, Province of, | | | | | | | | | | | | |
3.500%, 07/29/20 | | | | | | | 500,000 | | | | 530,496 | |
3.500%, 12/01/22 | | | CAD | | | | 2,800,000 | | | | 2,735,092 | |
4.250%, 12/01/21 | | | CAD | | | | 3,900,000 | | | | 4,059,307 | |
Spain Government Bond, 3.300%, 10/31/14 | | | EUR | | | | 1,500,000 | | | | 2,088,261 | |
Spain Letras del Tesoro, | | | | | | | | | | | | |
Notes, 0.536%, 03/14/146 | | | EUR | | | | 900,000 | | | | 1,219,580 | |
Notes, 0.587%, 04/16/146 | | | EUR | | | | 13,400,000 | | | | 18,145,209 | |
Notes, 0.721%, 10/17/146 | | | EUR | | | | 6,800,000 | | | | 9,169,184 | |
Total Foreign Government and Agency Obligations (cost $94,639,409) | | | | | | | | | | | 95,196,116 | |
Mortgage-Backed Securities - 3.4% | | | | | | | | | | | | |
American Home Mortgage Investment Trust, Series 2004-4, Class 4A, 2.367%, 02/25/45 (11/25/13)1 | | | | | | | 447,617 | | | | 448,773 | |
Arran Residential Mortgages Funding PLC, Series 2010-1A, Class A2B, 1.626%, 05/16/47 (11/18/13) (a)1 | | | EUR | | | | 1,648,791 | | | | 2,269,599 | |
Bank of America Funding Corp., Series 2005-D, Class A1, 2.633%, 05/25/35 (11/25/13)1 | | | | | | | 516,606 | | | | 524,684 | |
Bear Stearns Adjustable Rate Mortgage Trust, | | | | | | | | | | | | |
Series 2000-2, Class A1, 2.735%, 11/25/30 (12/25/13)1 | | | | | | | 12,174 | | | | 12,286 | |
Series 2002-11, Class 1A1, 2.563%, 02/25/33 (11/25/13)1 | | | | | | | 11,108 | | | | 11,125 | |
Series 2003-1, Class 6A1, 2.574%, 04/25/33 (11/25/13)1 | | | | | | | 201,518 | | | | 206,030 | |
Series 2005-2, Class A1, 2.600%, 03/25/35 (11/25/13)1 | | | | | | | 5,796,260 | | | | 5,851,840 | |
Series 2005-2, Class A2, 2.793%, 03/25/35 (11/25/13)1 | | | | | | | 2,964,480 | | | | 2,967,667 | |
Series 2005-5, Class A2, 2.250%, 08/25/35 (11/25/13)1 | | | | | | | 5,485,438 | | | | 5,519,974 | |
Series 2005-12, Class 13A1, 5.380%, 02/25/36 (12/25/13)1 | | | | | | | 181,285 | | | | 168,025 | |
Bear Stearns Alt-A Trust, | | | | | | | | | | | | |
Series 2005-4, Class 23A1, 2.658%, 05/25/35 (11/25/13)1 | | | | | | | 1,191,755 | | | | 1,115,917 | �� |
Series 2005-7, Class 22A1, 2.720%, 09/25/35 (11/25/13)1 | | | | | | | 573,217 | | | | 480,698 | |
Bear Stearns Commercial Mortgage Securities Trust, Series 2007-PW18, Class A4, 5.700%, 06/11/50 | | | | | | | 2,800,000 | | | | 3,188,641 | |
Citigroup Mortgage Loan Trust, Inc., | | | | | | | | | | | | |
Series 2005-6, Class A1, 2.270%, 09/25/35 (11/25/13)1 | | | | | | | 4,006,814 | | | | 3,963,346 | |
Series 2005-11, Class A2A, 2.510%, 10/25/35 (11/25/13)1 | | | | | | | 247,204 | | | | 242,942 | |
Countrywide Alternative Loan Trust, Series 2007-OA7, Class A1A, 0.350%, 05/25/47 (11/25/13)1 | | | | | | | 1,109,279 | | | | 890,963 | |
The accompanying notes are an integral part of these financial statements.
11
Managers PIMCO Bond Fund
Schedule of Portfolio Investments (continued)
| | | | | | | | | | | | |
| | | | | | Principal Amount† | | | Value | |
Mortgage-Backed Securities - 3.4% (continued) | | | | | | | | | | | | |
Countrywide Home Loans Mortgage Pass Through Trust, Series 2005-HYB9, Class 3A2A, 2.417%, 02/20/36 (11/20/13)1 | | | | | | $ | 290,330 | | | $ | 257,215 | |
CSMC, Series 2010-18R, Class 4A4, 2.569%, 04/26/38 (a)3 | | | | | | | 1,200,000 | | | | 1,165,814 | |
GreenPoint Mortgage Funding Trust, Series 2006-AR8, Class 1A1A, 0.250%, 01/25/47 (11/25/13)1 | | | | | | | 11 | | | | 11 | |
GSR Mortgage Loan Trust, Series 2005-AR7, Class 6A1, 5.043%, 11/25/353 | | | | | | | 703,499 | | | | 692,253 | |
IndyMac Index Mortgage Loan Trust, Series 2005-AR31, Class 1A1, 2.369%, 01/25/36 (12/25/13)1 | | | | | | | 1,356,071 | | | | 1,067,592 | |
JPMorgan Chase Commercial Mortgage Securities Trust, | | | | | | | | | | | | |
Series 2006-LDP9, Class A3, 5.336%, 05/15/47 | | | | | | | 2,100,000 | | | | 2,313,903 | |
Series 2010-C2, Class A3, 4.070%, 11/15/43 (a) | | | | | | | 2,000,000 | | | | 2,134,708 | |
JPMorgan Mortgage Trust, Series 2005-A1, Class 6T1, 3.947%, 02/25/35 (11/25/13)1 | | | | | | | 221,756 | | | | 223,626 | |
Merrill Lynch Mortgage Investors Trust, | | | | | | | | | | | | |
Series MLCC 2005-3, Class 4A, 0.420%, 11/25/35 (11/25/13)1 | | | | | | | 117,247 | | | | 108,290 | |
Series MLMI 2005-A10, Class A, 0.380%, 02/25/36 (11/25/13)1 | | | | | | | 687,573 | | | | 630,146 | |
Opteum Mortgage Acceptance Corp. Asset Backed Pass-Through Certificates, Series 2005-5, Class 1APT, 0.450%, 12/25/35 (11/25/13)1 | | | | | | | 2,192,109 | | | | 1,900,144 | |
Prime Mortgage Trust, | | | | | | | | | | | | |
Series 2004-CL1, Class 1A2, 0.570%, 02/25/34 (11/25/13)1 | | | | | | | 97,865 | | | | 92,487 | |
Series 2004-CL1, Class 2A2, 0.570%, 02/25/19 (11/25/13)1 | | | | | | | 2,236 | | | | 2,203 | |
Silenus European Loan Conduit No. 25, Ltd., Series 25X, Class A, 0.376%, 05/15/19 (11/15/13)1 | | | EUR | | | | 66,719 | | | | 87,191 | |
Structured Asset Mortgage Investments Trust, | | | | | | | | | | | | |
Series 2002-AR3, Class A1, 0.833%, 09/19/32 (11/19/13)1 | | | | | | | 228,841 | | | | 220,248 | |
Series 2005-AR5, Class A2, 0.423%, 07/19/35 (11/19/13)1 | | | | | | | 732,621 | | | | 700,695 | |
Structured Asset Securities Corp., | | | | | | | | | | | | |
Series 2001-21A, Class 1A1, 2.330%, 01/25/32 (11/25/13)1 | | | | | | | 16,806 | | | | 14,978 | |
Series 2006-11, Class A1, 2.653%, 10/28/35 (11/28/13) (a)1 | | | | | | | 360,628 | | | | 340,590 | |
Wachovia Bank Commercial Mortgage Trust, Series 2007-WHL8, Class A1, 0.254%, 06/15/20 (11/15/13) (a)1 | | | | | | | 1,253,783 | | | | 1,238,576 | |
WaMu Mortgage Pass-Through Certificates, | | | | | | | | | | | | |
Series 2002-AR17, Class 1A, 1.348%, 11/25/42 (11/25/13)1 | | | | | | | 119,825 | | | | 113,101 | |
Series 2005-AR13, Class A1A1, 0.460%, 10/25/45 (11/25/13)1 | | | | | | | 244,175 | | | | 227,838 | |
Washington Mutual MSC Mortgage Pass-Through Certificates Trust, Series 2002-AR1, 2.018%, 02/25/31 (12/25/13)1 | | | | | | | 3,113 | | | | 3,102 | |
Wells Fargo Mortgage Backed Securities Trust, Series 2006-AR2, Class 2A1, 2.633%, 03/25/363 | | | | | | | 1,182,168 | | | | 1,182,443 | |
Total Mortgage-Backed Securities (cost $41,949,459) | | | | | | | | | | | 42,579,664 | |
Municipal Bonds - 4.3% | | | | | | | | | | | | |
American Municipal Power, Inc., Combined Hydroelectric Projects Revenue, Taxable Build America, Series 2010 B, 8.084%, 02/15/50 | | | | | | | 1,000,000 | | | | 1,311,700 | |
California Infrastructure & Economic Development Bank Revenue, UCSF Neurosciences Building 19A, Taxable Build America, Series 2010 B, 6.486%, 05/15/49 | | | | | | | 1,000,000 | | | | 1,088,630 | |
California State General Obligation, Build America Bonds, 7.500%, 04/01/34 | | | | | | | 1,300,000 | | | | 1,706,627 | |
California State General Obligation, Build America Bonds, 7.550%, 04/01/39 | | | | | | | 1,300,000 | | | | 1,759,576 | |
California State General Obligation, Build America Bonds, 7.600%, 11/01/40 | | | | | | | 1,000,000 | | | | 1,369,800 | |
California State General Obligation, Build America Bonds, 7.950%, 03/01/36 | | | | | | | 1,100,000 | | | | 1,282,611 | |
California State University Systemwide Revenue, Series 2009 A, 5.250%, 11/01/38 | | | | | | | 500,000 | | | | 526,750 | |
The accompanying notes are an integral part of these financial statements.
12
Managers PIMCO Bond Fund
Schedule of Portfolio Investments (continued)
| | | | | | | | |
| | | Principal Amount† | | | Value | |
Municipal Bonds - 4.3% (continued) | | | | | | | | |
California State University Systemwide Revenue, Taxable Build America,
Series 2010 B, 6.434%, 11/01/30 | | $ | 700,000 | | | $ | 815,262 | |
Calleguas-Las Virgenes, CA Public Financing Authority Water Revenue, Calleguas Municipal Water District, Taxable Build America, Series 2010 B, 5.944%, 07/01/40 | | | 1,000,000 | | | | 1,089,530 | |
Chicago, IL Transit Authority, Sales & Transfer Tax Receipts Revenue, Pension Funding, Series 2008 A, 6.300%, 12/01/21 | | | 100,000 | | | | 110,683 | |
Chicago, IL Transit Authority, Sales & Transfer Tax Receipts Revenue, Pension Funding, Series 2008 A, 6.899%, 12/01/40 | | | 1,600,000 | | | | 1,841,328 | |
Chicago, IL Transit Authority, Sales & Transfer Tax Receipts Revenue, Retiree Health Care, Series 2008 B, 6.300%, 12/01/21 | | | 200,000 | | | | 221,366 | |
Chicago, IL Transit Authority, Sales & Transfer Tax Receipts Revenue, Retiree Health Care, Series 2008 B, 6.899%, 12/01/40 | | | 1,700,000 | | | | 1,942,386 | |
Chicago, IL Transit Authority, Sales & Transfer Tax Receipts Revenue, Taxable Build America, Series 2010 B, 6.200%, 12/01/40 | | | 1,000,000 | | | | 1,059,750 | |
Chicago, IL Transit Authority, Sales Tax Receipts Revenue, Series 2016, 5.250%, 12/01/36 | | | 2,200,000 | | | | 2,240,458 | |
Clark County, NV Airport Revenue, Taxable Direct Payment Build America, Series C, 6.820%, 07/01/45 | | | 800,000 | | | | 993,080 | |
Illinois Municipal Electric Agency Power Supply System Revenue, Series C, 6.832%, 02/01/35 | | | 800,000 | | | | 873,648 | |
Irvine Ranch, CA District Joint Powers Agency Water Revenue, 2.388%, 03/15/14 | | | 2,800,000 | | | | 2,804,116 | |
Los Angeles County Public Works Financing Authority Revenue, Multiple Capital Projects I, Series 2010 B, Taxable Build America, 7.488%, 08/01/33 | | | 200,000 | | | | 245,024 | |
Los Angeles County Public Works Financing Authority Revenue, Multiple Capital Projects I, Series 2010 B, Taxable Build America, 7.618%, 08/01/40 | | | 300,000 | | | | 363,429 | |
Los Angeles, CA Unified School District General Obligation, Series A-1, 4.500%, 07/01/22 (AGM Insured)7 | | | 3,600,000 | | | | 3,947,688 | |
Los Angeles, CA Unified School District General Obligation, Taxable Build America, Series 2010 RY, 6.758%, 07/01/34 | | | 4,000,000 | | | | 4,998,600 | |
Los Angeles, CA Wastewater System Revenue, Series 2010 A, 5.713%, 06/01/39 | | | 1,000,000 | | | | 1,097,140 | |
New Jersey State Turnpike Authority Revenue, Series 2010 A, 7.102%, 01/01/41 | | | 800,000 | | | | 1,033,152 | |
New York City Municipal Finance Authority Revenue, Water and Sewer System General Resolution, Taxable Bond | | | | | | | | |
America, Series 2010 GG, 5.724%, 06/15/42 | | | 5,000,000 | | | | 5,723,000 | |
New York City Municipal Finance Authority Revenue, Water and Sewer System Second General Resolution, Taxable Bond America, Series 2011 CC, 5.882%, 06/15/44 | | | 1,100,000 | | | | 1,286,813 | |
New York City Municipal Finance Authority Revenue, Water and Sewer System Second General Resolution, | | | | | | | | |
Taxable Bond America, Series 2011 CC, 6.282%, 06/15/42 | | | 1,100,000 | | | | 1,202,707 | |
New York Liberty Development Corp., Liberty Revenue, 4 World Trade Center Project, 5.750%, 11/15/51 | | | 1,000,000 | | | | 1,068,150 | |
New York State Dormitory Authority, 5.000%, 12/15/30 | | | 2,000,000 | | | | 2,196,220 | |
North Carolina Turnpike Authority State Annual Appropriation Revenue, Triangle Expressway System, Taxable Build America, Series 2009 B, 6.700%, 01/01/39 | | | 900,000 | | | | 985,590 | |
Public Power Generation Agency Revenue, Whelan Energy Center Unit 2, Taxable Build America, Series 2009 A, 7.242%, 01/01/41 | | | 1,200,000 | | | | 1,312,836 | |
San Francisco Bay Area Toll Authority Subordinate Toll Bridge Revenue, Series 2010 S-1, 7.043%, 04/01/50 | | | 900,000 | | | | 1,143,045 | |
Truckee Meadows Water Authority Revenue, Series 2005 A, 5.000%, 07/01/36 (NATL-RE)7 | | | 200,000 | | | | 203,548 | |
University of California General Revenue, Taxable Build America, Series 2009 R, 6.270%, 05/15/31 | | | 2,500,000 | | | | 2,701,700 | |
University of California Medical Center Regents Revenue, Series 2010 H, 6.548%, 05/15/48 | | | 300,000 | | | | 357,996 | |
University of California Medical Center Regents Revenue, Series 2010 H, 6.398%, 05/15/31 | | | 200,000 | | | | 230,692 | |
Total Municipal Bonds (cost $46,649,728) | | | | | | | 53,134,631 | |
| | | Shares | | | | |
Municipal Closed-End Bond Funds - 0.4% | | | | | | | | |
Dreyfus Municipal Income, Inc. | | | 37,500 | | | | 321,000 | |
The accompanying notes are an integral part of these financial statements.
13
Managers PIMCO Bond Fund
Schedule of Portfolio Investments (continued)
| | | | | | | | |
| | | Shares | | | Value | |
Municipal Closed-End Bond Funds - 0.4% (continued) | | | | | | | | |
DWS Municipal Income Trust | | | 55,000 | | | $ | 667,700 | |
Invesco Advantage Municipal Income Trust II | | | 61,796 | | | | 652,566 | |
Invesco Trust for Investment Grade Municipals | | | 55,000 | | | | 671,550 | |
MFS Municipal Income Trust | | | 53,800 | | | | 337,864 | |
Nuveen Performance Plus Municipal Fund | | | 55,000 | | | | 750,200 | |
Nuveen Premium Income Municipal Fund II | | | 55,000 | | | | 708,400 | |
Nuveen Premium Income Municipal Fund IV | | | 55,000 | | | | 660,000 | |
Nuveen Quality Income Municipal Fund2 | | | 55,000 | | | | 695,200 | |
Total Municipal Closed-End Bond Funds (cost $6,147,228) | | | | | | | 5,464,480 | |
Preferred Stocks - 0.3% | | | | | | | | |
DG Funding Trust, 0.535% (Financials) (a)5
(cost $6,037,773) | | | 573 | | | | 4,056,821 | |
| | | Principal Amount† | | | | |
U.S. Government and Agency Obligations - 69.9% | | | | | | | | |
Federal Home Loan Mortgage Corporation - 6.7% | | | | | | | | |
FHLMC, | | | | | | | | |
0.875%, 03/07/18 | | $ | 600,000 | | | | 590,475 | |
1.000%, 03/08/17 to 09/29/172 | | | 28,400,000 | | | | 28,487,560 | |
1.250%, 08/01/19 to 10/02/192 | | | 5,600,000 | | | | 5,406,363 | |
2.533%, 07/01/30 (01/15/14)1 | | | 1,717 | | | | 1,779 | |
2.693%, 11/01/34 (01/15/14)1 | | | 1,039,338 | | | | 1,109,098 | |
3.750%, 03/27/19 | | | 1,200,000 | | | | 1,331,783 | |
5.146%, 08/01/35 (01/15/14)1 | | | 52,844 | | | | 55,880 | |
5.500%, 08/23/17 | | | 100,000 | | | | 116,726 | |
FHLMC Gold Pool, | | | | | | | | |
4.000%, 09/01/40 to 12/01/41 | | | 4,260,023 | | | | 4,479,125 | |
4.000%, TBA | | | 13,000,000 | | | | 13,641,875 | |
4.500%, 06/01/23 to 07/01/41 | | | 3,785,617 | | | | 4,048,893 | |
5.500%, 11/01/26 to 05/01/40 | | | 10,125,936 | | | | 10,974,360 | |
6.000%, 02/01/16 to 11/01/37 | | | 6,164,507 | | | | 6,724,127 | |
6.500%, 01/01/26 | | | 14,804 | | | | 16,364 | |
FHLMC REMICS, | | | | | | | | |
0.324%, 07/15/19 to 08/15/19 (11/15/13)1 | | | 1,549,597 | | | | 1,547,513 | |
0.474%, 05/15/36 (11/15/13)1 | | | 769,755 | | | | 770,573 | |
0.674%, 09/15/30 (11/15/13)1 | | | 25,936 | | | | 25,957 | |
6.500%, 08/15/31 | | | 2,796,452 | | | | 3,148,892 | |
7.000%, 11/15/20 | | | 11,592 | | | | 12,510 | |
7.500%, 08/15/30 | | | 158,939 | | | | 186,763 | |
FHLMC Structured Pass Through Securities, 1.353%, 02/25/45 (11/25/13)1 | | | 114,333 | | | | 118,588 | |
Total Federal Home Loan Mortgage Corporation | | | | | | | 82,795,204 | |
Federal National Mortgage Association - 39.4% | | | | | | | | |
FNMA, | | | | | | | | |
0.875%, 08/28/17 to 05/21/182 | | | 8,700,000 | | | | 8,616,140 | |
The accompanying notes are an integral part of these financial statements.
14
Managers PIMCO Bond Fund
Schedule of Portfolio Investments (continued)
| | | | | | | | |
| | | Principal Amount† | | | Value | |
Federal National Mortgage Association - 39.4% (continued) | | | | | | | | |
FNMA, | | | | | | | | |
1.250%, 01/30/172 | | $ | 2,400,000 | | | $ | 2,439,977 | |
1.353%, 07/01/44 (12/25/13)1 | | | 130,911 | | | | 133,042 | |
1.875%, 09/18/18 | | | 300,000 | | | | 305,273 | |
2.290%, 09/01/35 (12/25/13)1 | | | 901,879 | | | | 949,402 | |
2.310%, 08/01/22 | | | 1,800,000 | | | | 1,724,838 | |
2.471%, 06/01/35 (12/25/13)1 | | | 1,580,109 | | | | 1,684,731 | |
2.870%, 09/01/27 | | | 1,100,000 | | | | 986,303 | |
3.000%, TBA | | | 18,000,000 | | | | 18,652,501 | |
3.330%, 11/01/21 | | | 96,778 | | | | 103,534 | |
3.388%, 05/01/36 (12/25/13)1 | | | 779,135 | | | | 809,043 | |
3.500%, 11/01/25 | | | 40,269 | | | | 42,623 | |
3.500%, TBA | | | 17,000,000 | | | | 17,652,578 | |
3.852%, 05/01/36 (12/25/13)1 | | | 375,404 | | | | 394,379 | |
4.000%, 04/01/20 to 10/01/31 | | | 1,891,214 | | | | 2,009,531 | |
4.000%, TBA | | | 35,000,000 | | | | 37,043,438 | |
4.500%, 05/01/18 to 05/01/42 | | | 46,993,348 | | | | 50,393,279 | |
4.500%, TBA | | | 96,000,000 | | | | 102,738,130 | |
5.000%, 02/13/17 to 03/01/42 | | | 34,316,488 | | | | 37,605,844 | |
5.000%, TBA | | | 97,000,000 | | | | 105,427,681 | |
5.072%, 05/01/35 (12/25/13)1 | | | 90,684 | | | | 97,383 | |
5.375%, 06/12/17 | | | 1,300,000 | | | | 1,504,044 | |
5.500%, 11/01/17 to 09/01/41 | | | 38,185,949 | | | | 41,664,369 | |
5.500%, TBA | | | 16,000,000 | | | | 17,462,504 | |
6.000%, 05/01/16 to 05/01/41 | | | 32,416,966 | | | | 35,499,975 | |
6.500%, 11/01/35 | | | 157,095 | | | | 178,237 | |
FNMA REMICS, | | | | | | | | |
0.230%, 12/25/36 (11/25/13)1 | | | 250,614 | | | | 245,559 | |
0.480%, 04/25/37 (11/25/13)1 | | | 496,084 | | | | 496,042 | |
0.620%, 09/25/35 (11/25/13)1 | | | 1,145,715 | | | | 1,147,764 | |
2.419%, 05/25/35 (11/25/13)1 | | | 133,999 | | | | 140,596 | |
5.000%, 04/25/33 | | | 954,376 | | | | 1,046,236 | |
7.200%, 05/25/23 | | | 356,664 | | | | 404,939 | |
FNMA Whole Loan, 5.981%, 12/25/423 | | | 211,559 | | | | 243,400 | |
Total Federal National Mortgage Association | | | | | | | 489,843,315 | |
Government National Mortgage Association - 0.9% | | | | | | | | |
GNMA, | | | | | | | | |
1.625%, 03/20/24 to 11/20/29 (12/20/13)1 | | | 245,630 | | | | 254,886 | |
1.750%, 08/20/25 (12/20/13)1 | | | 15,355 | | | | 15,983 | |
2.000%, 04/20/21 (12/20/13)1 | | | 4,688 | | | | 4,864 | |
5.000%, 07/15/34 to 12/15/41 | | | 8,548,080 | | | | 9,334,410 | |
6.500%, 06/20/28 | | | 429,994 | | | | 485,881 | |
6.750%, 10/16/403 | | | 1,206,367 | | | | 1,367,536 | |
Total Government National Mortgage Association | | | | | | | 11,463,560 | |
The accompanying notes are an integral part of these financial statements.
15
Managers PIMCO Bond Fund
Schedule of Portfolio Investments (continued)
| | | | | | | | |
| | | Principal Amount† | | | Value | |
U.S. Government Obligations - 22.9% | | | | | | | | |
U.S. Treasury Inflation Indexed Bonds, 3.625%, 04/15/28 | | $ | 2,168,925 | | | $ | 3,009,976 | |
U.S. Treasury Inflation Indexed Notes, | | | | | | | | |
0.125%, 04/15/17 to 07/15/22 | | | 6,006,884 | | | | 5,970,256 | |
0.625%, 07/15/21 | | | 7,055,952 | | | | 7,380,639 | |
1.125%, 01/15/21 | | | 11,867,010 | | | | 12,833,981 | |
1.250%, 07/15/20 | | | 214,474 | | | | 235,880 | |
U.S. Treasury Inflation Linked Notes, 2.375%, 01/15/25 | | | 15,322,645 | | | | 18,369,216 | |
U.S. Treasury Inflation Protected Securities, | | | | | | | | |
1.750%, 01/15/28 | | | 669,798 | | | | 753,994 | |
2.000%, 01/15/26 | | | 8,837,325 | | | | 10,239,561 | |
2.375%, 01/15/27 | | | 13,568,373 | | | | 16,389,115 | |
2.500%, 01/15/29 | | | 3,703,552 | | | | 4,578,083 | |
3.875%, 04/15/29 | | | 1,849,393 | | | | 2,663,559 | |
U.S. Treasury Notes, | | | | | | | | |
0.625%, 04/30/18 | | | 68,700,000 | | | | 67,122,030 | |
0.750%, 02/28/188 | | | 88,000 | | | | 86,707 | |
1.000%, 05/31/18 to 08/31/198,9 | | | 9,000,000 | | | | 8,757,188 | |
1.375%, 06/30/18 | | | 125,600,000 | | | | 126,527,305 | |
Total U.S. Government Obligations | | | | | | | 284,917,490 | |
Total U.S. Government and Agency Obligations (cost $865,306,300) | | | | | | | 869,019,569 | |
Short-Term Investments - 48.9% | | | | | | | | |
Certificates of Deposit - 0.1% | | | | | | | | |
Itau Unibanco SA, 0.140%, 10/31/146 | | | 1,100,000 | | | | 1,084,813 | |
Repurchase Agreements - 45.2% | | | | | | | | |
Barclays Capital, Inc., dated 10/31/13, due 11/01/13, 0.100%, total to be received $105,100,292 (collateralized by $107,115,119 U.S. Treasury Inflation Protection Bonds, 0.130%, 04/15/17) | | | 105,100,000 | | | | 105,100,000 | |
Barclays Capital, Inc., dated 10/31/13, due 11/04/13, 0.100%, total to be received $105,801,176 (collateralized by $107,958,830 U.S. Treasury Inflation Protection Bonds, 0.130%, 04/15/17) | | | 105,800,000 | | | | 105,800,000 | |
Citigroup Global Markets, Inc., dated 10/31/13, due 11/01/13, 0.110%, total to be received $3,392,403 (collateralized by various U.S. Government Agency Obligations, 1.625% - 7.000%, 01/14/14 - 10/01/43, totaling $3,460,241)10 | | | 3,392,393 | | | | 3,392,393 | |
Citigroup Global Markets, Inc., dated 10/31/13, due 11/01/13, 0.110%, total to be received $8,300,025 (collateralized by $8,445,391 U.S. Treasury Notes, 1.380%, 07/31/18) | | | 8,300,000 | | | | 8,300,000 | |
Citigroup Global Markets, Inc., dated 10/31/13, due 11/04/13, 0.100%, total to be received $8,300,092 (collateralized by $8,468,905 U.S. Treasury Notes, 1.000%, 03/31/17) | | | 8,300,000 | | | | 8,300,000 | |
Credit Suisse Securities (USA) LLC, dated 10/31/13, due 11/01/13, 0.080%, total to be received $713,403 (collateralized by various U.S. Government Agency Obligations, 0.000%, 02/15/18 - 11/15/40, totaling $727,670)10 | | | 713,401 | | | | 713,401 | |
Deutsche Bank Securities, Inc., dated 10/31/13, due 11/01/13, 0.120%, total to be received $3,392,404 (collateralized by various U.S. Government Agency Obligations, 2.000% - 7.000%, 07/01/25 - 11/01/47, totaling $3,460,241)10 | | | 3,392,393 | | | | 3,392,393 | |
J.P. Morgan Securities LLC., dated 10/31/13, due 11/01/13, 0.110%, total to be received $8,200,025 (collateralized by $8,307,490 U.S. Treasury Notes, 3.630%, 02/15/20) | | | 8,200,000 | | | | 8,200,000 | |
J.P. Morgan Securities LLC., dated 10/31/13, due 11/04/13, 0.100%, total to be received $4,100,046 (collateralized by $4,162,283 U.S. Treasury Notes, 3.630%, 02/15/20) | | | 4,100,000 | | | | 4,100,000 | |
The accompanying notes are an integral part of these financial statements.
16
Managers PIMCO Bond Fund
Schedule of Portfolio Investments (continued)
| | | | | | | | |
| | | Principal Amount† | | | Value | |
Short-Term Investments - 48.9% | | | | | | | | |
Repurchase Agreements - 45.2% (continued) | | | | | | | | |
Merrill Lynch, Pierce, Fenner & Smith, Inc., dated 10/31/13, due 11/01/13, 0.100%, total to be received $3,392,402 (collateralized by various U.S. Government Agency Obligations, 3.000% - 3.500%, 09/20/42 - 05/20/43, totaling
$3,460,241)10 | | $ | 3,392,393 | | | $ | 3,392,393 | |
Mizuho Securities USA, Inc., dated 10/31/13, due 11/01/13, 0.110%, total to be received $3,392,403 (collateralized by various U.S. Government Agency Obligations, 0.000% - 9.000%, 11/15/13 - 04/01/43, totaling $3,460,246)10 | | | 3,392,393 | | | | 3,392,393 | |
RBS Securities, Inc., dated 10/31/13, due 11/01/13, 0.110%, total to be received $152,500,466 (collateralized by $155,337,167 U.S. Treasury Notes, 0.500%, 07/31/17) | | | 152,500,000 | | | | 152,500,000 | |
RBS Securities, Inc., dated 10/31/13, due 11/04/13, 0.100%, total to be received $155,401,727 (collateralized by $158,553,447 U.S. Treasury Notes, 0.380%, 02/15/16) | | | 155,400,000 | | | | 155,400,000 | |
TD Securities (USA) LLC., dated 10/31/13, due 11/01/13, 0.110%, total to be received $300,001 (collateralized by $308,098 U.S. Treasury Notes, 1.500%, 06/30/16) | | | 300,000 | | | | 300,000 | |
Total Repurchase Agreements | | | | | | | 562,282,973 | |
U.S. Government and Agency Discount Notes - 3.4% | | | | | | | | |
FHLB, 0.020%, 12/11/136 | | | 30,600,000 | | | | 30,599,327 | |
FHLB, 0.020%, 12/27/136 | | | 2,500,000 | | | | 2,499,922 | |
FHLB, 0.020%, 01/03/146 | | | 8,400,000 | | | | 8,399,706 | |
Total U.S. Government and Agency Discount Notes | | | | | | | 41,498,955 | |
U.S. Treasury Bills - 0.1% | | | | | | | | |
U.S. Treasury Bills, 0.027%, 12/12/136,9 | | | 1,259,000 | | | | 1,258,961 | |
| | |
| | | Shares | | | | |
Other Investment Companies - 0.1%11 | | | | | | | | |
Dreyfus Institutional Cash Advantage Fund, Institutional Class Shares, 0.06% | | | 1,445,772 | | | | 1,445,772 | |
Total Short-Term Investments
(cost $607,570,972) | | | | | | | 607,571,474 | |
Total Investments - 147.9% (cost $1,820,973,673) | | | | | | | 1,838,733,137 | |
Other Assets, less Liabilities - (47.9)% | | | | | | | (595,222,701 | ) |
Net Assets - 100.0% | | | | | | $ | 1,243,510,436 | |
The accompanying notes are an integral part of these financial statements.
17
Notes to Schedule of Portfolio Investments
The following footnotes and abbreviations should be read in conjunction with the Schedule of Portfolio Investments previously presented in this report.
Based on the approximate cost of investments of $1,821,225,089 for Federal income tax purposes at October 31, 2013, the aggregate gross unrealized appreciation and depreciation were $25,789,282 and $8,281,234, respectively, resulting in net unrealized appreciation of investments of $17,508,048.
| † | Principal amount stated in U.S. dollars unless otherwise stated. |
| (a) | Security exempt from registration under Rule 144A of the Securities Act of 1933. This security may be resold in transactions exempt from registration, normally to qualified buyers. At October 31, 2013, the value of these securities amounted to $45,504,834, or 3.7% of net assets. |
| 1 | Floating Rate Security. The rate listed is as of October 31, 2013. Date in parentheses represents the security’s next coupon rate reset. |
| 2 | Some or all of these securities, amounting to a market value of $13,837,479, or 1.1% of net assets, were out on loan to various brokers. |
| 3 | Variable Rate Security. The rate listed is as of October 31, 2013, and is periodically reset subject to terms and conditions set forth in the debenture. |
| 4 | Perpetuity Bond. The date shown is the final call date. |
| 5 | Illiquid Security. A security not readily convertible into cash such as a stock, bond or commodity that is not actively traded and would be difficult to sell in a timely sale. The Fund may not invest more than 15% of its net assets in illiquid securities. All illiquid securities are valued by an independent pricing agent. Illiquid securities market value at October 31, 2013, amounted to $5,464,733, or 0.4% of net assets. |
| 6 | Represents yield to maturity at October 31, 2013. |
| 7 | Securities in the portfolio backed by insurance of financial institutions and financial guaranty assurance agencies amounted to $4,151,236, or 0.3% of net assets. |
| 8 | Some or all of these securities, amounting to a market value of $1,447,933, or 0.1% of net assets, are held with brokers as collateral for futures contracts. |
| 9 | Some or all of these securities, amounting to a market value of $4,030,685, or 0.3% of net assets, were segregated with brokers as collateral for swap contracts. |
| 10 | Collateral received from brokers for securities lending was invested in these short-term investments. |
| 11 | Yield shown represents the October 31, 2013, seven-day average yield, which refers to the sum of the previous seven days’ dividends paid, expressed as an annual percentage. |
Investments Definitions and Abbreviations:
| | |
AGM: | | Assured Guaranty Municipal Corp. |
EMTN: | | European Medium-Term Note |
FHLB: | | Federal Home Loan Bank |
FHLMC: | | Federal Home Loan Mortgage Corp. |
FNMA: | | Federal National Mortgage Corp. |
GMTN: | | Global Medium-Term Note |
GNMA: | | Government National Mortgage Association |
MTN: | | Medium-Term Note |
NATL-RE: | | National Public Finance Guarantee Corp. |
REMICS: | | Real Estate Mortgage Investment Conduits |
TBA | | To Be Announced |
Currency abbreviations have been used throughout the portfolio to indicate amounts shown in currencies other than the U.S. dollar (USD):
| | |
BRL: | | Brazilian Real |
CAD: | | Canadian Dollar |
EUR: | | Euro |
GBP: | | British Pound |
JPY: | | Japanese Yen |
MXN: | | Mexican Peso |
The accompanying notes are an integral part of these financial statements.
18
Notes to Schedule of Portfolio Investments (continued)
The following tables summarize the inputs used to value the Fund’s net assets by the fair value hierarchy levels as of October 31, 2013: (See Note 1 (a) in the Notes to the Financial Statements.)
| | | | | | | | | | | | | | | | |
| | | Quoted
Prices in
Active
Markets for
Identical
Investments
Level 1 | | | Significant Other
Observable
Inputs
Level 2 | | | Significant
Unobservable
Inputs
Level 3 | | | Total | |
Managers PIMCO Bond Fund | | | | | | | | | | | | | |
Investments in Securities | | | | | | | | | | | | | | | | |
Asset-Backed Securities | | | — | | | $ | 34,074,570 | | | | — | | | $ | 34,074,570 | |
Corporate Bonds and Notes† | | | — | | | | 127,635,812 | | | | — | | | | 127,635,812 | |
Foreign Government and Agency | | | | | | | | | | | | | | | | |
Obligations | | | — | | | | 95,196,116 | | | | — | | | | 95,196,116 | |
Mortgage-Backed Securities | | | — | | | | 42,579,664 | | | | — | | | | 42,579,664 | |
Municipal Bonds | | | — | | | | 53,134,631 | | | | — | | | | 53,134,631 | |
Municipal Closed-End Bond Funds | | $ | 5,464,480 | | | | — | | | | — | | | | 5,464,480 | |
Preferred Stocks | | | — | | | | 4,056,821 | | | | — | | | | 4,056,821 | |
U.S. Government and Agency Obligations† | | | — | | | | 869,019,569 | | | | — | | | | 869,019,569 | |
Short-Term Investments | | | | | | | | | | | | | | | | |
Certificates of Deposit | | | — | | | | 1,084,813 | | | | — | | | | 1,084,813 | |
Repurchase Agreements | | | — | | | | 562,282,973 | | | | — | | | | 562,282,973 | |
U.S. Government and Agency | | | | | | | | | | | | | | | | |
Discount Notes | | | — | | | | 41,498,955 | | | | — | | | | 41,498,955 | |
U.S. Treasury Bills | | | — | | | | 1,258,961 | | | | — | | | | 1,258,961 | |
Other Investment Companies | | | 1,445,772 | | | | — | | | | — | | | | 1,445,772 | |
| | | | | | | | | | | | | | | | |
Total Investments in Securities | | $ | 6,910,252 | | | $ | 1,831,822,885 | | | | — | | | $ | 1,838,733,137 | |
| | | | | | | | | | | | | | | | |
Financial Derivative Instruments-Assets†† | | | | | | | | | | | | | | | | |
Credit Contracts | | | — | | | $ | 1,160,139 | | | | — | | | $ | 1,160,139 | |
Foreign Exchange Contracts | | | — | | | | 1,162,828 | | | | — | | | | 1,162,828 | |
Interest Rate Contracts | | $ | 4,942,980 | | | | 5,733,779 | | | | — | | | | 10,676,759 | |
| | | | | | | | | | | | | | | | |
| | | 4,942,980 | | | | 8,056,746 | | | | — | | | | 12,999,726 | |
| | | | | | | | | | | | | | | | |
Financial Derivative Instruments-Liabilities†† | | | | | | | | | | | | | | | | |
Credit Contracts | | | — | | | | (2,903 | ) | | | — | | | | (2,903 | ) |
Foreign Exchange Contracts | | | — | | | | (1,904,088 | ) | | | — | | | | (1,904,088 | ) |
Interest Rate Contracts | | | — | | | | (1,290,124 | ) | | | — | | | | (1,290,124 | ) |
| | | | | | | | | | | | | | | | |
| | | — | | | | (3,197,115 | ) | | | — | | | | (3,197,115 | ) |
| | | | | | | | | | | | | | | | |
Total Financial Derivative Instruments | | $ | 4,942,980 | | | $ | 4,859,631 | | | | — | | | $ | 9,802,611 | |
| | | | | | | | | | | | | | | | |
| † | All corporate bonds and notes; U.S. government and agency obligations; held in the Fund are level 2 securities. For a detailed breakout of the corporate bonds and notes; U.S. government and agency obligations; by major industry or agency classification, please refer to the Schedule of Portfolio Investments. |
| †† | Derivative instruments, such as futures, written options, forwards and swap contracts, are not reflected in the Schedule of Portfolio Investments. Futures, forwards and swap contracts are valued at the unrealized appreciation/depreciation of the instrument and written options are shown at value. |
As of October 31, 2013, the Fund had no transfers between levels from the beginning of the reporting period.
The accompanying notes are an integral part of these financial statements.
19
Notes to Schedule of Portfolio Investments (continued)
The following schedule is the fair value of derivative instruments at October 31, 2013:
| | | | | | | | | | | | |
| | | Asset Derivatives | | | Liability Derivatives | |
Derivatives not accounted for as hedging instruments | | Statement of Assets and Liabilities
Location | | Fair Value | | | Statement of Assets and Liabilities
Location | | Fair Value | |
Credit contracts | | — | | | — | | | Options written | | $ | 83 | |
Credit contracts | | Receivable for Variation margin1 | | $ | 5,090 | | | Payable for Variation margin1 | | | — | |
Credit contracts | | Unrealized appreciation on swaps | | | 838,552 | | | Unrealized depreciation on swaps | | | 2,903 | |
Interest rate contracts | | Unrealized appreciation on swaps | | | 226,203 | | | Unrealized depreciation on swaps | | | 28,038 | |
Interest rate contracts | | — | | | — | | | Options written | | | 548,245 | |
Interest rate contracts | | Receivable for Variation margin1 | | | 236,710 | | | Payable for Variation margin1 | | | 52,744 | |
Foreign exchange contracts | | Unrealized appreciation on foreign currency contracts | | | 1,162,828 | | | Unrealized depreciation on foreign currency contracts | | | 1,904,088 | |
| | | | | | | | | | | | |
| Totals | | $ | 2,469,383 | | | | | $ | 2,536,101 | |
| | | | | | | | | | | | |
| 1 | Only current day’s variation margin is reported within the Statement of Assets and Liabilities. The variation margin is included in the open futures cumulative appreciation/ (depreciation) of $4,942,980 and centrally cleared swaps cumulative appreciation/(depreciation) of $3,879,297 as reported in the Notes to Schedule of Portfolio Investments. |
For the fiscal year ended October 31, 2013, the effect of derivative instruments on the Statement of Operations and the amount of realized gain/ (loss) and unrealized gain (loss) on derivatives recognized in income were as follows:
| | | | | | | | | | | | |
| | | Realized Gain (Loss) | | | Change in Unrealized Gain (Loss) | |
Derivatives not accounted for as hedging instruments | | Statement of Operations Location | | Realized
Gain/(Loss) | | | Statement of Operations Location | | Change In
Unrealized
Gain/(Loss) | |
Credit contracts | | Net realized gain on option contracts | | | — | | | Net change in unrealized appreciation (depreciation) of option contracts | | $ | 3,077 | |
Credit contracts | | Net realized gain on swap contracts | | $ | 1,004,803 | | | Net change in unrealized appreciation (depreciation) of swap contracts | | | (1,583,917 | ) |
Interest rate contracts | | Net realized loss on futures contracts | | | (1,339,036 | ) | | Net change in unrealized appreciation (depreciation) of futures contracts | | | 4,520,381 | |
Interest rate contracts | | Net realized gain on option contracts | | | 2,193,796 | | | Net change in unrealized appreciation (depreciation) of option contracts | | | (21,540 | ) |
Interest rate contracts | | Net realized gain on swap contracts | | | 2,419,350 | | | Net change in unrealized appreciation (depreciation) of swap contracts | | | 4,611,743 | |
Foreign exchange contracts | | Net realized gain on foreign currency transactions | | | 4,927,022 | | | Net change in unrealized appreciation (depreciation) of foreign currency translations | | | 26,589 | |
| | | | | | | | | | | | |
| Totals | | $ | 9,205,935 | | | | | $ | 7,556,333 | |
| | | | | | | | | | | | |
The accompanying notes are an integral part of these financial statements.
20
Notes to Schedule of Portfolio Investments (continued)
At October 31, 2013, the following Fund had futures contracts: (See Note 9 in the Notes to the Financial Statements.)
| | | | | | | | | | | | | | |
Type | | Number of Contracts | | Position | | | Expiration Date | | | Unrealized
Gain | |
5-Year U.S. Treasury Note | | 762 | | | Long | | | | 12/31/13 | | | $ | 1,995,590 | |
90-Day Eurodollar | | 3,792 | | | Long | | | | 06/15/15 to 06/19/17 | | | | 1,965,758 | |
U.S. Treasury 10-Year Bond | | 331 | | | Long | | | | 12/19/13 | | | | 981,632 | |
| | | | | | | | | | | | | | |
| | | | | | | | | Total | | | $ | 4,942,980 | |
| | | | | | | | | | | | | | |
At October 31, 2013, the following Fund had swap contracts: (See Note 10 in the Notes to the Financial Statements.)
| | | | | | | | | | | | | | | | | | | | | | |
Pay/Receive
Floating Rate | | Floating Rate Index | | Fixed Rate | | Counterparty | | Maturity | | Currency | | Notional Amount | | | Net Premiums
Paid/(Received) | | | Unrealized
Gain/(Loss) | |
| | Centrally Cleared Interest Rate Swaps | |
Pay | | 6 Month JPY LIBOR Rate | | 1.00% | | BNP | | 09/18/23 | | JPY | | | 220,000,000 | | | $ | 18,978 | | | $ | (79,311 | ) |
Pay | | 6 Month JPY LIBOR Rate | | 1.00% | | BRC | | 09/18/23 | | JPY | | | 250,000,000 | | | | 11,423 | | | | (79,984 | ) |
Pay | | 6 Month JPY LIBOR Rate | | 1.00% | | CS | | 09/18/23 | | JPY | | | 250,000,000 | | | | 14,870 | | | | (83,431 | ) |
Pay | | 6 Month JPY LIBOR Rate | | 1.00% | | DUB | | 09/18/23 | | JPY | | | 410,000,000 | | | | 21,453 | | | | (133,892 | ) |
Pay | | 6 Month JPY LIBOR Rate | | 1.00% | | GS | | 09/18/23 | | JPY | | | 280,000,000 | | | | 16,012 | | | | (92,800 | ) |
Pay | | 6 Month JPY LIBOR Rate | | 1.00% | | JPM | | 09/18/23 | | JPY | | | 60,000,000 | | | | 4,758 | | | | (21,213 | ) |
Pay | | 6 Month JPY LIBOR Rate | | 1.00% | | MS | | 09/18/23 | | JPY | | | 250,000,000 | | | | 11,385 | | | | (79,946 | ) |
Pay | | 6 Month JPY LIBOR Rate | | 1.00% | | RBS | | 09/18/23 | | JPY | | | 110,000,000 | | | | 9,169 | | | | (39,335 | ) |
Receive | | 1-Year-OIS-USD-FEDERAL FUNDS RATE | | 1.00% | | GS | | 10/15/17 | | USD | | | 48,200,000 | | | | (53,247 | ) | | | (281,459 | ) |
Receive | | 1-Year-OIS-USD-FEDERAL FUNDS RATE | | 1.00% | | MS | | 10/15/17 | | USD | | | 48,200,000 | | | | (60,375 | ) | | | (274,331 | ) |
Receive | | 1-Year-OIS-USD-FEDERAL FUNDS RATE | | 1.50% | | BOA | | 03/18/16 | | USD | | | 24,100,000 | | | | (729 | ) | | | 174,024 | |
Receive | | 1-Year-OIS-USD-FEDERAL FUNDS RATE | | 1.50% | | CS | | 03/18/16 | | USD | | | 9,900,000 | | | | 68,108 | | | | 3,080 | |
Receive | | 1-Year-OIS-USD-FEDERAL FUNDS RATE | | 1.50% | | GS | | 03/18/16 | | USD | | | 59,900,000 | | | | 487,357 | | | | (56,635 | ) |
Receive | | 1-Year-OIS-USD-FEDERAL FUNDS RATE | | 1.50% | | MS | | 03/18/16 | | USD | | | 42,900,000 | | | | 327,618 | | | | (19,138 | ) |
Receive | | 3 Month USD LIBOR Rate | | 2.75% | | BRC | | 06/19/43 | | USD | | | 7,800,000 | | | | 585,000 | | | | 628,685 | |
Receive | | 3 Month USD LIBOR Rate | | 2.75% | | GS | | 06/19/43 | | USD | | | 20,600,000 | | | | 1,551,180 | | | | 1,654,193 | |
Receive | | 3 Month USD LIBOR Rate | | 2.75% | | JPM | | 06/19/43 | | USD | | | 8,200,000 | | | | 564,561 | | | | 711,364 | |
Receive | | 3 Month USD LIBOR Rate | | 2.75% | | MS | | 06/19/43 | | USD | | | 12,600,000 | | | | 931,392 | | | | 1,029,176 | |
Receive | | 3 Month USD LIBOR Rate | | 3.00% | | MS | | 09/21/17 | | USD | | | 83,500,000 | | | | 138,443 | | | | 601,740 | |
| | | | | | | | | | | | | | | | | | | | | | |
| | | | | | | | | | | | | Totals | | | $ | 4,647,356 | | | $ | 3,560,787 | |
| | | | | | | | | | | | | | | | | | | | | | |
The accompanying notes are an integral part of these financial statements.
21
Notes to Schedule of Portfolio Investments (continued)
| | | | | | | | | | | | | | | | | | | | | | |
Pay/Receive
Floating Rate | | Floating Rate Index | | Fixed Rate | | Counterparty | | Maturity | | Currency | | Notional Amount | | | Net Premiums
Paid/(Received) | | | Unrealized
Gain/(Loss) | |
| | Interest Rate Swaps | | | | | | | | | | | | |
Pay | | 1-Year BRL-CDI | | 9.10% | | GS | | 01/02/17 | | BRL | | | 900,000 | | | | — | | | $ | (18,407 | ) |
Pay | | 1-Year BRL-CDI | | 10.63% | | DUB | | 01/02/17 | | BRL | | | 1,000,000 | | | $ | 242 | | | | (6,031 | ) |
Pay | | 28-Day MXN TIIE | | 5.50% | | BRC | | 09/13/17 | | MXN | | | 33,000,000 | | | | (16,078 | ) | | | 71,333 | |
Pay | | 28-Day MXN TIIE | | 5.50% | | MS | | 09/13/17 | | MXN | | | 11,000,000 | | | | (4,916 | ) | | | 23,334 | |
Pay | | 28-Day MXN TIIE | | 5.50% | | MS | | 09/02/22 | | MXN | | | 100,000 | | | | (136 | ) | | | (319 | ) |
Pay | | 28-Day MXN TIIE | | 5.60% | | BRC | | 09/06/16 | | MXN | | | 61,600,000 | | | | 16,387 | | | | 127,772 | |
Pay | | 28-Day MXN TIIE | | 6.00% | | JPM | | 06/05/23 | | MXN | | | 11,000,000 | | | | (26,153 | ) | | | (3,281 | ) |
Pay | | 28-Day MXN TIIE | | 6.35% | | MS | | 06/02/21 | | MXN | | | 4,000,000 | | | | 735 | | | | 3,764 | |
| | | | | | | | | | | | | | | | | | | | | | |
| | | | | | | | | | | | | Totals | | | $ | (29,919 | ) | | $ | 198,165 | |
| | | | | | | | | | | | | | | | | | | | | | |
| | | | | | | | | | | | | | | | | | | | | | | | | | |
Reference Entity | | Fixed Rate | | Counterparty | | Maturity | | Rating | | | Currency | | | Notional
Amount | | | Net
Premiums
Paid/
(Received) | | | Unrealized
Gain/(Loss) | |
Centrally Cleared Credit Default Swaps-Sell Protection † | |
ITraxx Europe 5-Year Index | | 1.00% | | BOA | | 12/20/18 | | | N/A | | | | EUR | | | | 12,600,000 | | | $ | (47,329 | ) | | $ | 207,041 | |
Markit CDX.NA.IG 5-Year Index | | 1.00% | | BNP | | 12/20/13 | | | N/A | | | | USD | | | | 12,800,000 | | | | 109,220 | | | | 76,568 | |
Markit CDX.NA.IG 5-Year Index | | 1.00% | | JPM | | 12/20/13 | | | N/A | | | | USD | | | | 6,100,000 | | | | 59,204 | | | | 29,335 | |
Markit CDX.NA.IG 5-Year Index | | 1.00% | | MS | | 12/20/13 | | | N/A | | | | USD | | | | 1,100,000 | | | | 10,400 | | | | 5,566 | |
| | | | | | | | | | | | | | | | | | | | | | | | | | |
| | | | | | | | | | | | | | | | | Total | | | $ | 131,495 | | | $ | 318,510 | |
| | | | | | | | | | | | | | | | | | | | | | | | | | |
| | | | | | | | | | | | | | | | | | | | | | | | |
Reference Entity | | Fixed Rate | | Counterparty | | Maturity | | Rating | | Currency | | | Notional
Amount | | | Net
Premiums
Paid/
(Received) | | | Unrealized
Gain/(Loss) | |
Credit Default Swaps-Sell Protection † | | | | | | | | | | | | | |
Berkshire Hathaway Inc. | | 1.00% | | BRC | | 12/20/13 | | AA | | | USD | | | | 400,000 | | | $ | 423 | | | $ | 546 | |
Berkshire Hathaway Inc. | | 1.00% | | DUB | | 09/20/16 | | AA | | | USD | | | | 400,000 | | | | 5,943 | | | | 1,559 | |
Brazil Federative Republic Bond | | 1.00% | | CITI | | 06/20/16 | | BBB | | | USD | | | | 4,300,000 | | | | (6,885 | ) | | | (2,339 | ) |
Brazil Federative Republic Bond | | 1.00% | | DUB | | 06/20/16 | | BBB | | | USD | | | | 1,400,000 | | | | (2,439 | ) | | | (564 | ) |
Brazil Federative Republic Bond | | 1.00% | | JPM | | 09/20/15 | | BBB | | | USD | | | | 1,400,000 | | | | (5,866 | ) | | | 9,922 | |
Brazil Federative Republic Bond | | 1.00% | | UBS | | 09/20/15 | | BBB | | | USD | | | | 1,000,000 | | | | (3,551 | ) | | | 6,449 | |
Brazil Federative Republic Bond | | 1.95% | | MS | | 08/20/16 | | BBB | | | USD | | | | 3,500,000 | | | | — | | | | 89,359 | |
China Government | | 1.00% | | MS | | 06/20/16 | | AA- | | | USD | | | | 1,800,000 | | | | (30,847 | ) | | | 63,162 | |
China Government | | 1.00% | | RBS | | 06/20/15 | | AA- | | | USD | | | | 1,900,000 | | | | 10,143 | | | | 16,356 | |
The accompanying notes are an integral part of these financial statements.
22
Notes to Schedule of Portfolio Investments (continued)
| | | | | | | | | | | | | | | | | | | | | | | | | | |
Reference Entity | | Fixed Rate | | Counterparty | | Maturity | | Rating | | | Currency | | | Notional
Amount | | | Net
Premiums
Paid/
(Received) | | | Unrealized
Gain/(Loss) | |
Export-Import Bank of A.S. | | 1.00% | | DUB | | 06/20/17 | | | AA- | | | | USD | | | | 300,000 | | | $ | (9,173 | ) | | $ | 13,154 | |
General Electric Capital Corp. | | 1.00% | | BRC | | 09/20/16 | | | AA+ | | | | USD | | | | 900,000 | | | | 9,478 | | | | 7,128 | |
General Electric Capital Corp. | | 1.00% | | DUB | | 09/20/15 | | | AA+ | | | | USD | | | | 1,000,000 | | | | 11,501 | | | | 3,073 | |
General Electric Capital Corp. | | 1.00% | | DUB | | 03/20/16 | | | AA+ | | | | USD | | | | 300,000 | | | | (7,342 | ) | | | 12,389 | |
General Electric Capital Corp. | | 1.00% | | MS | | 06/20/16 | | | AA+ | | | | USD | | | | 700,000 | | | | (1,370 | ) | | | 13,719 | |
JPMorgan Chase & Co. | | 1.00% | | DUB | | 09/20/16 | | | A | | | | USD | | | | 900,000 | | | | 11,032 | | | | 2,584 | |
Mexico Government | | 1.00% | | BRC | | 03/20/15 | | | BBB | | | | USD | | | | 700,000 | | | | (4,245 | ) | | | 10,906 | |
Mexico Government | | 1.00% | | CITI | | 06/20/16 | | | BBB | | | | USD | | | | 9,800,000 | | | | (1,345 | ) | | | 120,725 | |
Mexico Government | | 1.00% | | DUB | | 03/20/15 | | | BBB | | | | USD | | | | 1,100,000 | | | | (6,807 | ) | | | 17,275 | |
Mexico Government | | 1.00% | | DUB | | 03/20/16 | | | BBB | | | | USD | | | | 2,300,000 | | | | (7,927 | ) | | | 35,849 | |
Mexico Government | | 1.00% | | GS | | 06/20/16 | | | BBB | | | | USD | | | | 8,400,000 | | | | (158,069 | ) | | | 260,395 | |
Mexico Government | | 1.00% | | HSBC | | 09/20/16 | | | BBB | | | | USD | | | | 100,000 | | | | 513 | | | | 707 | |
Mexico Government | | 1.00% | | JPM | | 09/20/16 | | | BBB | | | | USD | | | | 200,000 | | | | 1,068 | | | | 1,371 | |
Mexico Government | | 1.00% | | MS | | 09/20/16 | | | BBB | | | | USD | | | | 600,000 | | | | (1,561 | ) | | | 8,889 | |
Mexico Government | | 1.00% | | UBS | | 09/20/15 | | | BBB | | | | USD | | | | 1,000,000 | | | | (5,310 | ) | | | 16,595 | |
Republic of Indonesia | | 1.00% | | MS | | 09/20/16 | | | BB+ | | | | USD | | | | 2,700,000 | | | | (119,546 | ) | | | 112,483 | |
Republic of Indonesia | | 1.00% | | UBS | | 09/20/16 | | | BB+ | | | | USD | | | | 300,000 | | | | (2,660 | ) | | | 1,875 | |
U.S. Treasury Notes | | 0.25% | | UBS | | 09/20/15 | | | AA+ | | | | EUR | | | | 5,000,000 | | | | (25,692 | ) | | | 12,082 | |
| | | | | | | | | | | | | | | | | | | | | | | | | | |
| | | | | | | | | | | | | | | | | Total | | | $ | (350,534 | ) | | $ | 835,649 | |
| | | | | | | | | | | | | | | | | | | | | | | | | | |
| † | If the Fund is a seller of protection and a credit event occurs, as defined under the terms of that particular swap agreement, the Fund will either (a) pay to the buyer of protection an amount equal to the notional amount of the swap and take delivery of the referenced obligation, or (b) pay a net settlement in the form of cash or securities equal to the notional amount of the swap less the recovery of the referenced obligation. |
At October 31, 2013, the following Fund had written put and call options, swaptions and inflation floors: (See Note 10 in the Notes to the Financial Statements.)
| | | | | | | | | | | | | | | | | | | | | | | | |
Pay/Receive Floating Rate | | Description | | Counterparty | | | Floating Rate Index | | Exercise Rate | | Expiration Date | | Notional Amount | | | Premium | | | Unrealized
Gain | |
| | Credit Default Swaptions | | | | | | | | | | | | | | | | |
Receive | | 5-Year Credit Default Swap (Put) | | | MS | | | CDX.NA.IG Series 20 Version 1 | | 1.10% | | 12/18/13 | | $ | 1,600,000 | | | $ | 3,160 | | | $ | 3,077 | |
| | | | | | | | | | | | | | | | | | | | | | | | |
The accompanying notes are an integral part of these financial statements.
23
Notes to Schedule of Portfolio Investments (continued)
| | | | | | | | | | | | | | | | | | | | | | |
Pay/Receive
Floating Rate | | Description | | Counterparty | | Floating Rate Index | | Exercise Rate | | Expiration Date | | Notional Amount | | | Premium | | | Unrealized
Gain/(Loss) | |
| | Interest Rate Swaptions | |
Receive | | 1-Year Interest Rate Swap (Put) | | MS | | 3-Month
USD-LIBOR | | 2.00% | | 03/31/14 | | $ | 74,300,000 | | | $ | 195,038 | | | $ | 111,912 | |
Receive | | 5-Year Interest Rate Swap (Call) | | GS | | 3-Month
USD-LIBOR | | 1.40% | | 01/27/14 | | | 67,000,000 | | | | 122,784 | | | | (20,322 | ) |
Receive | | 5-Year Interest Rate Swap (Call) | | MS | | 3-Month
USD-LIBOR | | 1.30% | | 01/27/14 | | | 11,800,000 | | | | 12,440 | | | | 549 | |
Receive | | 5-Year Interest Rate Swap (Put) | | GS | | 3-Month
USD-LIBOR | | 2.00% | | 01/27/14 | | | 67,000,000 | | | | 420,530 | | | | 304,513 | |
Receive | | 5-Year Interest Rate Swap (Put) | | MS | | 3-Month
USD-LIBOR | | 1.75% | | 11/27/13 | | | 16,800,000 | | | | 148,736 | | | | 140,716 | |
Receive | | 5-Year Interest Rate Swap (Put) | | MS | | 3-Month
USD-LIBOR | | 1.80% | | 01/27/14 | | | 11,800,000 | | | | 56,385 | | | | 18,477 | |
Receive | | 10-Year Interest Rate Swap (Call) | | DUB | | 3-Month
USD-LIBOR | | 2.40% | | 03/17/14 | | | 3,400,000 | | | | 10,540 | | | | (289 | ) |
Receive | | 10-Year Interest Rate Swap (Call) | | RBS | | 3-Month
USD-LIBOR | | 2.50% | | 01/27/14 | | | 2,000,000 | | | | 12,000 | | | | 5,046 | |
Receive | | 10-Year Interest Rate Swap (Put) | | DUB | | 3-Month
USD-LIBOR | | 2.90% | | 03/17/14 | | | 3,400,000 | | | | 54,400 | | | | 1,554 | |
Receive | | 10-Year Interest Rate Swap (Put) | | RBS | | 3-Month
USD-LIBOR | | 3.50% | | 01/27/14 | | | 2,000,000 | | | | 15,900 | | | | 13,263 | |
Receive | | 1-Year Interest Rate Swap (Call) | | BRC | | Euribor 6
Month | | 0.40% | | 03/12/14 | | | 5,800,000 | | | | 11,212 | | | | 1,879 | |
Receive | | 1-Year Interest Rate Swap (Call) | | GS | | Euribor 6
Month | | 0.40% | | 03/12/14 | | | 5,700,000 | | | | 11,754 | | | | 2,581 | |
Receive | | 1-Year Interest Rate Swap (Put) | | BRC | | Euribor 6
Month | | 0.40% | | 03/12/14 | | | 5,800,000 | | | | 12,707 | | | | 8,861 | |
Receive | | 1-Year Interest Rate Swap (Put) | | GS | | Euribor 6
Month | | 0.40% | | 03/12/14 | | | 5,700,000 | | | | 11,754 | | | | 7,973 | |
| | | | | | | | | | | | | | | | | | | | | | |
| | | | | | | | | | | | | Totals | | | $ | 1,096,180 | | | $ | 596,713 | |
| | | | | | | | | | | | | | | | | | | | | | |
| | | | | | | | | | | | | | | | | | | | |
Description | | Counterparty | | Strike Index | | | Expiration Date | | Notional
Amount | | | Premium | | | Unrealized
Gain | |
Inflation Floor Options | | | | | | | | | | | | | | | | | | | | |
Inflation Floor - OTC CPURNSA Index | | DUB | | $ | 216 | | | 03/10/20 | | $ | (11,400,000 | ) | | $ | 85,500 | | | $ | 76,307 | |
| | | | | | | | | | | | | | | | | | | | |
| | | | | | | | | | | | | | | | | | |
Description | | Exercise Price | | | Expiration
Date | | Number of
Contracts | | | Premium | | | Unrealized
Gain | |
Options on Exchange-Traded Futures | | | | | | | | | | | | | | | | | | |
Eurodollar Mid-Curve 3-Year futures (Put) | | $ | 97 | | | 03/14/14 | | | 103 | | | $ | 36,185 | | | $ | 2,710 | |
U.S. Treasury 10-Year Note futures (Call) | | $ | 128 | | | 12/19/13 | | | 17 | | | | 6,612 | | | | 1,300 | |
U.S. Treasury 10-Year Note futures (Put) | | $ | 124 | | | 12/19/13 | | | 17 | | | | 8,472 | | | | 7,674 | |
| | | | | | | | | | | | | | | | | | |
| | | | | | | | | Totals | | | $ | 51,269 | | | $ | 11,684 | |
| | | | | | | | | | | | | | | | | | |
The accompanying notes are an integral part of these financial statements.
24
Notes to Schedule of Portfolio Investments (continued)
Transactions in written put and call options and swaptions for the fiscal year ended October 31, 2013, were as follows: (See Note 10 in the Notes to the Financial Statements.)
| | | | | | | | | | | | |
| | | Number of
Contracts | | | Notional
Amount | | | Amount of
Premiums | |
Options and swaptions outstanding at October 31, 2012 | | | — | | | $ | 198,100,000 | | | $ | 951,373 | |
Options and swaptions written | | | 669 | | | | 827,400,000 | | | | 2,867,058 | |
Options and swaptions exercised/expired/closed | | | (532 | ) | | | (730,000,000 | ) | | | (2,582,323 | ) |
| | | | | | | | | | | | |
Options and swaptions outstanding at October 31, 2013 | | | 137 | | | $ | 295,500,000 | | | $ | 1,236,108 | |
| | | | | | | | | | | | |
At October 31, 2013, the following Fund had forward foreign currency contracts (in U.S. Dollars): (See Note 8 in the Notes to the Financial Statements.)
| | | | | | | | | | | | | | | | | | | | |
Foreign Currency | | Position | | | Settlement Date | | Counterparty | | Receivable
Amount | | | Payable Amount | | | Unrealized
Gain/
(Loss) | |
Brazilian Real | | | Long | | | 11/04/13 | | CS | | $ | 5,832,395 | | | $ | 5,632,839 | | | $ | 199,556 | |
Brazilian Real | | | Long | | | 11/04/13 | | CS | | | 1,800,253 | | | | 1,860,283 | | | | (60,030 | ) |
Brazilian Real | | | Long | | | 11/04/13 | | HSBC | | | 31,115 | | | | 32,075 | | | | (960 | ) |
Brazilian Real | | | Long | | | 11/04/13 to 12/03/13 | | MS | | | 177,478 | | | | 182,748 | | | | (5,270 | ) |
Canadian Dollar | | | Long | | | 12/23/13 | | BRC | | | 1,300,666 | | | | 1,312,218 | | | | (11,552 | ) |
Canadian Dollar | | | Long | | | 12/23/13 | | CITI | | | 1,129,223 | | | | 1,140,734 | | | | (11,511 | ) |
Canadian Dollar | | | Long | | | 12/23/13 | | GS | | | 1,244,156 | | | | 1,260,161 | | | | (16,005 | ) |
Canadian Dollar | | | Long | | | 12/23/13 | | JPM | | | 1,989,309 | | | | 2,008,442 | | | | (19,133 | ) |
Euro | | | Long | | | 12/17/13 | | CITI | | | 18,020,126 | | | | 17,609,117 | | | | 411,009 | |
Mexican Peso | | | Long | | | 12/17/13 | | JPM | | | 107,267 | | | | 105,964 | | | | 1,303 | |
Brazilian Real | | | Short | | | 11/04/13 | | CITI | | | 91,000 | | | | 88,835 | | | | 2,165 | |
Brazilian Real | | | Short | | | 12/03/13 | | CS | | | 1,848,147 | | | | 1,787,767 | | | | 60,380 | |
Brazilian Real | | | Short | | | 11/04/13 | | HSBC | | | 245,000 | | | | 238,514 | | | | 6,486 | |
Brazilian Real | | | Short | | | 11/04/13 | | MS | | | 7,230,530 | | | | 7,363,349 | | | | (132,819 | ) |
Brazilian Real | | | Short | | | 11/04/13 | | MS | | | 32,057 | | | | 31,115 | | | | 942 | |
British Pound | | | Short | | | 12/12/13 | | RBS | | | 3,748,680 | | | | 3,846,931 | | | | (98,251 | ) |
Canadian Dollar | | | Short | | | 12/23/13 | | CITI | | | 21,709,163 | | | | 21,327,849 | | | | 381,314 | |
Euro | | | Short | | | 12/17/13 to 04/01/14 | | CITI | | | 27,142,299 | | | | 27,609,365 | | | | (467,066 | ) |
Euro | | | Short | | | 06/02/14 | | CS | | | 507,200 | | | | 543,327 | | | | (36,127 | ) |
Euro | | | Short | | | 02/28/14 | | DUB | | | 10,682,766 | | | | 10,999,955 | | | | (317,189 | ) |
Euro | | | Short | | | 02/28/14 to 03/14/14 | | GS | | | 21,676,281 | | | | 22,028,925 | | | | (352,644 | ) |
Euro | | | Short | | | 12/17/13 | | HSBC | | | 170,744 | | | | 168,374 | | | | 2,370 | |
Euro | | | Short | | | 12/17/13 | | JPM | | | 9,116,249 | | | | 9,177,758 | | | | (61,509 | ) |
The accompanying notes are an integral part of these financial statements.
25
Notes to Schedule of Portfolio Investments (continued)
| | | | | | | | | | | | | | | | | | | | | | |
Foreign Currency | | Position | | | Settlement Date | | Counterparty | | | Receivable
Amount | | | Payable Amount | | | Unrealized
Gain/
(Loss) | |
Euro | | | Short | | | 12/17/13 | | | MS | | | $ | 12,154,878 | | | $ | 12,067,279 | | | $ | 87,599 | |
Euro | | | Short | | | 12/23/13 to 03/14/14 | | | RBS | | | | 13,938,264 | | | | 14,252,286 | | | | (314,022 | ) |
Euro | | | Short | | | 12/17/13 | | | UBS | | | | 194,441 | | | | 192,816 | | | | 1,625 | |
Japanese Yen | | | Short | | | 11/18/13 | | | CITI | | | | 204,417 | | | | 202,398 | | | | 2,019 | |
Japanese Yen | | | Short | | | 11/18/13 | | | JPM | | | | 1,933,876 | | | | 1,933,456 | | | | 420 | |
Mexican Peso | | | Short | | | 01/23/14 | | | JPM | | | | 292,413 | | | | 286,773 | | | | 5,640 | |
| | | | | | | | | | | | | | | | | | | | | | |
| | | | | | | | | Totals | | | $ | 164,550,393 | | | $ | 165,291,653 | | | $ | (741,260 | ) |
| | | | | | | | | | | | | | | | | | | | | | |
| | |
| Counterparty Abbreviations: |
| |
| BNP: | | BNP Paribas Bank |
| BOA: | | Bank of America |
| BRC: | | Barclays Bank PLC |
| CITI: | | Citigroup, Inc. |
| CS: | | Credit Suisse |
| DUB: | | Deutsche Bank AG |
| FNB: | | First National Bank |
| GS: | | Goldman Sachs & Co. |
| HSBC: | | HSBC Bank |
| JPM: | | JPMorgan Chase & Co. |
| MS: | | Morgan Stanley |
| RBS: | | Royal Bank of Scotland Group PLC |
| UBS: | | UBS Warburg LLC |
| | |
| Currency Abbreviations: |
| |
| BRL: | | Brazilian Real |
| EUR: | | Euro |
| JPY: | | Japanese Yen |
| MXN: | | Mexican Peso |
|
| Investment Abbreviations and Definitions: |
| |
| CDI: | | Brazil Interbank Deposit Rate |
| CPURNSA: | | Consumer Price All Urban Non-Seasonally Adjusted Index |
| EURIBOR: | | Euro Interbank Offered Rate |
| LIBOR: | | London Interbank Offered Rate |
| OIS: | | Overnight Index Swap |
| OTC: | | Over-the-counter |
| TIIE: | | Interbank Equilibrium Interest Rate |
|
The accompanying notes are an integral part of these financial statements. 26 |
Statement of Assets and Liabilities
October 31, 2013
| | | | |
Assets: | | | | |
Investments at value* (including securities on loan valued at $12,765,104) | | $ | 1,276,450,164 | |
Repurchase Agreements at value** | | | 562,282,973 | |
Receivable for delayed delivery investments sold | | | 73,745,820 | |
Dividends, interest and other receivables | | | 5,068,525 | |
Receivable for investments sold | | | 3,900,418 | |
Receivable for Fund shares sold | | | 1,611,783 | |
Foreign currency*** | | | 1,515,527 | |
Unrealized appreciation on foreign currency contracts | | | 1,162,828 | |
Unrealized appreciation on swaps | | | 1,064,755 | |
Variation margin receivable on financial derivative instruments | | | 241,800 | |
Receivable from affiliate | | | 73,118 | |
Swap premiums paid | | | 67,465 | |
Prepaid expenses | | | 30,666 | |
Total assets | | | 1,927,215,842 | |
Liabilities: | | | | |
Payable for delayed delivery investments purchased | | | 384,115,898 | |
Payable for investments purchased | | | 276,412,217 | |
Payable upon return of securities loaned | | | 14,282,973 | |
Payable for Fund shares repurchased | | | 3,780,138 | |
Unrealized depreciation on foreign currency contracts | | | 1,904,088 | |
Payable to brokers upon termination of futures, swaps and foreign currency contracts | | | 970,000 | |
Swap premiums received | | | 447,918 | |
Options written (premiums received $1,236,109) | | | 548,328 | |
Dividends payable to shareholders | | | 154,549 | |
Variation margin payable on financial derivative instruments | | | 52,744 | |
Unrealized depreciation on swaps | | | 30,941 | |
Accrued expenses: | | | | |
Investment advisory and management fees | | | 424,163 | |
Administrative fees | | | 212,084 | |
Trustee fees and expenses | | | 2,309 | |
Other | | | 367,056 | |
Total liabilities | | | 683,705,406 | |
| |
Net Assets | | $ | 1,243,510,436 | |
Net Assets Represent: | | | | |
Paid-in capital | | $ | 1,220,511,657 | |
Undistributed net investment income | | | 709,639 | |
Accumulated net realized loss from investments, options, futures contracts, swaps and foreign currency transactions | | | (5,265,239 | ) |
Net unrealized appreciation of investments, options, futures contracts, swaps and foreign currency translations | | | 27,554,379 | |
| |
Net Assets | | $ | 1,243,510,436 | |
Shares outstanding | | | 117,026,470 | |
Net asset value, offering and redemption price per share | | $ | 10.63 | |
* Investments at cost | | $ | 1,258,690,700 | |
** Repurchase agreements at cost | | $ | 562,282,973 | |
*** Foreign currency at cost | | $ | 1,528,929 | |
|
The accompanying notes are an integral part of these financial statements. 27 |
Statement of Operations
For the fiscal year ended October 31, 2013
| | | | |
Investment Income: | | | | |
Interest income | | $ | 28,177,298 | |
Dividend income | | | 535,810 | |
Securities lending income | | | 41,694 | |
Total investment income | | | 28,754,802 | |
Expenses: | | | | |
Investment advisory and management fees | | | 5,605,815 | |
Administrative fees | | | 2,802,928 | |
Extraordinary expense | | | 348,692 | |
Custodian | | | 339,815 | |
Transfer agent | | | 320,399 | |
Professional fees | | | 149,861 | |
Reports to shareholders | | | 136,375 | |
Trustees fees and expenses | | | 57,355 | |
Registration fees | | | 45,230 | |
Miscellaneous | | | 41,249 | |
Total expenses before offsets | | | 9,847,719 | |
Expense reimbursements | | | (1,338,558 | ) |
Net expenses | | | 8,509,161 | |
| |
Net investment income | | | 20,245,641 | |
Net Realized and Unrealized Gain (Loss): | | | | |
Net realized loss on investments | | | (4,497,359 | ) |
Net realized loss on futures contracts | | | (1,339,036 | ) |
Net realized gain on foreign currency transactions | | | 4,024,828 | |
Net realized gain on written options | | | 2,193,796 | |
Net realized gain on swap transactions | | | 3,424,153 | |
Net change in unrealized appreciation (depreciation) of investments | | | (46,248,093 | ) |
Net change in unrealized appreciation (depreciation) of futures contracts | | | 4,520,381 | |
Net change in unrealized appreciation (depreciation) on foreign currency translations | | | 70,451 | |
Net change in unrealized appreciation (depreciation) on written options | | | (18,463 | ) |
Net change in unrealized appreciation (depreciation) on swap transactions | | | 3,027,826 | |
Net realized and unrealized loss | | | (34,841,516 | ) |
Net decrease in net assets resulting from operations | | $ | (14,595,875 | ) |
|
The accompanying notes are an integral part of these financial statements. 28 |
Statements of Changes in Net Assets
For the fiscal year ended October 31,
| | | | | | | | |
| | | 2013 | | | 2012 | |
Increase (Decrease) in Net Assets From Operations: | | | | | | | | |
Net investment income | | $ | 20,245,641 | | | $ | 29,252,666 | |
Net realized gain on investments, options, futures contracts, swaps and foreign currency transactions | | | 3,806,382 | | | | 46,080,961 | |
Net change in unrealized appreciation (depreciation) of investments, options, futures contracts, swaps and foreign currency translations | | | (38,647,898 | ) | | | 41,685,035 | |
Net increase (decrease) in net assets resulting from operations | | | (14,595,875 | ) | | | 117,018,662 | |
Distributions to Shareholders: | | | | | | | | |
From net investment income | | | (34,138,855 | ) | | | (42,635,875 | ) |
From net realized gain on investments | | | (20,101,151 | ) | | | — | |
From return of capital | | | (2,501,308 | ) | | | — | |
Total distributions to shareholders | | | (56,741,314 | ) | | | (42,635,875 | ) |
Capital Share Transactions: | | | | | | | | |
Proceeds from sale of shares | | | 358,066,861 | | | | 391,140,790 | |
Reinvestment of dividends | | | 48,296,615 | | | | 36,842,985 | |
Cost of shares repurchased | | | (538,187,094 | ) | | | (294,836,464 | ) |
Net increase (decrease) from capital share transactions | | | (131,823,618 | ) | | | 133,147,311 | |
| | |
Total increase (decrease) in net assets | | | (203,160,807 | ) | | | 207,530,098 | |
Net Assets: | | | | | | | | |
Beginning of year | | | 1,446,671,243 | | | | 1,239,141,145 | |
End of year | | $ | 1,243,510,436 | | | $ | 1,446,671,243 | |
End of year undistributed net investment income | | $ | 709,639 | | | $ | 6,556,657 | |
| | | | | | | | |
Share Transactions: | | | | | | | | |
Sale of shares | | | 33,118,087 | | | | 36,127,870 | |
Shares issued in connection with reinvestment of dividends and distributions | | | 4,454,829 | | | | 3,434,473 | |
Shares repurchased | | | (50,389,826 | ) | | | (27,347,000 | ) |
Net increase (decrease) in shares | | | (12,816,910 | ) | | | 12,215,343 | |
|
The accompanying notes are an integral part of these financial statements. 29 |
Managers PIMCO Bond Fund
Financial Highlights
For a share outstanding throughout each fiscal year
| | | | | | | | | | | | | | | | | | | | |
| | | For the fiscal year ended October 31, | |
| | | 2013 | | | 2012 | | | 2011 | | | 2010 | | | 2009 | |
Net Asset Value, Beginning of Year | | $ | 11.14 | | | $ | 10.53 | | | $ | 11.24 | | | $ | 10.61 | | | $ | 9.85 | |
Net investment income | | | 0.16 | 3 | | | 0.24 | 3 | | | 0.38 | | | | 0.35 | | | | 0.49 | |
Net realized and unrealized gain (loss) on investments | | | (0.24 | )3 | | | 0.72 | 3 | | | (0.25 | ) | | | 0.73 | | | | 1.44 | |
Total from investment operations | | | (0.08 | ) | | | 0.96 | | | | 0.13 | | | | 1.08 | | | | 1.93 | |
Less Distributions to Shareholders from: | | | | | | | | | | | | | | | | | | | | |
Net investment income | | | (0.26 | ) | | | (0.35 | ) | | | (0.35 | ) | | | (0.32 | ) | | | (0.49 | ) |
Net realized gain on investments | | | (0.15 | ) | | | — | | | | (0.49 | ) | | | (0.13 | ) | | | (0.68 | ) |
Return of capital | | | (0.02 | ) | | | — | | | | — | | | | — | | | | — | |
Total distributions to shareholders | | | (0.43 | ) | | | (0.35 | ) | | | (0.84 | ) | | | (0.45 | ) | | | (1.17 | ) |
Net Asset Value, End of Year | | $ | 10.63 | | | $ | 11.14 | | | $ | 10.53 | | | $ | 11.24 | | | $ | 10.61 | |
Total Return1 | | | (0.72 | )% | | | 9.31 | % | | | 1.45 | % | | | 10.52 | % | | | 20.62 | % |
Ratio of net expenses to average net assets (with offsets and reductions) | | | 0.61 | %4 | | | 0.58 | % | | | 0.58 | % | | | 0.58 | % | | | 0.58 | % |
Ratio of expenses to average net assets (with offsets) | | | 0.61 | %4 | | | 0.58 | % | | | 0.58 | % | | | 0.58 | % | | | 0.58 | % |
Ratio of total expenses to average net assets (without offsets and reductions)2 | | | 0.70 | %4 | | | 0.70 | % | | | 0.71 | % | | | 0.74 | % | | | 0.78 | % |
Ratio of net investment income to average net assets1 | | | 1.45 | %4 | | | 2.22 | % | | | 2.54 | % | | | 2.38 | % | | | 3.78 | % |
Portfolio turnover | | | 255 | % | | | 375 | % | | | 495 | %5 | | | 359 | %5 | | | 531 | %5 |
Net assets at end of year (000’s omitted) | | $ | 1,243,510 | | | $ | 1,446,671 | | | $ | 1,239,141 | | | $ | 1,425,341 | | | $ | 1,114,164 | |
| | | | | | | | | | | | | | | | | | | | |
Notes to Financial Highlights
The following footnotes should be read in conjunction with the Financial Highlights of the Fund previously presented in this report.
| 1 | Total returns and net investment income would have been lower had certain expenses not been offset. |
| 2 | Excludes the impact of expense reimbursements or fee waivers and expense reductions such as brokerage credits, but includes non-reimbursable expense, if any, such as interest, taxes and extraordinary expenses. |
| 3 | Per share numbers have been calculated using average shares. |
| 4 | Includes non-routine extraordinary expenses amounting to 0.025% of average net assets. |
| 5 | Turnover ratio includes TBA dollar roll transactions. Had the TBA transactions been excluded the turnover ratios for the fiscal years ended 2011, 2010 and 2009 would have been 411%, 286% and 365%, respectively. |
Notes to Financial Statements
October 31, 2013
| 1. | Summary of Significant Accounting Policies |
Managers Trust I (the “Trust”) is an open-end management investment company, organized as a Massachusetts business trust, and registered under the Investment Company Act of 1940, as amended (the “1940 Act”). Currently, the Trust consists of a number of different funds, each having distinct investment management objectives, strategies, risks, and policies. Included in this report is the Managers PIMCO Bond Fund (the “Fund”).
The Fund’s financial statements are prepared in accordance with accounting principles generally accepted in the United States of America (“U.S. GAAP”), which require management to make estimates and assumptions that affect the reported amounts of assets and liabilities and disclosure of contingent assets and liabilities at the date of the financial statements and the reported amounts of income and expenses during the reporting period. Actual results could differ from those estimates and such differences could be material. The following is a summary of significant accounting policies followed by the Fund in the preparation of its financial statements:
| a. | Valuation of Investments |
Equity securities traded on a domestic or international securities exchange are valued at the last quoted sale price, or, lacking any sales, at the last quoted bid price. Over-the-counter securities are valued at the Nasdaq Official Closing Price, if one is available. Lacking any sales, over-the-counter securities are valued at the last quoted bid price. The Fund’s investments are generally valued based on market quotations provided by third-party pricing services approved by the Board of Trustees of the Fund (the “Board”).
Fixed-income securities are valued based on valuations furnished by independent pricing services that utilize matrix systems, which reflect such factors as security prices, yields, maturities, and ratings, and are supplemented by dealer and exchange quotations. Futures contracts for which market quotations are readily available are valued at the settlement price as of the close of the futures exchange. Short-term investments having a remaining maturity of 60 days or less are generally valued at amortized cost, which approximates market value. Investments in other open-end regulated investment companies are valued at their end of day net asset value per share. Investments in certain mortgage-backed and stripped mortgage-backed securities, preferred stocks, convertible securities, derivatives and other debt securities not traded on an organized securities market are valued on the basis of valuations provided by dealers or by a pricing service which uses information with respect to transactions in such securities and various relationships between such securities and yield to maturity in determining value.
Under certain circumstances, the value of certain Fund investments (including derivatives) may be based on an evaluation of fair value, pursuant to procedures established by and under the general supervision of the Board. The Pricing Committee is the committee formed by the Board to make fair value determinations for such investments. When determining the fair value of an investment, the Pricing Committee seeks to determine the price that the Fund might reasonably expect to receive from a current sale of that investment in an arm’s-length transaction. Fair value determinations shall be
based upon consideration of all available facts and information, including, but not limited to (i) attributes specific to the investment; (ii) fundamental analytical data and press releases relating to the investment and its issuer; (iii) the value of comparable securities or relevant financial instruments, including derivative securities, traded on other markets or among dealers; and (iv) other factors, such as future cash flows, interest rates, yield curves, volatilities, credit risks and/or default rates. The Board will be presented with a quarterly report comparing fair values determined by the Pricing Committee against subsequent market valuations for those securities. The values assigned to fair value investments are based on available information and do not necessarily represent amounts that might ultimately be realized, since such amounts depend on future developments inherent in long-term investments. Further, because of the inherent uncertainty of valuation, those estimated values may differ significantly from the values that would have been used had a ready market for the investments existed, and the differences could be material. The Fund may use the fair value of a portfolio investment to calculate its net asset value (“NAV”) when, for example, (1) market quotations are not readily available because a portfolio investment is not traded in a public market or the principal market in which the investment trades is closed, (2) trading in a portfolio investment is suspended and has not resumed before the Fund calculates its NAV, (3) a significant event affecting the value of a portfolio investment is determined to have occurred between the time of the market quotation provided for a portfolio investment and the time as of which the Fund calculates its NAV, (4) an investment’s price has remained unchanged over a period of time (often referred to as a “stale price”), or (5) Managers Investment Group LLC (the “Investment Manager”) determines that a market quotation is inaccurate. Portfolio investments that trade primarily on foreign markets are priced based upon the market quotation of such securities as of the close of their respective principal markets. Under certain circumstances, the Investment Manager may adjust such prices based on its determination of the impact of events occurring subsequent to the close of such markets but prior to the time as of which the Fund calculates its NAV. The Fund may invest in securities that may be thinly traded. The Board has adopted procedures to adjust prices of thinly traded securities that are judged to be stale so that they reflect fair value. An investment valued on the basis of its fair value may be valued at a price higher or lower than available market quotations. An investment valuation may differ depending on the method used and the factors considered in determining value according to the Fund’s fair value procedures.
U.S. GAAP defines fair value as the price that a Fund would receive to sell an asset or pay to transfer a liability in an orderly transaction between market participants at the measurement date. U.S. GAAP also establishes a framework for measuring fair value, and a three level hierarchy for fair value measurements based upon the transparency of inputs to the valuation of an asset or liability. Inputs may be observable or unobservable and refer broadly to the assumptions that market participants would use in pricing the asset or liability. Observable inputs reflect the assumptions market participants would use in pricing the asset or liability based on market data obtained from sources independent of the Fund. Unobservable inputs reflect the Fund’s own assumptions about the assumptions that market participants would use in pricing the asset
Notes to Financial Statements (continued)
or liability developed based on the best information available in the circumstances. Each investment is assigned a level based upon the observability of the inputs which are significant to the overall valuation.
The three-tier hierarchy of inputs is summarized below:
Level 1 – inputs are quoted prices in active markets for identical investments (e.g., equity securities, open-end investment companies, futures contracts, options contracts)
Level 2 – other observable inputs (including, but not limited to: quoted prices for similar assets or liabilities in markets that are active, quoted prices for identical or similar assets or liabilities in markets that are not active, inputs other than quoted prices that are observable for the assets or liabilities (such as interest rates, yield curves, volatilities, prepayment speeds, loss severities, credit risks and default rates) or other market corroborated inputs) (e.g., debt securities, government securities, swap contracts, foreign currency exchange contracts, foreign securities utilizing international fair value pricing, broker-quoted securities, fair valued securities with observable inputs)
Level 3 – inputs are significant unobservable inputs (including the Fund’s own assumptions used to determine the fair value of investments) (e.g., fair valued securities with unobservable inputs)
Changes in inputs or methodologies used for valuing investments may result in a transfer in or out of levels within the fair value hierarchy. The inputs or methodologies used for valuing investments are not necessarily an indication of the risk associated with investing in those investments.
Security transactions are accounted for as of trade date. Realized gains and losses on securities sold are determined on the basis of identified cost.
| c. | Investment Income and Expenses |
Dividend income is recorded on the ex-dividend date. Dividend and interest income on foreign securities is recorded net of any withholding tax. Interest income, which includes amortization of premium and accretion of discount on debt securities, is accrued as earned. Non-cash dividends included in dividend income, if any, are reported at the fair market value of the securities received. Other income and expenses are recorded on an accrual basis. Expenses that cannot be directly attributed to a Fund are apportioned among the Funds in the Trust and in some cases other affiliated funds based upon their relative average net assets or number of shareholders.
The Fund has a “balance credit” agreement with The Bank of New York Mellon (“BNYM”), the Fund’s custodian, whereby the Fund is credited with an interest factor equal to 0.75% below the effective
90-day T-Bill rate for account balances left uninvested overnight. If the T-Bill rate falls below 0.75%, no credits will be earned. These credits serve to reduce custody expenses that otherwise would be charged to the Fund. For the fiscal year ended October 31, 2013, the Fund’s custodian expense was not reduced.
Overdraft fees are computed at 1% above the Federal Funds rate on the day of the overdraft. Prior to January 1, 2013 the rate was 2%
above the effective Federal Funds rate. For the fiscal year ended October 31, 2013, overdraft fees for the Fund equaled $55.
The Trust has filed a proxy statement with the SEC to approve a new Declaration of Trust for the Trust, among other proposals. The costs associated with this proxy are being treated as “extraordinary expenses,” and, therefore, are excluded from the expense limitation agreement described in Note 2.
| d. | Dividends and Distributions |
Dividends resulting from net investment income, if any, normally will be declared daily and paid monthly. Distributions of capital gains, if any, will be made on an annual basis and when required for Federal excise tax purposes. Dividends and distributions to shareholders are recorded on the ex-dividend date. Income and capital gain distributions are determined in accordance with Federal income tax regulations, which may differ from U.S. GAAP. The most common differences are due to differing treatments for losses deferred due to wash sales, foreign currency, options, futures and market discount transactions. Permanent book and tax basis differences, if any, relating to shareholder distributions will result in reclassifications to paid-in capital.
The tax character of distributions paid during the fiscal years ended October 31, 2013 and October 31, 2012 were as follows:
| | | | | | | | |
Distributions paid from: | | | 2013 | | | | 2012 | |
Ordinary income | | $ | 27,279,634 | | | $ | 42,635,875 | |
Short-term capital gains | | | 16,058,426 | | | | — | |
Long-term capital gains | | | 10,901,946 | | | | — | |
Return of capital | | | 2,501,308 | | | | — | |
| | | | | | | | |
Totals | | $ | 56,741,314 | | | $ | 42,635,875 | |
| | | | | | | | |
As of October 31, 2013, the components of distributable earnings (excluding unrealized appreciation/depreciation) on a tax basis consisted of:
| | | | |
Capital loss carryforward | | | — | |
Undistributed ordinary income | | | — | |
Undistributed short-term capital gains | | | — | |
Undistributed long-term capital gains | | | — | |
The Fund intends to comply with the requirements under Subchapter M of the Internal Revenue Code of 1986, as amended, and, to distribute substantially all of its taxable income and gains to its shareholders and to meet certain diversification and income requirements with respect to investment companies. Therefore, no provision for Federal income or excise tax is included in the accompanying financial statements.
Additionally, based on the Fund’s understanding of the tax rules and rates related to income, gains and transactions for the foreign jurisdictions in which it invests, the Fund will provide for foreign taxes, and where appropriate, deferred foreign taxes.
Management has analyzed the Fund’s tax positions taken on federal income tax returns as of October 31, 2013, and for all open tax years, and has concluded that no provision for Federal income tax is required in the Fund’s financial statements. Additionally, the Fund
Notes to Financial Statements (continued)
is not aware of any tax position for which it is reasonably possible that the total amounts of unrecognized tax benefits will change materially in the next twelve months.
Under the Regulated Investment Company Modernization Act of 2010. Post-enactment capital losses may be carried forward for an unlimited time period. However, any new losses incurred will be required to be utilized prior to any loss carryovers incurred in pre-enactment taxable years, which generally expire eight years following the close of the taxable year in which they were incurred. As a result of this ordering rule, pre-enactment capital loss carryovers may be more likely to expire unused. Additionally, post- enactment capital losses that are carried forward retain their tax character as either short-term or long-term capital losses rather than being considered all short-term as under previous law.
| f. | Capital Loss Carryovers |
As of October 31, 2013, the Fund had no accumulated net realized capital loss carryovers from securities transactions for Federal income tax purposes. Should the Fund incur net capital losses for the fiscal year ended October 31, 2013, such amounts may be used to offset future realized capital gains, if any, through the expiration dates listed or in the case of post-enactment losses, for an unlimited time period.
The Trust’s Declaration of Trust authorizes for each series the issuance of an unlimited number of shares of beneficial interest, without par value. The Fund records sales and repurchases of its capital stock on the trade date. The cost of securities contributed to the Fund in connection with the issuance of shares is based on the valuation of those securities in accordance with the Fund’s policy on investment valuation.
At October 31, 2013, certain unaffiliated shareholders of record, specifically omnibus accounts, individually or collectively held greater than 10% of the outstanding shares of the Fund as follows: two collectively own 40%.
Transactions by these shareholders may have a material impact on the Fund.
The Fund may enter into repurchase agreements provided that the value of the underlying collateral, including accrued interest, will equal or exceed the value of the repurchase agreement during the term of the agreement. The underlying collateral for all repurchase agreements is held in safekeeping by the Fund’s custodian or at the Federal Reserve Bank. If the seller defaults and the value of the collateral declines, or if bankruptcy proceedings commence with respect to the seller of the security, realization of the collateral by the Fund may be delayed or limited. At October 31, 2013, the market value of repurchase agreements outstanding was $562,282,973.
| i. | Foreign Currency Translation |
The books and records of the Fund are maintained in U.S. dollars. The value of investments, assets and liabilities denominated in currencies other than U.S. dollars are translated into U.S. dollars based upon current foreign exchange rates. Purchases and sales of foreign investments, income and expenses are converted into U.S. dollars based on currency exchange rates prevailing on the
respective dates of such transactions. Net realized and unrealized gain (loss) on foreign currency transactions represent: (1) foreign exchange gains and losses from the sale and holdings of foreign currencies; (2) gains and losses between trade date and settlement date on investment securities transactions and forward foreign currency exchange contracts; and (3) gains and losses from the difference between amounts of interest and dividends recorded and the amounts actually received.
The Fund does not isolate the net realized and unrealized gain or loss resulting from changes in exchange rates from the fluctuations in market prices of securities held. Such fluctuations are included with the net realized and unrealized gain or loss on investments.
The Fund invests in securities of foreign entities and in instruments denominated in foreign currencies which involve risks not typically associated with investments in domestic securities. Non-domestic securities carry special risks, such as exposure to currency fluctuations, less developed or less efficient trading markets, political instability, a lack of company information, differing auditing and legal standards, and, potentially, less liquidity.
Realized gains in certain countries may be subject to foreign taxes at the Fund level, at rates ranging from approximately 10% to 15%. The Fund would pay such foreign taxes on net realized gains at the appropriate rate for each jurisdiction.
| k. | Securities Transacted on a When Issued Basis |
The Fund may enter into To Be Announced (“TBA”) sale commitments to hedge its portfolio positions or to sell mortgage-backed securities it owns under delayed delivery arrangements. Proceeds of TBA sale commitments are not received until the contractual settlement date. During the time a TBA sale commitment is outstanding, equivalent deliverable securities, or an offsetting TBA purchase commitment deliverable on or before the sale commitment date, are held as “cover” for the transaction. Unsettled TBA sale commitments are valued at the current market value of the underlying securities according to the procedures described under “Valuation of Investments,” in footnote 1a above. Each contract is marked-to-market daily and the change in market value is recorded by the Fund as an unrealized gain or loss. If the TBA sale commitment is closed through the acquisition of an offsetting purchase commitment, the Fund realizes a gain or loss. If the Fund delivers securities under the commitment, the Fund realizes a gain or a loss from the sale of the securities based upon the unit price established at the date the commitment was entered into.
| 2. | Agreements and Transactions with Affiliates |
The Trust has entered into an Investment Management Agreement under which the Investment Manager, a subsidiary of Affiliated Managers Group, Inc. (“AMG”), serves as investment manager to the Fund and is responsible for the Fund’s overall administration and operations. The Investment Manager selects one or more subadvisors for the Fund (subject to Board approval) and monitors each subadvisor’s investment performance, security holdings and investment strategies. The Fund’s investment portfolio is managed by one or more portfolio managers who serve pursuant to a subadvisory agreement with the Investment Manager.
Notes to Financial Statements (continued)
Investment management fees are paid directly by the Fund to the Investment Manager based on average daily net assets. The annual investment management fee rate, as a percentage of average daily net assets, for the fiscal year ended October 31, 2013, was 0.40%.
The Investment Manager has contractually agreed, through March 1, 2014, to waive management fees and/or reimburse Fund expenses in order to limit total annual Fund operating expenses after fee waiver and expense reimbursements (exclusive of taxes, interest (including interest incurred in connection with bank and custody overdrafts), brokerage commissions and other transaction costs, acquired fund fees and expenses, and extraordinary expenses) to 0.58% of the Fund’s average daily net assets.
The Fund is obligated to repay the Investment Manager such amounts waived, paid or reimbursed in future years provided that the repayment occurs within thirty-six (36) months after the waiver or reimbursement and that such repayment would not cause the Fund’s total operating expenses in any such future year to exceed the Fund’s expense cap. For the fiscal year ended October 31, 2013, the Fund’s components of reimbursement available are detailed in the following chart:
| | | | |
Reimbursement Available - 10/31/12 | | $ | 4,763,972 | |
Additional Reimbursements | | | 1,338,558 | |
Repayments | | | — | |
Expired Reimbursements | | | (1,643,094 | ) |
| | | | |
Reimbursement Available - 10/31/13 | | $ | 4,459,436 | |
| | | | |
The Fund has entered into an Administration and Shareholder Servicing Agreement under which the Investment Manager serves as the Fund’s administrator (the “Administrator”) and is responsible for all aspects of managing the Fund’s operations, including administration and shareholder services to the Fund, its shareholders, and certain institutions, such as bank trust departments, broker-dealers and registered investment advisers, that advise or act as an intermediary with the Fund’s shareholders. The Fund pays a fee to the Administrator at the rate of 0.20% per annum of the Fund’s average daily net assets for this service.
The aggregate annual retainer paid to each Independent Trustee of the Board is $105,000, plus $6,000 or $2,500 for each regular or special meeting attended, respectively. The Independent Chairman of the Trusts receives an additional payment of $25,000 per year. The Chairman of the Audit Committee receives an additional payment of $10,000 per year. The Trustees’ fees and expenses are allocated among all of the Funds for which the Investment Manager serves as the advisor (the “Managers Funds”) based on the relative net assets of such Funds. The “Trustees fees and expenses” shown in the financial statements represents the Fund’s allocated portion of the total fees and expenses paid by the Managers Funds.
Prior to January 1, 2013, the aggregate annual retainer paid to each Independent Trustee of the Board was $80,000, plus $5,000 or $2,500 for each regular or special meeting attended, respectively. The Independent Chairman of the Trust formerly received an
additional payment of $20,000 per year. The Chairman of the Audit Committee formerly received an additional payment of $8,000 per year.
The Fund is distributed by Managers Distributors, Inc. (the “Distributor” or “MDI”), a wholly-owned subsidiary of the Investment Manager. MDI serves as the distributor and underwriter for the Fund and is a registered broker-dealer and member of the Financial Industry Regulatory Authority, Inc. (“FINRA”). Shares of the Fund will be continuously offered and will be sold directly to prospective purchasers through brokers, dealers or other financial intermediaries who have executed selling agreements with MDI. Subject to the compensation arrangement discussed below, generally MDI bears all or a portion of the expenses of providing services pursuant to the distribution agreement, including the payment of the expenses relating to the distribution of prospectuses for sales purposes and any advertising or sales literature. Certain Trustees and Officers of the Fund are Officers and/or Directors of the Investment Manager, AMG and/or the Distributor.
The Securities and Exchange Commission granted an exemptive order that permits the Fund to lend and borrow money for certain temporary purposes directly to and from other eligible Managers Funds. Participation in this interfund lending program is voluntary for both borrowing and lending funds, and an interfund loan is only made if it benefits each participating fund. The Investment Manager administers the program according to procedures approved by the Board, and the Board monitors the operation of the program. An interfund loan must comply with certain conditions set out in the exemptive order, which are designed to assure fairness and protect all participating Funds. For the fiscal year ended October 31, 2013, the Fund neither borrowed or lent to any other Managers Funds.
| 3. | Purchases and Sales of Securities |
Purchases and sales of securities (excluding short-term securities and U.S. Government obligations) for the fiscal year ended October 31, 2013, were $249,559,181 and $487,723,953, respectively.
Purchases and sales of U.S. Government obligations for the fiscal year ended October 31, 2013, were $10,710,723,477 and $10,915,703,774, respectively.
| 4. | Portfolio Securities Loaned |
The Fund participates in a securities lending program offered by BNYM (the “Program”), providing for the lending of securities to qualified brokers. Securities lending income includes earnings of such temporary cash investments, plus or minus any rebate to a borrower. These earnings (after any rebate) are then divided between BNYM, as a fee for its services under the program, and the Fund, according to agreed-upon rates. Collateral on all securities loaned is accepted in cash and is maintained at a minimum level of 102% (105% in the case of certain foreign securities) of the market value, plus interest, if applicable, of investments on loan. It is the Fund’s policy to obtain additional collateral from or return excess collateral to the borrower by the end of the next business day, following the valuation date of the securities loaned. Therefore, the value of the collateral held may be temporarily less than the value of the securities on loan. Lending securities entails a risk of loss to the Fund if and to the extent that the market value of the securities loaned were to increase and the borrower did not increase the collateral accordingly, and the borrower fails to return the
Notes to Financial Statements (continued)
securities. Under the terms of the Program, the Fund is indemnified for such losses by BNYM. Cash collateral is held in a separate account managed by BNYM, who is authorized to exclusively enter into overnight government repurchase agreements. BNYM bears the risk of any deficiency in the amount of the cash collateral available for return to the borrower due to any loss on the collateral invested.
| 5. | Commitments and Contingencies |
In the normal course of business, the Fund may enter into contracts and agreements that contain a variety of representations and warranties, which provide general indemnifications. The maximum exposure to the Fund under these arrangements is unknown, as this would involve future claims that may be made against the Fund that have not yet occurred. However, the Fund had no prior claims or losses and expects the risk of material loss to be remote.
Certain transactions, such as futures and forward transactions, dollar roll agreements, or purchases of when-issued or delayed delivery securities may have a similar effect on the Fund’s net asset value as if the Fund had created a degree of leverage in its portfolio. However, if the Fund enters into such a transaction, the Fund will establish a segregated account with its custodian in which it will maintain cash, U.S. government securities or other liquid securities equal in value to its obligations in respect to such transaction. Securities and other assets held in the segregated account may not be sold while the transaction is outstanding, unless other suitable assets are substituted.
The following disclosures contain information on how and why the Fund uses derivative instruments, the credit risk and how derivative instruments affect the Fund’s financial position, results of operations and cash flows. The location and fair value amounts of these instruments on the Statement of Assets and Liabilities and the realized and changes in unrealized gains and losses on the Statement of Operations, each categorized by type of derivative contract, are included in a table in the Notes to the Schedule of Portfolio Investments. For the fiscal year ended October 31, 2013, the average quarterly balances of outstanding derivative financial instruments were as follows:
| | | | |
Financial futures contracts: | | | | |
Average number of contracts purchased | | | 2,583 | |
Average number of contracts sold | | | 8 | |
Average notional value of contracts purchased | | $ | 603,541,459 | |
Average notional value of contracts sold | | $ | 1,503,426 | |
Foreign currency exchange contracts: | | | | |
Average US dollar amounts purchased/sold | | $ | 235,755,045 | |
Options: | | | | |
Average notional value of option contracts written | | $ | 69,206 | |
Average notional value of swaption written | | $ | 260,120,000 | |
| | | | |
Credit default swaps: | | | | |
Average notional value - buy protection | | $ | 5,574,600 | |
Average notional value - sell protection | | $ | 109,900,000 | |
Interest rate swaps: | | | | |
Average notional value - pays fixed rate | | $ | 529,060,000 | |
Average notional value - receives fixed rate | | $ | 240,740,000 | |
| 8. | Forward Foreign Currency Contracts |
During the fiscal year ended October 31, 2013, the Fund invested in forward foreign currency contracts to facilitate transactions in foreign securities and to hedge against foreign currency exchange rate risk on its non-U.S. dollar denominated investment securities.
A forward foreign currency contract is an agreement between a fund and another party to buy or sell a currency at a set price at a future date. The market value of the contract will fluctuate with changes in currency exchange rates. The contract is marked-to-market daily, and the change in market value is recorded as an unrealized gain or loss. Gain or loss on the purchase or sale of contracts having the same settlement date, amount and counterparty is realized on the date of offset, otherwise gain or loss is realized on the settlement date. Risks may arise upon entering into these contracts from the potential inability of counterparties to meet the terms of their contracts and from unanticipated movements in the value of a foreign currency relative to the U.S. dollar.
The Fund entered into futures contracts to achieve a desired level of investment, whether to accommodate portfolio turnover or cash flows from capital shares transactions. There are certain risks associated with futures contracts. Prices may not move as expected or the Fund may not be able to close out the contract when it desires to do so, resulting in losses.
On entering into a futures contract, either cash or securities in an amount equal to a certain percentage of the contract value (initial margin) must be deposited with the futures broker. Subsequent payments (variation margin) are made or received each day. The variation margin payments equal the daily changes in the contract value and are recorded as unrealized gains or losses. For the OTC futures, daily variation margin is not required. The Fund recognizes a realized gain or loss when the contract is closed or expires equal to the difference between the value of the contract at the time it was opened and the value at the time it was closed. Futures are valued at their quoted daily settlement prices. The aggregate principal amounts of the contracts are not recorded in the financial statements. Fluctuations in the value of the contracts are recorded in the Statement of Assets and Liabilities as an asset (liability) and in the Statement of Operations as unrealized appreciation (depreciation) until the contracts are closed, when they are recorded as realized gains (losses) on futures contracts.
| 10. | Interest Rate Caps and Floors, Swap Contracts and Options |
For the fiscal year ended October 31, 2013, the Fund entered into over-the-counter transactions involving interest rate caps and floors, swap contracts, or purchased and written (sold) options, in order to manage its exposure to credit, currency, equity, interest rate and inflation risk.
Notes to Financial Statements (continued)
In interest rate caps and floor agreements, one party agrees to make payments only when interest rates exceed a specified rate or “cap” or fall below a specified rate or “floor,” usually in return for payment of a fee by the other party. Interest rate caps and floors entitle the purchaser, to the extent that a specified index exceeds or falls below a predetermined interest rate, to receive payments of interest on a notional principal amount from the party selling such interest rate caps or floors.
Swap contracts represent an agreement between counterparties to exchange cash flows based on the difference between two rates applied to a notional principal amount for a specified period. The most common type of interest rate swap involves the exchange of fixed-rate cash flows for variable-rate cash flows. Swaps ordinarily do not involve the exchange of principal between the parties. Purchased options on swap contracts (“swaptions”) give the holder the right, but not the obligation, to enter into a swap contract with the counterparty which has written the option on a date, at an interest rate, and with a notional amount as specified in the swaption agreement. If the counterparty to the swap transaction defaults, the Fund will be limited to contractual remedies pursuant to the agreements governing the transaction. There is no assurance that swap or swaption contract counterparties will be able to meet their obligations under the contracts or that, in the event of default, the Fund will succeed in pursuing contractual remedies. The Fund may thus assume the risk that payments owed to the Fund under a swap or swaption contract will be delayed, or not received at all. During the term of the swap agreement or swaption, unrealized gains or losses are recorded as a result of “marking to market.” When the swap agreement or swaption is terminated, the Fund will record a realized gain or loss equal to the difference between the proceeds from (or cost of) the closing transaction and the Fund’s basis in the contract, if any. Accrued interest and interest paid are recognized as unrealized and realized gain (loss), respectively. In each of the contracts, the Fund pays a premium to the counterparty in return for the swaption. These swaptions may be exercised by entering into a swap contract with the counterparty only on the date specified in each contract. The Fund also sold credit protection through credit default swaps. Under the terms of the swaps, the seller of the credit protection receives a periodic payment amount (premium) from the buyer that is a fixed percentage amount applied to a notional principal amount. In return, the seller agrees to pay the buyer the notional amount and take delivery of a debt instrument of the reference issuer of the same notional par amount if the reference entity is subject to a credit event (such as bankruptcy, failure to pay, or obligation acceleration) during the term of the swap.
Centrally cleared swaps listed or traded on a multilateral or trade facility platform, such as a registered exchange, are valued at the daily settlement price determined by the respective exchange. For centrally cleared credit default swaps the clearing facility requires its members to provide actionable levels across complete term structures. Daily changes in valuation of centrally cleared swaps, if any, are recorded as a receivable or payable for the change in value as appropriate (“variation margin”) in the Statement of Assets and Liabilities.
A written option contract is a contract in which the writer of the option grants the buyer of the option the right to purchase from (call option) or sell to (put option) the writer a designated instrument at a
specified price within a specified period of time. Options written (sold) are recorded as liabilities. The Fund, as writer of written options, bears the risk of an unfavorable change in the market value of the instrument underlying the written option. When an option expires, the premium (original option value) is realized as a gain if the option was written or as a loss if the option was purchased. When the exercise of an option results in a cash settlement, the difference between the premium and the settlement proceeds is recognized as realized gain or loss. When securities are acquired or delivered upon exercise of an option, the acquisition cost or sale proceeds are adjusted by the amount of the premium. When an option is closed, the difference between the premium and the cost to close the position is realized as a gain or loss.
| 11. | Risks Associated with Collateralized Mortgage Obligations (“CMOs”) |
The net asset value of the Fund may be sensitive to interest rate fluctuations because the Fund may hold several instruments, including CMOs and other derivatives, whose values can be significantly impacted by interest rate movements. CMOs are obligations collateralized by a portfolio of mortgages or mortgage-related securities. Payments of principal and interest on the mortgages are passed through to the holder of the CMOs on the same schedule as they are received, although certain classes of CMOs have priority over others with respect to the receipt of prepayments on the mortgages. Therefore, the investment in CMOs may be subject to a greater or lesser risk of prepayment than other types of mortgage-related securities. CMOs are subject to principal paydowns as a result of prepayment or refinancing of the underlying mortgage instruments As a result, the average life may be substantially less than the original maturity. CMOs may have a fixed or variable rate of interest.
| 12. | Dollar Roll Agreements |
The Fund may enter into dollar rolls in which it sells debt securities for delivery currently and simultaneously contract to repurchase similar, but not identical, securities at the same price or a lower price on an agreed date. The Fund receives compensation as consideration for entering into the commitment to repurchase. The compensation is the difference between the current sale price and the forward price for the future purchase (often referred to as the “drop”) as well as by the interest earned on the cash proceeds of the initial sale. The Fund may also be compensated by the receipt of a commitment fee. As the holder, the counterparty receives all principal and interest payments, including prepayments, made with respect to the similar security sold. Dollar rolls may be renewed with a new sale and repurchase price with a cash settlement made at renewal without physical delivery of the securities subject to the contract.
Certain risks may arise upon entering into dollar rolls from the potential inability of counterparties to meet the terms of their commitments. Additionally, the value of such securities may change adversely before the Fund is able to repurchase them. There can be no assurance that the Fund’s use of the cash that it receives from a dollar roll will provide a return that exceeds its cost.
Notes to Financial Statements (continued)
| 13. | Market, Credit and Counterparty Risks |
In the normal course of business, the Fund invests in securities and enters into transactions where risks exist due to market fluctuations and are exposed to credit risk with parties with whom it trades (issuers or counterparties). Market prices of investments held by the Fund may fall rapidly or unpredictably and will rise and fall due to changing economic, political, or market conditions or in response to events that affect particular industries or companies. The Fund may be exposed to credit or counterparty risk, or the risk that an institution or other entity with which the Fund has unsettled or open transactions will default or not perform under the contract. The Fund minimizes credit risk and counterparty risk by undertaking transactions with a large number of customers and counterparties on recognized and reputable exchanges. The Fund could lose money if the issuer or guarantor of a fixed income security, or the counterparty to a financial derivatives contract, repurchase agreement or a loan of portfolio securities, is unable or unwilling to make timely principal and/or interest payments, or to otherwise honor its obligations.
The Fund is subject to various Master Agreements, which govern the terms of certain transactions with select counterparties. These Master Agreements reduce the counterparty risk associated with relevant transactions by specifying credit protection mechanisms and providing standardization that improves legal certainty. Master Agreements can also help limit counterparty risk by specifying collateral posting arrangements at pre-arranged exposure levels. Under the Master Agreements, collateral is routinely transferred if the total net exposure to certain transactions (net of existing collateral already in place) governed under the relevant master agreement with a counterparty in a given account exceeds a specified threshold, which typically ranges from zero to $250,000 depending on the counterparty and the type of Master Agreement.
International Swaps and Derivatives Association, Inc. Master Agreements (“ISDA Master Agreements”) govern OTC financial derivative transactions entered into by the Fund and the respective counterparty. The ISDA Master Agreements maintain provisions for general obligations, representations, agreements, collateral and events of default or termination. Certain ISDA Master Agreements allow counterparties to OTC derivatives to terminate derivative contracts prior to maturity in the event the Fund’s net assets decline by a stated percentage or the Fund fails to meet the terms of the ISDA Master Agreement, which requires accelerated settlement of
all outstanding transactions under the applicable ISDA Master Agreement. Any election to early terminate could be material to the financial statements.
| 14. | New Accounting Pronouncements |
In December 2011, the Financial Accounting Standards Board (“FASB”) issued Accounting Standards Update (“ASU”) No. 2011-11 “Disclosures about Offsetting Assets and Liabilities.” ASU 2011-11 requires disclosures to make financial statements that are prepared under U.S. GAAP more comparable to those prepared under IFRS. The new disclosure requirements mandate that entities disclose both gross and net information about instruments and transactions eligible for offset in the statement of assets and liabilities as well as instruments and transactions subject to an agreement similar to a master netting arrangement. In addition, ASU 2011-11 requires disclosure of collateral received and posted in connection with master netting agreements or similar arrangements. New disclosures are required for annual reporting periods beginning on or after January 1, 2013, and interim periods within those annual periods. Management is evaluating the impact of ASU 2011-11 on the Funds’ financial statements and disclosures.
The Fund has determined that no other material events or transactions occurred through the issuance date of the Fund’s financial statements, which require additional disclosure in the Fund’s financial statements.
Tax Information (unaudited)
The Managers PIMCO Bond Fund hereby designates the maximum amount allowable of its net taxable income as qualified dividends as provided in the Jobs and Growth Tax Relief Reconciliation Act of 2003. The 2012/2013 Form 1099-DIV you receive for each Fund will show the tax status of all distributions paid to you during the year.
Pursuant to section 852 of the Internal Revenue Code, Managers PIMCO Bond Fund hereby designates $6,864,958, as a capital gain distribution with respect to the taxable year ended October 31, 2013, or if subsequently determined to be different, the net capital gains of such year.
Report of Independent Registered Public Accounting Firm
To the Board of Trustees of Managers Trust I and the Shareholders of Managers PIMCO Bond Fund:
In our opinion, the accompanying statement of assets and liabilities, including the schedule of portfolio investments, and the related statements of operations and of changes in net assets and the financial highlights present fairly, in all material respects, the financial position of Managers PIMCO Bond Fund (the “Fund”) at October 31, 2013, and the results of its operations, the changes in its net assets and the financial highlights for each of the periods indicated, in conformity with accounting principles generally accepted in the United States of America. These financial statements and financial highlights (hereafter referred to as “financial statements”) are the responsibility of the Fund’s management. Our responsibility is to express an opinion on these financial statements based on our audits. We conducted our audits of these financial statements in accordance with the standards of the Public Company Accounting Oversight Board (United States). Those standards require that we plan and perform the audit to obtain reasonable assurance about whether the financial statements are free of material misstatement. An audit includes examining, on a test basis, evidence supporting the amounts and disclosures in the financial statements, assessing the accounting principles used and significant estimates made by management, and evaluating the overall financial statement presentation. We believe that our audits, which included confirmation of securities at October 31, 2013 by correspondence with the custodian, brokers and the application of alternative auditing procedures where securities purchased had not been received, provide a reasonable basis for our opinion.
PricewaterhouseCoopers LLP
Boston, Massachusetts
December 26, 2013
Trustees and Officers
The Trustees and Officers of the Trust, their business addresses, principal occupations for the past five years and dates of birth are listed below. The Trustees provide broad supervision over the affairs of the Trust and the Funds. The Trustees are experienced executives who meet periodically throughout the year to oversee the Funds’ activities, review contractual arrangements with companies that provide services to the Funds, and review the Funds’ performance. Unless otherwise noted, the address of each Trustee or Officer is the address of the Trust: 800 Connecticut Avenue, Norwalk, Connecticut 06854.
There is no stated term of office for Trustees. Trustees serve until their resignation, retirement or removal in accordance with the Trust’s organizational documents and policies adopted by the Board from time to time. The Chairman of the Trustees, President, Treasurer and Secretary of the Trust are elected by the Trustees annually. Other officers hold office at the pleasure of the Trustees.
Independent Trustees
The following Trustees are not “interested persons” of the Trust within the meaning of the 1940 Act:
| | |
Name, Date of Birth, Number of Funds Overseen in Fund Complex* | | Principal Occupation(s) During Past 5
Years and Other Directorships Held by Trustee |
Bruce B. Bingham, 12/01/48 • Trustee since 2012 • Oversees 40 Funds in Fund Complex | | Partner, Hamilton Partners (real estate development firm) (1987-Present). |
| |
William E. Chapman, II, 9/23/41 • Independent Chairman • Trustee since 2000 • Oversees 40 Funds in Fund Complex | | President and Owner, Longboat Retirement Planning Solutions (1998-Present); Hewitt Associates, LLC (part time) (provider of Retirement and Investment Education Seminars) (2002-2009); Trustee Emeritus of Bowdoin College (2013-Present); Trustee of Bowdoin College (2002-2013); Director of Harding, Loevner Funds, Inc. (6 portfolios); Trustee of Third Avenue Trust (5 portfolios); Trustee of Third Avenue Variable Trust (1 portfolio); Trustee of Aston Funds (26 portfolios). |
| |
Edward J. Kaier, 9/23/45 • Trustee since 2000 • Oversees 40 Funds in Fund Complex | | Attorney at Law and Partner, Teeters Harvey Gilboy & Kaier LLP (2007-Present); Attorney at Law and Partner, Hepburn Willcox Hamilton & Putnam, LLP (1977-2007); Trustee of Third Avenue Trust (5 portfolios); Trustee of Third Avenue Variable Trust (1 portfolio); Trustee of Aston Funds (26 portfolios). |
| |
Kurt Keilbacker, 10/05/63 • Trustee since 2013 • Oversees 40 Funds in Fund Complex | | Managing Member, TechFund Europe (2000-Present); Managing Member, TechFund Capital (1997-Present) |
| |
Steven J. Paggioli, 4/03/50 • Trustee since 2000 • Oversees 40 Funds in Fund Complex | | Independent Consultant (2002-Present); Formerly Executive Vice President and Director, The Wadsworth Group (1986-2001); Executive Vice President, Secretary and Director, Investment Company Adminis-tration, LLC (1990-2001); Vice President, Secretary and Director, First Fund Distributors, Inc. (1991-2001); Trustee, Professionally Managed Portfolios (38 portfolios); Advisory Board Member, Sustainable Growth Advisors, LP; Independent Director, Chase Investment Counsel (2008 – Present); Trustee of Aston Funds (26 portfolios). |
| |
Richard F. Powers III, 2/02/46 • Trustee since 2013 • Oversees 40 Funds in Fund Complex | | Adjunct Professor, Boston College (2011-Present); Director of Ameriprise Financial Inc. (2005-2009) |
| |
Eric Rakowski, 6/05/58 • Trustee since 2000 • Oversees 40 Funds in Fund Complex | | Professor, University of California at Berkeley School of Law (1990-Present); Director of Harding, Loevner Funds, Inc. (6 portfolios); Trustee of Third Avenue Trust (5 portfolios); Trustee of Third Avenue Variable Trust (1 portfolio); Trustee of Aston Funds (26 portfolios). |
| |
Victoria Sassine, 8/11/65 • Trustee since 2013 • Oversees 40 Funds in Fund Complex | | Lecturer, Babson College (2007 – Present) |
| | |
Name, Date of Birth, Number of Funds Overseen in Fund Complex* | | Principal Occupation(s) During Past 5
Years and Other Directorships Held by Trustee |
Thomas R. Schneeweis, 5/10/47 • Trustee since 2000 • Oversees 40 Funds in Fund Complex | | Professor Emeritus, University of Massachusetts (2013 - Present); Director, CISDM at the University of Massachusetts, (1996-Present); President, Alternative Investment Analytics, LLC, (formerly Schneeweis Partners, LLC) (2001-Present); Partner, S Capital Management, LLC (2007-Present); President, TRS Associates (1982-Present); Professor of Finance, University of Massachusetts (1977-2013); Partner, White Bear Partners, LLC (2007-2010); Partner, Northampton Capital Management, LLC (2004-2010); Trustee of Aston Funds (26 portfolios). |
|
* The Fund Complex consists of Managers AMG Funds, The Managers Funds, Managers Trust I and Managers Trust II. |
|
| Interested Trustees |
|
Each Trustee in the following table is an “interested person” of the Trust within the meaning of the 1940 Act. Ms. Carsman is an interested person of the Trust within the meaning of the 1940 Act by virtue of her position with, and interest in securities of, AMG, and her former position as Chief Legal Officer of the Trust. |
Name, Date of Birth, Number of Funds Overseen in Fund Complex* | | Principal Occupation(s) During Past 5
Years and Other Directorships Held by Trustee |
Christine C. Carsman, 4/02/52 • Trustee since 2011 • Oversees 40 Funds in Fund Complex | | Senior Vice President and Deputy General Counsel, Affiliated Managers Group, Inc. (2011-Present); Senior Vice President and Chief Regulatory Counsel, Affiliated Managers Group, Inc. (2007-2011); Vice President and Chief Regulatory Counsel, Affiliated Managers Group, Inc. (2004-2007); Secretary and Chief Legal Officer, Managers AMG Funds, The Managers Funds, Managers Trust I and Managers Trust II (2004-2011); Senior Counsel, Vice President and Director of Operational Risk Management and Compliance, Wellington Management Company, LLP (1995-2004). |
|
| Officers |
| |
Name, Date of Birth, Position(s) Held with Fund and Length of Time Served | | Principal Occupation(s) During Past 5
Years |
Keitha L. Kinne, 5/16/58 • President since 2012 • Chief Operating Officer since 2007 | | Managing Partner and Chief Operating Officer, Managers Investment Group LLC (2007-Present); Chief Operating Officer, The Managers Funds, Managers AMG Funds and Managers Trust II (2007-Present); Chief Investment Officer, Managers Investment Group LLC (2008-Present); President, Managers Distributors, Inc. (2012-Present); Managing Director, Legg Mason & Co., LLC (2006-2007); Managing Director, Citigroup Asset Management (2004-2006). |
| |
Lewis Collins, 2/22/66 • Secretary since 2011 • Chief Legal Officer since 2011 | | Senior Vice President and Senior Counsel, Affiliated Managers Group, Inc. (2010-Present); Vice President and Senior Counsel, Affiliated Managers Group, Inc. (2006-2010); Senior Counsel, Affiliated Managers Group, Inc. (2002-2006); Attorney, Ropes & Gray LLP (1998-2002). |
Trustees and Officers (continued)
| | |
Name, Date of Birth, Position(s) Held with Fund and Length of Time Served | | Principal Occupation(s) During Past 5
Years |
| |
Donald S. Rumery, 5/29/58 • Chief Financial Officer since 2007 • Treasurer since 2000 | | Senior Vice President, Managers Investment Group LLC (2005-Present); Treasurer, The Managers Funds (1995-Present); Treasurer, Managers AMG Funds (1999-Present); Treasurer, Managers Trust II (2000-Present); Chief Financial Officer, The Managers Funds, Managers AMG Funds and Managers Trust II (2007-Present); Treasurer and Chief Financial Officer, Managers Distributors, Inc. (2000-2012); Vice President, The Managers Funds LLC,
(1994-2004). |
| |
John J. Ferencz, 3/09/62 • Chief Compliance Officer since 2010 | | Vice President, Legal and Compliance, Managers Investment Group LLC (2010-Present); Senior Compliance Analyst, Mutual Funds and Regulatory, GE Asset Management Incorporated
(2005-2010). |
| | |
Name, Date of Birth, Position(s) Held with Fund and Length of Time Served | | Principal Occupation(s) During Past 5
Years |
| |
Michael S. Ponder, 9/12/73 • Assistant Secretary since 2011 | | Senior Vice President and Counsel, Managers Investment Group LLC (2011-Present); Attorney, DeNovo Legal (2009-2010); Vice President, Credit Suisse (2007-2009); Associate, Willkie Farr & Gallagher LLP (2006-2007). |
| |
Matthew B. Wallace, 11/24/80 • Anti-Money Laundering Compliance Officer since 2012 | | Senior Associate, Legal and Compliance, Managers Investment Group LLC (2012-Present); Associate, Legal and Compliance, Managers Investment Group LLC (2010-2012); Compliance Specialist, Calamos Advisors LLC
(2007-2010). |
Annual Renewal of Investment Management and SubAdvisory Agreement
On June 20-21, 2013, the Board of Trustees, including a majority of the Trustees who are not “interested persons” of the Trust (the “Independent Trustees”), approved the Investment Management Agreement with the Investment Manager for Managers PIMCO Bond Fund (the “Fund”) and the Subadvisory Agreement for the Subadvisor of the Fund. The Independent Trustees were separately represented by independent counsel in connection with their consideration of the approval of these agreements. In considering the Investment Management and Subadvisory Agreements, the Trustees reviewed a variety of materials relating to the Fund, the Investment Manager and the Subadvisor, including comparative performance, fee and expense information for an appropriate peer group of similar mutual funds (the “Peer Group”), performance information for the relevant benchmark index (the “Fund Benchmark”) and, with respect to the Subadvisor, comparative performance information for an appropriate peer group of managed accounts, and, as to all other matters, other information provided to them on a periodic basis throughout the year, as well as information provided in connection with the meetings of June 20-21, 2013, regarding the nature, extent and quality of services provided by the Investment Manager and the Subadvisor under their respective agreements. Prior to voting, the Independent Trustees: (a) reviewed the foregoing information with their independent legal counsel and with management; (b) received materials from their independent legal counsel discussing the legal standards applicable to their consideration of the Investment Management Agreement and the Subadvisory Agreement; and (c) met with their independent legal counsel in private sessions at which no representatives of management were present.
Nature, extent, and quality of services.
In considering the nature, extent and quality of the services provided by the Investment Manager, the Trustees reviewed information relating to the Investment Manager’s operations and personnel. Among other things, the Investment Manager provided financial information, biographical information on its supervisory and professional staff and descriptions of its organizational and management structure. The Trustees also took into account information provided periodically throughout the previous year by the Investment Manager in Board meetings relating to the performance of its duties with respect to the Fund and the Trustees’ knowledge of the Investment Manager’s management and the quality of the performance of the Investment Manager’s duties. In the course of their deliberations regarding the Investment Management Agreement, the Trustees evaluated, among other things: (a) the extent and quality of the Investment Manager’s oversight of the operation and management of the Fund; (b) the quality of the search, selection and monitoring services performed by the Investment Manager in overseeing the portfolio management responsibilities of the Subadvisor; (c) the Investment Manager’s ability to supervise the Fund’s other service providers; and (d) the Investment Manager’s compliance program. The Trustees also took into account that, in performing its functions under the Investment Management Agreement and supervising the Subadvisor, the Investment Manager: performs periodic detailed analysis and reviews of the performance by the Subadvisor of its obligations to the Fund, including without limitation a review of the Subadvisor’s investment performance in respect of the Fund; prepares and presents periodic reports to the Board regarding the investment performance of the Subadvisor and other information regarding the Subadvisor, at such times and in such forms as the Board may reasonably request; reviews and considers any changes in the personnel of the Subadvisor responsible for performing the Subadvisor’s obligations and makes appropriate reports to the Board; reviews and considers any changes in the ownership or senior management of the Subadvisor and makes appropriate reports to the Board; performs periodic in-person or telephonic diligence meetings, including with respect to compliance matters, with representatives of the Subadvisor; assists the Board and management of the Trust in developing and reviewing information with respect to the annual consideration of the Subadvisory Agreement; prepares recommendations with respect to the continued retention of the Subadvisor or the replacement of the Subadvisor; identifies potential successors to or replacements of the Subadvisor or potential additional Subadvisors, performs appropriate due diligence, and develops and presents to the Board a recommendation as to any such successor, replacement, or additional Subadvisor; designates and compensates from its own resources such personnel as the Investment Manager may consider necessary or appropriate to the performance of its services; and performs such other review and reporting functions as the Board shall reasonably request consistent with the Investment Management Agreement and applicable law. The Trustees also took into account the financial condition of the Investment Manager with respect to its ability to provide the services required under the Investment Management Agreement and the Investment Manager’s undertaking to maintain a contractual expense limitation for the Fund. The Trustees also considered the Investment Manager’s risk management processes.
The Trustees also reviewed information relating to the Subadvisor’s operations and personnel and the investment philosophy, strategies and techniques (the “Investment Strategy”) used in managing the Fund. Among other things, the Trustees reviewed biographical information on portfolio management and other professional staff, information regarding the Subadvisor’s organizational and management structure and the Subadvisor’s brokerage policies and practices. The Trustees considered specific information provided regarding the experience of the individual at the Subadvisor with portfolio management responsibility for the Fund, including the information set forth in the Fund’s prospectus and statement of additional information. In the course of their deliberations, the Trustees evaluated, among other things: (a) the services rendered by the Subadvisor in the past; (b) the qualifications and experience of the Subadvisor’s personnel; and (c) the Subadvisor’s compliance program. The Trustees also took into account the financial condition of the Subadvisor with respect to its ability to provide the services required under the Subadvisory Agreement. The Trustees also considered the Subadvisor’s risk management processes.
Annual Renewal of Investment Management and SubAdvisory Agreement
Performance.
As noted above, the Board considered the Fund’s net performance during relevant time periods as compared to the Fund’s Peer Group and Fund Benchmark and considered the Subadvisor’s performance as compared to an appropriate peer group of managed accounts and also considered the gross performance of the Fund as compared to the Subadvisor’s relevant performance composite that utilizes the same investment strategy and approach and noted that the Board reviews on a quarterly basis detailed information about the Fund’s performance results, portfolio composition and Investment Strategies. The Board noted the Investment Manager’s expertise and resources in monitoring the performance, investment style and risk-adjusted performance of the Subadvisor. The Board was mindful of the Investment Manager’s attention to monitoring the Subadvisor’s performance with respect to the Fund and its discussions with management regarding the factors that contributed to the performance of the Fund.
Among other information relating to the Fund’s performance, the Trustees noted that the Fund’s performance for the 1-year, 3-year, 5-year and 10-year periods ended March 31, 2013 was above the median performance of the Peer Group and above the performance of the Fund Benchmark, the Barclays U.S. Aggregate Bond Index. The Board took into account management’s discussion of the Fund’s more recent performance. The Trustees also took into account the fact that the Fund ranked in the top quintile of the Peer Group for the 10-year period. The Trustees concluded that the Fund’s performance has been satisfactory.
Advisory and Subadvisory Fees and Profitability.
In considering the reasonableness of the advisory fee charged by the Investment Manager for managing the Fund, the Trustees noted that the Investment Manager, and not the Fund, is responsible for paying the fees charged by the Fund’s Subadvisor and, therefore, that the fees paid to the Investment Manager cover the cost of providing portfolio management services as well as the cost of providing search, selection and monitoring services in operating a “manager-of-managers” complex of mutual funds. The Trustees also considered the amount of the advisory fee retained by the Investment Manager after payment of the subadvisory fee with respect to the Fund. The Trustees concluded that, in light of the additional high quality supervisory services provided by the Investment Manager and the fact that the subadvisory fees are paid out of the advisory fee, the advisory fee payable by the Fund to the Investment Manager can reasonably be expected to exceed the median advisory fee for the Peer Group, which consists of many funds that do not operate with a manager-of-managers structure. In this regard, the Trustees also noted that the Investment Manager has undertaken to maintain a contractual expense limitation for the Fund.
In considering the reasonableness of the advisory fee payable to the Investment Manager, the Trustees also reviewed information provided by the Investment Manager setting forth all revenues and other benefits, both direct and indirect (including any so-called “fallout benefits” such as reputational value derived from the Investment Manager serving as Investment Manager to the Fund), received by the Investment Manager and its affiliates attributable to managing the Fund and all the mutual funds in the Managers Family of Funds, the cost of providing such services and the resulting profitability to the Investment Manager and its affiliates from these relationships. The Trustees also noted the current and potential asset levels of the Fund and the willingness of the Investment Manager to waive fees and pay expenses for the Fund from time to time as a means of limiting the total expenses of the Fund. The Trustees also considered management’s discussion of the current asset level of the Fund, and considered the impact on profitability of the current asset level and any future growth of assets of the Fund. The Board took into account management’s discussion of the current advisory fee structure, and, as noted above, the services the Investment Manager provides in performing its functions under the Investment Management Agreement and supervising the Subadvisor. In this regard, the Trustees noted that, unlike a mutual fund that is managed by a single investment adviser, the Fund operates in a manager-of-managers structure. Based on the foregoing, the Trustees concluded that the profitability to the Investment Manager is reasonable and that the Investment Manager is not realizing material benefits from economies of scale that would warrant adjustments to the advisory fees for the Fund at this time. With respect to economies of scale, the Trustees also noted that as the Fund’s assets increase over time, the Fund may realize other economies of scale to the extent that the increase in assets is proportionally greater than the increase in certain other expenses.
In considering the reasonableness of the fee payable by the Investment Manager to the Subadvisor, the Trustees relied on the ability of the Investment Manager to negotiate the terms of the Subadvisory Agreement at arm’s length as part of the manager-of-managers structure, noting that the Subadvisor is not affiliated with the Investment Manager. In addition, the Trustees considered other potential benefits of the subadvisory relationship to the Subadvisor, including, among others, the indirect benefits that the Subadvisor may receive from the Subadvisor’s relationship with the Fund, including any so-called “fallout benefits” to the Subadvisor, such as reputational value derived from the Subadvisor serving as Subadvisor to the Fund, which bears the Subadvisor’s name. In addition, the Trustees noted that the subadvisory fees are paid by the Investment Manager out of its advisory fee. As a consequence of all of the foregoing, the cost of services to be provided by the Subadvisor and the profitability to the Subadvisor of its relationship with the Fund were not material factors in the Trustees’ deliberations. For similar reasons, the Trustees did not consider potential economies of scale in the management of the Fund by the Subadvisor to be a material factor in their deliberations at this time.
The Trustees noted that the Fund’s advisory fees (which include both the advisory and administration fee) and total expenses (net of applicable expense waivers/reimbursements) as of March 31, 2013 were higher and lower, respectively, than the average for the Peer Group.
Annual Renewal of Investment Management and SubAdvisory Agreement
The Trustees took into account the fact that the Investment Manager has contractually agreed, through March 1, 2014, to limit the Fund’s net annual operating expenses (subject to certain excluded expenses) to 0.58%. The Trustees also took into account management discussion of the Fund’s expenses. The Trustees concluded that, in light of the nature, extent and quality of the services provided by the Investment Manager and the Subadvisor, the foregoing expense limitation and the considerations noted above with respect to the Subadvisor and the Investment Manager, the Fund’s advisory fees, including subadvisory fees, are reasonable.
****
After consideration of the foregoing, the Trustees also reached the following conclusions (in addition to the conclusions discussed above) regarding the Investment Management Agreement and the Subadvisory Agreement: (a) the Investment Manager and the Subadvisor have demonstrated that they possess the capability and resources to perform the duties required of them under the Investment Management Agreement and the Subadvisory Agreement; (b) the Subadvisor’s Investment Strategy is appropriate for pursuing the Fund’s investment objectives; and (c) the Investment Manager and the Subadvisor maintain appropriate compliance programs.
Based on all of the above-mentioned factors and related conclusions, with no single factor or conclusion being determinative and with each Trustee not necessarily attributing the same weight to each factor, the Trustees concluded that approval of the Investment Management Agreement and the Subadvisory Agreement would be in the best interests of the Fund and its shareholders. Accordingly, on June 20-21, 2013, the Trustees, including a majority of the Independent Trustees, voted to approve the Investment Management Agreement and the Subadvisory Agreement for the Fund.
Proxy Results
A special meeting of shareholders of Managers Trust I was held on July 2, 2013. With respect to the proposals to amend certain “fundamental” investment restrictions of the Funds, the meeting was adjourned to August 20, 2013 and October 22, 2013 with respect to Managers PIMCO Bond Fund (the “Fund”). With respect to the proposals to amend and restate the Amended and Restated Declaration of Trust the meeting was adjourned to August 20, 2013 and October 22, 2013, with respect to the Fund. The proposals and results of the votes are summarized below.
| | | | | | | | |
| | | All Funds in Trust | |
| Managers Trust I | | For | | | Withheld | |
| Election of Directors | | (in $NAV, rounded to the nearest dollar) | |
Bruce Bingham | | $ | 130,861,528 | | | $ | 4,865,035 | |
William E. Chapman, II | | | 130,740,436 | | | | 4,986,127 | |
Edward J. Kaier | | | 130,926,087 | | | | 4,800,475 | |
Steven J. Paggioli | | | 130,924,285 | | | | 4,802,277 | |
Erik Rakowski | | | 130,841,911 | | | | 4,884,651 | |
Thomas R. Schneeweis | | | 130,778,924 | | | | 4,947,639 | |
Christine C. Carsman | | | 131,045,716 | | | | 4,680,846 | |
Kurt Keilhacker | | | 130,714,266 | | | | 5,012,297 | |
Richard F. Powers III | | | 130,640,619 | | | | 5,085,943 | |
Victoria Sassine | | | 130,736,799 | | | | 4,989,763 | |
| | | | | | | | | | | | | | | | |
| | | Managers PIMCO Bond Fund | |
| | | For | | | Against | | | Abstain | | | Broker Non-Votes | |
To amend “fundamental” restrictions of the Funds with
respect to: | | (in $NAV, rounded to the nearest dollar) | |
Issuance of Senior Securities | | $ | 69,454,794 | | | $ | 4,539,549 | | | $ | 5,503,648 | | | $ | 24,536,306 | |
Borrowing | | | 68,202,816 | | | | 5,646,988 | | | | 5,648,187 | | | | 24,536,306 | |
Lending | | | 68,695,418 | | | | 5,142,934 | | | | 5,659,641 | | | | 24,536,306 | |
The Underwriting of Securities | | | 69,028,121 | | | | 4,829,579 | | | | 5,640,291 | | | | 24,536,306 | |
Purchasing and Selling Commodities | | | 69,088,982 | | | | 4,757,887 | | | | 5,651,123 | | | | 24,536,306 | |
Purchasing and Selling Real Estate | | | 68,943,064 | | | | 4,933,942 | | | | 5,620,966 | | | | 24,536,306 | |
Diversification of Investments | | | 70,530,615 | | | | 3,422,122 | | | | 5,545,253 | | | | 24,536,306 | |
Concentrating Investments in a Particular Industry | | | 67,955,953 | | | | 5,965,138 | | | | 5,576,901 | | | | 24,536,306 | |
| | | | | | | | | | | | | | | | |
| | | Managers PIMCO Bond Fund | |
| | | For | | | Against | | | Abstain | | | Broker Non-Votes | |
To amend and restate the Agreement and Declaration of the Trust
relating to: | | (in $NAV, rounded to the nearest dollar) | |
Declaration of Trust Amendment Procedures | | $ | 68,347,349 | | | $ | 5,177,119 | | | $ | 5,973,527 | | | $ | 24,536,302 | |
Merger, Consolidation, Sale of Assets and Termination of Trust, | | | | | | | | | | | | | | | | |
Series or Classes | | | 68,787,662 | | | | 4,601,355 | | | | 6,108,979 | | | | 24,536,302 | |
Other Changes | | | 68,418,577 | | | | 4,773,670 | | | | 6,305,738 | | | | 24,536,302 | |
Proxy Results (continued)
| | | | | | | | | | | | | | | | |
| | | 8All Funds in Trust | |
| | | For | | | Against | | | Abstain | | | Broker Non-Votes | |
To amend and restate the Agreement and Declaration of the Trust
relating to: | | (in $NAV, rounded to the nearest dollar) | |
Declaration of Trust Amendment Procedures | | $ | 192,290,005 | | | $ | 7,507,459 | | | $ | 7,994,207 | | | $ | 31,541,556 | |
Merger, Consolidation, Sale of Assets and Termination of Trust, | | | | | | | | | | | | | | | | |
Series or Classes | | | 124,093,865 | | | | 6,962,787 | | | | 8,955,316 | | | | 31,541,556 | |
Other Changes | | | 122,906,748 | | | | 7,515,009 | | | | 9,223,126 | | | | 31,541,556 | |
Investment Manager and Administrator
Managers Investment Group LLC
800 Connecticut Ave.
Norwalk, CT 06854
(800) 835-3879
Distributor
Managers Distributors, Inc.
800 Connecticut Ave.
Norwalk, CT 06854
(800) 835-3879
Subadvisor
Pacific Investment Management Co. LLC (“PIMCO”)
840 Newport Center Drive
Newport Beach, CA 92660
Custodian
The Bank of New York Mellon
2 Hanson Place
Brooklyn, NY 11217
Legal Counsel
Ropes & Gray LLP
Prudential Tower, 800 Boylston Street
Boston, MA 02199-3600
Transfer Agent
BNY Mellon Investment Servicing (US) Inc.
Attn: Managers
P.O. Box 9769
Providence, RI 02940
(800) 548-4539
For ManagersChoiceTM Only
Managers
c/o BNY Mellon Investment Servicing (US) Inc.
P.O. Box 9847
Providence, Rhode Island 02940-8047
(800) 358-7668
THIS PAGE INTENTIONALLY LEFT BLANK
THIS PAGE INTENTIONALLY LEFT BLANK
THIS PAGE INTENTIONALLY LEFT BLANK
MANAGERSAND MANAGERS AMG FUNDS
| | | | | | |
| EQUITY FUNDS | | | | BALANCED FUNDS |
BRANDYWINE BRANDYWINE BLUE BRANDYWINE ADVISORS MIDCAP GROWTH Friess Associates, LLC CADENCE CAPITAL APPRECIATION CADENCE MID-CAP CADENCE EMERGING COMPANIES Cadence Capital Management, LLC ESSEX SMALL/MICRO CAP GROWTH Essex Investment Management Co., LLC FQ TAX-MANAGED U.S. EQUITY FQ U.S. EQUITY First Quadrant, L.P. FRONTIER SMALL CAP GROWTH Frontier Capital Management Company, LLC GW&K SMALL CAP EQUITY Gannett Welsh & Kotler, LLC MICRO-CAP Lord, Abbett & Co. LLC WEDGE Capital Management L.L.P. Next Century Growth Investors LLC RBC Global Asset Management (U.S.) Inc. REAL ESTATE SECURITIES CenterSquare Investment Management, Inc. | | RENAISSANCE LARGE CAP GROWTH Renaissance Group LLC SKYLINE SPECIAL EQUITIES PORTFOLIO Skyline Asset Management, L.P. SPECIAL EQUITY Ranger Investment Management, L.P. Lord, Abbett & Co. LLC Smith Asset Management Group, L.P. Federated MDTA LLC SYSTEMATIC VALUE SYSTEMATIC MID CAP VALUE Systematic Financial Management, L.P. TIMESSQUARE INTERNATIONAL SMALL CAP TIMESSQUARE MID CAP GROWTH TIMESSQUARE SMALL CAP GROWTH TSCM GROWTH EQUITY TimesSquare Capital Management, LLC TRILOGY GLOBAL EQUITY TRILOGY EMERGING MARKETS EQUITY TRILOGY INTERNATIONAL SMALL CAP Trilogy Global Advisors, L.P. YACKTMAN YACKTMAN FOCUSED Yacktman Asset Management LP | | | | CHICAGO EQUITY PARTNERS BALANCED |
| | | | | Chicago Equity Partners, LLC |
| | | | | |
| | | | | ALTERNATIVE FUNDS |
| | | | | FQ GLOBAL ALTERNATIVES |
| | | | | FQ GLOBAL ESSENTIALS |
| | | | | First Quadrant, L.P. |
| | | | | |
| | | | | INCOME FUNDS |
| | | | | BOND (MANAGERS) GLOBAL INCOME OPPORTUNITY Loomis, Sayles & Co., L.P. BOND (MANAGERS PIMCO) Pacific Investment Management Co. LLC GW&K MUNICIPAL BOND GW&K FIXED INCOME GW&K MUNICIPAL ENHANCED YIELD Gannett Welsh & Kotler, LLC HIGH YIELD J.P. Morgan Investment Management LLC INTERMEDIATE DURATION GOVERNMENT SHORT DURATION GOVERNMENT Amundi Smith Breeden LLC |
| | | | |
| | | | |
| | | | |
| | | | |
| | | | |
| | | | |
| | | | |
| | | | |
| | | | |
| | | | |
| | | | |
| | | | |
| | | | |
| | | | |
| | | | |
| | | | |
| | | | |
| | | | |
| | | | | |
| | | | | |
| | | | | |
| | | | | | | |
This report is prepared for the Fund’s shareholders. It is authorized for distribution to prospective investors only when preceded or accompanied by an effective prospectus. To receive a free copy of the prospectus or Statement of Additional Information, which includes additional information about Fund Trustees, please contact us by calling 800.835.3879. Distributed by Managers Distributors, Inc., member FINRA. A description of the policies and procedures each Fund uses to vote its proxies is available: (i) without charge, upon request, by calling 800.835.3879, or (ii) on the Securities and Exchange Commission’s (SEC) Web site at www. sec.gov. For information regarding each Fund’s proxy voting record for the 12-month period ended June 30, call 800.835.3879 or visit the SEC Web site at www.sec.gov. The Fund files its complete schedule of portfolio holdings with the SEC for the first and third quarters of each fiscal year on Form N-Q. The Funds’ Forms N-Q are available on the SEC’s Web site at www.sec.gov. A Fund’s Forms N-Q may be reviewed and copied at the SEC’s Public Reference Room in Washington, DC. Information on the operation of the Public Reference Room may be obtained by calling 800.SEC.0330. To review a complete list of the Funds’ portfolio holdings, or to view the most recent quarterly holdings report, semiannual report, or annual report, please visit www.managersinvest.com. | | | | |
| www.managersinvest.com | | | | | | |

Managers Funds
Annual Report — October 31, 2013
| | | | |
| TABLE OF CONTENTS | | Page | |
| |
LETTER TO SHAREHOLDERS | | | 2 | |
| |
ABOUT YOUR FUND’S EXPENSES | | | 3 | |
| |
PORTFOLIO MANAGER’S COMMENTS, FUND SNAPSHOTS, AND SCHEDULE OF PORTFOLIO INVESTMENTS | | | | |
| |
NOTES TO SCHEDULE OF PORTFOLIO INVESTMENTS | | | 13 | |
| |
FINANCIAL STATEMENTS | | | | |
| |
Statement of Assets and Liabilities | | | 14 | |
Balance sheets, net asset value (NAV) per share computation and cumulative undistributed amounts | | | | |
| |
Statement of Operations | | | 15 | |
Detail of sources of income, expenses, and realized and unrealized gains (losses) during the fiscal year | | | | |
| |
Statements of Changes in Net Assets | | | 16 | |
Detail of changes in assets for the past two fiscal years | | | | |
| |
FINANCIAL HIGHLIGHTS | | | 17 | |
Historical net asset values per share, distributions, total returns, income and expenseratios, turnover ratios and net assets | | | | |
| |
NOTES TO FINANCIAL STATEMENTS | | | 18 | |
Accounting and distribution policies, details of agreements and transactions with Fund management and affiliates, and descriptions of certain investment risks | | | | |
| |
REPORT OF INDEPENDENT REGISTERED PUBLIC ACCOUNTING FIRM | | | 22 | |
| |
TRUSTEES AND OFFICERS | | | 23 | |
| |
ANNUAL RENEWAL OF INVESTMENT MANAGEMENT AND SUBADVISORY AGREEMENTS | | | 25 | |
Nothing contained herein is to be considered an offer, sale or solicitation of an offer to buy shares of any series of the Managers Family of Funds. Such offering is made only by Prospectus, which includes details as to offering price and other material information.
Letter to Shareholders
Dear Shareholder:
Thank you for your investment in The Managers Funds. Our foremost goal at Managers Investment Group (“MIG”) is to provide investment products and solutions that help our shareholders and clients successfully reach their investment goals and objectives. We do this by offering a broad selection of Funds managed by a collection of Affiliated Managers Group’s (“AMG”) affiliate investment boutiques, along with a complementary series of open-architecture mutual funds.
The past year has been an exciting one for us at MIG. We were pleased to welcome the Brandywine Funds into the Managers Fund family several months ago. We have been excited to begin this new chapter in the 27-year history of the Brandywine Funds, while maintaining shareholders’ access to the same investment team that has guided the Brandywine Funds since inception using its research-driven investment approach.
We announced effective November 1, 2013 that the GW&K Small Cap Equity Fund would be closed to new investors with certain limited exceptions. The team at GW&K manages a total of $2.3 billion (as of October 31, 2013) in small-capitalization equities and closing the Fund to new investors allows the team to continue to execute on the investment process that has been effective for the team for more than a decade. We will continue to make decisions such as these that we believe are in the best interest of our shareholders.
Risky assets have done quite well thus far in 2013, with U.S. equity markets surpassing all-time highs. Ongoing global monetary easing, a low-yield environment, and healthy U.S. economic growth are supporting investor appetite for risk assets. Despite improving investor sentiment, risks remain, including uncertainty surrounding the Fed’s eventual exit from its ultra-accommodative monetary policy, ongoing fiscal headwinds in the U.S. and slower growth in emerging markets. Nevertheless, we are optimistic about the prospects for the upcoming year and we are confident that our Funds are well positioned to weather an uncertain economic environment.
We thank you for your continued confidence and investment in The Managers Funds. You can rest assured that under all market conditions our team is focused on delivering excellent investment management services for your benefit.
Respectfully,

Keitha Kinne
President
The Managers Funds
2
About Your Fund’s Expenses
|
As a shareholder of a Fund, you may incur two types of costs: (1) transaction costs, which may include sales charges (loads) on purchase payments; redemption fees; and exchange fees; and (2) ongoing costs, including management fees; distribution (12b-1) fees; and other Fund expenses. This example is intended to help you understand your ongoing costs (in dollars) of investing in the Fund and to compare these costs with the ongoing costs of investing in other mutual funds. The example is based on $1,000 invested at the beginning of the period and held for the entire period as indicated below. Actual Expenses The first line of the following table provides information about the actual account values and actual expenses. You may use the information in this line, together with the amount you invested, to estimate the expenses that you paid over the period. Simply divide your account value by $1,000 (for example, an $8,600 account value divided by $1,000 = 8.6), then multiply the result by the number in the first line under the heading entitled “Expenses Paid During the Period” to estimate the expenses you paid on your account during this period. Hypothetical Example for Comparison Purposes The second line of the following table provides information about hypothetical account values and hypothetical expenses based on the Fund’s actual expense ratio and an assumed annual rate of return of 5% before expenses, which is not the Fund’s actual return. The hypothetical account values and expenses may not be used to estimate the actual ending account balance or expenses you paid for the period. You may use this information to compare the ongoing costs of investing in the Fund and other funds by comparing this 5% hypothetical example with the 5% hypothetical examples that appear in the shareholder reports of other funds. Please note that the expenses shown in the table are meant to highlight your ongoing costs only and do not reflect any transactional costs, such as sales charges (loads), redemption fees, or exchange fees. Therefore, the second line of the table is useful in comparing ongoing costs only, and will not help you determine the relative total costs of owning different funds. |
| | | | | | | | | | | | | | | | |
Six Months Ended
October 31, 2013 | | Expense
Ratio for
the Period | | | Beginning
Account Value
05/01/13 | | | Ending
Account Value
10/31/13 | | | Expenses
Paid During
the Period* | |
Managers California Intermediate Tax-Free Fund | |
Based on Actual Fund Return | | | 0.55 | % | | $ | 1,000 | | | $ | 992 | | | $ | 2.76 | |
Hypothetical (5% return before expenses) | | | 0.55 | % | | $ | 1,000 | | | $ | 1,022 | | | $ | 2.81 | |
| * | Expenses are equal to the Fund’s annualized expense ratio multiplied by the average account value over the period, multiplied by the number of days in the most recent fiscal half-year (184), then divided by 365. |
Managers California Intermediate Tax-Free Fund
Portfolio Manager’s Comments
THE PORTFOLIO MANAGER
The Managers California Intermediate Tax-Free Fund’s (the “Fund”) objective is to achieve income free from Federal income taxes and California state income taxes, including the Alternative Minimum Tax (“AMT”).
The Fund invests at least 80% of its total assets in intermediate-term California municipal bonds that are free from both Federal and California state income taxes, including the AMT. The Fund’s securities will have quality ratings comparable to the four highest rating categories of Moody’s Investors Services, Inc. (“Moody’s”) or Standard & Poor’s Corporation (“S&P”). The dollar-weighted average maturity of these intermediate-term securities is normally three-to-10 years. The Fund’s benchmark is the Barclays 5-Year Municipal Bond Index.
The Portfolio Manager
Miller Tabak Asset Management (“MTAM”), the subadvisor for the Fund, was founded in early 2008, and is a division of Miller Tabak + Co. LLC (“Miller Tabak”). Miller Tabak is a 30 year-old institutional trading firm that specializes in the discrete handling of stock purchases and sales, portfolio rebalancing, and listed options. MTAM focuses exclusively on managing municipal bond portfolios and is based in New York City.
Philosophy
The MTAM team focuses on purchasing municipal credits exhibiting improving credit characteristics while maintaining geographic and economic diversity as key elements in the portfolio-construction process. MTAM believes proactive total-return portfolio management offers greater potential rewards in an increasingly inefficient municipal bond market. Achieving reasonable and consistent growth of clients’ capital without taking elevated levels of principal risk is MTAM’s objective.
The California municipal bond market is a unique sector within the domestic fixed-income universe, consisting of over 6,000 issuers with distinct security structures and varying credit risks. MTAM seeks to exploit these nuances through a disciplined, risk-controlled, relative-value investment management process.
Process
| | • | | Active total-return portfolio management is MTAM’s central theme for achieving objectives that benefit the Fund |
| | • | | MTAM is committed to extensive, proprietary, and original research and analysis |
| | • | | MTAM follows a disciplined and well-defined investment process |
MTAM’s investment process can be divided into two distinct parts. The first part focuses on risk analysis. MTAM’s risk analysis has two components, interest-rate analysis and credit-risk analysis. MTAM strives to control interest-rate volatility by defining the appropriate ranges for duration and maturity based on the Fund’s predetermined liquidity requirements, the specific risk profile, and the given market environment.
The second component of MTAM’s risk analysis focuses on credit risk. MTAM applies rigorous standards for tax-exempt issuers, continually reviews financial statements, and closely monitors rating
agency commentary and relative trading spreads in the secondary market. Michael Pietronico, the Fund’s portfolio manager, has 17 years experience managing municipal bond portfolios, which gives him excellent knowledge of the key factors influencing the municipal bond market and an experienced eye to identify high-quality California municipal bonds.
The second major part of MTAM’s investment process assesses relative value. MTAM starts by creating expectations for the slope of the yield curve and yield spreads going forward. Once forecasts are finalized, MTAM assesses how its forecast and other potential outcomes may affect market prices. This ultimately helps MTAM identify what securities are most attractively valued and offer the best risk-adjusted return. MTAM also uses its market outlook to determine what sectors of the municipal market will add to and detract from performance and adjust weightings accordingly. Lastly, credit research at the security level is undertaken to analyze credit quality, yield, duration, structure, and call protection in order to assess a security’s potential contribution to the Fund.
Buy Discipline
There are three parts to MTAM’s buy discipline:
Supply Analysis
Macro View
Aggregate Municipal Supply
Secondary Market Supply
Dealer Inventories
Micro View
Supply/Demand Per State
Credit Analysis
Macro View
Major Economic Trends in Place
Micro View
Legal Structure of Securities
Service-Area Economic Performance
Project and System Operations
Individual Bond Structure Analysis
Prepayment Risk
Original Issue Discount
Reinvestment Risk
Municipal Bond Credit Research – Credit Review Process
1. Comprehensive bottom-up analysis of issuer, pledged security, and historical economic performance
2. Site visits and conference calls with key public officials
3. Comprehensive financial statement review with feasibility analysis
4
Managers California Intermediate Tax-Free Fund
Portfolio Manager’s Comments (continued)
4. Negotiate with underwriters to strengthen key security covenants and secure optimal pricing
5. Limits are implemented upon credit approval exposure
Credit Surveillance
| | • | | Database is maintained for holdings by issuer and Fund exposure |
| | • | | The relevant performance statistics are tracked on a monthly, quarterly, and annual basis to help capture meaningful trends, for example trading spreads |
| | • | | Outside resources are utilized; for example financial statement repositories, industry publications, internet search engines, and rating agencies |
Sell Discipline
An individual security may become a candidate for sale for any of the following reasons:
| | • | | The issuers investment fundamentals begin to deteriorate |
| | • | | To take advantage of more attractive yield opportunities |
| | • | | The individual security no longer appears to meet the portfolio’s investment objective(s) |
| | • | | To meet liquidity needs |
| | • | | To help shorten or lengthen the overall duration of the portfolio |
The Year in Review
For the fiscal year ended October 31, 2013, the Managers California Intermediate Tax-Free Fund returned 1.42%. The Fund’s benchmark, the Barclays 5-Year Municipal Bond Index, returned 0.78% during the same time period. Early in the year, most tax-free bond investors realized moderate gains as excess market supply in the month of March exerted downward pressure on prices. Concerns over the Federal Reserve potentially ending their bond purchase program, and a renewed interest in the stock market by some also kept interest in municipal bonds limited. During the Spring, tax-free bond investors experienced negative returns as concerns mounted that the Federal Reserve would begin to slow their purchases of bonds in the months ahead. Fixed-income securities of all types remained under pressure as a firming in the employment picture in America led investors to conclude that interest rates were headed higher in the coming months. While longer-term maturity bonds underperformed as one would expect, it was striking to see shorter maturity bonds succumb to the selling pressure and fail to maintain their value, even as the Federal Reserve remains far away from potentially raising the overnight Federal Funds Rate. Sentiment soured quickly within the municipal market that liquidity at times was extraordinarily difficult to find. Towards the end of the fiscal year, the Federal Reserve’s decision to delay the “taper” in September brought relief to the bond markets and the Fund ended the fiscal year with a slightly positive return.
The primary factor behind the Fund’s relative performance was its modest duration. Higher interest rates did not plague this Fund as much as the yield curve steepened during this time period - this in turn kept the Fund less volatile versus other funds who ventured out further along the yield curve. The Fund’s intermediate positioning worked well during the quarter as investor demand continued to be for relatively short maturities along the municipal yield curve. The Fund’s weighting in “kicker” bonds (bonds with exercisable warrants for bond holders) which are defensive in nature due to their higher-than-market coupons and their shorter call features, was a strong contributor to relative performance versus the benchmark as they tend to outperform during periods of rising rates due to their high income producing capabilities. The Fund’s performance over the last year was modestly negatively impacted by the underweighting of “AAA” rated credits which outperformed during that time period. The California economy is performing well and this is translating into an environment where credit quality is seen as stabilizing within the state overall. However, it is the future path of U.S. Treasury rates that will most determine the performance of the market in the future.
Fund Closure
On September 20, 2013, the Fund’s Board of Trustees approved a plan to liquidate the Fund’s assets with a transition to cash beginning on or about November 1, 2013. It is expected that the cash proceeds of the liquidation, less a small amount set aside for the liabilities and debts of the Fund, will be distributed to shareholders in a complete redemption of their shares on or about November 18, 2013. If you have any questions regarding the liquidation of the Fund and your options, please contact us at (800) 835-3879 or visit www.managersinvest.com. We appreciate the opportunity to serve your investment needs and hope to continue our relationship.
The views expressed represent the opinions of Miller Tabak Asset Management as of October 31, 2013 and are not intended as a forecast or guarantee of future results, and are subject to change without notice.
CUMULATIVE TOTAL RETURN PERFORMANCE
Managers California Intermediate Tax-Free Fund’s cumulative total return is based on the daily change in net asset value (NAV), and assumes that all dividends and distributions were reinvested. This chart compares a hypothetical $10,000 investment made in Managers California Intermediate Tax-Free Fund on October 31, 2003 to a $10,000 investment made in the Barclays 5-Year Municipal Bond Index for the same time period. Performance for periods longer than one year is annualized. The graph and table do not reflect the deduction of taxes that a shareholder would pay on a Fund distribution or redemption of shares. The listed returns for the Fund are net of expenses and the returns for the index exclude expenses. Past performance is not indicative of future results. Total returns would have been lower had certain expenses not been reduced.
Managers California Intermediate Tax-Free Fund
Portfolio Manager’s Comments (continued)
CUMULATIVE TOTAL RETURN PERFORMANCE (continued)
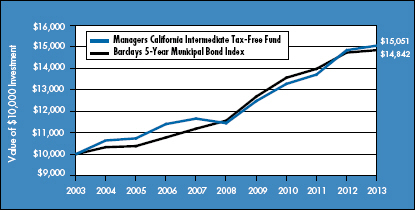
The table below shows the average annual total returns for the Managers California Intermediate Tax-Free Fund and the Barclays 5-Year Municipal Bond Index for the same time periods ended October 31, 2013.
| | | | | | | | | | | | |
| | | Average Annual Total Returns1 | |
| | | One Year | | | Five Years | | | Ten Years | |
Managers California Intermediate Tax-Free Fund2,3,4,5,6,7,8 | | | 1.42 | % | | | 5.63 | % | | | 4.17 | % |
Barclays 5-Year Municipal Bond Index9 | | | 0.78 | % | | | 5.12 | % | | | 4.03 | % |
The performance data shown represents past performance. Past performance is not a guarantee of future results. Current performance may be lower or higher than the performance data quoted. The investment return and principal value of an investment in the Fund will fluctuate so that an investor’s shares, when redeemed, may be worth more or less than their original cost. For performance information through the most recent month end, please call (800) 835-3879 or visit our Web site at www.managersinvest.com. Current net asset value per share for the Fund is available on the Fund’s Web site at www.managersinvest.com.
Investors should carefully consider the Fund’s investment objectives, risks, charges and expenses before investing. For this and other information, please call (800) 835-3879 or visit our Web site at www.managersinvest.com for a free prospectus. Read it carefully before investing or sending money. Funds are distributed by Managers Distributors, Inc., member FINRA.
| | |
1 | | Total return equals income yield plus share price change and assumes reinvestment of all dividends and capital gain distributions. Returns are net of fees and may reflect offsets of Fund expenses as described in the Prospectus. No adjustment has been made for taxes payable by shareholders on their reinvested dividends and capital gain distributions. Returns for periods greater than one year are annualized. The listed returns on the Fund are net of expenses and based on the published NAV as of October 31, 2013. All returns are in U.S. dollars ($). |
2 | | From time to time, the Fund’s advisor has waived its fees and/or absorbed Fund expenses, which has resulted in higher returns. |
3 | | The Fund is subject to risks associated with investments in debt securities, such as default risk and fluctuations in the perception of the debtor’s ability to pay their creditors. |
4 | | Changing interest rates may adversely affect the value of an investment. An increase in interest rates typically causes the value of bonds and other fixed-income securities to fall. |
5 | | The Fund is subject to risks associated from economic, political, geographic, and demographic conditions of California that could adversely affect the value of the Fund’s investment portfolio. |
6 | | Investment income may be subject to certain state and local taxes, and depending on your tax status, the federal alternative minimum tax. Capital gains are not exempt from federal income tax. |
7 | | Issuer of bonds may not be able to meet interest or principal payments when the bonds come due. |
8 | | Factors unique to the municipal bond market may negatively affect the value in municipal bonds. |
| 9 | | The Barclays 5-Year Municipal Bond Index provides a broad-based performance measure of the U.S. municipal bond market, consisting of securities with 4-6 year maturities. The Index tracks general obligation, revenue, insured, and prerefunded bonds with a minimum credit rating of Baa by Moody’s. Unlike the Fund, the Barclays 5-Year Municipal Bond Index is unmanaged, is not available for investment, and does not incur expenses. |
| | | |
| Not FDIC insured, nor bank guaranteed. May lose value. |
Managers California Intermediate Tax-Free Fund
Fund Snapshots
October 31, 2013
Portfolio Breakdown (unaudited)
| | | | |
Rating | | Managers
California
Intermediate
Tax-Free Fund** | |
Aaa | | | 1.04 | % |
Aa | | | 67.32 | % |
A | | | 31.64 | % |
| ** | As a percentage of market value of fixed income securities. |
Chart does not include equity securities
Top Ten Holdings (unaudited)
| | | | |
Security Name | | % of
Net Assets | |
San Bernardino, CA Community College District General Obligation, Election 2008, Series A, 6.375%, 08/01/26* | | | 3.2 | % |
Santa Ana, CA Unified School District General Obligation, Series A, 5.250%, 08/01/26 | | | 2.9 | |
San Francisco, CA City & County Airports Commission Revenue, Second Series Issue 32F, 5.250%, 05/01/17 (FGIC Insured) | | | 2.9 | |
Los Angeles, CA Municipal Improvement Corp. Lease Revenue, Series C, 5.000%, 09/01/18 | | | 1.8 | |
Butte-Glenn Counties, CA Community College District General Obligation, Series B, 5.000%, 08/01/23 (National Insured) | | | 1.8 | |
San Diego, CA Unified Port District Revenue, Series B, 5.000%, 09/01/23 (National Insured) | | | 1.8 | |
Alvord, CA Unified School District General Obligation, Election 2007, Series A, 5.000%, 08/01/23 (AGM Insured) | | | 1.6 | |
South Western, CA Community College District General Obligation, 5.000%, 08/01/23 (National Insured) | | | 1.6 | |
Los Angeles, CA Harbor Department Revenue, Series B, 5.000%, 08/01/20 (National Insured) | | | 1.6 | |
Port of Oakland, CA Revenue, Series B, 5.000%, 11/01/26 (National Insured) | | | 1.6 | |
| | | | |
Top Ten as a Group | | | 20.8 | % |
| | | | |
|
* Top Ten Holding at April 30, 2013 | |
Any sectors, industries, or securities discussed should not be perceived as investment recommendations. Mention of a specific security should not be considered a recommendation to buy or solicitation to sell that security. Specific securities mentioned in this report may have been sold from the Fund’s portfolio of investments by the time you receive this report.
7
Managers California Intermediate Tax-Free Fund
Schedule of Portfolio Investments
October 31, 2013
| | | | | | | | |
| | | Principal Amount | | | Value | |
Municipal Bonds - 93.4% | | | | | | | | |
Alvord, CA Unified School District General Obligation, Election 2007, Series A, 5.000%, 08/01/23 (AGM Insured) | | $ | 285,000 | | | $ | 306,079 | |
Alvord, CA Unified School District General Obligation, Series A, 5.900%, 02/01/17 (National Insured) | | | 110,000 | | | | 124,199 | |
Alvord, CA Unified School District General Obligation, Series A, 5.900%, 02/01/24 (National Insured) | | | 225,000 | | | | 262,053 | |
Anaheim, CA Public Financing Authority Electric System District Facilities, 4.000%, 10/01/17 (National Insured) | | | 20,000 | | | | 21,856 | |
Bakersfield, CA City School District, Series A, 5.250%, 11/01/21 (AGM Insured) | | | 110,000 | | | | 120,471 | |
Bakersfield, CA Wastewater Revenue, Series A, 5.000%, 09/15/19 (AGM Insured) | | | 175,000 | | | | 196,978 | |
Bakersfield, CA Wastewater Revenue, Series A, 5.000%, 09/15/22 (AGM Insured) | | | 200,000 | | | | 220,226 | |
Bakersfield, CA Wastewater Revenue, Series A, 5.000%, 09/15/26 (AGM Insured) | | | 15,000 | | | | 16,211 | |
Baldwin Park, CA Unified School District General Obligation, Election 2006, 4.300%, 08/01/24 (AGM Insured) | | | 75,000 | | | | 78,883 | |
Baldwin Park, CA Unified School District General Obligation, Election 2006, 4.750%, 08/01/25 (AGM Insured) | | | 75,000 | | | | 79,008 | |
Bay Area, CA Toll Authority Toll Bridge Revenue, Series F, 5.000%, 04/01/17 | | | 20,000 | | | | 22,977 | |
Bay Area, CA Toll Authority Toll Bridge Revenue, Series F, 5.000%, 04/01/22 | | | 35,000 | | | | 38,886 | |
Benicia, CA Unified School District General Obligation, 4.000%, 08/01/19 | | | 100,000 | | | | 107,748 | |
Bonita, CA Unified School District, Election 2004, Series B, 5.000%, 08/01/16 (FGIC Insured) | | | 50,000 | | | | 55,289 | |
Butte-Glenn Counties, CA Community College District General Obligation, Series B, 5.000%, 08/01/23 (National Insured) | | | 325,000 | | | | 342,833 | |
Cabrillo, CA Unified School District General Obligation, Series A, 5.000%, 08/01/25 | | | 25,000 | | | | 28,101 | |
Cabrillo, CA Unified School District General Obligation, Series A, 5.000%, 08/01/26 | | | 125,000 | | | | 138,608 | |
California State Department of Water Resources, Water System Revenue, Series A, 5.000%, 12/01/20 | | | 25,000 | | | | 28,816 | |
California State Educational Facilities Authority, Santa Clara University, 5.000%, 09/01/23 | | | 100,000 | | | | 115,866 | |
California State General Obligation, Various Purpose, 4.000%, 09/01/26 | | | 65,000 | | | | 67,146 | |
California State General Obligation, Various Purpose, 5.000%, 09/01/27 | | | 25,000 | | | | 27,252 | |
California State Public Works Board, Series B, 5.250%, 03/01/19 (AMBAC Insured) | | | 200,000 | | | | 200,640 | |
California State Public Works Board, Series C, 4.500%, 06/01/17 | | | 50,000 | | | | 56,691 | |
Carlsbad, CA Unified School District General Obligation, Election 2006, Series A, 5.000%, 08/01/21 (National Insured) | | | 20,000 | | | | 21,984 | |
Carlsbad, CA Unified School District General Obligation, Series B, 5.250%, 05/01/25 | | | 70,000 | | | | 76,471 | |
Centinela Valley Union High School District, Series A, 5.500%, 02/01/24 (National Insured) | | | 100,000 | | | | 115,867 | |
Central Marin, CA Sanitation Agency Revenue, 5.000%, 09/01/21 (National Insured) | | | 100,000 | | | | 108,793 | |
Central, CA Unified School District General Obligation, 5.000%, 07/01/21 (National Insured) | | | 75,000 | | | | 77,350 | |
Central, CA Unified School District General Obligation, 5.000%, 08/01/22 (Assured Guaranty) | | | 25,000 | | | | 27,561 | |
Central, CA Unified School District General Obligation, 5.000%, 07/01/23 (National Insured) | | | 25,000 | | | | 25,739 | |
Cerritos, CA Community College General Obligation, Election 2004, Series C, 5.250%, 08/01/25 | | | 15,000 | | | | 16,986 | |
Chaffey, CA Joint Union High School District General Obligation, 5.000%, 08/01/25 | | | 25,000 | | | | 27,971 | |
Citrus, CA Community College District General Obligation, Election 2004, Series B, 5.000%, 06/01/22 (National Insured) | | | 20,000 | | | | 21,877 | |
City of Costa Mesa, CA COP, Police Facility Expansion Project, 4.300%, 10/01/26 (National Insured) | | | 25,000 | | | | 25,940 | |
City of El Paso De Robles, CA General Obligation, 5.000%, 08/01/23 (National Insured) | | | 125,000 | | | | 130,658 | |
City of El Paso De Robles, CA General Obligation, 5.000%, 08/01/25 (National Insured) | | | 250,000 | | | | 259,155 | |
City of El Paso De Robles, CA General Obligation, 5.000%, 08/01/27 (National Insured) | | | 20,000 | | | | 20,526 | |
Clovis, CA Unified School District General Obligation, Election 2004, Series B, 5.000%, 08/01/23 (National Insured) | | | 115,000 | | | | 129,227 | |
Clovis, CA Unified School District General Obligation, Election 2004, Series B, 5.000%, 08/01/25 (National Insured) | | | 65,000 | | | | 69,756 | |
Colton, CA Public Financing Authority Electric Revenue, Series A, 5.000%, 04/01/26 | | | 140,000 | | | | 149,082 | |
Contra Costa County, CA Public Financing Authority Capital Projects Lease Revenue, Series A-1, 4.000%, 06/01/19 | | | 50,000 | | | | 53,608 | |
The accompanying notes are an integral part of these financial statements.
8
Managers California Intermediate Tax-Free Fund
Schedule of Portfolio Investments (continued)
| | | | | | | | |
| | | Principal Amount | | | Value | |
Municipal Bonds - 93.4% (continued) | | | | | | | | |
Corona-Norca, CA Unified School District, Election 2006, Series A, 5.000%, 08/01/24 (AGM Insured) | | $ | 75,000 | | | $ | 81,931 | |
Corona-Norca, CA Unified School District, Election 2006, Series A, 5.000%, 08/01/25 (AGM Insured) | | | 50,000 | | | | 54,433 | |
Desert Sands, CA Unified School District General Obligation, Election 2001, 5.000%, 08/01/16 | | | 50,000 | | | | 56,054 | |
Desert Sands, CA Unified School District General Obligation, Election 2001, 5.000%, 06/01/22 (AMBAC Insured) | | | 40,000 | | | | 44,649 | |
Desert Sands, CA Unified School District General Obligation, Election 2001, 5.000%, 08/01/26 | | | 175,000 | | | | 194,184 | |
Desert Sands, CA Unified School District General Obligation, Election 2001, 5.000%, 08/01/27 | | | 245,000 | | | | 270,933 | |
Desert Sands, CA Unified School District General Obligation, Election 2001, 5.000%, 08/01/28 | | | 50,000 | | | | 54,540 | |
Desert Sands, CA Unified School District General Obligation, Election 2001, 5.500%, 08/01/28 | | | 25,000 | | | | 28,069 | |
El Monte, CA Union High School District General Obligation, Election 2002, Series C, 5.000%, 06/01/21 (AGM Insured) | | | 40,000 | | | | 44,022 | |
Fairfield-Suisun, CA Unified School District General Obligation, Election 2002, 5.250%, 08/01/23 (National Insured) | | | 240,000 | | | | 248,962 | |
Fairfield-Suisun, CA Unified School District, Election 2002, 5.250%, 08/01/16 (National Insured) | | | 70,000 | | | | 72,614 | |
Fremont, CA Unified School District General Obligation, Series B, 5.000%, 08/01/24 | | | 25,000 | | | | 28,922 | |
Fresno County, CA Unified School District General Obligation, Series A, 6.000%, 08/01/26 (National Insured) | | | 110,000 | | | | 126,505 | |
Fresno County, CA Unified School District General Obligation, Series C, 5.900%, 08/01/22 (National Insured) | | | 25,000 | | | | 28,455 | |
Glendale, CA Unified School District General Obligation, 5.000%, 09/01/23 | | | 50,000 | | | | 57,982 | |
Grossmont, CA Union High School District General Obligation, 5.000%, 08/01/23 (National Insured) | | | 85,000 | | | | 91,923 | |
Grossmont-Cuyamaca, CA Community College District General Obligation, Series C, 5.000%, 08/01/24 (Assured Guaranty) | | | 50,000 | | | | 55,717 | |
Hacienda La Puente, CA Unified School District Facilities Financing Authority Revenue, 5.000%, 08/01/23 (AGM Insured) | | | 125,000 | | | | 143,130 | |
Hemet, CA Unified School District General Obligation,, 4.000%, 08/01/23 (AGM Insured) | | | 35,000 | | | | 36,041 | |
Hemet, CA Unified School District General Obligation, Series A, 5.000%, 08/01/22 (AGM Insured) | | | 125,000 | | | | 130,129 | |
Imperial, CA Irrigation District Electric System Revenue, 5.250%, 11/01/28 | | | 40,000 | | | | 43,542 | |
Imperial, CA Irrigation District Electric System Revenue, Series A, 5.250%, 11/01/24 | | | 100,000 | | | | 111,383 | |
Long Beach, CA Unified School District General Obligation Refunding, Series A, 5.000%, 08/01/25 | | | 30,000 | | | | 34,086 | |
Long Beach, CA Unified School District General Obligation, Series A, 5.500%, 08/01/26 | | | 85,000 | | | | 97,474 | |
Los Angeles County, CA Metropolitan Transportation Authority Sales Tax Revenue, Proposition C, Series E, 5.000%, 07/01/25 | | | 35,000 | | | | 39,587 | |
Los Angeles County, CA Public Works Financing Authority, 5.000%, 10/01/15 (National Insured) | | | 15,000 | | | | 16,308 | |
Los Angeles County, CA Public Works Financing Authority Revenue, Series A, 5.250%, 10/01/16 (AGM Insured) | | | 25,000 | | | | 28,235 | |
Los Angeles County, CA Sanitation Districts Financing Authority Capital Projects Revenue, 5.000%, 10/01/23 (FGIC Insured) | | | 80,000 | | | | 85,835 | |
Los Angeles, CA Department of Airports, Series D, 5.250%, 05/15/28 | | | 25,000 | | | | 27,595 | |
Los Angeles, CA Harbor Department Revenue, Series A, 4.000%, 08/01/17 | | | 25,000 | | | | 27,843 | |
Los Angeles, CA Harbor Department Revenue, Series B, 5.000%, 08/01/20 (National Insured) | | | 275,000 | | | | 300,781 | |
Los Angeles, CA Municipal Improvement Corp. Lease Revenue, Real Property, Series B, 4.750%, 09/01/26 | | | 100,000 | | | | 103,610 | |
Los Angeles, CA Municipal Improvement Corp. Lease Revenue, Series A, 5.000%, 09/01/24 | | | 100,000 | | | | 109,950 | |
Los Angeles, CA Municipal Improvement Corp. Lease Revenue, Series C, 5.000%, 09/01/18 | | | 300,000 | | | | 344,892 | |
Los Angeles, CA Municipal Improvement Corp. Revenue, Prerefunded, Series B1, 5.000%, 08/01/21 (FGIC Insured) | | | 5,000 | | | | 5,177 | |
Los Angeles, CA Municipal Improvement Corp. Revenue, Unrefunded, Series B1, 5.000%, 08/01/21 (FGIC Insured) | | | 120,000 | | | | 123,306 | |
Los Angeles, CA Municipal Improvement Corp. Revenue, Unrefunded, Series B1, 5.000%, 08/01/23 (FGIC Insured) | | | 50,000 | | | | 51,306 | |
Los Angeles, CA Municipal Improvement Corp. Revenue, Unrefunded, Series B1, 5.000%, 08/01/26 (FGIC Insured) | | | 200,000 | | | | 204,776 | |
Los Angeles, CA Municipal Improvement Lease Revenue, Capital Equipment, Series A, 5.000%, 09/01/16 | | | 160,000 | | | | 176,867 | |
Los Angeles, CA Municipal Improvement Revenue, Capital Equipment, Series 2008 A, 5.000%, 09/01/25 | | | 50,000 | | | | 54,503 | |
The accompanying notes are an integral part of these financial statements.
9
Managers California Intermediate Tax-Free Fund
Schedule of Portfolio Investments (continued)
| | | | | | | | |
| | | Principal Amount | | | Value | |
Municipal Bonds - 93.4% (continued) | | | | | | | | |
Los Angeles, CA Unified School District COPS, Capital Projects I, Series B-2, 5.000%, 12/01/15 | | $ | 40,000 | | | $ | 43,576 | |
Los Angeles, CA Unified School District General Obligation, Election 2004, Series G, 5.000%, 07/01/24 (AMBAC Insured) | | | 35,000 | | | | 37,986 | |
Madera, CA Unified School District General Obligation, 4.000%, 08/01/25 (AGM Insured) | | | 60,000 | | | | 63,070 | |
Madera, CA Unified School District General Obligation, Election 2006, 5.000%, 08/01/16 (National Insured) | | | 70,000 | | | | 77,425 | |
Merced Community College District, 4.000%, 08/01/20 | | | 75,000 | | | | 82,718 | |
Monrovia, CA Unified School District General Obligation, Election 2006, Series B, 5.250%, 08/01/25 (FSA Insured) | | | 30,000 | | | | 33,972 | |
Montebello, CA Unified School District General Obligation, Election 2004, 4.200%, 08/01/22 (National Insured) | | | 100,000 | | | | 106,849 | |
Montebello, CA Unified School District General Obligation, Election 2004, Series A, 5.000%, 08/01/28 | | | 25,000 | | | | 27,593 | |
Moreland, CA School District General Obligation, Series A, 5.000%, 08/01/15 (AMBAC Insured) | | | 50,000 | | | | 53,205 | |
Moreno Valley, CA Unified School District, 5.000%, 08/01/17 (National Insured) | | | 50,000 | | | | 55,224 | |
Moreno Valley, CA Unified School District General Obligation, 5.000%, 08/01/16 (National Insured) | | | 25,000 | | | | 27,205 | |
Mount Diablo, CA Unified School District General Obligation, Election 2002, Series B-2, 5.000%, 07/01/26 | | | 25,000 | | | | 27,897 | |
Mount Diablo, CA Unified School District General Obligation, Election 2002, Series C, 5.000%, 08/01/26 | | | 60,000 | | | | 67,687 | |
Ohlone, CA Community College District General Obligation, 5.000%, 08/01/25 | | | 25,000 | | | | 28,488 | |
Orange County, CA Sanitation District COP, Series A, 5.000%, 02/01/22 | | | 135,000 | | | | 153,102 | |
Palomar, CA Community College District General Obligation, Election 2006, Series A, 4.750%, 05/01/28 (AGM Insured) | | | 45,000 | | | | 47,316 | |
Peralta, CA Community College District General Obligation, Election 2006, Series B, 5.250%, 08/01/22 (AGM Insured) | | | 45,000 | | | | 49,525 | |
Peralta, CA Community College District General Obligation, Series A, 5.000%, 08/01/24 (National Insured) | | | 50,000 | | | | 53,055 | |
Perris, CA Union High School District General Obligation, Election 2004, Series A, 5.000%, 09/01/26 (FGIC Insured) | | | 15,000 | | | | 15,560 | |
Placentia-Yorba Linda, CA Unified School District General Obligation, Election 2002, Series B, 5.500%, 08/01/27 (FGIC Insured) | | | 65,000 | | | | 67,547 | |
Port of Oakland, CA Revenue, Series B, 5.000%, 11/01/17 (National Insured) | | | 10,000 | | | | 11,607 | |
Port of Oakland, CA Revenue, Series B, 5.000%, 11/01/22 (National Insured) | | | 30,000 | | | | 33,046 | |
Port of Oakland, CA Revenue, Series B, 5.000%, 11/01/26 (National Insured) | | | 275,000 | | | | 292,127 | |
Port of Oakland, CA Revenue, Series C, 5.000%, 11/01/17 (National Insured) | | | 225,000 | | | | 261,162 | |
Port of Oakland, CA Series B, 5.000%, 11/01/24 (National Insured) | | | 75,000 | | | | 80,951 | |
Puerto Rico Sales Tax Financing Corp. Revenue, Prerefunded, Series 2009 A, 5.000%, 08/01/18 | | | 20,000 | | | | 23,755 | |
Puerto Rico Sales Tax Financing Corp. Revenue, Unrefunded Balance, Series 2009 A, 5.000%, 08/01/18 | | | 50,000 | | | | 49,933 | |
Rescue, CA Union School District General Obligation, 5.000%, 09/01/21 (National Insured) | | | 25,000 | | | | 28,725 | |
Rescue, CA Union School District General Obligation, 5.000%, 07/01/23 (National Insured) | | | 50,000 | | | | 57,155 | |
Riverside, CA Community College District, 5.000%, 08/01/24 (AGM Insured) | | | 35,000 | | | | 37,088 | |
Riverside, CA Unified School District General Obligation, Election 2001, Series B, 4.000%, 08/01/17 (National Insured) | | | 100,000 | | | | 106,284 | |
Rosemead, CA School District General Obligation, Election 2000, Series D, 5.250%, 08/01/24 (AGM Insured) | | | 150,000 | | | | 165,997 | |
Rosemead, CA School District General Obligation, Election 2000, Series D, 5.250%, 08/01/25 (AGM Insured) | | | 55,000 | | | | 60,563 | |
Rosemead, CA School District General Obligation, Election 2000, Series D, 5.250%, 08/01/26 (AGM Insured) | | | 145,000 | | | | 158,871 | |
Rosemead, CA School District General Obligation, Election 2000, Series D, 5.500%, 08/01/28 (AGM Insured) | | | 125,000 | | | | 137,480 | |
Roseville, CA Joint Union High School District General Obligation, Election 2004, Series A, 5.000%, 08/01/26 (FGIC Insured) | | | 120,000 | | | | 124,260 | |
Rowland, CA Unified School District General Obligation, 4.125%, 08/01/27 | | | 25,000 | | | | 25,614 | |
Rowland, CA Unified School District General Obligation, 5.000%, 08/01/26 | | | 50,000 | | | | 55,835 | |
The accompanying notes are an integral part of these financial statements.
10
Managers California Intermediate Tax-Free Fund
Schedule of Portfolio Investments (continued)
| | | | | | | | |
| | | Principal Amount | | | Value | |
Municipal Bonds - 93.4% (continued) | | | | | | | | |
Sacramento, CA Municipal Utility District Electric Revenue, Series K, 5.250%, 07/01/24 (AMBAC Insured) | | $ | 145,000 | | | $ | 170,710 | |
Sacramento, CA Unified School District General Obligation, 5.000%, 07/01/25 | | | 50,000 | | | | 55,913 | |
San Bernardino, CA Community College District General Obligation, Election 2008, Series A, 6.375%, 08/01/26 | | | 480,000 | | | | 599,870 | |
San Bernardino, CA Community College District General Obligation, Series C, 5.000%, 08/01/26 (AGM Insured) | | | 175,000 | | | | 196,905 | |
San Diego, CA Public Facilities Financing Authority Sewer Revenue, Series B, 5.000%, 05/15/21 | | | 50,000 | | | | 57,502 | |
San Diego, CA Public Facilities Financing Authority Water Revenue, Series B, 5.000%, 08/01/20 | | | 30,000 | | | | 34,785 | |
San Diego, CA Unified Port District Revenue, Series B, 5.000%, 09/01/23 (National Insured) | | | 325,000 | | | | 330,574 | |
San Francisco, CA City & County Airports Commission International Airport Revenue, Second Series, Governmental Purpose, 5.000%, 05/01/27 | | | 100,000 | | | | 109,702 | |
San Francisco, CA City & County Airports Commission Revenue, Second Series Issue 32F, 5.250%, 05/01/17 (FGIC Insured) | | | 465,000 | | | | 534,666 | |
San Francisco, CA City & County Airports Commission Revenue, Second Series, Issue 34F, 5.000%, 05/01/16 (Assured Guaranty) | | | 95,000 | | | | 105,336 | |
San Francisco, CA City and County General Obligation, Laguna Honda Hospital, Series R3, 5.000%, 06/15/23 | | | 50,000 | | | | 52,586 | |
San Francisco, CA City & County Unified School District General Obligation, Election 2003, Series C, 5.000%, 06/15/22 (National Insured) | | | 55,000 | | | | 60,476 | |
San Joaquin County, CA Transportation Authority Sales Tax Revenue, Measure K, Series A, 5.000%, 03/01/27 | | | 50,000 | | | | 54,906 | |
San Jose, CA Unified School District General Obligation, Election 2002, Series C, 5.000%, 08/01/24 (FGIC Insured) | | | 200,000 | | | | 218,090 | |
San Juan, CA Unified School District General Obligation, 4.000%, 08/01/26 | | | 30,000 | | | | 31,120 | |
San Juan, CA Unified School District General Obligation, Election 2002, Series A, 5.000%, 08/01/16 (National Insured) | | | 150,000 | | | | 155,325 | |
San Mateo Joint Powers Financing Authority Capital Projects Lease Revenue, Series A, 5.000%, 07/15/17 | | | 25,000 | | | | 28,239 | |
San Mateo Joint Powers Financing Authority Capital Projects Lease Revenue, Series A, 5.000%, 07/15/24 | | | 225,000 | | | | 254,311 | |
Santa Ana, CA Unified School District General Obligation, Series A, 5.250%, 08/01/26 | | | 500,000 | | | | 552,355 | |
Santa Clara County, CA East Side Union High School District General Obligation, Election 2002, Series H, 5.000%, 08/01/19 (Assured Guaranty) | | | 100,000 | | | | 115,306 | |
Santa Clara County, CA East Side Union High School District General Obligation, Series A, 4.000%, 09/01/18 (AMBAC Insured) | | | 75,000 | | | | 81,472 | |
Santa Clara County, CA East Side Union High School District General Obligation, Series B, 5.100%, 02/01/16 (National Insured) | | | 250,000 | | | | 271,180 | |
Santa Clara County, CA East Side Union High School District General Obligation, Series B, 5.250%, 02/01/24 (National Insured) | | | 40,000 | | | | 46,276 | |
Santa Clara County, CA Financing Authority Lease Revenue, Series A, 5.000%, 11/15/21 | | | 185,000 | | | | 211,707 | |
Sierra Sands, CA Unified School District General Obligation, Series A, 5.000%, 11/01/22 (FGIC Insured) | | | 50,000 | | | | 52,068 | |
Sierra, CA Joint Community College District, School Facilities District No. 1, Election 2004, 5.000%, 08/01/24 (National Insured) | | | 100,000 | | | | 109,429 | |
Sierra, CA Joint Community College District, School Facilities District No. 1, Election 2004, 5.000%, 08/01/25 (National Insured) | | | 100,000 | | | | 109,054 | |
Snowline, CA Joint Unified School District Refunding Project, 4.250%, 09/01/20 (Assured Guaranty) | | | 50,000 | | | | 54,401 | |
Solano County, CA Community College District, 4.000%, 08/01/15 (National Insured) | | | 25,000 | | | | 26,504 | |
Solano County, CA Community College District, 5.000%, 08/01/16 (National Insured) | | | 40,000 | | | | 42,880 | |
Solano County, CA COP, 4.250%, 11/15/15 | | | 25,000 | | | | 26,518 | |
Sonoma County, CA Junior College District General Obligation, Series D, 5.000%, 08/01/16 | | | 15,000 | | | | 16,851 | |
South Western, CA Community College District General Obligation, 5.000%, 08/01/23 (National Insured) | | | 285,000 | | | | 305,908 | |
Southern California Public Power Authority Revenue, Southern Transmission Project, Series B, 5.750%, 07/01/24 | | | 75,000 | | | | 88,613 | |
The accompanying notes are an integral part of these financial statements.
11
Managers California Intermediate Tax-Free Fund
Schedule of Portfolio Investments (continued)
| | | | | | | | |
| | | Principal Amount | | | Value | |
Municipal Bonds - 93.4% (continued) | | | | | | | | |
State Center, CA Community College District General Obligation, Election 2002, Series A, 4.000%, 08/01/16 (AGM Insured) | | $ | 60,000 | | | $ | 65,105 | |
Sweetwater, CA Authority Water Revenue, 5.000%, 04/01/17 (AMBAC Insured) | | | 50,000 | | | | 52,922 | |
Tahoe-Truckee, CA Unified School District General Obligation, 5.500%, 08/01/19 (National Insured) | | | 75,000 | | | | 89,477 | |
Tracy, CA Joint Unified School District General Obligation, Election 2006, 5.000%, 08/01/25 (Assured Guaranty) | | | 100,000 | | | | 107,704 | |
Upland, CA Unified School District General Obligation, 5.000%, 08/01/22 | | | 25,000 | | | | 29,470 | |
Vacaville, CA Unified School District General Obligation, Election 2001, 5.000%, 08/01/16 (National Insured) | | | 120,000 | | | | 127,243 | |
Vacaville, CA Unified School District General Obligation, Election 2001, 5.000%, 08/01/17 (National Insured) | | | 40,000 | | | | 42,272 | |
Vacaville, CA Unified School District General Obligation, Election 2001, 5.000%, 08/01/22 (National Insured) | | | 15,000 | | | | 15,574 | |
Vacaville, CA Unified School District General Obligation, Election 2001, 5.000%, 08/01/25 (AMBAC Insured) | | | 350,000 | | | | 362,920 | |
Vacaville, CA Unified School District General Obligation, Election 2001, 5.000%, 08/01/26 (AMBAC Insured) | | | 85,000 | | | | 87,707 | |
Val Verde, CA Unified School District General Obligation, Election 2008, Series A, 5.500%, 08/01/22 | | | 100,000 | | | | 114,044 | |
Wasco, CA Union High School District General Obligation, Election 2008, Series B, 4.000%, 08/01/25 (AGM Insured) | | | 35,000 | | | | 35,075 | |
West Contra Costa, CA Unified School District General Obligation, Election 2005, Series B, 6.000%, 08/01/21 | | | 75,000 | | | | 93,602 | |
West Valley-Mission, CA Community College District General Obligation, Election 2012, Series A, 5.000%, 08/01/26 | | | 50,000 | | | | 57,016 | |
Westlands, CA Water District Revenue, Series A, 5.000%, 09/01/27 (AGM Insured) | | | 100,000 | | | | 109,310 | |
Wiseburn, CA School District, Class A, 5.000%, 08/01/16 (National Insured) | | | 75,000 | | | | 80,117 | |
Yosemite, CA Community College District General Obligation, Unrefunded, Election 2004, Series A, 5.000%, 08/01/22 (FGIC Insured) | | | 95,000 | | | | 100,313 | |
Yuba, CA Community College District General Obligation, Election 2006, Series A, 5.000%, 08/01/23 (AMBAC Insured) | | | 90,000 | | | | 98,149 | |
Yuba, CA Community College District General Obligation, Election 2006, Series A, 5.000%, 08/01/24 (AMBAC Insured) | | | 25,000 | | | | 27,151 | |
Total Municipal Bonds (cost $16,831,730) | | | | | | | 17,537,781 | |
| | |
| | | Shares | | | | |
Other Investment Companies - 5.6%1 | | | | | | | | |
BlackRock Liquidity Funds, California Money Fund - Institutional Class Shares, 0.01%
(cost $1,045,681) | | | 1,045,681 | | | | 1,045,681 | |
Total Investments - 99.0% (cost $17,877,411)2 | | | | | | | 18,583,462 | |
Other Assets, less Liabilities - 1.0% | | | | | | | 197,020 | |
Net Assets - 100.0% | | | | | | $ | 18,780,482 | |
The accompanying notes are an integral part of these financial statements.
12
Notes to Schedule of Portfolio Investments
The following footnotes and abbreviations should be read in conjunction with the Schedule of Portfolio Investments previously presented in this report.
Based on the approximate cost of investments of $17,877,411 for Federal income tax purposes at October 31, 2013, the aggregate gross unrealized appreciation and depreciation were $802,484 and $96,433, respectively, resulting in net unrealized appreciation of investments of $706,051.
| 1 | Yield shown represents the October 31, 2013, seven-day average yield, which refers to the sum of the previous seven days’ dividends paid, expressed as an annual percentage. |
| 2 | At October 31, 2013, the concentration of the Fund’s investments by state or territory determined as a percentage of net assets was as follows: California 93.0% and Puerto Rico 0.4%. At October 31, 2013, 62.1% of the securities in the portfolio were backed by insurance of financial institutions and financial guaranty assurance agencies. Insurers with a concentration greater than 10% of net assets were as follows: National Insured 31.6% and AGM 14.2%. |
The following table summarizes the inputs used to value the Fund’s net assets by the fair value hierarchy levels as of October 31, 2013: (See Note 1(a) in the Notes to Financial Statements.)
| | | | | | | | | | | | | | | | |
| | | Quoted Prices in Active Markets
for Identical Investments
Level 1 | | | Significant Other Observable Inputs
Level 2 | | | Significant Unobservable Inputs
Level 3 | | | Total | |
Managers California Intermediate Tax-Free Fund | | | | | | | | | |
Investments in Securities | | | | | | | | | | | | | |
Municipal Bonds† | | | — | | | $ | 17,537,781 | | | | — | | | $ | 17,537,781 | |
Other Investment Companies | | $ | 1,045,681 | | | | — | | | | — | | | | 1,045,681 | |
| | | | | | | | | | | | | | | | |
Total Investments in Securities | | $ | 1,045,681 | | | $ | 17,537,781 | | | | — | | | $ | 18,583,462 | |
| | | | | | | | | | | | | | | | |
| † | The municipal bonds held in the Fund are Level 2 securities. For a detailed breakout of the bonds by major classification, please refer to the Schedule of Portfolio Investments. |
As of October 31, 2013, the Fund had no transfers between levels from the beginning of the reporting period.
| | | | | | |
Investment Abbreviations: | | | | |
| | | |
AMBAC: | | Ambac Assurance Corp. | | FGIC: | | Financial Guaranty Insurance Company |
AGM: | | Assured Guaranty Municipal Corp. | | FSA: | | FSA Capital, Inc. |
COP: | | Certificates of Participation | | National: | | National Public Finance Guarantee Corp. |
|
The accompanying notes are an integral part of these financial statements. 13 |
Statement of Assets and Liabilities
October 31, 2013
| | | | |
Assets: | | | | |
Investments at value* | | $ | 18,583,462 | |
Dividends, interest and other receivables | | | 217,798 | |
Receivable from affiliate | | | 10,471 | |
Prepaid expenses | | | 4,300 | |
Total assets | | | 18,816,031 | |
Liabilities: | | | | |
Payable for Fund shares repurchased | | | 362 | |
Accrued expenses: | | | | |
Investment advisory and management fees | | | 6,443 | |
Administrative fees | | | 4,027 | |
Custodian | | | 16,149 | |
Professional fees | | | 7,344 | |
Trustees fees and expenses | | | 27 | |
Other | | | 1,197 | |
Total liabilities | | | 35,549 | |
| |
Net Assets | | $ | 18,780,482 | |
Net Assets Represent: | | | | |
Paid-in capital | | $ | 17,831,434 | |
Undistributed net investment income | | | 2,877 | |
Accumulated net realized gain from investments | | | 240,120 | |
Net unrealized appreciation of investments | | | 706,051 | |
Net Assets | | $ | 18,780,482 | |
Shares outstanding | | | 1,717,503 | |
Net asset value, offering and redemption price per share | | $ | 10.93 | |
* Investments at cost | | $ | 17,877,411 | |
|
The accompanying notes are an integral part of these financial statements. 14 |
Statement of Operations
For the fiscal year ended October 31, 2013
| | | | |
Investment Income: | | | | |
Interest income | | $ | 1,089,602 | |
Dividend income | | | 79 | |
Total investment income | | | 1,089,681 | |
Expenses: | | | | |
Investment advisory and management fees | | | 107,136 | |
Administrative fees | | | 67,880 | |
Custodian | | | 31,196 | |
Professional fees | | | 28,327 | |
Extraordinary expense | | | 4,582 | |
Registration fees | | | 3,891 | |
Transfer agent | | | 3,149 | |
Reports to shareholders | | | 1,843 | |
Trustees fees and expenses | | | 945 | |
Miscellaneous | | | 1,006 | |
Total expenses before offsets | | | 249,955 | |
Expense reimbursements | | | (95,949 | ) |
Net expenses | | | 154,006 | |
Net investment income | | | 935,675 | |
Net Realized and Unrealized Gain (Loss): | | | | |
Net realized gain on investments | | | 518,414 | |
Net change in unrealized appreciation (depreciation) of investments | | | (1,338,134 | ) |
Net realized and unrealized loss | | | (819,720 | ) |
| |
Net increase in net assets resulting from operations | | $ | 115,955 | |
|
The accompanying notes are an integral part of these financial statements. 15 |
Statements of Changes in Net Assets
For the fiscal year ended October 31,
| | | | | | | | |
| | | 2013 | | | 2012 | |
Increase (Decrease) in Net Assets From Operations: | | | | | | | | |
Net investment income | | $ | 935,675 | | | $ | 971,750 | |
Net realized gain on investments | | | 518,414 | | | | 61,220 | |
Net change in unrealized appreciation (depreciation) of investments | | | (1,338,134 | ) | | | 1,122,413 | |
Net increase in net assets resulting from operations | | | 115,955 | | | | 2,155,383 | |
Distributions to Shareholders: | | | | | | | | |
From net investment income | | | (931,222 | ) | | | (971,750 | ) |
Capital Share Transactions: | | | | | | | | |
Proceeds from sale of shares | | | 6,246,337 | | | | 1,402,727 | |
Reinvestment of dividends and distributions | | | 481,406 | | | | 440,362 | |
Cost of shares repurchased | | | (14,825,252 | ) | | | (2,195,616 | ) |
Net decrease from capital share transactions | | | (8,097,509 | ) | | | (352,527 | ) |
Total increase (decrease) in net assets | | | (8,912,776 | ) | | | 831,106 | |
Net Assets: | | | | | | | | |
Beginning of year | | | 27,693,258 | | | | 26,862,152 | |
End of year | | $ | 18,780,482 | | | $ | 27,693,258 | |
End of year undistributed net investment income (loss) | | $ | 2,877 | | | $ | (1,576 | ) |
| | | | | | | | |
Share Transactions: | | | | | | | | |
Sale of shares | | | 568,156 | | | | 126,691 | |
Reinvested shares from dividends and distributions | | | 43,858 | | | | 39,930 | |
Shares repurchased | | | (1,378,364 | ) | | | (199,729 | ) |
Net increase (decrease) in shares | | | (766,350 | ) | | | (33,108 | ) |
|
The accompanying notes are an integral part of these financial statements. 16 |
Managers California Intermediate Tax-Free Fund
Financial Highlights
For a share outstanding throughout each fiscal period
| | | | | | | | | | | | | | | | | | | | |
| | | For the fiscal year ended October 31, | |
| | | 2013 | | | 2012 | | | 2011 | | | 2010 | | | 2009 | |
Net Asset Value, Beginning of Year | | $ | 11.15 | | | $ | 10.67 | | | $ | 10.72 | | | $ | 10.40 | | | $ | 9.84 | |
Income from Investment Operations: | | | | | | | | | | | | | | | | | | | | |
Net investment income | | | 0.38 | 1 | | | 0.39 | 1 | | | 0.39 | | | | 0.34 | | | | 0.32 | |
Net realized and unrealized gain (loss) on investments | | | (0.22 | )1 | | | 0.48 | 1 | | | (0.05 | ) | | | 0.32 | | | | 0.55 | |
Total from investment operations | | | 0.16 | | | | 0.87 | | | | 0.34 | �� | | | 0.66 | | | | 0.87 | |
Less Distributions to Shareholders from: | | | | | | | | | | | | | | | | | | | | |
Net investment income | | | (0.38 | ) | | | (0.39 | ) | | | (0.39 | ) | | | (0.34 | ) | | | (0.31 | ) |
Total distributions to shareholders | | | (0.38 | ) | | | (0.39 | ) | | | (0.39 | ) | | | (0.34 | ) | | | (0.31 | ) |
Net Asset Value, End of Year | | $ | 10.93 | | | $ | 11.15 | | | $ | 10.67 | | | $ | 10.72 | | | $ | 10.40 | |
Total Return2 | | | 1.42 | % | | | 8.27 | % | | | 3.27 | % | | | 6.41 | % | | | 8.97 | % |
Ratio of net expenses to average net assets (with offsets/reductions) | | | 0.57 | %4 | | | 0.55 | % | | | 0.55 | % | | | 0.55 | % | | | 0.55 | % |
Ratio of expenses to average net assets (with offsets) | | | 0.57 | %4 | | | 0.55 | % | | | 0.55 | % | | | 0.55 | % | | | 0.55 | % |
Ratio of total expenses to average net assets (without offsets/reductions)3 | | | 0.92 | %4 | | | 0.90 | % | | | 0.90 | % | | | 0.96 | % | | | 0.86 | % |
Ratio of net investment income to average net assets2 | | | 3.45 | %4 | | | 3.56 | % | | | 3.69 | % | | | 3.20 | % | | | 3.08 | % |
Portfolio turnover | | | 10 | % | | | 5 | % | | | 8 | % | | | 64 | % | | | 152 | % |
Net assets at end of year (000’s omitted) | | $ | 18,780 | | | $ | 27,693 | | | $ | 26,862 | | | $ | 31,315 | | | $ | 31,181 | |
| | | | | | | | | | | | | | | | | | | | |
Notes to Financial Highlights
The following footnotes should be read in conjunction with the Financial Highlights of the Fund previously presented in this report.
| 1 | Per share numbers have been calculated using average shares. |
| 2 | Total returns and net investment income would have been lower had certain expenses not been offset. |
| 3 | Excludes the impact of expense reimbursements or fee waivers and expense reductions such as brokerage credits, but includes expense repayments and non-reimbursable expenses, if any, such as interest, taxes and extraordinary expenses. |
| 4 | Includes non-routine extraordinary expenses amounting to 0.017% of average net assets. |
Notes to Financial Statements
October 31, 2013
1.Summary of Significant Accounting Policies
Managers Trust I (the “Trust”) is an open-end management investment company, organized as a Massachusetts business trust, and registered under the Investment Company Act of 1940, as amended (the “1940 Act”). Currently, the Trust consists of a number of different funds, each having distinct investment management objectives, strategies, risks and policies. Included in this report is the Managers California Intermediate Tax-Free Fund (the “Fund”).
The Fund’s financial statements are prepared in accordance with accounting principles generally accepted in the United States of America (“U.S. GAAP”), which require management to make estimates and assumptions that affect the reported amounts of assets and liabilities and disclosure of contingent assets and liabilities at the date of the financial statements and the reported amounts of income and expenses during the reporting periods. Actual results could differ from those estimates and such differences could be material. The following is a summary of significant accounting policies followed by the Fund in the preparation of its financial statements:
a.Valuation of Investments
Equity securities traded on a domestic or international securities exchange are valued at the last quoted sale price, or, lacking any sales, at the last quoted bid price. Over-the-counter securities are valued at the Nasdaq Official Closing Price, if one is available. Lacking any sales, over-the-counter securities are valued at the last quoted bid price. The Fund’s investments are generally valued based on market quotations provided by third-party pricing services approved by the Board of Trustees of the Funds (the “Board”).
Fixed-income securities are valued based on valuations furnished by independent pricing services that utilize matrix systems, which reflect such factors as security prices, yields, maturities, and ratings, and are supplemented by dealer and exchange quotations. Short-term investments having a remaining maturity of 60 days or less are generally valued at amortized cost, which approximates market value. Investments in other open-end regulated investment companies are valued at their end of day net asset value per share.
Under certain circumstances, the value of certain Fund investments (including derivatives) may be based on an evaluation of fair value, pursuant to procedures established by and under the general supervision of the Board. The Pricing Committee is the committee formed by the Board to make fair value determinations for such investments. When determining the fair value of an investment, the Pricing Committee seeks to determine the price that the Fund might reasonably expect to receive from a current sale of that investment in an arm’s-length transaction. Fair value determinations shall be based upon consideration of all available facts and information, including, but not limited to (i) attributes specific to the investment; (ii) fundamental analytical data and press releases relating to the investment and its issuer; (iii) the value of comparable securities or relevant financial instruments, including derivative securities, traded on other markets or among dealers; and (iv) other factors, such as future cash flows, interest rates, yield curves, volatilities, credit risks and/or default rates. The Board will be presented with a quarterly report comparing fair values determined by the Pricing Committee against subsequent market valuations for those securities. The values assigned to fair value investments are based
on available information and do not necessarily represent amounts that might ultimately be realized, since such amounts depend on future developments inherent in long-term investments. Further, because of the inherent uncertainty of valuation, those estimated values may differ significantly from the values that would have been used had a ready market for the investments existed, and the differences could be material. The Fund may use the fair value of a portfolio investment to calculate its Net Asset Value (“NAV”) when, for example, (1) market quotations are not readily available because a portfolio investment is not traded in a public market or the principal market in which the investment trades is closed, (2) trading in a portfolio investment is suspended and has not resumed before the Fund calculates its NAV, (3) a significant event affecting the value of a portfolio investment is determined to have occurred between the time of the market quotation provided for a portfolio investment and the time as of which the Fund calculates its NAV, (4) an investment’s price has remained unchanged over a period of time (often referred to as a “stale price”), or (5) Managers Investment Group LLC (the “Investment Manager”) determines that a market quotation is inaccurate. Portfolio investments that trade primarily on foreign markets are priced based upon the market quotation of such securities as of the close of their respective principal markets. Under certain circumstances, the Investment Manager may adjust such prices based on its determination of the impact of events occurring subsequent to the close of such markets but prior to the time as of which the Fund calculates its NAV. The Fund may invest in securities that may be thinly traded. The Board has adopted procedures to adjust prices of thinly traded securities that are judged to be stale so that they reflect fair value. An investment valued on the basis of its fair value may be valued at a price higher or lower than available market quotations. An investment valuation may differ depending on the method used and the factors considered in determining value according to the Fund’s fair value procedures.
U.S. GAAP defines fair value as the price that a Fund would receive to sell an asset or pay to transfer a liability in an orderly transaction between market participants at the measurement date. U.S. GAAP also establishes a framework for measuring fair value, and a three level hierarchy for fair value measurements based upon the transparency of inputs to the valuation of an asset or liability. Inputs may be observable or unobservable and refer broadly to the assumptions that market participants would use in pricing the asset or liability. Observable inputs reflect the assumptions market participants would use in pricing the asset or liability based on market data obtained from sources independent of the Fund. Unobservable inputs reflect the Fund’s own assumptions about the assumptions that market participants would use in pricing the asset or liability developed based on the best information available in the circumstances. Each investment is assigned a level based upon the observability of the inputs which are significant to the overall valuation.
The three-tier hierarchy of inputs is summarized below:
Level 1 – inputs are quoted prices in active markets for identical investments (e.g., equity securities, open-end investment companies)
Level 2 – other observable inputs (including, but not limited to: quoted prices for similar assets or liabilities in markets that are active, quoted prices for identical or similar assets or liabilities in
Notes to Financial Statements (continued)
markets that are not active, inputs other than quoted prices that are observable for the assets or liabilities (such as interest rates, yield curves, volatilities, prepayment speeds, loss severities, credit risks and default rates) or other market corroborated inputs) (e.g., debt securities, government securities, foreign securities utilizing international fair value pricing, broker-quoted securities, fair valued securities with observable inputs)
Level 3 – inputs are significant unobservable inputs (including the Fund’s own assumptions used to determine the fair value of investments) (e.g., fair valued securities with unobservable inputs)
Changes in inputs or methodologies used for valuing investments may result in a transfer in or out of levels within the fair value hierarchy. The inputs or methodologies used for valuing investments are not necessarily an indication of the risk associated with investing in those investments.
b. Security Transactions
Security transactions are accounted for as of trade date. Realized gains and losses on securities sold are determined on the basis of identified cost.
c. Investment Income and Expenses
Dividend income is recorded on the ex-dividend date. Dividend and interest income on foreign securities is recorded net of any withholding tax. Interest income, which includes amortization of premium and accretion of discount on debt securities, is accrued as earned. Non-cash dividends included in dividend income, if any, are reported at the fair market value of the securities received. Other income and expenses are recorded on an accrual basis. Expenses that cannot be directly attributed to a Fund are apportioned among the Funds in the Trust and in some cases other affiliated funds based upon their relative average net assets or number of shareholders.
The Fund has a “balance credit” arrangement with The Bank of New York Mellon (“BNYM”), the Fund’s custodian, whereby the Fund is credited with an interest factor equal to 0.75% below the effective 90-day T-Bill rate for account balances left uninvested overnight. If the T-Bill rate falls below 0.75%, no credits will be earned. These credits serve to reduce custody expenses that would otherwise be charged to the Fund. For the fiscal year ended October 31, 2013, the custodian expense was not reduced.
Overdrafts fees are computed at 1% above the effective Federal Funds rate on the day of the overdraft. Prior to January 1, 2013 the rate was 2% above the effective Federal Funds rate. For the fiscal year ended October 31, 2013, the overdraft fees for the Fund equaled $3.
The Trust has filed a proxy statement with the SEC to approve a new Declaration of Trust for the Trust, among other proposals. The costs associated with this proxy are being treated as “extraordinary expenses,” and, therefore, are excluded from the expense limitation agreement described in Note 2.
d. Dividends and Distributions
Dividends resulting from net investment income, if any, normally will be declared daily and paid monthly. Distributions of capital gains, if any, will be made on an annual basis and when required for Federal excise tax purposes. Dividends and distributions to
shareholders are recorded on the ex-dividend date. Income and capital gain distributions are determined in accordance with Federal income tax regulations, which may differ from U.S. GAAP. The most common differences are due to differing treatments for losses deferred due to wash sales and market discount transactions. Permanent book and tax basis differences, if any, relating to shareholder distributions will result in reclassifications to paid-in capital.
The tax character of distributions paid during the fiscal years ended October 31, 2013 and October 31, 2012 were as follows:
| | | | | | | | |
| | | 2013 | | | 2012 | |
Distributions paid from: | | | | | | | | |
Ordinary income | | $ | 931,222 | | | $ | 971,750 | |
Short-term capital gains | | | — | | | | — | |
Long-term capital gains | | | — | | | | — | |
| | | | | | | | |
| | $ | 931,222 | | | $ | 971,750 | |
| | | | | | | | |
As of October 31, 2013, the components of distributable earnings (excluding unrealized appreciation/depreciation) on a tax basis consisted of:
| | | | |
Capital loss carryforward | | | — | |
Undistributed ordinary income | | | 2,877 | |
Undistributed short-term capital gains | | | — | |
Undistributed long-term capital gains | | $ | 240,120 | |
Post-October loss deferral | | | — | |
e. Federal Taxes
The Fund intends to comply with the requirements under Subchapter M of the Internal Revenue Code of 1986, as amended, and to distribute substantially all of its taxable income and gains to its shareholders and to meet certain diversification and income requirements with respect to investment companies. Therefore, no provision for Federal income or excise tax is included in the accompanying financial statements.
Additionally, based on the Fund’s understanding of the tax rules and rates related to income, gains and transactions for the foreign jurisdictions in which it invests, the Fund will provide for foreign taxes, and where appropriate, deferred foreign taxes.
Management has analyzed the Fund’s tax positions taken on Federal income tax returns as of October 31, 2013 and for all open tax years and has concluded that no provision for federal income tax is required in the Fund’s financial statements. Additionally, the Fund is not aware of any tax position for which it is reasonably possible that the total amounts of unrecognized tax benefits will change materially in the next twelve months.
Under the Regulated Investment Company Modernization Act of 2010, post-enactment capital losses may be carried forward for an unlimited time period. However, any new losses incurred will be required to be utilized prior to any loss carryovers incurred in pre-enactment taxable years, which generally expire eight years following the close of the taxable year in which they were incurred. As a result of this ordering rule, pre-enactment capital loss
Notes to Financial Statements (continued)
carryovers may be more likely to expire unused. Additionally, post-enactment capital losses that are carried forward retain their tax character as either short-term or long-term capital losses rather than being considered all short-term as under previous law.
f. Capital Loss Carryovers and Deferrals
For the fiscal year ended October 31, 2013, the Fund had no accumulated net realized capital loss carryovers from securities transactions for Federal income tax purposes. If the Fund had incurred net capital losses, such amounts may be used to offset future realized capital gains, if any, through an expiration date or in the case of post-enactment losses, for an unlimited time period.
For the fiscal year ended October 31, 2013, the Fund utilized capital loss carryovers in the amount of $278,294.
g. Capital Stock
The Trust’s Declaration of Trust authorizes for each series the issuance of an unlimited number of shares of beneficial interest, without par value. The Fund records sales and repurchases of its capital stock on the trade date. The cost of securities contributed to the Fund in connection with the issuance of shares is based on the valuation of those securities in accordance with the Fund’s policy on investment valuation.
At October 31, 2013, certain unaffiliated shareholders of record, specifically omnibus accounts, individually or collectively held greater than 10% of the outstanding shares of the Fund as follows: one owns 28%. Transactions by this shareholder may have a material impact on the Fund.
2. Agreements and Transactions with Affiliates
The Trust has entered into an Investment Management Agreement under which the Investment Manager, a subsidiary of Affiliated Managers Group, Inc. (“AMG”), serves as investment manager to the Fund and is responsible for the Fund’s overall administration and operations. The Investment Manager selects subadvisors for the Fund (subject to Board approval) and monitors the subadvisor’s investment performance, security holdings and investment strategies. The Fund’s investment portfolio is managed by one or more portfolio managers who serves pursuant to a subadvisory agreement with the Investment Manager.
Investment management fees are paid directly by the Fund to the Investment Manager based on average daily net assets. For the fiscal year ended October 31, 2013, the annual investment management fee rates, as a percentage of average daily net assets, were as follows:
| | | | |
on first $25 million | | | 0.40 | % |
on next $25 million | | | 0.35 | % |
on next $50 million | | | 0.30 | % |
on next $50 million | | | 0.25 | % |
on balance over $150 million | | | 0.20 | % |
The Investment Manager has contractually agreed, through March 1, 2014, to waive management fees and/or reimburse Fund expenses in order to limit total annual Fund operating expenses after fee waiver and expense reimbursements (exclusive of taxes, interest (including interest incurred in connection with bank and custody overdrafts), brokerage commissions, and other transaction costs, acquired fund fees and expenses and extraordinary expenses) to 0.55% of the Fund’s average daily net assets.
The Fund is obligated to repay the Investment Manager such amounts waived, paid or reimbursed in future years provided that the repayment occurs within thirty-six (36) months after the waiver or reimbursement and that such repayment would not cause the Fund’s total operating expenses in any such future year to exceed the Fund’s expense cap. For the fiscal year ended October 31, 2013, the Fund’s components of reimbursement available are detailed in the following chart:
| | | | |
Reimbursement Available - 10/31/12 | | $ | 321,401 | |
Additional Reimbursements | | | 95,949 | |
Repayments | | | — | |
Expired Reimbursements | | | (125,527 | ) |
| | | | |
Reimbursement Available - 10/31/13 | | $ | 291,823 | |
| | | | |
The Fund has entered into an Administration and Shareholder Servicing Agreement under which the Investment Manager serves as the Fund’s administrator (the “Administrator”) and is responsible for all aspects of managing the Fund’s operations, including administration and shareholder services to the Fund, its shareholders, and certain institutions, such as bank trust departments, broker-dealers and registered investment advisers, that advise or act as an intermediary with the Fund’s shareholders. The Fund pays a fee to the Administrator at the rate of 0.25% per annum of the Fund’s average daily net assets for this service.
The aggregate annual retainer paid to each Independent Trustee of the Board is $105,000, plus $6,000 or $2,500 for each regular or special meeting attended, respectively. The Independent Chairman of the Trust receives an additional payment of $25,000 per year. The Chairman of the Audit Committee receives an additional payment of $10,000 per year. The Trustees’ fees and expenses are allocated among all of the funds for which the Investment Manager serves as the advisor (the “Managers Funds”) based on the relative net assets of such Funds. The “Trustees fees and expenses” shown in the financial statements represents the Fund’s allocated portion of the total fees and expenses paid by the Managers Funds.
Prior to January 1, 2013, the annual retainer paid to each Independent Trustee of the Board was $80,000, plus $5,000 or $2,500 for each regular or special meeting attended, respectively. The Independent Chairman of the Trust formerly received an
Notes to Financial Statements (continued)
additional payment of $20,000 per year. The Chairman of the Audit Committee formerly received an additional payment of $8,000 per year.
The Fund is distributed by Managers Distributors, Inc. (the “Distributor” or “MDI”), a wholly-owned subsidiary of the Investment Manager. MDI serves as the distributor and underwriter for the Fund and is a registered broker-dealer and member of the Financial Industry Regulatory Authority, Inc. (“FINRA”). Shares of the Fund will be continuously offered and will be sold directly to prospective purchasers through brokers, dealers or other financial intermediaries who have executed selling agreements with MDI. Subject to the compensation arrangement discussed below, generally MDI bears all or a portion of the expenses of providing services pursuant to the distribution agreement, including the payment of the expenses relating to the distribution of prospectuses for sales purposes and any advertising or sales literature. Certain Trustees and Officers of the Fund are Officers and/or Directors of the Investment Manager, AMG and/or the Distributor.
The Securities and Exchange Commission granted an exemptive order that permits the Fund to lend and borrow money for certain temporary purposes directly to and from other eligible Managers Funds. Participation in this interfund lending program is voluntary for both borrowing and lending funds, and an interfund loan is only made if it benefits each participating fund. The Investment Manager administers the program according to procedures approved by the Board, and the Board monitors the operation of the program. An interfund loan must comply with certain conditions set out in the exemptive order, which are designed to assure fairness and protect all participating Funds. For the fiscal year ended October 31, 2013, the Fund neither borrowed or lent to other Managers Funds. At October 31, 2013, the Fund had no loans outstanding.
3. Purchases and Sales of Securities
Purchases and sales of securities (excluding short-term and U.S. Government obligations) for the fiscal year ended October 31, 2013, were $2,687,433 and $11,073,405, respectively. There were no purchases or sales of U.S. Government obligations for the Fund.
4. Portfolio Securities Loaned
The Fund participates in a securities lending program offered by BNYM (the “Program”), providing for the lending of securities to qualified brokers. Securities lending income includes earnings of such temporary cash investments, plus or minus any rebate to a borrower. These earnings (after any rebate) are then divided between BNYM, as a fee for its services under the program, and the Fund, according to agreed-upon rates. Collateral received on all securities loaned is accepted in cash and is maintained at a minimum level of 102% (105% in the case of certain foreign securities) of the market value, plus interest, if applicable, of investments on loan. It is the Fund’s policy to obtain additional collateral from or return excess collateral to the borrower by the end of the next business day, following the valuation date of the securities loaned. Therefore, the value of the collateral held may be temporarily less than the value of the securities on loan. Lending securities entails a risk of loss to the Fund if and to the extent that the market value of the securities loaned were to increase and the borrower did not increase the collateral accordingly, and the borrower fails to return the securities.
Under the terms of the Program, the Fund is indemnified for such losses by BNYM. Cash collateral is held in a separate account managed by BNYM, who is authorized to exclusively enter into overnight government repurchase agreements. BNYM bears the risk of any deficiency in the amount of the cash collateral available for return to the borrower due to any loss on the collateral invested. For the fiscal year ended October 31, 2013, the Fund had no lending.
5. Commitments and Contingencies
In the normal course of business, the Fund may enter into contracts and agreements that contain a variety of representations and warranties, which provide general indemnifications. The maximum exposure to the Fund under these arrangements is unknown, as this would involve future claims that may be made against a Fund that have not yet occurred. However, based on experience, the Fund had no prior claims or losses and expect the risks of loss to be remote.
6. New Accounting Pronouncements
In December 2011, the Financial Accounting Standards Board (“FASB”) issued Accounting Standards Update (“ASU”) No. 2011- 11 “Disclosures about Offsetting Assets and Liabilities.” ASU 2011-11 requires disclosures to make financial statements that are prepared under U.S. GAAP more comparable to those prepared under IFRS. The new disclosure requirements mandate that entities disclose both gross and net information about instruments and transactions eligible for offset in the statement of assets and liabilities as well as instruments and transactions subject to an agreement similar to a master netting arrangement. In addition, ASU 2011-11 requires disclosure of collateral received and posted in connection with master netting agreements or similar arrangements. New disclosures are required for annual reporting periods beginning on or after January 1, 2013, and interim periods within those annual periods. Management is evaluating the impact of ASU 2011-11 on the Fund’s financial statements and disclosures.
7. Subsequent Events
At a meeting held on September 19-20, 2013, the Trust’s Board of Trustees approved a plan to liquidate and terminate the Managers California Intermediate Tax-Free Fund. The Fund was liquidated on November 18, 2013.
The Fund has determined that no other material events or transactions occurred through the issuance date of the Fund’s financial statements which require additional disclosure in or adjustment of the Fund’s financial statements.
Tax Information (unaudited)
Managers California Intermediate Tax-Free Fund hereby designates the maximum amount allowable of its net taxable income as qualified dividends as provided in the Jobs and Growth Tax Relief Reconciliation Act of 2003. The 2012/2013 Form 1099-DIV you will receive for the Fund will show the tax status of all distributions paid to you during the year.
Pursuant to section 852 of the Internal Revenue Code, Managers California Intermediate Tax-Free Fund hereby designates $240,120 as a capital gain distribution with respect to the taxable fiscal year ended October 31, 2013, or if subsequently determined to be different, the net capital gains of such year.
Report of Independent Registered Public Accounting Firm
To the Board of Trustees of Managers Trust I and the Shareholders of Managers California Intermediate Tax-Free Fund:
In our opinion, the accompanying statement of assets and liabilities, including the schedule of portfolio investments, and the related statements of operations and of changes in net assets and the financial highlights present fairly, in all material respects, the financial position of Managers California Intermediate Tax-Free Fund (the “Fund”) at October 31, 2013, and the results of its operations, the changes in its net assets and the financial highlights for each of the periods indicated, in conformity with accounting principles generally accepted in the United States of America. These financial statements and financial highlights (hereafter referred to as “financial statements”) are the responsibility of the Fund’s management. Our responsibility is to express an opinion on these financial statements based on our audits. We conducted our audits of these financial statements in accordance with the standards of the Public Company Accounting Oversight Board (United States). Those standards require that we plan and perform the audit to obtain reasonable assurance about whether the financial statements are free of material misstatement. An audit includes examining, on a test basis, evidence supporting the amounts and disclosures in the financial statements, assessing the accounting principles used and significant estimates made by management, and evaluating the overall financial statement presentation. We believe that our audits, which included confirmation of securities at October 31, 2013 by correspondence with the custodian, provide a reasonable basis for our opinion.
PricewaterhouseCoopers LLP
Boston, Massachusetts
December 26, 2013
Trustees and Officers
The Trustees and Officers of the Trust, their business addresses, principal occupations for the past five years and dates of birth are listed below. The Trustees provide broad supervision over the affairs of the Trust and the Funds. The Trustees are experienced executives who meet periodically throughout the year to oversee the Funds’ activities, review contractual arrangements with companies that provide services to the Funds, and review the Funds’ performance. Unless otherwise noted, the address of each Trustee or Officer is the address of the Trust: 800 Connecticut Avenue, Norwalk, Connecticut 06854.
There is no stated term of office for Trustees. Trustees serve until their resignation, retirement or removal in accordance with the Trust’s organizational documents and policies adopted by the Board from time to time. The Chairman of the Trustees, President, Treasurer and Secretary of the Trust are elected by the Trustees annually. Other officers hold office at the pleasure of the Trustees.
Independent Trustees
The following Trustees are not “interested persons” of the Trust within the meaning of the 1940 Act:
| | |
Name, Date of Birth, Number of
Funds Overseen in Fund
Complex* | | Principal Occupation(s) During
Past 5 Years and Other Directorships
Held by Trustee |
Bruce B. Bingham, 12/01/48 • Trustee since 2012 • Oversees 40 Funds in Fund Complex | | Partner, Hamilton Partners (real estate development firm) (1987-Present). |
| |
William E. Chapman, II, 9/23/41 • Independent Chairman • Trustee since 2000 • Oversees 40 Funds in Fund Complex | | President and Owner, Longboat Retirement Planning Solutions (1998-Present); Hewitt Associates, LLC (part time) (provider of Retirement and Investment Education Seminars) (2002-2009); Trustee Emeritus of Bowdoin College (2013-Present), Trustee of Bowdoin College (2002-2013); Director of Harding, Loevner Funds, Inc. (6 portfolios); Trustee of Third Avenue Trust (5 portfolios); Trustee of Third Avenue Variable Trust (1 portfolio); Trustee of Aston Funds (26 portfolios). |
| |
Edward J. Kaier, 9/23/45 • Trustee since 2000 • Oversees 40 Funds in Fund Complex | | Attorney at Law and Partner, Teeters Harvey Gilboy & Kaier LLP (2007-Present); Attorney at Law and Partner, Hepburn Willcox Hamilton & Putnam, LLP (1977-2007); Trustee of Third Avenue Trust (5 portfolios); Trustee of Third Avenue Variable Trust (1 portfolio); Trustee of Aston Funds (26 portfolios). |
| |
Kurt Keibacker, 10/05/63 • Trustee since 2013 • Oversees 40 Funds in Fund Complex | | Managing Member, TechFund Europe (2000-Present); Managing Member, TechFund Capital (1997-Present) |
| |
Steven J. Paggioli, 4/03/50 • Trustee since 2000 • Oversees 40 Funds in Fund Complex | | Independent Consultant (2002-Present); Formerly Executive Vice President and Director, The Wadsworth Group (1986-2001); Executive Vice President, Secretary and Director, Investment Company Administration, LLC (1990-2001); Vice President, Secretary and Director, First Fund Distributors, Inc. (1991-2001); Trustee, Professionally Managed Portfolios (38 portfolios); Advisory Board Member, Sustainable Growth Advisors, LP; Independent Director, Chase Investment Counsel (2008 – Present); Trustee of Aston Funds (26 portfolios). |
| |
Richard F. Powers, III, 2/02/46 • Trustee since 2013 • Oversees 40 Funds in Fund Complex | | Adjunct Professor, Boston College (2011-Present); Director of Ameriprise Financial Inc. (2005-2009) |
| |
Eric Rakowski, 6/05/58 • Trustee since 2000 • Oversees 40 Funds in Fund Complex | | Professor, University of California at Berkeley School of Law (1990-Present); Director of Harding, Loevner Funds, Inc. (6 portfolios); Trustee of Third Avenue Trust (5 portfolios); Trustee of Third Avenue Variable Trust (1 portfolio); Trustee of Aston Funds (26 portfolios). |
| |
Victoria Sassine, 8/11/65 • Trustee since 2013 • Oversees 40 Funds in Fund Complex | | Lecturer, Babson College (2007 – Present) |
| | |
Name, Date of Birth, Number of
Funds Overseen in Fund
Complex* | | Principal Occupation(s) During
Past 5 Years and Other Directorships
Held by Trustee |
Thomas R. Schneeweis, 5/10/47 • Trustee since 2000 • Oversees 40 Funds in Fund Complex | | Professor Emeritus, University of Massachusetts (2013 - Present); Director, CISDM at the University of Massachusetts, (1996-Present); President, Alternative Investment Analytics, LLC, (formerly Schneeweis Partners, LLC) (2001-Present); Partner, S Capital Management, LLC (2007-Present); President, TRS Associates (1982-Present); Professor of Finance, University of Massachusetts (1977-2013); Partner, White Bear Partners, LLC (2007-2010); Partner, Northampton Capital Management, LLC (2004-2010); Trustee of Aston Funds (26 portfolios). |
* The Fund Complex consists of Managers AMG Funds, The Managers Funds, Managers Trust I and Managers Trust II. |
| |
| Interested Trustees | | |
|
| Each Trustee in the following table is an “interested person” of the Trust within the meaning of the 1940 Act. Ms. Carsman is an interested person of the Trust within the meaning of the 1940 Act by virtue of her position with, and interest in securities of, AMG, and her former position as Chief Legal Officer of the Trust. |
| |
Name, Date of Birth, Number of Funds Overseen in Fund
Complex* | | Principal Occupation(s) During Past
5 Years and Other Directorships
Held by Trustee |
Christine C. Carsman, 4/02/52 • Trustee since 2011 • Oversees 40 Funds in Fund Complex | | Senior Vice President and Deputy General Counsel, Affiliated Managers Group, Inc. (2011-Present); Senior Vice President and Chief Regulatory Counsel, Affiliated Managers Group, Inc. (2007-2011); Vice President and Chief Regulatory Counsel, Affiliated Managers Group, Inc. (2004-2007); Secretary and Chief Legal Officer, Managers AMG Funds, The Managers Funds, Managers Trust I and Managers Trust II (2004-2011); Senior Counsel, Vice President and Director of Operational Risk Management and Compliance, Wellington Management Company, LLP (1995-2004). |
| |
| Officers | | |
| |
Name, Date of Birth, Position(s)
Held with Fund and Length of
Time Served | | Principal Occupation(s) During
Past 5 Years |
Keitha L. Kinne, 5/16/58 • President since 2012 • Chief Operating Officer since 2007 | | Managing Partner and Chief Operating Officer, Managers Investment Group LLC (2007-Present); Chief Operating Officer, The Managers Funds, Managers AMG Funds and Managers Trust II (2007-Present); Chief Investment Officer, Managers Investment Group LLC (2008-Present); President, Managers Distributors, Inc. (2012-Present); Managing Director, Legg Mason & Co., LLC (2006-2007); Managing Director, Citigroup Asset Management (2004-2006). |
| |
Lewis Collins, 2/26/66 • Secretary since 2011 • Chief Legal Officer since 2011 | | Senior Vice President and Senior Counsel, Affiliated Managers Group, Inc. (2010-Present); Vice President and Senior Counsel, Affiliated Managers Group, Inc. (2006-2010); Senior Counsel, Affiliated Managers Group, Inc. (2002-2006); Attorney, Ropes & Gray LLP (1998-2002). |
Trustees and Officers (continued)
| | |
Name, Date of Birth, Position(s)
Held with Fund and Length of
Time Served | | Principal Occupation(s) During
Past 5 Years |
Donald S. Rumery, 5/29/58 • Chief Financial Officer since 2007 • Treasurer since 2000 | | Senior Vice President, Managers Investment Group LLC (2005-Present); Treasurer, The Managers Funds (1995-Present); Treasurer, Managers AMG Funds (1999-Present); Treasurer, Managers Trust II (2000-Present); Chief Financial Officer, The Managers Funds, Managers AMG Funds and Managers Trust II (2007-Present); Treasurer and Chief Financial Officer, Managers Distributors, Inc. (2000-2012); Vice President, The Managers Funds LLC, (1994-2004). |
| |
John J. Ferencz, 3/09/62 • Chief Compliance Officer since 2010 | | Vice President, Legal and Compliance, Managers Investment Group LLC (2010-Present); Senior Compliance Analyst, Mutual Funds and Regulatory, GE Asset Management Incorporated (2005-2010). |
| | |
Name, Date of Birth, Position(s)
Held with Fund and Length of
Time Served | | Principal Occupation(s) During
Past 5 Years |
Michael S. Ponder, 9/12/73 • Assistant Secretary since 2011 | | Senior Vice President and Counsel, Managers Investment Group LLC (2011-Present); Attorney, DeNovo Legal (2009-2010); Vice President, Credit Suisse (2007-2009); Associate, Willkie Farr & Gallagher LLP (2006-2007). |
| |
Matthew B. Wallace, 11/24/80 • Anti-Money Laundering Compliance Officer since 2012 | | Senior Associate, Legal and Compliance, Managers Investment Group LLC (2012-Present); Associate, Legal and Compliance, Managers Investment Group LLC (2010-2012); Compliance Specialist, Calamos Advisors LLC (2007-2010). |
Annual Renewal of Investment Management and Subadvisory Agreements
On June 20-21, 2013, the Board of Trustees, including a majority of the Trustees who are not “interested persons” of the Trust (the “Independent Trustees”), approved the Investment Management Agreement with the Investment Manager for Managers California Intermediate Tax-Free Fund (the “Fund”) and the Subadvisory Agreement for the Subadvisor. The Independent Trustees were separately represented by independent counsel in connection with their consideration of the approval of these agreements. In considering the Investment Management and Subadvisory Agreements, the Trustees reviewed a variety of materials relating to the Fund, the Investment Manager and the Subadvisor, including comparative performance, fee and expense information for an appropriate peer group of similar mutual funds (each a “Peer Group”), performance information for relevant benchmark indices (each a “Fund Benchmark”) and, with respect to the Subadvisor, comparative performance information for an appropriate peer group of managed accounts, and, as to all other matters, other information provided to them on a periodic basis throughout the year, as well as information provided in connection with the meetings of June 20-21, 2013, regarding the nature, extent and quality of services provided by the Investment Manager and the Subadvisor under their respective agreements. Prior to voting, the Independent Trustees: (a) reviewed the foregoing information with their independent legal counsel and with management; (b) received materials from their independent legal counsel discussing the legal standards applicable to their consideration of the Investment Management Agreement and the Subadvisory Agreement; and (c) met with their independent legal counsel in private sessions at which no representatives of management were present.
Nature, extent and quality of services.
In considering the nature, extent and quality of the services provided by the Investment Manager, the Trustees reviewed information relating to the Investment Manager’s operations and personnel. Among other things, the Investment Manager provided financial information, biographical information on its supervisory and professional staff and descriptions of its organizational and management structure. The Trustees also took into account information provided periodically throughout the previous year by the Investment Manager in Board meetings relating to the performance of its duties with respect to the Fund and the Trustees’ knowledge of the Investment Manager’s management and the quality of the performance of the Investment Manager’s duties. In the course of their deliberations regarding the Investment Management Agreement, the Trustees evaluated, among other things: (a) the extent and quality of the Investment Manager’s oversight of the operation and management of the Funds; (b) the quality of the search, selection and monitoring services performed by the Investment Manager in overseeing the portfolio management responsibilities of the Subadvisors; (c) the Investment Manager’s ability to supervise the Funds’ other service providers; and (d) the Investment Manager’s compliance program. The Trustees also took into account that, in performing its functions under the Investment Management Agreement and supervising the Subadvisor, the
Investment Manager: performs periodic detailed analysis and reviews of the performance by the Subadvisor of its obligations to the Fund, including without limitation a review of the Subadvisor’s investment performance in respect of the Fund; prepares and presents periodic reports to the Board regarding the investment performance of the Subadvisor and other information regarding the Subadvisor, at such times and in such forms as the Board may reasonably request; reviews and considers any changes in the personnel of the Subadvisor responsible for performing the Subadvisor’s obligations and makes appropriate reports to the Board; reviews and considers any changes in the ownership or senior management of the Subadvisor and makes appropriate reports to the Board; performs periodic in-person or telephonic diligence meetings, including with respect to compliance matters, with representatives of the Subadvisor; assists the Board and management of the Trust in developing and reviewing information with respect to the annual consideration of the Subadvisory Agreement; prepares recommendations with respect to the continued retention of the Subadvisor or the replacement of the Subadvisor; identifies potential successors to or replacements of the Subadvisor or potential additional Subadvisors, performs appropriate due diligence, and develops and presents to the Board a recommendation as to any such successor, replacement, or additional Subadvisor; designates and compensates from its own resources such personnel as the Investment Manager may consider necessary or appropriate to the performance of its services; and performs such other review and reporting functions as the Board shall reasonably request consistent with the Investment Management Agreement and applicable law. The Trustees also took into account the financial condition of the Investment Manager with respect to its ability to provide the services required under the Investment Management Agreement and the Investment Manager’s undertaking to maintain contractual expense limitations for the Fund. The Trustees also considered the Investment Manager’s risk management processes.
The Trustees also reviewed information relating to the Subadvisor’s operations and personnel and the investment philosophy, strategies and techniques used in managing the Fund. Among other things, the Trustees reviewed biographical information on portfolio management and other professional staff, information regarding the Subadvisor’s organizational and management structure and the Subadvisor’s brokerage policies and practices. The Trustees considered specific information provided regarding the experience of the individual(s) at the Subadvisor with portfolio management responsibility for the, including the information set forth in the Fund’s prospectus and statement of additional information. In the course of their deliberations, the Trustees evaluated, among other things: (a) the services rendered by the Subadvisor in the past; (b) the qualifications and experience of the Subadvisor’s personnel; and (c) the Subadvisor’s compliance program. The Trustees also took into account the financial condition of the Subadvisor with respect to its ability to provide the services required under its Subadvisory Agreement. The Trustees also considered the Subadvisor’s risk management processes.
Annual Renewal of Investment Management and Subadvisory Agreements (continued)
Performance.
As noted above, the Board considered the Fund’s net performance during relevant time periods as compared to the Fund’s Peer Group and Fund Benchmark and considered the Subadvisor’s performance as compared to an appropriate peer group of managed accounts and also considered the gross performance of the Fund or the portion of the Fund managed by the Subadvisor as compared to the Subadvisor’s relevant performance composite that utilizes the same investment strategy and approach and noted that the Board reviews on a quarterly basis detailed information about the Fund’s performance results, portfolio composition and Investment Strategy. The Board noted the Investment Manager’s expertise and resources in monitoring the performance, investment style and risk-adjusted performance of the Subadvisor. The Board was mindful of the Investment Manager’s attention to monitoring the Subadvisor’s performance with respect to the Fund and its discussions with management regarding the factors that contributed to the performance of the Fund.
Advisory Fees and Profitability.
In considering the reasonableness of the advisory fee charged by the Investment Manager for managing the Fund, the Trustees noted that the Investment Manager, and not the Fund, is responsible for paying the fees charged by the Fund’s Subadvisor and, therefore, that the fees paid to the Investment Manager cover the cost of providing portfolio management services as well as the cost of providing search, selection and monitoring services in operating a “manager-of-managers” complex of mutual funds. The Trustees also considered the amount of the advisory fee retained by the Investment Manager after payment of the subadvisory fee with respect to the Fund. The Trustees concluded that, in light of the additional high quality supervisory services provided by the Investment Manager and the fact that the subadvisory fees are paid out of the advisory fee, the advisory fee payable by the Fund to the Investment Manager can reasonably be expected to exceed the median advisory fee for the Peer Group, which consists of many funds that do not operate with a manager-of-managers structure. In this regard, the Trustees also noted that the Investment Manager has undertaken to maintain contractual expense limitations for the Fund.
In considering the reasonableness of the advisory fee payable to the Investment Manager, the Trustees also reviewed information provided by the Investment Manager setting forth all revenues and other benefits, both direct and indirect (including any so-called “fallout benefits” such as reputational value derived from the Investment Manager serving as Investment Manager to the Fund), received by the Investment Manager and its affiliates attributable to managing the Fund and all the mutual funds in the Managers Family of Funds, the cost of providing such services and the resulting profitability to the Investment Manager and its affiliates from these relationships. The Trustees also noted the current and potential asset levels of the Fund and the willingness of the Investment Manager to waive fees and pay expenses for the Fund from time to time as a means of limiting total expenses. The
Trustees also considered management’s discussion of the current asset levels of the Fund, and considered the impact on profitability of the current asset levels and any future growth of assets of the Fund. The Board took into account management’s discussion of the current advisory fee structure, and, as noted above, the services the Investment Manager provides in performing its functions under the Investment Management Agreement and supervising the Subadvisor. In this regard, the Trustees noted that, unlike a mutual fund that is managed by a single investment adviser, the Fund operates in a manager-of-managers structure. Based on the foregoing, the Trustees concluded that the profitability to the Investment Manager is reasonable and that the Investment Manager is not realizing material benefits from economies of scale that would warrant adjustments to the advisory fees for the Fund at this time. With respect to economies of scale, the Trustees also noted that as the Fund’s assets increase over time, the Fund may realize other economies of scale to the extent that the increase in assets is proportionally greater than the increase in certain other expenses.
Subadvisory Fees and Profitability.
In considering the reasonableness of the fee payable by the Investment Manager to the Subadvisor the Trustees relied on the ability of the Investment Manager to negotiate the terms of the Subadvisory Agreement at arm’s length as part of the manager-of-managers structure, noting that the Subadvisor is not affiliated with the Investment Manager. In addition, the Trustees considered other potential benefits of the subadvisory relationship to the Subadvisor, including, among others, the indirect benefits that the Subadvisor may receive from the Subadvisor’s relationship with the Fund, including any so-called “fallout benefits” to the Subadvisor, such as reputational value derived from the Subadvisor serving as Subadvisor to the Fund. In addition, the Trustees noted that the subadvisory fees are paid by the Investment Manager out of its advisory fee. As a consequence of all of the foregoing, the cost of services to be provided by the Subadvisor and the profitability to the Subadvisor of its relationship with the Fund were not material factors in the Trustees’ deliberations. For similar reasons, the Trustees did not consider potential economies of scale in the management of the Fund to be a material factor in their deliberations at this time.
The Trustees also noted that the subadvisory fees are paid by the Investment Manager out of its advisory fee. Also with respect to economies of scale, the Trustees noted that as the Fund’s assets increase over time, the Fund may realize other economies of scale to the extent the increase in assets is proportionally greater than the increase in certain other expenses.
In addition to the foregoing, the Trustees considered the specific factors and related conclusions set forth below.
Fund Performance.
Among other information relating to the Fund’s performance, the Trustees noted that the Fund’s performance for the 1-year, 3-year,
Annual Renewal of Investment Management and Subadvisory Agreements (continued)
5-year and 10-year periods ended March 31, 2013 was above the median performance of the Peer Group and above, above, slightly below and above, respectively, the performance of the Fund Benchmark, the Barclays 5-Year Municipal Bond Index. The Trustees took into account management’s discussion of the Fund’s performance, including the fact that the Fund ranked in the top quintile of the Peer Group for the 1-year and 10-year periods. The Trustees concluded that the Fund’s performance has been satisfactory.
Advisory Fees.
The Trustees noted that the Fund’s advisory fees (which include both the advisory and administration fee) and total expenses (net of applicable expense waivers/reimbursements) as of March 31, 2013 were higher and lower, respectively, than the average for the Peer Group. The Trustees took into account the fact that the Investment Manager has contractually agreed, through March 1, 2014, to limit the Fund’s net annual operating expenses (subject to certain excluded expenses) to 0.55%. The Board also took into account management’s discussion of the Fund’s expenses and the current size of the Fund. The Board noted that the Fund’s advisory fee contains breakpoints. The Trustees concluded that, in light of the nature, extent and quality of the services provided by the Investment Manager and the Subadvisor, the foregoing expense limitation and the considerations noted above with respect to the Subadvisor and the Investment Manager, the Fund’s advisory fees, including subadvisory fees, are reasonable.
* * * *
After consideration of the foregoing, the Trustees also reached the following conclusions (in addition to the conclusions discussed above) regarding the Investment Management Agreement and the Subadvisory Agreement: (a) the Investment Manager and the Subadvisor have demonstrated that they possess the capability and resources to perform the duties required of them under the Investment Management Agreement and the Subadvisory Agreement; (b) the Subadvisor’s Investment Strategy is appropriate for pursuing the Fund’s investment objectives; and (c) the Investment Manager and the Subadvisor maintain appropriate compliance programs.
Based on all of the above-mentioned factors and their related conclusions, with no single factor or conclusion being determinative and with each Trustee not necessarily attributing the same weight to each factor, the Trustees concluded that approval of the Investment Management Agreement and the Subadvisory Agreement would be in the best interests of the applicable Fund and its shareholders. Accordingly, on June 20-21, 2013, the Trustees, including a majority of the Independent Trustees, voted to approve the Investment Management Agreement and the Subadvisory Agreement (as applicable) for the Fund.
PROXY RESULTS
A special meeting of shareholders of Managers Trust I was held on July 2, 2013. With respect to the proposals to amend certain “fundamental” investment restrictions of the Funds, the meeting was adjourned to August 20, 2013 with respect to Managers California Intermediate Tax-Free Fund (the “Fund”). With respect to the proposals to amend and restate the Amended and Restated Declaration of Trust the meeting was adjourned to August 20, 2013, and October 22, 2013 with respect to the Fund. The proposals and results of the votes are summarized below.
| | | | | | | | |
| | | All Funds in Trust | |
| Managers Trust I | | For | | | Withheld | |
| Election of Directors | | (in $ NAV, rounded to the nearest dollar) | |
Bruce Bingham | | $ | 130,861,528 | | | $ | 4,865,035 | |
William E. Chapman, II | | | 130,740,436 | | | | 4,986,127 | |
Edward J. Kaier | | | 130,926,087 | | | | 4,800,475 | |
Steven J. Paggioli | | | 130,924,285 | | | | 4,802,277 | |
Erik Rakowski | | | 130,841,911 | | | | 4,884,651 | |
Thomas R. Schneeweis | | | 130,778,924 | | | | 4,947,639 | |
Christine C. Carsman | | | 131,045,716 | | | | 4,680,846 | |
Kurt Keilhacker | | | 130,714,266 | | | | 5,012,297 | |
Richard F. Powers III | | | 130,640,619 | | | | 5,085,943 | |
Victoria Sassine | | | 130,736,799 | | | | 4,989,763 | |
| | | | | | | | | | | | | | | | |
| | | Managers California Intermediate Tax-Free Fund | |
| | | For | | | Against | | | Abstain | | | Broker Non-Votes | |
| To amend “fundamental” restrictions of the Funds with respect to: | | (in $NAV, rounded to the nearest dollar) | |
Issuance of Senior Securities | | $ | 1,160,729 | | | $ | 32,378 | | | $ | 108,580 | | | $ | 93,231 | |
Borrowing | | | 1,108,542 | | | | 37,744 | | | | 155,402 | | | | 93,231 | |
Lending | | | 1,115,861 | | | | 30,425 | | | | 155,402 | | | | 93,231 | |
The Underwriting of Securities | | | 1,147,375 | | | | 43,035 | | | | 111,277 | | | | 93,231 | |
Purchasing and Selling Commodities | | | 1,149,149 | | | | 44,116 | | | | 108,422 | | | | 93,231 | |
Purchasing and Selling Real Estate | | | 1,151,824 | | | | 44,138 | | | | 105,725 | | | | 93,231 | |
Diversification of Investments | | | n/a | | | | n/a | | | | n/a | | | | n/a | |
Concentrating Investments in a Particular Industry | | | 1,175,361 | | | | 16,801 | | | | 109,525 | | | | 93,231 | |
| | | | | | | | | | | | | | | | |
| | | Managers California Intermediate Tax-Free Fund | |
| | | For | | | Against | | | Abstain | | | Broker Non-Votes | |
| To amend and restate the Agreement and Declaration of the Trust relating to: | | (in $NAV, rounded to the nearest dollar) | |
Declaration of Trust Amendment Procedures | | $ | 2,077,232 | | | $ | 35,443 | | | $ | 121,932 | | | $ | 93,231 | |
Merger, Consolidation, Sale of Assets and Termination of Trust, Series or Classes | | | 2,078,381 | | | | 29,350 | | | | 126,876 | | | | 93,231 | |
Other Changes | | | 2,028,161 | | | | 18,283 | | | | 188,164 | | | | 93,231 | |
28
PROXY RESULTS (continued)
| | | | | | | | | | | | | | | | |
| | | All Funds in Trust | |
| | | For | | | Against | | | Abstain | | | Broker Non-Votes | |
| To amend and restate the Agreement and Declaration of the Trust relating to: | | (in $NAV, rounded to the nearest dollar) | |
Declaration of Trust Amendment Procedures | | $ | 103,436,490 | | | $ | 6,791,454 | | | $ | 8,004,062 | | | $ | 31,237,912 | |
Merger, Consolidation, Sale of Assets and Termination of Trust, Series or Classes | | | 103,680,568 | | | | 6,329,177 | | | | 8,222,262 | | | | 31,237,912 | |
Other Changes | | | 102,553,456 | | | | 6,934,916 | | | | 8,743,634 | | | | 31,237,912 | |
29
|
THIS PAGE INTENTIONALLY LEFT BLANK |
|
THIS PAGE INTENTIONALLY LEFT BLANK |
THIS PAGE INTENTIONALLY LEFT BLANK
Investment Manager and Administrator
Managers Investment Group LLC
800 Connecticut Ave.
Norwalk, CT 06854
(800) 835-3879
Distributor
Managers Distributors, Inc.
800 Connecticut Ave.
Norwalk, CT 06854
(800) 835-3879
Custodian
The Bank of New York Mellon
2 Hanson Place
Legal Counsel
Ropes & Gray LLP
Prudential Tower, 800 Boylston Street
Boston, MA 02199-3600
Transfer Agent
BNY Mellon Investment Servicing (US) Inc.
Attn: Managers
P.O. Box 9769
Providence, RI 02940
(800) 548-4539
MANAGERS AND MANAGERS AMG FUNDS
| | | | | | |
EQUITY FUNDS | | | | BALANCED FUNDS |
| BRANDYWINE | | RENAISSANCE LARGE CAP GROWTH | | | | CHICAGO EQUITY PARTNERS BALANCED |
| BRANDYWINE BLUE | | Renaissance Group LLC | | | | Chicago Equity Partners, LLC |
| BRANDYWINE ADVISORS MIDCAP GROWTH | | | | | | |
| Friess Associates, LLC | | SKYLINE SPECIAL EQUITIES | | | | ALTERNATIVE FUNDS |
| | PORTFOLIO | | | | |
| CADENCE CAPITAL APPRECIATION | | Skyline Asset Management, L.P. | | | | FQ GLOBAL ALTERNATIVES |
| CADENCE MID-CAP | | | | | | FQ GLOBAL ESSENTIALS |
| CADENCE EMERGING COMPANIES | | SPECIAL EQUITY | | | | First Quadrant, L.P. |
| Cadence Capital Management, LLC | | Ranger Investment Management, L.P. | | | | |
| | Lord, Abbett & Co. LLC | | | | INCOME FUNDS |
| ESSEX SMALL/MICRO CAP GROWTH | | Smith Asset Management Group, L.P. | | | | BOND (MANAGERS) |
| Essex Investment Management Co., LLC | | Federated MDTA LLC | | | | GLOBAL INCOME OPPORTUNITY |
| | | | | | Loomis, Sayles & Co., L.P. |
| FQ TAX-MANAGED U.S. EQUITY | | SYSTEMATIC VALUE | | | | |
| FQ U.S. EQUITY | | SYSTEMATIC MID CAP VALUE | | | | |
| First Quadrant, L.P. | | Systematic Financial Management, L.P. | | | | BOND (MANAGERS PIMCO) |
| | | | | | Pacific Investment Management Co. LLC |
| FRONTIER SMALL CAP GROWTH | | TIMESSQUARE INTERNATIONAL | | | | |
| Frontier Capital Management Company, LLC | | SMALL CAP | | | | GW&K FIXED INCOME |
| | TIMESSQUARE MID CAP GROWTH | | | | GW&K MUNICIPAL BOND |
| GW&K SMALL CAP EQUITY | | TIMESSQUARE SMALL CAP GROWTH | | | | GW&K MUNICIPAL ENHANCED YIELD |
| Gannett Welsh & Kotler, LLC | | TSCM GROWTH EQUITY | | | | Gannett Welsh & Kotler, LLC |
| | TimesSquare Capital Management, LLC | | | | HIGH YIELD |
| MICRO-CAP | | | | | | J.P. Morgan Investment Management LLC |
| Lord, Abbett & Co. LLC | | TRILOGY GLOBAL EQUITY | | | | |
| WEDGE Capital Management L.L.P. | | TRILOGY EMERGING MARKETS EQUITY | | | | INTERMEDIATE DURATION GOVERNMENT |
| Next Century Growth Investors LLC | | TRILOGY INTERNATIONAL SMALL CAP | | | | SHORT DURATION GOVERNMENT |
| RBC Global Asset Management (U.S.) Inc. | | Trilogy Global Advisors, L.P. | | | | Amundi Smith Breeden LLC |
| | | | | | |
| REAL ESTATE SECURITIES | | YACKTMAN | | | | |
| CenterSquare Investment Management, Inc. | | YACKTMAN FOCUSED | | | | |
| | Yacktman Asset Management LP | | | | |
This report is prepared for the Funds’ shareholders. It is authorized for distribution to prospective investors only when preceded or accompanied by an effective prospectus. To receive a free copy of the prospectus or Statement of Additional Information, which includes additional information about Fund Trustees, please contact us by calling 800.835.3879. Distributed by Managers Distributors, Inc., member FINRA.
A description of the policies and procedures each Fund uses to vote its proxies is available: (i) without charge, upon request, by calling 800.835.3879, or (ii) on the Securities and Exchange Commission’s (SEC) Web site at www. sec.gov. For information regarding each Fund’s proxy voting record for the 12-month period ended June 30, call 800.835.3879 or visit the SEC Web site at www.sec.gov.
The Funds file their complete schedule of portfolio holdings with the SEC for the first and third quarters of each fiscal year on Form N-Q. The Funds’ Forms N-Q are available on the SEC’s Web site at www.sec.gov. A Fund’s Forms N-Q may be reviewed and copied at the SEC’s Public Reference Room in Washington, DC. Information on the operation of the Public Reference Room may be obtained by calling 800.SEC.0330. To review a complete list of the Funds’ portfolio holdings, or to view the most recent quarterly holdings report, semiannual report, or annual report, please visit www.managersinvest.com.
www.managersinvest.com

Registrant has adopted a Code of Ethics. See attached Exhibit (a)(1).
| Item 3. | AUDIT COMMITTEE FINANCIAL EXPERT |
Registrant’s Board of Trustees has determined that independent Trustees Mr. Edward J. Kaier and Mr. Steven J. Paggioli each qualify as the Audit Committee Financial Expert. Mr. Kaier and Mr. Paggioli are “independent” as such term is defined in Form N-CSR.
| Item 4. | PRINCIPAL ACCOUNTANT FEES AND SERVICES |
(a) Audit Fees
The aggregate fees billed by PwC to the Fund for the Funds’ two most recent fiscal years for professional services rendered for audits of annual financial statements, or services that are normally provided in connection with statutory and regulatory filings or engagements (“Audit Fees”) were as follows:
| | | | | | | | |
| | | Fiscal 2013 | | | Fiscal 2012 | |
Managers AMG FQ Tax-Managed U.S. Equity Fund | | | 14,074 | | | | 20,762 | |
Managers AMG FQ U.S. Equity Fund | | | 15,711 | | | | 20,548 | |
Managers AMG FQ Global Alternatives Fund | | | 17,231 | | | | 28,485 | |
Managers AMG FQ Global Essentials Fund | | | 16,548 | | | | 24,182 | |
Managers Frontier Small Cap Growth Fund | | | 15,572 | | | | 22,914 | |
Managers Micro-Cap Fund | | | 17,213 | | | | 17,402 | |
Managers Real Estate Securities Fund | | | 13,082 | | | | 19,976 | |
Managers PIMCO Bond Fund | | | 85,588 | | | | 64,657 | |
Managers CA Intermediate Tax-Free Fund | | | 19,590 | | | | 18,646 | |
Managers AMG TSCM Growth Equity Fund | | | 15,071 | | | | 16,932 | |
(b) Audit-Related Fees
There were no fees billed by PwC to the Fund in its two recent fiscal years for services rendered for assurance and related services that are reasonably related to the performance of the audit or review of the Fund’s financial statements, but are not reported as Audit Fees (“Audit-Related Fees”).
For the Funds’ two most recent fiscal years, there were no Audit-Related Fees billed by PwC for engagements related directly to the operations and financial reporting of one or more Funds by a Fund Service Provider. A Fund Service Provider is (a) any investment adviser to the Fund (not including any Subadvisor whose role is primarily portfolio management and is subcontracted with or overseen by another
investment adviser) or (b) any entity that provides ongoing services to the Fund and is controlling, controlled by or under common control with a Fund investment adviser described in (a).
(c) Tax Fees
The aggregate fees billed by PwC to the Funds for the two most recent fiscal years for professional services rendered for tax compliance, tax advice, and tax planning (“Tax Fees”) were as follows:
| | | | | | | | |
| | | Fiscal 2013 | | | Fiscal 2012 | |
Managers AMG FQ Tax-Managed U.S. Equity Fund | | | 7,000 | | | | 6,830 | |
Managers AMG FQ U.S. Equity Fund | | | 8,000 | | | | 6,830 | |
Managers AMG FQ Global Alternatives Fund | | | 10,000 | | | | 9,690 | |
Managers AMG FQ Global Essentials Fund | | | 10,000 | | | | 9,690 | |
Managers Frontier Small Cap Growth Fund | | | 7,000 | | | | 6,830 | |
Managers Micro-Cap Fund | | | 8,000 | | | | 6,830 | |
Managers Real Estate Securities Fund | | | 9,000 | | | | 8,930 | |
Managers PIMCO Bond Fund | | | 10,000 | | | | 10,710 | |
Managers CA Intermediate Tax-Free Fund | | | 7,750 | | | | 6,830 | |
Managers AMG TSCM Growth Equity Fund | | | 7,000 | | | | 5,610 | |
For the Funds’ two most recent fiscal years, Tax Fees billed by PwC for engagements by Fund Service Providers that related directly to the operations and financial reporting of the Funds were $0 for fiscal 2013 and $0 for fiscal 2012, respectively.
The services for which Tax Fees were charged comprise all services performed by professional staff in PwC’s tax division except those services related to the audit. Typically, this category would include fees for tax compliance, tax planning, and tax advice. Tax compliance, tax advice, and tax planning services include preparation of original and amended tax returns, claims for refund and tax payment-planning services, assistance with tax audits and appeals, tax advice related to mergers and acquisitions and requests for rulings or technical advice from taxing authorities.
(d) All Other Fees
There were no other fees billed by PwC to the Funds for all other non-audit services (“Other Fees”) during the Funds’ two most recent fiscal years. During the same period, there were no Other Fees billed by PwC for engagements by Fund Service Providers that related directly to the operations and financial reporting of the Funds.
According to policies adopted by the Audit Committee, services provided by PwC to the Funds must be pre-approved by the Audit Committee. On an annual basis, the Audit Committee reviews and pre-approves various types of services that PwC may perform for the Funds without specific
approval of each engagement, subject to specified budget limitations. As contemplated by the Sarbanes-Oxley Act of 2002 and related SEC rules, the Audit Committee also pre-approves non-audit services provided by PwC to any Fund Service Provider for any engagement that relates directly to the operations and financial reporting of the Funds. Any engagement that is not already pre-approved or that will exceed a pre-approved budget must be submitted to the Audit Committee for pre-approval. The Chairman of the Audit Committee is authorized on behalf of the Board of Trustees and the Audit Committee to approve the engagement of PwC to perform non-audit services subject to certain conditions, including notification to the Audit Committee of such pre-approval not later than the next meeting of the Audit Committee following the date of such pre-approval.
(e) (2) None.
(f) Not applicable.
(g) The aggregate fees billed by PwC in 2013 and 2012 for non-audit services rendered to the Funds and Fund Service Providers were $148,100 and $144,280, respectively. For the fiscal year ended October 31, 2013, this amount reflects the amounts disclosed above in Item 4(b),(c),(d), plus $64,350 in fees billed to the Fund Service Providers for non-audit services that did not relate directly to the operations and financial reporting of the Funds. For the fiscal year ended October 31, 2012, this amount reflects the amounts disclosed above in Item 4(b),(c),(d), plus $65,500 in fees billed to the Fund Service Providers for non-audit services that did not relate directly to the operations and financial reporting of the Funds.
(h) The Trust’s Audit Committee has considered whether the provision of non-audit services by registrant’s independent registered public accounting firm to the registrant’s investment advisor, and any entity controlling, controlled, or under common control with the investment advisor that provided ongoing services to the registrant that were not pre-approved by the Committee (because such services did not relate directly to the operations and financial reporting of the registrant) was compatible with maintaining the independence of the independent registered public accounting firm.
| Item 5. | AUDIT COMMITTEE OF LISTED REGISTRANTS |
Not applicable.
| Item 6. | SCHEDULE OF INVESTMENTS |
The schedule of investments in unaffiliated issuers as of the close of the reporting period is included as part of the shareholder report contained in Item 1 hereof.
| Item 7. | DISCLOSURE OF PROXY VOTING POLICIES AND PROCEDURES FOR CLOSED-END MANAGEMENT INVESTMENT COMPANIES |
Not applicable.
| Item 8. | PORTFOLIO MANAGERS OF CLOSED-END MANAGEMENT INVESTMENT COMPANIES |
Not applicable.
| Item 9. | PURCHASES OF EQUITY SECURITIES BY CLOSED-END MANAGEMENT INVESTMENT COMPANIES AND AFFILIATED PURCHASERS |
Not applicable.
| Item 10. | SUBMISSION OF MATTERS TO A VOTE OF SECURITY HOLDERS |
Not applicable.
| Item 11. | CONTROLS AND PROCEDURES |
(a) The Registrant’s principal executive and principal financial officers have concluded, based on their evaluation of the registrant’s disclosure controls and procedures as of a date within 90 days of the filing of this report, that the Registrant’s disclosure controls and procedures are reasonably designed to ensure that information required to be disclosed by the Registrant on Form N-CSR is recorded, processed, summarized and reported within the required time periods and that information required to be disclosed by the registrant in the reports that it files or submits on Form N-CSR is accumulated and communicated to the Registrant’s management, including its principal executive and principal financial officers, as appropriate to allow timely decisions regarding required disclosure.
(b) There were no changes in the Registrant’s internal control over financial reporting during the Registrant’s fourth fiscal quarter of the period covered by this report that have materially affected, or are reasonably likely to affect, the internal control over financial reporting.
| | |
| |
(a)(1) | | Any Code of Ethics or amendments hereto. Filed herewith. |
| |
(a)(2) | | Certifications pursuant to Rule 30a-2(a) under the Investment Company Act of 1940 - Filed herewith. |
| |
(a)(3) | | Not applicable. |
| |
(b) | | Certifications pursuant to Rule 30a-2(b) under the Investment Company Act of 1940 - Filed herewith. |
SIGNATURES
Pursuant to the requirements of the Securities Exchange Act of 1934 and the Investment Company Act of 1940, the registrant has duly caused this report to be signed on its behalf by the undersigned, thereunto duly authorized.
MANAGERS TRUST I
| | |
By: | | /s/ Keitha L. Kinne |
| | Keitha L. Kinne, Chief Operating Officer |
| |
Date: | | January 8, 2014 |
Pursuant to the requirements of the Securities Exchange Act of 1934 and the Investment Company Act of 1940, this report has been signed below by the following persons on behalf of the registrant and in the capacities and on the dates indicated.
| | |
By: | | /s/ Keitha L. Kinne |
| | Keitha L. Kinne, Chief Operating Officer |
| |
Date: | | January 8, 2014 |
| | |
By: | | /s/ Donald S. Rumery |
| | Donald S. Rumery, Chief Financial Officer |
| |
Date: | | January 8, 2014 |