UNITED STATES
SECURITIES AND EXCHANGE COMMISSION
Washington, D.C. 20549
FORM N-CSR
CERTIFIED SHAREHOLDER REPORT OF REGISTERED
MANAGEMENT INVESTMENT COMPANIES
Investment Company Act file number: 811-09521
AMG FUNDS I
(Exact name of registrant as specified in charter)
600 Steamboat Road, Suite 300, Greenwich, Connecticut 06830
(Address of principal executive offices) (Zip code)
AMG Funds LLC
600 Steamboat Road, Suite 300, Greenwich, Connecticut 06830
(Name and address of agent for service)
Registrant’s telephone number, including area code: (203) 299-3500
Date of fiscal year end: September 30
Date of reporting period: OCTOBER 1, 2014 – SEPTEMBER 30, 2015
(Annual Shareholder Report)
Item 1. Reports to Shareholders
| | | | |
 | | ANNUAL REPORT | | |
AMG Funds
September 30, 2015

AMG Managers Brandywine Fund: BRWIX
AMG Managers Brandywine Blue Fund: BLUEX
| | |
| www.amgfunds.com | | | AR073-0915 |
AMG Funds
Annual Report—September 30, 2015
| | | | |
TABLE OF CONTENTS | | PAGE | |
LETTER TO SHAREHOLDERS | | | 2 | |
| |
ABOUT YOUR FUND’S EXPENSES | | | 3 | |
| |
PORTFOLIO MANAGER’S COMMENTS, PORTFOLIO STATISTICS, AND SCHEDULES OF PORTFOLIO INVESTMENTS | | | | |
AMG Managers Brandywine Fund | | | 4 | |
AMG Managers Brandywine Blue Fund | | | 11 | |
| |
NOTES TO SCHEDULES OF PORTFOLIO INVESTMENTS | | | 17 | |
| |
FINANCIAL STATEMENTS | | | | |
| |
Statement of Assets and Liabilities | | | 19 | |
Balance sheets, net asset value (NAV) per share computations and cumulative undistributed amounts | | | | |
| |
Statement of Operations | | | 20 | |
Detail of sources of income, expenses, and realized and unrealized gains (losses) during the fiscal years | | | | |
| |
Statements of Changes in Net Assets | | | 21 | |
Detail of changes in assets for the past two fiscal years | | | | |
| |
Financial Highlights | | | 22 | |
Historical net asset values per share, distributions, total returns, income and expense ratios, turnover ratios and net assets | | | | |
| |
Notes to Financial Statements | | | 24 | |
Accounting and distribution policies, details of agreements and transactions with Fund management and affiliates, and descriptions of certain investment risks | | | | |
| |
REPORT OF INDEPENDENT REGISTERED PUBLIC ACCOUNTING FIRM | | | 30 | |
| |
ANNUAL RENEWAL OF INVESTMENT MANAGEMENT AND SUBADVISORY AGREEMENTS | | | 31 | |
| |
TRUSTEES AND OFFICERS | | | 34 | |
Nothing contained herein is to be considered an offer, sale or solicitation of an offer to buy shares of any series of the AMG Funds family of mutual funds. Such offering is made only by prospectus, which includes details as to offering price and other material information.
| | |
| | AMG Managers Brandywine Fund AMG Managers Brandywine Blue Fund |
DEAR FELLOW SHAREHOLDER:
Volatility marked the September quarter as China raised concerns about global economic conditions and uncertainty emerged regarding the U.S. Federal Reserve’s (the Fed) plan to hike interest rates. Sentiment took a clear turn for the worse in August, sending stocks into correction territory for the first time since 2011.
China spooked global markets in August by devaluing the yuan. With China’s growth rate already a key area of market interest, investors interpreted the move as an attempt to boost the nation’s slowing industrial sector by encouraging exports. The fallout was especially pronounced among Chinese stocks, with the Shanghai Composite losing more than one-fourth of its value in the September quarter.
Once considered a potential starting point for the Fed to raise interest rates, the central bank’s September meeting ended without action. At a subsequent press conference, Fed Chairwoman Janet Yellen noted,” The situation abroad bears close watching.” While most Fed officials believe a rate hike is still in the cards before the end of the year, investors worried that the global economy might be too fragile for tighter monetary policy anytime soon.
Market volatility spiked soon after China’s currency devaluation. The market was in full-fledged correction mode by August 24, with the S&P 500 Index more than 10 percent below its previous high (May 21). One of the most tranquil periods for stocks on record – the third-longest streak without a correction – was over.
Given our earnings-driven investment strategy, the AMG Managers Brandywine Funds hold companies on the economy’s leading edge. Companies that fall into that category took it on the chin in the September quarter as investors reassessed their economic expectations.
AMG Managers Brandywine Fund declined 9.1 percent in the three months through September as the Russell 3000® and Russell 3000® Growth Indexes declined 7.3 and 5.9 percent. AMG Managers Brandywine Blue Fund declined 7.0 percent during the quarter. The S&P 500, Russell 1000® and Russell 1000® Growth Indexes fell 6.4, 6.8 and 5.3 percent.
Qorvo, which makes technology and equipment used in communications transmission, beat the June-quarter consensus earnings estimate. That didn’t catch investor attention quite as much as some of the underlying detail did. Hitting the hot-button topic of the period, Qorvo reported slower-than-expected LTE base station construction in China and slower handset component sales to Chinese manufacturers. Qorvo was one of the most significant performance detractors in the Brandywine and Brandywine Blue portfolios.
Technology holdings represented Brandywine’s largest portfolio position. They accounted for the second largest concentration of assets in Brandywine Blue. While both Funds held positive exceptions, including LogMeIn in Brandywine and Facebook in Brandywine Blue, the technology sector was the biggest drag on performance versus benchmarks in the September quarter. Synchronoss Technologies (Brandywine) and Micron Technology (both Funds) were also notable detractors.
Consumer discretionary companies also weighed on performance as investors questioned previous assumptions about the economy. In Brandywine, where consumer discretionary holdings comprised the second largest portfolio position, the sector was the second greatest negative influence on performance relative to the Russell 3000® Growth Index.
Wearable camera maker GoPro (both Funds) beat estimates when it reported a fourfold increase in June-quarter earnings versus the same period a year ago. Still, slower-than-anticipated sales in its new Hero 4 product line and concerns about the pace of new product development carried more weight with investors than the company’s near-term results. Likewise, Diamond Resorts International (Brandywine) beat June-quarter estimates by earning $0.49 per share compared with a loss in the year-ago period. The company announced an acquisition during the height of the China-sparked volatility, and the deal was not well received.
The second biggest detractor from Brandywine Blue’s performance versus the Russell 1000® Growth Index was less about the companies the Fund held than it was about the companies it didn’t. Due to a relative lack of earnings strength among consumer staples companies, Brandywine Blue maintained limited exposure to the sector (two holdings) during the September quarter.
Thanks to Church & Dwight (Brandywine Blue only), the consumer staples sector generated a positive return for the Fund. However, Brandywine Blue’s small position in what was the best performing sector for the index during the quarter hurt relative performance. Said simply, investors became more risk-averse in the September quarter, and Brandywine Blue could have benefited from more exposure to consumer staples, which is traditionally considered to be a“defensive“sector in volatile times.
Bright spots for Brandywine included Skechers USA and Luxoft Holding, which exceeded expectations with 128 and 36 percent June-quarter earnings growth, respectively. Top contributors in Brandywine Blue included Nike (both Funds) and TJX Cos., (both Funds) which both topped earnings estimates in their most recently reported quarter.
For more information on companies that influenced September-quarter performance, please see Roses & Thorns on page 7 for Brandywine and page 14 for Brandywine Blue.
At the start of the December quarter, holdings from the technology, consumer discretionary and health care sectors represent Brandywine’s largest positions. Brandywine Blue’s largest sector positions are consumer discretionary, technology and health care. For more information on portfolio characteristics, please see page 6 for Brandywine and page 13 for Brandywine Blue.
Thanks for your confidence in our research-driven strategy and the team that implements it on your behalf. All of us at Friess Associates appreciate the opportunity to serve you.

Scott Gates
Chief Investment Officer
Friess Associates, LLC
About Your Fund’s Expenses
As a shareholder of a Fund, you may incur two types of costs: (1) transaction costs, which may include sales charges (loads) on purchase payments; redemption fees; and exchange fees; and (2) ongoing costs, including management fees; distribution (12b-1) fees; and other Fund expenses. This example is intended to help you understand your ongoing costs (in dollars) of investing in the Fund and to compare these costs with the ongoing costs of investing in other mutual funds. The example is based on $1,000 invested at the beginning of the period and held for the entire period as indicated below.
ACTUAL EXPENSES
The first line of the following table provides information about the actual account values and actual expenses. You may use the information in this line, together with the amount you invested, to estimate the expenses that you paid over the period. Simply divide your account value by $1,000 (for example, an $8,600 account value divided by $1,000 = 8.6), then multiply the result by the number in the first line under the heading entitled “Expenses Paid During Period” to estimate the expenses you paid on your account during this period.
HYPOTHETICAL EXAMPLE FOR COMPARISON PURPOSES
The second line of the following table provides information about hypothetical account values and hypothetical expenses based on the Fund’s actual expense ratio and an assumed annual rate of return of 5% before expenses, which is not the Fund’s actual return. The hypothetical account values and expenses may not be used to estimate the actual ending account balance or expenses you paid for the period. You may use this information to compare the ongoing costs of investing in the Fund and other funds by comparing this 5% hypothetical example with the 5% hypothetical examples that appear in the shareholder reports of other funds.
Please note that the expenses shown in the table are meant to highlight your on going costs only and do not reflect any transactional costs, such as sales charges (loads), redemption fees, or exchange fees. Therefore, the second line of the table is useful in comparing ongoing costs only, and will not help you determine the relative total costs of owning different funds.
| | | | | | | | | | | | | | | | |
| Six Months Ended September 30, 2015 | | Expense
Ratio for
the Period | | | Beginning
Account Value
4/01/15 | | | Ending
Account Value
9/30/15 | | | Expenses
Paid During
the Period* | |
AMG Managers Brandywine Fund | |
Based on Actual Fund Return | | | 1.12 | % | | $ | 1,000 | | | $ | 923 | | | $ | 5.39 | |
Hypothetical (5% return before expenses) | | | 1.12 | % | | $ | 1,000 | | | $ | 1,019 | | | $ | 5.66 | |
AMG Managers Brandywine Blue Fund | |
Based on Actual Fund Return | | | 1.20 | % | | $ | 1,000 | | | $ | 919 | | | $ | 5.78 | |
Hypothetical (5% return before expenses) | | | 1.20 | % | | $ | 1,000 | | | $ | 1,019 | | | $ | 6.08 | |
| * | Expenses are equal to the Fund’s annualized expense ratio multiplied by the average account value over the period, multiplied by the number of days in the most recent fiscal half-year (183), then divided by 365. |
3
AMG Managers Brandywine Fund
Portfolio Manager’s Comments
The stock market’s extended period of calm reached well into the fiscal year, with share prices reflecting continued investor optimism throughout the period’s first half. Sentiment wavered in the spring before deteriorating in the summer, leaving a mix of small gains and losses among major market barometers at the end of the 12 months through September 30, 2015.
AMG Managers Brandywine Fund (“Brandywine”) grew 3.9 percent in its fiscal year through September. Its benchmark, the Russell 3000® Growth Index, gained 3.2 percent. Brandywine and the index posted positive returns in the first three quarters of the year, then surrendered ground as stock prices corrected in the period’s final quarter.
One of the fiscal year’s most noteworthy developments, a major decline in oil prices, began in earnest during the first three months of the period, the December quarter of 2014. Amid conservative expectations for global growth and booming oil production in the U.S.,oil prices plummeted 40 percent in the three months through December. Given that and other macro issues to consider, investors generally chose to favor positive interpretations of the events that unfolded in the December quarter. Positive earnings results, outside of energy, contributed to the optimism.
Due to a lack of earnings strength in the sector, Brandywine’s direct exposure to energy was minimal. That ultimately proved to be the most significant contributor to December-quarter performance relative to the Russell 3000® Growth Index, where energy was the poorest performing sector.
Earnings strength among technology holdings also aided results, with 12 of the 13 companies that generated the portfolio’s relative advantage over
the index reporting expectation-beating earnings growth during the quarter. Industrial holdings were notable detractors, as the outlook for energy-related projects dimmed along with the fall in oil prices.Brandywine’s December-quarter return led the benchmark’s gain.
While January proved a tough month for stocks due to macroeconomic concerns, the market’s mood improved as the March quarter wore on and earnings season unfolded.
During the March quarter, Brandywine benefited from earnings strength demonstrated by holdings in the technology sector, such as Apple Inc., and the consumer discretionary sector, such as Columbia Sportswear Co. The industrial sector detracted the most from relative performance, as equipment rental companies H&E Equipment Services and United Rentals declined on concerns that lower oil prices would reduce demand for equipment used in energy-related projects. In what was the strongest quarter of the fiscal year for Brandywine and the benchmark, Brandywine outperformed.
In the June quarter, mixed economic data stoked debate as to when the U.S.Federal Reserve (the Fed) was most likely to begin acting on its telegraphed intention to raise interest rates in the not-too-distant future. Concerns grew about China, which reported its slowest pace of quarterly economic growth in six years during the period. Enthusiasm gave way to caution in the quarter, but Brandywine and its benchmark both managed to post positive returns in the period.
Financial holdings, insurers in particular, contributed the most to results versus the benchmark. Technology holdings continued to provide a significant supporting boost. At the other end, industrial holdings detracted the most from
relative results for the third consecutive quarter, with railcar makers detracting the most in this instance. Brandywine outperformed the Russell 3000® Growth Index for the third straight quarter.
After peaking May 21 and retesting that 52-week high only two months later, stocks retreated into correction territory during August (using the S&P 500 Index as a guide). The first correction (a decline of at least 10 percent from a previous high) since 2011 was marked by a return of volatility, with many familiar topics, including the Fed’s interest-rate intentions and slower growth in China, among other things, gaining renewed power to influence the market’s direction.
Brandywine and its benchmark posted quarterly declines for the first time in the fiscal year. It was also the only quarter in which the benchmark fared better than the Fund. Viewed to be among the most economically sensitive, the technology and consumer discretionary sectors detracted the most from Brandywine’s performance relative to the Russell 3000® Growth Index.
When assessing the fiscal year as a whole, health care holdings contributed the most to Brandywine’s performance versus the benchmark, followed by technology holdings. Holdings from the industrial and consumer staples sectors detracted most. Skechers USA, Luxoft Holding, Delta Air Lines and Ruckus Wireless were top contributors to performance versus the benchmark for the fiscal year. Synchronoss Technologies, GoPro, Qorvo and Google were top detractors.
This commentary reflects the viewpoints of Friess Associates, LLC as of September 30, 2015 and is not intended as a forecast or guarantee of future results.
4
AMG Managers Brandywine Fund
Portfolio Manager’s Comments (continued)
CUMULATIVE TOTAL RETURN PERFORMANCE
AMG Managers Brandywine Fund’s cumulative total return is based on the daily change in net asset value (NAV), and assumes that all dividends and distributions were reinvested. This graph compares a hypothetical $10,000 investment made in AMG Managers Brandywine Fund on September 30, 2005, to a $10,000 investment made in the Russell 3000® Growth Index, Russell 3000® Index and S&P 500 Index for the same time period. The graph and table do not reflect the deduction of taxes that a shareholder would pay on a Fund distribution or redemption of shares. The listed returns for the Fund are net of expenses and the returns for the index exclude expenses.
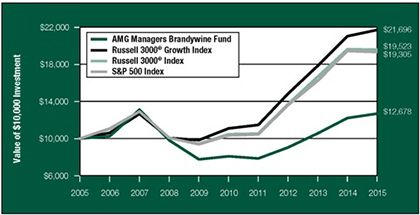
The table below shows the average annual total returns for the AMG Managers Brandywine Fund and the Russell 3000® Growth Index, Russell 3000® Index and S&P 500 Index for the same time periods ended September 30, 2015.
| | | | | | | | | | | | |
| Average Annual Total Returns1 | | One
Year | | | Five
Years | | | Ten
Years | |
AMG Managers Brandywine Fund2,3,4,5 | | | 3.88 | % | | | 9.42 | % | | | 2.40 | % |
Russell 3000® Growth Index6 | | | 3.21 | % | | | 14.38 | % | | | 8.05 | % |
Russell 3000® Index7 | | | (0.49 | )% | | | 13.28 | % | | | 6.92 | % |
S&P 500 Index8 | | | (0.61 | )% | | | 13.34 | % | | | 6.80 | % |
The performance data shown represents past performance. Past performance is not a guarantee of future results. Current performance may be lower or higher than the performance data quoted. The investment return and principal value of an investment in the Fund will fluctuate so that an investor’s shares, when redeemed, may be worth more or less than their original cost.
Investors should carefully consider the Fund’s investment objectives, risks, charges, and expenses before investing. For performance information through the most recent month end, current net asset values per share for the Fund and other information, please call (800) 835-3879 or visit our website at www.amgfunds.com for a free prospectus. Read it carefully before investing or sending money.
Distributed by AMG Distributors, Inc., member FINRA/SIPC.
| 1 | Total return equals income yield plus share price change and assumes reinvestment of all dividends and capital gain distributions. Returns are net of fees and may reflect offsets of Fund expenses as described in the prospectus. No adjustment has been made for taxes payable by shareholders on their reinvested dividends and capital gain distributions. Returns for periods greater than one year are annualized. The listed returns on the Fund are net of expenses and based on the published NAV as of September 30, 2015. All returns are in U.S. dollars ($). |
| 2 | The Fund inception dates and returns for all periods prior to October 1, 2013, reflect performance of the Predecessor Fund, Brandywine Fund, Inc., and was managed by Friess Associates, LLC with the same investment objective and substantially similar investment policies. |
| 3 | The Fund invests in growth stocks, which may be more sensitive to market movements because their prices tend to reflect future investor expectations rather than just current profits. Growth stocks may underperform value stocks during given periods. |
| 4 | Investments in international securities are subject to certain risks of overseas investing including currency fluctuations and changes in political and economic conditions, which could result in significant market fluctuations. These risks are magnified in emerging markets. |
| 5 | The Fund is subject to risks associated with investments in small- and mid-capitalization companies, such as erratic earnings patterns, competitive conditions, limited earnings history, and a reliance on one or a limited number of products. |
| 6 | The Russell 3000® Growth Index measures the performance of those Russell 3000® Index companies with higher price-to-book ratios and higher forecasted growth values. Unlike the Fund, the Russell 3000® Growth Index is unmanaged, is not available for investment and does not incur expenses. |
| 7 | The Russell 3000® Index is composed of the 3,000 largest U.S.companies as measured by market capitalization and represents about 98% of the U.S. stock market. Unlike the Fund, the Russell 3000® Index is unmanaged, is not available for investment and does not incur expenses. |
| 8 | The S&P 500 Index is a capitalization-weighted index of 500 stocks. The S&P 500 Index is designed to measure performance of the broad domestic economy through changes in the aggregate market value of 500 stocks representing all major industries. Unlike the Fund, the S&P 500 Index is unmanaged, is not available for investment and does not incur expenses. |
The Russell 3000® Growth Index and Russell 3000® Index are registered trademarks of Russell Investments. Russell® is a trademark of Russell Investments.
The S&P 500 Index is proprietary data of Standard & Poor’s,a division of McGraw-Hill Companies, Inc. All rights reserved.
Not FDIC insured, nor bank guaranteed. May lose value.
5
AMG Managers Brandywine Fund
Fund Snapshots (unaudited)
September 30, 2015
PORTFOLIO BREAKDOWN
| | | | | | | | | | | | | | | | |
Industry (Top Ten) | | AMG
Managers
Brandywine
Fund* | | | Russell
3000®
Growth
Index | | | Russell
3000®
Index | | | S&P 500
Index | |
Semiconductors | | | 6.8 | % | | | 2.2 | % | | | 2.4 | % | | | 2.4 | % |
Application Software | | | 6.4 | % | | | 5.5 | % | | | 4.1 | % | | | 4.0 | % |
Internet Retail | | | 4.8 | % | | | 3.2 | % | | | 1.7 | % | | | 1.9 | % |
Internet Software & Services | | | 4.6 | % | | | 6.5 | % | | | 3.5 | % | | | 3.8 | % |
Health Care Facilities | | | 4.0 | % | | | 3.8 | % | | | 2.7 | % | | | 2.8 | % |
Cable & Satellite | | | 3.6 | % | | | 5.1 | % | | | 3.3 | % | | | 3.2 | % |
Apparel, Accessories & Luxury Goods | | | 3.4 | % | | | 1.7 | % | | | 1.0 | % | | | 1.0 | % |
Health Care Equipment | | | 3.2 | % | | | 2.1 | % | | | 2.2 | % | | | 2.0 | % |
Footwear | | | 3.2 | % | | | 4.7 | % | | | 2.7 | % | | | 2.7 | % |
Pharmaceuticals | | | 3.1 | % | | | 3.4 | % | | | 4.8 | % | | | 5.7 | % |
Other Common Stock | | | 54.1 | % | | | 61.8 | % | | | 71.6 | % | | | 70.5 | % |
Cash & Cash Equivalent† | | | 2.8 | % | | | 0.0 | % | | | 0.0 | % | | | 0.0 | % |
| * | As a percentage of net assets. |
| † | Includes Other Assets and Liabilities. |
PORTFOLIO MARKET CAPITALIZATION

TOP TEN HOLDINGS
| | | | | | | | |
Security Name | | % of
Net Assets | | | % Change
from Book
Cost | |
The Priceline Group, Inc. | | | 2.5 | % | | | 3.4 | % |
Facebook, Inc., Class A* | | | 2.5 | | | | 33.6 | |
Amazon.com, Inc. | | | 2.2 | | | | 31.5 | |
Comcast Corp., Class A* | | | 2.1 | | | | 9.7 | |
Google, Inc., Class A | | | 2.1 | | | | -7.3 | |
Electronic Arts, Inc. | | | 2.0 | | | | -7.1 | |
KAR Auction Services, Inc. | | | 2.0 | | | | 9.1 | |
Spirit AeroSystems Holdings, Inc., Class A* | | | 2.0 | | | | 25.2 | |
VF Corp. | | | 2.0 | | | | 62.1 | |
Avago Technologies, Ltd.* | | | 1.9 | | | | 48.9 | |
| | | | | | | | |
Top Ten as a Group | | | 21.3 | % | | | | |
| | | | | | | | |
| * | Also Top Ten Holding as of June 30, 2015. |
ESTIMATED EARNINGS GROWTH RATE
OF THE FUND’S INVESTMENTS
Forecasted Increase in Earnings Per Share 2016 vs 2015
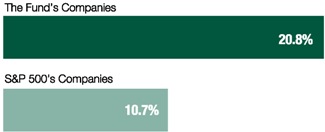
Source: Consensus estimates from FactSet Research Systems Inc.
This is not a forecast of the Fund’s future performance. Earnings growth for a Fund holding does not guarantee a corresponding increase in the market value of the holding or the Fund.
Because a fund’s strategy may result in multiple investments in particular sectors of the economy, its performance may depend on the performance of those sectors and may fluctuate more widely than investments diversified across more sectors. For additional information on these and other risk considerations, please see the Fund’s prospectus.
Any sectors, industries, or securities discussed should not be perceived as investment recommendations. Mention of a specific security should not be considered a recommendation to buy or solicitation to sell that security. Specific securities mentioned in this report may have been sold from the Fund’s portfolio of investments by the time you receive this report.
6
AMG Managers Brandywine Fund
Roses and Thorns (unaudited)
Quarter Ending September 30, 2015
| | | | | | | | |
$ Gain (in millions) | | % Gain | | | Biggest $ Winners | | Reason for Move |
| | | | | | |
| $ 3.8 | | | 25.0 | % | | Skechers U.S.A. Inc. (SKX) The footwear company grew June-quarter earnings 128 percent. Sales gains across multiple product lines drove 36 percent revenue growth on strong same-store sales. Skechers global backlog increased 40 percent, showing strength in domestic and international markets. The company announced a three-for-one stock split in August. |
| $ 2.6 | | | 17.9 | % | | Amazon.com Inc. (AMZN) The Internet retailer reported June-quarter earnings of $0.19 per share, topping the consensus estimate. Accelerating international growth and strong Amazon Web Service demand drove a better-than-expected 27 percent revenue increase. While Amazon continues to invest aggressively, improved operating efficiencies contributed to gross margin expansion. |
| $ 1.6 | | | 13.8 | % | | LogMeln Inc. (LOGM) The provider of remote access, support and collaboration solutions grew earnings 21 percent in the June quarter. Revenue increased 18 percent, driven by its collaboration product Join Me. LogMeIn’s decision to discontinue free remote access solutions contributed to price gains. |
| $ 1.3 | | | 11.9 | % | | Luxoft Holdings Inc. (LXFT) The software developer grew June-quarter earnings 36 percent, driven by 32 percent revenue growth. Shares gained during the quarter as the company raised revenue and earnings guidance for the remainder of the year. New deals in the financial service and automotive industries helped improve earnings visibility. |
| $ 1.2 | | | 9.2 | % | | Delta Air Lines Inc. (DAL) The provider of air transportation for passengers and cargo grew June-quarter earnings 22 percent, marking its ninth consecutive quarterly profit. Cost controls and fuel savings drove increased operating margins. Industry-wide seating capacity expansion moderated, providing support to pricing and free cash flow generation. |
| | | |
$ Loss
(in millions) | | % Loss | | | Biggest $ Losers | | Reason for Move |
| | | | | | |
| $ 5.8 | | | 10.5 | % | | Apple Inc. (AAPL) The designer and manufacturer of computers and mobile communications devices grew June-quarter earnings 44 percent, beating the consensus estimate. Shares traded lower on concerns iPhone sales to China would slow. Later in the quarter, Apple CEO Tim Cook announced that China sales were accelerating. |
| $ 4.2 | | | 28.3 | % | | Synchronoss Technologies Inc. (SNCR) The provider of communications activation management software and cloud storage reported June-quarter earnings of $0.56 per share, beating the consensus estimate by 10 percent. Shares declined due to concerns regarding a major customer’s commitment to Synchronoss’ personal cloud platform. We continue to hold Synchronoss as it expands its cloud platform with other carriers. |
| $ 4.1 | | | 29.7 | % | | Qorvo Inc. (QRVO) The provider of core technologies and radio frequency solutions for mobile communications reported June-quarter earnings of $1.09 per share, topping the consensus estimate. Shares declined in reaction to a delay of LTE base station build outs in China and slower hand set component sales to Chinese manufacturers. We sold Qorvo to fund a new holding with better visibility. |
| $ 3.8 | | | 33.7 | % | | GoPro Inc. (GPRO) The manufacturer of mountable and wearable cameras and accessories reported 337 percent June-quarter earnings growth, topping the consensus estimate by $0.09. Shares traded lower in the quarter due to slower-than-expected sales of the new Hero 4 Session camera and concerns about the pace of new product development. We sold GoPro to fund a new holding with greater near-term visibility. |
| $ 2.9 | | | 22.2 | % | | Micron Technology Inc. (MU) The manufacturer of DRAM and other memory semiconductors reported May-quarter earnings of $0.54 per share, falling short of the consensus estimate. Despite recent stability provided by industry consolidation, pricing came under pressure during the period. We sold Micron Technology to fund a new opportunity with better earnings visibility. |
All gains/losses are calculated on an average cost basis from June 30, 2015 through September 30, 2015.
This commentary reflects the viewpoints of Friess Associates, LLC as of September 30, 2015 and is not intended as a forecast or guarantee of future results.
7
AMG Managers Brandywine Fund
Schedule of Portfolio Investments
September 30, 2015
| | | | | | | | | | |
Shares | | | | Cost | | | Value | |
Common Stocks - 97.2% | | | | | |
Consumer Discretionary | | | | | |
| | Apparel Retail - 3.0% | | | | | | | | |
| 703,510 | | American Eagle Outfitters, Inc. | | $ | 10,226,896 | | | $ | 10,995,861 | |
| 128,329 | | The Finish Line, Inc., Class A | | | 3,306,013 | | | | 2,476,750 | |
| 130,910 | | The TJX Cos., Inc. | | | 7,803,810 | | | | 9,349,592 | |
| | Apparel, Accessories & Luxury Goods - 3.4% | | | | | |
| 173,480 | | G-III Apparel Group, Ltd.* | | | 12,363,647 | | | | 10,696,777 | |
| 221,430 | | VF Corp. | | | 9,319,939 | | | | 15,103,740 | |
| | Automotive Retail - 1.5% | | | | | | | | |
| 99,855 | | Murphy USA, Inc. | | | 5,505,732 | | | | 5,487,032 | |
| 22,835 | | O’Reilly Automotive, Inc.* | | | 5,397,549 | | | | 5,708,750 | |
| | Cable & Satellite - 3.6% | | | | | |
| 67,695 | | Charter Communications, Inc., Class A*,1 | | | 12,458,060 | | | | 11,904,166 | |
| 277,935 | | Comcast Corp., Class A | | | 14,404,856 | | | | 15,808,943 | |
| | Footwear - 3.2% | | | | | | | | |
| 585,430 | | Crocs, Inc.* | | | 8,853,096 | | | | 7,566,683 | |
| 26,720 | | NIKE, Inc., Class B | | | 1,982,275 | | | | 3,285,758 | |
| 18,235 | | Skechers U.S.A., Inc., Class A* | | | 918,585 | | | | 2,444,949 | |
| 295,485 | | Steven Madden, Ltd.* | | | 11,673,566 | | | | 10,820,661 | |
| | General Merchandise Stores - 1.9% | | | | | |
| 86,625 | | Ollie’s Bargain Outlet Holdings, Inc.* | | | 1,811,714 | | | | 1,400,726 | |
| 161,450 | | Target Corp. | | | 13,096,459 | | | | 12,699,657 | |
| | Home Furnishings - 1.1% | | | | | |
| 118,550 | | Tempur Sealy International, Inc.* | | | 8,912,171 | | | | 8,468,027 | |
| | Hotels, Resorts & Cruise Lines - 1.7% | | | | | |
| 554,865 | | Hilton Worldwide Holdings, Inc. | | | 15,533,497 | | | | 12,728,603 | |
| | Household Appliances - 1.3% | | | | | |
| 111,810 | | Helen of Troy, Ltd.* | | | 8,529,249 | | | | 9,984,633 | |
| | Internet Retail - 4.8% | | | | | | | | |
| 33,000 | | Amazon.com, Inc.* | | | 12,842,854 | | | | 16,892,370 | |
| 15,564 | | The Priceline Group, Inc.* | | | 18,624,496 | | | | 19,250,489 | |
| | Leisure Products - 0.1% | | | | | | | | |
| 56,689 | | MCBC Holdings, Inc.* | | | 853,938 | | | | 734,689 | |
| | Restaurants - 0.3% | | | | | | | | |
| 39,045 | | Papa John’s International, Inc. | | | 2,646,780 | | | | 2,673,802 | |
| | Specialty Stores - 1.6% | | | | | | | | |
| 239,545 | | Dick’s Sporting Goods, Inc. | | | 12,294,479 | | | | 11,883,827 | |
| | | | | | | | | | |
Total Consumer Discretionary | | | 199,359,661 | | | | 208,366,485 | |
| | This sector is 4.5% above your Fund’s cost. | |
Consumer Staples | | | | | | | | |
| | Food Retail - 0.1% | | | | | | | | |
| 24,890 | | The Kroger Co. | | | 928,146 | | | | 897,782 | |
| | This sector is 3.3% below your Fund’s cost. | |
| | | | | | | | | | |
Shares | | | | Cost | | | Value | |
Energy | | | | | |
| | Oil & Gas Equipment & Services - 0.9% | |
| 1,628,865 | | McDermott International, Inc.*,1 | | $ | 7,020,561 | | | $ | 7,004,120 | |
| | This sector is 0.2% below your Fund’s cost. | |
Financials | | | | | |
| | Hotel & Resort REITs - 0.7% | |
| 149,510 | | Pebblebrook Hotel Trust | | | 5,652,952 | | | | 5,300,130 | |
| | Property & Casualty Insurance - 2.9% | |
| 205,090 | | The Allstate Corp. | | | 12,117,849 | | | | 11,944,442 | |
| 279,320 | | FNF Group | | | 10,257,915 | | | | 9,907,480 | |
| | Specialized Finance - 1.7% | |
| 137,535 | | CME Group, Inc. | | | 12,922,783 | | | | 12,754,996 | |
| | Specialized REITs - 1.5% | | | | | |
| 134,420 | | American Tower Corp. | | | 13,179,075 | | | | 11,826,272 | |
| | | | | | | | | | |
Total Financials | | | 54,130,574 | | | | 51,733,320 | |
| | This sector is 4.4% below your Fund’s cost. | |
Health Care | | | | | |
| | Biotechnology - 1.4% | |
| 111,025 | | Gilead Sciences, Inc. | | | 11,358,593 | | | | 10,901,545 | |
| | Health Care Equipment - 3.2% | |
| 713,575 | | Boston Scientific Corp.* | | | 12,650,222 | | | | 11,709,766 | |
| 211,380 | | Integra LifeSciences Holdings Corp.* | | | 12,998,749 | | | | 12,587,679 | |
| | Health Care Facilities - 4.0% | |
| 152,390 | | Acadia Healthcare Co., Inc.* | | | 11,118,819 | | | | 10,098,885 | |
| 99,655 | | HCA Holdings, Inc.* | | | 8,249,011 | | | | 7,709,311 | |
| 233,460 | | VCA, Inc.* | | | 11,924,132 | | | | 12,291,669 | |
| | Health Care Services - 1.1% | |
| 139,260 | | AMN Healthcare Services, Inc.* | | | 4,262,446 | | | | 4,179,193 | |
| 138,725 | | Diplomat Pharmacy, Inc.* | | | 2,109,657 | | | | 3,985,569 | |
| 4,980 | | Teladoc, Inc.*,1 | | | 94,620 | | | | 111,004 | |
| | Health Care Supplies - 0.9% | |
| 209,085 | | LDR Holding Corp.* | | | 8,346,476 | | | | 7,219,705 | |
| | Health Care Technology - 0.9% | | | | | |
| 300,590 | | HealthStream, Inc.* | | | 8,441,486 | | | | 6,555,868 | |
| | Life Sciences Tools & Services - 1.5% | |
| 93,570 | | Thermo Fisher Scientific, Inc. | | | 12,353,590 | | | | 11,441,740 | |
| | Managed Health Care - 1.4% | |
| 91,780 | | UnitedHealth Group, Inc. | | | 7,086,243 | | | | 10,647,398 | |
| | Pharmaceuticals - 3.1% | |
| 142,925 | | Eli Lilly & Co. | | | 11,600,025 | | | | 11,961,393 | |
| 373,160 | | Pfizer, Inc. | | | 12,844,023 | | | | 11,720,956 | |
| | | | | | | | | | |
Total Health Care | | | 135,438,092 | | | | 133,121,681 | |
| | This sector is 1.7% below your Fund’s cost. | |
The accompanying notes are an integral part of these financial statements.
8
AMG Managers Brandywine Fund
Schedule of Portfolio Investments (continued)
| | | | | | | | | | |
Shares | | | | Cost | | | Value | |
Industrials | | | | | |
| | Aerospace & Defense - 2.0% | | | | | |
| 314,125 | | Spirit AeroSystems Holdings, Inc., Class A* | | $ | 12,129,505 | | | $ | 15,184,802 | |
| | Airlines - 1.9% | | | | | | | | |
| 323,180 | | Delta Air Lines, Inc. | | | 14,954,784 | | | | 14,501,087 | |
| | Building Products - 0.7% | | | | | |
| 95,355 | | Universal Forest Products, Inc. | | | 5,077,687 | | | | 5,500,076 | |
| | Construction & Engineering - 0.1% | | | | | |
| 36,028 | | Comfort Systems USA, Inc. | | | 951,715 | | | | 982,123 | |
| | Construction Machinery & Heavy Trucks - 1.4% | | | | | |
| 117,980 | | Wabtec Corp. | | | 3,185,758 | | | | 10,388,139 | |
| | Diversified Support Services - 2.0% | | | | | |
| 430,000 | | KAR Auction Services, Inc. | | | 13,991,281 | | | | 15,265,000 | |
| | Human Resources & Employment Services - 1.7% | | | | | |
| 129,860 | | ManpowerGroup, Inc. | | | 11,277,834 | | | | 10,634,235 | |
| 49,980 | | On Assignment, Inc.* | | | 1,842,749 | | | | 1,844,262 | |
| | Research & Consulting Services - 1.6% | | | | | |
| 271,830 | | The Advisory Board Co.* | | | 13,578,851 | | | | 12,379,138 | |
| | | | | | | | | | |
Total Industrials | | | 76,990,164 | | | | 86,678,862 | |
| | This sector is 12.6% above your Fund’s cost. | |
Information Technology | | | | | | | | |
| | Application Software - 6.4% | | | | | |
| 145,500 | | Callidus Software, Inc.* | | | 1,891,500 | | | | 2,472,045 | |
| 263,370 | | Guidewire Software, Inc.* | | | 13,586,062 | | | | 13,847,995 | |
| 310,590 | | Qlik Technologies, Inc.* | | | 12,864,285 | | | | 11,321,005 | |
| 152,655 | | Salesforce.com, Inc.* | | | 10,329,496 | | | | 10,598,837 | |
| 321,070 | | Synchronoss Technologies, Inc.* | | | 11,166,656 | | | | 10,531,096 | |
| | Communications Equipment - 2.8% | | | | | |
| 713,260 | | Infinera Corp.* | | | 9,438,689 | | | | 13,951,366 | |
| 591,640 | | Ruckus Wireless, Inc.* | | | 6,404,271 | | | | 7,028,683 | |
| | Data Processing & Outsourced Services - 2.8% | | | | | |
| 273,930 | | Black Knight Financial Services, Inc., Class A* | | | 7,101,249 | | | | 8,916,421 | |
| 183,705 | | Visa, Inc., Class A | | | 13,439,445 | | | | 12,796,890 | |
| | Home Entertainment Software - 2.8% | | | | | |
| 192,335 | | Activision Blizzard, Inc. | | | 6,040,331 | | | | 5,941,228 | |
| 229,100 | | Electronic Arts, Inc.* | | | 16,701,019 | | | | 15,521,525 | |
| | Internet Software & Services - 4.6% | | | | | |
| 211,145 | | Facebook, Inc., Class A* | | | 14,208,141 | | | | 18,981,935 | |
| 24,617 | | Google, Inc., Class A* | | | 16,953,494 | | | | 15,714,754 | |
| | IT Consulting & Other Services - 1.6% | | | | | |
| 194,955 | | Luxoft Holding, Inc.* | | | 7,376,282 | | | | 12,338,702 | |
| | Semiconductors - 6.8% | | | | | |
| 742,460 | | Applied Micro Circuits Corp.* | | | 4,861,292 | | | | 3,942,463 | |
| 1,507,245 | | Atmel Corp. | | | 14,748,839 | | | | 12,163,467 | |
| 117,415 | | Avago Technologies, Ltd. | | | 9,856,677 | | | | 14,678,049 | |
| 90,234 | | Microsemi Corp.* | | | 2,286,672 | | | | 2,961,480 | |
| | | | | | | | | | |
Shares | | | | Cost | | | Value | |
| 309,795 | | Silicon Motion Technology Corp. ADR | | $ | 8,291,252 | | | $ | 8,460,501 | |
| 111,430 | | Skyworks Solutions, Inc. | | | 9,489,986 | | | | 9,383,520 | |
| | Systems Software - 1.0% | | | | | |
| 177,325 | | Fortinet, Inc.* | | | 7,633,973 | | | | 7,532,766 | |
| | Technology Hardware, Storage & Peripherals - 1.3% | | | | | |
| 87,222 | | Apple, Inc. | | | 10,049,381 | | | | 9,620,587 | |
Total Information Technology | | | 214,718,992 | | | | 228,705,315 | |
| | This sector is 6.5% above your Fund’s cost. | |
Materials | | | | | | | | | | |
| | Construction Materials - 2.5% | | | | | |
| 53,950 | | Martin Marietta Materials, Inc. | | | 8,076,990 | | | | 8,197,703 | |
| 118,205 | | Vulcan Materials Co. | | | 9,813,112 | | | | 10,543,886 | |
| | | | | | | | | | |
Total Materials | | | 17,890,102 | | | | 18,741,589 | |
| | This sector is 4.8% above your Fund’s cost. | |
Telecommunication Services | | | | | |
| | Alternative Carriers - 0.4% | | | | | |
| 481,165 | | ORBCOMM, Inc.* | | | 2,709,271 | | | | 2,684,901 | |
| | This sector is 0.9% below your Fund’s cost. | |
Total Common Stocks | | | 709,185,563 | | | | 737,934,055 | |
| | | |
| | | | | Principal
Amount | | | | |
Short-Term Investments - 4.1% | | | | | | | | |
Commercial Paper - 2.9% | | | | | | | | |
| | Weatherford International, 0.95%, 10/01/15 | | $ | 22,470,000 | | | | 22,470,000 | |
Repurchase Agreements - 1.2%2 | | | | | |
| | BNP Paribas Securities Corp., dated 09/30/15, due 10/01/15, 0.110%, total to be received $2,104,996 (collateralized by various U.S. Government Agency Obligations, 0.250% - 7.500%, 08/01/16 - 10/01/45, totaling $2,147,092) | | | 2,104,990 | | | | 2,104,990 | |
| | Citigroup Global Markets Inc., dated 09/30/15, due 10/01/15, 0.120%, total to be received $2,104,997 (collateralized by various U.S. Government Agency Obligations, 0.000% - 7.000%, 05/15/18 - 10/01/45, totaling $2,147,090) | | | 2,104,990 | | | | 2,104,990 | |
| | HSBC Securities USA Inc., dated 09/30/15, due 10/01/15, 0.100%, total to be received $2,104,996 (collateralized by various U.S. Government Agency Obligations, 0.000% - 7.250%, 11/15/15 - 07/15/37, totaling $2,147,091) | | | 2,104,990 | | | | 2,104,990 | |
The accompanying notes are an integral part of these financial statements.
9
AMG Managers Brandywine Fund
Schedule of Portfolio Investments (continued)
| | | | | | | | | | |
| | | | | Principal
Amount | | | Value | |
Repurchase Agreements - 1.2% (continued)2 | | | | | |
| | Mizuho Securities USA, Inc., dated 09/30/15, due 10/01/15, 0.140%,total to be received $2,104,998 (collateralized by various U.S. Government Agency Obligations, 0.000% - 4.500%, 10/09/19 - 10/01/45, totaling $2,147,090) | | $ | 2,104,990 | | | $ | 2,104,990 | |
| | Royal Bank of Scotland PLC, dated 09/30/15, due 10/01/15, 0.090%,total to be received $443,129 (collateralized by various U.S. Government Agency Obligations, 0.094% - 3.625%, 01/31/16 - 02/15/44, totaling $451,992) | | | 443,128 | | | | 443,128 | |
| | | | | | | | | | |
Total Repurchase Agreements | | | 8,863,088 | | | | 8,863,088 | |
| | | | | | | | | | |
Shares | | | | Cost | | | Value | |
Other Investment Companies - 0.0%3,# | | | | | |
| 31,136 | | Dreyfus Institutional Cash Advantage Fund, Institutional Class Shares, 0.11% | | $ | 31,136 | | | $ | 31,136 | |
| | | | | | | | | | |
Total Short-Term Investments | | | 31,364,224 | | | | 31,364,224 | |
Total Investments - 101.3% | | $ | 740,549,787 | | | | 769,298,279 | |
| | | | | | | | | | |
Other Assets, less Liabilities - (1.3)% | | | | | | | (10,113,688 | ) |
Total Net Assets - 100.0% | | | | | | $ | 759,184,591 | |
| | | | | | | | | | |
The accompanying notes are an integral part of these financial statements.
10
AMG Managers Brandywine Blue Fund
Portfolio Manager’s Comments
Investors seemed certain at the start of the fiscal year. An enormous drop in the price of oil was certainly good for the consumer. The U. S. Federal Reserve (the Fed) so openly expressed its intentions that the market would enjoy a high degree of certainty in handicapping when the central bank would make its initial move to raise interest rates.
Then global economic concerns emerged, and domestic data appeared to turn on the Fed. The fiscal year ended in uncertainty, with a second-half swoon returning many market barometers to levels at which they started the 12 months through September 30, 2015.
AMG Managers Brandywine Blue Fund (“Brandywine Blue”) grew 1.3 percent in its fiscal year through September. The Russell 1000® Growth Index gained 3.2 percent.
The period started with a shock, with the floor dropping out from under oil prices amid conservative global consumption expectations and increased production from North American reserves. During the first three months of the fiscal year alone (the December quarter of 2014), the price of a barrel of crude oil declined 40 percent.
Brandywine Blue’s exposure to the energy sector was limited due to a lack of earnings strength in the sector that was evident coming into the period. That ultimately proved to be the most significant contributor to the performance advantage Brandywine Blue enjoyed over the Russell 1000® Growth Index, where energy was the index’s poorest performing sector in the December quarter.
Consumer-related companies were strong performers as falling oil prices and positive news on employment boosted confidence in spending. That was also good news for the Brandywine Blue
portfolio, which held consumer discretionary companies as it largest commitment. The December quarter turned out to be Brandywine Blue’s best quarter of the fiscal year on a relative and an absolute basis.
Strength in the dollar, global growth and interest rate expectations emerged as causes for concern early in the March quarter, but investor enthusiasm re-emerged as companies revealed better-than-expected results during the fourth-quarter reporting season.
Technology holdings, which comprised the portfolio’s second largest position, contributed the most to performance versus the Russell 1000® Growth Index. Industrial holdings were notable supporting contributors. The portfolio’s largest commitment, the consumer discretionary sector, detracted most from performance relative to the benchmark. Brandywine Blue’s March-quarter return exceeded the index’s results.
Mixed economic data in the June quarter prompted debate as to when the Fed was most likely to begin raising interest rates. Questions also emerged regarding global growth prospects, with China reporting its slowest pace of quarterly economic growth in six years. Chinese stocks ended the June quarter in sharp decline. The enthusiasm that marked the fiscal year’s first half dissipated.
Industrial holdings detracted the most from June-quarter performance as investors lowered demand expectations given the economic uncertainty. The same economic concerns weighed on consumer discretionary holdings, which represented Brandywine Blue’s largest commitment. Health care holdings were a relative bright spot. The benchmark fared better in the June quarter with a slight gain, as Brandywine Blue posted a modest decline.
Volatility surged in the September quarter as the calendar drew closer to a September meeting in which the Fed was, only months before, expected to initiate its first interest rate hike since stimulating the economy in the wake of the Great Recession. Economic data were mixed during the quarter, and the Fed ultimately chose not to act. In the meantime, stocks fell into correction territory (a decline of at least 10 percent from a previous high) for the first time since 2011 (from May 21 to August 24, using the S&P 500 Index as a guide).
Brandywine Blue and its benchmark both posted September-quarter declines, with the benchmark faring better. Viewed to be among the most economically sensitive, the technology and consumer discretionary sectors detracted the most from Brandywine Blue’s performance relative to the Russell 1000® Growth Index.
When assessing the fiscal year as a whole, Brandywine Blue’s limited exposure to the energy sector during the oil-price plunge was the most significant contributor to results versus the benchmark for the fiscal year. Brandywine Blue also benefited from outperformance among its holdings from the materials sector. Holdings from the industrial sector weighed the most on relative results, followed by technology holdings.
Nike, Delta Air Lines, D. R. Horton and TJX Cos. were top contributors to performance versus the benchmark for the fiscal year. GoPro, Qorvo, Quanta Services and Tenet Healthcare Corp. were top detractors.
This commentary reflects the viewpoints of Friess Associates, LLC as of September 30, 2015 and is not intended as a forecast or guarantee of future results.
11
AMG Managers Brandywine Blue Fund
Portfolio Manager’s Comments (continued)
CUMULATIVE TOTAL RETURN PERFORMANCE
AMG Managers Brandywine Blue Fund’s cumulative total return is based on the daily change in net asset value (NAV), and assumes that all dividends and distributions were reinvested. This graph compares a hypothetical $10,000 investment made in the AMG Managers Brandywine Blue Fund on September 30, 2005 to a $10,000 investment made in the Russell 1000® Growth Index, Russell 1000® Index and S&P 500 Index for the same time period. The graph and table do not reflect the deduction of taxes that a shareholder would pay on a Fund distribution or redemption of shares. The listed returns for the Fund are net of expenses and the returns for the index exclude expenses.
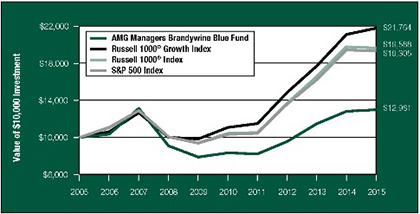
The table below shows the average annual total returns for the AMG Managers Brandywine Blue Fund and the Russell 1000® Growth Index, Russell 1000® Index and S&P 500 Index for the same time periods ended September 30, 2015.
| | | | | | | | | | | | |
| Average Annual Total Returns1 | | One
Year | | | Five
Years | | | Ten
Years | |
AMG Managers Brandywine Blue Fund2,3 | | | 1.31 | % | | | 9.28 | % | | | 2.64 | % |
Russell 1000® Growth Index4 | | | 3.17 | % | | | 14.47 | % | | | 8.09 | % |
Russell 1000® Index5 | | | (0.61 | )% | | | 13.42 | % | | | 6.95 | % |
S&P 500 Index6 | | | (0.61 | )% | | | 13.34 | % | | | 6.80 | % |
The performance data shown represents past performance. Past performance is not a guarantee of future results. Current performance may be lower or higher than the performance data quoted. The investment return and principal value of an investment in the Fund will fluctuate so that an investor’s shares, when redeemed, may be worth more or less than their original cost.
Investors should carefully consider the Fund’s investment objectives, risks, charges, and expenses before investing. For performance information through the most recent month end, current net asset values per share for the Fund and other information, please call (800) 835-3879 or visit our website at www.amgfunds.com for a free prospectus. Read it carefully before investing or sending money.
| Distributed | by AMG Distributors, Inc., member FINRA/SIPC. |
| 1 | Total return equals income yield plus share price change and assumes reinvestment of all dividends and capital gain distributions. Returns are net of fees and may reflect offsets of Fund expenses as described in the prospectus. No adjustment has been made for taxes payable by shareholders on their reinvested dividends and capital gain distributions. |
| | Returns for periods greater than one year are annualized. The listed returns on the Fund are net of expenses and based on the published NAV as of September 30, 2015. All returns are in U.S. dollars ($). |
| 2 | The Fund inception dates and returns for all periods prior to October 1, 2013, reflect performance of the Predecessor Fund, Brandywine Blue Fund, and was managed by Friess Associates, LLC with the same investment objective and substantially similar investment policies. |
| 3 | Investments in international securities are subject to certain risks of overseas investing including currency fluctuations and changes in political and economic conditions, which could result in significant market fluctuations. These risks are magnified in emerging markets. Active and frequent trading of a fund may result in higher transaction costs and increased tax liability. |
| 4 | The Russell 1000® Growth Index is a market capitalization weighted index that measures the performance of those Russell 1000® companies with higher price-to-book ratio and higher forecasted growth values. Unlike the Fund, the Russell 1000® Growth Index is unmanaged, is not available for investment and does not incur expenses. |
| 5 | The Russell 1000® Index measures the performance of approximately 1,000 of the largest securities based on a combination of their market cap and current index membership. The Russell 1000® Index represents approximately 92% of the U. S. market. Unlike the Fund, the Russell 1000® Index is unmanaged, is not available for investment and does not incur expenses. |
| 6 | The S&P 500 Index is a capitalization-weighted index of 500 stocks. The S&P 500 Index is designed to measure performance of the broad domestic economy through changes in the aggregate market value of 500 stocks representing all major industries. Unlike the Fund, the S&P 500 Index is unmanaged, is not available for investment and does not incur expenses. |
The Russell 1000® Growth Index and Russell 1000® Index are registered trademarks of Russell Investments. Russell® is a trademark of Russell Investments.
The S&P 500 Index is proprietary data of Standard & Poor’s, a division of McGraw-Hill Companies, Inc. All rights reserved.
Not FDIC insured, nor bank guaranteed. May lose value.
12
AMG Managers Brandywine Blue Fund
Fund Snapshots (unaudited)
September 30, 2015
PORTFOLIO BREAKDOWN
| | | | | | | | | | | | | | | | |
Industry (Top Ten) | | AMG
Managers
Brandywine
Blue Fund* | | | Russell
1000®
Growth
Index | | | Russell
1000®
Index | | | S&P
500
Index | |
Internet Retail | | | 6.9 | % | | | 3.4 | % | | | 1.8 | % | | | 1.9 | % |
Internet Software & Services | | | 4.8 | % | | | 6.7 | % | | | 3.6 | % | | | 3.8 | % |
Pharmaceuticals | | | 4.3 | % | | | 3.4 | % | | | 5.0 | % | | | 5.7 | % |
Semiconductors | | | 4.3 | % | | | 2.1 | % | | | 2.3 | % | | | 2.4 | % |
Property & Casualty Insurance | | | 4.2 | % | | | 0.5 | % | | | 3.1 | % | | | 2.8 | % |
Footwear | | | 4.0 | % | | | 4.8 | % | | | 2.7 | % | | | 2.7 | % |
Cable & Satellite | | | 3.8 | % | | | 5.5 | % | | | 3.4 | % | | | 3.2 | % |
Home Entertainment Software | | | 3.7 | % | | | 0.2 | % | | | 0.2 | % | | | 0.1 | % |
Health Care Facilities | | | 3.2 | % | | | 3.7 | % | | | 2.7 | % | | | 2.8 | % |
Insurance Brokers | | | 3.2 | % | | | 0.8 | % | | | 1.9 | % | | | 2.1 | % |
Other Common Stock | | | 53.1 | % | | | 68.9 | % | | | 73.3 | % | | | 72.5 | % |
Cash & Cash Equivalent† | | | 4.5 | % | | | 0.0 | % | | | 0.0 | % | | | 0.0 | % |
| * | As a percentage of net assets. |
| † | Includes Other Assets and Liabilities. |
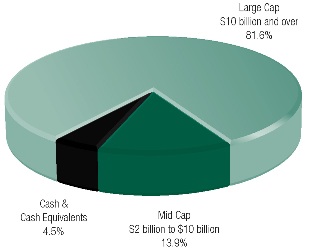
PORTFOLIO MARKET CAPITALIZATION
TOP TEN HOLDINGS
| | | | | | | | |
Security Name | | % of
Net Assets | | | % Change
from
Book Cost | |
NIKE, Inc., Class B* | | | 4.0 | % | | | 51.0 | % |
Marsh & McLennan Cos., Inc.* | | | 3.2 | | | | 61.2 | |
Delta Air Lines, Inc. | | | 2.8 | | | | -3.2 | |
Amazon.com, Inc. | | | 2.7 | | | | 31.5 | |
Facebook, Inc., Class A* | | | 2.7 | | | | 33.5 | |
The Priceline Group, Inc. | | | 2.5 | | | | 3.5 | |
The TJX Cos., Inc. | | | 2.5 | | | | 19.2 | |
Starbucks Corp. | | | 2.5 | | | | 55.0 | |
Avago Technologies, Ltd.* | | | 2.4 | | | | 51.5 | |
Church & Dwight Co., Inc. | | | 2.4 | | | | 9.9 | |
| | | | | | | | |
Top Ten as a Group | | | 27.7 | % | | | | |
| | | | | | | | |
| * | Also Top Ten Holding as of June 30, 2015. |
ESTIMATED EARNINGS GROWTH RATE
OF THE FUND’S INVESTMENTS
Forecasted Increase in Earnings Per Share 2016 vs 2015
Source: Consensus estimates from FactSet Research Systems Inc.
This is not a forecast of the Fund’s future performance. Earnings growth for a Fund holding does not guarantee a corresponding increase in the market value of the holding or the Fund.
Because a fund’s strategy may result in multiple investments in particular sectors of the economy, its performance may depend on the performance of those sectors and may fluctuate more widely than investments diversified across more sectors. For additional information on these and other risk considerations, please see the Fund’s prospectus.
Any sectors, industries, or securities discussed should not be perceived as investment recommendations. Mention of a specific security should not be considered a recommendation to buy or solicitation to sell that security. Specific securities mentioned in this report may have been sold from the Fund’s portfolio of investments by the time you receive this report.
13
AMG Managers Brandywine Blue Fund
Roses and Thorns (unaudited)
Quarter Ending September 30, 2015
| | | | | | | | |
$ Gain (in millions) | | % Gain | | | Biggest $ Winners | | Reason for Move |
| | | | | | |
| $ 0.8 | | | 13.8 | % | | Nike Inc. CL B. (NKE) The world’s largest provider of athletic footwear, apparel, equipment and accessories reported August-quarter earnings of $1.34 per share, exceeding the consensus estimate by 11 percent. Global future orders increased 17 percent, with Western Europe showing the greatest order growth. Direct-to-consumer revenue grew 46 percent in the quarter. |
| $ 0.7 | | | 17.9 | % | | Amazon Inc. (AMZN) The Internet retailer reported June-quarter earnings of $0.19 per share, topping the consensus estimate. Accelerating international growth and strong Amazon Web Service demand drove a better-than-expected 27 percent revenue increase. While Amazon continues to invest aggressively, improved operating efficiencies contributed to gross margin expansion. |
| $ 0.4 | | | 9.2 | % | | Delta Air Lines Inc. (DAL) The provider of air transportation for passengers and cargo grew June-quarter earnings 22 percent, marking its ninth consecutive quarterly profit. Cost controls and fuel savings drove increased operating margins. Industry-wide seating capacity expansion moderated, providing support to pricing and free cash flow generation. |
| $ 0.3 | | | 7.9 | % | | The TJX Cos. Inc. (TJX) The off-price apparel retailer reported July-quarter earnings of $0.80 per share, beating the consensus estimate. Shares gained during the quarter as the company announced that it exceeded expectations with 6 percent same-store sales growth. Better inventory buys, greater balance across departments and leveraging from its global sourcing model contributed to strong margins. |
| $ 0.3 | | | 4.4 | % | | Facebook Inc. (FB) The social networking service and website grew June-quarter earnings 19 percent. Increased mobile advertising revenue drove 39 percent sales growth. Facebook’s monthly average users grew 13 percent to nearly 1.5 billion as mobile utilization accelerated. |
| | | |
$ Loss
(in millions) | | % Loss | | | Biggest $ Losers | | Reason for Move |
| | | | | | |
| $ 1.4 | | | 10.7 | % | | Apple Inc. (AAPL) The designer and manufacturer of computers and mobile communications devices grew June-quarter earnings 44 percent, beating the consensus estimate. Shares traded lower on concerns iPhone sales to China would slow. Later in the quarter, Apple CEO Tim Cook announced that China sales were accelerating. |
| $ 1.2 | | | 29.0 | % | | Qorvo Inc. (QRVO) The provider of core technologies and radio frequency solutions for mobile communications reported June-quarter earnings of $1.09 per share, topping the consensus estimate. Shares declined in reaction to a delay of LTE base station build outs in China and slower hand set component sales to Chinese manufacturers. We sold Qorvo to fund a new holding with better visibility. |
| $ 1.2 | | | 33.7 | % | | GoPro Inc. (GPRO) The manufacturer of mountable and wearable cameras and accessories reported 337 percent June-quarter earnings growth, topping the consensus estimate by $0.09. Shares traded lower in the quarter due to slower-than-expected sales of the new Hero 4 Session camera and concerns about the pace of new product development. We sold GoPro to fund a new holding with greater near-term visibility. |
| $ 1.0 | | | 29.6 | % | | Tenet Healthcare Corp. (THC) The operator of hospitals and related health care facilities reported June-quarter earnings of $0.74 per share, beating the consensus estimate by 66 percent. Solid admissions growth and price increases drove results. A flurry of deal announcements put pressure on the stock during the quarter as investors digested the news. |
| $ 0.8 | | | 22.0 | % | | Micron Technologies Inc. (MU) The manufacturer of DRAM and other memory semiconductors reported May-quarter earnings of $0.54 per share, falling short of the consensus estimate. Despite recent stability provided by industry consolidation, pricing came under pressure during the period. We sold Micron Technology to fund a new opportunity with better earnings visibility. |
All gains/losses are calculated on an average cost basis from June 30, 2015 through September 30, 2015.
This commentary reflects the viewpoints of Friess Associates, LLC as of September 30, 2015 and is not intended as a forecast or guarantee of future results.
14
AMG Managers Brandywine Blue Fund
Schedule of Portfolio Investments
September 30, 2015
| | | | | | | | | | |
Shares | | | | Cost | | | Value | |
Common Stocks - 95.5% | | | | | |
Consumer Discretionary | | | | | |
| | Apparel Retail - 2.5% | | | | | | | | |
| 59,660 | | The TJX Cos., Inc. | | $ | 3,575,902 | | | $ | 4,260,917 | |
| | Apparel, Accessories & Luxury Goods - 2.0% | | | | | |
| 49,955 | | VF Corp. | | | 1,929,767 | | | | 3,407,431 | |
| | Automotive Retail - 0.7% | | | | | | | | |
| 5,070 | | O’Reilly Automotive, Inc.* | | | 1,198,406 | | | | 1,267,500 | |
| | Cable & Satellite - 3.8% | | | | | | | | |
15,010 | | Charter Communications, Inc., Class A*,1 | | | 2,762,323 | | | | 2,639,509 | |
| 65,550 | | Comcast Corp., Class A | | | 3,380,139 | | | | 3,728,484 | |
| | Consumer Electronics - 2.0% | | | | | | | | |
| 35,010 | | Harman International Industries, Inc. | | | 4,437,999 | | | | 3,360,610 | |
| | Footwear - 4.0% | | | | | | | | |
| 55,065 | | NIKE, Inc., Class B | | | 4,484,033 | | | | 6,771,343 | |
| | General Merchandise Stores - 2.3% | | | | | |
| 48,790 | | Target Corp. | | | 3,915,465 | | | | 3,837,821 | |
| | Home Improvement Retail - 2.2% | | | | | |
| 32,150 | | The Home Depot, Inc. | | | 3,703,973 | | | | 3,713,004 | |
| | Homebuilding - 2.3% | | | | | | | | |
| 133,495 | | D.R. Horton, Inc. | | | 3,678,054 | | | | 3,919,413 | |
| | Hotels, Resorts & Cruise Lines - 1.4% | | | | | |
| 104,635 | | Hilton Worldwide Holdings, Inc. | | | 2,931,686 | | | | 2,400,327 | |
| | Internet Retail - 6.9% | | | | | | | | |
| 8,923 | | Amazon.com, Inc.* | | | 3,472,630 | | | | 4,567,594 | |
| 27,200 | | Netflix, Inc.* | | | 3,363,593 | | | | 2,808,672 | |
| 3,452 | | The Priceline Group, Inc.* | | | 4,123,388 | | | | 4,269,641 | |
| | Restaurants - 2.5% | | | | | | | | |
| 74,200 | | Starbucks Corp. | | | 2,720,465 | | | | 4,217,528 | |
| | Specialty Stores - 2.3% | | | | | | | | |
| 79,105 | | Dick’s Sporting Goods, Inc. | | | 4,080,312 | | | | 3,924,399 | |
| | | | | | | | | | |
Total Consumer Discretionary | | | 53,758,135 | | | | 59,094,193 | |
| | This sector is 9.9% above your Fund’s cost. | | | | | |
Consumer Staples | | | | | | | | |
| | Food Retail - 2.0% | | | | | | | | |
| 95,000 | | The Kroger Co. | | | 3,571,079 | | | | 3,426,650 | |
| | Household Products - 2.4% | | | | | | | | |
| 47,960 | | Church & Dwight Co., Inc. | | | 3,660,833 | | | | 4,023,844 | |
| | | | | | | | | | |
Total Consumer Staples | | | 7,231,912 | | | | 7,450,494 | |
| | This sector is 3.0% above your Fund’s cost. | | | | | |
Financials | | | | | | | | |
| | Insurance Brokers - 3.2% | | | | | | | | |
| 103,165 | | Marsh & McLennan Cos., Inc. | | | 3,341,679 | | | | 5,387,276 | |
| | | | | | | | | | |
Shares | | | | Cost | | | Value | |
| | Property & Casualty Insurance - 4.2% | | | | | |
| 58,980 | | The Allstate Corp. | | $ | 3,477,183 | | | $ | 3,434,995 | |
| 101,692 | | FNF Group | | | 3,747,515 | | | | 3,607,015 | |
| | Specialized Finance - 2.3% | | | | | |
| 41,225 | | CME Group, Inc. | | | 3,873,324 | | | | 3,823,206 | |
| | Specialized REITs - 2.3% | | | | | |
| 45,040 | | American Tower Corp. | | | 4,270,695 | | | | 3,962,619 | |
| | | | | | | | | | |
Total Financials | | | 18,710,396 | | | | 20,215,111 | |
| | This sector is 8.0% above your Fund’s cost. | |
Health Care | | | | | | | | |
| | Biotechnology - 2.2% | | | | | |
| 37,360 | | Gilead Sciences, Inc. | | | 3,574,154 | | | | 3,668,378 | |
| | Health Care Equipment - 2.2% | | | | | |
| 225,450 | | Boston Scientific Corp.* | | | 3,928,353 | | | | 3,699,634 | |
| | Health Care Facilities - 3.2% | | | | | |
| 40,345 | | HCA Holdings, Inc.* | | | 3,291,096 | | | | 3,121,089 | |
| 65,200 | | Tenet Healthcare Corp.* | | | 3,420,406 | | | | 2,407,184 | |
| | Life Sciences Tools & Services - 2.2% | | | | | |
| 30,000 | | Thermo Fisher Scientific, Inc. | | | 3,964,808 | | | | 3,668,400 | |
| | Pharmaceuticals - 4.3% | | | | | |
| 41,400 | | Eli Lilly & Co. | | | 3,376,597 | | | | 3,464,766 | |
| 123,015 | | Pfizer, Inc. | | | 4,231,310 | | | | 3,863,901 | |
| | | | | | | | | | |
Total Health Care | | | 25,786,724 | | | | 23,893,352 | |
| | This sector is 7.3% below your Fund’s cost. | |
Industrials | | | | | | | | |
| | Airlines - 2.7% | | | | | | | | |
| 104,015 | | Delta Air Lines, Inc. | | | 4,823,920 | | | | 4,667,153 | |
| | Construction Machinery & Heavy Trucks - 2.2% | |
| 41,970 | | Wabtec Corp. | | | 2,863,738 | | | | 3,695,459 | |
| | Human Resources & Employment Services - 2.0% | |
| 40,500 | | ManpowerGroup, Inc. | | | 3,510,483 | | | | 3,316,545 | |
| | | | | | | | | | |
Total Industrials | | | 11,198,141 | | | | 11,679,157 | |
| | This sector is 4.3% above your Fund’s cost. | |
Information Technology | | | | | | | | |
| | Application Software - 2.1% | | | | | |
| 49,905 | | Salesforce.com, Inc.* | | | 3,366,596 | | | | 3,464,904 | |
| | Data Processing & Outsourced Services - 2.3% | | | | | |
| 55,500 | | Visa, Inc., Class A | | | 4,034,502 | | | | 3,866,130 | |
| | Home Entertainment Software - 3.7% | | | | | |
| 81,655 | | Activision Blizzard, Inc. | | | 2,544,800 | | | | 2,522,323 | |
| 55,910 | | Electronic Arts, Inc.* | | | 4,056,036 | | | | 3,787,903 | |
| | Internet Software & Services - 4.8% | | | | | |
| 50,480 | | Facebook, Inc., Class A* | | | 3,398,834 | | | | 4,538,152 | |
The accompanying notes are an integral part of these financial statements.
15
AMG Managers Brandywine Blue Fund
Schedule of Portfolio Investments (continued)
| | | | | | | | | | |
Shares | | | | Cost | | | Value | |
Information Technology (continued) | | | | | |
| | Internet Software & Services - 4.8% (continued) | |
| 5,577 | | Google, Inc., Class A* | | $ | 3,840,827 | | | $ | 3,560,189 | |
| | Semiconductors - 4.3% | |
| 32,510 | | Avago Technologies, Ltd. | | | 2,683,290 | | | | 4,064,075 | |
| 38,050 | | Skyworks Solutions, Inc. | | | 3,221,363 | | | | 3,204,191 | |
| | Systems Software - 1.9% | |
| 77,095 | | Fortinet, Inc.* | | | 3,677,549 | | | | 3,274,996 | |
| | Technology Hardware, Storage & Peripherals - 1.3% | | | | | |
| 19,396 | | Apple, Inc. | | | 2,234,712 | | | | 2,139,379 | |
| | | | | | | | | | |
Total Information Technology | | | 33,058,509 | | | | 34,422,242 | |
| | This sector is 4.1% above your Fund’s cost. | |
Materials | | | | | | | | |
| | Construction Materials - 2.8% | |
| 12,310 | | Martin Marietta Materials, Inc. | | | 1,843,025 | | | | 1,870,505 | |
| 32,075 | | Vulcan Materials Co. | | | 2,675,236 | | | | 2,861,090 | |
| | | | | | | | | | |
Total Materials | | | 4,518,261 | | | | 4,731,595 | |
| | This sector is 4.7% above your Fund’s cost. | |
Total Common Stocks | | | 154,262,078 | | | | 161,486,144 | |
| | | | | | | | | | |
Shares | | | | Principal
Amount | | | Value | |
Short-Term Investments - 6.0% | | | | | | | | |
Commercial Paper - 5.2% | | | | | | | | |
| | Weatherford International, 0.95%, 10/01/15 | | $ | 8,810,000 | | | $ | 8,810,000 | |
Repurchase Agreements - 0.8%2 | | | | | | | | |
| | HSBC Securities USA Inc., dated 09/30/15, due 10/01/15, 0.110%, total to be received $1,000,003 (collateralized by various U.S. Government Agency Obligations, 0.625% - 6.500%, 12/28/16 - 10/01/45, totaling $1,020,003) | | | 1,000,000 | | | | 1,000,000 | |
| | Royal Bank of Scotland PLC, dated 09/30/15, due 10/01/15, 0.090%, total to be received $323,463 (collateralized by various U.S. Government Agency Obligations, 0.094% - 3.625%, 01/31/16 - 02/15/44, totaling $329,932) | | | 323,462 | | | | 323,462 | |
| | | | | | | | | | |
| | Total Repurchase Agreements | | | 1,323,462 | | | | 1,323,462 | |
| | | |
| | | | | Cost | | | | |
Other Investment Companies - 0.0%3,# | | | | | | | | |
| 31,834 | | Dreyfus Institutional Cash Advantage Fund, Institutional Class Shares, 0.11% | | | 31,834 | | | | 31,834 | |
| | | | | | | | | | |
Total Short-Term Investments | | | 10,165,296 | | | | 10,165,296 | |
Total Investments - 101.5% | | $ | 164,427,374 | | | | 171,651,440 | |
| | | | | | | | | | |
Other Assets, less Liabilities - (1.5)% | | | | | | | (2,470,972 | ) |
Total Net Assets - 100.0% | | | | | | $ | 169,180,468 | |
The accompanying notes are an integral part of these financial statements.
16
Notes to Schedule of Portfolio Investments
The following footnotes and abbreviations should be read in conjunction with each of the Schedules of Portfolio Investments previously presented in this report. At September 30, 2015, the approximate cost of investments for federal income tax purposes and the aggregate gross unrealized appreciation and/or depreciation based on tax cost were as follows:
| | | | | | | | | | | | | | | | |
| Fund | | Cost | | | Appreciation | | | Depreciation | | | Net | |
AMG Managers Brandywine Fund | | $ | 740,942,840 | | | $ | 61,286,874 | | | $ | (32,931,435 | ) | | $ | 28,355,439 | |
AMG Managers Brandywine Blue Fund | | | 164,533,806 | | | | 14,110,796 | | | | (6,993,162 | ) | | | 7,117,634 | |
| * | Non-income producing security. |
| # | Rounds to less than 0.1%. |
| 1 | Some or all of these shares were out on loan to various brokers as of September 30, 2015, amounting to the following: |
| | | | | | | | |
| | | Market Value | | | % of Net Assets | |
AMG Managers Brandywine Fund | | $ | 9,103,699 | | | | 1.2 | % |
AMG Managers Brandywine Blue Fund | | $ | 1,362,837 | | | | 0.8 | % |
| 2 | Collateral received from brokers for securities lending was invested in these short-term investments. |
| 3 | Yield shown represents the September 30, 2015, seven-day average yield, which refers to the sum of the previous seven days’ dividends paid, expressed as an annual percentage. |
The following tables summarizes the inputs used to value the Fund’s net assets by the fair value hierarchy levels as of September 30, 2015. (See Note 1(a) in the Notes to Financial Statements.)
| | | | | | | | | | | | | | | | |
| | | Quoted Prices in Active Markets for Identical
Investments Level 1 | | | Significant Other
Observable Inputs
Level 2 | | | Significant
Unobservable Inputs
Level 3 | | | Total | |
AMG Managers Brandywine Fund | | | | | | | | | | | | | | | | |
Investments in Securities | | | | | | | | | | | | | | | | |
Common Stocks† | | $ | 737,934,055 | | | | — | | | | — | | | $ | 737,934,055 | |
Short-Term Investments | | | | | | | | | | | | | | | | |
Commercial Paper | | | — | | | $ | 22,470,000 | | | | — | | | | 22,470,000 | |
Repurchase Agreements | | | — | | | | 8,863,088 | | | | — | | | | 8,863,088 | |
Other Investment Companies | | | 31,136 | | | | — | | | | — | | | | 31,136 | |
| | | | | | | | | | | | | | | | |
Total Investments in Securities | | $ | 737,965,191 | | | $ | 31,333,088 | | | | — | | | $ | 769,298,279 | |
| | | | | | | | | | | | | | | | |
| | | | | | | | | | | | | | | | |
| | | Quoted Prices in Active
Markets for Identical
Investments Level 1 | | | Significant Other
Observable Inputs
Level 2 | | | Significant
Unobservable Inputs
Level 3 | | | Total | |
AMG Managers Brandywine Blue Fund | | | | | | | | | | | | | | | | |
Investments in Securities | | | | | | | | | | | | | | | | |
Common Stocks† | | $ | 161,486,144 | | | | — | | | | — | | | $ | 161,486,144 | |
Short-Term Investments | | | | | | | | | | | | | | | | |
Commercial Paper | | | — | | | $ | 8,810,000 | | | | — | | | | 8,810,000 | |
Repurchase Agreements | | | — | | | | 1,323,462 | | | | — | | | | 1,323,462 | |
Other Investment Companies | | | 31,834 | | | | — | | | | — | | | | 31,834 | |
| | | | | | | | | | | | | | | | |
Total Investments in Securities | | $ | 161,517,978 | | | $ | 10,133,462 | | | | — | | | $ | 171,651,440 | |
| | | | | | | | | | | | | | | | |
| † | All common stocks held in the Funds are Level 1 securities. For a detailed breakout of the common stocks by major industry classification, please refer to the respective Schedule of Portfolio Investments. |
As of September 30, 2015, the Funds had no transfers between levels from the beginning of the reporting period.
The accompanying notes are an integral part of these financial statements.
17
Notes to Schedule of Portfolio Investments (continued)
INVESTMENT DEFINITIONS AND ABBREVIATIONS:
ADR: ADR after the name of a holding stands for American Depositary Receipt, representing ownership of foreign securities on deposit with a domestic custodian bank.The value of the ADR securities is determined or significantly influenced by trading on exchanges not located in the United States or Canada. Sponsored ADRs are initiated by the underlying foreign company.
The accompanying notes are an integral part of these financial statements.
18
Statement of Assets and Liabilities
September 30, 2015
| | | | | | | | |
| | | AMG Managers
Brandywine Fund | | | AMG Managers
Brandywine
Blue Fund | |
Assets: | | | | | | | | |
Investments at value* (including securities on loan valued at $9,103,699 and $1,362,837, respectively) | | $ | 769,298,279 | | | $ | 171,651,440 | |
Receivable for investments sold | | | 28,982,137 | | | | 6,622,607 | |
Dividends, interest and other receivables | | | 330,476 | | | | 53,841 | |
Receivable for Fund shares sold | | | 7,876 | | | | 4,131 | |
Prepaid expenses | | | 6,419 | | | | 5,824 | |
Receivable from affiliate | | | — | | | | 11,136 | |
Total assets | | | 798,625,187 | | | | 178,348,979 | |
Liabilities: | | | | | | | | |
Payable upon return of securities loaned | | | 8,863,088 | | | | 1,323,462 | |
Payable for investments purchased | | | 29,311,810 | | | | 7,375,509 | |
Payable for Fund shares repurchased | | | 395,108 | | | | 239,445 | |
Accrued expenses: | | | | | | | | |
Investment advisory and management fees | | | 651,811 | | | | 144,856 | |
Administrative fees | | | 16,324 | | | | 4,346 | |
Shareholder servicing fees | | | 47,295 | | | | — | |
Trustees fees and expenses | | | 10,285 | | | | 2,634 | |
Other | | | 144,875 | | | | 78,259 | |
Total liabilities | | | 39,440,596 | | | | 9,168,511 | |
Net Assets | | $ | 759,184,591 | | | $ | 169,180,468 | |
Net Assets Represent: | | | | | | | | |
Paid-in capital | | $ | 1,263,234,331 | | | $ | 1,160,843,741 | |
Undistributed net investment income | | | — | | | | 283,385 | |
Accumulated net realized loss from investments | | | (532,798,232 | ) | | | (999,170,724 | ) |
Net unrealized appreciation of investments | | | 28,748,492 | | | | 7,224,066 | |
Net Assets | | $ | 759,184,591 | | | $ | 169,180,468 | |
Shares outstanding | | | 21,979,025 | | | | 4,983,567 | |
Net asset value, offering and redemption price per share | | $ | 34.54 | | | $ | 33.95 | |
* Investments at cost | | $ | 740,549,787 | | | $ | 164,427,374 | |
The accompanying notes are an integral part of these financial statements.
19
Statement of Operations
For the fiscal year ended September 30, 2015
| | | | | | | | |
| | | AMG Managers
Brandywine Fund | | | AMG Managers
Brandywine Blue
Fund | |
Investment Income: | | | | | | | | |
Dividend income | | $ | 8,831,875 | 1 | | $ | 2,884,050 | 2 |
Securities lending income | | | 1,091,815 | | | | 71,135 | |
Interest income | | | 153,803 | | | | 55,090 | |
Total investment income | | | 10,077,493 | | | | 3,010,275 | |
Expenses: | | | | | | | | |
Investment advisory and management fees | | | 8,364,737 | | | | 2,020,987 | |
Administrative fees | | | 207,295 | | | | 60,630 | |
Shareholder servicing fees | | | 197,167 | | | | 142,579 | |
Transfer agent | | | 133,397 | | | | 21,435 | |
Professional fees | | | 94,223 | | | | 58,899 | |
Custodian | | | 68,972 | | | | 22,239 | |
Reports to shareholders | | | 81,556 | | | | 56,217 | |
Trustees fees and expenses | | | 43,495 | | | | 9,944 | |
Registration fees | | | 26,230 | | | | 20,930 | |
Miscellaneous | | | 18,233 | | | | 5,101 | |
Total expenses | | | 9,235,305 | | | | 2,418,961 | |
Net investment income | | | 842,188 | | | | 591,314 | |
Net Realized and Unrealized Gain (Loss): | | | | | | | | |
Net realized gain on investments | | | 117,270,561 | | | | 24,081,566 | |
Net change in unrealized appreciation (depreciation) of investments | | | (82,922,251 | ) | | | (19,411,528 | ) |
Net realized and unrealized gain | | | 34,348,310 | | | | 4,670,038 | |
Net increase in net assets resulting from operations | | $ | 35,190,498 | | | $ | 5,261,352 | |
| 1 | Includes non-recurring dividends of $2,531,862. |
| 2 | Includes non-recurring dividends of $1,019,501. |
The accompanying notes are an integral part of these financial statements.
20
Statements of Changes in Net Assets
For the fiscal years ended September 30,
| | | | | | | | | | | | | | | | |
| | | AMG Managers | | | AMG Managers | |
| | | Brandywine Fund | | | Brandywine Blue Fund | |
| | | 2015 | | | 2014 | | | 2015 | | | 2014 | |
Increase (Decrease) in Net Assets From Operations: | | | | | | | | | | | | | | | | |
Net investment income (loss) | | $ | 842,188 | | | $ | (3,054,059 | ) | | $ | 591,314 | | | $ | (268,697 | ) |
Net realized gain on investments | | | 117,270,561 | | | | 136,874,008 | | | | 24,081,566 | | | | 49,369,990 | |
Net change in unrealized appreciation (depreciation) of investments | | | (82,922,251 | ) | | | (13,784,277 | ) | | | (19,411,528 | ) | | | (21,262,048 | ) |
Net increase in net assets resulting from operations | | | 35,190,498 | | | | 120,035,672 | | | | 5,261,352 | | | | 27,839,245 | |
Capital Share Transactions: | | | | | | | | | | | | | | | | |
Proceeds from sale of shares | | | 45,582,971 | | | | 4,928,378 | | | | 13,063,277 | | | | 10,719,994 | |
Cost of shares repurchased | | | (120,633,417 | ) | | | (142,141,834 | ) | | | (65,084,718 | ) | | | (101,238,732 | ) |
Net decrease from capital share transactions | | | (75,050,446 | ) | | | (137,213,456 | ) | | | (52,021,441 | ) | | | (90,518,738 | ) |
Total decrease in net assets | | | (39,859,948 | ) | | | (17,177,784 | ) | | | (46,760,089 | ) | | | (62,679,493 | ) |
Net Assets: | | | | | | | | | | | | | | | | |
Beginning of year | | | 799,044,539 | | | | 816,222,323 | | | | 215,940,557 | | | | 278,620,050 | |
End of year | | $ | 759,184,591 | | | $ | 799,044,539 | | | $ | 169,180,468 | | | $ | 215,940,557 | |
End of year undistributed (accumulated) net investment income (loss) | | | — | | | $ | (2,364,460 | ) | | $ | 283,385 | | | $ | (319,569 | ) |
| | | | | | | | | | | | | | | | |
Share Transactions: | | | | | | | | | | | | | | | | |
Sale of shares | | | 1,282,255 | | | | 156,337 | | | | 362,186 | | | | 333,891 | |
Shares repurchased | | | (3,332,982 | ) | | | (4,517,062 | ) | | | (1,823,138 | ) | | | (3,172,984 | ) |
Net decrease in shares | | | (2,050,727 | ) | | | (4,360,725 | ) | | | (1,460,952 | ) | | | (2,839,093 | ) |
The accompanying notes are an integral part of these financial statements.
21
AMG Managers Brandywine Fund
Financial Highlights
For a share outstanding throughout each fiscal year
| | | | | | | | | | | | | | | | | | | | |
| | | For the fiscal years ended September 30, | |
| | | 2015 | | | 20143 | | | 2013 | | | 2012 | | | 2011 | |
Net Asset Value, Beginning of Year | | $ | 33.25 | | | $ | 28.75 | | | $ | 24.62 | | | $ | 21.38 | | | $ | 22.02 | |
Income (loss) from Investment Operations: | | | | | | | | | | | | | | | | | | | | |
Net investment income (loss)1 | | | 0.04 | 2 | | | (0.12 | ) | | | (0.03 | ) | | | (0.05 | ) | | | (0.09 | ) |
Net realized and unrealized gain (loss) on investments | | | 1.25 | | | | 4.62 | | | | 4.16 | | | | 3.29 | | | | (0.55 | ) |
Total income (loss) from investment operations | | | 1.29 | | | | 4.50 | | | | 4.13 | | | | 3.24 | | | | (0.64 | ) |
Net Asset Value, End of Year | | $ | 34.54 | | | $ | 33.25 | | | $ | 28.75 | | | $ | 24.62 | | | $ | 21.38 | |
Total Return | | | 3.88 | % | | | 15.65 | % | | | 16.77 | % | | | 15.15 | % | | | (2.91 | )% |
Ratio of total expenses to average net assets | | | 1.10 | % | | | 1.10 | % | | | 1.11 | %4 | | | 1.08 | % | | | 1.09 | % |
Ratio of net investment income (loss) to average net assets | | | 0.10 | % | | | (0.37 | )% | | | (0.12 | )% | | | (0.23 | )% | | | (0.36 | )% |
Portfolio turnover | | | 190 | % | | | 219 | % | | | 214 | % | | | 256 | % | | | 234 | % |
Net assets at end of year (000’s omitted) | | $ | 759,185 | | | $ | 799,045 | | | $ | 816,222 | | | $ | 1,062,544 | | | $ | 1,336,871 | |
| | | | | | | | | | | | | | | | | | | | |
22
AMG Managers Brandywine Blue Fund
Financial Highlights
For a share outstanding throughout each fiscal year
| | | | | | | | | | | | | | | | | | | | |
| | | For the fiscal years ended September, | |
| | | 2015 | | | 20143 | | | 2013 | | | 2012 | | | 2011 | |
Net Asset Value, Beginning of Year | | $ | 33.51 | | | $ | 30.01 | | | $ | 25.00 | | | $ | 21.50 | | | $ | 21.78 | |
Income (loss) from Investment Operations: | | | | | | | | | | | | | | | | | | | | |
Net investment income (loss)1 | | | 0.10 | 2 | | | (0.03 | ) | | | 0.12 | | | | (0.11 | ) | | | (0.10 | ) |
Net realized and unrealized gain (loss) on investments | | | 0.34 | | | | 3.53 | | | | 4.89 | | | | 3.61 | | | | (0.18 | ) |
Total income (loss) from investment operations | | | 0.44 | | | | 3.50 | | | | 5.01 | | | | 3.50 | | | | (0.28 | ) |
Net Asset Value, End of Year | | $ | 33.95 | | | $ | 33.51 | | | $ | 30.01 | | | $ | 25.00 | | | $ | 21.50 | |
Total Return | | | 1.31 | % | | | 11.66 | % | | | 20.04 | % | | | 16.28 | % | | | (1.29 | )% |
Ratio of total expenses to average net assets | | | 1.20 | % | | | 1.19 | % | | | 1.22 | %4 | | | 1.23 | % | | | 1.18 | % |
Ratio of net investment income (loss) to average net assets | | | 0.29 | % | | | (0.11 | )% | | | 0.45 | % | | | (0.46 | )% | | | (0.38 | )% |
Portfolio turnover | | | 156 | % | | | 182 | % | | | 202 | % | | | 243 | % | | | 250 | % |
Net assets at end of year (000’s omitted) | | $ | 169,180 | | | $ | 215,941 | | | $ | 278,620 | | | $ | 627,622 | | | $ | 1,487,517 | |
| | | | | | | | | | | | | | | | | | | | |
Notes to Financial Highlights
| 1 | Per share numbers have been calculated using average shares |
| 2 | Includes non-recurring dividends.Without these dividends, net investment loss per share would have been ($0.07) and ($0.08) for the AMG Managers Brandywine and AMG Managers Brandywine Blue Funds, respectively |
| 3 | At the start of business October 1, 2013, AMG Managers Brandywine Fund and AMG Managers Brandywine Blue Fund were each reorganized into a respective fund of AMG Funds I. |
| 4 | Interest expense is less than 0.005% of average net assets. |
23
Notes to Financial Statements
September 30, 2015
1. SUMMARY OF SIGNIFICANT ACCOUNTING POLICIES
AMG Funds I (the “Trust”) is an open-end management investment company, organized as a Massachusetts business trust, and registered under the Investment Company Act of 1940, as amended (the “1940 Act”). Currently, the Trust consists of a number of different funds, each having distinct investment management objectives, strategies, risks, and policies. Included in this report are AMG Managers Brandywine Fund (“Brandywine”) and AMG Managers Brandywine Blue Fund (“Brandywine Blue”), each a “Fund” and collectively the “Funds.”
At the start of business on October 1, 2013, Brandywine, a series of Brandywine Fund, Inc. and Brandywine Blue, a series of Brandywine Blue Fund, Inc. (the “Predecessor Funds”), were each reorganized into a respective fund of the Trust. As a result of the reorganization, the Funds are the successors to the accounting and performance information of the Predecessor Funds.
The Funds’ financial statements are prepared in accordance with accounting principles generally accepted in the United States of America (“U.S. GAAP”), which require management to make estimates and assumptions that affect the reported amounts of assets and liabilities and disclosure of contingent assets and liabilities at the date of the financial statements and the reported amounts of income and expenses during the reporting periods. Actual results could differ from those estimates and such differences could be material. The following is a summary of significant accounting policies followed by the Funds in the preparation of their financial statements:
a. VALUATION OF INVESTMENTS
Equity securities traded on a national securities exchange or reported on the NASDAQ national market system (“NMS”) are valued at the last quoted sales price on the primary exchange or, if applicable, the NASDAQ official closing price or the official closing price of the relevant exchange or, lacking any sales, at the last quoted bid price or the mean between the last quoted bid and ask prices (the “exchange mean price”). Equity securities traded in the over-the-counter market (other than NMS securities) are valued at the exchange mean price. Foreign equity securities (securities principally traded in markets other than U.S. markets) are valued at the official closing price on the primary exchange or, for markets that either do not offer an official closing price or where the official closing price may not be representative of the overall market, the last quoted sale price.
Fixed income securities purchased with a remaining maturity of 60 days or less are valued at amortized cost, provided that the amortized cost value is approximately the same as the fair value of the security valued without the use of amortized cost. Investments in other open-end regulated investment companies are valued at their end of day net asset value per share.
The Funds’ investments are generally valued based on independent market quotations or prices or, if none, “evaluative” or other market based valuations provided by third-party pricing services approved by the Board of Trustees of the Trust (the “Board”). Under certain circumstances, the value of certain Fund investments (including derivatives) may be based on an evaluation of fair value, pursuant to procedures established by and under the general supervision of the Board. The Valuation Committee, which is comprised of the Independent Trustees of the Board, and the Pricing Committee, which is comprised of
representatives from AMG Fund, LLC (the “Investment Manager”) are the committees appointed by the Board to make fair value determinations. Each Fund may use the fair value of a portfolio instrument to calculate its net asset value (“NAV”) in the event that the market quotation, price or market based valuation for the portfolio instrument is not readily available or otherwise not determinable pursuant to the Board’s valuation procedures, if the Investment Manager for the Pricing Committee believes the quotation, price or market based valuation to be unreliable, or in certain other circumstances. When determining the fair value of an investment, the Pricing Committee and, if required under the Trust’s securities valuation procedures, the Valuation Committee, seeks to determine the price that the Fund might reasonably expect to receive from current sale of that investment in an arms-length transaction. Fair value determinations shall be based upon consideration of all available facts and information, including, but not limited to (i) attributes specific to the investment; (ii) fundamental and analytical data relating to the investment; and (iii) the value of other comparable securities or relevant financial instruments, including derivative securities, traded on other markets or among dealers.
The values assigned to fair value investments are based on available information and do not necessarily represent amounts that might ultimately be realized in the future, since such amounts depend on future developments inherent in long-term investments. Because of the inherent uncertainty of valuation, those estimated values may differ significantly from the values that would have been used had a ready market for the investments existed, and the differences could be material. The Board will be presented with a quarterly report showing as of the most recent quarter end, all outstanding securities fair valued by the Fund, including a comparison with the prior quarter end and the percentage of the Fund that the security represents at each quarter end.
With respect to foreign equity securities and certain foreign fixed income securities, the Board has adopted a policy that securities held in a Fund that can be fair valued by the applicable fair value pricing service are fair valued on each business day provided that each individual price exceeds a pre-established confidence level.
U.S. GAAP defines fair value as the price that a fund would receive to sell an asset or pay to transfer a liability in an orderly transaction between market participants at the measurement date. U.S. GAAP also establishes a framework for measuring fair value, and a three-level hierarchy for fair value measurements based upon the transparency of inputs to the valuation of an asset or liability. Inputs may be observable or unobservable and refer broadly to the assumptions that market participants would use in pricing the asset or liability. Observable inputs reflect the assumptions market participants would use in pricing the asset or liability based on market data obtained from sources independent of the Funds. Unobservable inputs reflect the Funds’ own assumptions about the assumptions that market participants would use in pricing the asset or liability developed based on the best information available in the circumstances. Each investment is assigned a level based upon the observability of the inputs which are significant to the overall valuation.
The three-tier hierarchy of inputs is summarized below:
Level 1 – inputs are quoted prices in active markets for identical investments (e.g.,equity securities, open-end investment companies)
Notes to Financial Statements (continued)
Level 2 – other observable inputs (including, but not limited to: quoted prices for similar assets or liabilities in markets that are active, quoted prices for identical or similar assets or liabilities in markets that are not active, inputs other than quoted prices that are observable for the assets or liabilities (such as interest rates, yield curves, volatilities, prepayment speeds, loss severities, credit risks and default rates) or other market corroborated inputs) (e.g., debt securities, government securities, foreign currency exchange contracts, foreign securities utilizing international fair value pricing, broker-quoted securities, fair valued securities with observable inputs)
Level 3 – inputs are significant unobservable inputs (including the Fund’s own assumptions used to determine the fair value of investments) (e.g., fair valued securities with unobservable inputs)
Changes in inputs or methodologies used for valuing investments may result in a transfer in or out of levels within the fair value hierarchy. The inputs or methodologies used for valuing investments may not necessarily be an indication of the risk associated with investing in those investments. Transfers between different levels of the fair value disclosure hierarchy are deemed to have occurred as of the beginning of the reporting period.
b. SECURITY TRANSACTIONS
Security transactions are accounted for as of trade date. Realized gains and losses on securities sold are determined on the basis of identified cost.
c. INVESTMENT INCOME AND EXPENSES
Dividend income is recorded on the ex-dividend date. Dividend and interest income on foreign securities is recorded gross of any withholding tax. Interest income, which includes amortization of premium and accretion of discount on debt securities, is accrued as earned. Non- cash dividends included in dividend income, if any, are reported at the fair market value of the securities received. Distributions received in excess of income from return of capital including real estate investment trusts (REITs) are recorded as a reduction of the cost of the related investment and/or as a realized gain. If the Funds no longer own the applicable securities, any distributions received in excess of income are recorded as an adjustment to realized gain. Other income and expenses are recorded on an accrual basis. Expenses that cannot be directly attributed to a Fund are apportioned among the Funds in the Trust and in some cases other affiliated funds based upon their relative average net assets or number of shareholders.
The Funds have a “balance credit” arrangement with The Bank of New York Mellon (“BNYM”), the Funds’ custodian, whereby each Fund is credited with an interest factor equal to 0.75% below the effective 90-day T-Bill rate for account balances left uninvested overnight. If the T-Bill rate falls below 0.75%, no credits will be earned. These credits serve to reduce custodian expenses that would otherwise be charged to each Fund. For the fiscal year ended September 30, 2015, the Funds’ custodian expense was not reduced.
Overdraft fees are computed at 1% above the effective Federal Funds rate on the day of the overdraft. For the fiscal year ended September 30, 2015, overdraft fees for Brandywine and Brandywine Blue equaled $390 and $117, respectively.
d. DIVIDENDS AND DISTRIBUTIONS
Fund distributions resulting from either net investment income or realized net capital gains, if any, will normally be declared and paid at least annually in December, as described in the Funds’ prospectus. Distributions to shareholders are recorded on the ex-dividend date. Distributions are determined in accordance with federal income tax regulations, which may differ from net investment income and net realized capital gains for financial statement purposes (U.S.GAAP). Differences may be permanent or temporary. Permanent differences are reclassified among capital accounts in the financial statements to reflect their tax character. Permanent book and tax basis differences, if any, relating to shareholder distributions will result in reclassifications to paid-in capital. Temporary differences arise when certain items of income, expense and gain or loss are recognized in different periods for financial statement and tax purposes; these differences will reverse at some time in the future. Permanent differences are due to fair fund settlements and a net operating loss. Temporary differences are due to wash sales.
As of September 30, 2015, the components of distributable earnings (excluding unrealized appreciation/depreciation) on a tax basis consisted of:
| | | | | | | | |
| | | Brandywine | | | Brandywine Blue | |
Capital loss carryforward | | $ | 532,405,180 | * | | $ | 999,064,292 | * |
Undistributed ordinary income | | | — | | | | 283,385 | |
Undistributed short-term capital gains | | | — | | | | — | |
Undistributed long-term capital gains | | | — | | | | — | |
Late-year loss deferral | | | — | | | | — | |
| * | Includes realized losses of $11,123,144 and $2,469,225 for Brandywine and Brandyine Blue, respectively, relating to sales of each portfolio made from September 15 to September 30, 2015, that may be deferred, as wash sales under the Internal Revenue Code, if repurchased within 30 days. Such deferrals may decrease each Fund’s capital loss carryforward for tax purposes as shown above. |
e. FEDERAL TAXES
Each Fund intends to comply with the requirements under Subchapter M of the Internal Revenue Code of 1986, as amended, and, to distribute substantially all of its taxable income and gains to its shareholders and to meet certain diversification and income requirements with respect to investment companies. Therefore, no provision for federal income or excise tax is included in the accompanying financial statements.
Additionally, based on each Fund’s understanding of the tax rules and rates related to income, gains and transactions for the foreign jurisdictions in which it invests, each Fund will provide for foreign taxes, and where appropriate, deferred foreign taxes.
Management has analyzed the Funds’ tax positions taken on federal income tax returns as of September 30, 2015, and for all open tax years (generally, the three prior taxable years), and has concluded that no provision for federal income tax is required in the Funds’ financial statements. Additionally, the Funds are not aware of any tax position for which it is reasonably possible that the total amounts of unrecognized tax benefits will change materially in the next twelve months.
25
Notes to Financial Statements (continued)
Net capital losses incurred in taxable years beginning after the enactment of the Regulated Investment Company Modernization Act of 2010, may be carried forward for an unlimited time period. Such losses will be required to be utilized prior to any loss carryovers incurred in pre-enactment taxable years, which generally expire eight years following the close of the taxable year in which they were incurred. As a result of this ordering rule, pre-enactment capital loss carryovers may be more likely to expire unused. Additionally, post- enactment capital losses that are carried forward retain their tax character as either short-term or long-term capital losses, unlike pre-enactment losses which are considered all short-term.
f. CAPITAL LOSS CARRYOVERS AND DEFERRALS
As of September 30, 2015, the Funds had accumulated net realized capital loss carryovers from securities transactions for federal income tax purposes as shown in the following chart. These amounts may be used to offset future realized capital gains, if any, through the expiration dates listed or in the case of post-enactment losses, for an unlimited time period.
| | | | | | | | | | | | |
| | | Capital Loss Carryover Amount | | | Expires | |
| Fund | | Short-Term | | | Long-Term | | | September 30, | |
Brandywine | | | | | | | | | | | | |
(Pre-Enactment) | | $ | 29,260,971 | | | | — | | | | 2017 | |
(Pre-Enactment) | | | 503,144,209 | | | | — | | | | 2018 | |
| | | | | | | | | | | | |
Totals | | $ | 532,405,180 | | | | — | | | | | |
| | | | | | | | | | | | |
Brandywine Blue | | | | | | | | | |
(Pre-Enactment) | | $ | 803,178,060 | | | | — | | | | 2017 | |
(Pre-Enactment) | | | 195,886,232 | | | | — | | | | 2018 | |
| | | | | | | | | | | | |
Totals | | $ | 999,064,292 | | | | — | | | | | |
| | | | | | | | | | | | |
For the fiscal year ended September 30, 2015, the Funds utilized capital loss carryovers in the amount of:
| | | | | | | | |
| | | Capital Loss Carryovers Utilized | |
| | | Short-Term | | | Long-Term | |
Brandywine Fund | | $ | 117,338,789 | | | | — | |
Brandywine Blue Fund | | | 24,167,570 | | | | — | |
g. CAPITAL STOCK
The Trust’s Declaration of Trust authorizes for each fund the issuance of an unlimited number of shares of beneficial interest, without par value. Each Fund records sales and repurchases of its capital stock on the trade date. The cost of securities contributed to the Funds in connection with the issuance of shares is based on the valuation of those securities in accordance with the Funds’ policy on investment valuation.
At September 30, 2015, certain unaffiliated shareholders of record, specifically omnibus accounts, individually or collectively held greater than 10% of the net
assets of the Funds as follows: Brandywine Blue - two collectively own 24%. Transactions by these shareholders may have a material impact on the Fund.
h. REPURCHASE AGREEMENTS
The Funds may enter into repurchase agreements provided that the value of the underlying collateral, including accrued interest, will equal or exceed the value of the repurchase agreement during the term of the agreement. The underlying collateral for all repurchase agreements is held in safekeeping by the Fund’s custodian or at the Federal Reserve Bank. If the seller defaults and the value of the collateral declines, or if bankruptcy proceedings commence with respect to the seller of the security, realization of the collateral by the Fund may be delayed or limited. At September 30, 2015, the market value of repurchase agreements outstanding for Brandywine and Brandywine Blue was $8,863,088, and $1,323,462, respectively.
2. AGREEMENTS AND TRANSACTIONS WITH AFFILIATES
For each of the Funds, the Trust has entered into an investment advisory agreement under which the Investment Manager, a subsidiary and the U.S. retail distributor arm of Affiliated Managers Group, Inc. (“AMG”), serves as investment manager to the Funds and is responsible for the Funds’ overall administration and operations. The Investment Manager selects one or more subadvisors for the Funds (subject to Board approval) and monitors each subadvisor’s investment performance, security holdings and investment strategies. Each Fund’s investment portfolio is managed by Friess Associates, LLC (“Friess”) through a subadvisory agreement between the Investment Manager and Friess relating to each Fund, and Friess Associates of Delaware, LLC (“Friess of Delaware”) through a sub-subadvisor agreement among the Investment Manager, Friess and Friess of Delaware relating to each Fund.
Investment management fees are paid directly by the Funds to the Investment Manager based on average daily net assets. For the fiscal year ended September 30, 2015, the Funds’ investment management fees were paid at the following annual rates of each Fund’s respective average daily net assets:
| | | | |
Brandywine | | | 1.00 | % |
Brandywine Blue | | | 1.00 | % |
The Investment Manager has contractually agreed, through at least February 1, 2016, to waive management fees (but not below zero) and/or reimburse each Fund’s expenses in order to limit total annual Fund operating expenses (exclusive of taxes, interest (including interest incurred in connection with bank and custody overdrafts), brokerage commissions and other transaction costs, acquired fund fees and expenses, and extraordinary expenses) to 2.00% of each Fund’s average daily net assets subject to later reimbursement by the Fund in certain circumstances. Each contractual expense limitation may only be terminated in the event the Investment Manager or a successor ceases to be the investment manager of the Fund or a successor fund, by mutual agreement between the Investment Manager and the Board, or in the event of the Fund’s liquidation unless the Fund is reorganized or is a party to a merger in which the surviving entity is successor to the accounting and performance information of the Fund.
Each Fund is obligated to repay the Investment Manager such amounts waived, paid, or reimbursed in future years provided that the repayment occurs within
26
Notes to Financial Statements (continued)
thirty-six (36) months after the waiver or reimbursement and that such repayment would not cause the Fund’s total annual operating expenses after fee waiver and expense reimbursements in any such future year to exceed that Fund’s respective contractual expense limitation amount. For the fiscal year ended September 30, 2015, each Fund had no reimbursement available for repayment.
Each Fund has entered into an Administration and Shareholder Servicing Agreement under which the Investment Manager serves as the Funds’ administrator (the “Administrator”) and is responsible for all aspects of managing the Funds’ operations, including administration and shareholder services to each Fund, its shareholders, and certain institutions, such as bank trust departments, broker-dealers and registered investment advisers, that advise or act as intermediary with the Funds’ shareholders. The Funds pay a fee to the Administrator at the rate of 0.03% of each Fund’s average daily net assets for the first $300 million of assets under management, 0.025% for the next $200 million, and 0.02% on amounts in excess of $500 million per annum, subject to a $40,000 annual minimum.
Effective January 1, 2015, the Board provides supervision of the affairs of the Trust, other trusts within the AMG Funds family of mutual funds (collectively the “AMG Funds family”) and other affiliated funds. Previously, the Board provided supervision to only the Trust and other trusts within the AMG Funds family.
Beginning January 1, 2015, the aggregate annual retainer paid to each Independent Trustee of the Board is $200,000, plus $16,000, $4,000 or $2,000 for each regular, in-person special or telephonic special meeting attended, respectively. The Independent Chairman of the Trusts receives an additional payment of $55,000 per year. The Chairman of the Audit Committee receives an additional payment of $25,000 per year.
Prior to January 1, 2015, the aggregate annual retainer paid to each Independent Trustee of the Board was $130,000, plus $7,000 or $2,500 for each regular or special meeting attended, respectively. The Independent Chairman of the Trust formerly received an additional payment of $35,000 per year. The Chairman of the Audit Committee formerly received an additional payment of $15,000 per year.
Effective January 1, 2015, the Trustees’ fees and expenses are generally allocated among all of the funds in the Trust, other trusts within the AMG Funds family and other affiliated funds based on the relative net assets of such funds. Before January 1, 2015, the Trustees’ fees and expenses were generally allocated among all of the funds in the Trust and other trusts within the AMG Funds family. The “Trustees fees and expenses “shown in the financial statements represents each Fund’s allocated portion of the total fees and expenses paid to the Independent Trustees of the Board.
The Funds are distributed by AMG Distributors, Inc. (the “Distributor”), a wholly-owned subsidiary of the Investment Manager. The Distributor serves as the distributor and underwriter for each Fund and is a registered broker-dealer and member of the Financial Industry Regulatory Authority, Inc. (“FINRA”). Shares of each Fund will be continuously offered and will be sold directly to prospective purchasers and through brokers, dealers or other financial intermediaries who have executed selling agreements with the Distributor. Subject to the
compensation arrangement discussed below, generally the Distributor bears all or a portion of the expenses of providing services pursuant to the distribution agreement, including the payment of the expenses relating to the distribution of prospectuses for sales purposes and any advertising or sales literature. Certain Trustees and Officers of the Funds are Officers and/or Directors of the Investment Manager, AMG and/or the Distributor.
The Board has approved reimbursement payments to the Investment Manager for shareholder servicing expenses (“shareholder servicing fees”) incurred. Shareholder servicing fees include payments to third parties such as a bank, broker- dealer, trust company or other financial intermediaries who provide shareholder recordkeeping, account servicing and other services. To the extent the Investment Manager makes shareholder servicing payments to a third party, the Fund may reimburse the Investment Manager up to the amounts incurred. For the fiscal year ended September 30, 2015, Brandywine and Brandywine Blue paid $197,167 or 0.02%, and $142,579 or 0.07%, respectively.
The Securities and Exchange Commission has granted an exemptive order that permits the Funds to lend and borrow money for certain temporary purposes directly to and from other eligible Funds in the AMG Funds family. Participation in this interfund lending program is voluntary for both the borrowing and lending Funds, and an interfund loan is only made if it benefits each participating Fund. The Investment Manager administers the program according to procedures approved by the Board, and the Board monitors the operation of the program. An interfund loan must comply with certain conditions set out in the exemptive order, which are designed to assure fairness and protect all participating Funds. For the fiscal year ended September 30, 2015, Brandywine borrowed $9,838,726 for one day paying interest of $168. The interest amount is included in the Statement of Operations as miscellaneous expense. At September 30, 2015, the Funds had no interfund loans outstanding.
3. PURCHASES AND SALES OF SECURITIES
Purchases and sales of securities (excluding short-term securities and U.S. Government obligations) for the fiscal year ended September 30, 2015, were as follows:
| | | | | | | | |
| | | Long-Term Securities | |
| Fund | | Purchases | | | Sales | |
Brandywine | | $ | 1,539,067,825 | | | $ | 1,608,238,019 | |
Brandywine Blue | | | 303,870,203 | | | | 358,485,889 | |
The Funds had no purchases or sales of U.S. Government obligations during the fiscal year ended September 30, 2015.
4. PORTFOLIO SECURITIES LOANED
The Funds participate in a securities lending program offered by BNYM (the “Program”), providing for the lending of securities to qualified brokers. Securities lending income includes earnings of such temporary cash investments, plus or minus any rebate to a borrower. These earnings (after any rebate) are then divided between BNYM, as a fee for its services under the Program, and the Funds, according to agreed-upon rates. Collateral received on all securities loaned is accepted in cash and is maintained at a minimum level of 102% (105% in the case of certain foreign securities) of the market value, plus interest, if applicable, of investments on loan. It is the Funds’ policy to
27
Notes to Financial Statements (continued)
obtain additional collateral from or return excess collateral to the borrower by the end of the next business day, following the valuation date of the securities loaned. Therefore, the value of the collateral held may be temporarily less than the value of the securities on loan. Lending securities entails a risk of loss to the Funds if and to the extent that the market value of the securities loaned were to increase and the borrower did not increase the collateral accordingly, and the borrower fails to return the securities. Under the terms of the Program, the Funds are indemnified for such losses by BNYM. Cash collateral is held in a separate account managed by BNYM, who is authorized to exclusively enter into overnight government repurchase agreements. BNYM bears the risk of any deficiency in the amount of the cash collateral available for return to the borrower due to any loss on the collateral invested. At September 30, 2015, the value of the securities loaned and cash collateral received were as follows:
| | | | | | | | |
| Fund | | Securities
Loaned | | | Cash Collateral
Received | |
Brandywine | | $ | 9,103,699 | | | $ | 8,863,088 | |
Brandywine Blue | | | 1,362,837 | | | | 1,323,462 | |
5. COMMITMENTS AND CONTINGENCIES
Under the Trust’s organizational documents, its trustees and officers are indemnified against certain liabilities arising out of the performance of their
duties to the Trust. In addition, in the normal course of business, the Funds may enter into contracts and agreements that contain a variety of representations and warranties, which provide general indemnifications. The maximum exposure to the Funds under these arrangements is unknown, as this would involve future claims that may be made against a Fund that have not yet occurred. However, based on experience, the Funds had no prior claims or losses and expect the risks of loss to be remote.
6. MASTER NETTING AGREEMENTS
The Funds may enter into master netting agreements with their counterparties for the securities lending program and repurchase agreements, which provide the right, in the event of default (including bankruptcy or insolvency) for the non-defaulting party to liquidate the collateral and calculate net exposure to the defaulting party or request additional collateral. For financial reporting purposes, the Funds do not offset financial assets and financial liabilities that are subject to master netting agreements in the Statement of Assets and Liabilities. For security lending transactions, see Note 4.
The following table is a summary of the Funds’ open repurchase agreements which are subject to a master netting agreement as of September 30, 2015:
| | | | | | | | | | | | | | | | |
| | | | | | Gross Amount Not Offset in the | | | | |
| | | | | | Statement of Assets and Liabilities | | | | |
| | | Net Amounts of Assets
Presented in the Statement
of Assets and Liabilities | | | Financial
Instruments
Collateral | | | Cash Collateral
Received | | | Net Amount | |
Brandywine | | | | | | | | | | | | | | | | |
BNP Paribas Securities Corp. | | $ | 2,104,990 | | | $ | 2,104,990 | | | | — | | | | — | |
Citigroup Global Markets, Inc. | | | 2,104,990 | | | | 2,104,990 | | | | — | | | | — | |
HSBC Securities USA, Inc. | | | 2,104,990 | | | | 2,104,990 | | | | — | | | | — | |
Mizuho Securities USA, Inc. | | | 2,104,990 | | | | 2,104,990 | | | | — | | | | — | |
Royal Bank of Scotland PLC | | | 443,128 | | | | 443,128 | | | | — | | | | — | |
| | | | | | | | | | | | | | | | |
Totals | | $ | 8,863,088 | | | $ | 8,863,088 | | | | — | | | | — | |
| | | | | | | | | | | | | | | | |
Brandywine Blue | | | | | | | | | | | | | | | | |
HSBC Securities USA, Inc. | | $ | 1,000,000 | | | $ | 1,000,000 | | | | — | | | | — | |
Royal Bank of Scotland PLC | | | 323,462 | | | | 323,462 | | | | — | | | | — | |
| | | | | | | | | | | | | | | | |
Totals | | $ | 1,323,462 | | | $ | 1,323,462 | | | | — | | | | — | |
| | | | | | | | | | | | | | | | |
7. SUBSEQUENT EVENTS
Each Fund has determined that no material events or transactions occurred through the issuance date of the Funds’ financial statements which require additional disclosure in or adjustment of the Funds’ financial statements.
28
Notes to Financial Statements (continued)
TAX INFORMATION (unaudited)
AMG Managers Brandywine Fund and AMG Managers Brandywine Blue Fund each hereby designates the maximum amount allowable of its net taxable income as qualified dividends as provided in the Jobs and Growth Tax Relief Reconciliation Act of 2003. The 2014/2015 Form 1099-DIV you receive for the Fund will show the tax status of all distributions paid to you during the year.
Pursuant to section 852 of the Internal Revenue Code, both AMG Managers Brandywine Fund and AMG Managers Brandywine Blue Fund hereby designate $0 as a capital gain distribution with respect to the taxable fiscal year ended September 30, 2015, or if subsequently determined to be different, the net capital gains of such year.
29
Report of Independent Registered Public Accounting Firm
| | |
TO THE BOARD OF TRUSTEES OF AMG FUNDS I AND SHAREHOLDERS OF AMG MANAGERS BRANDYWINE FUND AND AMG MANAGERS BRANDYWINE BLUE FUND In our opinion, the accompanying statements of assets and liabilities, including the schedules of portfolio investments, and the related statements of operations and of changes in net assets and the financial highlights present fairly, in all material respects, the financial positions of AMG Managers Brandywine Fund and AMG Managers Brandywine Blue Fund (the “Funds”) at September 30, 2015, and the results of each of their operations, the changes in each of their net assets and the financial highlights for each of the periods indicated, in conformity with accounting principles generally accepted in the United States of America. These financial statements and financial highlights (hereafter referred to as ”financial statements”) are the responsibility of the Funds’ management. Our responsibility is to express an opinion on these financial statements based on our audits. We conducted our audits of these financial statements in accordance with the standards of the Public Company Accounting Oversight Board (United States). Those standards require that we plan and perform the audit to obtain reasonable assurance about whether the financial statements are free of material misstatement. An audit includes examining, on a test basis, evidence supporting the amounts and disclosures in the financial statements, assessing the accounting principles used and significant estimates made by management, and evaluating the overall financial statement presentation. We believe that our audits, which included confirmation of securities at September 30, 2015 by correspondence with the custodian and brokers, and the application of alternative auditing procedures where securities purchased had not been received, provide a reasonable basis for our opinion. | | |
PricewaterhouseCoopers LLP
Boston, Massachusetts
October 20, 2015
30
Annual Renewal of Investment Management and Subadvisory Agreements (unaudited)
At an in-person meeting held on June 24-25, 2015, the Board of Trustees (the “Board or the “Trustees”), and separately a majority of the Trustees who are not” interested persons” of the Trust (the “Independent Trustees”), approved the Investment Management Agreement and separately an amendment to the Investment Management Agreement, in each case with AMG Funds LLC (the “Investment Manager”) (collectively the “Investment Management Agreement”) for each of AMG Managers Brandywine Fund and AMG Managers Brandywine Blue Fund (each a “Fund”), the Subadvisory Agreement with the Subadvisor with respect to each Fund and the Sub-Subadvisory Agreement with the Sub-Subadvisor with respect to each Fund. The Subadvisory Agreements and the Sub-Subadvisory Agreements are referred to collectively herein as the “Friess Agreements” and the Subadvisor and the Sub-Subadvisor are referred to collectively herein as “Friess.” The Independent Trustees were separately represented by independent legal counsel in connection with their consideration of the approval of these agreements.
In considering the Investment Management and Friess Agreements, the Trustees reviewed a variety of materials relating to each Fund, the Investment Manager and Friess including comparative performance, fee and expense information for an appropriate peer group of similar mutual funds (each a “Peer Group”), performance information for relevant benchmark indices (each a“Fund Benchmark”) and, with respect to Friess, comparative performance information for an appropriate peer group of managed accounts, and, as to all other matters, other information provided to them on a periodic basis throughout the year, as well as information provided in connection with the meetings of June 24- 25, 2015, regarding the nature, extent and quality of services provided by the Investment Manager and Friess under their respective agreements. Prior to voting, the Independent Trustees: (a) reviewed the foregoing information with their independent legal counsel and with management; (b) received materials from their independent legal counsel discussing the legal standards applicable to their consideration of
the Investment Management Agreement and the Friess Agreements; and (c) met with their independent legal counsel in private sessions at which no representatives of management were present.
NATURE, EXTENT AND QUALITY OF SERVICES
In considering the nature, extent and quality of the services provided by the Investment Manager, the Trustees reviewed information relating to the Investment Manager’s operations and personnel. Among other things, the Investment Manager provided financial information, biographical information on its supervisory and professional staff and descriptions of its organizational and management structure. The Trustees also took into account information provided periodically throughout the previous year by the Investment Manager in Board meetings relating to the performance of its duties with respect to the Funds and the Trustees’ knowledge of the Investment Manager’s management and the quality of the performance of the Investment Manager’s duties.
In the course of their deliberations regarding the Investment Management Agreement, the Trustees evaluated,among other things: (a) the extent and quality of the Investment Manager’s oversight of the operation and management of the Funds; (b) the quality of the search, selection and monitoring services performed by the Investment Manager in overseeing the portfolio management responsibilities of Friess; (c) the Investment Manager’s ability to supervise the Funds’ other service providers; and (d) the Investment Manager’s compliance program. The Trustees also took into account that, in performing its functions under the Investment Management Agreement and supervising Friess, the Investment Manager: performs periodic detailed analysis and reviews of the performance by Friess of its obligations to each Fund, including without limitation, analysis and review of portfolio and other compliance matters and review of Friess’s investment performance in respect of each Fund; prepares and presents periodic reports to the
Board regarding the investment performance of Friess and other information regarding Friess, at such times and in such forms as the Board may reasonably request; reviews and considers any changes in the personnel of Friess responsible for performing Friess’s obligations and makes appropriate reports to the Board; reviews and considers any changes in the ownership or senior management of Friess and makes appropriate reports to the Board; performs periodic in-person or telephonic diligence meetings, including with respect to compliance matters, with representatives of Friess; assists the Board and management of the Trust in developing and reviewing information with respect to the initial approval of each Friess Agreement and annual consideration of each Friess Agreement thereafter; prepares recommendations with respect to the continued retention of Friess or the replacement of Friess, including at the request of the Board; identifies potential successors to or replacements of Friess or potential additional subadvisors, performs appropriate due diligence, and develops and presents to the Board a recommendation as to any such successor, replacement, or additional subadvisor, including at the request of the Board; designates and compensates from its own resources such personnel as the Investment Manager may consider necessary or appropriate to the performance of its services; and performs such other review and reporting functions as the Board shall reasonably request consistent with the Investment Management Agreement and applicable law. The Trustees also took into account the financial condition of the Investment Manager with respect to its ability to provide the services required under the Investment Management Agreement and the Investment Manager’s undertaking to maintain a contractual expense limitation for each Fund (which is expected to expire on February 1, 2016). The Trustees also considered the Investment Manager’s risk management processes.
For each Fund, the Trustees also reviewed information relating to Friess’s operations and personnel and the investment philosophy, strategies and techniques (its” Investment
31
Annual Renewal of Investment Management and Subadvisory Agreements (continued)
Strategy”) used in managing the Fund. Among other things, the Trustees reviewed biographical information on portfolio management and other professional staff, information regarding Friess’s organizational and management structure and Friess’s brokerage policies and practices. The Trustees considered specific information provided regarding the experience of the individuals at Friess with portfolio management responsibility for the Funds, including the information set forth in the Funds’ prospectus and statement of additional information. In the course of their deliberations, the Trustees evaluated, among other things: (a) the services rendered by Friess in the past; (b) the qualifications and experience of Friess’s personnel; and (c) Friess’s compliance program. The Trustees also took into account the financial condition of Friess with respect to its ability to provide the services required under each Friess Agreement. The Trustees also considered Friess’s risk management processes.
PERFORMANCE
As noted above, the Board considered each Fund’s net performance during relevant time periods as compared to the Fund’s Peer Group and Fund Benchmark and considered Friess’s performance as compared to an appropriate peer group of managed accounts and also considered the gross performance of the Fund as compared to Friess’s relevant performance composite that utilizes the same investment strategy and approach and noted that the Board reviews on a quarterly basis detailed information about the Fund’s performance results, portfolio composition and Friess’s Investment Strategy. The Board noted the Investment Manager’s expertise and resources in monitoring the performance, investment style and risk-adjusted performance of Friess. The Board was mindful of the Investment Manager’s attention to monitoring Friess’s performance with respect to the Funds and its discussions with management regarding the factors that contributed to the performance of the Funds.
ADVISORY FEES AND PROFITABILITY
In considering the reasonableness of the advisory fee charged by the Investment Manager for
managing each Fund, the Trustees noted that the Investment Manager, and not the Fund, is responsible for paying the fees charged by the Fund’s Subadvisor, and, in turn, the Subadvisor is responsible for paying the fees charged by the Fund’s Sub-Subadvisor and, therefore, that the fees paid to the Investment Manager cover the cost of providing portfolio management services as well as the cost of providing search, selection and monitoring services in operating a “manager-of-managers” complex of mutual funds. The Trustees noted that the Investment Manager pays the Subadvisor a subadvisory fee that is equal to the advisory fee that it receives from each Fund. The Trustees concluded that, in light of the additional high quality supervisory services provided by the Investment Manager and the fact that the Investment Manager and the Subadvisor are paying the fees under the Subadvisory Agreements and Sub-Subadvisory Agreements, respectively, the advisory fee payable by each Fund to the Investment Manager can reasonably be expected to exceed the median advisory fee for the Peer Group, which consists of many funds that do not operate with a manager-of-managers structure. In this regard, the Trustees also noted that the Investment Manager has undertaken to maintain a contractual expense limitation for each Fund (which is expected to expire on February 1, 2016).
In addition, in considering the reasonableness of the advisory fee payable to the Investment Manager, the Trustees also reviewed information provided by the Investment Manager setting forth all revenues and other benefits, both direct and indirect (including any so-called” fallout benefits” such as reputational value derived from the Investment Manager serving as Investment Manager to a Fund), received by the Investment Manager and its affiliates attributable to managing each Fund and all the mutual funds in the AMG Funds Family of Funds, the cost of providing such services and the resulting profitability to the Investment Manager and its affiliates from these relationships. The Trustees also noted the current asset levels of each Fund and the willingness of the Investment Manager to waive fees and pay expenses for all of the Funds from time to time as
a means of limiting total expenses. The Trustees also considered management’s discussion of the current asset levels of the Funds, and considered the impact on profitability of the current asset levels and any future growth of assets of the Funds. The Board took into account management’s discussion of the current advisory fee structure, and, as noted above, the services the Investment Manager provides in performing its functions under the Investment Management Agreement and supervising Friess. In this regard, the Trustees noted that, unlike a mutual fund that is managed by a single investment adviser, the Funds operate in a manager-of-managers structure. Based on the foregoing, the Trustees concluded that the profitability to the Investment Manager is reasonable and that the Investment Manager is not realizing material benefits from economies of scale that would warrant adjustments to the advisory fees for any Fund at this time. With respect to economies of scale, the Trustees also noted that as a Fund’s assets increase over time, the Fund may realize other economies of scale to the extent that the increase in assets is proportionally greater than the increase in certain other expenses.
In considering the reasonableness of the fee payable by the Investment Manager to Friess, the Trustees relied on the ability of the Investment Manager to negotiate the terms of the Friess Agreements at arm’s length as part of the manager-of-managers structure, noting that the Investment Manager is not affiliated with Friess. In addition, the Trustees considered other potential benefits of the subadvisory relationship to Friess, including, among others, the indirect benefits that Friess may receive from its relationship with a Fund, including any so-called “fallout benefits “to Friess, such as reputational value derived from the Subadvisor and Sub-Subadvisor serving as Subadvisor and Sub-Subadvisor, respectively, to the Fund. In addition, the Trustees noted that the subadvisory fees are paid by the Investment Manager out of its advisory fee and, in turn, the sub-subadvisory fees are paid by the Subadvisor. As a consequence of all of the foregoing, the cost of services to be provided by Friess and the
Annual Renewal of Investment Management and Subadvisory Agreements (continued)
profitability to Friess of its relationship with a Fund were not material factors in the Trustees’ deliberations. For similar reasons, the Trustees did not consider potential economies of scale in the management of a Fund by Friess to be a material factor in their deliberations at this time.
In addition to the foregoing, the Trustees considered the specific factors and related conclusions set forth below with respect to each Fund, the Investment Manager and Friess.
AMG Managers Brandywine Fund
Fund Performance
Among other information relating to the Fund’s performance (including the predecessor fund’s performance for periods prior to its acquisition by the Trust on October 1, 2013), the Trustees noted that the Fund’s performance for the 1-year, 3-year, 5-year and 10-year periods ended March 31, 2015 was above, below, below and below, respectively, the median performance of the Peer Group and below the performance of the Fund Benchmark, the Russell® 3000 Growth Index. The Trustees also took into account management’s discussion of the Fund’s performance, including the fact that the Fund ranked in the top quintile relative to its Peer Group for the 1-year period. The Trustees noted the impact of the Fund’s underperformance from 2009 to 2012. The Trustees concluded that the Fund’s performance is being addressed.
Advisory and Subadvisory Fees
The Trustees noted that the Fund’s advisory fees (which include both the advisory and administration fee) and total expenses (net of applicable expense waivers/reimbursements) as of March 31, 2015 were both higher than the average for the Fund’s Peer Group. The Trustees took into account the fact that the Investment Manager has contractually agreed, through February 1, 2016, to limit the Fund’s net annual operating expenses (subject to certain excluded expenses) to 2.00% and noted that the Fund was operating below its expense cap as of March 31, 2015.
The Trustees also took into account
management’s discussion of the Fund’s expenses and competitiveness with comparably sized funds. The Trustees concluded that, in light of the nature, extent and quality of the services provided by the Investment Manager and Friess, the foregoing expense limitation and the considerations noted above with respect to the Investment Manager and Friess, the Fund’s advisory, subadvisory and sub-subadvisory fees are reasonable.
AMG Managers Brandywine Blue Fund
Fund Performance
Among other information relating to the Fund’s performance (including the predecessor fund’s performance for periods prior to its acquisition by the Trust on October 1, 2013), the Trustees noted that the Fund’s performance for the 1-year, 3-year, 5-year and 10-year periods ended March 31, 2015 was above, below, below and below, respectively, the median performance of the Peer Group and below the performance of the Fund Benchmark, the Russell 1000® Growth Index. The Trustees also took into account management’s discussion of the Fund’s performance, including the fact that the Fund ranked in the second quartile relative to its Peer Group for the 1-year period. The Trustees noted the impact of the Fund’s underperformance from 2009 to 2013. The Trustees concluded that the Fund’s performance is being addressed.
Advisory and Subadvisory Fees
The Trustees noted that the Fund’s advisory fees (which include both the advisory and administration fee) and total expenses (net of applicable expense waivers/reimbursements) as of March 31, 2015 were both higher than the average for the Peer Group. The Trustees took into account the fact that the Investment Manager has contractually agreed, through February 1, 2016, to limit the Fund’s net annual operating expenses (subject to certain excluded expenses) to 2.00% and noted that the Fund was operating below its expense cap as of March 31, 2015. The Trustees also took into account management’s discussion of the Fund’s expenses and competitiveness with comparably sized funds. The Trustees concluded
that, in light of the nature, extent and quality of the services provided by the Investment Manager and Friess, the foregoing expense limitation and the considerations noted above with respect to the Investment Manager and Friess, the Fund’s advisory, subadvisory and sub-subadvisory fees are reasonable.
* * * *
After consideration of the foregoing, the Trustees also reached the following conclusions (in addition to the conclusions discussed above) regarding the Investment Management Agreement and each Friess Agreement: (a) the Investment Manager and Friess have demonstrated that they possess the capability and resources to perform the duties required of them under the Investment Management Agreement and the Friess Agreements; (b) Friess’s Investment Strategy is appropriate for pursuing the applicable Fund’s investment objectives; and (c) the Investment Manager and Friess maintain appropriate compliance programs.
Based on all of the above-mentioned factors and their related conclusions, with no single factor or conclusion being determinative and with each Trustee not necessarily attributing the same weight to each factor, the Trustees concluded that approval of the Investment Management Agreement and each Friess Agreement would be in the best interests of the applicable Fund and its shareholders. Accordingly, on June 24-25, 2015, the Trustees, and separately a majority of the Independent Trustees, voted to approve the Investment Management Agreement and the Friess Agreements for each Fund.
AMG Funds
Trustees and Officers
The Trustees and Officers of the Trust, their business addresses, principal occupations for the past five years and dates of birth are listed below. The Trustees provide broad supervision over the affairs of the Trust and the Funds. The Trustees are experienced executives who meet periodically throughout the year to oversee the Funds’ activities, review contractual arrangements with
companies that provide services to the Funds, and review the Funds’ performance. Unless otherwise noted, the address of each Trustee or Officer is the address of the Trust: 800 Connecticut Avenue, Norwalk, CT 06854.
There is no stated term of office for Trustees. Trustees serve until their resignation, retirement or removal in accordance with the Trust’s
organizational documents and policies adopted by the Board from time to time. The Chairman of the Trustees, President, Treasurer and Secretary of the Trust are elected by the Trustees annually. Other officers hold office at the pleasure of the Trustees.
Independent Trustees
The following Trustees are not “interested persons” of the Trust within the meaning of the 1940 Act:
| | |
Number of Funds Overseen in Fund Complex | | Name, Date of Birth, Principal Occupation(s) During Past 5 Years and Other Directorships Held by Trustee |
• Trustee since 2012 | | Bruce B. Bingham, 12/1/48 |
• Oversees 45 Funds in Fund Complex | | Partner, Hamilton Partners (real estate development firm) (1987-Present); Trustee of Aston Funds (27 portfolios) (2014-Present) Director of The Yacktman Funds (2000-2012). |
| |
• Independent Chairman | | William E. Chapman II, 9/23/41 |
• Trustee since 2000 • Oversees 45 Funds in Fund Complex | | President and Owner, Longboat Retirement Planning Solutions (1998-Present); Hewitt Associates, LLC (part time) (provider of Retirement and Investment Education Seminars) (2002-2009); Trustee Emeritus of Bowdoin College (2013-Present); Trustee of Bowdoin College (2002-2013); Director of Harding, Loevner Funds, Inc. (6 portfolios); Trustee of Third Avenue Trust (5 portfolios); Trustee of Third Avenue Variable Trust (1 portfolio); Trustee of Aston Funds (27 portfolios) (2010-Present). |
| |
• Trustee since 2000 | | Edward J. Kaier, 9/23/45 |
• Oversees 45 Funds in Fund Complex | | Attorney at Law and Partner, Teeters Harvey Marrone & Kaier LLP (2007-Present); Attorney at Law and Partner, Hepburn Willcox Hamilton & Putnam, LLP (1977-2007); Trustee of Third Avenue Trust (5 portfolios); Trustee of Third Avenue Variable Trust (1 portfolio); Trustee of Aston Funds (27 portfolios) (2010-Present). |
| |
• Trustee since 2013 | | Kurt A. Keilhacker, 10/5/63 |
• Oversees 47 Funds in Fund Complex | | Managing Member, TechFund Capital (1997-Present); Managing Member, TechFund Europe (2000-Present); Trustee, Gordon College (2001-Present); Board Member, 6wind SA, (2002-Present); Managing Member, Elementum Ventures (2013-Present); Trustee of Aston Funds (27 portfolios) (2014-Present). |
| |
• Trustee since 2000 | | Steven J. Paggioli, 4/3/50 |
• Oversees 45 Funds in Fund Complex | | Independent Consultant (2002-Present); Formerly Executive Vice President and Director, The Wadsworth Group (1986-2001); Executive Vice President, Secretary and Director, Investment Company Administration, LLC (1990-2001); Vice President, Secretary and Director, First Fund Distributors, Inc. (1991-2001); Trustee, Professionally Managed Portfolios (43 portfolios); Advisory Board Member, Sustainable Growth Advisors, LP; Independent Director, Chase Investment Counsel (2008 – Present); Trustee of Aston Funds (27 portfolios) (2010-Present). |
| |
• Trustee since 2013 | | Richard F. Powers III, 2/2/46 |
• Oversees 45 Funds in Fund Complex | | Adjunct Professor, Boston College (2011-Present); Trustee of Aston Funds (27 portfolios) (2014-Present); President and CEO of Van Kampen Investments Inc. (1998-2003). |
| |
• Trustee since 2000 | | Eric Rakowski, 6/5/58 |
• Oversees 47 Funds in Fund Complex | | Professor, University of California at Berkeley School of Law (1990-Present); Director of Harding, Loevner Funds, Inc. (6 portfolios); Trustee of Third Avenue Trust (5 portfolios); Trustee of Third Avenue Variable Trust (1 portfolio); Trustee of Aston Funds (27 portfolios) (2010-Present). |
| |
• Trustee since 2013 • Oversees 47 Funds in Fund Complex | | Victoria L. Sassine, 8/11/65 Lecturer, Babson College (2007 – Present); Trustee of Aston Funds (27 portfolios) (2014-Present). |
| |
• Trustee since 2000 | | Thomas R. Schneeweis, 5/10/47 |
• Oversees 45 Funds in Fund Complex | | Professor Emeritus, University of Massachusetts (2013 - Present); Partner, S Capital Management, LLC (2007-Present); President, TRS Associates (1982-Present); Director, CISDM at the University of Massachusetts, (1996-2013); President, Alternative Investment Analytics, LLC, (formerly Schneeweis Partners, LLC) (2001-2013); Professor of Finance, University of Massachusetts (1977-2013); Partner, White Bear Partners, LLC (2007-2010); Partner, Northampton Capital Management, LLC (2004-2010); Trustee of Aston Funds (27 portfolios) (2010-Present). |
34
AMG Funds
Trustees and Officers (continued)
Interested Trustees
Each Trustee in the following table is an “interested person “of the Trust within the meaning of the 1940 Act. Ms. Carsman is an interested person of the Trust within the meaning of the 1940 Act by virtue of her position with, and interest in securities of, AMG, and her former position as Chief Legal Officer of the Trust.
| | |
Number of Funds Overseen in Fund Complex | | Name, Date of Birth, Principal Occupation(s) During Past 5 Years and Other Directorships Held by Trustee |
• Trustee since 2011 | | Christine C. Carsman, 4/2/52 |
• Oversees 47 Funds in Fund Complex | | Senior Vice President and Deputy General Counsel, Affiliated Managers Group, Inc. (2011-Present); Trustee of Aston Funds (27 portfolios) (2014-Present); Senior Vice President and Chief Regulatory Counsel, Affiliated Managers Group, Inc. (2007-2011); Vice President and Chief Regulatory Counsel, Affiliated Managers Group, Inc. (2004-2007); Secretary and Chief Legal Officer, AMG Funds, AMG Funds I, AMG Funds II and AMG Funds III (2004-2011); Senior Counsel, Vice President and Director of Operational Risk Management and Compliance, Wellington Management Company, LLP (1995-2004). |
Officers
| | |
Position(s) Held with Fund and Length of Time Served | | Name, Date of Birth, Principal Occupation(s) During Past 5 Years |
• President since 2014 | | Jeffrey T. Cerutti, 2/7/68 |
• Principal Executive Officer since 2014 | | Chief Executive Officer, AMG Funds LLC (2014-Present); Director, President and Principal, AMG Distributors, Inc. (2014-Present); Chief Executive Officer and President, Aston Funds (2015-Present); President, VP Distributors, (2011-2014); Executive Vice President, Head of Distribution, Virtus Investment Partners, Inc. (2010-2014); Managing Director, Head of Sales, UBS Global Asset Management (2001-2010). |
| |
• Chief Operating Officer since 2007 | | Keitha L. Kinne, 5/16/58 Chief Operating Officer, AMG Funds LLC (2007-Present); Chief Investment Officer, AMG Funds LLC (2008-Present); Chief Operating Officer, AMG Distributors, Inc. (2007-Present); Managing Partner, AMG Funds LLC (2007-2014); President, AMG Funds (2012-2014); President, AMG Distributors, Inc. (2012-2014); Managing Director, Legg Mason & Co., LLC (2006-2007); Managing Director, Citigroup Asset Management (2004-2006). |
| |
• Secretary since 2015 | | Mark J. Duggan, 2/20/65 |
• Chief Legal Officer since 2015 | | Senior Vice President and Senior Counsel, AMG Funds LLC (2015-Present); Secretary, and Chief Legal Officer, AMG Funds, AMG Funds I, AMG Funds II and AMG Funds III (2015-Present); Attorney, K&L Gates, LLP (2009-2015). |
| |
• Chief Financial Officer since 2007 • Treasurer since 1999 • Principal Financial Officer since 2008 | | Donald S. Rumery, 5/29/58 Senior Vice President, Director of Mutual Funds Services, AMG Funds LLC (2005-Present); Treasurer, AMG Funds III (1995-Present); Treasurer, AMG Funds (1999-Present); Treasurer, AMG Funds II (2000-Present); Chief Financial Officer, AMG Funds, AMG Funds III and AMG Funds III (2007-Present); Treasurer and Chief Financial Officer, AMG Distributors, Inc. (2000-2012); Vice President, AMG Funds LLC, (1994-2004). |
| |
• Assistant Treasurer since 2014 | | John C. Ball, 1/9/76 Vice President, Assistant Treasurer, AMG Funds LLC (2014-Present); Vice President, State Street Corp. (2010-2014); Vice President, State Street International (Ireland) Limited (2007-2010). |
| |
• Chief Compliance Officer since 2010 | | John J. Ferencz, 3/9/62 Vice President, Chief Compliance Officer - AMG Family of Funds, AMG Funds LLC (2010-Present); Code of Ethics Reporting Officer and Sarbanes Oxley Code of Ethics Compliance Officer, AMG Funds, AMG Funds I, AMG Funds II and AMG Funds III (2010-Present); Senior Compliance Analyst, Mutual Funds and Regulatory, GE Asset Management Incorporated (2005-2010). |
| |
• Anti-Money Laundering Compliance Officer since 2014 | | Patrick J. Spellman, 3/15/74 Senior Vice President, Chief Compliance Officer, AMG Funds LLC (2011-Present); Chief Compliance Officer, AMG Distributors, Inc., (2010-Present); Compliance Manager, Legal and Compliance, Affiliated Managers Group, Inc. (2005-2011). |
35
THIS PAGE INTENTIONALLY LEFT BLANK
Investment Manager and
Administrator*
AMG Funds LLC
800 Connecticut Avenue
Norwalk, CT 06854
(800) 835-3879
Distributor*
AMG Distributors, Inc.
800 Connecticut Avenue
Norwalk, CT 06854
(800) 835-3879
Subadvisor
Friess Associates, LLC
P.O. Box 576
Jackson, Wyoming 83001
Friess Associates of Delaware, LLC
P.O. Box 4166
Greenville, DE 19807
Custodian
The Bank of New York Mellon
2 Hanson Place
Brooklyn, NY 11217
Legal Counsel
Ropes & Gray LLP
Prudential Tower, 800 Boylston Street
Boston, MA 02199-3600
Transfer Agent
BNY Mellon Investment Servicing (US) Inc.
Attn: AMG Funds
P.O. Box 9769
Providence, RI 02940
(800) 548-4539
This report is prepared for the Funds’ shareholders. It is authorized for distribution to prospective investors only when preceded or accompanied by an effective prospectus. To receive a free copy of the prospectus or Statement of Additional Information, which includes additional information about Fund Trustees, please contact us by calling 800.835.3879. Distributed by AMG Distributors, Inc., member FINRA/SIPC.
Current net asset values per share for each Fund are available on the Funds’ website at www.amgfunds.com.
A description of the policies and procedures each Fund uses to vote its proxies is available: (i) without charge, upon request, by calling 800.835.3879, or (ii) on the Securities and Exchange Commission’s (SEC) website at www.sec.gov For information regarding each Fund’s proxy voting record for the 12-month period ended June 30, call 800.835.3879 or visit the SEC website at www.sec.gov.
Each Fund files its complete schedule of portfolio holdings with the SEC for the first and third quarters of each fiscal year on Form N-Q. The Fund’s Form N-Q are available on the SEC’s website at www.sec.gov. A Fund’s Form N-Q may be reviewed and copied at the SEC’s Public Reference Room in Washington, DC. Information on the operation of the Public Reference Room may be obtained by calling 1-800-SEC-0330. To review a complete list of the Fund’s portfolio holdings, or to view the most recent quarterly holdings report, semiannual report, or annual report, please visit www.amgfunds.com.
| * | Effective October 19, 2015, the address will change to 600 Steamboat Road, Suite 300, Greenwich, CT 06830. |
AFFILIATE SUBADVISED FUNDS
BALANCED FUNDS
AMG Chicago Equity Partners Balanced
Chicago Equity Partners, LLC
AMG FQ Global Risk-Balanced
First Quadrant, L.P.
EQUITY FUNDS
AMG Chicago Equity Partners Small Cap Value
Chicago Equity Partners, LLC
AMG FQ Tax-Managed U.S. Equity
AMG FQ U.S. Equity
First Quadrant, L.P.
AMG Frontier Small Cap Growth
Frontier Capital Management Company, LLC
AMG GW&K Small Cap Core
AMG GW&K Small Cap Growth
GW&K Investment Management, LLC
AMG Renaissance International Equity
AMG Renaissance Large Cap Growth
The Renaissance Group LLC
AMG SouthernSun Small Cap
AMG SouthernSun U.S. Equity
SouthernSun Asset Management, LLC
AMG Systematic Large Cap Value
AMG Systematic Mid Cap Value
Systematic Financial Management, L.P.
AMG TimesSquare All Cap Growth
AMG TimesSquare International Small Cap
AMG TimesSquare Mid Cap Growth
AMG TimesSquare Small Cap Growth
TimesSquare Capital Management, LLC
AMG Trilogy Emerging Markets Equity
AMG Trilogy Emerging Wealth Equity
AMG Trilogy Global Equity
AMG Trilogy International Small Cap
Trilogy Global Advisors, L.P.
AMG Yacktman
AMG Yacktman Focused
AMG Yacktman Special Opportunities
Yacktman Asset Management LP
FIXED INCOME FUNDS
AMG GW&K Core Bond
(formerly AMG Managers Total Return Bond)
AMG GW&K Enhanced Core Bond
AMG GW&K Municipal Bond
AMG GW&K Municipal Enhanced Yield
GW&K Investment Management, LLC
OPEN-ARCHITECTURE FUNDS
EQUITY FUNDS
AMG Managers Brandywine
AMG Managers Brandywine Advisors Mid Cap Growth
AMG Managers Brandywine Blue
Friess Associates, LLC
AMG Managers Cadence Capital Appreciation
AMG Managers Cadence Emerging Companies
AMG Managers Cadence Mid Cap
Cadence Capital Management, LLC
AMG Managers Emerging Opportunities
Lord, Abbett & Co. LLC
WEDGE Capital Management L.L.P.
Next Century Growth Investors LLC
RBC Global Asset Management (U.S.) Inc.
AMG Managers Essex Small/Micro Cap Growth
Essex Investment Management Co., LLC
AMG Managers Real Estate Securities
CenterSquare Investment Management, Inc.
AMG Managers Skyline Special Equities
Skyline Asset Management, L.P.
AMG Managers Special Equity
Ranger Investment Management,L.P.
Lord,Abbett & Co.LLC
Smith Asset Management Group,L.P.
Federated MDTA LLC
FIXED INCOME FUNDS
AMG Managers Bond
AMG Managers Global Income Opportunity
Loomis,Sayles & Co., L.P.
AMG Managers High Yield
J.P.Morgan Investment Management Inc.
AMG Managers Intermediate Duration Government
AMG Managers Short Duration Government
Amundi Smith Breeden LLC
| | |
 | | | www.amgfunds.com |
| | |
| | ANNUAL REPORT |
AMG Funds
September 30, 2015
AMG Managers Brandywine Advisors Mid Cap Growth Fund: BWAFX
| | |
| www.amgfunds.com | | | AR077-0915 |
AMG Funds
Annual Report—September 30, 2015
| | | | |
TABLE OF CONTENTS | | PAGE | |
| |
LETTER TO SHAREHOLDERS | | | 2 | |
| |
ABOUT YOUR FUND’S EXPENSES | | | 3 | |
| |
PORTFOLIO MANAGER’S COMMENTS, PORTFOLIO STATISTICS, AND SCHEDULE OF PORTFOLIO INVESTMENTS | | | 4 | |
| |
NOTES TO SCHEDULE OF PORTFOLIO INVESTMENTS | | | 10 | |
| |
FINANCIAL STATEMENTS | | | | |
| |
Statement of Assets and Liabilities | | | 11 | |
Balance sheet, net asset value (NAV) per share computation and cumulative undistributed amounts | | | | |
| |
Statement of Operations | | | 12 | |
Detail of sources of income, expenses, and realized and unrealized gains (losses) during the fiscal year | | | | |
| |
Statements of Changes in Net Assets | | | 13 | |
Detail of changes in assets for the past two fiscal years | | | | |
| |
Financial Highlights | | | 14 | |
Historical net asset values per share, distributions, total returns, income and expense ratios, turnover ratios and net assets | | | | |
| |
Notes to Financial Statements | | | 15 | |
Accounting and distribution policies, details of agreements and transactions with Fund management and affiliates, and descriptions of certain investment risks | | | | |
| |
REPORT OF INDEPENDENT REGISTERED PUBLIC ACCOUNTING FIRM | | | 20 | |
| |
ANNUAL RENEWAL OF INVESTMENT MANAGEMENT AND SUBADVISORY AGREEMENTS | | | 21 | |
| |
TRUSTEES AND OFFICERS | | | 24 | |
Nothing contained herein is to be considered an offer, sale or solicitation of an offer to buy shares of any series of the AMG Funds family of mutual funds. Such offering is made only by prospectus, which includes details as to offering price and other material information.
| | |
| | AMG Managers Brandywine Advisors Mid Cap Growth Fund |
DEAR FELLOW SHAREHOLDER:
Volatility marked the September quarter as China raised concerns about global economic conditions and uncertainty emerged regarding the U.S. Federal Reserve’s (the Fed) plan to hike interest rates. Sentiment took a clear turn for the worse in August, sending stocks into correction territory for the first time since 2011.
China spooked global markets in August by devaluing the yuan. With China’s growth rate already a key area of market interest, investors interpreted the move as an attempt to boost the nation’s slowing industrial sector by encouraging exports. The fallout was especially pronounced among Chinese stocks, with the Shanghai Composite losing more than one-fourth of its value in the September quarter.
Once considered a potential starting point for the Fed to raise interest rates, the central bank’s September meeting ended without action. At a subsequent press conference, Fed Chairwoman Janet Yellen noted,” The situation abroad bears close watching.” While most Fed officials believe a rate hike is still in the cards before the end of the year, investors worried that the global economy might be too fragile for tighter monetary policy anytime soon.
Market volatility spiked soon after China’s currency devaluation. The market was in full-fledged correction mode by August 24, with the S&P 500 Index more than 10 percent below its previous high (May 21). One of the most tranquil periods for stocks on record – the third-longest streak without a correction –was over.
Given our earnings-driven investment strategy, the AMG Managers Brandywine Advisors Mid Cap Growth Fund holds companies on the economy’s leading edge. Companies that fall into that category took it on the chin in the September quarter as investors reassessed their economic expectations.
Brandywine Advisors declined 11.0 percent in the three months through September as the S&P 500, Russell Midcap® and Russell Midcap® Growth Indexes declined 6.4, 8.0 and 8.0 percent.
For the September quarter, consumer discretionary holdings, which comprised the largest portfolio position, weighed on performance as investors questioned the consumer’s staying power amid the increase in economic uncertainty. While the sector included notable positive exceptions, including D.R. Horton and Restoration Hardware, consumer discretionary holdings detracted the most from performance relative to the Russell Midcap® Growth Index.
Wearable camera maker GoPro beat estimates when it reported a fourfold increase in June-quarter earnings versus the same period a year ago. Still, slower-than-anticipated sales in its new Hero 4 product line and concerns about
the pace of new product development carried more weight with investors than the company’s near-term results. Likewise, Diamond Resorts International beat June-quarter estimates by earning $0.49 per share compared with a loss in the year-ago period. The company announced an acquisition during the height of the China-sparked volatility, and the deal was not well received.
Holdings from the industrial sector, which represented the portfolio’s third largest position, also detracted from results versus the benchmark. Quanta Services and Spirit AeroSystems Holdings were notable detractors.
XPO Logistics, a non- asset- based transportation service provider, was the top detractor. Although the company more than doubled June-quarter revenue, organic growth from existing business lines slowed from 18 percent to 10 percent. At the same time, XPO Logistics announced its intention to acquire the trucking company Con-way for $3 billion. Investors met the news with confusion because acquiring Con-way’s significant trucking-related assets seemed like a departure from the asset-light strategy that XPO Logistics followed in the past.
Holdings from the materials sector contributed the most to performance relative to the Russell Midcap® Growth Index. Vulcan Materials Co. and Headwaters were top performers from the sector.
Other bright spots included footwear maker Skechers USA and technology service provider Luxoft Holding, which exceeded expectations with 128 and 36 percent June-quarter earnings growth, respectively.
For more information on companies that influenced September-quarter performance, please see Roses &Thorns on page 7.
At the start of the December quarter, holdings from the consumer discretionary, technology and industrial sectors represent the portfolio’s largest positions. For more information on portfolio characteristics, please see page 6.
Thanks for your confidence in our research-driven strategy and the team that implements it on your behalf. All of us at Friess Associates appreciate the opportunity to serve you.
Scott Gates
Chief Investment Officer
Friess Associates, LLC
2
About Your Fund’s Expenses
As a shareholder of a Fund, you may incur two types of costs: (1) transaction costs, which may include sales charges (loads) on purchase payments; redemption fees; and exchange fees; and (2) ongoing costs, including management fees; distribution (12b-1) fees; and other Fund expenses. This example is intended to help you understand your ongoing costs (in dollars) of investing in the Fund and to compare these costs with the ongoing costs of investing in other mutual funds. The example is based on $1,000 invested at the beginning of the period and held for the entire period as indicated below.
ACTUAL EXPENSES
The first line of the following table provides information about the actual account values and actual expenses. You may use the information in this line, together with the amount you invested, to estimate the expenses that you paid over the period. Simply divide your account value by $1,000 (for example, an $8,600 account value divided by $1,000 = 8.6), then multiply the result by the number in the first line under the heading entitled “Expenses Paid During Period” to estimate the expenses you paid on your account during this period.
HYPOTHETICAL EXAMPLE FOR COMPARISON PURPOSES
The second line of the following table provides information about hypothetical account values and hypothetical expenses based on the Fund’s actual expense ratio and an assumed annual rate of return of 5% before expenses, which is not the Fund’s actual return. The hypothetical account values and expenses may not be used to estimate the actual ending account balance or expenses you paid for the period. You may use this information to compare the ongoing costs of investing in the Fund and other funds by comparing this 5% hypothetical example with the 5% hypothetical examples that appear in the shareholder reports of other funds.
Please note that the expenses shown in the table are meant to highlight your on going costs only and do not reflect any transactional costs, such as sales charges (loads), redemption fees, or exchange fees. Therefore, the second line of the table is useful in comparing ongoing costs only, and will not help you determine the relative total costs of owning different funds.
| | | | | | | | | | | | | | | | |
| Six Months Ended September 30, 2015 | | Expense
Ratio
for the
Period | | | Beginning
Account
Value
4/01/15 | | | Ending
Account
Value
9/30/15 | | | Expenses
Paid
During
the
Period* | |
AMG Managers Brandywine Advisors Mid Cap Growth Fund | | | | | | | | | |
Based on Actual Fund Return | | | 1.14 | % | | $ | 1,000 | | | $ | 888 | | | $ | 5.41 | |
Hypothetical (5% return before expenses) | | | 1.14 | % | | $ | 1,000 | | | $ | 1,019 | | | $ | 5.78 | |
| * | Expenses are equal to the Fund’s annualized expense ratio multiplied by the average account value over the period, multiplied by the number of days in the most recent fiscal half-year (183), then divided by 365. |
3
AMG Managers Brandywine Advisors Mid Cap Growth Fund
Portfolio Manager’s Comments
The beginning of the fiscal year was marked by optimism, with investors welcoming a precipitous drop in oil prices as a potential boon to the consumer. U.S. Federal Reserve (the Fed) watching and mixed economic signals occupied the market’s attention as the year wore on, resulting in a notably different environment by the end of the 12 months through September 30, 2015.
A barrel of oil traded at roughly $90 when the fiscal year began. Just three months later, amid conservative expectations for global growth and booming oil production in the U.S., the price was less than $54. From re-energized consumer spending to altered domestic drilling prospects, the potential implications of oil’s dramatic fall became a defining theme in the December quarter of 2014.
Thanks to muted individual-company earnings promise in the energy sector at the start of the quarter, AMG Managers Brandywine Advisors Mid Cap Growth Fund (“Brandywine Advisors”) benefited versus the Russell Midcap® Growth Index due to minimal exposure to companies with fortunes directly tied to energy prices.
Brandywine Advisors did hold companies that could be affected by changes in longer-term project planning in and around the energy sector. Although a step removed from immediate oil-related consequences, exposure to the industrial sector, the portfolio’s largest position, limited the Fund’s upside in a positive environment marked by high hopes for the consumer. Brandywine Advisors trailed the benchmark in the December quarter.
While January proved a tough month for stocks due to macroeconomic concerns, the market’s mood improved as the March quarter progressed and earnings season unfolded.
As pressure on oil prices persisted, investors celebrated brighter prospects for consumers. Holdings from the consumer discretionary sector, which represented the portfolio’s second largest position, contributed the most to performance versus the benchmark. Top contributors included makers of apparel, footwear or both that demonstrated earnings strength during the quarter.
Technology and industrial holdings also aided results. The health care sector detracted from relative performance due to limited exposure in a period when the sector posted strong returns for the benchmark. In the end, the three months through March turned out to be the strongest quarter of the fiscal year for Brandywine Advisors on a relative and an absolute basis.
In the June quarter, mixed economic data sparked debate as to when the Fed was most likely to begin acting on its telegraphed intention to raise interest rates in the not-too-distant future. Concerns grew about China, which reported its slowest pace of quarterly economic growth in six years during the period. Enthusiasm gave way to caution in the quarter, and gains became tougher to come by than they were in the preceding six months.
Brandywine Advisors navigated the June-quarter environment well relative to the Russell Midcap® Growth Index. The Fund outperformed the index in seven of the nine economic sectors represented in the portfolio during the quarter. Consumer discretionary holdings contributed to relative results while industrial holdings detracted. While Brandywine Advisors outperformed its benchmark for the second consecutive quarter, the end result was a small negative absolute return.
After peaking May 21 and retesting that 52-week high only two months later, stocks retreated into
correction territory during August (using the S&P 500 Index as a guide). The first correction (a decline of at least 10 percent from a previous high) since 2011 was marked by a return of volatility, with many familiar topics, including the Fed’s interest-rate intentions and slower growth in China, among other things, gaining renewed power to influence the market’s direction.
Brandywine Advisors and its benchmark declined in the negative and volatile environment of the September quarter. Holdings considered to be among the most economically sensitive, including companies from the consumer discretionary and industrial sectors, detracted the most from performance versus the benchmark.
Brandywine Advisors declined 3.4 percent for its fiscal year ended September 30, 2015. The Russell Midcap® Growth Index gained 1.5 percent during that time.
When assessing the fiscal year as a whole, holdings from the industrial sector weighed the most on relative results, followed by health care holdings. Brandywine Advisors’ limited exposure to the energy sector during the oil-price plunge was the most significant contributor to results versus the benchmark for the fiscal year. Brandywine Advisors also benefited from outperformance among its holdings from the consumer discretionary sector.
XPO Logistics, Qorvo, Tenet Healthcare Corp. and GoPro were top detractors. Skechers USA, Vulcan Materials Co., Waste Connections and D.R. Horton were top contributors to performance versus the benchmark for the fiscal year.
This commentary reflects the viewpoints of Friess Associates, LLC as of September 30, 2015 and is not intended as a forecast or guarantee of future results.
4
AMG Managers Brandywine Advisors Mid Cap Growth Fund
Portfolio Manager’s Comments (continued)
CUMULATIVE TOTAL RETURN PERFORMANCE
The Fund’s cumulative total return is based on the daily change in net asset value (NAV), and assumes that all dividends and distributions were reinvested. The chart compares a hypothetical $10,000 investment made in the Fund on September 30, 2005, to a $10,000 investment made in the Russell Midcap® Growth Index, Russell Midcap® Index and S&P 500 Index for the same time period. The graph and table do not reflect the deduction of taxes that a shareholder would pay on a Fund distribution or redemption of shares. The listed returns for the Fund are net of expenses and the returns for the index exclude expenses.
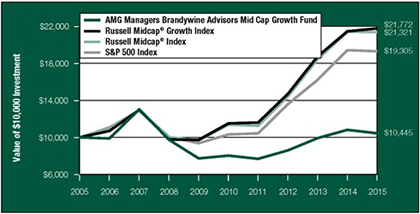
The table below shows the average annual total returns for the AMG Managers Brandywine Advisors Mid Cap Growth Fund and the Russell Midcap® Growth Index, Russell Midcap® Index and S&P 500 Index for the same time periods ended September 30, 2015.
| | | | | | | | | | | | |
| | | One | | | Five | | | Ten | |
| Average Annual Total Returns1 | | Year | | | Years | | | Years | |
AMG Managers Brandywine Advisors Mid Cap Growth Fund2,3,4 | | | (3.44 | )% | | | 5.39 | % | | | 0.44 | % |
Russell Midcap® Growth Index5 | | | 1.45 | % | | | 13.58 | % | | | 8.09 | % |
Russell Midcap® Index6 | | | (0.25 | )% | | | 13.40 | % | | | 7.87 | % |
S&P 500 Index7 | | | (0.61 | )% | | | 13.34 | % | | | 6.80 | % |
The performance data shown represents past performance.Past performance is not a guarantee of future results. Current performance may be lower or higher than the performance data quoted. The investment return and principal value of an investment in the Fund will fluctuate so that an investor’s shares, when redeemed, may be worth more or less than their original cost.
Investors should carefully consider the Fund’s investment objectives, risks, charges, and expenses before investing. For performance information through the most recent month end, current net asset values per share for the Fund and other information, please call (800) 835-3879 or visit our website at www.amgfunds.com for a free prospectus. Read it carefully before investing or sending money.
Distributed by AMG Distributors, Inc., member FINRA/SIPC.
| 1 | Total return equals income yield plus share price change and assumes reinvestment of all dividends and capital gain distributions. Returns are net of fees and may reflect offsets of Fund expenses as described in the Prospectus. No adjustment has been made for taxes payable by shareholders on their reinvested dividends and capital gain distributions. Returns for periods greater than one year are annualized. The listed returns on the Fund are net of expenses and based on the published NAV as of September 30, 2015. All returns are in U.S. dollars ($). |
| 2 | The Fund inception dates and returns for all periods beginning prior to October 1, 2013 reflect performance of the predecessor Fund, Brandywine Advisors Midcap Growth Fund, and was managed by Friess Associates, LLC with the same investment objectives and substantially similar investment policies. |
| 3 | The Fund is subject to risks associated with investments in mid-capitalization companies such as erratic earnings patterns, competitive conditions, limited earnings history, and a reliance on one or a limited number of products. |
| 4 | The Fund’s investment in foreign securities, even though publicly traded in the United States, may involve risks, which are in addition to those inherent in domestic investments. |
| 5 | The Russell Midcap® Growth Index measures the performance of the Russell Midcap companies with higher price-to-book ratios and higher forecasted growth values. The stocks are also members of the Russell 1000® Growth Index. Unlike the Fund, the Indices are unmanaged, are not available for investment, and do not incur expenses. |
| 6 | The Russell Midcap® Index measures the performance of the 800 smallest companies in the Russell 1000® Index, which represent approximately 25 percent of the total market capitalization of the Russell 1000® Index. Unlike the Fund, the Indices are unmanaged, are not available for investment, and do not incur expenses. |
| 7 | The S&P 500 Index is a capitalization-weighted index of 500 stocks. The S&P 500 Index is designed to measure performance of the broad domestic economy through changes in the aggregate market value of 500 stocks representing all major industries. Unlike the Fund, the S&P 500 Index is unmanaged, is not available for investment, and does not incur expenses. |
The Russell Midcap® Growth Index and Russell Midcap® Index are registered trademarks of Russell Investments. Russell® is a trademark of Russell Investments.
The S&P 500 Index is proprietary data of Standard & Poor’s, a division of McGraw-Hill Companies, Inc. All rights reserved.
Not FDIC insured, nor bank guaranteed. May lose value.
5
AMG Managers Brandywine Advisors Mid Cap Growth Fund
Fund Snapshots (unaudited)
September 30, 2015
PORTFOLIO BREAKDOWN
| | | | | | | | | | | | | | | | |
Industry (Top Ten) | | Brandywine
Advisors
Mid Cap
Growth
Fund* | | | Russell
Midcap®
Growth
Index | | | Russell
Midcap®
Index | | | S&P
500
Index | |
Semiconductors | | | 7.4 | % | | | 3.7 | % | | | 3.0 | % | | | 2.4 | % |
Health Care Facilities | | | 6.4 | % | | | 2.6 | % | | | 2.2 | % | | | 2.8 | % |
Application Software | | | 5.7 | % | | | 5.7 | % | | | 3.8 | % | | | 4.0 | % |
Construction Materials | | | 5.0 | % | | | 0.2 | % | | | 0.4 | % | | | 0.1 | % |
Footwear | | | 4.3 | % | | | 7.3 | % | | | 4.3 | % | | | 2.7 | % |
Aerospace & Defense | | | 2.8 | % | | | 1.6 | % | | | 1.2 | % | | | 2.7 | % |
Household Products | | | 2.7 | % | | | 0.9 | % | | | 0.5 | % | | | 1.8 | % |
Environmental & Facilities Services | | | 2.7 | % | | | 1.8 | % | | | 1.3 | % | | | 0.2 | % |
Construction Machinery & Heavy Trucks | | | 2.6 | % | | | 2.9 | % | | | 3.1 | % | | | 1.2 | % |
Household Appliances | | | 2.6 | % | | | 2.2 | % | | | 1.9 | % | | | 0.4 | % |
Other Common Stock | | | 53.4 | % | | | 71.1 | % | | | 78.3 | % | | | 81.7 | % |
Cash & Cash Equivalents† | | | 4.4 | % | | | 0.0 | % | | | 0.0 | % | | | 0.0 | % |
| * | As a percentage of net assets. |
| † | Includes Other Assets and Liabilities. |
PORTFOLIO MARKET CAPITALIZATION
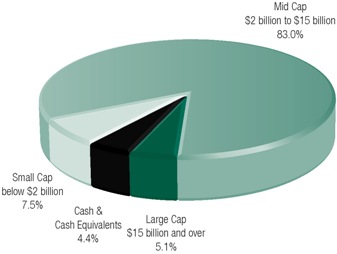
TOP TEN HOLDINGS
| | | | | | | | |
| | | | | | % Change | |
| | | % of | | | from | |
Security Name | | Net Assets | | | Book Cost | |
Avago Technologies, Ltd.* | | | 3.0 | % | | | 42.1 | % |
Spirit AeroSystems Holdings, Inc., Class A* | | | 2.8 | | | | 25.9 | |
Church & Dwight Co., Inc. | | | 2.7 | | | | 9.8 | |
Waste Connections, Inc. | | | 2.7 | | | | 1.1 | |
Guidewire Software, Inc. | | | 2.6 | | | | 0.8 | |
Wabtec Corp. | | | 2.6 | | | | 201.2 | |
Helen of Troy, Ltd.* | | | 2.6 | | | | 17.0 | |
Infinera Corp.* | | | 2.5 | | | | 4.1 | |
Vulcan Materials Co. | | | 2.5 | | | | 5.9 | |
Martin Marietta Materials, Inc. | | | 2.5 | | | | 0.0 | # |
| | | | | | | | |
Top Ten as a Group | | | 26.5 | % | | | | |
| | | | | | | | |
| * | Also Top Ten Holding as of June 30, 2015. |
| # | Rounds to less than 0.1%. |
ESTIMATED EARNINGS GROWTH RATE
OF THE FUND’S INVESTMENTS
Forecasted Increase in Earnings Per Share 2016 vs 2015
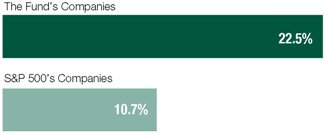
Source: Consensus estimates from FactSet Research Systems Inc.
This is not a forecast of the Fund’s future performance. Earnings growth for a Fund holding does not guarantee a corresponding increase in the market value of the holding or the Fund.
Because a fund’s strategy may result in multiple investments in particular sectors of the economy, its performance may depend on the performance of those sectors and may fluctuate more widely than investments diversified across more sectors. For additional information on these and other risk considerations, please see the Fund’s prospectus.
Any sectors, industries, or securities discussed should not be perceived as investment recommendations. Mention of a specific security should not be considered a recommendation to buy or solicitation to sell that security. Specific securities mentioned in this report may have been sold from the Fund’s portfolio of investments by the time you receive this report.
6
AMG Managers Brandywine Advisors Mid Cap Growth Fund
Roses and Thorns (unaudited)
Quarter Ending September 30, 2015
| | | | | | | | | | |
$ Gain (in millions) | | | % Gain | | | Biggest $ Winners Reason for Move |
| | | |
| | | | | | | | Skechers U.S.A. Inc. (SKX) | | |
| $ | 0.9 | | | | 24.5 | % | | The footwear company grew June-quarter earnings 128 percent. Sales gains across multiple product lines drove 36 percent revenue growth on strong same-store sales. Skechers global backlog increased 40 percent, showing strength in domestic and international markets. The company announced a three-for-one stock split in August. |
| | | |
| | | | | | | | Restoration Hardware Holdings Inc. (RH) | | |
| $ | 0.2 | | | | 3.1 | % | | The multi-channel retailer of upscale home furnishings, hardware and decorative items grew June-quarter earnings 27 percent. Sales increased 17 percent, topping the consensus estimate. The transition to the larger format Full Line Design Galleries supported on-line sales. |
| | | |
| | | | | | | | Vulcan Materials Co. (VMC) | | |
| $ | 0.2 | | | | 6.3 | % | | The manufacturer of concrete aggregate to highway, road and commercial markets reported 78 percent June-quarter earnings growth, topping the consensus estimate. Concrete aggregate revenue increased 15 percent due to strong pricing trends. Aggregate volumes were 8 percent above prior-year levels despite heavy rains in several key states. |
| | | |
| | | | | | | | D.R. Horton Inc. (DHI) | | |
| $ | 0.2 | | | | 7.3 | % | | The builder of single family homes reported June-quarter earnings of $0.60 per share, topping the consensus estimate by 20 percent. Sales increased 37 percent due to better-than-expected backlog conversion. D.R. Horton’s financial service division also contributed to the earnings upside. |
| | | |
| | | | | | | | Luxoft Holding Inc. (LXFT) | | |
| $ | 0.2 | | | | 11.9 | % | | The software developer grew June-quarter earnings 36 percent, driven by 32 percent revenue growth. Shares gained during the quarter as the company raised revenue and earnings guidance for the remainder of the year. New deals in the financial service and automotive industries helped improve earnings visibility. |
| | |
$ Loss
(in millions) | | | % Loss | | | Biggest $ Losers Reason for Move |
| | | | | | | | Qorvo Inc. (QRVO) | | |
| $ | 1.5 | | | | 33.2 | % | | The provider of core technologies and radio frequency solutions for mobile communications reported June-quarter earnings of $1.09 per share, topping the consensus estimate. Shares declined in reaction to a delay of LTE base station build outs in China and slower hand set component sales to Chinese manufacturers. We sold Qorvo to fund a new holding with better visibility. |
| | | |
| | | | | | | | Tenet Healthcare Corp. (THC) | | |
| $ | 1.4 | | | | 34.8 | % | | The operator of hospitals and related health care facilities reported June-quarter earnings of $0.74 per share, beating the consensus estimate by 66 percent. Solid admissions growth and price increases drove results. A flurry of deal announcements put pressure on the stock during the quarter as investors digested the news. |
| | | |
| | | | | | | | XPO Logistics Inc. (XPO) | | |
| $ | 1.3 | | | | 30.5 | % | | The provider of transportation and logistics management services reported 109 percent June-quarter revenue growth. Shares came under pressure as XPO’s organic revenue growth slowed from 18 percent to 10 percent (according to Morgan Stanley) and the announced acquisition of the trucking company Con-way Inc. We sold XPO Logistics to fund another stock with greater near-term visibility. |
| | | |
| | | | | | | | Diamond Resorts International Inc. (DRII) | | |
| $ | 1.0 | | | | 25.9 | % | | The provider of resort property sales and management services reported June-quarter earnings of $0.49 per share. Sales grew 11 percent due to increased closing efficiencies and new merchandising programs. Shares traded lower in the quarter after the announced acquisition of Gold Key Resorts. |
| | | |
| | | | | | | | GoPro Inc. (GPRO) | | |
| $ | 1.0 | | | | 33.7 | % | | The manufacturer of mountable and wearable cameras and accessories reported 337 percent June-quarter earnings growth, topping the consensus estimate by $0.09. Shares traded lower in the quarter due to slower-than-expected sales of the new Hero 4 Session camera and concerns about the pace of new product development. We sold GoPro to fund a new holding with greater near-term visibility. |
All gains/losses are calculated on an average cost basis from June 30, 2015 through September 30, 2015.
This commentary reflects the viewpoints of Friess Associates, LLC as of September 30, 2015 and is not intended as a forecast or guarantee of future results.
7
AMG Managers Brandywine Advisors Mid Cap Growth Fund
Schedule of Portfolio Investments
September 30, 2015
| | | | | | | | | | |
Shares | | | | Cost | | | Value | |
Common Stocks - 95.6% | | | | | |
Consumer Discretionary | | | | | |
| | Apparel Retail - 2.3% | | | | | | | | |
| 215,200 | | American Eagle Outfitters, Inc.1 | | $ | 2,979,043 | | | $ | 3,363,576 | |
| | Apparel, Accessories & Luxury Goods - 2.0% | |
| 47,000 | | G-III Apparel Group, Ltd.* | | | 3,357,113 | | | | 2,898,020 | |
| | Automotive Retail - 2.2% | | | | | | | | |
| 57,400 | | Murphy USA, Inc. | | | 3,127,217 | | | | 3,154,130 | |
| | Cable & Satellite - 2.2% | | | | | | | | |
| 43,600 | | AMC Networks, Inc., Class A* | | | 3,689,476 | | | | 3,190,212 | |
| | Consumer Electronics - 2.0% | | | | | |
| 29,845 | | Harman International Industries, Inc. | | | 3,766,301 | | | | 2,864,822 | |
| | Footwear - 4.3% | | | | | | | | |
| 21,600 | | Skechers U.S.A., Inc., Class A* | | | 1,108,985 | | | | 2,896,128 | |
| 87,500 | | Steven Madden, Ltd.* | | | 3,549,160 | | | | 3,204,250 | |
| | Home Furnishing Retail - 2.4% | | | | | |
| 37,000 | | Restoration Hardware Holdings, Inc.* | | | 3,377,808 | | | | 3,452,470 | |
| | Home Furnishings - 1.9% | | | | | |
| 38,070 | | Tempur Sealy International, Inc.* | | | 2,858,139 | | | | 2,719,340 | |
| | Homebuilding - 2.1% | | | | | | | | |
| 102,125 | | D.R. Horton, Inc. | | | 2,813,748 | | | | 2,998,390 | |
| | Hotels, Resorts & Cruise Lines - 2.1% | |
| 128,500 | | Diamond Resorts International, Inc.* | | | 4,245,179 | | | | 3,005,615 | |
| | Household Appliances - 2.6% | | | | | |
| 41,600 | | Helen of Troy, Ltd.* | | | 3,174,343 | | | | 3,714,880 | |
| | Restaurants - 1.1% | | | | | | | | |
| 23,132 | | Papa John’s International, Inc. | | | 1,568,477 | | | | 1,584,079 | |
| | Specialty Stores - 2.3% | | | | | | | | |
| 65,325 | | Dick’s Sporting Goods, Inc. | | | 3,369,760 | | | | 3,240,773 | |
| | | | | | | | | | |
Total Consumer Discretionary | | | 42,984,749 | | | | 42,286,685 | |
| | This sector is 1.6% below your Fund’s cost. | |
Consumer Staples | | | | | | | | |
| | Household Products - 2.7% | | | | | |
| 45,810 | | Church & Dwight Co., Inc. | | | 3,499,882 | | | | 3,843,459 | |
| | Packaged Foods & Meats - 1.7% | | | | | |
| 47,900 | | The Hain Celestial Group, Inc.* | | | 3,060,813 | | | | 2,471,640 | |
| | | | | | | | | | |
Total Consumer Staples | | | 6,560,695 | | | | 6,315,099 | |
| | This sector is 3.7% below your Fund’s cost. | |
Energy | | | | | | | | |
| | Oil & Gas Exploration & Production - 2.1% | |
| 169,900 | | Memorial Resource Development Corp.* | | | 2,934,972 | | | | 2,986,842 | |
| | This sector is 1.8% above your Fund’s cost. | |
| | | | | | | | | | |
Shares | | | | Cost | | | Value | |
Financials | | | | | | | | |
| | Hotel & Resort REITs - 2.1% | | | | | |
| 85,700 | | Pebblebrook Hotel Trust | | $ | 3,237,473 | | | $ | 3,038,065 | |
| | Property & Casualty Insurance - 2.2% | |
| 88,710 | | FNF Group | | | 3,225,076 | | | | 3,146,544 | |
| | | | | | | | | | |
Total Financials | | | 6,462,549 | | | | 6,184,609 | |
| | This sector is 4.3% below your Fund’s cost. | |
Health Care | | | | | | | | |
| | Health Care Equipment - 2.4% | | | | | |
| 58,000 | | Integra LifeSciences Holdings Corp.* | | | 3,562,350 | | | | 3,453,900 | |
| | Health Care Facilities - 6.4% | | | | | |
| 46,875 | | Acadia Healthcare Co., Inc.* | | | 3,395,414 | | | | 3,106,406 | |
| 70,000 | | Tenet Healthcare Corp.* | | | 3,961,145 | | | | 2,584,400 | |
| 65,500 | | VCA, Inc.* | | | 3,307,930 | | | | 3,448,575 | |
| | Health Care Services - 0.9% | | | | | |
| 42,700 | | Diplomat Pharmacy, Inc.* | | | 1,655,990 | | | | 1,226,771 | |
| | Life Sciences Tools & Services - 2.1% | |
| 25,000 | | Thermo Fisher Scientific, Inc. | | | 3,323,813 | | | | 3,057,000 | |
| | | | | | | | | | |
Total Health Care | | | 19,206,642 | | | | 16,877,052 | |
| | This sector is 12.1% below your Fund’s cost. | |
Industrials | | | | | | | | |
| | Aerospace & Defense - 2.8% | |
| 82,740 | | Spirit AeroSystems Holdings, Inc., Class A* | | | 3,175,590 | | | | 3,999,652 | |
| | Construction Machinery & Heavy Trucks - 2.6% | |
| 42,230 | | Wabtec Corp. | | | 1,234,559 | | | | 3,718,352 | |
| | Diversified Support Services - 2.1% | | | | | |
| 85,700 | | KAR Auction Services, Inc. | | | 2,621,421 | | | | 3,042,350 | |
| | Environmental & Facilities Services - 2.7% | |
| 79,000 | | Waste Connections, Inc. | | | 3,796,835 | | | | 3,837,820 | |
| | Human Resources & Employment Services - 2.2% | |
| 39,000 | | ManpowerGroup, Inc. | | | 3,384,476 | | | | 3,193,710 | |
| | Research & Consulting Services - 2.4% | | | | | |
| 74,200 | | The Advisory Board Co.* | | | 3,687,025 | | | | 3,379,068 | |
| | | | | | | | | | |
Total Industrials | | | 17,899,906 | | | | 21,170,952 | |
| | This sector is 18.3% above your Fund’s cost. | |
Information Technology | | | | | | | | |
| | Application Software - 5.7% | | | | | |
| 71,000 | | Guidewire Software, Inc.* | | | 3,703,959 | | | | 3,733,180 | |
| 87,500 | | Qlik Technologies, Inc.* | | | 3,620,607 | | | | 3,189,375 | |
| 36,000 | | Synchronoss Technologies, Inc.* | | | 1,595,365 | | | | 1,180,800 | |
| | Communications Equipment - 2.6% | | | | | |
| 185,540 | | Infinera Corp.* | | | 3,486,974 | | | | 3,629,163 | |
The accompanying notes are an integral part of these financial statements.
8
AMG Managers Brandywine Advisors Mid Cap Growth Fund
Schedule of Portfolio Investments (continued)
| | | | | | | | | | |
Shares | | | | Cost | | | Value | |
Information Technology (continued) | | | | | |
| | Data Processing & Outsourced Services - 2.3% | |
| 99,895 | | Black Knight Financial Services, Inc., Class A* | | $ | 2,631,732 | | | $ | 3,251,582 | |
| | Internet Software & Services - 2.4% | |
| 50,000 | | Akamai Technologies, Inc.* | | | 3,783,320 | | | | 3,453,000 | |
| | IT Consulting & Other Services - 1.3% | |
| 30,000 | | Luxoft Holding, Inc.* | | | 1,609,323 | | | | 1,898,700 | |
| | Semiconductors - 7.4% | |
| 436,000 | | Atmel Corp. | | | 4,150,737 | | | | 3,518,520 | |
| 33,815 | | Avago Technologies, Ltd. | | | 2,973,996 | | | | 4,227,213 | |
| 87,800 | | Microsemi Corp.* | | | 2,457,650 | | | | 2,881,596 | |
| | Systems Software - 2.0% | |
| 67,905 | | Fortinet, Inc.* | | | 3,239,395 | | | | 2,884,604 | |
| | | | | | | | | | |
Total Information Technology | | | 33,253,058 | | | | 33,847,733 | |
| | This sector is 1.8% above your Fund’s cost. | |
Materials | | | | | | | | |
| | Construction Materials - 5.0% | |
| 23,480 | | Martin Marietta Materials, Inc. | | | 3,568,445 | | | | 3,567,786 | |
| 40,000 | | Vulcan Materials Co. | | | 3,368,319 | | | | 3,568,000 | |
| | | | | | | | | | |
Total Materials | | | 6,936,764 | | | | 7,135,786 | |
| | This sector is 2.9% above your Fund’s cost. | |
Total Common Stocks | | | 136,239,335 | | | | 136,804,758 | |
| | | | | | | | | | |
Shares | | | | Principal
Amount | | | Value | |
Short-Term Investments - 6.6% | | | | | | | | |
Commercial Paper - 6.6% | | | | | |
| | Weatherford International, 0.95%, 10/01/15 | | $ | 9,420,000 | | | $ | 9,420,000 | |
Repurchase Agreements - 0.0%2,# | | | | | |
| | Royal Bank of Scotland PLC, dated 09/30/15, due 10/01/15, 0.090%, total to be received $28,989 (collateralized by various U.S. Government Agency Obligations, 0.094% - 3.625%, 01/31/16 - 02/15/44, totaling $29,569) | | | 28,989 | | | | 28,989 | |
| | | |
| | | | | Cost | | | | |
Other Investment Companies - 0.0%3,# | |
| 31,370 | | Dreyfus Institutional Cash Advantage Fund, Institutional Class Shares, 0.11% | | | 31,370 | | | | 31,370 | |
| | | | | | | | | | |
Total Short-Term Investments | | | 9,480,359 | | | | 9,480,359 | |
Total Investments - 102.2% | | $ | 145,719,694 | | | | 146,285,117 | |
| | | | | | | | | | |
Other Assets, less Liabilities - (2.2)% | | | | | | | (3,080,187 | ) |
Total Net Assets - 100.0% | | | | | | $ | 143,204,930 | |
| | | | | | | | | | |
The accompanying notes are an integral part of these financial statements.
9
Notes to Schedule of Portfolio Investments
The following footnotes should be read in conjunction with the Schedule of Portfolio Investments previously presented in this report.
Based on the approximate cost of investments of $145,758,826 for federal income tax purposes at September 30, 2015, the aggregate gross unrealized appreciation and depreciation were $10,277,373 and $9,751,082, respectively, resulting in net unrealized appreciation of investments of $526,291.
| * | Non-income producing security. |
| # | Rounds to less than 0.1%. |
| 1 | Some or all of these securities, amounting to a market value of $28,134, or 0.0% of net assets, were out on loan to various brokers. |
| 2 | Collateral received from brokers for securities lending was invested in these short-term investments. |
| 3 | Yield shown represents the September 30, 2015, seven-day average yield, which refers to the sum of the previous seven days’ dividends paid, expressed as an annual percentage. |
The following table summarizes the inputs used to value the Fund’s net assets by the fair value hierarchy levels as of September 30, 2015. (See Note 1(a) in the Notes to the Financial Statements.)
| | | | | | | | | | | | | | | | |
| | | Quoted Prices in Active
Markets for Identical
Investments Level 1 | | | Significant Other
Observable Inputs
Level 2 | | | Significant
Unobservable Inputs
Level 3 | | | Total | |
AMG Managers Brandywine Advisors Mid Cap Growth Fund | | | | | | | | | | | | | |
Investments in Securities | | | | | | | | | | | | | | | | |
Common Stocks† | | $ | 136,804,758 | | | | — | | | | — | | | $ | 136,804,758 | |
Short-Term Investments | | | | | | | | | | | | | | | | |
Commercial Paper | | | — | | | $ | 9,420,000 | | | | — | | | | 9,420,000 | |
Repurchase Agreements | | | — | | | | 28,989 | | | | — | | | | 28,989 | |
Other Investment Companies | | | 31,370 | | | | — | | | | — | | | | 31,370 | |
| | | | | | | | | | | | | | | | |
Total Investments in Securities | | $ | 136,836,128 | | | $ | 9,448,989 | | | | — | | | $ | 146,285,117 | |
| | | | | | | | | | | | | | | | |
| † | All common stocks held in the Fund are Level 1 securities. For a detailed breakout of the common stocks by major industry classification, please refer to the Schedule of Portfolio Investments. |
As of September 30, 2015, the Fund had no transfers between levels from the beginning of the reporting period.
The accompanying notes are an integral part of these financial statements.
10
Statement of Assets and Liabilities
September 30, 2015
| | | | |
Assets: | | | | |
Investments at value* (including securities on loan valued at $28,134) | | $ | 146,285,117 | |
Receivable for investments sold | | | 2,135,570 | |
Dividends, interest and other receivables | | | 54,421 | |
Receivable for Fund shares sold | | | 21 | |
Prepaid expenses | | | 2,072 | |
Total assets | | | 148,477,201 | |
Liabilities: | | | | |
Payable upon return of securities loaned | | | 28,989 | |
Payable for investments purchased | | | 5,057,156 | |
Payable for Fund shares repurchased | | | 212 | |
Accrued expenses: | | | | |
Investment advisory and management fees | | | 123,137 | |
Administrative fees | | | 3,694 | |
Shareholder servicing fees | | | 2,455 | |
Distribution fees | | | 485 | |
Trustees fees and expenses | | | 1,934 | |
Other | | | 54,209 | |
Total liabilities | | | 5,272,271 | |
Net Assets | | $ | 143,204,930 | |
Net Assets Represent: | | | | |
Paid-in capital | | $ | 158,989,127 | |
Accumulated net realized loss from investments | | | (16,349,620 | ) |
Net unrealized appreciation of investments | | | 565,423 | |
Net Assets | | $ | 143,204,930 | |
Shares outstanding | | | 15,465,049 | |
Net asset value, offering and redemption price per share | | $ | 9.26 | |
* Investments at cost | | $ | 145,719,694 | |
The accompanying notes are an integral part of these financial statements.
11
Statement of Operations
For the fiscal year ended September 30, 2015
| | | | |
Investment Income: | | | | |
Dividend income | | $ | 1,979,094 | 1 |
Securities lending income | | | 154,880 | |
Interest income | | | 56,947 | |
Total investment income | | | 2,190,921 | |
Expenses: | | | | |
Investment advisory and management fees | | | 1,550,059 | |
Administrative fees | | | 46,502 | |
Shareholder servicing fees | | | 16,352 | |
Distribution fees | | | 7,815 | |
Professional fees | | | 56,388 | |
Reports to shareholders | | | 26,466 | |
Registration fees | | | 22,610 | |
Custodian | | | 17,243 | |
Trustees fees and expenses | | | 8,063 | |
Transfer agent | | | 5,426 | |
Miscellaneous | | | 3,598 | |
Total expenses | | | 1,760,522 | |
Net investment income | | | 430,399 | |
Net Realized and Unrealized Gain (Loss): | | | | |
Net realized gain on investments | | | 9,561,931 | |
Net change in unrealized appreciation (depreciation) of investments | | | (15,157,148 | ) |
Net realized and unrealized loss | | | (5,595,217 | ) |
Net decrease in net assets resulting from operations | | $ | (5,164,818 | ) |
| 1 | Includes non-recurring dividends of $889,236. |
The accompanying notes are an integral part of these financial statements.
12
Statements of Changes in Net Assets
For the fiscal years ended September 30,
| | | | | | | | |
| | | 2015 | | | 2014 | |
Increase (Decrease) in Net Assets Resulting From Operations: | | | | | | | | |
Net investment income (loss) | | $ | 430,399 | | | $ | (808,269 | ) |
Net realized gain on investments | | | 9,561,931 | | | | 15,378,496 | |
Net change in unrealized appreciation (depreciation) of investments | | | (15,157,148 | ) | | | (2,276,747 | ) |
Net increase (decrease) in net assets resulting from operations | | | (5,164,818 | ) | | | 12,293,480 | |
Capital Share Transactions: | | | | | | | | |
Proceeds from sale of shares | | | 364,434 | | | | 562,812 | |
Cost of shares repurchased | | | (841,589 | ) | | | (1,255,676 | ) |
Net decrease from capital share transactions | | | (477,155 | ) | | | (692,864 | ) |
Total increase (decrease) in net assets | | | (5,641,973 | ) | | | 11,600,616 | |
Net Assets: | | | | | | | | |
Beginning of year | | | 148,846,903 | | | | 137,246,287 | |
End of year | | $ | 143,204,930 | | | $ | 148,846,903 | |
End of year accumulated net investment loss | | | — | | | $ | (599,248 | ) |
| | | | | | | | |
Share Transactions: | | | | | | | | |
Sale of shares | | | 36,485 | | | | 58,832 | |
Shares repurchased | | | (86,420 | ) | | | (131,593 | ) |
Net decrease in shares | | | (49,935 | ) | | | (72,761 | ) |
The accompanying notes are an integral part of these financial statements.
13
AMG Managers Brandywine Advisors Mid Cap Growth Fund
Financial Highlights
For a share outstanding throughout each fiscal year
| | | | | | | | | | | | | | | | | | | | |
| | | For the fiscal years ended September 30, | |
| | | 2015 | | | 20143 | | | 2013 | | | 2012 | | | 2011 | |
Net Asset Value, Beginning of Year | | $ | 9.59 | | | $ | 8.80 | | | $ | 7.63 | | | $ | 6.82 | | | $ | 7.13 | |
Income (loss) from Investment Operations: | | | | | | | | | | | | | | | | | | | | |
Net investment income (loss)1 | | | 0.03 | 4 | | | (0.05 | ) | | | (0.02 | ) | | | (0.03 | ) | | | (0.05 | ) |
Net realized and unrealized gain (loss) on investments | | | (0.36 | ) | | | 0.84 | | | | 1.20 | | | | 0.84 | | | | (0.26 | ) |
Total income (loss) from investment operations | | | (0.33 | ) | | | 0.79 | | | | 1.18 | | | | 0.81 | | | | (0.31 | ) |
Distributions to Shareholders from: | | | | | | | | | | | | | | | | | | | | |
Net investment income | | | — | | | | — | | | | (0.01 | ) | | | — | | | | — | |
Net Asset Value, End of Year | | $ | 9.26 | | | $ | 9.59 | | | $ | 8.80 | | | $ | 7.63 | | | $ | 6.82 | |
Total Return | | | (3.44 | )% | | | 8.98 | % | | | 15.43 | % | | | 11.88 | % | | | (4.35 | )% |
Ratio of total expenses to average net assets | | | 1.14 | % | | | 1.12 | % | | | 1.22 | % | | | 1.22 | %2 | | | 1.25 | %2 |
Ratio of net investment income (loss) to average net assets | | | 0.28 | % | | | (0.54 | )% | | | (0.20 | )% | | | (0.37 | )% | | | (0.63 | )% |
Portfolio turnover | | | 204 | % | | | 249 | % | | | 235 | % | | | 266 | % | | | 241 | % |
Net assets at end of year (000’s omitted) | | $ | 143,205 | | | $ | 148,847 | | | $ | 137,246 | | | $ | 119,769 | | | $ | 122,926 | |
| | | | | | | | | | | | | | | | | | | | |
Notes to Financial Highlights
| 1 | Per share numbers have been calculated using average shares. |
| 2 | Interest expense is less than 0.005% of average net assets. |
| 3 | At the start of business October 1, 2013, AMG Managers Brandywine Advisors Midcap Growth Fund was re-organized into a fund of AMG Funds I. |
| 4 | Includes non-recurring dividends. Without these dividends, net investment loss per share would have been $(0.03). |
14
Notes to Financial Statements
September 30, 2015
1. SUMMARY OF SIGNIFICANT ACCOUNTING POLICIES
AMG Funds I (the “Trust”) is an open-end management investment company, organized as a Massachusetts business trust and registered under the Investment Company Act of 1940, as amended (the “1940 Act”). Currently, the Trust consists of a number of different funds, each having distinct investment management objectives, strategies, risks, and policies. Included in this report is the AMG Managers Brandywine Advisors Mid Cap Growth Fund (the “Fund”).
At the start of business on October 1, 2013, Brandywine Advisors Midcap Growth Fund, a series of Brandywine Blue Fund, Inc. (the “Predecessor Fund”), was reorganized into a fund of the Trust. As a result of the reorganization, the Fund is the successor to the accounting and performance information of the Predecessor Fund.
The Fund’s financial statements are prepared in accordance with accounting principles generally accepted in the United States of America (“U.S. GAAP”), which require management to make estimates and assumptions that affect the reported amount of assets and liabilities and disclosure of contingent assets and liabilities at the date of the financial statements and the reported amounts of income and expenses during the reporting periods. Actual results could differ from those estimates and such differences may be material. The following is a summary of significant accounting policies followed by the Fund in the preparation of its financial statements:
a. VALUATION OF INVESTMENTS
Equity securities traded on a national securities exchange or reported on the NASDAQ national market system (“NMS”) are valued at the last quoted sales price on the primary exchange or, if applicable, the NASDAQ official closing price or the official closing price of the relevant exchange or, lacking any sales, at the last quoted bid price or the mean between the last quoted bid and ask prices (the “exchange mean price”). Equity securities traded in the over-the-counter market (other than NMS securities) are valued at the exchange mean price. Foreign equity securities (securities principally traded in markets other than U.S. markets) are valued at the official closing price on the primary exchange or, for markets that either do not offer an official closing price or where the official closing price may not be representative of the overall market, the last quoted sale price.
Fixed income securities purchased with a remaining maturity of 60 days or less are valued at amortized cost, provided that the amortized cost value is approximately the same as the fair value of the security valued without the use of amortized cost. Investments in other open-end regulated investment companies are valued at their end of day net asset value per share.
The Funds’ investments are generally valued based on independent market quotations or prices or, if none, “evaluative” or other market based valuations provided by third-party pricing services approved by the Board of Trustees of the Trust (the “Board”). Under certain circumstances, the value of certain Fund investments (including derivatives) may be based on an evaluation of fair value, pursuant to procedures established by and under the general supervision of the Board. The Valuation Committee, which is comprised of the Independent Trustees of the Board, and the Pricing Committee, which is comprised of representatives from AMG Fund, LLC (the “Investment Manager”) are the committees appointed by the Board to make fair value determinations. Each
Fund may use the fair value of a portfolio instrument to calculate its net asset value (“NAV”) in the event that the market quotation, price or market based valuation for the portfolio instrument is not readily available or otherwise not determinable pursuant to the Board’s valuation procedures, if the Investment Manager for the Pricing Committee believes the quotation, price or market based valuation to be unreliable, or in certain other circumstances. When determining the fair value of an investment, the Pricing Committee and, if required under the Trust’s securities valuation procedures, the Valuation Committee, seeks to determine the price that the Fund might reasonably expect to receive from current sale of that investment in an arms-length transaction. Fair value determinations shall be based upon consideration of all available facts and information, including, but not limited to (i) attributes specific to the investment; (ii) fundamental and analytical data relating to the investment; and (iii) the value of other comparable securities or relevant financial instruments, including derivative securities, traded on other markets or among dealers.
The values assigned to fair value investments are based on available information and do not necessarily represent amounts that might ultimately be realized in the future, since such amounts depend on future developments inherent in long-term investments. Because of the inherent uncertainty of valuation, those estimated values may differ significantly from the values that would have been used had a ready market for the investments existed, and the differences could be material. The Board will be presented with a quarterly report showing as of the most recent quarter end, all outstanding securities fair valued by the Fund, including a comparison with the prior quarter end and the percentage of the Fund that the security represents at each quarter end.
With respect to foreign equity securities and certain foreign fixed income securities, the Board has adopted a policy that securities held in a Fund that can be fair valued by the applicable fair value pricing service are fair valued on each business day provided that each individual price exceeds a pre-established confidence level.
U.S. GAAP defines fair value as the price that a fund would receive to sell an asset or pay to transfer a liability in an orderly transaction between market participants at the measurement date. U.S. GAAP also establishes a framework for measuring fair value, and a three-level hierarchy for fair value measurements based upon the transparency of inputs to the valuation of an asset or liability. Inputs may be observable or unobservable and refer broadly to the assumptions that market participants would use in pricing the asset or liability. Observable inputs reflect the assumptions market participants would use in pricing the asset or liability based on market data obtained from sources independent of the Fund. Unobservable inputs reflect the Fund’s own assumptions about the assumptions that market participants would use in pricing the asset or liability developed based on the best information available in the circumstances. Each investment is assigned a level based upon the observability of the inputs which are significant to the overall valuation.
The three-tier hierarchy of inputs is summarized below:
Level 1 – inputs are quoted prices in active markets for identical investments (e.g., equity securities, open- end investment companies)
Notes to Financial Statements (continued)
Level 2 – other observable inputs (including, but not limited to: quoted prices for similar assets or liabilities in markets that are active, quoted prices for identical or similar assets or liabilities in markets that are not active, inputs other than quoted prices that are observable for the assets or liabilities (such as interest rates, yield curves, volatilities, prepayment speeds, loss severities, credit risks and default rates) or other market corroborated inputs) (e.g., debt securities, government securities, foreign currency exchange contracts, foreign securities utilizing international fair value pricing, broker- quoted securities, fair valued securities with observable inputs)
Level 3 – inputs are significant unobservable inputs (including the Fund’s own assumptions used to determine the fair value of investments) (e.g., fair valued securities with unobservable inputs)
Changes in inputs or methodologies used for valuing investments may result in a transfer in or out of levels within the fair value hierarchy. The inputs or methodologies used for valuing investments may not necessarily be an indication of the risk associated with investing in those investments. Transfers between different levels of the fair value disclosure hierarchy are deemed to have occurred as of the beginning of the reporting period.
b. SECURITY TRANSACTIONS
Security transactions are accounted for as of trade date. Realized gains and losses on securities sold are determined on the basis of identified cost.
c. INVESTMENT INCOME AND EXPENSES
Dividend income is recorded on the ex-dividend date. Dividend and interest income on foreign securities is recorded gross of any withholding tax. Interest income, which includes amortization of premium and accretion of discount on debt securities, is accrued as earned. Non- cash dividends included in dividend income, if any, are reported at the fair market value of the securities received. Distributions received in excess of income from return of capital including real estate investment trusts (REITs) are recorded as a reduction of the cost of the related investment and/or as a realized gain. If the Fund no longer owns the applicable securities, any distributions received in excess of income are recorded as an adjustment to realized gain. Other income and expenses are recorded on an accrual basis. Expenses that cannot be directly attributed to a Fund are apportioned among the Funds in the Trust and in some cases other affiliated funds based upon their relative average net assets or number of shareholders.
The Fund has a “balance credit” arrangement with The Bank of New York Mellon (“BNYM”), the Fund’s custodian, whereby the Fund is credited with an interest factor equal to 0.75% below the effective 90-day T-Bill rate for account balances left uninvested overnight. If the T-Bill rate falls below 0.75%, no credits will be earned. These credits serve to reduce custodian expenses that would otherwise be charged to the Fund. For the fiscal year ended September 30, 2015, the Fund’s custodian expense was not reduced.
Overdraft fees are computed at 1% above the Federal Funds rate on the day of the overdraft. For the fiscal year ended September 30, 2015, overdraft fees for the Fund equaled $49.
d. DIVIDENDS AND DISTRIBUTIONS
Fund distributions resulting from either net investment income or realized net capital gains, if any, will normally be declared and paid at least annually in December, as described in the Fund’s prospectus. Distributions to shareholders are recorded on the ex-dividend date. Distributions are determined in accordance with federal income tax regulations, which may differ from net investment income and net realized capital gains for financial statement purposes (U.S. GAAP). Differences may be permanent or temporary. Permanent differences are reclassified among capital accounts in the financial statements to reflect their tax character. Permanent book and tax basis differences, if any, relating to shareholder distributions will result in reclassifications to paid-in capital. Temporary differences arise when certain items of income, expense and gain or loss are recognized in different periods for financial statement and tax purposes; these differences will reverse at some time in the future. Permanent differences are due to fair fund settlements and a net operating loss. Temporary differences are due to wash sales.
As of September 30, 2015, the components of distributable earnings (excluding unrealized appreciation/depreciation) on a tax basis consisted of:
| | | | |
Capital loss carryforward | | $ | 16,310,488 | * |
Undistributed ordinary income | | | — | |
Undistributed short-term capital gains | | | — | |
Undistributed long-term capital gains | | | — | |
Late-year loss deferral | | | — | |
| * | Includes realized losses of $1,800,590 related to sales of the portfolio made from September 15 to September 30, 2015, that may be deferred, as wash sales under the Internal Revenue Code, if repurchased within 30 days. Such deferral may decrease the Fund’s capital loss carryforward for tax purposes as shown above. |
e. FEDERAL TAXES
The Fund intends to comply with the requirements under Subchapter M of the Internal Revenue Code of 1986, as amended, to distribute substantially all of its taxable income and gains to its shareholders and to meet certain diversification and income requirements with respect to investment companies. Therefore, no provision for federal income or excise tax is included in the accompanying financial statements.
Additionally, based on the Fund’s understanding of the tax rules and rates related to income, gains and transactions for the foreign jurisdictions in which it invests, the Fund will provide for foreign taxes, and where appropriate, deferred foreign taxes.
Management has analyzed the Fund’s tax positions taken on federal income tax returns as of September 30, 2015, and for all open tax years (generally, the three prior taxable years), and has concluded that no provision for federal income tax is required in the Fund’s financial statements. Additionally, the Fund is not aware of any tax position for which it is reasonably possible that the total amounts of unrecognized tax benefits will change materially in the next twelve months.
Notes to Financial Statements (continued)
Net capital losses incurred in taxable years beginning after the enactment of the Regulated Investment Company Modernization Act of 2010, may be carried forward for an unlimited time period. Such losses will be required to be utilized prior to any loss carryovers incurred in pre-enactment taxable years, which generally expire eight years following the close of the taxable year in which they were incurred. As a result of this ordering rule, pre- enactment capital loss carryovers may be more likely to expire unused. Additionally, post- enactment capital losses that are carried forward retain their tax character as either short-term or long-term capital losses, unlike pre-enactment losses which are considered all short-term.
f. CAPITAL LOSS CARRYOVERS AND DEFERRALS
As of September 30, 2015, the Fund had an accumulated net realized capital loss carryover from securities transactions for federal income tax purposes as shown in the following chart. This amount may be used to offset future realized capital gains, if any, through the expiration date listed or in the case of post-enactment losses, for an unlimited time period.
| | | | | | | | | | |
| | | Capital Loss Carryover Amounts | | | |
| | | | | | | | | Expires |
| | | Short-Term | | | Long-Term | | | September 30, |
(Pre-Enactment) | | $ | 16,310,488 | | | | — | | | 2018 |
| | | | | | | | | | |
For the fiscal year ended September 30, 2015, the Fund utilized Capital Loss Carryovers in the amount of $9,597,544.
g. CAPITAL STOCK
The Trust’s Declaration of Trust authorizes for each fund the issuance of an unlimited number of shares of beneficial interest, without par value. The Fund records sales and repurchases of its capital stock on the trade date. The cost of securities contributed to the Fund in connection with the issuance of shares is based on the valuation of those securities in accordance with the Fund’s policy on investment valuation.
At September 30, 2015, certain affiliated shareholders of record, individually or collectively, held greater than 10% of the net assets of the Fund as follows: one owns 97%. Transactions by this shareholder may have a material impact on the Fund.
h. REPURCHASE AGREEMENTS
The Fund may enter into repurchase agreements provided that the value of the underlying collateral, including accrued interest, will equal or exceed the value of the repurchase agreement during the term of the agreement. The underlying collateral for all repurchase agreements is held in safekeeping by the Fund’s custodian or at the Federal Reserve Bank. If the seller defaults and the value of the collateral declines, or if bankruptcy proceedings commence with respect to the seller of the security, realization of the collateral by the Fund may be delayed or limited. At September 30, 2015, the market value of repurchase agreements outstanding was $28,989.
2. AGREEMENTS AND TRANSACTIONS WITH AFFILIATES
The Trust has entered into an investment advisory agreement under which the Investment Manager, a subsidiary and the U.S. retail distribution arm of Affiliated Managers Group, Inc. (”AMG”), serves as investment manager to the Fund and is responsible for the Fund’s overall administration and operations. The Investment Manager selects subadvisors for the Fund (subject to Board approval) and monitors the subadvisor’s investment performance, security holdings and investment strategies. The Fund’s investment portfolio is managed by Friess Associates, LLC (“Friess”) through a subadvisory agreement between the Investment Manager and Friess relating to the Fund, and Friess Associates of Delaware, LLC (“Friess of Delaware”) through a sub-subadvisory agreement among the Investment Manager, Friess and Friess of Delaware relating to the Fund.
Investment management fees are paid directly by the Fund to the Investment Manager based on average daily net assets. For the fiscal year ended September 30, 2015, the Fund paid an investment management fee at the annual rate of 1.00% of the average daily net assets of the Fund.
The Investment Manager has contractually agreed, through at least February 1, 2016, to waive management fees (but not below zero) and/or reimburse Fund expenses in order to limit total annual Fund operating expenses (exclusive of taxes, interest (including interest incurred in connection with bank and custody overdrafts), brokerage commissions and other transaction costs, acquired fund fees and expenses, and extraordinary expenses) to 1.95% of the Fund’s average daily net assets subject to later reimbursement by the Fund in certain circumstances. The contractual expense limitation may only be terminated in the event the Investment Manager or a successor ceases to be the investment manager of the Fund or a successor fund, by mutual agreement between the Investment Manager and the Board, or in the event of the Fund’s liquidation unless the Fund is reorganized or is a party to a merger in which the surviving entity is successor to the accounting and performance information of the Fund.
The Fund is obligated to repay the Investment Manager such amounts waived, paid or reimbursed in future years provided that the repayment occurs within thirty-six (36) months after the waiver or reimbursement and that such repayment would not cause the Fund’s total annual operating expenses after fee waiver and expense reimbursement in any such future year to exceed the Fund’s expense contractual expense limitation amount. For the fiscal year ended September 30, 2015, the Fund had no reimbursement available for repayment.
The Fund has entered into an Administration and Shareholder Servicing Agreement under which the Investment Manager serves as the Fund’s administrator (the” Administrator”) and is responsible for all aspects of managing the Fund’s operations, including administration and shareholder services to the Fund, its shareholders, and certain institutions, such as bank trust departments, broker- dealers and registered investment advisers, that advise or act as intermediary with the Fund’s shareholders. The Fund pays a fee to the Administrator at the rate of 0.03% of the Fund’s average daily net assets for the first $300 million of assets under management, 0.025% for the next $200 million, and 0.02% on amounts in excess of $500 million per annum, subject to a $40,000 annual minimum.
17
Notes to Financial Statements (continued)
Effective January 1, 2015, the Board provides supervision of the affairs of the Trust, other trusts within the AMG Funds family of mutual funds (collectively the “AMG Funds family”) and other affiliated funds. Previously, the Board provided supervision to only the Trust and other trusts within the AMG Funds family.
Beginning January 1, 2015, the aggregate annual retainer paid to each Independent Trustee of the Board is $200,000, plus $16,000, $4,000 or $2,000 for each regular, in- person special or telephonic special meeting attended, respectively. The Independent Chairman of the Trusts receives an additional payment of $55,000 per year. The Chairman of the Audit Committee receives an additional payment of $25,000 per year.
Prior to January 1, 2015, the aggregate annual retainer paid to each Independent Trustee of the Board was $130,000, plus $7,000 or $2,500 for each regular or special meeting attended, respectively. The Independent Chairman of the Trusts formerly received an additional payment of $35,000 per year. The Chairman of the Audit Committee formerly received an additional payment of $15,000 per year.
Effective January 1, 2015, the Trustees’ fees and expenses are generally allocated among all of the funds in the Trust, other trusts within the AMG Funds family and other affiliated funds based on the relative net assets of such funds. Before January 1, 2015, the Trustees’ fees and expenses were generally allocated among all of the funds in the Trust and other trusts within the AMG Funds family. The “Trustees fees and expenses” shown in the financial statements represents the Fund’s allocated portion of the total fees and expenses paid to the Independent Trustees of the Board.
The Fund is distributed by AMG Distributors, Inc. (the “Distributor”), a wholly-owned subsidiary of the Investment Manager. The Distributor serves as the distributor and underwriter for the Fund and is a registered broker-dealer and member of the Financial Industry Regulatory Authority, Inc. (”FINRA”). Shares of the Fund will be continuously offered and will be sold directly to prospective purchasers and through brokers, dealers or other financial intermediaries who have executed selling agreements with the Distributor. Subject to the compensation arrangement discussed below, generally the Distributor bears all or a portion of the expenses of providing services pursuant to the distribution agreement, including the payment of the expenses relating to the distribution of prospectuses for sales purposes and any advertising or sales literature. Certain Trustees and Officers of the Fund are Officers and/or Directors of the Investment Manager, AMG and/or the Distributor.
The Trust has adopted a distribution and service plan (the “Plan”) with respect to the Fund in accordance with the requirements of Rule 12b-1 under the 1940 Act and the requirements of the applicable rules of FINRA regarding asset based sales charges. Pursuant to the Plan, the Fund may make payments to reimburse the Distributor for its expenditures in financing any activity primarily intended to result in the sale of Fund shares and for maintenance and personal service provided to existing shareholders. The Plan authorizes payments to the Distributors of up to 0.25% annually of the Fund’s average daily net assets attributable to the sale of the Fund’s shares.
The Board has approved reimbursement payments to the Investment Manager for shareholder servicing expenses (“shareholder servicing fees”) incurred.
Shareholder servicing fees include payments to third parties such as a bank, broker-dealer, trust company or other financial intermediaries who provide shareholder recordkeeping, account servicing and other services. To the extent the Investment Manager makes shareholder servicing payments to a third party, the Fund may reimburse the Investment Manager up to the amounts incurred. For the six months ended September 30, 2015, the Fund paid $16,352 or 0.01%.
The Securities and Exchange Commission granted an exemptive order that permits the Fund to lend and borrow money for certain temporary purposes directly to and from other eligible Funds in the AMG Funds family. Participation in this interfund lending program is voluntary for both borrowing and lending Funds, and an interfund loan is only made if it benefits each participating Fund. The Investment Manager administers the program according to procedures approved by the Board, and the Board monitors the operation of the program. An interfund loan must comply with certain conditions set out in the exemptive order, which are designed to assure fairness and protect all participating Funds. For the fiscal year ended September 30, 2015, the Fund neither borrowed from nor lent to other Funds in the AMG Funds family.
3. PURCHASES AND SALES OF SECURITIES
Purchases and sales of securities (excluding short-term securities and U.S. Government obligations) for the fiscal year ended September 30, 2015, were $298,637,880 and $301,364,009, respectively. There were no purchases or sales of U.S. Government obligations for the Fund.
4. PORTFOLIO SECURITIES LOANED
The Fund participates in a securities lending program offered by BNYM (the “Program”), providing for the lending of securities to qualified brokers. Securities lending income includes earnings of such temporary cash investments, plus or minus any rebate to a borrower. These earnings (after any rebate) are then divided between BNYM, as a fee for its services under the Program, and the Fund, according to agreed-upon rates. Collateral received on all securities loaned is accepted in cash and is maintained at a minimum level of 102% (105% in the case of certain foreign securities) of the market value, plus interest, if applicable, of investments on loan. It is the Fund’s policy to obtain additional collateral from or return excess collateral to the borrower by the end of the next business day, following the valuation date of the securities loaned. Therefore, the value of the collateral held may be temporarily less than the value of the securities on loan. Lending securities entails a risk of loss to the Fund if and to the extent that the market value of the securities loaned were to increase and the borrower did not increase the collateral accordingly, and the borrower fails to return the securities. Under the terms of the Program, the Fund is indemnified for such losses by BNYM. Cash collateral is held in a separate account managed by BNYM, who is authorized to exclusively enter into overnight government repurchase agreements. BNYM bears the risk of any deficiency in the amount of the cash collateral available for return to the borrower due to any loss on the collateral invested. At September 30, 2015, the value of the securities loaned and cash collateral received was $28,134 and $28,989, respectively.
Notes to Financial Statements (continued)
5. COMMITMENTS AND CONTINGENCIES
Under the Trust’s organizational documents, its trustees and officers are indemnified against certain liabilities arising out of the performance of their duties to the Trust. In addition, in the normal course of business, the Fund may enter into contracts and agreements that contain a variety of representations and warranties, which provide general indemnifications. The maximum exposure to the Fund under these arrangements is unknown, as this would involve future claims that may be made against a Fund that have not yet occurred. However, based on experience, the Fund had no prior claims or losses and expects the risk of loss to be remote.
6. MASTER NETTING AGREEMENTS
The Fund may enter into master netting agreements with its counterparties for the securities lending program and repurchase agreements, which provide the right, in the event of default (including bankruptcy or insolvency) for the non-defaulting party to liquidate the collateral and calculate net exposure to the defaulting party or request additional collateral. For financial reporting purposes, the Fund does not offset financial assets and financial liabilities that are subject to master netting agreements in the Statement of Assets and Liabilities. For Securities lending transactions, see Note 4.
The following table is a summary of the Fund’s open repurchase agreements which are subject to a master netting agreement as of September 30, 2015:
| | | | | | | | | | | | | | | | |
| | | | | | Gross Amount Not Offset in the | | | | |
| | | | | | Statement of Assets and Liabilities | | | | |
| | | Net Amounts of Assets | | | Financial | | | | | | | |
| | | Presented in the Statement | | | Instruments | | | Cash Collateral | | | | |
| | | of Assets and Liabilities | | | Collateral | | | Received | | | Net Amount | |
Royal Bank of Scotland PLC. | | $ | 28,989 | | | $ | 28,989 | | | | — | | | | — | |
| | | | | | | | | | | | | | | | |
7. SUBSEQUENT EVENTS
The Fund has determined that no material events or transactions occurred through the issuance date of the Fund’s financial statements which require additional disclosure in or adjustment of the Fund’s financial statements.
TAX INFORMATION (unaudited)
The AMG Managers Brandywine Advisors Mid Cap Growth Fund hereby designates the maximum amount allowable of its net taxable income as qualified dividends as provided in the Jobs and Growth Tax Relief Reconciliation Act of 2003. The 2014/2015 Form 1099-DIV you receive for the Fund will show the tax status of all distributions paid to you during the year.
Pursuant to section 852 of the Internal Revenue Code, AMG Managers Brandywine Advisors Mid Cap Growth Fund hereby designates $0 as a capital gain distribution with respect to the taxable fiscal year ended September 30, 2015, or if subsequently determined to be different, the net capital gains of such year.
19
Report of Independent Registered Public Accounting Firm
TO THE BOARD OF TRUSTEES OF AMG FUNDS I AND SHAREHOLDERS OF AMG MANAGERS BRANDYWINE ADVISORS MID CAP GROWTH FUND:
In our opinion, the accompanying statement of assets and liabilities, including the schedule of portfolio investments, and the related statements of operations and of changes in net assets and the financial highlights present fairly, in all material respects, the financial position of AMG Managers Brandywine Advisors Mid Cap Growth Fund (the “Fund”) at September 30, 2015, and the results of its operations, the changes in its net assets and the financial highlights for each of the periods indicated, in conformity with accounting principles generally accepted in the United States of America. These financial statements and financial highlights (hereafter referred to as “financial statements”) are the responsibility of the Fund’s management. Our responsibility is to express an opinion on these financial statements based on our audits. We conducted our audits of these financial statements in accordance with the standards of the Public Company Accounting Oversight Board (United States). Those standards require that we plan and perform the audit to obtain reasonable assurance about whether the financial statements are free of material misstatement. An audit includes examining, on a test basis, evidence supporting the amounts and disclosures in the financial statements, assessing the accounting principles used and significant estimates made by management, and evaluating the overall financial statement presentation. We believe that our audits, which included confirmation of securities at September 30, 2015 by correspondence with the custodian and brokers, and the application of alternative auditing procedures where securities purchased had not been received, provide a reasonable basis for our opinion.
PricewaterhouseCoopers LLP
Boston, Massachusetts
October 20, 2015
20
Annual Renewal of Investment Management and Subadvisory Agreements (unaudited)
At an in-person meeting held on June 24-25, 2015, the Board of Trustees (the “Board” or the “Trustees”), and separately a majority of the Trustees who are not “interested persons” of the Trust (the “Independent Trustees”), approved the Investment Management Agreement and separately an amendment to the Investment Management Agreement, in each case with AMG Funds LLC (the “Investment Manager”) (collectively the “Investment Management Agreement”) for AMG Managers Brandywine Advisors Mid Cap Growth Fund (the “Fund”), the Subadvisory Agreement with the Subadvisor with respect to the Fund and the Sub-Subadvisory Agreement with the Sub-Subadvisor with respect to the Fund. The Subadvisory Agreement and the Sub-Subadvisory Agreement are referred to collectively herein as the “Friess Agreements” and the Subadvisor and the Sub-Subadvisor are referred to collectively herein as “Friess.” The Independent Trustees were separately represented by independent legal counsel in connection with their consideration of the approval of these agreements. In considering the Investment Management and Friess Agreements, the Trustees reviewed a variety of materials relating to the Fund, the Investment Manager and Friess including comparative performance, fee and expense information for an appropriate peer group of similar mutual funds (the “Peer Group”), performance information for the relevant benchmark index (the “Fund Benchmark”) and, with respect to Friess, comparative performance information for an appropriate peer group of managed accounts, and, as to all other matters, other information provided to them on a periodic basis throughout the year, as well as information provided in connection with the meetings of June 24-25, 2015, regarding the nature, extent and quality of services provided by the Investment Manager and Friess under their respective agreements. Prior to voting, the Independent Trustees: (a) reviewed the foregoing information with their independent legal counsel and with management; (b) received materials from their independent legal counsel discussing the legal standards applicable to their consideration of the Investment Management Agreement and the Friess Agreements; and (c) met with their
independent legal counsel in private sessions at which no representatives of management were present.
NATURE, EXTENT AND QUALITY OF SERVICES
In considering the nature, extent and quality of the services provided by the Investment Manager, the Trustees reviewed information relating to the Investment Manager’s operations and personnel. Among other things, the Investment Manager provided financial information, biographical information on its supervisory and professional staff and descriptions of its organizational and management structure. The Trustees also took into account information provided periodically throughout the previous year by the Investment Manager in Board meetings relating to the performance of its duties with respect to the Fund and the Trustees’ knowledge of the Investment Manager’s management and the quality of the performance of the Investment Manager’s duties.
In the course of their deliberations regarding the Investment Management Agreement, the Trustees evaluated, among other things: (a) the extent and quality of the Investment Manager’s oversight of the operation and management of the Fund; (b) the quality of the search, selection and monitoring services performed by the Investment Manager in overseeing the portfolio management responsibilities of Friess; (c) the Investment Manager’s ability to supervise the Fund’s other service providers; and (d) the Investment Manager’s compliance program. The Trustees also took into account that, in performing its functions under the Investment Management Agreement and supervising Friess, the Investment Manager: performs periodic detailed analysis and reviews of the performance by Friess of its obligations to the Fund, including without limitation, analysis and review of portfolio and other compliance matters and review of Friess’s investment performance in respect of the Fund; prepares and presents periodic reports to the Board regarding the investment performance of Friess and other information regarding Friess, at such times and in such forms as the Board may
reasonably request; reviews and considers any changes in the personnel of Friess responsible for performing Friess’s obligations and makes appropriate reports to the Board; reviews and considers any changes in the ownership or senior management of Friess and makes appropriate reports to the Board; performs periodic in-person or telephonic diligence meetings, including with respect to compliance matters, with representatives of Friess; assists the Board and management of the Trust in developing and reviewing information with respect to the initial approval of each Friess Agreement and annual consideration of each Friess Agreement thereafter; prepares recommendations with respect to the continued retention of Friess or the replacement of Friess, including at the request of the Board; identifies potential successors to or replacements of Friess or potential additional subadvisors, performs appropriate due diligence, and develops and presents to the Board a recommendation as to any such successor, replacement, or additional subadvisor, including at the request of the Board; designates and compensates from its own resources such personnel as the Investment Manager may consider necessary or appropriate to the performance of its services; and performs such other review and reporting functions as the Board shall reasonably request consistent with the Investment Management Agreement and applicable law. The Trustees also took into account the financial condition of the Investment Manager with respect to its ability to provide the services required under the Investment Management Agreement and the Investment Manager’s undertaking to maintain a contractual expense limitation for the Fund (which is expected to expire on February 1, 2016). The Trustees also considered the Investment Manager’s risk management processes.
The Trustees also reviewed information relating to Friess’s operations and personnel and the investment philosophy, strategies and techniques (its “Investment Strategy”) used in managing the Fund. Among other things, the Trustees reviewed biographical information on portfolio management and other professional staff, information regarding
21
Annual Renewal of Investment Management and Subadvisory Agreements (continued)
Friess’s organizational and management structure and Friess’s brokerage policies and practices. The Trustees considered specific information provided regarding the experience of the individuals at Friess with portfolio management responsibility for the Fund, including the information set forth in the Fund’s prospectus and statement of additional information. In the course of their deliberations, the Trustees evaluated, among other things: (a) the services rendered by Friess in the past; (b) the qualifications and experience of Friess’s personnel; and (c) Friess’s compliance program. The Trustees also took into account the financial condition of Friess with respect to its ability to provide the services required under each Friess Agreement. The Trustees also considered Friess’s risk management processes.
PERFORMANCE
As noted above, the Board considered the Fund’s net performance during relevant time periods as compared to the Fund’s Peer Group and Fund Benchmark and considered Friess’s performance as compared to an appropriate peer group of managed accounts and also considered the gross performance of the Fund as compared to Friess’s relevant performance composite that utilizes the same investment strategy and approach and noted that the Board reviews on a quarterly basis detailed information about the Fund’s performance results, portfolio composition and Friess’s Investment Strategy. The Board noted the Investment Manager’s expertise and resources in monitoring the performance, investment style and risk-adjusted performance of Friess. The Board was mindful of the Investment Manager’s attention to monitoring Friess’s performance with respect to the Fund and its discussions with management regarding the factors that contributed to the performance of the Fund.
Among other information relating to the Fund’s performance (including the predecessor fund’s performance for periods prior to its acquisition by the Trust on October 1, 2013), the Trustees noted that the Fund’s performance for the 1-year, 3-year, 5-year and 10-year periods ended March 31, 2015 was below the median performance of the
Peer Group and below the performance of the Fund Benchmark, the Russell® Midcap Growth Index. The Trustees also took into account management’s discussion of the Fund’s performance, including the reasons for the Fund’s underperformance. The Trustees noted the impact of the Fund’s underperformance from 2009 to 2013. The Trustees concluded that the Fund’s performance is being addressed.
ADVISORY FEES AND PROFITABILITY
In considering the reasonableness of the advisory fee charged by the Investment Manager for managing the Fund, the Trustees noted that the Investment Manager, and not the Fund, is responsible for paying the fees charged by the Fund’s Subadvisor, and, in turn, the Subadvisor is responsible for paying the fees charged by the Fund’s Sub-Subadvisor and, therefore, that the fees paid to the Investment Manager cover the cost of providing portfolio management services as well as the cost of providing search, selection and monitoring services in operating a “manager-of-managers” complex of mutual funds. The Trustees noted that the Investment Manager pays the Subadvisor a subadvisory fee that is equal to the advisory fee that it receives from the Fund. The Trustees concluded that, in light of the additional high quality supervisory services provided by the Investment Manager and the fact that the Investment Manager and the Subadvisor are paying the fees under the Subadvisory Agreement and Sub-Subadvisory Agreement, respectively, the advisory fee payable by the Fund to the Investment Manager can reasonably be expected to exceed the median advisory fee for the Peer Group, which consists of many funds that do not operate with a manager-of-managers structure. In this regard, the Trustees also noted that the Investment Manager has undertaken to maintain a contractual expense limitation for the Fund (which is expected to expire on February 1, 2016).
In addition, in considering the reasonableness of the advisory fee payable to the Investment Manager, the Trustees also reviewed information provided by the Investment Manager setting forth all revenues and other benefits, both direct and
indirect (including any so-called “fallout benefits” such as reputational value derived from the Investment Manager serving as Investment Manager to the Fund), received by the Investment Manager and its affiliates attributable to managing the Fund and all the mutual funds in the AMG Funds Family of Funds, the cost of providing such services and the resulting profitability to the Investment Manager and its affiliates from these relationships. The Trustees also noted the current asset levels of the Fund and the willingness of the Investment Manager to waive fees and pay expenses for the Fund from time to time as a means of limiting total expenses of the Fund. The Trustees also considered management’s discussion of the current asset level of the Fund, and considered the impact on profitability of the current asset level and any future growth of assets of the Fund. The Board took into account management’s discussion of the current advisory fee structure, and, as noted above, the services the Investment Manager provides in performing its functions under the Investment Management Agreement and supervising Friess. In this regard, the Trustees noted that, unlike a mutual fund that is managed by a single investment adviser, the Fund operates in a manager-of-managers structure. Based on the foregoing, the Trustees concluded that the profitability to the Investment Manager is reasonable and that the Investment Manager is not realizing material benefits from economies of scale that would warrant adjustments to the advisory fee at this time. With respect to economies of scale, the Trustees also noted that as the Fund’s assets increase over time, the Fund may realize other economies of scale to the extent that the increase in assets is proportionally greater than the increase in certain other expenses.
In considering the reasonableness of the fee payable by the Investment Manager to Friess, the Trustees relied on the ability of the Investment Manager to negotiate the terms of the Friess Agreements at arm’s length as part of the manager-of-managers structure, noting that the Investment Manager is not affiliated with Friess. In addition, the Trustees considered other potential
22
Annual Renewal of Investment Management and Subadvisory Agreements (continued)
benefits of the subadvisory relationship to Friess, including, among others, the indirect benefits that Friess may receive from its relationship with the Fund, including any so-called “fallout benefits” to Friess, such as reputational value derived from the Subadvisor and Sub-Subadvisor serving as Subadvisor and Sub-Subadvisor, respectively, to the Fund. In addition, the Trustees noted that the subadvisory fees are paid by the Investment Manager out of its advisory fee and, in turn, the sub-subadvisory fees are paid by the Subadvisor. As a consequence of all of the foregoing, the cost of services to be provided by Friess and the profitability to Friess of its relationship with the Fund were not material factors in the Trustees’ deliberations. For similar reasons, the Trustees did not consider potential economies of scale in the management of the Fund by Friess to be a material factor in their deliberations at this time.
The Trustees noted that the Fund’s advisory fees (which include both the advisory and administration fee) and total expenses (net of applicable expense waivers/reimbursements) as of March 31, 2015 were higher and lower, respectively, than the average for the Fund’s Peer Group. The Trustees took into account the fact that the Investment Manager has contractually agreed, through February 1, 2016, to limit the Fund’s net annual operating expenses (subject to certain excluded expenses) to 1.95% and noted that the Fund was operating below its expense cap as of March 31, 2015. The Trustees also took into account management’s discussion of the Fund’s expenses and competitiveness with comparably sized funds. The Trustees concluded that, in light of the nature, extent and quality of the services provided by the Investment Manager and Friess, the foregoing expense limitation and the considerations noted above with respect to the Investment Manager and Friess, the Fund’s advisory, subadvisory and sub-subadvisory fees are reasonable.
After consideration of the foregoing, the Trustees also reached the following conclusions (in addition to the conclusions discussed above) regarding the Investment Management Agreement and each
Friess Agreement: (a) the Investment Manager and Friess have demonstrated that they possess the capability and resources to perform the duties required of them under the Investment Management Agreement and the Friess Agreements; (b) Friess’s Investment Strategy is appropriate for pursuing the Fund’s investment objectives; and (c) the Investment Manager and Friess maintain appropriate compliance programs.
Based on all of the above-mentioned factors and their related conclusions, with no single factor or conclusion being determinative and with each Trustee not necessarily attributing the same weight to each factor, the Trustees concluded that approval of the Investment Management Agreement and each Friess Agreement would be in the best interests of the Fund and its shareholders. Accordingly, on June 24-25, 2015, the Trustees, and separately a majority of the Independent Trustees, voted to approve the Investment Management Agreement and the Friess Agreements for the Fund.
23
AMG Funds
Trustees and Officers
The Trustees and Officers of the Trust, their business addresses, principal occupations for the past five years and dates of birth are listed below. The Trustees provide broad supervision over the affairs of the Trust and the Funds. The Trustees are experienced executives who meet periodically throughout the year to oversee the Funds’ activities, review contractual arrangements with
companies that provide services to the Funds, and review the Funds’ performance. Unless otherwise noted, the address of each Trustee or Officer is the address of the Trust: 800 Connecticut Avenue, Norwalk, Connecticut 06854.
There is no stated term of office for Trustees. Trustees serve until their resignation, retirement or removal in accordance with the Trust’s
organizational documents and policies adopted by the Board from time to time. The Chairman of the Trustees, President, Treasurer and Secretary of the Trust are elected by the Trustees annually. Other officers hold office at the pleasure of the Trustees.
Independent Trustees
The following Trustees are not “interested persons” of the Trust within the meaning of the 1940 Act:
| | |
Number of Funds Overseen in Fund Complex | | Name, Date of Birth, Principal Occupation(s) During Past 5 Years and Other Directorships Held by
Trustee |
| • Trustee since 2012 | | Bruce B. Bingham, 12/1/48 |
| • Oversees 45 Funds in Fund Complex | | Partner, Hamilton Partners (real estate development firm) (1987-Present); Trustee of Aston Funds (27 portfolios) (2014-Present). Director of The Yacktman Funds (2000-2012). |
| |
| • Independent Chairman | | William E. Chapman II, 9/23/41 |
• Trustee since 2000 • Oversees 45 Funds in Fund Complex | | President and Owner, Longboat Retirement Planning Solutions (1998-Present); Hewitt Associates, LLC (part time) (provider of Retirement and Investment Education |
| | Seminars) (2002-2009); Trustee Emeritus of Bowdoin College (2013-Present); Trustee of Bowdoin College (2002-2013); Director of Harding, Loevner Funds, Inc. (6 portfolios); Trustee of Third Avenue Trust (5 portfolios); Trustee of Third Avenue Variable Trust (1 portfolio); Trustee of Aston Funds (27 portfolios) (2010-Present). |
| |
| • Trustee since 2000 | | Edward J. Kaier, 9/23/45 |
| • Oversees 45 Funds in Fund Complex | | Attorney at Law and Partner, Teeters Harvey Marrone & Kaier LLP (2007-Present); Attorney at Law and Partner, Hepburn Willcox Hamilton & Putnam, LLP (1977-2007); Trustee of Third Avenue Trust (5 portfolios); Trustee of Third Avenue Variable Trust (1 portfolio); Trustee of Aston Funds (27 portfolios) (2010-Present). |
| |
| • Trustee since 2013 | | Kurt A. Keilhacker, 10/5/63 |
| • Oversees 47 Funds in Fund Complex | | Managing Member, TechFund Capital (1997-Present); Managing Member, TechFund Europe (2000-Present); Trustee, Gordon College (2001-Present); Board Member, 6wind SA, (2002-Present); Managing Member, Elementum Ventures (2013-Present); Trustee of Aston Funds (27 portfolios) (2014-Present). |
| |
| • Trustee since 2000 | | Steven J. Paggioli, 4/3/50 |
| • Oversees 45 Funds in Fund Complex | | Independent Consultant (2002-Present); Formerly Executive Vice President and Director, The Wadsworth Group (1986-2001); Executive Vice President, Secretary and Director, Investment Company Administration, LLC (1990-2001); Vice President, Secretary and Director, First Fund Distributors, Inc. (1991-2001); Trustee, Professionally Managed Portfolios (43 portfolios); Advisory Board Member, Sustainable Growth Advisors, LP; Independent Director, Chase Investment Counsel (2008 – Present); Trustee of Aston Funds (27 portfolios) (2010-Present). |
| |
| • Trustee since 2013 | | Richard F. Powers III, 2/2/46 |
| • Oversees 45 Funds in Fund Complex | | Adjunct Professor, Boston College (2011-Present); Trustee of Aston Funds (27 portfolios) (2014-Present); President and CEO of Van Kampen Investments Inc. (1998-2003). |
| |
| • Trustee since 2000 | | Eric Rakowski, 6/5/58 |
| • Oversees 47 Funds in Fund Complex | | Professor, University of California at Berkeley School of Law (1990-Present); Director of Harding, Loevner Funds, Inc. (6 portfolios); Trustee of Third Avenue Trust (5 portfolios); Trustee of Third Avenue Variable Trust (1 portfolio); Trustee of Aston Funds (27 portfolios) (2010-Present). |
| |
| • Trustee since 2013 | | Victoria L. Sassine, 8/11/65 |
| • Oversees 47 Funds in Fund Complex | | Lecturer, Babson College (2007 – Present); Trustee of Aston Funds (27 portfolios) (2014-Present). |
| |
| • Trustee since 2000 | | Thomas R. Schneeweis, 5/10/47 |
| • Oversees 45 Funds in Fund Complex | | Professor Emeritus, University of Massachusetts (2013 - Present); Partner, S Capital Management, LLC (2007-Present); President, TRS Associates (1982-Present); Director, CISDM at the University of Massachusetts, (1996-2013); President, Alternative Investment Analytics, LLC, (formerly Schneeweis Partners, LLC) (2001-2013); |
| | Professor of Finance, University of Massachusetts (1977-2013); Partner, White Bear Partners, LLC (2007-2010); Partner, Northampton Capital Management, LLC (2004-2010); Trustee of Aston Funds (27 portfolios) (2010-Present). |
24
AMG Funds
Trustees and Officers (continued)
Interested Trustees
Each Trustee in the following table is an “interested person” of the Trust within the meaning of the 1940 Act. Ms. Carsman is an interested person of the Trust within the meaning of the 1940 Act by virtue of her position with, and interest in securities of, AMG, and her former position as Chief Legal Officer of the Trust.
| | |
Number of Funds Overseen in Fund Complex | | Name, Date of Birth, Principal Occupation(s) During Past 5 Years and Other Directorships Held by
Trustee |
| • Trustee since 2011 | | Christine C. Carsman, 4/2/52 |
| • Oversees 47 Funds in Fund Complex | | Senior Vice President and Deputy General Counsel, Affiliated Managers Group, Inc. (2011-Present); Trustee of Aston Funds (27 portfolios) (2014-Present); Senior Vice President and Chief Regulatory Counsel, Affiliated Managers Group, Inc. (2007-2011); Vice President and Chief Regulatory Counsel, Affiliated Managers Group, Inc. (2004-2007); Secretary and Chief Legal Officer, AMG Funds, AMG Funds I, AMG Funds II and AMG Funds III (2004-2011); Senior Counsel, Vice President and Director of Operational Risk Management and Compliance, Wellington Management Company, LLP (1995-2004). |
Officers
| | |
Position(s) Held with Fund and Length of Time Served | | Name, Date of Birth, Principal Occupation(s) During Past 5 Years |
| • President since 2014 | | Jeffrey T. Cerutti, 2/7/68 |
| • Principal Executive Officer since 2014 | | Chief Executive Officer, AMG Funds LLC (2014-Present); Director, President and Principal, AMG Distributors, Inc. (2014-Present); Chief Executive Officer and President, Aston Funds (2015-Present); President, VP Distributors, (2011-2014); Executive Vice President, Head of Distribution, Virtus Investment Partners, Inc. (2010-2014); Managing Director, Head of Sales, UBS Global Asset Management (2001-2010). |
| |
| • Chief Operating Officer since 2007 | | Keitha L. Kinne, 5/16/58 Chief Operating Officer, AMG Funds LLC (2007-Present); Chief Investment Officer, AMG Funds LLC (2008-Present); Chief Operating Officer, AMG Distributors, Inc. (2007-Present); Managing Partner, AMG Funds LLC (2007-2014); President, AMG Funds (2012-2014); President, AMG Distributors, Inc. (2012-2014); Managing Director, Legg Mason & Co., LLC (2006-2007); Managing Director, Citigroup Asset Management (2004-2006). |
| |
| • Secretary since 2015 | | Mark J. Duggan, 2/20/65 |
| • Chief Legal Officer since 2015 | | Senior Vice President and Senior Counsel, AMG Funds LLC (2015-Present); Secretary and Chief Legal Officer, AMG Funds, AMG Funds I, AMG Funds II and AMG Funds III (2015-Present); Attorney, K&L Gates, LLP (2009-2015). |
| |
| • Chief Financial Officer since 2007 | | Donald S. Rumery, 5/29/58 |
• Treasurer since 1999 • Principal Financial Officer since 2008 | | Senior Vice President, Director of Mutual Funds Services, AMG Funds LLC (2005-Present); Treasurer, AMG Funds III (1995-Present); Treasurer, AMG Funds (1999-Present); Treasurer, AMG Funds II (2000-Present); Chief Financial Officer, AMG Funds, AMG Funds III and AMG Funds III (2007-Present); Treasurer and Chief Financial Officer, AMG Distributors, Inc. (2000-2012); Vice President, AMG Funds LLC, (1994-2004). |
| |
| • Assistant Treasurer since 2014 | | John C. Ball, 1/9/76 Vice President, Assistant Treasurer, AMG Funds LLC (2014-Present); Vice President, State Street Corp. (2010-2014); Vice President, State Street International (Ireland) Limited (2007-2010). |
| |
| • Chief Compliance Officer since 2010 | | John J. Ferencz, 3/9/62 Vice President, Chief Compliance Officer - AMG Family of Funds, AMG Funds LLC (2010-Present); Code of Ethics Reporting Officer and Sarbanes Oxley Code of Ethics Compliance Officer, AMG Funds, AMG Funds I, AMG Funds II and AMG Funds III (2010-Present); Senior Compliance Analyst, Mutual Funds and Regulatory, GE Asset Management Incorporated (2005-2010). |
| |
| • Anti-Money Laundering Compliance Officer since 2014 | | Patrick J. Spellman, 3/15/74 Senior Vice President, Chief Compliance Officer, AMG Funds LLC (2011-Present); Chief Compliance Officer, AMG Distributors, Inc., (2010-Present); Compliance Manager, Legal and Compliance, Affiliated Managers Group, Inc. (2005-2011). |
25
THIS PAGE INTENTIONALLY LEFT BLANK
THIS PAGE INTENTIONALLY LEFT BLANK
THIS PAGE INTENTIONALLY LEFT BLANK
INVESTMENT MANAGER AND ADMINISTRATOR*
AMG Funds LLC
800 Connecticut Avenue
Norwalk, CT 06854
(800) 835-3879
DISTRIBUTOR*
AMG Distributors, Inc.
800 Connecticut Avenue
Norwalk, CT 06854
(800) 835-3879
SUBADVISOR
Friess Associates, LLC
P.O. Box 576
Jackson, Wyoming 83001
Friess Associates of Delaware, LLC
P.O. Box 4166
Greenville, DE 19807
CUSTODIAN
The Bank of New York Mellon
2 Hanson Place
Brooklyn, NY 11217
LEGAL COUNSEL
Ropes & Gray LLP
Prudential Tower, 800 Boylston Street
Boston, MA 02199-3600
TRANSFER AGENT
BNY Mellon Investment Servicing
(US) Inc.
Attn: AMG Funds
P.O. Box 9769
Providence, RI 02940
(800) 548-4539
This report is prepared for the Fund’s shareholders. It is authorized for distribution to prospective investors only when preceded or accompanied by an effective prospectus. To receive a free copy of the prospectus or Statement of Additional Information, which includes additional information about Fund Trustees, please contact us by calling 800.835.3879. Distributed by AMG Distributors, Inc., member FINRA/SIPC.
Current net asset values per share for the Fund are available on the Fund’s website at www.amgfunds.com.
A description of the policies and procedures the Fund uses to vote its proxies is available: (i) without charge, upon request, by calling 800.835.3879, or (ii) on the Securities and Exchange Commission’s (SEC) website at www.sec.gov For information regarding the Fund’s proxy voting record for the 12-month period ended June 30, call 800.835.3879 or visit the SEC website at www.sec.gov.
The Fund files its complete schedule of portfolio holdings with the SEC for the first and third quarters of each fiscal year on Form N-Q. The Fund’s Forms N-Q are available on the SEC’s website at www.sec.gov. A Fund’s Forms N-Q may be reviewed and copied at the SEC’s Public Reference Room in Washington, DC. Information on the operation of the Public Reference Room may be obtained by calling 1-800-SEC-0330. To review a complete list of the Fund’s portfolio holdings, or to view the most recent quarterly holdings report, semiannual report, or annual report, please visit www.amgfunds.com.
| * | Effective October 19, 2015, the address will change to 600 Steamboat Road, Suite 300, Greenwich, CT 06830. |
AFFILIATE SUBADVISED FUNDS
BALANCED FUNDS
AMG Chicago Equity Partners Balanced
Chicago Equity Partners, LLC
AMG FQ Global Risk-Balanced
First Quadrant, L.P.
EQUITY FUNDS
AMG Chicago Equity Partners Small Cap Value
Chicago Equity Partners, LLC
AMG FQ Tax-Managed U.S. Equity
AMG FQ U.S. Equity
First Quadrant, L.P.
AMG Frontier Small Cap Growth
Frontier Capital Management Company, LLC
AMG GW&K Small Cap Core
AMG GW&K Small Cap Growth
GW&K Investment Management, LLC
AMG Renaissance International Equity
AMG Renaissance Large Cap Growth
The Renaissance Group LLC
AMG SouthernSun Small Cap
AMG SouthernSun U.S. Equity
SouthernSun Asset Management, LLC
AMG Systematic Large Cap Value
AMG Systematic Mid Cap Value
Systematic Financial Management, L.P.
AMG TimesSquare All Cap Growth
AMG TimesSquare International Small Cap
AMG TimesSquare Mid Cap Growth
AMG TimesSquare Small Cap Growth
TimesSquare Capital Management, LLC
AMG Trilogy Emerging Markets Equity
AMG Trilogy Emerging Wealth Equity
AMG Trilogy Global Equity
AMG Trilogy International Small Cap
Trilogy Global Advisors, L.P.
AMG Yacktman
AMG Yacktman Focused
AMG Yacktman Special Opportunities
Yacktman Asset Management LP
FIXED INCOME FUNDS
AMG GW&K Core Bond
(formerly AMG Managers Total Return Bond)
AMG GW&K Enhanced Core Bond
AMG GW&K Municipal Bond
AMG GW&K Municipal Enhanced Yield
GW&K Investment Management, LLC
OPEN-ARCHITECTURE FUNDS
EQUITY FUNDS
AMG Managers Brandywine
AMG Managers Brandywine Advisors Mid Cap Growth
AMG Managers Brandywine Blue
Friess Associates, LLC
AMG Managers Cadence Capital Appreciation
AMG Managers Cadence Emerging Companies
AMG Managers Cadence Mid Cap
Cadence Capital Management, LLC
AMG Managers Emerging Opportunities
Lord, Abbett & Co. LLC
WEDGE Capital Management L.L.P.
Next Century Growth Investors LLC
RBC Global Asset Management (U.S.) Inc.
AMG Managers Essex Small/Micro Cap Growth
Essex Investment Management Co., LLC
AMG Managers Real Estate Securities
CenterSquare Investment Management, Inc.
AMG Managers Skyline Special Equities
Skyline Asset Management, L.P.
AMG Managers Special Equity
Ranger Investment Management, L.P.
Lord, Abbett & Co. LLC
Smith Asset Management Group, L.P.
Federated MDTA LLC
FIXED INCOME FUNDS
AMG Managers Bond
AMG Managers Global Income Opportunity
Loomis, Sayles & Co., L.P.
AMG Managers High Yield
J.P. Morgan Investment Management Inc.
AMG Managers Intermediate Duration Government
AMG Managers Short Duration Government
Amundi Smith Breeden LLC
| | |
 | | | www.amgfunds.com |
Item 2. CODE OF ETHICS
Registrant has adopted a Code of Ethics. See attached Exhibit (a)(1).
Item 3. AUDIT COMMITTEE FINANCIAL EXPERT
Registrant’s Board of Trustees has determined that independent Trustee Mr. Steven J. Paggioli qualifies as an Audit Committee Financial Expert. Mr. Paggioli is “independent” as such term is defined in Form N-CSR.
Item 4. PRINCIPAL ACCOUNTANT FEES AND SERVICES
(a) Audit Fees
The aggregate fees billed by the Funds’ independent registered public accounting firm, PricewaterhouseCoopers LLP (“PwC”), to the Funds for the Funds’ two most recent fiscal years for professional services rendered for audits of annual financial statements, or services that are normally provided in connection with statutory and regulatory filings or engagements (“Audit Fees”) were as follows:
| | | | | | | | |
| | | Fiscal 2015 | | | Fiscal 2014 | |
AMG Managers Brandywine Fund | | $ | 50,334 | | | $ | 24,969 | |
AMG Managers Brandywine Blue Fund | | $ | 40,322 | | | $ | 22,307 | |
AMG Managers Brandywine Advisors Mid Cap Growth Fund | | $ | 43,046 | | | $ | 21,268 | |
(b) Audit-Related Fees
There were no fees billed by PwC to the Funds in its two recent fiscal years for services rendered for assurance and related services that are reasonably related to the performance of the audit or review of the Fund’s financial statements, but are not reported as Audit Fees (“Audit-Related Fees”).
For the Funds’ two most recent fiscal years, there were no Audit-Related Fees billed by PwC for engagements related directly to the operations and financial reporting of one or more Funds by a Fund Service Provider. A Fund Service Provider is (a) any investment adviser to the Fund (not including any Subadvisor whose role is primarily portfolio management and is subcontracted with or overseen by another investment adviser) or (b) any entity that provides ongoing services to the Fund and is controlling, controlled by or under common control with a Fund investment adviser described in (a).
(c) Tax Fees
The aggregate fees billed by PwC to the Funds for the two most recent fiscal years for professional services rendered for tax compliance, tax advice, and tax planning (“Tax Fees”) were as follows:
| | | | | | | | |
| | | Fiscal 2015 | | | Fiscal 2014 | |
AMG Managers Brandywine Fund | | $ | 6,985 | | | $ | 4,080 | |
AMG Managers Brandywine Blue Fund | | $ | 6,985 | | | $ | 4,080 | |
AMG Managers Brandywine Advisors Mid Cap Growth Fund | | $ | 6,985 | | | $ | 4,080 | |
For the Funds’ two most recent fiscal years, Tax Fees billed by PwC for engagements by Fund Service Providers that related directly to the operations and financial reporting of the Funds were $0 for fiscal 2014 and $0 for fiscal 2013, respectively.
The services for which Tax Fees were charged comprise all services performed by professional staff in PwC’s tax division except those services related to the audit. Typically, this category would include fees for tax compliance, tax planning, and tax advice. Tax compliance, tax advice, and tax planning services include preparation of original and amended tax returns, claims for refund and tax payment-planning services, assistance with tax audits and appeals, tax advice related to mergers and acquisitions and requests for rulings or technical advice from taxing authorities.
(d) All Other Fees
There were no other fees billed by PwC to the Funds for all other non-audit services (“Other Fees”) during the Funds’ two most recent fiscal years. During the same period, there were no Other Fees billed by PwC for engagements by Fund Service Providers that related directly to the operations and financial reporting of the Funds.
(e)(1) According to policies adopted by the Audit Committee, services provided by PwC to the Funds must be pre-approved by the Audit Committee. On an annual basis, the Audit Committee reviews and pre-approves various types of services that PwC may perform for the Funds without specific approval of each engagement, subject to specified budget limitations. As contemplated by the Sarbanes-Oxley Act of 2002 and related SEC rules, the Audit Committee also pre-approves non-audit services provided by PwC to any Fund Service Provider for any engagement that relates directly to the operations and financial reporting of the Funds. Any engagement that is not already pre-approved or that will exceed a pre-approved budget must be submitted to the Audit Committee for pre-approval. The Chairman of the Audit Committee is authorized on behalf of the Board of Trustees and the Audit Committee to approve the engagement of PwC to perform non-audit services subject to certain conditions, including notification to the Audit Committee of such pre-approval not later than the next meeting of the Audit Committee following the date of such pre-approval.
(e)(2) None.
(f) Not applicable.
(g) The aggregate fees billed by PwC in 2015 and 2014 for non-audit services rendered to the Funds and Fund Service Providers were $116,523 and $305,390, respectively. For the fiscal year ended September 30, 2015, this amount reflects the amounts disclosed above in Item 4(b),(c),(d), plus $95,568 in fees billed to the Fund Service Providers for non-audit services that did not relate directly to the operations and financial reporting of the Funds. For the fiscal year ended September 30, 2014, this amount reflects the amounts disclosed above in Item 4(b),(c),(d), plus $48,000 in fees billed to the Fund Service Providers for non-audit services that did not relate directly to the operations and financial reporting of the Funds.
(h) The Trust’s Audit Committee has considered whether the provision of non-audit services by registrant’s independent registered public accounting firm to the registrant’s investment advisor, and any entity controlling, controlled, or under common control with the investment advisor that provided ongoing services to the registrant that were not pre-approved by the Committee (because such services did not relate directly to the operations and financial reporting of the registrant) was compatible with maintaining the independence of the independent registered public accounting firm.
Item 5. AUDIT COMMITTEE OF LISTED REGISTRANTS
Not applicable.
Item 6. SCHEDULE OF INVESTMENTS
The schedule of investments in unaffiliated issuers as of the close of the reporting period is included as part of the shareholder report contained in Item 1 hereof.
Item 7. DISCLOSURE OF PROXY VOTING POLICIES AND PROCEDURES FOR CLOSED-END MANAGEMENT INVESTMENT COMPANIES
Not applicable.
Item 8. PORTFOLIO MANAGERS OF CLOSED-END MANAGEMENT INVESTMENT COMPANIES
Not applicable.
Item 9. PURCHASES OF EQUITY SECURITIES BY CLOSED-END MANAGEMENT INVESTMENT COMPANIES AND AFFILIATED PURCHASERS
Not applicable.
Item 10. SUBMISSION OF MATTERS TO A VOTE OF SECURITY HOLDERS
Not applicable.
Item 11. CONTROLS AND PROCEDURES
(a) The Registrant’s principal executive and principal financial officers have concluded, based on their evaluation of the registrant’s disclosure controls and procedures as of a date within 90 days of the filing of this report, that the Registrant’s disclosure controls and procedures are reasonably designed to ensure that information required to be disclosed by the Registrant on Form N-CSR is recorded, processed, summarized and reported within the required time
periods and that information required to be disclosed by the registrant in the reports that it files or submits on Form N-CSR is accumulated and communicated to the Registrant’s management, including its principal executive and principal financial officers, as appropriate to allow timely decisions regarding required disclosure.
(b) There were no changes in the Registrant’s internal control over financial reporting during the Registrant’s fourth fiscal quarter of the period covered by this report that have materially affected, or are reasonably likely to affect, the internal control over financial reporting.
Item 12. EXHIBITS
| | |
| |
| (a)(1) | | Any Code of Ethics or amendments hereto. Filed herewith. |
| |
| (a)(2) | | Certifications pursuant to Rule 30a-2(a) under the Investment Company Act of 1940 - Filed herewith. |
| |
| (a)(3) | | Not applicable. |
| |
| (b) | | Certifications pursuant to Rule 30a-2(b) under the Investment Company Act of 1940 - Filed herewith. |
SIGNATURES
Pursuant to the requirements of the Securities Exchange Act of 1934 and the Investment Company Act of 1940, the registrant has duly caused this report to be signed on its behalf by the undersigned, thereunto duly authorized.
AMG FUNDS I
| | |
| By: | | /s/ Jeffrey T. Cerutti |
| | Jeffrey T. Cerutti, Principal Executive Officer |
| |
| Date: | | October 27, 2015 |
Pursuant to the requirements of the Securities Exchange Act of 1934 and the Investment Company Act of 1940, this report has been signed below by the following persons on behalf of the registrant and in the capacities and on the dates indicated.
| | |
| By: | | /s/ Jeffrey T. Cerutti |
| | Jeffrey T. Cerutti, Principal Executive Officer |
| |
| Date: | | October 27, 2015 |
| | |
| By: | | /s/ Donald S. Rumery |
| | Donald S. Rumery, Principal Financial Officer |
| |
| Date: | | October 27, 2015 |