UNITED STATES
SECURITIES AND EXCHANGE COMMISSION
Washington, D.C. 20549
FORM N-CSR
CERTIFIED SHAREHOLDER REPORT OF
REGISTERED MANAGEMENT INVESTMENT COMPANIES
Investment Company Act file number: 811-06520
AMG Funds I
(Exact name of registrant as specified in charter)
800 Connecticut Avenue, Norwalk, Connecticut 06854
(Address of principal executive offices) (Zip code)
AMG Funds LLC
800 Connecticut Avenue, Norwalk, Connecticut 06854
(Name and address of agent for service)
Registrant’s telephone number, including area code: (203) 299-3500
Date of fiscal year end: OCTOBER 31
Date of reporting period: NOVEMBER 1, 2013 – OCTOBER 31, 2014
(Annual Shareholder Report)
Item 1. Reports to Shareholders
| | | | |
 | | AMG Funds | | ANNUAL REPORT |
AMG Funds
October 31, 2014

| | |
| AMG FQ Tax-Managed U.S. Equity Fund | | |
| Investor Class: MFQAX | Institutional Class: MFQTX | | |
| |
| AMG FQ U.S. Equity Fund | | |
| Investor Class: FQUAX | Institutional Class: MEQFX | | |
| |
| AMG FQ Global Alternatives Fund | | |
| Investor Class: MGAAX | Service Class: MGASX | Institutional Class: MGAIX | | |
| |
| AMG FQ Global Risk-Balanced Fund | | |
| (formerly Managers AMG FQ Global Essentials Fund) | | |
| |
| Investor Class: MMAVX | Service Class: MMASX | Institutional Class: MMAFX | | |
| | |
| www.amgfunds.com | | | AR014-1014 |
AMG Funds
Annual Report—October 31, 2014
| | | | |
TABLE OF CONTENTS | | PAGE | |
LETTER TO SHAREHOLDERS | | | 2 | |
| |
ABOUT YOUR FUND’S EXPENSES | | | 3 | |
| |
PORTFOLIO MANAGER’S COMMENTS, FUND SNAPSHOTS, | | | | |
AND SCHEDULES OF PORTFOLIO INVESTMENTS | | | | |
| |
AMG FQ Tax-Managed U.S. Equity Fund | | | 4 | |
AMG FQ U.S. Equity Fund | | | 10 | |
AMG FQ Global Alternatives Fund | | | 16 | |
AMG FQ Global Risk-Balanced Fund | | | 19 | |
| |
NOTES TO SCHEDULES OF PORTFOLIO INVESTMENTS | | | 24 | |
| |
FINANCIAL STATEMENTS | | | | |
| |
Statement of Assets and Liabilities | | | 35 | |
Balance sheets, net asset value (NAV) per share computations and cumulative undistributed amounts | | | | |
| |
Statement of Operations | | | 37 | |
Detail of sources of income, expenses, and realized and unrealized gains (losses) during the fiscal year | | | | |
| |
Statements of Changes in Net Assets | | | 38 | |
Detail of changes in assets for the past two fiscal years | | | | |
| |
Financial Highlights | | | 40 | |
Historical net asset values per share, distributions, total returns, income and expense ratios, turnover ratios and net assets | | | | |
| |
Notes to Financial Highlights | | | 46 | |
| |
Notes to Financial Statements | | | 47 | |
Accounting and distribution policies, details of agreements and transactions with Fund management and affiliates, and descriptions of certain investment risks | | | | |
| |
REPORT OF INDEPENDENT REGISTERED PUBLIC ACCOUNTING FIRM | | | 58 | |
| |
TRUSTEES AND OFFICERS | | | 59 | |
| |
ANNUAL RENEWAL OF INVESTMENT MANAGEMENT AND SUBADVISORY AGREEMENTS | | | 61 | |
Nothing contained herein is to be considered an offer, sale or solicitation of an offer to buy shares of any series of the AMG Funds Family of mutual funds. Such offering is made only by Prospectus, which includes details as to offering price and other material information.
| | | | |
 | | AMG Funds | | Letter to Shareholders |
DEAR SHAREHOLDER:
The fiscal year ended October 31, 2014 was another period of strong equity returns. The S&P 500 Index, a widely followed barometer of the U.S. equity market, rose more than 17% during the past 12 months. International stocks, by comparison, had flat performance, as measured by the MSCI ACWI ex USA Index (in U.S. Dollar terms). The first quarter of 2014 marked the five-year anniversary of the equity bull market. Despite a few bouts of volatility and persistent doubts about the strength of the economic recovery since the beginning of the bull market, the S&P 500 Index has a cumulative gain of 236% (including reinvestment of dividends) since the market bottom on March 9, 2009, through October 31, 2014.
Meanwhile, the Barclays U.S. Aggregate Bond Index, a broad U.S. bond market benchmark, returned 4% for the 12 months ended October 31. Bond markets have performed strongly during this period, to the surprise of many, despite the unwinding of the U.S. Federal Reserve’s bond-buying program known as QE3.
Earlier this year, Managers Investment Group rebranded as AMG Funds. Our new name helps align our fund family more closely with our parent company, Affiliated Managers Group (“AMG”). While the names of funds branded under AMG changed slightly, the ticker symbols remain the same. There was no change to the legal or ownership structure of the funds and the name change will have no impact on their management.
Our foremost goal at AMG Funds is to provide investment products and solutions that help our shareholders and clients successfully reach their long-term investment goals. We do this by partnering with many of AMG’s Affiliate investment boutiques to offer a distinctive array of actively managed, return-oriented funds. In addition, we oversee and distribute a number of complementary mutual funds sub-advised by unaffiliated investment managers. We thank you for your continued confidence and investment in AMG Funds. You can rest assured that, under all market conditions, our team is focused on delivering excellent investment management services for your benefit.
Respectfully,

Jeffery Cerutti
President
AMG Funds
| | | | | | | | | | | | | | |
Average Annual Total Returns | | Periods ended
October 31, 2014 | |
Stocks: | | | | 1 Year | | | 3 Years | | | 5 Years | |
Large Caps | | (S&P 500 Index) | | | 17.27 | % | | | 19.77 | % | | | 16.69 | % |
Small Caps | | (Russell 2000® Index) | | | 8.06 | % | | | 18.18 | % | | | 17.39 | % |
International | | (MSCI All Country World Index ex USA Index) | | | 0.06 | % | | | 7.76 | % | | | 6.09 | % |
Bonds: | | | | | | | | | | | | | | |
Investment Grade | | (Barclays U.S. Aggregate Bond Index) | | | 4.14 | % | | | 2.73 | % | | | 4.22 | % |
High Yield | | (Barclays U.S. High Yield Bond Index) | | | 5.82 | % | | | 9.39 | % | | | 10.44 | % |
Tax-exempt | | (Barclays Municipal Bond Index) | | | 7.82 | % | | | 4.93 | % | | | 5.26 | % |
Treasury Bills | | (BofAML U.S. Treasury Bill 6 Month Index) | | | 0.14 | % | | | 0.16 | % | | | 0.23 | % |
2
About Your Fund’s Expenses
As a shareholder of a Fund, you may incur two types of costs: (1) transaction costs, which may include sales charges (loads) on purchase payments; redemption fees; and exchange fees; and (2) ongoing costs, including management fees; distribution (12b-1) fees; and other Fund expenses. This example is intended to help you understand your ongoing costs (in dollars) of investing in the Fund and to compare these costs with the ongoing costs of investing in other mutual funds. The example is based on $1,000 invested at the beginning of the period and held for the entire period as indicated below.
ACTUAL EXPENSES
The first line of the following table provides information about the actual account values and actual expenses. You may use the information in this line, together with the amount you invested, to estimate the expenses that you paid over the period. Simply divide your account value by $1,000 (for example, an $8,600 account value divided by $1,000 = 8.6), then multiply the result by the number in the first line under the heading entitled “Expenses Paid During Period” to estimate the expenses you paid on your account during this period.
HYPOTHETICAL EXAMPLE FOR COMPARISON PURPOSES
The second line of the following table provides information about hypothetical account values and hypothetical expenses based on the Fund’s actual expense ratio and an assumed annual rate of return of 5% before expenses, which is not the Fund’s actual return. The hypothetical account values and expenses may not be used to estimate the actual ending account balance or expenses you paid for the period. You may use this information to compare the ongoing costs of investing in the Fund and other funds by comparing this 5% hypothetical example with the 5% hypothetical examples that appear in the shareholder reports of other funds.
Please note that the expenses shown in the table are meant to highlight your ongoing costs only and do not reflect any transactional costs, such as sales charges (loads), redemption fees, or exchange fees. Therefore, the second line of the table is useful in comparing ongoing costs only, and will not help you determine the relative total costs of owning different funds.
| | | | | | | | | | | | | | | | |
| Six Months Ended October 31, 2014 | | Expense
Ratio for
the Period | | | Beginning
Account Value
5/01/14 | | | Ending
Account Value
10/31/14 | | | Expenses
Paid During
the Period* | |
AMG FQ Tax-Managed U.S. Equity Fund | | | | | | | | | | | | | | | | |
Investor Class Shares | | | | | | | | | | | | | | | | |
Based on Actual Fund Return | | | 1.24 | % | | $ | 1,000 | | | $ | 1,069 | | | $ | 6.47 | |
Hypothetical (5% return before expenses) | | | 1.24 | % | | $ | 1,000 | | | $ | 1,019 | | | $ | 6.31 | |
Institutional Class Shares | | | | | | | | | | | | | | | | |
Based on Actual Fund Return | | | 0.99 | % | | $ | 1,000 | | | $ | 1,070 | | | $ | 5.17 | |
Hypothetical (5% return before expenses) | | | 0.99 | % | | $ | 1,000 | | | $ | 1,020 | | | $ | 5.04 | |
AMG FQ U.S. Equity Fund | | | | | | | | | | | | | | | | |
Investor Class Shares | | | | | | | | | | | | | | | | |
Based on Actual Fund Return | | | 1.04 | % | | $ | 1,000 | | | $ | 1,054 | | | $ | 5.38 | |
Hypothetical (5% return before expenses) | | | 1.04 | % | | $ | 1,000 | | | $ | 1,020 | | | $ | 5.30 | |
Institutional Class Shares | | | | | | | | | | | | | | | | |
Based on Actual Fund Return | | | 0.79 | % | | $ | 1,000 | | | $ | 1,056 | | | $ | 4.09 | |
Hypothetical (5% return before expenses) | | | 0.79 | % | | $ | 1,000 | | | $ | 1,021 | | | $ | 4.02 | |
AMG FQ Global Alternatives Fund | | | | | | | | | | | | | | | | |
Investor Class Shares | | | | | | | | | | | | | | | | |
Based on Actual Fund Return | | | 1.89 | % | | $ | 1,000 | | | $ | 1,000 | | | $ | 9.53 | |
Hypothetical (5% return before expenses) | | | 1.89 | % | | $ | 1,000 | | | $ | 1,016 | | | $ | 9.60 | |
Service Class Shares | | | | | | | | | | | | | | | | |
Based on Actual Fund Return | | | 1.58 | % | | $ | 1,000 | | | $ | 1,001 | | | $ | 7.97 | |
Hypothetical (5% return before expenses) | | | 1.58 | % | | $ | 1,000 | | | $ | 1,017 | | | $ | 8.03 | |
Institutional Class Shares | | | | | | | | | | | | | | | | |
Based on Actual Fund Return | | | 1.44 | % | | $ | 1,000 | | | $ | 1,002 | | | $ | 7.27 | |
Hypothetical (5% return before expenses) | | | 1.44 | % | | $ | 1,000 | | | $ | 1,017 | | | $ | 7.32 | |
AMG FQ Global Risk-Balanced Fund | | | | | | | | | | | | | | | | |
Investor Class Shares | | | | | | | | | | | | | | | | |
Based on Actual Fund Return | | | 1.39 | % | | $ | 1,000 | | | $ | 1,012 | | | $ | 7.05 | |
Hypothetical (5% return before expenses) | | | 1.39 | % | | $ | 1,000 | | | $ | 1,018 | | | $ | 7.07 | |
Service Class Shares | | | | | | | | | | | | | | | | |
Based on Actual Fund Return | | | 1.02 | % | | $ | 1,000 | | | $ | 1,015 | | | $ | 5.18 | |
Hypothetical (5% return before expenses) | | | 1.02 | % | | $ | 1,000 | | | $ | 1,020 | | | $ | 5.19 | |
Institutional Class Shares | | | | | | | | | | | | | | | | |
Based on Actual Fund Return | | | 0.89 | % | | $ | 1,000 | | | $ | 1,015 | | | $ | 4.52 | |
Hypothetical (5% return before expenses) | | | 0.89 | % | | $ | 1,000 | | | $ | 1,021 | | | $ | 4.53 | |
| * | Expenses are equal to the Fund’s annualized expense ratio multiplied by the average account value over the period, multiplied by the number of days in the most recent fiscal half-year (184), then divided by 365. |
3
AMG FQ Tax-Managed U.S. Equity Fund
Portfolio Manager’s Comments
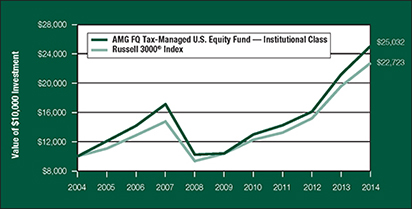
For the fiscal year ended October 31, 2014, the AMG FQ Tax-Managed U.S. Equity Fund (Institutional Class) returned 18.16%, compared to 16.07% for its benchmark, the Russell 3000®Index. Please refer to the table on page 5 or returns for various classes of shares.
U.S. equities continued their multi-year rally over the prior fiscal year as the equity bull market hit its fifth birthday with new market highs hit seemingly on a daily basis. Even periods of fear and pessimism, as experienced during late September and early October, were quickly erased with equities retracing losses. The impact of low short-and long-term interest rates continued to have their desired impact on risk-based assets, such as U.S. equities, although the U.S. Federal Reserve did end their explicit efforts to hold down long-term rates by winding down their quantitative easing program in October. For the entire one-year period ended October 31, 2014, larger-cap equities generally outperformed their smaller-cap brethren, with the Russell 1000® (large cap), Russell 2000® (small cap), Russell 3000® (all cap) and the Russell Microcap® indices returning 16.8%, 8.1%, 16.1%, and 7.3%, respectively.
The Fund delivered positive absolute returns for the prior fiscal year while outperforming the
benchmark Russell 3000® Index. Stock selection added value during the year, with gains primarily concentrated in the consumer discretionary, consumer staples and industrials sectors. Meanwhile, sector positioning relative to the benchmark was close to neutral throughout the year, consistent with the Fund’s investment process and, therefore, failed to add or detract significant value. Exposure to top-down factors offered mixed results relative to the benchmark throughout the year as well.
The Fund’s subadvisor, First Quadrant, L.P. (“First Quadrant”) maintains neutral positioning on both market capitalization and valuation entering the new fiscal year. The outlook for price momentum is more favorable than usual, however, and the Fund has an above average exposure. At the sector level, the Fund maintains modest overweights to the industrials and information technology sectors relative to the benchmark Russell 3000® Index but enters the new fiscal year with sector weightings broadly in-line with the benchmark. As a tax advantaged fund, the portfolio is managed to seek positive pre-tax and after-tax alpha. For this reason, First Quadrant employs tax-aware optimization which uses losses to offset gains as the portfolio is repositioned. Currently, most of the portfolio is locked up in gains; however, the Fund
continues to maintain a tax loss carry-forward, all of which is currently scheduled to expire in 2017.
This commentary reflects the viewpoints of the portfolio manager, First Quadrant, L.P., as of October 31, 2014 and is not intended as a forecast or guarantee of future results, and is subject to change without notice.
CUMULATIVE TOTAL RETURN PERFORMANCE
AMG FQ Tax-Managed U.S. Equity Fund’s cumulative total return is based on the daily change in net asset value (NAV), and assumes that all distributions were reinvested. This graph compares a hypothetical $10,000 investment made in the Institutional Class Shares of the Fund on October 31, 2004 with a $10,000 investment made in the Russell 3000® Index for the same time period. Performance for periods longer than one year is annualized. The graph and table do not reflect the deduction of taxes that a shareholder would pay on a Fund distribution or redemption of shares. The listed returns for the Fund are net of expenses and the returns for the index exclude expenses. Total returns would have been lower had certain expenses not been reduced.
4
AMG FQ Tax-Managed U.S. Equity Fund
Portfolio Manager’s Comments (continued)
CUMULATIVE TOTAL RETURN PERFORMANCE (continued)
The table below shows the average annual total returns for the AMG FQ Tax-Managed U.S. Equity Fund and the Russell 3000® Index for the same time periods ended October 31, 2014.
| | | | | | | | | | | | | | | | | | | | |
| Average Annual Total Returns1 | | One
Year | | | Five
Years | | | Ten
Years | | | Since
Inception | | | Inception
Date | |
AMG FQ Tax-Managed U.S. Equity Fund2,3 | | | | | |
Investor Class | | | 17.91 | % | | | 18.93 | % | | | — | | | | 7.42 | % | | | 03/01/06 | |
Institutional Class | | | 18.16 | % | | | 19.24 | % | | | 9.61 | % | | | 6.89 | % | | | 12/18/00 | |
Russell 3000® Index4 | | | 16.07 | % | | | 17.01 | % | | | 8.55 | % | | | 5.63 | % | | | 12/18/00 | † |
Return After Taxes on Distributions:5 | | | | | | | | | |
Investor Class | | | 17.88 | % | | | 18.89 | % | | | — | | | | 7.37 | % | | | 03/01/06 | |
Institutional Class | | | 18.07 | % | | | 19.15 | % | | | 9.51 | % | | | 6.80 | % | | | 12/18/00 | |
Return After Taxes on Distributions & Sale of Fund Shares:5 | | | | | |
Investor Class | | | 10.16 | % | | | 15.46 | % | | | — | | | | 5.98 | % | | | 03/01/06 | |
Institutional Class | | | 10.34 | % | | | 15.71 | % | | | 7.92 | % | | | 5.67 | % | | | 12/18/00 | |
The performance data shown represents past performance. Past performance is not a guarantee of future results. Current performance may be lower or higher than the performance data quoted. The investment return and principal value of an investment in the Fund will fluctuate so that an investor’s shares, when redeemed, may be worth more or less than their original cost.
Investors should carefully consider the Fund’s investment objectives, risks, charges, and expenses before investing. For performance information through the most recent month end, current net asset per share for the Fund and other information, please call (800) 835-3879 or visit our website at www.amgfunds.com for a free prospectus. Read it carefully before investing or sending money.
Distributed by AMG Distributors, Inc., member FINRA.
| † | Date reflects the inception date of the Fund, not the index. |
| 1 | Total return equals income yield plus share price change and assumes reinvestment of all dividends and capital gain distributions. Returns are net of fees and may reflect offsets of Fund expenses as described in the prospectus. No adjustment has been made for taxes payable by shareholders on their reinvested dividends and capital gain distributions. Returns for periods greater than one year are the average annual returns. The listed returns on the Fund are net of expenses and based on the published NAV as of October 31, 2014. All returns are in U.S. dollars ($). |
| 2 | From time to time, the Fund’s advisor has waived its fees and/or absorbed Fund expenses, which has resulted in higher returns. |
| 3 | The Fund invests in large-capitalization companies that may underperform other stock funds (such as funds that focus on small and medium capitalization companies) when stocks of large-capitalization companies are out of favor. Although the Fund is managed to minimize taxable distributions, it may not be able to avoid taxable distributions. |
| 4 | The Russell 3000® Index is composed of the 3,000 largest U.S. companies as measured by market capitalization, and represents approximately 98% of the U.S. stock market. Unlike the Fund, the Russell 3000® Index is unmanaged, is not available for investment, and does not incur expenses. |
| 5 | After-tax returns are calculated using the historical highest individual federal marginal income tax rates and do not reflect the impact of state and local taxes. Actual after-tax returns depend on an investor’s tax situation and may differ from those shown, and after-tax returns are not relevant to investors who hold their Fund shares through tax-deferred arrangements, such as 401(k) plans or individual retirement accounts. |
The Russell 3000® Index is a trademark of Russell Investments. Russell is a trademark of Russell Investments.
Not FDIC insured, nor bank guaranteed. May lose value.
5
AMG FQ Tax-Managed U.S. Equity Fund
Fund Snapshots (unaudited)
October 31, 2014
PORTFOLIO BREAKDOWN
| | | | | | | | |
Sector | | AMG FQ
Tax-Managed
U.S. Equity
Fund** | | | Russell 3000®
Index | |
Information Technology | | | 21.2 | % | | | 18.8 | % |
Financials | | | 14.4 | % | | | 17.7 | % |
Health Care | | | 14.1 | % | | | 14.0 | % |
Industrials | | | 12.2 | % | | | 11.3 | % |
Consumer Discretionary | | | 11.7 | % | | | 12.3 | % |
Energy | | | 8.8 | % | | | 8.4 | % |
Consumer Staples | | | 7.5 | % | | | 8.4 | % |
Materials | | | 3.5 | % | | | 3.7 | % |
Telecommunication Services | | | 2.7 | % | | | 2.2 | % |
Utilities | | | 1.8 | % | | | 3.2 | % |
Other Assets and Liabilities | | | 2.1 | % | | | 0.0 | % |
| ** | As a percentage of net assets. |
TOP TEN HOLDINGS
| | | | |
Security Name | | % of Net Assets | |
Apple, Inc.* | | | 3.7 | % |
Exxon Mobil Corp.* | | | 2.3 | |
Berkshire Hathaway, Inc., Class B* | | | 2.3 | |
Visa, Inc., Class A* | | | 2.1 | |
MasterCard, Inc., Class A* | | | 2.1 | |
DIRECTV* | | | 2.0 | |
Alaska Air Group, Inc.* | | | 1.9 | |
Chevron Corp.* | | | 1.8 | |
International Business Machines Corp.* | | | 1.8 | |
Pfizer, Inc. | | | 1.7 | |
| | | | |
Top Ten as a Group | | | 21.7 | % |
| | | | |
| * | Top Ten Holding at April 30, 2014. |
Because a fund’s strategy may result in multiple investments in particular sectors of the economy, its performance may depend on the performance of those sectors and may fluctuate more widely than investments diversified across more sectors. For additional information on these and other risk considerations, please see the Fund’s prospectus.
Any sectors, industries, or securities discussed should not be perceived as investment recommendations. Mention of a specific security should not be considered a recommendation to buy or solicitation to sell that security. Specific securities mentioned in this report may have been sold from the Fund’s portfolio of investments by the time you receive this report.
6
AMG FQ Tax-Managed U.S. Equity Fund
Schedule of Portfolio Investments
October 31, 2014
| | | | | | | | |
| | | Shares | | | Value | |
Common Stocks - 97.9% | | | | | | | | |
Consumer Discretionary - 11.7% | | | | | | | | |
1-800-Flowers.com, Inc., Class A* | | | 9,500 | | | $ | 76,285 | |
Bed Bath & Beyond, Inc.* | | | 3,400 | | | | 228,956 | |
Cablevision Systems Corp., Class A1 | | | 2,200 | | | | 40,964 | |
Dillard’s, Inc., Class A | | | 8,900 | | | | 941,264 | |
DIRECTV* | | | 14,800 | | | | 1,284,492 | |
Discovery Communications, Inc., Class A* | | | 1,400 | | | | 49,490 | |
Discovery Communications, Inc., Class C* | | | 1,400 | | | | 48,986 | |
The Gap, Inc. | | | 14,000 | | | | 530,460 | |
Jack in the Box, Inc. | | | 12,200 | | | | 866,688 | |
Lowe’s Cos., Inc. | | | 7,000 | | | | 400,400 | |
Macy’s, Inc. | | | 11,300 | | | | 653,366 | |
Marriott Vacations Worldwide Corp. | | | 9,100 | | | | 631,904 | |
Thor Industries, Inc. | | | 5,900 | | | | 312,051 | |
The TJX Cos., Inc. | | | 11,600 | | | | 734,512 | |
Twenty-First Century Fox, Inc., Class A | | | 1,000 | | | | 34,480 | |
Visteon Corp.* | | | 900 | | | | 84,510 | |
Wyndham Worldwide Corp. | | | 6,100 | | | | 473,787 | |
Total Consumer Discretionary | | | | | | | 7,392,595 | |
Consumer Staples - 7.5% | | | | | | | | |
Archer-Daniels-Midland Co. | | | 6,300 | | | | 296,100 | |
Cal-Maine Foods, Inc. | | | 2,900 | | | | 254,591 | |
Central Garden and Pet Co., Class A* | | | 17,000 | | | | 146,030 | |
CVS Health Corp. | | | 9,200 | | | | 789,452 | |
Dr Pepper Snapple Group, Inc. | | | 600 | | | | 41,550 | |
PepsiCo, Inc. | | | 2,300 | | | | 221,191 | |
Pilgrim’s Pride Corp.*,1 | | | 35,800 | | | | 1,017,078 | |
The Procter & Gamble Co. | | | 3,100 | | | | 270,537 | |
Sanderson Farms, Inc.1 | | | 6,400 | | | | 537,472 | |
Tyson Foods, Inc., Class A | | | 16,200 | | | | 653,670 | |
Wal-Mart Stores, Inc. | | | 6,500 | | | | 495,755 | |
Total Consumer Staples | | | | | | | 4,723,426 | |
Energy - 8.8% | | | | | | | | |
Adams Resources & Energy, Inc. | | | 1,000 | | | | 42,050 | |
Chevron Corp. | | | 9,400 | | | | 1,127,530 | |
ConocoPhillips | | | 10,800 | | | | 779,220 | |
Exxon Mobil Corp. | | | 15,200 | | | | 1,469,992 | |
Kosmos Energy, Ltd.* | | | 3,500 | | | | 32,655 | |
Marathon Petroleum Corp. | | | 6,200 | | | | 563,580 | |
Occidental Petroleum Corp. | | | 3,500 | | | | 311,255 | |
| | | | | | | | |
| | | Shares | | | Value | |
Phillips 66 | | | 4,600 | | | $ | 361,100 | |
REX American Resources Corp.* | | | 5,700 | | | | 414,732 | |
Schlumberger, Ltd. | | | 2,900 | | | | 286,114 | |
VAALCO Energy, Inc.* | | | 24,400 | | | | 181,048 | |
Total Energy | | | | | | | 5,569,276 | |
Financials - 14.4% | | | | | | | | |
American Financial Group, Inc. | | | 1,800 | | | | 107,694 | |
American International Group, Inc. | | | 4,900 | | | | 262,493 | |
American Tower Corp. | | | 800 | | | | 78,000 | |
Arch Capital Group, Ltd.* | | | 11,700 | | | | 658,944 | |
Aspen Insurance Holdings, Ltd. | | | 1,200 | | | | 52,356 | |
Bank of America Corp. | | | 22,500 | | | | 386,100 | |
Berkshire Hathaway, Inc., Class A* | | | 1 | | | | 210,000 | |
Berkshire Hathaway, Inc., Class B* | | | 10,287 | | | | 1,441,826 | |
BOK Financial Corp. | | | 2,400 | | | | 164,544 | |
The Chubb Corp. | | | 2,200 | | | | 218,592 | |
Citigroup, Inc. | | | 3,600 | | | | 192,708 | |
Crawford & Co., Class B | | | 6,000 | | | | 61,080 | |
Discover Financial Services | | | 10,500 | | | | 669,690 | |
Everest Re Group, Ltd. | | | 3,300 | | | | 563,145 | |
FelCor Lodging Trust, Inc. | | | 7,300 | | | | 78,329 | |
First Bancorp | | | 1,900 | | | | 34,428 | |
First Interstate BancSystem, Inc., Class A | | | 6,700 | | | | 196,578 | |
Franklin Resources, Inc. | | | 1,800 | | | | 100,098 | |
GAMCO Investors, Inc., Class A | | | 7,000 | | | | 578,340 | |
JPMorgan Chase & Co. | | | 4,600 | | | | 278,208 | |
KeyCorp | | | 25,800 | | | | 340,560 | |
MidSouth Bancorp, Inc. | | | 1,800 | | | | 34,092 | |
Montpelier Re Holdings, Ltd. | | | 4,400 | | | | 145,816 | |
Morgan Stanley | | | 18,900 | | | | 660,555 | |
OFG Bancorp | | | 4,100 | | | | 63,837 | |
The PNC Financial Services Group, Inc. | | | 800 | | | | 69,112 | |
PrivateBancorp, Inc. | | | 15,300 | | | | 494,496 | |
Pzena Investment Management, Inc., Class A | | | 7,300 | | | | 73,365 | |
SunTrust Banks, Inc. | | | 15,800 | | | | 618,412 | |
The Travelers Cos., Inc. | | | 1,000 | | | | 100,800 | |
Wells Fargo & Co. | | | 3,400 | | | | 180,506 | |
Total Financials | | | | | | | 9,114,704 | |
Health Care - 14.1% | | | | | | | | |
Alliance HealthCare Services, Inc.* | | | 3,500 | | | | 84,455 | |
The accompanying notes are an integral part of these financial statements.
7
AMG FQ Tax-Managed U.S. Equity Fund
Schedule of Portfolio Investments (continued)
| | | | | | | | |
| | | Shares | | | Value | |
Health Care - 14.1% (continued) | | | | | | | | |
Amgen, Inc. | | | 6,300 | | | $ | 1,021,734 | |
Anika Therapeutics, Inc.* | | | 9,800 | | | | 393,372 | |
Atrion Corp. | | | 251 | | | | 82,833 | |
Becton, Dickinson and Co. | | | 1,800 | | | | 231,660 | |
Biogen Idec, Inc.* | | | 2,430 | | | | 780,224 | |
CareFusion Corp.* | | | 13,900 | | | | 797,443 | |
Depomed, Inc.* | | | 3,400 | | | | 52,360 | |
Edwards Lifesciences Corp.* | | | 2,500 | | | | 302,300 | |
Exactech, Inc.* | | | 4,000 | | | | 85,200 | |
Gilead Sciences, Inc.* | | | 1,800 | | | | 201,600 | |
HealthSouth Corp. | | | 900 | | | | 36,297 | |
Humana, Inc. | | | 1,800 | | | | 249,930 | |
Johnson & Johnson | | | 4,600 | | | | 495,788 | |
Lannett Co., Inc.* | | | 8,900 | | | | 504,808 | |
McKesson Corp. | | | 1,600 | | | | 325,456 | |
Medtronic, Inc. | | | 1,500 | | | | 102,240 | |
Merck & Co., Inc. | | | 700 | | | | 40,558 | |
PAREXEL International Corp.* | | | 2,500 | | | | 135,775 | |
Pfizer, Inc. | | | 36,700 | | | | 1,099,165 | |
SurModics, Inc.* | | | 13,600 | | | | 294,440 | |
UnitedHealth Group, Inc. | | | 10,100 | | | | 959,601 | |
Universal Health Services, Inc., Class B | | | 5,800 | | | | 601,518 | |
WellPoint, Inc. | | | 300 | | | | 38,007 | |
Total Health Care | | | | | | | 8,916,764 | |
Industrials - 12.2% | | | | | | | | |
Alaska Air Group, Inc. | | | 22,400 | | | | 1,192,352 | |
AMERCO | | | 1,400 | | | | 379,568 | |
Argan, Inc. | | | 1,800 | | | | 62,658 | |
Delta Air Lines, Inc. | | | 20,650 | | | | 830,749 | |
Deluxe Corp. | | | 10,300 | | | | 626,240 | |
FedEx Corp. | | | 700 | | | | 117,180 | |
General Dynamics Corp. | | | 5,900 | | | | 824,584 | |
General Electric Co. | | | 16,800 | | | | 433,608 | |
Huntington Ingalls Industries, Inc. | | | 5,900 | | | | 624,338 | |
Kimball International, Inc., Class B | | | 4,300 | | | | 77,314 | |
Multi-Color Corp. | | | 900 | | | | 44,370 | |
Oshkosh Corp. | | | 1,700 | | | | 76,092 | |
Southwest Airlines Co. | | | 4,500 | | | | 155,160 | |
Teledyne Technologies, Inc.* | | | 4,700 | | | | 487,061 | |
UniFirst Corp. | | | 5,000 | | | | 557,800 | |
| | | | | | | | |
| | | Shares | | | Value | |
Union Pacific Corp. | | | 7,600 | | | $ | 885,020 | |
United Technologies Corp. | | | 1,400 | | | | 149,800 | |
VSE Corp. | | | 3,100 | | | | 186,868 | |
Total Industrials | | | | | | | 7,710,762 | |
Information Technology - 21.2% | | | | | | | | |
Advanced Energy Industries, Inc.* | | | 2,700 | | | | 53,406 | |
Apple, Inc. | | | 21,641 | | | | 2,337,228 | |
Aspen Technology, Inc.* | | | 13,200 | | | | 487,476 | |
Benchmark Electronics, Inc.* | | | 17,000 | | | | 403,240 | |
Brocade Communications Systems, Inc. | | | 26,600 | | | | 285,418 | |
Cisco Systems, Inc. | | | 6,300 | | | | 154,161 | |
EMC Corp. | | | 2,800 | | | | 80,444 | |
Google, Inc., Class A* | | | 301 | | | | 170,929 | |
Google, Inc., Class C* | | | 301 | | | | 168,283 | |
Harris Corp. | | | 600 | | | | 41,760 | |
Hewlett-Packard Co. | | | 22,500 | | | | 807,300 | |
Insight Enterprises, Inc.* | | | 8,400 | | | | 191,100 | |
International Business Machines Corp. | | | 6,800 | | | | 1,117,920 | |
Lattice Semiconductor Corp.* | | | 14,600 | | | | 97,966 | |
MasterCard, Inc., Class A | | | 15,580 | | | | 1,304,825 | |
Microsoft Corp. | | | 22,700 | | | | 1,065,765 | |
NetScout Systems, Inc.* | | | 4,400 | | | | 162,184 | |
Oracle Corp. | | | 24,900 | | | | 972,345 | |
PC Connection, Inc. | | | 6,900 | | | | 164,565 | |
Progress Software Corp.* | | | 2,200 | | | | 56,980 | |
QUALCOMM, Inc. | | | 7,300 | | | | 573,123 | |
Sanmina Corp.* | | | 2,200 | | | | 55,154 | |
Skyworks Solutions, Inc. | | | 10,400 | | | | 605,696 | |
VASCO Data Security International, Inc.* | | | 17,600 | | | | 445,632 | |
Visa, Inc., Class A | | | 5,600 | | | | 1,352,008 | |
Xerox Corp. | | | 20,900 | | | | 277,552 | |
Total Information Technology | | | | | | | 13,432,460 | |
Materials - 3.5% | | | | | | | | |
CF Industries Holdings, Inc. | | | 2,005 | | | | 521,300 | |
Graphic Packaging Holding Co.* | | | 25,300 | | | | 306,889 | |
KapStone Paper and Packaging Corp.* | | | 2,100 | | | | 64,596 | |
LyondellBasell Industries N.V., Class A | | | 8,100 | | | | 742,203 | |
United States Steel Corp.1 | | | 3,600 | | | | 144,144 | |
Westlake Chemical Corp. | | | 6,200 | | | | 437,410 | |
Total Materials | | | | | | | 2,216,542 | |
The accompanying notes are an integral part of these financial statements.
8
AMG FQ Tax-Managed U.S. Equity Fund
Schedule of Portfolio Investments (continued)
| | | | | | | | |
| | | Shares | | | Value | |
Telecommunication
Services - 2.7% | | | | | | | | |
AT&T, Inc. | | | 17,600 | | | $ | 613,184 | |
Cincinnati Bell, Inc.* | | | 121,000 | | | | 444,070 | |
Spok Holdings, Inc. | | | 4,000 | | | | 64,960 | |
T-Mobile US, Inc.* | | | 1,850 | | | | 54,001 | |
Verizon Communications, Inc. | | | 9,400 | | | | 472,350 | |
Windstream Holdings, Inc. | | | 5,700 | | | | 59,736 | |
Total Telecommunication Services | | | | | | | 1,708,301 | |
Utilities - 1.8% | | | | | | | | |
AES Corp. | | | 27,000 | | | | 379,890 | |
American Electric Power Co., Inc. | | | 4,400 | | | | 256,696 | |
Ormat Technologies, Inc. | | | 1,100 | | | | 31,845 | |
The Southern Co. | | | 9,100 | | | | 421,876 | |
UGI Corp. | | | 900 | | | | 33,921 | |
Total Utilities | | | | | | | 1,124,228 | |
Total Common Stocks
(cost $41,238,953) | | | | | | | 61,909,058 | |
| | | | | | | | |
| | | Principal Amount | | | Value | |
Short-Term Investments - 4.0% | | | | | | | | |
Repurchase
Agreements - 2.1%2 | | | | | | | | |
Cantor Fitzgerald Securities, Inc., dated 10/31/14, due 11/03/14, 0.130%, total to be received $1,000,011 (collateralized by various U.S. Government Agency Obligations, 0.000% - 10.500%, 01/01/15 - 09/20/64, totaling $1,020,000) | | $ | 1,000,000 | | | $ | 1,000,000 | |
Nomura Securities International, Inc., dated 10/31/14, due 11/03/14, 0.110%, total to be received $285,540 (collateralized by various U.S. Government Agency Obligations, 0.000% - 7.250%, 11/03/14 -11/01/44 totaling $291,248) | | | 285,537 | | | | 285,537 | |
Total Repurchase Agreements | | | | | | | 1,285,537 | |
| | |
| | | Shares | | | | |
Other Investment Companies - 1.9%3 | | | | | | | | |
Dreyfus Institutional Cash Advantage Fund, Institutional Class Shares, 0.06% | | | 1,204,064 | | | | 1,204,064 | |
Total Short-Term Investments
(cost $2,489,601) | | | | | | | 2,489,601 | |
Total Investments - 101.9%
(cost $43,728,554) | | | | | | | 64,398,659 | |
Other Assets, less
Liabilities - (1.9)% | | | | | | | (1,172,170 | ) |
Net Assets - 100.0% | | | | | | $ | 63,226,489 | |
The accompanying notes are an integral part of these financial statements.
9
AMG FQ U.S. Equity Fund
Portfolio Manager’s Comments
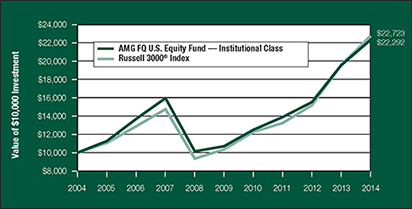
For the fiscal year ended October 31, 2014, the AMG FQ U.S. Equity Fund (Institutional Class) returned 14.05%, compared to 16.07% for its benchmark, the Russell 3000® Index. Please refer to the table on page 11 for returns for various classes of shares.
U.S. equities continued their multi-year rally over the prior fiscal year as the equity bull market hit its fifth birthday with new market highs hit seemingly on a daily basis. Even periods of fear and pessimism, as experienced during late September and early October, were quickly erased with equities retracing losses. The impact of low short-and long-term interest rates continued to have their desired impact on risk-based assets, such as U.S. equities, although the U.S. Federal Reserve did end their explicit efforts to hold down long-term rates by winding down their quantitative easing program in October. For the entire one-year period ended October 31, 2014, larger-cap equities generally outperformed their smaller-cap brethren with the Russell 1000® (large cap), Russell 2000® (small cap), Russell 3000® (all cap), and the Russell Microcap® indices returning 16.8%, 8.1%, 16.1%, and 7.3%, respectively.
The Fund delivered strong positive absolute returns for the prior fiscal year but trailed the
benchmark during this time. The Fund detracted value from both the equity-only portion of its portfolio as well as from its put-spread collar options (protection strategy) positions. Stock selection weakness within the health care and information technology sectors detracted from performance throughout the year, although the Fund did benefit from strong selection within the industrials sector. Meanwhile, sector positioning relative to the benchmark was close to neutral throughout the year, consistent with the Fund’s investment process and, therefore, failed to add or detract significant value. Exposure to top-down factors offered mixed results relative to the benchmark throughout the year. The Fund’s protection strategy, as expected, detracted from performance, as equity markets generally moved upward during this period.
The Fund’s subadvisor, First Quadrant, L.P. (“First Quadrant”) maintains neutral positioning on both market capitalization and valuation entering the new fiscal year. The outlook for price momentum is more favorable than usual, however, and the Fund has an above average exposure. At the sector level, the Fund maintains modest overweights to the financials and industrials sectors relative to the benchmark Russell 3000® Index, but enters the
new fiscal year with sector weightings broadly in-line with the benchmark.
This commentary reflects the viewpoints of the portfolio manager, First Quadrant, L.P., as of October 31, 2014 and is not intended as a forecast or guarantee of future results, and is subject to change without notice.
CUMULATIVE TOTAL RETURN PERFORMANCE
AMG FQ U.S. Equity Fund’s cumulative total return is based on the daily change in net asset value (NAV), and assumes that all distributions were reinvested. This graph compares a hypothetical $10,000 investment made in the Institutional Class Shares of the Fund on October 31, 2004 with a $10,000 investment made in the Russell 3000® Index for the same time period. Performance for periods longer than one year is annualized. The graph and table do not reflect the deduction of taxes that a shareholder would pay on a Fund distribution or redemption of shares. The listed returns for the Fund are net of expenses and the returns for the index exclude expenses. Total returns would have been lower had certain expenses not been reduced.
10
AMG FQ U.S. Equity Fund
Portfolio Manager’s Comments (continued)
CUMULATIVE TOTAL RETURN PERFORMANCE (continued)
The table below shows the average annual total returns for the AMG FQ U.S. Equity Fund and the Russell 3000® Index for the same time periods ended October 31, 2014.
| | | | | | | | | | | | | | | | | | | | |
| Average Annual Total Returns1 | | One
Year | | | Five
Years | | | Ten
Years | | | Since
Inception | | | Inception
Date | |
AMG FQ U.S. Equity Fund2,3 | | | | | | | | | | | | | | | | | | | | |
Investor Class | | | 13.76 | % | | | 15.52 | % | | | — | | | | 6.69 | % | | | 03/01/06 | |
Institutional Class | | | 14.05 | % | | | 15.82 | % | | | 8.35 | % | | | 8.46 | % | | | 08/14/92 | |
Russell 3000® Index4,5 | | | 16.07 | % | | | 17.01 | % | | | 8.55 | % | | | 9.65 | % | | | 08/14/92 | |
The performance data shown represents past performance. Past performance is not a guarantee of future results. Current performance may be lower or higher than the performance data quoted. The investment return and principal value of an investment in the Fund will fluctuate so that an investor’s shares, when redeemed, may be worth more or less than their original cost.
Investors should carefully consider the Fund’s investment objectives, risks, charges and expenses before investing. For performance information through the most recent month end, current net asset values per share for the Fund and other information, please call (800) 835-3879 or visit our website at www.amgfunds.com for a free prospectus. Read it carefully before investing or sending money.
Distributed by AMG Distributors, Inc., member FINRA.
| 1 | Total return equals income yield plus share price change and assumes reinvestment of all dividends and capital gain distributions. Returns are net of fees and may reflect offsets of Fund expenses as described in the prospectus. No adjustment has been made for taxes payable by shareholders on their reinvested dividends and capital gain distributions. Returns for periods greater than one year are the average annual returns. The listed returns on the Fund are net of expenses and based on the published NAV as of October 31, 2014. All returns are in U.S. dollars ($). |
| 2 | From time to time, the Fund’s advisor has waived its fees and/or absorbed Fund expenses, which has resulted in higher returns. |
| 3 | The Fund invests in large-capitalization companies that may underperform other stock funds (such as funds that focus on small and medium capitalization companies) when stocks of large-capitalization companies are out of favor. Also, the Fund may invest in derivatives; the complexity and rapidly changing structure of derivatives markets may increase the possibility of market losses. |
| 4 | The Russell 3000® Index is composed of the 3,000 largest U.S. companies as measured by market capitalization, and represents approximately 98% of the U.S. stock market. Unlike the Fund, the Russell 3000® Index is unmanaged, is not available for investment, and does not incur expenses. |
| 5 | The date reflects the inception date of the Fund, not the index. |
The Russell 3000® Index is a trademark of Russell Investments. Russell is a trademark of Russell Investments.
Not FDIC insured, nor bank guaranteed. May lose value.
11
AMG FQ U.S. Equity Fund
Fund Snapshots (unaudited)
October 31, 2014
PORTFOLIO BREAKDOWN
| | | | | | | | |
Sector | | AMG FQ U.S.
Equity
Fund** | | | Russell 3000®
Index | |
Information Technology | | | 19.0 | % | | | 18.8 | % |
Financials | | | 17.8 | % | | | 17.7 | % |
Health Care | | | 14.4 | % | | | 14.0 | % |
Consumer Discretionary | | | 12.8 | % | | | 12.3 | % |
Industrials | | | 10.6 | % | | | 11.3 | % |
Energy | | | 8.9 | % | | | 8.4 | % |
Consumer Staples | | | 8.3 | % | | | 8.4 | % |
Materials | | | 3.8 | % | | | 3.7 | % |
Telecommunication Services | | | 3.5 | % | | | 2.2 | % |
Utilities | | | 1.4 | % | | | 3.2 | % |
Other Assets and Liabilities | | | (0.5 | )% | | | 0.0 | % |
| ** | As a percentage of net assets. |
TOP TEN HOLDINGS
| | | | |
Security Name | | % of Net Assets | |
Exxon Mobil Corp.* | | | 2.7 | % |
Johnson & Johnson | | | 2.5 | |
Apple, Inc.* | | | 2.5 | |
Microsoft Corp.* | | | 2.4 | |
Berkshire Hathaway, Inc., Class B* | | | 2.3 | |
Pfizer, Inc.* | | | 2.0 | |
Bank of America Corp.* | | | 2.0 | |
AT&T, Inc.* | | | 1.8 | |
QUALCOMM, Inc.* | | | 1.8 | |
Merck & Co., Inc. | | | 1.7 | |
| | | | |
Top Ten as a Group | | | 21.7 | % |
| | | | |
| * | Top Ten Holding at April 30, 2014. |
Because a fund’s strategy may result in multiple investments in particular sectors of the economy, its performance may depend on the performance of those sectors and may fluctuate more widely than investments diversified across more sectors. For additional information on these and other risk considerations, please see the Fund’s prospectus.
Any sectors, industries, or securities discussed should not be perceived as investment recommendations. Mention of a specific security should not be considered a recommendation to buy or solicitation to sell that security. Specific securities mentioned in this report may have been sold from the Fund’s portfolio of investments by the time you receive this report.
12
AMG FQ U.S. Equity Fund
Schedule of Portfolio Investments
October 31, 2014
| | | | | | | | |
| | | Shares | | | Value | |
Common Stocks - 100.5% | | | | | | | | |
Consumer Discretionary - 12.8% | | | | | | | | |
Comcast Corp., Class A | | | 21,100 | | | $ | 1,167,885 | |
DIRECTV* | | | 5,700 | | | | 494,703 | |
Domino’s Pizza, Inc. | | | 7,900 | | | | 701,441 | |
Expedia, Inc. | | | 8,800 | | | | 747,736 | |
Foot Locker, Inc. | | | 6,400 | | | | 358,464 | |
The Gap, Inc. | | | 15,100 | | | | 572,139 | |
The Home Depot, Inc.4 | | | 9,100 | | | | 887,432 | |
Las Vegas Sands Corp. | | | 9,100 | | | | 566,566 | |
Macy’s, Inc. | | | 10,600 | | | | 612,892 | |
The McClatchy Co., Class A* | | | 23,400 | | | | 83,304 | |
PetMed Express, Inc.1 | | | 2,800 | | | | 36,988 | |
Pool Corp. | | | 1,000 | | | | 59,700 | |
Scripps Networks Interactive, Inc., Class A | | | 2,300 | | | | 177,652 | |
Thor Industries, Inc. | | | 5,000 | | | | 264,450 | |
TripAdvisor, Inc.* | | | 700 | | | | 62,062 | |
Twenty-First Century Fox, Inc., Class A | | | 20,600 | | | | 710,288 | |
The Walt Disney Co. | | | 4,500 | | | | 411,210 | |
Wyndham Worldwide Corp. | | | 9,700 | | | | 753,399 | |
Total Consumer Discretionary | | | | | | | 8,668,311 | |
Consumer Staples - 8.3% | | | | | | | | |
Archer-Daniels-Midland Co. | | | 17,300 | | | | 813,100 | |
Brown-Forman Corp., Class B | | | 450 | | | | 41,702 | |
Cal-Maine Foods, Inc.1 | | | 700 | | | | 61,453 | |
Central Garden and Pet Co., Class A* | | | 17,000 | | | | 146,030 | |
Church & Dwight Co., Inc. | | | 600 | | | | 43,446 | |
The Clorox Co. | | | 500 | | | | 49,750 | |
Costco Wholesale Corp. | | | 500 | | | | 66,685 | |
CVS Health Corp. | | | 5,700 | | | | 489,117 | |
Dr Pepper Snapple Group, Inc. | | | 10,100 | | | | 699,425 | |
The Kroger Co. | | | 900 | | | | 50,139 | |
PepsiCo, Inc. | | | 10,500 | | | | 1,009,785 | |
Pilgrim’s Pride Corp.*,1 | | | 23,800 | | | | 676,158 | |
The Procter & Gamble Co.4 | | | 6,200 | | | | 541,074 | |
Sanderson Farms, Inc.1 | | | 1,900 | | | | 159,562 | |
Tyson Foods, Inc., Class A4 | | | 14,800 | | | | 597,180 | |
Wal-Mart Stores, Inc. | | | 1,100 | | | | 83,897 | |
WD-40 Co. | | | 600 | | | | 46,002 | |
Total Consumer Staples | | | | | | | 5,574,505 | |
| | | | | | | | |
| | | Shares | | | Value | |
Energy - 8.9% | | | | | | | | |
Chevron Corp.4 | | | 2,600 | | | $ | 311,870 | |
ConocoPhillips4 | | | 12,900 | | | | 930,735 | |
Exxon Mobil Corp.4 | | | 18,900 | | | | 1,827,819 | |
Helix Energy Solutions Group, Inc.* | | | 11,800 | | | | 314,352 | |
Marathon Petroleum Corp. | | | 9,200 | | | | 836,280 | |
Occidental Petroleum Corp.4 | | | 3,000 | | | | 266,790 | |
Phillips 66 | | | 800 | | | | 62,800 | |
Schlumberger, Ltd. | | | 11,800 | | | | 1,164,188 | |
Valero Energy Corp. | | | 5,300 | | | | 265,477 | |
Total Energy | | | | | | | 5,980,311 | |
Financials - 17.8% | | | | | | | | |
1st Source Corp. | | | 4,800 | | | | 150,192 | |
Aflac, Inc. | | | 6,200 | | | | 370,326 | |
Alexander’s, Inc. | | | 200 | | | | 88,400 | |
The Allstate Corp. | | | 7,900 | | | | 512,315 | |
Altisource Portfolio Solutions, S.A.*,1 | | | 800 | | | | 59,728 | |
American Capital Agency Corp. | | | 3,400 | | | | 77,316 | |
American Express Co.4 | | | 8,400 | | | | 755,580 | |
AmTrust Financial Services, Inc. | | | 3,900 | | | | 174,993 | |
Aspen Insurance Holdings, Ltd. | | | 16,400 | | | | 715,532 | |
AvalonBay Communities, Inc. | | | 400 | | | | 62,336 | |
Bank of America Corp.4 | | | 77,800 | | | | 1,335,048 | |
Berkshire Hathaway, Inc., Class B*,4 | | | 11,300 | | | | 1,583,808 | |
Central Pacific Financial Corp. | | | 2,400 | | | | 45,360 | |
The Chubb Corp. | | | 1,900 | | | | 188,784 | |
Discover Financial Services | | | 1,300 | | | | 82,914 | |
Eagle Bancorp, Inc.* | | | 1,500 | | | | 53,895 | |
Everest Re Group, Ltd. | | | 900 | | | | 153,585 | |
FelCor Lodging Trust, Inc. | | | 6,900 | | | | 74,037 | |
Franklin Resources, Inc. | | | 5,000 | | | | 278,050 | |
GAMCO Investors, Inc., Class A | | | 3,800 | | | | 313,956 | |
The Geo Group, Inc. | | | 1,400 | | | | 55,916 | |
Health Care REIT, Inc. | | | 700 | | | | 49,777 | |
Host Hotels & Resorts, Inc. | | | 2,900 | | | | 67,599 | |
International Bancshares Corp. | | | 5,200 | | | | 147,524 | |
Janus Capital Group, Inc.1 | | | 6,100 | | | | 91,439 | |
JPMorgan Chase & Co.4 | | | 18,200 | | | | 1,100,736 | |
Lazard, Ltd., Class A | | | 6,300 | | | | 310,023 | |
Morgan Stanley | | | 4,000 | | | | 139,800 | |
The accompanying notes are an integral part of these financial statements.
13
AMG FQ U.S. Equity Fund
Schedule of Portfolio Investments (continued)
| | | | | | | | |
| | | Shares | | | Value | |
Financials - 17.8% (continued) | | | | | | | | |
PartnerRe, Ltd. | | | 900 | | | $ | 104,121 | |
Potlatch Corp. | | | 12,300 | | | | 541,077 | |
PrivateBancorp, Inc. | | | 8,800 | | | | 284,416 | |
SunTrust Banks, Inc. | | | 8,300 | | | | 324,862 | |
The Travelers Cos., Inc. | | | 2,900 | | | | 292,320 | |
Universal Insurance Holdings, Inc. | | | 5,400 | | | | 94,500 | |
Waddell & Reed Financial, Inc., Class A | | | 3,300 | | | | 157,542 | |
Washington Federal, Inc. | | | 1,900 | | | | 41,477 | |
Wells Fargo & Co.4 | | | 20,900 | | | | 1,109,581 | |
Total Financials | | | | | | | 11,988,865 | |
Health Care - 14.4% | | | | | | | | |
Aetna, Inc. | | | 1,500 | | | | 123,765 | |
Alliance HealthCare Services, Inc.* | | | 4,700 | | | | 113,411 | |
Amsurg Corp.* | | | 2,200 | | | | 118,822 | |
Biogen Idec, Inc.* | | | 2,100 | | | | 674,268 | |
CR Bard, Inc. | | | 4,700 | | | | 770,659 | |
Edwards Lifesciences Corp.* | | | 7,900 | | | | 955,268 | |
The Ensign Group, Inc. | | | 1,500 | | | | 58,080 | |
Express Scripts Holding Co.* | | | 900 | | | | 69,138 | |
Gilead Sciences, Inc.* | | | 7,900 | | | | 884,800 | |
Greatbatch, Inc.* | | | 1,400 | | | | 70,266 | |
Johnson & Johnson4 | | | 15,700 | | | | 1,692,146 | |
Ligand Pharmaceuticals, Inc.* | | | 5,400 | | | | 298,458 | |
Merck & Co., Inc. | | | 20,300 | | | | 1,176,182 | |
Natus Medical, Inc.* | | | 2,300 | | | | 78,200 | |
PAREXEL International Corp.* | | | 1,900 | | | | 103,189 | |
Pfizer, Inc.4 | | | 45,300 | | | | 1,356,735 | |
St Jude Medical, Inc. | | | 600 | | | | 38,502 | |
Thoratec Corp.* | | | 2,300 | | | | 62,514 | |
UnitedHealth Group, Inc.4 | | | 4,500 | | | | 427,545 | |
Universal Health Services, Inc., Class B | | | 1,100 | | | | 114,081 | |
WellPoint, Inc. | | | 3,600 | | | | 456,084 | |
Zimmer Holdings, Inc. | | | 600 | | | | 66,744 | |
Total Health Care | | | | | | | 9,708,857 | |
Industrials - 10.6% | | | | | | | | |
Delta Air Lines, Inc. | | | 19,400 | | | | 780,462 | |
Deluxe Corp. | | | 12,700 | | | | 772,160 | |
Emerson Electric Co. | | | 600 | | | | 38,436 | |
FedEx Corp. | | | 300 | | | | 50,220 | |
Fluor Corp. | | | 1,200 | | | | 79,608 | |
| | | | | | | | |
| | | Shares | | | Value | |
General Dynamics Corp. | | | 6,400 | | | $ | 894,464 | |
General Electric Co. | | | 2,500 | | | | 64,525 | |
Huntington Ingalls Industries, Inc. | | | 5,400 | | | | 571,428 | |
Hyster-Yale Materials Handling, Inc. | | | 600 | | | | 47,094 | |
Lockheed Martin Corp.4 | | | 5,600 | | | | 1,067,192 | |
Northrop Grumman Corp.4 | | | 4,700 | | | | 648,412 | |
Parker Hannifin Corp. | | | 300 | | | | 38,109 | |
RR Donnelley & Sons Co. | | | 2,972 | | | | 51,858 | |
Southwest Airlines Co. | | | 27,800 | | | | 958,544 | |
UniFirst Corp. | | | 800 | | | | 89,248 | |
Union Pacific Corp.4 | | | 7,800 | | | | 908,310 | |
United Parcel Service, Inc., Class B | | | 700 | | | | 73,437 | |
WABCO Holdings, Inc.* | | | 500 | | | | 48,690 | |
Total Industrials | | | | | | | 7,182,197 | |
Information Technology - 19.0% | | | | | | | | |
Advanced Energy Industries, Inc.* | | | 9,400 | | | | 185,932 | |
Apple, Inc.4 | | | 15,407 | | | | 1,663,956 | |
Aspen Technology, Inc.* | | | 5,100 | | | | 188,343 | |
Benchmark Electronics, Inc.* | | | 23,400 | | | | 555,048 | |
Brocade Communications Systems, Inc. | | | 26,500 | | | | 284,345 | |
Cisco Systems, Inc.4 | | | 9,200 | | | | 225,124 | |
eBay, Inc.* | | | 4,400 | | | | 231,000 | |
Facebook, Inc., Class A* | | | 2,600 | | | | 194,974 | |
Fairchild Semiconductor International, Inc.* | | | 4,700 | | | | 72,145 | |
Google, Inc., Class A*,4 | | | 882 | | | | 500,861 | |
Google, Inc., Class C*,4 | | | 782 | | | | 437,201 | |
Harris Corp. | | | 11,100 | | | | 772,560 | |
Hewlett-Packard Co. | | | 26,800 | | | | 961,584 | |
Insight Enterprises, Inc.* | | | 2,800 | | | | 63,700 | |
Integrated Device Technology, Inc.* | | | 15,500 | | | | 254,355 | |
Intel Corp. | | | 6,500 | | | | 221,065 | |
Marchex, Inc., Class B | | | 14,500 | | | | 55,535 | |
Microsoft Corp.4 | | | 34,400 | | | | 1,615,080 | |
Oracle Corp.4 | | | 16,200 | | | | 632,610 | |
Progress Software Corp.* | | | 5,600 | | | | 145,040 | |
QUALCOMM, Inc.4 | | | 15,100 | | | | 1,185,501 | |
Skyworks Solutions, Inc. | | | 13,500 | | | | 786,240 | |
Synopsys, Inc.* | | | 7,400 | | | | 303,252 | |
Texas Instruments, Inc. | | | 2,700 | | | | 134,082 | |
Visa, Inc., Class A | | | 2,700 | | | | 651,861 | |
WebMD Health Corp.*,1 | | | 1,700 | | | | 72,556 | |
The accompanying notes are an integral part of these financial statements.
14
AMG FQ U.S. Equity Fund
Schedule of Portfolio Investments (continued)
| | | | | | | | |
| | | Shares | | | Value | |
Information Technology - 19.0% (continued) | | | | | | | | |
Western Digital Corp. | | | 3,000 | | | $ | 295,110 | |
Xerox Corp. | | | 12,800 | | | | 169,984 | |
Total Information Technology | | | | | | | 12,859,044 | |
Materials - 3.8% | | | | | | | | |
Avery Dennison Corp. | | | 1,400 | | | | 65,590 | |
Celanese Corp., Series A | | | 9,300 | | | | 546,189 | |
CF Industries Holdings, Inc. | | | 200 | | | | 52,000 | |
Clearwater Paper Corp.* | | | 3,300 | | | | 212,355 | |
E.I. du Pont de Nemours & Co. | | | 1,300 | | | | 89,895 | |
LyondellBasell Industries N.V., Class A | | | 9,100 | | | | 833,833 | |
Monsanto Co. | | | 500 | | | | 57,520 | |
Schweitzer-Mauduit International, Inc. | | | 900 | | | | 38,754 | |
United States Steel Corp.1 | | | 5,000 | | | | 200,200 | |
Worthington Industries, Inc. | | | 12,000 | | | | 463,800 | |
Total Materials | | | | | | | 2,560,136 | |
Telecommunication Services - 3.5% | | | | | | | | |
AT&T, Inc.4 | | | 35,100 | | | | 1,222,884 | |
Cincinnati Bell, Inc.* | | | 65,600 | | | | 240,752 | |
Frontier Communications Corp. | | | 39,900 | | | | 260,946 | |
Inteliquent, Inc. | | | 4,600 | | | | 77,418 | |
United States Cellular Corp.* | | | 1,500 | | | | 54,630 | |
Verizon Communications, Inc. | | | 10,700 | | | | 537,675 | |
Total Telecommunication Services | | | | | | | 2,394,305 | |
Utilities - 1.4% | | | | | | | | |
AES Corp. | | | 5,000 | | | | 70,350 | |
AGL Resources, Inc. | | | 1,900 | | | | 102,429 | |
American Electric Power Co., Inc. | | | 9,100 | | | | 530,894 | |
Consolidated Edison, Inc. | | | 3,400 | | | | 215,424 | |
Public Service Enterprise Group, Inc. | | | 1,000 | | | | 41,310 | |
Total Utilities | | | | | | | 960,407 | |
Total Common Stocks
(cost $56,251,440) | | | | | | | 67,876,938 | |
| | | | | | | | |
| | | Contracts | | | Value | |
Purchased Options - 0.2% | | | | | | | | |
S&P 500 Puts, 1700 Strike Price, Expiration 01/17/15 | | | 174 | | | $ | 88,740 | |
S&P 500 Puts, 1825 Strike Price, Expiration 11/22/14 | | | 101 | | | | 12,928 | |
S&P 500 Puts, 1875 Strike Price, Expiration 12/20/14 | | | 67 | | | | 67,000 | |
Total Purchased Options
(cost $699,813) | | | | | | | 168,668 | |
| | |
| | | Principal
Amount | | | | |
Short-Term Investments - 2.3% | | | | | | | | |
Repurchase Agreements - 1.5%2 | | | | | | | | |
Cantor Fitzgerald Securities, Inc., dated 10/31/14, due 11/03/14, 0.130%, total to be received $1,000,011 (collateralized by various U.S. Government Agency Obligations, 0.000% - 10.500%, 01/01/15 - 09/20/64, totaling $1,020,000) | | $ | 1,000,000 | | | | 1,000,000 | |
Nomura Securities International, Inc., dated 10/31/14, due 11/03/14, 0.110%, total to be received $33,368 (collateralized by various U.S. Government Agency Obligations, 0.000% - 7.250%, 11/03/14 -11/01/44 totaling $34,035) | | | 33,368 | | | | 33,368 | |
Total Repurchase Agreements | | | | | | | 1,033,368 | |
| | |
| | | Shares | | | | |
Other Investment
Companies - 0.8%3 | | | | | | | | |
Dreyfus Institutional Cash Advantage Fund, Institutional Class Shares, 0.06% | | | 530,546 | | | | 530,546 | |
Total Short-Term Investments
(cost $1,563,914) | | | | | | | 1,563,914 | |
Total Investments - 103.0%
(cost $58,515,167) | | | | | | | 69,609,520 | |
Other Assets, less Liabilities - (3.0)% | | | | | | | (2,042,900 | ) |
Net Assets - 100.0% | | | | | | $ | 67,566,620 | |
The accompanying notes are an integral part of these financial statements.
15
AMG FQ Global Alternatives Fund
Portfolio Manager’s Comments
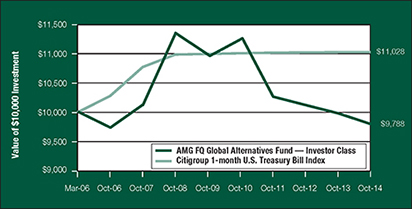
The AMG FQ Global Alternatives Fund (“Global Alternatives” or the “Fund”) delivered slightly negative returns for the past fiscal year ended October 31, 2014. The Fund (Investor Class) returned (1.84)% while the benchmark, the Citigroup 1-Month Treasury Bill Index, returned 0.03% during this time. Please refer to the table on page 17 for the returns of the other share classes.
The year witnessed a gradually widening array of economic and geopolitical risk, namely sluggish global growth, the developments surrounding the Islamic State, Russia/Ukraine conflict, Scottish independence referendum, unrest in Hong Kong, and the Ebola scare. Despite those risks, volatility across asset classes remained relatively subdued for most of the year, lulled by continued accommodative monetary policies of global central banks and close-to-record-low interest rates. That changed towards the fiscal year-end when the combination of the same risk factors, coupled with the end of the Federal Reserve’s (the Fed) bond purchases and the uncertainty about the U.S. future rate increases, changed the markets’ mood from nonchalant indifference to deep concern.
Volatility came back to life in September, which saw a shifting economic landscape marked by a stronger U.S. economy and meek growth elsewhere, especially in the Euro Zone, which introduced the prospect of monetary policy divergence between the leading developed economies. October brought more volatility into the markets in the approach to the Fed announcement. The Fed’s somewhat hawkish stance, as it ended quantitative easing and gave a more upbeat assessment of the U.S. economy, led to a significant increase in the U.S. Dollar against its major counterparties. Also contributing to the U.S. Dollar rally was the weakness in the Japanese Yen, as the Bank of Japan unexpectedly increased
monetary stimulus. Most global equities posted gains for the year, but more divergence in performance across countries could be observed towards the period-end as global economies embarked on varying economic paths. Global bonds also ended up benefiting from muted inflation in the U.S., continued disinflation in the Euro Zone and increased risk aversion at the fiscal year end.
The Fund’s modest loss was primarily driven by underperformance within the bond country selection strategy. The outperformance of German Bunds over U.S. Treasuries emphasized the two regions’ divergent economic paths and caught the fair value model, driven by relative attractiveness of bond risk premiums, on the wrong side of both markets. The loss from bond country selection was offset by solid gains from the currency strategy, which delivered positive returns in both the low-and higher-volatility environments. The Fund’s asset class selection strategy maintained a modest long position throughout the year which contributed positively to performance. The stock country selection strategy, on the other hand, was slightly down. The model attempting to capture expected risk and its effect on markets was mostly unsuccessful, as equity markets continued to be influenced to a large degree by central bank actions and not necessarily by convincing economic facts on the ground.
Going forward, global economic environment remains uncertain as the vulnerabilities evident in many global economies, such as Europe and Japan, remain unresolved. The scale of those problems is currently still masked by low interest rates, suppressed volatility and the positive impact of central banks’ quantitative easing policies ex-U.S. While the ending of the U.S. quantitative easing was well telegraphed, now investors will be trying to get a sense of the timing of the Fed’s first
rate rise and the pace of monetary tightening, as they try to establish the extent of the European Central Bank’s and Bank of Japan’s monetary stimulus and, possibly, new fiscal measures. More market volatility seems a relatively likely consequence. At the same time, a continued divergence in the economic fortunes of the world’s economies should encourage investors to pay more attention to fundamentals and to adopt a more nuanced view of the world.
This commentary reflects the viewpoints of the portfolio manager, First Quadrant, L.P., as of October 31, 2014 and is not intended as a forecast or guarantee of future results, and is subject to change without notice.
CUMULATIVE TOTAL RETURN PERFORMANCE
AMG FQ Global Alternatives Fund’s cumulative total return is based on the daily change in net asset value (NAV), and assumes that all distributions were reinvested. This graph compares a hypothetical $10,000 investment made in the Investor Class of the Fund on March 30, 2006 (commencement of operations), to a $10,000 investment made in the Citigroup 1-month U.S. Treasury Index for the same time period. Figures include reinvestment of capital gains and dividends. The listed returns for the Fund are net of expenses and the returns for the index exclude expenses. Performance for periods longer than one year is annualized. The graph and table do not reflect the deduction of taxes that a shareholder would pay on a Fund distribution or redemption of shares. The listed returns for the Fund are net of expenses and the returns for the index exclude expenses. Total returns would have been lower had certain expenses not been reduced.
16
AMG FQ Global Alternatives Fund
Portfolio Manager’s Comments (continued)
CUMULATIVE TOTAL RETURN PERFORMANCE (continued)
The table below shows the average annual total returns for the AMG FQ Global Alternatives Fund and the Citigroup 1-month U.S. Treasury Bill Index for the same time periods ended October 31, 2014.
| | | | | | | | | | | | | | | | |
| Average Annual Total Returns1 | | One
Year | | | Five
Years | | | Since
Inception | | | Inception
Date | |
AMG FQ Global Alternatives Fund2,3,4,5,6 | | | | | | | | | | | | | | | | |
Investor Class | | | (1.84 | )% | | | (2.28 | )% | | | (0.25 | )% | | | 03/30/06 | |
Service Class | | | (1.57 | )% | | | — | | | | (2.07 | )% | | | 01/01/10 | |
Institutional Class | | | (1.39 | )% | | | — | | | | (1.94 | )% | | | 01/01/10 | |
Citigroup 1-month U.S. Treasury Bill Index7 | | | 0.03 | % | | | 0.06 | % | | | 1.19 | % | | | 03/31/06 | |
The performance data shown represents past performance. Past performance is not a guarantee of future results. Current performance may be lower or higher than the performance data quoted. The investment return and principal value of an investment in the Fund will fluctuate so that an investor’s shares, when redeemed, may be worth more or less than their original cost.
Investors should carefully consider the Fund’s investment objectives, risks, charges and expenses before investing. For performance information through the most recent month end, current net asset values per share for the Fund and other information, please call (800) 835-3879 or visit our website at www.amgfunds for a free prospectus. Read it carefully before investing or sending money.
Distributed by AMG Distributors, Inc., member FINRA.
| 1 | Total return equals income yield plus share price change and assumes reinvestment of all dividends and capital gain distributions. Returns are net of fees and may reflect offsets of Fund expenses as described in the prospectus. No adjustment has been made for taxes payable by shareholders on their reinvested dividends and capital gain distributions. Returns for periods greater than one year are the average annual returns. The listed returns on the Fund are net of expenses and based on the published NAV as of October 31, 2014. All returns are in U.S. dollars ($). |
| 2 | From time to time, the Fund’s advisor has waived its fees and/or absorbed Fund expenses, which has resulted in higher returns. |
| 3 | Changing interest rates may adversely affect the value of an investment. An increase in interest rates typically causes the value of bonds and other fixed-income securities to fall. |
| 4 | The Fund may use derivative instruments for hedging purposes or as part of its investment strategy. There is a risk that a derivative intended as a hedge may not perform as expected. The main risk with derivatives is that some types can amplify a gain or loss, potentially earning or losing substantially more money than the actual cost of the derivative or that the counterparty may fail to honor its contract terms, causing a loss for the Fund. Use of these instruments may also involve certain costs and risks such as liquidity risk, interest rate risk, market risk, credit risk, management risk, and the risk that a fund could not close out a position when it would be most advantageous to do so. The Fund is subject to currency risk resulting from fluctuations in exchange rates that may affect the total loss or gain on a non-U.S. Dollar security when converted back to U.S. Dollars. |
| 5 | Investments in foreign securities and currency instruments are subject to additional risks such as erratic market conditions, economic and political instability, and currency exchange rate fluctuations. |
| 6 | Because the Fund invests in exchange traded funds (ETFs) which incur their own costs, investing in them could result in a higher cost to the investor. Additionally, the Fund will be indirectly exposed to all the risks of securities held by the ETFs. |
| 7 | Performance for the Citigroup 1-month U.S. Treasury Bill Index reflects an inception date of March 31, 2006. The Citigroup 1-month U.S. Treasury Bill Index is a market value-weighted index of public obligations of the U.S. Treasury with maturities of one month. Unlike the Fund, the Citigroup 1-month U.S. Treasury Bill Index is unmanaged, is not available for investment, and does not incur expenses. |
Not FDIC insured, nor bank guaranteed. May lose value.
17
AMG FQ Global Alternatives Fund
Schedule of Portfolio Investments
October 31, 2014
| | | | | | | | |
| | | Shares | | | Value | |
Exchange Traded Funds - 26.9% | | | | | | | | |
SPDR S&P 500 ETF Trust (cost $10,160,765) | | | 85,818 | | | $ | 17,306,058 | |
| | |
| | | Principal Amount | | | | |
U.S. Government Obligations - 55.3% | | | | | | | | |
U.S. Treasury Bills, | | | | | | | | |
0.003%, 11/28/14 to 12/04/145,6 | | $ | 34,605,000 | | | | 34,604,880 | |
0.038%, 03/26/155,6 | | | 1,000,000 | | | | 999,821 | |
Total U.S. Government Obligations (cost $35,603,888) | | | | | | | 35,604,701 | |
| | |
| | | Shares | | | | |
Other Investment Companies - 13.9%3 | | | | | | | | |
Dreyfus Institutional Cash Advantage Fund, Institutional Class Shares, 0.06%
(cost $8,965,849) | | | 8,965,849 | | | | 8,965,849 | |
Total Investments - 96.1% (cost $54,730,502) | | | | | | | 61,876,608 | |
Other Assets, less Liabilities - 3.9% | | | | | | | 2,513,577 | |
Net Assets - 100.0% | | | | | | $ | 64,390,185 | |
The accompanying notes are an integral part of these financial statements.
18
AMG FQ Global Risk-Balanced Fund
Portfolio Manager’s Comments
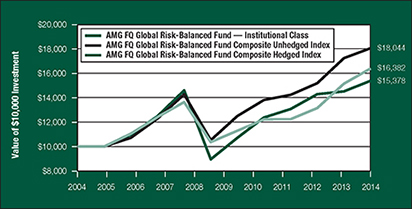
The AMG FQ Global Risk-Balanced Fund (formerly Managers AMG FQ Global Essentials Fund) (“the Fund”) posted positive absolute but negative relative returns for the past fiscal year ended October 31, 2014. The Fund (Institutional Class shares) returned 5.97%, while its benchmark, which consists of 60% of the return of MSCI World (hedged) Index and 40% of the return of the Citigroup World Government Bond (hedged) Index, returned 8.19% during this time, the difference predominantly attributable to the strong U.S. Dollar. Both global stocks and bonds contributed positively to the portfolio, but commodities were down.
The year was one of conflicting developments and a gradually widening array of economic and geopolitical risks, namely the sluggish global growth, deteriorating situation in the Middle East, Russia/Ukraine conflict, Scottish independence referendum, unrest in Hong Kong and the Ebola scare. Despite those risks, volatility across asset classes remained relatively subdued for most of the year, lulled by continued accommodative monetary policies and close-to-record-low interest rates. Although the global economy grew, albeit at a subdued pace, divergence in growth between the leading economies could be observed. While the U.S. economy continued to strengthen, there were areas of weakness, such as the Euro Zone and China. The Euro Zone, especially, continued to experience more deflationary pressures as the outcome of cuts in government spending after the financial crisis to “restore confidence” backfired and led, instead, to a stagnant economy. In addition, Russian sanctions had a visible negative impact on the region’s economy. In Japan, despite the monetary largesse of the Abe government and
significant optimism that this would pull Japan out of its decades-long deflation malaise, the economy seems to be stalling again.
The environment of weak global growth and increased geopolitical risks resulted in a surprising combination of low market volatility and a flight to safe-haven assets. As a result, the U.S. Dollar strengthened significantly and a flight to sovereign bonds could be observed in the second half of the fiscal year. The greenback was further supported by the prospect of monetary policy divergence between the leading developed economies. The Federal Reserve, having ended their bond purchasing program, is expected to start raising short-term interest rates earlier-than-expected next year in sharp contrast to central bank ex-U.S. that are still pursuing aggressive quantitative easing. The flight to quality resulted in strong performance of United Kingdom’s (U.K.) sovereign bonds portfolio, at the time when most commentators were proclaiming an imminent bear market for bonds. The strong U.S. Dollar, on the other hand, had a negative effect on commodity prices, driving down precious metals as well as oil and grains, which were already pressured by oversupply. The central bank-induced low-volatility environment supported U.K.’s equity exposure, which moved up and down in a fairly narrow range, but ended strongly positive by the fiscal year-end, mostly due to a very strong performance by the U.S. and Japan, with the Euro Zone posting only modest gains. Small-caps and property stocks also posted solid gains.
The asset allocation of the Fund remained constant over the year as the Market Risk Index continued to signal that we are in a low volatility
environment where most risky assets tend to be resilient. As seen over the fiscal year, pullbacks due to the Ukrainian situation in January or market weakness in September and October were followed by strong rallies. This sort of market resilience can be expected to continue into next year.
This commentary reflects the viewpoints of the portfolio manager, First Quadrant, L.P., as of October 31, 2014 and is not intended as a forecast or guarantee of future results, and is subject to change without notice.
CUMULATIVE TOTAL RETURN PERFORMANCE
AMG FQ Global Risk-Balanced Fund’s cumulative total return is based on the daily change in net asset value (NAV), and assumes that all distributions were reinvested. This graph compares a hypothetical $10,000 investment made in the Institutional Class Shares of the Fund on October 31, 2004, to a $10,000 investment made in the Hedged Index and the Unhedged Index for the same time period. Figures include reinvestment of capital gains and dividends. The listed returns for the Fund are net of expenses and the returns for the index exclude expenses. Performance for periods longer than one year is annualized. The graph and table do not reflect the deduction of taxes that a shareholder would pay on a Fund distribution or redemption of shares. The listed returns for the Fund are net of expenses and the returns for the index exclude expenses. Total returns would have been lower had certain expenses not been reduced.
19
AMG FQ Global Risk-Balanced Fund
Portfolio Manager’s Comments (continued)
CUMULATIVE TOTAL RETURN PERFORMANCE (continued)
The table below shows the average annual total returns for the AMG FQ Global Risk-Balanced Fund and the AMG FQ Global Risk-Balanced Fund Composite Hedged and Unhedged Indexes for the same time periods ended October 31, 2014.
| | | | | | | | | | | | | | | | | | | | |
| Average Annual Total Returns1 | | One
Year | | | Five
Years | | | Ten
Years | | | Since
Inception | | | Inception
Date | |
AMG FQ Global Risk-Balanced Fund2,3,4,5,6,7 | | | | | | | | | | | | | |
Investor Class | | | 5.33 | % | | | — | | | | — | | | | 6.66 | % | | | 01/01/10 | |
Service Class | | | 5.83 | % | | | — | | | | — | | | | 7.07 | % | | | 01/01/10 | |
Institutional Class | | | 5.97 | % | | | 7.50 | % | | | 4.40 | % | | | 6.21 | % | | | 11/18/88 | |
AMG FQ Global Risk-Balanced Fund Composite Hedged Index8,9,10 | | | 8.19 | % | | | 7.73 | % | | | 5.06 | % | | | 5.87 | % | | | 11/30/88 | |
AMG FQ Global Risk-Balanced Fund Composite Unhedged Index8,9,10 | | | 4.72 | % | | | 7.63 | % | | | 6.08 | % | | | 6.90 | % | | | 11/30/88 | |
The performance data shown represents past performance. Past performance is not a guarantee of future results. Current performance may be lower or higher than the performance data quoted. The investment return and principal value of an investment in the Fund will fluctuate so that an investor’s shares, when redeemed, may be worth more or less than their original cost.
Investors should carefully consider the Fund’s investment objectives, risks, charges and expenses before investing. For performance information through the most recent month end, current net asset values per share for the Fund and other information, please call (800) 835-3879 or visit our website at www.amgfunds.com for a free prospectus. Read it carefully before investing or sending money.
Distributed by AMG Distributors, Inc., member FINRA.
| 1 | Total return equals income yield plus share price change and assumes reinvestment of all dividends and capital gain distributions. Returns are net of fees and may reflect offsets of Fund expenses as described in the prospectus. No adjustment has been made for taxes payable by shareholders on their reinvested dividends and capital gain distributions. Returns for periods greater than one year are the average annual returns. The listed returns on the Fund are net of expenses and based on the published NAV as of October 31, 2014. All returns are in U.S. dollars ($). |
| 2 | From time to time, the Fund’s advisor has waived its fees and/or absorbed Fund expenses, which has resulted in higher returns. |
| 3 | Investments in foreign securities, even though publicly traded in the United States, may involve risks which are in addition to those inherent in domestic investments. The use of leverage in a Fund’s strategy can magnify relatively small market movements into relatively larger losses for the Fund. |
| 4 | The Fund is subject to special risk considerations similar to those associated with the direct ownership of real estate. Real estate valuations may be subject to factors such as changing general and local economic, financial, competitive and environmental conditions. |
| 5 | Because the Fund invests in exchange traded funds (ETFs) which incur their own costs, investing in them could result in a higher cost to the investor. Additionally, the Fund will be indirectly exposed to all the risks of securities held by the ETFs. |
| 6 | Obligations of certain government agencies are not backed by the full faith and credit of the U.S. Government. If one of these agencies defaulted on a loan, there is no guarantee that the U.S. Government will provide financial support. Additionally, debt securities of the U.S. Government may be affected by changing interest rates and subject to prepayment risk. |
| 7 | The Fund may use derivative instruments for hedging purposes or as part of its investment strategy. There is a risk that a derivative intended as a hedge may not perform as expected. The main risk with derivatives is that some types can amplify a gain or loss, potentially earning or losing substantially more money than the actual cost of the derivative or that the counterparty may fail to honor its contract terms, causing a loss for the Fund. Use of these instruments may also involve certain costs and risks such as liquidity risk, interest rate risk, market risk, credit risk, management risk, and the risk that a fund could not close out a position when it would be most advantageous to do so. The Fund is subject to currency risk resulting from fluctuations in exchange rates that may affect the total loss or gain on a non-U.S. Dollar security when converted back to U.S. Dollars. |
20
AMG FQ Global Risk-Balanced Fund
Portfolio Manager’s Comments (continued)
CUMULATIVE TOTAL RETURN PERFORMANCE (continued)
| 8 | Date reflects the inception date of the Fund, not the index. |
| 9 | The Fund’s index is comprised of 60% MSCI World Index, 40% Citigroup World Government Bond Index. The MSCI World Index is a free float-adjusted market capitalization weighted index that is designed to measure the equity market performance of developed and emerging markets. The MSCI World Index consists of 24 developed country indices. The Citigroup World Government Bond Index is a market capitalization weighted index consisting of the government bond markets. Country eligibility is determined based on market capitalization and investability criteria. All issues have a remaining maturity of at least one year. Unlike the Fund, the Composite Index is unmanaged, is not available for investment, and does not incur fees. All MSCI data is provided ’as is.’ The products described herein are not sponsored or endorsed and have not been reviewed or passed on by MSCI. In no event shall MSCI, its affiliates, or any MSCI data provider have any liability of any kind in connection with the MSCI data or the products described herein. Copying or redistributing the MSCI data is strictly prohibited. |
| 10 | The date reflects the closest available index date to the Fund’s inception date. |
Not FDIC insured, nor bank guaranteed. May lose value.
21
AMG FQ Global Risk-Balanced Fund
Schedule of Portfolio Investments
October 31, 2014
| | | | | | | | |
| | | Shares | | | Value | |
Exchange Traded Funds - 60.9% | | | | | | | | |
iShares Barclays TIPS Bond Fund | | | 92,075 | | | $ | 10,411,841 | |
iShares iBoxx $ High Yield Corporate Bond Fund1 | | | 250,845 | | | | 23,210,688 | |
Jefferies TR/J CRB Global Commodity Equity Index Fund | | | 36,703 | | | | 1,486,472 | |
Market Vectors Gold Miners | | | 85,676 | | | | 1,474,484 | |
Market Vectors RVE Hard Assets Producers1 | | | 43,130 | | | | 1,561,737 | |
Materials Select Sector SPDR Fund | | | 33,440 | | | | 1,618,496 | |
SPDR DB International Government Inflation-Protected Bond | | | 32,271 | | | | 1,902,053 | |
Vanguard REIT4 | | | 75,319 | | | | 5,949,448 | |
Total Exchange Traded Funds (cost $47,494,364) | | | | | | | 47,615,219 | |
| | |
| | | Notes | | | | |
Exchange Traded Notes - 10.3% | | | | | | | | |
Barclays, Inc., iPath Dow Jones-UBS Copper Subindex Total Return, 10/22/371 | | | 39,347 | | | | 1,449,937 | |
Barclays, Inc., iPath Dow Jones-UBS Grains Subindex Total Return, 10/22/371 | | | 21,768 | | | | 825,007 | |
Barclays, Inc., iPath Goldman Sachs Crude Oil Total Return Index, 08/07/361 | | | 35,801 | | | | 708,502 | |
Deutsche Bank AG, PowerShares DB Agriculture Double Long, 04/01/38 | | | 124,149 | | | | 759,792 | |
Deutsche Bank AG, PowerShares DB Gold Double Long, 02/15/38 | | | 60,002 | | | | 1,386,646 | |
Swedish Export Credit Corp., ELEMENTS Linked to the Rogers International Commodity Index - Total Return, 10/24/22 | | | 396,925 | | | | 2,933,276 | |
Total Exchange Traded Notes (cost $10,138,710) | | | | | | | 8,063,160 | |
| | |
| | | Number of | | | | |
| | | Contracts | | | | |
Purchased Options - 0.4% | | | | | | | | |
EURO STOXX 50 Puts, 2600 Strike Price, Expiration 03/20/15 | | | 124 | | | | 36,361 | |
EURO STOXX 50 Puts, 2800 Strike Price, Expiration 12/19/14 | | | 22 | | | | 4,246 | |
EURO STOXX 50 Puts, 2825 Strike Price, Expiration 12/19/14 | | | 60 | | | | 13,308 | |
EURO STOXX 50 Puts, 2850 Strike Price, Expiration 12/19/14 | | | 60 | | | | 15,263 | |
EURO STOXX 50 Puts, 3025 Strike Price, Expiration 11/21/14 | | | 108 | | | | 37,760 | |
S&P 500 Puts, 1700 Strike Price, Expiration 01/17/15 | | | 144 | | | | 73,440 | |
S&P 500 Puts, 1780 Strike Price, Expiration 11/22/14 | | | 110 | | | | 8,800 | |
S&P 500 Puts, 1825 Strike Price, Expiration 11/22/14 | | | 15 | | | | 1,920 | |
S&P 500 Puts, 1875 Strike Price, Expiration 12/20/14 | | | 67 | | | | 67,000 | |
Total Purchased Options (cost $949,919) | | | | | | | 258,098 | |
| | |
| | | Principal Amount | | | | |
U.S. Government Obligations - 11.5% | | | | | | | | |
U.S. Treasury Bills, 0.003%, 11/28/145,6 (cost $8,999,663) | | $ | 9,000,000 | | | | 9,000,000 | |
The accompanying notes are an integral part of these financial statements.
22
AMG FQ Global Risk-Balanced Fund
Schedule of Portfolio Investments (continued)
| | | | | | | | |
| | | Principal Amount | | | Value | |
Short-Term Investments - 29.9% | | | | | | | | |
Repurchase Agreements - 12.1%2 | | | | | | | | |
Cantor Fitzgerald Securities, Inc., dated 10/31/14, due 11/03/14, 0.130%, total to be received $2,256,876 (collateralized by various U.S. Government Agency Obligations, 0.000% - 10.500%, 01/01/15 - 09/20/64, totaling $2,301,985) | | $ | 2,256,848 | | | $ | 2,256,848 | |
Citigroup Global Markets, Inc., dated 10/31/14, due 11/03/14, 0.010%, total to be received $475,119 (collateralized by various U.S. Government Agency Obligations, 0.000% - 8.750%, 10/31/16 - 02/15/41, totaling $484,617) | | | 475,115 | | | | 475,115 | |
Daiwa Capital Markets America, dated 10/31/14, due 11/03/14, 0.150%, total to be received $2,256,877 (collateralized by various U.S. Government Agency Obligations, 0.000% - 8.000%, 09/24/15 - 03/01/48, totaling $2,301,986) | | | 2,256,848 | | | | 2,256,848 | |
Nomura Securities International, Inc., dated 10/31/14, due 11/03/14, 0.110%, total to be received $2,256,869 (collateralized by various U.S. Government Agency Obligations, 0.000% - 7.250%, 11/03/14 -11/01/44 totaling $2,301,985) | | | 2,256,848 | | | | 2,256,848 | |
State of Wisconsin Investment Board, dated 10/31/14, due 11/03/14, 0.150%, total to be received $2,256,876 (collateralized by various U.S. Government Agency Obligations, 0.125% - 2.500%, 04/15/16 - 01/15/29, totaling $2,304,955) | | | 2,256,848 | | | | 2,256,848 | |
Total Repurchase Agreements | | | | | | | 9,502,507 | |
| | |
| | | Shares | | | | |
Other Investment Companies - 17.8%3 | | | | | | | | |
Dreyfus Institutional Cash Advantage Fund, Institutional Class Shares, 0.06% | | | 8,748,578 | | | | 8,748,578 | |
JPMorgan Liquid Assets Money Market Fund, Capital Shares, 0.07% | | | 5,144,637 | | | | 5,144,637 | |
Total Other Investment Companies | | | | | | | 13,893,215 | |
Total Short-Term Investments (cost $23,395,722) | | | | | | | 23,395,722 | |
Total Investments - 113.0% (cost $90,978,378) | | | | | | | 88,332,199 | |
Other Assets, less Liabilities - (13.0)% | | | | | | | (10,129,681 | ) |
Net Assets - 100.0% | | | | | | $ | 78,202,518 | |
The accompanying notes are an integral part of these financial statements.
23
Notes to Schedules of Portfolio Investments
The following footnotes and abbreviations should be read in conjunction with each of the Schedules of Portfolio Investments previously presented in this report.
At October 31, 2014, the approximate cost of investments for Federal income tax purposes and the aggregate gross unrealized appreciation and/or depreciation based on tax cost were as follows:
| | | | | | | | | | | | | | | | |
| Fund | | Cost | | | Appreciation | | | Depreciation | | | Net | |
AMG FQ Tax-Managed U.S. Equity Fund | | $ | 43,728,782 | | | $ | 21,134,434 | | | $ | (464,557 | ) | | $ | 20,669,877 | |
AMG FQ U.S. Equity Fund | | | 58,565,827 | | | | 12,742,794 | | | | (1,699,101 | ) | | | 11,043,693 | |
AMG FQ Global Alternatives Fund | | | 54,730,502 | | | | 7,146,164 | | | | (58 | ) | | | 7,146,106 | |
AMG FQ Global Risk-Balanced Fund | | | 92,148,708 | | | | 1,390,990 | | | | (5,207,499 | ) | | | (3,816,509 | ) |
| * | Non-income producing security. |
| 1 | Some or all of these shares were out on loan to various brokers as of October 31, 2014, amounting to: |
| | | | | | | | |
| Fund | | Market Value | | | % of Net Assets | |
AMG FQ Tax-Managed U.S. Equity Fund | | $ | 1,254,944 | | | | 2.0 | % |
AMG FQ U.S. Equity Fund | | | 971,701 | | | | 1.4 | % |
AMG FQ Global Risk-Balanced Fund | | | 9,249,886 | | | | 11.8 | % |
| 2 | Collateral received from brokers for securities lending was invested in these short-term investments. |
| 3 | Yield shown for each investment company represents the October 31, 2014, seven-day average yield, which refers to the sum of the previous seven days’ dividends paid, expressed as an annual percentage. |
| 4 | Some or all of these securities were held as collateral for options written. |
| 5 | Represents yield to maturity at October 31, 2014. |
| 6 | Some or all of these securities were held as collateral for futures contracts as of October 31, 2014, amounting to: |
| | | | | | | | |
| Fund | | Market Value | | | % of Net Assets | |
AMG FQ Global Alternatives Fund | | $ | 35,604,701 | | | | 55.3 | % |
AMG FQ Global Risk-Balanced Fund | | | 9,000,000 | | | | 11.5 | % |
The following tables summarize the inputs used to value the Funds’ net assets by the fair value hierarchy levels as of October 31, 2014:
(See Note 1(a) in the Notes to Financial Statements.)
| | | | | | | | | | | | | | | | |
| | | Quoted Prices in Active | | | | | | | | | | |
| | | Markets for Identical | | | Significant Other | | | Significant Unobservable | | | | |
| | | Investments | | | Observable Inputs | | | Inputs | | | | |
| | | Level 1 | | | Level 2 | | | Level 3 | | | Total | |
AMG FQ Tax-Managed U.S. Equity Fund | | | | | | | | | | | | | | | | |
Investments in Securities | | | | | | | | | | | | | | | | |
Common Stocks† | | $ | 61,909,058 | | | | — | | | | — | | | $ | 61,909,058 | |
Short-Term Investments | | | | | | | | | | | | | | | | |
Repurchase Agreements | | | — | | | $ | 1,285,537 | | | | — | | | | 1,285,537 | |
Other Investment Companies | | | 1,204,064 | | | | — | | | | — | | | | 1,204,064 | |
| | | | | | | | | | | | | | | | |
Total Investments in Securities | | $ | 63,113,122 | | | $ | 1,285,537 | | | | — | | | $ | 64,398,659 | |
| | | | | | | | | | | | | | | | |
The accompanying notes are an integral part of these financial statements.
24
Notes to Schedules of Portfolio Investments (continued)
| | | | | | | | | | | | | | | | |
| | | Quoted Prices in Active | | | | | | | | | | |
| | | Markets for Identical | | | Significant Other | | | Significant Unobservable | | | | |
| | | Investments | | | Observable Inputs | | | Inputs | | | | |
| | | Level 1 | | | Level 2 | | | Level 3 | | | Total | |
AMG FQ U.S. Equity Fund | | | | | | | | | | | | | | | | |
Investments in Securities | | | | | | | | | | | | | | | | |
Common Stocks† | | $ | 67,876,938 | | | | — | | | | — | | | $ | 67,876,938 | |
Purchased Options | | | 168,668 | | | | — | | | | — | | | | 168,668 | |
Short-Term Investments | | | | | | | | | | | | | | | | |
Repurchase Agreements | | | — | | | $ | 1,033,368 | | | | — | | | | 1,033,368 | |
Other Investment Companies | | | 530,546 | | | | — | | | | — | | | | 530,546 | |
| | | | | | | | | | | | | | | | |
Total Investments in Securities | | $ | 68,576,152 | | | $ | 1,033,368 | | | | — | | | $ | 69,609,520 | |
| | | | | | | | | | | | | | | | |
Financial Derivative Instruments-Assets†† | | | | | | | | | | | | | | | | |
Equity Contracts | | $ | 2,414 | | | | — | | | | — | | | $ | 2,414 | |
| | | | | | | | | | | | | | | | |
Financial Derivative Instruments-Liabilities†† | | | | | | | | | | | | | | | | |
Equity Contracts | | | (1,054,280 | ) | | | — | | | | — | | | | (1,054,280 | ) |
| | | | | | | | | | | | | | | | |
Total Financial Derivative Instruments | | $ | (1,051,866 | ) | | | — | | | | — | | | $ | (1,051,866 | ) |
| | | | | | | | | | | | | | | | |
| | | | |
| | | Quoted Prices in Active | | | | | | | | | | |
| | | Markets for Identical | | | Significant Other | | | Significant Unobservable | | | | |
| | | Investments | | | Observable Inputs | | | Inputs | | | | |
| | | Level 1 | | | Level 2 | | | Level 3 | | | Total | |
AMG FQ Global Alternatives Fund | | | | | | | | | | | | | | | | |
Investments in Securities | | | | | | | | | | | | | | | | |
Exchange Traded Funds††† | | $ | 17,306,058 | | | | — | | | | — | | | $ | 17,306,058 | |
U.S. Government Obligations†††† | | | — | | | $ | 35,604,701 | | | | — | | | | 35,604,701 | |
Other Investment Companies | | | 8,965,849 | | | | — | | | | — | | | | 8,965,849 | |
| | | | | | | | | | | | | | | | |
Total Investments in Securities | | $ | 26,271,907 | | | $ | 35,604,701 | | | | — | | | $ | 61,876,608 | |
| | | | | | | | | | | | | | | | |
Financial Derivative Instruments-Assets†† | | | | | | | | | | | | | | | | |
Foreign Exchange Contracts | | | — | | | $ | 11,024,507 | | | | — | | | $ | 11,024,507 | |
Equity Contracts | | $ | 531,562 | | | | — | | | | — | | | | 531,562 | |
Interest Rate Contracts | | | 564,810 | | | | — | | | | — | | | | 564,810 | |
| | | | | | | | | | | | | | | | |
| | | 1,096,372 | | | | 11,024,507 | | | | — | | | | 12,120,879 | |
| | | | | | | | | | | | | | | | |
Financial Derivative Instruments-Liabilities†† | | | | | | | | | | | | | | | | |
Foreign Exchange Contracts | | | — | | | | (10,878,436 | ) | | | — | | | | (10,878,436 | ) |
Equity Contracts | | | (882,842 | ) | | | — | | | | — | | | | (882,842 | ) |
Interest Rate Contracts | | | (752,940 | ) | | | — | | | | — | | | | (752,940 | ) |
| | | | | | | | | | | | | | | | |
| | | (1,635,782 | ) | | | (10,878,436 | ) | | | — | | | | (12,514,218 | ) |
| | | | | | | | | | | | | | | | |
Total Financial Derivative Instruments | | $ | (539,410 | ) | | $ | 146,071 | | | | — | | | $ | (393,339 | ) |
| | | | | | | | | | | | | | | | |
The accompanying notes are an integral part of these financial statements.
25
Notes to Schedules of Portfolio Investments (continued)
| | | | | | | | | | | | | | | | |
| | | Quoted Prices in Active | | | | | | | | | | |
| | | Markets for Identical | | | Significant Other | | | Significant Unobservable | | | | |
| | | Investments | | | Observable Inputs | | | Inputs | | | | |
| | | Level 1 | | | Level 2 | | | Level 3 | | | Total | |
AMG FQ Global Risk-Balanced Fund | | | | | | | | | | | | | | | | |
Investments in Securities | | | | | | | | | | | | | | | | |
Exchange Traded Funds††† | | $ | 47,615,219 | | | | — | | | | — | | | $ | 47,615,219 | |
Exchange Traded Notes††† | | | 8,063,160 | | | | — | | | | — | | | | 8,063,160 | |
U.S. Government Obligations†††† | | | — | | | $ | 9,000,000 | | | | — | | | | 9,000,000 | |
Purchased Options | | | 258,098 | | | | — | | | | — | | | | 258,098 | |
Short-Term Investments | | | | | | | | | | | | | | | | |
Repurchase Agreements | | | — | | | | 9,502,507 | | | | — | | | | 9,502,507 | |
Other Investment Companies | | | 13,893,215 | | | | — | | | | — | | | | 13,893,215 | |
| | | | | | | | | | | | | | | | |
Total Investments in Securities | | $ | 69,829,692 | | | $ | 18,502,507 | | | | — | | | $ | 88,332,199 | |
| | | | | | | | | | | | | | | | |
Financial Derivative Instruments-Assets†† | | | | | | | | | | | | | | | | |
Equity Contracts | | $ | 580,318 | | | | — | | | | — | | | $ | 580,318 | |
Interest Rate Contracts | | | 452,817 | | | | — | | | | — | | | | 452,817 | |
| | | | | | | | | | | | | | | | |
| | | 1,033,135 | | | | — | | | | — | | | | 1,033,135 | |
| | | | | | | | | | | | | | | | |
Financial Derivative Instruments-Liabilities†† | | | | | | | | | | | | | | | | |
Equity Contracts | | | (1,963,340 | ) | | | — | | | | — | | | | (1,963,340 | ) |
| | | | | | | | | | | | | | | | |
Total Financial Derivative Instruments | | $ | (930,205 | ) | | | — | | | | — | | | $ | (930,205 | ) |
| | | | | | | | | | | | | | | | |
| † | For a detailed break-out of the common stocks by major industry classification, please refer to the Schedule of Portfolio Investments. |
| †† | Derivative instruments, such as futures, written options and forwards, are not reflected in the Schedule of Portfolio Investments. Futures and forwards are valued at the unrealized appreciation/depreciation of the instrument and written options are shown at value. |
| ††† | All exchange traded funds and exchange traded notes held in the Fund are level 1 securities. For a detailed breakout of these securities, please refer to the Schedule of Portfolio Investments. |
| †††† | All U.S. government and agency obligations held in the Fund are level 2 securities. For a detailed breakout of the U.S. government and agency obligations by major industry or agency classification, please refer to the Schedule of Portfolio Investments. |
As of October 31, 2014, the Funds had no transfers between levels from the beginning of the reporting period.
The accompanying notes are an integral part of these financial statements.
26
Notes to Schedules of Portfolio Investments (continued)
The following schedule shows the fair value of derivative instruments at October 31, 2014:
| | | | | | | | | | | | | | |
| | | | | Asset Derivatives | | | Liability Derivatives | |
| | | Derivatives not accounted | | Statement of Assets and | | | | | Statement of Assets and | | | |
| Fund | | for as hedging instruments | | Liabilities Location | | Fair Value | | | Liabilities Location | | Fair Value | |
AMG FQ U.S. Equity Fund | | | | | | | | | | | | | | |
| | Equity contracts | | Options purchased2 | | $ | 168,668 | | | Options written | | $ | 1,054,280 | |
| | Equity contracts | | Receivable for variation margin*,1 | | | 2,414 | | | Payable for variation margin*,1 | | | — | |
| | | | | | | | | | | | | | |
| | | | Totals | | $ | 171,082 | | | | | $ | 1,054,280 | |
| | | | | | | | | | | | | | |
| | | |
| | | | | Asset Derivatives | | | Liability Derivatives | |
| | | Derivatives not accounted | | Statement of Assets and | | | | | Statement of Assets and | | | |
| Fund | | for as hedging instruments | | Liabilities Location | | Fair Value | | | Liabilities Location | | Fair Value | |
AMG FQ Global Alternatives Fund | | | | | | | | | | | | | | |
| | Equity contracts | | Receivable for variation margin*,1 | | $ | 531,562 | | | Payable for variation margin*,1 | | $ | 882,842 | |
| | Interest rate contracts* | | Receivable for variation margin*,1 | | | 564,810 | | | Payable for variation margin*,1 | | | 752,940 | |
| | Foreign exchange contracts | | Unrealized appreciation of foreign currency contracts | | | 11,024,507 | | | Unrealized depreciation of foreign currency contracts | | | 10,878,436 | |
| | | | | | | | | | | | | | |
| | | | Totals | | $ | 12,120,879 | | | | | $ | 12,514,218 | |
| | | | | | | | | | | | | | |
| | | |
| | | | | Asset Derivatives | | | Liability Derivatives | |
| | | Derivatives not accounted | | Statement of Assets and | | | | | Statement of Assets and | | | |
| Fund | | for as hedging instruments | | Liabilities Location | | Fair Value | | | Liabilities Location | | Fair Value | |
AMG FQ Global Risk-Balanced Fund | | | | | | | | | | | | | | |
| | Equity contracts | | Options purchased2 | | $ | 258,098 | | | Options Written | | $ | 1,091,137 | |
| | Equity contracts | | Receivable for variation margin*,1 | | | 580,318 | | | Payable for variation margin*,1 | | | 872,203 | |
| | Interest rate contracts | | Receivable for variation margin*,1 | | | 452,817 | | | Payable for variation margin*,1 | | | — | |
| | | | | | | | | | | | | | |
| | | | Totals | | $ | 1,291,233 | | | | | $ | 1,963,340 | |
| | | | | | | | | | | | | | |
The accompanying notes are an integral part of these financial statements.
27
Notes to Schedules of Portfolio Investments (continued)
For the fiscal year ended October 31, 2014, the effect of derivative instruments on the Statement of Operations for the Funds and the amount of realized gain (loss) and unrealized gain (loss) on derivatives recognized in income is as follows:
| | | | | | | | | | | | | | |
| | | | | Realized Gain (Loss) | | | Change in Unrealized Gain (Loss) | |
| | | | | | | | | | | | Change in | |
| | | Derivatives not accounted | | Statement of Operations | | Realized | | | Statement of Operations | | Unrealized | |
| Fund | | for as hedging instruments | | Location | | Gain/(Loss) | | | Location | | Gain/(Loss) | |
AMG FQ U.S. Equity Fund | | | | | | | | | | | | | | |
| | Equity contracts | | Net realized loss on options purchased2 | | $ | (2,326,287 | ) | | Net change in unrealized appreciation-(depreciation) options purchased2 | | $ | (100,120 | ) |
| | Equity contracts | | Net realized gain on options written2 | | | 1,399,955 | | | Net change in unrealized appreciation-(depreciation) options written | | | (432,396 | ) |
| | Equity contracts | | Net realized gain on futures contracts | | | 33,664 | | | Net change in unrealized appreciation-(depreciation) of futures contracts | | | (4,848 | ) |
| | | | | | | | | | | | | | |
| | | | Totals | | $ | (892,668 | ) | | | | $ | (537,364 | ) |
| | | | | | | | | | | | | | |
| | | |
| | | | | Realized Gain (Loss) | | | Change in Unrealized Gain (Loss) | |
| | | | | | | | | | | | Change in | |
| | | Derivatives not accounted | | Statement of Operations | | Realized | | | Statement of Operations | | Unrealized | |
| Fund | | for as hedging instruments | | Location | | Gain/(Loss) | | | Location | | Gain/(Loss) | |
AMG FQ Global Alternatives Fund | | | | | | | | | | | | | | |
| | Equity contracts | | Net realized loss on futures contracts | | $ | (4,948,840 | ) | | Net change in unrealized appreciation-(depreciation) of futures contracts | | $ | 688,476 | |
| | Interest rate contracts | | Net realized loss on futures contracts | | | (4,820,070 | ) | | Net change in unrealized appreciation-(depreciation) of futures contracts | | | (361,202 | ) |
| | Foreign exchange contracts | | Net realized loss on foreign currency transactions | | | 4,698,051 | | | Net change in unrealized appreciation-(depreciation) of foreign currency translations | | | 364,793 | |
| | | | | | | | | | | | | | |
| | | | Totals | | $ | (5,070,859 | ) | | | | $ | 692,067 | |
| | | | | | | | | | | | | | |
| | | |
| | | | | Realized Gain (Loss) | | | Change in Unrealized Gain (Loss) | |
| | | | | | | | | | | | Change in | |
| | | Derivatives not accounted | | Statement of Operations | | Realized | | | Statement of Operations | | Unrealized | |
| Fund | | for as hedging instruments | | Location | | Gain/(Loss) | | | Location | | Gain/(Loss) | |
AMG FQ Global Risk-Balanced Fund | | | | | | | | | | | | | | |
| | Equity contracts | | Net realized loss on options purchased2 | | $ | (2,961,803 | ) | | Net change in unrealized appreciation-(depreciation) options purchased2 | | $ | (133,595 | ) |
| | Equity contracts | | Net realized gain on options written2 | | | 1,808,027 | | | Net change in unrealized appreciation-(depreciation) options written | | | (96,422 | ) |
| | Equity contracts | | Net realized gain on futures contracts | | | 6,601,118 | | | Net change in unrealized appreciation-(depreciation) of futures contracts | | | (2,868,246 | ) |
| | Interest rate contracts | | Net realized gain on futures contracts | | | 2,475,561 | | | Net change in unrealized appreciation-(depreciation) of futures contracts | | | (279,649 | ) |
| | | | | | | | | | | | | | |
| | | | Totals | | $ | 7,922,903 | | | | | $ | (3,377,912 | ) |
| | | | | | | | | | | | | | |
| * | Includes only the October 31, 2014 futures variation margin. Prior futures variation margin movements have been settled in cash on the Statement of Assets and Liabilities upon receipt or payment. |
| 1 | Only current day’s variation margin is reported within the Statement of Assets and Liabilities. |
| 2 | Options purchased are included in Investments at value on the Statement of Assets and Liabilities. Net realized gain (loss) on options purchased/written and net change in unrealized appreciation (depreciation) on options purchased are included in the net realized gain (loss) on investments on the Statement of Operations. |
The accompanying notes are an integral part of these financial statements.
28
Notes to Schedules of Portfolio Investments (continued)
At October 31, 2014, the following Funds had open written options:
(See Note 10 in the Notes to Financial Statements.)
AMG FQ U.S. Equity Fund
| | | | | | | | | | | | | | | | | | | | |
| | | | | | | | | Number of | | | | | | Unrealized | |
| Description | | Exercise Price | | | Expiration Date | | | Contracts | | | Premium | | | Gain/(Loss) | |
S&P 500 Index (Call) | | | 2,010 | | | | 01/17/15 | | | | 174 | | | $ | 156,339 | | | $ | (710,181 | ) |
S&P 500 Index (Call) | | | 2,050 | | | | 11/22/14 | | | | 101 | | | | 78,629 | | | | 7,929 | |
S&P 500 Index (Call) | | | 2,110 | | | | 12/20/14 | | | | 67 | | | | 38,425 | | | | 12,295 | |
S&P 500 Index (Put) | | | 1,625 | | | | 01/17/15 | | | | 174 | | | | 243,339 | | | | 193,314 | |
S&P 500 Index (Put) | | | 1,750 | | | | 11/22/14 | | | | 101 | | | | 110,948 | | | | 103,878 | |
S&P 500 Index (Put) | | | 1,800 | | | | 12/20/14 | | | | 67 | | | | 66,899 | | | | 33,064 | |
| | | | | | | | | | | | | | | | | | | | |
| | | | | | | | | | | Totals | | | $ | 694,579 | | | $ | (359,701 | ) |
| | | | | | | | | | | | | | | | | | | | |
| | | | | |
| AMG FQ Global Risk-Balanced Fund | | | | | | | | | | | | | | | | | | | | |
| | | | | |
| | | | | | | | | Number of | | | | | | Unrealized | |
| Description | | Exercise Price | | | Expiration Date | | | Contracts | | | Premium | | | Gain/(Loss) | |
EURO STOXX 50 (Call) | | | 3,275 | | | | 03/20/15 | | | | 124 | | | $ | 38,188 | | | $ | (46,500 | ) |
EURO STOXX 50 (Call) | | | 3,375 | | | | 12/19/14 | | | | 22 | | | | 3,847 | | | | 2,303 | |
EURO STOXX 50 (Call) | | | 3,450 | | | | 11/21/14 | | | | 108 | | | | 14,258 | | | | 13,582 | |
EURO STOXX 50 (Call) | | | 3,450 | | | | 12/19/14 | | | | 60 | | | | 14,812 | | | | 13,008 | |
EURO STOXX 50 (Call) | | | 3,475 | | | | 12/19/14 | | | | 60 | | | | 12,530 | | | | 11,177 | |
EURO STOXX 50 (Put) | | | 2,450 | | | | 03/20/15 | | | | 124 | | | | 62,781 | | | | 41,337 | |
EURO STOXX 50 (Put) | | | 2,700 | | | | 12/19/14 | | | | 82 | | | | 30,790 | | | | 21,747 | |
EURO STOXX 50 (Put) | | | 2,750 | | | | 12/19/14 | | | | 60 | | | | 25,768 | | | | 17,046 | |
EURO STOXX 50 (Put) | | | 2,875 | | | | 11/21/14 | | | | 108 | | | | 11,336 | | | | 509 | |
S&P 500 Index (Call) | | | 2,010 | | | | 01/17/15 | | | | 144 | | | | 132,220 | | | | (584,900 | ) |
S&P 500 Index (Call) | | | 2,040 | | | | 11/22/14 | | | | 110 | | | | 102,068 | | | | (13,432 | ) |
S&P 500 Index (Call) | | | 2,050 | | | | 11/22/14 | | | | 15 | | | | 11,968 | | | | 1,468 | |
S&P 500 Index (Call) | | | 2,110 | | | | 12/20/14 | | | | 67 | | | | 40,059 | | | | 13,929 | |
S&P 500 Index (Put) | | | 1,625 | | | | 01/17/15 | | | | 144 | | | | 201,296 | | | | 159,896 | |
S&P 500 Index (Put) | | | 1,700 | | | | 11/22/14 | | | | 110 | | | | 155,968 | | | | 150,468 | |
S&P 500 Index (Put) | | | 1,750 | | | | 11/22/14 | | | | 15 | | | | 15,719 | | | | 14,668 | |
S&P 500 Index (Put) | | | 1,800 | | | | 12/20/14 | | | | 67 | | | | 66,194 | | | | 32,359 | |
| | | | | | | | | | | | | | | | | | | | |
| | | | | | | | | | | Totals | | | $ | 939,802 | | | $ | (151,335 | ) |
| | | | | | | | | | | | | | | | | | | | |
The accompanying notes are an integral part of these financial statements.
29
Notes to Schedules of Portfolio Investments (continued)
Transactions in written put and call options for the fiscal year ended October 31, 2014, were as follows:
(See Note 10 in the Notes to Financial Statements.)
AMG FQ U.S. Equity Fund
| | | | | | | | |
| | | Number of | | | Amount of | |
| | | Contracts | | | Premiums | |
Options outstanding at October 31, 2013 | | | 685 | | | $ | 564,713 | |
Options written | | | 2,760 | | | | 2,444,035 | |
Options exercised/expired/closed | | | (2,761 | ) | | | (2,314,169 | ) |
| | | | | | | | |
Options outstanding at October 31, 2014 | | | 684 | | | $ | 694,579 | |
| | | | | | | | |
AMG FQ Global Risk-Balanced Fund
| | | | | | | | |
| | | Number of | | | Amount of | |
| | | Contracts | | | Premiums | |
Options outstanding at October 31, 2013 | | | 1,162 | | | $ | 777,852 | |
Options written | | | 5,860 | | | | 3,237,469 | |
Options exercised/expired/closed | | | (5,602 | ) | | | (3,075,519 | ) |
| | | | | | | | |
Options outstanding at October 31, 2014 | | | 1,420 | | | $ | 939,802 | |
| | | | | | | | |
All futures contracts are exchange traded unless otherwise noted. At October 31, 2014, the following Funds had open futures contracts:
AMG FQ U.S. Equity Fund
| | | | | | | | | | | | | | | | |
| | | | | | | | | Expiration | | | Unrealized | |
| Type | | Number of Contracts | | | Position | | | Date | | | gain | |
S&P 500 E-Mini Index | | | 2 | | | | Long | | | | 12/19/14 | | | $ | 2,414 | |
| | | | | | | | | | | | | | | | |
The accompanying notes are an integral part of these financial statements.
30
Notes to Schedules of Portfolio Investments (continued)
AMG FQ Global Alternative Fund
| | | | | | | | | | | | | | | | |
| | | | | | | | | | Expiration | | | Unrealized | |
| Type | | Currency | | Number of Contracts | | | Position | | Date | | | Gain/(Loss) | |
Amsterdam Index | | EUR | | | 12 | | | Long | | | 11/21/14 | | | $ | 52,778 | |
Australia 10-Year Bond | | AUD | | | 150 | | | Short | | | 12/16/14 | | | | (177,815 | ) |
Australian SPI 200 Index | | AUD | | | 76 | | | Short | | | 12/19/14 | | | | (450,710 | ) |
CAC40 Index | | EUR | | | 1 | | | Long | | | 11/24/14 | | | | 1,252 | |
Canadian 10-Year Bond | | CAD | | | 137 | | | Short | | | 12/31/14 | | | | (52,315 | ) |
DAX Index | | EUR | | | 5 | | | Short | | | 12/19/14 | | | | (48,538 | ) |
Euro-Bund 10-Year | | EUR | | | 203 | | | Short | | | 12/10/14 | | | | (428,040 | ) |
FTSE 100 Index | | GBP | | | 31 | | | Long | | | 12/22/14 | | | | 92,054 | |
FTSE/MIB Index | | EUR | | | 2 | | | Short | | | 12/19/14 | | | | (5,231 | ) |
Hang Seng Index | | HKD | | | 11 | | | Long | | | 11/28/14 | | | | 46,329 | |
IBEX 35 Index | | EUR | | | 10 | | | Long | | | 11/21/14 | | | | 27,273 | |
Janpanese 10-Year Bond | | JPY | | | 25 | | | Long | | | 12/11/14 | | | | 21,184 | |
S&P 500 E-Mini Index | | USD | | | 164 | | | Short | | | 12/19/14 | | | | (378,363 | ) |
S&P/TSX 60 Index | | CAD | | | 25 | | | Long | | | 12/19/14 | | | | 151,413 | |
TOPIX Index | | JPY | | | 17 | | | Long | | | 12/12/14 | | | | 160,463 | |
U.K. 10-Year Gilt | | GBP | | | 51 | | | Short | | | 12/31/14 | | | | (94,770 | ) |
U.S. Treasury 10-Year Bond | | USD | | | 590 | | | Long | | | 12/31/14 | | | | 543,626 | |
| | | | | | | | | | | | | | | | |
| | | | | | | | | | | Total | | | $ | (539,410 | ) |
| | | | | | | | | | | | | | | | |
| | | | | |
| AMG FQ Global Risk-Balanced Fund | | | | | | | | | | | | | | | | |
| | | | | |
| | | | | | | | | | Expiration | | | Unrealized | |
| Type | | Currency | | Number of Contracts | | | Position | | Date | | | Gain/(Loss) | |
Amsterdam Index | | EUR | | | 25 | | | Long | | | 11/21/14 | | | $ | 127,328 | |
Australia 10-Year Bond | | AUD | | | 50 | | | Long | | | 12/16/14 | | | | 130,582 | |
Australian SPI 200 Index | | AUD | | | 40 | | | Long | | | 12/19/14 | | | | 35,969 | |
CAC40 Index | | EUR | | | 45 | | | Long | |
| 11/24/14 to
12/22/14 |
| | | 1,426 | |
Canadian 10-Year Bond | | CAD | | | 43 | | | Long | | | 12/31/14 | | | | 24,693 | |
DAX Index | | EUR | | | 8 | | | Long | | | 12/19/14 | | | | (78,711 | ) |
E-Mini MSCI Index | | USD | | | 178 | | | Long | | | 12/19/14 | | | | (383,951 | ) |
Euro-Bund 30 Year | | EUR | | | 23 | | | Long | | | 12/10/14 | | | | 106,287 | |
The accompanying notes are an integral part of these financial statements.
31
Notes to Schedules of Portfolio Investments (continued)
| | | | | | | | | | | | | | | | |
| | | | | | | | | | Expiration | | | Unrealized | |
| Type | | Currency | | Number of Contracts | | | Position | | Date | | | Gain/(Loss) | |
FTSE 100 Index | | GBP | | | 31 | | | Long | | | 12/22/14 | | | $ | (123,394 | ) |
FTSE/MIB Index | | EUR | | | 19 | | | Long | | | 12/19/14 | | | | (80,859 | ) |
Hang Seng Index | | HKD | | | 15 | | | Long | | | 11/28/14 | | | | 65,832 | |
IBEX 35 Index | | EUR | | | 17 | | | Long | | | 11/21/14 | | | | 70,275 | |
Russell 2000 Index | | USD | | | 101 | | | Long | | | 12/19/14 | | | | 119,012 | |
S&P 500 E-Mini Index | | USD | | | 43 | | | Long | | | 12/19/14 | | | | 51,950 | |
S&P/TSX 60 Index | | CAD | | | 27 | | | Long | | | 12/19/14 | | | | (205,288 | ) |
TOPIX Index | | JPY | | | 29 | | | Long | | | 12/12/14 | | | | 108,526 | |
U.K. 10-Year Gilt | | GBP | | | 37 | | | Long | | | 12/31/14 | | | | 146,195 | |
U.S. Treasury Long Bond | | USD | | | 33 | | | Long | | | 12/31/14 | | | | 45,060 | |
| | | | | | | | | | | | | | | | |
| | | | | | | | | | | Total | | | $ | 160,932 | |
| | | | | | | | | | | | | | | | |
At October 31, 2014, the following Fund had foreign currency contracts (in U.S. Dollars):
(See Note 8 in the Notes to Financial Statements.)
AMG FQ Global Alternatives Fund
| | | | | | | | | | | | | | | | | | | | |
| | | | | | | | | | | | | | | | Unrealized | |
| | | | | | | | | | Receivable | | | | | | Gain/ | |
| Foreign Currency | | Position | | Settlement Date | | | Counterparty | | Amount | | | Payable Amount | | | (Loss) | |
Australian Dollar | | Long | | | 12/17/14 | | | GS | | $ | 27,598,119 | | | $ | 28,791,631 | | | $ | (1,193,512 | ) |
Australian Dollar | | Long | | | 12/17/14 | | | MS | | | 12,080,625 | | | | 12,081,892 | | | | (1,267 | ) |
British Pound | | Long | | | 12/17/14 | | | GS | | | 2,906,854 | | | | 2,962,845 | | | | (55,991 | ) |
British Pound | | Long | | | 12/17/14 | | | MS | | | 13,675,105 | | | | 14,005,441 | | | | (330,336 | ) |
Canadian Dollar | | Long | | | 12/17/14 | | | GS | | | 2,319,260 | | | | 2,344,777 | | | | (25,517 | ) |
Canadian Dollar | | Long | | | 12/17/14 | | | MS | | | 31,824,927 | | | | 32,741,152 | | | | (916,225 | ) |
Euro | | Long | | | 12/17/14 | | | GS | | | 453,193 | | | | 461,950 | | | | (8,757 | ) |
Euro | | Long | | | 12/17/14 | | | MS | | | 2,664,449 | | | | 2,695,698 | | | | (31,249 | ) |
Japanese Yen | | Long | | | 12/17/14 | | | GS | | | 17,381,472 | | | | 18,392,171 | | | | (1,010,699 | ) |
Japanese Yen | | Long | | | 12/17/14 | | | MS | | | 20,423,001 | | | | 21,845,722 | | | | (1,422,721 | ) |
New Zealand Dollar | | Long | | | 12/17/14 | | | GS | | | 3,472,573 | | | | 3,477,783 | | | | (5,210 | ) |
New Zealand Dollar | | Long | | | 12/17/14 | | | MS | | | 48,214,924 | | | | 50,945,266 | | | | (2,730,342 | ) |
Norwegian Krone | | Long | | | 12/17/14 | | | GS | | | 11,035,927 | | | | 11,604,539 | | | | (568,612 | ) |
Norwegian Krone | | Long | | | 12/17/14 | | | MS | | | 26,406,109 | | | | 28,246,375 | | | | (1,840,266 | ) |
Singapore Dollar | | Long | | | 12/17/14 | | | GS | | | 2,168,560 | | | | 2,188,867 | | | | (20,307 | ) |
The accompanying notes are an integral part of these financial statements.
32
Notes to Schedules of Portfolio Investments (continued)
| | | | | | | | | | | | | | | | | | | | | | |
| | | | | | | | | | | | | | | | | Unrealized | |
| | | | | | | | | | | Receivable | | | | | | Gain/ | |
| Foreign Currency | | Position | | Settlement Date | | | Counterparty | | | Amount | | | Payable Amount | | | (Loss) | |
Singapore Dollar | | Long | | | 12/17/14 | | | | MS | | | $ | 9,995,988 | | | $ | 10,217,621 | | | $ | (221,633 | ) |
Swedish Krona | | Long | | | 12/17/14 | | | | GS | | | | 7,795,256 | | | | 8,021,166 | | | | (225,910 | ) |
Swedish Krona | | Long | | | 12/17/14 | | | | MS | | | | 7,159,987 | | | | 7,387,392 | | | | (227,405 | ) |
Swiss Franc | | Long | | | 12/17/14 | | | | GS | | | | 2,818,124 | | | | 2,844,218 | | | | (26,094 | ) |
Swiss Franc | | Long | | | 12/17/14 | | | | MS | | | | 956,727 | | | | 973,110 | | | | (16,383 | ) |
Australian Dollar | | Short | | | 12/17/14 | | | | GS | | | | 6,688,084 | | | | 6,548,701 | | | | 139,383 | |
Australian Dollar | | Short | | | 12/17/14 | | | | MS | | | | 15,970,238 | | | | 15,226,686 | | | | 743,552 | |
British Pound | | Short | | | 12/17/14 | | | | GS | | | | 8,120,294 | | | | 7,971,619 | | | | 148,675 | |
British Pound | | Short | | | 12/17/14 | | | | MS | | | | 8,000,703 | | | | 7,938,480 | | | | 62,223 | |
Canadian Dollar | | Short | | | 12/17/14 | | | | GS | | | | 2,585,803 | | | | 2,541,697 | | | | 44,106 | |
Canadian Dollar | | Short | | | 12/17/14 | | | | MS | | | | 11,490,216 | | | | 11,370,682 | | | | 119,534 | |
Euro | | Short | | | 12/17/14 | | | | GS | | | | 2,242,901 | | | | 2,172,595 | | | | 70,306 | |
Euro | | Short | | | 12/17/14 | | | | MS | | | | 38,081,536 | | | | 36,878,526 | | | | 1,203,010 | |
Japanese Yen | | Short | | | 12/17/14 | | | | GS | | | | 2,361,331 | | | | 2,259,122 | | | | 102,209 | |
Japanese Yen | | Short | | | 12/17/14 | | | | MS | | | | 519,548 | | | | 491,300 | | | | 28,248 | |
New Zealand Dollar | | Short | | | 12/17/14 | | | | GS | | | | 56,630,280 | | | | 53,408,386 | | | | 3,221,894 | |
New Zealand Dollar | | Short | | | 12/17/14 | | | | MS | | | | 1,558,731 | | | | 1,523,101 | | | | 35,630 | |
Norwegian Krone | | Short | | | 12/17/14 | | | | GS | | | | 2,513,158 | | | | 2,393,381 | | | | 119,777 | |
Norwegian Krone | | Short | | | 12/17/14 | | | | MS | | | | 14,201,335 | | | | 13,474,669 | | | | 726,666 | |
Singapore Dollar | | Short | | | 12/17/14 | | | | GS | | | | 32,598,270 | | | | 31,807,167 | | | | 791,103 | |
Singapore Dollar | | Short | | | 12/17/14 | | | | MS | | | | 1,072,365 | | | | 1,055,203 | | | | 17,162 | |
Swedish Krona | | Short | | | 12/17/14 | | | | GS | | | | 33,365,954 | | | | 32,030,506 | | | | 1,335,448 | |
Swedish Krona | | Short | | | 12/17/14 | | | | MS | | | | 12,208,421 | | | | 11,930,683 | | | | 277,738 | |
Swiss Franc | | Short | | | 12/17/14 | | | | GS | | | | 28,576,881 | | | | 27,339,970 | | | | 1,236,911 | |
Swiss Franc | | Short | | | 12/17/14 | | | | MS | | | | 12,980,068 | | | | 12,379,136 | | | | 600,932 | |
| | | | | | | | | | | | | | | | | | | | | | |
| | | | | | | | | Totals | | | $ | 543,117,297 | | | $ | 542,971,226 | | | $ | 146,071 | |
| | | | | | | | | | | | | | | | | | | | | | |
The accompanying notes are an integral part of these financial statements.
33
Notes to Schedules of Portfolio Investments (continued)
| | |
| INVESTMENT DEFINITIONS AND ABBREVIATIONS: |
| REIT: | | Real Estate Investment Trust |
| TIPS: | | Treasury Inflation-Protected Securities |
|
| CURRENCY ABBREVIATIONS: |
| |
| AUD: | | Australian Dollar |
| CAD: | | Canadian Dollar |
| EUR: | | Euro |
| GBP: | | British Pound |
| HKD: | | Hong Kong Dollar |
| JPY: | | Japanese Yen |
| USD: | | U.S. Dollar |
|
| COUNTERPARTY ABBREVIATIONS: |
| |
| MS: | | Morgan Stanley |
| GS: | | Goldman Sachs Group, Inc. |
| OTC: | | Over-the-counter |
The accompanying notes are an integral part of these financial statements.
34
Statement of Assets and Liabilities
October 31, 2014
| | | | | | | | | | | | | | | | |
| | | AMG FQ | | | | | | | | | AMG FQ Global | |
| | | Tax-Managed | | | AMG FQ U.S. | | | AMG FQ Global | | | Risk-Balanced | |
| | | U.S. Equity Fund | | | Equity Fund | | | Alternatives Fund | | | Fund | |
Assets: | | | | | | | | | | | | | | | | |
Investments at value* (including securities on loan valued at $1,254,944, $971,701, $0, and $9,249,886, respectively) | | $ | 63,113,122 | | | $ | 68,576,152 | | | $ | 61,876,608 | | | $ | 78,829,692 | |
Repurchase agreements at value** | | | 1,285,537 | | | | 1,033,368 | | | | — | | | | 9,502,507 | |
Foreign currency*** | | | — | | | | — | | | | — | | | | 1,013 | |
Cash collateral for financial derivative instruments | | | — | | | | 77,000 | | | | 6,230,000 | | | | — | |
Receivable for Fund shares sold | | | 200,211 | | | | 1,932 | | | | 21,372 | | | | 7,582 | |
Dividends, interest and other receivables | | | 46,396 | | | | 53,407 | | | | 486 | | | | 25,155 | |
Receivable for variation margin on futures contracts | | | — | | | | 2,280 | | | | 263,713 | | | | 839,573 | |
Receivable for investments sold | | | — | | | | 79,955 | | | | — | | | | — | |
Receivable from affiliate | | | 2,655 | | | | 2,787 | | | | 45,467 | | | | 13,458 | |
Unrealized appreciation on forward foreign currency contracts | | | — | | | | — | | | | 11,024,507 | | | | — | |
Prepaid expenses | | | 4,517 | | | | 8,993 | | | | 10,533 | | | | 8,832 | |
Total assets | | | 64,652,438 | | | | 69,835,874 | | | | 79,472,686 | | | | 89,227,812 | |
Liabilities: | | | | | | | | | | | | | | | | |
Payable upon return of securities loaned | | | 1,285,537 | | | | 1,033,368 | | | | — | | | | 9,502,507 | |
Payable for collateral on financial derivative instruments | | | — | | | | — | | | | 3,200,000 | | | | — | |
Payable for Fund shares repurchased | | | 61,253 | | | | 18,913 | | | | 227,717 | | | | 117,263 | |
Due to custodian | | | — | | | | 79,955 | | | | — | | | | — | |
Written options (premiums received $0, $694,579, $0 and $939,802, respectively) | | | — | | | | 1,054,280 | | | | — | | | | 1,091,137 | |
Payable for variation margin on futures contracts | | | — | | | | — | | | | 593,303 | | | | 41,188 | |
Unrealized depreciation on forward foreign currency contracts | | | — | | | | — | | | | 10,878,436 | | | | — | |
Payable for investments purchased | | | — | | | | — | | | | — | | | | 174,226 | |
Accrued expenses: | | | | | | | | | | | | | | | | |
Investment management and advisory fees | | | 42,386 | | | | 19,518 | | | | 98,901 | | | | 39,375 | |
Shareholder servicing fees - Investor Class | | | — | | | | — | | | | 4,160 | | | | 466 | |
Shareholder servicing fees - Service Class | | | — | | | | — | | | | — | | | | 964 | |
Administrative fees | | | — | | | | 13,942 | | | | 14,544 | | | | 16,406 | |
Distribution fees - Investor Class | | | 2,166 | | | | 5,326 | | | | 5,200 | | | | 466 | |
Trustees fees and expenses | | | 111 | | | | 78 | | | | 416 | | | | 433 | |
Other | | | 34,496 | | | | 43,874 | | | | 59,824 | | | | 40,863 | |
Total liabilities | | | 1,425,949 | | | | 2,269,254 | | | | 15,082,501 | | | | 11,025,294 | |
Net Assets | | $ | 63,226,489 | | | $ | 67,566,620 | | | $ | 64,390,185 | | | $ | 78,202,518 | |
* Investments at cost | | $ | 42,443,017 | | | $ | 57,481,799 | | | $ | 54,730,502 | | | $ | 81,475,871 | |
** Repurchase agreements at cost | | $ | 1,285,537 | | | $ | 1,033,368 | | | | — | | | $ | 9,502,507 | |
*** Foreign currency at cost | | | — | | | | — | | | | — | | | $ | 1,019 | |
The accompanying notes are an integral part of these financial statements.
35
Statement of Assets and Liabilities (continued)
| | | | | | | | | | | | | | | | |
| | | AMG FQ | | | | | | | | | AMG FQ Global | |
| | | Tax-Managed | | | AMG FQ U.S. | | | AMG FQ Global | | | Risk-Balanced | |
| | | U.S. Equity Fund | | | Equity Fund | | | Alternatives Fund | | | Fund | |
Net Assets Represent: | | | | | | | | | | | | | | | | |
Paid-in capital | | $ | 56,707,225 | | | $ | 56,714,014 | | | $ | 58,733,018 | | | $ | 89,645,869 | |
Undistributed net investment income (loss) | | | 157,508 | | | | 7,147 | | | | (466,097 | ) | | | 2,157,962 | |
Accumulated net realized gain (loss) from investments, options, futures and foreign currency transactions | | | (14,308,349 | ) | | | 108,393 | | | | (626,162 | ) | | | (10,965,264 | ) |
Net unrealized appreciation (depreciation) of investments, options, futures and foreign currency translations | | | 20,670,105 | | | | 10,737,066 | | | | 6,749,426 | | | | (2,636,049 | ) |
Net Assets | | $ | 63,226,489 | | | $ | 67,566,620 | | | $ | 64,390,185 | | | $ | 78,202,518 | |
Investor Class: | | | | | | | | | | | | | | | | |
Net Assets | | $ | 12,540,957 | | | $ | 25,930,760 | | | $ | 24,149,518 | | | $ | 2,228,085 | |
Shares outstanding | | | 531,783 | | | | 1,507,747 | | | | 2,966,172 | | | | 160,956 | |
Net asset value, offering and redemption price per share | | $ | 23.58 | | | $ | 17.20 | | | $ | 8.14 | | | $ | 13.84 | |
Service Class: | | | | | | | | | | | | | | | | |
Net Assets | | | n/a | | | | n/a | | | $ | 31,390,455 | | | $ | 2,537,246 | |
Shares outstanding | | | n/a | | | | n/a | | | | 3,846,679 | | | | 181,534 | |
Net asset value, offering and redemption price per share | | | n/a | | | | n/a | | | $ | 8.16 | | | $ | 13.98 | |
Institutional Class: | | | | | | | | | | | | | | | | |
Net Assets | | $ | 50,685,532 | | | $ | 41,635,860 | | | $ | 8,850,212 | | | $ | 73,437,187 | |
Shares outstanding | | | 2,151,185 | | | | 2,418,450 | | | | 1,081,818 | | | | 5,239,595 | |
Net asset value, offering and redemption price per share | | $ | 23.56 | | | $ | 17.22 | | | $ | 8.18 | | | $ | 14.02 | |
The accompanying notes are an integral part of these financial statements.
36
Statement of Operations
For the fiscal year ended October 31, 2014
| | | | | | | | | | | | | | | | |
| | | AMG FQ | | | | | | | | | AMG FQ Global | |
| | | Tax-Managed | | | AMG FQ U.S. | | | AMG FQ Global | | | Risk-Balanced | |
| | | U.S. Equity Fund | | | Equity Fund | | | Alternatives Fund | | | Fund | |
Investment Income: | | | | | | | | | | | | | | | | |
Dividend income | | $ | 780,990 | | | $ | 1,239,770 | | | $ | 446,894 | | | $ | 2,117,560 | |
Interest income | | | 85 | | | | — | | | | 28,384 | | | | 6,418 | |
Securities lending income | | | 1,447 | | | | 7,323 | | | | 1,258 | | | | 107,404 | |
Total investment income | | | 782,522 | | | | 1,247,093 | | | | 476,536 | | | | 2,231,382 | |
Expenses: | | | | | | | | | | | | | | | | |
Investment management and advisory fees | | | 479,304 | | | | 227,919 | | | | 1,547,112 | | | | 506,329 | |
Administrative fees | | | — | | | | 162,799 | | | | 227,516 | | | | 210,970 | |
Distribution fees - Investor Class | | | 20,061 | | | | 62,271 | | | | 98,294 | | | | 9,084 | |
Shareholder servicing fees - Investor Class | | | — | | | | — | | | | 77,372 | | | | 9,084 | |
Shareholder servicing fees - Service Class | | | — | | | | — | | | | 51,652 | | | | 2,284 | |
Professional fees | | | 30,612 | | | | 31,808 | | | | 31,424 | | | | 51,763 | |
Transfer agent | | | 22,062 | | | | 28,317 | | | | 3,258 | | | | 16,322 | |
Registration fees | | | 30,490 | | | | 33,400 | | | | 49,888 | | | | 46,887 | |
Reports to shareholders | | | 11,175 | | | | 16,408 | | | | 32,241 | | | | 20,691 | |
Custodian | | | 7,717 | | | | 13,804 | | | | 6,668 | | | | 5,754 | |
Trustees fees and expenses | | | 2,039 | | | | 2,418 | | | | 2,515 | | | | 3,234 | |
Miscellaneous | | | 2,111 | | | | 2,431 | | | | 3,653 | | | | 1,745 | |
Expense repayments | | | 292 | | | | 4,993 | | | | —�� | | | | — | |
Total expenses before offsets | | | 605,863 | | | | 586,568 | | | | 2,131,593 | | | | 884,147 | |
Expense waiver | | | — | | | | — | | | | (6,088 | ) | | | (5,954 | ) |
Expense reimbursements | | | (27,397 | ) | | | (9,528 | ) | | | (593,356 | ) | | | (112,131 | ) |
Net expenses | | | 578,466 | | | | 577,040 | | | | 1,532,149 | | | | 766,062 | |
Net investment income (loss) | | | 204,056 | | | | 670,053 | | | | (1,055,613 | ) | | | 1,465,320 | |
Net Realized and Unrealized Gain (Loss): | | | | | | | | | | | | | | | | |
Net realized gain (loss) on investments | | | 4,366,025 | | | | 6,383,140 | | | | 5,455,351 | | | | (3,551,954 | ) |
Net realized gain (loss) on futures contracts | | | — | | | | 33,664 | | | | (9,768,910 | ) | | | 9,076,679 | |
Net realized gain on foreign currency transactions | | | — | | | | — | | | | 4,717,773 | | | | 17,378 | |
Net realized gain on written options | | | — | | | | 1,399,955 | | | | — | | | | 1,808,027 | |
Net change in unrealized appreciation (depreciation) of investments | | | 4,758,305 | | | | 374,633 | | | | (1,986,989 | ) | | | (984,989 | ) |
Net change in unrealized appreciation (depreciation) of futures contracts | | | — | | | | (4,848 | ) | | | 327,274 | | | | (3,147,895 | ) |
Net change in unrealized appreciation (depreciation) on foreign currency translations | | | — | | | | — | | | | 363,883 | | | | (3,994 | ) |
Net change in unrealized appreciation (depreciation) on written options | | | — | | | | (432,396 | ) | | | — | | | | (96,422 | ) |
Net realized and unrealized gain (loss) | | | 9,124,330 | | | | 7,754,148 | | | | (891,618 | ) | | | 3,116,830 | |
Net increase (decrease) in net assets resulting from operations | | $ | 9,328,386 | | | $ | 8,424,201 | | | $ | (1,947,231 | ) | | $ | 4,582,150 | |
The accompanying notes are an integral part of these financial statements.
37
Statements of Changes in Net Assets
For the fiscal years ended October 31,
| | | | | | | | | | | | | | | | |
| | | AMG FQ Tax-Managed | | | AMG FQ U.S. | |
| | | U.S. Equity Fund | | | Equity Fund | |
| | | 2014 | | | 2013 | | | 2014 | | | 2013 | |
Increase (Decrease) in Net Assets From Operations: | | | | | | | | | | | | | | | | |
Net investment income | | $ | 204,056 | | | $ | 265,978 | | | $ | 670,053 | | | $ | 861,768 | |
Net realized gain on investments, options and futures | | | 4,366,025 | | | | 5,319,200 | | | | 7,816,759 | | | | 5,506,743 | |
Net change in unrealized appreciation (depreciation) of investments, options and futures | | | 4,758,305 | | | | 6,683,434 | | | | (62,611 | ) | | | 5,835,124 | |
Net increase in net assets resulting from operations | | | 9,328,386 | | | | 12,268,612 | | | | 8,424,201 | | | | 12,203,635 | |
Distributions to Shareholders: | | | | | | | | | | | | | | | | |
From net investment income: | | | | | | | | | | | | | | | | |
Investor Class | | | (8,882 | ) | | | (45,496 | ) | | | (184,111 | ) | | | (217,396 | ) |
Institutional Class | | | (145,414 | ) | | | (329,833 | ) | | | (457,090 | ) | | | (638,539 | ) |
Total distributions to shareholders | | | (154,296 | ) | | | (375,329 | ) | | | (641,201 | ) | | | (855,935 | ) |
Capital Share Transactions:1 | | | | | | | | | | | | | | | | |
Net increase (decrease) from capital share transactions | | | 4,520,547 | | | | (5,096,506 | ) | | | (1,279,198 | ) | | | 2,180,618 | |
Total increase in net assets | | | 13,694,637 | | | | 6,796,777 | | | | 6,503,802 | | | | 13,528,318 | |
Net Assets: | | | | | | | | | | | | | | | | |
Beginning of year | | | 49,531,852 | | | | 42,735,075 | | | | 61,062,818 | | | | 47,534,500 | |
End of year | | $ | 63,226,489 | | | $ | 49,531,852 | | | $ | 67,566,620 | | | $ | 61,062,818 | |
End of year undistributed net investment income | | $ | 157,508 | | | $ | 107,748 | | | $ | 7,147 | | | $ | 22,286 | |
| | | | | | | | | | | | | | | | |
| 1 | See Note 1(g) of the Notes to Financial Statements. |
The accompanying notes are an integral part of these financial statements.
38
Statements of Changes in Net Assets (continued)
For the fiscal years ended October 31,
| | | | | | | | | | | | | | | | |
| | | AMG FQ Global | | | AMG FQ Global | |
| | | Alternatives Fund | | | Risk-Balanced Fund | |
| | | 2014 | | | 2013 | | | 2014 | | | 2013 | |
Increase (Decrease) in Net Assets From Operations: | | | | | | | | | | | | | | | | |
Net investment income (loss) | | $ | (1,055,613 | ) | | $ | (1,843,313 | ) | | $ | 1,465,320 | | | $ | 789,124 | |
Net realized gain on investments, futures and foreign currency transactions | | | 404,214 | | | | 8,304,238 | | | | 7,350,130 | | | | 179,130 | |
Net change in unrealized appreciation (depreciation) of investments, futures and foreign currency translations | | | (1,295,832 | ) | | | (9,464,913 | ) | | | (4,233,300 | ) | | | 593,316 | |
Net increase (decrease) in net assets resulting from operations | | | (1,947,231 | ) | | | (3,003,988 | ) | | | 4,582,150 | | | | 1,561,570 | |
Distributions to Shareholders: | | | | | | | | | | | | | | | | |
From net investment income: | | | | | | | | | | | | | | | | |
Investor Class | | | (3,442,996 | ) | | | (1,998,827 | ) | | | — | | | | (352,805 | ) |
Service Class | | | (2,525,748 | ) | | | (922,404 | ) | | | — | | | | (399,327 | ) |
Institutional Class | | | (1,557,194 | ) | | | (570,386 | ) | | | — | | | | (3,193,560 | ) |
Total distributions to shareholders | | | (7,525,938 | ) | | | (3,491,617 | ) | | | — | | | | (3,945,692 | ) |
Capital Share Transactions:1 | | | | | | | | | | | | | | | | |
Net decrease from capital share transactions | | | (44,975,030 | ) | | | (196,130,478 | ) | | | (26,162,709 | ) | | | (21,786,490 | ) |
Total decrease in net assets | | | (54,448,199 | ) | | | (202,626,083 | ) | | | (21,580,559 | ) | | | (24,170,612 | ) |
Net Assets: | | | | | | | | | | | | | | | | |
Beginning of year | | | 118,838,384 | | | | 321,464,467 | | | | 99,783,077 | | | | 123,953,689 | |
End of year | | $ | 64,390,185 | | | $ | 118,838,384 | | | $ | 78,202,518 | | | $ | 99,783,077 | |
End of year undistributed net investment income (loss) | | $ | (466,097 | ) | | $ | 7,349,905 | | | $ | 2,157,962 | | | | — | |
| | | | | | | | | | | | | | | | |
| 1 | See Note 1(g) of the Notes to Financial Statements. |
The accompanying notes are an integral part of these financial statements.
39
AMG FQ Tax-Managed U.S. Equity Fund
Financial Highlights
For a share outstanding throughout each fiscal year
| | | | | | | | | | | | | | | | | | | | |
| | | For the fiscal years ended October 31, | |
| Investor Class | | 2014 | | | 2013 | | | 2012 | | | 2011 | | | 2010 | |
Net Asset Value, Beginning of Year | | $ | 20.02 | | | $ | 15.37 | | | $ | 13.63 | | | $ | 12.47 | | | $ | 10.01 | |
Income from Investment Operations: | | | | | | | | | | | | | | | | | | | | |
Net investment income (loss)1 | | | 0.03 | | | | 0.06 | 4 | | | 0.05 | 6 | | | (0.01 | ) | | | 0.02 | |
Net realized and unrealized gain on investments1 | | | 3.55 | | | | 4.71 | | | | 1.69 | | | | 1.18 | | | | 2.44 | |
Total from investment operations | | | 3.58 | | | | 4.77 | | | | 1.74 | | | | 1.17 | | | | 2.46 | |
Less Distributions to Shareholders from: | | | | | | | | | | | | | | | | | | | | |
Net investment income | | | (0.02 | ) | | | (0.12 | ) | | | — | | | | (0.01 | ) | | | — | |
Net Asset Value, End of Year | | $ | 23.58 | | | $ | 20.02 | | | $ | 15.37 | | | $ | 13.63 | | | $ | 12.47 | |
Total Return2 | | | 17.91 | % | | | 31.31 | % | | | 12.77 | % | | | 9.40 | % | | | 24.58 | % |
Ratio of net expenses to average net assets (with offsets/reductions) | | | 1.24 | % | | | 1.26 | %5 | | | 1.24 | % | | | 1.24 | % | | | 1.24 | % |
Ratio of expenses to average net assets (with offsets) | | | 1.24 | % | | | 1.26 | %5 | | | 1.24 | % | | | 1.24 | % | | | 1.24 | % |
Ratio of total expenses to average net assets (without offsets/reductions)3 | | | 1.29 | % | | | 1.35 | %5 | | | 1.39 | % | | | 1.36 | % | | | 1.44 | % |
Ratio of net investment income (loss) to average net assets2 | | | 0.13 | % | | | 0.35 | %5 | | | 0.35 | % | | | (0.07 | )% | | | 0.22 | % |
Portfolio turnover | | | 45 | % | | | 49 | % | | | 36 | % | | | 40 | % | | | 81 | % |
Net assets at end of year (000’s omitted) | | $ | 12,541 | | | $ | 6,324 | | | $ | 3,026 | | | $ | 3,049 | | | $ | 4,116 | |
| | | | | | | | | | | | | | | | | | | | |
| |
| | | For the fiscal years ended October 31, | |
| Institutional Class | | 2014 | | | 2013 | | | 2012 | | | 2011 | | | 2010 | |
Net Asset Value, Beginning of Year | | $ | 19.99 | | | $ | 15.33 | | | $ | 13.58 | | | $ | 12.43 | | | $ | 9.98 | |
Income from Investment Operations: | | | | | | | | | | | | | | | | | | | | |
Net investment income1 | | | 0.09 | | | | 0.11 | 4 | | | 0.09 | 6 | | | 0.02 | | | | 0.05 | |
Net realized and unrealized gain on investments1 | | | 3.54 | | | | 4.70 | | | | 1.67 | | | | 1.19 | | | | 2.43 | |
Total from investment operations | | | 3.63 | | | | 4.81 | | | | 1.76 | | | | 1.21 | | | | 2.48 | |
Less Distributions to Shareholders from: | | | | | | | | | | | | | | | | | | | | |
Net investment income | | | (0.06 | ) | | | (0.15 | ) | | | (0.01 | ) | | | (0.06 | ) | | | (0.03 | ) |
Net Asset Value, End of Year | | $ | 23.56 | | | $ | 19.99 | | | $ | 15.33 | | | $ | 13.58 | | | $ | 12.43 | |
Total Return2 | | | 18.22 | %7 | | | 31.65 | %7 | | | 13.00 | % | | | 9.70 | % | | | 24.92 | % |
Ratio of net expenses to average net assets (with offsets/reductions) | | | 0.99 | % | | | 1.01 | %5 | | | 0.99 | % | | | 0.99 | % | | | 0.99 | % |
Ratio of expenses to average net assets (with offsets) | | | 0.99 | % | | | 1.01 | %5 | | | 0.99 | % | | | 0.99 | % | | | 0.99 | % |
Ratio of total expenses to average net assets (without offsets/reductions)3 | | | 1.04 | % | | | 1.10 | %5 | | | 1.14 | % | | | 1.11 | % | | | 1.19 | % |
Ratio of net investment income to average net assets2 | | | 0.40 | % | | | 0.62 | %5 | | | 0.60 | % | | | 0.18 | % | | | 0.45 | % |
Portfolio turnover | | | 45 | % | | | 49 | % | | | 36 | % | | | 40 | % | | | 81 | % |
Net assets at end of year (000’s omitted) | | $ | 50,686 | | | $ | 43,207 | | | $ | 36,884 | | | $ | 35,741 | | | $ | 39,420 | |
| | | | | | | | | | | | | | | | | | | | |
40
AMG FQ U.S. Equity Fund
Financial Highlights
For a share outstanding throughout each fiscal year
| | | | | | | | | | | | | | | | | | | | |
| | | For the fiscal years ended October 31, | |
| Investor Class | | 2014 | | | 2013 | | | 2012 | | | 2011 | | | 2010 | |
Net Asset Value, Beginning of Year | | $ | 15.23 | | | $ | 12.29 | | | $ | 11.30 | | | $ | 10.29 | | | $ | 8.93 | |
Income from Investment Operations: | | | | | | | | | | | | | | | | | | | | |
Net investment income | | | 0.14 | 1 | | | 0.19 | 1,4 | | | 0.22 | 1 | | | 0.09 | 1 | | | 0.10 | |
Net realized and unrealized gain on investments | | | 1.95 | 1 | | | 2.94 | 1 | | | 1.07 | 1 | | | 1.01 | 1 | | | 1.37 | |
Total from investment operations | | | 2.09 | | | | 3.13 | | | | 1.29 | | | | 1.10 | | | | 1.47 | |
Less Distributions to Shareholders from: | | | | | | | | | | | | | | | | | | | | |
Net investment income | | | (0.12 | ) | | | (0.19 | ) | | | (0.30 | ) | | | (0.09 | ) | | | (0.11 | ) |
Net Asset Value, End of Year | | $ | 17.20 | | | $ | 15.23 | | | $ | 12.29 | | | $ | 11.30 | | | $ | 10.29 | |
Total Return2 | | | 13.76 | % | | | 25.66 | % | | | 11.50 | % | | | 10.72 | % | | | 16.57 | % |
Ratio of net expenses to average net assets (with offsets/reductions) | | | 1.04 | % | | | 1.06 | %8 | | | 1.04 | % | | | 1.04 | %9 | | | 1.04 | % |
Ratio of expenses to average net assets (with offsets) | | | 1.04 | % | | | 1.06 | %8 | | | 1.04 | % | | | 1.04 | %9 | | | 1.04 | % |
Ratio of total expenses to average net assets (without offsets/reductions)3 | | | 1.05 | % | | | 1.10 | %8 | | | 1.15 | % | | | 1.13 | %9 | | | 1.15 | % |
Ratio of net investment income to average net assets2 | | | 0.88 | % | | | 1.37 | %8 | | | 1.84 | % | | | 0.83 | %9 | | | 0.98 | % |
Portfolio turnover | | | 87 | % | | | 91 | % | | | 132 | % | | | 138 | % | | | 117 | % |
Net assets at end of year (000’s omitted) | | $ | 25,931 | | | $ | 23,103 | | | $ | 12,764 | | | $ | 12,966 | | | $ | 18,755 | |
| | | | | | | | | | | | | | | | | | | | |
| |
| | | For the fiscal years ended October 31, | |
| Institutional Class | | 2014 | | | 2013 | | | 2012 | | | 2011 | | | 2010 | |
Net Asset Value, Beginning of Year | | $ | 15.27 | | | $ | 12.34 | | | $ | 11.38 | | | $ | 10.35 | | | $ | 8.99 | |
Income from Investment Operations: | | | | | | | | | | | | | | | | | | | | |
Net investment income | | | 0.18 | 1 | | | 0.24 | 1,4 | | | 0.25 | 1 | | | 0.12 | 1 | | | 0.13 | |
Net realized and unrealized gain on investments | | | 1.96 | 1 | | | 2.93 | 1 | | | 1.07 | 1 | | | 1.03 | 1 | | | 1.37 | |
Total from investment operations | | | 2.14 | | | | 3.17 | | | | 1.32 | | | | 1.15 | | | | 1.50 | |
Less Distributions to Shareholders from: | | | | | | | | | | | | | | | | | | | | |
Net investment income | | | (0.19 | ) | | | (0.24 | ) | | | (0.36 | ) | | | (0.12 | ) | | | (0.14 | ) |
Net Asset Value, End of Year | | $ | 17.22 | | | $ | 15.27 | | | $ | 12.34 | | | $ | 11.38 | | | $ | 10.35 | |
Total Return2 | | | 14.05 | % | | | 26.00 | % | | | 11.78 | % | | | 11.12 | % | | | 16.75 | % |
Ratio of net expenses to average net assets (with offsets/reductions) | | | 0.79 | % | | | 0.81 | %8 | | | 0.79 | % | | | 0.79 | %9 | | | 0.79 | % |
Ratio of expenses to average net assets (with offsets) | | | 0.79 | % | | | 0.81 | %8 | | | 0.79 | % | | | 0.79 | %9 | | | 0.79 | % |
Ratio of total expenses to average net assets (without offsets/reductions)3 | | | 0.80 | % | | | 0.85 | %8 | | | 0.90 | % | | | 0.88 | %9 | | | 0.90 | % |
Ratio of net investment income to average net assets2 | | | 1.13 | % | | | 1.73 | %8 | | | 2.09 | % | | | 1.08 | %9 | | | 1.22 | % |
Portfolio turnover | | | 87 | % | | | 91 | % | | | 132 | % | | | 138 | % | | | 117 | % |
Net assets at end of year (000’s omitted) | | $ | 41,636 | | | $ | 37,960 | | | $ | 34,231 | | | $ | 33,250 | | | $ | 32,309 | |
| | | | | | | | | | | | | | | | | | | | |
41
AMG FQ Global Alternatives Fund
Financial Highlights
For a share outstanding throughout each fiscal period
| | | | | | | | | | | | | | | | | | | | |
| | | For the fiscal years ended October 31, | |
| Investor Class | | 2014 | | | 2013 | | | 2012 | | | 2011 | | | 2010 | |
Net Asset Value, Beginning of Year | | $ | 8.90 | | | $ | 9.17 | | | $ | 9.30 | | | $ | 10.24 | | | $ | 9.96 | |
Income (Loss) from Investment Operations: | | | | | | | | | | | | | | | | | | | | |
Net investment loss1 | | | (0.11 | ) | | | (0.12 | ) | | | (0.12 | ) | | | (0.14 | ) | | | (0.14 | ) |
Net realized and unrealized gain (loss) on investments1 | | | (0.07 | ) | | | — | # | | | (0.01 | ) | | | (0.80 | ) | | | 0.42 | |
Total from investment operations | | | (0.18 | ) | | | (0.12 | ) | | | (0.13 | ) | | | (0.94 | ) | | | 0.28 | |
Less Distributions to Shareholders from: | | | | | | | | | | | | | | | | | | | | |
Net investment income | | | (0.58 | )10 | | | (0.15 | )10 | | | — | | | | — | | | | — | |
Net Asset Value, End of Year | | $ | 8.14 | | | $ | 8.90 | | | $ | 9.17 | | | $ | 9.30 | | | $ | 10.24 | |
Total Return2 | | | (2.07 | )%7 | | | (1.28 | )%7 | | | (1.40 | )% | | | (9.18 | )%7 | | | 2.81 | %7 |
Ratio of net expenses to average net assets (with offsets/reductions) | | | 1.88 | % | | | 1.90 | %11 | | | 1.92 | % | | | 1.92 | %12 | | | 1.91 | % |
Ratio of expenses to average net assets (with offsets) | | | 1.88 | % | | | 1.90 | %11 | | | 1.92 | % | | | 1.92 | %12 | | | 1.92 | % |
Ratio of total expenses to average net assets (without offsets/reductions)3 | | | 2.54 | % | | | 2.65 | %11 | | | 2.65 | % | | | 2.58 | %12 | | | 2.55 | % |
Ratio of net investment loss to average net assets2 | | | (1.35 | )% | | | (1.37 | )%11 | | | (1.35 | )% | | | (1.47 | )%12 | | | (1.39 | )% |
Portfolio turnover | | | — | | | | — | | | | — | | | | 12 | % | | | 17 | % |
Net assets at end of year (000’s omitted) | | $ | 24,150 | | | $ | 58,165 | | | $ | 237,013 | | | $ | 362,659 | | | $ | 518,118 | |
| | | | | | | | | | | | | | | | | | | | |
| | |
| | | | | | For the fiscal period ended | |
| | | For the fiscal years ended October 31, | | |
| Service Class | | 2014 | | | 2013 | | | 2012 | | | 2011 | | | October 31, 2010## | |
Net Asset Value, Beginning of Period | | $ | 8.93 | | | $ | 9.25 | | | $ | 9.36 | | | $ | 10.27 | | | $ | 9.97 | |
Income from Investment Operations: | | | | | | | | | | | | | | | | | | | | |
Net investment loss1 | | | (0.09 | ) | | | (0.09 | ) | | | (0.10 | ) | | | (0.11 | ) | | | (0.10 | ) |
Net realized and unrealized gain (loss) on investments1 | | | (0.06 | ) | | | — | # | | | (0.01 | ) | | | (0.80 | ) | | | 0.40 | |
Total from investment operations | | | (0.15 | ) | | | (0.09 | ) | | | (0.11 | ) | | | (0.91 | ) | | | 0.30 | |
Less Distributions to Shareholders from: | | | | | | | | | | | | | | | | | | | | |
Net investment income | | | (0.62 | )10 | | | (0.23 | )10 | | | — | | | | — | | | | — | |
Net Asset Value, End of Period | | $ | 8.16 | | | $ | 8.93 | | | $ | 9.25 | | | $ | 9.36 | | | $ | 10.27 | |
Total Return2 | | | (1.69 | )%7 | | | (1.02 | )% | | | (1.18 | )% | | | (8.86 | )% | | | 3.01 | %13 |
Ratio of net expenses to average net assets (with offsets/reductions) | | | 1.58 | % | | | 1.60 | %11 | | | 1.62 | % | | | 1.63 | %12 | | | 1.70 | %14 |
Ratio of expenses to average net assets (with offsets) | | | 1.58 | % | | | 1.60 | %11 | | | 1.62 | % | | | 1.63 | %12 | | | 1.70 | %14 |
Ratio of total expenses to average net assets (without offsets/reductions)3 | | | 2.24 | % | | | 2.35 | %11 | | | 2.35 | % | | | 2.29 | %12 | | | 2.36 | %14 |
Ratio of net investment loss to average net assets2 | | | (1.06 | )% | | | (1.03 | )%11 | | | (1.05 | )% | | | (1.18 | )%12 | | | (1.17 | )%14 |
Portfolio turnover | | | — | | | | — | | | | — | | | | 12 | % | | | 17 | % |
Net assets at end of period (000’s omitted) | | $ | 31,390 | | | $ | 39,060 | | | $ | 44,587 | | | $ | 43,870 | | | $ | 18,049 | |
| | | | | | | | | | | | | | | | | | | | |
42
AMG FQ Global Alternatives Fund
Financial Highlights
For a share outstanding throughout each fiscal period
| | | | | | | | | | | | | | | | | | | | |
| | | For the fiscal years ended October 31, | | | For the fiscal period ended | |
| Institutional Class | | 2014 | | | 2013 | | | 2012 | | | 2011 | | | October 31, 2010## | |
Net Asset Value, Beginning of Period | | $ | 8.96 | | | $ | 9.28 | | | $ | 9.38 | | | $ | 10.28 | | | $ | 9.97 | |
Income (Loss) from Investment Operations: | | | | | | | | | | | | | | | | | | | | |
Net investment loss1 | | | (0.08 | ) | | | (0.08 | ) | | | (0.08 | ) | | | (0.10 | ) | | | (0.08 | ) |
Net realized and unrealized gain (loss) on investments1 | | | (0.06 | ) | | | 0.01 | | | | (0.02 | ) | | | (0.80 | ) | | | 0.39 | |
Total from investment operations | | | (0.14 | ) | | | (0.07 | ) | | | (0.10 | ) | | | (0.90 | ) | | | 0.31 | |
Less Distributions to Shareholders from: | | | | | | | | | | | | | | | | | | | | |
Net investment income | | | (0.64 | )10 | | | (0.25 | )10 | | | — | | | | — | | | | — | |
Net Asset Value, End of Period | | $ | 8.18 | | | $ | 8.96 | | | $ | 9.28 | | | $ | 9.38 | | | $ | 10.28 | |
Total Return2 | | | (1.62 | )%7 | | | (0.77 | )%7 | | | (1.07 | )% | | | (8.75 | )%7 | | | 3.11 | %7,13 |
Ratio of net expenses to average net assets (with offsets/reductions) | | | 1.43 | % | | | 1.45 | %11 | | | 1.47 | % | | | 1.48 | %12 | | | 1.48 | %14 |
Ratio of expenses to average net assets (with offsets) | | | 1.43 | % | | | 1.45 | %11 | | | 1.47 | % | | | 1.48 | %12 | | | 1.48 | %14 |
Ratio of total expenses to average net assets (without offsets/reductions)3 | | | 2.09 | % | | | 2.20 | %11 | | | 2.20 | % | | | 2.14 | %12 | | | 2.14 | %14 |
Ratio of net investment loss to average net assets2 | | | (0.91 | )% | | | (0.89 | )%11 | | | (0.90 | )% | | | (1.03 | )%12 | | | (0.95 | )%14 |
Portfolio turnover | | | — | | | | — | | | | — | | | | 12 | % | | | 17 | % |
Net assets at end of period (000’s omitted) | | $ | 8,850 | | | $ | 21,613 | | | $ | 24,242 | | | $ | 31,045 | | | $ | 25,856 | |
| | | | | | | | | | | | | | | | | | | | |
43
AMG FQ Global Risk-Balanced Fund
Financial Highlights
For a share outstanding throughout each fiscal period
| | | | | | | | | | | | | | | | | | | | |
| | | For the fiscal years ended October 31, | | | For the fiscal
period ended | |
| Investor Class | | 2014 | | | 2013 | | | 2012 | | | 2011 | | | October 31, 2010* | |
Net Asset Value, Beginning of Period | | $ | 13.14 | | | $ | 13.36 | | | $ | 12.80 | | | $ | 12.73 | | | $ | 11.36 | |
Income from Investment Operations: | | | | | | | | | | | | | | | | | | | | |
Net investment income (loss)1 | | | 0.17 | | | | 0.03 | | | | (0.04 | ) | | | 0.01 | | | | (0.07 | ) |
Net realized and unrealized gain on investments1 | | | 0.53 | | | | 0.13 | | | | 1.11 | | | | 0.62 | | | | 1.44 | |
Total from investment operations | | | 0.70 | | | | 0.16 | | | | 1.07 | | | | 0.63 | | | | 1.37 | |
Less Distributions to Shareholders from: | | | | | | | | | | | | | | | | | | | | |
Net investment income | | | — | | | | (0.38 | )10 | | | (0.51 | )10 | | | (0.56 | )10 | | | — | |
Net Asset Value, End of Period | | $ | 13.84 | | | $ | 13.14 | | | $ | 13.36 | | | $ | 12.80 | | | $ | 12.73 | |
Total Return2 | | | 5.33 | % | | | 1.16 | % | | | 8.67 | %7 | | | 5.23 | %7 | | | 12.06 | %7,13 |
Ratio of net expenses to average net assets (with offsets/reductions) | | | 1.38 | % | | | 1.41 | %15 | | | 1.44 | % | | | 1.47 | % | | | 1.46 | %14 |
Ratio of expenses to average net assets (with offsets) | | | 1.38 | % | | | 1.41 | %15 | | | 1.44 | % | | | 1.47 | % | | | 1.46 | %14 |
Ratio of total expenses to average net assets (without offsets/reductions)3 | | | 1.52 | % | | | 1.55 | %15 | | | 1.50 | % | | | 1.49 | % | | | 1.54 | %14 |
Ratio of net investment income (loss) to average net assets2 | | | 1.30 | % | | | 0.25 | %15 | | | (0.32 | )% | | | 0.06 | % | | | (0.72 | )%14 |
Portfolio turnover | | | 5 | % | | | 36 | % | | | 43 | % | | | 80 | % | | | 127 | % |
Net assets at end of period (000’s omitted) | | $ | 2,228 | | | $ | 5,520 | | | $ | 13,043 | | | $ | 7,824 | | | $ | 6,517 | |
| | | | | | | | | | | | | | | | | | | | |
| | |
| | | For the fiscal years ended October 31, | | | For the fiscal
period ended | |
| Service Class | | 2014 | | | 2013 | | | 2012 | | | 2011 | | | October 31, 2010* | |
Net Asset Value, Beginning of Period | | $ | 13.21 | | | $ | 13.44 | | | $ | 12.86 | | | $ | 12.77 | | | $ | 11.36 | |
Income from Investment Operations: | | | | | | | | | | | | | | | | | | | | |
Net investment income (loss)1 | | | 0.23 | | | | 0.08 | | | | (0.02 | ) | | | 0.03 | | | | (0.04 | ) |
Net realized and unrealized gain on investments1 | | | 0.54 | | | | 0.14 | | | | 1.15 | | | | 0.62 | | | | 1.45 | |
Total from investment operations | | | 0.77 | | | | 0.22 | | | | 1.13 | | | | 0.65 | | | | 1.41 | |
Less Distributions to Shareholders from: | | | | | | | | | | | | | | | | | | | | |
Net investment income | | | — | | | | (0.45 | )10 | | | (0.55 | )10 | | | (0.56 | )10 | | | — | |
Net Asset Value, End of Period | | $ | 13.98 | | | $ | 13.21 | | | $ | 13.44 | | | $ | 12.86 | | | $ | 12.77 | |
Total Return2 | | | 5.83 | % | | | 1.61 | % | | | 9.11 | % | | | 5.44 | % | | | 12.41 | %13 |
Ratio of net expenses to average net assets (with offsets/reductions) | | | 0.96 | % | | | 0.99 | %15 | | | 0.99 | % | | | 1.15 | % | | | 1.17 | %14 |
Ratio of expenses to average net assets (with offsets) | | | 0.96 | % | | | 0.99 | %15 | | | 0.99 | % | | | 1.15 | % | | | 1.17 | %14 |
Ratio of total expenses to average net assets (without offsets/reductions)3 | | | 1.10 | % | | | 1.13 | %15 | | | 1.08 | % | | | 1.17 | % | | | 1.25 | %14 |
Ratio of net investment income (loss) to average net assets2 | | | 1.72 | % | | | 0.63 | %15 | | | (0.14 | )% | | | 0.24 | % | | | (0.43 | )%14 |
Portfolio turnover | | | 5 | % | | | 36 | % | | | 43 | % | | | 80 | % | | | 127 | % |
Net assets at end of period (000’s omitted) | | $ | 2,537 | | | $ | 5,844 | | | $ | 11,738 | | | $ | 1,103 | | | $ | 217 | |
| | | | | | | | | | | | | | | | | | | | |
44
AMG FQ Global Risk-Balanced Fund
Financial Highlights
For a share outstanding throughout each fiscal year
| | | | | | | | | | | | | | | | | | | | |
| | | For the fiscal years ended October 31, | |
| Institutional Class | | 2014 | | | 2013 | | | 2012 | | | 2011 | | | 2010** | |
Net Asset Value, Beginning of Year | | $ | 13.23 | | | $ | 13.47 | | | $ | 12.88 | | | $ | 12.77 | | | $ | 11.16 | |
Income from Investment Operations: | | | | | | | | | | | | | | | | | | | | |
Net investment income (loss)1 | | | 0.24 | | | | 0.10 | | | | 0.03 | | | | 0.08 | | | | (0.01 | ) |
Net realized and unrealized gain on investments1 | | | 0.55 | | | | 0.12 | | | | 1.12 | | | | 0.61 | | | | 1.72 | |
Total from investment operations | | | 0.79 | | | | 0.22 | | | | 1.15 | | | | 0.69 | | | | 1.71 | |
Less Distributions to Shareholders from: | | | | | | | | | | | | | | | | | | | | |
Net investment income | | | — | | | | (0.46 | )10 | | | (0.56 | )10 | | | (0.58 | )10 | | | (0.10 | ) |
Net Asset Value, End of Year | | $ | 14.02 | | | $ | 13.23 | | | $ | 13.47 | | | $ | 12.88 | | | $ | 12.77 | |
Total Return2 | | | 5.97 | % | | | 1.61 | % | | | 9.29 | % | | | 5.70 | %7 | | | 15.41 | %7 |
Ratio of net expenses to average net assets (with offsets/reductions) | | | 0.88 | % | | | 0.91 | %15 | | | 0.94 | % | | | 0.97 | % | | | 0.97 | % |
Ratio of expenses to average net assets (with offsets) | | | 0.88 | % | | | 0.91 | %15 | | | 0.94 | % | | | 0.97 | % | | | 0.97 | % |
Ratio of total expenses to average net assets (without offsets/reductions)3 | | | 1.02 | % | | | 1.05 | %15 | | | 1.00 | % | | | 0.99 | % | | | 1.05 | % |
Ratio of net investment income (loss) to average net assets2 | | | 1.76 | % | | | 0.75 | %15 | | | 0.20 | % | | | 0.64 | % | | | (0.09 | )% |
Portfolio turnover | | | 5 | % | | | 36 | % | | | 43 | % | | | 80 | % | | | 127 | % |
Net assets at end of year (000’s omitted) | | $ | 73,437 | | | $ | 88,419 | | | $ | 99,173 | | | $ | 86,935 | | | $ | 93,903 | |
| | | | | | | | | | | | | | | | | | | | |
45
Notes to Financial Highlights
The following footnotes should be read in conjunction with the Financial Highlights of the Funds previously presented in this report.
| # | Rounds to less than $0.01 per share or 0.01%. |
| ## | Commenced operations on January 1, 2010. |
| * | Investor Class and Service Class shares commenced operations on January 1, 2010. |
| ** | Effective January 1, 2010, existing shares of AMG FQ Global Risk-Balanced Fund were reclassified and redesignated as Institutional Class shares. |
| 1 | Per share numbers have been calculated using average shares. |
| 2 | Total returns and net investment income would have been lower had certain expenses not been offset. |
| 3 | Excludes the impact of expense reimbursements or fee waivers and expense reductions such as brokerage credits, but includes non-reimbursable expenses, if any, such as interest and taxes. |
| 4 | Includes non-recurring dividends. Without these dividends, net investment income per class would have been $0.00 and $0.05 for AMG FQ Tax-Managed U.S. Equity Fund’s Investor Class and Institutional Class, respectively, and $0.16 and $0.21 for AMG FQ U.S. Equity Fund’s Investor Class and Institutional Class, respectively. |
| 5 | Includes non-routine extraordinary expenses amounting to 0.025% and 0.024% of average net assets for the Investor Class and Institutional Class, respectively. |
| 6 | Includes non-recurring dividends. Without these dividends, net investment income per class would have been $0.01, and $0.05 for AMG FQ Tax-Managed U.S. Equity Fund’s Investor Class and Institutional Class Shares, respectively. |
| 7 | The total return is based on the Financial Statement Net Asset Values as shown above. |
| 8 | Includes non-routine extraordinary expenses amounting to 0.022% and 0.023% of average net assets for the Investor Class, and Institutional Class, respectively. |
| 9 | Excludes tax expense for the fiscal year ended October 31, 2011 of $2,454 or 0.01%. |
| 10 | The per share income distribution shown for the Institutional, Service, and Investor Class shares represents income derived primarily from foreign currency gains. (See Note 1(d)) of Notes to Financial Statements.) |
| 11 | Includes non-routine extraordinary expenses amounting to 0.020%, 0.018% and 0.020% of average net assets for the Investor Class, Service Class and Institutional Class, respectively. |
| 12 | Includes interest expense for the fiscal year ended October 31, 2011, of $62,878 or 0.01%. |
| 15 | Includes non-routine extraordinary expenses amounting to 0.026%, 0.023% and 0.026% of average net assets for the Investor Class, Service Class and Institutional Class, respectively. |
46
Notes to Financial Statements
October 31, 2014
1. SUMMARY OF SIGNIFICANT ACCOUNTING POLICIES
AMG Funds I (formerly Managers Trust I) (the “Trust”) is an open-end management investment company, organized as a Massachusetts business trust, and registered under the Investment Company Act of 1940, as amended (the “1940 Act”). Currently, the Trust consists of a number of different funds, each having distinct investment management objectives, strategies, risks, and policies. Included in this report are: AMG FQ Tax-Managed U.S. Equity Fund (“Tax-Managed”) (formerly Managers AMG FQ Tax-Managed U.S. Equity Fund), AMG FQ U.S. Equity Fund (“U.S. Equity”) (formerly Managers AMG FQ U.S. Equity Fund), AMG FQ Global Alternatives Fund (“Global Alternatives”) (formerly Managers AMG FQ Global Alternatives Fund) and AMG FQ Global Risk-Balanced Fund (“Global Risk-Balanced”) (formerly Managers AMG FQ Global Essentials Fund), each a “Fund” and collectively the “Funds.”
Effective December 1, 2012, Class A shares of the Tax-Managed, U.S. Equity and Global Alternatives Funds were renamed Investor Class shares. On November 30, 2012, at the close of business, all outstanding Class C shares of the Tax-Managed, U.S. Equity and Global Alternatives Funds were automatically converted to a number of full and/or fractional Investor Class shares equal in value to the shareholder Class C shares of each respective Fund.
Tax-Managed and U.S. Equity each offer two classes of shares: Investor Class and Institutional Class. Global Alternatives and Global Risk-Balanced each offers three classes of shares: Investor Class, Service Class and Institutional Class. Each class represents an interest in the same assets of the Fund. Although all share classes generally have identical voting rights, each share class votes separately when required by law. Different share classes may pay different distribution amounts to the extent the net asset value per share and/or the expenses of such share classes differ. Each share class has its own expense structure. Please refer to a current prospectus for additional information on each share class.
The Funds’ financial statements are prepared in accordance with accounting principles generally accepted in the United States of America (“U.S. GAAP”), which require management to make estimates and assumptions that affect the reported amounts of assets and liabilities and disclosure of contingent assets and liabilities at the date of the financial statements and the reported amounts of income and expenses during the reporting period. Actual results could differ from those estimates and such differences could be material. The following is a summary of significant accounting policies followed by the Funds in the preparation of their financial statements:
a. VALUATION OF INVESTMENTS
Equity securities traded on a domestic or international securities exchange are valued at the last quoted sale price, or, lacking any sales, at the last quoted bid price. Equity securities primarily traded on an international securities exchange and equity securities traded on NASDAQ or in a U.S. or non-U.S. over-the-counter (“OTC”) market are valued at the market’s official closing price, or, if there are no trades on the applicable date, at the last quoted bid price. In addition, if the applicable market does not offer an official closing price or if the official closing price is not representative of the overall market, equity securities primarily traded on an international securities exchange and equity securities traded in a non-U.S. over-the counter market are valued at the last quoted sales price. The Funds’ investments are generally valued based on independent
market quotations or prices or, if none, “evaluative” or other market based valuations provided by third-party pricing services approved by the Board of Trustees of the Funds (the “Board”).
Fixed-income securities are valued based on valuations furnished by independent pricing services that utilize matrix systems, which reflect such factors as security prices, yields, maturities, and ratings, and are supplemented by dealer and exchange quotations. Debt obligations (other than short term debt obligations that have 60 days or less remaining until maturity) will be valued using the evaluated bid price or the mean price provided by an authorized pricing service. Futures contracts for which market quotations are readily available are valued at the settlement price as of the close of the futures exchange. Short-term debt obligations (debt obligations with maturities of one year or less at the time of issuance) that have 60 days or less remaining until maturity will be valued at amortized cost. Investments in other open-end regulated investment companies are valued at their end of day net asset value per share except ETF’s, which are valued the same as equity securities.
Under certain circumstances, the value of certain Fund investments (including derivatives) may be based on an evaluation of fair value, pursuant to procedures established by and under the general supervision of the Board. The Pricing Committee is the committee formed by the Board to make fair value determinations for such investments. Each Fund may use the fair value of a portfolio investment to calculate its net asset value (“NAV”) in the event that the market quotation, price or market based valuation for the portfolio investment is not deemed to be readily available or otherwise not determinable pursuant to the Board’s valuation procedures, if AMG Funds LLC (formerly Managers Investment Group LLC) (the “Investment Manager”) believes the quotation, price or market based valuation to be unreliable, or in certain other circumstances. When determining the fair value of an investment, the Pricing Committee seeks to determine the price that the Fund might reasonably expect to receive from a current sale of that investment in an arms-length transaction. Fair value determinations shall be based upon consideration of all available facts and information, including, but not limited to (i) attributes specific to the investment; (ii) fundamental analytical data and press releases relating to the investment and its issuer; and (iii) the value of other comparable securities or relevant financial instruments, including derivative securities, traded on other markets or among dealers.
The values assigned to fair value investments are based on available information and do not necessarily represent amounts that might ultimately be realized in the future, since such amounts depend on future developments inherent in long-term investments. Because of the inherent uncertainty of valuation, those estimated values may differ significantly from the values that would have been used had a ready market for the investments existed, and the differences could be material. The Board will be presented with a quarterly report showing as of the most recent quarter end, all outstanding securities fair valued by the Pricing Committee, including a comparison with the prior quarter end and the percentage of the Fund that the security represents at each quarter end.
Portfolio investments that trade primarily on foreign markets are priced based upon the market quotation of such securities as of the close of their respective principal markets. Under certain circumstances, on behalf of a fund that
Notes to Financial Statements (continued)
invests in international securities, the Investment Manager or applicable subadvisor may recommend an adjustment of such prices based on its determination of the impact of events occurring subsequent to the close of such markets but prior to the time as of which each Fund calculates its NAV. The Board has also adopted a policy that securities held in a fund that invests in international securities and certain foreign debt obligations held by a fund, in each case, that can be fair valued by the applicable fair value pricing service are fair valued on each business day without regard to a “trigger” (e.g., without regard to invoking fair value based upon a change in a U.S. equity securities index exceeding a pre-determined level). The Funds may invest in securities that may be thinly traded. The Board has adopted procedures to adjust prices of securities that are judged to be stale so that they reflect fair value. An investment valued on the basis of its fair value may be valued at a price higher or lower than available market quotations.
U.S. GAAP defines fair value as the price that a fund would receive to sell an asset or pay to transfer a liability in an orderly transaction between market participants at the measurement date. U.S. GAAP also establishes a framework for measuring fair value, and a three-level hierarchy for fair value measurements based upon the transparency of inputs to the valuation of an asset or liability. Inputs may be observable or unobservable and refer broadly to the assumptions that market participants would use in pricing the asset or liability. Observable inputs reflect the assumptions market participants would use in pricing the asset or liability based on market data obtained from sources independent of the Funds. Unobservable inputs reflect the Funds’ own assumptions about the assumptions that market participants would use in pricing the asset or liability developed based on the best information available in the circumstances. Each investment is assigned a level based upon the observability of the inputs which are significant to the overall valuation.
The three-tier hierarchy of inputs is summarized below:
Level 1 – inputs are quoted prices in active markets for identical investments (e.g., equity securities, open-end investment companies, futures contracts, option contracts)
Level 2 – other observable inputs (including, but not limited to: quoted prices for similar assets or liabilities in markets that are active, quoted prices for identical or similar assets or liabilities in markets that are not active, inputs other than quoted prices that are observable for the assets or liabilities (such as interest rates, yield curves, volatilities, prepayment speeds, loss severities, credit risks and default rates) or other market corroborated inputs) (e.g., debt securities, government securities, foreign currency exchange contracts, foreign securities utilizing international fair value pricing, broker-quoted securities, fair valued securities with observable inputs)
Level 3 – inputs are significant unobservable inputs (including the Fund’s own assumptions used to determine the fair value of investments) (e.g., fair valued securities with unobservable inputs)
Changes in inputs or methodologies used for valuing investments may result in a transfer in or out of levels within the fair value hierarchy. The inputs or methodologies used for valuing investments may not necessarily be an indication of the risk associated with investing in those investments.
b. SECURITY TRANSACTIONS
Security transactions are accounted for as of trade date. Realized gains and losses on securities sold are determined on the basis of identified cost.
c. INVESTMENT INCOME AND EXPENSES
Dividend income is recorded on the ex-dividend date. Dividend and interest income on foreign securities is recorded gross of any withholding tax. Interest income, which includes amortization of premium and accretion of discount on debt securities, is accrued as earned. Non-cash dividends included in dividend income, if any, are reported at the fair market value of the securities received. Distributions received in excess of income from return of capital including real estate investment trusts (REITs) are recorded as a reduction of the cost of the related investment and/or as a realized gain. If the Funds no longer own the applicable securities, any distributions received in excess of income are recorded as an adjustment to realized gain. Other income and expenses are recorded on an accrual basis. Expenses that cannot be directly attributed to a Fund are apportioned among the Funds in the Trust and in some cases other affiliated funds based upon their relative average net assets or number of shareholders. Investment income, realized and unrealized capital gains and losses, the common expenses of each Fund, and certain Fund level expense reductions, if any, are allocated on a pro-rata basis to each class based on the relative net assets of each class to the total net assets of each Fund.
The Funds have a “balance credit” arrangement with The Bank of New York Mellon (“BNYM”), the Funds’ custodian, whereby each Fund is credited with an interest factor equal to 0.75% below the effective 90-day T-Bill rate for account balances left uninvested overnight. If the T-Bill rate falls below 0.75%, no credits will be earned. These credits serve to reduce custodian expenses that would otherwise be charged to each Fund. For the fiscal year ended October 31, 2014, the Funds’ custodian expense was not reduced.
Overdraft fees are computed at 1% above the effective Federal Funds rate on the day of the overdraft. Prior to January 1, 2013, the rate was 2% above the effective Federal Funds rate. For the fiscal year ended October 31, 2014, overdraft fees for Tax-Managed and U.S. Equity equaled $2 and $44, respectively.
The Trust held a shareholder meeting at which shareholders approved a new Declaration of Trust for the Trust, among other proposals. The costs associated with this proxy statement and shareholder meeting are being treated as “extraordinary expenses,” and, therefore, are excluded from the expense limitation agreement described in Note 2.
d. DIVIDENDS AND DISTRIBUTIONS
Fund distributions resulting from either net investment income or realized net capital gains, if any, will normally be declared and paid at least annually in December, as described in the Funds’ prospectus. Distributions to shareholders are recorded on the ex-dividend date. Distributions are determined in accordance with federal income tax regulations, which may differ from net investment income and net realized capital gains for financial statement purposes (U.S. GAAP). Differences may be permanent or temporary. Permanent differences are reclassified among capital accounts in the financial statements to reflect their tax character. Temporary differences arise when certain items of income, expense and gain or loss are recognized in different periods for
Notes to Financial Statements (continued)
financial statement and tax purposes; these differences will reverse at some time in the future. The differences are due to wash sales, foreign currency, futures, and market discount transactions. Permanent book and tax basis
differences, if any, relating to shareholder distributions will result in reclassifications to paid-in capital.
The tax character of distributions paid during the fiscal years ended October 31, 2013 and October 31, 2014 were as follows:
| | | | | | | | | | | | | | | | | | | | | | | | | | | | | | | | |
| | | Tax-Managed | | | U.S. Equity | | | Global Alternatives | | | Global Risk-Balanced | |
| | | 2014 | | | 2013 | | | 2014 | | | 2013 | | | 2014 | | | 2013 | | | 2014 | | | 2013 | |
Distributions paid from: | | | | | | | | | | | | | | | | | | | | | | | | | | | | | | | | |
Ordinary income | | $ | 154,296 | | | $ | 375,329 | | | $ | 641,201 | | | $ | 855,935 | | | $ | 7,525,504 | | | $ | 3,491,617 | | | | — | | | $ | 3,945,692 | |
Short-term capital gains | | | — | | | | — | | | | — | | | | — | | | | — | | | | — | | | | — | | | | — | |
Long-term capital gains | | | — | | | | — | | | | — | | | | — | | | | 434 | | | | — | | | | — | | | | — | |
Return of capital | | | — | | | | — | | | | — | | | | — | | | | — | | | | — | | | | — | | | | — | |
| | | | | | | | | | | | | | | | | | | | | | | | | | | | | | | | |
Totals | | $ | 154,296 | | | $ | 375,329 | | | $ | 641,201 | | | $ | 855,935 | | | $ | 7,525,938 | | | $ | 3,491,617 | | | | — | | | $ | 3,945,692 | |
| | | | | | | | | | | | | | | | | | | | | | | | | | | | | | | | |
As of October 31, 2014, the components of distributable earnings (excluding unrealized appreciation/depreciation) on tax basis consisted of:
| | | | | | | | | | | | | | | | |
| | | Tax-Managed | | | U.S. Equity | | | Global Alternatives | | | Global Risk-Balanced | |
Capital loss carryforward | | $ | 14,308,121 | | | $ | 729,379 | | | | — | | | $ | 10,666,235 | |
Late-year loss deferral | | | — | | | | — | | | $ | 886,351 | | | | — | |
Undistributed ordinary income | | | 157,508 | | | | 7,147 | | | | — | | | | 2,068,554 | |
Undistributed short-term capital gains | | | — | | | | — | | | | — | | | | — | |
Undistributed long-term capital gains | | | — | | | | — | | | | 3,586,865 | | | | — | |
e. FEDERAL TAXES
Each Fund intends to comply with the requirements under Subchapter M of the Internal Revenue Code of 1986, as amended, and to distribute substantially all of its taxable income and gains to its shareholders and to meet certain diversification and income requirements with respect to investment companies. Therefore, no provision for federal income or excise tax is included in the accompanying financial statements.
Additionally, based on each Fund’s understanding of the tax rules and rates related to income, gains and transactions for the foreign jurisdictions in which it invests, each Fund will provide for foreign taxes, and where appropriate, deferred foreign taxes.
Management has analyzed the Funds’ tax positions taken on federal income tax returns as of October 31, 2014, and for all open tax years (generally, the three prior taxable years), and has concluded that no provision for federal income tax is required in the Funds’ financial statements. Additionally, the Funds are not aware of any tax position for which it is reasonably possible that the total amounts of unrecognized tax benefits will change materially in the next twelve months.
Net capital losses incurred in taxable years beginning after the enactment of the Regulated Investment Company Modernization Act of 2010, may be carried forward for an unlimited time period. Such losses will be required to be utilized prior to any loss carryovers incurred in pre-enactment taxable years, which generally expire eight years following the close of the taxable year in which they were incurred. As a result of this ordering rule, pre-enactment capital loss carryovers may be more likely to expire unused. Additionally, post-enactment capital losses that are carried forward retain their tax character as either short-term or long-term capital losses, unlike pre-enactment losses which are considered all short-term.
f. CAPITAL LOSS CARRYOVERS AND DEFERRALS
As of October 31, 2014, the following Funds had accumulated net realized capital loss carryovers from securities transactions for federal income tax purposes as shown in the following chart. These amounts may be used to offset future realized capital gains, if any, through the expiration dates listed or in the case of post-enactment losses, for an unlimited time period.
| | | | | | | | | | | | |
| | | Capital Loss | | | | |
| | | Carryover Amounts | | | Expires | |
| Fund | | Short-Term | | | Long-Term | | | October 31, | |
Tax-Managed | | | | | | | | | | | | |
(Pre-Enactment) | | $ | 14,308,121 | | | | — | | | | 2017 | |
U.S. Equity | | | | | | | | | | | | |
(Pre-Enactment) | | $ | 729,379 | | | | — | | | | 2017 | |
Global Risk-Balanced | | | | | | | | | | | | |
(Pre-Enactment) | | $ | 10,666,235 | | | | — | | | | 2017 | |
For the fiscal year ended October 31, 2014, the following Funds utilized capital loss carryovers in the amount of:
| | | | | | | | | | |
| | | Capital Loss Carryover Utilized | |
| | | Short-Term | | | Long-Term | | | |
Tax-Managed | | $ | 4,366,253 | | | | | | — | |
U.S. Equity | | | 7,304,771 | | | | | | — | |
Global Alternatives | | | 3,073,927 | | | | | | — | |
Global Risk-Balanced | | | 4,385,031 | | | | | | — | |
Notes to Financial Statements (continued)
g. CAPITAL STOCK
The Trust’s Declaration of Trust authorizes for each series the issuance of an unlimited number of shares of beneficial interest, without par value. Each Fund records sales and repurchases of its capital stock on the trade date. The cost of securities contributed to the Funds in connection with the issuance of shares is based on the valuation of those securities in accordance with the Funds’ policy on investment valuation.
For the fiscal years ended October 31, 2014 and October 31, 2013, the capital stock transactions by class for Tax-Managed, U.S. Equity, Global Alternatives and Global Risk-Balanced were as follows:
| | | | | | | | | | | | | | | | | | | | | | | | | | | | | | | | |
| | | Tax-Managed | | | U.S. Equity | |
| | | October 31, 2014 | | | October 31, 2013 | | | October 31, 2014 | | | October 31, 2013 | |
| | | Shares | | | Amount | | | Shares | | | Amount | | | Shares | | | Amount | | | Shares | | | Amount | |
Investor Class: | | | | | | | | | | | | | | | | | | | | | | | | | | | | | | | | |
Proceeds from sale of shares† | | | 386,272 | | | $ | 8,486,117 | | | | 205,826 | | | $ | 3,228,327 | | | | 286,365 | | | $ | 4,693,895 | | | | 705,035 | | | $ | 9,826,464 | |
Reinvestment of distributions | | | 344 | | | | 7,388 | | | | 2,390 | | | | 36,540 | | | | 11,048 | | | | 182,960 | | | | 15,831 | | | | 214,473 | |
Cost of shares repurchased | | | (170,687 | ) | | | (3,673,280 | ) | | | (89,202 | ) | | | (1,494,904 | ) | | | (306,778 | ) | | | (5,050,651 | ) | | | (242,438 | ) | | | (3,364,257 | ) |
| | | | | | | | | | | | | | | | | | | | | | | | | | | | | | | | |
Net increase (decrease) | | | 215,929 | | | $ | 4,820,225 | | | | 119,014 | 1 | | $ | 1,769,963 | 1 | | | (9,365 | ) | | $ | (173,796 | ) | | | 478,428 | 1 | | $ | 6,676,680 | 1 |
| | | | | | | | | | | | | | | | | | | | | | | | | | | | | | | | |
Class C: | | | | | | | | | | | | | | | | | | | | | | | | | | | | | | | | |
Proceeds from sale of shares | | | — | | | | — | | | | 46 | | | $ | 680 | | | | — | | | | — | | | | 61 | | | $ | 731 | |
Reinvestment of distributions | | | — | | | | — | | | | — | | | | — | | | | — | | | | — | | | | — | | | | — | |
Cost of shares repurchased | | | — | | | | — | | | | (190,519 | ) | | | (2,841,267 | ) | | | — | | | | — | | | | (44,041 | ) | | | (545,096 | ) |
| | | | | | | | | | | | | | | | | | | | | | | | | | | | | | | | |
Net decrease | | | — | | | | — | | | | (190,473 | )2 | | $ | (2,840,587 | )2 | | | — | | | | — | | | | (43,980 | )2 | | $ | (544,365 | )2 |
| | | | | | | | | | | | | | | | | | | | | | | | | | | | | | | | |
Institutional Class: | | | | | | | | | | | | | | | | | | | | | | | | | | | | | | | | |
Proceeds from sale of shares | | | 400,535 | | | $ | 8,695,253 | | | | 235,286 | | | $ | 4,059,672 | | | | 138,039 | | | $ | 2,237,936 | | | | 105,723 | | | $ | 1,479,746 | |
Reinvestment of distributions | | | 6,540 | | | | 139,886 | | | | 20,620 | | | | 314,047 | | | | 27,209 | | | | 448,821 | | | | 46,517 | | | | 623,273 | |
Cost of shares repurchased | | | (416,905 | ) | | | (9,134,817 | ) | | | (500,175 | ) | | | (8,399,601 | ) | | | (233,359 | ) | | | (3,792,159 | ) | | | (440,096 | ) | | | (6,054,716 | ) |
| | | | | | | | | | | | | | | | | | | | | | | | | | | | | | | | |
Net decrease | | | (9,830 | ) | | $ | (299,678 | ) | | | (244,269 | ) | | $ | (4,025,882 | ) | | | (68,111 | ) | | $ | (1,105,402 | ) | | | (287,856 | ) | | $ | (3,951,697 | ) |
| | | | | | | | | | | | | | | | | | | | | | | | | | | | | | | | |
| † | For the fiscal year ended October 31, 2013, 183,714 shares and $2,840,671 are included due to the conversion of Class C shares into Investor Class shares for Tax-Managed and 43,914 shares and $544,417 are included due to the conversion of Class C shares into Investor Class shares for U.S. Equity. |
| 1 | Effective December 1, 2012, all Class A shares were renamed Investor Class shares. |
| 2 | Effective December 1, 2012, all Class C shares converted to Investor Class shares. |
| | | | | | | | | | | | | | | | | | | | | | | | | | | | | | | | |
| | | Global Alternatives | | | Global Risk-Balanced | |
| | | October 31, 2014 | | | October 31, 2013 | | | October 31, 2014 | | | October 31, 2013 | |
| | | Shares | | | Amount | | | Shares | | | Amount | | | Shares | | | Amount | | | Shares | | | Amount | |
Investor Class: | | | | | | | | | | | | | | | | | | | | | | | | | | | | | | | | |
Proceeds from sale of shares† | | | 653,168 | | | $ | 5,445,323 | | | | 4,690,722 | | | $ | 42,644,278 | | | | 86,533 | | | $ | 1,189,918 | | | | 135,790 | | | $ | 1,816,759 | |
Reinvestment of distributions | | | 382,414 | | | | 3,143,440 | | | | 179,330 | | | | 1,617,558 | | | | — | | | | — | | | | 26,780 | | | | 352,700 | |
Cost of shares repurchased | | | (4,606,759 | ) | | | (38,006,355 | ) | | | (24,188,615 | ) | | | (218,773,799 | ) | | | (345,704 | ) | | | (4,665,337 | ) | | | (718,516 | ) | | | (9,297,354 | ) |
| | | | | | | | | | | | | | | | | | | | | | | | | | | | | | | | |
Net decrease | | | (3,571,177 | ) | | $ | (29,417,592 | ) | | | (19,318,563 | )1 | | $ | (174,511,963 | )1 | | | (259,171 | ) | | $ | (3,475,419 | ) | | | (555,946 | ) | | $ | (7,127,895 | ) |
| | | | | | | | | | | | | | | | | | | | | | | | | | | | | | | | |
Class C: | | | | | | | | | | | | | | | | | | | | | | | | | | | | | | | | |
Proceeds from sale of shares | | | — | | | | — | | | | 485 | | | $ | 4,241 | | | | n/a | | | | n/a | | | | n/a | | | | n/a | |
Reinvestment of distributions | | | — | | | | — | | | | — | | | | — | | | | n/a | | | | n/a | | | | n/a | | | | n/a | |
Cost of shares repurchased | | | — | | | | — | | | | (1,768,034 | ) | | | (15,520,802 | ) | | | n/a | | | | n/a | | | | n/a | | | | n/a | |
| | | | | | | | | | | | | | | | | | | | | | | | | | | | | | | | |
Net decrease | | | — | | | | — | | | | (1,767,549 | )2 | | $ | (15,516,561 | )2 | | | n/a | | | | n/a | | | | n/a | | | | n/a | |
| | | | | | | | | | | | | | | | | | | | | | | | | | | | | | | | |
50
Notes to Financial Statements (continued)
| | | | | | | | | | | | | | | | | | | | | | | | | | | | | | | | |
| | | Global Alternatives | | | Global Risk-Balanced | |
| | | October 31, 2014 | | | October 31, 2013 | | | October 31, 2014 | | | October 31, 2013 | |
| | | Shares | | | Amount | | | Shares | | | Amount | | | Shares | | | Amount | | | Shares | | | Amount | |
Service Class: | | | | | | | | | | | | | | | | | | | | | | | | | | | | | | | | |
Proceeds from sale of shares | | | 1,513,774 | | | $ | 12,457,664 | | | | 2,680,416 | | | $ | 24,037,223 | | | | 94,233 | | | $ | 1,331,001 | | | | 485,265 | | | $ | 6,476,211 | |
Reinvestment of distributions | | | 281,457 | | | | 2,313,572 | | | | 101,432 | | | | 915,925 | | | | — | | | | — | | | | 30,275 | | | | 399,327 | |
Cost of shares repurchased | | | (2,320,808 | ) | | | (19,361,407 | ) | | | (3,229,606 | ) | | | (29,276,547 | ) | | | (355,211 | ) | | | (4,688,878 | ) | | | (946,436 | ) | | | (12,572,020 | ) |
| | | | | | | | | | | | | | | | | | | | | | | | | | | | | | | | |
Net decrease | | | (525,577 | ) | | $ | (4,590,171 | ) | | | (447,758 | ) | | $ | (4,323,399 | ) | | | (260,978 | ) | | $ | (3,357,877 | ) | | | (430,896 | ) | | $ | (5,696,482 | ) |
| | | | | | | | | | | | | | | | | | | | | | | | | | | | | | | | |
Institutional Class: | | | | | | | | | | | | | | | | | | | | | | | | | | | | | | | | |
Proceeds from sale of shares | | | 1,710,466 | | | $ | 14,093,245 | | | | 1,772,695 | | | $ | 15,972,797 | | | | 187,750 | | | $ | 2,519,242 | | | | 788,526 | | | $ | 10,408,006 | |
Reinvestment of distributions | | | 168,735 | | | | 1,388,688 | | | | 62,451 | | | | 564,557 | | | | — | | | | — | | | | 235,952 | | | | 3,116,920 | |
Cost of shares repurchased | | | (3,210,880 | ) | | | (26,449,200 | ) | | | (2,033,565 | ) | | | (18,315,909 | ) | | | (1,631,080 | ) | | | (21,848,655 | ) | | | (1,705,440 | ) | | | (22,487,039 | ) |
| | | | | | | | | | | | | | | | | | | | | | | | | | | | | | | | |
Net decrease | | | (1,331,679 | ) | | $ | (10,967,267 | ) | | | (198,419 | ) | | $ | (1,778,555 | ) | | | (1,443,330 | ) | | $ | (19,329,413 | ) | | | (680,962 | ) | | $ | (8,962,113 | ) |
| | | | | | | | | | | | | | | | | | | | | | | | | | | | | | | | |
| † | For the fiscal year ended October 31, 2013, 1,610,344 shares and $14,666,848 are included due to the conversion of Class C shares into Investor Class shares. |
| 1 | Effective December 1, 2012, all Class A shares were renamed Investor Class shares. |
| 2 | Effective December 1, 2012, all Class C shares converted to Investor Class shares. |
At October 31, 2014, certain unaffiliated shareholders of record, specifically omnibus accounts, individually or collectively held greater than 10% of the net assets of the funds as follows: Tax-Managed—one owns 19% and Global Alternatives—three collectively own 50%. Transactions by these shareholders may have a material impact on their respective Funds.
h. REPURCHASE AGREEMENTS
The Funds may enter into repurchase agreements provided that the value of the underlying collateral, including accrued interest, will equal or exceed the value of the repurchase agreement during the term of the agreement. The underlying collateral for all repurchase agreements is held in safekeeping by the Fund’s custodian or at the Federal Reserve Bank. If the seller defaults and the value of the collateral declines, or if bankruptcy proceedings commence with respect to the seller of the security, realization of the collateral by the Fund may be delayed or limited. At October 31, 2014, the market value of repurchase agreements outstanding for Tax-Managed, U.S. Equity and Global Risk-Balanced was $1,285,537, $1,033,368 and $9,502,507, respectively.
i. FOREIGN CURRENCY TRANSLATION
The books and records of the Funds are maintained in U.S. dollars. The value of investments, assets and liabilities denominated in currencies other than U.S. dollars are translated into U.S. dollars based upon current foreign exchange rates. Purchases and sales of foreign investments, income and expenses are converted into U.S. dollars based on currency exchange rates prevailing on the respective dates of such transactions. Net realized and unrealized gain (loss) on foreign currency transactions represent: (1) foreign exchange gains and losses from the sale and holdings of foreign currencies; (2) gains and losses between trade date and settlement date on investment securities transactions and forward foreign currency exchange contracts; and (3) gains and losses from the difference between amounts of interest and dividends recorded and the amounts actually received.
The Funds do not isolate the net realized and unrealized gain or loss resulting from changes in exchange rates from the fluctuations in market prices of securities held. Such fluctuations are included with the net realized and unrealized gain or loss on investments.
j. FOREIGN SECURITIES
Certain Funds invest in securities of foreign entities and in instruments denominated in foreign currencies which involve risks not typically associated with investments in domestic securities. Non-domestic securities carry special risks, such as exposure to currency fluctuations, less developed or less efficient trading markets, political instability, a lack of company information, differing auditing and legal standards, and, potentially, less liquidity.
Realized gains in certain countries may be subject to foreign taxes at the Fund level, at rates ranging from approximately 10% to 15%. The Funds would pay such foreign taxes at the appropriate rate for each jurisdiction.
2. AGREEMENTS AND TRANSACTIONS WITH AFFILIATES
For each of the Funds, the Trust has entered into an investment advisory agreement under which the Investment Manager, a subsidiary and the U.S. retail distribution arm of Affiliated Managers Group, Inc. (“AMG”), serves as Investment Manager to the Funds and is responsible for the Funds’ overall administration and operations. The Investment Manager selects one or more subadvisors for the Funds (subject to Board approval) and monitors each subadvisor’s investment performance, security holdings and investment strategies. Each Fund’s investment portfolios are managed by First Quadrant, L.P. (“First Quadrant”), who serves pursuant to a subadvisory agreement with the Investment Manager. AMG indirectly owns a majority interest in First Quadrant.
Tax-Managed is obligated by the Investment Management Agreement to pay a management fee to the Investment Manager at the annual rate of 0.85% of the
Notes to Financial Statements (continued)
average daily net assets of the Fund. Under the Investment Management Agreement with the Tax-Managed Fund, the Investment Manager provides a variety of administrative services to the Fund. The Investment Manager receives no additional compensation from the Fund for these services. Pursuant to a reimbursement agreement between the Investment Manager and First Quadrant, First Quadrant reimburses the Investment Manager for the costs the Investment Manager bears in providing such services to the Fund.
U.S. Equity, Global Alternatives and Global Risk-Balanced are obligated by the Investment Management Agreement to pay a management fee to the Investment Manager at the annual rate of 0.35%, 1.70% and 0.60%, respectively, of the average daily net assets of the applicable Fund. The Investment Manager, in turn, pays a portion of this fee to First Quadrant for its services as subadvisor.
The Investment Manager has contractually agreed, through at least March 1, 2015, to waive management fees (but not below zero) and/or reimburse Fund expenses in order to limit total annual Fund operating expenses after fee waiver and expense reimbursements (exclusive of taxes, interest (including interest incurred in connection with bank and custody overdrafts), distribution and service (12b-1) fees, brokerage commissions and other transaction costs, acquired fund fees and expenses and extraordinary expenses) of Tax-Managed, U.S. Equity and Global Risk-Balanced to 0.99%, 0.79% and 0.89%, respectively, of each Fund’s average daily net assets subject to later reimbursement by the Funds in certain circumstances. The contractual expense limitation may only be terminated in the event the Investment Manager or a successor ceases to be the Investment Manager of the Fund or a successor fund, by mutual agreement of the Investment Manager and the Trust’s Board of Trustees, or in the event of the Fund’s liquidation unless the Fund is reorganized or is a party to a merger in which the surviving entity is successor to the accounting and performance information of the Fund.
Effective July 1, 2013, the Investment Manager has contractually agreed through at least March 1, 2015, to waive management fees and/or reimburse Fund expenses in order to limit the Global Alternatives Fund’s total annual operating expenses after fee waiver and expense reimbursements (exclusive of taxes, interest (including interest incurred in connection with bank and custody overdrafts), shareholder servicing fees, distribution and service (12b-1) fees, brokerage commissions and other transaction costs, acquired fund fees and expenses, and extraordinary expenses) to 1.44% of average daily net assets. Immediately prior to July 1, 2013, the Fund had a contractual expense limitation of 1.49%.
Each Fund is obligated to repay the Investment Manager such amounts waived, paid or reimbursed in future years provided that the repayment occurs within thirty-six (36) months after the waiver or reimbursement and that such repayment would not cause the Fund’s total annual operating expenses after fee waiver and expense reimbursements in any such future year to exceed that Funds’ contractual expense limitation amount. For the fiscal year ended October 31, 2014, each Fund’s components of reimbursement available are detailed in the following chart:
| | | | | | | | |
| | | Tax-Managed | | | U.S. Equity | |
Reimbursement Available - 10/31/13 | | $ | 156,626 | | | $ | 113,315 | |
Additional Reimbursements | | | 27,397 | | | | 9,528 | |
Repayments | | | (292 | ) | | | (4,993 | ) |
Expired Reimbursements | | | (54,466 | ) | | | (40,466 | ) |
| | | | | | | | |
Reimbursement Available - 10/31/14 | | $ | 129,265 | | | $ | 77,384 | |
| | | | | | | | |
| | |
| | | | | | Global | |
| | | Global | | | Risk- | |
| | | Alternatives | | | Balanced | |
Reimbursement Available - 10/31/13 | | $ | 7,594,213 | | | $ | 218,608 | |
Additional Reimbursements | | | 593,356 | | | | 112,131 | |
Repayments | | | — | | | | — | |
Expired Reimbursements | | | (3,907,033 | ) | | | (24,770 | ) |
| | | | | | | | |
Reimbursement Available - 10/31/14 | | $ | 4,280,536 | | | $ | 305,969 | |
| | | | | | | | |
The Investment Manager has agreed to waive a portion of its management fee in consideration of shareholder servicing fees that it has received from JPMorgan Distribution Services, Inc., with respect to short-term cash investments each Fund may have made in the JPMorgan Liquid Assets Money Market Fund, Capital Shares. For the fiscal year ended October 31, 2014, the management fee for Global Alternatives and Global Risk-Balanced was reduced by $6,088 or 0.01% and $5,954 or 0.01%, respectively.
The aggregate annual retainer paid to each Independent Trustee of the Board is $130,000, plus $7,000 or $2,500 for each regular or special meeting attended, respectively. The Independent Chairman of the Trusts receives an additional payment of $35,000 per year. The Chairman of the Audit Committee receives an additional payment of $15,000 per year. The Trustees’ fees and expenses are allocated among all of the Funds in the Trusts for which the Investment Manager serves as the advisor based on the relative net assets of such Funds. The “Trustees fees and expenses” shown in the financial statements represents each Fund’s allocated portion of the total fees and expenses paid by the AMG Funds family of mutual funds (“AMG Funds family”).
Prior to January 1, 2014, the aggregate annual retainer paid to each Independent Trustee of the Board was $105,000, plus $6,000 or $2,500 for each regular or special meeting attended, respectively. The Independent Chairman of the Trusts formerly received an additional payment of $25,000 per year. The Chairman of the Audit Committee formerly received an additional payment of $10,000 per year.
Prior to January 1, 2013, the aggregate annual retainer paid to each Independent Trustee of the Board was $80,000, plus $5,000 or $2,500 for each regular or special meeting attended, respectively. The Independent Chairman of the Trusts formerly received an additional payment of $20,000 per year. The Chairman of the Audit Committee formerly received an additional payment of $8,000 per year.
The Funds are distributed by AMG Distributors, Inc. (formerly Managers Distributors, Inc.) (the “Distributor”), a wholly-owned subsidiary of the Investment Manager. The Distributor serves as the distributor and underwriter
Notes to Financial Statements (continued)
for each Fund and is a registered broker-dealer and member of the Financial Industry Regulatory Authority, Inc. (“FINRA”). Shares of each Fund will be continuously offered and will be sold directly to prospective purchasers through brokers, dealers or other financial intermediaries who have executed selling agreements with the Distributor. Subject to the compensation arrangement discussed below, generally the Distributor bears all or a portion of the expenses of providing services pursuant to the distribution agreement, including the payment of the expenses relating to the distribution of prospectuses for sales purposes and any advertising or sales literature. Certain Trustees and Officers of the Funds are Officers and/or Directors of the Investment Manager, AMG and/or the Distributor.
The Trust has adopted a distribution and service plan (the “Plan”) with respect to the Investor Class shares, and, through November 30, 2012, Class C shares, in accordance with the requirements of Rule 12b-1 under the 1940 Act and the requirements of the applicable rules of FINRA regarding asset based sales charges. Pursuant to the Plan, each Fund may make payments to the Distributor for its expenditures in financing any activity primarily intended to result in the sale of each such class of Fund’s shares and for maintenance and personal service provided to existing shareholders of that class. The Plan authorizes payments to the Distributor up to 0.25% annually of each Fund’s average daily net assets attributable to the Investor Class shares and, through November 30, 2012, up to 1.00% annually of each Fund’s average daily net assets attributable to the Class C shares.
For each of the Investor and Service Classes, the Board has approved reimbursement payments to the Investment Manager for shareholder servicing expenses (“shareholder servicing fees”) incurred. Shareholder servicing fees include payments to third parties such as a bank, broker-dealer, trust company or other financial intermediaries who provide shareholder recordkeeping and account servicing services. The Investor and Service Class shares may reimburse the Investment Manager for the actual amount incurred up to a maximum annual rate of each Class’s average daily net assets as shown in the table below.
The impact on the annualized expense ratios for the fiscal year ended October 31, 2014 was as follows:
| | | | | | | | |
| | | Maximum | | | Actual | |
| | | Amount | | | Amount | |
| Fund | | Allowed | | | Incurred | |
Tax-Managed | | | | | | | | |
Investor Class | | | n/a | | | | n/a | |
U.S. Equity | | | | | | | | |
Investor Class | | | n/a | | | | n/a | |
Global Alternatives | | | | | | | | |
Investor Class | | | 0.20 | % | | | 0.20 | % |
Service Class | | | 0.25 | % | | | 0.15 | % |
Global Risk-Balanced | | | | | | | | |
Investor Class | | | 0.25 | % | | | 0.25 | % |
Service Class | | | 0.25 | % | | | 0.08 | % |
The Securities and Exchange Commission granted an exemptive order that permits the Funds to lend and borrow money for certain temporary purposes directly to and from other eligible Funds in the AMG Funds family. Participation in this interfund lending program is voluntary for both the borrowing and lending Funds, and an interfund loan is only made if it benefits each participating Fund. The Investment Manager administers the program according to procedures approved by the Board, and the Board monitors the operation of the program. An interfund loan must comply with certain conditions set out in the exemptive order, which are designed to assure fairness and protect all participating Funds. For the fiscal year ended October 31, 2014, the following Funds either borrowed from or lent to other Funds in the AMG Funds family: Tax-Managed lent varying amounts not exceeding $1,220,158 for nine days earning interest of $85, Global Alternatives lent varying amounts not exceeding $4,863,765 for three days earning interest of $165 and Global Risk-Balanced lent varying amounts not exceeding $1,268,508 for ten days earning interest of $100. The interest amount is included in the Statement of Operations as interest income. At October 31, 2014, the Funds had no loans outstanding.
3. PURCHASES AND SALES OF SECURITIES
Purchases and sales of securities (excluding short-term securities and U.S. Government obligations) for the fiscal year ended October 31, 2014, were as follows:
| | | | | | | | |
| | | Long-Term Securities | |
| Fund | | Purchases | | | Sales | |
Tax-Managed | | $ | 29,099,977 | | | $ | 25,008,275 | |
U.S. Equity | | | 56,280,000 | | | | 58,098,209 | |
Global Alternatives | | | — | | | | 12,888,336 | |
Global Risk-Balanced | | | 3,325,683 | | | | 16,987,112 | |
The Funds had no purchases or sales of U.S. Government obligations during the fiscal year ended October 31, 2014.
4. PORTFOLIO SECURITIES LOANED
The Funds participate in a securities lending program offered by BNYM (the “Program”), providing for the lending of securities to qualified brokers. Securities lending income includes earnings of such temporary cash investments, plus or minus any rebate to a borrower. These earnings (after any rebate) are then divided between BNYM, as a fee for its services under the Program, and the Funds, according to agreed-upon rates. Collateral on all securities loaned is accepted in cash and is maintained at a minimum level of 102% (105% in the case of certain foreign securities) of the market value, plus interest, if applicable, of investments on loan. It is the Funds’ policy to obtain additional collateral from or return excess collateral to the borrower by the end of the next business day, following the valuation date of the securities loaned. Therefore, the value of the collateral held may be temporarily less than the value of the securities on loan. Lending securities entails a risk of loss to the Funds if and to the extent that the market value of the securities loaned were to increase and the borrower did not increase the collateral accordingly, and the borrower fails to return the securities. Under the terms of the Program, the Funds are indemnified for such losses by BNYM. Cash collateral is held in a separate account managed by BNYM, who is authorized to exclusively enter into overnight government repurchase agreements. BNYM bears the risk of any
Notes to Financial Statements (continued)
deficiency in the amount of the cash collateral available for return to the borrower due to any loss on the collateral invested.
At October 31, 2014, the value of the securities loaned and cash collateral received, were as follows:
| | | | | | | | |
| | | Securities | | | Cash Collateral | |
| Fund | | Loaned | | | Received | |
Tax-Managed | | $ | 1,254,944 | | | $ | 1,285,537 | |
U.S. Equity | | | 971,701 | | | | 1,033,368 | |
Global Risk-Balanced | | | 9,249,886 | | | | 9,502,507 | |
5. COMMITMENTS AND CONTINGENCIES
Under the Trust’s organizational documents, its trustees and officers are indemnified against certain liabilities arising out of the performance of their duties to the Trust. In addition, in the normal course of business, the Funds may enter into contracts and agreements that contain a variety of representations and warranties, which provide general indemnifications. The maximum exposure to the Funds under these arrangements is unknown, as this would involve future claims that may be made against the Funds that have not yet occurred. However, based on experience, the Funds had no prior claims or losses and expect the risks of loss to be remote.
6. FORWARD COMMITMENTS
Certain transactions, such as futures and forward transactions, dollar roll agreements, or purchases of when-issued or delayed delivery securities may have a similar effect on the Fund’s net asset value as if the Fund had created a degree of leverage in its portfolio. However, if a Fund enters into such a transaction, the Fund will establish a segregated account with its custodian in which it will maintain cash, U.S. government securities or other liquid securities equal in value to its obligations in respect to such transaction. Securities and other assets held in the segregated account may not be sold while the transaction is outstanding, unless other suitable assets are substituted.
7. DERIVATIVE INSTRUMENTS
The following disclosures contain information on how and why the Funds use derivative instruments, the credit risk and how derivative instruments affect the Fund’s financial position, results of operations and cash flows. The location and fair value amounts of these instruments on the Statement of Assets and Liabilities and the realized and changes in unrealized gains and losses on the Statement of Operations, each categorized by type of derivative contract, are included in a table in the Notes to the Schedules of Portfolio Investments. For the fiscal year ended October 31, 2014, the average quarterly balances of outstanding derivative financial instruments were as follows:
| | | | | | | | | | | | |
| | | U.S. | | | Global | | | Global | |
| | | Equity | | | Alternatives | | | Risk-Balanced | |
Financial futures contracts: | | | | | | | | | | | | |
Average number of contracts purchased | | | 2 | | | | 944 | | | | 845 | |
Average number of contracts sold | | | — | | | | 1,216 | | | | — | |
Average notional value of contracts purchased | | $ | 186,834 | | | $ | 129,223,731 | | | $ | 89,436,611 | |
Average notional value of contracts sold | | | — | | | $ | 152,334,264 | | | | — | |
Foreign currency exchange contracts: | | | | | | | | | | | | |
Average US dollar amounts purchased/sold | | | — | | | $ | 609,330,576 | | | | — | |
Options: | | | | | | | | | | | | |
Average notional value of option contracts purchased | | $ | 242,421 | | | | — | | | $ | 447,277 | |
Average notional value of option contracts written | | $ | 587,111 | | | | — | | | $ | 695,681 | |
8. FORWARD FOREIGN CURRENCY CONTRACTS
During the fiscal year ended October 31, 2014, Global Alternatives invested in forward foreign currency contracts to facilitate transactions in foreign securities and to hedge against foreign currency exchange rate risk on its non-U.S. dollar denominated investment securities.
A forward foreign currency contract is an agreement between a fund and another party to buy or sell a currency at a set price at a future date. The market value of the contract will fluctuate with changes in currency exchange rates. The contract is marked-to-market daily, and the change in market value is recorded as an unrealized gain or loss. Gain or loss on the purchase or sale of contracts having the same settlement date, amount and counterparty is realized on the date of offset, otherwise gain or loss is realized on the settlement date. Risks may arise upon entering into these contracts from the potential inability of counterparties to meet the terms of their contracts and from unanticipated movements in the value of a foreign currency relative to the U.S. dollar.
9. FUTURES CONTRACTS
U.S. Equity entered into equity index futures contracts with the objective of maintaining exposure to equity stock markets while maintaining liquidity. Global Alternatives and Global Risk-Balanced entered into futures contracts, including futures contracts on global equity and fixed-income securities, interest rate futures contracts, foreign currency futures contracts and futures contracts on security indices (including broad-based security indices). The Funds purchased and sold futures contracts to achieve a desired level of investment, whether to accommodate portfolio turnover or cash flows from capital shares transactions. There are certain risks associated with futures contracts. Prices may not move as expected or the Fund may not be able to close out the contract when it desires to do so, resulting in losses.
On entering into a futures contract, either cash or securities in an amount equal to a certain percentage of the contract value (initial margin) must be deposited with the futures broker. Subsequent payments (variation margin) are made or received each day. The variation margin payments equal the daily changes in the contract value and are recorded as unrealized gains or losses. For OTC futures, daily variation margin is not required. The Fund recognizes a realized
Notes to Financial Statements (continued)
gain or loss when the contract is closed or expires equal to the difference between the value of the contract at the time it was opened and the value at the time it was closed. Futures are valued at their quoted daily settlement prices. The aggregate principal amounts of the contracts are not recorded in the financial statements. Fluctuations in the value of the contracts are recorded in the Statement of Assets and Liabilities as an asset (liability) and in the Statement of Operations as unrealized appreciation (depreciation) until the contracts are closed, when they are recorded as realized gains (losses) on futures contracts.
10. OPTIONS
For the fiscal year ended October 31, 2014, U.S. Equity and Global Risk-Balanced entered into OTC transactions involving interest rate caps and floors, swap contracts, or purchased and written (sold) options in order to manage their exposure to credit, currency, equity, interest rate and inflation risk.
A written option contract is a contract in which the writer of the option grants the buyer of the option the right to purchase from (call option) or sell to (put option) the writer a designated instrument at a specified price within a specified period of time. Options written (sold) are recorded as liabilities. U.S. Equity and Global Risk-Balanced, as writer of written options, bears the risk of an unfavorable change in the market value of the instrument underlying the written option. When an option expires, the premium (original option value) is realized as a gain if the option was written or as a loss if the option was purchased. When the exercise of an option results in a cash settlement, the difference between the premium and the settlement proceeds is recognized as realized gain or loss. When securities are acquired or delivered upon exercise of an option, the acquisition cost or sale proceeds are adjusted by the amount of the premium. When an option is closed, the difference between the premium and the cost to close the position is realized as a gain or loss.
11. EXCHANGE TRADED NOTES
Global Risk-Balanced invests in Exchange Traded Notes (“ETNs”). ETNs are senior, unsecured, unsubordinated debt securities issued by a financial institution, listed on an exchange and traded in the secondary market. There are no periodic interest payments, and principal is not protected. The Fund could lose some or all of the amount invested. The price in the secondary market is determined by supply and demand, the current performance of the index, and the credit rating of the ETN issuer. At maturity, the issuer pays the Fund a return linked to the performance of the market index, such as a commodity index, to which the ETN is linked, minus the issuer’s fee. ETNs are subject to the risk of a breakdown in the futures markets that they use. As a means to obtain commodity exposure, the Fund invests in ETNs linked to commodity indices. The Fund may be exposed to a wide variety of commodity sectors, including, without limitation, agriculture, livestock, base/industrial metals, oil, energy and precious metals. Commodity prices, and the value of stocks of companies exposed to commodities, can be extremely volatile and are affected by a wide range of factors.
12. MARKET, CREDIT AND COUNTERPARTY RISKS
In the normal course of business, Global Alternatives and Global Risk-Balanced invest in securities and enter into transactions where risks exist due to market fluctuations and are exposed to credit risk with parties with whom it trades (issuers or counterparties). Market prices of investments held by the Funds may
fall rapidly or unpredictably and will rise and fall due to changing economic, political, or market conditions or in response to events that affect particular industries or companies. Each Fund may be exposed to credit or counterparty risk, or the risk that an institution or other entity with which the Fund has unsettled or open transactions will default or not perform under the contract. The Fund minimizes credit risk and counterparty risk by undertaking transactions with a large number of customers and counterparties on recognized and reputable exchanges. The Fund could lose money if the issuer or guarantor of a fixed income security, or the counterparty to a financial derivatives contract, repurchase agreement or a loan of portfolio securities, is unable or unwilling to make timely principal and/or interest payments, or to otherwise honor its obligations.
The Funds are subject to various Master Agreements, which govern the terms of certain transactions with select counterparties. These Master Agreements reduce the counterparty risk associated with relevant transactions by specifying credit protection mechanisms and providing standardization that improves legal certainty. Master Agreements can also help limit counterparty risk by specifying collateral posting arrangements at pre-arranged exposure levels. Under the Master Agreements, collateral is routinely transferred if the total net exposure to certain transactions (net of existing collateral already in place) governed under the relevant master agreement with a counterparty in a given account exceeds a specified threshold, which typically ranges from zero to $250,000 depending on the counterparty and the type of Master Agreement.
International Swaps and Derivatives Association, Inc. Master Agreements (“ISDA Master Agreements”) govern OTC financial derivative transactions entered into by the Funds and the respective counterparty. The ISDA Master Agreements maintain provisions for general obligations, representations, agreements, collateral and events of default or termination. Certain ISDA Master Agreements allow counterparties to OTC derivatives to terminate derivative contracts prior to maturity in the event the Funds’ net assets decline by a stated percentage or the Funds fail to meet the terms of the ISDA Master Agreement, which requires accelerated settlement of all outstanding transactions under the applicable ISDA Master Agreement. Any election to terminate early could be material to the financial statements.
13. MASTER NETTING AGREEMENTS
The Funds may enter into master netting agreements with their counterparties for the securities lending program, repurchase agreements and derivative instruments, which provide the right, in the event of default (including bankruptcy or insolvency) for the non-defaulting party to liquidate the collateral and calculate net exposure to the defaulting party or request additional collateral. For financial reporting purposes, the Funds do not offset financial assets and financial liabilities that are subject to master netting agreements in the Statement of Assets and Liabilities. For securities lending transactions, see Note 4.
Notes to Financial Statements (continued)
The following tables are a summary of the Funds’ open repurchase agreements and derivative instruments that are subject to a master netting agreements as of October 31, 2014:
| | | | | | | | | | | | | | | | |
| | | Net Amounts of
Assets Presented | | | Gross Amount Not Offset in the
Statement of Assets and Liabilities | | | | |
| | | in the Statement | | | | | |
| | | of Assets and | | | Financial Instruments | | | Cash Collateral | | | | |
| Fund | | Liabilities | | | Collateral | | | Received | | | Net Amount | |
Tax-Managed | | | | | | | | | | | | | | | | |
Cantor Fitzgerald Securities, Inc. | | $ | 1,000,000 | | | $ | 1,000,000 | | | | — | | | | — | |
Nomura Securities International, Inc. | | | 285,537 | | | | 285,537 | | | | — | | | | — | |
| | | | | | | | | | | | | | | | |
Total | | $ | 1,285,537 | | | $ | 1,285,537 | | | | — | | | | — | |
| | | | | | | | | | | | | | | | |
U.S. Equity | | | | | | | | | | | | | | | | |
Cantor Fitzgerald Securities, Inc. | | $ | 1,000,000 | | | $ | 1,000,000 | | | | — | | | | — | |
Nomura Securities International, Inc. | | | 33,368 | | | | 33,368 | | | | — | | | | — | |
| | | | | | | | | | | | | | | | |
Total | | $ | 1,033,368 | | | $ | 1,033,368 | | | | — | | | | — | |
| | | | | | | | | | | | | | | | |
Global Alternatives | | | | | | | | | | | | | | | | |
Goldman Sachs & Co. | | $ | 7,209,812 | | | $ | 3,140,609 | | | $ | 3,200,000 | | | $ | 869,203 | |
Morgan Stanley & Company LLC | | | 3,814,695 | | | | 3,814,695 | | | | — | | | | — | |
| | | | | | | | | | | | | | | | |
Total | | $ | 11,024,507 | | | $ | 6,955,304 | | | $ | 3,200,000 | | | $ | 869,203 | |
| | | | | | | | | | | | | | | | |
Global Risk-Balanced | | | | | | | | | | | | | | | | |
Cantor Fitzgerald Securities, Inc. | | $ | 2,256,848 | | | $ | 2,256,848 | | | | — | | | | — | |
Citigroup Global Markets America, Inc. | | | 475,115 | | | | 475,115 | | | | — | | | | — | |
Daiwa Capital Markets America | | | 2,256,848 | | | | 2,256,848 | | | | — | | | | — | |
Nomura Securities International, Inc. | | | 2,256,848 | | | | 2,256,848 | | | | — | | | | — | |
State of Wisconsin Investment Board | | | 2,256,848 | | | | 2,256,848 | | | | — | | | | — | |
| | | | | | | | | | | | | | | | |
Total | | $ | 9,502,507 | | | $ | 9,502,507 | | | | — | | | | — | |
| | | | | | | | | | | | | | | | |
| | | |
| | | Net Amounts of Liabilities Presented | | | Gross Amount Not Offset in the
Statement of Assets and Liabilities | | | | |
| | | in the Statement | | | | | |
| | | of Assets and | | | Financial | | | Cash Collateral | | | | |
| Fund | | Liabilities | | | Instruments Collateral | | | Pledged | | | Net Amount | |
Global Alternatives | | | | | | | | | | | | | | | | |
Goldman Sachs & Co. | | $ | 3,140,609 | | | $ | 3,140,609 | | | | — | | | | — | |
Morgan Stanley & Company LLC | | | 7,737,827 | | | | 3,814,695 | | | $ | 3,030,000 | | | $ | 893,132 | |
| | | | | | | | | | | | | | | | |
Total | | $ | 10,878,436 | | | $ | 6,955,304 | | | $ | 3,030,000 | | | $ | 893,132 | |
| | | | | | | | | | | | | | | | |
14. SUBSEQUENT EVENTS
Each Fund has determined that no material events or transactions occurred through the issuance date of the Funds’ financial statements which require additional disclosure in or adjustment of the Funds’ financial statements.
Tax Information (unaudited)
The AMG FQ Tax-Managed U.S. Equity, AMG FQ U.S. Equity, AMG FQ Global Alternatives and AMG FQ Global Risk-Balanced Funds each hereby designates the maximum amount allowable of its net taxable income as qualified dividends as provided in the Jobs and Growth Tax Relief Reconciliation Act of 2003. The 2013/2014 Form 1099-DIV you receive for each Fund will show the tax status of all distributions paid to you during the year.
Pursuant to section 852 of the Internal Revenue Code, AMG FQ Tax-Managed U.S. Equity, AMG FQ U.S. Equity, AMG FQ Global Alternatives and AMG FQ Global Risk-Balanced Funds each hereby designate $0, $0, $3,587,299 and $0, respectively, as a capital gain distribution with respect to the taxable year ended October 31, 2014, or if subsequently determined to be different, the net capital gains of such fiscal year.
Report of Independent Registered Public Accounting Firm
TO THE BOARD OF TRUSTEES OF AMG FUNDS I AND THE SHAREHOLDERS OF AMG FQ TAX-MANAGED U.S. EQUITY FUND, AMG FQ U.S. EQUITY FUND, AMG FQ GLOBAL ALTERNATIVES FUND AND AMG FQ GLOBAL RISK-BALANCED FUND
In our opinion, the accompanying statements of assets and liabilities, including the schedules of portfolio investments, and the related statements of operations and of changes in net assets and the financial highlights present fairly, in all material respects, the financial positions of AMG FQ Tax-Managed U.S. Equity Fund (formerly, Managers AMG FQ Tax-Managed U.S. Equity Fund), AMG FQ U.S. Equity Fund (formerly Managers AMG FQ U.S. Equity Fund), AMG FQ Global Alternatives Fund (formerly Managers AMG FQ Global Alternatives Fund) and AMG FQ Global Risk-Balanced Fund (formerly Managers AMG FQ Global Essentials Fund) (the “Funds”) at October 31, 2014, and the results of each of their operations, the changes in each of their net assets and the financial highlights for each of the periods indicated, in conformity with accounting principles generally accepted in the United States of America. These financial statements and financial highlights (hereafter referred to as “financial statements”) are the responsibility of the Funds’ management. Our responsibility is to express an opinion on these financial statements based on our audits. We conducted our audits of these financial statements in accordance with the standards of the Public Company Accounting Oversight Board (United States). Those standards require that we plan and perform the audit to obtain reasonable assurance about whether the financial statements are free of material misstatement. An audit includes examining, on a test basis, evidence supporting the amounts and disclosures in the financial statements, assessing the accounting principles used and significant estimates made by management, and evaluating the overall financial statement presentation. We believe that our audits, which included confirmation of securities at October 31, 2014 by correspondence with the custodian, brokers, transfer agent, and the application of alternative auditing procedures where securities purchased had not been received, provide a reasonable basis for our opinion.
PricewaterhouseCoopers LLP
Boston, Massachusetts
December 29, 2014
AMG Funds
Trustees and Officers
The Trustees and Officers of the Trust, their business addresses, principal occupations for the past five years and dates of birth are listed below. The Trustees provide broad supervision over the affairs of the Trust and the Funds. The Trustees are experienced executives who meet periodically throughout the year to oversee the Funds’ activities, review contractual arrangements with
companies that provide services to the Funds, and review the Funds’ performance. Unless otherwise noted, the address of each Trustee or Officer is the address of the Trust: 800 Connecticut Avenue, Norwalk, Connecticut 06854.
There is no stated term of office for Trustees. Trustees serve until their resignation, retirement or removal in accordance with the Trust’s
organizational documents and policies adopted by the Board from time to time. The Chairman of the Trustees, President, Treasurer and Secretary of the Trust are elected by the Trustees annually. Other officers hold office at the pleasure of the Trustees.
Independent Trustees
The following Trustees are not “interested persons” of the Trust within the meaning of the 1940 Act:
| | |
Number of Funds Overseen in Fund Complex | | Name, Date of Birth, Principal Occupation(s) During Past 5 Years and Other Directorships Held by Trustee |
| |
• Trustee since 2012 | | Bruce B. Bingham, 12/1/48 |
| |
• Oversees 43 Funds in Fund Complex | | Partner, Hamilton Partners (real estate development firm) (1987-Present); Trustee of Aston Funds (25 portfolios) (2014-Present); Director of The Yacktman Funds (2000-2012). |
| |
• Independent Chairman | | William E. Chapman, II, 9/23/41 |
| |
• Trustee since 2000 • Oversees 43 Funds in Fund Complex | | President and Owner, Longboat Retirement Planning Solutions (1998-Present); Hewitt Associates, LLC (part time) (provider of Retirement and Investment Education Seminars) (2002-2009); Trustee Emeritus of Bowdoin College (2013-Present); Trustee of Bowdoin College (2002-2013); Director of Harding, Loevner Funds, Inc. (6 portfolios); Trustee of Third Avenue Trust (5 portfolios); Trustee of Third Avenue Variable Trust (1 portfolio); Trustee of Aston Funds (25 portfolios) (2010-Present). |
| |
• Trustee since 2000 | | Edward J. Kaier, 9/23/45 |
| |
• Oversees 43 Funds in Fund Complex | | Attorney at Law and Partner, Teeters Harvey Marrone & Kaier LLP (2007-Present); Attorney at Law and Partner, Hepburn Willcox Hamilton & Putnam, LLP (1977-2007); Trustee of Third Avenue Trust (5 portfolios); Trustee of Third Avenue Variable Trust (1 portfolio); Trustee of Aston Funds (25 portfolios) (2010-Present). |
| |
• Trustee since 2013 | | Kurt A. Keilhacker, 10/5/63 |
| |
• Oversees 45 Funds in Fund Complex | | Managing Member, TechFund Capital (1997-Present); Managing Member, TechFund Europe (2000-Present); Trustee, Gordon College (2001-Present); Board Member, 6wind SA, (2002-Present); Managing Member, Clapham Partners I, LLC (2013-Present); Trustee of Aston Funds (25 portfolios) (2014-Present). |
| |
• Trustee since 2000 | | Steven J. Paggioli, 4/3/50 |
| |
• Oversees 43 Funds in Fund Complex | | Independent Consultant (2002-Present); Formerly Executive Vice President and Director, The Wadsworth Group (1986-2001); Executive Vice President, Secretary and Director, Investment Company Administration, LLC (1990-2001); Vice President, Secretary and Director, First Fund Distributors, Inc. (1991-2001); Trustee, Professionally Managed Portfolios (45 portfolios); Advisory Board Member, Sustainable Growth Advisors, LP; Independent Director, Chase Investment Counsel (2008 – Present); Trustee of Aston Funds (25 portfolios) (2010-Present). |
| |
• Trustee since 2013 | | Richard F. Powers III, 2/2/46 |
| |
• Oversees 43 Funds in Fund Complex | | Adjunct Professor, Boston College (2011-Present); Trustee of Aston Funds (25 portfolios) (2014-Present); Director of Ameriprise Financial Inc. (2005-2009); President and CEO of Van Kampen Investments Inc. (1998-2003). |
| |
• Trustee since 2000 | | Eric Rakowski, 6/5/58 |
| |
• Oversees 45 Funds in Fund Complex | | Professor, University of California at Berkeley School of Law (1990-Present); Director of Harding, Loevner Funds, Inc. (6 portfolios); Trustee of Third Avenue Trust (5 portfolios); Trustee of Third Avenue Variable Trust (1 portfolio); Trustee of Aston Funds (25 portfolios) (2010-Present). |
| |
• Trustee since 2013 | | Victoria L. Sassine, 8/11/65 |
| |
• Oversees 45 Funds in Fund Complex | | Lecturer, Babson College (2007 – Present); Trustee of Aston Funds (25 portfolios) (2014-Present). |
| |
• Trustee since 2000 | | Thomas R. Schneeweis, 5/10/47 |
| |
• Oversees 43 Funds in Fund Complex | | Professor Emeritus, University of Massachusetts (2013 - Present); Partner, S Capital Management, LLC (2007-Present); President, TRS Associates (1982-Present); Director, CISDM at the University of Massachusetts, (1996-2013); President, Alternative Investment Analytics, LLC, (formerly Schneeweis Partners, LLC) (2001-2013); Professor of Finance, University of Massachusetts (1977-2013); Partner, White Bear Partners, LLC (2007-2010); Partner, Northampton Capital Management, LLC (2004-2010); Trustee of Aston Funds (25 portfolios) (2010-Present). |
59
AMG Funds
Trustees and Officers (continued)
Interested Trustees
Each Trustee in the following table is an “interested person” of the Trust within the meaning of the 1940 Act. Ms. Carsman is an interested person of the Trust within the meaning of the 1940 Act by virtue of her position with, and interest in securities of, AMG, and her former position as Chief Legal Officer of the Trust.
| | |
Number of Funds Overseen in Fund Complex | | Name, Date of Birth, Principal Occupation(s) During Past 5 Years and Other Directorships Held by Trustee |
| |
• Trustee since 2011 | | Christine C. Carsman, 4/2/52 |
| |
• Oversees 45 Funds in Fund Complex | | Senior Vice President and Deputy General Counsel, Affiliated Managers Group, Inc. (2011-Present); Trustee of Aston Funds (25 portfolios) (2014-Present); Senior Vice President and Chief Regulatory Counsel, Affiliated Managers Group, Inc. (2007-2011); Vice President and Chief Regulatory Counsel, Affiliated Managers Group, Inc. (2004-2007); Secretary and Chief Legal Officer, AMG Funds, AMG Funds I, AMG Funds II and AMG Funds III (2004-2011); Senior Counsel, Vice President and Director of Operational Risk Management and Compliance, Wellington Management Company, LLP (1995-2004). |
| Officers | | |
| |
Position(s) Held with Fund and Length of Time Served | | Name, Date of Birth, Principal Occupation(s) During Past 5 Years |
| |
• President since 2014 | | Jeffrey T. Cerutti, 2/7/68 |
| |
• Principal Executive Officer since 2014 | | Chief Executive Officer, AMG Funds LLC (2014-Present); Director, President and Principal, AMG Distributors, Inc. (2014-Present); President and Principal Executive Officer, AMG Pantheon Private Equity Fund, LLC and AMG Pantheon Private Equity Master Fund, LLC (2014-Present); President, VP Distributors, (2011-2014); Executive Vice President, Head of Distribution, Virtus Investment Partners, Inc. (2010-2014); Managing Director, Head of Sales, UBS Global Asset Management (2001-2010). |
| |
• Chief Operating Officer since 2007 | | Keitha L. Kinne, 5/16/58 Chief Operating Officer, AMG Funds LLC (2007-Present); Chief Investment Officer, AMG Funds LLC (2008-Present); Chief Operating Officer, AMG Distributors, Inc. (2007-Present); Chief Operating Officer, AMG Pantheon Private Equity Fund, LLC and AMG Pantheon Private Equity Master Fund, LLC (2014-Present); Managing Partner, AMG Funds LLC (2007-2014); President, AMG Funds (2012-2014); President, AMG Distributors, Inc. (2012-2014); Managing Director, Legg Mason & Co., LLC (2006-2007); Managing Director, Citigroup Asset Management (2004-2006). |
| |
• Secretary since 2011 | | Lewis Collins, 2/22/66 |
| |
• Chief Legal Officer since 2011 | | Senior Vice President and Senior Counsel, Affiliated Managers Group, Inc. (2010-Present); Secretary, AMG Pantheon Private Equity Fund, LLC and AMG Pantheon Private Equity Master Fund, LLC (2014-Present); Vice President and Senior Counsel, Affiliated Managers Group, Inc. (2006-2010); Senior Counsel, Affiliated Managers Group, Inc. (2002-2006); Attorney, Ropes & Gray LLP (1998-2002). |
| |
• Chief Financial Officer since 2007 • Treasurer since 1999 • Principal Financial Officer since 1999 | | Donald S. Rumery, 5/29/58 Senior Vice President, AMG Funds LLC (2005-Present); Treasurer, AMG Funds III (1995-Present); Treasurer, AMG Funds (1999-Present); Treasurer, AMG Funds II (2000-Present); Chief Financial Officer, AMG Funds III, AMG Funds and AMG Funds II (2007-Present); Treasurer, Principal Financial Officer and Principal Accounting Officer, AMG Pantheon Private Equity Fund, LLC and AMG Pantheon Private Equity Master Fund, LLC (2014-Present); Treasurer and Chief Financial Officer, AMG Distributors, Inc. (2000-2012); Vice President, AMG Funds LLC, (1994-2004). |
| |
• Assistant Treasurer since 2014 | | John C. Ball, 1/9/76 Vice President, Assistant Treasurer, AMG Funds LLC (2014-Present); Assistant Treasurer, AMG Pantheon Private Equity Fund, LLC and AMG Pantheon Private Equity Master Fund, LLC (2014-Present); Vice President, State Street Corp. (2010-2014); Vice President, State Street International (Ireland) Limited (2007-2010). |
| |
• Chief Compliance Officer since 2010 | | John J. Ferencz, 3/9/62 Vice President, Legal and Compliance, AMG Funds LLC (2010-Present); Senior Compliance Analyst, Mutual Funds and Regulatory, GE Asset Management Incorporated (2005-2010). |
| |
• Assistant Secretary since 2011 | | Michael S. Ponder, 9/12/73 Senior Vice President and Counsel, AMG Funds LLC (2011-Present); Attorney, DeNovo Legal (2009-2010); Vice President, Credit Suisse (2007-2009); Associate, Willkie Farr & Gallagher LLP (2006-2007). |
| |
• Anti-Money Laundering Compliance Officer since 2014 | | Patrick J. Spellman, 3/15/74 Senior Vice President, Chief Compliance Officer, Legal and Compliance, AMG Funds LLC (2011-Present); Chief Compliance Officer, AMG Distributors, Inc., (2010-Present); Anti-Money Laundering Compliance Officer, AMG Pantheon Private Equity Fund, LLC and AMG Pantheon Private Equity Master Fund, LLC (2014-Present); Compliance Manager, Legal and Compliance, Affiliated Managers Group, Inc. (2005-2011). |
60
Annual Renewal of Investment Management and Subadvisory Agreements (unaudited)
At an in-person meeting held on June 19-20, 2014, the Board of Trustees (the “Board” or the “Trustees”), and separately a majority of the Trustees who are not “interested persons” of the Trust (the “Independent Trustees”), approved the Investment Management Agreement with the Investment Manager for each of AMG FQ U.S. Equity Fund (formerly Managers AMG FQ U.S. Equity Fund), AMG FQ Tax-Managed U.S. Equity Fund (formerly Managers AMG FQ Tax-Managed U.S. Equity Fund), AMG FQ Global Alternatives Fund (formerly Managers AMG FQ Global Alternatives Fund) and AMG FQ Global Risk-Balanced Fund (formerly Managers AMG FQ Global Essentials Fund) (each a “Fund”) and the Subadvisory Agreement with respect to each Fund. The Independent Trustees were separately represented by independent legal counsel in connection with their consideration of the approval of these agreements. In considering the Investment Management and Subadvisory Agreements, the Trustees reviewed a variety of materials relating to each Fund, the Investment Manager and the Subadvisor, including comparative performance, fee and expense information for an appropriate peer group of similar mutual funds for each Fund (each a “Peer Group”), performance information for the relevant benchmark index for each Fund (each a “Fund Benchmark”) and, with respect to the Subadvisor, comparative performance information for an appropriate peer group of managed accounts, and, as to all other matters, other information provided to them on a periodic basis throughout the year, as well as information provided in connection with the meetings of June 19-20, 2014, regarding the nature, extent and quality of services provided by the Investment Manager and the Subadvisor under their respective agreements. Prior to voting, the Independent Trustees: (a) reviewed the foregoing information with their independent legal counsel and with management; (b) received materials from their independent legal counsel discussing the legal standards applicable to their consideration of the Investment Management and Subadvisory Agreements; and (c) met with their independent legal counsel in private sessions at which no representatives of management were present.
NATURE, EXTENT AND QUALITY OF SERVICES.
In considering the nature, extent and quality of the services provided by the Investment Manager, the Trustees reviewed information relating to the Investment Manager’s operations and personnel. Among other things, the Investment Manager provided financial information, biographical information on its supervisory and professional staff and descriptions of its organizational and management structure. The Trustees also took into account information provided periodically throughout the previous year by the Investment Manager in Board meetings relating to the performance of the Investment Manager’s duties with respect to the Funds and the Trustees’ knowledge of the Investment Manager’s management and the quality of the performance of the Investment Manager’s duties. In the course of their deliberations regarding the Investment Management Agreement, the Trustees evaluated, among other things: (a) the extent and quality of the Investment Manager’s oversight of the operation and management of the Funds; (b) the quality of the Investment Manager’s oversight of the performance by the Subadvisor of its portfolio management duties; (c) the Investment Manager’s ability to supervise the Funds’ other service providers; and (d) the Investment Manager’s compliance program. The Trustees also took into account that, in performing its functions under the Investment Management Agreement and supervising the Subadvisor, the Investment Manager: performs periodic detailed analysis and reviews of the performance by the Subadvisor of its obligations to each Fund, including without limitation a review of the Subadvisor’s investment performance in respect of each Fund; prepares and presents periodic reports to the Board regarding the investment performance of the Subadvisor and other information regarding the Subadvisor, at such times and in such forms as the Board may reasonably request; reviews and considers any changes in the personnel of the Subadvisor responsible for performing the Subadvisor’s obligations and makes appropriate reports to the Board; reviews and considers any changes in the ownership or senior management
of the Subadvisor and makes appropriate reports to the Board; performs periodic in-person or telephonic diligence meetings, including with respect to compliance matters, with representatives of the Subadvisor; assists the Board and management of the Trust in developing and reviewing information with respect to the annual consideration of each Subadvisory Agreement; prepares recommendations with respect to the continued retention of the Subadvisor or the replacement of the Subadvisor; identifies potential successors to or replacements of the Subadvisor or potential additional subadvisors, performs appropriate due diligence, and develops and presents to the Board a recommendation as to any such successor, replacement, or additional subadvisor; designates and compensates from its own resources such personnel as the Investment Manager may consider necessary or appropriate to the performance of its services; and performs such other review and reporting functions as the Board shall reasonably request consistent with the Investment Management Agreement and applicable law. The Trustees noted the affiliation of the Subadvisor with the Investment Manager, noting any potential conflicts of interest. The Trustees also took into account the financial condition of the Investment Manager with respect to its ability to provide the services required under the Investment Management Agreement and the Investment Manager’s undertaking to maintain contractual expense limitations for the Funds. The Trustees also considered the Investment Manager’s risk management processes.
The Trustees also reviewed information relating to the Subadvisor’s financial condition, operations and personnel and the investment philosophy, strategies and techniques (its “Investment Strategy”) used in managing each Fund. Among other things, the Trustees reviewed biographical information on portfolio management and other professional staff, information regarding the Subadvisor’s organizational and management structure and the Subadvisor’s brokerage policies and practices. The Trustees considered specific information provided regarding the experience of
61
Annual Renewal of Investment Management and Subadvisory Agreements (continued)
the individuals at the Subadvisor with portfolio management responsibility for the Funds, including the information set forth in each Fund’s prospectus and statement of additional information. In the course of their deliberations, the Trustees evaluated, among other things: (a) the services rendered by the Subadvisor in the past; (b) the qualifications and experience of the Subadvisor’s personnel; and (c) the Subadvisor’s compliance program. The Trustees also took into account the financial condition of the Subadvisor with respect to its ability to provide the services required under each Subadvisory Agreement. The Trustees also considered the Subadvisor’s risk management processes.
PERFORMANCE.
As noted above, the Board considered each Fund’s net performance during relevant time periods as compared to the Fund’s Peer Group and Fund Benchmark and considered the Subadvisor’s performance as compared to an appropriate peer group of managed accounts and also considered the gross performance of the Fund as compared to the Subadvisor’s relevant performance composite that utilizes the same investment strategy and approach and noted that the Board reviews on a quarterly basis detailed information about each Fund’s performance results and portfolio composition, as well as the Subadvisor’s Investment Strategy. The Board noted the Investment Manager’s expertise and resources in monitoring the performance, investment style and risk-adjusted performance of the Subadvisor. The Board was mindful of the Investment Manager’s attention to monitoring the Subadvisor’s performance with respect to the Funds and its discussions with management regarding the factors that contributed to the performance of the Funds.
With respect to AMG FQ U.S. Equity Fund, among other information related to the Fund’s performance, the Trustees noted that the Fund’s performance for Institutional Class shares for the 1-year, 3-year, 5-year and 10-year periods ended March 31, 2014 was below, above, above and above, respectively, the median performance of
the Peer Group and below, below, below and above, respectively, the performance of the Fund Benchmark, the Russell 3000® Index. The Trustees took into account management’s discussion of the Fund’s performance, including the reasons for the Fund’s recent underperformance. The Trustees noted that the Fund ranked in the top quintile relative to its Peer Group for the 10-year period. The Trustees concluded that the Fund’s overall performance has been satisfactory in light of all factors considered.
With respect to AMG FQ Tax-Managed U.S. Equity Fund, among other information related to the Fund’s performance, the Trustees noted that the Fund’s performance for Institutional Class shares for the 1-year, 3-year, 5-year and 10-year periods ended March 31, 2014 was above the median performance of the Peer Group and above the performance of the Fund Benchmark, the Russell 3000® Index. The Trustees also took into account management’s discussion of the Fund’s performance. The Trustees noted that the Fund ranked in the top decile relative to its Peer Group for all relevant time periods. The Trustees concluded that the Fund’s performance has been satisfactory.
With respect to AMG FQ Global Alternatives Fund, among other information related to the Fund’s performance, the Trustees noted that the Fund’s performance for Investor Class shares for the 1-year, 3-year and 5-year periods ended March 31, 2014 and the period from the Fund’s inception on March 30, 2006 through March 31, 2014 was below the median performance of the Peer Group and below the performance of the Fund Benchmark, the Citigroup 1-Month U.S. Treasury Bill Index. The Trustees took into account management’s discussion of the Fund’s performance. The Trustees also took into account the impact of market conditions on the Fund’s performance over the last 12 months. The Trustees also noted that the Fund’s longer-term-performance has been impacted by several difficult calendar years of performance. The Trustees concluded that the Fund’s performance is being addressed.
With respect to AMG FQ Global Risk-Balanced Fund, among other information related to the Fund’s performance, the Trustees noted that the Fund’s performance for Institutional Class shares for the 1-year, 3-year, 5-year and 10-year periods ended March 31, 2014 was below, above, above and above, respectively, the median performance of the Peer Group and below, below, above and below, respectively, the performance of the Fund Benchmark, a Composite Index (60% MSCI World Index and 40% Citigroup World Government Bond Index (Hedged)). The Trustees took into account management’s discussion of the Fund’s performance, including the reasons for the Fund’s more recent underperformance. The Trustees concluded that the Fund’s overall performance has been satisfactory in light of all factors considered.
ADVISORY AND SUBADVISORY FEES AND PROFITABILITY.
In considering the reasonableness of the advisory fee payable to the Investment Manager, the Trustees reviewed information provided by the Investment Manager setting forth all revenues and other benefits, both direct and indirect (including any so-called “fallout benefits” such as reputational value derived from the Investment Manager serving as Investment Manager to a Fund), received by the Investment Manager and its affiliates attributable to managing each Fund and all the mutual funds in the AMG Funds family, the cost of providing such services and the resulting profitability to the Investment Manager and its affiliates from these relationships. The Trustees noted that the Investment Manager and the Subadvisor are affiliated and that, in the case of AMG FQ Tax-Managed U.S. Equity Fund and AMG FQ U.S. Equity Fund, the Investment Manager pays the Subadvisor a subadvisory fee that is equal to the advisory fee that it receives from the Fund. In the case of AMG FQ Global Alternatives Fund and AMG FQ Global Risk-Balanced Fund, the Trustees also considered the amount of the advisory fee retained by the Investment Manager after payment of the subadvisory fee with respect to each Fund. The Trustees also noted any payments that were made from the Subadvisor to the Investment Manager. The Trustees also noted management’s
Annual Renewal of Investment Management and Subadvisory Agreements (continued)
discussion of the current asset levels of the Funds, and considered the impact on profitability of the current asset levels and any future growth of assets of the Funds.
In considering the cost of services to be provided by the Investment Manager under the Investment Management Agreement and the profitability to the Investment Manager of its relationship with the Funds, the Trustees noted the undertaking by the Investment Manager to maintain contractual expense limitations for the Funds. The Board also took into account management’s discussion of the current advisory fee structure, and, as noted above, the services the Investment Manager provides in performing its functions under the Investment Management Agreement and supervising the Subadvisor. Based on the foregoing, the Trustees concluded that the profitability to the Investment Manager is reasonable and that the Investment Manager is not realizing material benefits from economies of scale that would warrant adjustments to the advisory fee at this time. Also with respect to economies of scale, the Trustees noted that as a Fund’s assets increase over time, the Fund may realize other economies of scale to the extent the increase in assets is proportionally greater than the increase in certain other expenses.
In considering the reasonableness of the subadvisory fees payable by the Investment Manager to the Subadvisor, the Trustees reviewed information regarding the cost of providing subadvisory services to each of the Funds and the resulting profitability to the Subadvisor from these relationships and noted that, because the Subadvisor is an affiliate of the Investment Manager, such profitability might be directly or indirectly shared by the Investment Manager. The Trustees also noted that the subadvisory fees are paid by the Investment Manager out of its advisory fee. The Board also took into account management’s discussion of the current subadvisory fee structure, and the services the Subadvisor provides in performing its functions under each Subadvisory Agreement. Based on the foregoing, the Trustees concluded that the
profitability to the Subadvisor is reasonable and that the Subadvisor is not realizing material benefits from economies of scale that would warrant adjustments to the subadvisory fees at this time. Also with respect to economies of scale, the Trustees noted that as a Fund’s assets increase over time, the Fund may realize other economies of scale to the extent the increase in assets is proportionally greater than the increase in certain other expenses.
With respect to AMG FQ U.S. Equity Fund, the Trustees noted that the Fund’s advisory fees (which include both the advisory and administration fee) and total expenses (net of applicable expense waivers/reimbursements) as of March 31, 2014 were both lower than the average for the Fund’s Peer Group. The Trustees took into account the fact that the Investment Manager has contractually agreed, through March 1, 2015, to limit the Fund’s net annual operating expenses (subject to certain excluded expenses) to 0.79%. The Trustees concluded that, in light of the nature, extent and quality of the services provided by the Investment Manager and the Subadvisor (which is an affiliate of the Investment Manager), the foregoing expense limitation and the considerations noted above with respect to the Subadvisor and the Investment Manager, the Fund’s advisory and subadvisory fees are reasonable.
With respect to AMG FQ Tax-Managed U.S. Equity Fund, the Trustees noted that the Fund’s advisory fee and total expenses (net of applicable expense waivers/reimbursements) as of March 31, 2014 were higher and lower, respectively, than the average for the Fund’s Peer Group. The Trustees took into account the fact that the Investment Manager has contractually agreed, through March 1, 2015, to limit the Fund’s net annual operating expenses (subject to certain excluded expenses) to 0.99%. The Board also took into account management’s discussion of the Fund’s expenses and the current size of the Fund. The Board also considered the differences in the Fund’s investment strategy relative to its Peer Group. The Trustees concluded that, in light of the nature,
extent and quality of the services provided by the Investment Manager and the Subadvisor (which is an affiliate of the Investment Manager), the foregoing expense limitation and the considerations noted above with respect to the Subadvisor and the Investment Manager, the Fund’s advisory and subadvisory fees are reasonable.
With respect to AMG FQ Global Alternatives Fund, the Trustees noted that the Fund’s advisory fees (which include both the advisory and administration fee) and total expenses (net of applicable expense waivers/reimbursements) as of March 31, 2014 were both higher than the average for the Fund’s Peer Group. The Trustees took into account the fact that the Investment Manager has contractually agreed, through March 1, 2015, to limit the Fund’s net annual operating expenses (subject to certain excluded expenses) to 1.44%. The Trustees also noted that the Investment Manager previously reduced the Fund’s expense limitation in 2013. The Trustees took into account management’s discussion of the Fund’s expenses and distinct investment strategy. The Trustees concluded that, in light of the nature, extent and quality of the services to be provided by the Investment Manager and the Subadvisor (which is an affiliate of the Investment Manager), the foregoing expense limitation and the considerations noted above with respect to the Subadvisor and the Investment Manager, the Fund’s advisory and subadvisory fees are reasonable.
With respect to AMG FQ Global Risk-Balanced Fund, the Trustees noted that the Fund’s advisory fees (which include both the advisory and administration fee) and total expenses (net of applicable expense waivers/reimbursements) as of March 31, 2014 were both lower than the average for the Fund’s Peer Group. The Trustees took into account the fact that the Investment Manager has contractually agreed, through March 1, 2015, to limit the Fund’s net annual operating expenses (subject to certain excluded expenses) to 0.89%. The Trustees also noted that the Investment Manager reduced this expense limitation from
63
Annual Renewal of Investment Management and Subadvisory Agreements (continued)
0.99% to 0.89% in 2012. The Trustees concluded that, in light of the nature, extent and quality of the services provided by the Investment Manager and the Subadvisor (which is an affiliate of the Investment Manager), the foregoing expense limitation and the considerations noted above with respect to the Subadvisor and the Investment Manager, the Fund’s advisory and subadvisory fees are reasonable.
* * * *
After consideration of the foregoing, the Trustees also reached the following conclusions (in addition to the conclusions discussed above) regarding the Investment Management and Subadvisory Agreements: (a) the Investment Manager has demonstrated that it possesses the resources and capability to perform the Investment Manager’s duties under the Investment Management Agreement; (b) the Subadvisor has the resources to perform the Subadvisor’s duties under the Subadvisory Agreements and is qualified to manage each Fund’s assets in accordance with its investment objectives and policies; and (c) the Investment Manager and Subadvisor maintain appropriate compliance programs.
Based on all of the above-mentioned factors and their related conclusions, with no single factor or conclusion being determinative and with each Trustee not necessarily attributing the same weight to each factor, the Trustees concluded that approval of the Investment Management Agreement and each Subadvisory Agreement would be in the best interests of the applicable Fund and its shareholders. Accordingly, on June 19-20, 2014, the Trustees, and separately a majority of the Independent Trustees, voted to approve the Investment Management Agreement and the Subadvisory Agreement for each Fund.
64
| | |
 | | AMG Funds |
INVESTMENT MANAGER AND ADMINISTRATOR
AMG Funds LLC
800 Connecticut Avenue
Norwalk, CT 06854
(800) 835-3879
DISTRIBUTOR
AMG Distributors, Inc.
800 Connecticut Avenue
Norwalk, CT 06854
(800) 835-3879
SUBADVISOR
First Quadrant, L.P.
800 E. Colorado Boulevard, Suite 900 Pasadena, CA 91101
CUSTODIAN
The Bank of New York Mellon
2 Hanson Place
Brooklyn, NY 11217
LEGAL COUNSEL
Ropes & Gray LLP
Prudential Tower, 800 Boylston Street Boston, MA 02199-3600
TRANSFER AGENT
BNY Mellon Investment Servicing (US) Inc.
Attn: AMG Funds
P.O. Box 9769
Providence, RI 02940
(800) 548-4539
FOR MANAGERSCHOICETM ONLY
AMG Funds
c/o BNY Mellon Investment Servicing (US) Inc.
P.O. Box 9847
Providence, Rhode Island 02940-8047
(800) 358-7668
This report is prepared for the Funds’ shareholders. It is authorized for distribution to prospective investors only when preceded or accompanied by an effective prospectus. To receive a free copy of the prospectus or Statement of Additional Information, which includes additional information about Fund Trustees, please contact us by calling 800.835.3879. Distributed by AMG Distributors, Inc., member FINRA.
Current net asset values per share for each Fund are available on the Funds’ website at www.amgfunds.com
A description of the policies and procedures each Fund uses to vote its proxies is available: (i) without charge, upon request, by calling 800.835.3879, or (ii) on the Securities and Exchange Commission’s (SEC) Web site at www.sec.gov. For information regarding each Fund’s proxy voting record for the 12-month period ended June 30, call 800.835.3879 or visit the SEC Web site at www.sec.gov.
Each Fund files its complete schedule of portfolio holdings with the SEC for the first and third quarters of each fiscal year on Form N-Q. The Fund’s Forms N-Q are available on the SEC’s website at www.sec.gov. A Fund’s Forms N-Q may be reviewed and copied at the SEC’s Public Reference Room in Washington, DC. Information on the operation of the Public Reference Room may be obtained by calling 1-800-SEC-0330. To review a complete list of the Fund’s portfolio holdings, or to view the most recent quarterly holdings report, semiannual report, or annual report, please visit www.amgfunds.com.
| | |
| | AMG Funds |
AFFILIATE SUBADVISED FUNDS
ALTERNATIVE FUNDS
AMG FQ Global Alternatives
First Quadrant, L.P.
BALANCED FUNDS
AMG Chicago Equity Partners Balanced
Chicago Equity Partners, LLC
AMG FQ Global Risk-Balanced
(formerly Managers AMG FQ Global Essentials)
First Quadrant, L.P.
EQUITY FUNDS
AMG FQ Tax-Managed U.S. Equity
AMG FQ U.S. Equity
First Quadrant, L.P.
AMG Frontier Small Cap Growth
Frontier Capital Management Company, LLC
AMG GW&K Small Cap Core
(formerly GW&K Small Cap Equity)
Gannett Welsh & Kotler, LLC
AMG Renaissance International Equity
AMG Renaissance Large Cap Growth
The Renaissance Group LLC
AMG SouthernSun Small Cap
AMG SouthernSun U.S. Equity
SouthernSun Asset Management, LLC
AMG Systematic Large Cap Value
(formerly Systematic Value)
AMG Systematic Mid Cap Value
Systematic Financial Management, L.P.
AMG TimesSquare All Cap Growth
(formerly Managers AMG TSCM Growth Equity)
AMG TimesSquare International Small Cap
AMG TimesSquare Mid Cap Growth
AMG TimesSquare Small Cap Growth
TimesSquare Capital Management, LLC
AMG Trilogy Emerging Markets Equity
AMG Trilogy Global Equity
AMG Trilogy International Small Cap
Trilogy Global Advisors, L.P.
AMG Yacktman Focused
AMG Yacktman
Yacktman Asset Management LP
FIXED INCOME FUNDS
AMG GW&K Enhanced Core Bond
(formerly Manages AMG GW&K Fixed Income)
AMG GW&K Municipal Bond
AMG GW&K Municipal Enhanced Yield
Gannett Welsh & Kotler, LLC
OPEN-ARCHITECTURE FUNDS
EQUITY FUNDS
AMG Managers Brandywine Advisors Midcap Growth
AMG Managers Brandywine Blue
AMG Managers Brandywine
Friess Associates, LLC
AMG Managers Cadence Capital Appreciation
AMG Managers Cadence Emerging Companies
AMG Managers Cadence Mid Cap
Cadence Capital Management, LLC
AMG Managers Emerging Opportunities
(formerly Managers Micro-Cap)
Lord, Abbett & Co. LLC
WEDGE Capital Management L.L.P.
Next Century Growth Investors LLC
RBC Global Asset Management (U.S.) Inc.
AMG Managers Essex Small/Micro Cap Growth
Essex Investment Management Co., LLC
AMG Managers Real Estate Securities
CenterSquare Investment Management, Inc.
AMG Managers Skyline Special Equities
(formerly Skyline Special Equities Portfolio)
Skyline Asset Management, L.P.
AMG Managers Special Equity
Ranger Investment Management, L.P.
Lord, Abbett & Co. LLC
Smith Asset Management Group, L.P.
Federated MDTA LLC
FIXED INCOME FUNDS
AMG Managers Bond
AMG Managers Global Income Opportunity
Loomis, Sayles & Co., L.P.
AMG Managers High Yield
J.P. Morgan Investment Management Inc.
AMG Managers Intermediate Duration Government
AMG Managers Short Duration Government
Amundi Smith Breeden LLC
AMG Managers Total Return Bond
(formerly Managers PIMCO Bond)
Pacific Investment Management Co. LLC
| | | | |
 | | | | www.amgfunds.com |
| | | | |
| | | | |
| | | AMG Funds | | ANNUAL REPORT |
AMG Funds
October 31, 2014
AMG Managers Total Return Bond Fund: MBDFX
(formerly Managers PIMCO Bond Fund)
| | |
| www.amgfunds.com | | AR021-1014 |
AMG Managers Total Return Bond Fund
Annual Report—October 31, 2014
| | | | |
TABLE OF CONTENTS | | PAGE | |
LETTER TO SHAREHOLDERS | | | 2 | |
| |
ABOUT YOUR FUND’S EXPENSES | | | 3 | |
| |
PORTFOLIO MANAGER’S COMMENTS, FUND SNAPSHOTS, AND SCHEDULE OF PORTFOLIO INVESTMENTS | | | 4 | |
| |
NOTES TO SCHEDULE OF PORTFOLIO INVESTMENTS | | | 20 | |
| |
FINANCIAL STATEMENTS | | | | |
| |
Statement of Assets and Liabilities | | | 36 | |
Balance sheet, net asset value (NAV) per share computation and cumulative undistributed amounts | | | | |
| |
Statement of Operations | | | 37 | |
Detail of sources of income, expenses, and realized and unrealized gains (losses) during the fiscal year | | | | |
| |
Statements of Changes in Net Assets | | | 38 | |
Detail of changes in assets for the past two fiscal years | | | | |
| |
Financial Highlights | | | 39 | |
Historical net asset values per share, distributions, total returns, income and expense ratios, turnover ratios and net assets | | | | |
| |
Notes to Financial Statements | | | 40 | |
Accounting and distribution policies, details of agreements and transactions with Fund management and affiliates, and descriptions of certain investment risks | | | | |
| |
REPORT OF INDEPENDENT REGISTERED PUBLIC ACCOUNTING FIRM | | | 49 | |
| |
TRUSTEES AND OFFICERS | | | 50 | |
| |
ANNUAL RENEWAL OF INVESTMENT MANAGEMENT AND SUBADVISORY AGREEMENT | | | 52 | |
Nothing contained herein is to be considered an offer, sale or solicitation of an offer to buy shares of any series of the AMG Funds Family of mutual funds. Such offering is made only by Prospectus, which includes details as to offering price and other material information.
| | | | |
 | | AMG Funds | | Letter to Shareholders |
DEAR SHAREHOLDER:
The fiscal year ended October 31, 2014 was another period of strong equity returns. The S&P 500 Index, a widely followed barometer of the U.S. equity market, rose more than 17% during the past 12 months. International stocks, by comparison, had flat performance, as measured by the MSCI ACWI ex USA Index (in U.S. Dollar terms). The first quarter of 2014 marked the five-year anniversary of the equity bull market. Despite a few bouts of volatility and persistent doubts about the strength of the economic recovery since the beginning of the bull market, the S&P 500 Index has a cumulative gain of 236% (including reinvestment of dividends) since the market bottom on March 9, 2009, through October 31, 2014.
Meanwhile, the Barclays U.S. Aggregate Bond Index, a broad U.S. bond market benchmark, returned 4% for the 12 months ended October 31. Bond markets have performed strongly during this period, to the surprise of many, despite the unwinding of the U.S. Federal Reserve’s bond-buying program known as QE3.
Earlier this year, Managers Investment Group rebranded as AMG Funds. Our new name helps align our fund family more closely with our parent company, Affiliated Managers Group (“AMG”). While the names of funds branded under AMG changed slightly, the ticker symbols remain the same. There was no change to the legal or ownership structure of the funds and the name change will have no impact on their management.
Our foremost goal at AMG Funds is to provide investment products and solutions that help our shareholders and clients successfully reach their long-term investment goals. We do this by partnering with many of AMG’s Affiliate investment boutiques to offer a distinctive array of actively managed, return-oriented funds. In addition, we oversee and distribute a number of complementary mutual funds sub-advised by unaffiliated investment managers. We thank you for your continued confidence and investment in AMG Funds. You can rest assured that, under all market conditions, our team is focused on delivering excellent investment management services for your benefit.
Respectfully,

Jeffery Cerutti
President
AMG Funds
| | | | | | | | | | | | | | |
Average Annual Total Returns | | Periods ended
October 31, 2014 | |
Stocks: | | | | 1 Year | | | 3 Years | | | 5 Years | |
Large Caps | | (S&P 500 Index) | | | 17.27 | % | | | 19.77 | % | | | 16.69 | % |
Small Caps | | (Russell 2000® Index) | | | 8.06 | % | | | 18.18 | % | | | 17.39 | % |
International | | (MSCI All Country World Index ex USA Index) | | | 0.06 | % | | | 7.76 | % | | | 6.09 | % |
Bonds: | | | | | | | | | | | | | | |
Investment Grade | | (Barclays U.S. Aggregate Bond Index) | | | 4.14 | % | | | 2.73 | % | | | 4.22 | % |
High Yield | | (Barclays U.S. High Yield Bond Index) | | | 5.82 | % | | | 9.39 | % | | | 10.44 | % |
Tax-exempt | | (Barclays Municipal Bond Index) | | | 7.82 | % | | | 4.93 | % | | | 5.26 | % |
Treasury Bills | | (BofAML U.S. Treasury Bill 6 Month Index) | | | 0.14 | % | | | 0.16 | % | | | 0.23 | % |
2
About Your Fund’s Expenses
As a shareholder of a Fund, you may incur two types of costs: (1) transaction costs, which may include sales charges (loads) on purchase payments; redemption fees; and exchange fees; and (2) ongoing costs, including management fees; distribution (12b-1) fees; and other Fund expenses. This example is intended to help you understand your ongoing costs (in dollars) of investing in the Fund and to compare these costs with the ongoing costs of investing in other mutual funds. The example is based on $1,000 invested at the beginning of the period and held for the entire period as indicated below.
ACTUAL EXPENSES
The first line of the following table provides information about the actual account values and actual expenses. You may use the information in this line, together with the amount you invested, to estimate the expenses that you paid over the period. Simply divide your account value by $1,000 (for example, an $8,600 account value divided by $1,000 = 8.6), then multiply the result by the number in the first line under the heading entitled “Expenses Paid During Period” to estimate the expenses you paid on your account during this period.
HYPOTHETICAL EXAMPLE FOR COMPARISON PURPOSES
The second line of the following table provides information about hypothetical account values and hypothetical expenses based on the Fund’s actual expense ratio and an assumed annual rate of return of 5% before expenses, which is not the Fund’s actual return. The hypothetical account values and expenses may not be used to estimate the actual ending account balance or expenses you paid for the period. You may use this information to compare the ongoing costs of investing in the Fund and other funds by comparing this 5% hypothetical example with the 5% hypothetical examples that appear in the shareholder reports of other funds.
Please note that the expenses shown in the table are meant to highlight your ongoing costs only and do not reflect any transactional costs, such as sales charges (loads), redemption fees, or exchange fees. Therefore, the second line of the table is useful in comparing ongoing costs only, and will not help you determine the relative total costs of owning different funds.
| | | | | | | | | | | | | | | | |
| Six Months Ended October 31, 2014 | | Expense
Ratio for
the Period | | | Beginning
Account Value
5/01/14 | | | Ending
Account Value
10/31/14 | | | Expenses
Paid During
the Period* | |
AMG Managers Total Return Bond Fund | | | | | | | | | | | | | | | | |
Based on Actual Fund Return | | | 0.58 | % | | $ | 1,000 | | | $ | 1,022 | | | $ | 2.96 | |
Hypothetical (5% return before expenses) | | | 0.58 | % | | $ | 1,000 | | | $ | 1,022 | | | $ | 2.96 | |
| * | Expenses are equal to the Fund’s annualized expense ratio multiplied by the average account value over the period, multiplied by the number of days in the period (184), then divided by 365. |
3
AMG Managers Total Return Bond Fund
Portfolio Manager’s Comments
AMG Managers Total Return Bond Fund seeks to maximize total return consistent with the preservation of capital by investing in debt securities such as corporate, mortgage-backed, international and government bonds. Normally, the Fund invests at least 80% of its net assets in these types of bonds.
THE PORTFOLIO MANAGER
Pacific Investment Management Company, LLC
Pacific Investment Management Company, LLC (“PIMCO”), the subadvisor for the AMG Managers Total Return Bond Fund, was founded in 1971. PIMCO is one of the world’s leading fixed-income managers, with expertise and significant resources committed to virtually every sector of the global bond market.
AMG Managers Total Return Bond Fund is an actively managed, diversified bond fund that focuses on intermediate-term, investment-grade bonds. The universe for the Fund includes all sectors of the bond market: governments, corporate bonds, mortgages, asset-backed securities, money market instruments and international bonds. The Fund seeks total return consistent with preservation of capital by employing PIMCO’s “Total Return” fixed-income investment philosophy. This philosophy follows three key principles:
| | • | | Major shifts in portfolio strategy are driven by longer-term, or secular, trends as opposed to short-term interest rate fluctuations. |
| | • | | Consistent investment performance is achieved by avoiding extreme swings in maturity/duration of a portfolio. |
| | • | | Emphasis is placed on adding value through state-of-the-art tools such as futures, options and volatility analysis. |
Economic analysis serves as the base for PIMCO’s portfolio strategy. Annually, PIMCO investment professionals conduct a three-day secular forum, where long-term economic and market forces are
evaluated and portfolio strategies are set. Each quarter, the team meets to evaluate the current business cycle and develop shorter-term forecasts which are used to fine-tune the investment strategy. PIMCO’s fixed-income research efforts focus on identifying relative value and understanding the risks inherent in different portfolio structures, strategies and bond market sectors. Using proprietary analytics and bottom-up credit analysis, the portfolio managers select individual bonds based on recommendations from sector analysts who specialize in corporate, mortgage, high yield, government and international bonds.
The ideal investment exhibits many of the following traits:
| | • | | It allows management to meet its overall portfolio positioning targets. Management typically invests in investment-grade securities but may invest up to 10% of the portfolio in securities that are below investment grade. |
| | • | | The investment has been independently analyzed by PIMCO. PIMCO does not rely solely on the credit ratings assigned by outside credit agencies. |
| | • | | Fund management deems that the security provides value relative to other securities within the same sector. |
Portfolio management:
| | • | | Is committed to seeking value across all bond market sectors. |
| | • | | Actively manages duration exposure, yield-curve position, volatility, sector allocation and security selection and takes only modest exposures in each of these areas relative to the market. |
| | • | | Normally hedges at least 75% of its foreign currency exposure. |
| | • | | Utilizes derivatives (futures, options, swap agreements) as substitutes for physical securities as a means of gaining more cost-effective exposure. |
The investment team may sell securities when:
| | • | | Securities individually no longer represent relative value. |
| | • | | Fund management makes a shift in its portfolio strategy (change in duration, yield curve positioning, sector strategy, etc.). |
THE YEAR IN REVIEW
Fixed-income markets rallied sharply during the prior 12 months, surprising many investors. Bond yields fell globally as a result of this market movement. Gains occurred despite the gradual tapering, and eventually ending, of the U.S. Federal Reserve’s (Fed) third round of bond-buying (quantitative easing). The prior year was marked by geopolitical tension and diverging markets, both from an economic and policy standpoint. The period ended with U.S. GDP growth strong and more than reversing the weather-induced weakness from earlier in the year. The stronger pace of growth led to a surge in the U.S. Dollar versus its major trading partners. Overseas, central banks announced new easing measures which included the European Central Bank (ECB) introducing a negative deposit rate and a program to promote business lending.
For the fiscal year ended October 31, 2014, the AMG Managers Total Return Bond Fund returned 3.64%, compared with 4.14% for its benchmark, the Barclays U.S. Aggregate Bond Index. The Fund generated solid absolute returns but trailed its benchmark during the prior year. The Fund’s underweight to investment-grade corporate bonds, which outperformed like-duration Treasuries, contributed to the Fund’s relative underperformance. Offsetting those relative losses was exposure to Build America municipal bonds as spreads tightened in the first half of 2014, amid investor demand for attractive yields. While the Fund benefitted towards the end of 2013 by virtue of its underweight to U.S. duration as yields rose across the curve, this positioning detracted value in 2014 as yields declined across most maturities.
4
AMG Managers Total Return Bond Fund
Portfolio Manager’s Comments (continued)
LOOKING FORWARD
The key output from PIMCO’s annual secular forum is an economic framework they call The New Neutral, which reflects their expectations for low real policy rates and has important implications for global financial markets. Global Aggregate demand is still insufficient to absorb bountiful aggregate supply, five years after the financial crisis and despite extraordinary monetary policies. Total global debt outstanding remains at peak levels, and this, combined with subpar growth, is constraining central bankers and the process of policy normalization.
PIMCO expects the U.S. to continue to be a bright spot in the global economy, with growth of 2.5-3%.This growth is likely to be driven by acceleration in capital expenditures, as corporations experience additional pricing power and better expected returns of their investments.
Underlying this view, monetary policy remains supportive, as the Fed looks to reflate the U.S. economy. Given the overall muted level of U.S. growth, compared to historical recoveries, PIMCO anticipates that the Fed is likely to raise policy rates only gradually. PIMCO’s expectation is that the first rise in the federal funds rate will take place in mid-2015.
One implication is that the continued intervention by monetary policy authorities, balanced with moderate GDP growth and strong corporate balance sheets, provides support for investments in bonds that trade at a spread to Treasuries. Additionally, given that maturities have been pushed out for a couple of more years, PIMCO expects it to be some time before there is a catalyst for a change in the financial cycle.
PIMCO expects the Euro Zone economy to expand by 0.75%-1.25% over the next year, continuing its painfully slow climb out of a double-dip recession. Spain should benefit from recent reform efforts
and Germany’s economy faces fewer structural headwinds. Italy and France, on the other hand, have yet to enact the types of reforms necessary to raise potential growth rates.
PIMCO expects ECB will keep monetary policy exceptionally accommodative for an extended period of time as it combats deflationary forces arising from a combination of ongoing fiscal tightening and still-constrained credit conditions (particularly in periphery countries). Although the ECB has announced an array of measures to support the Euro Zone economy, including targeted long-term refinancing operations and purchases of asset-backed securities and covered bonds, PIMCO does not believe the central bank will be able to sufficiently pursue these measures to arrest the challenge of slow growth and a slide in inflation expectations. Therefore, PIMCO thinks some form of quantitative easing in Europe is likely during 2015. The growth differential between the U.S. and Europe may also lead to a strong U.S. Dollar versus the Euro over the cyclical horizon.
In Japan, PIMCO expects growth of 1.0%-1.5%, while the debate continues to how the economy will withstand the value-added tax hike. Given tepid economic growth elsewhere in the economy, coupled with the considerable drag from the recent tax hike, the Bank of Japan (BOJ) will be obligated to support economic growth over the next year. PIMCO’s forecast is predicated on continued balance sheet expansion for the BOJ this year and possibly into next year. This should keep the Yen weak versus the U.S. Dollar, supporting Japanese exports to an extent. PIMCO also believes a weaker Yen should support higher inflation expectations in the country.
PIMCO sees a more balanced global economy in the years ahead. The baton is being passed in part from China to the developed world, where China had been an important driver of global growth in the wake of the financial crisis. While much of the world was deleveraging, China was re-leveraging both in the official banking system and outside of it, in the so-called shadow banking system.
Recently this has begun to change. As China tries to transform its economy into one that depends less on credit expansion, economic growth will slow – just as growth slowed in the developed world amid deleveraging after the financial crisis.
Beyond China, the outlook for Emerging Market countries remains bifurcated. Mexico and India are showing increasingly positive signs of economic recovery on the back of reform measures, while other countries, such as Brazil and Russia, still rely on China to drive their economies.
PIMCO will emphasize diverse sources of potential return, beyond traditional interest rate duration:
| | • | | Interest Rate Strategies- PIMCO plans to be largely underweight U.S. interest rate risk as PIMCO seeks more opportunities outside the United States, where business cycles may anchor rates for a considerable period. In Europe, PIMCO sees opportunities in sovereign debt in peripheral countries like Italy and Spain. PIMCO believes the ECB will keep monetary policy accommodative for an extended period of time as it combats deflationary forces arising from ongoing fiscal tightening and still-constrained credit conditions. |
| | • | | Mortgages- PIMCO maintains an underweight to Agency mortgage-backed securities (MBS), due to concerns about high valuation levels and effects of Fed tapering. PIMCO will hold and selectively add non-Agency MBS, as non-Agency mortgage credit continues to offer attractive loss-adjusted yields relative to other spread sectors. |
| | • | | Corporate Bonds- PIMCO will gradually add exposure to corporate credit, as market conditions permit. PIMCO views current economic conditions as reasonably benign from a credit perspective, as PIMCO does not anticipate a turn in |
5
AMG Managers Total Return Bond Fund
Portfolio Manager’s Comments (continued)
liquidity or the credit cycle over the cyclical cycle over the cyclical horizon. PIMCO prefers companies that benefit from increased pricing power and industry consolidation, such as those in the energy, health care and housing-related sectors.
| | • | | Emerging Markets- As the pace of economic growth in the developing world slows, PIMCO will remain selective in Emerging Market allocations. PIMCO currently sees Mexico as the most attractive opportunity, with solid fundamentals and high real interest rates. |
| | • | | Currency- Divergent central bank policies and economic growth are creating opportunities in the currency markets. This has led to opportunities to be long the U.S. Dollar, versus the Euro and Yen, which are still under pressure from aggressive central bank easing. |
| | • | | Municipals- PIMCO will hold tactical positions in taxable municipal bonds, as the sector offers attractive yields relative to similar Treasuries. PIMCO prefers revenue bonds, including taxable Build America bonds, to tax-backed general obligation bonds. |
| | • | | Treasury Inflation-Protected Securities(TIPS)- The Fund will continue to hold a position in TIPS. PIMCO believes that policymakers will ultimately be successful in raising inflation expectations and that longer-term inflation protection is attractively priced. |
6
AMG Managers Total Return Bond Fund
Portfolio Manager’s Comments (continued)
CUMULATIVE TOTAL RETURN PERFORMANCE
The Fund’s cumulative total return is based on the daily change in net asset value (NAV), and assumes that all dividends and distributions were reinvested. This graph compares a hypothetical $10,000 investment made in the AMG Managers Total Return Bond Fund on October 31, 2004, to a $10,000 investment made in the Barclays U.S. Aggregate Bond Index® for the same time period. Performance for periods longer than one year is annualized. The graph and table do not reflect the deduction of taxes that a shareholder would pay on a Fund distribution or redemption of shares. The listed returns for the Fund are net of expenses and the returns for the index exclude expenses. Total returns would have been lower had certain expenses not been reduced.
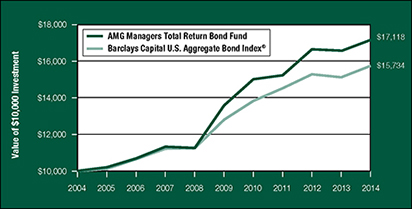
The table below shows the average annual total returns for the AMG Managers Total Return Bond Fund and the Barclays U.S. Aggregate Bond Index® for the same time periods ended October 31, 2014.
| | | | | | | | | | | | |
| | | One | | | Five | | | Ten | |
| Average Annual Total Returns 1 | | Year | | | Years | | | Years | |
AMG Managers Total Return Bond Fund2,3,4,5,6,7,8 | | | 3.64 | % | | | 4.76 | % | | | 5.52 | % |
Barclays U.S. Aggregate Bond Index®9 | | | 4.14 | % | | | 4.22 | % | | | 4.64 | % |
The performance data shown represents past performance. Past performance is not a guarantee of future results. Current performance may be lower or higher than the performance data quoted. The investment return and principal value of an investment in the Fund will fluctuate so that an investor’s shares, when redeemed, may be worth more or less than their original cost.
Investors should carefully consider the Fund’s investment objectives, risks, charges and expenses before investing. For performance information through the most recent month end, current net asset values per share for the Fund and other information, please call (800) 835-3879 or visit our website at www.amgfunds.com for a free prospectus. Read it carefully before investing or sending money.
Distributed by AMG Distributors, Inc., member FINRA.
| 1 | Total return equals income yield plus share price change and assumes reinvestment of all dividends and capital gain distributions. Returns are net of fees and may reflect offsets of Fund expenses as described in the prospectus. No adjustment has been made for taxes payable by shareholders on their reinvested dividends and capital gain distributions. Returns for periods greater than one year are annualized. The listed returns on the Fund are net of expenses and based on the published NAV as of October 31, 2014. All returns are in U.S. dollars($). |
| 2 | From time to time, the Fund’s advisor has waived its fees and/or absorbed Fund expenses, which has resulted in higher returns. |
| 3 | Fixed income funds are subject to the risks associated with investments in debt securities, such as default risk and fluctuations in the perception of the debtor’s ability to pay its creditors. Changing interest rates may adversely affect the value of a fixed income investment. An increase in interest rates typically causes the value of bonds and other fixed-income securities to fall. |
| 4 | The Fund may use derivative instruments for hedging purposes or as part of its investment strategy. There is also a risk that a derivative intended as a hedge may not perform as expected. The main risk with derivatives is that some types can amplify a gain or loss, potentially earning or losing substantially more money than the actual cost of the derivative; or that the counterparty may fail to honor its contract terms, causing a loss for the Fund. Use of these instruments may involve certain costs and risks such as liquidity risk, interest rate risk, market risk, credit risk, management risk, and the risk that the Fund could not close out a position when it would be most advantageous to do so. |
| 5 | Investments in international securities are subject to certain risks of overseas investing including currency fluctuations and changes in political and economic conditions, which could result in significant market fluctuations. These risks are magnified in emerging markets. |
| 6 | High yield bonds (also known as “junk bonds”) are subject to additional risks such as a greater risk of default. |
| 7 | Many bonds have call provisions which allow the debtors to pay them back before maturity. This is especially true with mortgage securities, which can be paid back any time. Typically debtors prepay their debt when it is to their advantage (when interest rates drop making a new loan at current rates more attractive), and thus likely to the disadvantage of bondholders, who may have to reinvest prepayment proceeds in securities with lower yields. Prepayment risk will vary depending on the provisions of the security and current interest rates relative to the interest rate of the debt. |
| 8 | Market risk associated with equity securities may become more pronounced for the Fund. |
| 9 | The Barclays U.S. Aggregate Bond Index® is an index of the U.S. investment-grade fixed-rate bond market, including both government and corporate bonds. Unlike the Fund, the Barclays U.S. Aggregate Bond Index® is unmanaged, is not available for investment, and does not incur expenses. |
Not FDIC insured, nor bank guaranteed. May lose value.
7
AMG Managers Total Return Bond Fund
Fund Snapshots (unaudited)
October 31, 2014
PORTFOLIO BREAKDOWN
| | | | | | | | |
Category | | AMG
Managers
Total Return
Bond Fund** | | | Barclays
U.S.
Aggregate
Bond Index® | |
U.S. Government and Agency Obligations | | | 42.6 | % | | | 39.1 | % |
Corporate Bonds and Notes | | | 33.8 | % | | | 23.2 | % |
Foreign Government and Agency Obligations | | | 8.0 | % | | | 6.1 | % |
Asset-Backed Securities | | | 7.6 | % | | | 0.5 | % |
Mortgage-Backed Securities | | | 5.6 | % | | | 31.1 | % |
Municipal Bonds | | | 4.6 | % | | | 0.0 | % |
Bank Loan Obligations | | | 0.7 | % | | | 0.0 | % |
Municipal Closed-End Bond Funds | | | 0.6 | % | | | 0.0 | % |
Other Assets and Liabilities | | | (3.5 | )% | | | 0.0 | % |
| ** | As a percentage of net assets. |
| | | | | | | | |
Rating | | AMG
Managers
Total Return
Bond Fund*** | | | Barclays
U.S.
Aggregate
Bond Index® | |
U.S. Treasury & Agency | | | 36.3 | % | | | 68.0 | % |
Aaa | | | 2.2 | % | | | 4.7 | % |
Aa | | | 9.9 | % | | | 3.8 | % |
A | | | 21.0 | % | | | 11.5 | % |
Baa | | | 12.5 | % | | | 12.0 | % |
Ba & lower | | | 18.1 | % | | | 0.0 | % |
TOP TEN HOLDINGS
| | | | |
Security Name | | % of Net Assets | |
FNMA, 5.000%, TBA 30yr* | | | 7.4 | % |
U.S. Treasury Inflation Indexed Notes, 0.125%, 07/15/24 | | | 2.5 | |
FNMA, 4.500%, TBA 30yr | | | 2.4 | |
U.S. Treasury Inflation Linked Notes, 2.375%, 01/15/25 | | | 2.0 | |
FNMA, 3.000%, TBA 15yr | | | 2.0 | |
FHLMC Gold Pool, 4.000%, TBA 30yr | | | 1.8 | |
U.S. Treasury Inflation Protected Securities, 2.375%, 01/15/27 | | | 1.8 | |
Brazil Letras do Tesouro Nacional, Notes, 12.205%, 10/01/15 | | | 1.8 | |
Barclays Bank PLC, 0.537%, 05/01/15 (12/01/14) | | | 1.6 | |
U.S. Treasury Inflation Indexed Notes, 1.125%, 01/15/21 | | | 1.3 | |
| | | | |
Top Ten as a Group | | | 24.6 | % |
| | | | |
| * | Top Ten Holding at April 30, 2014. |
| *** | As a percentage of market value of fixed income securities. Chart does not include equity securities. |
Credit quality ratings shown above reflect the highest rating assigned by either Standard & Poor’s (“S&P”) or Moody’s Investors Service, Inc. (“Moody’s”). These rating agencies are independent, nationally recognized statistical rating organizations and are widely used. Investment grade ratings are credit ratings of BBB/Baa or higher. Below investment grade ratings are credit ratings of BB/Ba or lower. Investments designated N/R are not rated by either rating agency. Unrated investments do not necessarily indicate low credit quality. Credit quality ratings are subject to change.
Any sectors, industries, or securities discussed should not be perceived as investment recommendations. Mention of a specific security should not be considered a recommendation to buy or solicitation to sell that security. Specific securities mentioned in this report may have been sold from the Fund’s portfolio of investments by the time you receive this report.
8
AMG Managers Total Return Bond Fund
Schedule of Portfolio Investments
October 31, 2014
| | | | | | | | |
| | | Principal Amount† | | | Value | |
Asset-Backed Securities - 7.6% | | | | | | | | |
Ally Auto Receivables Trust, Series 2014-1, Class A2, 0.480%, 02/15/17 | | $ | 9,700,000 | | | $ | 9,706,606 | |
Amortizing Residential Collateral Trust, Series 2002-BC4, 0.732%, 07/25/32 (11/25/14)1 | | | 77,398 | | | | 71,561 | |
Asset Backed Securities Corp. Home Equity Loan Trust, Series 2005-HE5, Class M4, 1.052%, 06/25/35 (11/25/14)1 | | | 3,300,000 | | | | 2,738,558 | |
Basic Asset Backed Securities Trust, Series 2006-1, Class A3, 0.462%, 04/25/36 (11/25/14)1 | | | 3,886,000 | | | | 3,380,952 | |
Bear Stearns Asset Backed Securities I Trust, Series 2007-HE5, Class 1A2, 0.332%, 06/25/47 (11/25/14)1 | | | 2,970,188 | | | | 2,862,196 | |
Countrywide Asset-Backed Certificates, | | | | | | | | |
Series 2005-14, Class 3A3, 0.502%, 04/25/36 (11/25/14)1 | | | 2,692,973 | | | | 2,653,242 | |
Series 2006-26, Class 2A3, 0.322%, 06/25/37 (11/25/14)1 | | | 2,509,082 | | | | 2,290,057 | |
Series 2007-2, Class 2A2, 0.252%, 08/25/37 (11/25/14)1 | | | 6,388,244 | | | | 6,340,939 | |
EFS Volunteer No. 2 LLC, Series 2012-1, Class A1, 1.035%, 07/26/27 (11/25/14) (a)1 | | | 1,291,703 | | | | 1,302,261 | |
EMC Mortgage Loan Trust, Series 2001-A, Class A, 0.892%, 05/25/40 (11/25/14) (a)1 | | | 456,383 | | | | 414,530 | |
First NLC Trust, Series 2007-1, Class A1, 0.222%, 08/25/37 (11/25/14) (a)1 | | | 597,615 | | | | 334,871 | |
Fremont Home Loan Trust, Series 2006-E, Class 2A1, 0.212%, 01/25/37 (11/25/14)1 | | | 35,796 | | | | 17,536 | |
GSAMP Trust, Series 2005-HE1, Class M2, 1.472%, 12/25/34 (11/25/14)1 | | | 2,081,154 | | | | 1,541,438 | |
HSI Asset Securitization Corp. Trust, Series 2005-I1, Class 2A4, 0.542%, 11/25/35 (11/25/14)1 | | | 200,000 | | | | 142,657 | |
Hyundai Auto Lease Securitization Trust, Series 2014-B, Class A1, 0.200%, 07/15/15 (a) | | | 4,185,716 | | | | 4,185,791 | |
JP Morgan Mortgage Acquisition Trust, Series 2006-NC1, Class A4, 0.325%, 04/25/36 (11/25/14)1 | | | 2,652,913 | | | | 2,608,313 | |
Long Beach Mortgage Loan Trust, Series 2004-4, Class 1A1, 0.712%, 10/25/34 (11/25/14)1 | | | 55,661 | | | | 50,660 | |
Merrill Lynch Mortgage Investors Trust, Series 2005-FM1, Class M1, 0.632%, 05/25/36 (11/25/14)1 | | | 2,832,000 | | | | 2,533,762 | |
Morgan Stanley ABS Capital I, Inc. Trust, Series 2005-HE4, Class M2, 0.622%, 07/25/35
(11/25/14)1 | | | 3,000,000 | | | | 2,764,689 | |
Morgan Stanley IXIS Real Estate Capital Trust, Series 2006-2, Class A1, 0.202%, 11/25/36 (11/25/14)1 | | | 10,700 | | | | 6,033 | |
Park Place Securities, Inc., Series 2005-WCW1, Class A1B, 0.412%, 09/25/35 (11/25/14)1 | | | 887,255 | | | | 883,552 | |
Residential Asset Mortgage Products, Inc., Series 2005-EFC6, Class M2, 0.582%, 11/25/35 (11/25/14)1 | | | 3,800,000 | | | | 3,220,838 | |
Residential Asset Securities Corporation, | | | | | | | | |
Series 2006-EMX2, Class A2, 0.352%, 02/25/36 (11/25/14)1 | | | 191,365 | | | | 188,931 | |
Series 2006-KS4, Class M1, 0.432%, 06/25/36 (11/25/14)1 | | | 6,000,000 | | | | 4,732,488 | |
Securitized Asset Backed Receivables LLC, Series 2007-HE1, Class A2A, 0.212%, 12/25/36 (11/25/14)1 | | | 428,940 | | | | 157,677 | |
Small Business Administration Participation Certificates, | | | | | | | | |
Series 2003-20I, Class 1, 5.130%, 09/01/23 | | | 31,803 | | | | 34,494 | |
Series 2007-20K, Class 1, 5.510%, 11/01/27 | | | 2,395,906 | | | | 2,687,104 | |
Series 2008-10E, Class 1, 5.110%, 09/01/18 | | | 694,182 | | | | 730,880 | |
Series 2008-20I, Class 1, 5.600%, 09/01/28 | | | 5,336,663 | | | | 5,977,611 | |
Series 2009-20E, Class 1, 4.430%, 05/01/29 | | | 3,394,727 | | | | 3,690,855 | |
Structured Asset Securities Corp. Mortgage Loan Trust, Series 2007-MN1A, Class A1, 0.382%, 01/25/37 (11/25/14) (a)1,2 | | | 5,716,241 | | | | 3,762,087 | |
Structured Asset Securities Corp. Mortgage Pass-Through Certificates, Series 2002-HF1, Class A, 0.732%, 01/25/33 (11/25/14)1 | | | 38,412 | | | | 35,886 | |
Total Asset-Backed Securities (cost $70,893,561) | | | | | | | 72,049,055 | |
Bank Loan Obligations - 0.7% | | | | | | | | |
Chrysler Group LLC, 3.500%, 05/24/17 (01/28/15)1 (cost $6,297,559) | | | 6,283,763 | | | | 6,257,578 | |
The accompanying notes are an integral part of these financial statements.
9
AMG Managers Total Return Bond Fund
Schedule of Portfolio Investments (continued)
| | | | | | | | | | | | |
| | | | | | Principal Amount† | | | Value | |
Corporate Bonds and Notes - 33.8% | | | | | | | | | | | | |
Financials - 22.2% | | | | | | | | | | | | |
Ally Financial, Inc., | | | | | | | | | | | | |
2.750%, 01/30/17 | | | | | | $ | 1,000,000 | | | $ | 1,003,700 | |
2.911%, 07/18/16 (01/20/15)1,3 | | | | | | | 1,900,000 | | | | 1,923,969 | |
3.500%, 07/18/16 | | | | | | | 900,000 | | | | 916,650 | |
5.500%, 02/15/17 | | | | | | | 3,300,000 | | | | 3,518,460 | |
7.500%, 09/15/20 | | | | | | | 799,000 | | | | 952,807 | |
8.300%, 02/12/15 | | | | | | | 800,000 | | | | 815,000 | |
Series 8, 6.750%, 12/01/14 | | | | | | | 3,900,000 | | | | 3,916,575 | |
American International Group, Inc., | | | | | | | | | | | | |
5.050%, 10/01/15 | | | | | | | 400,000 | | | | 415,974 | |
6.250%, 03/15/37 | | | | | | | 800,000 | | | | 889,424 | |
MTN, 5.600%, 10/18/16 | | | | | | | 800,000 | | | | 869,027 | |
Banco Popular Espanol, S.A., Series EMTN, 11.500%, 10/29/493,4,5 | | | EUR | | | | 700,000 | | | | 1,005,495 | |
Banco Santander Brasil, S.A., 4.500%, 04/06/15 (a) | | | | | | | 200,000 | | | | 202,924 | |
Banco Santander, S.A., 6.250%, 09/11/494,5 | | | EUR | | | | 3,300,000 | | | | 4,006,159 | |
Bank of America Corp., | | | | | | | | | | | | |
4.500%, 04/01/15 | | | | | | | 10,000,000 | | | | 10,162,620 | |
6.500%, 08/01/16 | | | | | | | 2,800,000 | | | | 3,054,542 | |
6.500%, 07/15/18 | | | | | | | 5,000,000 | | | | 5,723,525 | |
GMTN, 6.400%, 08/28/17 | | | | | | | 3,400,000 | | | | 3,832,834 | |
Bank of America NA, 0.534%, 06/15/17 (12/15/14)1 | | | | | | | 3,500,000 | | | | 3,476,214 | |
Bank of Montreal, 0.196%, 12/08/14 (12/08/14)1 | | | | | | | 5,500,000 | | | | 5,500,325 | |
Barclays Bank PLC, | | | | | | | | | | | | |
0.537%, 05/01/15 (12/01/14)1 | | | | | | | 15,300,000 | | | | 15,299,633 | |
7.625%, 11/21/22 | | | | | | | 2,900,000 | | | | 3,164,625 | |
7.750%, 04/10/234 | | | | | | | 4,200,000 | | | | 4,609,500 | |
BB&T Corp., MTN, 1.094%, 06/15/18 (12/15/14)1 | | | | | | | 3,600,000 | | | | 3,655,987 | |
BBVA Bancomer, S.A., | | | | | | | | | | | | |
4.500%, 03/10/16 (a) | | | | | | | 500,000 | | | | 523,750 | |
6.500%, 03/10/21 (a) | | | | | | | 900,000 | | | | 1,003,500 | |
The Bear Stearns Cos. LLC, 5.300%, 10/30/15 | | | | | | | 2,400,000 | | | | 2,510,731 | |
BPCE, S.A., 0.801%, 11/18/16 (11/18/14)1 | | | | | | | 7,300,000 | | | | 7,318,403 | |
CaixaBank, S.A., 3.250%, 10/05/15 | | | EUR | | | | 700,000 | | | | 901,939 | |
CIT Group, Inc., 4.750%, 02/15/15 (a) | | | | | | | 1,900,000 | | | | 1,917,813 | |
Citigroup, Inc., | | | | | | | | | | | | |
6.125%, 08/25/36 | | | | | | | 3,200,000 | | | | 3,780,906 | |
MTN, 0.752%, 05/01/17 (02/02/15)1,3 | | | | | | | 7,500,000 | | | | 7,508,318 | |
The accompanying notes are an integral part of these financial statements.
10
AMG Managers Total Return Bond Fund
Schedule of Portfolio Investments (continued)
| | | | | | | | | | | | |
| | | | | | Principal Amount† | | | Value | |
Financials - 22.2% (continued) | | | | | | | | | | | | |
Cooperatieve Centrale Raiffeisen-Boerenleenbank, | | | | | | | | | | | | |
0.515%, 11/23/16 (11/23/14)1 | | | | | | $ | 5,800,000 | | | $ | 5,806,786 | |
0.563%, 04/28/17 (01/28/15)1,3 | | | | | | | 2,800,000 | | | | 2,800,330 | |
Credit Agricole, S.A., 6.500%, 04/29/494,5 | | | EUR | | | | 900,000 | | | | 1,150,253 | |
Credit Suisse, | | | | | | | | | | | | |
GMTN, 0.725%, 05/26/17 (11/26/14)1 | | | | | | | 2,000,000 | | | | 2,005,832 | |
Series YCD, 0.465%, 03/17/15 (12/17/14)1 | | | | | | | 800,000 | | | | 800,013 | |
Eksportfinans ASA, 3.000%, 11/17/143 | | | | | | | 3,955,000 | | | | 3,959,331 | |
Ford Motor Credit Co. LLC, | | | | | | | | | | | | |
1.008%, 01/17/17 (01/20/15)1 | | | | | | | 10,500,000 | | | | 10,567,567 | |
2.750%, 05/15/15 | | | | | | | 1,100,000 | | | | 1,111,096 | |
3.875%, 01/15/15 | | | | | | | 4,700,000 | | | | 4,729,737 | |
7.000%, 04/15/15 | | | | | | | 1,400,000 | | | | 1,438,676 | |
MTN, 0.682%, 11/08/16 (02/09/15)1 | | | | | | | 3,800,000 | | | | 3,801,132 | |
The Goldman Sachs Group, Inc., | | | | | | | | | | | | |
0.683%, 03/22/16 (12/22/14)1 | | | | | | | 5,500,000 | | | | 5,496,221 | |
0.730%, 01/12/15 (01/12/15)1 | | | | | | | 1,800,000 | | | | 1,800,441 | |
International Lease Finance Corp., | | | | | | | | | | | | |
4.875%, 04/01/15 | | | | | | | 700,000 | | | | 709,520 | |
5.750%, 05/15/16 | | | | | | | 300,000 | | | | 313,313 | |
6.750%, 09/01/16 (a) | | | | | | | 800,000 | | | | 852,000 | |
JPMorgan Chase & Co., | | | | | | | | | | | | |
3.150%, 07/05/16 | | | | | | | 292,000 | | | | 302,101 | |
MTN, 0.784%, 04/25/18 (01/26/15)1 | | | | | | | 2,000,000 | | | | 2,002,388 | |
JPMorgan Chase Bank, NA, | | | | | | | | | | | | |
0.564%, 06/13/16 (12/15/14)1 | | | | | | | 1,300,000 | | | | 1,296,851 | |
0.770%, 05/31/174 | | | EUR | | | | 900,000 | | | | 1,128,680 | |
KBC Bank NV, 8.000%, 01/25/234 | | | | | | | 2,600,000 | | | | 2,896,933 | |
LBG Capital No. 1 PLC, 8.500%, 12/29/49 (a)4,5 | | | | | | | 400,000 | | | | 446,356 | |
LBG Capital No.2 PLC, Series 21, 15.000%, 12/21/193 | | | GBP | | | | 2,900,000 | | | | 6,494,753 | |
Lloyds Banking Group PLC, 7.625%, 12/29/494,5 | | | GBP | | | | 1,700,000 | | | | 2,751,690 | |
Morgan Stanley, MTN, 6.000%, 04/28/15 | | | | | | | 1,100,000 | | | | 1,128,512 | |
Nationwide Building Society, 6.250%, 02/25/20 (a) | | | | | | | 1,800,000 | | | | 2,120,276 | |
Navient Corp., MTN, 6.250%, 01/25/16 | | | | | | | 300,000 | | | | 312,750 | |
Principal Life Global Funding II, 1.200%, 05/19/17 (a) | | | | | | | 4,500,000 | | | | 4,483,377 | |
Qatari Diar Finance QSC, 3.500%, 07/21/15 | | | | | | | 900,000 | | | | 918,450 | |
The Royal Bank of Scotland Group PLC, 6.990%, 10/29/49 (a)4,5 | | | | | | | 2,600,000 | | | | 2,964,000 | |
Sberbank of Russia Via SB Capital, S.A., Series 4, 5.499%, 07/07/15 | | | | | | | 500,000 | | | | 508,655 | |
Standard Chartered PLC, 3.850%, 04/27/15 (a) | | | | | | | 3,800,000 | | | | 3,859,421 | |
State Bank of India, 4.500%, 07/27/15 (a) | | | | | | | 2,900,000 | | | | 2,970,635 | |
The accompanying notes are an integral part of these financial statements.
11
AMG Managers Total Return Bond Fund
Schedule of Portfolio Investments (continued)
| | | | | | | | | | | | |
| | | | | | Principal Amount† | | | Value | |
Financials - 22.2% (continued) | | | | | | | | | | | | |
Stone Street Trust, 5.902%, 12/15/15 (a) | | | | | | $ | 2,800,000 | | | $ | 2,928,257 | |
Sumitomo Mitsui Banking Corp., 0.602%, 05/02/17 (02/02/15)1 | | | | | | | 11,700,000 | | | | 11,701,451 | |
UBS AG, 7.625%, 08/17/22 | | | | | | | 2,000,000 | | | | 2,363,872 | |
VTB Bank OJSC Via VTB Capital, S.A., 6.465%, 03/04/15 (a)2 | | | | | | | 1,800,000 | | | | 1,812,780 | |
Wells Fargo & Co., Series K, 7.980%, 03/29/494,5 | | | | | | | 1,600,000 | | | | 1,771,499 | |
Total Financials | | | | | | | | | | | 208,887,264 | |
Industrials - 10.1% | | | | | | | | | | | | |
Apple, Inc., 2.850%, 05/06/21 | | | | | | | 200,000 | | | | 203,188 | |
BellSouth Corp., 4.182%, 04/26/15 (a)2 | | | | | | | 10,700,000 | | | | 10,869,381 | |
BMW US Capital LLC, EMTN, 0.574%, 06/02/17 (12/02/14)1,2 | | | | | | | 10,600,000 | | | | 10,616,960 | |
ConAgra Foods, Inc., 0.601%, 07/21/16 (01/21/15)1 | | | | | | | 5,900,000 | | | | 5,899,469 | |
Corp. Nacional del Cobre de Chile, 7.500%, 01/15/19 (a)3 | | | | | | | 1,200,000 | | | | 1,449,232 | |
Covidien International Finance S.A., 1.350%, 05/29/15 | | | | | | | 5,000,000 | | | | 5,024,455 | |
Daimler Finance North America LLC, 1.300%, 07/31/15 (a) | | | | | | | 5,800,000 | | | | 5,833,170 | |
Gazprom OAO Via Gaz Capital, S.A., | | | | | | | | | | | | |
5.092%, 11/29/15 (a) | | | | | | | 500,000 | | | | 508,865 | |
5.875%, 06/01/15 | | | EUR | | | | 900,000 | | | | 1,147,254 | |
Hellenic Railways Organization, S.A., | | | | | | | | | | | | |
4.028%, 03/17/17 | | | EUR | | | | 4,100,000 | | | | 4,911,841 | |
Series 3BR, 4.500%, 12/06/16 | | | JPY | | | | 91,600,000 | | | | 772,112 | |
Hewlett-Packard Co., 2.350%, 03/15/15 | | | | | | | 1,300,000 | | | | 1,307,927 | |
Petrobras International Finance Co., | | | | | | | | | | | | |
3.875%, 01/27/16 | | | | | | | 3,300,000 | | | | 3,372,098 | |
5.875%, 03/01/18 | | | | | | | 2,300,000 | | | | 2,477,629 | |
Petroleos Mexicanos, 8.000%, 05/03/19 | | | | | | | 1,200,000 | | | | 1,463,880 | |
Ras Laffan Liquefied Natural Gas Co., Ltd., 5.298%, 09/30/20 (a) | | | | | | | 557,460 | | | | 604,844 | |
Rohm & Haas Co., 6.000%, 09/15/17 | | | | | | | 316,000 | | | | 353,613 | |
Schaeffler Holding Finance BV, | | | | | | | | | | | | |
5.750%, 11/15/21 (a)6 | | | EUR | | | | 900,000 | | | | 1,168,718 | |
6.250%, 11/15/19 (a)2,6 | | | | | | | 600,000 | | | | 624,000 | |
Statoil A.S.A, 0.692%, 11/08/18 (02/09/15)1 | | | | | | | 6,800,000 | | | | 6,844,479 | |
Targa Resources Partners LP / Targa Resources Partners Finance Corp., 4.125%, 11/15/19 (a) | | | | | | | 1,100,000 | | | | 1,119,250 | |
TCM Sub LLC, 3.550%, 01/15/15 (a)2 | | | | | | | 11,600,000 | | | | 11,665,911 | |
Tesoro Logistics LP / Tesoro Logistics Finance Corp., | | | | | | | | | | | | |
5.500%, 10/15/19 (a) | | | | | | | 200,000 | | | | 206,000 | |
6.250%, 10/15/22 (a) | | | | | | | 600,000 | | | | 622,500 | |
Time Warner, Inc., | | | | | | | | | | | | |
3.150%, 07/15/15 | | | | | | | 4,400,000 | | | | 4,479,464 | |
5.875%, 11/15/16 | | | | | | | 1,200,000 | | | | 1,313,820 | |
The accompanying notes are an integral part of these financial statements.
12
AMG Managers Total Return Bond Fund
Schedule of Portfolio Investments (continued)
| | | | | | | | | | | | |
| | | | | | Principal Amount† | | | Value | |
Industrials - 10.1% (continued) | | | | | | | | | | | | |
UAL 2009-1 Pass Through Trust, 10.400%, 11/01/16 | | | | | | $ | 196,755 | | | $ | 217,414 | |
Verizon Communications, Inc., | | | | | | | | | | | | |
1.984%, 09/14/18 (12/14/14)1 | | | | | | | 500,000 | | | | 523,670 | |
2.500%, 09/15/16 | | | | | | | 700,000 | | | | 721,012 | |
3.000%, 11/01/21 | | | | | | | 800,000 | | | | 795,110 | |
3.500%, 11/01/24 | | | | | | | 3,800,000 | | | | 3,747,948 | |
3.650%, 09/14/18 | | | | | | | 1,800,000 | | | | 1,904,661 | |
Xerox Business Services LLC, 5.200%, 06/01/15 | | | | | | | 2,500,000 | | | | 2,562,947 | |
Total Industrials | | | | | | | | | | | 95,332,822 | |
Utilities - 1.5% | | | | | | | | | | | | |
Constellation Energy Group, Inc., 4.550%, 06/15/15 | | | | | | | 5,600,000 | | | | 5,727,204 | |
Dynegy Finance I, Inc. / Dynegy Finance II, Inc., | | | | | | | | | | | | |
6.750%, 11/01/19 (a) | | | | | | | 3,800,000 | | | | 3,937,750 | |
7.375%, 11/01/22 (a) | | | | | | | 900,000 | | | | 952,875 | |
7.625%, 11/01/24 (a) | | | | | | | 500,000 | | | | 530,625 | |
Entergy Corp., 3.625%, 09/15/15 | | | | | | | 2,200,000 | | | | 2,247,835 | |
Majapahit Holding, B.V., 7.750%, 01/20/20 | | | | | | | 700,000 | | | | 818,125 | |
Total Utilities | | | | | | | | | | | 14,214,414 | |
Total Corporate Bonds and Notes (cost $314,262,970) | | | | | | | | | | | 318,434,500 | |
Foreign Government and Agency Obligations - 8.0% | | | | | | | | | | | | |
Autonomous Community of Valencia Spain Notes, EMTN, 4.375%, 07/16/15 | | | EUR | | | | 400,000 | | | | 514,417 | |
Banco Nacional de Desenvolvimento Economico e Social, | | | | | | | | | | | | |
Notes, 3.375%, 09/26/16 (a) | | | | | | | 400,000 | | | | 409,500 | |
Notes, 4.125%, 09/15/17 (a) | | | EUR | | | | 400,000 | | | | 529,543 | |
Brazil Letras do Tesouro Nacional, | | | | | | | | | | | | |
Notes, 11.690%, 04/01/157 | | | BRL | | | | 6,000,000 | | | | 2,313,747 | |
Notes, 12.205%, 10/01/157 | | | BRL | | | | 45,550,000 | | | | 16,560,795 | |
Notes, 12.305%, 07/01/187 | | | BRL | | | | 5,800,000 | | | | 1,528,621 | |
Notes, 12.355%, 01/01/177 | | | BRL | | | | 3,000,000 | | | | 942,594 | |
Italy Buoni Poliennali Del Tesoro, | | | | | | | | | | | | |
Notes, 1.150%, 05/15/17 | | | EUR | | | | 6,300,000 | | | | 7,973,350 | |
Notes, 4.750%, 06/01/17 | | | EUR | | | | 2,500,000 | | | | 3,448,856 | |
Italy Certificati di Credito del Tesoro Notes, 0.621%, 04/29/167 | | | EUR | | | | 5,100,000 | | | | 6,332,330 | |
The Korea Development Bank Notes, 4.375%, 08/10/15 | | | | | | | 3,500,000 | | | | 3,598,991 | |
Korea Finance Corp. Notes, 3.250%, 09/20/16 | | | | | | | 800,000 | | | | 830,494 | |
Korea Housing Finance Corp. Notes, 4.125%, 12/15/15 (a) | | | | | | | 500,000 | | | | 517,064 | |
Mexican Bonos Notes, Series MI10, 9.500%, 12/18/14 | | | MXN | | | | 155,000,000 | | | | 11,614,367 | |
The accompanying notes are an integral part of these financial statements.
13
AMG Managers Total Return Bond Fund
Schedule of Portfolio Investments (continued)
| | | | | | | | | | | | |
| | | | | | Principal Amount† | | | Value | |
Foreign Government and Agency Obligations - 8.0% (continued) | | | | | | | | | | | | |
Ontario Bonds, Province of, | | | | | | | | | | | | |
3.150%, 06/02/22 | | | CAD | | | | 600,000 | | | $ | 552,737 | |
4.000%, 06/02/21 | | | CAD | | | | 2,200,000 | | | | 2,143,314 | |
Ontario Notes, Province of, 1.650%, 09/27/19 | | | | | | | 1,100,000 | | | | 1,085,381 | |
Quebec Bonds, Province of, | | | | | | | | | | | | |
3.500%, 07/29/20 | | | | | | | 500,000 | | | | 536,925 | |
3.500%, 12/01/22 | | | CAD | | | | 900,000 | | | | 843,351 | |
4.250%, 12/01/21 | | | CAD | | | | 2,600,000 | | | | 2,566,065 | |
Spain Government, | | | | | | | | | | | | |
Bonds, 2.750%, 10/31/24 (a) | | | EUR | | | | 5,100,000 | | | | 6,780,963 | |
Notes, 2.100%, 04/30/17 | | | EUR | | | | 1,700,000 | | | | 2,206,231 | |
Notes, 3.250%, 04/30/16 | | | EUR | | | | 1,200,000 | | | | 1,566,224 | |
Total Foreign Government and Agency Obligations (cost $79,814,590) | | | | | | | | | | | 75,395,860 | |
Mortgage-Backed Securities - 5.6% | | | | | | | | | | | | |
American Home Mortgage Investment Trust, Series 2004-4, Class 4A, 2.329%, 02/25/45 (12/25/14)1 | | | | | | | 384,199 | | | | 383,952 | |
Arran Residential Mortgages Funding PLC, Series 2010-1A, Class A2B, 1.598%, 05/16/47 (11/17/14) (a)1 | | | EUR | | | | 1,150,230 | | | | 1,455,002 | |
Bank of America Funding Corp., Series 2005-D, Class A1, 2.629%, 05/25/35 (12/25/14)1 | | | | | | | 395,126 | | | | 404,370 | |
Bear Stearns Adjustable Rate Mortgage Trust, | | | | | | | | | | | | |
Series 2000-2, Class A1, 2.747%, 11/25/30 (12/25/14)1 | | | | | | | 9,836 | | | | 9,380 | |
Series 2002-11, Class 1A1, 2.354%, 02/25/33 (12/25/14)1 | | | | | | | 8,536 | | | | 8,219 | |
Series 2003-1, Class 6A1, 2.504%, 04/25/33 (12/25/14)1 | | | | | | | 189,804 | | | | 191,600 | |
Series 2005-2, Class A1, 2.580%, 03/25/35 (12/25/14)1 | | | | | | | 4,708,338 | | | | 4,766,212 | |
Series 2005-2, Class A2, 2.528%, 03/25/35 (12/25/14)1 | | | | | | | 2,261,117 | | | | 2,287,345 | |
Series 2005-5, Class A2, 2.260%, 08/25/35 (12/25/14)1 | | | | | | | 4,322,727 | | | | 4,351,149 | |
Series 2005-12, Class 13A1, 5.422%, 02/25/36 (12/25/14)1 | | | | | | | 148,641 | | | | 134,297 | |
Bear Stearns Alt-A Trust, | | | | | | | | | | | | |
Series 2005-4, Class 23A1, 2.551%, 05/25/35 (12/25/14)1 | | | | | | | 1,068,092 | | | | 1,029,031 | |
Series 2005-7, Class 22A1, 2.649%, 09/25/35 (12/25/14)1 | | | | | | | 536,447 | | | | 445,028 | |
Bear Stearns Commercial Mortgage Securities Trust, Series 2007-PW18, Class A4, 5.700%, 06/11/50 | | | | | | | 2,800,000 | | | | 3,075,944 | |
CIFC Funding, Ltd., Series 2012-1AR, Class A1R, 1.382%, 08/14/24 (11/14/14) (a)1 | | | | | | | 4,800,000 | | | | 4,786,080 | |
Citigroup Mortgage Loan Trust, Inc., | | | | | | | | | | | | |
Series 2005-6, Class A1, 2.200%, 09/25/35 (12/25/14)1 | | | | | | | 3,230,834 | | | | 3,226,046 | |
Series 2005-11, Class A2A, 2.510%, 10/25/35 (12/25/14)1 | | | | | | | 206,544 | | | | 204,772 | |
Countrywide Alternative Loan Trust, Series 2007-OA7, Class A1A, 0.332%, 05/25/47 (11/25/14)1 | | | | | | | 1,003,772 | | | | 843,846 | |
Countrywide Home Loans, Inc., Series 2005-HYB9, Class 3A2A, 2.313%, 02/20/36 (12/20/14)1 | | | | | | | 245,132 | | | | 223,812 | |
CSMC, Series 2010-18R, Class 4A4, 2.467%, 04/26/38 (a)4 | | | | | | | 1,200,000 | | | | 1,172,286 | |
Eurohome UK Mortgages PLC, Series 2007-1, Class A, 0.713%, 06/15/44 (12/15/14)1 | | | GBP | | | | 1,642,786 | | | | 2,500,444 | |
GSR Mortgage Loan Trust, Series 2005-AR7, Class 6A1, 4.989%, 11/25/35 (12/25/14)1 | | | | | | | 508,362 | | | | 501,491 | |
IndyMac INDX Mortgage Loan Trust, Series 2005-AR31, Class, 2.350%, 01/25/36 (12/25/14)1 | | | | | | | 1,276,437 | | | | 1,045,105 | |
JPMorgan Chase Commercial Mortgage Securities Trust, Series 2006-LDP9, Class A3, 5.336%, 05/15/47 | | | | | | | 2,069,845 | | | | 2,213,947 | |
The accompanying notes are an integral part of these financial statements.
14
AMG Managers Total Return Bond Fund
Schedule of Portfolio Investments (continued)
| | | | | | | | | | | | |
| | | | | | Principal Amount† | | | Value | |
Mortgage-Backed Securities - 5.6% (continued) | | | | | | | | | | | | |
JPMorgan Mortgage Trust, Series 2005-A1, Class 6T1, 2.640%, 02/25/35 (12/25/14)1 | | | | | | $ | 180,075 | | | $ | 177,167 | |
Merrill Lynch Mortgage Investors Trust, | | | | | | | | | | | | |
Series MLCC 2005-3, Class 4A, 0.402%, 11/25/35 (11/25/14)1 | | | | | | | 105,990 | | | | 100,636 | |
Series MLMI 2005-A10, Class A, 0.362%, 02/25/36 (11/25/14)1 | | | | | | | 615,417 | | | | 567,996 | |
Opteum Mortgage Acceptance Corp. Asset Backed Pass-Through Certificates, Series 2005-5, Class 1APT, 0.432%, 12/25/35 (11/25/14)1 | | | | | | | 1,947,695 | | | | 1,747,278 | |
Prime Mortgage Trust, | | | | | | | | | | | | |
Series 2004-CL1, Class 1A2, 0.552%, 02/25/34 (11/25/14)1 | | | | | | | 79,624 | | | | 75,245 | |
Series 2004-CL1, Class 2A2, 0.552%, 02/25/19 (11/25/14)1 | | | | | | | 681 | | | | 670 | |
Residential Asset Securitization Trust, Series 2006-A7CB, Class 3A1, 6.500%, 07/25/36 | | | | | | | 5,148,775 | | | | 3,488,825 | |
Silenus European Loan Conduit No. 25, Ltd., Class A, 0.348%, 05/15/19 (11/17/14)1 | | | EUR | | | | 31,059 | | | | 38,473 | |
Structured Asset Mortgage Investments II Trust, | | | | | | | | | | | | |
Series 2005-AR5, Class A2, 0.407%, 07/19/35 (11/19/14)1 | | | | | | | 552,725 | | | | 535,947 | |
Series 2006-AR3, Class 11A1, 0.362%, 04/25/36 (11/25/14)1 | | | | | | | 633,983 | | | | 470,337 | |
Series 2007-AR4, Class A3, 0.372%, 09/25/47 (11/25/14)1 | | | | | | | 3,200,000 | | | | 2,525,469 | |
Structured Asset Mortgage Investments Trust, Series 2002-AR3, Class A1, 0.817%, 09/19/32 (11/19/14)1 | | | | | | | 188,438 | | | | 184,011 | |
Structured Asset Securities Corp., | | | | | | | | | | | | |
Series 2001-21A, Class 1A1, 2.217%, 01/25/32 (12/25/14)1 | | | | | | | 10,307 | | | | 10,018 | |
Series 2006-11, Class A1, 2.606%, 10/28/35 (12/28/14) (a)1 | | | | | | | 273,228 | | | | 260,614 | |
Wachovia Bank Commercial Mortgage Trust, Series 2007-WHL8, Class A1, 0.233%, 06/15/20 (11/15/14) (a)1 | | | | | | | 233,103 | | | | 232,561 | |
WaMu Mortgage Pass-Through Certificates, | | | | | | | | | | | | |
Series 2002-AR17, Class 1A, 1.315%, 11/25/42 (12/25/14)1 | | | | | | | 97,846 | | | | 95,283 | |
Series 2005-AR13, Class A1A1, 0.442%, 10/25/45 (11/25/14)1 | | | | | | | 217,375 | | | | 209,318 | |
Series 2007-OA6, Class 1A, 0.925%, 07/25/47 (12/25/14)1 | | | | | | | 6,453,014 | | | | 5,518,618 | |
Washington Mutual MSC Mortgage Pass-Through, Series 2002-AR1, Class 2A2, 1.770%, 02/25/31 (12/25/14)1 | | | | | | | 1,496 | | | | 1,497 | |
Wells Fargo Mortgage Backed Securities Trust, Series 2006-AR2, Class 2A1, 2.615%, 03/25/364 | | | | | | | 1,003,732 | | | | 1,001,926 | |
Total Mortgage-Backed Securities (cost $52,249,794) | | | | | | | | | | | 52,501,247 | |
Municipal Bonds - 4.6% | | | | | | | | | | | | |
American Municipal Power, Inc., Combined Hydroelectric Projects Revenue, Taxable Build America, 8.084%, 02/15/50 | | | | | | | 1,000,000 | | | | 1,563,810 | |
California Infrastructure & Economic Development Bank Revenue, UCSF Neurosciences Building 19A, Taxable Build America, 6.486%, 05/15/49 | | | | | | | 1,000,000 | | | | 1,198,180 | |
California State General Obligation, Build America Bonds, 7.500%, 04/01/34 | | | | | | | 1,300,000 | | | | 1,875,965 | |
California State General Obligation, Build America Bonds, 7.550%, 04/01/39 | | | | | | | 1,300,000 | | | | 1,953,705 | |
California State General Obligation, Build America Bonds, 7.600%, 11/01/40 | | | | | | | 1,000,000 | | | | 1,519,480 | |
California State General Obligation, Build America Bonds, 7.950%, 03/01/36 | | | | | | | 1,100,000 | | | | 1,361,217 | |
California State University Systemwide Revenue, Build America Bonds, 6.434%, 11/01/30 | | | | | | | 700,000 | | | | 863,114 | |
Calleguas-Las Virgenes, CA Public Financing Authority Water Revenue, Calleguas Municipal Water District, Taxable Build America, 5.944%, 07/01/40 | | | | | | | 1,000,000 | | | | 1,173,800 | |
Chicago, IL Transit Authority, Sales & Transfer Tax Receipts Revenue, Pension Funding, 6.300%, 12/01/21 | | | | | | | 100,000 | | | | 109,091 | |
The accompanying notes are an integral part of these financial statements.
15
AMG Managers Total Return Bond Fund
Schedule of Portfolio Investments (continued)
| | | | | | | | |
| | | Principal Amount† | | | Value | |
Municipal Bonds - 4.6% (continued) | | | | | | | | |
Chicago, IL Transit Authority, Sales & Transfer Tax Receipts Revenue, Pension Funding, 6.899%, 12/01/40 | | $ | 1,600,000 | | | $ | 1,983,696 | |
Chicago, IL Transit Authority, Sales & Transfer Tax Receipts Revenue, Retiree Health Care, 6.899%, 12/01/40 | | | 1,700,000 | | | | 2,107,677 | |
Clark County, NV Airport Revenue, Taxable Direct Payment Build America, 6.820%, 07/01/45 | | | 800,000 | | | | 1,130,624 | |
Illinois Municipal Electric Agency Power Supply System Revenue, 6.832%, 02/01/35 | | | 800,000 | | | | 965,496 | |
Los Angeles County Public Works Financing Authority Revenue, Multiple Capital Projects I, 7.488%, 08/01/33 | | | 200,000 | | | | 261,238 | |
Los Angeles County Public Works Financing Authority Revenue, Multiple Capital Projects I, 7.618%, 08/01/40 | | | 300,000 | | | | 425,787 | |
Los Angeles, CA Unified School District General Obligation, Taxable Build America, 6.758%, 07/01/34 | | | 4,000,000 | | | | 5,405,600 | |
Los Angeles, CA Wastewater System Revenue, 5.713%, 06/01/39 | | | 1,000,000 | | | | 1,252,170 | |
New Jersey State Turnpike Authority Revenue, 7.102%, 01/01/41 | | | 800,000 | | | | 1,134,168 | |
New York City Municipal Finance Authority Revenue, Water and Sewer System General Resolution, Taxable Bond America, 5.724%, 06/15/42 | | | 5,000,000 | | | | 6,315,000 | |
New York City Municipal Finance Authority Revenue, Water and Sewer System Second General Resolution, Taxable Bond America, 5.882%, 06/15/44 | | | 700,000 | | | | 906,745 | |
New York City Municipal Finance Authority Revenue, Water and Sewer System Second General Resolution, Taxable Bond America, 6.282%, 06/15/42 | | | 1,100,000 | | | | 1,278,101 | |
New York Liberty Development Corp., 5.750%, 11/15/51 | | | 1,000,000 | | | | 1,162,070 | |
North Carolina Turnpike Authority State Annual Appropriation Revenue, Triangle Expressway System, Taxable Build America, 6.700%, 01/01/39 | | | 900,000 | | | | 1,020,078 | |
Public Power Generation Agency Revenue, Whelan Energy Center Unit 2, Taxable Build America, 7.242%, 01/01/41 | | | 1,200,000 | | | | 1,368,708 | |
San Francisco Bay Area Toll Authority Subordinate Toll Bridge Revenue, 7.043%, 04/01/50 | | | 900,000 | | | | 1,304,928 | |
Truckee Meadows Water Authority Revenue, 5.000%, 07/01/36 (NATL-RE)8 | | | 200,000 | | | | 205,506 | |
University of California General Revenue, Taxable Build America, 6.270%, 05/15/31 | | | 2,500,000 | | | | 2,823,125 | |
University of California Medical Center Regents Revenue, 6.398%, 05/15/31 | | | 200,000 | | | | 241,718 | |
University of California Medical Center Regents Revenue, 6.548%, 05/15/48 | | | 300,000 | | | | 395,838 | |
Total Municipal Bonds (cost $33,792,510) | | | | | | | 43,306,635 | |
| | |
| | | Shares | | | | |
Municipal Closed-End Bond Funds - 0.6% | | | | | | | | |
Deutsche Municipal, Income Trust3 | | | 55,000 | | | | 744,700 | |
Dreyfus Municipal Income, Inc. | | | 37,500 | | | | 355,875 | |
Invesco Advantage Municipal Income Trust II | | | 61,796 | | | | 719,305 | |
Invesco Trust for Investment Grade Municipals | | | 55,000 | | | | 725,450 | |
MFS Municipal Income Trust | | | 53,800 | | | | 351,314 | |
Nuveen Performance Plus Municipal Fund | | | 55,000 | | | | 803,550 | |
Nuveen Premium Income Municipal Fund II | | | 55,000 | | | | 770,000 | |
Nuveen Premium Income Municipal Fund IV | | | 55,000 | | | | 731,500 | |
Nuveen Quality Income Municipal Fund3 | | | 36,585 | | | | 510,727 | |
Total Municipal Closed-End Bond Funds (cost $5,887,563) | | | | | | | 5,712,421 | |
The accompanying notes are an integral part of these financial statements.
16
AMG Managers Total Return Bond Fund
Schedule of Portfolio Investments (continued)
| | | | | | | | |
| | | Principal Amount† | | | Value | |
U.S. Government and Agency Obligations - 42.6% | | | | | | | | |
Federal Home Loan Mortgage Corporation - 4.6% | | | | | | | | |
FHLMC, | | | | | | | | |
0.875%, 03/07/18 | | $ | 600,000 | | | $ | 593,015 | |
1.250%, 08/01/19 to 10/02/193 | | | 5,600,000 | | | | 5,472,001 | |
2.448%, 11/01/34 (01/15/15)1 | | | 888,981 | | | | 955,402 | |
2.533%, 07/01/30 (01/15/15)1 | | | 1,636 | | | | 1,704 | |
3.750%, 03/27/19 | | | 1,000,000 | | | | 1,090,192 | |
5.128%, 08/01/35 (01/15/15)1 | | | 35,450 | | | | 37,523 | |
FHLMC Gold Pool, | | | | | | | | |
4.000%, TBA 30yr,9 | | | 16,000,000 | | | | 16,975,000 | |
4.500%, 06/01/23 | | | 29,071 | | | | 31,501 | |
4.500%, TBA 30yr,9 | | | 3,000,000 | | | | 3,249,844 | |
5.500%, 11/01/26 to 05/01/40 | | | 7,004,665 | | | | 7,822,809 | |
6.000%, 02/01/16 to 11/01/37 | | | 4,167,488 | | | | 4,705,343 | |
6.500%, 01/01/26 | | | 14,004 | | | | 15,882 | |
FHLMC REMICS, | | | | | | | | |
0.653%, 09/15/30 (11/15/14)1 | | | 18,090 | | | | 18,352 | |
6.500%, 08/15/31 | | | 2,171,138 | | | | 2,440,587 | |
7.000%, 11/15/20 | | | 9,598 | | | | 10,236 | |
7.500%, 08/15/30 | | | 135,563 | | | | 157,045 | |
FHLMC Structured Pass Through Securities, 1.308%, 02/25/45 (12/25/14)1 | | | 101,672 | | | | 104,160 | |
Total Federal Home Loan Mortgage Corporation | | | | | | | 43,680,596 | |
Federal National Mortgage Association - 23.8% | | | | | | | | |
FNMA, | | | | | | | | |
0.875%, 02/08/18 to 05/21/18 | | | 2,600,000 | | | | 2,569,753 | |
1.316%, 07/01/44 (12/25/14)1 | | | 111,797 | | | | 114,248 | |
1.875%, 09/18/18 | | | 300,000 | | | | 305,197 | |
2.038%, 09/01/35 (12/25/14)1 | | | 509,239 | | | | 537,446 | |
2.310%, 08/01/22 | | | 1,800,000 | | | | 1,776,013 | |
2.340%, 06/01/35 (12/25/14)1 | | | 1,436,213 | | | | 1,545,921 | |
2.870%, 09/01/27 | | | 1,100,000 | | | | 1,074,522 | |
3.000%, TBA 15yr,9 | | | 18,000,000 | | | | 18,669,376 | |
3.269%, 05/01/36 (12/25/14)1 | | | 628,757 | | | | 659,934 | |
3.330%, 11/01/21 | | | 94,988 | | | | 100,401 | |
3.500%, TBA 15yr,9 | | | 7,000,000 | | | | 7,396,482 | |
3.799%, 05/01/36 (12/25/14)1 | | | 287,138 | | | | 301,210 | |
4.000%, 07/01/18 to 10/01/31 | | | 19,510,760 | | | | 20,820,029 | |
The accompanying notes are an integral part of these financial statements.
17
AMG Managers Total Return Bond Fund
Schedule of Portfolio Investments (continued)
| | | | | | | | |
| | | Principal Amount† | | | Value | |
Federal National Mortgage Association - 23.8% (continued) | | | | | | | | |
FNMA, | | | | | | | | |
4.000%, TBA 30yr,9 | | $ | 2,000,000 | | | $ | 2,123,594 | |
4.500%, 03/01/18 to 05/01/42 | | | 11,921,333 | | | | 12,861,109 | |
4.500%, TBA 30yr,9 | | | 21,000,000 | | | | 22,716,094 | |
5.000%, 10/01/23 to 03/01/41 | | | 5,278,438 | | | | 5,853,310 | |
5.000%, TBA 30yr,9 | | | 63,000,000 | | | | 69,767,577 | |
5.136%, 05/01/35 (12/25/14)1 | | | 57,780 | | | | 61,857 | |
5.500%, 11/01/17 to 07/01/41 | | | 13,943,486 | | | | 15,598,972 | |
5.500%, TBA 30yr,9 | | | 11,000,000 | | | | 12,285,715 | |
6.000%, 05/01/16 to 05/01/41 | | | 16,091,196 | | | | 18,213,286 | |
6.000%, TBA 30yr,9 | | | 7,000,000 | | | | 7,914,709 | |
6.500%, 11/01/35 | | | 51,874 | | | | 58,923 | |
FNMA REMICS, | | | | | | | | |
0.212%, 12/25/36 (11/25/14)1 | | | 202,887 | | | | 198,319 | |
2.196%, 05/25/35 (12/25/14)1 | | | 115,851 | | | | 119,214 | |
5.000%, 04/25/33 | | | 762,401 | | | | 831,972 | |
7.200%, 05/25/23 | | | 300,410 | | | | 336,463 | |
FNMA Whole Loan, 5.871%, 12/25/424 | | | 186,822 | | | | 210,750 | |
Total Federal National Mortgage Association | | | | | | | 225,022,396 | |
Government National Mortgage Association - 0.9% | | | | | | | | |
GNMA, | | | | | | | | |
1.625%, 03/20/24 to 11/20/29 (12/20/14)1 | | | 230,733 | | | | 238,001 | |
2.000%, 04/20/21 (12/20/14)1 | | | 4,074 | | | | 4,180 | |
5.000%, 07/15/34 to 12/15/41 | | | 6,264,948 | | | | 6,926,069 | |
6.500%, 06/20/28 | | | 350,692 | | | | 390,434 | |
6.750%, 10/16/404 | | | 835,969 | | | | 935,841 | |
Total Government National Mortgage Association | | | | | | | 8,494,525 | |
U.S. Government Obligations - 13.3% | | | | | | | | |
U.S. Treasury Bonds, 3.125%, 08/15/44 | | | 11,100,000 | | | | 11,238,750 | |
U.S. Treasury Inflation Indexed Bonds, 3.625%, 04/15/28 | | | 147,058 | | | | 203,503 | |
U.S. Treasury Inflation Indexed Notes, | | | | | | | | |
0.125%, 01/15/22 to 07/15/2410,11 | | | 29,624,712 | | | | 28,928,710 | |
0.625%, 07/15/2110 | | | 7,176,176 | | | | 7,383,611 | |
1.125%, 01/15/2110 | | | 12,069,141 | | | | 12,762,175 | |
1.250%, 07/15/2010 | | | 545,320 | | | | 582,938 | |
U.S. Treasury Inflation Linked Notes, 2.375%, 01/15/25 | | | 15,962,276 | | | | 18,953,958 | |
U.S. Treasury Inflation Protected Securities, 1.750%, 01/15/28 | | | 681,210 | | | | 774,876 | |
The accompanying notes are an integral part of these financial statements.
18
AMG Managers Total Return Bond Fund
Schedule of Portfolio Investments (continued)
| | | | | | | | | | | | |
| | | | | | Principal Amount† | | | Value | |
U.S. Government Obligations - 13.3% (continued) | | | | | | | | | | | | |
U.S. Treasury Inflation Protected Securities, | | | | | | | | | | | | |
2.000%, 01/15/26 | | | | | | $ | 8,987,850 | | | $ | 10,400,632 | |
2.375%, 01/15/27 | | | | | | | 13,799,448 | | | | 16,642,355 | |
2.500%, 01/15/29 | | | | | | | 3,766,656 | | | | 4,695,668 | |
3.875%, 04/15/29 | | | | | | | 1,736,220 | | | | 2,498,257 | |
U.S. Treasury Notes, | | | | | | | | | | | | |
0.125%, 04/30/15 | | | | | | | 1,000,000 | | | | 1,000,156 | |
0.625%, 08/31/1710,11 | | | | | | | 1,600,000 | | | | 1,587,750 | |
2.375%, 08/15/24 | | | | | | | 7,400,000 | | | | 7,429,482 | |
Total U.S. Government Obligations | | | | | | | | | | | 125,082,821 | |
Total U.S. Government and Agency Obligations (cost $397,123,735) | | | | | | | | | | | 402,280,338 | |
Short-Term Investments - 4.9% | | | | | | | | | | | | |
Japan Treasury Bills - 2.9% | | | | | | | | | | | | |
Japan Treasury Discount Bills, 0.012%, 12/15/147 | | | JPY | | | | 3,060,000,000 | | | | 27,242,540 | |
Repurchase Agreements - 1.9% | | | | | | | | | | | | |
Cantor Fitzgerald Securities, Inc., dated 10/31/14, due 11/03/14, 0.130%, total to be received $2,302,168 (collateralized by various U.S. Government Agency Obligations, 0.000% - 10.500%, 01/01/15 - 09/20/64, totaling $2,348,186)12 | | | | | | | 2,302,143 | | | | 2,302,143 | |
Citigroup Global Markets, Inc., dated 10/31/14, due 11/03/14, 0.100%, total to be received $484,570 (collateralized by various U.S. Government Agency Obligations, 0.000% - 8.750%, 10/31/16 - 02/15/41, totaling $494,257)12 | | | | | | | 484,566 | | | | 484,566 | |
Citigroup Global Markets, Inc., dated 10/31/14, due 11/03/14, 0.160%, total to be received $8,300,111 (collateralized by $8,365,599 U.S. Treasury Notes, 2.250%, 04/30/21) | | | | | | | 8,300,000 | | | | 8,300,000 | |
Daiwa Capital Markets America, dated 10/31/14, due 11/03/14, 0.150%, total to be received $2,302,172 (collateralized by various U.S. Government Agency Obligations, 0.000% - 8.000%, 09/24/15 - 03/01/48, totaling $2,348,187)12 | | | | | | | 2,302,143 | | | | 2,302,143 | |
Nomura Securities International, Inc., dated 10/31/14, due 11/03/14, 0.110%, total to be received $2,302,164 (collateralized by various U.S. Government Agency Obligations, 0.000% - 7.250%, 11/03/14 -11/01/44 totaling $2,348,186)12 | | | | | | | 2,302,143 | | | | 2,302,143 | |
State of Wisconsin Investment Board, dated 10/31/14, due 11/03/14, 0.150%, total to be received $2,302,172 (collateralized by various U.S. Government Agency Obligations, 0.125% - 2.500%, 04/15/16 - 01/15/29, totaling $2,351,215)12 | | | | | | | 2,302,143 | | | | 2,302,143 | |
Total Repurchase Agreements | | | | | | | | | | | 17,993,138 | |
| | | |
| | | | | | Shares | | | | |
Other Investment Companies - 0.1%13 | | | | | | | | | | | | |
Dreyfus Institutional Cash Advantage Fund, Institutional Class Shares, 0.060% | | | | | | | 1,129,301 | | | | 1,129,301 | |
Total Short-Term Investments
(cost $47,684,435) | | | | | | | | | | | 46,364,979 | |
Total Investments - 108.4% (cost $1,008,006,717) | | | | | | | | | | | 1,022,302,613 | |
Other Assets, less Liabilities - (8.4)% | | | | | | | | | | | (79,346,471 | ) |
Net Assets - 100.0% | | | | | | | | | | $ | 942,956,142 | |
The accompanying notes are an integral part of these financial statements.
19
Notes to Schedule of Portfolio Investments
The following footnotes and abbreviations should be read in conjunction with the Schedule of Portfolio Investments previously presented in this report.
Based on the approximate cost of investments of $1,009,113,041 for federal income tax purposes at October 31, 2014, the aggregate gross unrealized appreciation and depreciation were $24,328,816 and $11,139,244, respectively, resulting in net unrealized appreciation of investments of $13,189,572.
| † | Principal amount stated in U.S. dollars unless otherwise stated. |
| (a) | Security exempt from registration under Rule 144A of the Securities Act of 1933. This security may be resold in transactions exempt from registration, normally to qualified buyers. At October 31, 2014, the value of these securities amounted to $92,321,363, or 9.8% of net assets. |
| 1 | Floating Rate Security. The rate listed is as of October 31, 2014. Date in parentheses represents the security’s next coupon rate reset. |
| 2 | Illiquid Security. A security not readily convertible into cash such as a stock, bond or commodity that is not actively traded and would be difficult to sell in a timely sale. The Fund may not invest more than 15% of its net assets in illiquid securities. All illiquid securities are valued by an independent pricing agent. Illiquid securities market value at October 31, 2014, amounted to $39,351,119, or 4.2% of net assets. |
| 3 | Some or all of these securities, amounting to a market value of $9,403,611, or 1.0% of net assets, were out on loan to various brokers. |
| 4 | Variable Rate Security. The rate listed is as of October 31, 2014, and is periodically reset subject to terms and conditions set forth in the debenture. |
| 5 | Perpetuity Bond. The date shown is the final call date. |
| 6 | Payment-in-Kind Security: The security may pay interest/dividends in additional par/shares and/or in cash. Rates shown are the current rate and possible payment rates. |
| 7 | Represents yield to maturity at October 31, 2014. |
| 8 | Securities in the portfolio backed by insurance of financial institutions and financial guaranty assurance agencies amounted to $205,506, or 0.02% of net assets. |
| 9 | TBA Securities are purchased/sold on a forward commitment basis with an approximate principal amount and no defined maturity date. The actual principal and maturity date will be determined upon settlement when the specific mortgage pools are assigned. |
| 10 | Some or all of this security is held with brokers as collateral for swap contracts, amounting to a market value of $7,828,702, or 0.8% of net assets. |
| 11 | Some or all of this security is held with brokers as collateral for futures contracts, amounting to a market value of $4,104,953, or 0.4% of net assets. |
| 12 | Collateral received from brokers for securities lending was invested in these short-term investments. |
| 13 | Yield shown represents the October 31, 2014, seven-day average yield, which refers to the sum of the previous seven days’ dividends paid, expressed as an annual percentage. |
INVESTMENTS DEFINITIONS AND ABBREVIATIONS:
| | |
EMTN: | | European Medium-Term Note |
FHLMC: | | Federal Home Loan Mortgage Corp. |
FNMA: | | Federal National Mortgage Corp. |
GMTN: | | Global Medium-Term Note |
GNMA: | | Government National Mortgage Association |
MTN: | | Medium-Term Note |
NATL-RE: | | National Public Finance Guarantee Corp. |
REMICS: | | Real Estate Mortgage Investment Conduits |
TBA | | To Be Announced |
Currency abbreviations have been used throughout the portfolio to indicate amounts shown in currencies other than the U.S. dollar (USD):
| | |
BRL: | | Brazilian Real |
CAD: | | Canadian Dollar |
EUR: | | Euro |
GBP: | | British Pound |
JPY: | | Japanese Yen |
MXN: | | Mexican Peso |
The accompanying notes are an integral part of these financial statements.
20
Notes to Schedule of Portfolio Investments (continued)
The following tables summarize the inputs used to value the Fund’s net assets by the fair value hierarchy levels as of October 31, 2014: (See Note 1(a) in the Notes to the Financial Statements.)
| | | | | | | | | | | | | | | | |
| | | Quoted Prices in Active | | | | | | | | | | |
| | | Markets for Identical | | | Significant Other | | | Significant Unobservable | | | | |
| | | Investments | | | Observable Inputs | | | Inputs | | | | |
| | | Level 1 | | | Level 2 | | | Level 3 | | | Total | |
AMG Managers Total Return Bond Fund | | | | | | | | | | | | | | | | |
Investments in Securities | | | | | | | | | | | | | | | | |
Asset-Backed Securities | | | — | | | $ | 72,049,055 | | | | — | | | $ | 72,049,055 | |
Bank Loan Obligations | | | — | | | | 6,257,578 | | | | — | | | | 6,257,578 | |
Corporate Bonds and Notes† | | | — | | | | 318,434,500 | | | | — | | | | 318,434,500 | |
Foreign Government and Agency Obligations | | | — | | | | 75,395,860 | | | | — | | | | 75,395,860 | |
Mortgage-Backed Securities | | | — | | | | 52,501,247 | | | | — | | | | 52,501,247 | |
Municipal Bonds | | | — | | | | 43,306,635 | | | | — | | | | 43,306,635 | |
Municipal Closed-End Bond Funds | | $ | 5,712,421 | | | | — | | | | — | | | | 5,712,421 | |
U.S. Government and Agency Obligations† | | | — | | | | 402,280,338 | | | | — | | | | 402,280,338 | |
Short-Term Investments | | | | | | | | | | | | | | | | |
Japan Treasury Bills | | | — | | | | 27,242,540 | | | | — | | | | 27,242,540 | |
Repurchase Agreements | | | — | | | | 17,993,138 | | | | — | | | | 17,993,138 | |
Other Investment Companies | | | 1,129,301 | | | | — | | | | — | | | | 1,129,301 | |
| | | | | | | | | | | | | | | | |
Total Investments in Securities | | $ | 6,841,722 | | | $ | 1,015,460,891 | | | | — | | | $ | 1,022,302,613 | |
| | | | | | | | | | | | | | | | |
Financial Derivative Instruments-Assets†† | | | | | | | | | | | | | | | | |
Credit Contracts | | | — | | | $ | 1,463,209 | | | | — | | | $ | 1,463,209 | |
Foreign Exchange Contracts | | | — | | | | 22,419,152 | | | | — | | | | 22,419,152 | |
Interest Rate Contracts | | $ | 1,474,208 | | | | 1,070,159 | | | | — | | | | 2,544,367 | |
| | | | | | | | | | | | | | | | |
| | | 1,474,208 | | | | 24,952,520 | | | | — | | | | 26,426,728 | |
| | | | | | | | | | | | | | | | |
Financial Derivative Instruments-Liabilities†† | | | | | | | | | | | | | | | | |
Credit Contracts | | | — | | | | (128,653 | ) | | | — | | | | (128,653 | ) |
Foreign Exchange Contracts | | | — | | | | (9,444,975 | ) | | | — | | | | (9,444,975 | ) |
Interest Rate Contracts | | | (242,456 | ) | | | (3,190,258 | ) | | | — | | | | (3,432,714 | ) |
| | | | | | | | | | | | | | | | |
| | | (242,456 | ) | | | (12,763,886 | ) | | | — | | | | (13,006,342 | ) |
| | | | | | | | | | | | | | | | |
Total Financial Derivative Instruments | | $ | 1,231,752 | | | $ | 12,188,634 | | | | — | | | $ | 13,420,386 | |
| | | | | | | | | | | | | | | | |
| † | All corporate bonds and notes; U.S. government and agency obligations; held in the Fund are level 2 securities. For a detailed breakout of the corporate bonds and notes; U.S. government and agency obligations; by major industry or agency classification, please refer to the Schedule of Portfolio Investments. |
| †† | Derivative instruments, such as futures, written options, forwards and swap contracts, are not reflected in the Schedule of Portfolio Investments. Futures, forwards and swap contracts are valued at the unrealized appreciation/depreciation of the instrument and written options are shown at value. |
As of October 31, 2014, the Fund had no transfers between levels from the beginning of the reporting period.
The accompanying notes are an integral part of these financial statements.
21
Notes to Schedule of Portfolio Investments (continued)
The following schedule is the fair value of derivative instruments at October 31, 2014:
| | | | | | | | | | | | |
| | | Asset Derivatives | | | Liability Derivatives | |
| Derivatives not accounted | | Statement of Assets and | | | | | Statement of Assets and | | | |
| for as hedging instruments | | Liabilities Location | | Fair Value | | | Liabilities Location | | Fair Value | |
Credit contracts | | — | | | — | | | Options written | | $ | 21,450 | |
Credit contracts | | Receivable for Variation margin1 | | $ | 413,258 | | | Payable for Variation margin1 | | | — | |
Credit contracts | | Unrealized appreciation on swaps | | | 1,249,254 | | | Unrealized depreciation on swaps | | | 124,951 | |
Interest rate contracts | | Unrealized appreciation on swaps | | | 160,905 | | | Unrealized depreciation on swaps | | | 456,644 | |
Interest rate contracts | | — | | | — | | | Options written | | | 1,096,631 | |
Interest rate contracts | | Receivable for Variation margin1 | | | 451,430 | | | Payable for Variation margin1 | | | 774,817 | |
Foreign exchange contracts | | Unrealized appreciation on foreign currency contracts | | | 22,419,152 | | | Unrealized depreciation on foreign currency contracts | | | 8,949,736 | |
Foreign exchange contracts | | — | | | — | | | Options written | | | 495,239 | |
| | | | | | | | | | | | |
| | Totals | | $ | 24,693,999 | | | | | $ | 11,919,468 | |
| | | | | | | | | | | | |
| 1 | Only current day’s variation margin is reported within the Statement of Assets and Liabilities. The variation margin is included in the open futures cumulative appreciation/ (depreciation) of $1,231,752 and centrally cleared swaps cumulative appreciation/(depreciation) of $(1,923,726) is reported in the Notes to Schedule of Portfolio Investments. |
For the fiscal year ended October 31, 2014, the effect of derivative instruments on the Statement of Operations and the amount of realized gain/(loss) and unrealized gain/(loss) on derivatives recognized in income were as follows:
| | | | | | | | | | | | |
| | | Realized Gain (Loss) | | | Change in Unrealized Gain (Loss) | |
| | | | | | | | | | Change In | |
| Derivatives not accounted | | Statement of Operations | | Realized | | | Statement of Operations | | Unrealized | |
| for as hedging instruments | | Location | | Gain/(Loss) | | | Location | | Gain/(Loss) | |
Credit contracts | | Net realized gain on written option contracts | | $ | 8,380 | | | Net change in unrealized appreciation (depreciation) of written option contracts | | $ | 14,347 | |
Credit contracts | | Net realized gain on swap contracts | | | 2,073,202 | | | Net change in unrealized appreciation (depreciation) of swap contracts | | | 162,973 | |
Interest rate contracts | | Net realized gain on futures contracts | | | 11,068,731 | | | Net change in unrealized appreciation (depreciation) of futures contracts | | | (3,711,228 | ) |
Interest rate contracts | | Net realized gain on written option contracts | | | 3,247,594 | | | Net change in unrealized appreciation (depreciation) of written option contracts | | | (331,831 | ) |
Interest rate contracts | | Net realized gain on swap contracts | | | 463,031 | | | Net change in unrealized appreciation (depreciation) of swap contracts | | | (6,171,246 | ) |
Foreign exchange contracts | | Net realized gain on foreign currency transactions | | | 5,878,255 | | | Net change in unrealized appreciation (depreciation) of foreign currency translations | | | 14,210,676 | |
Foreign exchange contracts | | Net realized gain on written option contracts | | | 38,154 | | | Net change in unrealized appreciation (depreciation) of written option contracts | | | (8,884 | ) |
| | | | | | | | | | | | |
| | Totals | | $ | 22,777,347 | | | | | $ | 4,164,807 | |
| | | | | | | | | | | | |
The accompanying notes are an integral part of these financial statements.
22
Notes to Schedule of Portfolio Investments (continued)
At October��31, 2014, the Fund had futures contracts as follows:
(See Note 9 in the Notes to the Financial Statements.)
Futures Contracts
| | | | | | | | | | | | | | |
| | | | | | | | | | | Unrealized | |
| Type | | Number of Contracts | | | Position | | Expiration Date | | | Gain/(Loss) | |
90-Day Eurodollar | | | 2,474 | | | Long | | | 03/16/15 to 12/14/15 | | | $ | (58,895 | ) |
90-Day Sterling | | | 220 | | | Short | | | 03/18/15 to 09/16/15 | | | | (85,467 | ) |
Canadian 10-Year Bond | | | 21 | | | Short | | | 12/31/14 | | | | (9,634 | ) |
Euro-BTP | | | 226 | | | Long | | | 12/10/14 | | | | 124,178 | |
Euro-Bund 10-Year | | | 118 | | | Short | | | 12/10/14 | | | | (88,460 | ) |
U.S. Treasury 10-Year Bond | | | 1,055 | | | Long | | | 12/31/14 | | | | 1,168,571 | |
U.S. Treasury Long Bond | | | 712 | | | Long | | | 12/31/14 | | | | 181,459 | |
| | | | | | | | | | | | | | |
| | | | | | | | | Totals | | | $ | 1,231,752 | |
| | | | | | | | | | | | | | |
At October 31, 2014, the Fund had swap contracts as follows:
(See Note 10 in the Notes to the Financial Statements.)
Centrally Cleared Interest Rate Swaps
| | | | | | | | | | | | | | | | | | | | | | | | | | |
| Pay/Receive | | | | | | | | | | | | | | | | | Net Premiums | | | Unrealized | |
| Floating Rate | | Floating Rate Index | | Fixed Rate | | | Counterparty | | Maturity | | | Currency | | Notional Amount | | | Paid/(Received) | | | Gain/(Loss) | |
Pay | | 1-Year GBP | | | 1.51 | % | | RBS | | | 10/07/16 | | | GBP | | | 3,800,000 | | | $ | 38 | | | $ | (9,985 | ) |
Pay | | 1-Year GBP | | | 1.59 | % | | MS | | | 10/05/16 | | | GBP | | | 16,700,000 | | | | 334 | | | | (66,127 | ) |
Pay | | 2-Year GBP | | | 1.50 | % | | BOA | | | 09/18/16 | | | GBP | | | 2,500,000 | | | | (11,622 | ) | | | (9,024 | ) |
Pay | | 2-Year GBP | | | 1.50 | % | | BRC | | | 09/18/16 | | | GBP | | | 21,800,000 | | | | (66,259 | ) | | | (113,774 | ) |
Pay | | 2-Year GBP | | | 1.88 | % | | BRC | | | 10/05/17 | | | GBP | | | 8,200,000 | | | | — | | | | (68,005 | ) |
Pay | | 28-Day MXN TIIE | | | 5.50 | % | | BRC | | | 09/13/17 | | | MXN | | | 33,000,000 | | | | 68,479 | | | | 10,360 | |
Pay | | 28-Day MXN TIIE | | | 5.50 | % | | MS | | | 09/13/17 | | | MXN | | | 11,000,000 | | | | 21,478 | | | | 4,802 | |
Pay | | 28-Day MXN TIIE | | | 5.50 | % | | MS | | | 09/02/22 | | | MXN | | | 100,000 | | | | (269 | ) | | | 93 | |
Pay | | 28-Day MXN TIIE | | | 5.60 | % | | BRC | | | 09/06/16 | | | MXN | | | 61,600,000 | | | | 143,298 | | | | 2,957 | |
Pay | | 28-DAY MXN TIIE | | | 5.84 | % | | BNP | | | 09/14/21 | | | MXN | | | 3,000,000 | | | | 815 | | | | 1,433 | |
Pay | | 28-Day MXN TIIE | | | 6.35 | % | | MS | | | 06/02/21 | | | MXN | | | 4,000,000 | | | | 9,083 | | | | 3,818 | |
Pay | | 28-Day MXN TIIE | | | 6.81 | % | | CITI | | | 06/19/34 | | | MXN | | | 10,000,000 | | | | 7,004 | | | | (24,011 | ) |
Pay | | 28-Day MXN TIIE | | | 6.81 | % | | JPM | | | 06/19/34 | | | MXN | | | 210,000,000 | | | | 170,612 | | | | (527,760 | ) |
Pay | | 28-Day MXN TIIE | | | 6.81 | % | | SGCB | | | 06/19/34 | | | MXN | | | 30,000,000 | | | | 19,439 | | | | (70,460 | ) |
Pay | | 28-Day MXN TIIE | | | 7.02 | % | | GS | | | 06/08/34 | | | MXN | | | 27,400,000 | | | | 36,177 | | | | (28,450 | ) |
Receive | | 1-Year-OIS-USD-FEDERAL FUNDS RATE | | | 0.09 | % | | BOA | | | 02/27/15 | | | USD | | | 34,800,000 | | | | — | | | | (755 | ) |
The accompanying notes are an integral part of these financial statements.
23
Notes to Schedule of Portfolio Investments (continued)
| | | | | | | | | | | | | | | | | | | | | | | | | | |
| Pay/Receive | | | | | | | | | | | | | | | | | Net Premiums | | | Unrealized | |
| Floating Rate | | Floating Rate Index | | Fixed Rate | | | Counterparty | | Maturity | | | Currency | | Notional Amount | | | Paid/(Received) | | | Gain/(Loss) | |
Receive | | 1-Year-OIS-USD-FEDERAL FUNDS RATE | | | 0.09 | % | | CS | | | 12/30/14 | | | USD | | | 37,300,000 | | | | — | | | $ | (570 | ) |
Receive | | 1-Year-OIS-USD-FEDERAL FUND RATE | | | 0.09 | % | | CS | | | 02/27/15 | | | USD | | | 8,500,000 | | | $ | (263 | ) | | | 79 | |
Receive | | 1-Year-OIS-USD-FEDERAL FUNDS RATE | | | 0.09 | % | | GS | | | 02/27/15 | | | USD | | | 7,500,000 | | | | 32 | | | | (195 | ) |
Receive | | 1-Year-OIS-USD-FEDERAL FUNDS RATE | | | 1.00 | % | | GS | | | 10/15/17 | | | USD | | | 48,200,000 | | | | (53,247 | ) | | | (218,099 | ) |
Receive | | 1-Year-OIS-USD-FEDERAL FUNDS RATE | | | 1.00 | % | | MS | | | 10/15/17 | | | USD | | | 48,200,000 | | | | (60,375 | ) | | | (210,972 | ) |
Receive | | 1-Year-OIS-USD-FEDERAL FUNDS RATE | | | 1.75 | % | | GS | | | 03/19/20 | | | USD | | | 20,200,000 | | | | 125,153 | | | | 89,908 | |
Receive | | 1-Year-OIS-USD-FEDERAL FUNDS RATE | | | 2.55 | % | | RBS | | | 09/04/24 | | | USD | | | 2,200,000 | | | | — | | | | (17,068 | ) |
Receive | | 1-Year-OIS-USD-FEDERAL FUNDS RATE | | | 2.80 | % | | GS | | | 12/18/43 | | | USD | | | 25,700,000 | | | | 1,198,872 | | | | 69,539 | |
Receive | | 3 Month USD LIBOR Rate | | | 2.75 | % | | BRC | | | 06/19/43 | | | USD | | | 1,700,000 | | | | 127,500 | | | | (28,397 | ) |
Receive | | 3 Month USD LIBOR Rate | | | 2.75 | % | | GS | | | 06/19/43 | | | USD | | | 20,600,000 | | | | 1,551,180 | | | | (350,286 | ) |
Receive | | 3 Month USD LIBOR Rate | | | 2.75 | % | | MS | | | 06/19/43 | | | USD | | | 12,600,000 | | | | 931,392 | | | | (196,865 | ) |
Receive | | 3 Month USD LIBOR Rate | | | 3.50 | % | | GS | | | 12/18/43 | | | USD | | | 3,400,000 | | | | 127,770 | | | | (444,333 | ) |
Receive | | 6 Month USD LIBOR Rate | | | 4.00 | % | | GS | | | 06/19/24 | | | USD | | | 5,500,000 | | | | 90,640 | | | | 85,592 | |
| | | | | | | | | | | | | | | | | | | | | | | | | | |
| | | | | | | | | | | | | | | | | Totals | | | $ | 4,437,261 | | | $ | (2,116,555 | ) |
| | | | | | | | | | | | | | | | | | | | | | | | | | |
Interest Rate Swaps
| | | | | | | | | | | | | | | | | | | | | | | | | | |
| Pay/Receive | | | | | | | | | | | | | | | | | Net Premiums | | | Unrealized | |
| Floating Rate | | Floating Rate Index | | Fixed Rate | | | Counterparty | | Maturity | | | Currency | | Notional Amount | | | Paid/(Received) | | | Gain/(Loss) | |
Pay | | 1-Year BRL-CDI | | | 11.25 | % | | GS | | | 01/04/21 | | | BRL | | | 900,000 | | | $ | (4,702 | ) | | $ | (681 | ) |
Pay | | 1-Year BRL-CDI | | | 11.25 | % | | UBS | | | 01/04/21 | | | BRL | | | 2,400,000 | | | | (3,770 | ) | | | (10,614 | ) |
Pay | | 1-Year BRL-CDI | | | 11.47 | % | | GS | | | 01/04/21 | | | BRL | | | 44,300,000 | | | | 30,354 | | | | (20,126 | ) |
Pay | | 1-Year BRL-CDI | | | 11.47 | % | | HSBC | | | 01/02/17 | | | BRL | | | 33,900,000 | | | | 19,149 | | | | (16,454 | ) |
Pay | | 1-Year BRL-CDI | | | 11.47 | % | | JPM | | | 01/02/17 | | | BRL | | | 5,900,000 | | | | (1,116 | ) | | | 2,501 | |
Pay | | 1-Year BRL-CDI | | | 11.50 | % | | DUB | | | 01/04/21 | | | BRL | | | 21,100,000 | | | | 58,853 | | | | (109,127 | ) |
Pay | | 1-Year BRL-CDI | | | 11.50 | % | | GS | | | 01/04/21 | | | BRL | | | 28,700,000 | | | | 46,674 | | | | (114,836 | ) |
Pay | | 1-Year BRL-CDI | | | 11.50 | % | | MS | | | 01/04/21 | | | BRL | | | 800,000 | | | | (1,511 | ) | | | (404 | ) |
Pay | | 1-Year BRL-CDI | | | 11.50 | % | | UBS | | | 01/04/21 | | | BRL | | | 19,700,000 | | | | (24,816 | ) | | | (22,386 | ) |
Pay | | 1-Year BRL-CDI | | | 11.68 | % | | DUB | | | 01/04/21 | | | BRL | | | 22,600,000 | | | | 26,592 | | | | 123,376 | |
Pay | | 1-Year BRL-CDI | | | 11.68 | % | | HSBC | | | 01/04/21 | | | BRL | | | 400,000 | | | | (35 | ) | | | 131 | |
Pay | | 1-Year BRL-CDI | | | 11.68 | % | | UBS | | | 01/04/21 | | | BRL | | | 1,200,000 | | | | (4,712 | ) | | | 5,174 | |
Pay | | 28-Day MXN TIIE | | | 5.70 | % | | GS | | | 01/18/19 | | | MXN | | | 5,000,000 | | | | (1,231 | ) | | | 13,275 | |
Pay | | 28-Day MXN TIIE | | | 5.70 | % | | JPM | | | 01/18/19 | | | MXN | | | 5,000,000 | | | | (1,444 | ) | | | 13,526 | |
The accompanying notes are an integral part of these financial statements.
24
Notes to Schedule of Portfolio Investments (continued)
| | | | | | | | | | | | | | | | | | | | | | | | | | | | | | |
| Pay/Receive | | | | | | | | | | | | | | | | | | | Net Premiums | | | Unrealized | |
| Floating Rate | | Floating Rate Index | | Fixed Rate | | | Counterparty | | | Maturity | | | Currency | | | Notional Amount | | | Paid/(Received) | | | Gain/(Loss) | |
Pay | | 28-Day MXN TIIE | | | 5.84 | % | | | UBS | | | | 09/14/21 | | | | MXN | | | | 3,900,000 | | | $ | 832 | | | $ | 1,988 | |
Pay | | 28-Day MXN TIIE | | | 6.81 | % | | | DUB | | | | 06/19/34 | | | | MXN | | | | 50,000,000 | | | | 5,079 | | | | (77,594 | ) |
Pay | | 28-Day MXN TIIE | | | 6.92 | % | | | CITI | | | | 06/10/29 | | | | MXN | | | | 3,800,000 | | | | 4,963 | | | | 934 | |
Pay | | 28-Day MXN TIIE | | | 7.02 | % | | | DUB | | | | 06/08/34 | | | | MXN | | | | 78,000,000 | | | | 106,537 | | | | (84,422 | ) |
| | | | | | | | | | | | | | | | | | | | | | | | | | | | | | |
| | | | | | | | | | | | | | | | | | | | | Totals | | | $ | 255,696 | | | $ | (295,739 | ) |
| | | | | | | | | | | | | | | | | | | | | | | | | | | | | | |
Centrally Cleared Credit Default Swaps-Sell Protection †
| | | | | | | | | | | | | | | | | | | | | | | | | | |
| | | | | | | | | | | | | | | | | | Net | | | | |
| | | | | | | | | | | | | | | | | | Premiums | | | | |
| | | Fixed | | | | | | | | | | | | Notional | | | Paid/ | | | Unrealized | |
| Reference Entity | | Rate | | | Counterparty | | Maturity | | | Rating | | Currency | | Amount | | | (Received) | | | Gain/(Loss) | |
CDX.NA.HY.23 5-Year Index | | | 1.00 | % | | CS | | | 12/20/19 | | | BAA+ | | USD | | | 5,600,000 | | | $ | 78,576 | | | $ | 20,975 | |
CDX.NA.HY.23 5-Year Index | | | 1.00 | % | | JPM | | | 12/20/19 | | | BAA+ | | USD | | | 400,000 | | | | 5,706 | | | | 1,405 | |
CDX.NA.HY.23 5-Year Index | | | 1.00 | % | | UBS | | | 12/20/19 | | | B | | USD | | | 2,100,000 | | | | 121,380 | | | | 25,305 | |
iTraxx Europe 5-Year Index | | | 1.00 | % | | CS | | | 12/20/19 | | | A | | EUR | | | 12,800,000 | | | | 134,814 | | | | 128,167 | |
iTraxx Europe 5-Year Index | | | 1.00 | % | | CS | | | 12/20/19 | | | A- | | EUR | | | 11,300,000 | | | | 229,757 | | | | 16,977 | |
| | | | | | | | | | | | | | | | | | | | | | | | | | |
| | | | | | | | | | | | | | | | | Totals | | | $ | 570,233 | | | $ | 192,829 | |
| | | | | | | | | | | | | | | | | | | | | | | | | | |
Credit Default Swaps-Sell Protection †
| | | | | | | | | | | | | | | | | | | | | | | | | | |
| | | | | | | | | | | | | | | | | | Net | | | | |
| | | | | | | | | | | | | | | | | | Premiums | | | | |
| | | Fixed | | | | | | | | | | | | Notional | | | Paid/ | | | Unrealized | |
| Reference Entity | | Rate | | | Counterparty | | Maturity | | | Rating | | Currency | | Amount | | | (Received) | | | Gain/(Loss) | |
ABX.HE | | | 0.11 | % | | BRC | | | 05/25/46 | | | BA- | | USD | | | 4,804,713 | | | $ | (982,867 | ) | | $ | 30,576 | |
Berkshire Hathaway Inc. | | | 1.00 | % | | DUB | | | 09/20/16 | | | AA | | USD | | | 400,000 | | | | 3,885 | | | | 5 | |
Brazil Federative Republic Bond | | | 1.00 | % | | CITI | | | 06/20/16 | | | BAA | | USD | | | 4,300,000 | | | | (4,273 | ) | | | 30,607 | |
Brazil Federative Republic Bond | | | 1.00 | % | | DUB | | | 06/20/16 | | | BAA | | USD | | | 1,400,000 | | | | (1,513 | ) | | | 10,161 | |
Brazil Federative Republic Bond | | | 1.00 | % | | GS | | | 12/20/19 | | | BAA | | USD | | | 11,200,000 | | | | (404,273 | ) | | | 127,881 | |
Brazil Federative Republic Bond | | | 1.00 | % | | HSBC | | | 12/20/19 | | | BAA | | USD | | | 3,800,000 | | | | (139,850 | ) | | | 45,892 | |
Brazil Federative Republic Bond | | | 1.00 | % | | JPM | | | 09/20/15 | | | BAA | | USD | | | 1,400,000 | | | | (2,754 | ) | | | 12,297 | |
Brazil Federative Republic Bond | | | 1.00 | % | | UBS | | | 09/20/15 | | | BAA | | USD | | | 1,000,000 | | | | (1,667 | ) | | | 8,145 | |
Brazil Federative Republic Bond | | | 1.95 | % | | MS | | | 08/20/16 | | | BAA | | USD | | | 3,500,000 | | | | — | | | | 79,207 | |
China Government | | | 1.00 | % | | MS | | | 06/20/16 | | | AA- | | USD | | | 1,800,000 | | | | (19,143 | ) | | | 53,047 | |
China Government | | | 1.00 | % | | RBS | | | 06/20/15 | | | AA- | | USD | | | 1,900,000 | | | | 3,923 | | | | 304 | |
Colombia Government | | | 1.00 | % | | GS | | | 03/20/19 | | | BAA | | USD | | | 2,500,000 | | | | (19,720 | ) | | | 49,917 | |
The accompanying notes are an integral part of these financial statements.
25
Notes to Schedule of Portfolio Investments (continued)
| | | | | | | | | | | | | | | | | | | | | | | | | | |
| | | | | | | | | | | | | | | | | | Net | | | | |
| | | | | | | | | | | | | | | | | | Premiums | | | | |
| | | Fixed | | | | | | | | | | | | Notional | | | Paid/ | | | Unrealized | |
| Reference Entity | | Rate | | | Counterparty | | Maturity | | | Rating | | Currency | | Amount | | | (Received) | | | Gain/(Loss) | |
Export-Import Bank of A.S. | | | 1.00 | % | | DUB | | | 06/20/17 | | | AA- | | USD | | | 300,000 | | | $ | (6,650 | ) | | $ | 12,371 | |
General Electric Capital Corp. | | | 1.00 | % | | BRC | | | 09/20/16 | | | AA+ | | USD | | | 900,000 | | | | 6,196 | | | | 2,563 | |
General Electric Capital Corp. | | | 1.00 | % | | DUB | | | 09/20/15 | | | AA+ | | USD | | | 1,000,000 | | | | 5,399 | | | | (4,602 | ) |
General Electric Capital Corp. | | | 1.00 | % | | DUB | | | 03/20/16 | | | AA+ | | USD | | | 300,000 | | | | (4,869 | ) | | | 10,394 | |
General Electric Capital Corp. | | | 1.00 | % | | MS | | | 06/20/16 | | | AA+ | | USD | | | 700,000 | | | | (850 | ) | | | 9,614 | |
Greek Government | | | 1.00 | % | | GS | | | 12/20/15 | | | B | | EUR | | | 200,000 | | | | (9,774 | ) | | | (5,326 | ) |
Greek Government | | | 1.00 | % | | MS | | | 06/20/15 | | | B- | | EUR | | | 3,900,000 | | | | (108,205 | ) | | | 2,294 | |
Italian Government | | | 1.00 | % | | BRC | | | 06/20/17 | | | BAA | | USD | | | 1,000,000 | | | | 3,090 | | | | 3,017 | |
Italian Government | | | 1.00 | % | | BRC | | | 06/20/19 | | | BAA | | USD | | | 400,000 | | | | (2,423 | ) | | | 1,578 | |
Italian Government | | | 1.00 | % | | BRC | | | 06/20/19 | | | BAA | | USD | | | 400,000 | | | | (2,251 | ) | | | 1,384 | |
Italian Government | | | 1.00 | % | | BRC | | | 09/20/19 | | | BAA | | USD | | | 100,000 | | | | — | | | | (450 | ) |
Italian Government | | | 1.00 | % | | BRC | | | 12/20/19 | | | BAA | | USD | | | 9,700,000 | | | | 24,825 | | | | (84,306 | ) |
Italian Government | | | 1.00 | % | | CITI | | | 06/20/17 | | | BAA | | USD | | | 1,400,000 | | | | 7,089 | | | | 1,299 | |
Italian Government | | | 1.00 | % | | DUB | | | 09/20/16 | | | BAA | | USD | | | 100,000 | | | | 905 | | | | (242 | ) |
Italian Government | | | 1.00 | % | | DUB | | | 06/20/19 | | | BAA | | USD | | | 300,000 | | | | (1,951 | ) | | | 1,324 | |
Italian Government | | | 1.00 | % | | DUB | | | 09/20/19 | | | BAA | | USD | | | 300,000 | | | | (138 | ) | | | (1,206 | ) |
Italian Government | | | 1.00 | % | | GS | | | 06/20/17 | | | BAA | | USD | | | 1,100,000 | | | | 5,416 | | | | 1,205 | |
Italian Government | | | 1.00 | % | | GS | | | 12/20/19 | | | BAA | | USD | | | 600,000 | | | | 1,445 | | | | (5,123 | ) |
Italian Government | | | 1.00 | % | | HSBC | | | 06/20/19 | | | BAA | | USD | | | 300,000 | | | | (1,951 | ) | | | 1,323 | |
Italian Government | | | 1.00 | % | | MS | | | 12/20/19 | | | BAA | | USD | | | 1,000,000 | | | | 1,929 | | | | (8,052 | ) |
iTraxx Europe Series 22 5 Year Index | | | 1.00 | % | | CITI | | | 12/20/19 | | | BAA | | EUR | | | 200,000 | | | | (6,548 | ) | | | (168 | ) |
iTraxx Europe Series 22 5 Year Index | | | 1.00 | % | | MS | | | 12/20/19 | | | BAA | | EUR | | | 500,000 | | | | (16,218 | ) | | | (572 | ) |
JPMorgan Chase & Co. | | | 1.00 | % | | DUB | | | 09/20/16 | | | A | | USD | | | 900,000 | | | | 7,212 | | | | 1,657 | |
Mexico Government | | | 1.00 | % | | BRC | | | 03/20/15 | | | A- | | USD | | | 600,000 | | | | (1,003 | ) | | | 5,471 | |
Mexico Government | | | 1.00 | % | | CITI | | | 06/20/16 | | | A- | | USD | | | 9,800,000 | | | | (835 | ) | | | 110,366 | |
Mexico Government | | | 1.00 | % | | DUB | | | 03/20/15 | | | A- | | USD | | | 1,100,000 | | | | (1,877 | ) | | | 10,136 | |
Mexico Government | | | 1.00 | % | | DUB | | | 03/20/16 | | | A- | | USD | | | 2,300,000 | | | | (5,256 | ) | | | 30,308 | |
Mexico Government | | | 1.00 | % | | GS | | | 06/20/16 | | | A- | | USD | | | 8,400,000 | | | | (98,095 | ) | | | 251,516 | |
Mexico Government | | | 1.00 | % | | HSBC | | | 09/20/16 | | | A- | | USD | | | 100,000 | | | | 339 | | | | 739 | |
Mexico Government | | | 1.00 | % | | HSBC | | | 12/20/16 | | | A- | | USD | | | 100,000 | | | | 672 | | | | 412 | |
The accompanying notes are an integral part of these financial statements.
26
Notes to Schedule of Portfolio Investments (continued)
| | | | | | | | | | | | | | | | | | | | | | | | | | |
| | | | | | | | | | | | | | | | | | Net | | | | |
| | | | | | | | | | | | | | | | | | Premiums | | | | |
| | | Fixed | | | | | | | | | | | | Notional | | | Paid/ | | | Unrealized | |
| Reference Entity | | Rate | | | Counterparty | | Maturity | | | Rating | | Currency | | Amount | | | (Received) | | | Gain/(Loss) | |
Mexico Government | | | 1.00 | % | | JPM | | | 09/20/16 | | | A- | | USD | | | 200,000 | | | $ | 698 | | | $ | 1,435 | |
Mexico Government | | | 1.00 | % | | MS | | | 09/20/16 | | | A- | | USD | | | 600,000 | | | | (1,020 | ) | | | 9,069 | |
Mexico Government | | | 1.00 | % | | MS | | | 03/20/19 | | | A- | | USD | | | 10,000,000 | | | | 46,126 | | | | 96,255 | |
Mexico Government | | | 1.00 | % | | UBS | | | 09/20/15 | | | A- | | USD | | | 1,000,000 | | | | (2,493 | ) | | | 12,000 | |
Republic of Indonesia | | | 1.00 | % | | MS | | | 09/20/16 | | | BAA- | | USD | | | 2,700,000 | | | | (78,147 | ) | | | 144,176 | |
Republic of Indonesia | | | 1.00 | % | | UBS | | | 09/20/16 | | | BAA- | | USD | | | 300,000 | | | | (1,739 | ) | | | 5,397 | |
Russian Government | | | 1.00 | % | | BRC | | | 09/20/15 | | | BAA | | USD | | | 500,000 | | | | (5,097 | ) | | | 1,984 | |
Russian Government | | | 1.00 | % | | BRC | | | 12/20/15 | | | BAA | | USD | | | 1,700,000 | | | | (23,143 | ) | | | 3,989 | |
Russian Government | | | 1.00 | % | | BRC | | | 09/20/19 | | | BAA | | USD | | | 4,000,000 | | | | (223,435 | ) | | | (14,904 | ) |
Russian Government | | | 1.00 | % | | BRC | | | 12/20/19 | | | BAA | | USD | | | 1,500,000 | | | | (106,779 | ) | | | 7,987 | |
Russian Government | | | 1.00 | % | | CITI | | | 09/20/15 | | | BAA | | USD | | | 2,300,000 | | | | (21,425 | ) | | | 6,592 | |
Russian Government | | | 1.00 | % | | DUB | | | 09/20/15 | | | BAA | | USD | | | 200,000 | | | | (1,951 | ) | | | 684 | |
Russian Government | | | 1.00 | % | | GS | | | 12/20/19 | | | BAA | | USD | | | 4,000,000 | | | | (281,234 | ) | | | 17,760 | |
U.S. Treasury Notes | | | 0.25 | % | | UBS | | | 09/20/15 | | | AAA | | EUR | | | 5,000,000 | | | | (10,300 | ) | | | 34,916 | |
| | | | | | | | | | | | | | | | | | | | | | | | | | |
| | | | | | | | | | | | | | | | | Totals | | | $ | (2,482,568 | ) | | $ | 1,124,303 | |
| | | | | | | | | | | | | | | | | | | | | | | | | | |
| † | If the Fund is a seller of protection and a credit event occurs, as defined under the terms of that particular swap agreement, the Fund will either (a) pay to the buyer of protection an amount equal to the notional amount of the swap and take delivery of the referenced obligation, or (b) pay a net settlement in the form of cash or securities equal to the notional amount of the swap less the recovery of the referenced obligation. |
At October 31, 2014, the Fund had written put and call options, swaptions and inflation floors as follows:
(See Note 10 in the Notes to the Financial Statements.)
Credit Default Swaptions
| | | | | | | | | | | | | | | | | | | | | | | | | | |
| Pay/Receive | | | | | | | | | | | | | | | | | | | | Unrealized | |
| Floating Rate | | Description | | Counterparty | | Floating Rate Index | | Exercise Rate | | | Expiration Date | | | Notional Amount | | | Premium | | | Gain/(Loss) | |
Pay | | 5-Year Credit Default Swap (Call) | | CITI | | iTraxx Europe Series 22 | | | 0.60 | % | | | 01/21/15 | | | $ | 2,700,000 | | | $ | 4,655 | | | $ | (1,165 | ) |
Pay | | 5-Year Credit Default Swap (Call) | | GS | | iTraxx Europe Series 22 | | | 0.60 | % | | | 01/21/15 | | | | 1,500,000 | | | | 1,825 | | | | (1,409 | ) |
Pay | | 5-Year Credit Default Swap (Call) | | JPM | | iTraxx Europe Series 22 | | | 0.60 | % | | | 01/21/15 | | | | 1,500,000 | | | | 2,105 | | | | (1,128 | ) |
Pay | | 5-Year Credit Default Swap (Put) | | CITI | | iTraxx Europe Series 22 | | | 0.90 | % | | | 01/21/15 | | | | 1,500,000 | | | | 2,931 | | | | 494 | |
Pay | | 5-Year Credit Default Swap (Put) | | CITI | | iTraxx Europe Series 22 | | | 1.00 | % | | | 01/21/15 | | | | 1,200,000 | | | | 2,848 | | | | 1,638 | |
Pay | | 5-Year Credit Default Swap (Put) | | GS | | iTraxx Europe Series 22 | | | 1.00 | % | | | 01/21/15 | | | | 1,500,000 | | | | 4,129 | | | | 2,617 | |
Pay | | 5-Year Credit Default Swap (Put) | | JPM | | iTraxx Europe Series 22 | | | 1.00 | % | | | 01/21/15 | | | | 1,500,000 | | | | 4,211 | | | | 2,699 | |
Pay | | 5-Year Credit Default Swap (Put) | | GS | | iTraxx Europe Series 22 | | | 1.10 | % | | | 01/21/15 | | | | 800,000 | | | | 2,019 | | | | 1,541 | |
Pay | | 5-Year Credit Default Swap (Put) | | GS | | iTraxx Europe Series 22 | | | 1.20 | % | | | 01/21/15 | | | | 1,900,000 | | | | 4,694 | | | | 3,982 | |
The accompanying notes are an integral part of these financial statements.
27
Notes to Schedule of Portfolio Investments (continued)
| | | | | | | | | | | | | | | | | | | | | | | | | | |
| Pay/Receive | | | | | | | | | | | | | | | | | | | | Unrealized | |
| Floating Rate | | Description | | Counterparty | | Floating Rate Index | | Exercise Rate | | | Expiration Date | | | Notional Amount | | | Premium | | | Gain/(Loss) | |
Receive | | 5-Year Credit Default Swap (Put) | | CITI | | CDX.NA.IG Series 22 | | | 0.85 | % | | | 12/17/14 | | | $ | 3,200,000 | | | $ | 3,760 | | | $ | 3,072 | |
Receive | | 5-Year Credit Default Swap (Put) | | CITI | | CDX.NA.IG Series 22 | | | 0.90 | % | | | 12/17/14 | | | | 2,700,000 | | | | 3,072 | | | | 2,673 | |
Receive | | 5-Year Credit Default Swap (Put) | | CITI | | CDX.NA.IG Series 22 | | | 0.95 | % | | | 12/17/14 | | | | 2,100,000 | | | | 2,625 | | | | 2,410 | |
| | | | | | | | | | | | | | | | | | | | | | | | | | |
| | | | | | | | | | | | | | | | | Totals | | | $ | 38,874 | | | $ | 17,424 | |
| | | | | | | | | | | | | | | | | | | | | | | | | | |
Interest Rate Swaptions
| | | | | | | | | | | | | | | | | | | | | | | | | | |
| Pay/Receive | | | | | | | | | | | | | | | | | | | | Unrealized | |
| Floating Rate | | Description | | Counterparty | | Floating Rate Index | | Exercise Rate | | | Expiration Date | | | Notional Amount | | | Premium | | | Gain/(Loss) | |
Pay | | 5-Year Interest Rate Swap (Call) | | GS | | Euribor 6 Month | | | 0.45 | % | | | 12/05/14 | | | $ | 4,300,000 | | | $ | 4,300 | | | $ | (4,875 | ) |
Pay | | 5-Year Interest Rate Swap (Call) | | GS | | Euribor 6 Month | | | 0.63 | % | | | 12/05/14 | | | | 4,300,000 | | | | 2,602 | | | | 1,618 | |
Pay | | 10-Year Interest Rate Swap (Call) | | DUB | | Euribor 6 Month | | | 0.95 | % | | | 03/23/15 | | | | 2,500,000 | | | | 6,479 | | | | (6,929 | ) |
Pay | | 10-Year Interest Rate Swap (Call) | | GS | | Euribor 6 Month | | | 1.20 | % | | | 01/20/15 | | | | 10,800,000 | | | | 58,426 | | | | (133,026 | ) |
Pay | | 10-Year Interest Rate Swap (Put) | | DUB | | Euribor 6 Month | | | 1.55 | % | | | 03/23/15 | | | | 2,500,000 | | | | 20,734 | | | | 12,937 | |
Pay | | 10-Year Interest Rate Swap (Put) | | GS | | Euribor 6 Month | | | 1.60 | % | | | 01/20/15 | | | | 10,800,000 | | | | 113,930 | | | | 107,094 | |
Receive | | 3-Year Interest Rate Swap (Call) | | MS | | 3-Month USD-LIBOR | | | 1.03 | % | | | 11/14/14 | | | | 8,000,000 | | | | 8,640 | | | | 7,418 | |
Receive | | 5-Year Interest Rate Swap (Call) | | DUB | | 3-Month USD-LIBOR | | | 1.65 | % | | | 11/17/14 | | | | 24,000,000 | | | | 38,400 | | | | 21,600 | |
Receive | | 5-Year Interest Rate Swap (Call) | | DUB | | 3-Month USD-LIBOR | | | 1.70 | % | | | 12/02/14 | | | | 4,300,000 | | | | 9,030 | | | | 651 | |
Receive | | 5-Year Interest Rate Swap (Call) | | GS | | 3-Month USD-LIBOR | | | 1.58 | % | | | 11/28/14 | | | | 1,000,000 | | | | 1,850 | | | | 1,258 | |
Receive | | 5-Year Interest Rate Swap (Call) | | GS | | 3-Month USD-LIBOR | | | 1.80 | % | | | 12/01/14 | | | | 7,500,000 | | | | 13,365 | | | | (15,383 | ) |
Receive | | 5-Year Interest Rate Swap (Call) | | JPM | | 3-Month USD-LIBOR | | | 1.70 | % | | | 11/17/14 | | | | 6,500,000 | | | | 12,350 | | | | 4,081 | |
Receive | | 5-Year Interest Rate Swap (Call) | | MS | | 3-Month USD-LIBOR | | | 1.58 | % | | | 11/14/14 | | | | 17,000,000 | | | | 22,100 | | | | 18,440 | |
Receive | | 5-Year Interest Rate Swap (Call) | | MS | | 3-Month USD-LIBOR | | | 1.68 | % | | | 11/14/14 | | | | 16,500,000 | | | | 49,912 | | | | 34,783 | |
Receive | | 5-Year Interest Rate Swap (Call) | | MS | | 3-Month USD-LIBOR | | | 1.78 | % | | | 11/28/14 | | | | 22,900,000 | | | | 133,392 | | | | 57,866 | |
Receive | | 5-Year Interest Rate Swap (Call) | | MS | | 3-Month USD-LIBOR | | | 1.80 | % | | | 12/01/14 | | | | 18,400,000 | | | | 32,660 | | | | (37,869 | ) |
Receive | | 5-Year Interest Rate Swap (Call) | | MS | | 3-Month USD-LIBOR | | | 1.85 | % | | | 12/02/14 | | | | 12,500,000 | | | | 25,000 | | | | (40,389 | ) |
Receive | | 5-Year Interest Rate Swap (Put) | | DUB | | 3-Month USD-LIBOR | | | 2.05 | % | | | 12/02/14 | | | | 4,300,000 | | | | 19,393 | | | | 16,675 | |
Receive | | 5-Year Interest Rate Swap (Put) | | GS | | 3-Month USD-LIBOR | | | 2.08 | % | | | 11/28/14 | | | | 700,000 | | | | 332 | | | | 66 | |
Receive | | 5-Year Interest Rate Swap (Put) | | GS | | 3-Month USD-LIBOR | | | 2.10 | % | | | 12/01/14 | | | | 7,500,000 | | | | 37,500 | | | | 34,842 | |
Receive | | 5-Year Interest Rate Swap (Put) | | MS | | 3-Month USD-LIBOR | | | 2.03 | % | | | 11/28/14 | | | | 1,500,000 | | | | 750 | | | | (177 | ) |
Receive | | 5-Year Interest Rate Swap (Put) | | MS | | 3-Month USD-LIBOR | | | 2.13 | % | | | 11/28/14 | | | | 2,200,000 | | | | 462 | | | | (37 | ) |
Receive | | 5-Year Interest Rate Swap (Put) | | MS | | 3-Month USD-LIBOR | | | 2.15 | % | | | 12/02/14 | | | | 10,000,000 | | | | 32,000 | | | | 29,543 | |
The accompanying notes are an integral part of these financial statements.
28
Notes to Schedule of Portfolio Investments (continued)
| | | | | | | | | | | | | | | | | | | | | | | | | | |
| Pay/Receive | | | | | | | | | | | | | | | | | | | | Unrealized | |
| Floating Rate | | Description | | Counterparty | | Floating Rate Index | | Exercise Rate | | | Expiration Date | | | Notional Amount | | | Premium | | | Gain/(Loss) | |
Receive | | 5-Year Interest Rate Swap (Put) | | MS | | 3-Month USD-LIBOR | | | 2.15 | % | | | 12/01/14 | | | $ | 18,400,000 | | | $ | 69,920 | | | $ | 65,990 | |
Receive | | 5-Year Interest Rate Swap (Put) | | MS | | 3-Month USD-LIBOR | | | 2.52 | % | | | 09/18/15 | | | | 30,000,000 | | | | 262,500 | | | | (25,425 | ) |
Receive | | 5-Year Interest Rate Swap (Put) | | MS | | 3-Month USD-LIBOR | | | 2.60 | % | | | 09/14/15 | | | | 11,100,000 | | | | 145,688 | | | | 55,460 | |
Receive | | 5-Year Interest Rate Swap (Put) | | MS | | 3-Month USD-LIBOR | | | 2.77 | % | | | 01/23/15 | | | | 11,700,000 | | | | 1,638 | | | | 549 | |
Receive | | 10-Year Interest Rate Swap (Put) | | MS | | 3-Month USD-LIBOR | | | 2.80 | % | | | 02/02/15 | | | | 7,300,000 | | | | 116,435 | | | | 77,828 | |
Receive | | 10-Year Interest Rate Swap (Put) | | MS | | 3-Month USD-LIBOR | | | 2.82 | % | | | 01/30/15 | | | | 900,000 | | | | 4,208 | | | | (50 | ) |
Receive | | 30-Year Interest Rate Swap (Put) | | MS | | 3-Month USD-LIBOR | | | 3.30 | % | | | 01/30/15 | | | | 1,700,000 | | | | 19,550 | | | | 1,116 | |
Receive | | 30-Year Interest Rate Swap (Put) | | MS | | 3-Month USD-LIBOR | | | 3.32 | % | | | 01/16/15 | | | | 3,900,000 | | | | 39,780 | | | | 9,305 | |
| | | | | | | | | | | | | | | | | | | | | | | | | | |
| | | | | | | | | | | | | | | | | Totals | | | $ | 1,303,326 | | | $ | 294,960 | |
| | | | | | | | | | | | | | | | | | | | | | | | | | |
Inflation Floor Options
| | | | | | | | | | | | | | | | | | | | | | |
| | | | | | | | Expiration | | | Notional | | | | | | Unrealized | |
| Description | | Counterparty | | Strike Index | | | Date | | | Amount | | | Premium | | | Gain | |
Inflation Floor - OTC CPURNSA Index | | DUB | | | 216 | | | | 03/10/20 | | | $ | 11,400,000 | | | $ | 85,500 | | | $ | 81,553 | |
| | | | | | | | | | | | | | | | | | | | | | |
OTC Options
| | | | | | | | | | | | | | | | | | | | | | |
| | | | | | | | Expiration | | | Notional | | | | | | Unrealized | |
| Description | | Counterparty | | Strike Price | | | Date | | | Amount | | | Premium | | | Gain/(Loss) | |
AUD Vs USD (Call) | | CITI | | | 0.89 | | | | 12/15/14 | | | $ | 1,200,000 | | | $ | 6,787 | | | $ | 1,338 | |
AUD Vs USD (Put) | | BRC | | | 0.86 | | | | 11/25/14 | | | | 1,200,000 | | | | 5,490 | | | | 1,961 | |
AUD Vs USD (Put) | | CITI | | | 0.85 | | | | 11/20/14 | | | | 1,200,000 | | | | 6,659 | | | | 5,858 | |
AUD Vs USD (Put) | | CITI | | | 0.85 | | | | 12/15/14 | | | | 1,200,000 | | | | 6,065 | | | | 3,313 | |
AUD Vs USD (Put) | | CITI | | | 0.85 | | | | 11/20/14 | | | | 3,300,000 | | | | 16,299 | | | | 13,314 | |
AUD Vs USD (Put) | | CITI | | | 0.86 | | | | 11/07/14 | | | | 1,400,000 | | | | 6,434 | | | | 5,136 | |
AUD Vs USD (Put) | | CITI | | | 0.86 | | | | 11/13/14 | | | | 1,100,000 | | | | 6,483 | | | | 4,639 | |
AUD Vs USD (Put) | | CITI | | | 0.87 | | | | 11/05/14 | | | | 1,200,000 | | | | 3,517 | | | | 2,209 | |
AUD Vs USD (Put) | | CS | | | 0.86 | | | | 12/01/14 | | | | 1,300,000 | | | | 8,095 | | | | 3,924 | |
AUD Vs USD (Put) | | DUB | | | 0.88 | | | | 12/03/14 | | | | 5,000,000 | | | | 27,745 | | | | (24,755 | ) |
AUD Vs USD (Put) | | UBS | | | 0.86 | | | | 11/06/14 | | | | 1,100,000 | | | | 5,547 | | | | 4,681 | |
AUD Vs USD (Put) | | UBS | | | 0.87 | | | | 11/13/14 | | | | 1,100,000 | | | | 5,116 | | | | 2,199 | |
EUR Vs USD (Put) | | CS | | | 1.25 | | | | 11/06/14 | | | | 1,200,000 | | | | 5,993 | | | | (604 | ) |
EUR Vs USD (Put) | | DUB | | | 1.26 | | | | 11/20/14 | | | | 1,200,000 | | | | 7,572 | | | | (4,247 | ) |
EUR Vs USD (Put) | | DUB | | | 1.26 | | | | 11/06/14 | | | | 4,400,000 | | | | 22,384 | | | | (11,946 | ) |
The accompanying notes are an integral part of these financial statements.
29
Notes to Schedule of Portfolio Investments (continued)
| | | | | | | | | | | | | | | | | | | | | | |
| | | | | | | | Expiration | | | Notional | | | | | | Unrealized | |
| Description | | Counterparty | | Strike Price | | | Date | | | Amount | | | Premium | | | Gain/(Loss) | |
USD Vs BRL (Call) | | GS | | | 2.80 | | | | 01/20/15 | | | $ | 1,200,000 | | | $ | 9,000 | | | $ | 3,199 | |
USD Vs BRL (Call) | | JPM | | | 2.58 | | | | 10/31/14 | | | | 800,000 | | | | 7,720 | | | | 7,720 | |
USD Vs BRL (Call) | | JPM | | | 2.80 | | | | 01/21/15 | | | | 1,100,000 | | | | 10,560 | | | | 5,095 | |
USD Vs BRL (Call) | | JPM | | | 2.80 | | | | 01/23/15 | | | | 1,100,000 | | | | 8,635 | | | | 2,871 | |
USD Vs BRL (Put) | | GS | | | 2.30 | | | | 01/20/15 | | | | 1,200,000 | | | | 5,100 | | | | 2,871 | |
USD Vs BRL (Put) | | JPM | | | 2.30 | | | | 01/21/15 | | | | 1,100,000 | | | | 8,140 | | | | 6,082 | |
USD Vs BRL (Put) | | JPM | | | 2.30 | | | | 01/23/15 | | | | 1,100,000 | | | | 8,635 | | | | 6,549 | |
USD Vs INR (Call) | | BRC | | | 63.27 | | | | 01/27/15 | | | | 2,400,000 | | | | 16,800 | | | | (446 | ) |
USD Vs INR (Call) | | BRC | | | 63.90 | | | | 01/16/15 | | | | 1,200,000 | | | | 6,540 | | | | 1,668 | |
USD Vs INR (Call) | | BRC | | | 64.25 | | | | 02/25/15 | | | | 1,200,000 | | | | 10,140 | | | | 1,543 | |
USD Vs INR (Call) | | CITI | | | 62.80 | | | | 12/24/14 | | | | 1,500,000 | | | | 8,310 | | | | 1,151 | |
USD Vs INR (Call) | | CS | | | 63.00 | | | | 12/05/14 | | | | 900,000 | | | | 4,248 | | | | 2,384 | |
USD Vs INR (Call) | | GS | | | 63.50 | | | | 01/12/15 | | | | 1,400,000 | | | | 9,800 | | | | 3,229 | |
USD Vs INR (Call) | | GS | | | 63.85 | | | | 02/25/15 | | | | 400,000 | | | | 3,412 | | | | 15 | |
USD Vs INR (Call) | | HSBC | | | 63.00 | | | | 01/06/15 | | | | 1,400,000 | | | | 15,750 | | | | 7,864 | |
USD Vs INR (Call) | | HSBC | | | 63.85 | | | | 02/25/15 | | | | 800,000 | | | | 6,800 | | | | 5 | |
USD Vs INR (Call) | | JPM | | | 63.00 | | | | 12/18/14 | | | | 1,400,000 | | | | 8,218 | | | | 3,399 | |
USD Vs INR (Call) | | JPM | | | 63.40 | | | | 01/22/15 | | | | 800,000 | | | | 5,096 | | | | 206 | |
USD Vs INR (Call) | | UBS | | | 64.25 | | | | 02/25/15 | | | | 2,400,000 | | | | 20,376 | | | | 3,182 | |
USD Vs INR (Put) | | BRC | | | 60.90 | | | | 01/16/15 | | | | 1,200,000 | | | | 6,540 | | | | 1,594 | |
USD Vs INR (Put) | | CS | | | 60.75 | | | | 12/05/14 | | | | 900,000 | | | | 3,330 | | | | 1,568 | |
USD Vs INR (Put) | | HSBC | | | 60.00 | | | | 01/06/15 | | | | 1,400,000 | | | | 3,150 | | | | 1,414 | |
USD Vs JPY (Call) | | BRC | | | 108.25 | | | | 11/06/14 | | | | 1,200,000 | | | | 4,272 | | | | (38,708 | ) |
USD Vs JPY (Call) | | DUB | | | 107.60 | | | | 11/07/14 | | | | 1,200,000 | | | | 4,932 | | | | (44,990 | ) |
USD Vs JPY (Call) | | DUB | | | 107.85 | | | | 11/19/14 | | | | 1,200,000 | | | | 5,940 | | | | (41,687 | ) |
USD Vs JPY (Put) | | BOA | | | 97.00 | | | | 11/10/14 | | | | 1,800,000 | | | | 2,484 | | | | 2,484 | |
USD Vs JPY (Put) | | BRC | | | 97.00 | | | | 11/10/14 | | | | 1,100,000 | | | | 1,375 | | | | 1,375 | |
USD Vs JPY (Put) | | CITI | | | 99.00 | | | | 09/30/15 | | | | 6,500,000 | | | | 64,913 | | | | 29,845 | |
USD Vs JPY (Put) | | UBS | | | 100.00 | | | | 07/03/15 | | | | 2,600,000 | | | | 16,640 | | | | 6,974 | |
USD Vs JPY (Put) | | UBS | | | 110.00 | | | | 12/03/14 | | | | 1,800,000 | | | | 8,235 | | | | 535 | |
USD Vs JPY (Put) | | UBS | | | 110.50 | | | | 12/03/14 | | | | 1,800,000 | | | | 10,530 | | | | 685 | |
The accompanying notes are an integral part of these financial statements.
30
Notes to Schedule of Portfolio Investments (continued)
| | | | | | | | | | | | | | | | | | | | | | |
| | | | | | | | Expiration | | | Notional | | | | | | Unrealized | |
| Description | | Counterparty | | Strike Price | | | Date | | | Amount | | | Premium | | | Gain/(Loss) | |
USD Vs JPY (Put) | | UBS | | | 110.50 | | | | 01/07/15 | | | $ | 1,500,000 | | | $ | 14,438 | | | $ | (49 | ) |
USD Vs JPY (Put) | | UBS | | | 98.00 | | | | 11/10/14 | | | | 1,100,000 | | | | 2,310 | | | | 2,310 | |
USD Vs MXN (Call) | | GS | | | 13.80 | | | | 12/24/14 | | | | 1,000,000 | | | | 7,910 | | | | 2,856 | |
USD Vs MXN (Call) | | GS | | | 13.85 | | | | 01/28/15 | | | | 1,000,000 | | | | 6,340 | | | | (1,941 | ) |
USD Vs MXN (Put) | | GS | | | 13.20 | | | | 12/24/14 | | | | 1,000,000 | | | | 3,740 | | | | 1,040 | |
USD Vs MXN (Put) | | GS | | | 13.25 | | | | 01/28/15 | | | | 1,000,000 | | | | 5,810 | | | | 204 | |
| | | | | | | | | | | | | | | | | | | | | | |
| | | | | | | | | | | | | Totals | | | $ | 486,355 | | | $ | (8,884 | ) |
| | | | | | | | | | | | | | | | | | | | | | |
Options on Exchange-Traded Futures
| | | | | | | | | | | | | | | | | | | | |
| | | | | | Expiration | | | Number of | | | | | | Unrealized | |
| Description | | Exercise Price | | | Date | | | Contracts | | | Premium | | | Gain/(Loss) | |
Euro-Bund 10-Year Futures (Call) | | | 151.00 | | | | 11/21/14 | | | | 25 | | | | — | | | $ | (10,691 | ) |
Euro-Bund 10-Year Futures (Call) | | | 151.50 | | | | 11/21/14 | | | | 53 | | | | — | | | | 1,811 | |
Euro-Bund 10-Year Futures (Call) | | | 152.00 | | | | 11/21/14 | | | | 43 | | | | — | | | | (321 | ) |
Euro-Bund 10-Year Futures (Put) | | | 146.00 | | | | 11/21/14 | | | | 24 | | | | — | | | | 8,696 | |
U.S. Treasury 10-Year Note Futures (Put) | | | 125.50 | | | | 11/21/14 | | | | 99 | | | $ | 18,724 | | | | (6,026 | ) |
U.S. Treasury 10-Year Note Futures (Put) | | | 126.00 | | | | 11/21/14 | | | | 140 | | | | 41,954 | | | | (17,109 | ) |
| | | | | | | | | | | | | | | | | | | | |
| | | | | | | | | | | Totals | | | $ | 60,678 | | | $ | (23,640 | ) |
| | | | | | | | | | | | | | | | | | | | |
Transactions in written put and call options and swaptions for the fiscal year ended October 31, 2014, were as follows:
(See Note 10 in the Notes to the Financial Statements.)
| | | | | | | | | | | | |
| | | Number of | | | | | | Amount of | |
| | | Contracts | | | Notional Amount | | | Premiums | |
Options and swaptions outstanding at October 31, 2013 | | | 137 | | | $ | 295,500,000 | | | $ | 1,236,108 | |
Options and swaptions written | | | 450 | | | | 808,300,000 | | | | 4,398,479 | |
Options and swaptions exercised/expired/closed | | | (203 | ) | | | (705,500,000 | ) | | | (3,659,854 | ) |
| | | | | | | | | | | | |
Options and swaptions outstanding at October 31, 2014 | | | 384 | | | $ | 398,300,000 | | | $ | 1,974,733 | |
| | | | | | | | | | | | |
The accompanying notes are an integral part of these financial statements.
31
Notes to Schedule of Portfolio Investments (continued)
At October 31, 2014, the Fund had forward foreign currency contracts (in U.S. Dollars):
(See Note 8 in the Notes to the Financial Statements.)
Foreign Currency
| | | | | | | | | | | | | | | | | | | | |
| | | | | | | | | | Receivable | | | | | | Unrealized | |
| | | Position | | Settlement Date | | | Counterparty | | Amount | | | Payable Amount | | | Gain/(Loss) | |
Australian Dollar | | Long | | | 11/03/14 | | | BOA | | $ | 788,319 | | | $ | 788,077 | | | $ | 242 | |
Australian Dollar | | Long | | | 11/04/14 | | | BOA | | | 710,845 | | | | 713,239 | | | | (2,394 | ) |
Australian Dollar | | Long | | | 12/02/14 | | | CITI | | | 1,976,492 | | | | 1,994,436 | | | | (17,944 | ) |
Australian Dollar | | Long | | | 11/03/14 | | | GS | | | 388,001 | | | | 388,863 | | | | (862 | ) |
Australian Dollar | | Long | | | 11/04/14 | | | GS | | | 16,876,421 | | | | 16,934,215 | | | | (57,794 | ) |
Australian Dollar | | Long | | | 11/04/14 | | | JPM | | | 578,882 | | | | 581,007 | | | | (2,125 | ) |
Australian Dollar | | Long | | | 12/02/14 | | | JPM | | | 1,202,051 | | | | 1,204,363 | | | | (2,312 | ) |
Brazilian Real | | Long | | | 11/04/14 | | | UBS | | | 1,620,461 | | | | 1,627,652 | | | | (7,191 | ) |
Brazilian Real | | Long | | | 01/05/15 | | | UBS | | | 11,881,894 | | | | 12,523,482 | | | | (641,588 | ) |
Canadian Dollar | | Long | | | 11/17/14 | | | HSBC | | | 1,223,925 | | | | 1,230,820 | | | | (6,895 | ) |
Euro | | Long | | | 11/03/14 | | | BOA | | | 3,985,088 | | | | 4,008,272 | | | | (23,184 | ) |
Euro | | Long | | | 11/04/14 | | | BOA | | | 1,181,749 | | | | 1,182,425 | | | | (676 | ) |
Euro | | Long | | | 11/20/14 | | | BRC | | | 102,737,220 | | | | 104,958,632 | | | | (2,221,412 | ) |
Euro | | Long | | | 06/15/15 | | | BRC | | | 2,994,209 | | | | 3,197,786 | | | | (203,577 | ) |
Euro | | Long | | | 11/04/14 | | | CITI | | | 766,946 | | | | 770,201 | | | | (3,255 | ) |
Euro | | Long | | | 11/20/14 | | | CITI | | | 13,470,528 | | | | 13,736,309 | | | | (265,781 | ) |
Euro | | Long | | | 11/20/14 | | | GS | | | 27,632,881 | | | | 28,314,808 | | | | (681,927 | ) |
Euro | | Long | | | 06/15/15 | | | GS | | | 6,926,228 | | | | 7,397,053 | | | | (470,825 | ) |
Euro | | Long | | | 11/20/14 | | | HSBC | | | 2,356,215 | | | | 2,479,708 | | | | (123,493 | ) |
Euro | | Long | | | 11/20/14 | | | JPM | | | 10,911,279 | | | | 11,567,018 | | | | (655,739 | ) |
Euro | | Long | | | 06/15/15 | | | JPM | | | 1,955,966 | | | | 2,083,202 | | | | (127,236 | ) |
Indian Rupee | | Long | | | 12/05/14 | | | BRC | | | 183,715 | | | | 184,000 | | | | (285 | ) |
Indian Rupee | | Long | | | 11/24/14 | | | HSBC | | | 261,312 | | | | 262,000 | | | | (688 | ) |
Indian Rupee | | Long | | | 01/08/15 | | | JPM | | | 505,988 | | | | 504,000 | | | | 1,988 | |
Japanese Yen | | Long | | | 11/04/14 | | | BRC | | | 46,007,701 | | | | 47,918,899 | | | | (1,911,198 | ) |
Japanese Yen | | Long | | | 11/05/14 | | | BRC | | | 1,275,269 | | | | 1,283,000 | | | | (7,731 | ) |
Japanese Yen | | Long | | | 11/04/14 | | | CITI | | | 4,866,383 | | | | 5,062,942 | | | | (196,559 | ) |
Japanese Yen | | Long | | | 12/02/14 | | | CITI | | | 11,823,267 | | | | 12,290,651 | | | | (467,384 | ) |
The accompanying notes are an integral part of these financial statements.
32
Notes to Schedule of Portfolio Investments (continued)
| | | | | | | | | | | | | | | | | | | | |
| | | | | | | | | | Receivable | | | | | | Unrealized | |
| | | Position | | Settlement Date | | | Counterparty | | Amount | | | Payable Amount | | | Gain/(Loss) | |
Japanese Yen | | Long | | | 11/04/14 | | | CS | | $ | 569,082 | | | $ | 587,000 | | | $ | (17,918 | ) |
Japanese Yen | | Long | | | 11/04/14 | | | DUB | | | 682,564 | | | | 704,000 | | | | (21,436 | ) |
Japanese Yen | | Long | | | 11/05/14 | | | DUB | | | 1,145,825 | | | | 1,200,000 | | | | (54,175 | ) |
Japanese Yen | | Long | | | 12/02/14 | | | DUB | | | 2,286,823 | | | | 2,357,847 | | | | (71,024 | ) |
Japanese Yen | | Long | | | 11/04/14 | | | GS | | | 2,459,900 | | | | 2,587,900 | | | | (128,000 | ) |
Japanese Yen | | Long | | | 11/04/14 | | | JPM | | | 3,104,478 | | | | 3,261,434 | | | | (156,956 | ) |
Japanese Yen | | Long | | | 11/05/14 | | | UBS | | | 1,191,481 | | | | 1,195,000 | | | | (3,519 | ) |
Mexican Peso | | Long | | | 12/18/14 | | | BRC | | | 122,544 | | | | 122,836 | | | | (292 | ) |
Mexican Peso | | Long | | | 02/05/15 | | | BRC | | | 13,979,729 | | | | 13,961,949 | | | | 17,780 | |
Mexican Peso | | Long | | | 12/18/14 | | | CITI | | | 4,260,178 | | | | 4,364,254 | | | | (104,076 | ) |
Mexican Peso | | Long | | | 12/18/14 | | | CS | | | 177,411 | | | | 176,687 | | | | 724 | |
Mexican Peso | | Long | | | 01/08/15 | | | DUB | | | 3,177,951 | | | | 3,178,754 | | | | (803 | ) |
Mexican Peso | | Long | | | 01/22/15 | | | DUB | | | 4,977,976 | | | | 4,979,238 | | | | (1,262 | ) |
Mexican Peso | | Long | | | 02/05/15 | | | DUB | | | 8,939,856 | | | | 8,942,508 | | | | (2,652 | ) |
Mexican Peso | | Long | | | 02/05/15 | | | HSBC | | | 107,874 | | | | 106,611 | | | | 1,263 | |
Mexican Peso | | Long | | | 12/18/14 | | | JPM | | | 2,210,650 | | | | 2,278,268 | | | | (67,618 | ) |
Mexican Peso | | Long | | | 02/05/15 | | | JPM | | | 4,394,439 | | | | 4,452,577 | | | | (58,138 | ) |
Australian Dollar | | Short | | | 11/04/14 | | | CITI | | | 2,935,775 | | | | 2,938,396 | | | | (2,621 | ) |
Australian Dollar | | Short | | | 11/04/14 | | | GS | | | 9,615,058 | | | | 9,724,859 | | | | (109,801 | ) |
Australian Dollar | | Short | | | 12/02/14 | | | GS | | | 16,900,223 | | | | 16,843,646 | | | | 56,577 | |
Australian Dollar | | Short | | | 11/04/14 | | | HSBC | | | 971,499 | | | | 984,451 | | | | (12,952 | ) |
Australian Dollar | | Short | | | 11/04/14 | | | JPM | | | 3,214,758 | | | | 3,228,716 | | | | (13,958 | ) |
Brazilian Real | | Short | | | 04/02/15 | | | CS | | | 1,217,681 | | | | 1,160,098 | | | | 57,583 | |
Brazilian Real | | Short | | | 04/02/15 | | | HSBC | | | 1,218,126 | | | | 1,160,098 | | | | 58,028 | |
Brazilian Real | | Short | | | 01/05/15 | | | JPM | | | 12,907,667 | | | | 11,881,894 | | | | 1,025,773 | |
Brazilian Real | | Short | | | 04/02/15 | | | JPM | | | 1,445,122 | | | | 1,462,508 | | | | (17,386 | ) |
Brazilian Real | | Short | | | 11/04/14 | | | UBS | | | 1,695,614 | | | | 1,620,461 | | | | 75,153 | |
Brazilian Real | | Short | | | 12/02/14 | | | UBS | | | 1,615,162 | | | | 1,606,734 | | | | 8,428 | |
Brazilian Real | | Short | | | 01/05/15 | | | UBS | | | 1,046,120 | | | | 984,654 | | | | 61,466 | |
Brazilian Real | | Short | | | 10/02/15 | | | UBS | | | 17,846,324 | | | | 16,768,901 | | | | 1,077,423 | |
British Pound | | Short | | | 12/11/14 | | | BRC | | | 6,869,669 | | | | 6,830,068 | | | | 39,601 | |
The accompanying notes are an integral part of these financial statements.
33
Notes to Schedule of Portfolio Investments (continued)
| | | | | | | | | | | | | | | | | | | | |
| | | | | | | | | | Receivable | | | | | | Unrealized | |
| | | Position | | Settlement Date | | | Counterparty | | Amount | | | Payable Amount | | | Gain/(Loss) | |
British Pound | | Short | | | 12/11/14 | | | CITI | | $ | 808,943 | | | $ | 805,983 | | | $ | 2,960 | |
British Pound | | Short | | | 12/11/14 | | | DUB | | | 2,558,550 | | | | 2,558,677 | | | | (127 | ) |
British Pound | | Short | | | 12/11/14 | | | GS | | | 2,207,230 | | | | 2,194,066 | | | | 13,164 | |
Canadian Dollar | | Short | | | 11/17/14 | | | BRC | | | 10,953,473 | | | | 10,886,215 | | | | 67,258 | |
Canadian Dollar | | Short | | | 02/10/15 | | | CITI | | | 8,137,354 | | | | 7,888,588 | | | | 248,766 | |
Euro | | Short | | | 11/20/14 | | | BRC | | | 10,986,831 | | | | 10,833,573 | | | | 153,258 | |
Euro | | Short | | | 06/15/15 | | | BRC | | | 3,433,706 | | | | 3,237,763 | | | | 195,943 | |
Euro | | Short | | | 11/20/14 | | | CITI | | | 108,401,280 | | | | 102,183,258 | | | | 6,218,022 | |
Euro | | Short | | | 08/07/15 | | | DUB | | | 267,586 | | | | 251,255 | | | | 16,331 | |
Euro | | Short | | | 11/20/14 | | | GS | | | 125,497,147 | | | | 119,037,712 | | | | 6,459,435 | |
Euro | | Short | | | 06/15/15 | | | JPM | | | 9,158,703 | | | | 8,638,639 | | | | 520,064 | |
Indian Rupee | | Short | | | 01/08/15 | | | HSBC | | | 336,000 | | | | 337,325 | | | | (1,325 | ) |
Indian Rupee | | Short | | | 12/05/14 | | | JPM | | | 184,000 | | | | 183,715 | | | | 285 | |
Japanese Yen | | Short | | | 11/04/14 | | | BRC | | | 16,223,818 | | | | 15,828,652 | | | | 395,166 | |
Japanese Yen | | Short | | | 12/02/14 | | | BRC | | | 43,455,250 | | | | 41,676,638 | | | | 1,778,612 | |
Japanese Yen | | Short | | | 11/04/14 | | | CITI | | | 8,818,162 | | | | 8,626,122 | | | | 192,040 | |
Japanese Yen | | Short | | | 12/15/14 | | | CITI | | | 9,447,198 | | | | 8,996,298 | | | | 450,900 | |
Japanese Yen | | Short | | | 11/04/14 | | | DUB | | | 10,437,893 | | | | 10,107,582 | | | | 330,311 | |
Japanese Yen | | Short | | | 11/05/14 | | | DUB | | | 902,000 | | | | 899,332 | | | | 2,668 | |
Japanese Yen | | Short | | | 08/07/15 | | | HSBC | | | 4,100,000 | | | | 3,736,102 | | | | 363,898 | |
Japanese Yen | | Short | | | 11/04/14 | | | JPM | | | 18,098,949 | | | | 17,535,359 | | | | 563,590 | |
Japanese Yen | | Short | | | 12/15/14 | | | JPM | | | 10,697,192 | | | | 10,163,145 | | | | 534,047 | |
Japanese Yen | | Short | | | 12/15/14 | | | UBS | | | 8,521,768 | | | | 8,096,669 | | | | 425,099 | |
Mexican Peso | | Short | | | 12/18/14 | | | BRC | | | 2,846,363 | | | | 2,843,579 | | | | 2,784 | |
Mexican Peso | | Short | | | 12/18/14 | | | CITI | | | 1,248,949 | | | | 1,239,654 | | | | 9,295 | |
Mexican Peso | | Short | | | 11/04/14 | | | DUB | | | 17,184,326 | | | | 17,180,363 | | | | 3,963 | |
Mexican Peso | | Short | | | 12/18/14 | | | DUB | | | 12,454,100 | | | | 12,252,316 | | | | 201,784 | |
Mexican Peso | | Short | | | 02/05/15 | | | DUB | | | 9,105,228 | | | | 8,882,673 | | | | 222,555 | |
Mexican Peso | | Short | | | 11/13/14 | | | GS | | | 10,838,561 | | | | 10,651,512 | | | | 187,049 | |
Mexican Peso | | Short | | | 12/11/14 | | | GS | | | 2,615,165 | | | | 2,551,638 | | | | 63,527 | |
Mexican Peso | | Short | | | 12/18/14 | | | GS | | | 5,092,796 | | | | 4,992,695 | | | | 100,101 | |
The accompanying notes are an integral part of these financial statements.
34
Notes to Schedule of Portfolio Investments (continued)
| | | | | | | | | | | | | | | | | | | | | | |
| | | | | | | | | | | Receivable | | | | | | Unrealized | |
| | | Position | | Settlement Date | | | Counterparty | | | Amount | | | Payable Amount | | | Gain/(Loss) | |
Mexican Peso | | Short | | | 01/22/15 | | | | GS | | | $ | 5,068,871 | | | $ | 4,946,988 | | | $ | 121,883 | |
Mexican Peso | | Short | | | 02/05/15 | | | | GS | | | | 534,830 | | | | 538,043 | | | | (3,213 | ) |
Mexican Peso | | Short | | | 12/18/14 | | | | HSBC | | | | 755,000 | | | | 753,176 | | | | 1,824 | |
Mexican Peso | | Short | | | 12/18/14 | | | | JPM | | | | 762,000 | | | | 756,593 | | | | 5,407 | |
Mexican Peso | | Short | | | 12/18/14 | | | | UBS | | | | 906,000 | | | | 906,429 | | | | (429 | ) |
Mexican Peso | | Short | | | 01/08/15 | | | | UBS | | | | 3,244,131 | | | | 3,158,997 | | | | 85,134 | |
| | | | | | | | | | | | | | | | | | | | | | |
| | | | | | | | | Totals | | | $ | 896,666,147 | | | $ | 883,196,731 | | | $ | 13,469,416 | |
| | | | | | | | | | | | | | | | | | | | | | |
COUNTERPARTY ABBREVIATIONS:
| | |
BNP: | | BNP Paribas Bank |
BOA: | | Bank of America |
BRC: | | Barclays Bank PLC |
CITI: | | Citigroup, Inc. |
CS: | | Credit Suisse |
DUB: | | Deutsche Bank AG |
GS: | | Goldman Sachs & Co. |
HSBC: | | HSBC Bank |
JPM: | | JPMorgan Chase & Co. |
MS: | | Morgan Stanley |
RBS: | | Royal Bank of Scotland Group PLC |
SGCB: | | Societe Generale |
UBS: | | UBS Warburg LLC |
CURRENCY ABBREVIATIONS:
| | |
AUD: | | Australian Dollar |
BRL: | | Brazilian Real |
EUR: | | Euro |
GBP: | | British Pound |
INR: | | Indian Rupee |
JPY: | | Japanese Yen |
MXN: | | Mexican Peso |
USD: | | United States Dollar |
INVESTMENT ABBREVIATIONS AND DEFINITIONS:
| | |
CDI: | | Brazil Interbank Deposit Rate |
CPURNSA: | | Consumer Price All Urban Non-Seasonally Adjusted Index |
EURIBOR: | | Euro Interbank Offered Rate |
LIBOR: | | London Interbank Offered Rate |
OIS: | | Overnight Index Swap |
OTC: | | Over-the-counter |
TIIE: | | Interbank Equilibrium Interest Rate |
The accompanying notes are an integral part of these financial statements.
35
Statement of Assets and Liabilities
October 31, 2014
| | | | |
Assets: | |
Investments at value* (including securities on loan valued at $9,403,611) | | $ | 1,022,302,613 | |
Receivable for investments sold | | | 112,737,584 | |
Receivable for delayed delivery investments sold | | | 38,339,297 | |
Unrealized appreciation on foreign currency contracts | | | 22,419,152 | |
Dividends, interest and other receivables | | | 5,130,765 | |
Cash collateral for financial derivative instruments | | | 1,953,000 | |
Unrealized appreciation on swaps | | | 1,410,159 | |
Foreign currency** | | | 992,975 | |
Variation margin receivable on financial derivative instruments | | | 864,688 | |
Receivable for Fund shares sold | | | 806,090 | |
Swap premiums paid | | | 418,182 | |
Receivable from affiliate | | | 92,014 | |
Prepaid expenses | | | 18,211 | |
Total assets | | | 1,207,484,730 | |
Liabilities: | | | | |
Payable for delayed delivery investments purchased | | | 198,394,961 | |
Payable for investments purchased | | | 18,053,553 | |
Payable for collateral on financial derivative instruments | | | 11,193,000 | |
Payable upon return of securities loaned | | | 9,693,138 | |
Unrealized depreciation on foreign currency contracts | | | 8,949,736 | |
Payable to custodian | | | 8,668,939 | |
Payable for Fund shares repurchased | | | 3,074,732 | |
Swap premiums received | | | 2,645,054 | |
Options written (premiums received $1,974,733) | | | 1,613,320 | |
Variation margin payable on financial derivative instruments | | | 774,817 | |
Unrealized depreciation on swaps | | | 581,595 | |
Accrued expenses: | | | | |
Investment advisory and management fees | | | 369,733 | |
Administrative fees | | | 184,866 | |
Trustee fees and expenses | | | 4,151 | |
Other | | | 326,993 | |
Total liabilities | | | 264,528,588 | |
Net Assets | | $ | 942,956,142 | |
Net Assets Represent: | | | | |
Paid-in capital | | $ | 893,362,866 | |
Undistributed net investment income (loss) | | | (986,160 | ) |
Accumulated net realized gain from investments, options, futures contracts, swaps and foreign currency transactions | | | 22,341,769 | |
Net unrealized appreciation of investments, options, futures contracts, swaps and foreign currency translations | | | 28,237,667 | |
Net Assets | | $ | 942,956,142 | |
Shares outstanding | | | 86,743,693 | |
Net asset value, offering and redemption price per share | | $ | 10.87 | |
* Investments at cost | | $ | 1,008,006,717 | |
** Foreign currency at cost | | $ | 976,872 | |
The accompanying notes are an integral part of these financial statements.
36
Statement of Operations
For the fiscal year ended October 31, 2014
| | | | |
Investment Income: | | | | |
Interest income | | $ | 23,758,156 | |
Dividend income | | | 449,229 | |
Securities lending income | | | 36,719 | |
Foreign withholding tax | | | (40,988 | ) |
Total investment income | | | 24,203,116 | |
Expenses: | | | | |
Investment advisory and management fees | | | 4,737,211 | |
Administrative fees | | | 2,368,606 | |
Custodian | | | 273,523 | |
Transfer agent | | | 166,719 | |
Reports to shareholders | | | 144,729 | |
Professional fees | | | 155,086 | |
Trustees fees and expenses | | | 48,825 | |
Shareholder servicing fees | | | 19,822 | |
Registration fees | | | 56,543 | |
Miscellaneous | | | 28,224 | |
Total expenses before offsets | | | 7,999,288 | |
Expense reimbursements | | | (1,124,267 | ) |
Net expenses | | | 6,875,021 | |
Net investment income | | | 17,328,095 | |
Net Realized and Unrealized Gain (Loss): | | | | |
Net realized gain on investments | | | 2,724,111 | |
Net realized gain on futures contracts | | | 11,068,731 | |
Net realized gain on foreign currency transactions | | | 4,928,213 | |
Net realized gain on written options | | | 3,294,128 | |
Net realized gain on swap transactions | | | 2,536,233 | |
Net change in unrealized appreciation (depreciation) of investments | | | (3,463,568 | ) |
Net change in unrealized appreciation (depreciation) of futures contracts | | | (3,711,228 | ) |
Net change in unrealized appreciation (depreciation) on foreign currency translations | | | 14,192,725 | |
Net change in unrealized appreciation (depreciation) on written options | | | (326,368 | ) |
Net change in unrealized appreciation (depreciation) on swap transactions | | | (6,008,273 | ) |
Net realized and unrealized gain | | | 25,234,704 | |
Net increase in net assets resulting from operations | | $ | 42,562,799 | |
The accompanying notes are an integral part of these financial statements.
37
Statements of Changes in Net Assets
For the fiscal years ended October 31,
| | | | | | | | |
| | | 2014 | | | 2013 | |
Increase (Decrease) in Net Assets From Operations: | | | | | | | | |
Net investment income | | $ | 17,328,095 | | | $ | 20,245,641 | |
Net realized gain on investments, options, futures contracts, swaps and foreign currency transactions | | | 24,551,416 | | | | 3,806,382 | |
Net change in unrealized appreciation (depreciation) of investments, options, futures contracts, swaps and foreign currency translations | | | 683,288 | | | | (38,647,898 | ) |
Net increase (decrease) in net assets resulting from operations | | | 42,562,799 | | | | (14,595,875 | ) |
Distributions to Shareholders: | | | | | | | | |
From net investment income | | | (16,020,069 | ) | | | (34,138,855 | ) |
From net realized gain on investments | | | — | | | | (20,101,151 | ) |
From return of capital | | | — | | | | (2,501,308 | ) |
Total distributions to shareholders | | | (16,020,069 | ) | | | (56,741,314 | ) |
Capital Share Transactions: | | | | | | | | |
Proceeds from sale of shares | | | 244,902,657 | | | | 358,066,861 | |
Reinvestment of dividends | | | 13,489,957 | | | | 48,296,615 | |
Cost of shares repurchased | | | (585,489,638 | ) | | | (538,187,094 | ) |
Net decrease from capital share transactions | | | (327,097,024 | ) | | | (131,823,618 | ) |
Total decrease in net assets | | | (300,554,294 | ) | | | (203,160,807 | ) |
Net Assets: | | | | | | | | |
Beginning of year | | | 1,243,510,436 | | | | 1,446,671,243 | |
End of year | | $ | 942,956,142 | | | $ | 1,243,510,436 | |
End of year undistributed net investment income (loss) | | $ | (986,160 | ) | | $ | 709,639 | |
| | | | | | | | |
Share Transactions: | | | | | | | | |
Sale of shares | | | 22,918,825 | | | | 33,118,087 | |
Shares issued in connection with reinvestment of dividends and distributions | | | 1,262,078 | | | | 4,454,829 | |
Shares repurchased | | | (54,463,680 | ) | | | (50,389,826 | ) |
Net decrease in shares | | | (30,282,777 | ) | | | (12,816,910 | ) |
The accompanying notes are an integral part of these financial statements.
38
AMG Managers Total Return Bond Fund
Financial Highlights
For a share outstanding throughout each fiscal year
| | | | | | | | | | | | | | | | | | | | |
| | | For the fiscal years ended October 31, | |
| | | 2014 | | | 2013 | | | 2012 | | | 2011 | | | 2010 | |
Net Asset Value, Beginning of Year | | $ | 10.63 | | | $ | 11.14 | | | $ | 10.53 | | | $ | 11.24 | | | $ | 10.61 | |
Net investment income | | | 0.16 | 3 | | | 0.16 | 3 | | | 0.24 | 3 | | | 0.38 | | | | 0.35 | |
Net realized and unrealized gain (loss) on investments | | | 0.22 | 3 | | | (0.24 | )3 | | | 0.72 | 3 | | | (0.25 | ) | | | 0.73 | |
Total from investment operations | | | 0.38 | | | | (0.08 | ) | | | 0.96 | | | | 0.13 | | | | 1.08 | |
Less Distributions to Shareholders from: | | | | | | | | | | | | | | | | | | | | |
Net investment income | | | (0.14 | ) | | | (0.26 | ) | | | (0.35 | ) | | | (0.35 | ) | | | (0.32 | ) |
Net realized gain on investments | | | — | | | | (0.15 | ) | | | — | | | | (0.49 | ) | | | (0.13 | ) |
Return of capital | | | — | | | | (0.02 | ) | | | — | | | | — | | | | — | |
Total distributions to shareholders | | | (0.14 | ) | | | (0.43 | ) | | | (0.35 | ) | | | (0.84 | ) | | | (0.45 | ) |
Net Asset Value, End of Year | | $ | 10.87 | | | $ | 10.63 | | | $ | 11.14 | | | $ | 10.53 | | | $ | 11.24 | |
Total Return1 | | | 3.64 | % | | | (0.72 | )% | | | 9.31 | % | | | 1.45 | % | | | 10.52 | % |
Ratio of net expenses to average net assets (with offsets and reductions) | | | 0.58 | % | | | 0.61 | %4 | | | 0.58 | % | | | 0.58 | % | | | 0.58 | % |
Ratio of expenses to average net assets (with offsets) | | | 0.58 | % | | | 0.61 | %4 | | | 0.58 | % | | | 0.58 | % | | | 0.58 | % |
Ratio of total expenses to average net assets (without offsets and reductions)2 | | | 0.67 | % | | | 0.70 | %4 | | | 0.70 | % | | | 0.71 | % | | | 0.74 | % |
Ratio of net investment income to average net assets1 | | | 1.46 | % | | | 1.45 | %4 | | | 2.22 | % | | | 2.54 | % | | | 2.38 | % |
Portfolio turnover | | | 177 | % | | | 255 | % | | | 375 | % | | | 495 | %5 | | | 359 | %5 |
Net assets at end of year (000’s omitted) | | $ | 942,956 | | | $ | 1,243,510 | | | $ | 1,446,671 | | | $ | 1,239,141 | | | $ | 1,425,341 | |
| | | | | | | | | | | | | | | | | | | | |
Notes to Financial Highlights
| 1 | Total returns and net investment income would have been lower had certain expenses not been offset. |
| 2 | Excludes the impact of expense reimbursements or fee waivers and expense reductions such as brokerage credits, but includes non-reimbursable expense, if any, such as interest, taxes and extraordinary expenses. |
| 3 | Per share numbers have been calculated using average shares. |
| 4 | Includes non-routine extraordinary expenses amounting to 0.025% of average net assets. |
| 5 | Turnover ratio includes TBA dollar roll transactions. Had the TBA transactions been excluded the turnover ratios for the fiscal years ended 2011 and 2010 would have been 411% and 286%, respectively. |
39
Notes to Financial Statements
October 31, 2014
1. SUMMARY OF SIGNIFICANT ACCOUNTING POLICIES
AMG Funds I (formerly Managers Trust I) (the “Trust”) is an open-end management investment company, organized as a Massachusetts business trust, and registered under the Investment Company Act of 1940, as amended (the “1940 Act”). Currently, the Trust consists of a number of different funds, each having distinct investment management objectives, strategies, risks, and policies. Included in this report is the AMG Managers Total Return Bond Fund (formerly Managers PIMCO Bond Fund) (the “Fund”).
The Fund’s financial statements are prepared in accordance with accounting principles generally accepted in the United States of America (“U.S. GAAP”), which require management to make estimates and assumptions that affect the reported amounts of assets and liabilities and disclosure of contingent assets and liabilities at the date of the financial statements and the reported amounts of income and expenses during the reporting period. Actual results could differ from those estimates and such differences may be material. The following is a summary of significant accounting policies followed by the Fund in the preparation of its financial statements:
a. VALUATION OF INVESTMENTS
Equity securities traded on a domestic or international securities exchange are valued at the last quoted sale price, or, lacking any sales, at the last quoted bid price. Equity securities primarily traded on an international securities exchange and equity securities traded on NASDAQ or in a U.S. or non-U.S. over-the-counter market are valued at the market’s official closing price, or, if there are no trades on the applicable date, at the last quoted bid price. In addition, if the applicable market does not offer an official closing price or if the official closing price is not representative of the overall market, equity securities primarily traded on an international securities exchange and equity securities traded in a non-U.S. over-the counter market are valued at the last quoted sales price. The Fund’s investments are generally valued based on independent market quotations or prices or, if none, “evaluative” or other market based valuations provided by third-party pricing services approved by the Board of Trustees of the Fund (the “Board”).
Fixed-income securities are valued based on valuations furnished by independent pricing services that utilize matrix systems, which reflect such factors as security prices, yields, maturities, and ratings, and are supplemented by dealer and exchange quotations. Debt obligations (other than short-term debt obligations that have 60 days or less remaining until maturity) will be valued using the evaluated bid price or the mean price provided by an authorized pricing service. Futures contracts for which market quotations are readily available are valued at the settlement price as of the close of the futures exchange. Short-term debt obligations (debt obligations with maturities of one year or less at the time of issuance) that have 60 days or less remaining until maturity will be valued at amortized cost. Investments in other open-end regulated investment companies are valued at their end of day net asset value per share. Investments in certain mortgage-backed and stripped mortgage-backed securities, preferred stocks, convertible securities, derivatives and other debt securities not traded on an organized securities market are valued on the basis of valuations provided by dealers or by a pricing service which uses information with respect to transactions in such securities and various relationships between such securities and yield to maturity in determining value.
Under certain circumstances, the value of certain Fund investments (including derivatives) may be based on an evaluation of fair value, pursuant to procedures established by and under the general supervision of the Board. The Pricing Committee is the committee formed by the Board to make fair value determinations for such investments. The Fund may use the fair value of a portfolio investment to calculate its net asset value (“NAV”) in the event that the market quotation, price or market based valuation for the portfolio investment is not deemed to be readily available or otherwise not determinable pursuant to the Board’s valuation procedures, if AMG Funds LLC (formerly Managers Investment Group LLC) (the “Investment Manager”) believes the quotation, price or market based valuation to be unreliable, or in certain other circumstances. When determining the fair value of an investment, the Pricing Committee seeks to determine the price that the Fund might reasonably expect to receive from a current sale of that investment in an arms-length transaction. Fair value determinations shall be based upon consideration of all available facts and information, including, but not limited to (i) attributes specific to the investment; (ii) fundamental analytical data and press releases relating to the investment and its issuer; and (iii) the value of other comparable securities or relevant financial instruments, including derivative securities, traded on other markets or among dealers.
The values assigned to fair value investments are based on available information and do not necessarily represent amounts that might ultimately be realized in the future, since such amounts depend on future developments inherent in long-term investments. Because of the inherent uncertainty of valuation, those estimated values may differ significantly from the values that would have been used had a ready market for the investments existed, and the differences could be material. The Board will be presented with a quarterly report showing as of the most recent quarter end, all outstanding securities fair valued by the Pricing Committee, including a comparison with the prior quarter end and the percentage of the Fund that the security represents at each quarter end.
Portfolio investments that trade primarily on foreign markets are priced based upon the market quotation of such securities as of the close of their respective principal markets. Under certain circumstances, on behalf of a fund that invests in international securities, the Investment Manager or applicable subadvisor may adjust such prices based on its determination of the impact of events occurring subsequent to the close of such markets but prior to the time as of which the Fund calculates its NAV. The Board has also adopted a policy that securities held in a fund that invests in international securities and certain foreign debt obligations held by a fund, in each case, that can be fair valued by the applicable fair value pricing service are fair valued on each business day without regard to a “trigger” (e.g., without regard to invoking fair value based upon a change in a U.S. equity securities index exceeding a pre-determined level). The Fund may invest in securities that may be thinly traded. The Board has adopted procedures to adjust prices of securities that are judged to be stale so that they reflect fair value. An investment valued on the basis of its fair value may be valued at a price higher or lower than available market quotations.
U.S. GAAP defines fair value as the price that a Fund would receive to sell an asset or pay to transfer a liability in an orderly transaction between market participants at the measurement date. U.S. GAAP also establishes a framework for measuring fair value, and a three-level hierarchy for fair value
Notes to Financial Statements (continued)
measurements based upon the transparency of inputs to the valuation of an asset or liability. Inputs may be observable or unobservable and refer broadly to the assumptions that market participants would use in pricing the asset or liability. Observable inputs reflect the assumptions market participants would use in pricing the asset or liability based on market data obtained from sources independent of the Fund. Unobservable inputs reflect the Fund’s own assumptions about the assumptions that market participants would use in pricing the asset or liability developed based on the best information available in the circumstances. Each investment is assigned a level based upon the observability of the inputs which are significant to the overall valuation.
The three-tier hierarchy of inputs is summarized below:
Level 1 – inputs are quoted prices in active markets for identical investments (e.g., equity securities, open-end investment companies, futures contracts, options contracts)
Level 2 – other observable inputs (including, but not limited to: quoted prices for similar assets or liabilities in markets that are active, quoted prices for identical or similar assets or liabilities in markets that are not active, inputs other than quoted prices that are observable for the assets or liabilities (such as interest rates, yield curves, volatilities, prepayment speeds, loss severities, credit risks and default rates) or other market corroborated inputs) (e.g., debt securities, government securities, swap contracts, foreign currency exchange contracts, foreign securities utilizing international fair value pricing, broker-quoted securities, fair valued securities with observable inputs)
Level 3 – inputs are significant unobservable inputs (including the Fund’s own assumptions used to determine the fair value of investments) (e.g., fair valued securities with unobservable inputs)
Changes in inputs or methodologies used for valuing investments may result in a transfer in or out of levels within the fair value hierarchy. The inputs or methodologies used for valuing investments may not necessarily be an indication of the risk associated with investing in those investments.
b. SECURITY TRANSACTIONS
Security transactions are accounted for as of trade date. Realized gains and losses on securities sold are determined on the basis of identified cost.
c. INVESTMENT INCOME AND EXPENSES
Dividend income is recorded on the ex-dividend date. Dividend and interest income on foreign securities is recorded gross of any withholding tax. Interest income, which includes amortization of premium and accretion of discount on debt securities, is accrued as earned. Non-cash dividends included in dividend income, if any, are reported at the fair market value of the securities received. Other income and expenses are recorded on an accrual basis. Expenses that cannot be directly attributed to a Fund are apportioned among the Funds in the Trust and in some cases other affiliated funds based upon their relative average net assets or number of shareholders.
The Fund has a “balance credit” agreement with The Bank of New York Mellon (“BNYM”), the Fund’s custodian, whereby the Fund is credited with an interest factor equal to 0.75% below the effective 90-day T-Bill rate for account balances left uninvested overnight. If the T-Bill rate falls below 0.75%, no
credits will be earned. These credits serve to reduce custodian expenses that would otherwise be charged to the Fund. For the fiscal year ended October 31, 2014, the Fund’s custodian expense was not reduced.
Overdraft fees are computed at 1% above the effective Federal Funds rate on the day of the overdraft. For the fiscal year ended October 31, 2014, overdraft fees for the Fund equaled $819.
The Trust held a shareholder meeting at which shareholders approved a new Declaration of Trust for the Trust, among other proposals. The costs associated with this proxy statement and shareholder meeting are being treated as “extraordinary expenses,” and, therefore, are excluded from the expense limitation agreement described in Note 2.
d. DIVIDENDS AND DISTRIBUTIONS
Fund distributions resulting from either net investment income or realized net capital gains, if any, will normally be declared and paid at least annually in December, as described in the Fund’s prospectus. Distributions to shareholders are recorded on the ex-dividend date. Distributions are determined in accordance with federal income tax regulations, which may differ from net investment income and net realized capital gains for financial statement purposes (U.S. GAAP). Differences may be permanent or temporary. Permanent differences are reclassified among capital accounts in the financial statements to reflect their tax character. Temporary differences arise when certain items of income, expense and gain or loss are recognized in different periods for financial statement and tax purposes; these differences will reverse at some time in the future. The differences are due to differing treatments for wash sales, foreign currency, options, futures and market discount transactions. Permanent book and tax basis differences, if any, relating to shareholder distributions will result in reclassifications to paid-in capital.
The tax character of distributions paid during the fiscal years ended October 31, 2014 and October 31, 2013 were as follows:
| | | | | | | | |
| Distributions paid from: | | 2014 | | | 2013 | |
Ordinary income | | $ | 16,174,618 | | | $ | 27,279,634 | |
Short-term capital gains | | | — | | | | 16,058,426 | |
Long-term capital gains | | | — | | | | 10,901,946 | |
Return of capital | | | — | | | | 2,501,308 | |
| | | | | | | | |
Totals | | $ | 16,174,618 | | | $ | 56,741,314 | |
| | | | | | | | |
As of October 31, 2014, the components of distributable earnings (excluding unrealized appreciation/depreciation) on a tax basis consisted of:
| | | | |
Capital loss carryforward | | | — | |
Undistributed ordinary income | | $ | 28,138,412 | |
Undistributed short-term capital gains | | | — | |
Undistributed long-term capital gains | | $ | 8,894,260 | |
e. FEDERAL TAXES
The Fund intends to comply with the requirements under Subchapter M of the Internal Revenue Code of 1986, as amended, to distribute substantially all of its taxable income and gains to its shareholders and to meet certain diversification
41
Notes to Financial Statements (continued)
and income requirements with respect to investment companies. Therefore, no provision for federal income or excise tax is included in the accompanying financial statements.
Additionally, based on the Fund’s understanding of the tax rules and rates related to income, gains and transactions for the foreign jurisdictions in which it invests, the Fund will provide for foreign taxes, and where appropriate, deferred foreign taxes.
Management has analyzed the Fund’s tax positions taken on federal income tax returns as of October 31, 2014, and for all open tax years (generally, the three prior taxable years), and has concluded that no provision for federal income tax is required in the Fund’s financial statements. Additionally, the Fund is not aware of any tax position for which it is reasonably possible that the total amounts of unrecognized tax benefits will change materially in the next twelve months.
Net capital losses incurred in taxable years beginning after the enactment of the Regulated Investment Company Modernization Act of 2010, post-enactment capital losses may be carried forward for an unlimited time period. Such losses will be required to be utilized prior to any loss carryovers incurred in pre-enactment taxable years, which generally expire eight years following the close of the taxable year in which they were incurred. As a result of this ordering rule, pre-enactment capital loss carryovers may be more likely to expire unused. Additionally, post-enactment capital losses that are carried forward will retain their tax character as either short-term or long-term capital losses, unlike pre-enactment losses which are considered all short-term.
f. CAPITAL LOSS CARRYOVERS
As of October 31, 2014, the Fund had no accumulated net realized capital loss carryovers from securities transactions for federal income tax purposes. Should the Fund incur net capital losses for the fiscal year ended October 31, 2015, such amounts may be used to offset future realized capital gains, for an unlimited time period.
g. CAPITAL STOCK
The Trust’s Declaration of Trust authorizes for each series the issuance of an unlimited number of shares of beneficial interest, without par value. The Fund records sales and repurchases of its capital stock on the trade date. The cost of securities contributed to the Fund in connection with the issuance of shares is based on the valuation of those securities in accordance with the Fund’s policy on investment valuation.
At October 31, 2014, certain unaffiliated shareholders of record, specifically omnibus accounts, individually or collectively held greater than 10% of the net assets of the Fund as follows: two collectively own 46%. Transactions by these shareholders may have a material impact on the Fund.
h. REPURCHASE AGREEMENTS
The Fund may enter into repurchase agreements provided that the value of the underlying collateral, including accrued interest, will equal or exceed the value of the repurchase agreement during the term of the agreement. The underlying collateral for all repurchase agreements is held in safekeeping by the Fund’s custodian or at the Federal Reserve Bank. If the seller defaults and the value of
the collateral declines, or if bankruptcy proceedings commence with respect to the seller of the security, realization of the collateral by the Fund may be delayed or limited. At October 31, 2014, the market value of repurchase agreements outstanding was $17,993,138.
i. FOREIGN CURRENCY TRANSLATION
The books and records of the Fund are maintained in U.S. dollars. The value of investments, assets and liabilities denominated in currencies other than U.S. dollars are translated into U.S. dollars based upon current foreign exchange rates. Purchases and sales of foreign investments, income and expenses are converted into U.S. dollars based on currency exchange rates prevailing on the respective dates of such transactions. Net realized and unrealized gain (loss) on foreign currency transactions represent: (1) foreign exchange gains and losses from the sale and holdings of foreign currencies; (2) gains and losses between trade date and settlement date on investment securities transactions and forward foreign currency exchange contracts; and (3) gains and losses from the difference between amounts of interest and dividends recorded and the amounts actually received.
The Fund does not isolate the net realized and unrealized gain or loss resulting from changes in exchange rates from the fluctuations in market prices of securities held. Such fluctuations are included with the net realized and unrealized gain or loss on investments.
j. FOREIGN SECURITIES
The Fund invests in securities of foreign entities and in instruments denominated in foreign currencies which involve risks not typically associated with investments in domestic securities. Non-domestic securities carry special risks, such as exposure to currency fluctuations, less developed or less efficient trading markets, political instability, a lack of company information, differing auditing and legal standards, and, potentially, less liquidity.
Realized gains in certain countries may be subject to foreign taxes at the Fund level, at rates ranging from approximately 10% to 15%. The Fund would pay such foreign taxes on net realized gains at the appropriate rate for each jurisdiction.
k. SECURITIES TRANSACTED ON A WHEN ISSUED BASIS
The Fund may enter into To Be Announced (“TBA”) sale commitments to hedge its portfolio positions or to sell mortgage-backed securities it owns under delayed delivery arrangements. Proceeds of TBA sale commitments are not received until the contractual settlement date. During the time a TBA sale commitment is outstanding, equivalent deliverable securities, or an offsetting TBA purchase commitment deliverable on or before the sale commitment date, are held as “cover” for the transaction. Unsettled TBA sale commitments are valued at the current market value of the underlying securities according to the procedures described under “Valuation of Investments,” in footnote 1a above. Each contract is marked-to market daily and the change in market value is recorded by the Fund as an unrealized gain or loss. If the TBA sale commitment is closed through the acquisition of an offsetting purchase commitment, the Fund realizes a gain or loss. If the Fund delivers securities under the commitment, the Fund realizes a gain or a loss from the sale of the securities based upon the unit price established at the date the commitment was entered into.
Notes to Financial Statements (continued)
2. AGREEMENTS AND TRANSACTIONS WITH AFFILIATES
The Trust has entered into an investment advisory agreement under which the Investment Manager, a subsidiary and the U.S. retail distribution arm of Affiliated Managers Group, Inc. (“AMG”), serves as investment manager to the Fund and is responsible for the Fund’s overall administration and operations. The Investment Manager selects one or more subadvisors for the Fund (subject to Board approval) and monitors each subadvisor’s investment performance, security holdings and investment strategies. The Fund’s investment portfolio is managed by one or more portfolio managers who serves pursuant to a subadvisory agreement with the Investment Manager.
Investment management fees are paid directly by the Fund to the Investment Manager based on average daily net assets. For the fiscal year ended October 31, 2014, the Fund paid an investment management fee at the annual rate of 0.40% of the average daily net assets of the Fund.
The Investment Manager has contractually agreed, through at least March 1, 2015, to waive management fees (but not below zero) and/or reimburse Fund expenses in order to limit total annual Fund operating expenses after fee waiver and expense reimbursements (exclusive of taxes, interest (including interest incurred in connection with bank and custody overdrafts), brokerage commissions and other transaction costs, acquired fund fees and expenses, and extraordinary expenses) to 0.58% of the Fund’s average daily net assets subject to later reimbursement by the Fund in certain circumstances. The contractual expense limitation may only be terminated in the event the Investment Manager or a successor ceases to be the investment manager of the Fund or a successor fund, by mutual agreement of the Investment Manager and the AMG Funds’ Board of Trustees, or in the event of the Fund’s liquidation unless the Fund is reorganized or is a party to a merger in which the surviving entity is successor to the accounting and performance information of the Fund.
The Fund is obligated to repay the Investment Manager such amounts waived, paid or reimbursed in future years provided that the repayment occurs within thirty-six (36) months after the waiver or reimbursement and that such repayment would not cause the Fund’s total annual operating expenses after fee waiver and expense reimbursements in any such future year to exceed the Fund’s contractual expense limitation amount. For the fiscal year ended October 31, 2014, the Fund’s components of reimbursement available are detailed in the following chart:
| | | | |
Reimbursement Available - 10/31/13 | | $ | 4,459,436 | |
Additional Reimbursements | | | 1,124,267 | |
Repayments | | | — | |
Expired Reimbursements | | | (1,586,734 | ) |
| | | | |
Reimbursement Available - 10/31/14 | | $ | 3,996,969 | |
| | | | |
The Fund has entered into an Administration and Shareholder Servicing Agreement under which the Investment Manager serves as the Fund’s administrator (the “Administrator”) and is responsible for all aspects of managing the Fund’s operations, including administration and shareholder services to the Fund, its shareholders, and certain institutions, such as bank trust departments, broker-dealers and registered investment advisers, that
advise or act as an intermediary with the Fund’s shareholders. The Fund pays a fee to the Administrator at the rate of 0.20% per annum of the Fund’s average daily net assets for this service.
The aggregate annual retainer paid to each Independent Trustee of the Board is $130,000, plus $7,000 or $2,500 for each regular or special meeting attended, respectively. The Independent Chairman of the Trusts receives an additional payment of $35,000 per year. The Chairman of the Audit Committee receives an additional payment of $15,000 per year. The Trustees’ fees and expenses are allocated among all of the Funds in the Trusts for which the Investment Manager serves as the advisor based on the relative net assets of such Funds. The “Trustees fees and expenses” shown in the financial statements represents each Fund’s allocated portion of the total fees and expenses paid by the AMG Funds family of mutual funds (“AMG Funds family”).
Prior to January 1, 2014, the aggregate annual retainer paid to each Independent Trustee of the Board was $105,000, plus $6,000 or $2,500 for each regular or special meeting attended, respectively. The Independent Chairman of the Trusts formerly received an additional payment of $25,000 per year. The Chairman of the Audit Committee formerly received an additional payment of $10,000 per year.
Prior to January 1, 2013, the aggregate annual retainer paid to each Independent Trustee of the Board was $80,000, plus $5,000 or $2,500 for each regular or special meeting attended, respectively. The Independent Chairman of the Trusts formerly received an additional payment of $20,000 per year. The Chairman of the Audit Committee formerly received an additional payment of $8,000 per year.
The Fund is distributed by AMG Distributors, Inc. (formerly Managers Distributors, Inc.) (the “Distributor”), a wholly-owned subsidiary of the Investment Manager. The Distributor serves as the distributor and underwriter for the Fund and is a registered broker-dealer and member of the Financial Industry Regulatory Authority, Inc. (“FINRA”). Shares of the Fund will be continuously offered and will be sold directly to prospective purchasers and through brokers, dealers or other financial intermediaries who have executed selling agreements with the Distributor. Subject to the compensation arrangement discussed below, generally the Distributor bears all or a portion of the expenses of providing services pursuant to the distribution agreement, including the payment of the expenses relating to the distribution of prospectuses for sales purposes and any advertising or sales literature. Certain Trustees and Officers of the Fund are Officers and/or Directors of the Investment Manager, AMG and/or the Distributor.
The Securities and Exchange Commission granted an exemptive order that permits the Fund to lend and borrow money for certain temporary purposes directly to and from other eligible Funds in the AMG Funds family. Participation in this interfund lending program is voluntary for both the borrowing and lending Funds, and an interfund loan is only made if it benefits each participating Fund. The Investment Manager administers the program according to procedures approved by the Board, and the Board monitors the operation of the program. An interfund loan must comply with certain conditions set out in the exemptive order, which are designed to assure fairness and protect all participating Funds. For the fiscal year ended October 31, 2014, the Fund neither borrowed or lent to other Funds in the AMG Funds family.
Notes to Financial Statements (continued)
3. PURCHASES AND SALES OF SECURITIES
Purchases and sales of securities (excluding short-term securities and U.S. Government obligations) for the fiscal year ended October 31, 2014, were $631,663,860 and $337,794,367, respectively. Purchases and sales of U.S. Government obligations for the fiscal year ended October 31, 2014, were $1,374,488,351 and $1,946,748,944, respectively.
4. PORTFOLIO SECURITIES LOANED
The Fund participates in a securities lending program offered by BNYM (the “Program”), providing for the lending of securities to qualified brokers. Securities lending income includes earnings of such temporary cash investments, plus or minus any rebate to a borrower. These earnings (after any rebate) are then divided between BNYM, as a fee for its services under the program, and the Fund, according to agreed-upon rates. Collateral on all securities loaned is accepted in cash and is maintained at a minimum level of 102% (105% in the case of certain foreign securities) of the market value, plus interest, if applicable, of investments on loan. It is the Fund’s policy to obtain additional collateral from or return excess collateral to the borrower by the end of the next business day, following the valuation date of the securities loaned. Therefore, the value of the collateral held may be temporarily less than the value of the securities on loan. Lending securities entails a risk of loss to the Fund if and to the extent that the market value of the securities loaned were to increase and the borrower did not increase the collateral accordingly, and the borrower fails to return the securities. Under the terms of the Program, the Fund is indemnified for such losses by BNYM. Cash collateral is held in a separate account managed by BNYM, who is authorized to exclusively enter into overnight government repurchase agreements. BNYM bears the risk of any deficiency in the amount of the cash collateral available for return to the borrower due to any loss on the collateral invested. At October 31, 2014, the value of the securities loaned was $9,403,611 and the cash collateral received was $9,693,138.
5. COMMITMENTS AND CONTINGENCIES
Under the Trust’s organizational documents, its trustees and officers are indemnified against certain liabilities arising out of the performance of their duties to the Trust. In addition, in the normal course of business, the Fund may enter into contracts and agreements that contain a variety of representations and warranties, which provide general indemnifications. The maximum exposure to the Fund under these arrangements is unknown, as this would involve future claims that may be made against a Fund that have not yet occurred. However, based on experience, the Fund had no prior claims or losses and expects the risks of loss to be remote.
6. FORWARD COMMITMENTS
Certain transactions, such as futures and forward transactions, dollar roll agreements, or purchases of when-issued or delayed delivery securities may have a similar effect on the Fund’s net asset value as if the Fund had created a degree of leverage in its portfolio. However, if the Fund enters into such a transaction, the Fund will establish a segregated account with its custodian in which it will maintain cash, U.S. government securities or other liquid securities equal in value to its obligations in respect to such transaction. Securities and
other assets held in the segregated account may not be sold while the transaction is outstanding, unless other suitable assets are substituted.
7. DERIVATIVE INSTRUMENTS
The following disclosures contain information on how and why the Fund uses derivative instruments, the credit risk and how derivative instruments affect the Fund’s financial position, results of operations and cash flows. The location and fair value amounts of these instruments on the Statement of Assets and Liabilities and the realized and changes in unrealized gains and losses on the Statement of Operations, each categorized by type of derivative contract, are included in a table in the Notes to the Schedule of Portfolio Investments. For the fiscal year ended October 31, 2014, the average quarterly balances of derivative financial instruments outstanding were as follows:
| | | | |
Financial futures contracts: | | | | |
Average number of contracts purchased | | | 6,169 | |
Average number of contracts sold | | | 72 | |
Average notional value of contracts purchased | | $ | 1,200,771,140 | |
Average notional value of contracts sold | | $ | 13,692,237 | |
Foreign currency exchange contracts: | | | | |
Average US dollar amounts purchased/sold | | $ | 369,957,165 | |
Options: | | | | |
Average notional value of option contracts written | | $ | 146,055 | |
Average notional value of swaption written | | $ | 233,300,000 | |
Credit default swaps: | | | | |
Average notional value - sell protection | | $ | 105,901,021 | |
Interest rate swaps: | | | | |
Average notional value - pays fixed rate | | $ | 1,294,500,000 | |
Average notional value - receives fixed rate | | $ | 364,540,000 | |
8. FORWARD FOREIGN CURRENCY CONTRACTS
During the fiscal year ended October 31, 2014, the Fund invested in forward foreign currency contracts to facilitate transactions in foreign securities and to hedge against foreign currency exchange rate risk on its non-U.S. dollar denominated investment securities.
A forward foreign currency contract is an agreement between a fund and another party to buy or sell a currency at a set price at a future date. The market value of the contract will fluctuate with changes in currency exchange rates. The contract is marked-to-market daily, and the change in market value is recorded as an unrealized gain or loss. Gain or loss on the purchase or sale of contracts having the same settlement date, amount and counterparty is realized on the date of offset, otherwise gain or loss is realized on the settlement date. Risks may arise upon entering into these contracts from the potential inability of counterparties to meet the terms of their contracts and from unanticipated movements in the value of a foreign currency relative to the U.S. dollar.
9. FUTURES CONTRACTS
The Fund entered into futures contracts to achieve a desired level of investment, whether to accommodate portfolio turnover or cash flows from capital shares transactions. There are certain risks associated with futures contracts. Prices may not move as expected or the Fund may not be able to close out the contract when it desires to do so, resulting in losses.
Notes to Financial Statements (continued)
On entering into a futures contract, either cash or securities in an amount equal to a certain percentage of the contract value (initial margin) must be deposited with the futures broker. Subsequent payments (variation margin) are made or received each day. The variation margin payments equal the daily changes in the contract value and are recorded as unrealized gains or losses. For over-the-counter (“OTC”) futures, daily variation margin is not required. The Fund recognizes a realized gain or loss when the contract is closed or expires equal to the difference between the value of the contract at the time it was opened and the value at the time it was closed. Futures are valued at their quoted daily settlement prices. The aggregate principal amounts of the contracts are not recorded in the financial statements. Fluctuations in the value of the contracts are recorded in the Statement of Assets and Liabilities as an asset (liability) and in the Statement of Operations as unrealized appreciation (depreciation) until the contracts are closed, when they are recorded as realized gains (losses) on futures contracts.
10. INTEREST RATE CAPS AND FLOORS, SWAP CONTRACTS AND OPTIONS
For the fiscal year ended October 31, 2014, the Fund entered into over-the-counter transactions involving interest rate caps and floors, swap contracts, or purchased and written (sold) options, in order to manage its exposure to credit, currency, equity, interest rate and inflation risk.
In interest rate caps and floor agreements, one party agrees to make payments only when interest rates exceed a specified rate or “cap” or fall below a specified rate or “floor,” usually in return for payment of a fee by the other party. Interest rate caps and floors entitle the purchaser, to the extent that a specified index exceeds or falls below a predetermined interest rate, to receive payments of interest on a notional principal amount from the party selling such interest rate caps or floors.
Swap contracts represent an agreement between counterparties to exchange cash flows based on the difference between two rates applied to a notional principal amount for a specified period. The most common type of interest rate swap involves the exchange of fixed-rate cash flows for variable-rate cash flows. Swaps ordinarily do not involve the exchange of principal between the parties. Purchased options on swap contracts (“swaptions”) give the holder the right, but not the obligation, to enter into a swap contract with the counterparty which has written the option on a date, at an interest rate, and with a notional amount as specified in the swaption agreement. If the counterparty to the swap transaction defaults, the Fund will be limited to contractual remedies pursuant to the agreements governing the transaction. There is no assurance that swap or swaption contract counterparties will be able to meet their obligations under the contracts or that, in the event of default, the Fund will succeed in pursuing contractual remedies. The Fund may thus assume the risk that payments owed to the Fund under a swap or swaption contract will be delayed, or not received at all. During the term of the swap agreement or swaption, unrealized gains or losses are recorded as a result of “marking to market.” When the swap agreement or swaption is terminated, the Fund will record a realized gain or loss equal to the difference between the proceeds from (or cost of) the closing transaction and the Fund’s basis in the contract, if any. Accrued interest and interest paid are recognized as unrealized and realized gain (loss), respectively. In each of the contracts, the Fund pays a premium to the counterparty in return for the swaption. These swaptions may be exercised by entering into a swap
contract with the counterparty only on the date specified in each contract. The Fund also sold credit protection through credit default swaps. Under the terms of the swaps, the seller of the credit protection receives a periodic payment amount (premium) from the buyer that is a fixed percentage amount applied to a notional principal amount. In return, the seller agrees to pay the buyer the notional amount and take delivery of a debt instrument of the reference issuer of the same notional par amount if the reference entity is subject to a credit event (such as bankruptcy, failure to pay, or obligation acceleration) during the term of the swap.
Centrally cleared swaps listed or traded on a multilateral or trade facility platform, such as a registered exchange, are valued at the daily settlement price determined by the respective exchange. For centrally cleared credit default swaps the clearing facility requires its members to provide actionable levels across complete term structures. Daily changes in valuation of centrally cleared swaps, if any, are recorded as a receivable or payable for the change in value as appropriate (“variation margin”) in the Statement of Assets and Liabilities.
A written option contract is a contract in which the writer of the option grants the buyer of the option the right to purchase from (call option) or sell to (put option) the writer a designated instrument at a specified price within a specified period of time. Options written (sold) are recorded as liabilities. The Fund, as writer of written options, bears the risk of an unfavorable change in the market value of the instrument underlying the written option. When an option expires, the premium (original option value) is realized as a gain if the option was written or as a loss if the option was purchased. When the exercise of an option results in a cash settlement, the difference between the premium and the settlement proceeds is recognized as realized gain or loss. When securities are acquired or delivered upon exercise of an option, the acquisition cost or sale proceeds are adjusted by the amount of the premium. When an option is closed, the difference between the premium and the cost to close the position is realized as a gain or loss.
11. RISKS ASSOCIATED WITH COLLATERALIZED MORTGAGE OBLIGATIONS (“CMOS”)
The net asset value of the Fund may be sensitive to interest rate fluctuations because the Fund may hold several instruments, including CMOs and other derivatives, whose values can be significantly impacted by interest rate movements. CMOs are obligations collateralized by a portfolio of mortgages or mortgage-related securities. Payments of principal and interest on the mortgages are passed through to the holder of the CMOs on the same schedule as they are received, although certain classes of CMOs have priority over others with respect to the receipt of prepayments on the mortgages. Therefore, the investment in CMOs may be subject to a greater or lesser risk of prepayment than other types of mortgage-related securities. CMOs are subject to principal paydowns as a result of prepayment or refinancing of the underlying mortgage instruments. As a result, the average life may be substantially less than the original maturity. CMOs may have a fixed or variable rate of interest.
12. DOLLAR ROLL AGREEMENTS
For fiscal year ended October 31, 2014, the Fund entered into dollar rolls in which it sells debt securities for delivery currently and simultaneously contract to repurchase similar, but not identical, securities at the same price or a lower price on an agreed date. The Fund receives compensation as consideration for
Notes to Financial Statements (continued)
entering into the commitment to repurchase. The compensation is the difference between the current sale price and the forward price for the future purchase (often referred to as the “drop”) as well as by the interest earned on the cash proceeds of the initial sale. The Fund may also be compensated by the receipt of a commitment fee. As the holder, the counterparty receives all principal and interest payments, including prepayments, made with respect to the similar security sold. Dollar rolls may be renewed with a new sale and repurchase price with a cash settlement made at renewal without physical delivery of the securities subject to the contract.
Certain risks may arise upon entering into dollar rolls from the potential inability of counterparties to meet the terms of their commitments. Additionally, the value of such securities may change adversely before the Fund is able to repurchase them. There can be no assurance that the Fund’s use of the cash that it receives from a dollar roll will provide a return that exceeds its cost.
13. MARKET, CREDIT AND COUNTERPARTY RISKS
In the normal course of business, the Fund invests in securities and enters into transactions where risks exist due to market fluctuations and are exposed to credit risk with parties with whom it trades (issuers or counterparties). Market prices of investments held by the Fund may fall rapidly or unpredictably and will rise and fall due to changing economic, political, or market conditions or in response to events that affect particular industries or companies. The Fund may be exposed to credit or counterparty risk, or the risk that an institution or other entity with which the Fund has unsettled or open transactions will default or not perform under the contract. The Fund minimizes credit risk and counterparty risk by undertaking transactions with a large number of customers and counterparties on recognized and reputable exchanges. The Fund could lose money if the issuer or guarantor of a fixed income security, or the counterparty to a financial derivatives contract, repurchase agreement or a loan of portfolio securities, is unable or unwilling to make timely principal and/or interest payments, or to otherwise honor its obligations.
The Fund is subject to various Master Agreements, which govern the terms of certain transactions with select counterparties. These Master Agreements
reduce the counterparty risk associated with relevant transactions by specifying credit protection mechanisms and providing standardization that improves legal certainty. Master Agreements can also help limit counterparty risk by specifying collateral posting arrangements at pre-arranged exposure levels. Under the Master Agreements, collateral is routinely transferred if the total net exposure to certain transactions (net of existing collateral already in place) governed under the relevant master agreement with a counterparty in a given account exceeds a specified threshold, which typically ranges from zero to $250,000 depending on the counterparty and the type of Master Agreement.
International Swaps and Derivatives Association, Inc. Master Agreements (“ISDA Master Agreements”) govern OTC financial derivative transactions entered into by the Fund and the respective counterparty. The ISDA Master Agreements maintain provisions for general obligations, representations, agreements, collateral and events of default or termination. Certain ISDA Master Agreements allow counterparties to OTC derivatives to terminate derivative contracts prior to maturity in the event the Fund’s net assets decline by a stated percentage or the Fund fails to meet the terms of the ISDA Master Agreement, which requires accelerated settlement of all outstanding transactions under the applicable ISDA Master Agreement. Any election to early terminate could be material to the financial statements.
14. MASTER NETTING AGREEMENT
The Fund may enter into master netting agreements with its counterparties for the securities lending program, repurchase agreements and derivative instruments, which provide the right, in the event of default (including bankruptcy or insolvency) for the non-defaulting party to liquidate the collateral and calculate net exposure to the defaulting party or request additional collateral. For financial reporting purposes, the Fund does not offset financial assets and financial liabilities that are subject to master netting agreements in the Statement of Assets and Liabilities. For securities lending transactions, see Note 4.
46
Notes to Financial Statements (continued)
The following tables are a summary of the Fund’s open repurchase agreements and derivative instruments that are subject to a master netting agreement as of October 31, 2014:
| | | | | | | | | | | | | | | | |
| | | Net Amounts of | | | | | | | | | | |
| | | Assets Presented | | | | | | | |
| | | in the Statement of Assets and | | | Gross Amount Not Offset in the
Statement of Assets and Liabilities | | | | |
| | | Liabilities | | | Financial Instruments | | | Cash Collateral Received | | | Net Amount | |
Bank of America | | $ | 242 | | | $ | 242 | | | | — | | | | — | |
Barclays Bank PLC | | | 2,743,062 | | | | 2,743,062 | | | | — | | | | — | |
Cantor Fitzgerald Securities, Inc. | | | 2,302,143 | | | | 2,302,143 | | | | — | | | | — | |
Citigroup Global Markets, Inc. | | | 16,068,399 | | | | 9,944,868 | | | $ | 4,500,000 | | | $ | 1,623,531 | |
Credit Suisse | | | 58,307 | | | | 32,312 | | | | 25,995 | | | | — | |
Daiwa Capital Markets America | | | 2,302,143 | | | | 2,302,143 | | | | — | | | | — | |
Deutsche Bank AG | | | 1,192,490 | | | | 702,124 | | | | 280,000 | | | | 210,366 | |
Goldman Sachs & Co. | | | 7,547,179 | | | | 2,703,829 | | | | 3,990,000 | | | | 853,350 | |
HSBC Bank | | | 493,670 | | | | 320,060 | | | | — | | | | 173,610 | |
JPMorgan Chase & Co. | | | 2,681,611 | | | | 1,144,878 | | | | 470,000 | | | | 1,066,733 | |
Morgan Stanley | | | 441,717 | | | | 441,717 | | | | — | | | | — | |
Nomura Securities International, Inc. | | | 2,302,143 | | | | 2,302,143 | | | | — | | | | — | |
Royal Bank of Scotland Group PLC | | | 4,227 | | | | — | | | | 4,227 | | | | — | |
State of Wisconsin Investment Board | | | 2,302,143 | | | | 2,302,143 | | | | — | | | | — | |
UBS Warburg LLC | | | 1,801,155 | | | | 797,899 | | | | 600,000 | | | | 403,256 | |
| | | | | | | | | | | | | | | | |
Total | | $ | 42,240,631 | | | $ | 28,039,563 | | | $ | 9,870,222 | | | $ | 4,330,846 | |
| | | | | | | | | | | | | | | | |
| | | | | | | | | | | | | | | | |
| | | Net Amounts of | | | | |
| | | Liabilities Presented in the Statement | | | Gross Amount Not Offset In the
Statement of Assets and Liabilities | | | | |
| | | of Assets and | | | Financial | | | | | | | |
| | | Liabilities | | | Instruments | | | Cash Collateral Pledged | | | Net Amount | |
Bank of America | | $ | 26,254 | | | $ | 242 | | | | — | | | $ | 26,012 | |
Barclays Bank PLC | | | 5,873,323 | | | | 2,971,670 | | | $ | 52,000 | | | | 2,849,653 | |
Citigroup Global Markets, Inc. | | | 1,160,302 | | | | 1,160,302 | | | | — | | | | — | |
Credit Suisse | | | 32,312 | | | | 32,312 | | | | — | | | | — | |
Deutsche Bank AG | | | 702,124 | | | | 702,124 | | | | — | | | | — | |
Goldman Sachs & Co. | | | 2,703,829 | | | | 2,703,829 | | | | — | | | | — | |
HSBC Bank | | | 320,060 | | | | 320,060 | | | | — | | | | — | |
JPMorgan Chase & Co. | | | 1,144,878 | | | | 1,144,878 | | | | — | | | | — | |
Morgan Stanley | | | 944,406 | | | | 944,406 | | | | — | | | | — | |
UBS Warburg LLC | | | 797,899 | | | | 797,899 | | | | — | | | | — | |
| | | | | | | | | | | | | | | | |
Total | | $ | 13,705,387 | | | $ | 10,777,722 | | | $ | 52,000 | | | $ | 2,875,665 | |
| | | | | | | | | | | | | | | | |
47
Notes to Financial Statements (continued)
15. SUBSEQUENT EVENTS
The Fund has determined that no material events or transactions occurred through the issuance date of the Fund’s financial statements which require additional disclosure in or adjustment of the Fund’s financial statements.
Tax Information (unaudited)
The AMG Managers Total Return Bond Fund hereby designates the maximum amount allowable of its net taxable income as qualified dividends as provided in the Jobs and Growth Tax Relief Reconciliation Act of 2003. The 2013/2014 Form 1099-DIV you receive for each Fund will show the tax status of all distributions paid to you during the year.
Pursuant to section 852 of the Internal Revenue Code, AMG Managers Total Return Bond Fund hereby designates $8,894,260, as a capital gain distribution with respect to the taxable year ended October 31, 2014, or if subsequently determined to be different, the net capital gains of such year.
48
Report of Independent Registered Public Accounting Firm
TO THE BOARD OF TRUSTEES OF AMG FUNDS I AND THE SHAREHOLDERS OF AMG MANAGERS TOTAL RETURN BOND FUND:
In our opinion, the accompanying statement of assets and liabilities, including the schedule of portfolio investments, and the related statements of operations and of changes in net assets and the financial highlights present fairly, in all material respects, the financial position of AMG Managers Total Return Bond Fund (formerly, Managers PIMCO Bond Fund) (the “Fund”) at October 31, 2014, and the results of its operations, the changes in its net assets and the financial highlights for each of the periods indicated, in conformity with accounting principles generally accepted in the United States of America. These financial statements and financial highlights (hereafter referred to as “financial statements”) are the responsibility of the Fund’s management. Our responsibility is to express an opinion on these financial statements based on our audits. We conducted our audits of these financial statements in accordance with the standards of the Public Company Accounting Oversight Board (United States). Those standards require that we plan and perform the audit to obtain reasonable assurance about whether the financial statements are free of material misstatement. An audit includes examining, on a test basis, evidence supporting the amounts and disclosures in the financial statements, assessing the accounting principles used and significant estimates made by management, and evaluating the overall financial statement presentation. We believe that our audits, which included confirmation of securities at October 31, 2014 by correspondence with the custodian, brokers and the application of alternative auditing procedures provide a reasonable basis for our opinion.
PricewaterhouseCoopers LLP
Boston, Massachusetts
December 29, 2014
49
AMG Funds
Trustees and Officers
The Trustees and Officers of the Trust, their business addresses, principal occupations for the past five years and dates of birth are listed below. The Trustees provide broad supervision over the affairs of the Trust and the Funds. The Trustees are experienced executives who meet periodically throughout the year to oversee the Funds’ activities, review contractual arrangements with
companies that provide services to the Funds, and review the Funds’ performance. Unless otherwise noted, the address of each Trustee or Officer is the address of the Trust: 800 Connecticut Avenue, Norwalk, Connecticut 06854.
There is no stated term of office for Trustees. Trustees serve until their resignation, retirement or removal in accordance with the Trust’s
organizational documents and policies adopted by the Board from time to time. The Chairman of the Trustees, President, Treasurer and Secretary of the Trust are elected by the Trustees annually. Other officers hold office at the pleasure of the Trustees.
Independent Trustees
The following Trustees are not “interested persons” of the Trust within the meaning of the 1940 Act:
| | |
| Number of Funds | | |
Overseen in Fund Complex | | Name, Date of Birth, Principal Occupation(s) During Past 5 Years and Other Directorships Held by Trustee |
| |
• Trustee since 2012 | | Bruce B. Bingham, 12/1/48 |
| |
• Oversees 43 Funds in Fund Complex | | Partner, Hamilton Partners (real estate development firm) (1987-Present); Trustee of Aston Funds (25 portfolios) (2014-Present); Director of The Yacktman Funds (2000-2012). |
| |
• Independent Chairman | | William E. Chapman, II, 9/23/41 |
| |
• Trustee since 2000 • Oversees 43 Funds in Fund Complex | | President and Owner, Longboat Retirement Planning Solutions (1998-Present); Hewitt Associates, LLC (part time) (provider of Retirement and Investment Education Seminars) (2002-2009); Trustee Emeritus of Bowdoin College (2013-Present); Trustee of Bowdoin College (2002-2013); Director of Harding, Loevner Funds, Inc. (6 portfolios); Trustee of Third Avenue Trust (5 portfolios); Trustee of Third Avenue Variable Trust (1 portfolio); Trustee of Aston Funds (25 portfolios) (2010-Present). |
| |
• Trustee since 2000 | | Edward J. Kaier, 9/23/45 |
| |
• Oversees 43 Funds in Fund Complex | | Attorney at Law and Partner, Teeters Harvey Marrone & Kaier LLP (2007-Present); Attorney at Law and Partner, Hepburn Willcox Hamilton & Putnam, LLP (1977-2007); Trustee of Third Avenue Trust (5 portfolios); Trustee of Third Avenue Variable Trust (1 portfolio); Trustee of Aston Funds (25 portfolios) (2010-Present). |
| |
• Trustee since 2013 | | Kurt A. Keilhacker, 10/5/63 |
| |
• Oversees 45 Funds in Fund Complex | | Managing Member, TechFund Capital (1997-Present); Managing Member, TechFund Europe (2000-Present); Trustee, Gordon College (2001-Present); Board Member, 6wind SA, (2002-Present); Managing Member, Clapham Partners I, LLC (2013-Present); Trustee of Aston Funds (25 portfolios) (2014-Present). |
| |
• Trustee since 2000 | | Steven J. Paggioli, 4/3/50 |
| |
• Oversees 43 Funds in Fund Complex | | Independent Consultant (2002-Present); Formerly Executive Vice President and Director, The Wadsworth Group (1986-2001); Executive Vice President, Secretary and Director, Investment Company Administration, LLC (1990-2001); Vice President, Secretary and Director, First Fund Distributors, Inc. (1991-2001); Trustee, Professionally Managed Portfolios (45 portfolios); Advisory Board Member, Sustainable Growth Advisors, LP; Independent Director, Chase Investment Counsel (2008 – Present); Trustee of Aston Funds (25 portfolios) (2010-Present). |
| |
• Trustee since 2013 | | Richard F. Powers III, 2/2/46 |
| |
• Oversees 43 Funds in Fund Complex | | Adjunct Professor, Boston College (2011-Present); Trustee of Aston Funds (25 portfolios) (2014-Present); Director of Ameriprise Financial Inc. (2005-2009); President and CEO of Van Kampen Investments Inc. (1998-2003). |
| |
• Trustee since 2000 | | Eric Rakowski, 6/5/58 |
| |
• Oversees 45 Funds in Fund Complex | | Professor, University of California at Berkeley School of Law (1990-Present); Director of Harding, Loevner Funds, Inc. (6 portfolios); Trustee of Third Avenue Trust (5 portfolios); Trustee of Third Avenue Variable Trust (1 portfolio); Trustee of Aston Funds (25 portfolios) (2010-Present). |
| |
• Trustee since 2013 | | Victoria L. Sassine, 8/11/65 |
| |
• Oversees 45 Funds in Fund Complex | | Lecturer, Babson College (2007 – Present); Trustee of Aston Funds (25 portfolios) (2014-Present). |
| |
• Trustee since 2000 | | Thomas R. Schneeweis, 5/10/47 |
| |
• Oversees 43 Funds in Fund Complex | | Professor Emeritus, University of Massachusetts (2013 - Present); Partner, S Capital Management, LLC (2007-Present); President, TRS Associates (1982-Present); Director, CISDM at the University of Massachusetts, (1996-2013); President, Alternative Investment Analytics, LLC, (formerly Schneeweis Partners, LLC) (2001-2013); Professor of Finance, University of Massachusetts (1977-2013); Partner, White Bear Partners, LLC (2007-2010); Partner, Northampton Capital Management, LLC (2004-2010); Trustee of Aston Funds (25 portfolios) (2010-Present). |
50
AMG Funds
Trustees and Officers (continued)
Interested Trustees
Each Trustee in the following table is an “interested person” of the Trust within the meaning of the 1940 Act. Ms. Carsman is an interested person of the Trust within the meaning of the 1940 Act by virtue of her position with, and interest in securities of, AMG, and her former position as Chief Legal Officer of the Trust.
| | |
| Number of Funds | | |
Overseen in Fund Complex | | Name, Date of Birth, Principal Occupation(s) During Past 5 Years and Other Directorships Held by Trustee |
| |
• Trustee since 2011 | | Christine C. Carsman, 4/2/52 |
| |
• Oversees 45 Funds in Fund Complex | | Senior Vice President and Deputy General Counsel, Affiliated Managers Group, Inc. (2011-Present); Trustee of Aston Funds (25 portfolios) (2014-Present); Senior Vice President and Chief Regulatory Counsel, Affiliated Managers Group, Inc. (2007-2011); Vice President and Chief Regulatory Counsel, Affiliated Managers Group, Inc. (2004-2007); Secretary and Chief Legal Officer, AMG Funds, AMG Funds I, AMG Funds II and AMG Funds III (2004-2011); Senior Counsel, Vice President and Director of Operational Risk Management and Compliance, Wellington Management Company, LLP (1995-2004). |
Officers
| | |
| Position(s) Held with Fund | | |
and Length of Time Served | | Name, Date of Birth, Principal Occupation(s) During Past 5 Years |
| |
• President since 2014 | | Jeffrey T. Cerutti, 2/7/68 |
| |
• Principal Executive Officer since 2014 | | Chief Executive Officer, AMG Funds LLC (2014-Present); Director, President and Principal, AMG Distributors, Inc. (2014-Present); President and Principal Executive Officer, AMG Pantheon Private Equity Fund, LLC and AMG Pantheon Private Equity Master Fund, LLC (2014-Present); President, VP Distributors, (2011-2014); Executive Vice President, Head of Distribution, Virtus Investment Partners, Inc. (2010-2014); Managing Director, Head of Sales, UBS Global Asset Management (2001-2010). |
| |
• Chief Operating Officer since 2007 | | Keitha L. Kinne, 5/16/58 Chief Operating Officer, AMG Funds LLC (2007-Present); Chief Investment Officer, AMG Funds LLC (2008-Present); Chief Operating Officer, AMG Distributors, Inc. (2007-Present); Chief Operating Officer, AMG Pantheon Private Equity Fund, LLC and AMG Pantheon Private Equity Master Fund, LLC (2014-Present); Managing Partner, AMG Funds LLC (2007-2014); President, AMG Funds (2012-2014); President, AMG Distributors, Inc. (2012-2014); Managing Director, Legg Mason & Co., LLC (2006-2007); Managing Director, Citigroup Asset Management (2004-2006). |
| |
• Secretary since 2011 • Chief Legal Officer since 2011 | | Lewis Collins, 2/22/66 Senior Vice President and Senior Counsel, Affiliated Managers Group, Inc. (2010-Present); Secretary, AMG Pantheon Private Equity Fund, LLC and AMG Pantheon Private Equity Master Fund, LLC (2014-Present); Vice President and Senior Counsel, Affiliated Managers Group, Inc. (2006-2010); Senior Counsel, Affiliated Managers Group, Inc. (2002-2006); Attorney, Ropes & Gray LLP (1998-2002). |
| |
• Chief Financial Officer since 2007 • Treasurer since 1999 • Principal Financial Officer since 1999 | | Donald S. Rumery, 5/29/58 Senior Vice President, AMG Funds LLC (2005-Present); Treasurer, AMG Funds III (1995-Present); Treasurer, AMG Funds (1999-Present); Treasurer, AMG Funds II (2000-Present); Chief Financial Officer, AMG Funds III, AMG Funds and AMG Funds II (2007-Present); Treasurer, Principal Financial Officer and Principal Accounting Officer, AMG Pantheon Private Equity Fund, LLC and AMG Pantheon Private Equity Master Fund, LLC (2014-Present); Treasurer and Chief Financial Officer, AMG Distributors, Inc. (2000-2012); Vice President, AMG Funds LLC, (1994-2004). |
| |
• Assistant Treasurer since 2014 | | John C. Ball, 1/9/76 Vice President, Assistant Treasurer, AMG Funds LLC (2014-Present); Assistant Treasurer, AMG Pantheon Private Equity Fund, LLC and AMG Pantheon Private Equity Master Fund, LLC (2014-Present); Vice President, State Street Corp. (2010-2014); Vice President, State Street International (Ireland) Limited (2007-2010). |
| |
• Chief Compliance Officer since 2010 | | John J. Ferencz, 3/9/62 Vice President, Legal and Compliance, AMG Funds LLC (2010-Present); Senior Compliance Analyst, Mutual Funds and Regulatory, GE Asset Management Incorporated (2005-2010). |
| |
• Assistant Secretary since 2011 | | Michael S. Ponder, 9/12/73 Senior Vice President and Counsel, AMG Funds LLC (2011-Present); Attorney, DeNovo Legal (2009-2010); Vice President, Credit Suisse (2007-2009); Associate, Willkie Farr & Gallagher LLP (2006-2007). |
| |
• Anti-Money Laundering Compliance Officer since 2014 | | Patrick J. Spellman, 3/15/74 Senior Vice President, Chief Compliance Officer, Legal and Compliance, AMG Funds LLC (2011-Present); Chief Compliance Officer, AMG Distributors, Inc., (2010-Present); Anti-Money Laundering Compliance Officer, AMG Pantheon Private Equity Fund, LLC and AMG Pantheon Private Equity Master Fund, LLC (2014-Present); Compliance Manager, Legal and Compliance, Affiliated Managers Group, Inc. (2005-2011). |
51
Annual Renewal of Investment Management and SubAdvisory Agreement
At an in-person meeting held on June 19-20, 2014, the Board of Trustees (the “Board” or the “Trustees”), and separately a majority of the Trustees who are not “interested persons” of the Trust (the “Independent Trustees”), approved the Investment Management Agreement with the Investment Manager for AMG Managers Total Return Bond Fund (formerly Managers PIMCO Bond Fund) (the “Fund”) and the Subadvisory Agreement for the Subadvisor of the Fund. The Independent Trustees were separately represented by independent legal counsel in connection with their consideration of the approval of these agreements. In considering the Investment Management and Subadvisory Agreements, the Trustees reviewed a variety of materials relating to the Fund, the Investment Manager and the Subadvisor, including comparative performance, fee and expense information for an appropriate peer group of similar mutual funds (the “Peer Group”), performance information for the relevant benchmark index (the “Fund Benchmark”) and, with respect to the Subadvisor, comparative performance information for an appropriate peer group of managed accounts, and, as to all other matters, other information provided to them on a periodic basis throughout the year, as well as information provided in connection with the meetings of June 19-20, 2014, regarding the nature, extent and quality of services provided by the Investment Manager and the Subadvisor under their respective agreements. Prior to voting, the Independent Trustees: (a) reviewed the foregoing information with their independent legal counsel and with management; (b) received materials from their independent legal counsel discussing the legal standards applicable to their consideration of the Investment Management Agreement and the Subadvisory Agreement; and (c) met with their independent legal counsel in private sessions at which no representatives of management were present.
NATURE, EXTENT, AND QUALITY OF SERVICES.
In considering the nature, extent and quality of the services provided by the Investment Manager, the Trustees reviewed information relating to the Investment Manager’s operations and personnel. Among other things, the Investment Manager
provided financial information, biographical information on its supervisory and professional staff and descriptions of its organizational and management structure. The Trustees also took into account information provided periodically throughout the previous year by the Investment Manager in Board meetings relating to the performance of the Investment Manager’s duties with respect to the Fund and the Trustees’ knowledge of the Investment Manager’s management and the quality of the performance of the Investment Manager’s duties. In the course of their deliberations regarding the Investment Management Agreement, the Trustees evaluated, among other things: (a) the extent and quality of the Investment Manager’s oversight of the operation and management of the Fund; (b) the quality of the search, selection and monitoring services performed by the Investment Manager in overseeing the portfolio management responsibilities of the Subadvisor; (c) the Investment Manager’s ability to supervise the Fund’s other service providers; and (d) the Investment Manager’s compliance program. The Trustees also took into account that, in performing its functions under the Investment Management Agreement and supervising the Subadvisor, the Investment Manager: performs periodic detailed analysis and reviews of the performance by the Subadvisor of its obligations to the Fund, including without limitation a review of the Subadvisor’s investment performance in respect of the Fund; prepares and presents periodic reports to the Board regarding the investment performance of the Subadvisor and other information regarding the Subadvisor, at such times and in such forms as the Board may reasonably request; reviews and considers any changes in the personnel of the Subadvisor responsible for performing the Subadvisor’s obligations and makes appropriate reports to the Board; reviews and considers any changes in the ownership or senior management of the Subadvisor and makes appropriate reports to the Board; performs periodic in-person or telephonic diligence meetings, including with respect to compliance matters, with representatives of the Subadvisor; assists the Board and management of the Trust in developing and reviewing information with respect to the annual consideration of the Subadvisory
Agreement; prepares recommendations with respect to the continued retention of the Subadvisor or the replacement of the Subadvisor; identifies potential successors to or replacements of the Subadvisor or potential additional subadvisors, performs appropriate due diligence, and develops and presents to the Board a recommendation as to any such successor, replacement, or additional subadvisor; designates and compensates from its own resources such personnel as the Investment Manager may consider necessary or appropriate to the performance of its services; and performs such other review and reporting functions as the Board shall reasonably request consistent with the Investment Management Agreement and applicable law. The Trustees also took into account the financial condition of the Investment Manager with respect to its ability to provide the services required under the Investment Management Agreement and the Investment Manager’s undertaking to maintain a contractual expense limitation for the Fund. The Trustees also considered the Investment Manager’s risk management processes.
The Trustees also reviewed information relating to the Subadvisor’s operations and personnel and the investment philosophy, strategies and techniques (the “Investment Strategy”) used in managing the Fund. Among other things, the Trustees reviewed biographical information on portfolio management and other professional staff, information regarding the Subadvisor’s organizational and management structure and the Subadvisor’s brokerage policies and practices. The Trustees considered specific information provided regarding the experience of the individual at the Subadvisor with portfolio management responsibility for the Fund, including the information set forth in the Fund’s prospectus and statement of additional information. In the course of their deliberations, the Trustees evaluated, among other things: (a) the services rendered by the Subadvisor in the past; (b) the qualifications and experience of the Subadvisor’s personnel; and (c) the Subadvisor’s compliance program. The Trustees also took into account the financial condition of the Subadvisor with respect to its ability to provide the services required under the Subadvisory Agreement. The Trustees also
Annual Renewal of Investment Management and SubAdvisory Agreement (continued)
considered the Subadvisor’s risk management processes.
PERFORMANCE.
As noted above, the Board considered the Fund’s net performance during relevant time periods as compared to the Fund’s Peer Group and Fund Benchmark and considered the Subadvisor’s performance as compared to an appropriate peer group of managed accounts and also considered the gross performance of the Fund as compared to the Subadvisor’s relevant performance composite that utilizes the same investment strategy and approach and noted that the Board reviews on a quarterly basis detailed information about the Fund’s performance results, portfolio composition and Investment Strategies. The Board noted the Investment Manager’s expertise and resources in monitoring the performance, investment style and risk-adjusted performance of the Subadvisor. The Board was mindful of the Investment Manager’s attention to monitoring the Subadvisor’s performance with respect to the Fund and its discussions with management regarding the factors that contributed to the performance of the Fund.
Among other information relating to the Fund’s performance, the Trustees noted that the Fund’s performance for the 1-year, 3-year, 5-year and 10-year periods ended March 31, 2014 was below, below, above and above, respectively, the median performance of the Peer Group and below, above, above and above, respectively, the performance of the Fund Benchmark, the Barclays U.S. Aggregate Bond Index®. The Trustees took into account management’s discussion of the Fund’s performance, including the reasons for the Fund’s more recent underperformance. The Trustees also took into account the fact that the Fund ranked in the second quintile of the Peer Group for the 5-year period and in the top quintile relative to the Peer Group for the 10-year period. The Trustees concluded that the Fund’s overall performance has been satisfactory.
ADVISORY AND SUBADVISORY FEES AND PROFITABILITY.
In considering the reasonableness of the advisory fee charged by the Investment Manager for managing the Fund, the Trustees noted that the
Investment Manager, and not the Fund, is responsible for paying the fees charged by the Fund’s Subadvisor and, therefore, that the fees paid to the Investment Manager cover the cost of providing portfolio management services as well as the cost of providing search, selection and monitoring services in operating a “manager-of-managers” complex of mutual funds. The Trustees also considered the amount of the advisory fee retained by the Investment Manager after payment of the subadvisory fee with respect to the Fund. The Trustees concluded that, in light of the additional high quality supervisory services provided by the Investment Manager and the fact that the subadvisory fees are paid out of the advisory fee, the advisory fee payable by the Fund to the Investment Manager can reasonably be expected to exceed the median advisory fee for the Peer Group, which consists of many funds that do not operate with a manager-of-managers structure. In this regard, the Trustees also noted that the Investment Manager has undertaken to maintain a contractual expense limitation for the Fund.
In considering the reasonableness of the advisory fee payable to the Investment Manager, the Trustees also reviewed information provided by the Investment Manager setting forth all revenues and other benefits, both direct and indirect (including any so-called “fallout benefits” such as reputational value derived from the Investment Manager serving as Investment Manager to the Fund), received by the Investment Manager and its affiliates attributable to managing the Fund and all the mutual funds in the AMG Funds family, the cost of providing such services and the resulting profitability to the Investment Manager and its affiliates from these relationships. The Trustees also noted the current asset levels of the Fund and the willingness of the Investment Manager to waive fees and pay expenses for the Fund from time to time as a means of limiting the total expenses of the Fund. The Trustees also considered management’s discussion of the current asset level of the Fund, and considered the impact on profitability of the current asset level and any future growth of assets of the Fund. The Board took into account management’s discussion of the current advisory fee structure, and, as noted above, the services the Investment Manager
provides in performing its functions under the Investment Management Agreement and supervising the Subadvisor. In this regard, the Trustees noted that, unlike a mutual fund that is managed by a single investment adviser, the Fund operates in a manager-of-managers structure. Based on the foregoing, the Trustees concluded that the profitability to the Investment Manager is reasonable and that the Investment Manager is not realizing material benefits from economies of scale that would warrant adjustments to the advisory fees for the Fund at this time. With respect to economies of scale, the Trustees also noted that as the Fund’s assets increase over time, the Fund may realize other economies of scale to the extent that the increase in assets is proportionally greater than the increase in certain other expenses.
In considering the reasonableness of the fee payable by the Investment Manager to the Subadvisor, the Trustees relied on the ability of the Investment Manager to negotiate the terms of the Subadvisory Agreement at arm’s length as part of the manager-of-managers structure, noting that the Subadvisor is not affiliated with the Investment Manager. In addition, the Trustees considered other potential benefits of the subadvisory relationship to the Subadvisor, including, among others, the indirect benefits that the Subadvisor may receive from the Subadvisor’s relationship with the Fund, including any so-called “fallout benefits” to the Subadvisor, such as reputational value derived from the Subadvisor serving as Subadvisor to the Fund, which, prior to April 28, 2014, bore the Subadvisor’s name. In addition, the Trustees noted that the subadvisory fees are paid by the Investment Manager out of its advisory fee. As a consequence of all of the foregoing, the cost of services to be provided by the Subadvisor and the profitability to the Subadvisor of its relationship with the Fund were not material factors in the Trustees’ deliberations. For similar reasons, the Trustees did not consider potential economies of scale in the management of the Fund by the Subadvisor to be a material factor in their deliberations at this time.
The Trustees noted that the Fund’s advisory fees (which include both the advisory and administration fee) and total expenses (net of applicable expense waivers/reimbursements) as of
Annual Renewal of Investment Management and SubAdvisory Agreement (continued)
March 31, 2014 were higher and lower, respectively, than the average for the Peer Group. The Trustees took into account the fact that the Investment Manager has contractually agreed, through March 1, 2015, to limit the Fund’s net annual operating expenses (subject to certain excluded expenses) to 0.58%. The Trustees also took into account management discussion of the Fund’s expenses. The Trustees concluded that, in light of the nature, extent and quality of the services provided by the Investment Manager and the Subadvisor, the foregoing expense limitation and the considerations noted above with respect to the Subadvisor and the Investment Manager, the Fund’s advisory and subadvisory fees are reasonable.
* * * *
After consideration of the foregoing, the Trustees also reached the following conclusions (in addition to the conclusions discussed above) regarding the Investment Management Agreement and the Subadvisory Agreement: (a) the Investment Manager and the Subadvisor have demonstrated that they possess the capability and resources to perform the duties required of them under the Investment Management Agreement and the Subadvisory Agreement; (b) the Subadvisor’s Investment Strategy is appropriate for pursuing the Fund’s investment objectives; and (c) the Investment Manager and the Subadvisor maintain appropriate compliance programs.
Based on all of the above-mentioned factors and their related conclusions, with no single factor or conclusion being determinative and with each Trustee not necessarily attributing the same weight to each factor, the Trustees concluded that approval of the Investment Management Agreement and the Subadvisory Agreement would be in the best interests of the Fund and its shareholders. Accordingly, on June 19-20, 2014, the Trustees, and separately a majority of the Independent Trustees, voted to approve the Investment Management Agreement and the Subadvisory Agreement for the Fund.
54
THIS PAGE INTENTIONALLY LEFT BLANK
THIS PAGE INTENTIONALLY LEFT BLANK
| | |
 | | AMG Funds |
INVESTMENT MANAGER AND
ADMINISTRATOR
AMG Funds LLC
800 Connecticut Avenue
Norwalk, CT 06854
(800) 835-3879
DISTRIBUTOR
AMG Distributors, Inc.
800 Connecticut Avenue
Norwalk, CT 06854
(800) 835-3879
SUBADVISOR
Pacific Investment Management Co. LLC
840 Newport Center Drive
Newport Beach, CA 92660
CUSTODIAN
The Bank of New York Mellon
2 Hanson Place
Brooklyn, NY 11217
LEGAL COUNSEL
Ropes & Gray LLP
Prudential Tower, 800 Boylston Street
Boston, MA 02199-3600
TRANSFER AGENT
BNY Mellon Investment Servicing (US) Inc.
Attn: AMG Funds
P.O. Box 9769
Providence, RI 02940
(800) 548-4539
FOR MANAGERSCHOICETM ONLY
AMG Funds
c/o BNY Mellon Investment Servicing (US) Inc.
P.O. Box 9847
Providence, Rhode Island 02940-8047
(800) 358-7668
This report is prepared for the Fund’s shareholders. It is authorized for distribution to prospective investors only when preceded or accompanied by an effective prospectus. To receive a free copy of the prospectus or Statement of Additional Information, which includes additional information about Fund Trustees, please contact us by calling 800.835.3879. Distributed by AMG Distributors, Inc., member FINRA.
Current net asset values per share for the Fund are available on the Fund’s website at www.amgfunds.com.
A description of the policies and procedures the Fund uses to vote its proxies is available: (i) without charge, upon request, by calling 800.835.3879, or (ii) on the Securities and Exchange Commission’s (SEC) website at www.sec.gov. For information regarding the Fund’s proxy voting record for the 12-month period ended June 30, call 800.835.3879 or visit the SEC website at www.sec.gov.
The Fund files its complete schedule of portfolio holdings with the SEC for the first and third quarters of each fiscal year on Form N-Q. The Fund’s Forms N-Q are available on the SEC’s website at www.sec.gov. A Fund’s Forms N-Q may be reviewed and copied at the SEC’s Public Reference Room in Washington, DC. Information on the operation of the Public Reference Room may be obtained by calling 1-800-SEC-0330. To review a complete list of the Fund’s portfolio holdings, or to view the most recent quarterly holdings report, semiannual report, or annual report, please visit www.amgfunds.com.
| | |
| | AMG Funds |
AFFILIATE SUBADVISED FUNDS
ALTERNATIVE FUNDS
AMG FQ Global Alternatives
First Quadrant, L.P.
BALANCED FUNDS
AMG Chicago Equity Partners Balanced
Chicago Equity Partners, LLC
AMG FQ Global Risk-Balanced
(formerly Managers AMG FQ Global Essentials)
First Quadrant, L.P.
EQUITY FUNDS
AMG FQ Tax-Managed U.S. Equity
AMG FQ U.S. Equity
First Quadrant, L.P.
AMG Frontier Small Cap Growth
Frontier Capital Management Company, LLC
AMG GW&K Small Cap Core
(formerly GW&K Small Cap Equity)
Gannett Welsh & Kotler, LLC
AMG Renaissance International Equity
AMG Renaissance Large Cap Growth
The Renaissance Group LLC
AMG SouthernSun Small Cap
AMG SouthernSun U.S. Equity
SouthernSun Asset Management, LLC
AMG Systematic Large Cap Value
(formerly Systematic Value)
AMG Systematic Mid Cap Value
Systematic Financial Management, L.P.
AMG TimesSquare All Cap Growth
(formerly Managers AMG TSCM Growth Equity)
AMG TimesSquare International Small Cap
AMG TimesSquare Mid Cap Growth
AMG TimesSquare Small Cap Growth
TimesSquare Capital Management, LLC
AMG Trilogy Emerging Markets Equity
AMG Trilogy Global Equity
AMG Trilogy International Small Cap
Trilogy Global Advisors, L.P.
AMG Yacktman Focused
AMG Yacktman
Yacktman Asset Management LP
FIXED INCOME FUNDS
AMG GW&K Enhanced Core Bond
(formerly Managers GW&K Fixed Income)
AMG GW&K Municipal Bond
AMG GW&K Municipal Enhanced Yield
Gannett Welsh & Kotler, LLC
OPEN-ARCHITECTURE FUNDS
EQUITY FUNDS
AMG Managers Brandywine Advisors Mid Cap Growth
AMG Managers Brandywine Blue
AMG Managers Brandywine
Friess Associates, LLC
AMG Managers Cadence Capital Appreciation
AMG Managers Cadence Emerging Companies
AMG Managers Cadence Mid Cap
Cadence Capital Management, LLC
AMG Managers Emerging Opportunities
(formerly Managers Micro-Cap)
Lord, Abbett & Co. LLC
WEDGE Capital Management L.L.P.
Next Century Growth Investors LLC
RBC Global Asset Management (U.S.) Inc.
AMG Managers Essex Small/Micro Cap Growth
Essex Investment Management Co., LLC
AMG Managers Real Estate Securities
CenterSquare Investment Management, Inc.
AMG Managers Skyline Special Equities
(formerly Skyline Special Equities Portfolio)
Skyline Asset Management, L.P.
AMG Managers Special Equity
Ranger Investment Management, L.P.
Lord, Abbett & Co. LLC
Smith Asset Management Group, L.P. Federated MDTA LLC
FIXED INCOME FUNDS
AMG Managers Bond
AMG Managers Global Income Opportunity
Loomis, Sayles & Co., L.P.
AMG Managers High Yield
J.P. Morgan Investment Management Inc.
AMG Managers Intermediate Duration Government
AMG Managers Short Duration Government
Amundi Smith Breeden LLC
AMG Managers Total Return Bond
(formerly Managers PIMCO Bond)
Pacific Investment Management Co. LLC
| | | | |
 | | | | www.amgfunds.com |
| | | | |
| | | | |
 | | ANNUAL REPORT | | |
AMG Funds
October 31, 2014
AMG Frontier Small Cap Growth Fund
Investor Class: MSSVX | Service Class: MSSCX | Institutional Class: MSSYX
AMG TimesSquare All Cap Growth Fund
(formerly Managers AMG TSCM Growth Equity Fund)
Investor Class: MTGVX | Service Class: MTGSX | Institutional Class: MTGIX
AMG Managers Emerging Opportunities Fund
(formerly Managers Micro-Cap Fund)
Service Class: MMCFX | Institutional Class: MIMFX
AMG Managers Real Estate Securities Fund: MRESX
| | |
| www.amgfunds.com | | AR022-1014 |
AMG Funds
Annual Report—October 31, 2014
| | |
TABLE OF CONTENTS | | PAGE |
| |
LETTER TO SHAREHOLDERS | | 2 |
| |
ABOUT YOUR FUND’S EXPENSES | | 3 |
| |
PORTFOLIO MANAGER’S COMMENTS, FUND SNAPSHOTS, AND SCHEDULES OF PORTFOLIO INVESTMENTS | | |
| |
AMG Frontier Small Cap Growth Fund | | 4 |
| |
AMG TimesSquare All Cap Growth Fund | | 10 |
| |
AMG Managers Emerging Opportunities Fund | | 16 |
| |
AMG Managers Real Estate Securities Fund | | 25 |
| |
NOTES TO SCHEDULES OF PORTFOLIO INVESTMENTS | | 30 |
| |
FINANCIAL STATEMENTS | | |
| |
Statement of Assets and Liabilities | | 32 |
| |
Balance sheets, net asset value (NAV) per share computations and cumulative undistributed amounts | | |
| |
Statement of Operations | | 34 |
| |
Detail of sources of income, expenses, and realized and unrealized gains (losses) during the fiscal year | | |
| |
Statements of Changes in Net Assets | | 35 |
| |
Detail of changes in assets for the past two fiscal years | | |
| |
FINANCIAL HIGHLIGHTS | | 37 |
| |
Historical net asset values per share, distributions, total returns, income and expense ratios, turnover ratios and net assets | | |
| |
NOTES TO FINANCIAL HIGHLIGHTS | | 43 |
| |
NOTES TO FINANCIAL STATEMENTS | | 44 |
| |
Accounting and distribution policies, details of agreements and transactions with Fund management and affiliates, and descriptions of certain investment risks | | |
| |
REPORT OF INDEPENDENT REGISTERED PUBLIC ACCOUNTING FIRM | | 53 |
| |
TRUSTEES AND OFFICERS | | 54 |
| |
ANNUAL RENEWAL OF INVESTMENT MANAGEMENT AND SUBADVISORY AGREEMENTS | | 56 |
Nothing contained herein is to be considered an offer, sale or solicitation of an offer to buy shares of any series of the AMG Funds Family of mutual funds. Such offering is made only by Prospectus, which includes details as to offering price and other material information.
| | | | |
| | Letter to Shareholders | | |
DEAR SHAREHOLDER:
The fiscal year ended October 31, 2014 was another period of strong equity returns. The S&P 500 Index, a widely followed barometer of the U.S. equity market, rose more than 17% during the past 12 months. International stocks, by comparison, had flat performance, as measured by the MSCI ACWI ex USA Index (in U.S. Dollar terms). The first quarter of 2014 marked the five-year anniversary of the equity bull market. Despite a few bouts of volatility and persistent doubts about the strength of the economic recovery since the beginning of the bull market, the S&P 500 Index has a cumulative gain of 236% (including reinvestment of dividends) since the market bottom on March 9, 2009, through October 31, 2014.
Meanwhile, the Barclays U.S. Aggregate Bond Index, a broad U.S. bond market benchmark, returned 4% for the 12 months ended October 31. Bond markets have performed strongly during this period, to the surprise of many, despite the unwinding of the U.S. Federal Reserve’s bond-buying program known as QE3.
Earlier this year, Managers Investment Group rebranded as AMG Funds. Our new name helps align our fund family more closely with our parent company, Affiliated Managers Group (“AMG”). While the names of funds branded under AMG changed slightly, the ticker symbols remain the same. There was no change to the legal or ownership structure of the funds and the name change will have no impact on their management.
Our foremost goal at AMG Funds is to provide investment products and solutions that help our shareholders and clients successfully reach their long-term investment goals. We do this by partnering with many of AMG’s Affiliate investment boutiques to offer a distinctive array of actively managed, return-oriented funds. In addition, we oversee and distribute a number of complementary mutual funds sub-advised by unaffiliated investment managers. We thank you for your continued confidence and investment in AMG Funds. You can rest assured that, under all market conditions, our team is focused on delivering excellent investment management services for your benefit.
Respectfully,

Jeffery Cerutti
President
AMG Funds
| | | | | | | | | | | | | | |
Average Annual Total Returns | | Periods ended October 31, 2014 | |
Stocks: | | | | 1 Year | | | 3 Years | | | 5 Years | |
Large Caps | | (S&P 500 Index) | | | 17.27 | % | | | 19.77 | % | | | 16.69 | % |
Small Caps | | (Russell 2000® Index) | | | 8.06 | % | | | 18.18 | % | | | 17.39 | % |
International | | (MSCI All Country World Index ex USA Index) | | | 0.06 | % | | | 7.76 | % | | | 6.09 | % |
Bonds: | | | | | | | | | | | | | | |
Investment Grade | | (Barclays U.S. Aggregate Index) | | | 4.14 | % | | | 2.73 | % | | | 4.22 | % |
High Yield | | (Barclays U.S. High Yield Bond Index) | | | 5.82 | % | | | 9.39 | % | | | 10.44 | % |
Tax-exempt | | (Barclays Municipal Bond Index) | | | 7.82 | % | | | 4.93 | % | | | 5.26 | % |
Treasury Bills | | (BofAML U.S. Treasury Bill 6 Month Index) | | | 0.14 | % | | | 0.16 | % | | | 0.23 | % |
2
About Your Fund’s Expenses
As a shareholder of a Fund, you may incur two types of costs: (1) transaction costs, which may include sales charges (loads) on purchase payments; redemption fees; and exchange fees; and (2) ongoing costs, including management fees; distribution (12b-1) fees; and other Fund expenses. This example is intended to help you understand your ongoing costs (in dollars) of investing in the Fund and to compare these costs with the ongoing costs of investing in other mutual funds. The example is based on $1,000 invested at the beginning of the period and held for the entire period as indicated below.
ACTUAL EXPENSES
The first line of the following table provides information about the actual account values and actual expenses. You may use the information in this line, together with the amount you invested, to estimate the expenses that you paid over the period. Simply divide your account value by $1,000 (for example, an $8,600 account value divided by $1,000 = 8.6), then multiply the result by the number in the first line under the heading entitled “Expenses Paid During Period” to estimate the expenses you paid on your account during this period.
HYPOTHETICAL EXAMPLE FOR COMPARISON PURPOSES
The second line of the following table provides information about hypothetical account values and hypothetical expenses based on the Fund’s actual expense ratio and an assumed annual rate of return of 5% before expenses, which is not the Fund’s actual return. The hypothetical account values and expenses may not be used to estimate the actual ending account balance or expenses you paid for the period. You may use this information to compare the ongoing costs of investing in the Fund and other funds by comparing this 5% hypothetical example with the 5% hypothetical examples that appear in the shareholder reports of other funds.
Please note that the expenses shown in the table are meant to highlight your ongoing costs only and do not reflect any transactional costs, such as sales charges (loads), redemption fees, or exchange fees. Therefore, the second line of the table is useful in comparing ongoing costs only, and will not help you determine the relative total costs of owning different funds.
| | | | | | | | | | | | | | | | |
| Six Months Ended October 31, 2014 | | Expense
Ratio for
the Period | | | Beginning
Account
Value
5/01/14 | | | Ending
Account
Value
10/31/14 | | | Expenses
Paid During
the Period* | |
AMG Frontier Small Cap Growth Fund | | | | | | | | | | | | | | | | |
Investor Class | | | | | | | | | | | | | | | | |
Based on Actual Fund Return | | | 1.55 | % | | $ | 1,000 | | | $ | 1,033 | | | $ | 7.94 | |
Hypothetical (5% return before expenses) | | | 1.55 | % | | $ | 1,000 | | | $ | 1,017 | | | $ | 7.88 | |
Service Class | | | | | | | | | | | | | | | | |
Based on Actual Fund Return | | | 1.28 | % | | $ | 1,000 | | | $ | 1,034 | | | $ | 6.56 | |
Hypothetical (5% return before expenses) | | | 1.28 | % | | $ | 1,000 | | | $ | 1,019 | | | $ | 6.51 | |
Institutional Class | | | | | | | | | | | | | | | | |
Based on Actual Fund Return | | | 1.05 | % | | $ | 1,000 | | | $ | 1,036 | | | $ | 5.39 | |
Hypothetical (5% return before expenses) | | | 1.05 | % | | $ | 1,000 | | | $ | 1,020 | | | $ | 5.35 | |
AMG TimesSquare All Cap Growth Fund | | | | | | | | | | | | | | | | |
Investor Class | | | | | | | | | | | | | | | | |
Based on Actual Fund Return | | | 1.28 | % | | $ | 1,000 | | | $ | 1,080 | | | $ | 6.71 | |
Hypothetical (5% return before expenses) | | | 1.28 | % | | $ | 1,000 | | | $ | 1,019 | | | $ | 6.51 | |
Service Class | | | | | | | | | | | | | | | | |
Based on Actual Fund Return | | | 0.89 | % | | $ | 1,000 | | | $ | 1,082 | | | $ | 4.67 | |
Hypothetical (5% return before expenses) | | | 0.89 | % | | $ | 1,000 | | | $ | 1,021 | | | $ | 4.53 | |
Institutional Class | | | | | | | | | | | | | | | | |
Based on Actual Fund Return | | | 0.79 | % | | $ | 1,000 | | | $ | 1,083 | | | $ | 4.15 | |
Hypothetical (5% return before expenses) | | | 0.79 | % | | $ | 1,000 | | | $ | 1,021 | | | $ | 4.02 | |
AMG Managers Emerging Opportunities Fund | | | | | | | | | | | | | | | | |
Service Class | | | | | | | | | | | | | | | | |
Based on Actual Fund Return | | | 1.43 | % | | $ | 1,000 | | | $ | 1,028 | | | $ | 7.31 | |
Hypothetical (5% return before expenses) | | | 1.43 | % | | $ | 1,000 | | | $ | 1,018 | | | $ | 7.27 | |
Institutional Class | | | | | | | | | | | | | | | | |
Based on Actual Fund Return | | | 1.18 | % | | $ | 1,000 | | | $ | 1,029 | | | $ | 6.03 | |
Hypothetical (5% return before expenses) | | | 1.18 | % | | $ | 1,000 | | | $ | 1,019 | | | $ | 6.01 | |
AMG Managers Real Estate Securities Fund | | | | | | | | | | | | | | | | |
Based on Actual Fund Return | | | 1.20 | % | | $ | 1,000 | | | $ | 1,107 | | | $ | 6.37 | |
Hypothetical (5% return before expenses) | | | 1.20 | % | | $ | 1,000 | | | $ | 1,019 | | | $ | 6.11 | |
| * | Expenses are equal to the Fund’s annualized expense ratio multiplied by the average account value over the period, multiplied by the number of days in the most recent fiscal half-year (184), then divided by 365. |
3
AMG Frontier Small Cap Growth Fund
Portfolio Manager’s Comments
THE PORTFOLIO MANAGER
Frontier Capital Management Co. LLC (“Frontier”) manages client assets in small-, small/mid-, mid- and large-cap U.S. equity strategies. The AMG Frontier Small Cap Growth Fund follows a small-cap growth discipline as Frontier implements its “GARP” investment approach to select attractive small-cap stocks.
Frontier believes:
| | • | | Fundamental research is the cornerstone to adding value |
| | • | | Stock prices ultimately are linked to sales and earnings growth |
| | • | | Growth must be purchased at a reasonable price (“GARP”) |
| | • | | Research is a continuous process |
Frontier utilizes and draws support from its entire team of 18 investment professionals to identify opportunities and conduct fundamental research. Through fundamental bottom-up research, Frontier seeks long-term capital appreciation by investing in small-capitalization companies that it believes have above-average earnings growth potential and are available at reasonable valuations.
Frontier looks for companies it believes can generate long-term, sustainable earnings, managed by qualified professionals capable of executing a well-conceived strategic plan. Frontier seeks businesses that can generate superior rates of return on capital in excess of their cost of capital over a business cycle, due to above-average secular growth prospects or a competitive advantage.
THE YEAR IN REVIEW
For the fiscal year ended October 31, 2014, the AMG Frontier Small Cap Growth Fund (Service Class) (the “Fund”) returned 7.5%, compared with the Russell 2000® Growth Index, which returned 8.3%.
U.S. equities finished the twelve months ending October 31, 2014 with strong positive returns. Small caps trailed large caps as the Russell 2000® rose 8.1% versus the 16.8% gain of the large cap Russell 1000®. The U.S. economy continues to show resilience and remains the bright spot globally. The October Institute for Supply Management manufacturing index regained its 3 1⁄2 year high of 59.0 achieved in August and surpassed expectations for a decline. The underlying details were even better as the production gauge hit a 10-year high and new orders rose to the second highest level of the past decade. While the service index slowed to 57.1 last month, from 58.6 in September, the employment gauge rose to its highest level since 2005. Readings above 50 indicate economic expansion. Confirming the data, nonfarm payrolls grew a seasonally adjusted 214,000 in October dropping the unemployment rate to 5.8%, its lowest level since 2008. This was the ninth month where the economy added over 200,000 jobs, the best streak since 1995. Improving consumer confidence and falling oil prices should support further U.S. economic expansion despite concerns over China’s slowing growth, Europe flirting with recession and Middle East turmoil.
Our three top contributing sectors were technology, consumer discretionary and financial services. The Fund carried a significant overweight in technology this year and it has been our best relative return sector, up 18%, versus the 10% gain of the benchmark. In particular, our semiconductor holdings were up over 44% for the trailing 12 months, compared to the 37% industry return in the Russell 2000® Growth. This sector has been led by TriQuint Semiconductor, Inc. (TriQuint”), up 146%. TriQuint is gaining share in the mobile devices market that requires increasing numbers of its power amplifiers and filters. The company is also merging with competitor RF Micro Devices, which will result in much higher margins and earnings for the combined company. In early October, Microchip Technology, a semiconductor manufacturer, preannounced disappointing results and called for an industry-wide downturn.
Historically, Microchip has been considered the “canary in the coal mine” as it usually is one of the first companies in the industry to experience a slowdown in orders. Almost all semiconductor stocks fell significantly on this news; however, as more companies have reported earnings, it appears as though the majority of the weakness is related to a slowdown in China and we believe a sharp semiconductor downturn is unlikely. While the Fund remained overweight in technology, we reduced our weighting by selling five hardware related technology positions: Advanced Energy Industries, Ingram Micro, Monolithic Power Systems, ON Semiconductor and Teradyne, and trimming positions in several other holdings as well.
The Fund has been underweight consumer discretionary, our second strongest contributing sector. Our 7% return outpaced the 1% decline of the benchmark. Our positioning in the sector had been predicated on most consumer companies operating at peak margins, consumer stocks having outperformed for five years and consumers combatting tepid wage gains and increased taxes. After sales trends slowed markedly at the end of last year and the stocks corrected, we added to our consumer exposure and are currently overweight the index. Commercial truck axle manufacturer Meritor, classified under auto, was our strongest contributing stock, up 67%. New management has reinvigorated the business and is laser focused on improving profit margins. Mattress retailer and manufacturer Select Comfort, who sells the Sleep Number bed, appreciated 40% reflecting share gains and improved industry sales.
Financial services, an overweight sector, was also a strong contributing sector, as our 17% return outpaced the 11% return of the index. Results were led by the 24% advance of brokerage firm Raymond James. It remains a top holding in the portfolio and the company is experiencing solid results in each of its businesses: investment banking, private client services, asset management and conventional banking. The Fund also benefitted from the 29% gain of payment
4
AMG Frontier Small Cap Growth Fund
Portfolio Manager’s Comments (continued)
processor Heartland Payment Systems. Our investment thesis centering on the company’s captive salesforce being a competitive moat to new emerging payment systems such as Square appears to be unfolding. Additionally, management efforts to accelerate sales are gaining traction, as new processing equipment installed is at record levels.
Producer durables was our largest detractor to absolute performance, as our -7% return lagged the 4% gain of the benchmark. While we were overweight the sector during the fiscal year, we have sold several positions and are currently underweight. Detractors included engineering firm MasTec, down 10%, and back office support firm Advisory Board Company, down 22%. MasTec was hurt by a significant slowdown in wireless capital spend by its largest customer, AT&T. In addition, investors are concerned that lower oil prices will hurt the company’s pipeline construction business. We believe the company will take share in wireless, posting substantial growth, that the pipeline business will remain robust for the foreseeable future and that the stock is undervalued. Advisory Board has declined as the company has made several acquisitions of early-stage technology health care companies that are currently unprofitable, hurting profit margins and earnings per share. We had materially reduced the holding during the year and it is now a small position. We recently met with management and believe they now recognize the importance of improving operating margins and we continue to hold our small position. We would look to add to our holdings if our research indicates
that the investments the company made over the last year would lead to accelerating growth and improved profitability.
While geopolitical turmoil and softening economies outside the U.S. create uncertainty for financial markets, recent economic data make it clear that our economy continues to improve. Supporting a continued low-interest-rate environment, inflation expectations remain restrained and weakening global economies, particularly in China and Europe, have resulted in commodity price declines, particularly oil. The decline in the West Texas Intermediate crude prices from $105 to $75 per barrel has resulted in lower gasoline prices for consumers and a financial stimulus estimated at $500 annualized per U.S. household. Finally, and perhaps most importantly, are the improvements in the labor market with the unemployment rate down to 5.8%, the lowest rate in over six years. The stronger labor market in the context of lower energy prices is likely to provide a foundation for solid consumer spending as we head into the holidays and 2015. The inflation outlook remains muted and corporate profits appear poised to grow from record levels. Unless there are policy errors or exogenous major geopolitical shocks, we expect stocks to continue their advance higher.
In short, the U.S. economy appears to be decoupling from the rest of the world. One consequence of this is a rising value for the U.S. dollar. In this environment, smaller companies, which generally have more domestic revenue concentration, should fundamentally
perform better than large multinationals. In addition, the stronger dollar will have less of a translation headwind to profits of smaller, more domestically-oriented companies. Given all of these factors, we are optimistic about the prospects for small-cap equity returns in the year ahead.
This commentary reflects the viewpoints of the portfolio manager, Frontier Capital Management Company, LLC as of October 31, 2014 and is not intended as a forecast or guarantee of future results.
The Russell 2000® Growth Index measures the performance of the Russell 2000 companies with higher price-to-book ratios and higher forecasted growth values.
The Russell 2000® Index is composed of the 2000 smallest stocks in the Russell 3000® Index and is widely regarded in the industry as the premier measure of small-cap stock performance. Unlike the Fund, the Russell 2000® Index is unmanaged, is not available for investment and does not incur expenses.
The Russell 1000® Index measures the performance of approximately 1,000 of the largest securities based on a combination of their market cap and current index membership. The Russell 1000 represents approximately 92% of the U.S. market. Unlike the Fund, the Russell 1000® Index is unmanaged, is not available for investment, and does not incur expenses.
5
AMG Frontier Small Cap Growth Fund
Portfolio Manager’s Comments (continued)
CUMULATIVE TOTAL RETURN PERFORMANCE
AMG Frontier Small Cap Growth Fund’s cumulative total return is based on the daily change in net asset value (NAV), and assumes that all dividends and distributions were reinvested. This chart compares a hypothetical $10,000 investment made in AMG Frontier Small Cap Growth Fund’s Service Class on October 31, 2004, to a $10,000 investment made in the Russell 2000® Growth Index for the same time period. The graph and table do not reflect the deduction of taxes that a shareholder would pay on a Fund distribution or redemption of shares. The listed returns for the Fund are net of expenses and the returns for the index exclude expenses. Total returns would have been lower had certain expenses not been reduced.
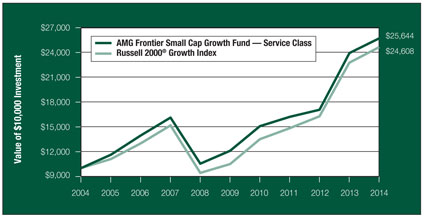
The table below shows the average annual total returns for the AMG Frontier Small Cap Growth Fund and the Russell 2000® Growth Index for the same time periods ended October 31, 2014.
| | | | | | | | | | | | | | | | | | | | |
| Average Annual Total Returns1 | | One Year | | | Five Years | | | Ten Years | | | Since Inception | | | Inception Date | |
AMG Frontier Small Cap Growth Fund2,3,4 | | | | | | | | | | | | | | | | | | | | |
Investor Class | | | 7.19 | % | | | — | | | | — | | | | 14.49 | % | | | 01/01/10 | |
Service Class | | | 7.46 | % | | | 16.23 | % | | | 9.88 | % | | | 7.71 | % | | | 09/24/97 | |
Institutional Class | | | 7.74 | % | | | — | | | | — | | | | 15.03 | % | | | 01/01/10 | |
Russell 2000® Growth Index5 | | | 8.26 | % | | | 18.61 | % | | | 9.42 | % | | | 5.40 | % | | | 09/24/97 | † |
The performance data shown represents past performance. Past performance is not a guarantee of future results. Current performance may be lower or higher than the performance data quoted. The investment return and principal value of an investment in the Fund will fluctuate so that an investor’s shares, when redeemed, may be worth more or less than their original cost.
Investors should carefully consider the Fund’s investment objectives, risks, charges and expenses before investing. For performance information through the most recent month end, current net asset values per share for the Fund and other information, please call (800) 835-3879 or visit our website at www.amgfunds.com for a free prospectus. Read it carefully before investing or sending money.
Distributed by AMG Distributors, Inc., member FINRA.
| † | Date reflects inception date of the Fund, not the index. |
| 1 | Total return equals income yield plus share price change and assumes reinvestment of all dividends and capital gain distributions. Returns are net of fees and may reflect offsets of Fund expenses as described in the prospectus. No adjustment has been made for taxes payable by shareholders on their reinvested dividends and capital gain distributions. Returns for periods greater than one year are annualized. The listed returns on the Fund are net of expenses and based on the published NAV as of October 31, 2014. All returns are in U.S. dollars ($). |
| 2 | From time to time, the Fund’s advisor has waived its fees and/or absorbed Fund expenses, which has resulted in higher returns. |
| 3 | The Fund invests in growth stocks, which may be more sensitive to market movements because their prices tend to reflect future investor expectations rather than just current profits. Growth stocks may underperform value stocks during given periods. |
| 4 | The Fund is subject to risks associated with investments in small-capitalization companies, such as erratic earnings patterns, competitive conditions, limited earnings history, and a reliance on one or a limited number of products. |
| 5 | The Russell 2000® Growth Index measures the performance of the Russell 2,000 companies with higher price-to-book ratios and higher forecasted growth values. Unlike the Fund, the Russell 2000® Growth Index is unmanaged, is not available for investment, and does not incur expenses. |
The Russell 2000® Growth Index is a registered trademark of Russell Investments. Russell® is a trademark of Russell Investments.
Not FDIC insured, nor bank guaranteed. May lose value.
6
AMG Frontier Small Cap Growth Fund
Fund Snapshots (unaudited)
October 31, 2014
PORTFOLIO BREAKDOWN
| | | | |
Sector | | AMG Frontier
Small Cap Growth
Fund** | | Russell 2000®
Growth
Index |
Information Technology | | 32.6% | | 25.5% |
Health Care | | 19.9% | | 22.8% |
Industrials | | 17.8% | | 14.8% |
Consumer Discretionary | | 12.4% | | 15.2% |
Financials | | 8.4% | | 7.9% |
Energy | | 3.5% | | 3.9% |
Materials | | 2.7% | | 5.1% |
Telecommunication Services | | 1.7% | | 0.8% |
Consumer Staples | | 0.7% | | 3.8% |
Utilities | | 0.0% | | 0.2% |
Other Assets and Liabilities | | 0.3% | | 0.0% |
| ** | As a percentage of net assets. |
TOP TEN HOLDINGS
| | |
Security Name | | % of Net Assets |
Raymond James Financial, Inc.* | | 3.1% |
Watsco, Inc.* | | 2.8 |
Tessera Technologies, Inc.* | | 2.7 |
Alkermes PLC* | | 2.5 |
Ellie Mae, Inc. | | 2.5 |
MEDNAX, Inc.* | | 2.5 |
WABCO Holdings, Inc.* | | 2.4 |
Synaptics, Inc. | | 2.3 |
MasTec, Inc.* | | 2.3 |
Puma Biotechnology, Inc. | | 2.3 |
| | |
Top Ten as a Group | | 25.4% |
| | |
| * | Top Ten Holding at April 30, 2014. |
Because a fund’s strategy may result in multiple investments in particular sectors of the economy, its performance may depend on the performance of those sectors and may fluctuate more widely than investments diversified across more sectors. For additional information on these and other risk considerations, please see the Fund’s prospectus.
Any sectors, industries, or securities discussed should not be perceived as investment recommendations. Mention of a specific security should not be considered a recommendation to buy or solicitation to sell that security. Specific securities mentioned in this report may have been sold from the Fund’s portfolio of investments by the time you receive this report.
7
AMG Frontier Small Cap Growth Fund
Schedule of Portfolio Investments
October 31, 2014
| | | | | | | | |
| | | Shares | | | Value | |
Common Stocks—99.7% | | | | | | | | |
Consumer Discretionary—12.4% | |
2U, Inc.* | | | 17,781 | | | $ | 323,614 | |
American Eagle Outfitters, Inc. | | | 13,891 | | | | 178,777 | |
Boot Barn Holdings, Inc.* | | | 413 | | | | 7,331 | |
Chico’s FAS, Inc. | | | 18,269 | | | | 275,496 | |
DSW, Inc., Class A | | | 12,522 | | | | 371,277 | |
Fiesta Restaurant Group, Inc.* | | | 5,472 | | | | 301,781 | |
Fox Factory Holding Corp.* | | | 20,569 | | | | 348,439 | |
Harman International Industries, Inc. | | | 3,471 | | | | 372,577 | |
IMAX Corp.* | | | 7,630 | | | | 224,780 | |
LifeLock, Inc.* | | | 17,068 | | | | 288,620 | |
LKQ Corp.* | | | 20,822 | | | | 594,884 | |
Noodles & Co.*,1 | | | 9,100 | | | | 207,753 | |
Select Comfort Corp.* | | | 14,576 | | | | 374,457 | |
Tilly’s, Inc., Class A* | | | 19,873 | | | | 141,496 | |
Vera Bradley, Inc.* | | | 6,886 | | | | 157,001 | |
Vitamin Shoppe, Inc.* | | | 6,665 | | | | 312,788 | |
Total Consumer Discretionary | | | | | | | 4,481,071 | |
Consumer Staples—0.7% | |
Natural Grocers by Vitamin Cottage, Inc.*,1 | | | 13,200 | | | | 239,052 | |
Energy—3.5% | |
Carrizo Oil & Gas, Inc.* | | | 7,371 | | | | 382,850 | |
Emerald Oil, Inc.* | | | 15,191 | | | | 48,307 | |
InterOil Corp.*,1 | | | 1,589 | | | | 90,001 | |
Matrix Service Co.* | | | 14,764 | | | | 369,986 | |
SandRidge Energy, Inc.*,1 | | | 24,078 | | | | 93,904 | |
WPX Energy, Inc.* | | | 15,700 | | | | 300,184 | |
Total Energy | | | | | | | 1,285,232 | |
Financials—8.4% | |
Allied World Assurance Co. Holdings AG | | | 19,862 | | | | 754,756 | |
Jones Lang LaSalle, Inc. | | | 2,804 | | | | 379,129 | |
Raymond James Financial, Inc. | | | 20,428 | | | | 1,146,624 | |
Signature Bank* | | | 4,966 | | | | 601,532 | |
Waddell & Reed Financial, Inc., Class A | | | 3,493 | | | | 166,756 | |
Total Financials | | | | | | | 3,048,797 | |
Health Care—19.9% | |
Alkermes PLC* | | | 18,210 | | | | 920,515 | |
Avalanche Biotechnologies, Inc.* | | | 5,973 | | | | 214,311 | |
BioDelivery Sciences International, Inc.*,1 | | | 6,100 | | | | 106,140 | |
| | | | | | | | |
| | | Shares | | | Value | |
Celldex Therapeutics, Inc.*,1 | | | 10,754 | | | $ | 180,129 | |
Centene Corp.* | | | 3,968 | | | | 367,715 | |
DexCom, Inc.* | | | 15,645 | | | | 703,243 | |
Insulet Corp.* | | | 13,445 | | | | 580,421 | |
Intercept Pharmaceuticals, Inc.* | | | 1,500 | | | | 387,585 | |
Intrexon Corp.*,1 | | | 29,260 | | | | 653,083 | |
Kite Pharma, Inc.*,1 | | | 1,646 | | | | 60,886 | |
Medidata Solutions, Inc.* | | | 8,800 | | | | 396,968 | |
MEDNAX, Inc.* | | | 14,350 | | | | 895,870 | |
Molina Healthcare, Inc.* | | | 4,300 | | | | 209,152 | |
PerkinElmer, Inc. | | | 4,560 | | | | 197,995 | |
Puma Biotechnology, Inc.* | | | 3,282 | | | | 822,469 | |
Sangamo BioSciences, Inc.*,1 | | | 20,950 | | | | 254,333 | |
Unilife Corp.* | | | 67,231 | | | | 246,738 | |
United Therapeutics Corp.* | | | 116 | | | | 15,192 | |
Total Health Care | | | | | | | 7,212,745 | |
Industrials—17.8% | |
A. O. Smith Corp. | | | 11,362 | | | | 606,163 | |
The Advisory Board Co.* | | | 3,923 | | | | 210,547 | |
Carlisle Cos., Inc. | | | 4,205 | | | | 373,740 | |
KAR Auction Services, Inc. | | | 15,096 | | | | 458,315 | |
MasTec, Inc.* | | | 29,114 | | | | 833,825 | |
Meritor, Inc.* | | | 30,083 | | | | 345,654 | |
MSA Safety, Inc. | | | 5,654 | | | | 324,935 | |
Pall Corp. | | | 156 | | | | 14,261 | |
Quanta Services, Inc.* | | | 12,072 | | | | 411,414 | |
RPX Corp.* | | | 6,337 | | | | 89,035 | |
Stock Building Supply Holdings, Inc.* | | | 16,910 | | | | 265,318 | |
Terex Corp. | | | 8,418 | | | | 242,186 | |
WABCO Holdings, Inc.* | | | 8,851 | | | | 861,910 | |
Watsco, Inc. | | | 9,875 | | | | 1,003,497 | |
WESCO International, Inc.* | | | 4,935 | | | | 406,693 | |
Total Industrials | | | | | | | 6,447,493 | |
Information Technology—32.6% | |
3D Systems Corp.*,1 | | | 7,000 | | | | 264,600 | |
Aspen Technology, Inc.* | | | 5,046 | | | | 186,349 | |
Belden, Inc. | | | 11,372 | | | | 809,573 | |
Blackhawk Network Holdings, Inc., Class B* | | | 8,200 | | | | 273,880 | |
Callidus Software, Inc.* | | | 22,410 | | | | 315,757 | |
Ellie Mae, Inc.* | | | 23,654 | | | | 907,840 | |
The accompanying notes are an integral part of these financial statements.
8
AMG Frontier Small Cap Growth Fund
Schedule of Portfolio Investments (continued)
| | | | | | | | |
| | | Shares | | | Value | |
Information Technology—32.6% (continued) | |
Envestnet, Inc.* | | | 6,021 | | | $ | 267,453 | |
FleetMatics Group PLC* | | | 14,480 | | | | 537,787 | |
FLIR Systems, Inc. | | | 7,392 | | | | 247,854 | |
Fortinet, Inc.* | | | 16,472 | | | | 429,096 | |
Heartland Payment Systems, Inc. | | | 12,683 | | | | 655,077 | |
Integrated Device Technology, Inc.* | | | 33,573 | | | | 550,933 | |
Jack Henry & Associates, Inc. | | | 7,845 | | | | 469,288 | |
Kulicke & Soffa Industries, Inc.* | | | 20,498 | | | | 295,581 | |
Microsemi Corp.* | | | 4,826 | | | | 125,814 | |
Pandora Media, Inc.* | | | 895 | | | | 17,256 | |
QLogic Corp.* | | | 33,792 | | | | 399,083 | |
QuinStreet, Inc.* | | | 16,752 | | | | 67,846 | |
RealPage, Inc.* | | | 7,164 | | | | 142,349 | |
Rovi Corp.* | | | 14,667 | | | | 306,247 | |
Semtech Corp.* | | | 6,623 | | | | 168,092 | |
Silver Spring Networks, Inc.*,1 | | | 12,232 | | | | 117,183 | |
Synaptics, Inc.* | | | 12,365 | | | | 846,137 | |
Synchronoss Technologies, Inc.* | | | 1,510 | | | | 78,022 | |
Tangoe, Inc.* | | | 33,186 | | | | 486,839 | |
Tessera Technologies, Inc. | | | 32,542 | | | | 988,951 | |
TriQuint Semiconductor, Inc.* | | | 28,189 | | | | 609,728 | |
Ultratech, Inc.* | | | 9,892 | | | | 189,234 | |
Universal Display Corp.*,1 | | | 567 | | | | 17,736 | |
Virtusa Corp.* | | | 5,652 | | | | 231,619 | |
Web.com Group, Inc.* | | | 20,343 | | | | 417,642 | |
WEX, Inc.* | | | 3,515 | | | | 399,163 | |
Yelp, Inc.*,1 | | | 278 | | | | 16,680 | |
Total Information Technology | | | | | | | 11,836,689 | |
Materials—2.7% | | | | | | | | |
Caesarstone Sdot-Yam, Ltd. | | | 6,394 | | | | 357,169 | |
| | | | | | | | |
| | | Shares | | | Value | |
Eagle Materials, Inc. | | | 3,511 | | | $ | 306,967 | |
Globe Specialty Metals, Inc. | | | 16,450 | | | | 309,424 | |
Total Materials | | | | | | | 973,560 | |
Telecommunication Services—1.7% | | | | | |
Cogent Communications Holdings, Inc. | | | 18,278 | | | | 620,355 | |
Total Common Stocks
(cost $24,562,216) | | | | | | | 36,144,994 | |
| | |
| | | Principal
Amount | | | | |
Short-Term Investments—4.2% | | | | | | | | |
Repurchase Agreements—3.3%2 | |
Cantor Fitzgerald Securities, Inc., dated 10/31/14, due 11/03/14, 0.130%, total to be received $1,000,011 (collateralized by various U.S. Government Agency Obligations, 0.000%—10.500%, 01/01/15—09/20/64, totaling $1,020,000) | | $ | 1,000,000 | | | | 1,000,000 | |
Nomura Securities USA, Inc., dated 10/31/14, due 11/03/14, 0.110%, total to be received $207,283 (collateralized by various U.S. Government Agency Obligations, 0.000%—7.250%, 11/03/14—11/01/44, totaling $211,427) | | | 207,281 | | | | 207,281 | |
Total Repurchase Agreements | | | | | | | 1,207,281 | |
| | |
| | | Shares | | | | |
Other Investment Companies—0.9%3 | |
Dreyfus Institutional Cash Advantage Fund, Institutional Class Shares, 0.06% | | | 326,520 | | | | 326,520 | |
Total Short-Term Investments
(cost $1,533,801) | | | | | | | 1,533,801 | |
Total Investments—103.9%
(cost $26,096,017) | | | | | | | 37,678,795 | |
Other Assets, less Liabilities—(3.9)% | | | | (1,401,609 | ) |
Net Assets—100.0% | | | | | | $ | 36,277,186 | |
The accompanying notes are an integral part of these financial statements.
9
AMG TimesSquare All Cap Growth Fund
Portfolio Manager’s Comments
The AMG TimesSquare All Cap Growth Fund
(the “Fund”) seeks to achieve long-term capital appreciation by investing in the stocks of large-, mid- and small-capitalization companies.
THE PORTFOLIO MANAGER
TimesSquare Capital Management, LLC (“TimesSquare”), the Fund’s subadvisor, utilizes a bottom-up fundamental approach to all-cap investing. Led by co-managers Kenneth Duca, Tony Rosenthal and Grant Babyak, the investment team at TimesSquare believes its proprietary fundamental research skills, which place a particular emphasis on the assessment of management quality and an in-depth understanding of superior business models, enable the team to build a diversified portfolio of large-cap, mid-cap and small-cap growth stocks designed to generate good risk-adjusted returns. When selecting growth stocks, Fund management utilizes a fundamental, bottom-up process to identify companies that demonstrate consistent and sustainable revenue and earnings growth, offer distinct and sustainable competitive advantages, have strong, experienced management teams, have stocks selling at reasonable valuations and that Fund management believes have the potential to appreciate in price by 25 to 50% within the next 12 to 18 months.
THE PERIOD IN REVIEW
For the fiscal year ended October 31, 2014, the AMG TimesSquare Growth Equity Fund (Institutional Class Shares) returned 12.2%, underperforming the Russell 3000® Growth Index, which returned 16.4%.
As 2013 ended, the high-profile overhangs of tapering and budgets were addressed. Fourth-quarter returns, ranging from 8% to 10% across U.S. equity segments, capped a remarkable year for the markets. An orderly changing of the guard was signaled at the U.S. Federal Reserve (“the Fed”) as outgoing chair Bernanke announced the long-awaited tapering of open market bond purchases. The surprisingly early reduction from $85 billion to $75 billion a month kept markets calm, given the taper’s gradual nature. At the
same time, a two-year federal budget deal was reached, making unlikely a repeat of October’s 16-day government shutdown.
The U.S. equity markets traveled a bumpy road in the first quarter of 2014. Gains in February overcame retreats in January and March, to lead the major indices to positive returns of approximately 2%. Stirring the markets was a downward revision to the initial estimate for the prior quarter’s GDP growth. This was coupled with lower consumer spending caused, in part, by one of the coldest winters on record, leading some to reset growth expectations for 2014. Related to that, corporate managements in general have been reducing their forward guidance below estimates. On a more optimistic note, the Institute for Supply Management’s metrics of manufacturing and service activities remained above the economic expansion level, while measures of consumer confidence and sentiment indicated optimism. Added to the mix was the Fed’s third consecutive $10 billion reduction of monthly bond purchases, which slowed the pace to $55 billion beginning in April.
The U.S. stock markets sprang ahead in the second quarter, unperturbed by repeated downward revisions to the prior quarter’s GDP growth rate, which, at -2.9%, saw the greatest decline in five years. At the same time, however, the Institute for Supply Management’s (“ISM”) metrics of manufacturing and service activities remained above the economic expansion level — in line with general expectations — and measures of consumer confidence and sentiment remained optimistic. Businesses and consumers likely dismissed the broad economic slowdown as both weather-induced and short-term in nature. Instead, they latched onto positive job growth and stock market returns. The song remained the same as the Fed reduced again by $10 billion its monthly bond purchases, which was $35 billion beginning in July. More notably, the Fed highlighted the strengthening employment situation as contributing to its view that the zero-interest rate policy might change as early as 2015.
In the third quarter, U.S. stock markets gyrated as economic readings often conflicted with prior expectations as well as with each other. By the end of the quarter, the major stock indices showed flat to negative returns. The final revision to GDP growth for the second quarter was edged up to 4.6% — matching the prior peak set at the end of 2011. Underlying that growth were pockets of increased corporate capital expenditures and higher levels of consumer spending. While the ISM’s metrics of manufacturing and service activities remained above the economic expansion level, the pace for each slackened by a larger degree than had been expected. As evidenced by increased consumer spending, consumer sentiment climbed although consumer confidence unexpectedly fell. The Fed hewed closely to its playbook and reduced monthly bond purchases by $10 billion for the seventh consecutive time, with the expectation that the final $15 billion of monthly purchases would cease with October. The eventual end of its zero-interest rate policy was deferred when Fed chair Yellen maintained it would be a “considerable time” before interest rates would be increased. As the quarter ended, oil prices fell sharply to the lowest levels in over a year, and although home prices climbed, it was at a decelerating rate of growth. Meanwhile, the job market strengthened as the unemployment rate fell below 6% for the first time since mid-2008.
Shrugging off the ghosts of Octobers past, the U.S. stock markets posted solid gains this month. Broadly speaking, recent economic activity was strong, with the initial 3.5% estimate for third quarter GDP growth and the ISM’s metrics of manufacturing activities both better than expected. The ISM’s measure of service activity was below expectations, yet still safely above the expansion level. No surprises came from the Fed as it officially ended the “quantitative easing” monthly bond-buying program that had been in place since September 2012. The Fed felt comfortable doing so since inflation has remained in check and the labor market has strengthened — the unemployment rate fell to 5.8% at the end of October. The outlook for consumers improved as
AMG TimesSquare All Cap Growth Fund
Portfolio Manager’s Comments (continued)
measures of sentiment and confidence rose by an unexpected amount, to their highest levels since 2007. Likely, lower gasoline prices factored into those views as oil prices fell to another 12-month low.
The portfolio underperformed the Russell 3000® Growth Index on a relative basis during the past trailing year. Stock selection had a strong negative effect and drove our underperformance; in general, our investments in technology, consumer staples, health care and producer durables lagged their counterparts in the index, while our holdings in financial services and consumer discretionary outperformed. Sector allocation had a slight positive effect although we continue to build our concentrated all-cap growth portfolio from the bottom-up.
Technology was our most challenging sector during this 12-month time frame, and we sold out of CommVault Systems Inc. and NeuStar Inc., both down -36% while they were in the portfolio. CommVault provides data and information management software applications and related services. Results from its second quarter disappointed investors and management with part of the software revenue miss stemming from poor sales execution. Management was cautious about the macro environment, especially from Europe, which made its sales cycle more unpredictable. Even though CommVault continued to gain market share in the storage software market, we believed there was too much uncertainty and sold the stock to make room for higher quality names. NeuStar provides real-time information and analysis to the internet, telecommunications, information services, financial services, retail, media and advertising sectors. The weakness in the stock was attributed to the circulation of a document in late April which called for negotiating terms of the Number Portability Administration contract with a new vendor and away from NeuStar. It’s worth noting that this document was premature, as contract negotiations were not yet final at the time and still are not. The stock appeared to have priced in the loss of this business. Nevertheless, near-term challenges were likely to persist and we decided to
sell the name. On a more positive note, Facebook Inc., newly purchased in the portfolio at the end of last year, rose 62% since we initiated the position. The social media and networking company consistently reported strong accelerating advertising revenues and earnings growth that outpaced consensus estimates, driven by higher realized pricing for mobile advertising. Mobile now represents 59% of advertising revenue. We used the later run-up as an opportunity to trim the position.
Our underperformance in consumer staples was mostly driven by health and wellness specialty retailer GNC Holdings, Inc.’s weak -38% return. GNC reported its second consecutive quarterly miss in the third quarter of 2013. The stock was impacted by a multitude of factors, including weak consumer environment, particularly in mall traffic, and fears of a weather disruption in some of their markets. While the Gold Card program is boosting store traffic, they have experienced lower average tickets from new Gold Card users. Coupled with the announcement that both the CEO and CFO were leaving the company, we lost faith in the management and sold our position. We had been trimming the name up until this point, although GNC was the bottommost detractor to the portfolio this year.
Health care was the best performing sector on an absolute basis this year, and while we had a few weaker health care names, our relative underperformance was mostly due to the strength of the benchmark. Celldex Therapeutics, Inc. is a biopharmaceutical company focused on the treatment of cancer and other diseases based on its antibody-focused, precision-targeted immunotherapy platform. Celldex fell -20% after the company announced it would discontinue its clinical trial of CDX-1135 for dense deposit disease (DDD) due to difficulties in enrolling patients. Even though Celldex still has quite a few other immune-therapies in the pipeline, the stock was likely to trade sideways in the near-term so we decided to liquidate our position from this concentrated, best ideas portfolio. Another relative detractor was Air Methods Corp., a provider of air
medical emergency transport services and systems in the U.S. utilizing helicopters and fixed-wing aircraft. Earlier in the year, the name had rallied due to revenues and earnings that beat consensus estimates, driven by stronger-than-expected same-store volumes as well as base conversions. However, in third quarter, Air Methods preannounced negative numbers, due to lower-than-anticipated commercial payor mix, which we believe to be short-term volatility. All-in-all, Air Methods was up 8% for the year, which trailed the benchmark sector average return of 34%. More positive news was found in Actavis Plc, a global specialty pharmaceutical company. The company reported strong results with beats to revenue and earnings estimates, due to strength in its generic segment, and surged ahead by 50%. With its Forest Labs acquisition, which closed in July 2014, Actavis will broaden its branded pharmaceutical segment in areas such as gastrointestinal, respiratory and cystic fibrosis. Actavis was the top contributor to the portfolio this year.
Within producer durables, On Assignment Inc. provides in-demand, skilled professionals in areas such as technology, health care and life science. For the third quarter of 2014, On Assignment reported a mixed quarter with better-than-expected earnings although with weaker revenues. A greater influence on the subsequent -13% price decline was the reduced forward guidance, as management cited project delays at some larger customers and noted that its Oxford division for health care IT was not reaccelerating on its growth path as quickly as had been expected. That may not change for several quarters, so we are reevaluating On Assignment’s place in the portfolio. We changed tracks in this sector when we exited Union Pacific Corporation and initiated a position in CSX Corporation in July 2014. The freight rail industry has always been an attractive one, with very high barriers to entry and rational pricing where the rail companies had limited direct competition — Union Pacific’s routes were generally west of the Mississippi River while CSX’s were east of it. In our view, Union Pacific’s
11
AMG TimesSquare All Cap Growth Fund
Portfolio Manager’s Comments (continued)
valuations were near their historical highs while CSX seemed undervalued, though both should benefit from growing shipping volume trends. CSX has been up 14% since purchased.
Overall, the financial services was a credit to the portfolio this year. New to the portfolio was WisdomTree Investments, the exchange-traded funds (ETF) provider. The company’s stock price had been weak following outflows from its Yen-hedged Japanese equity offering, though we believed offsetting inflows to other ETFs, particularly European and Indian, mitigated the market’s concerns and we initiated the position in August 2014. Subsequently WisdomTree’s net flows turned positive year-to-date and its share price increased by 32% since we began buying. Posting a 19% gain was Alliance Data Systems, a provider of transaction-based marketing and customer loyalty solutions. Alliance was credited with strong earnings ahead of estimates and organic growth in its Epsilon marketing services segment, and management raised full year guidance. The company’s pipeline appeared robust with the anticipated addition of approximately 33% growth of new private label clients in 2014 versus 2013 including: BJ’s Wholesale Club, Overstock.com, Designer Shoe Warehouse, Orbitz and Virgin America. Based on those new signings and positive credit trends, we believe that Alliance’s growth should reaccelerate to higher levels. On the debit side was Intercontinental Exchange, the operator of global exchanges for energy, financial and commodity trading. The first half of the year saw investors penalizing the company due to concerns over the U.K. financial regulator’s Markets in Financial Instruments Directive II (MiFID II) and high-frequency trading. The former relates to reforms in Europe which may impact the dominant position of European futures exchanges, among them ICE’s London
International Financial Futures and Options Exchange (LIFFE). It’s worth noting, the rules are not yet final and are years from being implemented. In terms of the latter, ICE has minimal exposure to high-frequency trading when compared to their overall revenues and earnings. The second half of the year saw ICE recover as trading volumes rebounded, especially due to low-energy prices and interest rates. ICE exceed expectations for earnings and the company continued to buy back its stock, but was still a relative detractor to our portfolio, as it was up only 9% over the year compared with a benchmark sector average return of 16%.
Better fortune came from our consumer discretionary names, especially from our new position in Alibaba Group, which we bought during its September 2014 IPO and afterward. As the largest e-commerce company in the world, Alibaba has nearly 80% market share in China — its footprint was equivalent to the Amazon, eBay, and Google’s combined presence in the U.S. With such a dominant position, Alibaba benefits from the inherent network effects that also create significant barriers to entry for competitors. Investors have recognized that and its share price climbed 48%. Walt Disney Co., the diversified international family entertainment and media company, is another name that thrived this year. Disney climbed 35% on its blockbuster hit movie “Frozen,” which was the highest grossing animated film of all time and also a best-selling title on Blu-ray and digital. The company was further aided by strength in its Studio Entertainment, Parks & Resorts, and Consumer Products segments. Continuing the good news was O’Reilly Automotive Inc., a specialty retailer of automotive parts, tools and accessories. O’Reilly issued solid revenues and estimates driven by same-store sales growth, with the pace of new
store openings running ahead of original plans. O’Reilly had doubled the amount of customers in their loyalty program. The company viewed this as an important element of their marketing efforts and plans to tie this into a new point-of-sale system that is expected to be rolled out this summer. O’Reilly approached our price target and was sold out of the portfolio in February 2014 after achieving a 21% return. A dark spot on the portfolio was Starbucks Corporation, the global coffeehouse chain. The company reported inline EPS with improving prospects as the company adds more food and beverage items to their menus. However, we were worried about the rising cost of coffee beans and sold out of the position. An unprecedented drought in Brazil destroyed much of the country’s coffee crop, which would impact supplies and prices for several years to come. Starbucks was down -6% during the period when we held it.
Moving toward the end of 2014, the U.S markets are likely envisioning a world without quantitative easing. Some areas of the economy have seen increased capital expenditures, but corporate spending has not yet broadened widely. Those companies with significant overseas exposures — typically larger capitalizations — cast a worried eye on slowing growth in China and the frail European economy. Remaining constant is our approach of bottom-up analysis and identifying superior growth businesses to build our portfolios, no matter what the economic environment or outlook may bring.
This commentary reflects the viewpoints of the portfolio manager, TimesSquare Capital Management, LLC as of October 31, 2014 and is not intended as a forecast or guarantee of future results, and is subject to change without notice.
12
AMG TimesSquare All Cap Growth Fund
Portfolio Manager’s Comments (continued)
CUMULATIVE TOTAL RETURN PERFORMANCE
AMG TimesSquare All Cap Growth Fund’s cumulative total return is based on the daily change in net asset value (NAV), and assumes that all dividends and distributions were reinvested. This chart compares a hypothetical $10,000 investment made in AMG TimesSquare All Cap Growth Fund’s Institutional Class on July 30, 2010 (commencement of operations) to a $10,000 investment made in the Russell 3000® Growth Index for the same time period. The graph and table do not reflect the deduction of taxes that a shareholder would pay on a Fund distribution or redemption of shares. The listed returns for the Fund are net of expenses and the returns for the index exclude expenses. Total returns would have been lower had certain expenses not been reduced.
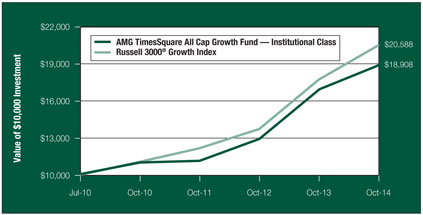
The table below shows the average annual total returns for the AMG TimesSquare All Cap Growth Fund and the Russell 3000® Growth Index for the same time periods ended October 31, 2014.
| | | | | | | | | | | | |
| Average Annual Total Returns1 | | One
Year | | | Since
Inception | | | Inception
Date | |
AMG TimesSquare All Cap Growth Fund2,3,4,5,6 | | | | | | | | | | | | |
Investor Class | | | 11.59 | % | | | 15.64 | % | | | 07/30/10 | |
Service Class | | | 12.04 | % | | | 16.12 | % | | | 07/30/10 | |
Institutional Class | | | 12.17 | % | | | 16.15 | % | | | 07/30/10 | |
Russell 3000® Growth Index7 | | | 16.39 | % | | | 18.52 | % | | | 07/30/10 | † |
The performance data shown represents past performance. Past performance is not a guarantee of future results. Current performance may be lower or higher than the performance data quoted. The investment return and principal value of an investment in the Fund will fluctuate so that an investor’s shares, when redeemed, may be worth more or less than their original cost.
Investors should carefully consider the Fund’s investment objectives, risks, charges and expenses before investing. For performance information through the most recent month end, current net asset values per share for the Fund and other information, please call (800) 835-3879 or visit our website at www.amgfunds.com for a free prospectus. Read it carefully before investing or sending money.
Distributed by AMG Distributors, Inc., member FINRA.
| † | Date reflects the inception date of the Fund, not the index. |
| 1 | Total return equals income yield plus share price change and assumes reinvestment of all dividends and capital gain distributions. Returns are net of fees and may reflect offsets of Fund expenses as described in the prospectus. No adjustment has been made for taxes payable by shareholders on their reinvested dividends and capital gain distributions. Returns for periods greater than one year are annualized. The listed returns on the Fund are net of expenses and based on the published NAV as of October 31, 2014. All returns are in U.S. dollars ($). |
| 2 | From time to time, the Fund’s advisor has waived its fees and/or absorbed Fund expenses, which has resulted in higher returns. |
| 3 | The Fund invests in growth stocks, which may be more sensitive to market movements because their prices tend to reflect future investor expectations rather than just current profits. Growth stocks may underperform value stocks during given periods. |
| 4 | The Fund invests in large-capitalization companies that may underperform other stock funds (such as funds that focus on small- and medium-capitalization companies) when stocks of large-capitalization companies are out of favor. The Fund is subject to risks associated with small- and mid-capitalization companies, such as erratic earnings patterns, competitive conditions, limited earnings history, and a reliance on one or a limited number of products. |
| 5 | A greater percentage of the Fund’s holdings may be focused in a smaller number of securities which may place the Fund at greater risk than a more diversified fund. |
| 6 | Investing in public offerings (IPOs) is risky and the prices of stocks purchased in IPOs tend to fluctuate more widely than stocks of companies that have been publicly traded for a longer period of time. Stocks purchased in IPOs generally do not have a trading history, and information about the companies may be available for very limited periods. |
| 7 | The Russell 3000® Growth Index measures the performance of those Russell 3000® Index companies with higher price-to-book ratios and higher forecasted growth values. Unlike the Fund, the Russell 3000® Growth Index is unmanaged, is not available for investment, and does not incur expenses. |
The Russell 3000® Growth Index is a registered trademark of Russell Investments. Russell® is a trademark of Russell Investments.
Not FDIC insured, nor bank guaranteed. May lose value.
13
AMG TimesSquare All Cap Growth Fund
Fund Snapshots (unaudited)
October 31, 2014
PORTFOLIO BREAKDOWN
| | | | | | | | |
Sector | | AMG TimesSquare
All Cap
Growth Fund** | | | Russell 3000®
Growth Index | |
Information Technology | | | 30.4 | % | | | 28.0 | % |
Consumer Discretionary | | | 14.8 | % | | | 17.9 | % |
Industrials | | | 15.3 | % | | | 12.2 | % |
Health Care | | | 12.4 | % | | | 14.9 | % |
Financials | | | 10.3 | % | | | 5.5 | % |
Materials | | | 5.3 | % | | | 4.1 | % |
Energy | | | 5.1 | % | | | 5.2 | % |
Consumer Staples | | | 4.5 | % | | | 9.9 | % |
Telecommunication Services | | | 0.0 | % | | | 2.2 | % |
Utilities | | | 0.0 | % | | | 0.1 | % |
Other Assets and Liabilities | | | 1.9 | % | | | 0.0 | % |
| ** | As a percentage of net assets. |
TOP TEN HOLDINGS
| | | | |
Security Name | | % of Net Assets | |
Actavis PLC | | | 3.1 | % |
MasterCard, Inc., Class A* | | | 3.0 | |
Alliance Data Systems Corp. | | | 3.0 | |
The Walt Disney Co.* | | | 3.0 | |
Prudential Financial, Inc. | | | 3.0 | |
American Tower Corp.* | | | 3.0 | |
CSX Corp. | | | 3.0 | |
Apple, Inc. | | | 2.9 | |
DaVita HealthCare Partners, Inc. | | | 2.8 | |
Alibaba Group Holding, Ltd., Sponsored ADR | | | 2.8 | |
| | | | |
Top Ten as a Group | | | 29.6 | % |
| | | | |
| * | Top Ten Holding at April 30, 2014. |
Because a fund’s strategy may result in multiple investments in particular sectors of the economy, its performance may depend on the performance of those sectors and may fluctuate more widely than investments diversified across more sectors. For additional information on these and other risk considerations, please see the Fund’s prospectus.
Any sectors, industries, or securities discussed should not be perceived as investment recommendations. Mention of a specific security should not be considered a recommendation to buy or solicitation to sell that security. Specific securities mentioned in this report may have been sold from the Fund’s portfolio of investments by the time you receive this report.
14
AMG TimesSquare All Cap Growth Fund
Schedule of Portfolio Investments
October 31, 2014
| | | | | | | | |
| | | Shares | | | Value | |
Common Stocks—98.1% | | | | | | | | |
Consumer Discretionary—14.8% | |
BorgWarner, Inc. | | | 15,165 | | | $ | 864,708 | |
NIKE, Inc., Class B | | | 9,195 | | | | 854,859 | |
Ross Stores, Inc. | | | 12,620 | | | | 1,018,686 | |
Time Warner Cable, Inc. | | | 6,480 | | | | 953,921 | |
The Walt Disney Co. | | | 12,725 | | | | 1,162,810 | |
Wyndham Worldwide Corp. | | | 11,525 | | | | 895,147 | |
Total Consumer Discretionary | | | | | | | 5,750,131 | |
Consumer Staples—4.5% | | | | | |
The Estee Lauder Cos., Inc., Class A | | | 11,300 | | | | 849,534 | |
TreeHouse Foods, Inc.* | | | 10,505 | | | | 894,711 | |
Total Consumer Staples | | | | | | | 1,744,245 | |
Energy—5.1% | | | | | | | | |
EP Energy Corp., Class A*,1 | | | 66,440 | | | | 970,024 | |
Schlumberger, Ltd. | | | 10,345 | | | | 1,020,638 | |
Total Energy | | | | | | | 1,990,662 | |
Financials—10.3% | | | | | | | | |
American Tower Corp. | | | 11,855 | | | | 1,155,863 | |
Intercontinental Exchange, Inc. | | | 3,415 | | | | 711,310 | |
Prudential Financial, Inc. | | | 13,115 | | | | 1,161,202 | |
WisdomTree Investments, Inc.1 | | | 66,485 | | | | 980,654 | |
Total Financials | | | | | | | 4,009,029 | |
Health Care—12.4% | | | | | | | | |
Actavis PLC* | | | 4,940 | | | | 1,199,136 | |
Air Methods Corp.* | | | 12,310 | | | | 581,401 | |
Biogen Idec, Inc.* | | | 2,765 | | | | 887,786 | |
DaVita HealthCare Partners, Inc.* | | | 14,220 | | | | 1,110,155 | |
Envision Healthcare Holdings, Inc.* | | | 30,675 | | | | 1,072,091 | |
Total Health Care | | | | | | | 4,850,569 | |
Industrials—15.3% | | | | | | | | |
American Airlines Group, Inc. | | | 18,110 | | | | 748,849 | |
The Corporate Executive Board Co. | | | 12,660 | | | | 933,042 | |
CSX Corp. | | | 32,400 | | | | 1,154,412 | |
DigitalGlobe, Inc.* | | | 29,310 | | | | 837,973 | |
Nielsen N.V. | | | 18,545 | | | | 787,977 | |
On Assignment, Inc.* | | | 23,165 | | | | 674,102 | |
TriNet Group, Inc.* | | | 28,145 | | | | 842,098 | |
Total Industrials | | | | | | | 5,978,453 | |
| | | | | | | | |
| | | Shares | | | Value | |
Information Technology—30.4% | |
Alibaba Group Holding, Ltd., Sponsored ADR* | | | 11,070 | | | $ | 1,091,502 | |
Alliance Data Systems Corp.* | | | 4,160 | | | | 1,178,736 | |
Apple, Inc. | | | 10,339 | | | | 1,116,612 | |
Applied Materials, Inc. | | | 44,615 | | | | 985,545 | |
Facebook, Inc., Class A* | | | 11,425 | | | | 856,761 | |
Fidelity National Information Services, Inc. | | | 15,295 | | | | 893,075 | |
Google, Inc., Class A* | | | 1,576 | | | | 894,963 | |
Google, Inc., Class C* | | | 1,621 | | | | 906,269 | |
MasterCard, Inc., Class A | | | 14,105 | | | | 1,181,294 | |
salesforce.com, inc.* | | | 15,580 | | | | 996,964 | |
TE Connectivity, Ltd. | | | 16,295 | | | | 996,113 | |
WNS Holdings, Ltd., ADR* | | | 36,460 | | | | 736,857 | |
Total Information Technology | | | | | | | 11,834,691 | |
Materials—5.3% | | | | | |
Ecolab, Inc. | | | 8,890 | | | | 988,835 | |
PolyOne Corp. | | | 28,885 | | | | 1,069,034 | |
Total Materials | | | | | | | 2,057,869 | |
Total Common Stocks
(cost $30,352,468) | | | | | | | 38,215,649 | |
| | |
| | | Principal
Amount | | | | |
Short-Term Investments—6.0% | |
Repurchase Agreements—2.4%2 | |
Cantor Fitzgerald Securities, Inc., dated 10/31/14, due 11/03/14, 0.130%, total to be received $929,351 (collateralized by various U.S. Government Agency Obligations, 0.000%—10.500%, 01/01/15—09/20/64, totaling $947,928) | | $ | 929,341 | | | | 929,341 | |
| | |
| | | Shares | | | | |
Other Investment Companies—3.6%3 | |
Dreyfus Institutional Cash Advantage Fund, Institutional Class Shares, 0.06% | | | 1,385,624 | | | | 1,385,624 | |
Total Short-Term Investments
(cost $2,314,965) | | | | 2,314,965 | |
Total Investments—104.1%
(cost $32,667,433) | | | | 40,530,614 | |
Other Assets, less
Liabilities—(4.1)% | | | | (1,589,193 | ) |
Net Assets—100.0% | | | | | | $ | 38,941,421 | |
The accompanying notes are an integral part of these financial statements.
15
AMG Managers Emerging Opportunities Fund
Portfolio Manager’s Comments
The AMG Managers Emerging Opportunities Fund primarily invests in the stocks of U.S. micro-capitalization companies. Normally the Fund invests at least 80% of its net assets in U.S. micro-cap stocks. The Fund employs multiple portfolio managers who specialize in distinct investment approaches. This “intelligence diversification” not only serves to manage risk, but also seeks to incorporate into the portfolio the breadth of the micro-cap market by focusing different analytical insights on micro-cap investing. The Fund’s team of subadvisors strives to achieve this performance and diversification while ensuring that the Fund operates within the framework of its investment objective and principal investment strategies. The Russell Microcap® Index is the benchmark for the Fund.
THE PORTFOLIO MANAGERS
Lord, Abbett & Co. LLC (“Lord Abbett”)
The team focuses its stock selection effort on companies that have revenue growth of at least 15%, are experiencing year-to-year operating margin improvement and are experiencing earnings growth that is driven by top-line growth rather than being driven by one-time events or simple cost-cutting measures. The focus is also on identifying companies with higher-quality balance sheets (often captured by finding companies with manageable debt-to-total-capital ratios) and that are already profitable. Once this process is completed, the focus for the team is on forecasting both revenue and earnings growth over the next several years. To achieve this goal, and to find companies that are expected to grow faster than their industry average, members of the team spend an extensive amount of time understanding the competitive advantages of a firm, the industry dynamics within which they operate and the strength of management.
The sell discipline is enacted if there is a fundamental change in the business, a more attractive alternative is found or if a holding reaches a 5% weight in the overall portfolio. The Lord Abbett portfolio typically holds between 75 and 100 stocks with no individual holding typically exceeding 5%. There is a risk constraint that prevents any individual industry from being greater than 25% of the total portfolio weight. The annual
turnover of the portfolio is expected to be relatively high, although there is no explicit target as part of either the stock selection or the portfolio-construction process.
Next Century Growth Investors LLC (“Next Century”)
The team requires historical revenue growth of at least 15% for a company before conducting further research. Other key factors considered initially by the team are strong historical revenue growth, low debt and high Return On Equity (“ROE”). Quantitative screening is done on a regular basis to see which stocks over the past year are experiencing significant growth. The next stage of this process involves intensive first-hand research to determine the growth prospects of a company, with the team choosing a stock only when it has become convinced a company has an extraordinary opportunity to grow their business. The uniqueness of this process lies in the fact that the team seeks out these companies regardless of their short-term prospects and\or current valuation. The team is looking for “home runs” and companies that will grow to the point that they will eventually reach a small-market capitalization.
The sell discipline is enacted if there is a change in the original investment thesis or a fundamental change in the business of the company. In addition, a holding will become a candidate for sale if it reaches an extreme valuation, becomes larger than 5% of the overall portfolio or as it approaches $1 billion in market capitalization. Typically, companies are sold out of the micro-cap portfolio because they have approached $1 billion in market capitalization.
The Next Century portion of the Fund is concentrated and typically has 40-60 holdings, which can create a high level of volatility. The only risk constraints are that sector weights can not exceed two times the Russell 2000® Growth sector weights, and no individual holding can be greater than 5% of the portfolio.
RBC Global Asset Management (U.S.) Inc. (“RBC”)
The team uses an investment process that focuses on generating solid stock selection by identifying companies with strong, long-term, attractive
business fundamentals that are selling at low valuations. In order to initially generate ideas, the team at RBC uses quantitative screens and industry research to concentrate stock selection on a narrower sub-universe of micro-cap companies. The team then focuses a majority of its time on conducting intensive “on-the-ground” fundamental research in order to uncover these opportunities. The focus is on identifying companies with long-term, solid business fundamentals and near-term profitability improvement potential. In terms of short-term factors, the team looks for companies that have shown institutional investor neglect or avoidance and sizeable insider ownership with the potential for both improving profit margins and accelerating earnings in the near future. In terms of long-term factors, the team looks for companies with proven products or services that are leading in market share within their respective industries while maintaining a sustainable competitive advantage and a solid balance sheet.
The resulting portfolio that is generated by this stock selection process tends to exhibit low turnover with company stocks generally held for several years. The portfolio is well diversified with anywhere from 60 to 90 holdings with a maximum of 5% in any single holding.
WEDGE Capital Management L.L.P. (“WEDGE”)
The investment process is a combination of both quantitative and fundamental research insights. The quantitative portion of the investment process uses commonly found factors and characteristics that can be accessed via any number of commercial databases. The value-added portion of the process, therefore, uses a number of different factors across five major categories: valuation, earnings quality, operating efficiency, capital usage and momentum, whose efficacy has been verified via long-term regression analysis. This is referred to as the Fundamental Value model. The top results of this model are combined with the best resulting stocks from the Financial Quality model, which measures stocks across categories such as multiple earnings growth, profitability, leverage and liquidity. The top stocks that appear in both models are eligible for fundamental research. The fundamental research portion of the investment
AMG Managers Emerging Opportunities Fund
Portfolio Manager’s Comments (continued)
process is exclusionary in nature and meant to eliminate stocks that are not strong in earnings forecasts, valuation metrics, sector\industry outlook or any factor that cannot be easily captured quantitatively.
A stock is scrutinized for possible sale if it falls below the top four deciles in the Fundamental Value model. Stocks are sold when they become fairly-valued, an upgrade opportunity develops or the original investment thesis materially deteriorates. The portion of the Fund managed by WEDGE is confined to plus or minus 10% in any given sector, although sector positions tend to be much closer to the Index weight than this (it should be noted that these self-imposed sector weighting constraints are based on a proprietary liquidity analysis conducted on an ongoing basis by the micro-cap team and is NOT driven by the sector weightings of any micro-cap benchmark). The final portfolio seeks to be a well-diversified, micro-cap portfolio holding approximately 150 securities and consistently maintaining a value bias relative to the benchmark. The portfolio tends to hold securities within the $40 million to $400 million market capitalization range, although it does not require a sale of a holding until it reaches $800 million in market capitalization.
THE YEAR IN REVIEW
Over the past year, equities within the U.S. posted gains despite ongoing macroeconomic headwinds that continue to threaten what has been, thus far, a gradual economic recovery from the 2008 and 2009 deep recession. While equities within the U.S. posted positive returns across the market capitalization spectrum, these gains were achieved in fitful spurts as the “risk on, risk off” environment, U.S. Federal Reserve (“Fed”) policy changes and waning global growth continued to create uncertainty. Despite these risks, investors increased equity exposure as U.S. equity indices across the market cap spectrum generated robust
gains in the fourth quarter of 2013. From January 1st to October 31st 2014, large-cap equities significantly outperformed micro-cap and small-cap equities as volatility increased. Investors tentatively entered the fourth quarter of 2014 firmly focused the Fed’s next move to potentially raise short-term interest rates and U.S. economics, including unemployment and housing statistics. Against this backdrop, micro-cap equities delivered returns of 7.3%, as measured by the Russell Microcap® Index, which underperformed returns of their large-cap and small-cap brethren, which returned 16.8% and 8.1%, respectively, as measured by the Russell 1000® and Russell 2000® indices.
For the fiscal year ended October 31, 2014, the AMG Managers Emerging Opportunities Fund (Service Class) returned 5.1%, compared with 7.3% for its benchmark, the Russell Microcap® Index. After significantly outperforming its benchmark in fiscal year 2013, the Fund underperformed its benchmark in 2014. A majority of the underperformance was driven by the Fund’s unfavorable sector positioning, which is primarily a residual of the stock selection process for each of the Fund’s subadvisors. The Fund’s underweights within the financials and health care sectors, and overweights within the information technology and consumer discretionary sectors, detracted most from relative performance. The Fund’s stock selection was neutral as weak stock selection within the information technology, energy and telecommunication services sectors was offset by strong stock selection within the consumer discretionary, industrials and health care sectors.
At the subadvisor level, Next Century and RBC underperformed the Russell Microcap® Index, partially offset by outperformance from Lord Abbett and Wedge. Next Century’s aggressive growth style experienced unfavorable sector positioning and weak stock selection, particularly in the high-growth information technology sector,
biotechnology related industries and the industrials sector, partially offset by strong stock selection in the consumer discretionary sector. RBC’s core growth process experienced unfavorable sector positioning with its significant underweight to the health care sector, as well as weak stock selection within the energy and health care sectors, partially offset by strong stock selection within the industrials sector. Lord Abbett contributed positively to the Fund’s relative performance with strong stock selection in the health care and consumer discretionary sectors. WEDGE’s quantitative process produced strong stock selection within consumer staples, consumer discretionary, information technology and industrials sectors, partially offset by weak stock selection within the energy sector.
LOOKING FORWARD
The portfolio managers are cautiously optimistic about forward-looking prospects for micro-cap equities. The portfolio managers believe that each of their respective investment processes, focused on finding companies with solid secular growth prospects, have the potential to perform well if investors focus on company fundamentals and less so on uncertainties related to Fed policy or other macro risks. The Fund generally remains positioned for ongoing economic recovery, with overweights in economically sensitive industrials, information technology and consumer discretionary sectors. The portfolio managers continue to avoid financials with a large underweight (15%) to this sector relative to the benchmark.
This commentary reflects the viewpoints of the portfolio managers, Lord, Abbett & Co. LLC, Next Century Growth Investors LLC, RBC Global Asset Management (U.S.) Inc. and WEDGE Capital Management L.L.P., as of October 31, 2014 and is not intended as a forecast or guarantee of future results.
17
AMG Managers Emerging Opportunities Fund
Portfolio Manager’s Comments (continued)
CUMULATIVE TOTAL RETURN PERFORMANCE
AMG Managers Emerging Opportunities Fund’s cumulative total return is based on the daily change in net asset value (NAV), and assumes that all dividends and distributions were reinvested. This chart compares a hypothetical $10,000 investment made in the AMG Managers Emerging Opportunities Fund’s Service Class on October 31, 2004 to a $10,000 investment made in the Russell Microcap® Index and the Russell 2000® Index for the same time period. The graph and table do not reflect the deduction of taxes that a shareholder would pay on a Fund distribution or redemption of shares. The listed returns for the Fund are net of expenses and the returns for the index exclude expenses. Total returns would have been lower had certain expenses not been reduced
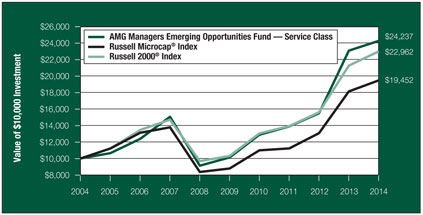
The table below shows the average annual total returns for the AMG Managers Emerging Opportunities Fund and the Russell Microcap® Index and Russell 2000® Index for the same time periods ended October 31, 2014.
| | | | | | | | | | | | | | | | | | | | |
| Average Annual Total Returns1 | | One
Year | | | Five
Years | | | Ten
Years | | | Since
Inception | | | Inception
Date | |
AMG Managers Emerging Opportunities Fund2,3 | | | | | | | | | | | | | | | | | | | | |
Service Class | | | 5.09 | % | | | 19.08 | % | | | 9.26 | % | | | 13.52 | % | | | 06/30/94 | |
Institutional Class | | | 5.33 | % | | | — | | | | — | | | | 26.11 | % | | | 10/01/11 | |
Russell Microcap® Index5 | | | 7.34 | % | | | 17.24 | % | | | 6.88 | % | | | 7.38 | %4 | | | 06/30/00 | |
Russell 2000® Index6 | | | 8.06 | % | | | 17.39 | % | | | 8.67 | % | | | 9.57 | % | | | 06/30/94 | † |
The performance data shown represents past performance. Past performance is not a guarantee of future results. Current performance may be lower or higher than the performance data quoted. The investment return and principal value of an investment in the Fund will fluctuate so that an investor’s shares, when redeemed, may be worth more or less than their original cost.
Investors should carefully consider the Fund’s investment objectives, risks, charges, and expenses before investing. For performance information through the most recent month end, current net asset values per share for the Fund and other information, please call (800) 835-3879 or visit our website at www.amgfunds.com for a free prospectus. Read it carefully before investing or sending money.
Distributed by AMG Distributors, Inc., member FINRA.
| † | Date reflects the inception date of the Fund, not the index. |
| 1 | Total return equals income yield plus share price change and assumes reinvestment of all dividends and capital gain distributions. Returns are net of fees and may reflect offsets of Fund expenses as described in the prospectus. No adjustment has been made for taxes payable by shareholders on their reinvested dividends and capital gain distributions. Returns for periods greater than one year are annualized. The listed returns on the Fund are net of expenses and based on the published NAV as of October 31, 2014. All returns are in U.S. dollars ($). |
| 2 | From time to time, the Fund’s advisor has waived its fees and/or absorbed Fund expenses, which has resulted in higher returns. |
| 3 | The Fund is subject to the special risks associated with investments in micro-cap companies, such as relatively short earnings histories, competitive conditions, less publicly available corporate information, and reliance on a limited number of products. |
| 4 | Since the Russell Microcap® Index’s inception date of June 30, 2000, the average annual return for the index was 7.38%. |
| 5 | The Russell Microcap® Index tracks the microcap segment of the U.S. equity market. It makes up less than 3% of the U.S. equity market and is represented by the smallest 1,000 securities in the small-cap Russell 2000® Index plus the next 1,000 securities. Unlike the Fund, the Russell Microcap® Index is unmanaged, is not available for investment, and does not incur expenses. |
| 6 | The Russell 2000® Index is composed of the 2,000 smallest stocks in the Russell 3000® Index and is widely regarded in the industry as the premier measure of small-cap stock performance. Unlike the Fund, the Russell 2000® Index is unmanaged, is not available for investment, and does not incur expenses. |
The Russell Microcap® Index and Russell 2000® Index are registered trademarks of Russell Investments. Russell® is a trademark of Russell Investments.
Not FDIC insured, nor bank guaranteed. May lose value.
AMG Managers Emerging Opportunities Fund
Fund Snapshots (unaudited)
October 31, 2014
PORTFOLIO BREAKDOWN
| | | | | | | | | | | | |
Sector | | AMG
Managers
Emerging
Opportunities
Fund** | | | Russell
Microcap®
Index | | | Russell 2000®
Index | |
Information Technology | | | 20.7 | % | | | 15.9 | % | | | 17.8 | % |
Health Care | | | 19.8 | % | | | 21.9 | % | | | 14.0 | % |
Industrials | | | 18.0 | % | | | 11.8 | % | | | 14.0 | % |
Consumer Discretionary | | | 16.8 | % | | | 12.5 | % | | | 13.1 | % |
Financials | | | 12.3 | % | | | 25.6 | % | | | 24.3 | % |
Materials | | | 3.1 | % | | | 2.8 | % | | | 4.8 | % |
Energy | | | 2.8 | % | | | 3.9 | % | | | 4.6 | % |
Consumer Staples | | | 2.3 | % | | | 2.3 | % | | | 3.2 | % |
Telecommunication Services | | | 1.4 | % | | | 2.0 | % | | | 0.7 | % |
Utilities | | | 0.8 | % | | | 1.2 | % | | | 3.5 | % |
Other Assets and Liabilities | | | 2.0 | % | | | 0.1 | % | | | 0.0 | % |
| ** | As a percentage of net assets. |
TOP TEN HOLDINGS
| | | | |
Security Name | | % of Net Assets | |
Universal Electronics, Inc.* | | | 1.4 | % |
Columbus McKinnon Corp.* | | | 1.3 | |
Kona Grill, Inc.* | | | 1.2 | |
Rentrak Corp. | | | 1.1 | |
Qualys, Inc. | | | 1.0 | |
Tyler Technologies, Inc.* | | | 1.0 | |
Cardiovascular Systems, Inc. | | | 0.9 | |
Compass Diversified Holdings | | | 0.9 | |
U.S. Physical Therapy, Inc. | | | 0.9 | |
AZZ, Inc. | | | 0.9 | |
| | | | |
Top Ten as a Group | | | 10.6 | % |
| | | | |
| * | Top Ten Holding at April 30, 2014. |
Because a fund’s strategy may result in multiple investments in particular sectors of the economy, its performance may depend on the performance of those sectors and may fluctuate more widely than investments diversified across more sectors. For additional information on these and other risk considerations, please see the Fund’s prospectus.
Any sectors, industries, or securities discussed should not be perceived as investment recommendations. Mention of a specific security should not be considered a recommendation to buy or solicitation to sell that security. Specific securities mentioned in this report may have been sold from the Fund’s portfolio of investments by the time you receive this report.
19
AMG Managers Emerging Opportunities Fund
Schedule of Portfolio Investments
October 31, 2014
| | | | | | | | |
| | | Shares | | | Value | |
Common Stocks—98.0% | | | | | | | | |
Consumer Discretionary—16.8% | | | | | |
1-800-Flowers.com, Inc., Class A* | | | 26,800 | | | $ | 215,204 | |
2U, Inc.*,1 | | | 38,360 | | | | 698,152 | |
BJ’s Restaurants, Inc.* | | | 19,644 | | | | 864,729 | |
Boot Barn Holdings, Inc.* | | | 22,200 | | | | 394,050 | |
Bravo Brio Restaurant Group, Inc.* | | | 25,400 | | | | 352,298 | |
Bridgepoint Education, Inc.* | | | 62,802 | | | | 793,817 | |
Build-A-Bear Workshop, Inc.* | | | 6,900 | | | | 116,955 | |
Carmike Cinemas, Inc.* | | | 10,000 | | | | 320,500 | |
Chuy’s Holdings, Inc.*,1 | | | 50,239 | | | | 1,502,649 | |
Citi Trends, Inc.* | | | 15,300 | | | | 346,545 | |
Culp, Inc. | | | 13,100 | | | | 248,507 | |
Delta Apparel, Inc.* | | | 41,600 | | | | 436,800 | |
Destination Maternity Corp. | | | 57,185 | | | | 856,631 | |
Destination XL Group, Inc.* | | | 216,720 | | | | 1,135,613 | |
Einstein Noah Restaurant Group, Inc. | | | 22,200 | | | | 449,550 | |
Famous Dave’s of America, Inc.* | | | 4,425 | | | | 115,360 | |
Frisch’s Restaurants, Inc. | | | 4,000 | | | | 102,720 | |
Grand Canyon Education, Inc.* | | | 27,700 | | | | 1,326,830 | |
Harte-Hanks, Inc. | | | 34,200 | | | | 222,642 | |
Haverty Furniture Cos., Inc. | | | 10,550 | | | | 232,205 | |
Hooker Furniture Corp. | | | 15,685 | | | | 239,824 | |
iRobot Corp.*,1 | | | 22,444 | | | | 801,700 | |
Jason Industries, Inc.* | | | 32,700 | | | | 287,760 | |
Johnson Outdoors, Inc., Class A | | | 4,625 | | | | 138,981 | |
Kirkland’s, Inc.* | | | 13,600 | | | | 242,080 | |
Kona Grill, Inc.* | | | 107,384 | | | | 2,419,362 | |
LGI Homes, Inc.* | | | 45,106 | | | | 875,959 | |
Libbey, Inc.* | | | 52,100 | | | | 1,497,875 | |
Liberty Tax, Inc.*,1 | | | 6,500 | | | | 246,285 | |
LifeLock, Inc.* | | | 38,629 | | | | 653,216 | |
Lifetime Brands, Inc. | | | 21,600 | | | | 369,576 | |
M/I Homes, Inc.* | | | 18,044 | | | | 388,668 | |
Malibu Boats, Inc., Class A* | | | 48,496 | | | | 904,935 | |
The Marcus Corp. | | | 26,925 | | | | 461,225 | |
MarineMax, Inc.* | | | 68,267 | | | | 1,308,678 | |
Red Robin Gourmet Burgers, Inc.* | | | 12,100 | | | | 665,137 | |
Rentrak Corp.*,1 | | | 28,642 | | | | 2,201,711 | |
Rocky Brands, Inc. | | | 8,025 | | | | 105,448 | |
Ruth’s Hospitality Group, Inc. | | | 31,100 | | | | 378,487 | |
| | | | | | | | |
| | | Shares | | | Value | |
Saga Communications, Inc., Class A | | | 3,300 | | | $ | 132,330 | |
Smith & Wesson Holding Corp.* | | | 84,500 | | | | 858,520 | |
SodaStream International, Ltd.* | | | 6,600 | | | | 145,464 | |
Stein Mart, Inc. | | | 19,400 | | | | 259,572 | |
Stoneridge, Inc.* | | | 28,700 | | | | 372,813 | |
Strattec Security Corp. | | | 2,300 | | | | 238,556 | |
Summer Infant, Inc.* | | | 35,100 | | | | 118,989 | |
Tandy Leather Factory, Inc. | | | 78,600 | | | | 726,264 | |
Tower International, Inc.* | | | 10,600 | | | | 257,580 | |
Unifi, Inc.* | | | 8,100 | | | | 226,557 | |
Universal Electronics, Inc.* | | | 51,000 | | | | 2,901,390 | |
Vince Holding Corp.* | | | 15,828 | | | | 554,771 | |
WCI Communities, Inc.* | | | 14,464 | | | | 271,345 | |
West Marine, Inc.* | | | 33,500 | | | | 329,640 | |
ZAGG, Inc.* | | | 118,200 | | | | 794,304 | |
Zoe’s Kitchen, Inc.*,1 | | | 36,902 | | | | 1,345,447 | |
Total Consumer Discretionary | | | | | | | 34,452,206 | |
Consumer Staples—2.3% | | | | | |
Amira Nature Foods, Ltd.* | | | 32,316 | | | | 562,622 | |
Calavo Growers, Inc. | | | 23,180 | | | | 1,125,157 | |
Craft Brew Alliance, Inc.* | | | 19,300 | | | | 267,884 | |
Diplomat Pharmacy, Inc.* | | | 41,567 | | | | 893,691 | |
Farmer Bros. Co.* | | | 11,900 | | | | 347,004 | |
John B Sanfilippo & Son, Inc. | | | 18,000 | | | | 668,700 | |
Nature’s Sunshine Products, Inc. | | | 8,000 | | | | 119,200 | |
Omega Protein Corp.* | | | 15,600 | | | | 225,420 | |
The Pantry, Inc.* | | | 22,775 | | | | 586,912 | |
Total Consumer Staples | | | | | | | 4,796,590 | |
Energy—2.8% | | | | | | | | |
Abraxas Petroleum Corp.* | | | 34,800 | | | | 143,724 | |
Callon Petroleum Co.* | | | 50,000 | | | | 328,000 | |
Dawson Geophysical Co. | | | 34,600 | | | | 587,854 | |
Emerald Oil, Inc.* | | | 62,300 | | | | 198,114 | |
Geospace Technologies Corp.* | | | 15,400 | | | | 474,166 | |
Gulf Island Fabrication, Inc. | | | 23,291 | | | | 492,372 | |
Gulfport Energy Corp.* | | | 16,500 | | | | 827,970 | |
Panhandle Oil and Gas, Inc., Class A | | | 12,500 | | | | 257,000 | |
RigNet, Inc.* | | | 14,579 | | | | 633,458 | |
Ring Energy, Inc.* | | | 57,100 | | | | 982,120 | |
Synergy Resources Corp.* | | | 52,600 | | | | 641,194 | |
The accompanying notes are an integral part of these financial statements.
20
AMG Managers Emerging Opportunities Fund
Schedule of Portfolio Investments (continued)
| | | | | | | | |
| | | Shares | | | Value | |
Energy—2.8% (continued) | | | | | | | | |
TGC Industries, Inc.* | | | 36,681 | | | $ | 115,178 | |
Total Energy | | | | | | | 5,681,150 | |
Financials—12.3% | | | | | | | | |
Actua Corp.* | | | 57,833 | | | | 1,087,260 | |
AMERISAFE, Inc. | | | 29,800 | | | | 1,242,660 | |
Arrow Financial Corp.1 | | | 13,086 | | | | 358,426 | |
Asta Funding, Inc.* | | | 48,800 | | | | 411,384 | |
Atlas Financial Holdings, Inc.* | | | 17,600 | | | | 261,008 | |
The Bank of Kentucky Financial Corp. | | | 5,000 | | | | 234,550 | |
Boston Private Financial Holdings, Inc. | | | 32,100 | | | | 422,115 | |
Centerstate Banks, Inc. | | | 31,700 | | | | 368,988 | |
Chatham Lodging Trust | | | 24,000 | | | | 614,880 | |
CoBiz Financial, Inc. | | | 80,400 | | | | 966,408 | |
Compass Diversified Holdings* | | | 99,200 | | | | 1,830,240 | |
Crawford & Co., Class B | | | 26,400 | | | | 268,752 | |
Diamond Hill Investment Group, Inc.1 | | | 2,800 | | | | 375,172 | |
EMC Insurance Group, Inc. | | | 11,200 | | | | 358,848 | |
FBR & Co.* | | | 17,300 | | | | 417,622 | |
Federated National Holding Co. | | | 7,700 | | | | 257,642 | |
Financial Institutions, Inc. | | | 20,275 | | | | 509,713 | |
First Connecticut Bancorp, Inc. | | | 8,200 | | | | 128,248 | |
First Defiance Financial Corp. | | | 7,800 | | | | 238,914 | |
Flushing Financial Corp. | | | 25,150 | | | | 506,521 | |
Fortegra Financial Corp.* | | | 12,400 | | | | 122,512 | |
Gain Capital Holdings, Inc. | | | 42,100 | | | | 360,376 | |
Gramercy Property Trust, Inc. | | | 80,100 | | | | 500,625 | |
Heritage Financial Corp. | | | 28,747 | | | | 504,510 | |
Heritage Financial Group, Inc. | | | 5,900 | | | | 125,021 | |
HFF, Inc., Class A | | | 8,263 | | | | 260,119 | |
JMP Group, Inc. | | | 18,200 | | | | 132,860 | |
LaSalle Hotel Properties | | | 25,800 | | | | 1,011,618 | |
MainSource Financial Group, Inc. | | | 14,200 | | | | 258,298 | |
Manning & Napier, Inc. | | | 26,900 | | | | 426,096 | |
Marcus & Millichap, Inc.* | | | 34,299 | | | | 1,065,327 | |
Metro Bancorp, Inc.* | | | 13,800 | | | | 345,552 | |
MidWestOne Financial Group, Inc. | | | 4,600 | | | | 122,728 | |
National Interstate Corp. | | | 4,600 | | | | 130,824 | |
Northrim BanCorp, Inc. | | | 36,926 | | | | 1,067,161 | |
OceanFirst Financial Corp. | | | 29,850 | | | | 494,614 | |
One Liberty Properties, Inc.1 | | | 11,500 | | | | 263,235 | |
| | | | | | | | |
| | | Shares | | | Value | |
Oppenheimer Holdings, Inc., Class A | | | 25,400 | | | $ | 623,570 | |
Orrstown Financial Services, Inc.* | | | 7,300 | | | | 122,202 | |
Pacific Continental Corp. | | | 17,700 | | | | 255,234 | |
Peoples Bancorp, Inc. | | | 15,400 | | | | 379,610 | |
Physicians Realty Trust | | | 16,900 | | | | 259,246 | |
Pinnacle Financial Partners, Inc. | | | 16,581 | | | | 649,975 | |
Piper Jaffray Cos.* | | | 12,837 | | | | 724,777 | |
Silvercrest Asset Management Group, Inc., Class A | | | 30,727 | | | | 458,754 | |
Square 1 Financial, Inc., Class A* | | | 23,929 | | | | 475,948 | |
Stock Yards Bancorp, Inc. | | | 14,490 | | | | 482,227 | |
Territorial Bancorp, Inc. | | | 12,025 | | | | 258,297 | |
Trico Bancshares | | | 19,300 | | | | 507,590 | |
Univest Corp. of Pennsylvania | | | 17,700 | | | | 363,204 | |
ViewPoint Financial Group, Inc. | | | 16,370 | | | | 446,410 | |
Washington Trust Bancorp, Inc. | | | 10,675 | | | | 409,600 | |
West Bancorporation, Inc. | | | 8,025 | | | | 133,054 | |
Whitestone REIT | | | 32,100 | | | | 481,500 | |
Total Financials | | | | | | | 25,082,025 | |
Health Care—19.8% | | | | | | | | |
AAC Holdings, Inc.* | | | 48,652 | | | | 1,059,640 | |
ABIOMED, Inc.* | | | 12,904 | | | | 423,122 | |
Acceleron Pharma, Inc.*,1 | | | 9,463 | | | | 349,942 | |
Achillion Pharmaceuticals, Inc.* | | | 37,482 | | | | 440,414 | |
Addus HomeCare Corp.* | | | 12,700 | | | | 252,349 | |
Adeptus Health, Inc., Class A*,1 | | | 12,821 | | | | 425,401 | |
Agios Pharmaceuticals, Inc.*,1 | | | 12,991 | | | | 1,091,634 | |
Albany Molecular Research, Inc.* | | | 5,200 | | | | 120,952 | |
AMN Healthcare Services, Inc.* | | | 42,157 | | | | 722,993 | |
Anika Therapeutics, Inc.* | | | 8,600 | | | | 345,204 | |
AtriCure, Inc.* | | | 55,776 | | | | 972,734 | |
Avalanche Biotechnologies, Inc.*,1 | | | 13,657 | | | | 490,013 | |
Avanir Pharmaceuticals, Inc.* | | | 57,075 | | | | 738,551 | |
BioDelivery Sciences International, Inc.*,1 | | | 38,911 | | | | 677,051 | |
BioScrip, Inc.*,1 | | | 128,900 | | | | 832,694 | |
Bluebird Bio, Inc.* | | | 23,210 | | | | 974,588 | |
Cardiovascular Systems, Inc.* | | | 59,871 | | | | 1,856,001 | |
Cross Country Healthcare, Inc.* | | | 23,600 | | | | 228,212 | |
Depomed, Inc.* | | | 89,505 | | | | 1,378,377 | |
Endologix, Inc.* | | | 9,683 | | | | 110,386 | |
Epizyme, Inc.*,1 | | | 14,442 | | | | 383,146 | |
The accompanying notes are an integral part of these financial statements.
21
AMG Managers Emerging Opportunities Fund
Schedule of Portfolio Investments (continued)
| | | | | | | | |
| | | Shares | | | Value | |
Health Care—19.8% (continued) | | | | | | | | |
Exactech, Inc.* | | | 61,000 | | | $ | 1,299,300 | |
ExamWorks Group, Inc.* | | | 15,995 | | | | 620,286 | |
Fluidigm Corp.* | | | 58,532 | | | | 1,697,428 | |
Foundation Medicine, Inc.* | | | 18,070 | | | | 467,652 | |
Harvard Bioscience, Inc.* | | | 54,000 | | | | 259,200 | |
HealthEquity, Inc.* | | | 47,391 | | | | 966,776 | |
Heska Corp.* | | | 8,700 | | | | 121,713 | |
Icad, Inc.* | | | 40,900 | | | | 460,125 | |
Imprivata, Inc.*,1 | | | 33,610 | | | | 523,980 | |
Infinity Pharmaceuticals, Inc.* | | | 35,407 | | | | 482,243 | |
Inogen, Inc.* | | | 33,422 | | | | 789,094 | |
Intersect ENT, Inc.* | | | 39,774 | | | | 755,308 | |
K2M Group Holdings, Inc.* | | | 43,880 | | | | 706,468 | |
Karyopharm Therapeutics, Inc.*,1 | | | 18,425 | | | | 756,899 | |
Kite Pharma, Inc.*,1 | | | 11,948 | | | | 441,957 | |
LDR Holding Corp.* | | | 14,608 | | | | 503,100 | |
MiMedx Group, Inc.*,1 | | | 63,464 | | | | 646,064 | |
NanoString Technologies, Inc.* | | | 34,161 | | | | 363,815 | |
NeoGenomics, Inc.* | | | 61,239 | | | | 346,000 | |
Neurocrine Biosciences, Inc.* | | | 35,524 | | | | 657,904 | |
NxStage Medical, Inc.* | | | 49,413 | | | | 749,101 | |
Oxford Immunotec Global PLC*,1 | | | 22,098 | | | | 341,193 | |
ProQR Therapeutics N.V.*,1 | | | 16,743 | | | | 214,813 | |
The Providence Service Corp.* | | | 9,900 | | | | 437,382 | |
PTC Therapeutics, Inc.* | | | 17,175 | | | | 701,942 | |
Receptos, Inc.* | | | 13,570 | | | | 1,406,531 | |
Repligen Corp.* | | | 11,368 | | | | 286,701 | |
Revance Therapeutics, Inc.* | | | 13,217 | | | | 266,455 | |
RTI Surgical, Inc.* | | | 60,900 | | | | 309,981 | |
Sangamo BioSciences, Inc.*,1 | | | 31,645 | | | | 384,170 | |
Sientra, Inc.* | | | 11,500 | | | | 204,700 | |
Spectranetics Corp.* | | | 31,521 | | | | 1,001,422 | |
Streamline Health Solutions, Inc.* | | | 102,300 | | | | 399,993 | |
SurModics, Inc.* | | | 59,700 | | | | 1,292,505 | |
Symmetry Medical, Inc.* | | | 47,100 | | | | 466,290 | |
TESARO, Inc.*,1 | | | 18,246 | | | | 507,604 | |
U.S. Physical Therapy, Inc. | | | 42,276 | | | | 1,824,209 | |
Ultragenyx Pharmaceutical, Inc.*,1 | | | 11,809 | | | | 555,141 | |
Utah Medical Products, Inc. | | | 2,100 | | | | 119,280 | |
Vanda Pharmaceuticals, Inc.* | | | 35,035 | | | | 420,770 | |
| | | | | | | | |
| | | Shares | | | Value | |
Vascular Solutions, Inc.* | | | 17,500 | | | $ | 514,675 | |
Verastem, Inc.*,1 | | | 32,304 | | | | 306,565 | |
Zeltiq Aesthetics, Inc.* | | | 39,587 | | | | 1,015,011 | |
Total Health Care | | | | | | | 40,465,150 | |
Industrials—18.0% | | | | | | | | |
Acacia Research Corp.1 | | | 15,400 | | | | 277,200 | |
ACCO Brands Corp.* | | | 121,400 | | | | 999,122 | |
Aceto Corp. | | | 18,700 | | | | 425,238 | |
Aerovironment, Inc.* | | | 21,653 | | | | 663,664 | |
Air Transport Services Group, Inc.* | | | 39,600 | | | | 323,928 | |
Alamo Group, Inc. | | | 11,559 | | | | 495,188 | |
The Allied Defense Group, Inc.*,4 | | | 38,600 | | | | 3,088 | |
Ameresco, Inc., Class A*,1 | | | 30,200 | | | | 248,848 | |
Apogee Enterprises, Inc. | | | 22,618 | | | | 992,930 | |
Astronics Corp.* | | | 28,303 | | | | 1,466,391 | |
AZZ, Inc. | | | 38,600 | | | | 1,804,936 | |
Barrett Business Services, Inc. | | | 8,800 | | | | 206,888 | |
Columbus McKinnon Corp. | | | 91,300 | | | | 2,597,485 | |
Covenant Transportation Group, Inc., Class A* | | | 35,619 | | | | 738,738 | |
CRA International, Inc.* | | | 11,850 | | | | 355,500 | |
CTPartners Executive Search, Inc.* | | | 17,241 | | | | 314,648 | |
Ducommun, Inc.* | | | 29,400 | | | | 776,454 | |
Dynamic Materials Corp. | | | 12,200 | | | | 222,162 | |
Echo Global Logistics, Inc.* | | | 22,215 | | | | 580,478 | |
Ennis, Inc. | | | 96,450 | | | | 1,430,353 | |
Enphase Energy, Inc.*,1 | | | 22,558 | | | | 338,821 | |
FreightCar America, Inc. | | | 13,200 | | | | 435,204 | |
Furmanite Corp.* | | | 55,100 | | | | 412,148 | |
Gibraltar Industries, Inc.* | | | 15,075 | | | | 229,894 | |
Global Power Equipment Group, Inc. | | | 18,000 | | | | 245,340 | |
GP Strategies Corp.* | | | 31,100 | | | | 1,031,276 | |
Graham Corp. | | | 30,382 | | | | 1,017,797 | |
The Greenbrier Cos., Inc.1 | | | 26,300 | | | | 1,644,802 | |
H&E Equipment Services, Inc. | | | 13,044 | | | | 487,715 | |
Hudson Technologies, Inc.* | | | 135,000 | | | | 602,100 | |
Interface, Inc. | | | 35,300 | | | | 565,859 | |
The KEYW Holding Corp.* | | | 45,700 | | | | 463,855 | |
Kimball International, Inc., Class B | | | 7,500 | | | | 134,850 | |
LB Foster Co., Class A | | | 9,650 | | | | 521,968 | |
Lydall, Inc.* | | | 12,000 | | | | 371,160 | |
Marten Transport, Ltd. | | | 49,437 | | | | 969,954 | |
Mistras Group, Inc.* | | | 15,000 | | | | 247,350 | |
The accompanying notes are an integral part of these financial statements.
22
AMG Managers Emerging Opportunities Fund
Schedule of Portfolio Investments (continued)
| | | | | | | | |
| | | Shares | | | Value | |
Industrials—18.0% (continued) | | | | | | | | |
NN, Inc. | | | 44,950 | | | $ | 1,123,750 | |
Northwest Pipe Co.* | | | 13,600 | | | | 486,608 | |
Old Dominion Freight Line, Inc.* | | | 15,725 | | | | 1,145,881 | |
Orion Marine Group, Inc.* | | | 47,900 | | | | 524,984 | |
PAM Transportation Services, Inc.* | | | 2,900 | | | | 124,642 | |
Patrick Industries, Inc.* | | | 20,500 | | | | 875,760 | |
Paylocity Holding Corp.* | | | 27,905 | | | | 683,673 | |
Performant Financial Corp.* | | | 43,400 | | | | 374,542 | |
PGT, Inc.* | | | 64,100 | | | | 602,860 | |
Pike Corp.* | | | 20,400 | | | | 243,576 | |
Power Solutions International, Inc.* | | | 11,161 | | | | 731,045 | |
Quality Distribution, Inc.* | | | 20,300 | | | | 263,088 | |
Radiant Logistics, Inc.* | | | 32,600 | | | | 126,162 | |
Sparton Corp.* | | | 42,200 | | | | 1,143,620 | |
Sun Hydraulics Corp. | | | 23,450 | | | | 933,544 | |
Taser International, Inc.*,1 | | | 53,901 | | | | 1,015,495 | |
Trex Co., Inc.* | | | 18,955 | | | | 815,065 | |
US Ecology, Inc. | | | 17,823 | | | | 896,140 | |
Total Industrials | | | | | | | 36,753,767 | |
Information Technology—20.7% | | | | | | | | |
Ambarella, Inc.* | | | 24,983 | | | | 1,106,497 | |
Amber Road, Inc.*,1 | | | 70,097 | | | | 935,795 | |
American Software, Inc., Class A | | | 38,950 | | | | 376,257 | |
Aspen Technology, Inc.* | | | 7,700 | | | | 284,361 | |
Bel Fuse, Inc., Class B | | | 9,900 | | | | 280,071 | |
Benefitfocus, Inc.*,1 | | | 38,800 | | | | 1,075,148 | |
Borderfree, Inc.*,1 | | | 37,512 | | | | 411,132 | |
Callidus Software, Inc.* | | | 35,590 | | | | 501,463 | |
ChannelAdvisor Corp.* | | | 24,160 | | | | 335,582 | |
Ciber, Inc.* | | | 98,300 | | | | 321,441 | |
Computer Task Group, Inc. | | | 56,850 | | | | 500,280 | |
comScore, Inc.* | | | 33,314 | | | | 1,403,852 | |
Control4 Corp.*,1 | | | 16,473 | | | | 255,496 | |
Cray, Inc.*,1 | | | 14,963 | | | | 518,618 | |
CTS Corp. | | | 26,900 | | | | 494,960 | |
CYREN, Ltd.* | | | 151,900 | | | | 270,382 | |
Datalink Corp.* | | | 21,000 | | | | 265,650 | |
Digi International, Inc.* | | | 28,783 | | | | 238,323 | |
Dot Hill Systems Corp.* | | | 65,200 | | | | 257,540 | |
| | | | | | | | |
| | | Shares | | | Value | |
Ellie Mae, Inc.* | | | 23,348 | | | $ | 896,096 | |
ePlus, Inc.* | | | 3,800 | | | | 232,066 | |
Evolving Systems, Inc. | | | 10,700 | | | | 116,630 | |
FARO Technologies, Inc.* | | | 20,342 | | | | 1,139,152 | |
Glu Mobile, Inc.* | | | 163,400 | | | | 632,358 | |
GSI Group, Inc.* | | | 76,300 | | | | 980,455 | |
The Hackett Group, Inc. | | | 39,000 | | | | 273,390 | |
Information Services Group, Inc.* | | | 59,600 | | | | 252,108 | |
Inphi Corp.* | | | 42,179 | | | | 652,931 | |
Integrated Silicon Solution, Inc. | | | 69,860 | | | | 948,699 | |
Interactive Intelligence Group, Inc.* | | | 33,800 | | | | 1,631,188 | |
IXYS Corp. | | | 41,912 | | | | 489,113 | |
Lionbridge Technologies, Inc.* | | | 105,500 | | | | 509,565 | |
LivePerson, Inc.* | | | 46,802 | | | | 673,949 | |
Luxoft Holding, Inc.* | | | 18,941 | | | | 757,451 | |
Marchex, Inc., Class B | | | 27,500 | | | | 105,325 | |
Marketo, Inc.*,1 | | | 13,823 | | | | 446,068 | |
Materialise N.V., ADR*,1 | | | 48,565 | | | | 534,701 | |
Mavenir Systems, Inc.*,1 | | | 24,877 | | | | 304,992 | |
Maxwell Technologies, Inc.*,1 | | | 42,692 | | | | 497,789 | |
NCI, Inc., Class A* | | | 25,500 | | | | 259,590 | |
NIC, Inc. | | | 39,800 | | | | 733,514 | |
Oplink Communications, Inc. | | | 25,600 | | | | 533,760 | |
PC Connection, Inc. | | | 21,446 | | | | 511,487 | |
PC-Tel, Inc. | | | 30,700 | | | | 236,390 | |
PFSweb, Inc.* | | | 11,000 | | | | 129,470 | |
Planet Payment, Inc.* | | | 179,410 | | | | 303,203 | |
Q2 Holdings, Inc.* | | | 26,429 | | | | 398,814 | |
QAD, Inc., Class A | | | 6,000 | | | | 129,060 | |
Qualys, Inc.* | | | 66,663 | | | | 2,138,549 | |
Rally Software Development Corp.* | | | 36,619 | | | | 374,246 | |
Reis, Inc. | | | 8,278 | | | | 193,705 | |
The Rubicon Project, Inc.* | | | 55,329 | | | | 634,071 | |
Ruckus Wireless, Inc.* | | | 65,397 | | | | 848,853 | |
Sapiens International Corp. N.V.*,1 | | | 57,000 | | | | 451,440 | |
ShoreTel, Inc.* | | | 28,400 | | | | 229,756 | |
Sierra Wireless, Inc.*,1 | | | 10,006 | | | | 273,964 | |
Silicon Motion Technology Corp., ADR | | | 9,663 | | | | 229,110 | |
Silver Spring Networks, Inc.* | | | 25,116 | | | | 240,611 | |
Spansion, Inc., Class A* | | | 28,850 | | | | 593,733 | |
SPS Commerce, Inc.* | | | 12,590 | | | | 733,997 | |
TechTarget, Inc.* | | | 77,224 | | | | 736,717 | |
The accompanying notes are an integral part of these financial statements.
23
AMG Managers Emerging Opportunities Fund
Schedule of Portfolio Investments (continued)
| | | | | | | | |
| | | Shares | | | Value | |
Information Technology—20.7% (continued) | |
Tessco Technologies, Inc. | | | 48,500 | | | $ | 1,539,875 | |
Textura Corp.* | | | 17,907 | | | | 477,042 | |
TrueCar, Inc.*,1 | | | 23,737 | | | | 398,782 | |
TubeMogul, Inc.* | | | 19,909 | | | | 309,386 | |
Tucows, Inc., Class A* | | | 8,000 | | | | 124,400 | |
Tyler Technologies, Inc.* | | | 18,500 | | | | 2,070,520 | |
Ultra Clean Holdings, Inc.* | | | 63,800 | | | | 560,164 | |
Varonis Systems, Inc.*,1 | | | 31,055 | | | | 604,951 | |
Violin Memory, Inc.* | | | 85,234 | | | | 412,533 | |
Virtusa Corp.* | | | 24,923 | | | | 1,021,345 | |
Vishay Precision Group, Inc.* | | | 66,150 | | | | 1,123,888 | |
Wix.com, Ltd.* | | | 16,177 | | | | 274,847 | |
Xoom Corp.* | | | 7,149 | | | | 107,950 | |
Yodlee, Inc.*,1 | | | 39,725 | | | | 549,397 | |
Total Information Technology | | | | | | | 42,395,994 | |
Materials—3.1% | | | | | | | | |
Flotek Industries, Inc.* | | | 25,386 | | | | 562,554 | |
FutureFuel Corp. | | | 15,600 | | | | 207,792 | |
Koppers Holdings, Inc. | | | 29,200 | | | | 1,152,816 | |
Landec Corp.* | | | 65,300 | | | | 822,127 | |
Materion Corp. | | | 15,825 | | | | 624,296 | |
Myers Industries, Inc. | | | 18,800 | | | | 280,872 | |
OMNOVA Solutions, Inc.* | | | 196,800 | | | | 1,383,504 | |
UFP Technologies, Inc.* | | | 5,325 | | | | 117,256 | |
Universal Stainless & Alloy Products, Inc.* | | | 46,000 | | | | 1,182,660 | |
Total Materials | | | | | | | 6,333,877 | |
Telecommunication Services—1.4% | |
8x8, Inc.* | | | 99,723 | | | | 783,823 | |
IDT Corp., Class B | | | 28,200 | | | | 464,736 | |
inContact, Inc.* | | | 39,585 | | | | 352,306 | |
Premiere Global Services, Inc.* | | | 55,500 | | | | 581,085 | |
Shenandoah Telecommunications Co. | | | 17,800 | | | | 526,702 | |
Towerstream Corp.* | | | 181,500 | | | | 226,875 | |
Total Telecommunication Services | | | | 2,935,527 | |
Utilities—0.8% | | | | | | | | |
Chesapeake Utilities Corp. | | | 11,062 | | | | 535,733 | |
Connecticut Water Service, Inc. | | | 3,200 | | | | 118,944 | |
Middlesex Water Co. | | | 11,900 | | | | 268,345 | |
| | | | | | | | |
| | | Shares | | | Value | |
Unitil Corp. | | | 21,000 | | | $ | 731,640 | |
Total Utilities | | | | | | | 1,654,662 | |
Total Common Stocks (cost $150,568,066) | | | | | | | 200,550,948 | |
Exchange Traded Funds—0.2% | | | | | | | | |
SPDR S&P Regional Banking ETF1 (cost $250,803) | | | 8,500 | | | | 340,680 | |
| | |
| | | Principal
Amount | | | | |
Short-Term Investments—8.2% | |
Repurchase Agreements—6.2%2 | |
Cantor Fitzgerald Securities, Inc., dated 10/31/14, due 11/03/14, 0.130%, total to be received $3,031,745 (collateralized by various U.S. Government Agency Obligations, 0.000%—10.500%, 01/01/15—09/20/64, totaling $3,092,346) | | $ | 3,031,712 | | | | 3,031,712 | |
Citigroup Global Markets, Inc., dated 10/31/14, due 11/03/14, 0.100%, total to be received $638,216 (collateralized by various U.S. Government Agency Obligations, 0.000%—8.750%, 10/31/16—02/15/41, totaling $650,975) | | | 638,211 | | | | 638,211 | |
Daiwa Capital Markets America, dated 10/31/14, due 11/03/14, 0.150%, total to be received $3,031,750 (collateralized by various U.S. Government Agency Obligations, 0.000%—8.000%, 09/24/15—03/01/48, totaling $3,092,347) | | | 3,031,712 | | | | 3,031,712 | |
Nomura Securities USA, Inc., dated 10/31/14, due 11/03/14, 0.110%, total to be received $3,031,740 (collateralized by various U.S. Government Agency Obligations, 0.000%—7.250%, 11/03/14—11/01/44, totaling $3,092,346) | | | 3,031,712 | | | | 3,031,712 | |
State of Wisconsin Investment Board, dated 10/31/14, due 11/03/14, 0.150%, total to be received $3,031,750 (collateralized by various U.S. Government Agency Obligations, 0.125%—2.500%, 04/15/16—01/15/29, totaling $3,096,336) | | | 3,031,712 | | | | 3,031,712 | |
Total Repurchase Agreements | | | | | | | 12,765,059 | |
| | |
| | | Shares | | | | |
Other Investment Companies—2.0%3 | |
Dreyfus Institutional Cash Advantage Fund, Institutional Class Shares, 0.06% | | | 4,033,360 | | | | 4,033,360 | |
Total Short-Term Investments
(cost $16,798,419) | | | | 16,798,419 | |
Total Investments—106.4%
(cost $167,617,288) | | | | 217,690,047 | |
Other Assets, less
Liabilities—(6.4)% | | | | (13,010,719 | ) |
Net Assets—100.0% | | | | | | $ | 204,679,328 | |
The accompanying notes are an integral part of these financial statements.
24
AMG Managers Real Estate Securities Fund
Portfolio Manager’s Comments
AMG Managers Real Estate Securities Fund seeks a combination of income and long-term capital appreciation by investing in stocks of companies that are principally engaged in owning and operating commercial real estate properties for the benefit of their investors, including real estate investment trusts (REITs). AMG Funds LLC utilizes an independent subadvisor, CenterSquare Investment Management, LLC (“CenterSquare”), to manage the assets of this Portfolio.
THE PORTFOLIO MANAGER
CenterSquare Investment Management, Inc.
The investment team at CenterSquare believes real estate securities play an important role in a multi-asset class investment portfolio. CenterSquare’s strategy recognizes that real estate securities are not simply stocks or real estate. They are hybrid financial investments that must be valued on the basis of a number of meaningful factors, only one of which is the value of the firm’s property portfolio. To accurately assess the relative value of a REIT, CenterSquare takes into account critical business and market factors, such as: the company’s capitalization, its position within public capital markets and the quality of the management team.
CenterSquare believes that investment success is the result of the company’s ability to provide a consistently accurate answer to the question at the heart of its value-oriented investment strategy: which REITs do they believe will generate the highest risk-adjusted returns? CenterSquare believes that a diversified portfolio with a value orientation will result in strong risk-adjusted returns.
CenterSquare employs a value-oriented investment process with two distinct and complementary components: bottom-up real estate research and the company’s proprietary Relative Value Model (RVM) securities valuation process, which was designed to provide a uniform basis for evaluating the validity of a security’s
trading price. Combining real estate research and the RVM process has been central to CenterSquare’s track record of delivering strong returns without incurring high levels of risk.
THE YEAR IN REVIEW
For the fiscal year ended October 31, 2014, the AMG Managers Real Estate Securities Fund returned 19.9%, compared with 20.7% for its benchmark, the Dow Jones U.S. Select REIT Index. During the same period, the S&P 500 Index returned 17.3%.
The U.S. REIT market outperformed the broader equity markets during the year ended October 31, 2014, as concern about rapidly rising interest rates faded and investors instead turned attention to the very healthy real estate operating environment and favorable financing backdrop. Rental rate growth started to accelerate across all sectors in 2014, as occupancy levels fully recovered to pre-recession levels. The low interest rate environment has stimulated demand for income-oriented investments such as real estate and REITs.
All major property sectors generated positive total returns during the fiscal year. Property sector performance was led by the specialty, residential and hotel sectors which posted total returns of 35.8%, 28.5% and 27.2%, respectively. Even the worst performing sectors — industrial and health care — generated healthy total returns of 8.9% and 11.2%, respectively.
The Fund underperformed the benchmark due to stock selection and sector positioning. The portfolio’s underweight position to the health care sector, along with strong stock picking within the sector, generated positive relative performance. Stock picks within the office, shopping center and specialty sectors were other notable positive contributors to performance. Stock selection within the residential and hotel sectors, however, hurt relative returns. Sector selection was a negative contributor due to the portfolio’s underweight to
residential and specialty sectors, both of which were top performers on an absolute basis. The Fund’s overweight to office and industrial sectors also detracted from performance. Additionally, cash detracted meaningfully from performance in the rising market.
OUTLOOK
The U.S. economy has strengthened relative to the first half of the year and relative to the world’s other major economies. Job growth, heretofore a laggard, has been healthy and assuages concerns about the breadth of the recovery. As recent data has led some to question the trajectory of growth in Europe and parts of Asia, U.S. real assets have attracted a greater share of investor interest. Accelerating economic growth and the wind-down of the Federal Reserve’s quantitative easing program have brought to the forefront the question of when rates will rise. It is our view that interest rates are likely headed higher in the medium term, but that the increase will be measured and gradual.
A slowly improving economy continues to favor real estate. Today’s historically low levels of new construction, offer REITs the chance to capitalize on strong demand without pressure from additional supply. The strongest property sectors should be those tied to the energy and information technology industries where job growth has been strongest. The portfolio remains under-exposed to sectors that are most likely to lag in a rising interest rate environment, notably health care and triple net. We believe REITs offer attractive risk-adjusted total returns and that REITs offer good investment opportunities to investors seeking high and growing dividends.
This commentary reflects the viewpoints of the portfolio manager, CenterSquare Investment Management, Inc. as of October 31, 2014 and is not intended as a forecast or guarantee of future results.
25
AMG Managers Real Estate Securities Fund
Portfolio Manager’s Comments (continued)
CUMULATIVE TOTAL RETURN PERFORMANCE
AMG Managers Real Estate Securities Fund’s cumulative total return is based on the daily change in net asset value (NAV), and assumes that all dividends and distributions were reinvested. This chart compares a hypothetical $10,000 investment made in AMG Managers Real Estate Securities Fund on October 31, 2004, to a $10,000 investment made in the Dow Jones U.S. Select REIT Index for the same time period. The graph and table do not reflect the deduction of taxes that a shareholder would pay on a Fund distribution or redemption of shares. The listed returns for the Fund are net of expenses and the returns for the index exclude expenses. Total returns would have been lower had certain expenses not been reduced.
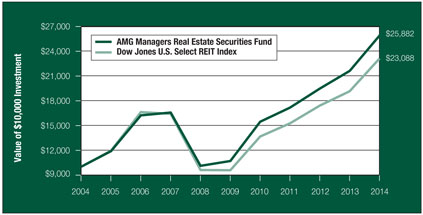
The table below shows the average annual total returns for the AMG Managers Real Estate Securities Fund and the S&P 500 and Dow Jones U.S. Select REIT indices for the same time periods ended October 31, 2014.
| | | | | | | | | | | | |
| | | One | | | Five | | | Ten | |
| Average Annual Total Returns1 | | Year | | | Years | | | Years | |
AMG Managers Real Estate Securities Fund2,3,4 | | | 19.88 | % | | | 19.35 | % | | | 9.98 | % |
Dow Jones U.S. Select REIT Index5 | | | 20.69 | % | | | 19.25 | % | | | 8.73 | % |
S&P 500 Index6 | | | 17.27 | % | | | 16.69 | % | | | 8.20 | % |
The performance data shown represents past performance. Past performance is not a guarantee of future results. Current performance may be lower or higher than the performance data quoted. The investment return and principal value of an investment in the Fund will fluctuate so that an investor’s shares, when redeemed, may be worth more or less than their original cost.
Investors should carefully consider the Fund’s investment objectives, risks, charges and expenses before investing. For performance information through the most recent month end, current net asset values per share for the Fund and other information, please call (800) 835-3879 or visit our website at www.amgfunds.com for a free prospectus. Read it carefully before investing or sending money.
Distributed by AMG Distributors, Inc., member FINRA.
| 1 | Total return equals income yield plus share price change and assumes reinvestment of all dividends and capital gain distributions. Returns are net of fees and may reflect offsets of Fund expenses as described in the prospectus. No adjustment has been made for taxes payable by shareholders on their reinvested dividends and capital gain distributions. Returns for periods greater than one year are annualized. The listed returns on the Fund are net of expenses and based on the published NAV as of October 31, 2014. All returns are in U.S. dollars ($). |
| 2 | From time to time, the Fund’s advisor has waived its fees and/or absorbed Fund expenses, which has resulted in higher returns. |
| 3 | The Fund is subject to special risk considerations similar to those associated with the direct ownership of real estate. Real estate valuations may be subject to factors such as changing general and local economic, financial, competitive, and environmental conditions. |
| 4 | Companies that are in similar businesses may be similarly affected by particular economic or market events; to the extent the Fund has substantial holdings within a particular sector, the risks associated with that sector increase. |
| 5 | The Dow Jones U.S. Select REIT Index measures U.S. publicly traded Real Estate Investment Trusts. Unlike the Fund, the Dow Jones U.S. Select REIT Index is unmanaged, is not available for investment, and does not incur expenses. |
| 6 | The S&P 500 Index is a capitalization-weighted index of 500 stocks. The S&P 500 Index is designed to measure performance of the broad domestic economy through changes in the aggregate market value of 500 stocks representing all major industries. Unlike the Fund, the Index is unmanaged, is not available for investment, and does not incur expenses. |
The S&P 500 Index is proprietary data of Standard & Poor’s, a division of McGraw-Hill Companies, Inc. All rights reserved.
The Dow Jones U.S. Select REIT Index is proprietary data of Standard & Poor’s Dow Jones Indices LLC, a division of McGraw-Hill Companies, Inc. All rights reserved.
Not FDIC insured, nor bank guaranteed. May lose value.
26
AMG Managers Real Estate Securities Fund
Fund Snapshots (unaudited)
October 31, 2014
PORTFOLIO BREAKDOWN
| | | | |
Sector | | AMG Managers
Real Estate
Securities
Fund** | |
REITs (Office Properties) | | | 18.7 | % |
REITs (Apartments) | | | 17.5 | % |
REITs (Regional Malls) | | | 13.5 | % |
REITs (Diversified) | | | 11.1 | % |
REITs (Shopping Centers) | | | 8.5 | % |
REITs (Health Care) | | | 8.4 | % |
REITs (Hotels) | | | 7.7 | % |
REITs (Storage) | | | 6.8 | % |
REITs (Warehouse/Industrials) | | | 6.0 | % |
REITS (Single Tenant) | | | 0.3 | % |
Other Assets and Liabilities | | | 1.5 | % |
| ** | As a percentage of net assets. |
TOP TEN HOLDINGS
| | | | |
Security Name | | % of Net Assets | |
Simon Property Group, Inc.* | | | 7.4 | % |
Boston Properties, Inc.* | | | 5.0 | |
Prologis, Inc.* | | | 4.8 | |
Essex Property Trust, Inc.* | | | 4.5 | |
Health Care REIT, Inc. | | | 4.3 | |
General Growth Properties, Inc.* | | | 4.1 | |
Public Storage* | | | 4.0 | |
UDR, Inc.* | | | 3.8 | |
Ventas, Inc.* | | | 3.2 | |
Equity Residential | | | 3.1 | |
| | | | |
Top Ten as a Group | | | 44.2 | % |
| | | | |
| * | Top Ten Holding at April 30, 2014. |
Because a fund’s strategy may result in multiple investments in particular sectors of the economy, its performance may depend on the performance of those sectors and may fluctuate more widely than investments diversified across more sectors. For additional information on these and other risk considerations, please see the Fund’s prospectus.
Any sectors, industries, or securities discussed should not be perceived as investment recommendations. Mention of a specific security should not be considered a recommendation to buy or solicitation to sell that security. Specific securities mentioned in this report may have been sold from the Fund’s portfolio of investments by the time you receive this report.
27
AMG Managers Real Estate Securities Fund
Schedule of Portfolio Investments
October 31, 2014
| | | | | | | | |
| | | Shares | | | Value | |
Common Stocks—0.9% | |
Starwood Hotels & Resorts Worldwide, Inc. (Consumer Discretionary) (cost $2,972,542) | | | 38,050 | | | $ | 2,916,913 | |
REITs—98.5% | | | | | | | | |
Apartments—17.5% | | | | | |
American Campus Communities, Inc. | | | 81,300 | | | | 3,192,651 | |
AvalonBay Communities, Inc. | | | 51,210 | | | | 7,980,566 | |
Camden Property Trust | | | 40,510 | | | | 3,105,902 | |
Education Realty Trust, Inc. | | | 109,300 | | | | 1,230,718 | |
Equity Residential | | | 142,170 | | | | 9,889,345 | |
Essex Property Trust, Inc. | | | 69,550 | | | | 14,032,408 | |
Mid-America Apartment Communities, Inc. | | | 52,780 | | | | 3,729,435 | |
UDR, Inc. | | | 399,120 | | | | 12,065,398 | |
Total Apartments | | | | | | | 55,226,423 | |
Diversified—11.1% | | | | | |
Digital Realty Trust, Inc. | | | 52,620 | | | | 3,630,254 | |
Duke Realty Corp. | | | 300,870 | | | | 5,704,495 | |
Liberty Property Trust | | | 204,410 | | | | 7,107,336 | |
National Health Investors, Inc. | | | 23,820 | | | | 1,569,976 | |
PS Business Parks, Inc. | | | 52,190 | | | | 4,395,442 | |
Retail Properties of America, Inc., Class A | | | 175,740 | | | | 2,757,361 | |
Vornado Realty Trust | | | 70,740 | | | | 7,744,615 | |
Washington Real Estate Investment Trust | | | 79,170 | | | | 2,237,344 | |
Total Diversified | | | | | | | 35,146,823 | |
Health Care—8.4% | |
Aviv REIT, Inc. | | | 80,570 | | | | 2,717,626 | |
Health Care REIT, Inc. | | | 190,530 | | | | 13,548,588 | |
Ventas, Inc. | | | 148,240 | | | | 10,155,922 | |
Total Health Care | | | | | | | 26,422,136 | |
Hotels—7.7% | | | | | |
Chesapeake Lodging Trust | | | 44,450 | | | | 1,468,628 | |
Host Hotels & Resorts, Inc. | | | 411,270 | | | | 9,586,704 | |
Pebblebrook Hotel Trust | | | 35,630 | | | | 1,517,838 | |
Strategic Hotels & Resorts, Inc. * | | | 314,450 | | | | 4,040,683 | |
Sunstone Hotel Investors, Inc. | | | 508,480 | | | | 7,784,829 | |
Total Hotels | | | | | | | 24,398,682 | |
Office Properties—18.7% | |
Alexandria Real Estate Equities, Inc. | | | 30,250 | | | | 2,510,750 | |
Boston Properties, Inc. | | | 124,800 | | | | 15,818,400 | |
Brandywine Realty Trust | | | 345,040 | | | | 5,323,967 | |
Corporate Office Properties Trust | | | 52,960 | | | | 1,447,926 | |
| | | | | | | | |
| | | Shares | | | Value | |
Empire State Realty Trust, Inc., Class A | | | 71,660 | | | $ | 1,143,694 | |
Equity Commonwealth | | | 119,650 | | | | 3,195,851 | |
Highwoods Properties, Inc. | | | 169,770 | | | | 7,278,040 | |
Hudson Pacific Properties, Inc. | | | 175,490 | | | | 4,792,632 | |
Kilroy Realty Corp. | | | 93,890 | | | | 6,360,109 | |
Parkway Properties, Inc. | | | 134,920 | | | | 2,705,146 | |
SL Green Realty Corp. | | | 73,870 | | | | 8,546,759 | |
Total Office Properties | | | | | | | 59,123,274 | |
Regional Malls—13.5% | |
General Growth Properties, Inc. | | | 503,320 | | | | 13,041,021 | |
The Macerich Co. | | | 28,840 | | | | 2,033,220 | |
Simon Property Group, Inc. | | | 130,460 | | | | 23,379,737 | |
Tanger Factory Outlet Centers, Inc. | | | 120,020 | | | | 4,293,115 | |
Total Regional Malls | | | | | | | 42,747,093 | |
Shopping Centers—8.5% | |
Acadia Realty Trust | | | 80,220 | | | | 2,502,864 | |
DDR Corp. | | | 156,290 | | | | 2,835,101 | |
Excel Trust, Inc. | | | 33,960 | | | | 441,480 | |
Federal Realty Investment Trust | | | 20,860 | | | | 2,749,348 | |
Kimco Realty Corp. | | | 184,430 | | | | 4,601,528 | |
Ramco-Gershenson Properties Trust | | | 126,640 | | | | 2,213,667 | |
Regency Centers Corp. | | | 122,350 | | | | 7,426,645 | |
Retail Opportunity Investments Corp. | | | 240,410 | | | | 3,928,299 | |
Total Shopping Centers | | | | | | | 26,698,932 | |
Single Tenant—0.3% | |
Spirit Realty Capital, Inc. | | | 76,980 | | | | 916,062 | |
Storage—6.8% | | | | | |
CubeSmart | | | 49,790 | | | | 1,048,079 | |
Extra Space Storage, Inc. | | | 56,060 | | | | 3,260,450 | |
Public Storage | | | 68,010 | | | | 12,536,963 | |
Sovran Self Storage, Inc. | | | 54,390 | | | | 4,628,045 | |
Total Storage | | | | | | | 21,473,537 | |
Warehouse/Industrials—6.0% | |
CyrusOne, Inc. | | | 90,760 | | | | 2,478,656 | |
Prologis, Inc. | | | 362,320 | | | | 15,090,628 | |
Rexford Industrial Realty, Inc. | | | 94,910 | | | | 1,466,360 | |
Total Warehouse
/Industrials | | | | | | | 19,035,644 | |
Total REITs
(cost $266,956,970) | | | | | | | 311,188,606 | |
The accompanying notes are an integral part of these financial statements.
28
AMG Managers Real Estate Securities Fund
Schedule of Portfolio Investments (continued)
| | | | | | | | |
| | | Shares | | | Value | |
Other Investment Companies—2.6%3 | | | | | |
Dreyfus Institutional Cash Advantage Fund, Institutional Class Shares, 0.06% (cost $8,208,901) | | | 8,208,901 | | | $ | 8,208,901 | |
| | | | |
| | | Value | |
Total Investments—102.0% | | | | |
(cost $278,138,413) | | $ | 322,314,420 | |
Other Assets, less Liabilities—(2.0)% | | | (6,356,917 | ) |
Net Assets—100.0% | | $ | 315,957,503 | |
The accompanying notes are an integral part of these financial statements.
29
Notes to Schedules of Portfolio Investments
The following footnotes and abbreviations should be read in conjunction with each of the Schedules of Portfolio Investments previously presented in this report.
At October 31, 2014, the approximate cost of investments for federal income tax purposes and the aggregate gross unrealized appreciation and/or depreciation based on tax cost were as follows:
| | | | | | | | | | | | | | | | |
| Fund | | Cost | | | Appreciation | | | Depreciation | | | Net | |
AMG Frontier Small Cap Growth Fund | | $ | 26,587,134 | | | $ | 12,652,042 | | | $ | (1,560,381 | ) | | $ | 11,091,661 | |
AMG TimesSquare All Cap Growth Fund | | | 32,751,875 | | | | 8,243,094 | | | | (464,355 | ) | | | 7,778,739 | |
AMG Managers Emerging Opportunities Fund | | | 170,823,383 | | | | 56,899,619 | | | | (10,032,955 | ) | | | 46,866,664 | |
AMG Managers Real Estate Securities Fund | | | 279,784,651 | | | | 44,488,048 | | | | (1,958,279 | ) | | | 42,529,769 | |
| * | Non-income producing security. |
| 1 | Some or all of these shares were out on loan to various brokers as of October 31, 2014 amounting to the following: |
| | | | | | | | |
| Fund | | Market Value | | | % of Net Assets | |
AMG Frontier Small Cap Growth Fund | | $ | 1,171,270 | | | | 3.2 | % |
AMG TimesSquare All Cap Growth Fund | | | 908,119 | | | | 2.3 | % |
AMG Managers Emerging Opportunities Fund | | | 12,229,198 | | | | 6.0 | % |
| 2 | Collateral received from brokers for securities lending was invested in these short-term investments. |
| 3 | Yield shown represents the October 31, 2014, seven-day average yield, which refers to the sum of the previous seven days’ dividends paid, expressed as an annual percentage. |
| 4 | Illiquid Security: A security not readily convertible into cash such as a stock, bond or commodity that is not actively traded, and would be difficult to sell in a timely sale. The Funds may not invest more than 15% of its net assets in illiquid securities. All illiquid securities are valued by an independent pricing agent. The market value of illiquid securities at October 31, 2014, amounted to the following: |
| | | | | | | | |
| Fund | | Market Value | | | % of Net Assets | |
AMG Managers Emerging Opportunities Fund | | $ | 3,088 | | | | 0.002 | % |
As of October 31, 2014, the securities in the AMG Managers Real Estate Securities Fund were all valued using Level 1 inputs. For a detailed breakout of the common stocks and REITs by major industry classification, please refer to the Schedule of Portfolio Investments previously presented in this report.
The following tables summarize the inputs used to value the Funds’ net assets by the fair value hierarchy levels as of October 31, 2014: (See Note 1(a) in the Notes to the Financial Statements.)
| | | | | | | | | | | | | | | | |
| | | Quoted Prices in
Active Markets for Identical
Investments Level 1 | | | Significant Other Observable Inputs Level 2 | | | Significant
Unobservable Inputs Level 3 | | | Total | |
AMG Frontier Small Cap Growth Fund | | | | | | | | | | | | | | | | |
Investments in Securities | | | | | | | | | | | | | | | | |
Common Stocks† | | $ | 36,144,994 | | | | — | | | | — | | | $ | 36,144,994 | |
Short-Term Investments | | | | | | | | | | | | | | | | |
Repurchase Agreements | | | — | | | $ | 1,207,281 | | | | — | | | | 1,207,281 | |
Other Investment Companies | | | 326,520 | | | | — | | | | — | | | | 326,520 | |
| | | | | | | | | | | | | | | | |
Total Investments in Securities | | $ | 36,471,514 | | | $ | 1,207,281 | | | | — | | | $ | 37,678,795 | |
| | | | | | | | | | | | | | | | |
The accompanying notes are an integral part of these financial statements.
30
Notes to Schedules of Portfolio Investments (continued)
| | | | | | | | | | | | | | | | |
| | | Quoted Prices in
Active Markets for Identical
Investments Level 1 | | | Significant Other Observable Inputs Level 2 | | | Significant
Unobservable Inputs Level 3 | | | Total | |
AMG TimesSquare All Cap Growth Fund | | | | | | | | | | | | | | | | |
Investments in Securities | | | | | | | | | | | | | | | | |
Common Stocks† | | $ | 38,215,649 | | | | — | | | | — | | | $ | 38,215,649 | |
Short-Term Investments | | | | | | | | | | | | | | | | |
Repurchase Agreements | | | — | | | $ | 929,341 | | | | — | | | | 929,341 | |
Other Investment Companies | | | 1,385,624 | | | | — | | | | — | | | | 1,385,624 | |
| | | | | | | | | | | | | | | | |
Total Investments in Securities | | $ | 39,601,273 | | | $ | 929,341 | | | | — | | | $ | 40,530,614 | |
| | | | | | | | | | | | | | | | |
| | | | |
| | | Quoted Prices in
Active Markets
for Identical
Investments Level 1 | | | Significant Other Observable Inputs Level 2 | | | Significant
Unobservable Inputs Level 3 | | | Total | |
AMG Managers Emerging Opportunities Fund | | | | | | | | | | | | | | | | |
Investments in Securities | | | | | | | | | | | | | | | | |
Common Stocks | | | | | | | | | | | | | | | | |
Information Technology | | $ | 42,395,994 | | | | — | | | | — | | | $ | 42,395,994 | |
Health Care | | | 40,465,150 | | | | — | | | | — | | | | 40,465,150 | |
Industrials | | | 36,750,679 | | | $ | 3,088 | | | | — | | | | 36,753,767 | |
Consumer Discretionary | | | 34,452,206 | | | | — | | | | — | | | | 34,452,206 | |
Financials | | | 25,082,025 | | | | — | | | | — | | | | 25,082,025 | |
Materials | | | 6,333,877 | | | | — | | | | — | | | | 6,333,877 | |
Energy | | | 5,681,150 | | | | — | | | | — | | | | 5,681,150 | |
Consumer Staples | | | 4,796,590 | | | | — | | | | — | | | | 4,796,590 | |
Telecommunication Services | | | 2,935,527 | | | | — | | | | — | | | | 2,935,527 | |
Utilities | | | 1,654,662 | | | | — | | | | — | | | | 1,654,662 | |
Exchange Traded Funds | | | 340,680 | | | | — | | | | — | | | | 340,680 | |
Short-Term Investments | | | | | | | | | | | | | | | | |
Repurchase Agreements | | | — | | | | 12,765,059 | | | | — | | | | 12,765,059 | |
Other Investment Companies | | | 4,033,360 | | | | — | | | | — | | | | 4,033,360 | |
| | | | | | | | | | | | | | | | |
Total Investments in Securities | | $ | 204,921,900 | | | $ | 12,768,147 | | | | — | | | $ | 217,690,047 | |
| | | | | | | | | | | | | | | | |
| † | All common stocks held in the Funds are Level 1 securities. For a detailed breakout of the common stocks by major industry classification, please refer to the respective Schedule of Portfolio Investments. |
As of October 31, 2014, the Funds had no transfers between levels from the beginning of the reporting period.
INVESTMENTS DEFINITIONS AND ABBREVIATIONS:
ADR: ADR after the name of a holding stands for American Depositary Receipt, representing ownership of foreign securities on deposit with a domestic custodian bank. The value of the ADR securities is determined or significantly influenced by trading on exchanges not located in the United States or Canada. Sponsored ADRs are initiated by the underlying foreign company.
ETF: Exchange Traded Fund
REIT: Real Estate Investment Trust
The accompanying notes are an integral part of these financial statements.
31
Statement of Assets and Liabilities
October 31, 2014
| | | | | | | | | | | | |
| | | AMG Frontier
Small Cap
Growth Fund | | | AMG
TimesSquare
All Cap
Growth Fund | | | AMG Managers
Emerging
Opportunities
Fund | |
Assets: | | | | | | | | | | | | |
Investments at value* (including securities on loan valued at $1,171,270, $908,119 and $12,229,198, respectively) | | $ | 37,678,795 | | | $ | 40,530,614 | | | $ | 217,690,047 | |
Receivable for investments sold | | | 713,026 | | | | 1,555,018 | | | | 2,390,041 | |
Dividends, interest and other receivables | | | 6,076 | | | | 3,805 | | | | 64,058 | |
Receivable for Fund shares sold | | | 1,750 | | | | 4,913 | | | | 54,382 | |
Prepaid expenses | | | 11,236 | | | | 17,366 | | | | 15,327 | |
Receivable from affiliate | | | 6,611 | | | | 24,323 | | | | 33,794 | |
Total assets | | | 38,417,494 | | | | 42,136,039 | | | | 220,247,649 | |
Liabilities: | | | | | | | | | | | | |
Payable upon return of securities loaned | | | 1,207,281 | | | | 929,341 | | | | 12,765,059 | |
Payable for investments purchased | | | 862,970 | | | | 2,176,688 | | | | 2,137,789 | |
Payable for Fund shares repurchased | | | 5,314 | | | | 14,668 | | | | 332,525 | |
Accrued expenses: | | | | | | | | | | | | |
Investment advisory and management fees | | | 28,512 | | | | 23,449 | | | | 161,311 | |
Administrative fees | | | — | | | | 7,817 | | | | 40,328 | |
Shareholder servicing fees—Investor Class | | | 72 | | | | 5,456 | | | | — | |
Shareholder servicing fees—Service Class | | | — | | | | 3,347 | | | | 33,322 | |
Distribution fees—Investor Class | | | 72 | | | | 1,094 | | | | — | |
Trustees fees and expenses | | | 109 | | | | 217 | | | | 1,118 | |
Other | | | 35,978 | | | | 32,541 | | | | 96,869 | |
Total liabilities | | | 2,140,308 | | | | 3,194,618 | | | | 15,568,321 | |
Net Assets | | $ | 36,277,186 | | | $ | 38,941,421 | | | $ | 204,679,328 | |
Net Assets Represent: | | | | | | | | | | | | |
Paid-in capital | | $ | 9,025,808 | | | $ | 27,888,391 | | | $ | 135,194,748 | |
Undistributed net investment income | | | — | | | | — | | | | 126,489 | |
Accumulated net realized gain from investments | | | 15,668,600 | | | | 3,189,849 | | | | 19,285,332 | |
Net unrealized appreciation of investments | | | 11,582,778 | | | | 7,863,181 | | | | 50,072,759 | |
Net Assets | | $ | 36,277,186 | | | $ | 38,941,421 | | | $ | 204,679,328 | |
Investor Class: | | | | | | | | | | | | |
Net Assets | | $ | 364,686 | | | $ | 5,416,798 | | | | n/a | |
Shares outstanding | | | 14,520 | | | | 324,821 | | | | n/a | |
Net asset value, offering and redemption price per share | | $ | 25.12 | | | $ | 16.68 | | | | n/a | |
Service Class: | | | | | | | | | | | | |
Net Assets | | $ | 14,842,249 | | | $ | 30,197,645 | | | $ | 169,397,786 | |
Shares outstanding | | | 584,413 | | | | 1,781,651 | | | | 3,595,799 | |
Net asset value, offering and redemption price per share | | $ | 25.40 | | | $ | 16.95 | | | $ | 47.11 | |
Institutional Class: | | | | | | | | | | | | |
Net Assets | | $ | 21,070,251 | | | $ | 3,326,978 | | | $ | 35,281,542 | |
Shares outstanding | | | 820,243 | | | | 196,493 | | | | 745,595 | |
Net asset value, offering and redemption price per share | | $ | 25.69 | | | $ | 16.93 | | | $ | 47.32 | |
* Investments at cost | | $ | 26,096,017 | | | $ | 32,667,433 | | | $ | 167,617,288 | |
The accompanying notes are an integral part of these financial statements.
32
Statement of Assets and Liabilities (continued)
| | | | |
| | | AMG Managers
Real Estate
Securities Fund | |
Assets: | | | | |
Investments at value* | | $ | 322,314,420 | |
Receivable for investments sold | | | 651,609 | |
Receivable for Fund shares sold | | | 618,297 | |
Dividends, interest and other receivables | | | 63,404 | |
Prepaid expenses | | | 5,936 | |
Total assets | | | 323,653,666 | |
Liabilities: | | | | |
Payable for investments purchased | | | 6,977,992 | |
Payable for Fund shares repurchased | | | 366,164 | |
Accrued expenses: | | | | |
Investment advisory and management fees | | | 148,882 | |
Administrative fees | | | 62,034 | |
Shareholder servicing fees | | | 62,034 | |
Trustees fees and expenses | | | 44 | |
Other | | | 79,013 | |
Total liabilities | | | 7,696,163 | |
Net Assets | | $ | 315,957,503 | |
Net Assets Represent: | | | | |
Paid-in capital | | $ | 261,833,881 | |
Undistributed net investment income | | | 1,227,254 | |
Accumulated net realized gain from investments | | | 8,720,361 | |
Net unrealized appreciation of investments | | | 44,176,007 | |
Net Assets | | $ | 315,957,503 | |
Shares outstanding | | | 26,268,328 | |
Net asset value, offering and redemption price per share | | $ | 12.03 | |
* Investments at cost | | $ | 278,138,413 | |
The accompanying notes are an integral part of these financial statements.
33
Statement of Operations
For the fiscal year ended October 31, 2014
| | | | | | | | | | | | | | | | |
| | | AMG Frontier
Small Cap
Growth Fund | | | AMG
TimesSquare
All Cap
Growth Fund | | | AMG Managers
Emerging
Opportunities
Fund | | | AMG Managers
Real Estate
Securities Fund | |
Investment Income: | | | | | | | | | | | | | | | | |
Dividend income | | $ | 269,172 | 1 | | $ | 277,676 | | | $ | 1,543,804 | 2 | | $ | 6,205,895 | |
Securities lending income | | | 77,120 | | | | 736 | | | | 201,522 | | | | — | |
Interest income | | | — | | | | — | | | | 118 | | | | — | |
Foreign withholding tax | | | (2,073 | ) | | | — | | | | — | | | | — | |
Total investment income | | | 344,219 | | | | 278,412 | | | | 1,745,444 | | | | 6,205,895 | |
Expenses: | | | | | | | | | | | | | | | | |
Investment advisory and management fees | | | 487,263 | | | | 284,265 | | | | 2,170,315 | | | | 1,508,052 | |
Administrative fees | | | — | | | | 94,755 | | | | 542,579 | | | | 628,355 | |
Distribution fees—Investor Class | | | 944 | | | | 13,069 | | | | — | | | | — | |
Shareholder servicing fees—Service Class | | | 35,093 | | | | 30,657 | | | | 445,065 | | | | — | |
Shareholder servicing fees—Investor Class | | | 944 | | | | 12,642 | | | | — | | | | — | |
Shareholder servicing fees | | | — | | | | — | | | | — | | | | 628,355 | |
Registration fees | | | 44,705 | | | | 41,157 | | | | 39,944 | | | | 49,486 | |
Professional fees | | | 30,727 | | | | 33,346 | | | | 38,381 | | | | 50,675 | |
Custodian | | | 18,194 | | | | 6,267 | | | | 43,773 | | | | 20,469 | |
Transfer agent | | | 10,528 | | | | 18,202 | | | | 39,458 | | | | 26,056 | |
Reports to shareholders | | | 9,330 | | | | 11,051 | | | | 33,984 | | | | 69,920 | |
Trustees fees and expenses | | | 2,079 | | | | 1,735 | | | | 8,236 | | | | 8,796 | |
Miscellaneous | | | 3,119 | | | | 2,324 | | | | 28,899 | | | | 4,917 | |
Expense repayments | | | — | | | | — | | | | — | | | | 26,047 | |
Total expenses before offsets | | | 642,926 | | | | 549,470 | | | | 3,390,634 | | | | 3,021,128 | |
Expense reimbursements | | | (93,286 | ) | | | (193,572 | ) | | | (360,327 | ) | | | — | |
Expense reductions | | | — | | | | (9,750 | ) | | | (58,214 | ) | | | (15,747 | ) |
Net expenses | | | 549,640 | | | | 346,148 | | | | 2,972,093 | | | | 3,005,381 | |
Net investment income (loss) | | | (205,421 | ) | | | (67,736 | ) | | | (1,226,649 | ) | | | 3,200,514 | |
Net Realized and Unrealized Gain (Loss): | | | | | | | | | | | | | | | | |
Net realized gain on investments | | | 16,786,267 | | | | 3,340,666 | | | | 22,310,331 | | | | 10,848,695 | |
Net change in unrealized appreciation (depreciation) of investments | | | (11,092,183 | ) | | | 994,416 | | | | (11,389,106 | ) | | | 34,560,852 | |
Net realized and unrealized gain | | | 5,694,084 | | | | 4,335,082 | | | | 10,921,225 | | | | 45,409,547 | |
Net increase in net assets resulting from operations | | $ | 5,488,663 | | | $ | 4,267,346 | | | $ | 9,694,576 | | | $ | 48,610,061 | |
| 1 | Includes non-recurring dividends of $25,677. |
| 2 | Includes non-recurring dividends of $206,279. |
The accompanying notes are an integral part of these financial statements.
34
Statements of Changes in Net Assets
For the fiscal years ended October 31,
| | | | | | | | | | | | | | | | | | | | | | | | |
| | | AMG Frontier
Small Cap Growth Fund | | | AMG TimesSquare All
Cap Growth Fund | | | AMG Managers Emerging
Opportunities Fund | |
| | | 2014 | | | 2013 | | | 2014 | | | 2013 | | | 2014 | | | 2013 | |
Increase (Decrease) in Net Assets From Operations: | | | | | | | | | | | | | | | | | | | | | | | | |
Net investment income (loss) | | $ | (205,421 | ) | | $ | (180,285 | ) | | $ | (67,736 | ) | | $ | 54,882 | | | $ | (1,226,649 | ) | | $ | (459,051 | ) |
Net realized gain on investments | | | 16,786,267 | | | | 8,773,344 | | | | 3,340,666 | | | | 4,505,144 | | | | 22,310,331 | | | | 29,255,923 | |
Net change in unrealized appreciation (depreciation) of investments | | | (11,092,183 | ) | | | 18,984,862 | | | | 994,416 | | | | 3,689,693 | | | | (11,389,106 | ) | | | 37,936,325 | |
Net increase in net assets resulting from operations | | | 5,488,663 | | | | 27,577,921 | | | | 4,267,346 | | | | 8,249,719 | | | | 9,694,576 | | | | 66,733,197 | |
Distributions to Shareholders: | | | | | | | | | | | | | | | | | | | | | | | | |
From net investment income: | | | | | | | | | | | | | | | | | | | | | | | | |
Investor Class | | | — | | | | — | | | | — | | | | (6,039 | ) | | | — | | | | — | |
Service Class | | | — | | | | — | | | | — | | | | (66,568 | ) | | | — | | | | (200,919 | ) |
Institutional Class | | | — | | | | — | | | | — | | | | (16,460 | ) | | | — | | | | (134,351 | ) |
From net realized gain on investments: | | | | | | | | | | | | | | | | | | | | | | | | |
Investor Class | | | (41,612 | ) | | | — | | | | (535,996 | ) | | | — | | | | — | | | | — | |
Service Class | | | (1,754,199 | ) | | | — | | | | (3,026,191 | ) | | | — | | | | (23,264,454 | ) | | | (8,440,046 | ) |
Institutional Class | | | (6,547,364 | ) | | | — | | | | (314,008 | ) | | | — | | | | (5,190,571 | ) | | | (2,201,758 | ) |
Total distributions to shareholders | | | (8,343,175 | ) | | | — | | | | (3,876,195 | ) | | | (89,067 | ) | | | (28,455,025 | ) | | | (10,977,074 | ) |
Capital Share Transactions:1 | | | | | | | | | | | | | | | | | | | | | | | | |
Net increase (decrease) from capital share transactions | | | (34,624,118 | ) | | | (40,721,845 | ) | | | 2,258,667 | | | | 2,745,621 | | | | 6,392,011 | | | | 20,768,144 | |
Total increase (decrease) in net assets | | | (37,478,630 | ) | | | (13,143,924 | ) | | | 2,649,818 | | | | 10,906,273 | | | | (12,368,438 | ) | | | 76,524,267 | |
Net Assets: | | | | | | | | | | | | | | | | | | | | | | | | |
Beginning of year | | | 73,755,816 | | | | 86,899,740 | | | | 36,291,603 | | | | 25,385,330 | | | | 217,047,766 | | | | 140,523,499 | |
End of year | | $ | 36,277,186 | | | $ | 73,755,816 | | | $ | 38,941,421 | | | $ | 36,291,603 | | | $ | 204,679,328 | | | $ | 217,047,766 | |
End of year undistributed net investment income (loss) | | | — | | | | — | | | | — | | | $ | (14,957 | ) | | $ | 126,489 | | | $ | 78,367 | |
| | | | | | | | | | | | | | | | | | | | | | | | |
| 1 | See Note 1(g) of the Notes to Financial Statements. |
The accompanying notes are an integral part of these financial statements.
35
Statements of Changes in Net Assets (continued)
For the fiscal years ended October 31,
| | | | | | | | |
| | | AMG Managers Real
Estate Securities Fund | |
| | | 2014 | | | 2013 | |
Increase (Decrease) in Net Assets From Operations: | | | | | | | | |
Net investment income | | $ | 3,200,514 | | | $ | 2,124,958 | |
Net realized gain on investments | | | 10,848,695 | | | | 11,667,269 | |
Net change in unrealized appreciation (depreciation) of investments | | | 34,560,852 | | | | 2,575,248 | |
Net increase in net assets resulting from operations | | | 48,610,061 | | | | 16,367,475 | |
Distributions to Shareholders: | | | | | | | | |
From net investment income | | | (2,925,112 | ) | | | (1,863,912 | ) |
From net realized gain on investments | | | (12,258,881 | ) | | | (3,921,545 | ) |
Total distributions to shareholders | | | (15,183,993 | ) | | | (5,785,457 | ) |
Capital Share Transactions: | | | | | | | | |
Proceeds from sale of shares | | | 135,347,394 | | | | 129,568,438 | |
Reinvestment of dividends and distributions | | | 13,118,901 | | | | 5,096,432 | |
Cost of shares repurchased | | | (78,560,763 | ) | | | (100,989,345 | ) |
Net increase from capital share transactions | | | 69,905,532 | | | | 33,675,525 | |
Total increase in net assets | | | 103,331,600 | | | | 44,257,543 | |
Net Assets: | | | | | | | | |
Beginning of year | | | 212,625,903 | | | | 168,368,360 | |
End of year | | $ | 315,957,503 | | | $ | 212,625,903 | |
End of year undistributed net investment income | | $ | 1,227,254 | | | $ | 654,982 | |
| | | | | | | | |
Share Transactions: | | | | | | | | |
Sale of shares | | | 12,516,599 | | | | 12,151,788 | |
Reinvested shares from dividends and distributions | | | 1,345,243 | | | | 503,733 | |
Shares repurchased | | | (7,291,385 | ) | | | (9,677,837 | ) |
Net increase in shares | | | 6,570,457 | | | | 2,977,684 | |
The accompanying notes are an integral part of these financial statements.
36
AMG Frontier Small Cap Growth Fund
Financial Highlights
For a share outstanding throughout each fiscal period
| | | | | | | | | | | | | | | | | | | | |
| | | For the fiscal year ended October 31, | | | For the fiscal
period ended October 31, 2010* | |
| Investor Class | | 2014 | | | 2013 | | | 2012 | | | 2011 | | |
Net Asset Value, Beginning of Period | | $ | 26.26 | | | $ | 18.81 | | | $ | 17.90 | | | $ | 16.70 | | | $ | 14.64 | |
Income from Investment Operations: | | | | | | | | | | | | | | | | | | | | |
Net investment loss1 | | | (0.21 | )4 | | | (0.14 | )5 | | | (0.13 | )6 | | | (0.16 | ) | | | (0.11 | ) |
Net realized and unrealized gain on investments1 | | | 2.05 | | | | 7.59 | | | | 1.04 | | | | 1.36 | | | | 2.17 | |
Total from investment operations | | | 1.84 | | | | 7.45 | | | | 0.91 | | | | 1.20 | | | | 2.06 | |
Distributions to Shareholders from: | | | | | | | | | | | | | | | | | | | | |
Net realized gain on investments | | | (2.98 | ) | | | — | | | | — | | | | — | | | | — | |
Net Asset Value, End of Period | | $ | 25.12 | | | $ | 26.26 | | | $ | 18.81 | | | $ | 17.90 | | | $ | 16.70 | |
Total Return2 | | | 7.24 | %8 | | | 39.61 | % | | | 5.08 | % | | | 7.19 | % | | | 14.07 | %14 |
Ratio of net expenses to average net assets (with offsets/reductions) | | | 1.55 | % | | | 1.58 | %7 | | | 1.55 | % | | | 1.55 | % | | | 1.55 | %15 |
Ratio of expenses to average net assets (with offsets) | | | 1.55 | % | | | 1.58 | %7 | | | 1.55 | % | | | 1.55 | % | | | 1.55 | %15 |
Ratio of total expenses to average net assets (without offsets/reductions)3 | | | 1.74 | % | | | 1.65 | %7 | | | 1.65 | % | | | 1.72 | % | | | 1.94 | %15 |
Ratio of net investment loss to average net assets2 | | | (0.86 | )% | | | (0.64 | )%7 | | | (0.70 | )% | | | (0.86 | )% | | | (0.91 | )%15 |
Portfolio turnover | | | 63 | % | | | 65 | % | | | 38 | % | | | 44 | % | | | 52 | % |
Net assets at end of period (000’s omitted) | | $ | 365 | | | $ | 366 | | | $ | 474 | | | $ | 563 | | | $ | 406 | |
| | | | | | | | | | | | | | | | | | | | |
| | | | | | | | | | | | | | | | | | | | |
| | | For the fiscal year ended October 31, | |
| Service Class | | 2014 | | | 2013 | | | 2012 | | | 2011 | | | 2010* | |
Net Asset Value, Beginning of Year | | $ | 26.48 | | | $ | 18.92 | | | $ | 17.96 | | | $ | 16.72 | | | $ | 13.42 | |
Income from Investment Operations: | | | | | | | | | | | | | | | | | | | | |
Net investment loss1 | | | (0.15 | )4 | | | (0.10 | )5 | | | (0.09 | )6 | | | (0.12 | ) | | | (0.12 | ) |
Net realized and unrealized gain on investments1 | | | 2.08 | | | | 7.66 | | | | 1.05 | | | | 1.36 | | | | 3.42 | |
Total from investment operations | | | 1.93 | | | | 7.56 | | | | 0.96 | | | | 1.24 | | | | 3.30 | |
Distributions to Shareholders from: | | | | | | | | | | | | | | | | | | | | |
Net realized gain on investments | | | (3.01 | ) | | | — | | | | — | | | | — | | | | — | |
Net Asset Value, End of Year | | $ | 25.40 | | | $ | 26.48 | | | $ | 18.92 | | | $ | 17.96 | | | $ | 16.72 | |
Total Return2 | | | 7.54 | %8 | | | 39.96 | %8 | | | 5.35 | %8 | | | 7.42 | %8 | | | 24.59 | % |
Ratio of net expenses to average net assets (with offsets/reductions) | | | 1.28 | % | | | 1.33 | %7 | | | 1.30 | % | | | 1.30 | % | | | 1.37 | % |
Ratio of expenses to average net assets (with offsets) | | | 1.28 | % | | | 1.33 | %7 | | | 1.30 | % | | | 1.30 | % | | | 1.37 | % |
Ratio of total expenses to average net assets (without offsets/reductions)3 | | | 1.47 | % | | | 1.40 | %7 | | | 1.40 | % | | | 1.47 | % | | | 1.66 | % |
Ratio of net investment loss to average net assets2 | | | (0.59 | )% | | | (0.43 | )%7 | | | (0.48 | )% | | | (0.63 | )% | | | (0.78 | )% |
Portfolio turnover | | | 63 | % | | | 65 | % | | | 38 | % | | | 44 | % | | | 52 | % |
Net assets at end of year (000’s omitted) | | $ | 14,842 | | | $ | 15,273 | | | $ | 12,664 | | | $ | 18,199 | | | $ | 18,290 | |
| | | | | | | | | | | | | | | | | | | | |
37
AMG Frontier Small Cap Growth Fund
Financial Highlights
For a share outstanding throughout each fiscal period
| | | | | | | | | | | | | | | | | | | | |
| | | For the fiscal year ended October 31, | | | For the fiscal period ended October 31, 2010* | |
| Institutional Class | | 2014 | | | 2013 | | | 2012 | | | 2011 | | |
Net Asset Value, Beginning of Period | | $ | 26.72 | | | $ | 19.04 | | | $ | 18.03 | | | $ | 16.74 | | | $ | 14.64 | |
Income from Investment Operations: | | | | | | | | | | | | | | | | | | | | |
Net investment loss1 | | | (0.09 | )4 | | | (0.04 | )5 | | | (0.04 | )6 | | | (0.08 | ) | | | (0.05 | ) |
Net realized and unrealized gain on investments1 | | | 2.10 | | | | 7.72 | | | | 1.05 | | | | 1.37 | | | | 2.15 | |
Total from investment operations | | | 2.01 | | | | 7.68 | | | | 1.01 | | | | 1.29 | | | | 2.10 | |
Distributions to Shareholders from: | | | | | | | | | | | | | | | | | | | | |
Net realized gain on investments | | | (3.04 | ) | | | — | | | | — | | | | — | | | | — | |
Net Asset Value, End of Period | | $ | 25.69 | | | $ | 26.72 | | | $ | 19.04 | | | $ | 18.03 | | | $ | 16.74 | |
Total Return2 | | | 7.78 | %8 | | | 40.34 | % | | | 5.60 | % | | | 7.71 | % | | | 14.34 | %14 |
Ratio of net expenses to average net assets (with offsets/reductions) | | | 1.05 | % | | | 1.08 | %7 | | | 1.05 | % | | | 1.05 | % | | | 1.05 | %15 |
Ratio of expenses to average net assets (with offsets) | | | 1.05 | % | | | 1.08 | %7 | | | 1.05 | % | | | 1.05 | % | | | 1.05 | %15 |
Ratio of total expenses to average net assets (without offsets/reductions)3 | | | 1.24 | % | | | 1.15 | %7 | | | 1.15 | % | | | 1.22 | % | | | 1.44 | %15 |
Ratio of net investment loss to average net assets2 | | | (0.34 | )% | | | (0.17 | )%7 | | | (0.20 | )% | | | (0.41 | )% | | | (0.41 | )%15 |
Portfolio turnover | | | 63 | % | | | 65 | % | | | 38 | % | | | 44 | % | | | 52 | % |
Net assets at end of period (000’s omitted) | | $ | 21,070 | | | $ | 58,117 | | | $ | 73,762 | | | $ | 77,217 | | | $ | 11,750 | |
| | | | | | | | | | | | | | | | | | | | |
38
AMG TimesSquare All Cap Growth Fund
Financial Highlights
For a share outstanding throughout each fiscal period
| | | | | | | | | | | | | | | | | | | | |
| | | For the fiscal year ended October 31, | | | For the fiscal
period ended October 31, 2010** | |
| Investor Class | | 2014 | | | 2013 | | | 2012 | | | 2011 | | |
Net Asset Value, Beginning of Period | | $ | 16.60 | | | $ | 12.75 | | | $ | 11.02 | | | $ | 10.93 | | | $ | 10.00 | |
Income from Investment Operations: | | | | | | | | | | | | | | | | | | | | |
Net investment income (loss)1 | | | (0.08 | ) | | | (0.02 | )9 | | | (0.02 | )6 | | | (0.10 | ) | | | (0.00 | )# |
Net realized and unrealized gain on investments1 | | | 1.92 | | | | 3.89 | | | | 1.75 | | | | 0.19 | | | | 0.93 | |
Total from investment operations | | | 1.84 | | | | 3.87 | | | | 1.73 | | | | 0.09 | | | | 0.93 | |
Distributions to Shareholders from: | | | | | | | | | | | | | | | | | | | | |
Net investment income | | | — | | | | (0.02 | ) | | | — | | | | (0.00 | )# | | | — | |
Net realized gain on investments | | | (1.76 | ) | | | — | | | | — | | | | — | | | | — | |
Total distributions to shareholders | | | (1.76 | ) | | | (0.02 | ) | | | — | | | | (0.00 | )# | | | — | |
Net Asset Value, End of Period | | $ | 16.68 | | | $ | 16.60 | | | $ | 12.75 | | | $ | 11.02 | | | $ | 10.93 | |
Total Return2 | | | 11.59 | % | | | 30.41 | % | | | 15.70 | % | | | 0.84 | % | | | 9.30 | %14 |
Ratio of net expenses to average net assets (with offsets/reductions) | | | 1.25 | % | | | 1.30 | %10 | | | 1.17 | % | | | 1.11 | % | | | 1.17 | %15 |
Ratio of expenses to average net assets (with offsets) | | | 1.28 | % | | | 1.32 | %10 | | | 1.19 | % | | | 1.19 | % | | | 1.17 | %15 |
Ratio of total expenses to average net assets (without offsets/reductions)3 | | | 1.79 | % | | | 1.85 | %10 | | | 1.80 | % | | | 2.04 | % | | | 15.15 | %15 |
Ratio of net investment loss to average net assets2 | | | (0.52 | )% | | | (0.17 | )%10 | | | (0.14 | )% | | | (0.86 | )% | | | (0.11 | )%15 |
Portfolio turnover | | | 94 | % | | | 102 | % | | | 87 | % | | | 102 | % | | | 50 | % |
Net assets at end of period (000’s omitted) | | $ | 5,417 | | | $ | 5,046 | | | $ | 3,608 | | | $ | 2,465 | | | $ | 14 | |
| | | | | | | | | | | | | | | | | | | | |
| | | | | | | | | | | | | | | | | | | | |
| | | For the fiscal year ended October 31, | | | For the fiscal
period ended October 31, 2010** | |
| Service Class | | 2014 | | | 2013 | | | 2012 | | | 2011 | | |
Net Asset Value, Beginning of Period | | $ | 16.80 | | | $ | 12.88 | | | $ | 11.10 | | | $ | 10.94 | | | $ | 10.00 | |
Income from Investment Operations: | | | | | | | | | | | | | | | | | | | | |
Net investment income (loss)1 | | | (0.02 | ) | | | 0.03 | 9 | | | 0.01 | 6 | | | (0.02 | ) | | | (0.00 | )# |
Net realized and unrealized gain on investments1 | | | 1.95 | | | | 3.93 | | | | 1.77 | | | | 0.18 | | | | 0.94 | |
Total from investment operations | | | 1.93 | | | | 3.96 | | | | 1.78 | | | | 0.16 | | | | 0.94 | |
Distributions to Shareholders from: | | | | | | | | | | | | | | | | | | | | |
Net investment income | | | — | | | | (0.04 | ) | | | — | | | | — | | | | — | |
Net realized gain on investments | | | (1.78 | ) | | | — | | | | — | | | | — | | | | — | |
Total distributions to shareholders | | | (1.78 | ) | | | (0.04 | ) | | | — | | | | — | | | | — | |
Net Asset Value, End of Period | | $ | 16.95 | | | $ | 16.80 | | | $ | 12.88 | | | $ | 11.10 | | | $ | 10.94 | |
Total Return2 | | | 12.04 | % | | | 30.88 | % | | | 16.04 | %8 | | | 1.46 | %8 | | | 9.40 | %14 |
Ratio of net expenses to average net assets (with offsets/reductions) | | | 0.86 | % | | | 0.90 | %10 | | | 0.96 | % | | | 0.96 | % | | | 1.03 | %15 |
Ratio of expenses to average net assets (with offsets) | | | 0.89 | % | | | 0.92 | %10 | | | 0.98 | % | | | 1.04 | % | | | 1.03 | %15 |
Ratio of total expenses to average net assets (without offsets/reductions)3 | | | 1.40 | % | | | 1.45 | %10 | | | 1.59 | % | | | 1.89 | % | | | 15.00 | %15 |
Ratio of net investment income (loss) to average net assets2 | | | (0.13 | )% | | | 0.23 | %10 | | | 0.09 | % | | | (0.17 | )% | | | 0.00 | %15 |
Portfolio turnover | | | 94 | % | | | 102 | % | | | 87 | % | | | 102 | % | | | 50 | % |
Net assets at end of period (000’s omitted) | | $ | 30,198 | | | $ | 28,281 | | | $ | 19,498 | | | $ | 18,321 | | | $ | 11 | |
| | | | | | | | | | | | | | | | | | | | |
39
AMG TimesSquare All Cap Growth Fund
Financial Highlights
For a share outstanding throughout each fiscal period
| | | | | | | | | | | | | | | | | | | | |
| | | For the fiscal year ended October 31, | | | For the fiscal
period ended October 31, 2010** | |
| Institutional Class | | 2014 | | | 2013 | | | 2012 | | | 2011 | | |
Net Asset Value, Beginning of Period | | $ | 16.77 | | | $ | 12.87 | | | $ | 11.07 | | | $ | 10.94 | | | $ | 10.00 | |
Income from Investment Operations: | | | | | | | | | | | | | | | | | | | | |
Net investment income (loss)1 | | | (0.01 | ) | | | 0.05 | 9 | | | 0.03 | 6 | | | 0.00 | # | | | 0.01 | |
Net realized and unrealized gain on investments1 | | | 1.95 | | | | 3.92 | | | | 1.77 | | | | 0.13 | | | | 0.93 | |
Total from investment operations | | | 1.94 | | | | 3.97 | | | | 1.80 | | | | 0.13 | | | | 0.94 | |
Distributions to Shareholders from: | | | | | | | | | | | | | | | | | | | | |
Net investment income | | | — | | | | (0.07 | ) | | | — | | | | (0.00 | )# | | | — | |
Net realized gain on investments | | | (1.78 | ) | | | — | | | | — | | | | — | | | | — | |
Total distributions to shareholders | | | (1.78 | ) | | | (0.07 | ) | | | — | | | | (0.00 | )# | | | — | |
Net Asset Value, End of Period | | $ | 16.93 | | | $ | 16.77 | | | $ | 12.87 | | | $ | 11.07 | | | $ | 10.94 | |
Total Return2 | | | 12.10 | %8 | | | 31.00 | %8 | | | 16.26 | % | | | 1.23 | % | | | 9.40 | %14 |
Ratio of net expenses to average net assets (with offsets/reductions) | | | 0.76 | % | | | 0.80 | %10 | | | 0.77 | % | | | 0.71 | % | | | 0.79 | %15 |
Ratio of expenses to average net assets (with offsets) | | | 0.79 | % | | | 0.82 | %10 | | | 0.79 | % | | | 0.79 | % | | | 0.79 | %15 |
Ratio of total expenses to average net assets (without offsets/reductions)3 | | | 1.30 | % | | | 1.35 | %10 | | | 1.40 | % | | | 1.64 | % | | | 14.74 | %15 |
Ratio of net investment income (loss) to average net assets2 | | | (0.04 | )% | | | 0.35 | %10 | | | 0.26 | % | | | 0.03 | % | | | 0.27 | %15 |
Portfolio turnover | | | 94 | % | | | 102 | % | | | 87 | % | | | 102 | % | | | 50 | % |
Net assets at end of period (000’s omitted) | | $ | 3,327 | | | $ | 2,965 | | | $ | 2,279 | | | $ | 1,982 | | | $ | 1,063 | |
| | | | | | | | | | | | | | | | | | | | |
40
AMG Managers Emerging Opportunities Fund
Financial Highlights
For a share outstanding throughout each fiscal period
| | | | | | | | | | | | | | | | | | | | |
| | | For the fiscal year ended October 31, | |
| Service Class† | | 2014 | | | 2013 | | | 2012 | | | 2011 | | | 2010 | |
Net Asset Value, Beginning of Year | | $ | 51.19 | | | $ | 37.26 | | | $ | 36.03 | | | $ | 33.42 | | | $ | 26.37 | |
Income from Investment Operations: | | | | | | | | | | | | | | | | | | | | |
Net investment loss1 | | | (0.29 | )4 | | | (0.14 | )5 | | | (0.23 | ) | | | (0.27 | ) | | | (0.25 | ) |
Net realized and unrealized gain on investments1 | | | 3.01 | | | | 16.99 | | | | 4.12 | | | | 2.88 | | | | 7.30 | |
Total from investment operations | | | 2.72 | | | | 16.85 | | | | 3.89 | | | | 2.61 | | | | 7.05 | |
Distributions to Shareholders from: | | | | | | | | | | | | | | | | | | | | |
Net investment income | | | — | | | | (0.07 | ) | | | — | | | | — | | | | — | |
Net realized gain on investments | | | (6.80 | ) | | | (2.85 | ) | | | (2.66 | ) | | | — | | | | — | |
Total distributions to shareholders | | | (6.80 | ) | | | (2.92 | ) | | | (2.66 | ) | | | — | | | | — | |
Net Asset Value, End of Year | | $ | 47.11 | | | $ | 51.19 | | | $ | 37.26 | | | $ | 36.03 | | | $ | 33.42 | |
Total Return2 | | | 5.09 | % | | | 49.00 | % | | | 11.55 | %††† | | | 7.78 | % | | | 26.73 | %8 |
Ratio of net expenses to average net assets (with offsets/reductions) | | | 1.41 | %11 | | | 1.44 | %12 | | | 1.41 | % | | | 1.41 | % | | | 1.50 | % |
Ratio of expenses to average net assets (with offsets) | | | 1.44 | %11 | | | 1.45 | %12 | | | 1.43 | % | | | 1.43 | % | | | 1.52 | % |
Ratio of total expenses to average net assets (without offsets/reductions)3 | | | 1.61 | %11 | | | 1.65 | %12 | | | 1.68 | % | | | 1.66 | % | | | 1.72 | % |
Ratio of net investment loss to average net assets2 | | | (0.61 | )%11 | | | (0.33 | )%12 | | | (0.62 | )% | | | (0.73 | )% | | | (0.84 | )% |
Portfolio turnover | | | 98 | % | | | 96 | % | | | 64 | % | | | 85 | % | | | 93 | % |
Net assets at end of year (000’s omitted) | | $ | 169,398 | | | $ | 172,959 | | | $ | 110,732 | | | $ | 113,742 | | | $ | 135,570 | |
| | | | | | | | | | | | | | | | | | | | |
| | | | | | | | | | | | | | | | |
| | | For the fiscal year ended October 31, | | | For the fiscal period
October 1, 2011 through October 31, 2011 | |
| Institutional Class†† | | 2014 | | | 2013 | | | 2012 | | |
Net Asset Value, Beginning of Period | | $ | 51.31 | | | $ | 37.37 | | | $ | 36.03 | | | $ | 31.02 | |
Income from Investment Operations: | | | | | | | | | | | | | | | | |
Net investment loss1 | | | (0.17 | )4 | | | (0.03 | )5 | | | (0.13 | ) | | | (0.01 | ) |
Net realized and unrealized gain on investments1 | | | 3.00 | | | | 16.99 | | | | 4.13 | | | | 5.02 | |
Total from investment operations | | | 2.83 | | | | 16.96 | | | | 4.00 | | | | 5.01 | |
Distributions to Shareholders from: | | | | | | | | | | | | | | | | |
Net investment income | | | — | | | | (0.17 | ) | | | — | | | | — | |
Net realized gain on investments | | | (6.82 | ) | | | (2.85 | ) | | | (2.66 | ) | | | — | |
Total distributions to shareholders | | | (6.82 | ) | | | (3.02 | ) | | | (2.66 | ) | | | — | |
Net Asset Value, End of Period | | $ | 47.32 | | | $ | 51.31 | | | $ | 37.37 | | | $ | 36.03 | |
Total Return2 | | | 5.33 | % | | | 49.36 | % | | | 11.84 | %††† | | | 16.18 | %14 |
Ratio of net expenses to average net assets (with offsets/reductions) | | | 1.16 | %11 | | | 1.19 | %12 | | | 1.16 | % | | | 1.17 | %15 |
Ratio of expenses to average net assets (with offsets) | | | 1.19 | %11 | | | 1.20 | %12 | | | 1.18 | % | | | 1.19 | %15 |
Ratio of total expenses to average net assets (without offsets/reductions)3 | | | 1.36 | %11 | | | 1.40 | %12 | | | 1.43 | % | | | 1.50 | %15 |
Ratio of net investment loss to average net assets2 | | | (0.36 | )%11 | | | (0.08 | )%12 | | | (0.37 | )% | | | (0.42 | )%15 |
Portfolio turnover | | | 98 | % | | | 96 | % | | | 64 | % | | | 85 | % |
Net assets at end of period (000’s omitted) | | $ | 35,282 | | | $ | 44,089 | | | $ | 29,791 | | | $ | 31,735 | |
| | | | | | | | | | | | | | | | |
41
AMG Managers Real Estate Securities Fund
Financial Highlights
For a share outstanding throughout each fiscal year
| | | | | | | | | | | | | | | | | | | | |
| | | For the fiscal year ended October 31, | |
| | | 2014 | | | 2013 | | | 2012 | | | 2011 | | | 2010 | |
Net Asset Value, Beginning of Year | | $ | 10.79 | | | $ | 10.07 | | | $ | 8.95 | | | $ | 8.12 | | | $ | 5.68 | |
Income from Investment Operations: | | | | | | | | | | | | | | | | | | | | |
Net investment income1 | | | 0.14 | | | | 0.11 | | | | 0.09 | | | | 0.06 | | | | 0.08 | |
Net realized and unrealized gain on investments1 | | | 1.84 | | | | 0.96 | | | | 1.11 | | | | 0.83 | | | | 2.43 | |
Total from investment operations | | | 1.98 | | | | 1.07 | | | | 1.20 | | | | 0.89 | | | | 2.51 | |
Distributions to Shareholders from: | | | | | | | | | | | | | | | | | | | | |
Net investment income | | | (0.13 | ) | | | (0.10 | ) | | | (0.08 | ) | | | (0.06 | ) | | | (0.07 | ) |
Net realized gain on investments | | | (0.61 | ) | | | (0.25 | ) | | | — | | | | — | | | | — | |
Total distributions to shareholders | | | (0.74 | ) | | | (0.35 | ) | | | (0.08 | ) | | | (0.06 | ) | | | (0.07 | ) |
Net Asset Value, End of Year | | $ | 12.03 | | | $ | 10.79 | | | $ | 10.07 | | | $ | 8.95 | | | $ | 8.12 | |
Total Return2 | | | 19.88 | % | | | 10.89 | %8 | | | 13.43 | % | | | 11.06 | % | | | 44.47 | % |
Ratio of net expenses to average net assets (with offsets/reductions) | | | 1.19 | % | | | 1.26 | %13 | | | 1.26 | % | | | 1.41 | % | | | 1.49 | % |
Ratio of expenses to average net assets (with offsets) | | | 1.20 | % | | | 1.27 | %13 | | | 1.27 | % | | | 1.42 | % | | | 1.50 | % |
Ratio of total expenses to average net assets (without offsets/reductions)3 | | | 1.20 | % | | | 1.27 | %13 | | | 1.28 | % | | | 1.48 | % | | | 1.79 | % |
Ratio of net investment income to average net assets2 | | | 1.27 | % | | | 1.08 | %13 | | | 0.92 | % | | | 0.69 | % | | | 1.12 | % |
Portfolio turnover | | | 49 | % | | | 86 | % | | | 36 | % | | | 75 | % | | | 99 | % |
Net assets at end of year (000’s omitted) | | $ | 315,958 | | | $ | 212,626 | | | $ | 168,368 | | | $ | 55,568 | | | $ | 23,787 | |
| | | | | | | | | | | | | | | | | | | | |
42
Notes to Financial Highlights
| # | Rounds to less than $0.01 per share or 0.01%. |
| * | Effective January 1, 2010, existing shares of AMG Frontier Small Cap Growth Fund were reclassified and redesignated as Service Class shares. Investor Class and Institutional Class shares commenced operations on January 1, 2010. |
| ** | Commenced operations on July 30, 2010. |
| † | Effective October 1, 2011, existing shares of AMG Managers Emerging Opportunities Fund were reclassified and redesignated as Service Class shares. |
| †† | As of the close of business on September 30, 2011, Managers Institutional Micro-Cap Fund (“Institutional Micro-Cap”) merged into AMG Managers Emerging Opportunities Fund. Each full and partial share of Institutional Micro-Cap was exchanged for shares in the new Institutional Class of AMG Managers Emerging Opportunities Fund in an equivalent dollar amount. |
| ††† | Returns would have been lower if not for capital inflow resulting from market timing settlements. |
| 1 | Per share numbers have been calculated using average shares. |
| 2 | Total returns and net investment income (loss) would have been lower had certain expenses not been offset. |
| 3 | Excludes the impact of expense reimbursement and expense reductions such as brokerage credits, but includes expense repayments and non-reimbursable expenses, if any, such as interest, taxes and extraordinary expenses. (See Note 1(c) of Notes to Financial Statements.) |
| 4 | Includes non-recurring dividends. Without these dividends, net investment income per share would have been $(0.22), $(0.16), and $(0.10) for AMG Frontier Small Cap Growth Fund’s Investor Class, Service Class, and Institutional Class shares, respectively, and $(0.33) and $(0.21) for AMG Managers Emerging Opportunities Fund’s Service Class and Institutional Class shares, respectively. |
| 5 | Includes non-recurring dividends. Without these dividends, net investment income per share would have been $(0.20), $(0.17), and $(0.09) for AMG Frontier Small Cap Growth Fund’s Investor Class, Service Class, and Institutional Class shares, respectively, and $(0.31) and $(0.20) for AMG Managers Emerging Opportunities Fund’s Service Class and Institutional Class shares, respectively. |
| 6 | Includes non-recurring dividends. Without these dividends, net investment income per share would have been $(0.16), $(0.12), and $(0.07) for AMG Frontier Small Cap Growth Fund’s Investor Class, Service Class, and Institutional Class shares, respectively, and $(0.03), $(0.01), and $0.02 for AMG TimesSquare All Cap Growth Fund’s Investor Class, Service Class, and Institutional Class shares, respectively. |
| 7 | Includes non-routine extraordinary expenses amounting to 0.026%, 0.026% and 0.026% of average net assets for the Investor Class, Service Class and Institutional Class, respectively. |
| 8 | The Total Return is based on the Financial Statement Net Asset Values as shown above. |
| 9 | Includes a non-recurring dividend. Without this dividend, net investment income per share would have been $(0.05), $0.00, and $0.03 for AMG TimesSquare All Cap Growth Fund’s Investor Class, Service Class, and Institutional Class shares, respectively. |
| 10 | Includes non-routine extraordinary expenses amounting to 0.023%, 0.023% and 0.026% of average net assets for the Investor Class, Service Class and Institutional Class, respectively. |
| 11 | Includes tax expense of $23,725 or 0.01%. |
| 12 | Includes non-routine extraordinary expenses amounting to 0.022% and 0.022% of average net assets for the Service Class and Institutional Class, respectively. |
| 13 | Includes non-routine extraordinary expenses amounting to 0.027% of average net assets. |
43
Notes to Financial Statements
October 31, 2014
1. SUMMARY OF SIGNIFICANT ACCOUNTING POLICIES
AMG Funds I (formerly Managers Trust I) (the “Trust”), is an open-end management investment company, organized as a Massachusetts business trust, and registered under the Investment Company Act of 1940, as amended (the “1940 Act”). Currently, the Trust consists of a number of different funds, each having distinct investment management objectives, strategies, risks and policies. Included in this report are the AMG Frontier Small Cap Growth Fund (“Small Cap”) (formerly Managers Frontier Small Cap Growth Fund), AMG TimesSquare All Cap Growth Fund (“All Cap Growth”) (formerly Managers AMG TSCM Growth Equity Fund), AMG Managers Emerging Opportunities Fund (“Emerging Opportunities”) (formerly Managers Micro-Cap Fund) and AMG Managers Real Estate Securities Fund (“Real Estate Securities”) (formerly Managers Real Estate Securities Fund), each a “Fund” and collectively the “Funds.”
Small Cap and All Cap Growth each offer three classes of shares: Investor Class, Service Class, and Institutional Class. Emerging Opportunities currently offers two classes of shares: Institutional Class and Service Class. Each class represents an interest in the same assets of the Fund. Although all share classes generally have identical voting rights, each share class votes separately when required by law. Different share classes may pay different distribution amounts to the extent the net asset value per share and/or the expenses of such share classes differ. Each share class has its own expense structure. Please refer to a current prospectus for additional information on each share class.
The Funds’ financial statements are prepared in accordance with accounting principles generally accepted in the United States of America (“U.S. GAAP”), which require management to make estimates and assumptions that affect the reported amounts of assets and liabilities and disclosure of contingent assets and liabilities at the date of the financial statements and the reported amounts of income and expenses during the reporting period. Actual results could differ from those estimates and such differences could be material. The following is a summary of significant accounting policies followed by the Funds in the preparation of their financial statements:
a. VALUATION OF INVESTMENTS
Equity securities traded on a domestic or international securities exchange are valued at the last quoted sale price, or, lacking any sales, at the last quoted bid price. Equity securities primarily traded on an international securities exchange and equity securities traded on NASDAQ or in a U.S. or non-U.S. over-the counter market are valued at the market’s official closing price, or, if there are no trades on the applicable date, at the last quoted bid price. In addition, if the applicable market does not offer an official closing price or if the official closing price is not representative of the overall market, equity securities primarily traded on an international securities exchange and equity securities traded in a non-U.S. over-the counter market are valued at the last quoted sales price. The Funds’ investments are generally valued based on independent market quotations or prices or, if none, “evaluative” or other market based valuations provided by third-party pricing services approved by the Board of Trustees of the Funds (the “Board”).
Short-term debt obligations (debt obligations with maturities of one year or less at the time of issuance) that have 60 days or less remaining until maturity will
be valued at amortized cost. Investments in other open-end regulated investment companies are valued at their end of day net asset value per share.
Under certain circumstances, the value of certain Fund investments (including derivatives) may be based on an evaluation of fair value, pursuant to procedures established by and under the general supervision of the Board. The Pricing Committee is the committee formed by the Board to make fair value determinations for such investments. Each Fund may use the fair value of a portfolio investment to calculate its net asset value (“NAV”) in the event that the market quotation, price or market based valuation for the portfolio investment is not deemed to be readily available or otherwise not determinable pursuant to the Board’s valuation procedures, if AMG Funds LLC (formerly Managers Investment Group LLC) (the “Investment Manager”) believes the quotation, price or market based valuation to be unreliable, or in certain other circumstances. When determining the fair value of an investment, the Pricing Committee seeks to determine the price that the Fund might reasonably expect to receive from a current sale of that investment in an arms-length transaction. Fair value determinations shall be based upon consideration of all available facts and information, including, but not limited to (i) attributes specific to the investment; (ii) fundamental analytical data and press releases relating to the investment and its issuer; and (iii) the value of other comparable securities or relevant financial instruments, including derivative securities, traded on other markets or among dealers.
The values assigned to fair value investments are based on available information and do not necessarily represent amounts that might ultimately be realized in the future, since such amounts depend on future developments inherent in long-term investments. Because of the inherent uncertainty of valuation, those estimated values may differ significantly from the values that would have been used had a ready market for the investments existed, and the differences could be material. The Board will be presented with a quarterly report showing as of the most recent quarter end, all outstanding securities fair valued by the Pricing Committee, including a comparison with the prior quarter end and the percentage of the Fund that the security represents at each quarter end.
Portfolio investments that trade primarily on foreign markets are priced based upon the market quotation of such securities as of the close of their respective principal markets. Under certain circumstances, on behalf of a fund that invests in international securities, the Investment Manager or applicable subadvisor may recommend an adjustment of such prices based on its determination of the impact of events occurring subsequent to the close of such markets but prior to the time as of which each Fund calculates its NAV. The Board has also adopted a policy that securities held in a fund that invests in international securities and certain foreign debt obligations held by a fund, in each case, that can be fair valued by the applicable fair value pricing service are fair valued on each business day without regard to a “trigger” (e.g., without regard to invoking fair value based upon a change in a U.S. equity securities index exceeding a predetermined level). The Funds may invest in securities that may be thinly traded. The Board has adopted procedures to adjust prices of securities that are judged to be stale so that they reflect fair value. An investment valued on the basis of its fair value may be valued at a price higher or lower than available market quotations.
Notes to Financial Statements (continued)
U.S. GAAP defines fair value as the price that a fund would receive to sell an asset or pay to transfer a liability in an orderly transaction between market participants at the measurement date. U.S. GAAP also establishes a framework for measuring fair value, and a three level hierarchy for fair value measurements based upon the transparency of inputs to the valuation of an asset or liability. Inputs may be observable or unobservable and refer broadly to the assumptions that market participants would use in pricing the asset or liability. Observable inputs reflect the assumptions market participants would use in pricing the asset or liability based on market data obtained from sources independent of the Funds. Unobservable inputs reflect the Funds’ own assumptions about the assumptions that market participants would use in pricing the asset or liability developed based on the best information available in the circumstances. Each investment is assigned a level based upon the observability of the inputs which are significant to the overall valuation.
The three-tier hierarchy of inputs is summarized below:
Level 1 – inputs are quoted prices in active markets for identical investments (e.g., equity securities, open-end investment companies)
Level 2 – other observable inputs (including, but not limited to: quoted prices for similar assets or liabilities in markets that are active, quoted prices for identical or similar assets or liabilities in markets that are not active, inputs other than quoted prices that are observable for the assets or liabilities (such as interest rates, yield curves, volatilities, prepayment speeds, loss severities, credit risks and default rates) or other market corroborated inputs) (e.g., debt securities, government securities, foreign securities utilizing international fair value pricing, broker-quoted securities, fair valued securities with observable inputs)
Level 3 – inputs are significant unobservable inputs (including the Fund’s own assumptions used to determine the fair value of investments) (e.g., fair valued securities with unobservable inputs)
Changes in inputs or methodologies used for valuing investments may result in a transfer in or out of levels within the fair value hierarchy. The inputs or methodologies used for valuing investments may not necessarily be an indication of the risk associated with investing in those investments.
b. SECURITY TRANSACTIONS
Security transactions are accounted for as of trade date. Realized gains and losses on securities sold are determined on the basis of identified cost.
c. INVESTMENT INCOME AND EXPENSES
Dividend income is recorded on the ex-dividend date. Dividend and interest income on foreign securities is recorded gross of any withholding tax. Interest income, which includes amortization of premium and accretion of discount on debt securities, is accrued as earned. Non-cash dividends included in dividend income, if any, are reported at the fair market value of the securities received. Distributions received in excess of income from return of capital including real estate-investment trusts (REITs) are recorded as a reduction of the cost of the related investment and/or as a realized gain. If the Funds no longer own the applicable securities, any distributions received in excess of income are recorded as an adjustment to realized gain. Other income and expenses are recorded on an accrual basis. Expenses that cannot be directly attributed to a
Fund are apportioned among the Funds in the Trust and in some cases other affiliated funds based upon their relative average net assets or number of shareholders. For Small Cap, All Cap Growth and Emerging Opportunities Funds, investment income, realized and unrealized capital gains and losses, the common expenses of each Fund, and certain Fund level expense reductions, if any, are allocated on a pro rata basis to each class based on the relative net assets of each class to the total net assets of each Fund.
The following Funds had certain portfolio trades directed to various brokers, under a brokerage recapture program, which paid a portion of such Fund’s expenses. For the fiscal year ended October 31, 2014, the amount by which the Funds’ expenses were reduced and the impact on the annualized expense ratios, if any, were as follows: All Cap Growth—$9,750 or 0.03%, Emerging Opportunities—$58,214 or 0.03% and Real Estate Securities—$15,747 or 0.01%.
The Funds have a “balance credit” arrangement with The Bank of New York Mellon (“BNYM”), the Funds’ custodian, whereby each Fund is credited with an interest factor equal to 0.75% below the effective 90-day T-Bill rate for account balances left uninvested overnight. If the T-Bill rate falls below 0.75%, no credits will be earned. These credits serve to reduce custodian expenses that would otherwise be charged to each Fund. For the fiscal year ended October 31, 2014, the Funds’ custodian expense was not reduced.
Overdraft fees are computed at 1% above the effective Federal Funds rate on the day of the overdraft. For the fiscal year ended October 31, 2014, the overdraft fees for Small Cap, All Cap Growth and Emerging Opportunities equaled $643, $2 and $7, respectively.
The Trust held a shareholder meeting at which shareholders approved a new Declaration of Trust for the Trust, among other proposals. The costs associated with this proxy statement and shareholder meeting are being treated as “extraordinary expenses,” and, therefore, are excluded from the expense limitation agreement described in Note 2.
d. DIVIDENDS AND DISTRIBUTIONS
Fund distributions resulting from either net investment income or realized net capital gains, if any, will normally be declared and paid at least annually in December, as described in the Funds’ prospectus. Distributions to shareholders are recorded on the ex-dividend date. Distributions are determined in accordance with federal income tax regulations, which may differ from net investment income and net realized capital gains for financial statement purposes (U.S. GAAP). Differences may be permanent or temporary. Permanent differences are reclassified among capital accounts in the financial statements to reflect their tax character. Temporary differences arise when certain items of income, expense and gain or loss are recognized in different periods for financial statement and tax purposes; these differences will reverse at some time in the future. The differences are primarily due to differing treatments for losses deferred due to excise tax regulations, wash sales and REITs. Permanent book and tax basis differences, if any, relating to shareholder distributions will result in reclassifications to paid-in capital.
Notes to Financial Statements (continued)
The tax character of distributions paid during the fiscal years ended October 31, 2014 and October 31, 2013 were as follows:
| | | | | | | | | | | | | | | | | | | | | | | | | | | | | | | | |
| | | Small Cap | | | All Cap Growth | | | Emerging Opportunities | | | Real Estate Securities | |
| | | 2014 | | | 2013 | | | 2014 | | | 2013 | | | 2014 | | | 2013 | | | 2014 | | | 2013 | |
Distributions paid from: | | | | | | | | | | | | | | | | | | | | | | | | | | | | | | | | |
Ordinary income | | | — | | | | — | | | | — | | | $ | 89,067 | | | | — | | | | — | | | $ | 2,628,242 | | | $ | 1,720,440 | |
Short-term capital gains | | $ | 3,323,514 | | | | — | | | $ | 1,451,179 | | | | — | | | $ | 13,504,881 | | | $ | 335,270 | | | | 2,795,836 | | | | 1,449,621 | |
Long-term capital gains | | | 5,019,661 | | | | — | | | | 2,425,016 | | | | — | | | | 14,950,144 | | | | 10,641,804 | | | | 9,759,915 | | | | 2,615,396 | |
| | | | | | | | | | | | | | | | | | | | | | | | | | | | | | | | |
Total | | $ | 8,343,175 | | | | — | | | $ | 3,876,195 | | | $ | 89,067 | | | $ | 28,455,025 | | | $ | 10,977,074 | | | $ | 15,183,993 | | | $ | 5,785,457 | |
| | | | | | | | | | | | | | | | | | | | | | | | | | | | | | | | |
As of October 31, 2014, the components of distributable earnings (excluding unrealized appreciation/depreciation) on a tax basis consisted of:
| | | | | | | | | | | | | | | | |
| | | Small Cap | | | All Cap Growth | | | Emerging
Opportunities | | | Real Estate
Securities | |
Capital loss carryforward | | | — | | | | — | | | | — | | | | — | |
Undistributed ordinary income | | | — | | | | — | | | | — | | | $ | 1,227,254 | |
Undistributed short-term capital gains | | $ | 3,364,561 | | | $ | 878,919 | | | $ | 3,416,573 | | | | 1,394,115 | |
Undistributed long-term capital gains | | | 12,795,156 | | | | 2,395,372 | | | | 19,201,343 | | | | 8,972,484 | |
e. FEDERAL TAXES
Each Fund intends to comply with the requirements under Subchapter M of the Internal Revenue Code of 1986, as amended, to distribute substantially all of its taxable income and gains to its shareholders and to meet certain diversification and income requirements with respect to investment companies. Therefore, no provision for federal income or excise tax is included in the accompanying financial statements.
Additionally, based on each Fund’s understanding of the tax rules and rates related to income, gains and transactions for the foreign jurisdictions in which it invests, each Fund will provide for foreign taxes, and where appropriate, deferred foreign taxes.
Management has analyzed the Funds’ tax positions taken on federal income tax returns as of October 31, 2014 and for all open tax years (generally, the three prior taxable years), and has concluded that no provision for federal income tax is required in the Funds’ financial statements. Additionally, the Funds are not aware of any tax position for which it is reasonably possible that the total amounts of unrecognized tax benefits will change materially in the next twelve months.
Net capital losses incurred in taxable years beginning after the enactment of the Regulated Investment Company Modernization Act of 2010, may be carried forward for an unlimited time period. Such losses will be required to be utilized prior to any loss carryovers incurred in pre-enactment taxable years, which generally expire eight years following the close of the taxable year in which they were incurred. As a result of this ordering rule, pre-enactment capital loss carryovers may be more likely to expire unused. Additionally, post-enactment capital losses that are carried forward will retain their tax character as either short-term or long-term capital losses, unlike pre-enactment losses which are considered all short-term.
f. CAPITAL LOSS CARRYOVERS AND DEFERRALS
As of October 31, 2014, the Funds had no accumulated net realized capital loss carryovers from securities transactions for federal income tax purposes. Should the Funds incur net capital losses for the fiscal year ended October 31, 2015, such amounts may be used to offset future realized capital gains, for an unlimited time period.
g. CAPITAL STOCK
The Trust’s Declaration of Trust authorizes for each series the issuance of an unlimited number of shares of beneficial interest, without par value. Each Fund records sales and repurchases of its capital stock on the trade date. The cost of securities contributed to the Funds in connection with the issuance of shares is based on the valuation of those securities in accordance with the Funds’ policy on investment valuation.
46
Notes to Financial Statements (continued)
For the fiscal years ended October 31, 2014, and October 31, 2013, the capital stock transactions by class for the Small Cap, All Cap Growth and Emerging Opportunities were:
| | | | | | | | | | | | | | | | | | | | | | | | | | | | | | | | |
| | | Small Cap | | | All Cap Growth | |
| | | 2014 | | | 2013 | | | 2014 | | | 2013 | |
| | | Shares | | | Amount | | | Shares | | | Amount | | | Shares | | | Amount | | | Shares | | | Amount | |
Investor Class: | | | | | | | | | | | | | | | | | | | | | | | | | | | | | | | | |
Proceeds from sale of shares | | | 26 | | | $ | 650 | | | | 472 | | | $ | 11,202 | | | | 20,952 | | | $ | 332,090 | | | | 44,427 | | | $ | 652,528 | |
Reinvestment of distributions | | | 1,687 | | | | 41,612 | | | | — | | | | — | | | | 33,626 | | | | 535,996 | | | | 465 | | | | 6,034 | |
Cost of shares repurchased | | | (1,134 | ) | | | (26,633 | ) | | | (11,753 | ) | | | (257,651 | ) | | | (33,772 | ) | | | (541,949 | ) | | | (23,858 | ) | | | (354,373 | ) |
| | | | | | | | | | | | | | | | | | | | | | | | | | | | | | | | |
Net increase (decrease) | | | 579 | | | $ | 15,629 | | | | (11,281 | ) | | $ | (246,449 | ) | | | 20,806 | | | $ | 326,137 | | | | 21,034 | | | $ | 304,189 | |
| | | | | | | | | | | | | | | | | | | | | | | | | | | | | | | | |
Service Class: | | | | | | | | | | | | | | | | | | | | | | | | | | | | | | | | |
Proceeds from sale of shares | | | 36,361 | | | $ | 941,064 | | | | 14,996 | | | $ | 346,091 | | | | 323,639 | | | $ | 5,257,143 | | | | 506,959 | | | $ | 7,532,724 | |
Reinvestment of distributions | | | 69,579 | | | | 1,731,122 | | | | — | | | | — | | | | 187,380 | | | | 3,026,191 | | | | 5,075 | | | | 66,433 | |
Cost of shares repurchased | | | (98,207 | ) | | | (2,449,400 | ) | | | (107,664 | ) | | | (2,411,622 | ) | | | (412,684 | ) | | | (6,674,101 | ) | | | (342,293 | ) | | | (5,092,088 | ) |
| | | | | | | | | | | | | | | | | | | | | | | | | | | | | | | | |
Net increase (decrease) | | | 7,733 | | | $ | 222,786 | | | | (92,668 | ) | | $ | (2,065,531 | ) | | | 98,335 | | | $ | 1,609,233 | | | | 169,741 | | | $ | 2,507,069 | |
| | | | | | | | | | | | | | | | | | | | | | | | | | | | | | | | |
Institutional Class: | | | | | | | | | | | | | | | | | | | | | | | | | | | | | | | | |
Proceeds from sale of shares | | | 20,110 | | | $ | 517,471 | | | | 24,657 | | | $ | 530,043 | | | | 25,695 | | | $ | 414,520 | | | | 98,087 | | | $ | 1,355,750 | |
Reinvestment of distributions | | | 259,755 | | | | 6,525,038 | | | | — | | | | — | | | | 19,479 | | | | 314,008 | | | | 1,097 | | | | 14,314 | |
Cost of shares repurchased | | | (1,634,808 | ) | | | (41,905,042 | ) | | | (1,723,427 | ) | | | (38,939,908 | ) | | | (25,502 | ) | | | (405,231 | ) | | | (99,460 | ) | | | (1,435,701 | ) |
| | | | | | | | | | | | | | | | | | | | | | | | | | | | | | | | |
Net increase (decrease) | | | (1,354,943 | ) | | $ | (34,862,533 | ) | | | (1,698,770 | ) | | $ | (38,409,865 | ) | | | 19,672 | | | $ | 323,297 | | | | (276 | ) | | $ | (65,637 | ) |
| | | | | | | | | | | | | | | | | | | | | | | | | | | | | | | | |
| | | | | | | | | | | | | | | | |
| | | Emerging Opportunities | |
| | | 2014 | | | 2013 | |
| | | Shares | | | Amount | | | Shares | | | Amount | |
Service Class: | | | | | | | | | | | | | | | | |
Proceeds from sale of shares | | | 1,097,506 | | | $ | 52,817,257 | 1 | | | 769,762 | | | $ | 35,294,189 | |
Reinvestment of distributions | | | 480,130 | | | | 22,993,403 | | | | 245,892 | | | | 8,478,353 | |
Cost of shares repurchased | | | (1,360,770 | ) | | | (63,737,132 | ) | | | (608,491 | ) | | | (25,727,865 | ) |
| | | | | | | | | | | | | | | | |
Net increase | | | 216,866 | | | $ | 12,073,528 | | | | 407,163 | | | $ | 18,044,677 | |
| | | | | | | | | | | | | | | | |
Institutional Class: | | | | | | | | | | | | | | | | |
Proceeds from sale of shares | | | 69,044 | | | $ | 3,338,393 | | | | 171,893 | | | $ | 8,092,144 | |
Reinvestment of distributions | | | 107,315 | | | | 5,151,130 | | | | 66,982 | | | | 2,310,199 | |
Cost of shares repurchased | | | (290,013 | ) | | | (14,171,040 | ) | | | (176,822 | ) | | | (7,678,876 | ) |
| | | | | | | | | | | | | | | | |
Net increase (decrease) | | | (113,654 | ) | | $ | (5,681,517 | ) | | | 62,053 | | | $ | 2,723,467 | |
| | | | | | | | | | | | | | | | |
| 1 | Includes a contribution of capital by the Investment Manager ( See Note 2 in the Notes to Financial Statements.) |
At October 31, 2014, certain unaffiliated shareholders of record, specifically omnibus accounts, individually or collectively held greater than 10% of the net assets of the Funds as follows: Small Cap—two collectively own 46%; All Cap Growth—one owns 14%; Emerging Opportunities—two collectively own 47%; Real Estate Securities—three collectively own 61%. Transactions by these shareholders may have a material impact on their respective Fund.
47
Notes to Financial Statements (continued)
h. REPURCHASE AGREEMENTS
The Funds may enter into repurchase agreements provided that the value of the underlying collateral, including accrued interest, will equal or exceed the value of the repurchase agreement during the term of the agreement. The underlying collateral for all repurchase agreements is held in safekeeping by the Fund’s custodian or at the Federal Reserve Bank. If the seller defaults and the value of the collateral declines, or if bankruptcy proceedings commence with respect to the seller of the security, realization of the collateral by the Fund may be delayed or limited. At October 31, 2014, the market value of repurchase agreements outstanding for Small Cap, All Cap Growth and Emerging Opportunities was $1,207,281, $929,341 and $12,765,059, respectively.
2. AGREEMENTS AND TRANSACTIONS WITH AFFILIATES
For each of the Funds, the Trust has entered into an investment advisory agreement under which the Investment Manager, a subsidiary and the U.S. retail distribution arm of Affiliated Managers Group, Inc. (“AMG”), serves as Investment Manager to the Funds and is responsible for the Funds’ overall administration and operations. The Investment Manager selects one or more subadvisors for the Funds (subject to Board approval) and monitors each subadvisor’s investment performance, security holdings and investment strategies. Each Fund’s investment portfolio is managed by one or more portfolio managers who serve pursuant to a subadvisory agreement with the Investment Manager. Small Cap is managed by Frontier Capital Management Co., LLC (“Frontier”). All Cap Growth is managed by TimesSquare Capital Management, LLC (“TimesSquare”). AMG indirectly owns a majority interest in Frontier and TimesSquare.
Investment management fees are paid directly by the Funds to the Investment Manager based on average daily net assets. For the fiscal year ended October 31, 2014, the Funds’ investment management fees were paid at the following annual rate of each Fund’s respective average daily net assets:
| | | | |
Small Cap | | | 1.00 | % |
All Cap Growth | | | 0.75 | % |
Emerging Opportunities | | | 1.00 | % |
Real Estate Securities | | | 0.60 | % |
The Investment Manager has contractually agreed, through March 1, 2015, to waive management fees (but not below zero) and/or reimburse Fund expenses in order to limit total annual Fund operating expenses after fee waiver and expense reimbursements (exclusive of taxes, interest (including interest incurred in connection with bank and custody overdrafts), shareholder servicing fees, distribution and service (12b-1) fees, brokerage commissions, and other transaction costs, acquired fund fees and expenses and extraordinary expenses) of Small Cap, All Cap Growth, and Emerging Opportunities to 1.05%, 0.79%, and 1.18%, respectively, of each Fund’s average daily net assets subject to later reimbursement by the Funds in certain circumstances. The contractual expense limitation may only be terminated in the event the Investment Manager or a successor ceases to be the Investment Manager of the Fund or a successor fund, by mutual agreement of the Investment Manager and the AMG Funds’ Board of Trustees, or in the event of the Fund’s liquidation unless the Fund is reorganized or is a party to a merger in which the surviving entity is successor to the accounting and performance information of the Fund.
Effective July 1, 2012, the Investment Manager has contractually agreed through March 1, 2015 to waive management fees and/or reimburse Fund expenses in order to limit the Real Estate Securities Fund’s total annual Fund operating expenses after fee waiver and expense reimbursements (exclusive of taxes, interest (including interest incurred in connection with bank and custody overdrafts), brokerage commissions and other transaction costs, acquired fund fees and expenses, and extraordinary expenses) to 1.24% of the Fund’s average daily net assets. Immediately prior to July 1, 2012, the Fund had a contractual expense limitation of 1.29%.
Each Fund is obligated to repay the Investment Manager such amounts waived, paid or reimbursed in future years provided that the repayment occurs within thirty-six (36) months after the waiver or reimbursement and that such repayment would not cause the Fund’s total annual operating expenses after fee waiver and expense reimbursements in any such future year to exceed that Fund’s contractual expense limitation amount. For the fiscal year ended October 31, 2014, each Fund’s components of reimbursement available are detailed in the following chart:
| | | | | | | | | | | | |
| | | Small
Cap | | | All Cap
Growth | | | Emerging
Opportunities | |
Reimbursement Available—10/31/13 | | $ | 268,302 | | | $ | 465,355 | | | $ | 1,003,559 | |
Additional Reimbursements | | | 93,286 | | | | 193,572 | | | | 360,327 | |
Repayments | | | — | | | | — | | | | — | |
Expired Reimbursements | | | (116,506 | ) | | | (157,601 | ) | | | (326,044 | ) |
| | | | | | | | | | | | |
Reimbursement Available—10/31/14 | | $ | 245,082 | | | $ | 501,326 | | | $ | 1,037,842 | |
| | | | | | | | | | | | |
| | | | |
| | | Real Estate
Securities | |
Reimbursement Available—10/31/13 | | $ | 26,047 | |
Additional Reimbursements | | | — | |
Repayments | | | (26,047 | ) |
Expired Reimbursements | | | — | |
| | | | |
Reimbursement Available—10/31/14 | | $ | 0 | |
| | | | |
Small Cap is obligated by its investment management contract to pay an annual management fee to the Investment Manager. The Investment Manager, in turn, pays all or a portion of this fee to Frontier. Under its Investment Manager Agreement with the Fund, the Investment Manager provides a variety of administrative services to the Fund. The Investment Manager receives compensation from Frontier for its administrative services to the Fund pursuant to a separate agreement between the Investment Manager and Frontier. For each of the Funds other than Small Cap, the Trust has entered into an Administration and Shareholder Servicing Agreement under which the Investment Manager serves as the Funds’ administrator (the “Administrator”) and is responsible for all aspects of managing the Funds’ operations, including administration and shareholder services to each Fund, its shareholders, and certain institutions, such as bank trust departments, broker-dealers and registered investment advisers, that advise or act as an intermediary with the Funds’ shareholders. The Funds pays a fee to the Administrator at the rate of 0.25% per annum of each Fund’s average daily net assets for this service.
Notes to Financial Statements (continued)
The aggregate annual retainer paid to each Independent Trustee of the Board is $130,000, plus $7,000 or $2,500 for each regular or special meeting attended, respectively. The Independent Chairman of the Trusts receives an additional payment of $35,000 per year. The Chairman of the Audit Committee receives an additional payment of $15,000 per year. The Trustees’ fees and expenses are allocated among all of the Funds in the Trusts for which the Investment Manager serves as the advisor based on the relative net assets of such Funds. The “Trustees fees and expenses” shown in the financial statements represents each Fund’s allocated portion of the total fees and expenses paid by the AMG Funds family of mutual funds (“AMG Funds family”).
Prior to January 1, 2014, the aggregate annual retainer paid to each Independent Trustee of the Board was $105,000, plus $6,000 or $2,500 for each regular or special meeting attended, respectively. The Independent Chairman of the Trusts formerly received an additional payment of $25,000 per year. The Chairman of the Audit Committee formerly received an additional payment of $10,000 per year.
Prior to January 1, 2013, the aggregate annual retainer paid to each Independent Trustee of the Board was $80,000, plus $5,000 or $2,500 for each regular or special meeting attended, respectively. The Independent Chairman of the Trusts formerly received an additional payment of $20,000 per year. The Chairman of the Audit Committee formerly received an additional payment of $8,000 per year.
The Funds are distributed by AMG Distributors, Inc. (formerly Managers Distributors, Inc.) (the “Distributor”), a wholly-owned subsidiary of the Investment Manager. The Distributor serves as the distributor and underwriter for each Fund and is a registered broker-dealer and member of the Financial Industry Regulatory Authority, Inc. (“FINRA”). Shares of each Fund will be continuously offered and will be sold directly to prospective purchasers and through brokers, dealers or other financial intermediaries who have executed selling agreements with the Distributor. Subject to the compensation arrangement discussed below, generally the Distributor bears all or a portion of the expenses of providing services pursuant to the distribution agreement, including the payment of the expenses relating to the distribution of prospectuses for sales purposes and any advertising or sales literature. Certain Trustees and Officers of the Funds are Officers and/or Directors of the Investment Manager, AMG and/or the Distributor.
Small Cap and All Cap Growth have adopted a distribution and service plan (the “Plan”) with respect to the Investor Class shares in accordance with the requirements of Rule 12b-1 under the 1940 Act and the requirements of the applicable rules of FINRA regarding asset based sales charges. Pursuant to the Plan, each Fund may make payments to the Distributor for its expenditures in financing any activity primarily intended to result in the sale of each such class of the Fund’s shares and for maintenance and personal service provided to existing shareholders of that class. The Plan authorizes payments to the Distributor up to 0.25% annually of each Fund’s average daily net assets attributable to the Investor Class shares.
For each of the Investor and Service Classes, the Board has approved reimbursement payments to the Investment Manager for shareholder servicing expenses (“shareholder servicing fees”) incurred. Shareholder servicing fees
include payments to third parties such as a bank, broker-dealer, trust company or other financial intermediaries who provide shareholder recordkeeping, account servicing and other services. The Investor and Service Class shares may reimburse the Investment Manager for the actual amount incurred up to a maximum annual rate of each Class’s average daily net asset value as shown in the table below.
The impact on the annualized expense ratios for the fiscal year ended October 31, 2014 were as follows:
| | | | | | | | |
| Fund | | Maximum
Amount
Allowed | | | Actual
Amount
Incurred | |
Small Cap | | | | | | | | |
Investor Class | | | 0.25 | % | | | 0.25 | % |
Service Class | | | 0.25 | % | | | 0.23 | % |
All Cap Growth | | | | | | | | |
Investor Class | | | 0.25 | % | | | 0.24 | % |
Service Class | | | 0.25 | % | | | 0.10 | % |
Emerging Opportunities | | | | | | | | |
Service Class | | | 0.25 | % | | | 0.25 | % |
During the period, the Service Class of the Emerging Opportunities Fund recorded a capital contribution by the Investment Manager of $61,744. The contribution represented a payment in connection with the reallocation of certain shareholder servicing expenses for which the Class had reimbursed the Investment Manager in prior periods, plus interest.
The Securities and Exchange Commission granted an exemptive order that permits the Funds to lend and borrow money for certain temporary purposes directly to and from other eligible Funds in the AMG Funds family. Participation in this interfund lending program is voluntary for both borrowing and lending Funds, and an interfund loan is only made if it benefits each participating Fund. The Investment Manager administers the program according to procedures approved by the Board, and the Board monitors the operation of the program. An interfund loan must comply with certain conditions set out in the exemptive order, which are designed to assure fairness and protect all participating Funds. For the fiscal year ended October 31, 2014, the following Funds either borrowed from or lent to other Funds in the AMG Funds family: Small Cap borrowed $2,056,818, for two days paying interest of $68. The interest amount is included in the Statement of Operations as miscellaneous expense. Emerging Opportunities lent $1,937,398, for four days earning interest of $118. The interest amount is included in the Statement of Operations as interest income. At October 31, 2014, the Funds had no loans outstanding.
For the fiscal year ended October 31, 2014, Emerging Opportunities executed the following transactions at the closing price of the security and with no commissions under Rule 17a-7 procedures approved by the Board:
November 1, 2013—bought 900 shares of Faro Technologies, Inc. at $50.14 from Lord Abbett Research Fund—Small-Cap Value Series
Notes to Financial Statements (continued)
November 1, 2013—sold 3,379 shares of Fluidigm Corp. at $31.38 to Lord Abbett Developing Growth Fund
November 1, 2013—sold 4,732 shares of Flotek Industries, Inc. at $20.97 to Lord Abbett Developing Growth Fund
November 1, 2013—sold 4,784 shares of RigNet, Inc. at $36.94 to Lord Abbett Developing Growth Fund
November 5, 2013—bought 1,012 shares of Faro Technologies, Inc. at $51.00 from Lord Abbett Research Fund—Small-Cap Value Series
November 15, 2013—bought 2,400 shares of Virtusa Corp. at $35.24 from Lord Abbett Micro Cap Value Fund
Janurary 29, 2014—sold 4,297 shares of Rentrack Corp. at $53.32 to Lord Abbett Developing Growth Fund
February 4, 2014—sold 4,685 shares of Rentrack Corp. at $56.50 to Lord Abbett Developing Growth Fund
February 19, 2014—sold 2,288 shares of Rentrack Corp. at $64.21 to Lord Abbett Developing Growth Fund
February 20, 2014—sold 5,187 shares of Boulder Brands, Inc. at $14.02 to Lord Abbett Bond Debenture Fund
March 6, 2014—bought 2,073 shares of Gentherm, Inc. at $31.90 from Lord Abbett Research Fund—Small-Cap Value Series
March 6, 2014—bought 1,200 shares of Gentherm, Inc. at $31.64 from Lord Abbett Research Fund—Small-Cap Value Series
March 6, 2014—bought 800 shares of Pinnacle Financial Partners at $37.16 from Lord Abbett Research Fund—Small-Cap Value Series
March 6, 2014—bought 1,200 shares of Pinnacle Financial Partners at $37.09 from Lord Abbett Research Fund—Small-Cap Value Series
March 19, 2014—sold 3,357 shares of Receptos, Inc. at $54.35 to Lord Abbett Developing Growth Fund
March 24, 2014—sold 4,369 shares of Rentrack Corp. at $57.45 to Lord Abbett Developing Growth Fund
April 9, 2014—sold 1,036 shares of Astronics Corp. at $56.11 to Lord Abbett Micro Cap Value Fund
April 24, 2014—bought 1,100 shares of Vince Holding Corp. at $26.35 to Lord Abbett High Yield Fund
May 27, 2014—bought 300 shares of Sarepta Therapeutics, Inc. at $35.07 to Lord Abbett Fundamental Equity Fund
June 25, 2014—sold 16,438 shares of Invensense, Inc. at $22.05 to Lord Abbett Developing Growth Fund
July 8, 2014—sold 5,181 shares of Aerovironment, Inc. at $31.14 to Lord Abbett High Yield Fund
September 10, 2014—sold 2,566 shares of ExamWorks Group, Inc. at $33.51 to Lord Abbett Research Fund—Small-Cap Value Series
October 3, 2014—sold 6,703 shares of Ambarella, Inc. at $42.65 to Lord Abbett Developing Growth Fund
3. PURCHASES AND SALES OF SECURITIES
Purchases and sales of securities (excluding short-term securities and U.S. Government Obligations) for the fiscal year ended October 31, 2014, were as follows:
| | | | | | | | |
| | | Long-Term Securities | |
| Fund | | Purchases | | | Sales | |
Small Cap | | $ | 30,554,620 | | | $ | 72,714,051 | |
All Cap Growth | | | 34,800,959 | | | | 36,708,754 | |
Emerging Opportunities | | | 208,759,494 | | | | 226,590,495 | |
Real Estate Securities | | | 186,776,746 | | | | 122,829,881 | |
The Funds had no purchases or sales of U.S. Government obligations during the fiscal year ended October 31, 2014.
4. PORTFOLIO SECURITIES LOANED
The Funds, other than Real Estate Securities, participate in a securities lending program offered by BNYM (the “Program”), providing for the lending of securities to qualified brokers. Securities lending income includes earnings of such temporary cash investments, plus or minus any rebate to a borrower. These earnings (after any rebate) are then divided between BNYM, as a fee for its services under the Program, and the Funds, according to agreed-upon rates. Collateral on all securities loaned is accepted in cash and is maintained at a minimum level of 102% (105% in the case of certain foreign securities) of the market value, plus interest, if applicable, of investments on loan. It is the Funds’ policy to obtain additional collateral from or return excess collateral to the borrower by the end of the next business day, following the valuation date of the securities loaned. Therefore, the value of the collateral held may be temporarily less than the value of the securities on loan. Lending securities entails a risk of loss to the Funds if and to the extent that the market value of the securities loaned were to increase and the borrower did not increase the collateral accordingly, and the borrower fails to return the securities. Under the terms of the Program, the Funds are indemnified for such losses by BNYM. Cash collateral is held in a separate account managed by BNYM, who is authorized to exclusively enter into overnight government repurchase agreements. BNYM bears the risk of any deficiency in the amount of the cash collateral available for return to the borrower due to any loss on the collateral invested.
50
Notes to Financial Statements (continued)
At October 31, 2014, the value of the securities loaned and cash collateral received were as follows:
| | | | | | | | |
| | | Securities | | | Cash
Collateral | |
| Fund | | Loaned | | | Received | |
Small Cap | | $ | 1,171,270 | | | $ | 1,207,281 | |
All Cap Growth | | | 908,119 | | | | 929,341 | |
Emerging Opportunities | | | 12,229,198 | | | | 12,765,059 | |
5. COMMITMENTS AND CONTINGENCIES
Under the Trust’s organizational documents, its trustees and officers are indemnified against certain liabilities arising out of the performance of their duties to the Trust. In addition, in the normal course of business, the Funds may enter into contracts and agreements that contain a variety of representations and warranties, which provide general indemnifications. The maximum exposure
to the Funds under these arrangements is unknown, as this would involve future claims that may be made against the Funds that have not yet occurred. However, based on experience, the Funds had no prior claims or losses and expect the risks of loss to be remote.
6. MASTER NETTING AGREEMENTS
The Funds may enter into master netting agreements with their counterparties for the securities lending program and repurchase agreements, which provide the right, in the event of default (including bankruptcy or insolvency) for the non-defaulting party to liquidate the collateral and calculate net exposure to the defaulting party or request additional collateral. For financial reporting purposes, the Funds do not offset financial assets and financial liabilities that are subject to master netting agreements in the Statement of Assets and Liabilities. For securities lending transactions, see Note 4.
The following tables are a summary of the Funds’ open repurchase agreements that are subject to a master netting agreement as of October 31, 2014:
| | | | | | | | | | | | | | | | |
| | | | | | Gross Amount Not Offset in the
Statement of Assets and Liabilities | | | | |
| Fund | | Net Amounts of Assets
Presented in the Statement
of Assets and Liabilities | | | Financial Instruments
Collateral | | | Cash Collateral Received | | | Net Amount | |
Small Cap | | | | | | | | | | | | | | | | |
Cantor Fitzgerald Securities, Inc. | | $ | 1,000,000 | | | $ | 1,000,000 | | | | — | | | | — | |
Nomura Securities USA, Inc. | | | 207,281 | | | | 207,281 | | | | — | | | | — | |
| | | | | | | | | | | | | | | | |
Total | | $ | 1,207,281 | | | $ | 1,207,281 | | | | — | | | | — | |
| | | | | | | | | | | | | | | | |
All Cap Growth | | | | | | | | | | | | | | | | |
Cantor Fitzgerald Securities, Inc. | | $ | 929,341 | | | $ | 929,341 | | | | — | | | | — | |
| | | | | | | | | | | | | | | | |
Total | | $ | 929,341 | | | $ | 929,341 | | | | — | | | | — | |
| | | | | | | | | | | | | | | | |
Emerging Opportunities | | | | | | | | | | | | | | | | |
Cantor Fitzgerald Securities, Inc. | | $ | 3,031,712 | | | $ | 3,031,712 | | | | — | | | | — | |
Citigroup Global Markets, Inc. | | | 638,211 | | | | 638,211 | | | | — | | | | — | |
Daiwa Capital Markets America | | | 3,031,712 | | | | 3,031,712 | | | | — | | | | — | |
Nomura Securities USA, Inc. | | | 3,031,712 | | | | 3,031,712 | | | | — | | | | — | |
State of Wisconsin Investment Board | | | 3,031,712 | | | | 3,031,712 | | | | — | | | | — | |
| | | | | | | | | | | | | | | | |
Total | | $ | 12,765,059 | | | $ | 12,765,059 | | | | — | | | | — | |
| | | | | | | | | | | | | | | | |
7. SUBSEQUENT EVENTS
Each Fund has determined that no material events or transactions occurred through the issuance date of the Funds’ financial statements which require additional disclosure in or adjustment of the Funds’ financial statements.
51
Notes to Financial Statements (continued)
TAX INFORMATION (unaudited)
AMG Frontier Small Cap Growth Fund, AMG TimesSquare All Cap Growth Fund, AMG Managers Emerging Opportunities Fund and AMG Managers Real Estate Securities Fund each hereby designates the maximum amount allowable of its net taxable income as qualified dividends as provided in the Jobs and Growth Tax Relief Reconciliation Act of 2003. The 2013/2014 Form 1099-DIV you receive for each Fund will show the tax status of all distributions paid to you during the year.
Pursuant to section 852 of the Internal Revenue Code, AMG Frontier Small Cap Growth Fund, AMG TimesSquare All Cap Growth Fund, AMG Managers Emerging Opportunities Fund and AMG Managers Real Estate Securities Fund each hereby designate $12,795,156, $2,425,016, $19,204,566 and $9,759,915 respectively, as a capital gain distribution with respect to the taxable year ended October 31, 2014, or if subsequently determined to be different, the net capital gains of such year.
52
Report of Independent Registered Public Accounting Firm
TO THE BOARD OF TRUSTEES OF AMG FUNDS I AND THE SHAREHOLDERS OF AMG FRONTIER SMALL CAP GROWTH FUND, AMG TIMESSQUARE ALL CAP GROWTH FUND, AMG MANAGERS EMERGING OPPORTUNITIES FUND AND AMG MANAGERS REAL ESTATE SECURITIES FUND:
In our opinion, the accompanying statements of assets and liabilities, including the schedules of portfolio investments, and the related statements of operations and of changes in net assets and the financial highlights present fairly, in all material respects, the financial positions of AMG Frontier Small Cap Growth Fund (formerly, Managers Frontier Small Cap Growth Fund), AMG TimesSquare All Cap Growth Fund (formerly, Managers AMG TSCM Growth Equity Fund), AMG Managers Emerging Opportunities Fund (formerly, Managers Micro-Cap Fund) and AMG Managers Real Estate Securities Fund (formerly, Managers Real Estate Fund) (the “Funds”) at October 31, 2014, and the results of each of their operations, the changes in each of their net assets and the financial highlights for each of the periods indicated, in conformity with accounting principles generally accepted in the United States of America. These financial statements and financial highlights (hereafter referred to as “financial statements”) are the responsibility of the Funds’ management. Our responsibility is to express an opinion on these financial statements based on our audits. We conducted our audits of these financial statements in accordance with the standards of the Public Company Accounting Oversight Board (United States). Those standards require that we plan and perform the audit to obtain reasonable assurance about whether the financial statements are free of material misstatement. An audit includes examining, on a test basis, evidence supporting the amounts and disclosures in the financial statements, assessing the accounting principles used and significant estimates made by management, and evaluating the overall financial statement presentation. We believe that our audits, which included confirmation of securities at October 31, 2014 by correspondence with the custodian, brokers and the application of alternative auditing procedures where securities purchased had not been received, provide a reasonable basis for our opinion.
PricewaterhouseCoopers LLP
Boston, Massachusetts
December 29, 2014
53
AMG Funds
Trustees and Officers
The Trustees and Officers of the Trust, their business addresses, principal occupations for the past five years and dates of birth are listed below. The Trustees provide broad supervision over the affairs of the Trust and the Funds. The Trustees are experienced executives who meet periodically throughout the year to oversee the Funds’ activities, review contractual arrangements with
companies that provide services to the Funds, and review the Funds’ performance. Unless otherwise noted, the address of each Trustee or Officer is the address of the Trust: 800 Connecticut Avenue, Norwalk, Connecticut 06854.
There is no stated term of office for Trustees. Trustees serve until their resignation, retirement or removal in accordance with the Trust’s
organizational documents and policies adopted by the Board from time to time. The Chairman of the Trustees, President, Treasurer and Secretary of the Trust are elected by the Trustees annually. Other officers hold office at the pleasure of the Trustees.
Independent Trustees
The following Trustees are not “interested persons” of the Trust within the meaning of the 1940 Act:
| | |
Number of Funds
Overseen in Fund Complex | | Name, Date of Birth, Principal Occupation(s) During Past 5 Years and Other Directorships Held by Trustee |
| |
• Trustee since 2012 | | Bruce B. Bingham, 12/1/48 |
• Oversees 43 Funds in Fund Complex | | Partner, Hamilton Partners (real estate development firm) (1987-Present); Trustee of Aston Funds (25 portfolios) (2014-Present); Director of The Yacktman Funds (2000-2012). |
| |
• Independent Chairman | | William E. Chapman II, 9/23/41 |
• Trustee since 2000 • Oversees 43 Funds in Fund Complex | | President and Owner, Longboat Retirement Planning Solutions (1998-Present); Hewitt Associates, LLC (part time) (provider of Retirement and Investment Education Seminars) (2002-2009); Trustee Emeritus of Bowdoin College (2013-Present); Trustee of Bowdoin College (2002-2013); Director of Harding, Loevner Funds, Inc. (6 portfolios); Trustee of Third Avenue Trust (5 portfolios); Trustee of Third Avenue Variable Trust (1 portfolio); Trustee of Aston Funds (25 portfolios) (2010-Present). |
| |
| |
• Trustee since 2000 | | Edward J. Kaier, 9/23/45 |
• Oversees 43 Funds in Fund Complex | | Attorney at Law and Partner, Teeters Harvey Marrone & Kaier LLP (2007-Present); Attorney at Law and Partner, Hepburn Willcox Hamilton & Putnam, LLP (1977-2007); Trustee of Third Avenue Trust (5 portfolios); Trustee of Third Avenue Variable Trust (1 portfolio); Trustee of Aston Funds (25 portfolios) (2010-Present). |
| |
• Trustee since 2013 | | Kurt A. Keilhacker, 10/5/63 |
• Oversees 45 Funds in Fund Complex | | Managing Member, TechFund Capital (1997-Present); Managing Member, TechFund Europe (2000-Present); Trustee, Gordon College (2001-Present); Board Member, 6wind SA, (2002-Present); Managing Member, Clapham Partners I, LLC (2013-Present); Trustee of Aston Funds (25 portfolios) (2014-Present). |
| |
• Trustee since 2000 | | Steven J. Paggioli, 4/3/50 |
• Oversees 43 Funds in Fund Complex | | Independent Consultant (2002-Present); Formerly Executive Vice President and Director, The Wadsworth Group (1986-2001); Executive Vice President, Secretary and Director, Investment Company Administration, LLC (1990-2001); Vice President, Secretary and Director, First Fund Distributors, Inc. (1991-2001); Trustee, Professionally Managed Portfolios (45 portfolios); Advisory Board Member, Sustainable Growth Advisors, LP; Independent Director, Chase Investment Counsel (2008-Present); Trustee of Aston Funds (25 portfolios) (2010-Present). |
| |
• Trustee since 2013 | | Richard F. Powers III, 2/2/46 |
• Oversees 43 Funds in Fund Complex | | Adjunct Professor, Boston College (2011-Present); Trustee of Aston Funds (25 portfolios) (2014-Present); Director of Ameriprise Financial Inc. (2005-2009); President and CEO of Van Kampen Investments Inc. (1998-2003). |
| |
• Trustee since 2000 | | Eric Rakowski, 6/5/58 |
• Oversees 45 Funds in Fund Complex | | Professor, University of California at Berkeley School of Law (1990-Present); Director of Harding, Loevner Funds, Inc. (6 portfolios); Trustee of Third Avenue Trust (5 portfolios); Trustee of Third Avenue Variable Trust (1 portfolio); Trustee of Aston Funds (25 portfolios) (2010-Present). |
| |
• Trustee since 2013 | | Victoria L. Sassine, 8/11/65 |
• Oversees 45 Funds in Fund Complex | | Lecturer, Babson College (2007-Present); Trustee of Aston Funds (25 portfolios) (2014-Present). |
| |
• Trustee since 2000 | | Thomas R. Schneeweis, 5/10/47 |
• Oversees 43 Funds in Fund Complex | | Professor Emeritus, University of Massachusetts (2013-Present); Partner, S Capital Management, LLC (2007-Present); President, TRS Associates (1982-Present); Director, CISDM at the University of Massachusetts, (1996-2013); President, Alternative Investment Analytics, LLC, (formerly Schneeweis Partners, LLC) (2001-2013); Professor of Finance, University of Massachusetts (1977-2013); Partner, White Bear Partners, LLC (2007-2010); Partner, Northampton Capital Management, LLC (2004-2010); Trustee of Aston Funds (25 portfolios) (2010-Present). |
54
AMG Funds
Trustees and Officers (continued)
Interested Trustees
Each Trustee in the following table is an “interested person” of the Trust within the meaning of the 1940 Act. Ms. Carsman is an interested person of the Trust within the meaning of the 1940 Act by virtue of her position with, and interest in securities of, AMG, and her former position as Chief Legal Officer of the Trust.
| | |
Number of Funds Overseen in
Fund Complex | | Name, Date of Birth, Principal Occupation(s) During Past 5 Years and Other Directorships Held by Trustee |
| |
• Trustee since 2011 | | Christine C. Carsman, 4/2/52 |
• Oversees 45 Funds in Fund Complex | | Senior Vice President and Deputy General Counsel, Affiliated Managers Group, Inc. (2011-Present); Trustee of Aston Funds (25 portfolios) (2014-Present); Senior Vice President and Chief Regulatory Counsel, Affiliated Managers Group, Inc. (2007-2011); Vice President and Chief Regulatory Counsel, Affiliated Managers Group, Inc. (2004-2007); Secretary and Chief Legal Officer, AMG Funds, AMG Funds I, AMG Funds II and AMG Funds III (2004-2011); Senior Counsel, Vice President and Director of Operational Risk Management and Compliance, Wellington Management Company, LLP (1995-2004). |
Officers
| | |
Position(s) Held with Fund and
Length of Time Served | | Name, Date of Birth, Principal Occupation(s) During Past 5 Years |
| |
• President since 2014 | | Jeffrey T. Cerutti, 2/7/68 |
• Principal Executive Officer since 2014 | | Chief Executive Officer, AMG Funds LLC (2014-Present); Director, President and Principal, AMG Distributors, Inc. (2014-Present); President and Principal Executive Officer, AMG Pantheon Private Equity Fund, LLC and AMG Pantheon Private Equity Master Fund, LLC (2014-Present); President, VP Distributors, (2011-2014); Executive Vice President, Head of Distribution, Virtus Investment Partners, Inc. (2010-2014); Managing Director, Head of Sales, UBS Global Asset Management (2001-2010). |
| |
• Chief Operating Officer since 2007 | | Keitha L. Kinne, 5/16/58 Chief Operating Officer, AMG Funds LLC (2007-Present); Chief Investment Officer, AMG Funds LLC (2008-Present); Chief Operating Officer, AMG Distributors, Inc. (2007-Present); Chief Operating Officer, AMG Pantheon Private Equity Fund, LLC and AMG Pantheon Private Equity Master Fund, LLC (2014-Present); Managing Partner, AMG Funds LLC (2007-2014); President, AMG Funds (2012-2014); President, AMG Distributors, Inc. (2012-2014); Managing Director, Legg Mason & Co., LLC (2006-2007); Managing Director, Citigroup Asset Management (2004-2006). |
| |
• Secretary since 2011 | | Lewis Collins, 2/22/66 |
• Chief Legal Officer since 2011 | | Senior Vice President and Senior Counsel, Affiliated Managers Group, Inc. (2010-Present); Secretary, AMG Pantheon Private Equity Fund, LLC and AMG Pantheon Private Equity Master Fund, LLC (2014-Present); Vice President and Senior Counsel, Affiliated Managers Group, Inc. (2006-2010); Senior Counsel, Affiliated Managers Group, Inc. (2002-2006); Attorney, Ropes & Gray LLP (1998-2002). |
| |
• Chief Financial Officer since 2007 • Treasurer since 1999 • Principal Financial Officer since 1999 | | Donald S. Rumery, 5/29/58 Senior Vice President, AMG Funds LLC (2005-Present); Treasurer, AMG Funds III (1995-Present); Treasurer, AMG Funds (1999-Present); Treasurer, AMG Funds II (2000-Present); Chief Financial Officer, AMG Funds III, AMG Funds and AMG Funds II (2007-Present); Treasurer, Principal Financial Officer and Principal Accounting Officer, AMG Pantheon Private Equity Fund, LLC and AMG Pantheon Private Equity Master Fund, LLC (2014-Present); Treasurer and Chief Financial Officer, AMG Distributors, Inc. (2000-2012); Vice President, AMG Funds LLC, (1994-2004). |
| |
• Assistant Treasurer since 2014 | | John C. Ball, 1/9/76 Vice President, Assistant Treasurer, AMG Funds LLC (2014-Present); Assistant Treasurer, AMG Pantheon Private Equity Fund, LLC and AMG Pantheon Private Equity Master Fund, LLC (2014-Present); Vice President, State Street Corp. (2010-2014); Vice President, State Street International (Ireland) Limited (2007-2010). |
| |
• Chief Compliance Officer since 2010 | | John J. Ferencz, 3/9/62 Vice President, Legal and Compliance, AMG Funds LLC (2010-Present); Senior Compliance Analyst, Mutual Funds and Regulatory, GE Asset Management Incorporated (2005-2010). |
| |
• Assistant Secretary since 2011 | | Michael S. Ponder, 9/12/73 Senior Vice President and Counsel, AMG Funds LLC (2011-Present); Attorney, DeNovo Legal (2009-2010); Vice President, Credit Suisse (2007-2009); Associate, Willkie Farr & Gallagher LLP (2006-2007). |
| |
• Anti-Money Laundering Compliance Officer since 2014 | | Patrick J. Spellman, 3/15/74 Senior Vice President, Chief Compliance Officer, Legal and Compliance, AMG Funds LLC (2011-Present); Chief Compliance Officer, AMG Distributors, Inc., (2010-Present); Anti-Money Laundering Compliance Officer, AMG Pantheon Private Equity Fund, LLC and AMG Pantheon Private Equity Master Fund, LLC (2014-Present); Compliance Manager, Legal and Compliance, Affiliated Managers Group, Inc. (2005-2011). |
55
Annual Renewal of Investment Management and Subadvisory Agreements
At an in-person meeting held on June 19-20, 2014, the Board of Trustees (the “Board” or the “Trustees”), and separately a majority of the Trustees who are not “interested persons” of the Trust (the “Independent Trustees”), approved the Investment Management Agreement with the Investment Manager for each of AMG Managers Emerging Opportunities Fund (formerly Managers Micro-Cap Fund), AMG Frontier Small Cap Growth Fund (formerly Managers Frontier Small Cap Growth Fund), AMG TimesSquare All Cap Growth Fund (formerly Managers AMG TSCM Growth Equity Fund) and AMG Managers Real Estate Securities Fund (formerly Managers Real Estate Securities Fund) (each a “Fund”) and the Subadvisory Agreement for each of the Subadvisors. The Independent Trustees were separately represented by independent legal counsel in connection with their consideration of the approval of these agreements. In considering the Investment Management and Subadvisory Agreements, the Trustees reviewed a variety of materials relating to each Fund, the Investment Manager and each Subadvisor, including comparative performance, fee and expense information for an appropriate peer group of similar mutual funds (each a “Peer Group”), performance information for relevant benchmark indices (each a “Fund Benchmark”) and, with respect to each Subadvisor, comparative performance information for an appropriate peer group of managed accounts, and, as to all other matters, other information provided to them on a periodic basis throughout the year, as well as information provided in connection with the meetings of June 19-20, 2014, regarding the nature, extent and quality of services provided by the Investment Manager and the Subadvisors under their respective agreements. Prior to voting, the Independent Trustees: (a) reviewed the foregoing information with their independent legal counsel and with management; (b) received materials from their independent legal counsel discussing the legal standards applicable to their consideration of the Investment Management Agreement and the Subadvisory Agreements; and (c) met with their independent legal counsel in private sessions at which no representatives of management were present.
NATURE, EXTENT AND QUALITY OF SERVICES.
In considering the nature, extent and quality of the services provided by the Investment Manager, the Trustees reviewed information relating to the Investment Manager’s operations and personnel. Among other things, the Investment Manager provided financial information, biographical information on its supervisory and professional staff and descriptions of its organizational and management structure. The Trustees also took into account information provided periodically throughout the previous year by the Investment Manager in Board meetings relating to the performance of the Investment Manager’s duties with respect to the Funds and the Trustees’ knowledge of the Investment Manager’s management and the quality of the performance of the Investment Manager’s duties. In the course of their deliberations regarding the Investment Management Agreement, the Trustees evaluated, among other things: (a) the extent and quality of the Investment Manager’s oversight of the operation and management of the Funds; (b) the quality of the search, selection and monitoring services performed by the Investment Manager in overseeing the portfolio management responsibilities of the Subadvisors; (c) the Investment Manager’s ability to supervise the Funds’ other service providers; and (d) the Investment Manager’s compliance program. The Trustees also took into account that, in performing its functions under the Investment Management Agreement and supervising each Subadvisor, the Investment Manager: performs periodic detailed analysis and reviews of the performance by each Subadvisor of its obligations to a Fund, including without limitation a review of each Subadvisor’s investment performance in respect of a Fund; prepares and presents periodic reports to the Board regarding the investment performance of each Subadvisor and other information regarding each Subadvisor, at such times and in such forms as the Board may reasonably request; reviews and considers any changes in the personnel of each Subadvisor responsible for performing the Subadvisor’s obligations and makes appropriate reports to the Board; reviews and considers any changes in the ownership or senior management
of each Subadvisor and makes appropriate reports to the Board; performs periodic in-person or telephonic diligence meetings, including with respect to compliance matters, with representatives of each Subadvisor; assists the Board and management of the Trust in developing and reviewing information with respect to the annual consideration of each Subadvisory Agreement; prepares recommendations with respect to the continued retention of any Subadvisor or the replacement of any Subadvisor; identifies potential successors to or replacements of any Subadvisor or potential additional subadvisors, performs appropriate due diligence, and develops and presents to the Board a recommendation as to any such successor, replacement, or additional subadvisor; designates and compensates from its own resources such personnel as the Investment Manager may consider necessary or appropriate to the performance of its services; and performs such other review and reporting functions as the Board shall reasonably request consistent with the Investment Management Agreement and applicable law. With respect to AMG Frontier Small Cap Growth Fund and AMG TimesSquare All Cap Growth Fund, the Trustees noted the affiliation of each Subadvisor with the Investment Manager, noting any potential conflicts of interest. The Trustees also took into account the financial condition of the Investment Manager with respect to its ability to provide the services required under the Investment Management Agreement and the Investment Manager’s undertaking to maintain contractual expense limitations for the Funds. The Trustees also considered the Investment Manager’s risk management processes.
The Trustees also reviewed information relating to each Subadvisor’s operations and personnel and the investment philosophy, strategies and techniques (for each Subadvisor, its “Investment Strategy”) used in managing a Fund or the portion of a Fund for which the Subadvisor has portfolio management responsibility. Among other things, the Trustees reviewed biographical information on portfolio management and other professional staff, information regarding each Subadvisor’s organizational and management structure and each Subadvisor’s brokerage policies and
Annual Renewal of Investment Management and Subadvisory Agreements (continued)
practices. The Trustees considered specific information provided regarding the experience of the individual(s) at each Subadvisor with portfolio management responsibility for a Fund or the portion of a Fund managed by the Subadvisor, including the information set forth in the Fund’s prospectus and statement of additional information. With respect to AMG Managers Emerging Opportunities Fund, which is managed with multiple Subadvisors, the Trustees also noted information provided by the Investment Manager regarding the manner in which each Subadvisor’s Investment Strategy complements those utilized by the Fund’s other Subadvisors. In the course of their deliberations, the Trustees evaluated, among other things: (a) the services rendered by each Subadvisor in the past; (b) the qualifications and experience of the Subadvisor’s personnel; and (c) the Subadvisor’s compliance program. The Trustees also took into account the financial condition of each Subadvisor with respect to its ability to provide the services required under its Subadvisory Agreement. The Trustees also considered each Subadvisor’s risk management processes.
PERFORMANCE.
As noted above, the Board considered each Fund’s net performance during relevant time periods as compared to each Fund’s Peer Group and Fund Benchmark and considered each Subadvisor’s performance as compared to an appropriate peer group of managed accounts and also considered the gross performance of the Fund or the portion of the Fund managed by each Subadvisor as compared to the Subadvisor’s relevant performance composite that utilizes the same investment strategy and approach and noted that the Board reviews on a quarterly basis detailed information about each Fund’s performance results, portfolio composition and Investment Strategies, including with respect to AMG Managers Emerging Opportunities Fund, the portion of the Fund managed by each Subadvisor. The Board noted the Investment Manager’s expertise and resources in monitoring the performance, investment style and risk-adjusted performance of each Subadvisor. The Board also noted each Subadvisor’s performance record with respect to AMG Managers Emerging Opportunities
Fund. The Board was mindful of the Investment Manager’s attention to monitoring each Subadvisor’s performance with respect to the Funds and its discussions with management regarding the factors that contributed to the performance of the Funds.
ADVISORY AND SUBADVISORY FEES AND PROFITABILITY.
In considering the reasonableness of the advisory fee charged by the Investment Manager for managing each Fund, the Trustees noted that the Investment Manager, and not the Fund, is responsible for paying the fees charged by the Fund’s Subadvisor(s) and, therefore, that the fees paid to the Investment Manager cover the cost of providing portfolio management services as well as the cost of providing search, selection and monitoring services in operating a “manager-of-managers” complex of mutual funds. With respect to AMG Managers Emerging Opportunities Fund, AMG TimesSquare All Cap Growth Fund and AMG Managers Real Estate Securities Fund, the Trustees also considered the amount of the advisory fee retained by the Investment Manager after payment of the subadvisory fee with respect to each Fund. With respect to AMG Frontier Small Cap Growth Fund, the Trustees noted that the Investment Manager pays the Subadvisor a subadvisory fee that is equal to the advisory fee that it receives from the Fund. The Trustees also noted any payments that were made from Frontier Capital Management Company, LLC (“Frontier”) and TimesSquare Capital Management, LLC (“TimesSquare”) to the Investment Manager. The Trustees concluded that, in light of the additional high quality supervisory services provided by the Investment Manager and the fact that the subadvisory fees are paid out of the advisory fee, the advisory fee payable by each Fund to the Investment Manager can reasonably be expected to exceed the median advisory fee for the Peer Group, which consists of many funds that do not operate with a manager-of-managers structure. In this regard, the Trustees also noted that the Investment Manager has undertaken to maintain contractual expense limitations for the Funds.
In considering the reasonableness of the advisory fee payable to the Investment Manager, the Trustees also reviewed information provided by the
Investment Manager setting forth all revenues and other benefits, both direct and indirect (including any so-called “fallout benefits” such as reputational value derived from the Investment Manager serving as Investment Manager to a Fund), received by the Investment Manager and its affiliates attributable to managing each Fund and all the mutual funds in the AMG Funds family, the cost of providing such services and the resulting profitability to the Investment Manager and its affiliates from these relationships. The Trustees also noted the current asset levels of each Fund and the willingness of the Investment Manager to waive fees and pay expenses for all of the Funds from time to time as a means of limiting total expenses. The Trustees also considered management’s discussion of the current asset levels of the Funds, and considered the impact on profitability of the current asset levels and any future growth of assets of the Funds. The Board took into account management’s discussion of the current advisory fee structure, and, as noted above, the services the Investment Manager provides in performing its functions under the Investment Management Agreement and supervising each Subadvisor. In this regard, the Trustees noted that, unlike a mutual fund that is managed by a single investment adviser, the Funds operate in a manager-of-managers structure. Based on the foregoing, the Trustees concluded that the profitability to the Investment Manager is reasonable and that the Investment Manager is not realizing material benefits from economies of scale that would warrant adjustments to the advisory fees for any Fund at this time. With respect to economies of scale, the Trustees also noted that as a Fund’s assets increase over time, the Fund may realize other economies of scale to the extent that the increase in assets is proportionally greater than the increase in certain other expenses.
SUBADVISORY FEES AND PROFITABILITY
In considering the reasonableness of the fee payable by the Investment Manager to each Subadvisor (other than Frontier and TimesSquare, which are affiliates of the Investment Manager), the Trustees relied on the ability of the Investment Manager to negotiate the terms of the Subadvisory Agreement at arm’s length as part of the
Annual Renewal of Investment Management and Subadvisory Agreements (continued)
manager-of-managers structure, noting that the Subadvisor (other than Frontier and TimesSquare) is not affiliated with the Investment Manager. In addition, the Trustees considered other potential benefits of the subadvisory relationship to a Subadvisor, including, among others, the indirect benefits that the Subadvisor may receive from the Subadvisor’s relationship with a Fund, including any so-called “fallout benefits” to the Subadvisor, such as reputational value derived from the Subadvisor serving as Subadvisor to the Fund. In addition, the Trustees noted that the subadvisory fees are paid by the Investment Manager out of its advisory fee. As a consequence of all of the foregoing, the cost of services to be provided by each unaffiliated Subadvisor and the profitability to the Subadvisor of its relationship with a Fund were not material factors in the Trustees’ deliberations. For similar reasons, the Trustees did not consider potential economies of scale in the management of a Fund or the portion of a Fund managed by each unaffiliated Subadvisor to be a material factor in their deliberations at this time.
In considering the reasonableness of the fees payable by the Investment Manager to each of Frontier and TimesSquare, the Trustees noted that each of Frontier and TimesSquare is an affiliate of the Investment Manager and reviewed information regarding the cost to Frontier and TimesSquare, respectively, of providing subadvisory services to a Fund and the resulting profitability from such relationship and noted that, because each of Frontier and TimesSquare is an affiliate of the Investment Manager, such profitability might be directly or indirectly shared by the Investment Manager. The Trustees also noted that the subadvisory fees are paid by the Investment Manager out of its advisory fee. The Board also took into account management’s discussion of the current subadvisory fee structure, and the services each of Frontier and TimesSquare provides in performing its functions under the applicable Subadvisory Agreement. Based on the foregoing, the Trustees concluded that the profitability to each of Frontier and TimesSquare is reasonable and that neither Frontier nor TimesSquare is realizing material benefits from economies of scale that would warrant adjustments to the subadvisory fees at this time. Also with respect to economies of
scale, the Trustees noted that as a Fund’s assets increase over time, the Fund may realize other economies of scale to the extent the increase in assets is proportionally greater than the increase in certain other expenses.
In addition to the foregoing, the Trustees considered the specific factors and related conclusions set forth below with respect to each Fund, the Investment Manager and each Subadvisor.
AMG MANAGERS EMERGING OPPORTUNITIES FUND
FUND PERFORMANCE.
Among other information relating to the Fund’s performance, the Trustees noted that the Fund’s performance for Service Class shares for the 1-year, 3-year, 5-year and 10-year periods ended March 31, 2014 was above the median performance of the Peer Group and above the performance of the Fund Benchmark, the Russell Microcap® Index. The Trustees took into account management’s discussion of the Fund’s performance. The Trustees also took into account the fact that the Fund ranked in the top quintile relative to the Peer Group for the 1-year and 3-year periods and noted the Fund’s favorable 5-year track record as a multi-manager, multi-style Fund. The Trustees concluded that the Fund’s performance has been satisfactory.
ADVISORY FEES.
The Trustees noted that the Fund’s advisory fees (which include both the advisory and administration fee) and total expenses (net of applicable expense waivers/reimbursements) as of March 31, 2014 were both higher than the average for the Peer Group. The Trustees took into account the fact that the Investment Manager has contractually agreed, through March 1, 2015, to limit the Fund’s net annual operating expenses (subject to certain excluded expenses) to 1.18%. The Trustees also noted that the Investment Manager had reduced the Fund’s expense limitation in previous years. The Trustees took into account management’s discussion of the Fund’s expenses and competitiveness with comparably sized funds. The Trustees concluded that, in light
of the nature, extent and quality of the services provided by the Investment Manager and the Subadvisors, the foregoing expense limitation and the considerations noted above with respect to the Subadvisors and the Investment Manager, the Fund’s advisory and subadvisory fees are reasonable.
AMG FRONTIER SMALL CAP GROWTH FUND
FUND PERFORMANCE.
Among other information relating to the Fund’s performance, the Trustees noted that the Fund’s performance for Service Class shares for the 1-year, 3-year, 5-year and 10-year periods ended March 31, 2014 was above, below, below and above, respectively, the median performance of the Peer Group and above, below, below and above, respectively, the performance of the Fund Benchmark, the Russell 2000® Growth Index. The Trustees took into account management’s discussion of the Fund’s performance, including the fact that the Fund’s performance has ranked in the top quintile for the 1-year period. The Trustees noted the impact of the Fund’s underperformance from 2011 to 2013 on the Fund’s intermediate-term performance. The Trustees concluded that the Fund’s overall performance has been satisfactory in light of all factors considered.
ADVISORY FEES.
The Trustees noted that the Fund’s advisory fee and total expenses (net of applicable expense waivers/reimbursements) as of March 31, 2014 were higher and lower, respectively, than the average for the Peer Group. The Trustees took into account the fact that the Investment Manager has contractually agreed, through March 1, 2015, to limit the Fund’s net annual operating expenses (subject to certain excluded expenses) to 1.05%. The Board also took into account management’s discussion of the Fund’s expenses and the current size of the Fund. The Trustees concluded that, in light of the nature, extent and quality of the services provided by the Investment Manager and the Subadvisor (which is an affiliate of the Investment Manager), the foregoing expense limitation and the considerations noted above with respect to the Subadvisor and the Investment Manager, the Fund’s advisory and subadvisory fees are reasonable.
Annual Renewal of Investment Management and Subadvisory Agreements (continued)
AMG TIMESSQUARE ALL CAP GROWTH FUND
FUND PERFORMANCE.
Among other information relating to the Fund’s performance, the Trustees noted that the Fund’s performance for Service Class shares for the 1-year and 3-year periods ended March 31, 2014 and the period from the Fund’s inception on July 30, 2010 through March 31, 2014 was below the median performance of the Peer Group and below the performance of the Fund Benchmark, the Russell 3000® Growth Index. The Trustees took into account management’s discussion of the Fund’s performance, including the reasons for the Fund’s more recent underperformance. The Trustees also noted that the Fund’s 3-year and since inception performance was impacted by underperformance in 2011. The Trustees concluded that the Fund’s performance is being addressed.
ADVISORY FEES.
The Trustees noted that the Fund’s advisory fees (which include both the advisory and administration fee) and total expenses (net of applicable expense waivers/reimbursements) as of March 31, 2014 were higher and lower, respectively, than the average for the Peer Group. The Trustees took into account the fact that the Investment Manager has contractually agreed, through March 1, 2015, to limit the Fund’s net annual operating expenses (subject to certain excluded expenses) to 0.79%. The Board took into account management’s discussion of the Fund’s expenses and the current size of the Fund. The Trustees concluded that, in light of the nature, extent and quality of the services provided by the Investment Manager and the Subadvisor (which is an affiliate of the Investment Manager), the foregoing expense limitation and the
considerations noted above with respect to the Subadvisor and the Investment Manager, the Fund’s advisory and subadvisory fees are reasonable.
AMG MANAGERS REAL ESTATE SECURITIES FUND
FUND PERFORMANCE.
Among other information relating to the Fund’s performance, the Trustees noted that the Fund’s performance for the 1-year, 3-year, 5-year and 10-year periods ended March 31, 2014 was above the median performance of the Peer Group and above, below, below and above, respectively, the performance of the Fund Benchmark, the Dow Jones U.S. Select REIT Index. The Trustees took into account management’s discussion of the Fund’s performance, including the Fund’s recent strong performance compared to the Fund Benchmark and the Peer Group. The Trustees also noted that the Fund ranked in the top quintile relative to its Peer Group for the 1-year, 5-year and 10-year periods. The Trustees concluded that the Fund’s overall performance has been satisfactory.
ADVISORY FEES.
The Trustees noted that the Fund’s advisory fees (which include both the advisory and administration fee) and total expenses (net of applicable expense waivers/reimbursements) as of March 31, 2014 were both higher than the average for the Peer Group. The Trustees took into account the fact that the Investment Manager has contractually agreed, through March 31, 2015, to limit the Fund’s net annual operating expenses (subject to certain excluded expenses) to 1.24% and noted that the Fund was operating below its expense cap as of March 31, 2014. The Trustees also noted that the Investment Manager reduced the Fund’s expense limitation from 1.29% to 1.24% in 2012. The Trustees also took into
account management’s discussion of the Fund’s expenses and competitiveness with comparably sized funds. The Trustees concluded that, in light of the nature, extent and quality of the services provided by the Investment Manager and the Subadvisor, the foregoing expense limitation and the considerations noted above with respect to the Subadvisor and the Investment Manager, the Fund’s advisory and subadvisory fees are reasonable.
* * * *
After consideration of the foregoing, the Trustees also reached the following conclusions (in addition to the conclusions discussed above) regarding the Investment Management Agreement and each Subadvisory Agreement: (a) the Investment Manager and each Subadvisor have demonstrated that they possess the capability and resources to perform the duties required of them under the Investment Management Agreement and the applicable Subadvisory Agreements; (b) each Subadvisor’s Investment Strategy is appropriate for pursuing the applicable Fund’s investment objectives; and (c) the Investment Manager and each Subadvisor maintain appropriate compliance programs.
Based on all of the above-mentioned factors and their related conclusions, with no single factor or conclusion being determinative and with each Trustee not necessarily attributing the same weight to each factor, the Trustees concluded that approval of the Investment Management Agreement and each Subadvisory Agreement would be in the best interests of the applicable Fund and its shareholders. Accordingly, on June 19-20, 2014, the Trustees, and separately a majority of the Independent Trustees, voted to approve the Investment Management Agreement and the Subadvisory Agreements (as applicable) for each Fund.
59
THIS PAGE INTENTIONALLY LEFT BLANK
INVESTMENT MANAGER AND
ADMINISTRATOR
AMG Funds LLC
800 Connecticut Avenue
Norwalk, CT 06854
(800) 835-3879
DISTRIBUTOR
AMG Distributors, Inc.
800 Connecticut Avenue
Norwalk, CT 06854
(800) 835-3879
CUSTODIAN
The Bank of New York Mellon
2 Hanson Place
Brooklyn, NY 11217
LEGAL COUNSEL
Ropes & Gray LLP
Prudential Tower, 800 Boylston Street
Boston, MA 02199-3600
TRANSFER AGENT
BNY Mellon Investment Servicing (US) Inc.
Attn: AMG Funds
P.O. Box 9769
Providence, RI 02940
(800) 548-4539
FOR MANAGERSCHOICETM ONLY
AMG Funds
c/o BNY Mellon Investment Servicing (US) Inc.
P.O. Box 9847
Providence, RI 02940-8047
(800) 358-7668
This report is prepared for the Funds’ shareholders. It is authorized for distribution to prospective investors only when preceded or accompanied by an effective prospectus. To receive a free copy of the prospectus or Statement of Additional Information, which includes additional information about Fund Trustees, please contact us by calling 800.835.3879. Distributed by AMG Distributors, Inc., member FINRA.
Current net asset values per share for each Fund are available on the Funds’ website at www.amgfunds.com.
A description of the policies and procedures each Fund uses to vote its proxies is available: (i) without charge, upon request, by calling 800.835.3879, or (ii) on the Securities and Exchange Commission’s (SEC) website at www.sec.gov. For information regarding each Fund’s proxy voting record for the 12-month period ended June 30, call 800.835.3879 or visit the SEC website at www.sec.gov.
Each Fund files its complete schedule of portfolio holdings with the SEC for the first and third quarters of each fiscal year on Form N-Q. The Fund’s Forms N-Q are available on the SEC’s website at www.sec.gov. A Funds’ Forms N-Q may be reviewed and copied at the SEC’s Public Reference Room in Washington, DC. Information on the operation of the Public Reference Room may be obtained by calling 1-800-SEC-0330. To review a complete list of the Fund’s portfolio holdings, or to view the most recent quarterly holdings report, semiannual report, or annual report, please visit www.amgfunds.com.
AFFILIATE SUBADVISED FUNDS
ALTERNATIVE FUNDS
AMG FQ Global Alternatives
First Quadrant, L.P.
BALANCED FUNDS
AMG Chicago Equity Partners Balanced
Chicago Equity Partners, LLC
AMG FQ Global Risk-Balanced
(formerly Managers AMG FQ Global Essentials)
First Quadrant, L.P.
EQUITY FUNDS
AMG FQ Tax-Managed U.S. Equity
AMG FQ U.S. Equity
First Quadrant, L.P.
AMG Frontier Small Cap Growth
Frontier Capital Management Company, LLC
AMG GW&K Small Cap Core
(formerly GW&K Small Cap Equity)
Gannett Welsh & Kotler, LLC
AMG Renaissance International Equity
AMG Renaissance Large Cap Growth
The Renaissance Group LLC
AMG SouthernSun Small Cap
AMG SouthernSun U.S. Equity
SouthernSun Asset Management, LLC
AMG Systematic Large Cap Value
(formerly Systematic Value)
AMG Systematic Mid Cap Value
Systematic Financial Management, L.P.
AMG TimesSquare All Cap Growth
(formerly Managers AMG TSCM Growth Equity)
AMG TimesSquare International Small Cap
AMG TimesSquare Mid Cap Growth
AMG TimesSquare Small Cap Growth
TimesSquare Capital Management, LLC
AMG Trilogy Emerging Markets Equity
AMG Trilogy Global Equity
AMG Trilogy International Small Cap
Trilogy Global Advisors, L.P.
AMG Yacktman Focused
AMG Yacktman
Yacktman Asset Management LP
FIXED INCOME FUNDS
AMG GW&K Enhanced Core Bond
(formerly Managers AMG GW&K Fixed Income)
AMG GW&K Municipal Bond
AMG GW&K Municipal Enhanced Yield
Gannett Welsh & Kotler, LLC
OPEN-ARCHITECTURE FUNDS
EQUITY FUNDS
AMG Managers Brandywine Advisors Mid Cap Growth
AMG Managers Brandywine Blue
AMG Managers Brandywine
Friess Associates, LLC
AMG Managers Cadence Capital Appreciation
AMG Managers Cadence Emerging Companies
AMG Managers Cadence Mid Cap
Cadence Capital Management, LLC
AMG Managers Emerging Opportunities
(formerly Managers Micro-Cap)
Lord, Abbett & Co. LLC
WEDGE Capital Management L.L.P.
Next Century Growth Investors LLC
RBC Global Asset Management (U.S.) Inc.
AMG Managers Essex Small/Micro Cap Growth
Essex Investment Management Co., LLC
AMG Managers Real Estate Securities
CenterSquare Investment Management, Inc.
AMG Managers Skyline Special Equities
(formerly Skyline Special Equities Portfolio)
Skyline Asset Management, L.P.
AMG Managers Special Equity
Ranger Investment Management, L.P. Lord, Abbett & Co. LLC
Smith Asset Management Group, L.P. Federated MDTA LLC
FIXED INCOME FUNDS
AMG Managers Bond
AMG Managers Global Income Opportunity
Loomis, Sayles & Co., L.P.
AMG Managers High Yield
J.P. Morgan Investment Management Inc.
AMG Managers Intermediate Duration Government
AMG Managers Short Duration Government
Amundi Smith Breeden LLC
AMG Managers Total Return Bond
(formerly Managers PIMCO Bond)
Pacific Investment Management Co. LLC
| | |
 | | www.amgfunds.com |
Registrant has adopted a Code of Ethics. See attached Exhibit (a)(1).
| Item 3. | AUDIT COMMITTEE FINANCIAL EXPERT |
Registrant’s Board of Trustees has determined that independent Trustees Mr. Edward J. Kaier and Mr. Steven J. Paggioli each qualify as the Audit Committee Financial Expert. Mr. Kaier and Mr. Paggioli are “independent” as such term is defined in Form N-CSR.
| Item 4. | PRINCIPAL ACCOUNTANT FEES AND SERVICES |
The aggregate fees billed by PwC to the Fund for the Funds’ two most recent fiscal years for professional services rendered for audits of annual financial statements, or services that are normally provided in connection with statutory and regulatory filings or engagements (“Audit Fees”) were as follows:
| | | | | | | | |
| | | Fiscal
2014 | | | Fiscal
2013 | |
AMG FQ Tax-Managed U.S. Equity Fund | | $ | 22,031 | | | $ | 14,074 | |
AMG FQ U.S. Equity Fund | | $ | 21,503 | | | $ | 15,711 | |
AMG FQ Global Alternatives Fund | | $ | 18,329 | | | $ | 17,231 | |
AMG FQ Global Risk-Balanced Fund | | $ | 25,516 | | | $ | 16,548 | |
AMG Frontier Small Cap Growth Fund | | $ | 22,095 | | | $ | 15,572 | |
AMG Managers Emerging Opportunities Fund | | $ | 22,662 | | | $ | 17,213 | |
AMG Managers Real Estate Securities Fund | | $ | 33,045 | | | $ | 13,082 | |
AMG Managers Total Return Bond Fund | | $ | 103,620 | | | $ | 85,588 | |
AMG TimesSquare All Cap Growth Fund | | $ | 25,058 | | | $ | 15,071 | |
There were no fees billed by PwC to the Fund in its two recent fiscal years for services rendered for assurance and related services that are reasonably related to the performance of the audit or review of the Fund’s financial statements, but are not reported as Audit Fees (“Audit-Related Fees”).
For the Funds’ two most recent fiscal years, there were no Audit-Related Fees billed by PwC for engagements related directly to the operations and financial reporting of one or more Funds by a Fund Service Provider. A Fund Service Provider is (a) any investment adviser to the Fund (not including any Subadvisor whose role is primarily portfolio management and is subcontracted with or overseen by another investment adviser) or (b) any entity that provides ongoing services to the Fund and is controlling, controlled by or under common control with a Fund investment adviser described in (a).
The aggregate fees billed by PwC to the Funds for the two most recent fiscal years for professional services rendered for tax compliance, tax advice, and tax planning (“Tax Fees”) were as follows:
| | | | | | | | |
| | | Fiscal
2014 | | | Fiscal
2013 | |
AMG FQ Tax-Managed U.S. Equity Fund | | $ | 6,985 | | | $ | 7,000 | |
AMG FQ U.S. Equity Fund | | $ | 8,045 | | | $ | 8,000 | |
AMG FQ Global Alternatives Fund | | $ | 10,720 | | | $ | 10,000 | |
AMG FQ Global Risk-Balanced Fund | | $ | 10,720 | | | $ | 10,000 | |
AMG Frontier Small Cap Growth Fund | | $ | 6,885 | | | $ | 7,000 | |
AMG Managers Emerging Opportunities Fund | | $ | 8,045 | | | $ | 8,000 | |
AMG Managers Real Estate Securities Fund | | $ | 8,960 | | | $ | 9,000 | |
AMG Managers Total Return Bond Fund | | $ | 10,970 | | | $ | 10,000 | |
AMG TimesSquare All Cap Growth Fund | | $ | 6,985 | | | $ | 7,000 | |
For the Funds’ two most recent fiscal years, Tax Fees billed by PwC for engagements by Fund Service Providers that related directly to the operations and financial reporting of the Funds were $0 for fiscal 2014 and $0 for fiscal 2013, respectively.
The services for which Tax Fees were charged comprise all services performed by professional staff in PwC’s tax division except those services related to the audit. Typically, this category would include fees for tax compliance, tax planning, and tax advice. Tax compliance, tax advice, and tax planning services include preparation of original and amended tax returns, claims for refund and tax payment-planning services, assistance with tax audits and appeals, tax advice related to mergers and acquisitions and requests for rulings or technical advice from taxing authorities.
There were no other fees billed by PwC to the Funds for all other non-audit services (“Other Fees”) during the Funds’ two most recent fiscal years. During the same period, there were no Other Fees billed by PwC for engagements by Fund Service Providers that related directly to the operations and financial reporting of the Funds.
According to policies adopted by the Audit Committee, services provided by PwC to the Funds must be pre-approved by the Audit Committee. On an annual basis, the Audit Committee reviews and pre-approves various types of services that PwC may perform for the Funds without specific approval of each engagement, subject to specified budget limitations. As contemplated by the Sarbanes-Oxley Act of 2002 and related SEC rules, the Audit Committee also pre-approves non-audit services provided by PwC to any Fund Service Provider for any engagement that relates directly to the operations and financial reporting of the Funds. Any engagement that is not already pre-approved or that will exceed a pre-approved budget must be submitted to the Audit Committee for pre-approval. The Chairman of the Audit Committee is authorized on behalf of the Board of Trustees and the Audit Committee to approve the engagement of PwC to perform non-audit services subject to certain conditions, including notification to the Audit Committee of such pre-approval not later than the next meeting of the Audit Committee following the date of such pre-approval.
(e)(2) None.
(g) The aggregate fees billed by PwC in 2014 and 2013 for non-audit services rendered to the Funds and Fund Service Providers were $126,315 and $140,350, respectively. For the fiscal year ended October 31, 2014, this amount reflects the amounts disclosed above in Item 4(b),(c),(d), plus $48,000 in fees billed to the Fund Service Providers for non-audit services that did not relate directly to the operations and financial reporting of the Funds. For the fiscal year ended October 31, 2013, this amount reflects the amounts disclosed above in Item 4(b),(c),(d), plus $64,350 in fees billed to the Fund Service Providers for non-audit services that did not relate directly to the operations and financial reporting of the Funds.
(h) The Trust’s Audit Committee has considered whether the provision of non-audit services by registrant’s independent registered public accounting firm to the registrant’s investment advisor, and any entity controlling, controlled, or under common control with the investment advisor that provided ongoing services to the registrant that were not pre-approved by the Committee (because such services did not relate directly to the operations and financial reporting of the registrant) was compatible with maintaining the independence of the independent registered public accounting firm.
| Item 5. | AUDIT COMMITTEE OF LISTED REGISTRANTS |
Not applicable.
| Item 6. | SCHEDULE OF INVESTMENTS |
The schedule of investments in unaffiliated issuers as of the close of the reporting period is included as part of the shareholder report contained in Item 1 hereof.
| Item 7. | DISCLOSURE OF PROXY VOTING POLICIES AND PROCEDURES FOR CLOSED-END MANAGEMENT INVESTMENT COMPANIES |
Not applicable.
| Item 8. | PORTFOLIO MANAGERS OF CLOSED-END MANAGEMENT INVESTMENT COMPANIES |
Not applicable.
| Item 9. | PURCHASES OF EQUITY SECURITIES BY CLOSED-END MANAGEMENT INVESTMENT COMPANIES AND AFFILIATED PURCHASERS |
Not applicable.
| Item 10. | SUBMISSION OF MATTERS TO A VOTE OF SECURITY HOLDERS |
Not applicable.
| Item 11. | CONTROLS AND PROCEDURES |
(a) The Registrant’s principal executive and principal financial officers have concluded, based on their evaluation of the registrant’s disclosure controls and procedures as of a date within 90 days of the filing of this report, that the Registrant’s disclosure controls and procedures are reasonably designed to ensure that information required to be disclosed by the Registrant on Form N-CSR is recorded, processed, summarized and reported within the required time periods and that information required to be disclosed by the registrant in the reports that it files or submits on Form N-CSR is accumulated and communicated to the Registrant’s management, including its principal executive and principal financial officers, as appropriate to allow timely decisions regarding required disclosure.
(b) There were no changes in the Registrant’s internal control over financial reporting during the Registrant’s fourth fiscal quarter of the period covered by this report that have materially affected, or are reasonably likely to affect, the internal control over financial reporting.
Item 12. EXHIBITS
| | |
| (a)(1) | | Any Code of Ethics or amendments hereto. Filed herewith. |
| |
| (a)(2) | | Certifications pursuant to Rule 30a-2(a) under the Investment Company Act of 1940—Filed herewith. |
| |
| (a)(3) | | Not applicable. |
| |
| (b) | | Certifications pursuant to Rule 30a-2(b) under the Investment Company Act of 1940—Filed herewith. |
SIGNATURES
Pursuant to the requirements of the Securities Exchange Act of 1934 and the Investment Company Act of 1940, the registrant has duly caused this report to be signed on its behalf by the undersigned, thereunto duly authorized.
| | |
| AMG Funds I |
| |
| By: | | /s/ Jeffrey T. Cerutti |
| | Jeffrey T. Cerutti, Chief Operating Officer |
Date: January 7, 2015
Pursuant to the requirements of the Securities Exchange Act of 1934 and the Investment Company Act of 1940, this report has been signed below by the following persons on behalf of the registrant and in the capacities and on the dates indicated.
| | |
| By: | | /s/ Jeffrey T. Cerutti |
| | Jeffrey T. Cerutti, Chief Operating Officer |
Date: January 7, 2015
| | |
| By: | | /s/ Donald S. Rumery |
| | Donald S. Rumery, Chief Financial Officer |
Date: January 7, 2015