UNITED STATES
SECURITIES AND EXCHANGE COMMISSION
Washington, D.C. 20549
FORM N-CSR
CERTIFIED SHAREHOLDER REPORT OF REGISTERED
MANAGEMENT INVESTMENT COMPANIES
Investment Company Act file number: 811-06520
AMG Funds I
(Exact name of registrant as specified in charter)
600 Steamboat Road, Suite 300, Greenwich, Connecticut 06830
(Address of principal executive offices) (Zip code)
AMG Funds LLC
600 Steamboat Road, Suite 300, Greenwich, Connecticut 06830
(Name and address of agent for service)
Registrant’s telephone number, including area code: (203) 299-3500
Date of fiscal year end: DECEMBER 31
Date of reporting period: NOVEMBER 1, 2017 – DECEMBER 31, 2017
(Annual Shareholder Report)
Item 1. Reports to Shareholders
| | | | | | |

| | ANNUAL REPORT | | | | |
| | |
| | AMG Funds December 31, 2017 AMG Managers CenterSquare Real Estate Fund |
| | | | | | | | | | |
| | | | | |
| | Class N: MRESX | | Class I: MRASX | | Class Z: MREZX | | | | |
| | | | | | | | | | |
| | | | | | | | | | |
| | | | | | | | | | |
| | | | | | |
| | | | | | |
| | | |
amgfunds.com | | | | | | 123117 AR017 |
| | |
| | | AMG Funds Annual Report — December 31, 2017 |
| | |
| | | | | | |
| | TABLE OF CONTENTS | | PAGE | |
| | | |
| | | LETTER TO SHAREHOLDERS | | | 2 | |
| | | |
| | | ABOUT YOUR FUND’S EXPENSES | | | 3 | |
| | | |
| | | PORTFOLIO MANAGER’S COMMENTS, FUND SNAPSHOTS AND SCHEDULE OF PORTFOLIO INVESTMENTS | | | 4 | |
| | | |
| | | FINANCIAL STATEMENTS | | | | |
| | | |
| | | Statement of Assets and Liabilities | | | 9 | |
| | | |
| | | Balance sheet, net asset value (NAV) per share computations and cumulative undistributed amounts | | | | |
| | | |
| | | Statement of Operations | | | 11 | |
| | | |
| | | Detail of sources of income, expenses, and realized and unrealized gains (losses) during the fiscal year | | | | |
| | | |
| | | Statements of Changes in Net Assets | | | 12 | |
| | | |
| | | Detail of changes in assets for the past two fiscal years | | | | |
| | | |
| | | Financial Highlights | | | 13 | |
| | | |
| | | Historical net asset values per share, distributions, total returns, income and expense ratios, turnover ratios and net assets | | | | |
| | | |
| | | Notes to Financial Statements | | | 16 | |
| | | |
| | | Accounting and distribution policies, details of agreements and transactions with Fund management and affiliates, and descriptions of certain investment risks | | | | |
| | | |
| | | REPORT OF INDEPENDENT REGISTERED PUBLIC ACCOUNTING FIRM | | | 20 | |
| | | |
| | | OTHER INFORMATION | | | 21 | |
| | | |
| | | TRUSTEES AND OFFICERS | | | 22 | |
| | | |
| | | ANNUAL RENEWAL OF INVESTMENT MANAGEMENT AND SUBADVISORY AGREEMENTS | | | 25 | |
Nothing contained herein is to be considered an offer, sale or solicitation of an offer to buy shares of any series of the AMG Funds family of mutual funds. Such offering is made only by prospectus, which includes details as to offering price and other material information.
| | |
| | |
| | Letter to Shareholders |
| | |
Dear Shareholder:
The two-month period ending December 31, 2017, was a strong period for equity markets as the health of the global economy continued to improve and positive investor sentiment helped extend the U.S. bull market. The S&P 500® Index, a widely followed barometer of the U.S. equity market, returned 4.21% during the two-month period. By comparison, small cap stocks underperformed large caps with a 2.47% return for the small cap Russell 2000® Index.
The S&P 500 Index has notched positive performance in every month since the U.S. presidential election amidst the backdrop of strong corporate earnings, improving global economic growth, and the passage of sweeping tax reform. 2017 also marked a turning point for the broader global economy as growth accelerated in a more coordinated fashion around the world, global trade improved and commodities recovered. U.S. equity market volatility remained extremely low despite saber rattling in North Korea and a devastating hurricane season. In fact, the S&P 500 Index has not seen a pullback greater than 5% since the summer of 2016.
In total, ten of eleven S&P 500 Index sectors were positive during the final two months of 2017; however, there was meaningful dispersion in performance across sectors. Telecommunication services and consumer staples stocks led the Index with returns of 12.16% and 8.01%, respectively, while companies within the information technology and utilities sectors were the laggards with returns of 1.15% and -3.56%, respectively. Value stocks outperformed growth stocks in the two-month period ending December 31, 2017 with returns of 4.57% and 13.7% for the Russell 1000® Growth and Russell 1000® Value Indices, respectively. Outperformance of value stocks late in 2017 could not disrupt the trend of outperformance by growth, which has outperformed value on a quarterly basis in every quarter of 2017. International equities finished the year strongly and outperformed domestic equities in 2017, marking the first year of outperformance since 2012 as the global economy picked up and international returns were boosted by a weaker U.S. Dollar. Emerging markets had their strongest year since 2009 with a 37.3% return in 2017 for the MSCI Emerging Markets Index.
The U.S. bond market produced slightly positive returns for the two month period ending December 31, 2017, as measured by the 0.33% return for the Bloomberg Barclays U.S. Aggregate Bond Index, a broad measure of U.S. bond market performance. The yield curve flattened as the U.S. Federal Reserve (the Fed) continued to normalize monetary policy and short-term interest rates rose more than longer-term rates. Investment grade corporates outperformed Treasuries and securitized credits with returns of 0.77%, 0.17% and 0.16%, respectively.
AMG Funds appreciates the privilege of providing investment tools to you and your clients. Our foremost goal is to provide investment solutions that help our shareholders successfully reach their long-term investment goals. By partnering with AMG’s affiliated investment boutiques, AMG Funds provides access to a distinctive array of actively managed return-oriented investment strategies. Additionally, we oversee and distribute a number of complementary open-architecture mutual funds subadvised by unaffiliated investment managers. We thank you for your continued confidence and investment in AMG Funds. You can
rest assured that under all market conditions our team is focused on delivering excellent investment management services for your benefit.
Respectfully,

Jeffery Cerutti
President
AMG Funds
| | | | | | | | | | | | | | | | |
Average Annual Total Returns | | Periods ended
December 31, 2017* | |
Stocks: | | | | Nov - Dec 2017# | | 1 Year | | | 3 Years | | | 5 Years | |
Large Caps | | (S&P 500® Index) | | 4.21% | | | 21.83 | % | | | 11.41 | % | | | 15.79 | % |
| | | | | |
Small Caps | | (Russell 2000® Index) | | 2.47% | | | 14.65 | % | | | 9.96 | % | | | 14.12 | % |
| | | | | |
International | | (MSCI All Country World ex-USA Index) | | 3.07% | | | 27.19 | % | | | 7.83 | % | | | 6.80 | % |
| | | | | |
Bonds: | | | | | | | | | | | | | | | | |
| | | | | |
Investment Grade | | (Bloomberg Barclays U.S. Aggregate Bond Index) | | 0.33% | | | 3.54 | % | | | 2.24 | % | | | 2.10 | % |
| | | | | |
High Yield | | (Bloomberg Barclays U.S. Corporate High Yield Index) | | 0.05% | | | 7.50 | % | | | 6.35 | % | | | 5.78 | % |
| | | | | |
Tax-exempt | | (Bloomberg Barclays Municipal Bond Index) | | 0.50% | | | 5.45 | % | | | 2.98 | % | | | 3.02 | % |
| | | | | |
Treasury Bills | | (ICE BofAML 6-Month U.S. Treasury Bill Index) | | 0.18% | | | 0.95 | % | | | 0.62 | % | | | 0.43 | % |
| * | Source: Factset. Past performance is no guarantee of future results. |
| # | The Fund changed its fiscal year end from October 31, to December 31. |
2
About Your Fund’s Expenses
As a shareholder of a Fund, you may incur two types of costs: (1) transaction costs, which may include sales charges (loads) on purchase payments; redemption fees; and exchange fees; and (2) ongoing costs, including management fees; distribution (12b-1) fees; and other Fund expenses. This example is intended to help you understand your ongoing costs (in dollars) of investing in the Fund and to compare these costs with the ongoing costs of investing in other mutual funds. The example is based on $1,000 invested at the beginning of the period and held for the entire period as indicated below.
ACTUAL EXPENSES
The first line of the following table provides information about the actual account values and
actual expenses. You may use the information in this line, together with the amount you invested, to estimate the expenses that you paid over the period. Simply divide your account value by $1,000 (for example, an $8,600 account value divided by $1,000 = 8.6), then multiply the result by the number in the first line under the heading entitled “Expenses Paid During Period” to estimate the expenses you paid on your account during this period.
HYPOTHETICAL EXAMPLE FOR COMPARISON PURPOSES
The second line of the following table provides information about hypothetical account values and hypothetical expenses based on the Fund’s actual expense ratio and an assumed annual rate of return of 5% before expenses, which is not the Fund’s
actual return. The hypothetical account values and expenses may not be used to estimate the actual ending account balance or expenses you paid for the period. You may use this information to compare the ongoing costs of investing in the Fund and other funds by comparing this 5% hypothetical example with the 5% hypothetical examples that appear in the shareholder reports of other funds.
Please note that the expenses shown in the table are meant to highlight your ongoing costs only and do not reflect any transactional costs, such as sales charges (loads), redemption fees, or exchange fees. Therefore, the second line of the table is useful in comparing ongoing costs only, and will not help you determine the relative total costs of owning different funds.
| | | | | | | | | | | | | | | | |
Two Months Ended December 31, 2017 | | Expense
Ratio for
the Period | | | Beginning
Account
Value
11/01/17 | | | Ending
Account
Value
12/31/17 | | | Expenses
Paid
During
the Period* | |
AMG Managers CenterSquare Real Estate Fund | |
Based on Actual Fund Return | |
Class N | | | 1.04 | % | | $ | 1,000 | | | $ | 1,040 | | | $ | 1.77 | |
Class I | | | .90 | % | | $ | 1,000 | | | $ | 1,040 | | | $ | 1.53 | |
Class Z | | | .79 | % | | $ | 1,000 | | | $ | 1,040 | | | $ | 1.35 | |
Based on Hypothetical 5% Annual Return | |
Class N | | | 1.04 | % | | $ | 1,000 | | | $ | 1,007 | | | $ | 1.74 | |
Class I | | | .90 | % | | $ | 1,000 | | | $ | 1,007 | | | $ | 1.51 | |
Class Z | | | .79 | % | | $ | 1,000 | | | $ | 1,007 | | | $ | 1.32 | |
| * | Expenses are equal to the Fund’s annualized expense ratio multiplied by the average account value over the period, multiplied by the number of days in the most recent fiscal period (61), then divided by 365. |
3
AMG Managers CenterSquare Real Estate Fund
Portfolio Manager’s Comments (unaudited)
For the two months ending December 31, 2017, the AMG Managers CenterSquare Real Estate Fund (the “Fund”) (Class N shares) returned 3.95%, compared with 3.10% for its benchmark, the Dow Jones U.S. Select REIT Index. During the same period, the S&P 500® Index returned 4.21%.
The 10 Year U.S. Treasury yield rose slightly before declining a bit late in December to 2.43% or about 10bps higher than it was at the end of Q3. The long end of the yield curve continues to show little reaction to the Federal Reserve’s tightening policy as evidenced by the fact that the yield was range bound all year. In fact, the yield sits today almost exactly where it ended 2016 despite three hikes in the federal funds rate throughout the year.
There was wide dispersion in property type performance over the period, with regional mall and shopping center sectors performing strongly over the period. Other noteworthy sector performance included the outperformance of the hotel REIT sector, spurred by the passage of tax reform. Expectations of faster economic growth following the passage of tax reform should first influence the most economically sensitive real estate sectors. Healthcare REITs, which performed surprisingly well in the first half of the year only to underperform starting in the third quarter, was again one of the worst performing property sectors during the period. Data centers also underperformed over the two-month period after generating very strong performance in the first nine months of the year and remain the top performing sector for the calender year by a wide margin.
The Fund’s outperformance over the period was primarily driven by strong stock selection while sector positioning also had a modestly positive contribution to relative results. With stock selection positive across almost all sectors, only suburban office detracted for the period. Highlights included our overweight to regional mall name GGP, Inc. which benefited from recent M&A activity in the retail sector, HealthCare Trust of America, which focuses on medical offices, self-storage name CubeSmart, a company that offers attractive valuations within the sector, and our overweight to hotel security Hilton Worldwide Holdings. The weakest performers over the period included Corporate Office Properties Trust and Essex Property Trust. Positive sector selection was driven by our overweight to office infill, and our underweight to the healthcare sector.
From a positioning perspective, we reallocated our exposure within alternative housing by purchasing Invitation Homes Inc, adding to American Homes 4 Rent, and selling Starwood Waypoint Homes. We added exposure to the specialty sector by purchasing Iron Mountain Inc. as the company has increased its datacenter exposure and offers an attractive yield and good fundamentals. We reduced our positioning in office infill by selling some exposure to West Coast names Douglas Emmett and Kilroy Realty Corp, companies that have done very well for us for this calender year and are near full
valuations. We continued to increase our underweight to the healthcare sector, as we believe the longer duration and low growth nature of the sector remain negatives for the long term and skilled nursing facilities continue to face operational issues.
OUTLOOK
Expectations for economic growth in 2018 received a boost with the passage of tax reform. Optimism is likely to remain high as the administration shifts to pressing its agenda for a major infrastructure spending plan. Faster economic growth combined with the current strong state of the housing and labor markets should generate a little higher inflation—something policymakers around the world have been working to spur. At the same time, the Federal Reserve appears poised to continue pressing ahead with its plans to raise the short end of the yield curve. We believe long-term interest rates, which have been extraordinarily low for a very long time, will eventually rise, but will do so at a gradual and measured pace. Further we expect rising rates will be accompanied by faster economic growth and higher inflation, which are both long-term positives for commercial real estate.
The views expressed represent the opinions of CenterSquare Investment Management, Inc. as of December 31, 2017 and are not intended as a forecast or guarantee of future results, and are subject to change without notice.
4
AMG Managers CenterSquare Real Estate Fund
Portfolio Manager’s Comments (continued)
CUMULATIVE TOTAL RETURN PERFORMANCE
AMG Managers CenterSquare Real Estate Fund’s cumulative total return is based on the daily change in net asset value (NAV), and assumes that all dividends and distributions were reinvested. This graph compares a hypothetical $10,000 investment made in the Fund’s Class N shares on December 31, 2007 to a $10,000 investment made in the Dow Jones U.S. Select REIT Index and S&P 500® Index for the same time period. The graph and table do not reflect the deduction of taxes that a shareholder would pay on a Fund distribution or redemption of shares. The listed returns for the Fund are net of expenses and the returns for the index exclude expenses. Total returns would have been lower had certain expenses not been reduced.
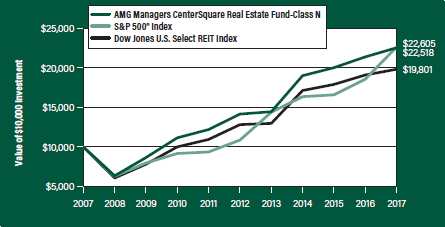
The table below shows the average annual total returns for the AMG Managers CenterSquare Real Estate Fund and the Dow Jones U.S. Select REIT Index and S&P 500® Index for the same time periods ended December 31, 2017.
| | | | | | | | | | | | | | | | | | | | | | | | |
| Average Annual Total Returns1 | | Two
Months2 | | | One
Year | | | Five
Years | | | Ten
Years | | | Since
Inception | | | Inception
Date | |
AMG Managers CenterSquare Real Estate Fund3, 4, 5, 6, 7 | | | | | | | | | | | | | | | | | | | | | | | | |
Class N | | | 3.95 | % | | | 5.40 | % | | | 9.74 | % | | | 8.46 | % | | | 9.02 | % | | | 12/31/97 | |
Class I | | | 3.97 | % | | | — | | | | — | | | | — | | | | 2.62 | % | | | 02/24/17 | |
Class Z | | | 4.00 | % | | | — | | | | — | | | | — | | | | 2.68 | % | | | 02/24/17 | |
Dow Jones U.S. Select REIT Index8 | | | 3.10 | % | | | 3.76 | % | | | 9.09 | % | | | 7.07 | % | | | 9.17 | % | | | 12/31/97 | † |
S&P 500® Index9 | | | 4.21 | % | | | 21.83 | % | | | 15.79 | % | | | 8.50 | % | | | 7.19 | % | | | 12/31/97 | † |
The performance data shown represents past performance. Past performance is not a guarantee of future results. Current performance may be lower or higher than the performance data quoted. The investment return and principal value of an investment will fluctuate so that an investor’s shares, when redeemed, may be worth more or less than their original cost.
Investors should carefully consider the Fund’s investment objectives, risks, charges and expenses before investing. For performance information through the most recent month end, current net asset values per share for the Fund and other information, please call 800.835.3879 or visit our website at amgfunds.com for a free prospectus. Read it carefully before investing or sending money.
Distributed by AMG Distributors, Inc., member FINRA/SIPC.
| † | Date reflects the inception date of the Fund, not the index. |
| 1 | Total return equals income yield plus share price change and assumes reinvestment of all dividends and capital gain distributions. Returns are net of fees and may reflect offsets of Fund expenses as described in the prospectus. No adjustment has been made for taxes payable by shareholders on their reinvested dividends and capital gain distributions. Returns for periods greater than one year are annualized. The listed returns on the Fund are net of expenses and based on the published NAV as of December 31, 2017. All returns are in U.S. dollars ($). |
| 2 | The Fund changed its fiscal year end from October 31, to December 31. |
| 3 | From time to time, the Fund’s advisor has waived its fees and/or absorbed Fund expenses, which has resulted in higher returns. |
| 4 | The Fund is subject to special risk considerations similar to those associated with the direct ownership of real estate. Real estate valuations may be subject to factors such as changing general and local economic, financial, competitive, and environmental conditions. |
| 5 | A greater percentage of the Fund’s holdings may be focused in a smaller number of securities which may place the Fund at greater risk than a more diversified fund. |
| 6 | Investing in initial public offerings (IPOs) is risky and the prices of stocks purchased in IPOs tend to fluctuate more widely than stocks of companies that have been publicly traded for a longer period of time. Stocks purchased in IPOs generally do not have a trading history, and information about the companies may be available for very limited periods. |
| 7 | Companies that are in similar businesses may be similarly affected by particular economic or market events; to the extent the Fund has substantial holdings within a particular sector, the risks associated with that sector increase. |
| 8 | The Dow Jones U.S. Select REIT Index measures U.S. publicly traded real estate investment trusts. Unlike the Fund, the Dow Jones U.S. Select REIT Index is unmanaged, is not available for investment, and does not incur expenses. |
| 9 | The S&P 500® Index is a capitalization-weighted index of 500 stocks. The S&P 500® Index is designed to measure performance of the broad domestic economy through changes in the aggregate market value of 500 stocks representing all major industries. Unlike the Fund, the S&P 500® Index is unmanaged, is not available for investment, and does not incur expenses. |
The S&P 500® Index is proprietary data of Standard & Poor’s, a division of McGraw-Hill Companies, Inc. All rights reserved.
The Dow Jones U.S. Select REIT Index is proprietary data of Standard & Poor’s Dow Jones Indices LLC, a division of McGraw-Hill Companies, Inc. All rights reserved.
Not FDIC insured, nor bank guaranteed. May lose value.
5
| | |
| AMG Managers CenterSquare Real Estate Fund | | |
Fund Snapshots (unaudited) December 31, 2017 | | |
PORTFOLIO BREAKDOWN
| | | | |
Sector | | % of
Net Assets | |
Apartments | | | 19.4 | |
Office Property | | | 16.1 | |
Regional Malls | | | 10.7 | |
Hotels | | | 10.0 | |
Warehouse/Industrials | | | 9.9 | |
Diversified | | | 9.2 | |
Shopping Centers | | | 8.3 | |
Health Care | | | 8.1 | |
Storage | | | 7.8 | |
Other Assets Less Liabilities | | | 0.5 | |
TOP TEN HOLDINGS
| | | | |
Security Name | | % of
Net Assets | |
Simon Property Group, Inc. | | | 7.5 | |
Prologis, Inc. | | | 6.1 | |
AvalonBay Communities, Inc. | | | 5.8 | |
Boston Properties, Inc. | | | 3.8 | |
CubeSmart | | | 3.2 | |
HCP, Inc. | | | 3.0 | |
Alexandria Real Estate Equities, Inc. | | | 2.8 | |
GGP, Inc. | | | 2.8 | |
Welltower, Inc. | | | 2.6 | |
American Homes 4 Rent, Class A | | | 2.6 | |
| | | | |
Top Ten as a Group | | | 40.2 | |
| | | | |
Because a fund’s strategy may result in multiple investments in particular sectors of the economy, its performance may depend on the performance of those sectors and may fluctuate more widely than investments diversified across more sectors. For additional information on these and other risk considerations, please see the Fund’s prospectus.
Any sectors, industries, or securities discussed should not be perceived as investment recommendations. Mention of a specific security should not be considered a recommendation to buy or solicitation to sell that security. Specific securities mentioned in this report may have been sold from the Fund’s portfolio of investments by the time you receive this report.
6
| | |
| AMG Managers CenterSquare Real Estate Fund | | |
Schedule of Portfolio Investments December 31, 2017 | | |
| | | | | | | | |
| | | Shares | | | Value | |
REITS - 99.5% | | | | | | | | |
Apartments - 19.4% | | | | | | | | |
American Homes 4 Rent, Class A | | | 346,730 | | | $ | 7,572,583 | |
Apartment Investment & Management Co., Class A | | | 135,880 | | | | 5,939,315 | |
AvalonBay Communities, Inc. | | | 96,070 | | | | 17,139,849 | |
Camden Property Trust | | | 63,180 | | | | 5,816,351 | |
Essex Property Trust, Inc. | | | 29,990 | | | | 7,238,686 | |
Invitation Homes, Inc. | | | 255,190 | | | | 6,014,828 | |
UDR, Inc. | | | 192,980 | | | | 7,433,590 | |
Total Apartments | | | | | | | 57,155,202 | |
Diversified - 9.2% | | | | | | | | |
Corporate Office Properties Trust | | | 119,170 | | | | 3,479,764 | |
Cousins Properties, Inc. | | | 285,530 | | | | 2,641,153 | |
Duke Realty Corp. | | | 235,050 | | | | 6,395,710 | |
Equinix, Inc. | | | 11,450 | | | | 5,189,369 | |
STAG Industrial, Inc. | | | 97,710 | | | | 2,670,414 | |
Vornado Realty Trust | | | 86,100 | | | | 6,731,298 | |
Total Diversified | | | | | | | 27,107,708 | |
Health Care - 8.1% | | | | | | | | |
HCP, Inc. | | | 342,950 | | | | 8,944,136 | |
Healthcare Trust of America, Inc., Class A | | | 240,340 | | | | 7,219,814 | |
Welltower, Inc. | | | 119,680 | | | | 7,631,993 | |
Total Health Care | | | | | | | 23,795,943 | |
Hotels - 10.0% | | | | | | | | |
Chesapeake Lodging Trust | | | 87,780 | | | | 2,377,960 | |
Hilton Worldwide Holdings, Inc. | | | 60,450 | | | | 4,827,537 | |
Host Hotels & Resorts, Inc. | | | 261,080 | | | | 5,182,438 | |
LaSalle Hotel Properties | | | 182,940 | | | | 5,135,126 | |
Park Hotels & Resorts, Inc. | | | 109,403 | | | | 3,145,336 | |
Sun Communities, Inc. | | | 66,280 | | | | 6,149,459 | |
Sunstone Hotel Investors, Inc. | | | 167,740 | | | | 2,772,742 | |
Total Hotels | | | | | | | 29,590,598 | |
Office Property - 16.1% | | | | | | | | |
Alexandria Real Estate Equities, Inc. | | | 63,520 | | | | 8,295,077 | |
Boston Properties, Inc. | | | 86,600 | | | | 11,260,598 | |
Columbia Property Trust, Inc. | | | 110,440 | | | | 2,534,598 | |
Douglas Emmett, Inc. | | | 79,300 | | | | 3,256,058 | |
| | | | | | | | |
| | | Shares | | | Value | |
Highwoods Properties, Inc. | | | 97,130 | | | $ | 4,944,888 | |
Hudson Pacific Properties, Inc. | | | 115,623 | | | | 3,960,088 | |
JBG SMITH Properties | | | 96,560 | | | | 3,353,529 | |
Kilroy Realty Corp. | | | 63,800 | | | | 4,762,670 | |
Mack-Cali Realty Corp. | | | 237,460 | | | | 5,119,637 | |
Total Office Property | | | | | | | 47,487,143 | |
Regional Malls - 10.7% | | | | | | | | |
GGP, Inc. | | | 353,040 | | | | 8,257,606 | |
The Macerich Co. | | | 19,130 | | | | 1,256,458 | |
Simon Property Group, Inc. | | | 127,790 | | | | 21,946,655 | |
Total Regional Malls | | | | | | | 31,460,719 | |
Shopping Centers - 8.3% | | | | | | | | |
DDR Corp. | | | 257,980 | | | | 2,311,501 | |
Kimco Realty Corp. | | | 245,530 | | | | 4,456,369 | |
Regency Centers Corp. | | | 102,190 | | | | 7,069,504 | |
Taubman Centers, Inc. | | | 39,760 | | | | 2,601,497 | |
Urban Edge Properties | | | 137,290 | | | | 3,499,522 | |
Weingarten Realty Investors | | | 135,670 | | | | 4,459,473 | |
Total Shopping Centers | | | | | | | 24,397,866 | |
Storage - 7.8% | | | | | | | | |
CubeSmart | | | 323,730 | | | | 9,362,271 | |
Extra Space Storage, Inc. | | | 53,140 | | | | 4,647,093 | |
Iron Mountain, Inc. | | | 58,030 | | | | 2,189,472 | |
Public Storage | | | 33,240 | | | | 6,947,160 | |
Total Storage | | | | | | | 23,145,996 | |
Warehouse/Industrials - 9.9% | | | | | | | | |
CyrusOne, Inc. | | | 84,820 | | | | 5,049,335 | |
DCT Industrial Trust, Inc. | | | 66,990 | | | | 3,937,672 | |
Prologis, Inc. | | | 279,540 | | | | 18,033,126 | |
QTS Realty Trust, Inc., Class A | | | 37,840 | | | | 2,049,414 | |
Total Warehouse/Industrials | | | | | | | 29,069,547 | |
Total REITS
(Cost $289,541,216) | | | | | | | 293,210,722 | |
Total Investments - 99.5%
(Cost $289,541,216) | | | | | | | 293,210,722 | |
Other Assets, less Liabilities - 0.5% | | | | | | | 1,343,546 | |
Net Assets - 100.0% | | | | | | $ | 294,554,268 | |
REITS Real Estate Investment Trusts
The accompanying notes are an integral part of these financial statements.
7
| | |
| AMG Managers CenterSquare Real Estate Fund | | |
| Schedule of Portfolio Investments (continued) | | |
The following table summarizes the inputs used to value the Fund’s investments by the fair value hierarchy levels as of December 31, 2017:
| | | | | | | | | | | | | | | | |
| | | Level 1 | | | Level 2 | | | Level 3 | | | Total | |
Investments in Securities | | | | | | | | | | | | | | | | |
REITS† | | $ | 293,210,722 | | | | — | | | | — | | | $ | 293,210,722 | |
| | | | | | | | | | | | | | | | |
Total Investments in Securities | | $ | 293,210,722 | | | | — | | | | — | | | $ | 293,210,722 | |
| | | | | | | | | | | | | | | | |
| † | All REITs held in the Fund are Level 1 securities. For a detailed breakout of REITs by major industry classification, please refer to the Fund’s Schedule of Portfolio Investments. |
As of December 31, 2017, the Fund had no transfers between levels from the beginning of the reporting period.
The accompanying notes are an integral part of these financial statements.
8
| | |
| Statement of Assets and Liabilities | | |
| December 31, 2017 | | |
| | | | |
| | | AMG Managers
CenterSquare
Real
Estate Fund | |
Assets: | | | | |
Investments at Value* | | $ | 293,210,722 | |
Receivable for investments sold | | | 4,680,760 | |
Dividend, interest and other receivables | | | 1,412,889 | |
Receivable for Fund shares sold | | | 932,723 | |
Receivable from affiliate | | | 35,242 | |
Prepaid expenses | | | 34,091 | |
Total assets | | | 300,306,427 | |
Liabilities: | | | | |
Payable for investments purchased | | | 2,689,029 | |
Payable for Fund shares repurchased | | | 2,552,241 | |
Due to custodian | | | 137,156 | |
Accrued expenses: | | | | |
Investment advisory and management fees | | | 152,546 | |
Administrative fees | | | 38,136 | |
Shareholder service fees | | | 54,857 | |
Professional fees | | | 43,370 | |
Trustee fees and expenses | | | 1,685 | |
Other | | | 83,139 | |
Total liabilities | | | 5,752,159 | |
Net Assets | | $ | 294,554,268 | |
* Investments at cost | | $ | 289,541,216 | |
The accompanying notes are an integral part of these financial statements.
9
| | |
| Statement of Assets and Liabilities (continued) | | |
| | | | |
| | | AMG Managers
CenterSquare
Real
Estate Fund | |
Net Assets Represent: | | | | |
Paid-in capital | | $ | 291,652,965 | |
Undistributed net investment income | | | 175,873 | |
Accumulated net realized loss from investments | | | (944,076 | ) |
Net unrealized appreciation on investments | | | 3,669,506 | |
Net Assets | | $ | 294,554,268 | |
| |
Class N: | | | | |
Net Assets | | $ | 235,689,931 | |
Shares outstanding | | | 22,591,295 | |
Net asset value, offering and redemption price per share | | $ | 10.43 | |
Class I: | | | | |
Net Assets | | $ | 58,715,508 | |
Shares outstanding | | | 5,628,380 | |
Net asset value, offering and redemption price per share | | $ | 10.43 | |
Class Z: | | | | |
Net Assets | | $ | 148,829 | |
Shares outstanding | | | 14,269 | |
Net asset value, offering and redemption price per share | | $ | 10.43 | |
The accompanying notes are an integral part of these financial statements.
10
Statements of Operations
For the fiscal period ended December 31, 2017 and the fiscal year ended October 31, 2017
| | | | | | | | |
| | | AMG Managers CenterSquare Real
Estate Fund | |
| | | For the fiscal
period ended
December 31, 2017* | | | For the fiscal
year ended
October 31, 2017# | |
Investment Income: | | | | | | | | |
Dividend income | | $ | 2,826,321 | 1 | | $ | 7,203,814 | |
Total investment income | | | 2,826,321 | | | | 7,203,814 | |
Expenses: | | | | | | | | |
Investment advisory and management fees | | | 304,428 | | | | 2,153,819 | |
Administrative fees | | | 76,107 | | | | 538,455 | |
Shareholder servicing fees - Class N | | | 101,811 | | | | 862,748 | |
Shareholder servicing fees - Class I | | | 10,878 | | | | 15,027 | |
Professional fees | | | 46,373 | | | | 65,087 | |
Registration fees | | | 17,266 | | | | 62,927 | |
Transfer agent fees | | | 4,568 | | | | 35,711 | |
Custodian fees | | | 5,879 | | | | 37,552 | |
Reports to shareholders | | | 23,813 | | | | 73,140 | |
Trustee fees and expenses | | | 3,460 | | | | 26,755 | |
Miscellaneous | | | 1,188 | | | | 23,401 | |
Total expenses before offsets | | | 595,771 | | | | 3,894,622 | |
Expense reductions | | | (6,309 | ) | | | (23,576 | ) |
Fee waivers | | | (71,625 | ) | | | — | |
Net expenses | | | 517,837 | | | | 3,871,046 | |
Net investment income | | | 2,308,484 | | | | 3,332,768 | |
Net Realized and Unrealized Gain: | | | | | | | | |
Net realized gain on investments | | | 2,022,925 | | | | 26,241,651 | |
Net change in unrealized appreciation/depreciation on investments | | | 7,502,164 | | | | (11,494,670 | ) |
Net realized and unrealized gain | | | 9,525,089 | | | | 14,746,981 | |
Net increase in net assets resulting from operations | | $ | 11,833,573 | | | $ | 18,079,749 | |
| * | The Fund changed its fiscal year end from October 31 to December 31. See Note 1 in the Notes to Financial Statements. |
| # | Effective February 27, 2017, the Fund’s share classes were renamed as described in Note 1 of the Notes to the Financial Statements. |
| 1 | Includes non-recurring dividends of $314,050. |
The accompanying notes are an integral part of these financial statements.
11
Statements of Changes in Net Assets
For the fiscal period ended December 31, 2017 and the fiscal years ended October 31, 2017 and 2016
| | | | | | | | | | | | |
| | | AMG Managers CenterSquare
Real Estate Fund | |
| | | December 31,
2017* | | | October 31,
2017# | | | October 31,
2016# | |
Increase in Net Assets Resulting From Operations: | | | | | | | | | | | | |
Net investment income | | $ | 2,308,484 | | | $ | 3,332,768 | | | $ | 7,277,663 | |
Net realized gain on investments | | | 2,022,925 | | | | 26,241,651 | | | | 33,240,249 | |
Net change in unrealized appreciation/depreciation on investments | | | 7,502,164 | | | | (11,494,670 | ) | | | (24,037,460 | ) |
Net increase in net assets resulting from operations | | | 11,833,573 | | | | 18,079,749 | | | | 16,480,452 | |
Distributions to Shareholders: | | | | | | | | | | | | |
| | | |
From net investment income: | | | | | | | | | | | | |
Class N | | | (1,249,401 | ) | | | (6,688,109 | ) | | | (4,897,741 | ) |
Class I | | | (323,944 | ) | | | (144,564 | ) | | | — | |
Class Z | | | (837 | ) | | | (744 | ) | | | — | |
From net realized gain on investments: | | | | | | | | | | | | |
Class N | | | (20,198,303 | ) | | | (33,199,655 | ) | | | (30,833,694 | ) |
Class I | | | (5,050,272 | ) | | | — | | | | — | |
Class Z | | | (12,491 | ) | | | — | | | | — | |
Total distributions to shareholders | | | (26,835,248 | ) | | | (40,033,072 | ) | | | (35,731,435 | ) |
Capital Share Transactions:1 | | | | | | | | | | | | |
Net increase (decrease) from capital share transactions | | | 7,826,349 | | | | (98,423,119 | ) | | | 91,179,116 | |
Total increase (decrease) in net assets | | | (7,175,326 | ) | | | (120,376,442 | ) | | | 71,928,133 | |
Net Assets: | | | | | | | | | | | | |
Beginning of period | | | 301,729,594 | | | | 422,106,036 | | | | 350,177,903 | |
End of period | | $ | 294,554,268 | | | $ | 301,729,594 | | | $ | 422,106,036 | |
End of period undistributed net investment income | | $ | 175,873 | | | | — | | | $ | 2,637,734 | |
| | | | | | | | | | | | |
| * | The Fund changed its fiscal year end from October 31 to December 31. See Note 1 in the Notes to Financial Statements. |
| # | Effective October 1, 2016, and February 27, 2017 the Fund’s share classes were renamed as described in Note 1 of the Notes to the Financial Statements. |
| 1 | See Note 1(g) of the Notes to Financial Statements. |
The accompanying notes are an integral part of these financial statements.
12
AMG Managers CenterSquare Real Estate Fund
Financial Highlights
For a share outstanding throughout each fiscal period
| | | | | | | | | | | | | | | | | | | | | | | | |
| | | For the fiscal period
ended December 31, | | | For the fiscal years
ended October 31, | |
| Class N | | 2017* | | | 2017# | | | 2016## | | | 2015 | | | 2014 | | | 2013 | |
Net Asset Value, Beginning of Period | | $ | 11.02 | | | $ | 11.68 | | | $ | 12.34 | | | $ | 12.03 | | | $ | 10.79 | | | $ | 10.07 | |
Income from Investment Operations: | | | | | | | | | | | | | | | | | | | | | | | | |
Net investment income1,2 | | | 0.09 | 3 | | | 0.10 | | | | 0.22 | 4 | | | 0.16 | 5 | | | 0.14 | | | | 0.11 | |
Net realized and unrealized gain on investments | | | 0.34 | | | | 0.42 | | | | 0.40 | | | | 0.75 | | | | 1.84 | | | | 0.96 | |
Total income from investment operations | | | 0.43 | | | | 0.52 | | | | 0.62 | | | | 0.91 | | | | 1.98 | | | | 1.07 | |
Less Distributions to Shareholders from: | | | | | | | | | | | | | | | | | | | | | | | | |
Net investment income | | | (0.06 | ) | | | (0.21 | ) | | | (0.15 | ) | | | (0.21 | ) | | | (0.13 | ) | | | (0.10 | ) |
Net realized gain on investments | | | (0.96 | ) | | | (0.97 | ) | | | (1.13 | ) | | | (0.39 | ) | | | (0.61 | ) | | | (0.25 | ) |
Total distributions to shareholders | | | (1.02 | ) | | | (1.18 | ) | | | (1.28 | ) | | | (0.60 | ) | | | (0.74 | ) | | | (0.35 | ) |
Net Asset Value, End of Period | | $ | 10.43 | | | $ | 11.02 | | | $ | 11.68 | | | $ | 12.34 | | | $ | 12.03 | | | $ | 10.79 | |
Total Return2 | | | 3.95 | %6,7 | | | 4.75 | %7 | | | 5.33 | %7 | | | 7.68 | %7 | | | 19.88 | %7 | | | 10.89 | % |
Ratio of net expenses to average net assets8 | | | 1.04 | %9 | | | 1.08 | % | | | 1.15 | % | | | 1.16 | % | | | 1.19 | % | | | 1.26 | %10 |
Ratio of gross expenses to average net assets11 | | | 1.06 | %12 | | | 1.09 | % | | | 1.16 | % | | | 1.17 | % | | | 1.20 | % | | | 1.27 | %10 |
Ratio of net investment income to average net assets2 | | | 3.61 | %9 | | | 0.91 | % | | | 1.88 | % | | | 1.32 | % | | | 1.27 | % | | | 1.08 | %10 |
Portfolio turnover | | | 13 | %6 | | | 71 | % | | | 65 | % | | | 61 | % | | | 49 | % | | | 86 | % |
Net assets end of period (000’s) omitted | | $ | 235,690 | | | $ | 243,684 | | | $ | 422,106 | | | $ | 350,178 | | | $ | 315,958 | | | $ | 212,626 | |
| | | | | | | | | | | | | | | | | | | | | | | | |
13
AMG Managers CenterSquare Real Estate Fund
Financial Highlights
For a share outstanding throughout each fiscal period
| | | | | | | | |
| | | For the fiscal period
ended December 31, | | | For the fiscal period
ended October 31, | |
| Class I | | 2017* | | | 201713 | |
Net Asset Value, Beginning of Period | | $ | 11.02 | | | $ | 11.22 | |
Income (loss) from Investment Operations: | | | | | | | | |
Net investment income1,2 | | | 0.09 | 3 | | | 0.11 | |
Net realized and unrealized gain (loss) on investments | | | 0.34 | | | | (0.26 | ) |
Total income (loss) from investment operations | | | 0.43 | | | | (0.15 | ) |
Less Distributions to Shareholders from: | | | | | | | | |
Net investment income | | | (0.06 | ) | | | (0.05 | ) |
Net realized gain on investments | | | (0.96 | ) | | | — | |
Total distributions to shareholders | | | (1.02 | ) | | | (0.05 | ) |
Net Asset Value, End of Period | | $ | 10.43 | | | $ | 11.02 | |
Total Return2,6,7 | | | 3.97 | % | | | (1.30 | )% |
Ratio of net expenses to average net assets | | | 0.90 | %9,14 | | | 0.94 | %9,14 |
Ratio of gross expenses to average net assets11 | | | 0.92 | %12 | | | 0.95 | %9 |
Ratio of net investment income to average net assets2 | | | 3.75 | %9 | | | 1.46 | %9 |
Portfolio turnover | | | 13 | %6 | | | 71 | %6 |
Net assets end of period (000’s) omitted | | $ | 58,716 | | | $ | 57,902 | |
| | | | | | | | |
AMG Managers CenterSquare Real Estate Fund
Financial Highlights
For a share outstanding throughout each fiscal period
| | | | | | | | |
| | | For the fiscal period
ended December 31, | | | For the fiscal period
ended October 31, | |
| Class Z | | 2017* | | | 201713 | |
Net Asset Value, Beginning of Period | | $ | 11.02 | | | $ | 11.22 | |
Income (loss) from Investment Operations: | | | | | | | | |
Net investment income1,2 | | | 0.09 | 3 | | | 0.12 | |
Net realized and unrealized gain (loss) on investments | | | 0.34 | | | | (0.26 | ) |
Total income (loss) from investment operations | | | 0.43 | | | | (0.14 | ) |
Less Distributions to Shareholders from: | | | | | | | | |
Net investment income | | | (0.06 | ) | | | (0.06 | ) |
Net realized gain on investments | | | (0.96 | ) | | | — | |
Total distributions to shareholders | | | (1.02 | ) | | | (0.06 | ) |
Net Asset Value, End of Period | | $ | 10.43 | | | $ | 11.02 | |
Total Return2,6,7 | | | 4.00 | % | | | (1.27 | )% |
Ratio of net expenses to average net assets | | | 0.79 | %9,14 | | | 0.83 | %9,14 |
Ratio of gross expenses to average net assets11 | | | 0.81 | %12 | | | 0.84 | %9 |
Ratio of net investment income to average net assets2 | | | 3.86 | %9 | | | 1.57 | %9 |
Portfolio turnover | | | 13 | %6 | | | 71 | %6 |
Net assets end of period (000’s) omitted | | $ | 149 | | | $ | 143 | |
| | | | | | | | |
| * | The Fund changed its fiscal year end from October 31 to December 31. See Note 1 in the Notes to Financial Statements. |
| # | Effective February 27, 2017, Class S was renamed Class N. |
| ## | Effective October 1, 2016, the shares were reclassified and redesignated as Class S shares. |
| 1 | Per share numbers have been calculated using average shares. |
| 2 | Total returns and net investment income would have been lower had certain expenses not been offset. |
| 3 | Includes non-recurring dividends. Without these dividends, net investment income per class would have been $0.08, $0.08 and $0.08 for Class N, Class I, and Class Z, respectively. |
| 4 | Includes non-recurring dividends. Without these dividends, net investment income per share would have been $0.12 for Class N shares. |
| 5 | Includes non-recurring dividends. Without these dividends, net investment income per share would have been $0.13 for Class N shares. |
| 7 | The total return is calculated using the published Net Asset Value as of fiscal period end. |
| 8 | Includes reduction from broker recapture amounting to less than 0.01% for the period ended December 31, 2017, and 0.01%, 0.01%, 0.01%, 0.01%. 0.01% for the fiscal years ended October 31, 2017, 2016, 2015, 2014, 2013, respectively. |
| 10 | Includes non-routine extraordinary expenses amounting to 0.027% of average net assets. |
| 11 | Excludes the impact of expense reimbursement or fee waivers and expense reductions such as brokerage credits, but includes expense repayments and non-reimbursable expenses, if any, such as interest, taxes, and extraordinary expenses. (See Note 1(c) and 2 in the Notes to Financial Statements.) |
| 12 | Ratio does not reflect the annualization of audit, printing and registration expenses. |
| 13 | Commencement of operations was on February 27, 2017. |
| 14 | Includes reduction from broker recapture amounting to less than 0.01% for the period ended December 31, 2017 and 0.01% for the period ended October 31, 2017. |
Notes to Financial Statements
December 31, 2017
1. SUMMARY OF SIGNIFICANT ACCOUNTING POLICIES
AMG Funds I (the “Trust”) is an open-end management investment company, organized as a Massachusetts business trust, and registered under the Investment Company Act of 1940, as amended (the “1940 Act”). Currently, the Trust consists of a number of different funds, each having distinct investment management objectives, strategies, risks, and policies. Included in this report is the AMG Managers CenterSquare Real Estate Fund (the “Fund”).
Commencing with the fiscal year beginning on November 1, 2017, the fiscal year of the Fund was changed from the period ending October 31 of each year to the period ending December 31 of each year.
The Fund offers different classes of shares, which, effective October 1, 2016, the Fund’s shares were reclassified and redesignated to Class S, and effective February 27, 2017, Class S shares were renamed Class N and the Fund commenced offering Class I and Class Z shares. Each class represents an interest in the same assets of the respective Fund. Although all share classes generally have identical voting rights, each share class votes separately when required by law. Different share classes may pay different distribution amounts to the extent the net asset value per share and/or the expenses of such share classes differ. Each share class has its own expense structure.
The Fund is non-diversified. A greater percentage of the Fund’s holdings may be focused in a smaller number of securities which may place the Fund at greater risk than a more diversified fund.
The Fund’s financial statements are prepared in accordance with accounting principles generally accepted in the United States of America (“U.S. GAAP”), including accounting and reporting guidance pursuant to Accounting Standards Codification Topic 946 applicable to investment companies. U.S. GAAP requires management to make estimates and assumptions that affect the reported amounts of assets and liabilities and disclosure of contingent assets and liabilities at the date of the financial statements and the reported amounts of income and expenses during the reporting period. Actual results could differ from those estimates and such differences could be material. The following is a summary of significant accounting policies followed by the Fund in the preparation of its financial statements:
a. VALUATION OF INVESTMENTS
Equity securities, including REITS, traded on a national securities exchange or reported on the NASDAQ national market system (“NMS”) are valued at the last quoted sales price on the primary exchange or, if applicable, the NASDAQ official closing price or the official closing price of the relevant exchange or, lacking any sales, at the last quoted bid price or the mean between the last quoted bid and ask prices (the “exchange mean price”). Equity securities traded in the over-the-counter market (other than NMS securities) are valued at the exchange mean price. Foreign equity securities (securities principally traded in markets other than U.S. markets) are valued at the official closing price on the primary exchange or, for markets that either do not offer an official closing price or where the official closing price may not be representative of the overall market, the last quoted sale price.
The Fund’s portfolio investments are generally valued based on independent market quotations or prices or, if none, “evaluative” or other market based valuations provided by third party pricing services approved by the Board of Trustees of the Trust (the “Board”). Under certain circumstances, the value of certain Fund portfolio investments may be based on an evaluation of fair value,
pursuant to procedures established by and under the general supervision of the Board. The Valuation Committee, which is comprised of the Independent Trustees of the Board, and the Pricing Committee, which is comprised of representatives from AMG Funds LLC (the “Investment Manager”) are the committees appointed by the Board to make fair value determinations. The Fund may use the fair value of a portfolio investment to calculate its net asset value (“NAV”) in the event that the market quotation, price or market based valuation for the portfolio investment is not readily available or otherwise not determinable pursuant to the Board’s valuation procedures, if the Investment Manager or the Pricing Committee believes the quotation, price or market based valuation to be unreliable, or in certain other circumstances. When determining the fair value of an investment, the Pricing Committee and, if required under the Trust’s securities valuation procedures, the Valuation Committee, seeks to determine the price that the Fund might reasonably expect to receive from current sale of that portfolio investment in an arms-length transaction. Fair value determinations shall be based upon consideration of all available facts and information, including, but not limited to (i) attributes specific to the investment; (ii) fundamental and analytical data relating to the investment; and (iii) the value of other comparable securities or relevant financial instruments, including derivative securities, traded on other markets or among dealers.
The values assigned to fair value portfolio investments are based on available information and do not necessarily represent amounts that might ultimately be realized in the future, since such amounts depend on future developments inherent in long-term investments. Because of the inherent uncertainty of valuation, those estimated values may differ significantly from the values that would have been used had a ready market for the investments existed, and the differences could be material. The Board will be presented with a quarterly report showing as of the most recent quarter end, all outstanding securities fair valued by the Fund, including a comparison with the prior quarter end and the percentage of the Fund that the security represents at each quarter end.
With respect to foreign equity securities and certain foreign fixed income securities, the Board has adopted a policy that securities held in a Fund that can be fair valued by the applicable fair value pricing service are fair valued on each business day provided that each individual price exceeds a pre-established confidence level.
U.S. GAAP defines fair value as the price that a fund would receive to sell an asset or pay to transfer a liability in an orderly transaction between market participants at the measurement date. U.S. GAAP also establishes a framework for measuring fair value, and a three level hierarchy for fair value measurements based upon the transparency of inputs to the valuation of an asset or liability. Inputs may be observable or unobservable and refer broadly to the assumptions that market participants would use in pricing the asset or liability. Observable inputs reflect the assumptions market participants would use in pricing the asset or liability based on market data obtained from sources independent of the Fund.
Unobservable inputs reflect the Fund’s own assumptions about the assumptions that market participants would use in pricing the asset or liability developed based on the best information available in the circumstances. Each investment is assigned a level based upon the observability of the inputs which are significant to the overall valuation.
The three-tier hierarchy of inputs is summarized below:
Level 1 – inputs are quoted prices in active markets for identical investments (e.g., equity securities, open-end investment companies)
Level 2 – other observable inputs (including, but not limited to: quoted prices for similar assets or liabilities in markets that are active, quoted prices for identical or
Notes to Financial Statements (continued)
similar assets or liabilities in markets that are not active, inputs other than quoted prices that are observable for the assets or liabilities (such as interest rates, yield curves, volatilities, prepayment speeds, loss severities, credit risks and default rates) or other market corroborated inputs) (e.g., debt securities, government securities, foreign currency exchange contracts, foreign securities utilizing international fair value pricing, fair valued securities with observable inputs)
Level 3 – inputs are significant unobservable inputs (including the Fund’s own assumptions used to determine the fair value of investments) (e.g., fair valued securities with unobservable inputs)
Changes in inputs or methodologies used for valuing investments may result in a transfer in or out of levels within the fair value hierarchy. The inputs or methodologies used for valuing investments may not necessarily be an indication of the risk associated with investing in those investments. Transfers between different levels of the fair value disclosure hierarchy are deemed to have occurred as of the beginning of the reporting period.
b. SECURITY TRANSACTIONS
Security transactions are accounted for as of trade date. Realized gains and losses on securities sold are determined on the basis of identified cost.
c. INVESTMENT INCOME AND EXPENSES
Dividend income is recorded on the ex-dividend date. Interest income, which includes amortization of premium and accretion of discount on debt securities, is accrued as earned. Dividend and interest income on foreign securities is recorded gross of any withholding tax. Non-cash dividends included in dividend income, if any, are reported at the fair market value of the securities received. Upon notification from issuers, distributions received from a real estate investment trust (“REIT”) may be redesignated as a reduction of cost of investments and/or realized gain. Other income and expenses are recorded on an accrual basis. Expenses that cannot be directly attributed to a Fund are apportioned among the funds in the Trust and other trusts within the AMG Funds family of mutual funds (collectively the “AMG Funds Family”) based upon their relative average net assets or number of shareholders. Investment income, realized and unrealized capital gains and losses, the common expenses of the Fund, and certain fund level expense reductions, if any, are allocated on a pro-rata basis to each class based on the relative net assets of each class to the total net assets of the Fund.
The Fund had certain portfolio trades directed to various brokers under a brokerage recapture program. Credits received from the brokerage recapture program are earned and paid on a monthly basis, and are recorded as expense offsets, which serve to reduce the Funds’ overall expense ratio. For the fiscal period ended December 31, 2017, the impact on the expense ratios, if any, was $6,309 or less than 0.01%.
d. DIVIDENDS AND DISTRIBUTIONS
Fund distributions resulting from either net investment income or realized net capital gains, if any, are declared and paid out quarterly in March, June, September and December for income and will normally be declared and paid at least annually in December for realized net capital gains. Distributions to shareholders are recorded on the ex-dividend date. Distributions are determined in accordance with federal income tax regulations, which may differ from net investment income and net realized capital gains for financial statement purposes (U.S. GAAP). Differences may be permanent or temporary. Permanent differences are reclassified among
capital accounts in the financial statements to reflect their tax character. Permanent book and tax basis differences, if any, relating to shareholder distributions will result in reclassifications to paid-in capital. Temporary differences arise when certain items of income, expense and gain or loss are recognized in different periods for financial statement and tax purposes; these differences will reverse at some time in the future. Permanent differences are due to current year equalization. Temporary differences are due to wash sales.
The tax character of distributions paid during the fiscal period ended December 31, 2017 and fiscal year ended October 31, 2017 were as follows:
| | | | | | | | |
| Distributions paid from: | | December 31,
2017 | | | October 31,
2017 | |
Ordinary income | | $ | 1,574,182 | | | $ | 6,528,931 | |
Short-term capital gains | | | 6,499,755 | | | | 7,876,037 | |
Long-term capital gains | | | 18,761,311 | | | | 25,628,104 | |
| | | | | | | | |
| | $ | 26,835,248 | | | $ | 40,033,072 | |
| | | | | | | | |
As of December 31, 2017, the components of distributable earnings (excluding unrealized appreciation/depreciation) on tax basis consisted of:
| | | | |
Capital loss carryforward | | | — | |
Undistributed ordinary income | | $ | 175,873 | |
Undistributed short-term capital gains | | | 533,215 | |
Undistributed long-term capital gains | | | 1,194,096 | |
Late-year loss deferral | | | — | |
At December 31, 2017, the approximate cost of investments and the aggregate gross unrealized appreciation and depreciation for federal income tax were as follows:
| | | | | | | | | | | | |
| Cost | | Appreciation | | | Depreciation | | | Net | |
$292,212,603 | | $ | 16,347,344 | | | $ | (15,349,225 | ) | | $ | 998,119 | |
e. FEDERAL TAXES
The Fund currently qualifies as an investment company and intends to comply with the requirements under Subchapter M of the Internal Revenue Code of 1986, as amended, and to distribute substantially all of its taxable income and gains to its shareholders and to meet certain diversification and income requirements with respect to investment companies. Therefore, no provision for federal income or excise tax is included in the accompanying financial statements.
Additionally, based on the Fund’s understanding of the tax rules and rates related to income, gains and transactions for the foreign jurisdictions in which it invests, the Fund will provide for foreign taxes, and where appropriate, deferred foreign taxes.
Management has analyzed the Fund’s tax positions taken on federal income tax returns as of December 31, 2017, and for all open tax years (generally, the three prior taxable years), and has concluded that no provision for federal income tax is required in the Fund’s financial statements. Additionally, Management is not aware of any tax position for which it is reasonably possible that the total amounts of unrecognized tax benefits will change materially in the next twelve months.
17
Notes to Financial Statements (continued)
Net capital losses incurred may be carried forward for an unlimited time period, and retain their tax character as either short-term or long-term capital losses.
f. CAPITAL LOSS CARRYOVERS AND DEFERRALS
As of December 31, 2017, the Fund had no accumulated net realized capital loss carryovers from securities transactions for federal income tax purposes . These amounts may be used to offset future realized capital gains, if any, for an unlimited time period.
g. CAPITAL STOCK
The Trust’s Declaration of Trust authorizes for the Fund the issuance of an unlimited number of shares of beneficial interest, without par value. The Fund records sales and repurchases of its capital stock on the trade date.
For the fiscal period ended December 31, 2017 and the fiscal year ended October 31, 2017, the capital stock transactions by class for the Fund were as follows:
| | | | | | | | | | | | | | | | | | | | | | | | |
| | | December 31, 2017 | | | October 31, 2017 | | | October 31, 2016 | |
| | | Shares | | | Amount | | | Shares | | | Amount | | | Shares | | | Amount | |
Class N: | | | | | | | | | | | | | | | | | | | | | | | | |
Proceeds from sale of shares | | | 519,246 | | | $ | 5,810,011 | | | | 7,839,045 | | | $ | 87,226,250 | | | | 18,653,759 | | | $ | 222,136,592 | |
Reinvestment of distributions | | | 1,991,031 | | | | 20,686,818 | | | | 3,219,980 | | | | 34,583,644 | | | | 2,747,238 | | | | 31,501,690 | |
Cost of shares repurchased | | | (2,028,658 | ) | | | (22,589,402 | ) | | | (25,090,414 | ) | | | (278,435,016 | ) | | | (13,630,885 | ) | | | (162,459,166 | ) |
| | | | | | | | | | | | | | | | | | | | | | | | |
Net increase (decrease) | | | 481,619 | | | $ | 3,907,427 | | | | (14,031,389 | ) | | $ | (156,625,122 | ) | | | 7,770,112 | | | $ | 91,179,116 | |
| | | | | | | | | | | | | | | | | | | | | | | | |
Class I:1 | | | | | | | | | | | | | | | | | | | | | | | | |
Proceeds from sale of shares | | | 508,867 | | | $ | 5,708,005 | | | | 5,898,330 | | | $ | 65,213,040 | | | | — | | | | — | |
Reinvestment of distributions | | | 323,970 | | | | 3,366,045 | | | | 4,064 | | | | 45,022 | | | | — | | | | — | |
Cost of shares repurchased | | | (457,891 | ) | | | (5,168,455 | ) | | | (648,960 | ) | | | (7,198,342 | ) | | | — | | | | — | |
| | | | | | | | | | | | | | | | | | | | | | | | |
Net increase | | | 374,946 | | | $ | 3,905,595 | | | | 5,253,434 | | | $ | 58,059,720 | | | | — | | | | — | |
| | | | | | | | | | | | | | | | | | | | | | | | |
Class Z:1 | | | | | | | | | | | | | | | | | | | | | | | | |
Proceeds from sale of shares | | | — | | | | — | | | | 26,293 | | | $ | 287,191 | | | | — | | | | — | |
Reinvestment of distributions | | | 1,284 | | | $ | 13,327 | | | | 67 | | | | 743 | | | | — | | | | — | |
Cost of shares repurchased | | | — | | | | — | | | | (13,375 | ) | | | (145,651 | ) | | | — | | | | — | |
| | | | | | | | | | | | | | | | | | | | | | | | |
Net increase | | | 1,284 | | | $ | 13,327 | | | | 12,985 | | | $ | 142,283 | | | | — | | | | — | |
| | | | | | | | | | | | | | | | | | | | | | | | |
| 1 | Commencement of operations was on February 27, 2017. |
2. AGREEMENTS AND TRANSACTIONS WITH AFFILIATES
The Trust has entered into an investment advisory agreement under which the Investment Manager, a subsidiary and the U.S. retail distribution arm of Affiliated Managers Group, Inc. (“AMG”), serves as investment manager to the Fund and is responsible for the Fund’s overall administration and operations. The Investment Manager selects one or more subadvisers for the Fund (subject to Board approval) and monitors each subadviser’s investment performance, security holdings and investment strategies. The Fund’s investment portfolio is managed by one or more portfolio managers who serve pursuant to a subadvisory agreement with the Investment Manager.
Investment management fees are paid directly by the Fund to the Investment Manager based on average daily net assets. The Fund’s investment management fee is paid at the annual rate of 0.60% of average daily net assets of the Fund.
The Investment Manager has contractually agreed, through at least March 1, 2018, to waive management fees and/or reimburse fund expenses in order to limit total
annual Fund operating expenses after fee waiver and expense reimbursements (exclusive of taxes, interest (including interest incurred in connection with bank and custody overdrafts), brokerage commissions and other transaction costs, acquired fund fees and expenses and extraordinary expenses) of the Fund to 1.24% of the Fund’s average daily net assets subject to later reimbursement by the Fund in certain circumstances.
The contractual expense limitation may only be terminated in the event the Investment Manager or a successor ceases to be the investment manager of the Fund or a successor fund, by mutual agreement between the Investment Manager and the Board, or in the event of the Fund’s liquidation unless the Fund is reorganized or is a party to a merger in which the surviving entity is successor to the accounting and performance information of the Fund.
In general, for a period of up to 36 months, the Investment Manager may recover the Funds fees waived and expenses paid pursuant to this contractual agreement, provided that such repayment would not cause the Fund’s total annual operating
18
Notes to Financial Statements (continued)
expenses after fee waiver and expense reimbursements (exclusive of the items noted in the parenthetical above) to exceed the contractual expense limitation amount.
The Trust, on behalf of the Fund, has entered into an amended and restated Administration Agreement under which the Investment Manager serves as the Fund’s administrator (the “Administrator”) and is responsible for all non-portfolio management aspects of managing the Fund’s operations, including administration and shareholder services to the Fund. The Fund pays a fee to the Administrator at the rate of 0.15% per annum of the Fund’s average daily net assets for this service. Prior to October 1, 2016, the Fund paid an administration fee under a similar contract at an annual rate of 0.25% of the Fund’s average daily net assets.
The Fund is distributed by AMG Distributors, Inc. (the “Distributor”), a wholly-owned subsidiary of the Investment Manager. The Distributor serves as the distributor and underwriter for the Fund and is a registered broker-dealer and member of the Financial Industry Regulatory Authority, Inc. (“FINRA”). Shares of the Fund will be continuously offered and will be sold directly to prospective purchasers and through brokers, dealers or other financial intermediaries who have executed selling agreements with the Distributor. Generally the Distributor bears all or a portion of the expenses of providing services pursuant to the distribution agreement, including the payment of the expenses relating to the distribution of prospectuses for sales purposes and any advertising or sales literature.
For Class N and Class I shares, the Board has approved reimbursement payments to the Investment Manager for shareholder servicing expenses (“shareholder servicing fees”) incurred. Shareholder servicing fees include payments to financial intermediaries, such as broker-dealers (including fund supermarket platforms), banks, and trust companies who provide shareholder recordkeeping, account servicing and other services. Class N and Class I shares may reimburse the Investment Manager for the actual amount incurred up to a maximum annual rate of each Class’s average daily net assets as shown in the table below.
The impact on the annualized expense ratio for the fiscal period ended December 31, 2017, were as follows:
| | | | | | | | |
| | | Maximum Annual
Amount
Approved | | | Actual
Amount
Incurred | |
Class N | | | 0.25 | % | | | 0.25 | % |
Class I | | | 0.15 | % | | | 0.11 | % |
The Board provides supervision of the affairs of the Trust and other trusts within the AMG Funds family. The Trustees of the Trust who are not affiliated with an Investment Manager receive an annual retainer and per meeting fees for regular, special and telephonic meetings, and they are reimbursed for out-of-pocket
expenses incurred while carrying out their duties as Board members. The Chairman of the Board and the Audit Committee Chair receive additional annual retainers. Certain Trustees and Officers of the Funds are Officers and/or Directors of the Investment Manager, AMG and/or the Distributor.
The Securities and Exchange Commission (the “SEC”) granted an exemptive order that permits the Funds to lend and borrow money for certain temporary purposes directly to and from other eligible funds in the AMG Funds family. Participation in this interfund lending program is voluntary for both the borrowing and lending funds, and an interfund loan is only made if it benefits each participating fund. The Administrator manages the program according to procedures approved by the Board, and the Board monitors the operation of the program. An interfund loan must comply with certain conditions set out in the exemptive order, which are designed to assure fairness and protect all participating funds. For the fiscal period ended December 31, 2017, the Fund borrowed a maximum amount of $1,910,334 for eight days paying interest of $695. The interest amount is included in the Statement of Operations as miscellaneous expense. At December 31, 2017, the Fund had no interfund loans outstanding.
The Investment Manager has agreed to voluntarily waive certain expenses incurred due to the change in the Fund’s fiscal year end.
3. PURCHASES AND SALES OF SECURITIES
Purchases and sales of securities (excluding short-term securities and U.S. Government Obligations) for the period ended December 31, 2017, were $37,530,336 and $56,320,540, respectively. The Fund had no purchases or sales of U.S. Government Obligations during the period ended December 31, 2017.
4. COMMITMENTS AND CONTINGENCIES
Under the Trust’s organizational documents, its trustees and officers are indemnified against certain liabilities arising out of the performance of their duties to the Trust. In addition, in the normal course of business, the Fund may enter into contracts and agreements that contain a variety of representations and warranties, which provide general indemnifications. The maximum exposure to the Fund under these arrangements is unknown, as this would involve future claims that may be made against the Fund that have not yet occurred. However, based on experience, the Fund had no prior claims or losses and expects the risks of loss to be remote.
5. SUBSEQUENT EVENTS
The Fund has determined that no material events or transactions occurred through the issuance date of the Fund’s financial statements, which require an additional disclosure in or adjustment of the Fund’s financial statements.
19
Report of Independent Registered Public Accounting Firm
TO THE BOARD OF TRUSTEES OF AMG FUNDS I AND SHAREHOLDERS OF AMG MANAGERS CENTERSQUARE REAL ESTATE FUND
Opinion on the Financial Statements
We have audited the accompanying statement of assets and liabilities, including the schedule of portfolio investments, of AMG Managers CenterSquare Real Estate Fund (one of the funds constituting AMG Funds I, hereafter collectively referred to as the “Fund”) as of December 31, 2017, the related statement of operations for the period November 1, 2017 through December 31, 2017 and for the year ended October 31, 2017, the statement of changes in net assets for the period November 1, 2017 through December 31, 2017 and each of the two years in the period ended October 31, 2017, including the related notes, and the financial highlights for each of the periods indicated therein (collectively referred to as the “financial statements”). In our opinion, the financial statements present fairly, in all material respects, the financial position of the Fund as of December 31, 2017, the results of its operations for the period November 1, 2017 through December 31, 2017 and for the year ended October 31, 2017, the changes in its net assets for the period November 1, 2017 through December 31, 2017 and for each of the two years in the period ended October 31, 2017 and the financial highlights for each of the periods indicated therein in conformity with accounting principles generally accepted in the United States of America.
Basis for Opinion
These financial statements are the responsibility of the Fund’s management. Our responsibility is to express an opinion on the Fund’s financial statements based on our audits. We are a public accounting firm registered with the Public Company Accounting Oversight Board (United States) (“PCAOB”) and are required to be independent with respect to the Fund in accordance with the U.S. federal securities laws and the applicable rules and regulations of the Securities and Exchange Commission and the PCAOB.
We conducted our audits of these financial statements in accordance with the standards of the PCAOB. Those standards require that we plan and perform the audit to obtain reasonable assurance about whether the financial statements are free of material misstatement, whether due to error or fraud.
Our audits included performing procedures to assess the risks of material misstatement of the financial statements, whether due to error or fraud, and performing procedures that respond to those risks. Such procedures included examining, on a test basis, evidence regarding the amounts and disclosures in the financial statements. Our audits also included evaluating the accounting principles used and significant estimates made by management, as well as evaluating the overall presentation of the financial statements. Our procedures included confirmation of securities owned as of December 31, 2017 by correspondence with the custodian and brokers; when replies were not received from brokers, we performed other auditing procedures. We believe that our audits provide a reasonable basis for our opinion.
PricewaterhouseCoopers LLP
Boston, Massachusetts
February 27, 2018
We have served as the auditor of one or more investment companies in AMG Funds Family since 1993.
20
Other Information
TAX INFORMATION
The AMG Managers CenterSquare Real Estate Fund hereby designates the maximum amount allowable of its net taxable income as qualified dividends as provided in the Jobs and Growth Tax Relief Reconciliation Act of 2003. The Form 1099-DIV you receive for the Fund will show the tax status of all distributions paid to you during the year.
Pursuant to section 852 of the Internal Revenue Code, AMG Managers CenterSquare Real Estate Fund hereby designates $19,529,620 as a capital gain distribution with respect to the taxable fiscal period ended December 31, 2017, or if subsequently determined to be different, the net capital gains of such year. AMG Managers CenterSquare Real Estate Fund hereby designates $529,661 as a §1250 gain distribution with respects to the taxable calendar year ended December 31, 2017, or if subsequently determined to be different, the §1250 gains of such calendar year.
21
AMG Funds
Trustees and Officers
The Trustees and Officers of the Trust, their business addresses, principal occupations for the past five years and ages are listed below. The Trustees provide broad supervision over the affairs of the Trust and the Funds. The Trustees are experienced executives who meet periodically throughout the year to oversee the Funds’ activities, review contractual arrangements with companies that provide services to the Funds, and
review the Funds’ performance. Unless otherwise noted, the address of each Trustee or Officer is the address of the Trust: 600 Steamboat Road, Suite 300, Greenwich, Connecticut 06830.
There is no stated term of office for Trustees. Trustees serve until their resignation, retirement or removal in
accordance with the Trust’s organizational documents and policies adopted by the Board from time to time. The Chairman of the Trustees, President, Treasurer and Secretary of the Trust are elected by the Trustees annually. Other officers hold office at the pleasure of the Trustees.
Independent Trustees
The following Trustees are not “interested persons” of the Trust within the meaning of the 1940 Act:
| | |
Number of Funds Overseen in Fund Complex | | Name, Age, Principal Occupation(s) During Past 5 Years and Other Directorships Held by Trustee |
• Trustee since 2012 • Oversees 61 Funds in Fund Complex | | Bruce B. Bingham, 69 Partner, Hamilton Partners (real estate development firm) (1987-Present); Director of The Yacktman Funds (2000-2012). |
| |
• Trustee since 2000 • Oversees 61 Funds in Fund Complex | | Edward J. Kaier, 72 Attorney at Law and Partner, Teeters Harvey Marrone & Kaier LLP (2007-Present); Attorney at Law and Partner, Hepburn Willcox Hamilton & Putnam, LLP (1977-2007); Trustee of Third Avenue Trust (5 portfolios); Trustee of Third Avenue Variable Trust (1 portfolio). |
| |
• Trustee since 2013 • Oversees 63 Funds in Fund Complex | | Kurt A. Keilhacker, 54 Managing Member, TechFund Capital (1997-Present); Managing Member, TechFund Europe (2000-Present); Board Member, 6wind SA, (2002-Present); Managing Member, Elementum Ventures (2013-Present); Trustee, Gordon College (2001-2016). |
| |
• Trustee since 2000 • Oversees 61 Funds in Fund Complex | | Steven J. Paggioli, 67 Independent Consultant (2002-Present); Formerly Executive Vice President and Director, The Wadsworth Group (1986-2001); Executive Vice President, Secretary and Director, Investment Company Administration, LLC (1990-2001); Vice President, Secretary and Director, First Fund Distributors, Inc. (1991-2001); Trustee, Professionally Managed Portfolios (32 portfolios); Advisory Board Member, Sustainable Growth Advisors, LP; Independent Director, Chase Investment Counsel (2008–Present). |
| |
• Trustee since 2013 • Oversees 61 Funds in Fund Complex | | Richard F. Powers III, 72 Adjunct Professor, U.S. Naval War College (2016); Adjunct Professor, Boston College (2010-2013); President and CEO of Van Kampen Investments Inc. (1998-2003). |
| |
• Independent Chairman • Trustee since 2000 • Oversees 63 Funds in Fund Complex | | Eric Rakowski, 59 Professor, University of California at Berkeley School of Law (1990-Present); Director of Harding, Loevner Funds, Inc. (9 portfolios); Trustee of Third Avenue Trust (5 portfolios); Trustee of Third Avenue Variable Trust (1 portfolio). |
| |
• Trustee since 2013 • Oversees 63 Funds in Fund Complex | | Victoria L. Sassine, 52 Lecturer, Babson College (2007 – Present). |
| |
• Trustee since 2000 • Oversees 61 Funds in Fund Complex | | Thomas R. Schneeweis, 70 Professor Emeritus, University of Massachusetts (2013-Present); Partner, S Capital Wealth Advisors (2015-Present); President, TRS Associates (1982-Present); BoardMember, Chartered Alternative Investment Association (“CAIA”) (2002-Present); Director, CAIA Foundation (Education) (2010-Present); Director, Institute for Global Asset and Risk Management (Education) (2010-Present); Partner, S Capital Management, LLC (2007-2015); Director, CISDM at the University of Massachusetts,(1996-2013); President, Alternative Investment Analytics, LLC, (formerly Schneeweis Partners, LLC) (2001-2013); Professor of Finance, University of Massachusetts(1977-2013). |
22
AMG Funds
Trustees and Officers (continued)
Interested Trustees
Each Trustee in the following table is an “interested person” of the Trust within the meaning of the 1940 Act. Ms. Carsman is an interested person of the Trust within the meaning of the 1940 Act by virtue of her position with, and interest in securities of, AMG.
| | |
Number of Funds Overseen in Fund
Complex | | Name, Age, Principal Occupation(s) During Past 5 Years and Other Directorships Held by Trustee |
• Trustee since 2011 • Oversees 63 Funds in Fund Complex | | Christine C. Carsman, 65 Executive Vice President, Deputy General Counsel and Chief Regulatory Counsel, Affiliated Managers Group, Inc. (2017-Present); Director (2010-Present) and Chair of the Board of Directors (2015-Present), AMG Funds plc; Director of Harding, Loevner Funds, Inc. (9 portfolios); Senior Vice President and Deputy General Counsel, Affiliated Managers Group, Inc. (2011-2016); Senior Vice President and Chief Regulatory Counsel, Affiliated Managers Group, Inc. (2007-2011); Vice President and Chief Regulatory Counsel, Affiliated Managers Group, Inc. (2004-2007); Secretary and Chief Legal Officer, AMG Funds, AMG Funds I, AMG Funds II and AMG Funds III (2004-2011); Senior Counsel, Vice President and Director of Operational Risk Management and Compliance, Wellington Management Company, LLP (1995-2004). |
| |
| Officers | | |
| |
Position(s) Held with Fund and Length of
Time Served | | Name, Age, Principal Occupation(s) During Past 5 Years |
• President since 2014 | | Jeffrey T. Cerutti, 50 |
• Principal Executive Officer since 2014 • Chief Executive Officer since 2016 | | Chief Executive Officer, AMG Funds LLC (2014-Present); Director, President and Principal, AMG Distributors, Inc. (2014-Present); President and Principal Executive Officer, AMG Funds, AMG Funds I, AMG Funds II and AMG Funds III (2014-Present); Chief Executive Officer, President and Principal Executive Officer, AMG Funds IV, (2015-Present); Chief Executive Officer, AMG Funds, AMG Funds I, AMG Funds II and AMG Funds III (2016-Present); Chief Executive Officer, Aston Asset Management, LLC (2016); President, VP Distributors, (2011-2014); Executive Vice President, Head of Distribution, Virtus Investment Partners, Inc. (2010-2014); Managing Director, Head of Sales, UBS Global Asset Management (2001-2010). |
| |
• Chief Operating Officer since 2007 | | Keitha L. Kinne, 59 Chief Operating Officer, AMG Funds LLC (2007-Present); Chief Investment Officer, AMG Funds LLC (2008-Present); Chief Operating Officer, AMG Distributors, Inc. (2007-Present); Chief Operating Officer, AMG Funds, AMG Funds I, AMG Funds II, and AMG Funds III (2007-Present); Chief Operating Officer, AMG Funds IV, (2016-Present); Chief Operating Officer and Chief Investment Officer, Aston Asset Management, LLC (2016); President and Principal Executive Officer, AMG Funds, AMG Funds I, AMG Funds II and AMG Funds III (2012-2014); Managing Partner, AMG Funds LLC (2007-2014); President, AMG Funds (2012-2014); President, AMG Distributors, Inc. (2012-2014); Managing Director, Legg Mason & Co., LLC (2006-2007); Managing Director, Citigroup Asset Management (2004-2006). |
| |
• Secretary since 2015 • Chief Legal Officer since 2015 | | Mark J. Duggan, 53 Senior Vice President and Senior Counsel, AMG Funds LLC (2015-Present); Secretary and Chief Legal Officer, AMG Funds, AMG Funds I, AMG Funds II and AMG Funds III (2015-Present); Secretary and Chief Legal Officer, AMG Funds IV, (2015-Present); Attorney, K&L Gates, LLP (2009-2015). |
| |
• Chief Financial Officer since 2017 • Treasurer since 2017 • Principal Financial Officer since 2017 • Principal Accounting Officer since 2017 | | Thomas G. Disbrow, 52 Vice President, Mutual Fund Treasurer & CFO, AMG Funds, AMG Funds LLC (2017-Present); Chief Financial Officer, Principal Financial Officer, Treasurer and Principal Accounting Officer, AMG Funds, AMG Funds I, AMG Funds II, AMG Funds III and AMG Funds IV (2017-Present); Managing Director - Global Head of Traditional Funds Product Control, UBS Asset Management (Americas), Inc. (2015-2017); Managing Director - Head of North American Funds Treasury, UBS Asset Management (Americas), Inc. (2011-2015). |
| |
• Chief Compliance Officer since 2016 | | Gerald F. Dillenburg, 51 Vice President, Chief Compliance Officer AMG Funds, AMG Funds LLC (2017-Present); Chief Compliance Officer AMG Funds, AMG Funds LLC (2016-2017); Chief Compliance Officer and Sarbanes Oxley Code of Ethics Compliance Officer, AMG Funds, AMG Funds I, AMG Funds II and AMG Funds III (2016-Present); Chief Compliance Officer, AMG Funds IV (1996-Present); Sarbanes-Oxley Code of Ethics Compliance Officer, AMG Funds IV (2016-Present); Chief Compliance Officer, Aston Asset Management, LLC (2006-2016); Chief Operating Officer, Aston Funds (2003-2016); Secretary, Aston Funds (1996-2015); Chief Financial Officer, Aston Funds (1997-2010); Chief Financial Officer, Aston Asset Management, LLC (2006-2010); Treasurer, Aston Funds (1996-2010). |
| |
• Deputy Treasurer since 2017 | | John A. Starace, 47 Director, Mutual Fund Accounting, AMG Funds LLC (2017-Present); Vice President, Deputy Treasurer of Mutual Funds Services, AMG Funds LLC (2014-2017); Deputy Treasurer, AMG Funds, AMG Funds I, AMG Funds II, AMG Funds III and AMG Funds IV (2017-Present); Vice President, Citi Hedge Fund Services (2010-2014); Audit Senior Manager (2005-2010) and Audit Manager (2001-2005), Deloitte & Touche LLP. |
23
AMG Funds
Trustees and Officers (continued)
| | |
Position(s) Held with Fund and Length of Time Served | | Name, Age, Principal Occupation(s) During Past 5 Years |
• Controller since 2017 | | Christopher R. Townsend, 50 Vice President, Business Finance, AMG Funds LLC (2017-Present); Head of Business Finance, AMG Funds LLC (2015-2017); Chief Financial Officer and Financial and Operations Principal, AMG Distributors, Inc. (2016-Present); Controller, AMG Funds, AMG Funds I, AMG Funds II, AMG Funds III and AMG Funds IV (2017-Present); Treasurer, Chief Financial Officer, Principal Financial Officer, Principal Accounting Officer, AMG Funds, AMG Funds I, AMG Funds II, AMG Funds III and AMG Funds IV (2017); Chief Financial Officer, Aston Asset Management LLC (2016); Head of Finance and Accounting, Allianz Asset Management (2006-2015). |
| |
• Anti-Money Laundering Compliance Officer since 2014 | | Patrick J. Spellman, 43 Vice President, Chief Compliance Officer, AMG Funds LLC (2017-Present); Senior Vice President, Chief Compliance Officer, AMG Funds LLC (2011-2017); Chief Compliance Officer, AMG Distributors, Inc., (2010-Present); Anti-Money Laundering Compliance Officer, AMG Funds, AMG Funds I, AMG Funds II, and AMG Funds III (2014-Present); Anti-Money Laundering Officer, AMG Funds IV, (2016-Present); Compliance Manager, Legal and Compliance, Affiliated Managers Group, Inc. (2005-2011). |
| |
• Assistant Secretary since 2016 | | Maureen A. Meredith, 32 Director, Counsel, AMG Funds LLC (2017-Present); Vice President, Counsel, AMG Funds LLC (2015-2017); Assistant Secretary, AMG Funds, AMG Funds I, AMG Funds II, AMG Funds III and AMG Funds IV (2016-Present); Associate, Ropes & Gray LLP (2011-2015); Law Fellow, Massachusetts Appleseed Center for Law and Justice (2010-2011). |
24
|
| Annual Renewal of Investment Management and Subadvisory Agreements (unaudited) |
AMG Managers CenterSquare Real Estate Fund: Approval of Subadvisory Agreement on December 7, 2017
At an in-person meeting held on December 7, 2017, the Board of Trustees (the “Board” or the “Trustees”), and separately a majority of the Trustees who are not “interested persons” of AMG Funds I (the “Independent Trustees”), approved a new subadvisory agreement between AMG Funds LLC (the “Investment Manager”) and CSIM Investment Management LLC (subsequently renamed CenterSquare Investment Management LLC) (the “New Subadvisory Agreement”) relating to AMG Managers CenterSquare Real Estate Fund (the “Fund”). The New Subadvisory Agreement was presented for approval because the former subadvisory agreement between the Investment Manager and CenterSquare Investment Management, Inc. relating to the Fund (the “Former Subadvisory Agreement”) was expected to terminate in connection with CSIM Investment Management LLC’s intent to purchase 100% of CenterSquare Investment Management, Inc.’s assets, which was expected to occur on or around January 2, 2018 (the “Transaction”). CSIM Investment Management LLC, CenterSquare Investment Management, Inc. and CenterSquare Investment Management LLC are referred to collectively herein as “CenterSquare.”
The Independent Trustees were separately represented by independent legal counsel in connection with their consideration of the approval of the New Subadvisory Agreement. In considering the New Subadvisory Agreement, the Trustees considered the information relating to the Fund and CenterSquare provided to them in connection with their December 7, 2017 meeting, and also considered generally the information relating to the Fund and CenterSquare provided to them in connection with their meeting on June 28-29, 2017, which was the meeting in which the Trustees considered and approved the renewal of the Former Subadvisory Agreement for an additional one year period. In connection with the June 28-29, 2017 meeting, the information provided to the Trustees relating to the Fund included comparative performance, fee and expense information for an appropriate peer group of similar mutual funds (the “Peer Group”), performance information for relevant benchmark indices (the “Fund Benchmark”) and, with respect to CenterSquare, comparative performance information for an appropriate peer group of managed accounts.
The Trustees also considered the other information provided to them on a periodic basis throughout the year, including at their meeting on June 28-29, 2017, regarding the nature, extent and quality of services provided by CenterSquare under the Former Subadvisory Agreement. Prior to voting, the Independent Trustees met with their independent legal counsel in a private session at which no representatives of management were present.
NATURE, EXTENT AND QUALITY OF SERVICES
In considering, at their June 28-29, 2017 meeting, the nature, extent and quality of the services provided by CenterSquare, the Trustees reviewed information relating to CenterSquare’s financial condition, operations and personnel and the investment philosophy, strategies and techniques (the “Investment Strategy”) used in managing the Fund. Among other things, the Trustees reviewed biographical information on portfolio management and other professional staff, information regarding CenterSquare’s organizational and management structure and CenterSquare’s brokerage policies and practices. The Trustees considered specific information provided regarding the experience of the individuals at CenterSquare with portfolio management responsibility for the Fund, including the information set forth in the Fund’s prospectus and statement of additional information. In the course of their deliberations at such meeting, the Trustees evaluated, among other things: (a) the services rendered by CenterSquare in the past; (b) the qualifications and experience of CenterSquare personnel; and (c) CenterSquare’s compliance program. The Trustees also took into account, at their December 7, 2017 meeting, the financial condition of CenterSquare with respect to its ability to provide the same level of services under the New Subadvisory Agreement as under the Former Subadvisory Agreement. The Trustees also considered CenterSquare’s risk management processes.
The Trustees, at their December 7, 2017 meeting, reviewed information relating to the Transaction and the role of current CenterSquare personnel under the New Subadvisory Agreement following the Transaction and noted that the role of such personnel would be identical. The Trustees considered the investment philosophy, strategies and techniques that are intended to be used by CenterSquare in managing the Fund. Among other things, the Trustees reviewed updated biographical
information on portfolio management and other professional staff and information regarding CenterSquare’s organizational and management structure. The Trustees considered specific information provided regarding the experience of the individuals at CenterSquare with portfolio management responsibility for the Fund, including the information set forth in the Fund’s prospectus and statement of additional information. In this regard, the Trustees observed that CenterSquare had extensive experience managing real estate strategies. The Trustees noted that CenterSquare has served as subadviser to the Fund since 2004 and that the same personnel would continue to serve as portfolio managers to the Fund.
PERFORMANCE
Among other information relating to the Fund’s performance, the Trustees noted, at their June 28-29, 2017 meeting, that the Fund’s performance for Class N shares (which share class has the earliest inception date of all the share classes of the Fund and the largest amount of assets of all the share classes of the Fund) for the 1-year, 3-year, 5-year and 10-year periods ended March 31, 2017 was below, above, above and above, respectively, the median performance of the Peer Group and above the performance of the Fund Benchmark, the Dow Jones U.S. Select REIT Index. The Trustees took into account management’s discussion of the Fund’s performance, both at their June 28-29, 2017 meeting and at their December 7, 2017 meeting. At their June 28-29, 2017 meeting, the Trustees took into account the Fund’s outperformance relative to the Fund Benchmark and the reasons for the Fund’s more recent underperformance relative to its Peer Group. At such meeting, the Trustees also noted that Class N shares of the Fund ranked in the top decile relative to its Peer Group for the 10-year period and in the top quintile relative to its Peer Group for the 3-year and 5-year periods. At such meeting, the Trustees also considered the gross performance of the Fund by CenterSquare as compared to CenterSquare’s relevant performance composite that utilizes the same investment strategy and approach and noted that the Board reviews on a quarterly basis detailed information about both the Fund’s performance results and portfolio composition, as well as CenterSquare’s Investment Strategy. At their December 7, 2017 meeting, the Trustees also considered more recent performance information, noting that the Fund’s performance was below,
25
|
| Annual Renewal of Investment Management and Subadvisory Agreements (continued) |
above, above and above the performance of the Fund Benchmark for the 1-year, 3-year, 5-year and 10-year periods ended September 30, 2017.
SUBADVISORY FEES AND PROFITABILITY
The Trustees noted that the Investment Manager, and not the Fund, is responsible for paying the fees charged by CenterSquare. In considering the reasonableness of the subadvisory fee, the Trustees relied on the ability of the Investment Manager to negotiate the terms of the New Subadvisory Agreement at arm’s length as part of the manager-of-managers structure, noting that CenterSquare is not affiliated with the Investment Manager.
In addition, the Trustees considered other potential benefits of the subadvisory relationship to CenterSquare, including, among others, the indirect benefits that CenterSquare may receive from its relationship with the Fund, including any so-called “fallout benefits” to CenterSquare, such as
reputational value derived from CenterSquare serving as subadviser to the Fund. In addition, the Trustees noted that the subadvisory fees are paid by the Investment Manager out of its advisory fee. As a consequence of all of the foregoing, the cost of services to be provided by CenterSquare and the profitability to CenterSquare of its relationship with the Fund were not material factors in the Trustees’ deliberations. For similar reasons, the Trustees did not consider potential economies of scale in the management of the Fund by CenterSquare to be a material factor in their deliberations at this time. Taking into account all of the foregoing, the Trustees concluded that, in light of the nature, extent and quality of the services provided to-date by CenterSquare, and the other considerations noted above with respect to CenterSquare, the Fund’s subadvisory fees are reasonable.
* * * *
After consideration of the foregoing, the Trustees also reached the following conclusions (in addition to the
conclusions discussed above) regarding the New Subadvisory Agreement: (a) CenterSquare has demonstrated that it possesses the capability and resources to perform the duties required of it under the New Subadvisory Agreement; (b) CenterSquare’s Investment Strategy is appropriate for pursuing the Fund’s investment objectives; and (c) CenterSquare maintains appropriate compliance programs.
Based on all of the above-mentioned factors and related conclusions, with no single factor or conclusion being determinative and with each Trustee not necessarily attributing the same weight to each factor, the Trustees concluded that approval of the New Subadvisory Agreement would be in the best interests of the Fund and its shareholders. Accordingly, on December 7, 2017, the Trustees, and separately a majority of the Independent Trustees, voted to approve the New Subadvisory Agreement for the Fund.
26
THIS PAGE INTENTIONALLY LEFT BLANK
THIS PAGE INTENTIONALLY LEFT BLANK
Investment Manager and Administrator
AMG Funds LLC
600 Steamboat Road, Suite 300
Greenwich, CT 06830
800.835.3879
Distributor
AMG Distributors, Inc.
600 Steamboat Road, Suite 300
Greenwich, CT 06830
800.835.3879
Subadvisor
CenterSquare Investment Management, Inc.
630 W Germantown Pike Suite 300
Plymouth Meeting, PA 19462
Custodian
The Bank of New York Mellon
111 Sanders Creek Parkway
East Syracuse, NY 13057
Legal Counsel
Ropes & Gray LLP
Prudential Tower, 800 Boylston Street
Boston, MA 02199-3600
Transfer Agent
BNY Mellon Investment Servicing (US) Inc.
Attn: AMG Funds
P.O. Box 9769
Providence, RI 02940
800.548.4539
This report is prepared for the Funds’ shareholders. It is authorized for distribution to prospective investors only when preceded or accompanied by an effective prospectus. To receive a free copy of the prospectus or Statement of Additional Information, which includes additional information about Fund Trustees, please contact us by calling 800.835.3879. Distributed by AMG Distributors, Inc., member FINRA/SIPC.
Current net asset values per share for each Fund are available on the Funds’ website at amgfunds.com.
A description of the policies and procedures the Fund uses to vote its proxies is available: (i) without charge, upon request, by calling 800.835.3879, or (ii) on the Securities and Exchange Commission’s (SEC) website at sec.gov. For information regarding the Fund’s proxy voting record for the 12-month period ended June 30, call 800.835.3879 or visit the SEC website at sec.gov.
The Fund files its complete schedule of portfolio holdings with the SEC for the first and third quarters of each fiscal year on Form N-Q. The Funds’ Forms N-Q are available on the SEC’s website at sec.gov. A Fund’s Form N-Q may be reviewed and copied at the SEC’s Public Reference Room in Washington, DC. Information on the operation of the Public Reference Room may be obtained by calling 1.800.SEC.0330. To review a complete list of the Fund’s portfolio holdings, or to view the most recent quarterly holdings report, semiannual report, or annual report, please visit amgfunds.com.
AFFILIATE SUBADVISED FUNDS
BALANCED FUNDS
AMG Chicago Equity Partners Balanced
Chicago Equity Partners, LLC
AMG FQ Global Risk-Balanced
First Quadrant, L.P.
EQUITY FUNDS
AMG Chicago Equity Partners Small Cap Value
Chicago Equity Partners, LLC
AMG FQ Tax-Managed U.S. Equity
AMG FQ Long-Short Equity
First Quadrant, L.P.
AMG Frontier Small Cap Growth
Frontier Capital Management Company, LLC
AMG GW&K Small Cap Core
AMG GW&K Small/Mid Cap
AMG GW&K U.S. Small Cap Growth
GW&K Investment Management, LLC
AMG Renaissance International Equity
AMG Renaissance Large Cap Growth
The Renaissance Group LLC
AMG River Road Dividend All Cap Value
AMG River Road Dividend All Cap Value II
AMG River Road Focused Absolute Value
AMG River Road Long-Short
AMG River Road Small-Mid Cap Value
AMG River Road Small Cap Value
River Road Asset Management, LLC
AMG SouthernSun Small Cap
AMG SouthernSun Global Opportunities
AMG SouthernSun U.S. Equity
SouthernSun Asset Management, LLC
AMG Systematic Mid Cap Value
Systematic Financial Management, L.P.
AMG TimesSquare Emerging Markets Small Cap
AMG TimesSquare International Small Cap
AMG TimesSquare Mid Cap Growth
AMG TimesSquare Small Cap Growth
TimesSquare Capital Management, LLC
AMG Trilogy Emerging Markets Equity
AMG Trilogy Emerging Wealth Equity
Trilogy Global Advisors, L.P.
AMG Yacktman
AMG Yacktman Focused
AMG Yacktman Focused Fund - Security Selection Only
AMG Yacktman Special Opportunities
Yacktman Asset Management LP
FIXED INCOME FUNDS
AMG GW&K Core Bond
AMG GW&K Enhanced Core Bond
AMG GW&K Municipal Bond
AMG GW&K Municipal Enhanced Yield
GW&K Investment Management, LLC
OPEN-ARCHITECTURE FUNDS
ALTERNATIVE FUNDS
AMG Managers Lake Partners LASSO Alternative
Lake Partners, Inc.
BALANCED FUNDS
AMG Managers Montag & Caldwell Balanced
Montag & Caldwell, LLC
EQUITY FUNDS
AMG Managers Brandywine
AMG Managers Brandywine Advisors Mid Cap Growth
AMG Managers Brandywine Blue
Friess Associates, LLC
AMG Managers Cadence Emerging Companies
AMG Managers Cadence Mid Cap
Cadence Capital Management, LLC
AMG Managers CenterSquare Real Estate
CenterSquare Investment Management, Inc.
AMG Managers Emerging Opportunities
Lord, Abbett & Co. LLC
WEDGE Capital Management L.L.P.
Next Century Growth Investors LLC
RBC Global Asset Management (U.S.) Inc.
AMG Managers Essex Small/Micro Cap Growth
Essex Investment Management Co., LLC
AMG Managers Fairpointe ESG Equity
AMG Managers Fairpointe Mid Cap
Fairpointe Capital LLC
AMG Managers Guardian Capital Global Dividend
Guardian Capital LP
AMG Managers LMCG Small Cap Growth
LMCG Investments, LLC
AMG Managers Montag & Caldwell Growth
AMG Managers Montag & Caldwell Mid Cap Growth
Montag & Caldwell, LLC
AMG Managers Pictet International
Pictet Asset Management Limited
AMG Managers Silvercrest Small Cap
Silvercrest Asset Management Group LLC
AMG Managers Skyline Special Equities
Skyline Asset Management, L.P.
AMG Managers Special Equity
Ranger Investment Management, L.P.
Lord, Abbett & Co. LLC
Smith Asset Management Group, L.P.
Federated MDTA LLC
AMG Managers Value Partners Asia Dividend
Value Partners Hong Kong Limited
FIXED INCOME FUNDS
AMG Managers Amundi Intermediate Government
AMG Managers Amundi Short Duration Government
Amundi Pioneer Institutional Asset Management, Inc.
AMG Managers Doubleline Core Plus Bond
DoubleLine Capital LP
AMG Managers Global Income Opportunity
AMG Managers Loomis Sayles Bond
Loomis, Sayles & Co., L.P.
| | | | | | |
| amgfunds.com | | | | 123117 | | AR017 |
Item 2. CODE OF ETHICS
Registrant has adopted a Code of Ethics. See attached Exhibit (a)(1).
Item 3. AUDIT COMMITTEE FINANCIAL EXPERT
Registrant’s Board of Trustees has determined that independent Trustee Mr. Steven J. Paggioli qualifies as an Audit Committee Financial Expert. Mr. Paggioli is “independent” as such term is defined in Form N-CSR.
Item 4. PRINCIPAL ACCOUNTANT FEES AND SERVICES
The aggregate fees billed by the Fund’s independent registered public accounting firm, PricewaterhouseCoopers LLP (“PwC”), to the Fund for the Fund’s two most recent fiscal years for professional services rendered for audits of annual financial statements, or services that are normally provided in connection with statutory and regulatory filings or engagements (“Audit Fees”) were as follows:
| | | | | | | | |
| | | Fiscal
period
ended
December
31, 2017* | | | Fiscal
year
ended
October
31, 2017 | |
AMG Managers CenterSquare Real Estate Fund | | $ | 22,434 | | | $ | 23,714 | |
| * | The Fund changed its fiscal year end from October 31 to December 31. |
Fees billed by PwC to the Fund in its two most recent fiscal years for services rendered for assurance and related services that are reasonably related to the performance of the audit or review of the Fund’s financial statements but are not reported as Audit Fees (“Audit-Related Fees”) were $10,034 for the fiscal period ended December 31, 2017 and $10,034 for fiscal year ended October 31, 2017 and related to services performed pursuant to Rule 17f-2 under the Investment Company Act of 1940.
For the Fund’s two most recent fiscal years, there were no Audit-Related Fees billed by PwC for engagements related directly to the operations and financial reporting of one or more Funds by a Fund Service Provider. A Fund Service Provider is (a) any investment adviser to the Fund (not including any Subadvisor whose role is primarily portfolio management and is subcontracted with or overseen by another investment adviser) or (b) any entity that provides ongoing services to the Fund and is controlling, controlled by or under common control with a Fund investment adviser described in (a).
The aggregate fees billed by PwC to the Fund for the two most recent fiscal years for professional services rendered for tax compliance, tax advice, and tax planning (“Tax Fees”) were as follows:
| | | | | | | | |
| | | Fiscal period
ended
December 31,
2017* | | | Fiscal year
ended
October 31,
2017 | |
AMG Managers CenterSquare Real Estate Fund | | $ | 9,425 | | | $ | 9,425 | |
| * | The Fund changed its fiscal year end from October 31 to December 31. |
For the Fund’s two most recent fiscal years, Tax Fees billed by PwC for engagements by Fund Service Providers that related directly to the operations and financial reporting of the Fund were $0 for the fiscal period ended December 31, 2017 and $0 for the fiscal year ended October 31, 2017, respectively.
The services for which Tax Fees were charged comprise all services performed by professional staff in PwC’s tax division except those services related to the audit. Typically, this category would include fees for tax compliance, tax planning, and tax advice. Tax compliance, tax advice, and tax planning services include preparation of original and amended tax returns, claims for refund and tax payment-planning services, assistance with tax audits and appeals, tax advice related to mergers and acquisitions and requests for rulings or technical advice from taxing authorities.
There were no other fees billed by PwC to the Fund for all other non-audit services (“Other Fees”) during the Fund’s two most recent fiscal years. During the same period, there were no Other Fees billed by PwC for engagements by Fund Service Providers that related directly to the operations and financial reporting of the Fund.
(e)(1) According to policies adopted by the Audit Committee, services provided by PwC to the Fund must be pre-approved by the Audit Committee. On an annual basis, the Audit Committee reviews and pre-approves various types of services that PwC may perform for the Fund without specific approval of each engagement, subject to specified budget limitations. As contemplated by the Sarbanes-Oxley Act of 2002 and related SEC rules, the Audit Committee also pre-approves non-audit services provided by PwC to any Fund Service Provider for any engagement that relates directly to the operations and financial reporting of the Fund. Any engagement that is not already pre-approved or that will exceed a pre-approved budget must be submitted to the Audit Committee for pre-approval. The Chairman of the Audit Committee is authorized on behalf of the Board of Trustees and the Audit Committee to approve the engagement of PwC to perform non-audit services subject to certain conditions, including notification to the Audit Committee of such pre-approval not later than the next meeting of the Audit Committee following the date of such pre-approval.
(e)(2) None.
(f) Not applicable.
(g) The aggregate fees billed by PwC for the fiscal period ended December 31, 2017 and the fiscal year ended October 31, 2017 for non-audit services rendered to the Funds and Fund Service Providers were $93,125 and $90,275, respectively. For the fiscal period ended December 31, 2017, this amount reflects the amounts disclosed above in Item 4(b),(c),(d), plus $83,700 in fees billed to the Fund Service Providers for non-audit services that did not relate directly to the operations and financial reporting of the Funds. For the fiscal year ended October 31, 2017, this amount reflects the amounts disclosed above in Item 4(b),(c),(d), plus $80,850 in fees billed to the Fund Service Providers for non-audit services that did not relate directly to the operations and financial reporting of the Funds.
(h) The Trust’s Audit Committee has considered whether the provision of non-audit services by registrant’s independent registered public accounting firm to the registrant’s investment advisor, and any entity controlling, controlled, or under common control with the investment advisor that provided ongoing services to the registrant that were not pre-approved by the Committee (because such services did not relate directly to the operations and financial reporting of the registrant) was compatible with maintaining the independence of the independent registered public accounting firm.
Item 5. AUDIT COMMITTEE OF LISTED REGISTRANTS
Not applicable.
Item 6. SCHEDULE OF INVESTMENTS
The schedule of investments in unaffiliated issuers as of the close of the reporting period is included as part of the shareholder report contained in Item 1 hereof.
Item 7. DISCLOSURE OF PROXY VOTING POLICIES AND PROCEDURES FOR CLOSED-END MANAGEMENT INVESTMENT COMPANIES
Not applicable.
Item 8. PORTFOLIO MANAGERS OF CLOSED-END MANAGEMENT INVESTMENT COMPANIES
Not applicable.
Item 9. PURCHASES OF EQUITY SECURITIES BY CLOSED-END MANAGEMENT INVESTMENT COMPANIES AND AFFILIATED PURCHASERS
Not applicable.
Item 10. SUBMISSION OF MATTERS TO A VOTE OF SECURITY HOLDERS
Not applicable.
Item 11. CONTROLS AND PROCEDURES
(a) The Registrant’s principal executive and principal financial officers have concluded, based on their evaluation of the
registrant’s disclosure controls and procedures as of a date within 90 days of the filing of this report, that the Registrant’s disclosure controls and procedures are reasonably designed to ensure that information required to be disclosed by the Registrant on Form N-CSR is recorded, processed, summarized and reported within the required time periods and that information required to be disclosed by the registrant in the reports that it files or submits on Form N-CSR is accumulated and communicated to the Registrant’s management, including its principal executive and principal financial officers, as appropriate to allow timely decisions regarding required disclosure.
(b) There were no changes in the Registrant’s internal control over financial reporting during the Registrant’s last fiscal quarter of the period covered by this report that have materially affected, or are reasonably likely to affect, the internal control over financial reporting.
Item 12. DISCLOSURE OF SECURITIES LENDING ACTIVITIES FOR CLOSED-END MANAGEMENT INVESTMENT COMPANIES
Not applicable.
Item 13. EXHIBITS
| | |
| |
| (a)(1) | | Any Code of Ethics or amendments hereto. Filed herewith. |
| |
| (a)(2) | | Certifications pursuant to Rule 30a-2(a) under the Investment Company Act of 1940 – Filed herewith. |
| |
| (a)(3) | | Not applicable. |
| |
| (b) | | Certifications pursuant to Rule 30a-2(b) under the Investment Company Act of 1940 – Filed herewith. |
SIGNATURES
Pursuant to the requirements of the Securities Exchange Act of 1934 and the Investment Company Act of 1940, the registrant has duly caused this report to be signed on its behalf by the undersigned, thereunto duly authorized.
AMG Funds I
| | |
| By: | | /s/ Jeffrey T. Cerutti |
| | | Jeffrey T. Cerutti, Principal Executive Officer |
| |
| Date: | | February 28, 2018 |
Pursuant to the requirements of the Securities Exchange Act of 1934 and the Investment Company Act of 1940, this report has been signed below by the following persons on behalf of the registrant and in the capacities and on the dates indicated.
| | |
| By: | | /s/ Jeffrey T. Cerutti |
| | | Jeffrey T. Cerutti, Principal Executive Officer |
| |
| Date: | | February 28, 2018 |
| |
| By: | | /s/ Thomas Disbrow |
| | | Thomas Disbrow, Principal Financial Officer |
| |
| Date: | | February 28, 2018 |